BRIEF REPORT Transfer of Intestinal Microbiota From Lean Donors Increases Insulin Sensitivity in Individuals With Metabolic Syndrome ANNE VRIEZE,* ELS VAN NOOD,* FRITS HOLLEMAN,* JARKKO SALOJÄRVI, ‡ RUUD S. KOOTTE, § JOEP F. W. M. BARTELSMAN, GEESJE M. DALLINGA–THIE, § MARIETTE T. ACKERMANS, ¶ MIREILLE J. SERLIE, # RAISH OOZEER,** MURIEL DERRIEN,** ANNE DRUESNE,** JOHAN E. T. VAN HYLCKAMA VLIEG,** VINCENT W. BLOKS, ‡‡ ALBERT K. GROEN, ‡‡ HANS G. H. J. HEILIG, §§ ERWIN G. ZOETENDAL, §§ ERIK S. STROES, § WILLEM M. DE VOS, ‡,§§ JOOST B. L. HOEKSTRA,* and MAX NIEUWDORP* ,§ *Department of Internal Medicine, § Department of Vascular Medicine and Experimental Vascular Medicine, Department of Gastroenterology, ¶ Department of Clinical Chemistry, Laboratory of Endocrinology, # Department of Endocrinology and Metabolism, Academic Medical Center, Amsterdam, The Netherlands; ‡ Department of Basic Veterinary Medicine, University of Helsinki, Helsinki, Finland; **Danone Research, Center Daniel Carasso, Palaiseau, France; ‡‡ Center for Liver, Digestive, and Metabolic Diseases, University Medical Center Groningen, University of Groningen, Groningen, The Netherlands; §§ Laboratory of Microbiology, Wageningen University, Wageningen, The Netherlands Alterations in intestinal microbiota are associated with obesity and insulin resistance. We studied the effects of infusing intestinal microbiota from lean donors to male recipients with metabolic syndrome on the recipients’ microbiota composition and glucose metabolism. Sub- jects were assigned randomly to groups that were given small intestinal infusions of allogenic or autologous mi- crobiota. Six weeks after infusion of microbiota from lean donors, insulin sensitivity of recipients increased (median rate of glucose disappearance changed from 26.2 to 45.3 mol/kg/min; P < .05) along with levels of butyrate-producing intestinal microbiota. Intestinal mi- crobiota might be developed as therapeutic agents to in- crease insulin sensitivity in humans; www.trialregister.nl ; registered at the Dutch Trial Register (NTR1776). Keywords: Bacteria; Clinical Trial; Diabetes; Short-Chain Fatty Acids. A ccumulating data suggest that intestinal microbiota contributes to host metabolism. 1 In animal models obesity is associated with substantial changes in the com- position and metabolic function of gut microbiota. 2,3 The colonic microbiota in obese mice shows a lower microbial diversity and is enriched in carbohydrate and lipid us- ers. 2,3 However, in human beings consensus regarding the specific bacterial species involved and evidence for a caus- ative role of the microbiota in host metabolism is lack- ing. 4,5 Most studies focus on the colonic microbiota, whereas the proximal intestine is crucial for carbohydrate and fat uptake, resulting in obesity and insulin resis- tance. 4 Furthermore, because small-intestinal sensing mechanisms exist to improve insulin sensitivity via neu- ronal circuits, 6 changes in small intestinal microbiota could be one of the stimuli driving this mechanism. We thus hypothesized that rebalancing the obesogenic micro- biota by small intestinal infusion of gut microbiota from a lean donor would positively affect (host) energy metab- olism and insulin sensitivity in subjects with metabolic syndrome. A detailed description of patient selection and methods is available in the Supplementary Materials and Methods. Briefly, treatment-naive male subjects with metabolic syn- drome underwent small-intestine biopsies and subse- quent bowel lavage through a duodenal tube, followed by random assignment to either an allogenic (from lean male donors with a body mass index 23 kg/m 2 ;n 9) or autologous gut microbiota infusion (reinfusion of own collected feces; n 9) (Supplementary Figure 1 and Sup- plementary Table 1). Insulin sensitivity was measured before and 6 weeks after gut microbiota infusion by means of a hyperinsulinemic euglycemic clamp using [6,6 2 H 2 ]-glucose to measure endogenous glucose production (EGP) and hepatic and peripheral insulin sensitivity (rate of disappearance [Rd]). 7 Large (fecal samples) and small- (duodenal biopsies) intestine gut microbiota composition and fecal short-chain fatty acids were measured at baseline and 6 weeks after infusion, as previously published. 8,9 We found an improvement in peripheral insulin sen- sitivity 6 weeks after allogenic gut microbiota infusion (median rate of glucose disappearance, Rd: from 26.2 to 45.3 mol/kg/min; P .05) (Figure 1A). A trend to- ward improvement in hepatic insulin sensitivity, ex- pressed as EGP suppression, was observed in the allo- genic group (median EGP suppression, from 51.5% to 61.6%; P .08) (Figure 1B). No differences in diet composition, resting energy expenditure (REE), or counter-regulatory hormones were found between all clamps (Supplementary Table 2). Fecal microbiota of obese subjects was characterized by lower microbial Abbreviations used in this paper: BMI, body mass index; EGP, endog- enous glucose production; Rd, rate of disposal; REE, resting energy expenditure. © 2012 by the AGA Institute 0016-5085/$36.00 http://dx.doi.org/10.1053/j.gastro.2012.06.031 BRIEF REPORTS GASTROENTEROLOGY 2012;143:913–916

Welcome message from author
This document is posted to help you gain knowledge. Please leave a comment to let me know what you think about it! Share it to your friends and learn new things together.
Transcript

CBMU
bccr
KF
opcde
watmr
BRIE
FREP
ORTS
GASTROENTEROLOGY 2012;143:913–916
BRIEF REPORT
Transfer of Intestinal Microbiota From Lean Donors Increases InsulinSensitivity in Individuals With Metabolic Syndrome
ANNE VRIEZE,* ELS VAN NOOD,* FRITS HOLLEMAN,* JARKKO SALOJÄRVI,‡ RUUD S. KOOTTE,§
JOEP F. W. M. BARTELSMAN,� GEESJE M. DALLINGA–THIE,§ MARIETTE T. ACKERMANS,¶ MIREILLE J. SERLIE,#
RAISH OOZEER,** MURIEL DERRIEN,** ANNE DRUESNE,** JOHAN E. T. VAN HYLCKAMA VLIEG,**VINCENT W. BLOKS,‡‡ ALBERT K. GROEN,‡‡ HANS G. H. J. HEILIG,§§ ERWIN G. ZOETENDAL,§§ ERIK S. STROES,§
WILLEM M. DE VOS,‡,§§ JOOST B. L. HOEKSTRA,* and MAX NIEUWDORP*,§
*Department of Internal Medicine, §Department of Vascular Medicine and Experimental Vascular Medicine, �Department of Gastroenterology, ¶Department of Clinicalhemistry, Laboratory of Endocrinology, #Department of Endocrinology and Metabolism, Academic Medical Center, Amsterdam, The Netherlands; ‡Department ofasic Veterinary Medicine, University of Helsinki, Helsinki, Finland; **Danone Research, Center Daniel Carasso, Palaiseau, France; ‡‡Center for Liver, Digestive, and
§§
etabolic Diseases, University Medical Center Groningen, University of Groningen, Groningen, The Netherlands; Laboratory of Microbiology, Wageningenniversity, Wageningen, The Netherlands(o
wpgtccco
Alterations in intestinal microbiota are associated withobesity and insulin resistance. We studied the effects ofinfusing intestinal microbiota from lean donors to malerecipients with metabolic syndrome on the recipients’microbiota composition and glucose metabolism. Sub-jects were assigned randomly to groups that were givensmall intestinal infusions of allogenic or autologous mi-crobiota. Six weeks after infusion of microbiota fromlean donors, insulin sensitivity of recipients increased(median rate of glucose disappearance changed from26.2 to 45.3 �mol/kg/min; P < .05) along with levels of
utyrate-producing intestinal microbiota. Intestinal mi-robiota might be developed as therapeutic agents to in-rease insulin sensitivity in humans; www.trialregister.nl;egistered at the Dutch Trial Register (NTR1776).
eywords: Bacteria; Clinical Trial; Diabetes; Short-Chainatty Acids.
Accumulating data suggest that intestinal microbiotacontributes to host metabolism.1 In animal models
besity is associated with substantial changes in the com-osition and metabolic function of gut microbiota.2,3 Theolonic microbiota in obese mice shows a lower microbialiversity and is enriched in carbohydrate and lipid us-rs.2,3 However, in human beings consensus regarding the
specific bacterial species involved and evidence for a caus-ative role of the microbiota in host metabolism is lack-ing.4,5 Most studies focus on the colonic microbiota,
hereas the proximal intestine is crucial for carbohydratend fat uptake, resulting in obesity and insulin resis-ance.4 Furthermore, because small-intestinal sensing
echanisms exist to improve insulin sensitivity via neu-onal circuits,6 changes in small intestinal microbiota
could be one of the stimuli driving this mechanism. Wethus hypothesized that rebalancing the obesogenic micro-biota by small intestinal infusion of gut microbiota from
a lean donor would positively affect (host) energy metab-olism and insulin sensitivity in subjects with metabolicsyndrome.
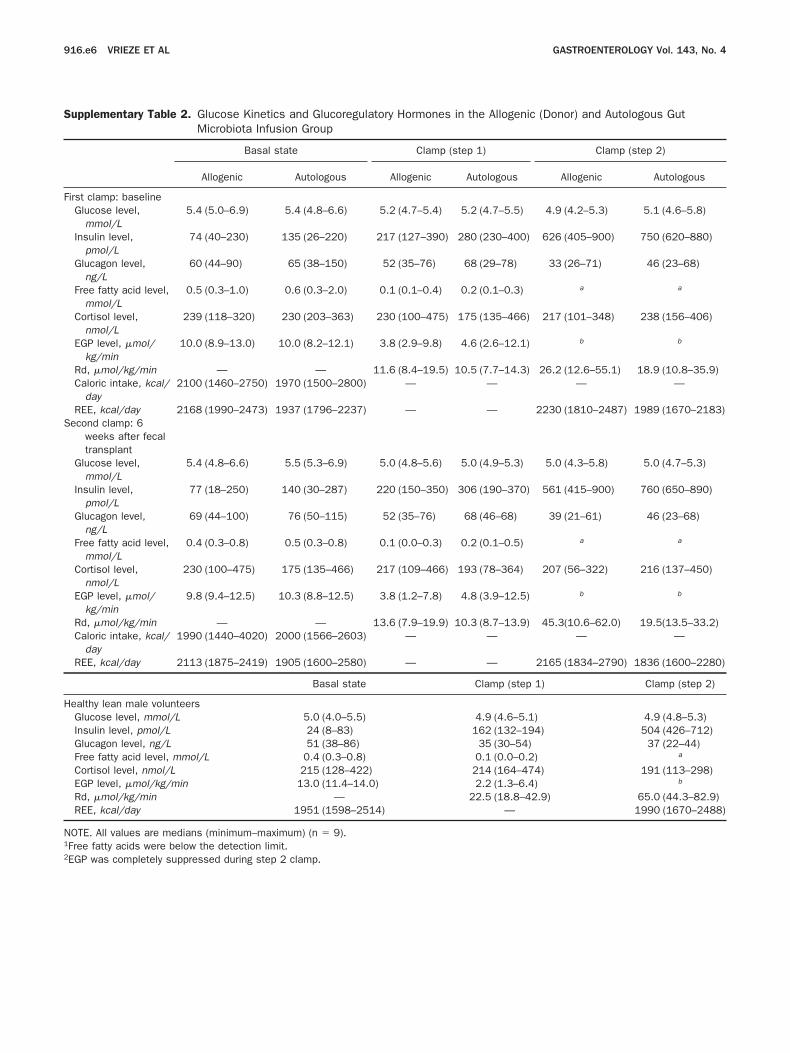
A detailed description of patient selection and methodsis available in the Supplementary Materials and Methods.Briefly, treatment-naive male subjects with metabolic syn-drome underwent small-intestine biopsies and subse-quent bowel lavage through a duodenal tube, followed byrandom assignment to either an allogenic (from lean maledonors with a body mass index � 23 kg/m2; n � 9) orautologous gut microbiota infusion (reinfusion of owncollected feces; n � 9) (Supplementary Figure 1 and Sup-plementary Table 1). Insulin sensitivity was measuredbefore and 6 weeks after gut microbiota infusion bymeans of a hyperinsulinemic euglycemic clamp using [6,62H2]-glucose to measure endogenous glucose productionEGP) and hepatic and peripheral insulin sensitivity (ratef disappearance [Rd]).7 Large (fecal samples) and small-
(duodenal biopsies) intestine gut microbiota compositionand fecal short-chain fatty acids were measured at baselineand 6 weeks after infusion, as previously published.8,9
We found an improvement in peripheral insulin sen-sitivity 6 weeks after allogenic gut microbiota infusion(median rate of glucose disappearance, Rd: from 26.2 to45.3 �mol/kg/min; P � .05) (Figure 1A). A trend to-
ard improvement in hepatic insulin sensitivity, ex-ressed as EGP suppression, was observed in the allo-enic group (median EGP suppression, from 51.5%o 61.6%; P � .08) (Figure 1B). No differences in dietomposition, resting energy expenditure (REE), orounter-regulatory hormones were found between alllamps (Supplementary Table 2). Fecal microbiota ofbese subjects was characterized by lower microbial
Abbreviations used in this paper: BMI, body mass index; EGP, endog-enous glucose production; Rd, rate of disposal; REE, resting energyexpenditure.
© 2012 by the AGA Institute0016-5085/$36.00
http://dx.doi.org/10.1053/j.gastro.2012.06.031

(
awo
wscf7ggt4tdoig
rlFngcptiX
BRIEF
REP
ORTS
914 VRIEZE ET AL GASTROENTEROLOGY Vol. 143, No. 4
diversity, higher amounts of Bacteroidetes, and decreasedamounts of Clostridium cluster XIVa as compared withlean donor healthy subjects. Quantitative polymerasechain reaction analysis showed no change in the totalnumbers of fecal bacteria (allogenic, from 10.8 � 0.2 to11.0 � 0.4 vs autologous, from 11.6 � 0.6 to 11.3 � 0.4log10 bacteria/g feces, non significant [ns]) and Archaeaallogenic, from 6.7 � 0.9 to 6.8 � 0.8 vs autologous,
from 6.3 � 0.4 to 6.7 � 0.7 log10 bacteria/g feces, ns)fter gut microbial infusion. Gut microbial diversityas increased significantly after allogenic gut microbi-ta transfer (from 178 � 62 to 234 � 40 species; P �
.05), but was unchanged in the autologous group (from184 � 71 to 211 � 50, ns). Sixteen bacterial groupsincreased significantly in the allogenic treatment group,including those related to the butyrate-producer Roseburiaintestinalis, which showed a 2.5-fold increase. Moreover, asubset of 6 bacterial groups differed significantly betweenthe allogenic and autologous treatment groups after 6weeks, including the oxalate-converting Oxalobacter formi-genes and other Firmicutes (Figure 2A and SupplementaryTable 3). Also, fecal short-chain fatty acids decreased afterallogenic gut microbiota infusion (median acetate from 49.5to 37.6; P � .05; butyrate, from 14.1 to 8.9; P � .05; andpropionate, from 18.2 to 16.3 mmol/kg feces; ns) comparedwith nonsignificant changes in the autologous group.
All small intestinal biopsy specimens showed normalhistology. Total bacterial abundance in biopsy speci-
Figure 1. Box plots and individual changes between baseline and aftecontrols vs obese subjects (Mann–Whitney test).
mens showed no differences after either allogenic or
autologous microbial fecal infusion (allogenic, from7.0 � 0.2 to 7.0 � 0.3 vs autologous, from 7.1 � 0.2 to7.0 � 0.2 log10 bacteria/cells per biopsy; ns). Archaea
ere below the detection limit in both groups. Noignificant differences were found with respect to mi-robial diversity in both treatment groups (allogenic,rom 91.3 � 54.7 to 68.1 � 15.7; ns; autologous, from3.6 � 23.3 to 83.6 � 52; ns). A total of 7 bacterialroups were altered within the allogenic treatmentroup after 6 weeks, including an increase of the bu-yrate-producer Eubacterium hallii (Supplementary Table). In contrast, E hallii showed an almost 2-fold reduc-ion in the autologous treatment group. Three bacteriaiffered significantly between the allogenic and autol-gous treatment groups at 6 weeks (Figure 2B) includ-
ng the nitric oxide producer Alcaligenes faecalis and theram-negative Escherichia coli.
In conclusion, our data point toward a regulatingole for butyrate derived from gut microbial metabo-ism leading to an improvement in insulin sensitivity.irst, we observed a significant modification in intesti-al microbiota composition in fecal samples after allo-enic gut microbiota infusion, including a 2.5-fold in-rease in the number of bacteria related to the butyrate-roducing R intestinalis (Figure 2A).4 Second, we foundhat bacteria related to the similarly butyrate-produc-ng E hallii (anaerobic, phylotype Clostridium clusterIVa)10 were increased in the small intestine mucosa
eeks for (A) peripheral and (B) hepatic insulin sensitivity. *P � .05 lean
r 6 wafter allogenic gut microbiota transfer (Figure 2B). Bu-

rabc
cmeg
BRIE
FREP
ORTS
October 2012 INTESTINAL MICROBIOTA TRANSFER 915
tyrate is produced by microbiota both in the large andsmall intestines for energy and signaling purposes,11,12
with orally administrated butyrate having a direct effecton glucose metabolism.13
Our data confirm that increased gut microbiota di-versity also is associated with improved insulin resis-
Figure 2. Heat maps of (A) fe-al and (B) small intestinal guticrobiota with significant differ-
nces between both treatmentroups depicted as a red box.
The color value shows log10 foldchanges.
tance.14 Whether diversity or changes in specific bacte-
ial species contribute to this effect is unknown,lthough it has been suggested that butyrate producedy certain bacteria prevents translocation of endotoxicompounds derived from the gut microbiota,14,15 which
has been shown to drive insulin resistance.14 Whetheroral administration of identified microbiota can result
in comparable effects on glucose metabolism is cur-
11
BRIEF
REP
ORTS
916 VRIEZE ET AL GASTROENTEROLOGY Vol. 143, No. 4
rently under study. If confirmed, this could offer arationale for novel therapeutic interventions aimed atimproving insulin sensitivity in humans.
Supplementary Material
Note: To access the supplementary materialaccompanying this article, visit the online version ofGastroenterology at www.gastrojournal.org, and at http:/dx.doi.org/10.1053/j.gastro.2012.06.031.
References
1. Qin J, et al. Nature 2010;464:59–65.2. Turnbaugh PJ, et al. Nature 2006;444:1027–1031.3. Backhed F, et al. Proc Natl Acad Sci U S A 2004;101:15718–
15723.4. Kootte RS, et al. Diabetes Obes Metab 2012;14:112–120.5. Duncan SH, et al. Int J Obes (Lond) 2008;32:1720–1724.6. Wang P, et al. Nature 2008;452:1012–1016.7. Langeveld M, et al. J Clin Endocrinol Metab 2008;93:845–851.8. Arumugam M, et al. Nature 2011;473:174–180.9. Wolever TM, et al. Br J Nutr 2000;84:57–61.
10. Munoz-Tamayo R, et al. FEMS Microbiol Ecol 2011;76:615–624.11. Arvans DL, et al. Am J Physiol Gastrointest Liver Physiol 2005;
288:696–704.2. Zoetendal EG, et al. ISME J 2012;6:1415–1426.
3. Gao Z, et al. Diabetes 2009;58:1509–1517.14. Cani PD, et al. Diabetes 2007;56:1761–1772.15. Lewis K, et al. Inflamm Bowel Dis 2010;16:1138–1148.
Received December 28, 2011. Accepted June 7, 2012.
Reprint requestsAddress requests for reprints to: M. Nieuwdorp, MD, PhD,
Academic Medical Center, Department of Vascular Medicine,Meibergdreef 9, Room F4-159.2, 1105 AZ Amsterdam, TheNetherlands. e-mail: [email protected]; fax: � 31 205669343.
AcknowledgmentsThe authors would like to thank Irene Lenoir–Wijnkoop, Remi
Brazeilles, and Pascale Rondeau (Danone Research) for valuablecomments on the protocol design and statistical analyses. Finally,the authors are grateful to Ineke Heikamp-de Jong, Philippe Puylaert,and Wilma Akkermans-van Vliet (Wageningen University) forexcellent laboratory assistance.
Conflicts of interestThe authors disclose no conflicts.
FundingSupported by an NWO-VENI grant 2008 (016.096.044 to M.N.),
Netherlands Foundation for Cardiovascular Excellence (2008-5 toA.V.), an NWO-ZONMW VEMI grant (170881001 to E.v.N.), and an
NWO-Spinoza grant 2008 (W.M.d.V.).
tfhjb
pcTtw(aDs
hws
u
October 2012 INTESTINAL MICROBIOTA TRANSFER 916.e1
Supplementary Materials and Methods
Obese SubjectsMale Caucasian obese subjects were recruited by
newspaper advertisements and screened for characteris-tics of the metabolic syndrome, specifically with a bodymass index � 30 kg/m2 or waist circumference � 102 cmand a fasting plasma glucose level � 5.6 mmol/L (Sup-plementary Table 1).1 Because animal studies have shownhat gut microbiota composition is affected by severalactors including bile acid composition, subjects with aistory of cholecystectomy were excluded, as well as sub-
ects who used any medication, probiotics, and/or anti-iotics in the past 3 months.2 Written informed consent
was obtained from all subjects. The study was approvedby the Institutional Review Board and conducted at theAcademic Medical Center in accordance with the Decla-ration of Helsinki (updated version 2008). The study wasregistered at the Dutch Trial Register (NTR1776).
Screening of Lean DonorsLean healthy Caucasian males (body mass index �
23 kg/m2) also were recruited by newspaper advertise-ments and matched for age and sex. They completedquestionnaires regarding diet and bowel habits, travelhistory, comorbidity including (family history of) diabe-tes mellitus, and lack of medication use. They werescreened for the presence of infectious diseases accordingto an adapted version of the Dutch Red Cross donorquestionnaire.3 Blood was screened for the presence ofantibodies to human immunodeficiency virus; humanT-lymphotropic virus; hepatitis A, B, and C; cytomegalo-virus; Epstein–Barr virus; Strongyloides; and amebiasis. Do-nors also were excluded if screening of their feces revealedthe presence of parasites (eg, Blastocystis hominis or Dien-tamoeba fragilis), Clostridium difficile, or other pathogenicbacteria (Shigella, Campylobacter, Yersinia, Salmonella).
Experimental DesignOn the first study day a hyperinsulinemic clamp
was applied in all study subjects to measure insulinsensitivity (see Hyperinsulinemic–Euglycemic Clamp sec-tion). On the second day, after an overnight fast, studysubjects and donors brought freshly produced morningstool for processing; study subjects were randomized in adouble-blind fashion to either allogenic (from lean maledonors) or autologous (from own collected feces) gutmicrobial infusion via a gastroduodenal tube (see GutMicrobiota Transfer Procedure section). A gastroduode-noscopy without sedation was performed and small in-testinal biopsy specimens were taken. Biopsy samplesimmediately were collected in sterile tubes, snap-frozenin liquid nitrogen, and processed as described.4 A duode-nal tube was positioned and bowel lavage with polyeth-ylene glycol solution (Macrogol or Klean-Prep, Norgine
BV, Amsterdam the Netherlands) was performed over 5hours to clean out endogenous fecal contamination fol-lowed by gut microbial infusion. Gastroduodenoscopy-assisted biopsies and the hyperinsulinemic euglycemicclamp were repeated after 6 weeks. The experimentalstudy design is shown in Supplementary Figure 1. Ofnote, the main reasons for choosing infusion of intestinalmicrobiota into the small rather than the large intestinewere as follows: (1) metabolic role of the small intestineas compared with the colon and (2) in our experience thenasoduodenal route provides better access and tolerabil-ity in patients while being equally effective in adminis-trating large amounts of intestinal microbiota.5
Hyperinsulinemic–Euglycemic ClampGlucose metabolism was measured in the basal
state and during a 2-step hyperinsulinemic euglycemicclamp using [6,6 2H2]-glucose to measure EGP and he-
atic and peripheral insulin sensitivity (Rd).6 Body fatomposition was measured using bioimpedance analysis.he REE was measured using indirect calorimetry. Par-
icipants were allowed to follow their own diet, butere asked to keep a weekly online nutritional diary
www.dieetinzicht.nl) to monitor caloric intake includingmount of dietary carbohydrate, fat, protein, and fiber.etails of the hyperinsulinemic euglycemic clamp are
hown in Supplementary Table 2.Subjects refrained from heavy physical exercise for 24
ours before the clamp. After a 12-hour fast, a catheteras inserted into an antecubital vein for infusion of
table-isotope tracer [6,6-2H2]glucose (Cambridge Iso-topes, Andover, MA), insulin, and glucose. A second cath-eter was inserted retrogradely in the contralateral handvein and kept in a thermoregulated (60°C) clear plasticbox for sampling of arterialized venous blood. Saline wasinfused as 0.9% NaCl at a rate of 50 mL/h to keep thecatheters patent. At t � 0 hours (0800), blood sampleswere drawn for determination of background enrich-ments. Then, a primed continuous infusion of isotope[6,6-2H2]glucose was started (prime, 8.8 �mol/kg; contin-
ous, 0.11 �mol/kg�1/min�1) and continued until theend of the clamp. After a 2-hour equilibration period,blood samples were drawn for isotope enrichments andsamples for glucoregulatory hormones and free fatty ac-ids. Thereafter (t � 2.0 h), a 2-step hyperinsulinemiceuglycemic clamp was started: step 1 included an infu-sion of insulin at a rate of 20 mU/m�2/min�1 (Actrapid200 IU/mL; Novo Nordisk Farma BV, Alphen aan denRijn, The Netherlands) to assess hepatic insulin sensitiv-ity. Glucose 20% was started to maintain a plasma glu-cose concentration of 5 mmol/L. Plasma glucose concen-trations were measured every 5 minutes at the bedsideusing a Beckman glucose meter (Beckman, Fullerton,CA). After 2 hours (t � 4 h), blood samples were drawn at5-minute intervals for the measurement of glucose con-centrations and isotopic enrichments. Another blood
sample was drawn for measurement of glucoregulatory
the2bcpctptssp
spasthcfrbii
s
sbmbOAisawF(eiT
ffaftCTtwtmgtdoBc
palt((mbTC
916.e2 VRIEZE ET AL GASTROENTEROLOGY Vol. 143, No. 4
hormones and free fatty acids. Hereafter, insulin infusionwas increased to a rate of 60 mU/m�2/min�1 (step 2) toassess peripheral insulin sensitivity. After another 2 h(t � 6 h), blood sampling was repeated.
Body composition was measured at baseline and after6 weeks with bioelectrical impedance analysis (MaltronBF906; Maltron, Rayleigh, UK). Oxygen consumptionand CO2 production were measured continuously duringhe final 20 minutes of both the basal state and theyperinsulinemic euglycemic clamp by indirect calorim-try using a ventilated hood system (Sensormedics model900; Sensormedics, Anaheim, CA). REE including car-ohydrate oxidation and fatty acid oxidation rates werealculated from oxygen consumption and carbon dioxideroduction. Rate of appearance and Rd of glucose werealculated using the modified form of the Steele equa-ions for non–steady-state measurements as describedreviously.7 EGP was calculated as the difference betweenhe rate of appearance of glucose and the glucose infu-ion rate. Both peripheral (Rd) and hepatic insulin sen-itivity (suppression of EGP) were calculated and ex-ressed as the median with a range.
Gut Microbiota Transfer ProcedureAt the day of infusion the patient and donor
delivered feces produced within 6 hours before use.5 Fecalamples were taken before and after processing to studyrocedural effects on microbial composition. Immedi-tely after delivery, the feces was covered with sterilealine (500 mL 0.9% NaCl) to reduce exposure to oxygen,ransferred to a blender, and mixed for 10 minutes. Theomogenized solution then was filtered twice through alean metal sieve. Subsequently, the filtrate was trans-erred to a 1000-mL sterile glass bottle and stored atoom temperature until the patient had finished theowel lavage. Finally, the gut microbiota solution was
nfused gradually through the duodenal tube in approx-mately 30 minutes.
Gut Microbiota AnalysisDonor and study subjects collected a morning
stool sample at baseline and after 6 weeks to determinethe microbiota composition. Samples were collected in 2plastic containers, immediately frozen at �20°C, andtransferred to �80°C within a week. The microbiotacomposition of the small intestinal biopsy specimens andfecal samples was determined by analyzing RNA signa-tures using the Human Intestinal Tract Chip (HITChip),a custom-made Agilent microarray (Agilent Technolo-gies, Palo Alto, CA) containing approximately 5500 spe-cific oligonucleotide probes that cover more than 1000intestinal phylotypes.8,9
DNA was isolated from fecal samples and purifiedusing the repeated bead-beating plus column method asdescribed previously.10 For DNA isolation of the biopsy
pecimens we used a different bead beating protocol.11 Inhort, 0.5 g (wet weight) of feces was suspended in lysisuffer (500 mmol/L NaCl, 50 mmol/L Tris-HCl, pH 8, 50mol/L EDTA, 4% sodium dodecyl sulfate) plus Zirconia
eads and glass beads (Biospec Products, Battlesville,K). The tube was shaken with Fastprep (MPBio, Santana, CA) at 5.5ms for 3 minutes at 4°C, followed by
ncubation at 95°C for 15 minutes. The DNA in theupernatant was precipitated with ammonium acetatend isopropanol, washed with 70% ethanol, and after-ard treated with proteinase K and DNase-free RNase.inally, the DNA was purified on a QIAamp spin column
Qiagen, Foster City, CA) according to the manufactur-r’s instructions. DNA concentration was quantified us-ng the NanoDrop 1000 spectrophotometer (NanoDropechnologies, Wilmington, DE).Quantification of total bacteria and methanogens in
ecal and small intestinal biopsy specimens was per-ormed with the same bacterial DNA used for HITChipnalysis. Quantitative polymerase chain reaction was per-ormed with a real-time polymerase chain reaction sys-em (PRISM 7900HT; Applied Biosystems, Foster City,A). All reactions were performed at least in duplicate.o facilitate comparison with other bacterial quantifica-
ion methods, the number of detected molecules (DNA)as converted to cell equivalents. A bacterial culture of
he stated reference strain (grown in the appropriateedia and collected at the stationary phase) was used to
enerate a standard curve-relating cycle threshold to bac-erial cell number (determined microscopically with 4=,6-iamidino-2-phenylindole staining from a dilution seriesf the reference strains). Standard curves of DNA fromifidobacterium longum and Methanobrevibacter smithii werereated using 106 to 1010 cells. Samples were analyzed in
a 25-�L reaction mix consisting of 12.5 �L SYBR Premix(50 mmol/L KCl, 20 mmol/L Tris-HCl, pH 8.4, 0.2mmol/L of deoxynucleoside triphosphate, 0.625 U Ta-KaRa Taq (Clonetech, Mountain View, CA), 3 mmol/LMgCl2, and 10 nmol/L fluorescein), 0.2 �mol/L of each
rimer, and 5 �L of DNA. For detection of total bacteriand methanogens in feces and small intestine, serial di-utions (100–1000) of the extracted DNA were subjectedo quantitative polymerase chain reaction using Uni331F5=-TCCTACGGGAGGCAGCAGT �3=) and Uni797R5=-GGACTACCAGGGTATCTAATCCTGTT-3=).11 For
ethanogenic Archaea, primers targeting the methano-acteriales order Mtb857F (5=-CGWAGGGAAGCTGT-AAGT-3=) and Mtb1196R (5=-TACCGTCGTCCACTC-TT-3=) were used as described earlier.12 The following
conditions of quantitative polymerase chain reactionused were as follows: 95°C for 10 minutes, followed by 35cycles of denaturation at 95°C for 15 seconds, annealingtemperature of 60°C for 20 seconds, extension at 72°Cfor 30 seconds, and a final extension step at 72°C for 5minutes. A melting curve was performed at the end ofeach run to verify the specificity of the polymerase chain
reaction amplicons by slowly heating the final reaction
pd
tf
rwom
tWgsmtslfdstacgbltt
October 2012 INTESTINAL MICROBIOTA TRANSFER 916.e3
mix to 95°C (0.5°C per cycle). Data analysis was per-formed using the Sequence Detection System (version2.3) software (Applied Biosystems). By using cycle thresh-old values in the linear range of the assay, bacterialequivalents were interpolated from a standard curve gen-erated in the same experiment and then weight-correctedto yield a value in bacterial cell equivalents/g feces.
The HITChip, a phylogenetic microarray, was used forthe high-throughput profiling of the microbiota in fecesand small intestinal biopsy specimens as described pre-viously.8 The advantage of the HITChip method is that
hylogenetic profiling of microbiota goes beyond theepth of canonical pyrosequencing.13,14 The disadvantage
is that 16S ribosomal RNA gene profiling only providesinsight into population dynamics, not into microbialactivity.
In short, 10 ng DNA was used to amplify the 16Sribosomal RNA genes using the T7prom-Bact-27-for andUni-1492-rev primers followed by in vitro transcriptionand labeling with Cy3 and Cy5, respectively, for fecalsamples. The primer Prok-1369-rev was used as reverseprimer for the biopsy samples because Uni-1492-rev wasmajorly targeting the overabundant human DNA, result-ing in its depletion for efficient bacterial 16S ribosomalRNA gene amplification (data not shown). Equal molarmixes of Cy3-/Cy5-labeled 16S ribosomal RNA targetswere fragmented and subsequently hybridized on themicroarrays at 62.5°C for 16 hours in a rotation oven(Agilent Technologies, Amstelveen, The Netherlands),followed by washing and drying of the slides. Sampleswere arrayed in duplex for technical replication, whichresulted in exclusion of 1 fecal sample in the autologoustreatment group as well as 1 biopsy sample in eachtreatment group. After scanning the slides, the data wereextracted from the microarray images using the AgilentFeature Extraction software (versions 7.5–9.1; available:http://www.agilent.com). Subsequently, the microarraydata were minimum–maximum normalized and furtheranalyzed using a set of R-based scripts (http://www.r-project.org/) in combination with a custom-designedrelational database that runs under the MySQL databasemanagement system (http://www.mysql.com). Hierarchi-cal clustering of probe profiles was performed using Pear-son correlation-based distance and complete linkagemethod. Gut microbial diversity was determined by theSimpson reciprocal index as previously described.15
Determination of Fecal and Plasma ShortChain Fatty AcidsIn short, 0.2– 0.5 g feces was weighed and resus-
pended in phosphate-buffered saline so that a 10� dilu-ion was obtained. A total of 350 �L of homogenizedeces was mixed with 200 �L formic acid (5% by volume),
100 �L 2-ethylbutyric acid (1.25 g/L; Sigma–Aldrich, Zwi-jndrecht, the Netherlands), and 350 �L MilliQ. Fecal
samples were centrifuged for 5 minutes at 15,000 � g toemove large particles, filtered, and protein-free samplesere subjected to vacuum distillation after the additionf an internal standard solution containing 1:1 mmol/Lethylbutyric acid and 110 mmol/L [13C]-formic acid.16
Short chain fatty acids acetate, proprionate and butyratewere determined quantitatively using a ShimadzuGC2010 gas chromatograph (Shimadzu Corporation,Kyoto, Japan) equipped with a flame ionization detector.
StatisticsSample size calculations showed that to detect
30% difference in peripheral insulin sensitivity upon al-logenic treatment, compared with 5% difference afterautologous treatment with 80% power, the sample size ineach group was estimated to be 9. Accepting a 10%drop-out rate per group, we enrolled 20 patients in total.Two subjects (1 in each treatment arm) were excludedfrom analyses because of antibiotic use during the trialunrelated to the microbial infusion. Statistical analyseswere performed with SPSS software (version 16; IBM,Chicago, IL). Depending on the distribution of the data,data are expressed as mean � standard error of the meanor median with range. The primary outcome was effect oflean donor gut microbiota infusion on insulin sensitivityafter 6 weeks. The secondary outcome was the change inspecific small- and large-gut microbiota as well as pro-duced fecal short chain fatty acids. For significantchanges between and within treatment groups, clinicalparameters were tested with the (paired) Student t test orhe Mann–Whitney test (differences between groups) and
ilcoxon signed-rank test (differences within treatmentroup), depending on distribution of the data. Expres-ion analysis for HITChip was performed with non linear
ixed effects (nlme) package in R.17 Differences betweenreatment groups at 6 weeks for both fecal samples andmall intestinal biopsy samples were computed using ainear mixed model, and the P values then were correctedor multiple comparisons by the q-value package.18,19 Toetect differences within each treatment group in theseamples, a multivariate mixed model taking into accounthe effects of repeated measurements, treatment group,nd individual temporal stability of gut microbiota wasonstructed. Moreover, because of low small-intestinal-ut microbiota diversity we could not detect differencesetween treatment groups using models mentioned ear-
ier; we thus used Random Forests multivariate analyseso detect differences in small intestinal bacteria withinreatment groups after 6 weeks.20
Supplementary References
1. Alberti KG, et al. Circulation 2009;120:1640–1645.2. Kootte RS, et al. Diabetes Obes Metab 2012;14:112–120.3. Van der Bij AK, et al. Transfusion 2006;46:1729–1736.4. Dethlefsen L, et al. PLoS Biol 2008;6:2383–2400.5. Nieuwdorp M, et al. Ned Tijdschr Geneeskd 2008;152:1927–
1932.
6. Langeveld M, et al. J Clin Endocrinol Metab 2008;93:845–851.
916.e4 VRIEZE ET AL GASTROENTEROLOGY Vol. 143, No. 4
7. Steele R. Ann N Y Acad Sci 1959;82:420–430.8. Rajilic-Stojanovic M, et al. Environ Microbiol 2009;11:1736–1751.9. Arumugam M, et al. Nature 2011;473:174–180.
10. Zoetendal EG, et al. Syst Appl Microbiol 2001;24:405–410.11. Nadkarni MA, et al. Microbiology 2002;148:257–266.12. Yu Y, et al. Biotechnol Bioeng 2005;89:670–679.13. van den Bogert B, et al. Appl Environ Microbiol 2011;77:2071–
2080.
14. Claesson MJ, et al. Gut Microbes 2010;1:277–278.15. Zilliox MJ, et al. Nat Methods 2007;4:911–913.16. Wolever TM, et al. Br J Nutr 2000;84:57–61.17. Pinheiro JC, et al. Springer 2000.18. Bretz F, et al. Boca Raton: CRC Press, 2010.19. Storey JA, et al. J R Stat Soc Series B Stat Methodol 2010;64:
479–498.
20. Breiman L. Machine Learning 1996;24:123–140.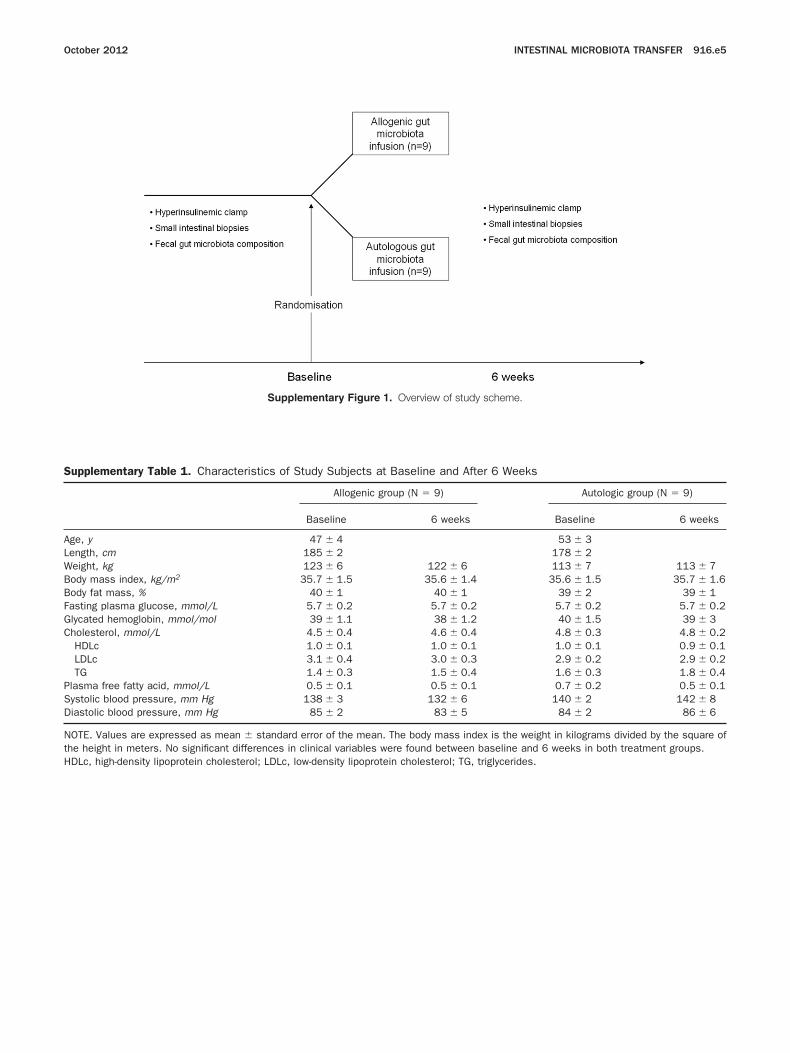
1. Overview of study scheme.
A
October 2012 INTESTINAL MICROBIOTA TRANSFER 916.e5
Supplementary Figure
Supplementary Table 1. Characteristics of Study Subjects at
Allogenic g
Baseline
ge, y 47 � 4Length, cm 185 � 2Weight, kg 123 � 6Body mass index, kg/m2 35.7 � 1.5Body fat mass, % 40 � 1Fasting plasma glucose, mmol/L 5.7 � 0.2Glycated hemoglobin, mmol/mol 39 � 1.1Cholesterol, mmol/L 4.5 � 0.4
HDLc 1.0 � 0.1LDLc 3.1 � 0.4TG 1.4 � 0.3
Plasma free fatty acid, mmol/L 0.5 � 0.1Systolic blood pressure, mm Hg 138 � 3Diastolic blood pressure, mm Hg 85 � 2
NOTE. Values are expressed as mean � standard error of the mean.the height in meters. No significant differences in clinical variables w
Baseline and After 6 Weeks
roup (N � 9) Autologic group (N � 9)
6 weeks Baseline 6 weeks
53 � 3178 � 2
122 � 6 113 � 7 113 � 735.6 � 1.4 35.6 � 1.5 35.7 � 1.6
40 � 1 39 � 2 39 � 15.7 � 0.2 5.7 � 0.2 5.7 � 0.238 � 1.2 40 � 1.5 39 � 34.6 � 0.4 4.8 � 0.3 4.8 � 0.21.0 � 0.1 1.0 � 0.1 0.9 � 0.13.0 � 0.3 2.9 � 0.2 2.9 � 0.21.5 � 0.4 1.6 � 0.3 1.8 � 0.40.5 � 0.1 0.7 � 0.2 0.5 � 0.1132 � 6 140 � 2 142 � 8
83 � 5 84 � 2 86 � 6
The body mass index is the weight in kilograms divided by the square ofere found between baseline and 6 weeks in both treatment groups.
HDLc, high-density lipoprotein cholesterol; LDLc, low-density lipoprotein cholesterol; TG, triglycerides.
N
916.e6 VRIEZE ET AL GASTROENTEROLOGY Vol. 143, No. 4
Supplementary Table 2. Glucose Kinetics and Glucoregulatory Hormones in the Allogenic (Donor) and Autologous GutMicrobiota Infusion Group
Basal state Clamp (step 1) Clamp (step 2)
Allogenic Autologous Allogenic Autologous Allogenic Autologous
First clamp: baselineGlucose level,
mmol/L5.4 (5.0–6.9) 5.4 (4.8–6.6) 5.2 (4.7–5.4) 5.2 (4.7–5.5) 4.9 (4.2–5.3) 5.1 (4.6–5.8)
Insulin level,pmol/L
74 (40–230) 135 (26–220) 217 (127–390) 280 (230–400) 626 (405–900) 750 (620–880)
Glucagon level,ng/L
60 (44–90) 65 (38–150) 52 (35–76) 68 (29–78) 33 (26–71) 46 (23–68)
Free fatty acid level,mmol/L
0.5 (0.3–1.0) 0.6 (0.3–2.0) 0.1 (0.1–0.4) 0.2 (0.1–0.3) a a
Cortisol level,nmol/L
239 (118–320) 230 (203–363) 230 (100–475) 175 (135–466) 217 (101–348) 238 (156–406)
EGP level, �mol/kg/min
10.0 (8.9–13.0) 10.0 (8.2–12.1) 3.8 (2.9–9.8) 4.6 (2.6–12.1) b b
Rd, �mol/kg/min — — 11.6 (8.4–19.5) 10.5 (7.7–14.3) 26.2 (12.6–55.1) 18.9 (10.8–35.9)Caloric intake, kcal/
day2100 (1460–2750) 1970 (1500–2800) — — — —
REE, kcal/day 2168 (1990–2473) 1937 (1796–2237) — — 2230 (1810–2487) 1989 (1670–2183)Second clamp: 6
weeks after fecaltransplant
Glucose level,mmol/L
5.4 (4.8–6.6) 5.5 (5.3–6.9) 5.0 (4.8–5.6) 5.0 (4.9–5.3) 5.0 (4.3–5.8) 5.0 (4.7–5.3)
Insulin level,pmol/L
77 (18–250) 140 (30–287) 220 (150–350) 306 (190–370) 561 (415–900) 760 (650–890)
Glucagon level,ng/L
69 (44–100) 76 (50–115) 52 (35–76) 68 (46–68) 39 (21–61) 46 (23–68)
Free fatty acid level,mmol/L
0.4 (0.3–0.8) 0.5 (0.3–0.8) 0.1 (0.0–0.3) 0.2 (0.1–0.5) a a
Cortisol level,nmol/L
230 (100–475) 175 (135–466) 217 (109–466) 193 (78–364) 207 (56–322) 216 (137–450)
EGP level, �mol/kg/min
9.8 (9.4–12.5) 10.3 (8.8–12.5) 3.8 (1.2–7.8) 4.8 (3.9–12.5) b b
Rd, �mol/kg/min — — 13.6 (7.9–19.9) 10.3 (8.7–13.9) 45.3(10.6–62.0) 19.5(13.5–33.2)Caloric intake, kcal/
day1990 (1440–4020) 2000 (1566–2603) — — — —
REE, kcal/day 2113 (1875–2419) 1905 (1600–2580) — — 2165 (1834–2790) 1836 (1600–2280)
Basal state Clamp (step 1) Clamp (step 2)
Healthy lean male volunteersGlucose level, mmol/L 5.0 (4.0–5.5) 4.9 (4.6–5.1) 4.9 (4.8–5.3)Insulin level, pmol/L 24 (8–83) 162 (132–194) 504 (426–712)Glucagon level, ng/L 51 (38–86) 35 (30–54) 37 (22–44)Free fatty acid level, mmol/L 0.4 (0.3–0.8) 0.1 (0.0–0.2) a
Cortisol level, nmol/L 215 (128–422) 214 (164–474) 191 (113–298)EGP level, �mol/kg/min 13.0 (11.4–14.0) 2.2 (1.3–6.4) b
Rd, �mol/kg/min — 22.5 (18.8–42.9) 65.0 (44.3–82.9)REE, kcal/day 1951 (1598–2514) — 1990 (1670–2488)
OTE. All values are medians (minimum–maximum) (n � 9).1Free fatty acids were below the detection limit.
2EGP was completely suppressed during step 2 clamp.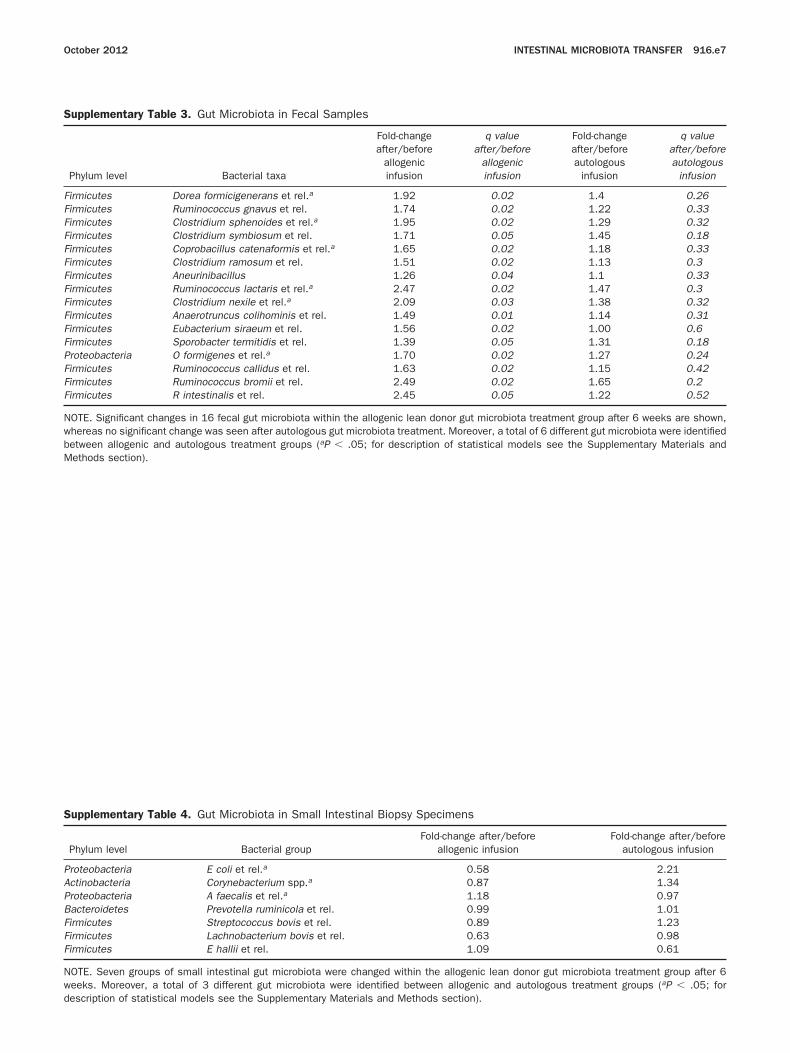
NwbM
PAPBFFF
Nwd
October 2012 INTESTINAL MICROBIOTA TRANSFER 916.e7
Supplementary Table 3. Gut Microbiota in Fecal Samples
Phylum level Bacterial taxa
Fold-changeafter/before
allogenicinfusion
q valueafter/before
allogenicinfusion
Fold-changeafter/beforeautologous
infusion
q valueafter/beforeautologous
infusion
Firmicutes Dorea formicigenerans et rel.a 1.92 0.02 1.4 0.26Firmicutes Ruminococcus gnavus et rel. 1.74 0.02 1.22 0.33Firmicutes Clostridium sphenoides et rel.a 1.95 0.02 1.29 0.32Firmicutes Clostridium symbiosum et rel. 1.71 0.05 1.45 0.18Firmicutes Coprobacillus catenaformis et rel.a 1.65 0.02 1.18 0.33Firmicutes Clostridium ramosum et rel. 1.51 0.02 1.13 0.3Firmicutes Aneurinibacillus 1.26 0.04 1.1 0.33Firmicutes Ruminococcus lactaris et rel.a 2.47 0.02 1.47 0.3Firmicutes Clostridium nexile et rel.a 2.09 0.03 1.38 0.32Firmicutes Anaerotruncus colihominis et rel. 1.49 0.01 1.14 0.31Firmicutes Eubacterium siraeum et rel. 1.56 0.02 1.00 0.6Firmicutes Sporobacter termitidis et rel. 1.39 0.05 1.31 0.18Proteobacteria O formigenes et rel.a 1.70 0.02 1.27 0.24Firmicutes Ruminococcus callidus et rel. 1.63 0.02 1.15 0.42Firmicutes Ruminococcus bromii et rel. 2.49 0.02 1.65 0.2Firmicutes R intestinalis et rel. 2.45 0.05 1.22 0.52
OTE. Significant changes in 16 fecal gut microbiota within the allogenic lean donor gut microbiota treatment group after 6 weeks are shown,hereas no significant change was seen after autologous gut microbiota treatment. Moreover, a total of 6 different gut microbiota were identifiedetween allogenic and autologous treatment groups (aP � .05; for description of statistical models see the Supplementary Materials and
ethods section).Supplementary Table 4. Gut Microbiota in Small Intestinal Biopsy Specimens
Phylum level Bacterial groupFold-change after/before
allogenic infusionFold-change after/before
autologous infusion
roteobacteria E coli et rel.a 0.58 2.21ctinobacteria Corynebacterium spp.a 0.87 1.34roteobacteria A faecalis et rel.a 1.18 0.97acteroidetes Prevotella ruminicola et rel. 0.99 1.01irmicutes Streptococcus bovis et rel. 0.89 1.23irmicutes Lachnobacterium bovis et rel. 0.63 0.98irmicutes E hallii et rel. 1.09 0.61
OTE. Seven groups of small intestinal gut microbiota were changed within the allogenic lean donor gut microbiota treatment group after 6eeks. Moreover, a total of 3 different gut microbiota were identified between allogenic and autologous treatment groups (aP � .05; for
escription of statistical models see the Supplementary Materials and Methods section).
Related Documents