http://doi.org/10.4038/sljm.v28i2.141 Sri Lanka Journal of Medicine Vol. 28 No.2, 2019 24 Received:05/08/2019 Accepted revised version:09/11/2019 Published: 31/12/2019 BRIEF REPORT. BODY FAT AND LIPID PARAMETERS OF MANAGEMENT ASSISTANTS IN A RURAL AREA IN SRI LANKA Senadheera S. P. A. S. 1 , Siriwardhana E. A. R. I. E. 1 , Wickramage S. P. 2 1 Department of Biochemistry 2 Department of Physiology Faculty of Medicine and Allied Sciences Rajarata Universityof Sri Lanka, 50008, Saliyapura, Anuradhapura, Sri Lanka Correspondence: Dr. S. P. A. S. Senadheera, Department of Biochemistry Faculty of Medicine and Allied Sciences RajarataUniversityof Sri Lanka, 50008, Saliyapura, Anuradhapura, Sri Lanka Tel: 094 71 3474466 Email: [email protected] ORCiD ID: https://orcid.org/0000-0002-6556-4996 Abstract Background Fat in certain body compartments has a significant contribution to dyslipidemia. Objective The objective was to determine the fat distribution in various body compartments among management assistants (clerks: sedentary occupational group), from the Anuradhapura Municipal Council area, Sri Lanka and to estimate their lipid profiles for any correlation with fat distribution. Methods In this descriptive cross-sectional study [n=78; males=15(mean age=38(11) years); females=63 (mean age=39(9) years)], weight, height, waist and hip circumferences were measured using standard WHO methods. Body fat was measured using 8 electrode bio impedance analyzer system (HBF375 Karada Scan, Japan). Lipid profile was estimated using colorimetric assay kit methods. Results According to the BMI, 57% of females were obese and 13% were overweight, and 67% of males were obese and 20% were overweight. Abdominal obesity [WC>90cm males; >80cm females] was present in 73% of males and 81% of females. Based on total BF% (males>25%; females>35%-obese), 73% males and 65% females were obese. Twenty nine percent of females and 73% of males had a high visceral fat percentage (>10%). This work is licensed under a Creative Commons Attribution 4.0 International License (CC BY)

Welcome message from author
This document is posted to help you gain knowledge. Please leave a comment to let me know what you think about it! Share it to your friends and learn new things together.
Transcript
http://doi.org/10.4038/sljm.v28i2.141 Sri Lanka Journal of Medicine Vol. 28 No.2, 2019
24
Received:05/08/2019 Accepted revised version:09/11/2019 Published: 31/12/2019
BRIEF REPORT.
BODY FAT AND LIPID PARAMETERS OF MANAGEMENT ASSISTANTS
IN A RURAL AREA IN SRI LANKA
Senadheera S. P. A. S. 1, Siriwardhana E. A. R. I. E. 1, Wickramage S. P.2
1Department of Biochemistry
2Department of Physiology
Faculty of Medicine and Allied Sciences
Rajarata Universityof Sri Lanka, 50008, Saliyapura, Anuradhapura, Sri Lanka
Correspondence: Dr. S. P. A. S. Senadheera, Department of Biochemistry
Faculty of Medicine and Allied Sciences
RajarataUniversityof Sri Lanka, 50008, Saliyapura, Anuradhapura, Sri Lanka
Tel: 094 71 3474466
Email: [email protected] ORCiD ID: https://orcid.org/0000-0002-6556-4996
Abstract
Background
Fat in certain body compartments has a significant contribution to dyslipidemia.
Objective
The objective was to determine the fat distribution in various body compartments among
management assistants (clerks: sedentary occupational group), from the Anuradhapura
Municipal Council area, Sri Lanka and to estimate their lipid profiles for any correlation with
fat distribution.
Methods
In this descriptive cross-sectional study [n=78; males=15(mean age=38(11) years);
females=63 (mean age=39(9) years)], weight, height, waist and hip circumferences were
measured using standard WHO methods. Body fat was measured using 8 electrode bio
impedance analyzer system (HBF375 Karada Scan, Japan). Lipid profile was estimated using
colorimetric assay kit methods.
Results
According to the BMI, 57% of females were obese and 13% were overweight, and 67% of
males were obese and 20% were overweight. Abdominal obesity [WC>90cm males; >80cm
females] was present in 73% of males and 81% of females. Based on total BF% (males>25%;
females>35%-obese), 73% males and 65% females were obese. Twenty nine percent of
females and 73% of males had a high visceral fat percentage (>10%).
This work is licensed under a Creative Commons Attribution 4.0 International License (CC BY)
Sri Lanka Journal of Medicine Vol. 28 No.2, 2019
25
Among the females, 68%, 17%, 92% and among males, 73%, 27%, 80% had
hypercholesterolaemia, hypertriglyceridemia and high LDL levels, respectively. Low HDL
levels were observed in 47% of males and 68% of females. Conicity index (CI) and body
adiposity index (BAI) were at high risk level in 93% of males and 75% of females and 27%
of males and 56% of females, respectively.
Conclusion
The prevalence of overweight and obesity was high among the individuals of the study group
and a majority were unaware that they were dyslipidemic.
Key words: body fat, overweight, management assistants, visceral fat, hypercholesterolaemia
Introduction
Contribution of fat depots in the body on
NCDs
The incidence of overweight and obesity
among Sri Lankans are reported to be
25.2% and 9.2% respectively1. Obesity and
overweight are mainly instigated by excess
body fat (BF) deposition. Overweight and
obesity due to high body fat is associated
with many metabolic disorders including
diabetes mellitus, hypertension and
cardiovascular diseases (CVD)2.
Dyslipidemia which leads to many of the
non-communicable diseases (NCDs) in
obesity and overweight is mainly due to
circulating free fatty acid (FFA) levels
which act upon muscles, pancreatic beta
cells and vascular endothelium. In obesity
or overweight, there is a failure in
regulation of FFA release in response to
insulin/ meal ingestion. This can be
explained by understanding the metabolic
activity of different fat depots in the
human body3.
If the body fat depots are categorized as
upper subcutaneous (USC), lower
subcutaneous (LSC) and visceral, most
dietary fat is deposited in visceral, than in
USC and LSC depots respectively per
gram of tissue4. Therefore, during
lipolysis, visceral fat releases more FFAs
per gram of tissue5. During overnight post
absorptive stage, USC fat depot undergoes
more lipolysis compared to LSC.
Therefore, in the post absorptive stage,
USC fat has a greater contribution to
circulating fatty acids3.
During the fed state, the action of insulin
on suppression of fatty acid release is more
in LSC than USC depot. Thus, even in the
fed state, release of fatty acids is
comparatively higher in the USC depot
than LSC. However, as the large
adipocytes in visceral fat are resistant to
insulin, the highest amount of fatty acids
are released by the visceral depots during
the fed state3. Moreover, visceral depots
release more harmful cytokines and
decrease the release of beneficial
adipokines. FFAs and cytokines released
from visceral depots are taken up by the
liver and are responsible for making
lipoproteins, increasing VLDL and LDL in
the circulation3.
Recent research reveal that more than 60%
of the post prandial circulatory fatty acids
are from USC and not from visceral
depots6. Although the actions and efficacy
of lipolysis in USC and visceral depots is
still under debate, it is proven that both
these depots are responsible in
atherogenicity, USC by increasing
circulatory fatty acids (leading to obesity)
and visceral by uploading visceral
(omental) fatty acids and cytokines to liver

http://doi.org/10.4038/sljm.v28i2.141 Sri Lanka Journal of Medicine Vol. 28 No.2, 2019
26
(leading to atherogenicity). Therefore,
estimation of percentage fat depots in USC
and visceral compartments is beneficial
during screening and preventive measures
of NCDs.
High risk of NCDs in South Asians
When the whole body is considered
according to the three compartment basis,
body fat depots can again be divided in to
superficial subcutaneous, deep
subcutaneous and visceral, which have
different metabolic activity rates.
Therefore, studies have emphasized the
importance of considering regional body
fat distribution than excess adiposity or
BMI in evaluating the risk of CVD and
other metabolic disorders7. In Caucasians,
excess dietary energy is deposited in the
superficial subcutaneous compartment (all
over the body) as fat which is
metabolically inactive. The superficial
subcutaneous compartment of South
Asians is smaller compared to Caucasians.
Hence, excess energy is mainly deposited
in the deep subcutaneous and visceral
compartments as fat in South Asians.
These compartments contain metabolically
active adipose tissues and this leads to the
release of free fatty acids and other lipid
derivatives to the blood stream making
dyslipidemic effects2 thus could influence
the lipid profile. Despite having lower
body fat percentages and lower BMI
compared to Caucasians, higher incidence
of NCDs among South Asian populations
could be explained by the above outcome.
Conversely, obesity strongly depends on
the dietary patterns and the level of
physical activities of individuals8. Nature
of the different occupational categories
determines the physical activity rates and
thereby the body composition and health
status of the workers. Body fat distribution
of working populations, changes in lipid
profile with body fat distribution and
associated risks are yet to be researched in
Sri Lanka.
NCD risk in Anuradhapura – a rural
area in Sri Lanka
According to a survey conducted in 2011,
the prevalence of diabetes in the North
Central province, a rural area of Sri Lanka
was 9.6%. Compared to another rural area
(Uva province – 6.8%) which had a
comparable mean energy consumption of
the population, diabetes prevalence was
higher in the North Central province9.
Anuradhapura is the capital of this
province and it is currently experiencing
drastic changes in human lifestyles,
shifting from an agricultural environment
towards a sedentary framework. As the
changes in lifestyle, dietary patterns and
physical activity could worsen the burden
of metabolic syndrome even in rural areas
in Sri Lanka, people should be educated
regarding the prevention of NCDs via
increasing physical activities.
“Management assistants” who basically
engage in clerical work is an occupational
group categorized under sedentary
physical activity10. The objective of the
present study was to determine the body
fat distribution in various compartments of
the bodies of management assistants
(clerical staff) working in government
sector institutions of the Anuradhapura
municipal council area.
Materials and methods
The study was a descriptive cross sectional
study [n=78; males=15 (mean age =
38(11) years; females=63; mean age=39(9)
years]. All management assistants working
in the government sector offices in
Anuradhapura municipal council area who
volunteered to participate in this study
were recruited after obtaining written
consent. Ethical approval was obtained
from the Ethics Review Committee of the
Rajarata University of Sri Lanka
(Approval No. ERC/2016/10).

Sri Lanka Journal of Medicine Vol. 28 No.2, 2019
27
Anthropometric data
Height and weight of the individuals were
measured using a standardized stadiometer
and a calibrated electronic scale with
digital readout to the nearest 0.1 kg
respectively. BMI was calculated by the
individuals’ body weight (kg) divided by
height (m) squared (kg/m2).
Waist circumference (WC) was measured
at the approximate midpoint between the
lower margin of the last palpable rib and
the top of the iliac crest using a non-
stretchable tape and hip circumference was
measured at the widest portion of the
buttocks11.
Body fat analysis
Body impedance was measured by a pre
validated single-frequency, 8 electrode bio
impedance analyzer system (HBF 375
Karada Scan, Japan)12, 13. Results were
compared with a standard equation derived
through DXA method for body fat
percentage analyzing14. Cutoff of total
body fat for males and females were
considered as 25% and 35% respectively15.
Lipid profile was estimated using
colorimetric assay kit methods
(BIOLABO, France).
Cutoff values considered for the
parameters in the present study are shown
in table 1.
Data analysis
Data were analyzed using SPSS version 18
for Windows and Microsoft Excel 2007.
Data were interpreted as percentages, and
the significant differences between males
and female groups were estimated at 95%
confident interval. Correlations between
parameters were determined by Pearsons’
correlation coefficients.
Results
Socio demographic data and
anthropometric data
The study population included
management assistants with no diagnosed
NCDs (n=78), aged 20-60 years who were
employed in the Anuradhapura municipal
council area. Mean weight, height, waist
circumference, hip circumference and
waist: hip ratios of the population are
shown in table 2.
According to the BMI, in the female
population 57% (36/62) were obese and
13% (8/63) were overweight and in the
male population 67% (10/15) were obese
and 20% (3/15) were overweight.
Abdominal obesity [abdominal obesity:
WC >90 cm males; >80 cm females] was
present in 73% of males and 81% of
females. Based on the W:H ratio 70% of
females were at a high risk and 24% of
females and 40% of males were at a
moderate risk for CVD (W:H = 0.96 – 1.0
for males; 0.81 – 0.85 for females –
moderate risk; >1.1 for males; >0.86 for
females – high risk).
Body fat analysis
Percentage BF values obtained by bio
impedance analyzer system (HBF 375
Karada Scan, Japan) showed a strong
positive correlation (r=0.87, p< 0.00001)
with the values obtained by the equation
derived for Asian men and women, via
DXA method. Fat and skeletal muscle
percentages in different compartments of
males and females are shown in table 3.
Based on total BF% (males >25%; females
>35% - obese), 73% males (11/15) and
65% females (41/63) were obese. Twenty
nine percent of the females and 73% of the
males had a high visceral fat percentage
(>10%). Skeletal muscle percentages in all
compartments were higher in males than
females. However, fat depots percentages

http://doi.org/10.4038/sljm.v28i2.141 Sri Lanka Journal of Medicine Vol. 28 No.2, 2019
28
were higher in females compared to males.
The highest fat percentage in females was
in the arms [49(4.3)] followed by legs
[44(5.6)], while males had comparable fat
percentages in both arms and legs. The
mean visceral fat percentage of males was
5% higher than in females (table 4).
Subcutaneous fat in the whole body, trunk,
legs, arms and total body fat (TBF) was
higher in females, and fat in all the
compartments increased with increasing
age, with a significant rise from the 30s to
40s (table 4 and figure 1). However,
visceral fat in males was higher than that
of females and increased with age, with
Table 1: Cutoff values
Parameter Normal Risk category
FBS [24]
<100 mg/dl – normal;
101 - 126 mg/dl (7.0
mmol/l) – pre diabetic
≥126 mg/dl
(7.0 mmol/l) -
DM
- -
Total
cholesterol
[25]
<150 mg/dl low risk (150-
200 mg/dl)
between 200-
239 mg/dl -
borderline high
risk
> 240 mg/dl -
twice the high
risk
Triglycerides
[25] <150 mg/dl-normal
150-199
mg/dL-
Border line
200-499 mg/dl-
H
500 mg/dl and
above-VH
LDL [25] <100 mg/dl >100 mg/dl - -
HDL [25] 60 mg/dl and above-
best
40-49 M, 50-
59 F – low
risk
< 40- M , < 50-
F high risk -
Atherogenic
index (AI) <0.21 ≥0.21
BAI [26] <34.6% ≥34.6%
CI [27]
<1.25 ≥1.25
Parameter Risk level BMI[28] <23 - normal 23<25 – over weight >25 - obese
Waist [11] <90 cm for males;
<80 cm for females -
normal
>85 cm for females;
>90 cm for males –
high risk
-
Waist:hip
ratio [29]
<0.95 for males;
<0.80 for females –
low risk
0.96 – 1.0 for males;
0.81 – 0.85 for females
– moderate risk
>1.1 for males; >0.86
for females – high risk
FBS = fasting blood glucose; HDL=high density lipoprotein cholesterol; LDL= low density lipoprotein
cholesterol; AI= atherogenic index; CI=conicity index; BAI= body adipocity index; BMI= body mass index
WHO and IDF, 200624
Palo Alto Medical Foundation: South Asians and Cholesterol25
Gadelha et al., 2016 26
Nadeem et al., 2013 27
The Asia-Pacific perspective: Redefining obesity and its treatment, 2000 28
report of a WHO expert consultation, 2008 11
Qiao and Nyamdorj, 2010 29

Sri Lanka Journal of Medicine Vol. 28 No.2, 2019
29
significant increase from 20s to 30s (table
4 and figure 1).
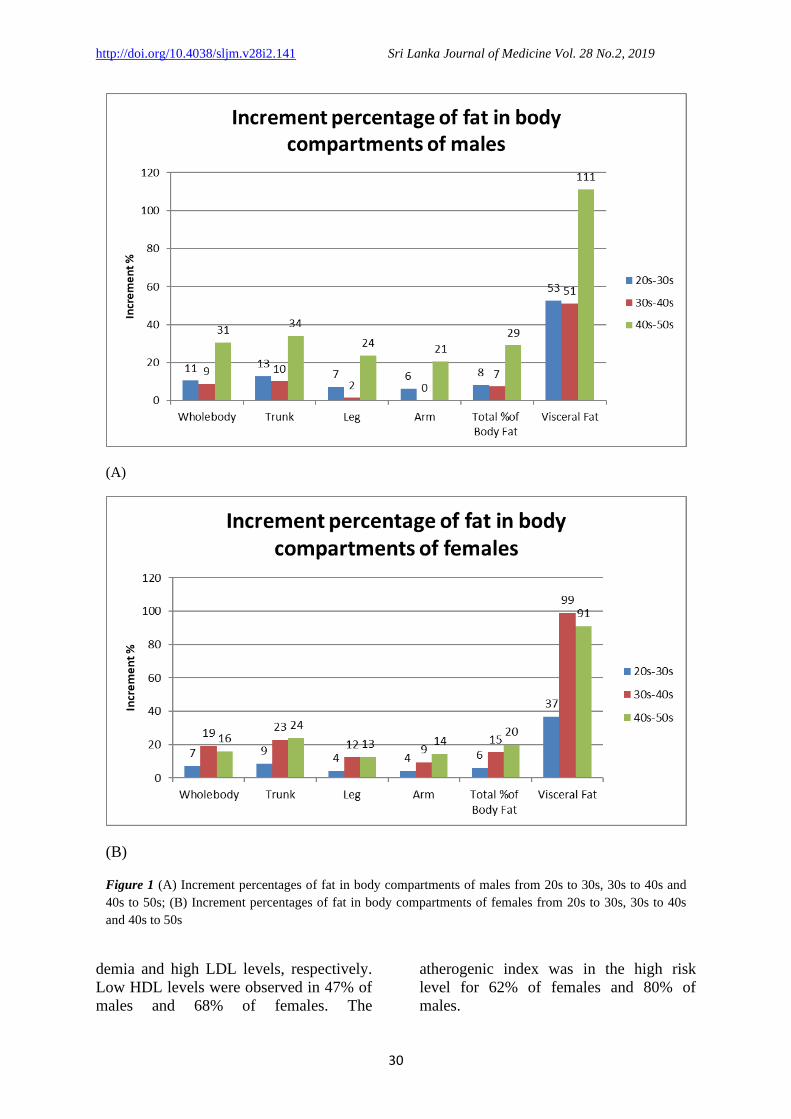
There was a 45.5% increment in visceral
fat in females in the 40s age group
compared to the 30s; while a 36.7%
increment in visceral fat was seen in
females in the 30s age group compared to
the 20s was observed (figure 1). This
indicated that visceral fat percentages in
females increase significantly from the 30s
to 40s. Moreover, from 20s to 30s there
was a 37% visceral fat increase and 99%
and 91% increase from 20s to 40s and 20s
to 50s, emphasizing the rapid rise of
visceral fat depots with increasing age in
males. Compared to the other
compartments, the highest fat depot
increment was observed from 30s to 40s
with a total body fat increment percentage
of 8.7% (figure 1).
The increment of fat in all compartments
in males was highest from 20s to 30s.
Serum cholesterol
Mean serum lipid parameters of the
population are shown in table 5. Mean
lipid parameters and adiposity indexes in
both males and females were above the
normal level (table 5).
From the male population, 3/15 and 2/15
respectively were not aware that they were
having hyperglycemia and pre diabetes.
Four out of 63 and 2/63 of females were
not aware that they were having
hyperglycemia and pre diabetes.
Of the females, 68%, 17%, 92%, and
among the males, 73%, 27%, 80% had
hypercholesterolaemia, hypertriglyceri-
Table 2: Mean weight, height, waist circumference, hip circumference and waist: hip
ratios
Males (n=15) Females (n=62)
Mean age in years 38(11) 39(9)
Mean weight 76(11) kg 60(10) kg
Mean height 168(6) cm 155(6) cm
Mean BMI 27.0(4) 25.6(4)
Mean waist circumference 97(12) cm 89(9) cm
Mean hip circumference 104(7) cm 102(8) cm
Mean waist: hip ratio 0.93(0.07) 0.90(0.04)
Table 3: Fat % and skeletal muscle% in different compartments of males and females
Males (n=15) Females (n=63)
SC SK SC SK
Whole body 19.5(3.5) 30(2.6) 30.9(4.4) 22.8(1.9)
Trunk 18(3.6) 22(3.3) 27.7(4.2) 17.4(2.2)
Leg 27(4.9) 47(2.6) 44.3(5.6) 35.0(1.9)
Arm 27(4.5) 36(2.5) 49.3(4.7) 23.7(3.4)
%TBF 28(4.6) 36.4(4.0)
BMR 1675(165) 1258(1328
Visceral Fat 13(5.5) 8(3.8)
SC- subcutaneous; SK- skeletal muscle; BMR- basal metabolic rate; TBF = Total body fat
Table 4: Fat depot percentages in different age groups
Gender Age Whole body Trunk Leg Arm Total % of Body Fat Visceral Fat
Female
20s 28 24 41 46 33 5
30s 30 27 43 48 35 7
40s 33 30 47 51 38 10
50s 32 30 47 53 40 10
Male
20s 18 16 26 26 26 9
30s 20 18 28 28 28 14
40s 19 18 26 26 28 14
50s 23 21 32 31 33 19
http://doi.org/10.4038/sljm.v28i2.141 Sri Lanka Journal of Medicine Vol. 28 No.2, 2019
30
demia and high LDL levels, respectively.
Low HDL levels were observed in 47% of
males and 68% of females. The
atherogenic index was in the high risk
level for 62% of females and 80% of
males.
(A)
(B)
Figure 1 (A) Increment percentages of fat in body compartments of males from 20s to 30s, 30s to 40s and
40s to 50s; (B) Increment percentages of fat in body compartments of females from 20s to 30s, 30s to 40s
and 40s to 50s

Sri Lanka Journal of Medicine Vol. 28 No.2, 2019
31
The conicity index and body adiposity
index were at high risk level in 93% of
males and 75% of females and 27% of
males and 56% of females, respectively.
Among the females with
hypercholesterolemia (43), 26 were in the
ages of 20s and 30s (66.6% of females
were in their 20s and 30s). Among the
males with hypercholesterolemia (11), 4
were in the ages of 20s and 30s.
Correlations
Correlations between parameters are
shown in table 6.
Table 5: Mean serum lipid parameters
Males (n=15) Females (n=63)
FBS 97(40) mg/dl 84(28) mg/dl
Total cholesterol 234(76) mg/dl 245(67) mg/dl
TAG 122(47) mg/dl 103(53) mg/dl
HDL 41(8) mg/dl 45(11) mg/dl
LDL cal 169(73) mg/dl 179(63) mg/dl
AI 0.46(0.19) 0.31(0.28)
CI 1.32(0.07) 1.32(0.11)
BAI 29.70(4.37) 35.38(5.39) FBS = fasting blood glucose; TAG=triacylglycerol; HDL=high density lipoprotein cholesterol; LDL (cal)=
calculated value of low density lipoprotein cholesterol; AI= atherogenic index; CI=conicity index; BIA=
body adipocity index
Table 6: Correlations between anthropometric parameters and lipid parameters
TAG HDL AI CI BAI
WC *0.33
(p= 0.0032)
**-0.46
(p<0.0001)
**0.43
(p<0.0001)
***0.60
(p<0.0001)
**0.55
(p<0.0001)
W:H *0.32
(p=0.0043)
*-0.34
(p=0.0023)
**0.40
(p=0.00028)
**0.46
(p<0.0001)
Whole body SC - - - *0.24
(p=0.034307)
****0.82
(p<0.0001)
Trunk SC - - - *0.28
(p=0.013034)
****0.85
(p<0.0001)
Leg SC - - - - ****0.80
(p<0.0001)
Arm SC - - - - ***0.69
(p<0.0001)
TBF - - - *0.31
(p=0.0057)
****0.81
(p=0.0057)
BMI - **-0.41
(p=0.000193)
*0.31
(p=0.0057)
*0.38
(p=0.0006)
***0.70
(p=0.0057)
Visceral fat - *-0.37
(p=0.0008)
*0.32
(p=0.0043)
*0.37
(p=0.0008)
**0.52
(p<0.0001)
*weak correlation; **moderate correlation; ***strong correlation; ****very strong
correlation
SC=subcutaneous; WC=waist circumference; W:H=waist: hip ratio; TBF=total body fat;
BMI=body mass index AI, CI, BAI

http://doi.org/10.4038/sljm.v28i2.141 Sri Lanka Journal of Medicine Vol. 28 No.2, 2019
32
Waist circumference had a moderate
negative correlation with HDL and
moderate positive correlations with AI and
BAI and a strong correlation with CI. BAI
had very strong correlations with whole
body SC, trunk SC and total body fat,
strong correlations with arm SC and BMI
and moderate correlation with visceral fat.
Visceral fat had weak positive correlations
with AI and CI, weak negative correlation
with HDL and a moderate positive
correlation with BAI.
Discussion
The present study reveals that a
considerable number in this population is
at a high risk for NCDs and many are not
aware that they have a high BMI,
dyslipidaemia or diabetes. Both males and
females should to pay more attention to
body fat deposition and alterations of
serum parameters related to NCDs, in their
20s and 30s, as there is a radical increase
in body fat deposition during this age,
which reaches a plateau in the 40s and 50s.
As the literature indicates, this age related
body fat changes could be due to the
decrease in lower body fat and increase in
visceral fat which has been observed in the
present study as well. Some studies
elucidate that the age related fat percentage
changes could be due to a decrease in lean
mass and bone minerals, despite body fat
increase with age. Therefore, some
researchers emphasize that the total
percentage body fat increase could be due
to the decrease in lean mass with age.
However, the percentage abdominal fat
increase could be due to excess fat
deposition in the abdominal region15.
Furthermore, the risk of NCDs increases
with age due to fat deposition in the heart,
liver and skeletal muscles, making these
organs resistant to insulin. Moreover, there
are reductions in the mass of individual
organs/tissues with increasing age and thus
in tissue-specific organ metabolic rate.
This could be responsible in decreasing
overall resting metabolic rate, which will
also increase the fat mass and reduce fat-
free mass16.
A considerable number of individuals in
the present study were unaware that they
were dyslipidemic or prediabetic or
diabetic. A study conducted in the North
Central province in 2016 (n=24) with a
non diabetic population revealed that
hypercholesterolemia, hypertriglyceri-
demia, reduced HDL levels and increased
LDL levels were present in 37.5%, 42.0%,
16.7%, 41.7% of individuals whose BF%
were ≥ 30%, respectively17. In the present
study, 68%, 17%, 92% of females and
73%, 27%, 80% of males had
hypercholesterolaemia, hypertriglyceri-
demia and high LDL levels, respectively.
Low HDL levels were observed in 47%
males and 68% in females. Except for the
percentage of population with
hypertriglyceridemia, all percentages with
other dyslipidemic conditions were higher
than the study conducted in 2016. This
could be due to the higher sample size of
the present study. This indicates a large
number of “healthy” individuals in Sri
Lanka are unaware that they are having
NCDs and this might become a
considerable burden in the near future,
weighing down on the country’s economy.
A visceral fat rate ≥ 7, total body fat above
34% and WC above 88 cm are risk factors
for metabolic syndrome in women18. Half
(50.8%) of the females (32/63) of the
present study were at or exceeding these
risk levels.
In the present study, visceral fat had weak
positive correlations with AI and CI, a
weak negative correlation with HDL and a
moderate positive correlation with BAI.
This indicates that compared to fat depots
in other compartments of the body,
visceral fat causes a significant
contribution to the lipid profile, mainly
affecting HDL levels. This is further
Sri Lanka Journal of Medicine Vol. 28 No.2, 2019
33
proven by the correlations elicited by the
WC (a moderate predictor of visceral fat19)
with TAG, HDL, AI, CI and BAI. When the whole population of the current
study is considered, the mean fat
percentages obtained for different body
compartments [trunk 25.8(5.7)%; legs
41.0(8.7)%; arms 45.0(10.0)%] were
considerably higher than the values
obtained in a similar study in India
conducted using a BIA -Omron Karada
Scan (Model HBF -510, Japan), which
elicited the fat percentage of the trunk, legs
and arms to be 22.9 ±6.9%, 27.9 ±8.1%
and 29.0 ±9.2% respectively20. Another
study conducted to measure BF of South
Asians by Foot to Foot BIA method and
BOD POD method (n=80), obtained
results of 21.94±7.88% and 26.20±8.47%,
BF respectively by the two methods. The
mean age of that population was
27.78±10.49 years, (42.5% were women)
and the mean BMI was 22.68±3.51 kg m−2 21. The BF% of the group with a mean age
of 26.8(2.7) years [BMI=24.9(4.1)] in the
present study (n=63) had 29.5(5.1)% mean
BF. Therefore, the above outcomes
indicate that the population of the present
study, mainly the female population, had
higher body fat values and had more NCD
risk factors compared to the other South
Asian populations. A study conducted in Sri Lanka in 2013
with a BC 418, Tanita, Japan BIA,
revealed that the BF% of men (age
26.7 ± 6.6years) was 19.5 ±6.6 and females
was 28.0 ± 6.0 and 34.7 ± 4.3 (when the
age groups were 25.9 ± 7.2 years and
47.3 ± 4.9 years, respectively)22. The total
BF% of males in the present study was
17.7(3.9) (age 20s) and that of females was
28.0(3.7) (age 20s) and 33.3(2.7) (age 40s)
which were comparable to the previous
study. A Sri Lankan healthy population
(n=100) with a mean age of
37.4 ± 3.5 years, BMI 23.9 ± 4.1 described
a 37.2 ± 5.2 mean fat mass % when fat
mass was determined by 2H2O dilution
technique for body composition analysis.
In the present study, for the same age
group of women, comparable results were
obtained [mean age 34.2(3), BMI
24.9(4.1), BF% 35.2(3.9)]. Furthermore,
that study elucidated that the fat mass
percentages calculated by applying
Density (obtained by Durnin and
Womersley equation) to Siri and Brozeket
al equations and to the equation developed
by de Lanerolle-Dias et al. significantly
(p < 0.001) underestimated %FM
compared to the 2H2O dilution23.
Conclusion The incidence of overweight and obesity
and high fat percentages in various body
compartments were higher among females
compared to males in the tested population
and higher than the values obtained for the
same parameters in prior studies with
international populations. A considerable
number of the population is not aware that
they are dyslipidemic, diabetic or
overweight. This indicates that
standardization of the body fat percentage
values and establishment of cutoff values
for Sri Lankans and awareness
programmes are mandatory to minimize
the risk of developing non communicable
diseases.
List of Abbreviations BF – Body fat
WC – waist circumference
HDL – High density lipoprotein
cholesterol
LDL – Low density lipoprotein cholesterol
CI – Conicity index
BAI – Body adiposity index
CVD – Cardio vascular diseases
NCD – Non communicable diseases
FFA – Free fatty acids
USC – Upper subcutaneous
LSC – Lower subcutaneous
BMI – Body mass index
TAG - Triacylglycerol
BIA – Body impedance analyzer

http://doi.org/10.4038/sljm.v28i2.141 Sri Lanka Journal of Medicine Vol. 28 No.2, 2019
34
Acknowledgements –
Authors wish to acknowledge the Rajarata
University research grant (RJT/RP &
HDC/2016/FMAS/R/03) for the financial
support.
Authors wish to acknowledge Fernando
SDNP, Nawarathna KGNMCK, Martin
ASJ, Herath UGHMNPB, Gunarathna
KGHP, Kularathna DGS., Kulugammana
MBCN, Gunathilaka WMBRS,
Aluthgedara ISK for their technical
support.
References
1. Katulanda P, Jayawardena MA, Sheriff
MH, Constantine GR, Matthews DR.
Prevalence of overweight and obesity
in Sri Lankan adults. Obesity Reviws.
2010;11(11):751-6. doi:
10.1111/j.1467-789X.2010.00746.x.
2. Sniderman AD, Bhopal R,
Prabhakaran D, Sarrafzadegan N,
Tchernof A. Why might South Asians
be so susceptible to central obesity and
its atherogenic consequences? The
adipose tissue overflow hypothesis.
International Journal of Epidemiology.
2007;6(1):20-225.doi:
10.1093/ije/dyl245
3. Jensen MD, Role of Body Fat
Distribution and the Metabolic
Complications of Obesity. Journal of
Clinical Endocrinology and
Metabolism. 2008;93(11 Suppl
1):S57–S63.doi: 10.1210/jc.2008-
1585.
4. Marin P, Andersson B, Ottosson M,
Olbe L, Chowdhury B, Kvist H, Holm
G, Sjostrom L, Bjorntorp P. The
morphology and metabolism of
intraabdominal adipose tissue in men.
Metabolism.1992;41:1242–8.
5. Jensen MD, Gender differences in
regional fatty acid metabolism before
and after meal ingestion. Journal of
Clinical Investigation. 1995; 96(5):
2297–2303. doi: 10.1172/JCI118285
6. Nielsen S, Guo ZK, Johnson CM,
Hensrud DD, Jensen MD. Splanchnic
lipolysis in human obesity. Journal of
Clinical Investigation. 2004;113:1582–
8.
7. Després JP. Body Fat Distribution and
Risk of Cardiovascular Disease.
Circulation. 2012;26:1301-
13.doi:10.1161/CIRCULATIONAHA.
111.067264
8. Popkin BM. The nutrition transition
and obesity in the developing world.
Journal of Nutrition.
2001;131(3):871S–3S.
9. Katulanda P, Rathnapala DAV, Sheriff
R, Matthews DR. Province and ethnic
specific prevalence of diabetes among
Sri Lankan adults. Sri Lanka Journal
of Diabetes Endocrinology and
Metabolism.2011;1:2-7.
10. Steeves JA, Tudor-Locke C, Murphy
RA, King GA, Fitzhugh EC, Harris
TB. Classification of occupational
activity categories using
accelerometry: NHANES 2003–2004.
International Journal of Behavioral
Nutrition and Physical Activity. 2015;
12: 89. doi: 10.1186/s12966-015-
0235-z
11. Waist circumference and waist–hip
ratio: report of a WHO expert
consultation. World Health
Organization. Geneva. 2008;1-47.
12. Saiyed SH, Sekhar A. A study on
anthropometric measurements ,
Nutritional status and Body
composition of the Night shift BPO
executives. International
Journal of Pure &
Applied Bioscience.2015;3(3): 65–9.
Sri Lanka Journal of Medicine Vol. 28 No.2, 2019
35
13. Chintala KK., Krishna BH, Pradesh A,
Heart Rate Variability in Overweight
Health Care Students: Correlation with
Visceral Fat. Journal of Clinical and
Diagnostic Research.
2015;9(1):CC06–CC08.doi:
10.7860/JCDR/2015/12145.5434
14. Gallagher D, Heymsfield SB, Heo M,
Jebb SA, Murgatroyd PR, Sakamoto
Y. Healthy percentage body fat ranges:
an approach for developing guidelines
based on body mass index. American
Journal of Clinical Nutrition.
2000;72(3):694-701.
15. Deurenberg P, Yap M, van Staveren
WA. Body mass index and percent
body fat: a meta analysis among
different ethnic groups. International
Journal of Obesity Related Metabolic
Disorders. 1998;22:1164–71.
16. St-Onge MP, Gallagher D. Body
composition changes with aging: The
cause or the result of alterations in
metabolic rate and macronutrient
oxidation?. Nutrition.2010;26(2):152–
155. doi:10.1016/j.nut.2009.07.004.
17. Rathnayake G, Perera R, Hettiaratchi
U, Do the lipid profiles of Type 2
Diabetes Mellitus patients and controls
differ based on their body fat
percentage and visceral fat
levels?.Journal of Clinical Lipidology.
2016; 10(3):663-664.
18. Bintvihok W, Chaikittisilpa S,
Panyakamlerd K, Jaisamrarn U,
Taechakraichana N. Cut-off value of
body fat in association with metabolic
syndrome in Thai peri- and
postmenopausal women. Climacteric.
2013Jun; 16(3):393-7.
doi:10.3109/13697137.2012.762762.
19. Li X, Katashima M, Yasumasu T, Li
KJ. Visceral fat area, waist
circumference and metabolic risk
factors in abdominally obese Chinese
adults.
Biomedical and Environmental Science
s.2012;25(2):141-8.
20. Solanki JD, Makwana AH, Mehta HB,
Kamdar P, Desai C, Gandhi P.
Comparison of Regional Variation Of
Body Composition In Type 2 Diabetics
And Matched Controls Of An Urban
Area Of Gujarat, India Using Bio-
Electrical Impedance Method.
International Journal of Basic and
Applied Physiology. 2013;2(1):94-8.
21. Kalra S,Mercuri M, Anand SS.
Measures of body fat in South Asian
adults. Nutrition and Diabetes. 2013
May;3(5):e69.doi:10.1038/nutd.2013.1
0
22. Ranasinghe C, Gamage P, Katulanda
P, Andraweera N, Thilakarathne S,
Tharanga P. Relationship between
Body mass index (BMI) and body fat
percentage, estimated by bioelectrical
impedance, in a group of Sri Lankan
adults: a cross sectional study. BMC
Public Health. 2013;13:797.
doi:10.1186/1471-2458-13-797.
23. Waidyatilaka I, de Silva A, de
Lanerolle-Dias M, Atukorala S,
Lanerolle P. A field tool for prediction
of body fat in Sri Lankan women:
skinfold thickness equation. Journal of
Health, Population and Nutrition.
2016; 35:31.DOI 10.1186/s41043-016-
0069-6
24. WHO/ IDF, Definition and diagnosis
of diabetes mellitus and intermediate
hyperglycemia,Report of a WHO/ IDF
consultation, 2006. Available at:
https://www.idf.org/webdata/docs/WH
O_IDF_definition_diagnosis_of_diabet
es.pdf
https://www.ncbi.nlm.nih.gov/pubmed/?term=St-Onge%20MP%5BAuthor%5D&cauthor=true&cauthor_uid=20004080

http://doi.org/10.4038/sljm.v28i2.141 Sri Lanka Journal of Medicine Vol. 28 No.2, 2019
36
25. Palo Alto Medical Foundation South
Asians and Cholesterol: Available
at:http://www.pamf.org/southasian/sup
port/handouts/cholesterol.pdf
26. Gadelha AB, Neri SGR, Safons MP,
Moreira SR, Lima RM, Comparisons
between body adiposity indexes and
cutoff values in the prediction of
functional disability in older women.
SciELO Analytics. 2016;18(4).
27. Nadeem A, Naveed AK, Hussain MM,
Raza SI. Cut-off values of
anthropometric indices to determine
insulin resistance in Pakistani adults.
Journal of Pakistan Medical
Association. 2013;63(10):1220-5.
28. The Asia-Pacific perspective:
Redefining obesity and its treatment.
Coordinated by the International
Diabetes Institute, World Health
Organization Collaborating Centre for
the Epidemiology of Diabetes Mellitus
and Health Promotion for Non-
communicable Diseases. 2000.
http://www.wpro.who.int/nutrition/doc
uments/docs/Redefiningobesity.pdf.
29. Qiao Q, Nyamdorj R. The optimal
cutoff values and their performance of
waist circumference and waist-to-hip
ratio for diagnosing type II diabetes.
European Journal of Clinical
Nutrition. 2010;64(1):23-9.
doi:10.1038/ejcn.2009.92.
Related Documents


