BRIEF FACTS OF HIMACHAL PRADESH 2012-13 ECONOMICS AND STATISTICS DEPARTMENT HIMACHAL PRADESH

Welcome message from author
This document is posted to help you gain knowledge. Please leave a comment to let me know what you think about it! Share it to your friends and learn new things together.
Transcript

BRIEF FACTS OF
HIMACHAL PRADESH
2012-13
ECONOMICS AND STATISTICS DEPARTMENT HIMACHAL PRADESH

PREFACE
The “Brief Facts about Himachal Pradesh” is designed to present, in a concise form, the principal statistical series currently available in respect of all important aspects of the economy of Himachal Pradesh.
The Twenty issue of ‘Brief Facts’ has been
brought out by the department with the ideas that this small handy booklet is proving very useful to those who use statistical data frequently and quickly and do not have the time or facility to refer to the more detailed publications of this department.
This booklet has been compiled in the Official
Statistics Section of the Directorate. Pradeep Chauhan Economic Adviser Govt.of Himachal Pradesh.

CONTENTS
TABLE Page Brief Facts about H.P. (ii)-(xi) I-GENERAL 1.1 Economic indicators 1-6
II-AREA AND POPULATION : 2.1 Area and population-2011 Census 7 2.2 Classified population -2011 Census 8 2.3 Urbanisation-Comparative study-2001 and 2011 9 2.4 District-wise Handicapped population 2001. 10 2.5 Distribution of Main & Marginal workers 2011 11 2.6 Scheduled Castes Population-2011-Census 12 2.7 Scheduled Tribes Population-2011-Census 14 2.8 Area 2011 Census 2.9 Projected population of Himachal Pradesh 2.10 No. of Households-2011Census. III-AGRICULTURE : 3.1 Land utilization 3.2 Net irrigated area 3.3 Area under principal crops in H.P. 3.4 Production of principal crops 3.5 Consumption of Fertilizers in Terms of Nutrients 3.6 Area Under High Yielding Variety Crops
16 17 18
19 20 21 22 23 24
IV-HORTICULTURE :
4.1 Area under fruits 25 4.2 Production of fruits 26 V-CLIMATE 5.1 Rainfall 27

TABLE Page VI
FOREST 6.1
: Forest area according to legal classification
28 6.2 Outturn and Value of major and minor forest products 28 VII-LIVESTOCK : 7.1 Livestock and poultry 29 7.2 Veterinary Institution 30 7.3 Average Daily Milk Yield per animal/ Total
Milk Production
31 VIII-FISHERIES :
8.1 Fisheries 32 IX -EDUCATION : 9.1 Education 33 9.2 Literacy 34 X-HEALTH AND FAMILY WELFARE : 10.1 Progress of family planning 35 10.2 Medical and public health 36 10.3 Birth and Death Rate H.P. 37 10.4 Achievement under universal Immunization Programme 38 XI- FOOD AND SUPPLIES :
11.1 Import of essential commodities 39 11.2 Number of fair price shops 40 XII-POWER :
12.1 Installed capacity in H.P. 40 12.2 Electricity generated and consumed 41

TABLE XIII-CO-OPERATION
Page
13.1 Co-operative movement 42 XIV-TRANSPORT AND COMMUNICATIONS : 14.1 Road Length 45 14.2 Nationalized transport 46 14.3 Number of post offices and letter boxes 47
XV-INDUSTRIES : 15.1 District-wise number of factories registered and
workers
48 XVI-BANKING : 16.1 Scheduled commercial banks 49 XVII-CRIMES :
17.1 Crimes in H.P.
50
XVIII-EMPLOYMENT : 18.1 Registration and placing work done by Employment
Exchanges 51
18.2 H.P. Govt. Employees 52 XIX-PLANNING : 19.1 Annual Plan 53

TABLE Page XX-ECONOMIC CENSUS : 20.1 Number of enterprises and number of persons usually
working 54
XXI-STATE INCOME 21.1 Comparison of movement of gross state domestic
product at factors cost
56 XXII-PUBLIC FINANCE :
22.1 Overall budget of H.P. 58 XXIII-STATE FINANCE 23.1 Number of CST Registered in H.P. 62 XXIV- MISCELLANEOUS : 24.1 Small savings 63 24.2 Number of Tourists Visited in H.P. 64 24.3 Consumer price index numbers for
industrial workers
65 24.4 Consumer price index numbers for
industrial workers in H.P.
66 24.5 Index numbers of wholesale prices by
group in Indian Union
67 24.6 Height of important places 68 24.7 Survey on poor families(2002-07)-Rural 69

CONVERSION FACTORS AREA 1 Acre 0.404686 Hectares 1 Square mile 2.590 sq. Kilometres 1 Square mile 640 Acres- 259 Hectares 1 Square yard 0.84 sq. metres 1 Hectare 2.47105 Acres WEIGHT 1 Ounce 28.3495 Grams 1 Pound 0.45359 Kilograms 1 Maund 0.373 Quintal 1 Kilogram 2.2046 Pounds 1 Metric ton 1000 kilograms LENGTH 1 Inch 2.54 Centimetres 1 Centimetre 0.3937 Inch 1 Metre 1.09 Yards 1 Kilometre 0.62 Mile VOLUME 1 Cubic yard 0.7646 Cubic metre 1 Cubic metre 1.3079 Cubic yards 1 Cubic yard 35.3133 Cubic feet CAPACITY 1 Imperial gallon 4.54596 Litres 1 Litre 0.22 Imperial gallon
(i)

BRIEF FACTS ABOUT HIMACHAL PRADESH Historical Background: Himachal Pradesh came into being on 15th April, 1948 as a centrally administered territory by the integration of 30 erstwhile princely States. At that time the State had four districts viz. Chamba, Mahasu, Mandi and Sirmaur and its area was 25,839 sq. kms. Later in 1951, it became a part “C” State under a Governor with a 36 Member Legislative Assembly and a three member cabinet. In 1954, Bilaspur, another part ‘C’ State was merged with Himachal Pradesh thereby adding one more district with an area of 1,168 sq. kms. And the strength of its Assembly was raised to 41. In 1956, despite the majority recommendations of the State Re-organisation Commission for its merger with Punjab, Himachal Pradesh retained its separate entity. On November 1, 1956 it again became a Union Territory under an Administrator designated as Lieutenant Governor and its Assembly was abolished. In 1960, a new border district of Kinnaur was carved out of Mahasu district. Then in 1963, Assembly was revived and a popular Ministry was formed. Till October, 1966 the old Himachal Pradesh comprised the six hill districts of Bilaspur, Chamba, Kinnaur, Mahasu, Mandi and Sirmaur with an area of 27,007 sq. kms. Having a population of 13,51,144 persons(1951 Census).
(ii)

On 1st November, 1966, it was enlarged by merging the district of Kangra, Shimla, Kullu, Lahaul-Spiti, the Nalagarh tehsil of Ambala district, some parts of Una tehsil of Hoshiarpur district and Dalhousie of Gurdaspur district of the then Punjab State. With this merger the total area of Himachal Pradesh increased to 55,673 sq. kms. And its population to 28,12,463(1961 Census). Now it comprised the Districts of Bilaspur, Chamba, Kangra, Kinnaur, Kullu, Lahaul-Spiti, Mahasu, Mandi, Shimla and Sirmaur. On 25th January, 1971, Himachal Pradesh attained Statehood.
Reorganisation of the districts took place on 1st September, 1972 as a consequence whereof two more new districts namely Una and Hamirpur were created mainly as a result of trifurcation of the erstwhile Kangra district. Also from the then existing districts of Mahasu and Shimla, new districts of Shimla and Solan were formed by reorganizing the boundaries of old districts. Presently, the strength of Legislative Assembly of Himachal Pradesh is 68. To the Union Legislature, Himachal Pradesh is represented by 4 Members to Lok Sabha and 3 Members to Rajya Sabha. The Pradesh has got a High Court and a Public Service Commission located at Shimla. There are Five Govt. Universities in the Pradesh. One for general education with its seat at Shimla, the other Agricultural University with its seat at Palampur, the third is Horticulture and Forestry University with its seat at Nauni(Solan),Fourth Technical University with its seat at Hamirpur and Fifth is Center University with its seat at Dharamshala in Kangra District (H.P.)
(iii)

Physical Features: Himachal Pradesh is almost wholly mountainous with altitudes ranging from 350 metres to 6,975 metres above the mean sea level. Its location is between Latitude 30o 22’40” N to 33o 12’40” N and Longitude 75o 45’55”E to 79o 04’20” E. It has deeply dissected topography complex geological structure and a rich temperate flora in the sub-tropical latitudes. Physiographically, the State can be divided in to five zones-viz. (i) Wet Sub-temperate zone,(ii) humid sub-temperate zone, (iii) dry temperate-alpine high lands, (iv) humid sub-tropical zone, and(v) sub-humid sub-tropical zone. Wet sub-temperate zone comprises Palampur and Dharamshala of Kangra district, Jogindernagar area of Mandi district and Dalhousie area of Chamba district, humid sub-temperate zone comprises the district of Kullu, Shimla, parts of Mandi, Solan, Chamba, Kangra and Sirmaur, Dry temperate- Alpine High lands include major parts of Lahaul-Spiti, Pangi and Kinnaur, humid sub-tropical zone consists of Bilaspur, Bhattiyat valley of District Chamba, Nalagarh area of District Solan, Dehragopipur and Nurpur areas of district Kangra and sub-humid tropical zone comprises of District Una, Paonta-Sahib area of District Sirmaour, and Indora area of District Kangra.
(iv)

Climate: Himachal Pradesh lies in the lap of Himalayas. Its climate is largely conditioned by that single factor. It varies from mild to cold with area under snowing winters. The normal rainfall is 1278 mm. The maximum rainfall is in Kangra district. Soils: The soils of Himachal Pradesh can be broadly divided into nine groups on the basis of their development and physiochemical properties. These groups are alluvial soils, brown hill soils, brown earths, brown forest soils, grey wooded or podzolic soils, grey brown podzolic soils, plansolic soils, humus and iron podzols and Alpine humus mountain skeletal soils. Rivers: Rivers which flow through this State are Beas in Kullu, Mandi and Kangra districts, Satluj in Kinnaur, Shimla and Bilaspur districts, Yamuna has its tributaries in Shimla and Sirmaur districts, Chenab (Chander Bhaga) flows through Lahaul-Spiti and Chamba districts and Ravi through Chamba district.
(v)

All these rivers are snow-fed and hence perennial. Besides the natural reservoirs and the large drops available in the river courses provide immense potential for hydel power generation at a low cost. Population: Himachal Pradesh extends over an area of 55,673 sq. kms. According to 2011 census, the total population of the state is 68,64,602 with a density of 123 persons. The highest density 407 is in Hamirpur district and the lowest 2 in Lahaul-Spiti district. According to 2011 census, Number of females per thousand males is 972. The decennial growth rate is 12.9 per cent during 2001-2011. Livestock Population: According to 2007 livestock census, the total livestock population in the State was 52,16,686 and the total poultry was 8,O9,546.
Land Holdings : There is a preponderance of small land holdings in the Pradesh. According to 2005-06 Agricultural Census, the holdings of less than one hectare accounted for 68.3 per cent of the total holdings whereas the area covered by these holdings formed only 26.7 per cent of the total area. If small farmers are also taken into account with marginal farmers, then the percentage of holdings comes to 87.1 whereas the area coverage upto 2.0 hectares size-class is only 25.3 per cent.The Average size of holding was 1.0 hectares in 2005-06.
vi

Agriculture : Agriculture is the main occupation of the people of the state. About 69 per cent of the main workers are engaged in agricultural pursuits. Agriculture is beset with the disadvantage of small holdings. Only 75 per cent of the total reporting area is available for cultivation. Out of this area, ‘net area sown’ and ‘current fallows’ account for only 13 per cent. There is hardly any scope for mechanized farming due to preponderance of small holdings and terraced fields. Against all these odds, the farmers of Himachal Pradesh are constantly endeavoring to exploit fully the agricultural potential of the State to increase food production and also to supplement the income by producing quality cash crops. Wheat, barley, paddy and maize are the important cereal crops under cultivation. Seed potato, ginger and off-season vegetables are the important cash crops. There is potential for the development of crops like hops, mushrooms, olives, saffron and zeera.
(vii)

Horticulture : Horticulture in the upper reaches and mid hills and cereals in the valley seems to be the schematic design of the things, the nature has designed of Himachal Pradesh. Himachal Pradesh Government and the farmers have seized this opportunity and today this Pradesh has emerged as the ‘Horticultural State of India’. Apple is the major horticultural crop, the production of which was 412.36 lakh tonne during 2012-13. Bulk of the apple is produced in five districts viz. Shimla, Kullu, Mandi, Kinnaur and Chamba. Power : Himachal Pradesh State Electricity Board is engaged in the investigation and execution of various hydro electric projects and transmission and distribution of electricity. It is a matter of satisfaction that despite very difficult and mountaineous terrains almost all the inhabited villages in the State have been electrified. Himachal Pradesh has a vast hydro electric potential which is estimated at 23,000 MW. The total installed capacity (hydro and diesel) in Himachal Pradesh as on 31st March, 2013 was 477.5 MW (Hydro 477.4 MW and diesel 0.1 MW). (viii)

Industries : Himachal Pradesh has made significant achievements in the field of industrialization. The process of industrialization in the State started during the eighties and gained momentum during the decade. Up to December,2012, there were 494 medium and large scale industries and about 38,592 small scale industries with a total investment of Rs. 16,588.56 crore in the State. These industries provide employment to about 2.11 lakh persons. Roads : In a hilly state like Himachal Pradesh, the entire progress depends primarily on the development of roads. It is not possible to provide appreciable length of railways in these areas. No movement of any type of material and persons in various fields like agriculture, horticulture, industry is at all possible unless there is a well developed system of roads and road transport. Thus the roads constitute the very life line of Himachal’s economy. The density of motorable roads per 100 sq. kms. Of area in Himachal Pradesh stood at 59.21 km. as at the end of 2012-13. Transport : Road transport is the principal mode of transportation in Himachal Pradesh. Passenger Transport is managed by a Government Owned Himachal
(ix)

Road Transport Corporation(H.R.T.C.). As on 31st March, 2013 this Corporation had 2076 buses, 16 trucks and 51 other vehicles. There are only two narrow gauge railway lines connecting Shimla with Kalka (96km.) and Jogindernagar with Pathankot(113 km.)and one 33 km. broad gauge railway line from Nangaldam to Charuru for Una District. At present there are only three Airports namely Shimla at Jubbar Hatti, Kangra at Gaggal and Kullu at Bhuntar. Education: In terms of literacy, literacy percentage of the Pradesh has increased from 76.5 in 2001 to 82.8 in 2011 as against All-India literacy rate of 74.0 per cent to achieve 100 percent literacy in the State, a literacy mission has been started in each district with the co-ordination of Primary Education Deptt. And the Distt. Saksharta Samiti under the chairmanship of Deputy Commissioners. (x)

There were Functional 10,739 Primary, 2,317 Middle Schools and 2,162 High/10+2 Schools as on 31 March, 2013. Public Health and Family Welfare: Due to successful implementation of various health programmes the health of the people of the State has improved. Special attention has been paid to the provision of health and medical care services in the remotest rural areas of the Pradesh. Disease control and eradication programmes have given rich dividends. Total number of medical institutions in Government sector stood at 3,824 on 31st March, 2013. State Income: According to quick estimates, the per capita income of Himachal Pradesh in 2012-13(Advance) stood at Rs.82611. This shows an increase of 10.60 percent over 2011-12(Rs.74694) in the State. (xi)

I- GENERAL 1.1- ECONOMIC INDICATORS Sl. No.
Item Unit Year Parti-culars
1 2 3 4 5LOCATION
1. (a) Latitude 300 22’ 40” N to 33’ 12’ 40” N (b) Longitude 750 45’ 55” E to 79’ 04’ 20” E (c) Height from mean sea Level from 350 metre to 6,975 metre
AREA2. Total area Sq.Kms. 2011 55,6733. Area under forests ” 2011-12 37,033
POPULATION4. Total population No. 2011 68646025. Density of population
per Sq. Km. ” 1236. Decennial growth rate Percent 2001-2011 12.97. Percentage of male
population to total population
”
2011
50.7
8. Percentage of female population to total population
”
”
49.3
9. Females per thousand males No. ” 972

2
I- GENERAL 1.1- ECONOMIC INDICATORS
1 2 3 4 510. Percentage of rural
population Percent 2011 90.0 11. Percentage of urban
population ” ” 10.0 12. Percentage of Scheduled
Castes to total population
”
2011
25.2
13. Percentage of Scheduled Tribes to total population
”
”
5.7
14. Percentage of total main workers to total population
”
”
30.0
15. Percentage of cultivators to total workers ” ” 57.9
16. Percentage of agricultural laborers to total workers
”
”
4.9
17. Birth rate Per’000 2011 16.518. Death rate ” ,, 6.7
AGRICULTURE 19. Per capita net area sown Hect. 2008-09 0.120. Per capita cultivated
area ” ” 0.1

3
I- GENERAL 1.1-ECONOMIC INDICATORS 1 2 3 4 5 21
Percentage of area sown more than once to net area sown
Hect.
2008-09
5.4 CO-OPERATION
22 Co-operative Societies No. 2011-12 470923 Total membership ’000 ” 153524 Total working capital Lakhs Rs. ” 1758886.84
EMPLOYMENT EXCHANGES
25 No. of candidates on live register at the end of
No. 2012-13
861314
26 Percentage of placements to total registration
Per- cent
”
1.31
ELECTRICITY
27 Electricity generated M.U. 2012-13 1774.416 28 Electricity purchased
From other states ” ”
7957.290 29 Energy sold within
the state ” ”
6633.045(P) ROADS
30
Total Roads Length kms. 2012-13 34647

4 I- GENERAL
1.1- ECONOMIC INDICATORS-contd.
1 2 3 4 5COMMUNICATIONS
31 Population per post office
No.2012-13 2468
32 Area per post office Sq. km. ” 20.0 BANKING
33 Bank offices per lakh of population
No. Jun.2012 16.9
34 Per capita deposits Rs. ” 5775335 Per capita advances Rs. ” 20612
MEDICAL36 All types of
hospitals/dispensaries etc. (Allopathic and Ayurvedic)
No
2012-13
3824
37 Beds available ” ” 1061338 Hospitals/dispensaries
per lakh of population ” ” 55.7 39 Beds per lakh of
population ” ” 155
EDUCATION 40 Percentage literacy :- (a) Males Percent 2011 89.5 (b) Females ” ” 75.9 Total ” ” 82.8

5 I- GENERAL
1.1. ECONOMIC INDICATORS- Concld. 1 2 3 4 541 No. of Schools Functional:- (i) Primary No. 2012-13 10739 (ii) Middle ” ” 2317 (iii) High /
Higher Secondary ” ” 216242 Arts Colleges ” ” 67
STATE INCOME43 Per capita income:- (i) at current
prices Rs. 2012-13Adv. 82611 (ii) at constant
prices ” ” 51586 STATE FINANCE44 Per capita revenue
receipts(Net) Rs. 2013-14(B) 2485045 Per capita revenue
expenditure (Net) ” ” 2477546 Per capita capital
expenditure (Net) ” ” 289747 Total per capita
expenditure (Gross) ” ” 27672

6
I- GENERAL 1.1. —ECONOMIC INDICATORS- Concld.
1 2 3 4 5
PRICES
48 Consumer price index numbers:-
for industrial
workers in H.P.
(Base 2001=100)
(a) General -- 2012 188
(b) Food -- ,, 205

7
II-AREA AND POPULATION 2.1- AREA AND POPULATIN
Sl No
District No. of in- habited villages2001
Area (’000 sq. kms.)
Popu-lation 2011 Census
Densityper sq.km. 2011 Census
Decennial growth rate 2001-2011
percentage)
1 2 3 4 5 6 71 Bilaspur 965 1.2 381956 327 +12.02 Chamba 1,118 6.5 519080 80 +12.63 Hamirpur 1,635 1.1 454768 407 +10.24 Kangra 3,619 5.7 1510075 263 +12.85 Kinnaur 234 6.4 84121 13 +7.46 Kullu 172 5.5 437903 80 +14.87 Lahaul-
Spiti
287 13.9 31564 2 -5.0
8 Mandi 2,833 4.0 999777 253 +10.99 Shimla 2,520 5.2 814010 159 +12.710 Sirmaur 966 2.8 529855 188 +15.511 Solan 2,388 1.9 580320 300 +15.912 Una 758 1.5 521173 338 +16.3 Himachal Pradesh 17,495 55.7 6864602 123 +12.9 Source- Census of India, 2011.

8
II -AREA AND POPULATION 2.2- CLASSIFIED POPULATION -2011 Census SL. No.
District Male Female Fe-males per ’000 males (No.)
Rural Urban Total Rural Urban Total
1. 2. 3. 4. 5. 6. 7. 8. 9. 1 Bilaspur 179.6 13.1 192.7 177.2 12.0 189.2 981
2 Chamba 242.0 19.4 261.4 241.0 16.8 257.8 986
3 Hamirpur 200.7 16.3 217.0 222.6 15.1 237.7 1095
4 Kangra 705.4 45.2 750.6 718.4 41.1 759.5 1012
5 Kinnaur 46.2 - 46.2 37.9 - 37.9 819
6 Kullu 203.3 22.2 225.5 193.2 19.2 212.4 942
7 Lahaul-Spiti
16.6 - 16.6 15.0 - 15.0
903
8 Mandi 466.1 32.0 498.1 471.1 30.6 501.7 1007
9 Shimla 314.3 110.8 425.1 298.4 90.6 389.0 915
10 Sirmaur 246.2 30.1 276.3 226.5 27.0 253.5 918
11 Solan 249.7 59.0 308.7 228.4 43.1 271.5 880
12 Una 240.3 23.4 263.7 236.0 21.5 257.5 976
Himachal Pradesh
3110.4 371.5 3481.9 3065.7 317.0 3382.7 972
Source- Census of India, 2011,

9 II-AREA AND POPULATION
2.3- URBANISATION COMPARATIVE STUDY – 2001 AND 2011 CENSUS
Source- Census of India, 2001 and 2011, H.P.
Sl No
District Urban Population Growth rate 2001-2011
(Percentage) 2001 2011
1 2 3 4 5 1 Bilaspur 21,951 25129 14.5 2 Chamba 34,542 36108 4.5 3 Hamirpur 30,206 31430 4.1 4 Kangra 72,285 86281 19.4 5 Kinnaur -- -- -- 6 Kullu 30,093 41391 37.5 7 Lahaul-Spiti -- -- -- 8 Mandi 60,982 62637 2.7 9 Shimla 1,67,233 201351 20.4 10 Sirmaur 47,670 57165 19.9 11 Solan 91,195 102147 12.0 12 Una 39,424 44913 13.9 Himachal
Pradesh 5,95,581 688552
15.6

10 II-AREA AND POPULATION 2.4- DISTRICT-WISE HANDICAPPED POPULATION 2001 CENSUS
Sl. District Total In
SeeingIn
SpeechIn Hear- ing
In Move-ment
Mental
1 2 3. 4. 5. 6. 7. 8. 1 Bilaspur 11528 4255 810 965 4143 1355 2 Chamba 11394 5471 976 1176 2752 1019 3 Hamirpur 13292 5938 812 913 3999 1630 4 Kangra 31238 11128 2763 3064 9996 4287 5 Kinnaur 2594 1395 236 399 472 92 6 Kullu 9786 4291 1019 1411 2299 766 7 Lahaul-
Spiti 766 458 44 73 143 48
8 Mandi 24214 9272 2011 2671 7711 2549 9 Shimla 14675 7201 1343 1615 3189 1327 10 Sirmaur 13728 6152 1081 1458 3684 1353 11 Solan 11563 4372 830 855 4138 1368 12 Una 11172 4189 837 639 3986 1521 Himachal Pradesh
155950 64122 12762 15239 46512 17315
Source—Census of India, 2001,

11 II -AREA AND POPULATION
2.5- DISTRIBUTION OF MAIN AND MARGINAL WORKERS—2011 CENSUS
(In ’000) Sl No
District Main worke
rs
Culti-vators
Agri- cul- turala-borer’s
House hold in-dustry etc.
Other worke-rs
Mar-ginal
workers
1 2 3 4 5 6 7 8
1 Bilaspur 103.4 40.6 1.2 1.5 60.2 102.5 2 Chamba 119.6 52.0 2.6 1.9 63.1 174.4 3 Hamirpur 126.2 54.0 3.5 1.8 66.9 115.8 4 Kangra 313.9 69.4 11.1 7.7 225.7 361.3 5 Kinnaur 46.8 25.9 1.8 0.6 18.5 9.5 6 Kullu 193.9 132.5 7.2 1.8 52.4 75.2 7 Lahaul-
Spiti 15.1 8.9 0.3 0.2 5.9 4.1
8 Mandi 284.2 148.3 4.8 3.9 127.1 288.5 9 Shimla 311.8 156.5 17.5 5.4 132.4 119.2 10 Sirmaur 193.9 116.0 5.9 2.7 69.3 86.2 11 Solan 219.2 80.1 5.8 3.0 130.4 79.5 12 Una 134.5 35.6 7.0 2.2 89.5 80.8 Himachal
Pradesh 2062.5 919.8
68.7
32.7
1041.4
1497.0
Source.—Census of India, 2011, H.P.

12
II - AREA AND
2.6- SCHEDULED CASTES
Sl. No.
District Male
Rural Urban Total 1 2 3 4 51. Bilaspur 47550 2721 502712. Chamba 53144 3010 561543. Hamirpur 50806 2921 537274. Kangra 152186 7511 1596975. Kinnaur 7433 - 74336. Kullu 58981 3705 626867. Lahaul-
Spiti 1154 - 1154 8. Mandi 140605 6645 1472509. Shimla 91176 19652 11082810. Sirmaur 77367 5650 8301711. Solan 76902 8580 8548212. Una 54768 3833 58601Himachal Pradesh 812072 64228 876300
13
POPULATION POPULATION – 2011 CENSUS
Female
Total Scheduled Castes population
Percentage of Scheduled Castes population to total population of the District
Rural Urban Total
6 7 8 9 1046128 2590 48718 98989 25.9 52491 3045 55536 111690 21.5 52735 2794 55529 109256 24.0 152616 7072 159688 319385 21.2 7317 - 7317 14750 17.5 56533 3440 59973 122659 28.0
1081 - 1081 2235 7.1
139975 6514 146489 293739 29.4 88059 16890 104949 215777 26.5 72352 5376 77728 160745 30.3 71898 7156 79054 164536 28.4 53278 3612 56890 115491 22.2
794463
58489 852952 1729252
25.2
Source.—Census of India—2011

14
II—AREA AND
2.7- SCHEDULED TRIBES Sl No
District MaleRural Urban Total
1 2 3 4 51 Bilaspur 5290 195 54852 Chamba 66589 1311 679003 Hamirpur 1396 135 15314 Kangra 39498 2247 417455 Kinnaur 23609 - 236096 Kullu 6320 2173 84937 L & S 12748 - 127488 Mandi 6114 231 63459 Shimla 2795 1759 455410 Sirmaur 5702 210 591211 Solan 12469 882 1335112 Una 4366 79 4445Himachal Pradesh 186896 9222 196118 Source:—Census of India –2011,

15
POPULATION POPULATION – 2011 CENSUS
Female Total Scheduled Tribes populati
on
Percentage of Scheduled Tribes
population to total
population of the District
Rural Urban Total
6 7 8 9 105044 164 5208 10693 2.866318 1282 67600 135500 26.11405 108 1513 3044 0.740736 2083 42819 84564 5.625137 - 25137 48746 57.96143 2186 8329 16822 3.812959 - 12959 25707 81.46245 197 6442 12787 1.32604 1597 4201 8755 1.15213 137 5350 11262 2.111606 688 12294 25645 4.44086 70 4156 8601 1.7
187496
8512 196008 392126 5.7

16
II —AREA AND POPULATION 2.8- AREA –2011 CENSUS
(In sq. kms.) Sl No
District Rural Urban Total
1 2 3 4 51 Bilaspur 1,149.47 17.53 1,167.002 Chamba 6,501.26 20.74 6,522.003 Hamirpur 1,106.39 11.61 1,118.004 Kangra 5,691.34 47.66 5,739.005 Kinnaur 6,401.00 -- 6,401.006 Kullu 5,485.87 17.13 5,503.007 Lahaul-
Spiti 13,841.00 -- 13,841.00 8 Mandi 3,922.26 27.74 3,950.009 Shimla 5,075.57 55.43 5,131.0010 Sirmaur 2,805.88 19.12 2,825.0011 Solan 1,902.63 33.37 1,936.0012 Una 1,519.51 20.49 1,540.00Himachal Pradesh 55,402.18 270.82 55,673.00 Source.—Census of India, 2011 Census

17
II —AREA AND POPULATION
2.9- PROJECTED POPULATION OF HIMACHAL PRADESH Project population (’000)
As on 1st October
Growth rate over previous year
1 2 32001 6130 --2002 6196 1.082003 6265 1.112004 6332 1.072005 6398 1.042006 6462 1.002007 6524 0.962008 6585 0.942009 6644 0.902010 6701 0.862011 6757 0.842012 6812 0.812013 6865 0.782014 6919 0.792015 6965 0.662016 7015 0.722017 7061 0.652018 7105 0.622019 7148 0.612020 7189 0.572021 7227 0.532022 7264 0.51Source:—Central Statistical Organisation

18
II —AREA AND POPULATION
2.10- NO. OF HOUSEHOLDS –2011 CENSUS
Sl No.
District Rural Urban Total
1 2 3 4 51. Bilaspur 74712 5773 804852. Chamba 94596 7864 1024603. Hamirpur 98115 7404 1055194. Kangra 318379 20508 3388875. Kinnaur 19976 - 199766. Kullu 84358 10449 948077. Lahaul-
Spiti 6674 - 6674 8. Mandi 203747 15398 2191459. Shimla 129854 54508 18436210. Sirmaur 85087 13121 9820811. Solan 96510 25915 12242512. Una 100502 9830 110332Himachal Pradesh 1312510 170770 1483280
Source.—Census of India, 2011, H.P.

19
III—AGRICULTURE 3.1- LAND UTILISATION
(’000 Hectares) Sl No.
Item 2006-07 2007-08 2008-09
1 2 3 4 51. Total geographical are:-
(a) By professional survey
5567.3
5567.3
5567.3 (b) By village papers 4544.4 4389.7 4549.6
2.
Forests 1099.7 1083.1
1103.0
3. Area not available for cultivation 1125.1 1101.6
1121.8
4.
Other uncultivated land excluding current fallows
1703.1
1624.5
1706.2 5.
Fallow land 75.2 72.6
79.2
6. Net area sown 541.4 507.9 539.5 7. Total cropped area 954.0 897.4 946.1 8. Area sown more than
once 412.6 389.5
406.7 9.
Net irrigated area 107549 93550
107852
Source:– Annual season and Crop Reports, Directorate of Land Records, Himachal Pradesh Note;- Data from 2009-10 onwards not received.

20
III- AGRICULTURE 3.2- NET IRRIGATED AREA-SOURCE-WISE
(Hectares)
SI.
No
Source 2007-08 2008-09
1. 2. 3. 4.
1. Canals 4390 4046
2. Tanks 236 283
3. Wells and
Tube Wells
15752 17432
4. Other Sources 73172 86091
Total .. 93550 107852
Source- Annual Season and crop Reports, Directorate of Land Records, Himachal Pradesh. Note;- Data from 2009-10 onwards not received.

21 III- AGRICULTURE
3.3— AREA UNDER PRINCIPAL CROPS IN HIMACHAL PRADESH (Hectares) Sl. No.
Crop. 2006-07 2007-08 2008-09
1. 2. 3. 4. 5.1. Wheat 362250 366590 3600702. Maize 299040 300150 2988063. Rice 69210 78570 767204. Barley 24100 23510 226335. Millets and
other cereals 7470 7440 87786. Ragi 3000 1840 12857. Gram 1330 1450 7608. Other Pulses 21570 30970 30398 Total
Foodgrains 787910 811980 7994501. Sugar cane 3020 2700 24292. Ginger 2300 2270 2170 3. Chillies 600 700 647 4. Rape and
Mustard 8890 8760 8991 5. Linseed 1470 1570 695
6 Sesamum 3800 3590 3303Source-Annual Season and Crop Reports, Directorate of Land Records, Himachal Pradesh. Note;- Data from 2009-10 onwards not received.

22 III- AGRICULTURE 3.4—PRODUCTION OF PRINCIPAL CROPS
(MT) Sl. No.
Crop 2006-07 2007-08 2008-09
1. 2. 3. 4. 5.1. Wheat 596490 562010 381180 2. Maize 695380 682620 676640 3. Rice 123490 121450 118280 4. Barley 33870 30680 20450 5. Millets and
other cereals 5080 5460
4290 6. Ragi 3160 2490 2440 7. Gram 1020 1370 290 8. Other Pulses 11120 33220 23220 Total Foodgrains… 146960 1440660 1226790 1. Sugar cane 59180 58440 53068 2. Ginger 25540 25540 18814 3. Chillies 160 250 199 4. Rape and Mustard 4510 3580 2373 5. Linseed 360 400 148 6 Sesamum 1710 1270 1160 Source-Annual Season and Crop Reports, Directorate of Land Records, Himachal Pradesh. Note;- Data from 2009-10 onwards not received.

23
III- AGRICULTURE 3.5-CONSUMPTION OF FERTILIZERS IN TERMS OF NUTRIENTS
(M.T.)
Year/District Kharif (N+P+K)
Rabi (N+P+K)
Total
1. 2. 3. 4.2007-08 20597 29361 499582008-09 23768 33595 573632009-10 20874 32364 532382010-11 19811 35322 551332011-12
21332 30151 51483
Bilaspur 1448 946 2394Chamba 898 343 1241Hamirpur 1817 775 2592Kangra 3815 5213 9028Kinnaur 34 221 255Kullu 1169 2910 4079Lahaul-Spiti 257 153 410Mandi 3093 3234 6327Shimla 1712 8423 10135Sirmaur 2326 1963 4289Solan 1784 1702 3486Una 2979 4268 7247Source:- Directorate of Agriculture, H.P. N : Nitrogenous P : Phosphatic K : Potassic

24
III- AGRICULTURE 3.6-AREA UNDER HIGH YIELDING VARIETY CROPS (000 Hect.) Year Maize Paddy Wheat
1. 2. 3. 4.
2000-01 219.68 73.83 329.77
2001-02 231.58 74.53 346.72
2002-03 192.10 64.73 313.23
2003-04 222.19 78.90 264.07
2004-05 242.76 75.21 353.29
2005-06 273.14 70.94 346.15
2006-07 280.61 72.65 349.60
2007-08 280.31 73.56 332.09
2008-09 280.51 74.61 325.22
2009-10 296.50 76.00 328.00
2010-11 327.00 75.20 327.00
2011-12
2012-13
279.05
288.15
75.08
75.70
330.35
335.35
Source:- Directorate of Agriculture, H.P.

25
IV-HORTICULTURE
4.1 –AREA UNDR FRUITS
(Hectares) Year Apple Others Total1. 2. 3. 4.
1995-96 78,292 1,17,392 1,95,6841996-97 80,338 1,15,874 1,96,2121997-98 83.056 1,19,306 2,02,3621998-99 85,631 1,21,609 2,07,2401999-00 88,673 1,24,278 2,12,9512000-01 90,347 1,26,879 2,17,2262001-02 92,820 1,30,215 2,23,0352002-03 81,630 94,576 1,76,2062003-04 84,112 98,329 1,82,4412004-05 86,202 1,00,700 1,86,9022005-06 88,560 1,03,108 1,91,6682006-07 91,804 1,05,641 1,97,4452007-08 94,726 1,05,776 2,00,5022008-09 94,438 1,10,191 2,04,6292009-10 99,564 1,08,590 2,08,1542010-11 2011-12
101,485103,644
1,09,8101,10,930
2,11,2952,14,574
Source- Horticulture Department, Himachal Pradesh.

26 IV- HORTICULTURE
4.2- PRODUCTION OF FRUITS
(’000 Tonnes) Year Apple Others Total1. 2. 3. 4.
1991-92 301.73 40.57 342.301992-93 379.05 45.80 324.851993-94 294.73 30.74 325.471994-95 122.78 47.76 170.541995-96 276.68 35.21 311.891996-97 288.54 63.09 351.631997-98 234.25 45.44 279.691998-99 393.65 54.03 447.681999-00 49.13 40.27 89.402000-01 376.73 51.31 428.042001-02 180.53 82.92 263.452002-03 348.26 111.36 459.622003-04 459.49 100.48 559.972004-05 527.60 164.41 692.012005-06 540.36 155.16 695.522006-07 268.40 100.70 369.102007-08 592.57 120.27 712.842008-09 510.16 117.92 628.082009-10 280.11 102.13 382.242010-11 892.11 135.71 1027.822011-12 2012-13
275.04412.36
85.39 128.42
360.43540.78
Source- Horticulture Department,Himachal Pradesh.

27 V- CLIMATE
5.1- RAINFALL
(In Millimeters) Year Rainfall
1. 2.
2000 1,052
2001 1,068
2002 985
2003 1,132
2004 1,001
2005 1,190
2006 1,103
2007 1,000
2008 1,141
2009 908
2010 1,243
2011
2012
1,156
1,080
Source- Directorate of Land Records, H.P.

28 VI-FORESTS
6.1- FOREST AREA ACCORDING TO LEGAL CLASSIFICATION
(In sq. Kms.) Sl No
Item 2010-11 2011-12
1 2 3 4 1. Reserved Forests 1,898 1,898 2. Protected Forests 33,130 33,130 3. Un-classed Forests 886 886 4. Other Forests 369 369 5. Forests not under
the control of Forests Department 750
750 6. Total- 37,033 37,033 Source- Forest Department, Himachal Pradesh. 6.2. OUTTURN AND VALUE OF MAJOR AND MINOR FOREST PRODUCTS Year Major produce Minor produce
(Value in’000 Rs. ) Timber (Standing volume ’000cu. Metres)
Fuel*(tonnes)
Resin Fodder and grazing
Other produce
2009-10 277.9 173 62512 932 133282 2010-11 2011-12
245.4 146.1
143 18
103258102457
881947
117738 80141
Source- Forest Department, Himachal Pradesh *Includes Firewood and Charcoal.

29
VII- LIVESTOCK 7.1- LIVESTOCK AND POULTRY
(In Thousands)
Category 2003 2007 1 2 3
A. LIVESTOCK: Cattle 2,196 2,269 Buffaloes 773 762 Sheep 906 901 Goats 1,116 1,241 Horses and
Ponies 17 13
Mules and donkeys 33 26
Pigs 3 2 Other livestock 2 2 Total livestock 5,046 5,216
B POULTRY 764 809 Source-Animal Husbandry Department.

30 VII-LIVESTOCK 7.2- VETERINARY INSTITUTION Item 2011-12 2012-13
1 2. 3.
1.State level Veterinary Hospital, 1
1
2.Polyclinics 7 7
3.Hospitals/C.V.D. 361 362
4.Dispensaries 1763 1762
5.Other institution 72 73
Total 2204 2205
Animals Treated(in ’000) 2860 2632
Source – Animal Husbandry Department, Himachal Pradesh.

31
VII-LIVESTOCK 7.3-AVERAGE DAILY MILK YIELD PER ANIMAL/TOTAL MILK PRODUCTION Item 2011-12 2012-13
1. 2. 3.
Daily Milk yield in grams
a) Cow 3261 3263
b) Buffaloe 3423 3563
c) Goat 504 501
Total Milk Producation
(in’000 Tonnes)
a) Cow 679.971 690.966
B) Buffaloe 389.968 398.806
c) Goat 49.927 48.840
Total 1119.866 1138.612
Source – Animal Husbandry Department, Himachal Pradesh.

32 VIII- FISHERIES
8.1- FISHERIES Sl.No. 2011-12 2012-13
1 2 3 41. Licensed
fishermen registered (No) 10,785 10,872
2. Production of fish (tonnes) 8,045 8,561
3. Approximate value of fish caught (‘000 Rs.) 5,05,400 5,81,813
4. Fishing Offences detected (No.) 1,584 1,443
5. Compensation realized (Rs.) 4,79,270 4,85,860
6. Fish Sanctuaries established (No.)
16 16
Source-Directorate of Fisheries, Himachal Pradesh.
33
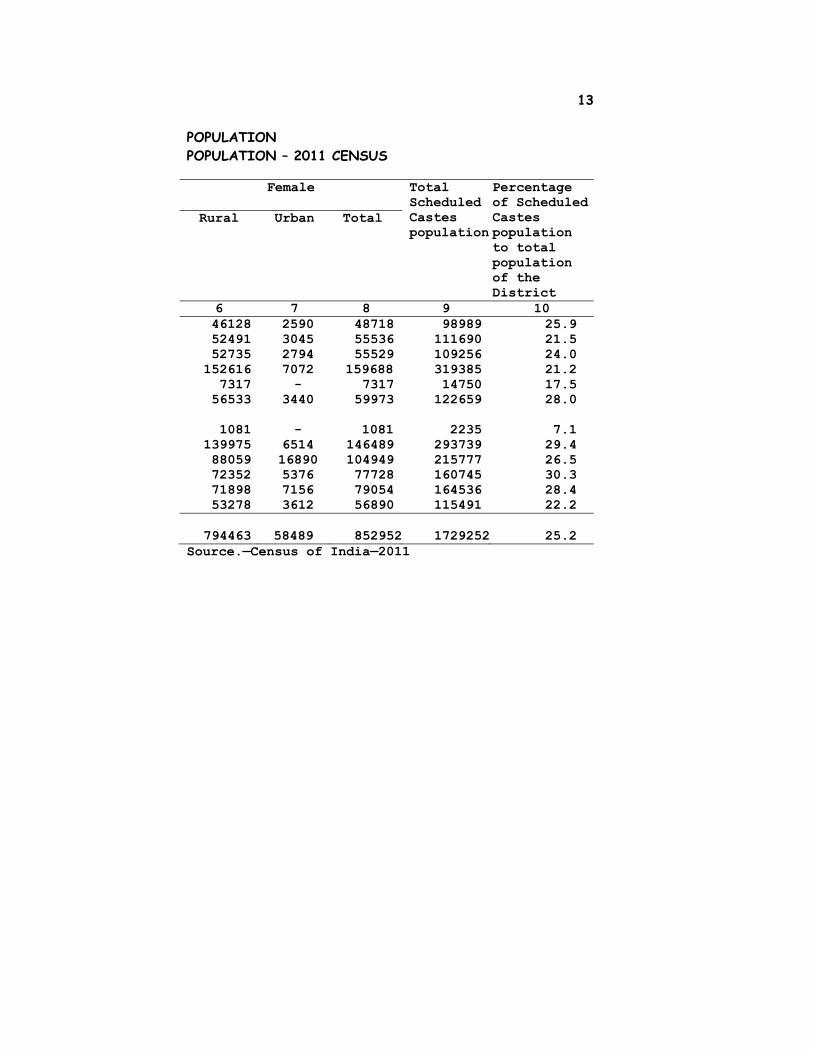
IX- EDUCATION 9.1- EDUCATION SI No.
Item 2011-12 2012-13
1 2 3 41 Primary School $ 10564 10739
2 Middle School $ 2265 2317
3 High School $ 848 834
4 Higher Secondary & +2 $ 1244 1328
5 Colleges 65+53* 67+59*
6 Universities 3+11* 5+15*
7 Medical Colleges 3 3
8 B.Ed. Colleges 4+71* 4+71*
9 Law College 3+6* 3+6*
10 Sanskrit Institutions 5+17* 5+17*
11 JBT Colleges 12+19* 12+20*
12 Polytechnic Institutions 10+19* 10+18*
$ Functional * Private Source- Education Department Himachal Pradesh.

34 IX- EDUCATION 9.2- LITERACY
SI. No.
District Percentage literacy 1991 2001 2011
1 2 3 4 51 Bilaspur 67.2 77.8 84.62 Chamba 44.7 62.9 72.23 Hamirpur 74.9 82.5 88.24 Kangra 70.5 80.1 85.75 Kinnaur 58.3 75.2 80.06 Kullu 54.8 72.9 79.47 Lahaul-Spiti 56.8 73.1 76.88 Mandi 62.7 75.2 81.59 Shimla 64.6 79.1 83.610 Sirmaur 51.6 70.4 78.811 Solan 63.3 76.6 83.712 Una 70.9 80.4 86.5 Himachal Pradesh 63.9 76.5 82.8 Source- Census of India- 1991, 2001,2011

35
X- HEALTH AND FAMILY WELFARE 10.1- PROGRESS OF FAMILY PLANNING
SI.
No.
Item 2010-11 2011-12 2012-13
1 2 3 4 5
1. Sterlisation Operations
Performed
(a) Males 2618 2344 2522
(b) Females 21020 20514 20658
Total
23638 22858
23280
2. I.U.C.D.
Insertions 21220 19697
19892
Source- Health and Family Welfare Department, H.P.

36
X-HEALTH AND FAMILY WELFARE 10.2- MEDICAL AND PUBLIC HEALTH
Item Unit 2011-12 2012-13 1 2 3 4 1.Allopathic institutions :
a)Hospitals No. 53 53 b)Primary Health
Centres ” 472
474 c)Community Health
Centres ” 76
78 d)E.S.I Dispensaries ” 10 11 e)Sub Centres ” 2065 2065 Total ” 2676 2681 2. Beds available ” 9702 9702 3. Ayurvedic institutions:
a) Hospitals* ” 29 31 b) Dispensaries ” 1109 1108 c) Ayurvedic
Pharmacies ” 3 3
d) Research Institutions ” 1
1
Total .. 1142 1143 4. Beds available No. 856 911 Source- Directorates of Health and Family Welfare and Ayurveda, Himachal Pradesh. * Includes one Nature Cure Hospital

37 X-HEALTH AND FAMILY WELFARE 10.3- BIRTH AND DEATH RATE H.P. Year Birth Rate Death Rate Difference 1 2 3 4 1971 37.3 15.6 21.7
1981 31.5 11.1 20.4
1991 28.5 8.9 19.6
2000 22.1 7.2 14.9
2001 21.2 7.1 14.1
2002 20.7 7.5 13.2
2003 20.6 7.1 13.5
2004 19.2 6.8 12.4
2005 20.0 6.9 13.1
2006 18.8 6.8 12.0
2007 17.4 7.1 10.3
2008 17.7 7.4 10.3
2009 17.2 7.2 10.0
2010 16.9 6.9 10.0
2011 16.5 6.7 9.8
Source-SRS Bulletin Registrar General,India.
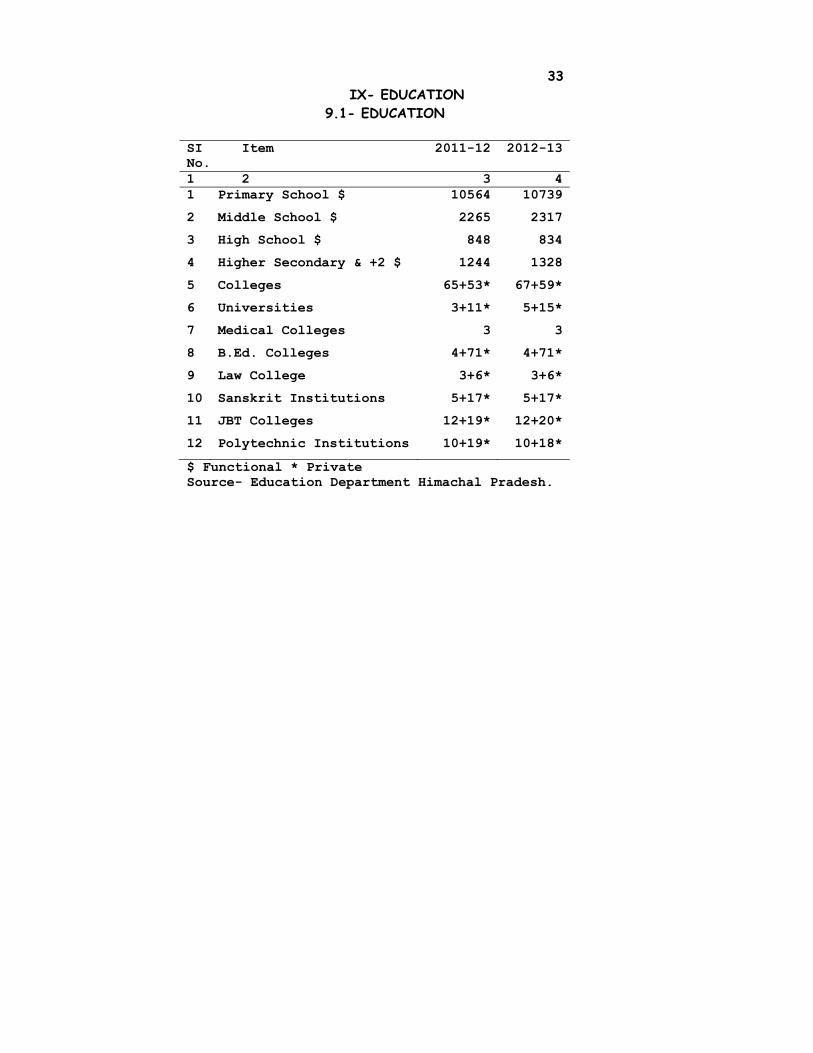
38 X-HEALTH AND FAMILY WELFARE 10.4-ACHIEVEMENT UNDER UNIVERSAL IMMUNIZATION PROGRAMME Sr. No.
Item 2011-12 2012-13
1 2 3 41 D.P.T. 113040 113566
2 Polio 113559 113642
3 B.C.G. 119455 120481
4 Hepatitis-B 114156 113122
5 Measles 112573 110370
6 Vit. A 1st dose 104590 107866
7 Polio Booster 102179 101898
8 D.P.T. Booster 102070 101970
9 Vit. A 5th dose 119073 127351
10 D.P.T. (5-6 years) 91364 82180
11 T.T. (10 years) 102488 99322
12 T.T. (16 years) 115171 116617
13 T.T.(PW) 110876 110185
14 I.F.A. (Mothers) 55448 108125
Source- Health and Family Welfare Department, H.P.
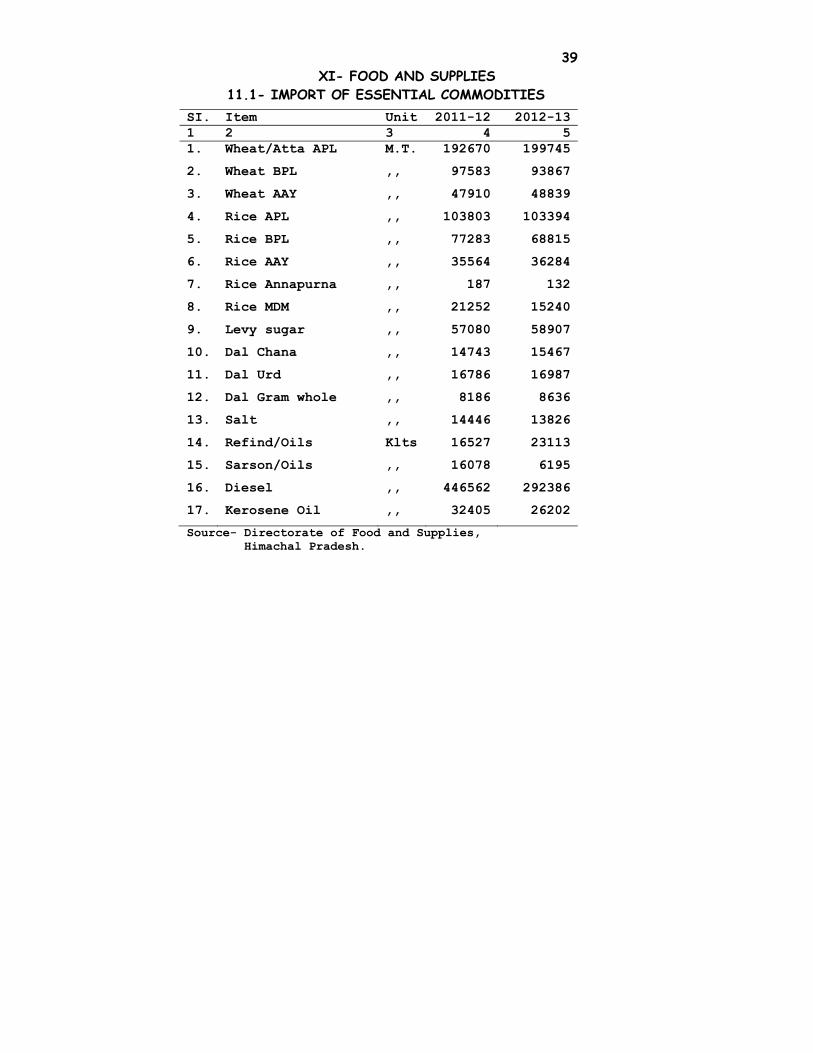
39 XI- FOOD AND SUPPLIES
11.1- IMPORT OF ESSENTIAL COMMODITIES
Source- Directorate of Food and Supplies, Himachal Pradesh.
SI. Item Unit 2011-12 2012-13 1 2 3 4 5 1. Wheat/Atta APL M.T. 192670 199745
2. Wheat BPL ,, 97583 93867
3. Wheat AAY ,, 47910 48839
4. Rice APL ,, 103803 103394
5. Rice BPL ,, 77283 68815
6. Rice AAY ,, 35564 36284
7.
8.
Rice Annapurna
Rice MDM
,,
,,
187
21252
132
15240
9. Levy sugar ,, 57080 58907
10. Dal Chana ,, 14743 15467
11. Dal Urd ,, 16786 16987
12. Dal Gram whole ,, 8186 8636
13. Salt ,, 14446 13826
14. Refind/Oils Klts 16527 23113
15. Sarson/Oils ,, 16078 6195
16. Diesel ,, 446562 292386
17. Kerosene Oil ,, 32405 26202
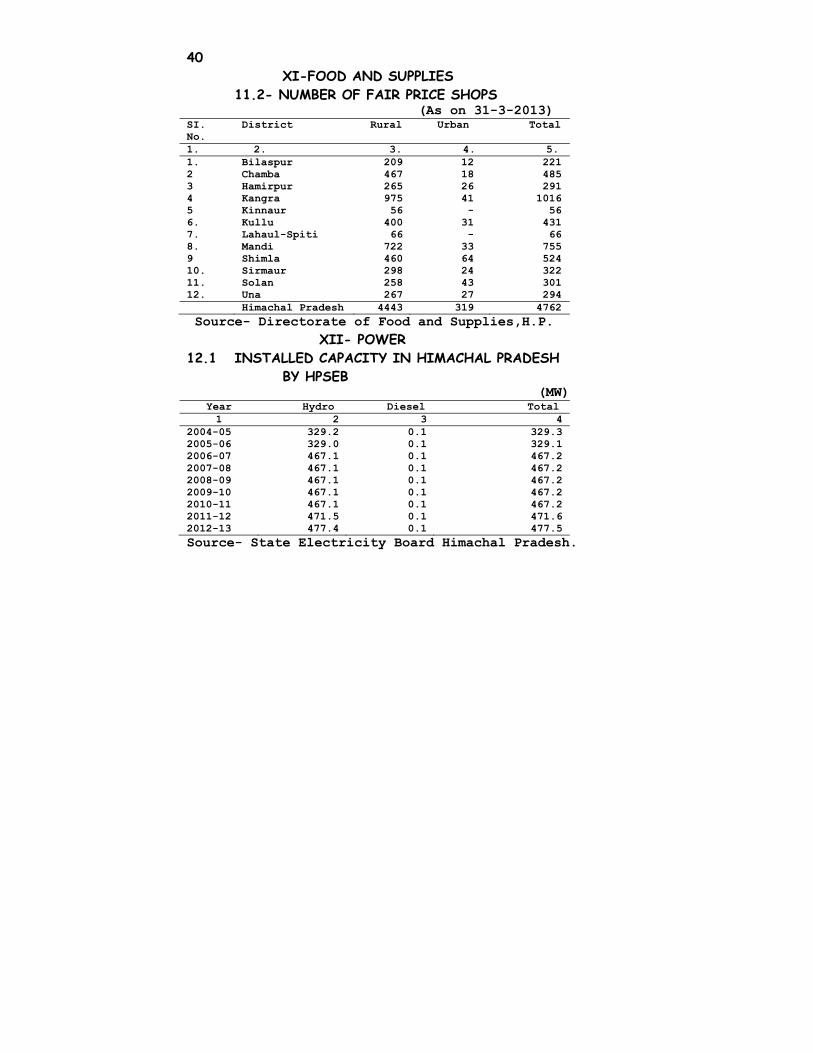
40 XI-FOOD AND SUPPLIES 11.2- NUMBER OF FAIR PRICE SHOPS (As on 31-3-2013) SI. No.
District Rural Urban Total
1. 2. 3. 4. 5. 1. Bilaspur 209 12 221 2 Chamba 467 18 485 3 Hamirpur 265 26 291 4 Kangra 975 41 1016 5 Kinnaur 56 - 56 6. Kullu 400 31 431 7. Lahaul-Spiti 66 - 66 8. Mandi 722 33 755 9 Shimla 460 64 524 10. Sirmaur 298 24 322 11. Solan 258 43 301 12. Una 267 27 294 Himachal Pradesh 4443 319 4762 Source- Directorate of Food and Supplies,H.P. XII- POWER 12.1 INSTALLED CAPACITY IN HIMACHAL PRADESH
BY HPSEB (MW)
Year Hydro Diesel Total 1 2 3 4
2004-05 329.2 0.1 329.3 2005-06 329.0 0.1 329.1 2006-07 467.1 0.1 467.2 2007-08 467.1 0.1 467.2 2008-09 467.1 0.1 467.2 2009-10 467.1 0.1 467.2 2010-11 467.1 0.1 467.2 2011-12 2012-13
471.5 477.4
0.1 0.1
471.6 477.5
Source- State Electricity Board Himachal Pradesh.

41
XII-POWER 12.2- ELECTRICITY GENERATED AND CONSUMEDW
(In million Units)
Source.-Himachal Pradesh State Electricity Board.
Item Unit 2011-12 2012-13 Total electricity generated
M. KWh 2019.954 1774.416
Energy purchased from BBMB & other states
M.U6822.670 7957.290
Energy Consumed to other state ” 627.280 1572.410Energy Consumed within the state ” 6828.745 6633.045(P)(a)Domestic ” 1398.744 1578.482 (b)Non Domestic Non Comm. ,, 95.908 103.924 (c)Commercial ” 365.008 398.971 (d)Public Lighting 12.711 13.602 (e)Agricultural ” 35.468 45.050 (f)Industrial ” 4288.531 3852.340 (g)Govt. irrigation & WSS ” 430.677 447.328 (h)Temporary Supply ,, 28.516 23.918 (i)Bulk & Misc. ,, 172.094 167.591 (j)Antodaya 1.088 1.839
Consumers served No. 2027970 2086562(a)Domestic ” 1714791 1760248 (b)Non Domestic Non Comm. ” 19312 22047 (c)Commercial ” 226911 232614 (d)Public Lighting ” 756 865 (e)Agricultural ” 18190 19940 (f)Industrial ” 34366 34501 (g)Govt. irrigation & WSS ,, 4790 5202 (h)Temporary Supply ,, 3728 4300 (i)Bulk & Misc. ,, 244 190 (j)Antodaya ,, 4882 6655

42
XIII-CO-OPERATION 13.1- CO-OPERATIVE MOVEMENT….. contd.
Sl.No. Item 2010-11 2011-121 2 3 4I. SOCITIES (No.):1. Agricultural 2,110 2,1172. Non-Agricultural 2,500 2,5423. Urban banks 5 54. State and Central banks 4 45. 0ther secondary societies 34 41
Total 4,653 4,709II. MEMBERSHIP (’000)1.Agri-Societies 1,128 1,1042.Non-Agricultural Societies 269 3263.Urban banks 21 224.State and Central banks 80 805.0ther secondary societies 3 3
Total 1,501 1,535

43
XIII-CO-OPERATION 13.1- CO-OPERATIVE MOVEMENT……… contd.
1 2. 3. 4.III.WORKING CAPITAL(lakh Rs.)
1. Agricultural Societies 190235.60
235124.26
2. Non-Agricultural Societies 68075.06
64913.73
3. Urban banks 40367.25 45962.80 4. State and Central banks 1279751.80
1400672.22
5. 0ther secondary societies 12770.59
12213.83
Total 1591200.30
1758886.84
IV.LOANS ADVANCED(lakh Rs.)
1. Agricultural Societies 31538.47
38431.84
2. Non-Agricultural Societies 7808.23
8476.68
3. Urban banks 17441.58 47343.47 4. Primary Land Mortgage Bank & State & Central Banks 570916.65
316117.57

44 XIII-CO-OPERATION
13.1- CO-OPERATIVE MOVEMENT……… concld.
1 2 3 4V. LOANS OUTSTANDING
(lakh Rs.):
1. Agricultural
Societies 40711.44 50126.07
2. Non-Agricultural
Societies 11764.00 13507.61
3. Urban banks 19308.68 22307.25
4. Primary Land
Mortgage Bank and
State and Central
Banks 457305.44 533883.52
Source-Co-operative Department, Himachal Pradesh.
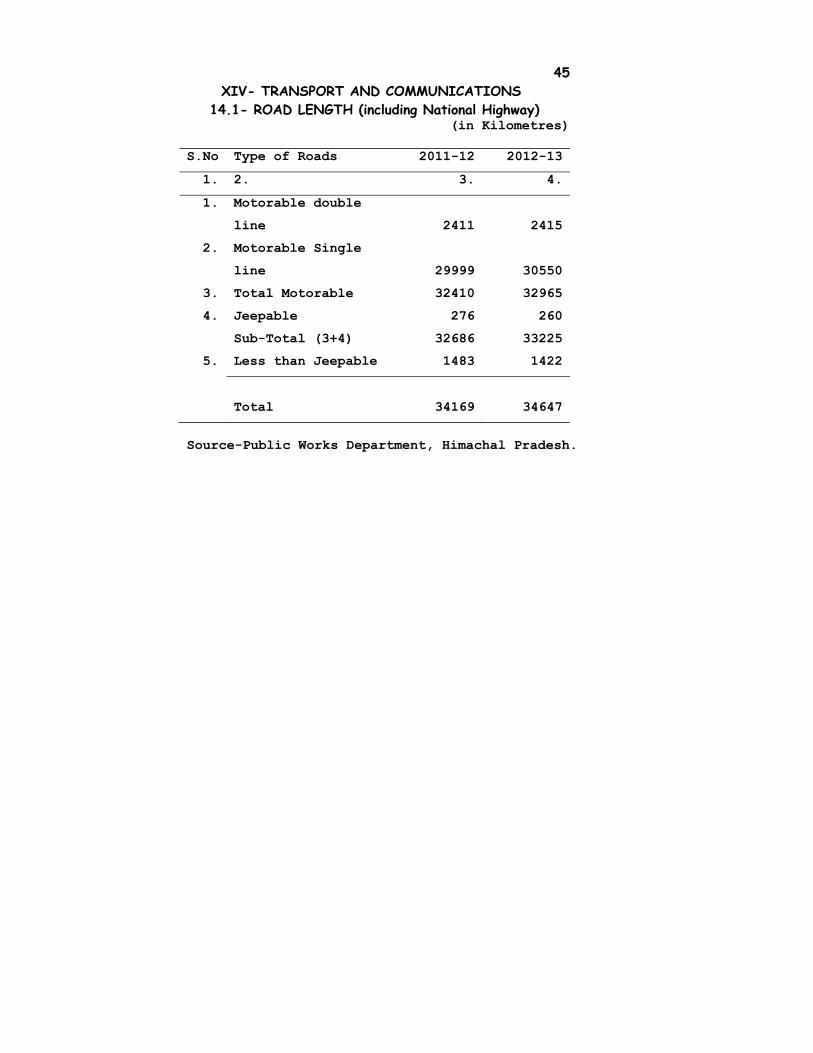
45
XIV- TRANSPORT AND COMMUNICATIONS 14.1- ROAD LENGTH (including National Highway)
(in Kilometres)
S.No Type of Roads 2011-12 2012-13
1. 2. 3. 4.
1. Motorable double
line 2411 2415
2. Motorable Single
line 29999 30550
3. Total Motorable 32410 32965
4. Jeepable 276 260
Sub-Total (3+4) 32686 33225
5. Less than Jeepable 1483 1422
Total 34169 34647
Source-Public Works Department, Himachal Pradesh.

46
XIV- TRANSPORT AND COMMUNICATIONS
14.2- NATIONALISED TRANSPORT Sl. No.
Item 2011-12 2012-13
1. 2. 3. 4.
1. Motor Vehicles:
(a) Buses 2,024 2,076
(b) Attached Buses 0 0
(c) Trucks 16 16
(d) Other Vehicles 86 51
Total 2,126 2,143
2. No.of routes
under operation 2,045 2,088
3. Distance covered
(‘000kms.) 1,66,589 1,67,586
Source:- Himachal Pradesh Road Transport Corporation H.P.

47
XIV- TRANSPORT AND COMMUNICATIOINS 14.3- NUMBER OF POST OFFICES AND LETTER BOXES
Item 2010-11 2011-12 2012-13
1 Number of Post Offices: (a) Head offices 18 18 18
(B) Sub-offices 444 446 446
(C) Branch Post Office 2,315 2,314 2314
Total 2,777 2,778 2,778
2. Number of letter Boxes 7,629 7,628
2,629
Source-Postmaster General H.P. Circle, Shimla.

48 XV- INDUSTRIES
15.1- DISTRICT-WISE NUMBER OF FACTORIES REGISTERED AND WORKERS
Sl. No.
District December, 2012
Factories (No.)
Workers*(No.)
1. 2. 3. 4.1. Bilaspur 98 4552
2. Chamba 77 1659
3. Hamirpur 194 772
4. Kangra 459 9275
5. Kinnaur 5 1382
6. Kullu 189 2463
7. Lahaul-Spiti - -
8. Mandi 172 3665
9. Shimla 173 6609
10. Sirmaur 610 46373
11. Solan 2275 194916
12. Una 256 19467
Himachal Pradesh 4508 291133
Source-Chief Inspector of Factories ,H.P. *Average.

49 XVI- BANKING 16.1- SCHEDULED COMMERCIAL BANKS
(Rs. In Lakhs)
Source:- Quarterly Bankings Statistics Handout.
Sl No
District June,2012
No.of Banks
Deposits Credit C.D.Ratio%age
1 2 3. 4. 5. 6.1 Bilaspur 59 1485 438 29.492 Chamba 65 1407 470 33.403 Hamirpur 77 2831 493 17.414 Kangra 220 7748 1683 21.725 Kinnaur 25 420 190 45.246 Kullu 76 1907 944 49.507 Lahaul-
Spiti 11 191 46 24.08 8 Mandi 142 3690 1172 31.769 Shimla 184 12094 3815 31.5410 Sirmaur 70 1330 1170 87.9711 Solan 148 3920 2965 75.6412 Una 82 2574 747 29.02 Himachal Pradesh
1159 39599 14133 35.69

50
XVII-CRIMES 17.1- CRIMES IN HIMACHAL PRADESH
(Number) Sr.No District/Other 2010 2011 20121 2 3 4 51. Bilaspur 1328 1236 1098
2. Chamba 911 973 821
3. Hamirpur 1218 1005 1033
4. Kangra 3265 3443 3505
5. Kinnaur 260 335 236
6. Kullu 1182 2197 1053
7. Lahaul-Spiti 140 173 1598. Mandi 2383 2019 2168
9. Shimla 2222 3312 1892
10. Sirmaur 1067 1106 1149
11. Solan 1469 1875 928
12. Una 1331 1142 1118
1. PD Baddi 467 733 733
2. CID 14 28 29
3. Railway and Traffic
19 28 15
Himachal Pradesh 16809 18875 15937
Source:-Police Department, Himachal Pradesh.

51 XVIII-EMPLOYMENT
18.1- REGISTRATION AND PLACING WORK DONE BY EMPLOYMENT EXCHANGES
Period No. of
candidates
registered
No. of
vacancies
notified
No. of
candidates
placed
No. of
applicants
on live
register (at
the end of
the period)
1 2 3 4 5
2006-07 149012 6132 6127* 756980
2007-08 146519 4358 4697* 780744
2008-09 167437 7287 7381* 813782
2009-10 130480 4235 4080* 827329
2010-11 120042 6732 4368* 825764
2011-12
2012-13
135781
168779
10573
5611
11620*
11309*
839007
861314
*Including Private Sector Source:- Directorate of Labour, Employment and Training,
Himachal Pradesh.

52 XVIII-EMPLOYMENT 18.2- HIMACHAL PRADESH GOVERNMENT EMPLOYEES
(Regular) (In thousand)
Refe-rence date
Gazett-ed
Non-Gazetted Grand TotalClass
II+IIIClass
IVTotal
1 2 3 4 5 6As on 31st March : 2001 10.8 103.5 25.6 129.1 139.9
2002 8.4 108.9 27.1 136.0 144.4
2003 9.0 111.7 26.3 138.0 147.0
2004 9.3 111.1 26.5 137.6 146.9
2005 9.3 110.7 25.6 136.3 145.6
2006 8.7 109.9 43.2 153.1 161.8
2007 8.9 110.5 55.0 165.5 174.4
2008 9.1 112.1 61.5 173.6 182.7
2009 10.0 112.5 66.6 179.1 189.1
2010 9.8 112.2 68.6 180.8 190.6
2011
2012
9.9
10.2
109.3
109.3
68.4
67.9
177.7
177.2
187.6
187.4
Source:- Directorate of Economics & Statistics, Himachal Pradesh.

53
XIX- PLANNING 19.1- ANNUAL PLAN
(Rs. In Crore)
Sl No
Sector 2012-13Approved Outlay
1 2 31. Agriculture and Allied
services 480.30
2. Rural Development 171.913. Irrigation and Flood
control 318.47 4. Energy 531.925. Industry and Minerals 36.976. Transport and
Communication 736.93 7. Science, Technology and
Environment 14.06 8. General Economic Services 93.659. Education 457.4110 Health 214.1011 W.S., Sewerage, Housing
and Urban Development 368.64
12 Other Social services 193.4113 General Services 60.2314 Special area Programme 22.00 Total 3700.00Source:- Planning Department, Himachal Pradesh

54
XX-ECONOMIC
20.1- NUMBER OF ENTERPRISES AND NUMBER OF Sl. No.
District EnterprisesTotal Agri-
culturalNon-
agricultural
1 2 3 4 51. Bilaspur 17950 851 17099
2. Chamba 16886 1383 15503
3. Hamirpur 19962 355 19607
4. Kangra 60250 2504 57746
5. Kinnaur 3969 58 3911
6. Kullu 19246 1597 17649
7. L&S 1963 1 1962
8. Mandi 39190 2714 36476
9. Shimla 30013 1399 28614
10. Sirmaur 17007 773 16234
11. Solan 22405 262 22143
12. Una 18932 117 18815
H.P. 267773 12014 255759
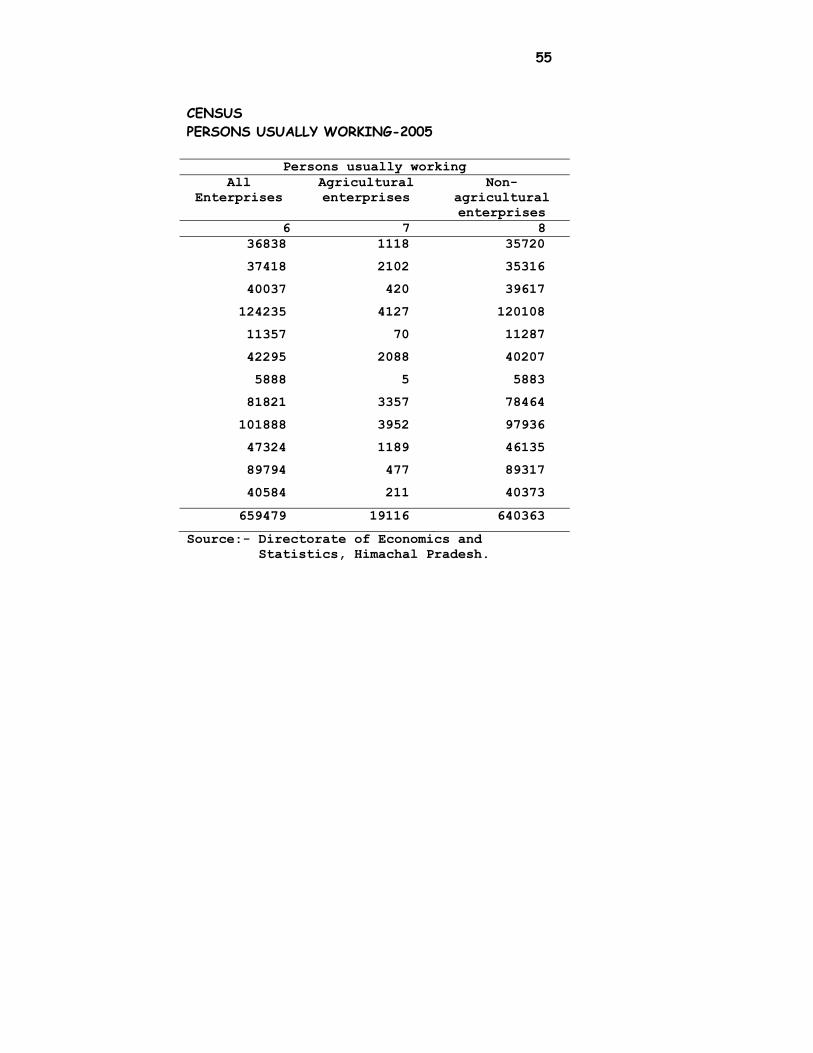
55 CENSUS PERSONS USUALLY WORKING-2005
Persons usually workingAll
Enterprises Agricultural enterprises
Non-agricultural enterprises
6 7 836838 1118 35720
37418 2102 35316
40037 420 39617
124235 4127 120108
11357 70 11287
42295 2088 40207
5888 5 5883
81821 3357 78464
101888 3952 97936
47324 1189 46135
89794 477 89317
40584 211 40373
659479 19116 640363
Source:- Directorate of Economics and Statistics, Himachal Pradesh.

56
XXI-STATE 21.1- COMPARISION OF MOVEMENT OF GROSS STATE
Sl. No.
Item 2008-09
1 2 31. Gross State Domestic Product
(Rs. Lakhs):
(i) At current prices 4148310 (ii) At 2004-05 prices 3321010 2. Per Capita Income
(Rupees):
(i) At current prices 49903 (ii) At 2004-05 prices 41666 3. Index numbers of gross
State domestic product with 2004-05 =100 as base:
(i) At current prices 172.30 (ii) At 2004-05 prices 137.93 4. Index number of per capita
income with 2004-05 =100 as base:
(i) At current prices 149.64 (ii) At 2004-05 prices 124.94

57
INCOME DOMESTIC PRODUCT AT FACTOR COST (NEW SERIES)
(Base2004-05) 2009-10 2010-11(P) 2011-12(Q) 2012-13(Ad.)
4 5 6 7
4818859
5635534 6381199 7207642
3589722 3903645 4193935 4455409
58402 67475 74694 8261143492 46821 48923 51586
200.15 234.07 265.04 299.36149.10 162.13 174.19 185.05
175.13 202.34 223.98 247.72130.42 140.40 146.70 154.69
Source:- Directorate of Economics and Statistics,
Himachal Pradesh.

58
XXII-PUBLIC 22.1- OVERALL BUDGET
Sl. No.
Item Income 2011-12(A)
1 2 31. Opening Balance 906.53
2. Revenue Receipts 14542.86
3. Capital Account Receipts
i) Loans(Recoveries) 24.87
ii)Public Debt (Incurred) 1984.05
iii)Non debt receipts 0.00
iv)Deposits and advances
Remittances and Provident Fund
818.86
Sub-total(i-iv) 2827.78
4. Contingency fund 0.00
5. Receipts (2+3+4) 17370.64
Total (1+5) 18277.17

59
FINANCE OF HIMACHAL PRADESH—contd.
(In lakh Rupees)
Income2012-13(B) 2012-13(R) 2013-14(B)
4 5 6 790.54 948.67 956.69
16342.98 16735.82 17700.94
25.29 26.16 27.68
3306.30 3299.44 3512.45
0.00 0.00 0.00
650.00 650.00 650.00
3981.59 3975.60
4190.13
0.00 0.00 0.00
20324.57 20711.42 21891.07
21115.11 21660.09 22847.76

60
XXII-PUBLIC 22.1- OVERALL BUDGET
Sl. No.
Item Expenditure
2011-12(A)1 2 31. Revenue Expenditure 13897.97
2. Capital Expenditure 1809.83
3. Loans (Advances) 492.98
4. Public Debt (Repayable)
including Inter State 1127.72
5. Contingency Fund 0.00
6. Sub Total (1 to 5) 17328.50
7. Closing Balance 948.67
Total 18277.17

61
FINANCE OF HIMACHAL PRADESH—concld.
(In lakh Rupees) Expenditure
2012-13(B) 2012-13(R) 2013-14(B) 4 5 6
15969.19 16381.00 17646.97
1970.26 2012.57 2063.45
367.17 379.39 342.39
1937.30 1930.44 1714.45
0.00 0.00 0.00
20243.92 20703.40 21767.26
871.19 956.69 1080.50
21115.11 21660.09 22847.76
Source:- Finance Department, Himachal Pradesh. A-Actual R- Revised B- Budget

62 XXIII-STATE FINANCE 23.1- NUMBER OF CST REGISTERED IN HIMACHAL PRADESH
District/Other Up to March,2012
Up to March,2013
1 2 3Bilaspur 4529 4747
Chamba 1723 1671
Hamirpur 3722 3082
Kangra 5601 5278
Kinnaur 999 1046
Kullu 3636 3712
Lahaul-Spiti - 152
Mandi 5966 6518
Shimla 9935 10253
Sirmaur 3791 3942
Solan 13182 13496
Una 4345 4354
B.B.N Baddi
Nurpur
-
3129
472
3112
H.P. 60558 61835
Source:- Excise and Taxation Department,H.P.

63
XXIV-MISCELLANEOUS
24.1- SMALL SAVINGS
(’000 Rs.) Year Gross
DepositsWithdrawal Net Deposit
1 2 3 42011-12 346127.00 314361.00 31766.00
2012-13 396723.00 339339.00 57384.00
Bilaspur 35403.00 30706.00 4697.00
Chamba 15492.00 12333.00 3159.00
Hamirpur 65025.00 54200.00 10825.00
Kangra 103245.00 90639.00 12606.00
Kinnaur 2084.00 1951.00 133.00
Kullu 12556.00 10980.00 1576.00
Lahaul-Spiti 307.00 268.00
39.00
Mandi 52456.00 44394.00 8062.00
Shimla 41139.00 33041.00 8098.00
Sirmaur 12308.00 9402.00 2906.00
Solan 20539.00 19398.00 1141.00
Una 36169.00 32027.00 4142.00
Source:- Directorate of Small Savings, H.P.
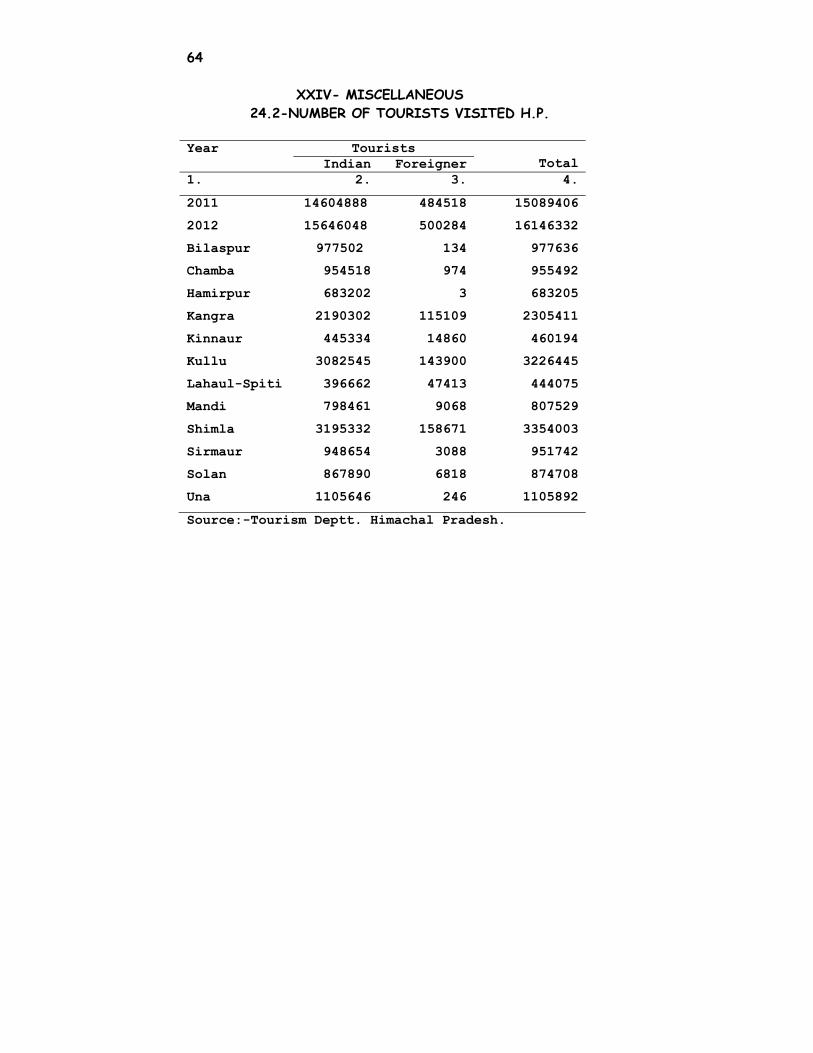
64 XXIV- MISCELLANEOUS 24.2-NUMBER OF TOURISTS VISITED H.P.
Source:-Tourism Deptt. Himachal Pradesh.
Year TouristsTotal Indian Foreigner
1. 2. 3. 4.
2011
2012
14604888
15646048
484518
500284
15089406
16146332
Bilaspur 977502 134 977636
Chamba 954518 974 955492
Hamirpur 683202 3 683205
Kangra 2190302 115109 2305411
Kinnaur 445334 14860 460194
Kullu 3082545 143900 3226445
Lahaul-Spiti 396662 47413 444075
Mandi 798461 9068 807529
Shimla 3195332 158671 3354003
Sirmaur 948654 3088 951742
Solan 867890 6818 874708
Una 1105646 246 1105892
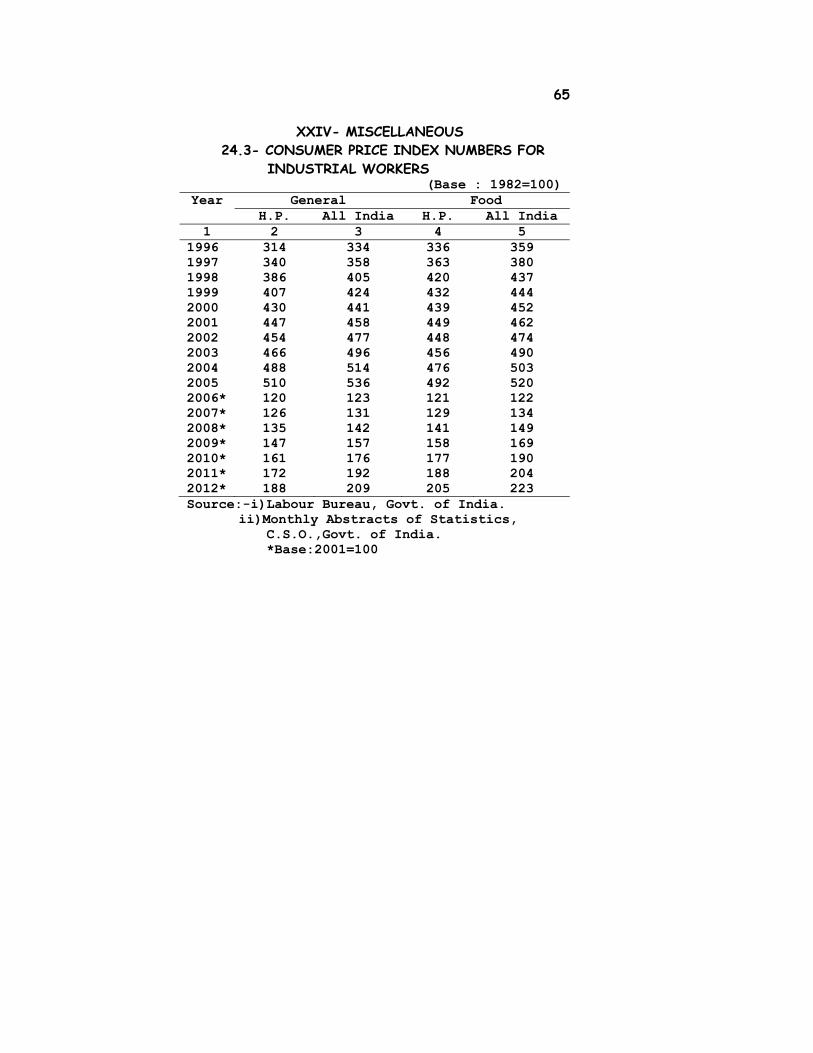
65 XXIV- MISCELLANEOUS 24.3- CONSUMER PRICE INDEX NUMBERS FOR INDUSTRIAL WORKERS
(Base : 1982=100) Year General Food
H.P. All India H.P. All India1 2 3 4 5
1996 314 334 336 3591997 340 358 363 3801998 386 405 420 4371999 407 424 432 4442000 430 441 439 4522001 447 458 449 4622002 454 477 448 4742003 466 496 456 4902004 488 514 476 5032005 510 536 492 5202006* 120 123 121 1222007* 126 131 129 1342008* 135 142 141 1492009* 147 157 158 1692010* 161 176 177 1902011* 2012*
172 188
192209
188205
204223
Source:-i)Labour Bureau, Govt. of India. ii)Monthly Abstracts of Statistics,
C.S.O.,Govt. of India. *Base:2001=100

66 XXIV-MISCELLANEOUS 24.4-CONSUMER PRICE INDEX NUMBERS FOR
INDUSTRIAL WORKER IN H.P Year General Index with
(Base-2001=100) 1 22010 161
2011
2012
172
188
January 178
February 178
March 180
April 185
May 185
June 186
July 192
August 195
September 195
October 195
November 196
December 196
Source: - Labour Bureau, Shimla

67 XXIV-MISCELLANEOUS
24.5- INDEX NUMBERS OF WHOLESALE PRICES BY GROUP IN INDIAN UNION
(Base 2004-05=100) Sl. No.
Group/Sub-Group 2011-12 2012-13*
1 2 3 4 1. All Commodities 156.1 167.6 2. Primary articles 200.3 220.0 3. Food articles 192.7 211.8 4. Non-food articles 182.7 201.9 5. Minerals 320.7 347.4 6. Fuel, power, light and
Lubricants 169.0
186.9 7. Manufactured Products 139.5 147.0 8. Food Products 151.2 163.4 9. Beverage, Tobacco and tobacco
products 163.3
175.1 10. Textiles 128.5 131.3 11. Wood and wood products 161.0 170.9 12. Paper and paper products 131.9 136.6 13. Leather and leather products 130.0 134.2 14. Rubber and Plastic products 133.6 137.5 15. Chemical and Chemical Products 134.7 143.6 16. Non-metallic mineral products 152.9 163.4 17. Basic metals, alloys and metal
products 156.3
166.1 18. Machinery and Machine tools 125.1 128.4 19. Transport equipments and parts 124.6 129.8 Source:- R.B.I. Bulletins. *- Provisional

68
XXIV- MISCELLANEOUS 24.6- HEIGHT OF IMPORTANT PLACES Sl. No.
Place Height from Mean Sea Level (Mts.)
Distance from Shimla
(kms.)
1 2
3 4
1. Bilaspur 610 862. Chamba 2,149 4353. Hamirpur 786 1704. Dharmshala 1,597 2755. Kalpa 2,769 2606. Kullu 1,219 2307. Keylong 3,165 3888. Mandi 754 1589. Shimla 2,206 010. Nahan 933 13811. Solan 1,463 4512. Una via Chandigarh 365 24013. Una via Nalagarh 365 20214. Chail 2,149 6015. Kasauli 1,927 6716. Manali 1,926 26917. Narkanda 2,721 6418. Rohtang Pass 3,955 324

69 XXIV-MISCELLANEOUS
24.7-SURVEY ON POOR FAMILIES (2002-07)-Rural Sl. No.
District Totalfamilies at the time of survey
No. of BPL families
% of families below poverty line to total families
1 2 3 4 51. Bilaspur 75051 17337 23
2. Chamba 85676 46393 54
3. Hamirpur 95795 19514 20
4. Kangra 289185 63250 22
5. Kinnaur 13255 2824 21
6. Kullu 69388 11267 16
7. L&S 5517 2400 44
8. Mandi 206096 41339 20
9. Shimla 108999 31682 29
10. Sirmaur 70439 13695 19
11. Solan 73733 17478 24
12. Una 89792 15191 17
H.P. 1182926 282370 24
Source:- Rural Development Department, H.P.
Related Documents