Bridging the Technological Divide Xavier Cirera Diego Comin Marcio Cruz Technology Adoption by Firms in Developing Countries

Welcome message from author
This document is posted to help you gain knowledge. Please leave a comment to let me know what you think about it! Share it to your friends and learn new things together.
Transcript

Bridging the Technological Divide
Xavier Cirera
Diego Comin
Marcio Cruz
Technology Adoption by Firms in Developing Countries
Brid
gin
g th
e Te
chn
olo
gica
l Divid
e


Bridging the Technological Divide


Bridging the Technological Divide
Technology Adoption by Firms in Developing Countries
Xavier Cirera, Diego Comin, and Marcio Cruz
© 2022 International Bank for Reconstruction and Development / The World Bank
1818 H Street NW, Washington, DC 20433
Telephone: 202-473-1000; internet: www.worldbank.org
Some rights reserved
1 2 3 4 25 24 23 22
This work is a product of the staff of The World Bank with external contributions. The findings, interpretations, and conclusions expressed in this work do not necessarily reflect the views of The World Bank, its Board of Execu-tive Directors, or the governments they represent. The World Bank does not guarantee the accuracy, completeness, or currency of the data included in this work and does not assume responsibility for any errors, omissions, or discrepancies in the information, or liability with respect to the use of or failure to use the information, methods, processes, or conclusions set forth. The boundaries, colors, denominations, and other information shown on any map in this work do not imply any judgment on the part of The World Bank concerning the legal status of any territory or the endorsement or acceptance of such boundaries.
Nothing herein shall constitute or be construed or considered to be a limitation upon or waiver of the privileges and immunities of The World Bank, all of which are specifically reserved.
Rights and Permissions
This work is available under the Creative Commons Attribution 3.0 IGO license (CC BY 3.0 IGO) http:// creativecommons.org/licenses/by/3.0/igo. Under the Creative Commons Attribution license, you are free to copy, distribute, transmit, and adapt this work, including for commercial purposes, under the following conditions:
Attribution—Please cite the work as follows: Cirera, Xavier, Diego Comin, and Marcio Cruz. 2022. Bridging the Technological Divide: Technology Adoption by Firms in Developing Countries. Washington, DC: World Bank. doi:10.1596/978-1-4648-1826-4. License: Creative Commons Attribution CC BY 3.0 IGO
Translations—If you create a translation of this work, please add the following disclaimer along with the attribu-tion: This translation was not created by The World Bank and should not be considered an official World Bank translation. The World Bank shall not be liable for any content or error in this translation.
Adaptations—If you create an adaptation of this work, please add the following disclaimer along with the attribu-tion: This is an adaptation of an original work by The World Bank. Views and opinions expressed in the adaptation are the sole responsibility of the author or authors of the adaptation and are not endorsed by The World Bank.
Third-party content—The World Bank does not necessarily own each component of the content contained within the work. The World Bank therefore does not warrant that the use of any third-party-owned individual component or part contained in the work will not infringe on the rights of those third parties. The risk of claims resulting from such infringement rests solely with you. If you wish to reuse a component of the work, it is your responsibility to determine whether permission is needed for that reuse and to obtain permission from the copyright owner. Examples of components can include, but are not limited to, tables, figures, or images.
All queries on rights and licenses should be addressed to World Bank Publications, The World Bank Group, 1818 H Street NW, Washington, DC 20433, USA; e-mail: [email protected].
ISBN (paper): 978-1-4648-1826-4ISBN (electronic): 978-1-4648-1859-2DOI: 10.1596/978-1-4648-1826-4
Cover image: Remedios Varo, Alchemy or the Useless Science (1958). © 2022 Remedios Varo, Artists Rights Society (ARS), New York / VEGAP, Madrid. Used with the permission of Artists Rights Society (ARS), New York / VEGAP, Madrid. Further permission required for reuse.
Cover design: Bill Pragluski, Critical Stages, LLC.
The Library of Congress Control Number has been requested.

v
Contents
Foreword .....................................................................................................................xiii
Preface ..........................................................................................................................xv
Acknowledgments ................................................................................................... xvii
About the Authors ..................................................................................................... xxi
Abbreviations ...........................................................................................................xxiii
Introduction ....................................................................................................................1
The Imperative of Technology in Developing Countries ..............................1
The Technological Divide ...............................................................................3
Road Map to the Volume ................................................................................5
Contributions to the Literature ...................................................................12
Main Messages from the Volume ..................................................................12
Notes ..............................................................................................................15
References ......................................................................................................16
Part 1 Measuring the Technological Divide ......................................................... 19
1. A New Approach to Measure Technology Adoption by Firms .....................21
Introduction ..................................................................................................21
Measuring Adoption and Use of Technology by Firms ...............................22
Opening the Black Box: The Firm-level Adoption of Technology (FAT) Survey ..............................................................................24
The Data Used in This Volume .....................................................................36
Using the FAT Data to Understand Some of the Limitations of Standard Measures of Technology ................................................................37
Summing Up ..................................................................................................42
Notes ..............................................................................................................42
References ......................................................................................................44
vi Contents
2. Facts about Technology Adoption and Use in Developing Countries .........47
Introduction ..................................................................................................47
Cross-Country Technology Facts .................................................................48
Cross-Firm Technology Facts .......................................................................54
Other Technology Facts ................................................................................60
Summing Up ..................................................................................................65
Notes ..............................................................................................................66
References .....................................................................................................67
3. Adoption of Sector-Specific Technologies ......................................................69
Introduction ..................................................................................................69
Technology Differences across and within Sectors ......................................70
Technology Upgrading and the Limits to Leapfrogging..............................79
Specialization, Technology, and Outsourcing ..............................................85
Summing Up ..................................................................................................90
Notes ..............................................................................................................90
References ......................................................................................................91
Part 2 The Implications of the Technological Divide for Long-Term Economic Growth ........................................................................................... 93
4. Technology Sophistication, Productivity, and Employment .........................95
Introduction ..................................................................................................95
Technology and Firm-Level Productivity ....................................................96
Technology Adoption and Employment ....................................................100
Summing Up ................................................................................................107
Notes ............................................................................................................107
References ....................................................................................................108
5. Digital Technologies and Resilience to Shocks ...........................................111
Introduction ................................................................................................111
Digital Technologies ....................................................................................112
Technology and Resilience ..........................................................................120
Summing Up ................................................................................................133
Notes ............................................................................................................134
References ...................................................................................................135

Contents vii
Part 3 What Countries Can Do to Bridge the Technological Divide ............... 139
6. What Constrains Firms from Adopting Better Technologies? ....................141
Introduction ................................................................................................141
Firm-Level Determinants of Adoption ......................................................141
Perceived Drivers of and Obstacles to Technology Adoption ...................144
Factual Evidence on Drivers of and Obstacles to Technology Adoption .....146
Summing Up ................................................................................................164
Notes ............................................................................................................164
References ....................................................................................................166
7. Policies and Instruments to Accelerate Technology Adoption .................169
Introduction ................................................................................................169
A Checklist to Design Technology Upgrading Programs ..........................169
Using the FAT Survey to Inform the Design and Implementation of Policies Supporting Technology Upgrading ..........................................178
Instruments to Support Technology Upgrading at the Firm Level ..........183
Summing Up ................................................................................................197
Notes ............................................................................................................198
References ....................................................................................................200
Appendix A. The Firm-level Adoption of Technology (FAT) Survey, Implementation, and Data Set ................................................................................203
BoxesI.1 Defining Technology and Business Functions ..........................................................6
1.1 The Technology Index at the Firm Level: An Example from the Food-Processing Sector in Senegal ..........................................................................34
2.1 The Large Gap in Technology Sophistication between Formal and Informal Firms .........................................................................................................52
3.1 The Strong Sector Composition of the Use of Industry 4.0 Technologies ...........75
3.2 The Closeness of Pharmaceutical Firms to the Technology Frontier ...................78
6.1 Specific Barriers to the Use of Digital Platforms ..................................................150
7.1 Digital Platforms Are Prone to Market Concentration and Dominance ............172
7.2 The Firm-Level Technology Diagnostic Tool .......................................................181

viii Contents
7.3 Agriculture Extension: The Case of Embrapa ......................................................188
7.4 Credit Guarantees for Technology through the Korea Technology Finance Corporation (KOTEC) ...........................................................................................191
7.5 The Difference between Vouchers and Grants ......................................................193
7.6 Fraunhofer Institutes .............................................................................................197
Figures
1.1 While Countries Are Converging in Their Adoption of Technology, They Are Diverging in the Intensity of Use ............................................................23
1.2 Conceptual Framework for the Firm-level Adoption of Technology (FAT) Survey ........................................................................................26
1.3 General Business Functions and Their Associated Technologies ..........................27
1.4 Share of Firms Using Technologies Applied to Various General Business Functions, All Countries ..........................................................................................28
1.5 Sector-Specific Business Functions and Technologies ...........................................31
1.6 An Example of the Technology Index .....................................................................34
B1.1.1 Comparing Technology Sophistication of a Large and a Small Firm in the Food-Processing Sector ................................................................................35
1.7 Firms Vary Widely in the Status of Their Adoption of General-Purpose Technologies ............................................................................................................39
1.8 Among Firms with Access to Computers and the Internet, a Large Share Relies Mostly on Less Sophisticated Methods to Conduct Business Functions .............41
2.1 Estimated Technology Sophistication, by Country: Manufacturing .....................48
2.2 Estimated Technology Sophistication, by Country: Agriculture and Services ......49
2.3 There Is a Strong Correlation between the Technology Sophistication of a Region and Regional Productivity ...................................................................51
2.4 Cross-Country Differences in Technology Are Also Explained by the Number of Firms Using Sophisticated Technology ................................................52
B2.1.1 Technology Sophistication Is Significantly Greater among Formal Firms in Senegal ......................................................................................................................53
2.5 The Level of Technology Sophistication for General Business Functions Varies Greatly .........................................................................................54
2.6 Technology Sophistication Varies across Firm Size ................................................55
2.7 The Likelihood of Adopting Frontier Technologies for General Business Functions Varies across Firm Size ............................................................56
2.8 The Likelihood of Adopting Frontier Technologies for Sector-Specific Business Functions Varies across Firm Size ............................................................57
2.9 Rank Orderings of the Distribution of Technology Sophistication Are Consistent across Select Countries ...................................................................58

Contents ix
2.10 Most Productive Countries and Regions Have Firms That Use More Sophisticated Technologies on Average ...................................................................59
2.11 Within-Firm Variance of Technology Sophistication Is Positively Associated with Regional Productivity ..................................................................61
2.12 Technology Disruption in Telecommunications ...................................................62
2.13 Diffusion Curves, by Firm Size (Early versus Late Adopters) ................................62
2.14 Firms with Lower Levels of Technological Capabilities Tend to Overestimate Their Technological Sophistication ..................................................64
3.1 Firms in Agriculture Tend to Use More Sophisticated Technologies in Sector-Specific Business Functions ........................................................................71
3.2 The Technology Gaps Are Larger in General Business Functions in Agriculture Compared to Sector-Specific Business Functions ..............................72
3.3 Technology Sophistication for Fabrication in Manufacturing Is Low in Developing Countries ..............................................................................................73
B3.1.1 The Likelihood of Adopting Advanced Manufacturing Technologies Varies Widely across Sectors ....................................................................................75
B3.1.2 More Capital-Intensive Agricultural Firms Are More Likely to Adopt Advanced Technologies ............................................................................................76
3.4 Differences in Technology across Countries Roughly Follow Income Differences in the Food-Processing Sector .............................................................77
3.5 Cross-Country Comparisons in Wearing Apparel Are Not So Large among Exporter Countries ..................................................................................................77
B3.2.1 Pharmaceutical Firms Are Relatively Close to the Technology Frontier, but There Is Significant Room for Improvement in Developing Countries ................78
3.6 Digitalization of Sector-Specific Business Functions Is at an Early Stage in Retail Services ......................................................................................................79
3.7 The Diffusion Curves of Newer Sector-Specific Technologies Do Not Suggest Leapfrogging ...............................................................................................80
3.8 Tractor Ownership, Renting, and Digital Renting Do Not Suggest Leapfrogging through Digital Platforms .................................................................84
3.9 Across Sectors, There Is Large Heterogeneity in Outsourcing Sector-Specific Business Functions .........................................................................86
3.10 Within Sectors, There Is Heterogeneity in the Degree of Outsourcing within Sector-Specific Business Functions .............................................................87
3.11 The Significant Correlation between Outsourcing Tasks and Technology Sophistication (All Business Functions) Is Restricted to Some Business Functions ...................................................................................................88
3.12 There Are No Significant Differences between Traders and Nontraders in Outsourcing Business Functions .............................................................................89
4.1 Several Drivers Affect the Margins of Productivity Growth ..................................96

x Contents
4.2 Technology Sophistication Is Correlated with Labor Productivity .......................97
4.3 The Level of Technology Sophistication Varies Considerably across Agriculture, Manufacturing, and Services Sectors .................................................99
4.4 Differences in Technology Sophistication between the Republic of Korea and Senegal Are Larger in the Agricultural Sector than in Nonagricultural Sectors and Are Driven Mainly by the Low Sophistication of Informal Firms ...100
4.5 Firms Generally Keep the Same Number of Jobs When They Adopt New Technologies ..................................................................................................101
4.6 Firms That Have Adopted Better Technology Have Increased Employment ......102
4.7 More Sophisticated Technologies in Some Business Functions Are More Associated with Employment Growth ..................................................................103
4.8 Firms with a Higher Level of Technology Are Creating More Jobs but Not Changing Their Share of Low-Skilled Workers ...................................................104
4.9 Firms Using More Sophisticated Technologies Pay Higher Wages .....................105
4.10 Technology Sophistication Contributes to Wage Inequality within Firms .........106
5.1 Use of Internet and Adoption of Applications of Digital Technologies Vary by Sophistication and Firm Size ..................................................................113
5.2 Digital Technology Intensity Varies across Sectors and Business Functions .......114
5.3 Some Technologies Diffuse More Rapidly than Others .......................................115
5.4 Market Concentration Poses a Challenge for the Supply of Digital Business Solutions .................................................................................................119
5.5 The Large Drop in Sales at the Beginning of the COVID-19 Pandemic Persisted for Many Firms, and the Loss Was Greater for Microenterprises and Small Firms......................................................................................................121
5.6 Demand for Digital Solutions Increased Greatly in Response to the COVID-19 Pandemic .............................................................................................123
5.7 A Large Share of Businesses Digitalized during the COVID-19 Pandemic ........124
5.8 Among Firms That Used and Invested in Digital Technologies, Investments in Digitalizing External, Customer-Related Functions Dominated ...................124
5.9 There Is Large Variation across Countries in the Use of Digital Technologies to Respond to the COVID-19 Pandemic ........................................125
5.10 Smaller Firms Have Used and Invested Less in Digital Solutions ........................125
5.11 The Probability of a Digital Response to the COVID-19 Pandemic Is Larger for Firms That Were Digitally Ready before the Pandemic .....................126
5.12 Sales Fell Less during the COVID-19 Pandemic for Firms That Increased the Use of and/or Investment in Digital Technologies during the Pandemic ..........127
5.13 Firms’ Likelihood of Adopting Additional Digital Solutions to Respond to the COVID-19 Crisis Increased with Technology Sophistication .......................129
5.14 The Direct Effect of Technology Readiness before the COVID-19 Pandemic Is Much Larger than the Indirect Effect on the Change in Sales during the Pandemic ....................................................................................129

Contents xi
5.15 The Direct and Indirect Effects of Digital Readiness Are Consistent across Different Types of Digital Solutions ......................................................................130
5.16 Adoption of Green Practices Is at a Very Early Stage in Georgia .........................132
5.17 There Is a Positive Correlation between Technology Sophistication and Use of Energy-Efficient Technologies in Georgia .................................................133
6.1 Technology Adoption Depends on a Set of Complementary Factors That Are External and Internal to the Firm ..........................................................143
6.2 Competition Is a Top Driver for Technology Adoption ......................................144
6.3 Lack of Demand and Firm Capabilities Are Key Obstacles for Technology Adoption .............................................................................................145
6.4 Longer Distances from Internet Nodes Significantly Reduce the Likelihood that Firms Will Adopt Internet Service ..............................................149
6.5 The Impact of Access to the Internet Is More Restricted to General Business Functions than to Sector-Specific Business Functions .........................149
6.6 Globally Engaged Firms Are More Sophisticated Technologically ......................151
6.7 Foreign-Owned Companies Tend to Have More Sophisticated Technologies across General Business Functions .................................................152
6.8 Constraints to Financial Credit Are a Larger Barrier to Technology Upgrading for Smaller Firms .................................................................................153
6.9 Firms That Use External Business Consultants Have Higher Levels of Technology Sophistication ....................................................................154
6.10 Firms with a Lower Level of Technology Are Especially Likely to Think They Are More Technologically Sophisticated than They Actually Are .............156
6.11 Engagement with Multinational Enterprises or More Seasoned CEOs Is Positively Associated with Technology Sophistication .....................................158
6.12 Firms with Better Management Characteristics, Management Practices, and Organizational Capabilities Have Higher Levels of Technology Sophistication .........................................................................................................160
6.13 Firms Capable of Developing and Customizing Equipment and Software Are More Sophisticated Technologically ...............................................................162
6.14 Human Capital Is Higher among Firms with More Sophisticated Technologies ... 163
7.1 Large Firms Tend to Be More Aware of and Benefit More from Public Support of Technology Adoption than Small and Medium Firms ......................176
7.2 A Considerable Share of Public Support to Businesses to Cope with the COVID-19 Pandemic Went to Firms That Did Not Need It ..............................177
7.3 A Checklist for Policy Makers to Upgrade Technologies .....................................178
B7.2.1 The Firm-Level Technology Diagnostic ................................................................181
7.4 A Typology of Instruments to Support the Firm-Level Adoption of Technology ........................................................................................184
7.5 Framework for Policy and Instruments to Support the Firm-Level Adoption of Technology .......................................................................................185

xii Contents
B7.4.1 KOTEC’s Credit Guarantee Scheme ......................................................................192
A.1 Livestock: Sector-Specific Business Functions and Technologies ........................204
A.2 Wearing Apparel: Sector-Specific Business Functions and Technologies ............204
A.3 Leather and Footwear: Sector-Specific Business Functions and Technologies ...205
A.4 Motor Vehicles: Sector-Specific Business Functions and Technologies ...............205
A.5 Pharmaceuticals: Sector-Specific Business Functions and Technologies ............206
A.6 Manufacturing (Fabrication): Sector-Specific Business Functions and Technologies ...........................................................................................................206
A.7 Land Transport: Sector-Specific Business Functions and Technologies ..............207
A.8 Financial Services: Sector-Specific Business Functions and Technologies ..........207
A.9 Accommodation: Sector-Specific Business Functions and Technologies ............208
A.10 Health Services: Sector-Specific Business Functions and Technologies ..............208
Map6.1 Firms in Senegal Are More Likely to Access the Internet in Clusters
Surrounded by Digital Infrastructure ...................................................................148
Photos3.1 Technologies Used for Irrigation and Storage in Senegal Vary Greatly
in Sophistication ......................................................................................................72
3.2 Small Firms in Developing Countries Still Perform Many Functions Manually ............................................................................................74
Tables1.1 Number of Establishments Surveyed, by Sector and Firm Size .............................36
A.1 Number of Establishments Surveyed, by Strata....................................................210
A.2 Total Number of Establishments (Population Distribution by Sector and Firm Size) ........................................................................................................212
A.3 Number of Establishments Surveyed, by Sector and Firm Size ...........................212

xiii
Foreword
Poverty reduction and shared prosperity can be achieved only with sustained growth.
But the global economy is increasingly vulnerable to global shocks. The COVID-19
(coronavirus) pandemic and its devastating impact on livelihoods has shown how
vulnerable economies are. Potential future pandemics, climate change shocks, and
political tensions threaten a sustainable recovery and future economic growth pros-
pects. In this context, technology is emerging as a critical lifeline to increase the resil-
ience of economies and boost economic growth. The pandemic has led to an
unprecedented demand for the use of digital technologies by businesses and therefore
provides a renewed opportunity to accelerate technology upgrading.
Since Joseph Schumpeter’s pathbreaking work, technology has been recognized to
be at the center of economic growth and development. Technologies used by firms are
central to the process of creative destruction. Yet, existing measures of technology use
fall short of providing a comprehensive characterization of technologies across and
within firms, particularly for developing countries. This volume builds on a large
effort to collect novel data through the new Firm-level Adoption of Technology (FAT)
survey, providing a breakthrough contribution to address this knowledge gap. The
new methods and data presented allow practitioners and policy makers to look inside
the “black box” of technology adoption by firms and identify the key obstacles that
constrain job creation through digital transformation and upgrading of business
functions.
The volume’s key findings contribute to the literature in three major directions.
First, new measures of technology use show that most firms in developing countries are
quite far from the technology frontier, and they may not be aware of the extent to
which they lag. Second, new evidence shows that technology adoption is a key driver of
long-term growth through its positive impact on productivity, jobs, and economic
resilience. Third, in bridging the technological divide, access to reliable and high-
quality infrastructure is a necessary condition for technology upgrading, but not a suf-
ficient one. Developing countries need to enhance their institutions to promote market
competition while shifting the focus from access to technology to the effective use of
technology by firms.

xiv Foreword
The research presented here is part of the World Bank’s Productivity Project led by
the Chief Economist’s Office of the Equitable Growth, Finance, and Institutions
Vice Presidency. We are confident that researchers and development practitioners
alike will highly value the new findings on technology adoption and the directions for
development policies this volume contains.
Indermit S. Gill
Vice President, Equitable Growth, Finance, and Institutions
The World Bank

xv
Preface
Productivity accounts for half of the differences in gross domestic product per capita
across countries. Identifying policies that stimulate productivity is thus critical to alle-
viating poverty and fulfilling the rising aspirations of global citizens. In recent decades,
however, productivity growth has slowed globally, and the lagging productivity perfor-
mance of developing countries is a major barrier to convergence with income levels in
advanced economies. The World Bank Productivity Project seeks to bring frontier
thinking to the measurement and determinants of productivity, grounded in the devel-
oping country context, to global policy makers. Each volume in the series explores a
different aspect of the topic through dialogue with academics and policy makers and
through sponsored empirical work in the World Bank’s client countries.
Bridging the Technological Divide: Technology Adoption by Firms in Developing
Countries, the seventh volume in the series, breaks new ground in the empirics of tech-
nology adoption. Like The Innovation Paradox before it, this volume stresses the impor-
tance to economic growth of the flow of ideas and new practices. Indeed, recent studies
suggest that differences in the evolution of technology diffusion across countries drive
a corresponding evolution of productivity (total factor productivity) that can account
for the divergence in the world income distribution over the last 200 years.
The agent that in practice undertakes technology adoption and drives technology
diffusion is the firm. The Productivity Project opens the “black box” of the firm for the
first time in a comprehensive way by developing and fielding the detailed Firm-level
Adoption of Technology (FAT) survey in 11 countries. Bridging the Technological Divide
brings together the first wave of findings from that effort, documenting the patterns of
adoption of different types of technologies within and across firms, and the factors that
facilitate or impede diffusion. The hope is that the volume will stimulate interest in
exploring this critical dimension of growth generally, and exploiting these surveys in
particular.
This book is a product of the Equitable Growth, Finance, and Institutions Vice
Presidency.
William F. Maloney
Chief Economist, Latin America and the Caribbean Region
Director, World Bank Productivity Project series
The World Bank

Other Titles in the World Bank Productivity Project
Place, Productivity, and Prosperity: Revisiting Spatially Targeted Policies for Regional Development. 2022. Arti Grover, Somik V. Lall, and William F. Maloney. Washington, DC: World Bank.
At Your Service? The Promise of Services-Led Development. 2021. Gaurav Nayyar, Mary Hallward-Driemeier, and Elwyn Davies. Washington, DC: World Bank.
Harvesting Prosperity: Technology and Productivity Growth in Agriculture. 2020. Keith Fuglie, Madhur Gautam, Aparajita Goyal, and William F. Maloney. Washington, DC: World Bank.
High-Growth Firms: Facts, Fiction, and Policy Options for Emerging Economies. 2019. Arti Grover Goswami, Denis Medvedev, and Ellen Olafsen. Washington, DC: World Bank.
Productivity Revisited: Shifting Paradigms in Analysis and Policy. 2018. Ana Paula Cusolito and William F. Maloney. Washington, DC: World Bank.
The Innovation Paradox: Developing-Country Capabilities and the Unrealized Promise of Technological Catch-Up. 2017. Xavier Cirera and William F. Maloney. Washington, DC: World Bank.
All books in the World Bank Productivity Project are available free of charge at https://openknowledge .worldbank.org/handle/10986/30560.

xvii
Acknowledgments
This book was written by Xavier Cirera (senior economist, Finance, Competitiveness,
and Innovation Global Practice, World Bank), Diego Comin (professor of economics,
Dartmouth College), and Marcio Cruz (senior economist, Finance, Competitiveness,
and Innovation Global Practice, World Bank), with the collaboration of a core team
from the World Bank working on the Firm-level Adoption of Technology (FAT) project.
Kyung Min Lee provided key contributions across this project as a core team member,
from survey design to data implementation, and coauthorship of key background
papers. Other core team members who provided key contributions on survey
implementation and data analysis include Pedro Jose Martinez Alanis, Antonio Soares
Martins Neto, Caroline Nogueira, and Santiago Reyes. Enrico Berkes (Ohio State
University) and Jesica Torres contributed with coauthorship of background papers.
Additional inputs were provided by Edgar Avalos, Ana Paula Cusolito, Sara Nyman,
and Juni Zhu. The work was carried out under the guidance of Mona Haddad (global
director, Trade, Investment, and Competitiveness, World Bank), Martha Martinez
Licetti (practice Manager, Markets and Technology, World Bank), William F. Maloney
(director, World Bank Productivity Project and chief economist, Latin America and the
Caribbean Region), and Denis Medvedev (director, Economic Policy Research
Department, International Finance Corporation).
We thank Ayhan Kose (chief economist, Equitable Growth, Finance, and Institutions
Practice Group) for support and helpful comments. We also thank Najy Benhassine,
Paulo Correa, and Caroline Freund (University of California San Diego) for supporting
the project and providing guidance at early stages in the role of managers or directors.
We are very thankful to peer reviewers who provided key inputs during the concept
note review, the quality enhancement review, and the decision meeting, including Rami
Amin, Paulo Bastos, Mark Dutz, Ana Margarida Fernandes, Mary Hallward-Driemeier,
Maurice Kugler (George Mason University), and Mark Williams. Alvaro Gonzalez
provided detailed revision and feedback.
We are grateful for additional comments and feedback provided by Mark Aguiar
(Princeton University), Asya Akhlaque, Pol Antras (Harvard University), David Baqaee
(University of California Los Angeles), Mark Bils (University of Rochester), Paco Buera
(Washington University), Andrew L. Dabalen, Maria Cristina DiNardi (University of
Minnesota), Apoorv Gupta (Dartmouth College), John Haltiwanger (University of
Maryland), Elhanan Helpman (Harvard University), Justin Hill, Leonardo Iacovone,

xviii Acknowledgments
David Lagakos (Boston University), Marti Mestieri (Northwestern University), Gaurav
Nayyar, Antonio Nucifora, Nina Pavnik (Dartmouth College), Richard Rogerson
(Princeton University), Consolate K. Rusagara, Manu Garcia Santana (Universitat
Pompeu Fabra), Jon Skinner (Dartmouth College), Chris Snyder (Dartmouth College),
Doug Staiger (Dartmouth College), Jaume Ventura (Universitat Pompeu Fabra),
Stephen Yeo, and Albert G. Zeufack, as well as participants in a seminar at Dartmouth
College from the Central Bank of Chile, Harvard Business School, Oxford University,
and Seoul University.
The preparation of the FAT survey questionnaire involved the contribution of
several sector experts within and outside the World Bank. First, we would like to thank
Silvia Muzi and Jorge Rodriguez Meza for sharing the expertise of the World Bank
Enterprise Survey team, and Mark Dutz for contributing with the revision and pilot.
Next, we thank several colleagues who contributed with the development of the sector-
specific modules, including Victor A. Aragones, Correia Araujo, Arturo Ardila Gomez,
Kazimir Luka Bacic, Brendan Michael Dack, Edson Emiliano Duch, Erick C. M.
Fernandes, Erik Feyen, Madhur Gautam, Laurent Gonnet, Aparajita Goyal, Etienne
Raffi Kechichian, Austin Kilroy, Holger A. Kray, Blair Edward Lapres, Michael Morris,
Harish Natarajan, Irina A. Nikolic, Ashesh Prasann, Robert Townsend, and Justin Yap.
Similarly, we would like to thank several external experts. From Embrapa (Brazil), we
thank Alexandre Costa Varella, Flávio Dessaune Tardin, Alberto Duarte Vilarinhos,
Carlos Estevão Leite Cardoso, Edison Ulisses Ramos Junior, Isabela Volpi Furtini, and
other participants of the internal seminars to validate the sector-specific questionnaires
for agriculture and livestock. For other sectors, we thank Sandra Aris, Justin Barnes,
Chris Baughman, James M. Keding, Daren Samuels, Shelly Wolfram, and Steve
Zebovitz, as well as Sudha Jayaraman (University of Utah), Christina Kozycki (National
Institutes of Health), Elizabeth Krebs (Jefferson University), and Jon Skinner
(Dartmouth College). We also thank Tanay Balantrapu, João Bevilaqua Basto, and
Carmen Contreras for their excellent support through the preparation of the
questionnaire and implementation of the surveys.
The implementation of data collection across 11 countries also benefited from key
contributions from World Bank colleagues working in the regions and local institutions.
We thank the following colleagues for their collaboration in implementing the FAT
survey: for Bangladesh and India, Siddharth Sharma; for Burkina Faso, Jean Michel
Marchat; for Ghana, Elwyn Davies, David Elmaleh, and Katherine Anne Stapleton; for
Kenya, Utz Johann Pape and Zenaida Uriz; for the Republic of Korea, Anwar Aridi,
Sameer Goyal, Soyoun Jun, and Hoon Soh; for Malawi, Efrem Zephnath Chilima; for
Poland, Magda Malec and Lukasz Marc; for Senegal, Carlos Castelan and Mark Dutz;
and for Vietnam, Brian Mtonya and Trang Thu Tran. We also thank the following local
institutions for collaboration during the implementation of the survey: Guilherme
Muchale de Araujo and the Federation of Industries of the state of Ceará (Brazil),
Ghana Statistical Service, National Statistical Office of Malawi, Statistics Poland, and
Acknowledgments xix
Pham Dinh Thuy and the General Statistics Office of Vietnam. We thank the following
institutions for the provision of sampling frames: Bangladesh Bureau of Statistics,
Central Statistics Office of India, Kenya National Bureau of Statistics, Statistics Korea,
and the Senegal National Agency for Statistics and Demography. For technical guidance
on implementing the sampling design and weights, we thank Filip Jolevski, Talip Kilic,
and especially Diego Zardetto for extended support in designing the sampling weights.
We thank our publishing team—Cindy Fisher, Patricia Katayama, and Mark
McClure—for the design, production, and marketing of this book; Nancy Morrison for
her excellent and timely editorial services; Gwenda Larsen for proofreading; and our
communications team for its creative energy in promoting the book.
Financial support from the Korea–World Bank Group Partnership Facility (KWPF)
made possible this volume and data collection, and it is gratefully acknowledged. We
also thank the infoDev Multi-Donor Trust Fund, the Competitive Industries and
Innovation Program (CIIP), and the Facility for Investment Climate Advisory Services
(FIAS) for the financial support provided for the design of the survey and data
collection.


xxi
About the Authors
Xavier Cirera is a senior economist in the Finance, Competitiveness, and Innovation
Global Practice of the World Bank. His work focuses on innovation and technology. He
has led the policy effectiveness reviews in science, technology, and innovation imple-
mented in Brazil, Chile, Colombia, Ukraine, and Vietnam. He is the coauthor of The
Innovation Paradox: Developing-Country Capabilities and the Unrealized Promise of
Technological Catch-Up and A Practitioner’s Guide to Innovation Policy: Instruments to
Build Firm Capabilities and Accelerate Technological Catch-Up in Developing Countries.
His most recent work focuses on the measurement and impact of technology adoption
and diffusion and the impact of innovation on employment and firm dynamics. Before
joining the World Bank, he was a research fellow at the Institute of Development
Studies at the University of Sussex. He holds a PhD in economics from the University
of Sussex.
Diego Comin is a professor of economics at Dartmouth College. He is also a research
fellow at the Center for Economic Policy Research and faculty research fellow in the
National Bureau of Economic Research’s Economic Fluctuations and Growth Program.
He has published multiple articles in top economic journals on the topics of business
cycles, technology diffusion, economic growth, and firm volatility. He has also authored
case studies published in the book Drivers of Competitiveness. He has consulted for the
World Bank, the International Monetary Fund, the Federal Reserve Bank of New York,
the European Central Bank, the Danish Science Ministry, the Economic and Social
Research Institute of the government of Japan, the prime minister of Malaysia, Citibank,
and Microsoft. Previously, he was an assistant professor of economics at New York
University and associate professor of business administration at the Harvard Business
School (HBS). He has also designed and led immersion programs in Peru and Malaysia,
for which he received the Apgar Award for Innovation in Teaching from the HBS Dean.
He holds a PhD in economics from Harvard University.
Marcio Cruz is a senior economist in the Finance, Competitiveness, and Innovation
Global Practice of the World Bank. Previously, he worked in the Development
Economics unit contributing to the World Bank’s flagship publications Global Economic
Prospects and Global Monitoring Report. Before joining the World Bank, Cruz worked
as a tenured professor in the Department of Economics at the Federal University of
Paraná and as an economist for the Secretary of Planning of the state of Paraná, Brazil.

xxii About the Authors
His main research interests are firm dynamics, technology adoption, entrepreneurship,
international trade, and impact evaluation. His research has been published in
scholarly journals such as the Journal of International Economics, World Development,
and the Cambridge Journal of Regions, Economy and Society. He received the World
Bank’s Research Academy Award for the best new research from across the World Bank
in 2015. He holds a PhD in international economics from the Graduate Institute of
International and Development Studies in Geneva.
Abbreviations xxiii
Abbreviations
ABF all business functions
AI artificial intelligence
B2B business to business
BAS business advisory services
BPS Business Pulse Survey
CEO chief executive officer
COVID-19 coronavirus disease 2019
CRM customer relationship management
ERP enterprise resource planning
EXT extensive margin technology index
FAT Firm-level Adoption of Technology survey
GBF general business function
GDP gross domestic product
GPT general-purpose technology
GVC global value chain
HR human resources
ICT information and communication technology
INT intensive margin technology index
IT information technology
KOTEC Korea Technology Finance Corporation
R&D research and development
SBF sector-specific business function
SMEs small and medium enterprises
SRM supplier relationship management
TC technology center
TES technology extension services


1
Introduction
Every body must be sensible how much labour is abridged and facilitated by the
application of proper machinery. By means of the plough two men, with the
assistance of three horses, will cultivate more ground than twenty could do with
the spade. A miller and his servant, with a wind or water mill, will at their ease
grind more corn than eight men could do, with the severest labour, by hand mills.
—Adam Smith, An Inquiry into the Nature and Causes of
the Wealth of Nations, 1776
The Imperative of Technology in Developing Countries
Technology is at the heart of economic growth. From historical accounts of how tech-
nological change since the Industrial Revolution has shaped economic development in
Europe, such as David Landes’ The Unbound Prometheus (Landes 2003), to endogenous
growth models (Romer 1990; Aghion and Howitt 1992), technology has been identi-
fied as a key ingredient of growth and economic transformation. Measuring the uses of
technology and understanding the drivers of and barriers to the adoption of technol-
ogy are, therefore, critical to designing policies that facilitate economic development.
Until the nineteenth century, the main source of cross-country variation in technology
was whether new technologies had arrived in a country (Comin, Easterly, and Gong
2010). While there has been a widespread reduction in the time needed to acquire and
adopt a new technology, current technological differences across countries originate
mostly from differences in how intensively new technologies are eventually used once
they arrive in a country (Comin and Mestieri 2018).
Technological catch-up happens through firms. Firms are the prime source for
adopting more sophisticated technologies to be applied in the production of goods and
provision of services. These upgrades are key to promoting gains in productivity, the
engine of economic growth and prosperity. While technology can improve economic
welfare through different channels, it is primarily through the process of adoption by
firms that most workers are affected. Workers can have access to higher-productivity
jobs and countries can achieve higher prosperity through the adoption of more sophis-
ticated technologies. With very few exceptions of countries that are rich in natural
resources, there is no successful example of a developing country that graduated to
become an advanced economy without improving the technological level of its
production through its firms, in either agriculture, manufacturing, or services.

2 Bridging the Technological Divide
Yet around the world, there is a large technological divide across firms. This divide
is reflected in low productivity levels and a lack of better-quality jobs—particularly in
developing countries, where the number of enterprises per worker relatively close to
the forefront of technology sophistication (the technology frontier) is quite low. But
this divide is not restricted to developing economies. In high-income countries, the gap
between frontier and laggard firms is also large and could potentially increase,
which could, in turn, deepen challenges associated with income inequality across and
within countries. The technological divide across firms also affects firms’ varying
ability to cope with and bounce back from economic shocks, given that more capable
and technologically sophisticated firms are also more resilient.
Bridging the technological divide is thus an imperative for development policies. Understanding how technology is used and distributed across firms and identifying the
main drivers of adoption are critical to unpack the “black box” of the firm, and, even
more important, to design policies that can help accelerate adoption and convergence
to the technology frontier. Addressing some of the most relevant development chal-
lenges, from eradicating global poverty to promoting environmentally sustainable eco-
nomic growth, will require not only innovation, but also technology upgrading of
firms across the globe. The fact that most firms, particularly in developing countries,
are far from the technology frontier suggests that this is not an easy challenge, but it
also suggests that there are many opportunities for enhancing productivity and gener-
ating high-quality jobs in developing countries. To better understand this challenge at
the firm level, we need to improve existing measures of technology and the body of
data that can better reveal how firms make decisions and actually use (or do not use)
technology in their operations. This will help answer the question of why firms, par-
ticularly in developing countries, are not adopting and using technology that clearly
could benefit them. Armed with this understanding, policy makers and practitioners
can design better policies and interventions to help firms adopt better and more sophis-
ticated technologies.
Recent global trends have increased the focus on technology as a source of growth.
First, numerous studies have documented a productivity growth slowdown in advanced
economies and some middle-income countries in recent decades (Andrews, Criscuolo,
and Gal 2016; Gordon 2012), as well as a decrease in business dynamism (Akcigit and
Ates 2019). An important culprit for this slowdown is the lack of innovation, and more
important, the low diffusion of technology to laggard firms. Second, the spread of
advanced digital technologies and the so-called fourth industrial revolution (Industry
4.0), along with changes in production processes and potential reshoring, threaten
some of the production and development models based on exports and low wages,
which were enormously successful in the East Asia region. These new developments call
for more investments in technology upgrading. Third, the COVID-19 pandemic and
related restrictions have increased the pressure for more flexible and automated pro-
duction and management processes that can circumvent lockdown restrictions and
Introduction 3
potential structural changes in demand and point to the need to be technology-ready
for future shocks. Finally, climate change and increasing concerns about the state of the
global environment will continue intensifying the need to upgrade to more sophisti-
cated and cleaner technologies.
The Technological Divide
Despite the economic relevance of the technology frontier, there is no comprehensive
body of data across countries and sectors describing where the frontier is and how far
firms in developing countries are from it. As a famous saying—usually attributed to
Peter Drucker, a well-known management consultant—goes, “You cannot improve what
you don’t measure.” This dictum describes a common challenge policy makers and
practitioners face when thinking about the effectiveness of policies to promote tech-
nology upgrading. The World Bank Group has made important contributions to
address similar challenges in other areas in the past, such as poverty and education. The
poverty line and associated household data collection, for example, introduced in the
1990s, have facilitated designing, targeting, and monitoring public interventions aimed
at eradicating global poverty, including projects funded by the World Bank. Yet, efforts
to measure technology adoption by firms have been restricted to a few variables
included in the World Bank Enterprise Survey, mostly related to access to general-
purpose technologies (such as electricity, the internet, or websites) or to individual
projects (such as those promoting technology upgrading for agriculture). Other insti-
tutions are furthering measurements of technology, particularly national statistical
offices, but most of them are restricted to measuring information and communication
technology, or advanced manufacturing technologies in high-income countries.
This volume advances these efforts by proposing a new approach and body of data
to understand adoption and use of technology from the perspective of the firm, par-
ticularly in developing countries. Specifically, this volume addresses data shortcomings
in existing surveys, and offers a new framework for collecting data on the adoption and
use of technology by firms. This new approach facilitates exploration of the process of
technology adoption by firms and its variation (heterogeneity) across firms, sectors,
and countries with a high level of granularity. In the light of the new data collected, the
volume examines some of the theories on technology adoption and presents new styl-
ized facts that can improve the design of policies to facilitate technology adoption and
diffusion. It also provides a detailed overview of the process of technology adoption
with special emphasis on developing countries, and the important variations that char-
acterize technology use across and within firms.
To do so, the volume introduces a new data collection instrument, the Firm-level
Adoption of Technology (FAT) survey. The development of the FAT survey involved
intensive research and interaction with more than 50 industry experts with experience
in firms in advanced economies as well as in developing countries to identify the

4 Bridging the Technological Divide
location of the technology frontier and the array of technologies (the technology grid)
available for a firm to perform a task, including the most relevant technology options—
from most basic to most sophisticated. More specifically, the methodology identifies
the relevant business functions conducted by the firm. They are split between general
business functions (GBFs) that are common to all firms, such as business administra-
tion and payment methods, and sector-specific business functions (SBFs) relevant to
specific sectors, such as harvesting for agriculture, and sewing for wearing apparel.
Then, for each of these business functions, the FAT survey identifies a grid of technolo-
gies available to perform that task, and with guidance from industry experts, it ranks
them according to their level of sophistication.
While the FAT survey identifies where the technology frontier is, the data collected
across several countries help determine how far from the frontier firms are. The data
provide a very rich characterization of the technologies used by firms and offer new
insights on the main drivers of and barriers to technology adoption. The survey was
implemented in 11 countries, across a variety of regions and income levels. In addition,
the analysis is complemented by a review of some of the main policy instruments that
can be used to support technology adoption, with the aim of helping government and
public agencies design more effective policies to support technology adoption.
The FAT survey captures the multidimensionality of technology in terms of types,
use, drivers, barriers, and impacts. These multiple dimensions require identifying and
measuring the different types of technologies that are covered by this volume. While
firms adopt technologies to accomplish specific tasks, the characteristics of these tech-
nologies vary and affect their potential benefits, their main drivers, and the key obsta-
cles to adoption.
The attempt described in this volume to measure and document the mechanisms of
technology adoption can be seen as analogous to recent efforts in the realm of manage-
rial quality.1 Despite these similarities, there are also important differences in these
approaches. While management practices refer to establishing routines to deal with
decision processes, the technology measures presented in this volume reflect actions
embodied in machines and software or represent processes that typically require certain
equipment and technological knowledge to use them. The effort reported here mea-
sures a large number of technologies used and derives several indexes of technology
sophistication. This provides a very granular perspective of general-purpose and
sector-specific technologies used to produce and sell goods and services.
Improving the measures of the technological divide is critical for developing
countries, where firms are often confined to more rudimentary and less automated
technologies. The more accurate and granular the information on technology use is,
the better equipped researchers, policy makers, and practitioners can be to identify
the key bottleneck(s) to facilitate technology upgrading that can lead to expansion of
firms and creation of better jobs. For this purpose, data with detailed measures of
Introduction 5
technology used by firms across different sectors are needed. This kind of measure
can be aggregated by country, regions, sectors, or specific business functions to iden-
tify the distance from the technology frontier, and to understand the key drivers,
obstacles, and policies that could improve these results. This is the main contribution
that this volume aims to provide.
Perhaps the best way to illustrate the implications of the technological divide is with
an example. Imagine a young worker starting a job in two different country contexts.
The first worker starts working in a food-processing firm producing dairy products in
the Republic of Korea. This firm has 150 workers and uses frontier technologies to
perform most business functions, from administration to production. The second
worker goes to a firm of similar size in Kenya, producing similar products. Despite
performing similar functions using above-average technologies compared to other
firms in Kenya, there is a significant gap in technologies this firm uses for production
compared to its Korean peer. The estimated productivity per worker in the Korean firm
is about 55 percent higher than the firm in Kenya, which allows the Korean firm to pay
higher salaries to its workers. But this is only part of the reason why the economic pros-
pect for a worker is expected to be higher in Korea.
Firms in more advanced economies are not only more technologically sophisticated
on average, but there are also many more of them. A key economic challenge for most
developing countries and emerging economies is not only that their average formal
firm is distant from the technology frontier, but there are also very few of them, relative
to the population.2 Returning to the comparison between Kenya and Korea, both
countries have a relatively similar population (around 50 million), but a very different
number of firms. The Kenyan economy has less than 1 formal business with more than
10 employees for every thousand individuals, and about 2.1 for every thousand
individuals of working age. Korea has about 6.5 formal businesses with 10 or more
employees for every thousand people, and 9.2 businesses for every thousand individuals
of working age. To move closer to the frontier, developing countries need not only to
improve the technological capabilities of existing firms but also to build the conditions
to optimize the reallocation of resources toward more capable firms, and attract more
entrepreneurs to increase the entry of high-quality firms and induce the exit of low-
productivity firms, as highlighted by the second volume of the World Bank Productivity
Project series (Cusolito and Maloney 2018).
Road Map to the Volume
This volume focuses on the adoption and use of technology by firms. The firm is
at the center of the analysis. This implies that we need to understand how tech-
nologies are applied to the main tasks that firms need to carry out to produce and
sell goods and services. This requires opening the black box of the firm further
(Rosenberg 1983) and documenting the types of technology and the processes
6 Bridging the Technological Divide
used to perform firms’ tasks. To this end, the volume presents a new method to
measure technology at the level of business functions particular to the operations
of that firm (for some key definitions about business functions and technology, see
box I.1). This approach allows us to understand what technologies are used, how
they are used, and why they were chosen by firms, which is a critical step to under-
stand the process of technology diffusion and the overall technological progress of
an economy.
BOX I.1
Defining Technology and Business Functions
Technology can be defined as a manner of accomplishing a task especially using technical processes, methods, or knowledge. This definition captures the broader perspective of the way this term is used by social scientists, but it also highlights the challenges associated with measur-ing it. Technology is not only the machinery or “hardware” but also often includes the process or method. The discussion that follows highlights some important distinctions among different types of technologies and the concept of business functions widely used across the volume.
Business functions. Business functions are specific tasks carried out by an enterprise with the purpose of supporting or performing production or service provision. The concept of the business function has been used by national statistical offices.a This volume follows a conceptual frame-work that categorizes business functions in two groups: general business functions and sector-specific business functions. General business functions are tasks that all firms conduct regardless of the sector in which they operate (such as tasks related to business administration, including human resources and finance; production or services operation planning; sourcing, procurement, and supply chain management; sales; and payment methods). Sector-specific business functions are usually more directly associated with core production processes or service provision and are relevant only for firms in a given sector (such as food refrigeration in food processing or sewing in wearing apparel).b
General-purpose technologies (GPTs). Historical accounts of technological change have emphasized the role of certain technologies that have had a disruptive impact, such as the steam engine, the combustion engine, electricity, computers, and the internet.c GPTs are widely used as inputs of other technologies. For example, computers are necessary to implement enterprise resource planning.d The adoption and diffusion of GPTs are critical elements of aggregate produc-tivity and countries’ technology convergence.e But at a more micro level, what matters for firms’ productivity is the application of these GPTs in complementary technologies.f Thus, the study of firm technology adoption needs to go beyond the use of GPTs and document the use of applied technologies.
Digital technologies. A digital technology allows the representation of information in bits to generate, store, or process data, which can reduce several relevant economic costs. Digital technologies are characterized by cost reduction along five dimensions: (1) search costs; (2) replication costs; (3) transportation costs; (4) tracking costs; and (5) verification costs.g Digital technologies are applications of other GPTs (including computers, software develop-ment, and the internet) that overcome the limitation of communication and integration across computers. Recently, mobile communications and cloud technologies have been expanding the
(Box continues on the following page.)

Introduction 7
development of these technologies. As a result, the use of these technologies also depends on the provision of GPT infrastructure, mainly the internet and the mobile network. While many frontier technologies are digital these days, there is large variation in terms of sophistication of digital technologies applied to different tasks of the firm.
Technology adoption. Technology adoption refers to the acquisition and use of a new technol-ogy by individual units (such as a firm, a household, or an organization).
Technology diffusion. Technology diffusion is the dynamic consequence of adoption across firms and organizations. It measures the accumulation of technology across adopters and over time, which arises from decision units at the level of individuals, firms, and governments. While the concept of technology adoption centers on individual units (such as firms), the process of technology diffusion is centered on the technology itself (Stoneman and Battisti 2010). For exam-ple, the diffusion of tractors with global positioning systems (GPS) in a given country, over time, represents an aggregated behavior of several adopters (including firms in this country that started using this technology).
Network effects. Network effects occur when the value of a technology, such as computers or automated teller machines (ATMs), increases the more users it has. Network effects are often accompanied by a production scale effect that reduces the cost of the technology. A critical ele-ment for adoption is that decisions to adopt depend on the number of users.h Most technologies have some degree of network effects, given that the more users a technology has, the greater the availability of additional or complementary services that can be provided. Understanding how large these network effects are will determine the decision by a firm or other adopters to adopt the technology, and hence also affects its diffusion.
a. Eurostat (2000) defines the term “business function” as the activities carried out by an enterprise, which can be divided into core functions and support functions. According to this definition, core business functions are activities of an enterprise yielding income: the production of final goods or services intended for the market or for third parties. Support business functions are ancillary (supporting) activities carried out by the enterprise in order to permit or to facilitate the core business functions, its production activity.b. Chapter 1 and appendix A provide further details on these concepts and how they are linked to the technology measures at the firm level.c. See Landes (2003); Rosenberg (1983); and Comin (2000). Bresnahan and Trajtenberg (1995) characterize GPTs as a handful of technologies that become ubiquitous in their use, and as they diffuse they bring about general productivity improvements.d. For example, electricity enabled a revolution in the way machinery operated and new technologies were developed. Computers and the internet allow firms to implement new management and sales technologies. The Internet of Things is enabling a revolution in technologies implemented in agriculture.e. Bresnahan (2010) identifies three key features. These technologies are “i) widely used, ii) [are] capable of ongoing improvement, and iii) [enable] innovation in the sectors where these are applied.”f. See Comin and Hobijn (2004) for evidence across countries. An example of the relevance of this topic is the ever-expanding literature on the impact of computers and information and communication technology on aggregate productivity and the missing productivity gains, described as the “productivity paradox” (Solow 1987).g. See Goldfarb and Tucker (2019) for more details.h. An extensive literature has focused on the market structure of these technologies (Katz and Shapiro 1986) and the prevalence of standards (David 1985). A famous case is that of video cassette recorders (VCRs) in the 1980s, with two competing main technologies, VHS and Beta. In the case of ATMs, Saloner and Shepard (1995) show how delays in adoption decline with the increase in the number of branches and users.
BOX I.1
Defining Technology and Business Functions (continued)

8 Bridging the Technological Divide
The volume is organized in three parts aiming to address the following questions:
■■ Where is the technology frontier and how far from it are firms in developing
countries?
■■ What are the implications of the technological divide for jobs, growth, and
resilience?
■■ What can countries do to bridge the technological divide?
Part 1. Measuring the Technological Divide (Chapters 1, 2, and 3)
The first part of the volume focuses on the need for this new measurement frame-
work and describes in detail the main characteristics of the FAT survey and key find-
ings. It provides the foundation to understand the degree of firms’ adoption of
technology and the multiple dimensions of the use of technology in firms. The
remainder of this part is based on the analysis of the new data collected, which allows
new stylized facts about technology adoption by firms to be uncovered and
presented.
Chapter 1 describes the methodology of the FAT survey as a new approach to mea-
sure firm-level adoption and use of technology. The chapter starts by reviewing the
literature on measuring technology adoption from different perspectives, including the
macro and micro levels. It then explains further how the FAT survey was elaborated
and what technologies are covered for both general and sector-specific business func-
tions, and how the information is converted into a technology sophistication index that
can be aggregated by business function, firm, sector, region, and country. The chapter
concludes with a discussion about how the new method and the FAT survey can address
some of the limitations of standard measures of technology through different dimen-
sions: first, by identifying the purpose for which a technology is used for a particular
business function; and second, by differentiating adoption (whether the firm uses a
technology or not) from intensive use (what technology a firm is using most frequently
to perform a business function).
Chapter 2 presents some stylized facts on firm adoption of technology analyzing
primary data collected by the FAT survey. This volume uses primary data collected
across 11 countries, including Bangladesh, Brazil (only the state of Ceará), Burkina
Faso, Ghana, India (only the states of Tamil Nadu and Uttar Pradesh), Kenya, the
Republic of Korea, Malawi, Poland, Senegal, and Vietnam. These facts are organized by
cross-country, cross-firm, and within-firm dimensions. The technology facts high-
lighted in this chapter summarize some of the key messages across the volume. The
discussion starts by showing how far the average and the top 20 percent of firms are in
terms of technology sophistication from the technology frontier in manufacturing,
agriculture, and services. The top 20 percent of firms in Korea and Poland are used as a
benchmark and an aspirational frontier for developing countries. The results show that

Introduction 9
the technology index used in the analysis is strongly correlated with regional productivity
across countries. They suggest that comparing the technology sophistication of the
average formal firm is not enough to understand the aggregate technology gap, and
therefore the income gap, on a per capita basis. The density of firms with sophisticated
technology and the number of workers they employ also matter. The chapter also ana-
lyzes the variation of technology sophistication across business functions within firms,
the trends of technology adoption across firm size, and the potential behavioral bias
from firms misjudging their low levels of technology.
Chapter 3 provides a deep dive into differences in production technologies
adopted by firms in different sectors. It starts with a detailed description of the
technology sophistication used in agriculture, food processing (manufacturing),
wearing apparel (manufacturing), and retail (services). For agriculture, it shows
how the technology index captures variations in technology sophistication, using
practical examples from Senegal comparing irrigation and storage practices. This
chapter also provides a discussion about variations in technology intensity across
sectors from the perspective of advanced Industry 4.0 technologies. In particular, it
uses one business function that is common across all manufacturing firms and
shows that some of these advanced technologies (such as robots and 3D printers)
are much more prevalent among firms in the motor vehicles sector than in other
manufacturing sectors. This focus on sectors also highlights that the technology
frontier in some sectors might be more sophisticated and capital intensive. Yet,
robots and 3D printers may not capture the level of sophistication of the average
firm in another sector, such as pharmaceuticals, that is also knowledge and capital
intensive. The chapter also challenges the popular perception that firms can jump
across levels of technology, and finds that such leapfrogging is rare in sector- specific
technologies. The chapter ends with an analysis of the relationship between
technology sophistication and the decision to outsource SBFs. As an example, it
shows that, on average, firms that outsource the SBF of design in the wearing
apparel sector tend to have lower levels of sophistication.
Part 2. The Implications of the Technological Divide for Long-Term Economic Growth (Chapters 4 and 5)
The second part of the volume analyzes the relationship between technology adoption
and productivity, jobs, and economic resilience.
Chapter 4 traces the links between technology adoption and firm performance,
with a focus on productivity and jobs. To start, it shows a positive and significant
association between technology sophistication as measured by the FAT technology
index and productivity at the firm level. It then discusses how this relationship
between technology and productivity is also associated with structural change,

10 Bridging the Technological Divide
emphasizing the larger technology gap between Korea and Senegal in agriculture
than in manufacturing and services. This gap is mostly driven by informal firms. The
discussion highlights the importance of facilitating technology adoption in agricul-
ture as a driver of structural change. The second part of the chapter focuses on the
relationship between technology adoption and jobs. First, it shows that most firms
report that they do not change the number of workers when adopting more sophis-
ticated technologies. Indeed, contrary to popular belief, the results from the FAT data
comparing firms across countries suggest that firms that have adopted more sophis-
ticated technologies have generated more jobs, on average. Moreover, these addi-
tional jobs do not necessarily reduce the share of unskilled workers on their payrolls.
If anything, the negative significant correlation with SBFs suggests that for some
technologies the share of unskilled workers increases. The chapter also combines the
FAT data with administrative matched employer-employee data from Brazil and
shows that there is a positive and significant wage premium associated with more
sophisticated technologies, as well as higher wage inequality within firms.
Chapter 5 analyzes how the COVID-19 shock has increased firms’ investments in
digitalization, and how firms that were more “digital ready” before the pandemic
have been more resilient. This finding has relevance for the slower-moving crisis of
climate change shocks. This chapter starts with a discussion of patterns of digitaliza-
tion, emphasizing the heterogeneity of digital technologies across general and sector-
specific business functions. It examines how the market structure related to the
supply of digital solutions is important for the diffusion of digital technologies.
Then, the chapter assesses how the COVID-19 pandemic led to an unprecedented
shock that propelled firms to adopt digital technologies. To do so, the chapter intro-
duces data from the World Bank Business Pulse Survey (BPS), which included a few
questions on digital adoption. The results, based on data for more than 60 countries,
show that around 45 percent of firms started to use or increased their use of digital
platforms in response to the pandemic and 28 percent invested in digital solutions.
The chapter then presents the results of an analysis that combined data from the FAT
survey and the BPS to tease out the direct and indirect effects of technology readiness
on firm performance during the COVID-19 pandemic. The indirect effect stems
from the fact that technology readiness before the COVID-19 pandemic has also
helped firms adopt and increase their use of digital technology in response to the
shock. The results suggest that technology readiness significantly contributed to firm
performance, and the direct effect was about five times larger than the indirect effect.
The chapter ends with preliminary results for the FAT survey in Georgia, which
incorporates questions on green technology. It shows a positive association between
technology sophistication and the adoption of green technologies, which suggests
the existence of complementarities between “green” and “nongreen” technologies, as
well as the possibility of common drivers of and barriers to their adoption.

Introduction 11
Part 3. What Countries Can Do to Bridge the Technological Divide (Chapters 6 and 7)
The third part of the volume discusses the key factors that impede technology upgrad-
ing by firms and the policy instruments available to promote technological catch-up.
Chapter 6 focuses on the drivers of and barriers to technology adoption and use. This chapter starts by providing a conceptual framework, informed by a wide review of
the literature emphasizing the factors that drive adoption, including those that are
external to the firm (such as infrastructure, competition, demand, regulations, access to
finance, and supply of knowledge and human capital) and those that are internal to the
firm (such as information and behavioral biases, management quality and organization,
and know-how and skills capabilities). It then follows the structure provided by this
framework to analyze the association between technology sophistication and these fac-
tors, based on the FAT data. First, it focuses on firms’ perceptions, and presents results
based on what firms report as the most relevant drivers (competition) and obstacles for
adoption (lack of demand, lack of capabilities, and lack of finance). It then uses factual
data from the FAT survey to check the association between these variables and technol-
ogy sophistication, for both the extensive margin (whether the firm uses a technology or
not) and the intensive margin (the technology most frequently used by the firm). The
discussion highlights the various factors that drive adoption, and emphasizes that the
context and type of technology are important in understanding adoption.
Chapter 7 reviews the main policies and programs that can be most effective to
reduce the technological divide. It starts by providing some general guidelines to
design technology upgrading programs and emphasizes that public agencies have an
important role to play to address coordination and information failures. The starting
point should be to ensure that the enabling conditions to adopt technologies are in
place in terms of access to infrastructure, information, and external knowledge, and
the removal of regulatory bottlenecks. The chapter provides a checklist of actions for
policy makers to minimize the risk of government failure, and highlights the impor-
tance of implementing good diagnostics to identify key technology gaps and better
target firms. It provides some examples of how the FAT data can be used in this pro-
cess to help policy makers and practitioners identify key bottlenecks and prioritize
policy interventions. It also shows how the FAT survey can be used as a firm-level
diagnostic to support business advisory interventions. Finally, the chapter describes
a variety of policy instruments to support technology upgrading, and discusses some
of the most important features for design and implementation. These instruments
can play an important role in addressing some of the barriers highlighted in the pre-
vious chapter to promote technology diffusion and the digital transformation of
businesses.

12 Bridging the Technological Divide
Contributions to the Literature
This seventh volume in the World Bank Productivity Project series contributes to the
literature on technology adoption in several ways:
■■ It describes a new methodology for measuring technology adoption at the firm
level.
■■ It presents new evidence of the firm-level technological divide across different
dimensions, such as countries, regions, sectors, firms, and business functions,
using a novel data set covering firms in agriculture, manufacturing, and services
from 11 countries.
■■ It uncovers the richness of the variation for technology sophistication across
sectors and the association with outsourcing some tasks.
■■ It provides new evidence on the effects of technology readiness on resilience.
■■ It offers novel findings regarding the limitations of improving access to digital
infrastructure on technology adoption.
■■ It summarizes the tools available to policy makers aiming to promote technology
upgrading.
The FAT data can serve as a benchmark for firms, regions, and countries to understand
their distance from the technology frontier. The survey can also be used as a firm-level
diagnostic, helping policy makers and practitioners set areas to be prioritized when
designing and implementing measures to support technology adoption.
Main Messages from the Volume
The volume’s findings and analytical insights draw on a set of background papers
supported by the World Bank through this project. Cirera et al. (2020) provide key
concepts on technology measures and findings that are used throughout this volume.
These findings can be summarized in the nine main messages that follow.
There Is a Large Technological Divide across Firms
Message 1. Most firms in developing countries are quite far from the technology frontier, and they may not be aware of the extent to which they lag. Evidence from the FAT data shows that most firms are far from the technology frontier,
particularly in developing countries. This gap is present even for top firms with respect to
technology sophistication across countries and is wider in developing countries, where
few firms are relatively close to the technology frontier. Importantly, when firms are asked
to assess themselves in terms of technology sophistication with respect to other similar
firms in the country or globally, firms in the lower levels (quintiles) of technology sophis-
tication tend to demonstrate overconfidence, reporting a ranking that is well above their
actual level of sophistication. This behavioral bias may lead to an important market fail-
ure by reducing firms’ willingness to pay for technology upgrading.

Introduction 13
Message 2. Firms’ levels of technology sophistication span multiple dimensions. The more disaggregated the unit of analysis—from country to region, to sector, to firm, to business functions within the firm—the larger the variation.Firms use different technologies to perform a variety of tasks needed for different
business functions. Some of these functions are common across firms (such as
business administration, sales, and payment methods), while others are sector
specific. A firm’s level of technology sophistication, measured by their proximity
to the technology frontier to perform a task, is not uniform across the business
functions of the same establishment. Indeed, the more technologically advanced
firms are, on average, the more variation there is in the level of sophistication
across functions. From this perspective, significant improvements in digital infra-
structure and access to general- purpose technologies are important enablers, but
they have limited power to explain the large variation of adoption between and
within firms.
Message 3. The transition from industrial revolutions is incomplete in developing countries. The simultaneous rapid spread of information and communication technology
(ICT) alongside the persistence of a large share of firms still struggling to access reli-
able electricity is one of the many paradoxes of technology in developing countries.
First, it shows the power and the limits of technology disruptions associated with the
digital revolution. Second, there is large variation in terms of the quality of supply
and potential for network effects through the diffusion of knowledge and technology
across firms and through different uses of digital technologies.3 Thus, while the focus
of the media and policy makers is on the latest technological transition (or industrial
revolution), many firms in developing countries have yet to complete previous
transitions.
Message 4. Leapfrogging is rare. Technology upgrading by firms is mostly a continuous process of learning.Despite some perceived opportunities for leapfrogging, technological progress is,
and should be seen as, a continuous and accumulative process: a process that
requires firms to acquire the capabilities needed to increasingly adopt more
sophisticated technologies. It takes a significant amount of knowledge to learn
about frontier technologies in a given field, to identify which ones are the most
relevant for production processes, and to learn how to integrate them in the busi-
ness under different market conditions. Knowledge is also required to think about
the types of products, services, and processes that can be produced with each new
technology, and once a plan to upgrade technology has been made, to implement
it and train the workforce to execute it. As a result, a key objective of innovation
policies in developing countries must be to build these managerial, production,
and technological capabilities.
14 Bridging the Technological Divide
Message 5. Technology adoption is important for productivity, jobs, and economic resilience. The FAT data show that there is a significant and robust association between the level
of sophistication of technologies adopted and used by firms and labor productivity.
This association is also present when comparing the average technology sophistica-
tion and productivity across regions and countries. These findings are consistent with
both the macroeconomic and microeconomic literature emphasizing the contribu-
tion of technology for productivity and long-term economic growth. Moreover, firms
with higher levels of technology sophistication grow more and generate more and
better jobs. While there is a positive wage premium for technology, evidence across
countries for which FAT data are available suggests there is not a significant associa-
tion between technology sophistication and changes in firms’ skills composition over
the same period that these firms grew faster. If anything, for sector-specific technolo-
gies, the results suggest that firms that have adopted better technology have increased
employment, including for low-skilled jobs. Technology adoption also leads to more
resilience. Previous research shows that firms with more diverse technologies were
more resilient following natural disasters. The same may be true for the COVID-19
pandemic. The FAT survey provides evidence suggesting that those firms with higher
levels of technology sophistication have been more likely to adjust and performed bet-
ter in terms of sales.
Bridging the Technological Divide Is an Imperative for Development Policies
Message 6. Access to reliable and high-quality internet service and other infrastructure is a necessary condition for technology upgrading, but not a sufficient one.For a given quality of infrastructure access, there is large variation in the use of tech-
nologies for particular business functions at the firm level. This message has important
implications for investments supported by development agencies, including the World
Bank Group, by emphasizing the complementarities between investment in infrastruc-
ture and the necessary firm capabilities to benefit from it.
Message 7. Market competition is an important driver of adoption.When looking at adoption decisions, it is important to understand not only barriers
but also drivers. One of the most important drivers is competition, which more than
40 percent of firms report is a main incentive to upgrade their technologies. Given
the barriers and drivers identified by this volume and the literature, the first and
most important role for the government is to create the enabling conditions for
technology adoption by: (1) investing in infrastructure; (2) eliminating regulatory
bottlenecks; and (3) solving coordination failures around the provision of technol-
ogy and advisory services and information infrastructure jointly with the private
sector.

Introduction 15
Message 8. Technology upgrading policies should shift the focus from access to technology to use of technology. Many firms, particularly in developing countries, do not intensively use technologies
for which they already have access to perform relevant business functions. While in
some cases this might be explained by network effects, such as the use of digital pay-
ments that depends on other actors, in others cases the constraint seems to be more
related to lack of complementary capabilities of the firm, such as the intensive use of
handwritten processes for business administration and planning, when the firm
already has access to computers and the internet. This is also related to other comple-
mentary factors that the firm may need to make the best productive use of available
technologies. In terms of direct support, for example, significant imperfections in
financial markets in developing countries limit firms’ access to finance for technology
upgrading, especially for intangible assets. Working with the financial sector to address
information asymmetries between lenders and potential borrowers is critical.
Instruments such as grants and vouchers need to be linked to some measurable posi-
tive spillovers and externalities, accompanied by technical assistance, and monitored
for their effects on the adoption and use of technologies, to avoid the risks of govern-
ment failure.
Message 9. The COVID-19 shock has provided an opportunity for technology upgrading.The COVID-19 pandemic has led to an unprecedented demand for the use of digital
technologies by businesses. Building on this renewed interest in technology upgrading,
governments and business-support organizations are intensifying the use of policy
instruments to assist digital adoption and upgrading. While the surge in demand for
solutions opens several opportunities for technology upgrading for firms in developing
countries, there are also signs that the technology gap is increasing across firms, such as
a larger concentration of online sales by digitally connected companies at the expense
of brick-and-mortar retail businesses. New evidence presented in this volume shows
that firms that had a higher level of technologies before the pandemic, particularly
digital technologies, were significantly more likely to accelerate adoption after the
COVID-19 crisis struck. These results reinforce the finding that existing barriers may
be persistent. Mitigating the risks of this growing technology gap requires removing
existing barriers to adoption, especially in laggard firms.
Notes
1. There is a long tradition in management and economics documenting and measuring specific management practices. Pathbreaking studies by Bloom and Van Reenen (2007) and Bloom et al. (2019) have extended the scope of this literature by conducting firm-level surveys in a large number of firms across countries to measure the quality of management practices along several dimensions connected to operations, planning, monitoring, and human resources. These sur-veys include the World Management Survey (WMS) and the Management and Organizational Practices Survey (MOPS). While the WMS is a telephone-based survey using double-blind meth-odologies, MOPS is an online and paper-based survey.
16 Bridging the Technological Divide
2. This challenge goes beyond having more big firms (Ciani et al. 2020), given that large firms in developing countries are also significantly behind the technology frontier.
3. Network effects occur when the value of a technology, such as computers or automated teller machines (ATMs), increases the more users it has. Network effects are often accompanied by a production scale effect that reduces the cost of the technology.
References
Aghion, P., and P. Howitt. 1992. “A Model of Growth through Creative Destruction.” Econometrica 60 (2): 323–51.
Akcigit, U., and S. T. Ates. 2019. “What Happened to U.S. Business Dynamism?” NBER Working Paper 25756, National Bureau of Economic Research, Cambridge, MA.
Andrews, D., C. Criscuolo, and P. N. Gal. 2016. “The Best versus the Rest: The Global Productivity Slowdown, Divergence across Firms and the Role of Public Policy.” OECD Productivity Working Paper 5, Organisation for Economic Co-operation and Development.
Bloom, N., E. Brynjolfsson, L. Foster, R. Jarmin, M. Patnaik, I. Saporta-Eksten, and J. Van Reenen. 2019. “What Drives Differences in Management Practices?” American Economic Review 109 (5): 1648–83.
Bloom, N., and J. Van Reenen. 2007. “Measuring and Explaining Management Practices across Firms and Countries.” Quarterly Journal of Economics 122 (4): 1351–1408.
Bresnahan, T. 2010. “General Purpose Technologies.” In Handbook of the Economics of Innovation, Vol. 2, 761–91. Amsterdam: Elsevier.
Bresnahan, T. F., and M. Trajtenberg. 1995. “General Purpose Technologies ‘Engines of Growth’?” Journal of Econometrics 65 (1): 83–108.
Ciani, A., M. C. Hyland, N. Karalashvili, J. L. Keller, A. Ragoussis, and T. T. Tran. 2020. Making It Big: Why Developing Countries Need More Large Firms. Washington, DC: World Bank.
Cirera, X., D. Comin, M. Cruz, and K. M. Lee. 2020. “Technology within and across Firms.” CEPR Discussion Paper 15427, Center for Economic and Policy Research, Washington, DC.
Comin, D. 2000. “An Uncertainty-Driven Theory of the Productivity Slowdown in Manufacturing.” PhD thesis, Harvard University, Cambridge, MA.
Comin, D., W. Easterly, and E. Gong. 2010. “Was the Wealth of Nations Determined in 1000 B.C.?” NBER Working Paper 12657, National Bureau of Economic Research, Cambridge, MA.
Comin, D., and B. Hobijn. 2004. “Cross-Country Technology Adoption: Making the Theories Face the Facts.” Journal of Monetary Economics 51 (1): 39–83.
Comin, D., and M. Mestieri. 2018. “If Technology Has Arrived Everywhere, Why Has Income Diverged?” American Economic Journal: Macroeconomics 10 (3):137–78.
Cusolito, A. P., and W. F. Maloney. 2018. Productivity Revisited: Shifting Paradigms in Analysis and Policy. World Bank Productivity Project series. Washington, DC: World Bank.
David, P. A. 1985. “Clio and the Economics of QWERTY.” American Economic Review 75 (2): 332–37.
Eurostat. 2000. “Glossary: Business Functions.”
Goldfarb, A., and C. Tucker. 2019. “Digital Economics.” Journal of Economic Literature 57 (1): 3–43.
Gordon, R. J. 2012. “Is U.S. Economic Growth Over? Faltering Innovation Confronts the Six Headwinds.” NBER Working Paper 18315, National Bureau of Economic Research, Cambridge, MA.
Katz, M. L., and C. Shapiro. 1986. “Technology Adoption in the Presence of Network Externalities.” Journal of Political Economy 94 (4): 822–41.
Landes, D. S. 2003. The Unbound Prometheus: Technological Change and Industrial Development in Western Europe from 1750 to the Present. 2nd ed. Cambridge, UK: Cambridge University Press.
Introduction 17
Romer, P. M. 1990. “Endogenous Technological Change.” Journal of Political Economy 98 (5, Part 2): S71–S102.
Rosenberg, N. 1983. Inside the Black Box: Technology and Economics. Cambridge, UK: Cambridge University Press.
Saloner, G., and A. Shepard. 1995. “Adoption of Technologies with Network Effects: An Empirical Examination of the Adoption of Automated Teller Machines.” RAND Journal of Economics 26 (3): 479–501.
Smith, A. 1776. An Inquiry into the Nature and Causes of the Wealth of Nations. London: W. Strahan and T. Cadell.
Solow, R. 1987. “We’d Better Watch Out.” New York Times Book Review (July 12): 36.
Stoneman, P., and G. Battisti. 2010. “The Diffusion of New Technology.” In Handbook of the Economics of Innovation, Vol. 2, 733–60. Amsterdam: Elsevier.


PART 1Measuring the Technological Divide

21
1. A New Approach to Measure Technology Adoption by Firms
Introduction
When firms adopt more sophisticated technology, it can boost productivity and
enhance opportunities for good-quality jobs. But technology is not a unique and
narrow set of equipment or processes. Firms use various technologies to perform a
variety of productive tasks, from administration to production, to delivery of their
products or services. The effects and limitations of different types of technologies
utilized by firms are still unknown. Thus, understanding firms’ process of deciding why
to apply a technology, what given technology they apply to perform specific tasks, and
how they apply it is fundamental to comprehending firms’ performance and improving
evidence-based policies that aim to boost technological progress.
Measuring “what” and “how” technologies are used by firms across a range of sectors
and levels of development is a challenge. Going back to the seminal works by Ryan and
Gross (1943) and Griliches (1957) on the diffusion of hybrid varieties of corn, the domi-
nant approach to measuring technology has focused on whether a potential adopter uses
an advanced technology. In addition to studying technology diffusion and the drivers of
adoption, this approach has facilitated the study of the effect of technology on productivity
or wages.1 Most of these studies, however, have looked at the impact of one specific tech-
nology, typically an advanced one. Although these measures have significantly contributed
to our understanding of “why” firms adopt a given technology, they do not provide a com-
prehensive perspective for understanding “what” different kinds of technologies firms are
using and “how” they are using them for different tasks that could complement one another.
This chapter reviews some of the existing approaches to measuring technology at
the firm level and proposes a new method to capture the multiple dimensions of the
use of technology from the perspective of the firm. The chapter addresses the following
questions:
■■ What are the main limitations of the current approaches measuring “what” and
“how” technologies are used by firms?
■■ What more granular measures can be devised to better ascertain “what” and
“how” technologies are being adopted and used by firms?
■■ How can more granular measures of the use of technology within the firm
help us understand the importance of complementary factors—beyond
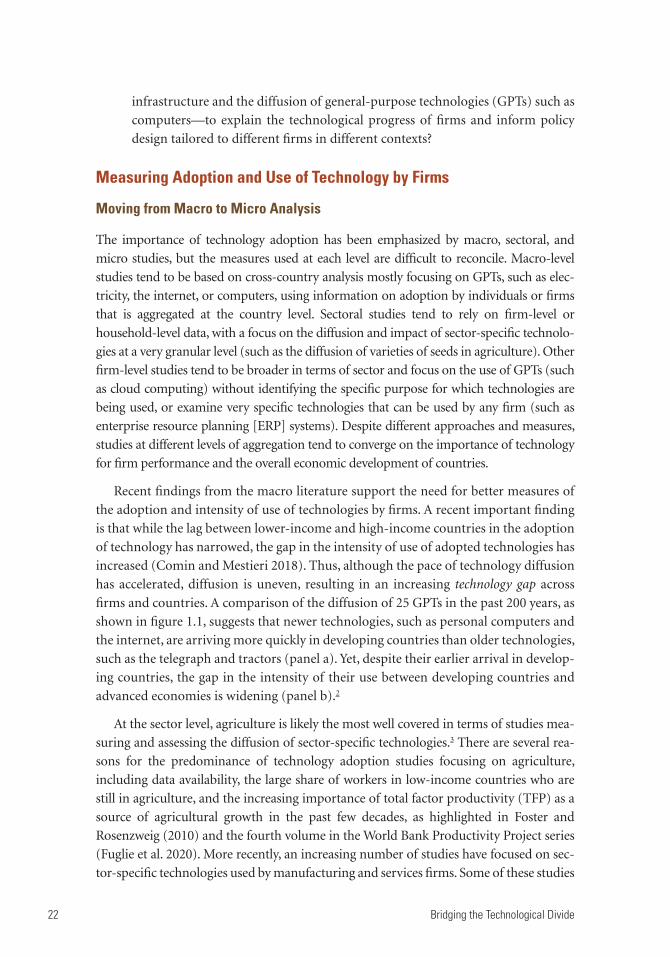
22 Bridging the Technological Divide
infrastructure and the diffusion of general-purpose technologies (GPTs) such as
computers—to explain the technological progress of firms and inform policy
design tailored to different firms in different contexts?
Measuring Adoption and Use of Technology by Firms
Moving from Macro to Micro Analysis
The importance of technology adoption has been emphasized by macro, sectoral, and
micro studies, but the measures used at each level are difficult to reconcile. Macro-level
studies tend to be based on cross-country analysis mostly focusing on GPTs, such as elec-
tricity, the internet, or computers, using information on adoption by individuals or firms
that is aggregated at the country level. Sectoral studies tend to rely on firm-level or
household-level data, with a focus on the diffusion and impact of sector-specific technolo-
gies at a very granular level (such as the diffusion of varieties of seeds in agriculture). Other
firm-level studies tend to be broader in terms of sector and focus on the use of GPTs (such
as cloud computing) without identifying the specific purpose for which technologies are
being used, or examine very specific technologies that can be used by any firm (such as
enterprise resource planning [ERP] systems). Despite different approaches and measures,
studies at different levels of aggregation tend to converge on the importance of technology
for firm performance and the overall economic development of countries.
Recent findings from the macro literature support the need for better measures of
the adoption and intensity of use of technologies by firms. A recent important finding
is that while the lag between lower-income and high-income countries in the adoption
of technology has narrowed, the gap in the intensity of use of adopted technologies has
increased (Comin and Mestieri 2018). Thus, although the pace of technology diffusion
has accelerated, diffusion is uneven, resulting in an increasing technology gap across
firms and countries. A comparison of the diffusion of 25 GPTs in the past 200 years, as
shown in figure 1.1, suggests that newer technologies, such as personal computers and
the internet, are arriving more quickly in developing countries than older technologies,
such as the telegraph and tractors (panel a). Yet, despite their earlier arrival in develop-
ing countries, the gap in the intensity of their use between developing countries and
advanced economies is widening (panel b).2
At the sector level, agriculture is likely the most well covered in terms of studies mea-
suring and assessing the diffusion of sector-specific technologies.3 There are several rea-
sons for the predominance of technology adoption studies focusing on agriculture,
including data availability, the large share of workers in low-income countries who are
still in agriculture, and the increasing importance of total factor productivity (TFP) as a
source of agricultural growth in the past few decades, as highlighted in Foster and
Rosenzweig (2010) and the fourth volume in the World Bank Productivity Project series
(Fuglie et al. 2020). More recently, an increasing number of studies have focused on sec-
tor-specific technologies used by manufacturing and services firms. Some of these studies
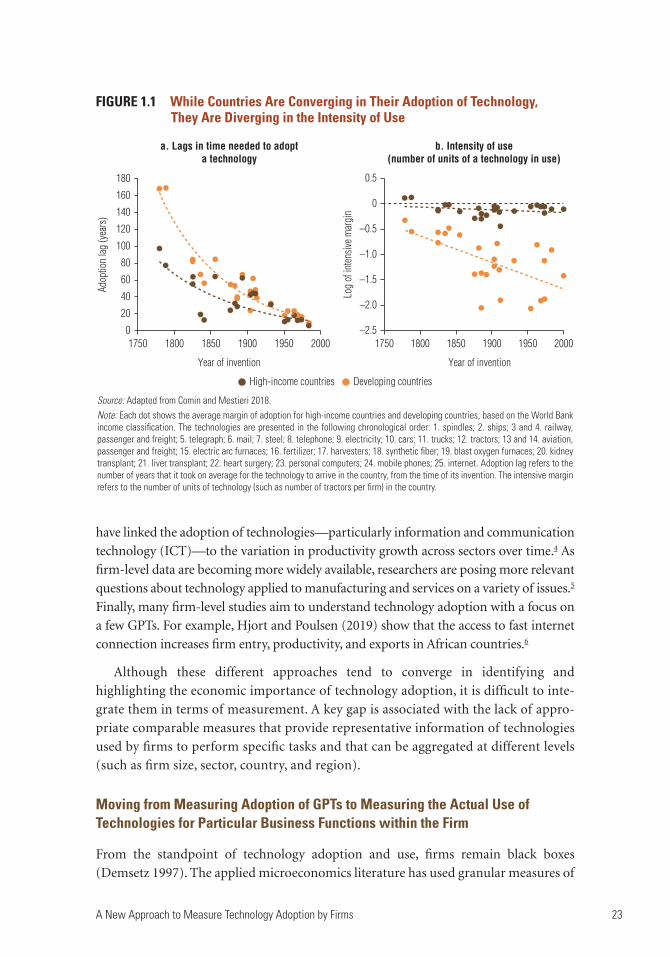
A New Approach to Measure Technology Adoption by Firms 23
have linked the adoption of technologies—particularly information and communication
technology (ICT)—to the variation in productivity growth across sectors over time.4 As
firm-level data are becoming more widely available, researchers are posing more relevant
questions about technology applied to manufacturing and services on a variety of issues.5
Finally, many firm-level studies aim to understand technology adoption with a focus on
a few GPTs. For example, Hjort and Poulsen (2019) show that the access to fast internet
connection increases firm entry, productivity, and exports in African countries.6
Although these different approaches tend to converge in identifying and
highlighting the economic importance of technology adoption, it is difficult to inte-
grate them in terms of measurement. A key gap is associated with the lack of appro-
priate comparable measures that provide representative information of technologies
used by firms to perform specific tasks and that can be aggregated at different levels
(such as firm size, sector, country, and region).
Moving from Measuring Adoption of GPTs to Measuring the Actual Use of Technologies for Particular Business Functions within the Firm
From the standpoint of technology adoption and use, firms remain black boxes
(Demsetz 1997). The applied microeconomics literature has used granular measures of
FIGURE 1.1 While Countries Are Converging in Their Adoption of Technology, They Are Diverging in the Intensity of Use
High-income countries Developing countries
0
20
40
60
80
100
120
140
160
180
a. Lags in time needed to adopta technology
b. Intensity of use(number of units of a technology in use)
Adop
tion
lag (y
ears
)
1750 1800 1850 1900 1950 2000
Year of invention
–0.5
–1.0
–1.5
–2.0
–2.5
0
0.5
Log
of in
tensiv
e mar
gin
1750 1800 1850 1900 1950 2000
Year of invention
Source: Adapted from Comin and Mestieri 2018.Note: Each dot shows the average margin of adoption for high-income countries and developing countries, based on the World Bank income classification. The technologies are presented in the following chronological order: 1. spindles; 2. ships; 3 and 4. railway, passenger and freight; 5. telegraph; 6. mail; 7. steel; 8. telephone; 9. electricity; 10. cars; 11. trucks; 12. tractors; 13 and 14. aviation, passenger and freight; 15. electric arc furnaces; 16. fertilizer; 17. harvesters; 18. synthetic fiber; 19. blast oxygen furnaces; 20. kidney transplant; 21. liver transplant; 22. heart surgery; 23. personal computers; 24. mobile phones; 25. internet. Adoption lag refers to the number of years that it took on average for the technology to arrive in the country, from the time of its invention. The intensive margin refers to the number of units of technology (such as number of tractors per firm) in the country.

24 Bridging the Technological Divide
technology adoption by firms, but most of these measures apply to very specific sectors,
and therefore face constraints for purposes of comparability. Many attempts have been
made to understand the dynamics of technology through innovation surveys and pat-
ent data, but they do not capture some essential features of technology adoption, par-
ticularly for developing countries.7
The relevance and emergence of digital technologies have motivated researchers to
measure the use of advanced technologies by firms in numerous sectors. As a result, sta-
tistical offices from advanced economies have developed ICT surveys for that purpose,
including the US Census Bureau (Information Communication Technology Survey
[ICTS] and Annual Business Survey [ABS]); the European Union’s Eurostat (Community
Survey of ICT Usage); and Statistics Canada (Survey of Advanced Technology [SAT]).
Recently, the Canadian SAT has extended the scope of these measurement efforts to mea-
sure whether firms use a significant number of advanced technologies (between 41 and
50, depending on the round), with a focus on manufacturing.
Despite significant progress, existing measures of technology still fall short of pro-
viding a comprehensive characterization of technologies used by firms. First, the num-
ber of technologies covered is rather limited when compared to how many technologies
are involved in production and management processes. Second, their focus on the pres-
ence of advanced technologies makes it impossible to understand how production
takes place in companies without such technologies. This concern is most relevant in
developing countries where advanced technologies have diffused more slowly. Third,
because their unit of analysis is the firm, existing surveys are not designed to examine
technology at the level of business functions undertaken by the firm, and cannot
measure which business functions benefit from each particular technology. This
drawback is particularly problematic for GPTs that can be relevant for multiple business
functions. Finally, existing surveys largely omit questions about how intensively a
technology is employed in the firm. Therefore, they do not reveal whether a technology
that is present is widely utilized or used only marginally.8
To overcome these limitations, this volume proposes a new approach to measure tech-
nology that shifts the unit of analysis from the firm to the business function level. This
approach, described by Cirera et al. (2020), led to the development of a new survey instru-
ment by the World Bank Group in collaboration with several sector and technology experts.
The survey, described in the next section, has been designed to collect detailed information
for a representative sample of firms about the technologies that each firm uses to perform
key business functions necessary to operate in its respective sector of economic activity.
Opening the Black Box: The Firm-level Adoption of Technology (FAT) Survey
The World Bank Group’s new approach to measuring technology at the firm level, the FAT
survey, has been piloted to a representative sample of firms in 11 countries. Much of the

A New Approach to Measure Technology Adoption by Firms 25
analysis in this volume draws on the survey results and comparisons with other surveys and
studies.
The 11 countries included are: Bangladesh; Brazil (only the state of Ceará); Burkina
Faso; Ghana; India (only the states of Tamil Nadu and Uttar Pradesh); Kenya; the Republic
of Korea; Malawi; Poland; Senegal; and Vietnam. For those countries, sub national data
were collected for 51 regions. Data collection is ongoing or planned for 2022 in Brazil
(the state of Paraná); Cambodia; Chile; Croatia; Ethiopia; Georgia; Indonesia; Mauritania;
and Peru. Preliminary results from Georgia are used in chapter 5 to discuss the relation-
ship between technology and resilience focusing on green technology.
The FAT survey has five modules. Module A collects information about general char-
acteristics of the firm.9 Module B covers technologies used to perform general business
functions that are common across all firms, while module C focuses on sector-specific
technologies. Module D focuses on barriers and drivers of technology adoption, while
module E gathers information about the firm’s balance sheet and employment. To attain
a wide coverage that allows a meaningful study of sector-specific technologies, sector-
specific modules were developed for 12 significant sectors in the economy: agriculture and
livestock; manufacturing (food processing, wearing apparel, leather and footwear, motor
vehicles, and pharmaceuticals); and services (wholesale and retail, financial services, land
transport services, accommodation, and health services). These sectors have been selected
to cover all three major types of industry (agriculture, manufacturing, and services) and
are based on their share in a country’s aggregate value added, employment, and number
of establishments. The discussion that follows describes in more detail the approach devel-
oped to measure technology as part of modules B and C of the survey.
Linking Technologies to Business Functions
The approach to measure technology at the firm level starts by differentiating firm-
level business functions in two groups: general business functions (GBFs) and sector-
specific business functions (SBFs). The unit of analysis of this approach is the business
function, rather than the firm. GBFs are tasks that all firms conduct regardless of the
sector in which they operate (such as businesses’ administration-related tasks, produc-
tion planning, sourcing and procurement, sales, and payment methods). SBFs are tasks
relevant only for companies in a given sector (such as harvesting in agriculture, cook-
ing in food processing, or sewing in apparel). Figure 1.2 summarizes the way technolo-
gies are measured through business functions.
A key step for this approach is to determine what business functions and technologies
associated with them best represent the overall technology level of the firm. To this end, the
methodology follows three steps. First, the team conducted desk research revisiting the spe-
cialized literature. Second, experts across the World Bank Group in each of the sectors cov-
ered provided inputs and feedback. Third, the team reached out to external consultants
with significant experience in the field (at least 15 years).10 This process allowed the team to

26 Bridging the Technological Divide
identify the main business functions, both general and specific to the sector, conducted in
firms and the technologies that can be used to perform the key tasks in each of the identified
functions (corresponding to “why” firms use a given technology).
The proposed approach normalizes the technology measures by the technology fron-
tier in each business function. Previous measures of technology sophistication focused on
sectors—such as Lall (2000), which is widely used in the area of international trade—do
not capture the fact that regardless of the sector they are in, some firms are closer to the
technology frontier for a particular business function than others. For example, a firm in
agriculture in a given country might be much closer to the technology frontier than
another firm in manufacturing when considering their respective relevant business func-
tions. By normalizing the technology measures based on the frontier of each business
function in each country, this approach allows for the possibility of comparing firms in
sectors with different levels of intensity of technology use (technology intensity).
Technology Use across General Business Functions
What are the key business functions and technologies used across GBFs? The exercise
conducted with the support of private sector experts has identified seven key general
business functions that are common across all firms: business administration (such as
accounting, finance, and human resources); production or service operations planning;
sourcing and procurement (supply chain management); marketing and product devel-
opment; sales; payment methods; and quality control. These GBFs have in common the
fact that all firms tend to perform them, irrespective of their sector or activity. Figure 1.3
presents the GBFs and the possible technologies that can be used to conduct each of
them, identified through the discussions with sector experts.
Evidence from the FAT data suggests that most of the sampled firms tend to rely on
manual processes or basic digital technologies to perform these GBFs. Figure 1.4 provides
some descriptive statistics from the FAT data to better illustrate the GBF measures.
FIGURE 1.2 Conceptual Framework for the Firm-level Adoption of Technology (FAT) Survey
Source: Original figure for this volume.
General business functions (GBFs)(applied to all firms)
Firm-level adoption of technology
GBF 1 GBF 2 GBF 3 SBF 1 SBF 2 SBF 3
TechnologiesB1
TechnologiesB2
TechnologiesB3
Sector-specific business functions (SBFs)(applied to firms in a specific sector)
TechnologiesC1
TechnologiesC2
TechnologiesC3

A New
Approach to Measure Technology Adoption by Firm
s 27
FIGURE 1.3 General Business Functions and Their Associated Technologies
Source: Original figure based on the Firm-level Adoption of Technology (FAT) survey.a. Business administration includes accounting, finance, and human resources.
1. Businessadministrationa
Handwrittenprocesses
Computers withstandard software
(e.g., Excel)
Mobile apps ordigital platforms
Computers with specialized
installed software
Enterprise resourceplanning (ERP)
Enterprise resourceplanning (ERP)
Handwrittenprocesses
Computers withstandard software
Mobile apps ordigital platforms
Specialized softwarefor demand planning,and demand forecast
Manual search ofsuppliers, without
centralized database
Computers withstandard software
Online social media,specialized apps, or
digital platforms
Supplierrelationship
management (SRM)
SRMintegrated with
production planning
Informal chat(face-to-face)
Online chat(e.g., WhatsApp or
internet)
Structuredcustomer surveys
Customerrelationshipmanagement
(CRM)
Big dataanalytics and
artificialintelligence
Direct sales at theestablishment
Direct sales byphone or email
Sales throughsocial media
platforms or apps
Cash
Exchange ofgoods or services
Check, voucher,or bank wire
Prepaid, creditor debit card
Manual, visual, orwritten processes
without thesupport of digital
technologies
Manual, visual, orwritten processeswith the support ofdigital technologies
Statistical processcontrol
Automated systemsfor inspection
Online orelectronic payment
by bank wire
Online throughplatform
Virtual orcryptocurrency
Online sales usingexternal digital
platforms(e.g., Amazon, eBay,
Alibaba)
Online sales(e-commerce) using
own website
Electronic ordersintegrated intosupply chain
2. Production or serviceoperations planning
3. Sourcing andprocurement
4. Marketing andproduct development 5. Sales 6. Payment methods 7. Quality control
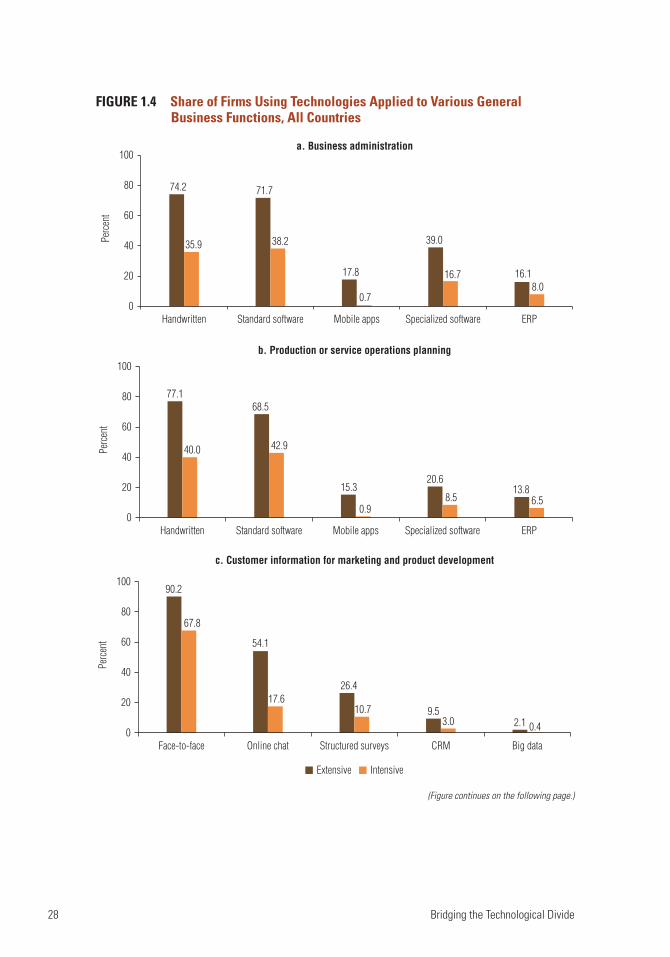
28 Bridging the Technological Divide
FIGURE 1.4 Share of Firms Using Technologies Applied to Various General Business Functions, All Countries
77.1
40.0
Handwritten
68.5
42.9
Standard software
15.3
0.9
Mobile apps
20.6
8.5
Specialized software
13.86.5
ERP
Perc
ent
0
20
40
60
80
100
74.2
35.9
Handwritten
71.7
38.2
Standard software
17.8
0.7
Mobile apps
39.0
16.7
Specialized software
16.18.0
ERP0
20
40
60
80
100
Perc
ent
90.2
67.8
Face-to-face
54.1
17.6
Online chat
26.4
10.7
Structured surveys
c. Customer information for marketing and product development
b. Production or service operations planning
a. Business administration
9.53.0
CRM
2.1 0.4
Big data
Perc
ent
0
20
40
60
80
100
Extensive Intensive
(Figure continues on the following page.)

A New Approach to Measure Technology Adoption by Firms 29
FIGURE 1.4 Share of Firms Using Technologies Applied to Various General Business Functions, All Countries (continued)
79.9
60.070.6
34.3
Phone, emailAt the establishment
23.6
0.9
Social media
6.30.6
Digital platform
d. Sales methods
e. Payment methods
f. Quality control inspection
11.7
1.2
Own website
5.91.3
Electronic orders0
20
40
60
80
100
Perc
ent
Extensive Intensive
93.8
73.7
Manual/visual
42.9
21.1
Suppliers/computers
15.5
2.7
Software monitoring
4.4 1.2
Automated systems0
20
40
60
80
100
Perc
ent
7.21.4
Exchange of goods or services
89.0
50.5
Cash
70.3
24.9
Check/bank wire
31.9
6.0
Debit/credit
50.7
15.6
Online bank
35.8
1.5
Online platform0
20
40
60
80
100
Perc
ent
Source: Original figure based on Firm-level Adoption of Technology (FAT) survey data.Note: Estimates based on cross-country average weighted by sampling weights. The 11 countries covered are Bangladesh; Brazil (only the state of Ceará); Burkina Faso; Ghana; India (only the states of Tamil Nadu and Uttar Pradesh); Kenya; Korea, Rep.; Malawi; Poland; Senegal; and Vietnam. The extensive measure captures the array of technologies used by the firm. The intensive measure captures the nature of the most used technology in the business function. Business administration includes accounting, finance, and human resources. CRM = customer relationship management; ERP = enterprise resource planning.

30 Bridging the Technological Divide
These are tasks for which digital technologies are prevalent, including the frontier
technology. Therefore, firms from any sector could potentially benefit from a digital
upgrade in these functions. Starting with business administration and production or
service operations planning, about 70 percent of firms use standard software, such as
Excel, but more than one-third of firms still rely mostly on handwritten methods. Panels
a and b of figure 1.4 present the average share of firms across countries using different
methods to perform tasks related to business administration processes and production
or service operations planning, at both the extensive margin (whether they use the tech-
nology at all) and intensive margin (whether the technology is the most frequently used
one to perform that particular task/business function). The results also show that less
than 1 percent of businesses rely mostly on mobile apps to perform these tasks, and less
than 9 percent rely mostly on ERP.
In the areas of marketing, sales, and payment, the adoption of more sophisticated
technologies is more prevalent for payment, but with a large gap between the exten-
sive and the intensive margins. These three business functions have in common the
fact that they involve interactions with actors (customers or suppliers) outside the
firm, with high potential for network economies in which products and services are
created and value is added through social networks operating on large or global
scales. Figure 1.4 shows that digital payments (e.g., online bank, online platform) are
widely diffused technologies among firms, but half of firms still rely mostly on cash
and 25 percent rely mostly on checks. For marketing, big data and artificial intelli-
gence (AI) are still very rare among firms. Only 2 percent use these technologies and
1 percent use them intensively. For quality control tasks, most firms still rely on man-
ual procedures as the most frequently used method.
Technology Use across Sector-Specific Business Functions
For the sector-specific technologies, a similar approach was used to identify key
business functions and associated technologies in 12 sectors of activity across agri-
culture, manufacturing, and services (agriculture, livestock, food processing, wear-
ing apparel, leather and footwear, motor vehicles, pharmaceuticals, wholesale and
retail, financial services, land transport services, accommodation, and health
services). An additional business function, fabrication, was also included for all
manufacturing sectors. The identification of key business functions and the fron-
tier in each sector required a significant interaction with several sector specialists.
These functions tend to be associated with sector-specific production processes.
Figure 1.5 exemplifies for agriculture, food-processing (manufacturing), and retail
(services) how the FAT survey unpacks sector-specific production or service provi-
sion activities into the main business functions and the technologies that can be
used to accomplish them.11 For more information on the business functions and
associated technologies for other sectors, see appendix A.
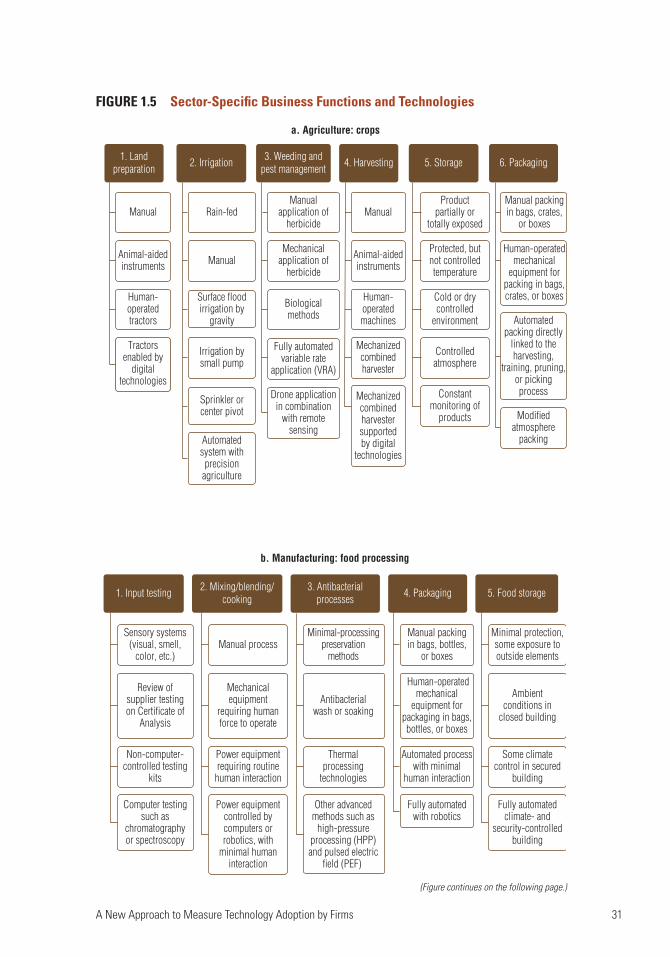
A New Approach to Measure Technology Adoption by Firms 31
FIGURE 1.5 Sector-Specific Business Functions and Technologies
a. Agriculture: crops
b. Manufacturing: food processing
1. Input testing 2. Mixing/blending/cooking
3. Antibacterialprocesses
Manual packingin bags, bottles,
or boxes
Human-operatedmechanical
equipment forpackaging in bags,bottles, or boxes
Ambientconditions in
closed building
Minimal protection,some exposure tooutside elements
Some climatecontrol in secured
building
Automated processwith minimal
human interaction
Fully automatedwith robotics
Fully automatedclimate- and
security-controlledbuilding
5. Food storage4. Packaging
Sensory systems(visual, smell,
color, etc.)
Review ofsupplier testingon Certificate of
Analysis
Non-computer-controlled testing
kits
Computer testingsuch as
chromatographyor spectroscopy
Minimal-processingpreservation
methods
Antibacterialwash or soaking
Thermalprocessing
technologies
Other advancedmethods such as
high-pressureprocessing (HPP)and pulsed electric
field (PEF)
Manual process
Mechanicalequipment
requiring humanforce to operate
Power equipmentrequiring routine
human interaction
Power equipmentcontrolled bycomputers orrobotics, with
minimal humaninteraction
1. Landpreparation 2. Irrigation 3. Weeding and
pest management 4. Harvesting
Manual
5. Storage 6. Packaging
Manual packingin bags, crates,
or boxes
Human-operatedmechanical
equipment forpacking in bags,crates, or boxes
Automatedpacking directly
linked to theharvesting,
training, pruning,or pickingprocess
Modifiedatmosphere
packing
Productpartially or
totally exposed
Protected, butnot controlledtemperature
Cold or drycontrolled
environment
Controlledatmosphere
Constantmonitoring of
products
Animal-aidedinstruments
Human-operatedmachines
Mechanizedcombinedharvester
Manualapplication of
herbicide
Mechanicalapplication of
herbicide
Biologicalmethods
Fully automatedvariable rate
application (VRA)
Drone applicationin combination
with remotesensing
Mechanizedcombinedharvestersupportedby digital
technologies
Rain-fed
Manual
Surface floodirrigation by
gravity
Irrigation bysmall pump
Sprinkler orcenter pivot
Automatedsystem with
precisionagriculture
Manual
Animal-aidedinstruments
Human-operatedtractors
Tractorsenabled by
digitaltechnologies
(Figure continues on the following page.)

32 Bridging the Technological Divide
FIGURE 1.5 Sector-Specific Business Functions and Technologies (continued)
c. Services: wholesale and retail
1. Customer service
At the store Manual cost
2. Pricing 3. Merchandising 4. Inventory
Handwrittenrecord keeping
5. Advertisement
Paper-basedcommunication
Radio, billboards,TV
Email ormobile phone
Social media(YouTube,
Facebook, Twitter,Instagram)
Search enginemarketing
Big data analyticsor artificialintelligence
Computerdatabases with
manual updates
Warehousemanagementsystem andbarcodes
Automatedinventory
control (CAO)or vendor-managed
inventory orradio-frequency
identification
Automatedstorage and
retrieval systems
Manuallyselecting products
Categorymanagement tools
Retailmerchandising
systems or digitalmerchandising
Producttrend analytics
with big data andmachine learning
Automatedmarkup
Automatedpromotional
Dynamic pricingsystems
Personalizedpricing drivenby predictive
analytics
Call help desk
Social media(e.g., Facebook,WhatsApp, or
similar)
Online requests
Chatbots
Source: Original figure based on the Firm-level Adoption of Technology (FAT) survey.
For sector-specific business functions, digital technologies tend to be embedded
in other technologies that are usually at the frontier. This is a common feature, par-
ticularly in agriculture and manufacturing, and has important implications in terms
of the costs of adoption and the importance of network effects. For example, among
methods commonly used by agricultural firms to perform harvesting (figure 1.5,
panel a), the most basic option is to harvest manually, followed by animal-aided
instruments; human-operated machines or a single tractor with one specific func-
tion (such as a single-axle tractor); a combined harvester (machines or tractors that
combine multiple functions fully operated by the worker); and a combined harvester
supported by digital technologies (such as a global positioning system [GPS] or com-
puting systems integrated with the tractor). Unlike for GBFs, the application of digi-
tal technologies for the sector-specific business function of harvesting requires other
sophisticated equipment or machines.
The different measures of technology used by firms are converted into indexes
of technology sophistication for comparability and analytical purposes. One

A New Approach to Measure Technology Adoption by Firms 33
important element of the data is the fact that most firms use more than one tech-
nology to perform similar tasks (such as handwritten processes, Excel, and special-
ized software for business administration) with different levels of intensity. The
next section describes how this information is converted into an index that is infor-
mative about the firm’s level of technology sophistication to perform each business
function. The sections that follow provide a short summary of the technology
indexes widely used in this volume.
The Technology Index
The FAT survey asks two types of questions about the technologies used to perform a
business function. The first type inquires about the use of each of the technologies listed
by the experts as relevant in a given business function (corresponding to whether or not
firms adopt technology). The answer to these questions characterizes the full array of
technologies that the firm uses. The second type of question gathers information about
which of the technologies used is employed more intensively (corresponding to “what”
and “how” firms use technology).12 The answer to this question is used to construct tech-
nology measures that reflect the nature of the main technology used in the business
function (the intensive measure) as opposed to the most sophisticated technology from
the array of technologies used in the business function (extensive measure).13 This
distinction is relevant because firms do not use all the technologies available to perform
a business function with the same intensity, and the impact of a technology on the firm’s
productivity may depend on the importance of the technology used most intensively.
To measure the technology gap of the most intensively used technology, the tech-
nologies are combined into an index capturing the technology sophistication for each
business function. The index varies between 1 and 5, where 1 stands for the most basic
level of technology and 5 reflects the most sophisticated.14 With the help of experts for
each industry, a rank was assigned to the technologies in each business function accord-
ing to their sophistication. The sophistication of a technology measures its complexity,
which corresponds to its capacity to conduct more tasks and/or tasks of greater diffi-
culty, or to perform them with greater accuracy or precision. Naturally, technology
sophistication tends to be correlated with the novelty of the technology.15 Figure 1.6
provides a simple example of the technology index for two functions: business admin-
istration (GBF); and storage for agriculture (SBF).16 Box 1.1 presents an example of
applying the technology index to different sizes of firms (small and large) in a particu-
lar sector (food processing) in a particular country (Senegal).
These measures of technology provide a very rich description of the overall level
of sophistication of a firm, as well as the variation of technology sophistication
across functions. They can be aggregated at different levels for which the FAT data
are representative, such as country, subnational regions, sector of activity, firm size,
and firm formality status.17

34 Bridging the Technological Divide
BOX 1.1
The Technology Index at the Firm Level: An Example from the Food-Processing Sector in Senegal
The measure of technology sophistication developed for this volume can characterize the technology landscape of firms with a high level of granularity. Figure B1.1.1 presents two spider charts that dis-play the measures for each of the general business functions (GBFs) (panel a) and sector-specific business functions (SBFs) (panel b) for the two firms in the food-processing sector in Senegal: a small firm (Firm A), shown with the solid brown line; and a large firm (Firm B), shown with the dashed orange line. In general, the large firm uses more sophisticated technologies than the small one, but there is significant variation in the gap across different functions (Cirera et al. 2020). However, the gap between the sophistication of technologies used in both companies varies considerably depend-ing on the technology measure, the type of business function, and the specific business function considered.
With the exception of cooking, for all other business functions Firm B has a level of technology sophistication greater than or equal to Firm A. The average sophistication for Firm B across busi-ness functions is 2.3 versus 1.4 for Firm A. Firm B has greater sophistication in both GBFs and SBFs, though the gap in sophistication is slightly larger in SBFs (2.6 minus 1.7 = 0.9) than in GBFs (2.0 minus 1.2 = 0.8). Beyond differences in average sophistication, there is significant variation in sophistication across business functions within a firm. For example, the sophistication for both firms is the same in business administration, planning, sourcing, and marketing, but Firm B has greater sophistication in sales, payment, and quality control. For SBFs, the two firms have the
FIGURE 1.6 An Example of the Technology Index
Source: Original figure based on the Firm-level Adoption of Technology (FAT) survey.Note: Business administration includes accounting, finance, and human resources.
Extensive Extensive
Use? Yes/No Use? Yes/No
5. Storage
Yes Handwrittenprocesses
a. General business functions b. Sector-specific business functions—agriculture
1. Businessadministration
Computers with standardsoftware (e.g., Excel)
Mobile apps or digitalplatforms
Computers with specializedinstalled software
Enterprise resourceplanning (ERP)
Yes
No
No
No
No
Product partiallyor totally exposed
Protected, but notcontrolled temperature
Cold or dry controlledenvironment
High-end centralstorage, with controlled
atmosphere andtemperature
Continuous temperaturemonitoring device ordigital data loggers
No
No
No
2
Yes1 Yes 1Yes 1
Most used? Most used?
Intensive Intensive
(Box continues on the following page.)

A New Approach to Measure Technology Adoption by Firms 35
same sophistication in only one function: packaging. Firm B has greater sophistication in three of the remaining functions and Firm A has greater sophistication in cooking. This suggests that there is greater variation in sophistication within firms across SBFs than across GBFs. Similarly, figure B1.1.1 also suggests that there is more variation within Firm B than within Firm A (1.8 versus 0.36).
BOX 1.1
The Technology Index at the Firm Level: An Example from the Food-Processing Sector in Senegal (continued)
FIGURE B1.1.1 Comparing Technology Sophistication of a Large and a Small Firm in the Food-Processing Sector
Source: Cirera et al. 2020.Note: Firm A (the small firm) has 16 workers. Firm B (the large firm) has 300 workers. INT = an index reflecting the sophistication of the most widely used technology in a business function. The higher the index, the greater the sophistication.
Business administration
Planning
Sourcing
MarketingSales
b.Sector-specific business function, INT
a. General business function, INT
5
4
3
21
Food storage
Packaging5
43
21
Antibacterialprocesses
Cooking
Input testing
Payment
Quality control
Firm A (small) Firm B (large)

36 Bridging the Technological Divide
The Data Used in This Volume
This volume relies mostly on primary firm-level data from representative samples from
11 countries. The data were collected from 2019, before the COVID-19 pandemic, to
2021, in the midst of the pandemic. Table 1.1 shows the number of establishments
interviewed, which totaled more than 13,000 and represent around 1.3 million estab-
lishments.18 The Bangladesh data only include manufacturing, and the India and
Malawi data exclude agriculture. The survey was stratified by firm size (small, medium,
and large), sectors, and regions within countries. Because of stratification, the shares of
firms in agriculture and manufacturing are proportionately large relative to services,
compared to the distribution in the universe of firms. Particularly in the case of manu-
facturing, this improves the statistical power of the analysis. In the case of Senegal,
informal firms are also included given that they are available in the sampling frame of
Senegal’s national statistical office. In this case, the survey was also stratified by formal
and informal firms, which allows the team to measure the technology gap between
formal and informal firms in the country. For the remaining countries, the data are
representative of the formal sector only. Thus, in the case of countries where the share
of informality is high among firms with 5 or more workers, especially in African coun-
tries, the analysis may overestimate the technology sophistication of the average firm,
by excluding informal ones.19
TABLE 1.1 Number of Establishments Surveyed, by Sector and Firm Size
Country Total
Sector Firm size
Agriculture Manufacturing Services Small Medium LargeBangladesh 903 — 903 — 361 232 310
Brazila 711 72 387 252 205 322 184
Burkina Faso 600 80 140 380 335 187 78
Ghana 1,262 85 275 902 774 382 106
Indiab 1,519 — 791 728 629 598 292
Kenya 1,305 155 335 815 499 421 385
Korea, Rep. 1,551 129 652 770 656 569 326
Malawi 482 — 137 345 284 122 76
Poland 1,500 90 607 803 779 394 327
Senegal 1,786 204 679 903 1,219 395 172
Vietnam 1,499 110 806 583 774 426 299
Total 13,118 925 5,712 6,481 6,515 4,048 2,555
Source: Original table based on Firm-level Adoption of Technology (FAT) survey data.Note: Firm size refers to the number of workers: small (5–19), medium (20–99), and large (100 or more). — = not available.a. The Brazil sample covers only the state of Ceará.b. The India sample covers only the states of Tamil Nadu and Uttar Pradesh.

A New Approach to Measure Technology Adoption by Firms 37
To ensure comparability, the team implemented a standardized data collection
protocol across all countries. Data collectors included national statistical agencies in
Malawi, Poland, and Vietnam; public-private institutions such as the State Industry
Association (FIEC) in Ceará, Brazil; and specialized data collection firms in the
remaining countries, with the sampling frame provided by national statistical offices.
The same protocols were followed, as specified in a standard terms of reference for
implementation. For each country, each survey item was professionally translated
from English to the local language and back again, with interactions and revisions
from World Bank team members who are fluent or native speakers in the local lan-
guage.20 The FAT data were collected through both face-to-face interviews and by
telephone. The analyses presented in this book are performed using sampling weights.
When computing cross-country analysis, the weights were rescaled so that all coun-
tries are equally weighted. See appendix A for more details about the FAT data and the
weights used.
The richness of these data sets, over the period of 2019–21, offers a unique perspec-
tive to explore new questions and provide new evidence on the adoption and use of
technology by firms. The next section uses the FAT data to illustrate the importance of
granular measures of technologies used by firms to explain why some of the standard
measures of technology provide a limited perspective.
Using the FAT Data to Understand Some of the Limitations of Standard Measures of Technology
In addition to measuring technologies at the business function level, the FAT survey
also provides standard measures of GPTs. These measures include access to and qual-
ity of electricity, and use of ICT (such as mobile phones, computers, and the inter-
net), as well as advanced digital technologies (such as cloud computing, robots, big
data, and AI). These measures also provide an overall perspective on access to infra-
structure and the conditions that enable technology use. Thus, before going into the
specifics of technologies linked with business functions, the next section provides a
general perspective on where firms in developing countries stand with respect to the
adoption of technologies that are usually associated with different stages of indus-
trial revolution. The section also explains the reason why these measures provide a
limited perspective of the level of technology sophistication of firms, and the impor-
tance of linking the use of technologies to specific functions within a firm, as pro-
posed by the FAT survey.
The Incomplete Transition from Industry 2.0 to Industry 4.0 in Developing Countries
Different stages of technological transitions, popularly defined as Industry 2.0, 3.0, and
4.0, are associated with the diffusion of disruptive GPTs. Industry 2.0 encompasses the

38 Bridging the Technological Divide
diffusion of technologies powered by electricity, which are technologies from the 1880s.
Industry 3.0 refers to the ICT revolution, including the use of mobile phones, comput-
ers, and the internet. These technologies became available over the 1970–80 period.21
Industry 4.0 refers to technologies that in most cases have some digital component, but
a higher level of autonomy, connection, and integration of information across different
devices and machines to perform tasks. Among the GPTs usually associated with
Industry 4.0 are the Internet of Things, big data analytics, AI, 3D printing, advanced
robotics, and cloud computing.22
Standard measures of GPTs can only partially identify and explain where firms
stand in the use of technologies associated with each technological transition. The
adoption of Industry 2.0 technologies is incomplete in some firms in developing coun-
tries, which in some cases use manual processes. Access to the internet is wider, but
adoption of Industry 3.0 technologies is partial. Most firms are very far from using
Industry 4.0 technologies (figure 1.7). In addition to serving as technologies them-
selves, GPTs act as infrastructure for the development of applied technologies.
Access to GPTs is not the only factor that matters for adoption of these applied tech-
nologies: quality is also very important. For example, although most firms in develop-
ing countries have access to electricity, quality, measured by the small share of firms
that do not experience outages, is often poor (panel a). These shortages occur for all
types of firms. Also, there is a clear gap in how firms respond to this low quality of
infrastructure access. Large firms are much more likely to have a generator to minimize
electricity shortages (panel a). This difference in the response to low-quality electricity
creates differences in technology use that limit, for example, the possibility of leapfrog-
ging—skipping over a less sophisticated level of technology to use a more sophisticated
one. Leapfrogging will be discussed in chapter 3.
Similarly, for Industry 3.0 technologies, even if access is widespread, adoption and
use of particular technologies differ (panel b). There are not large gaps in access to
mobile phones by large, medium, or small firms in developing countries. The pattern is
different for computers and the internet, which almost all large firms use, while less
than 75 percent of small firms do. Despite widespread access, quality differs across
firms, but as shown in the next section, even with the same quality of access, firms dif-
fer greatly in their use and adoption of applied technologies. In the case of Industry
4.0 technologies (panel c), a very small share of firms uses these technologies. The
exception is cloud computing, for which there is also a clear gap across firm size.
The incomplete technological transitions across countries are not fully captured by
standard measures of technology adopted by firms. The simultaneous rapid spread of
ICT general-purpose technologies alongside the persistence of a large share of firms still
struggling to gain basic access to reliable electricity is one of the many paradoxes of tech-
nology in developing countries. First, it shows the power and the limits of technology
disruptions associated with the digital revolution.23 Second, there is large variation in
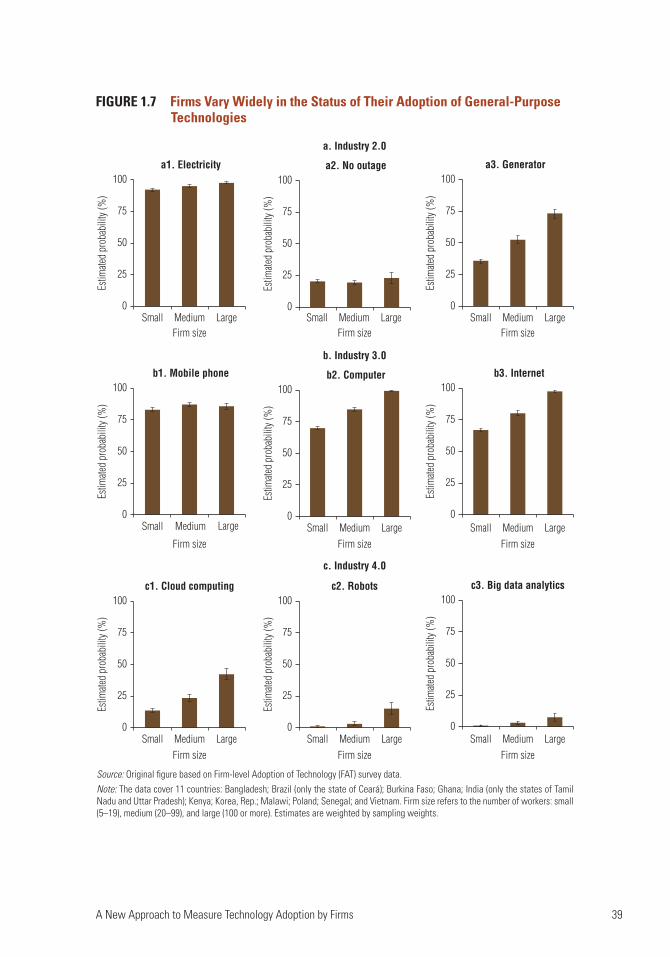
A New Approach to Measure Technology Adoption by Firms 39
FIGURE 1.7 Firms Vary Widely in the Status of Their Adoption of General-Purpose Technologies
Source: Original figure based on Firm-level Adoption of Technology (FAT) survey data.Note: The data cover 11 countries: Bangladesh; Brazil (only the state of Ceará); Burkina Faso; Ghana; India (only the states of Tamil Nadu and Uttar Pradesh); Kenya; Korea, Rep.; Malawi; Poland; Senegal; and Vietnam. Firm size refers to the number of workers: small (5–19), medium (20–99), and large (100 or more). Estimates are weighted by sampling weights.
Firm size Firm size Firm size
Firm size Firm size Firm size
b. Industry 3.0
0
25
50
75
100
Estim
ated
prob
abili
ty (%
)
Small Medium Large
b1. Mobile phone
0
25
50
75
100
Estim
ated
prob
abili
ty (%
)
Small Medium Large
b2. Computer
0
25
50
75
100
Estim
ated
prob
abili
ty (%
)
Small Medium Large
b3. Internet
c. Industry 4.0
0
25
50
75
100
Estim
ated
prob
abili
ty (%
)
Small Medium Large
c1. Cloud computing
0
25
50
75
100
Estim
ated
prob
abili
ty (%
)
Small Medium Large
c2. Robots
0
25
50
75
100
Estim
ated
prob
abili
ty (%
)
Small Medium Large
c3. Big data analytics
a. Industry 2.0
0
25
50
75
100
Estim
ated
prob
abili
ty (%
)
Small Medium Large
a1. Electricity
0
25
50
75
100
Estim
ated
prob
abili
ty (%
)
Small Medium Large
a2. No outage
0
25
50
75
100
Estim
ated
prob
abili
ty (%
)
Firm size Firm size Firm sizeSmall Medium Large
a3. Generator

40 Bridging the Technological Divide
terms of the quality of supply and potential for network economies across different uses
of digital technologies. Thus, while the focus of the media and policy makers is on the
latest technological transition (or industrial revolution), many firms, particularly in
developing countries, have yet to complete previous transitions. This is partly due to the
quality of the infrastructure underlying these technologies, but also partly due to other
factors to be discussed next. But one clear lesson is that these technology differences are
not visible using standard measures of access to GPTs.
How Are Firms Actually Using Computers and the Internet and for What Purposes?
Measuring the adoption of GPTs to characterize the degree of technology sophistica-
tion of a firm can be misleading without identifying the purpose for and intensity of a
firm’s use of those technologies. Beyond the problems with accessing reliable infra-
structure—which could facilitate the adoption of applied technologies—for a given
level of adoption of a given digital technology, the sophistication of use varies widely
among firms.
A simple example is provided by comparing the technologies used by firms to
perform business administration tasks, conditional on having computers and the
internet. Figure 1.8 shows the share of firms using different levels of technology on
both the extensive margin (whether they use it or not) and the intensive margin
(which technology they use most intensively) to perform business administration
tasks related to accounting, finance, and human resources, conditional on having
computers and/or the internet. Most of those firms use standard software (such as
Excel) to perform this task (extensive margin). This is also the technology used most
frequently by those firms (intensive margin). But about 21 percent of firms rely on
specialized software, while 11 percent use enterprise resource planning (ERP). There
are significant differences in terms of technology sophistication between processing
data manually, using standard Excel software, and utilizing ERP in terms of the
capabilities to perform tasks, the efficiency gains of the processes, and the outputs
produced. But there are also important differences in terms of just using a technol-
ogy (the extensive margin) or using it intensively as the most used technology
(intensive margin).
The results presented by the first two sets of bars (use of handwritten methods or
standard software) in figure 1.8 describe another anomaly of adoption when looking
merely at adoption of GPTs. Why do approximately one-fifth of firms (with 5 or more
workers) still rely mostly on handwritten methods despite the fact that those firms have
access to computers or the internet? Although the indicators, such as access to computers
and the internet, used in traditional surveys provide a general picture on the adoption of
a few GPTs, they fail to provide information on what technologies firms are effectively
using to perform different tasks and functions, as shown in figure 1.8. This is a critical

A New Approach to Measure Technology Adoption by Firms 41
element because firms can use the internet in many different ways, ranging from using
email for a few marketing activities to having fully digitalized and integrated manage-
ment processes. Understanding this range of applications is essential to learn about firm
performance, given that different uses result in very differentiated effects on productivity
and profits. But traditional measures of ICT are not well suited to measure the granular-
ity needed to explain firms’ adoption and use of specific technologies.
FIGURE 1.8 Among Firms with Access to Computers and the Internet, a Large Share Relies Mostly on Less Sophisticated Methods to Conduct Business Functions
Source: Original figure based on Firm-level Adoption of Technology (FAT) survey data.Note: This figure presents firm-level data from eight countries (Bangladesh; Brazil [only the state of Ceará]; Ghana; India [only the states of Tamil Nadu and Uttar Pradesh]; Kenya; Korea, Rep.; Senegal; and Vietnam) on general business functions conditional on having computers and the internet. Business administration processes are those related to accounting, finance, and human resources. The extensive measure captures the array of technologies used by the firm. The intensive measure captures the nature of the most used technology in the business function. ERP = enterprise resource planning.
Extensive Intensive
Perc
ent
66.2
19.5
0
20
40
60
80
100
Handwritten
87.6
47.5
Standard software
22.3
0.9
Mobile apps
49.4
21.1
Specialized software
21.1
10.6
ERP
67.9
20.2
0
20
40
60
80
100
Handwritten
Perc
ent
88.9
47.7
Standard software
a. Business administration processes conditional on having computers
b. Business administration processes conditional on having internet service
21.7
0.8
Mobile apps
48.7
20.9
Specialized software
20.0
9.9
ERP

42 Bridging the Technological Divide
Summing Up
This chapter puts forward a new framework to measure technology adoption. The
framework has four core principles. First, the firm is at the center of the analysis.
Second, it is grounded at the business function and task level. Third, it includes all
technologies that can be used for a given business function. Fourth, it measures what
kinds of technologies firms use and which technology they use more intensively. This
new approach is necessary to measure the multiple dimensions of technology from the
perspective of the firm. The scope and granularity of the framework can help research-
ers and policy makers thoroughly understand the process of technology adoption and
use, including existing heterogeneity in patterns of adoption; differences between sec-
tors; the impact on firm performance; and the main barriers to and drivers of technol-
ogy adoption and use.
To illustrate the benefits of this framework and the data collected for this volume
compared to standard GPT measures, this chapter provides an example in a context of
industrial revolutions. The FAT data show that many firms in developing countries are
still struggling with an incomplete transition from Industry 2.0 to Industry 3.0.
Moreover, despite having computers and the internet, many firms still rely on
handwritten methods to conduct business functions that could benefit from digital
technologies. The granular information obtained through the FAT survey approach is
critical to describe the reality of firms in both developed and developing countries.
More important, the granularity of the data yielded by the survey and analysis is needed
to design more targeted and effective policies that aim to increase technology adoption
and use by firms. The chapters that follow use the data collected from the FAT survey
to shed some light on all these issues.
Notes
1. See Mansfield (1961); Krueger (1993); Foster and Rosenzweig (1995); DiNardo and Pischke (1997); Bartel, Ichniowski, and Shaw (2007); Duflo, Kremer, and Robinson (2011); Atkin, Khandelwal, and Osman (2017); and Juhász, Squicciarini, and Voigtländer (2020).
2. The Cross-country Historical Adoption of Technology (CHAT) data set provides aggregated mea-sures of adoption of more than 100 GPTs across more than 150 countries since 1800 (Comin and Mestieri 2018). The data set defines technologies as a group of production methods that are used to produce an intermediate good or service. It covers major technologies related to transportation, telecommunications, information technology (IT), health care, steel production, and electricity.
3. See, for example, Ryan and Gross (1943); Griliches (1957); Foster and Rosenzweig (1996); Suri (2011); Bustos, Caprettini, and Ponticelli (2016); and Gupta, Ponticelli, and Tesei (2020).
4. See, for example, Comin (2000); Jorgenson, Ho, and Stiroh (2005, 2008); Oliner, Sichel, and Stiroh (2007); and Van Ark, O’Mahoney, and Timmer (2008).
5. Examples of these studies vary from identifying the positive effects of adopting computer numer-ically controlled (CNC) machines and computer-aided design (CAD) software in the productiv-ity of valve manufacturing (Bartel, Ichniowski, and Shaw 2007) to measuring the presence of CT scanners in hospitals (Trajtenberg 1990) to the impact of adopting onboard computers in trucks (Hubbard 2003).

A New Approach to Measure Technology Adoption by Firms 43
6. Other examples of studies measuring the presence of some ICTs such as computers or access to the internet include Brynjolfsson and Hitt (2000); Stiroh (2002); Bresnahan, Brynjolfsson, and Hitt (2002); and Akerman, Gaarder, and Mogstad (2015).
7. Innovation surveys are widely available in many countries, but they usually do not provide informa-tion about how far a given firm is from the technology frontier. The questions are usually relative (for example, innovation in terms of process or product with respect to the local, national, or international market). Patent data identify some relevant aspects of the dynamics on the technology frontier, but most of them do not apply to an average firm in developing countries or advanced economies.
8. One exception is Mansfield (1963), and the papers that have followed this study, which examine the diffusion of a technology within a company, providing a proxy for the intensity with which the technology is used.
9. The survey is designed, implemented, and weighted at the establishment level. For multi- establishment firms, the survey targets the establishment randomly selected in the sample.
10. The external experts in agriculture and livestock were agricultural engineers and researchers from Brazil’s Embrapa (Empresa Brasileira de Pesquisa Agropecuária, Brazilian Agricultural Research Corporation). For food processing, wearing apparel, motor vehicles, pharmaceuticals, transport, finance, and retail, as well as for the GBFs, the team relied on senior external consultants selected by a large management consulting organization. For health services, the team relied on consultants and physicians with practical experience in developing countries and advanced economies.
11. Appendix A provides more details on business functions and technologies covered by the other sector-specific variables.
12. In the pre-pilot stage, the team experimented with an alternative survey design that asked about the fraction of time/output/processes that were conducted with each of the technolo-gies in the business function. However, this approach was harder to implement and con-tained larger errors because respondents found it difficult to answer precisely, and the more subjective interpretation made it harder to compare answers across business functions and companies.
13. The technology indexes are defined as:
= + ×
= + ×
EXT r
INT r
1 4 ˆ
1 4 ˆf j f j
EXT
f j f jINT
, ,
, ,
EXTf,j is the most advanced technology (extensive margin) used in a business function f within a
firm j. INTf,j is the index for most widely used technology (intensive margin).
r̂f is a relative rank
of technology defined as −
−
rR
,f
f
1
1 where r
f is a rank of technology and R
f is the maximum rank in a
business function.
14. Cirera et al. (2020) provide a detailed discussion and several robustness checks on the rationale and consistency of using a cardinal measure of technology based on an ordinal ranking.
15. The construction of technology sophistication rankings predated the administration of the survey and was not influenced by attributes (such as productivity) of firms that use a given technology.
16. Cirera et al. (2020) also develop a technology sophistication index to measure adoption at the extensive margin. Appendix A provides more details about this alternative index (EXT). This index is used in chapter 6 to provide more heterogeneity when discussing key barriers of adoption.
17. For example, in Senegal the sample is also representative for formal and informal firms.
18. The survey covers a universe of 1.3 million establishments with the following distribution across countries: Bangladesh (15,358); Brazil’s state of Ceará (23,364); Burkina Faso (57,328); Ghana (42,165); India’s states of Tamil Nadu and Uttar Pradesh (92,061); Kenya (74,255); Korea (545,515); Malawi (2,123); Poland (244,983); Senegal (9,583); and Vietnam (179,713).

44 Bridging the Technological Divide
19. To control for some of the differences in samples, stratification, and economic structure when comparing countries in the sample, dummies for sector, firm size, and formality are used to calculate correlations and different cross-country estimates.
20. Cirera et al. (2020) describe the design features implemented to minimize measurement bias and errors.
21. Comin and Mestieri (2018) present the reference year of invention for these technologies: electricity (1882); personal computers (PCs) (1973); cell phones (1973); and the internet (1983).
22. Hallward-Driemeier and Nayyar (2017) provide further discussions on the emergence of Industry 4.0. Although some of these technologies, such as AI, have been available since the 1960s, they have been increasingly available in recent years.
23. While almost all firms use mobile phones, clearly benefiting from an extraordinary process of leapfrogging, only a small share has reported no outages in electricity. There is a large gap in access to generators, particularly for small firms.
References
Akerman, A., I. Gaarder, and M. Mogstad. 2015. “The Skill Complementarity of Broadband Internet.” Quarterly Journal of Economics 130 (4): 1781–824.
Atkin, D., A. K. Khandelwal, and A. Osman. 2017. “Exporting and Firm Performance: Evidence from a Randomized Experiment.” Quarterly Journal of Economics 132 (2): 551–615.
Bartel, A., C. Ichniowski, and K. Shaw. 2007. “How Does Information Technology Affect Productivity? Plant-Level Comparisons of Product Innovation, Process Improvement, and Worker Skills.” Quarterly Journal of Economics 122 (4): 1721–58.
Bresnahan, T. F., E. Brynjolfsson, and L. M. Hitt. 2002. “Information Technology, Workplace Organization, and the Demand for Skilled Labor: Firm-Level Evidence.” Quarterly Journal of Economics 117 (1): 339–76.
Brynjolfsson, E., and L. M. Hitt. 2000. “Beyond Computation: Information Technology, Organizational Transformation and Business Performance.” Journal of Economic Perspectives 14 (4): 23–48.
Bustos, P., B. Caprettini, and J. Ponticelli. 2016. “Agricultural Productivity and Structural Transformation: Evidence from Brazil.” American Economic Review 106 (6): 1320–65.
Cirera, X., C. Comin, M. Cruz, and K. M. Lee. 2020. “Anatomy of Technology in the Firm.” NBER Working Paper 28080, National Bureau of Economic Research, Cambridge, MA.
Comin, D. 2000. “An Uncertainty-Driven Theory of the Productivity Slowdown in Manufacturing.” PhD thesis, Harvard University, Cambridge, MA.
Comin, D., and M. Mestieri. 2018. “If Technology Has Arrived Everywhere, Why Has Income Diverged?” American Economic Journal: Macroeconomics 10 (3):137–78.
Demsetz, H. 1997. “The Firm in Economic Theory: A Quiet Revolution.” American Economic Review 87 (2): 426–29.
DiNardo, J. E., and J.-S. Pischke. 1997. “The Returns to Computer Use Revisited: Have Pencils Changed the Wage Structure Too?” Quarterly Journal of Economics 112 (1): 291–303.
Duflo, E., M. Kremer, and J. Robinson. 2011. “Nudging Farmers to Use Fertilizer: Theory and Experimental Evidence from Kenya.” American Economic Review 101 (6): 2350–90.
Foster, A. D., and M. R. Rosenzweig. 1995. “Learning by Doing and Learning from Others: Human Capital and Technical Change in Agriculture.” Journal of Political Economy 103 (6): 1176–1209.
Foster, A. D., and M. R. Rosenzweig. 1996. “Technical Change and Human-Capital Returns and Investments: Evidence from the Green Revolution.” American Economic Review 86 (4): 931–53.
Foster, A. D., and M. R. Rosenzweig. 2010. “Microeconomics of Technology Adoption.” Annual Review of Economics 2 (1): 395–424.

A New Approach to Measure Technology Adoption by Firms 45
Fuglie, K., M. Gautam, A. Goyal, and W. F. Maloney. 2020. Harvesting Prosperity: Technology and Productivity Growth in Agriculture. World Bank Productivity Project series. Washington, DC: World Bank.
Griliches, Z. 1957. “Hybrid Corn: An Exploration in the Economics of Technological Change.” Econometrica 25 (4): 501–22.
Gupta, A., J. Ponticelli, and A. Tesei. 2020. “Information, Technology Adoption and Productivity: The Role of Mobile Phones in Agriculture.” NBER Working Paper 27192, National Bureau of Economic Research, Cambridge, MA.
Hallward-Driemeier, M., and G. Nayyar. 2017. Trouble in the Making? The Future of Manufacturing-Led Development. Washington, DC: World Bank.
Hjort, J., and J. Poulsen. 2019. “The Arrival of Fast Internet and Employment in Africa.” American Economic Review 109 (3):1032–79.
Hubbard, T. N. 2003. “Information, Decisions, and Productivity: Onboard Computers and Capacity Utilization in Trucking.” American Economic Review 93 (4): 1328–53.
Jorgenson, D. W., M. S. Ho, and K. Stiroh. 2005. Productivity, Volume 3: Information Technology and the American Growth Resurgence. Cambridge, MA: MIT Press.
Jorgenson, D. W., M. S. Ho, and K. Stiroh. 2008. “A Retrospective Look at the US Productivity Growth Resurgence.” Journal of Economic Perspectives 22 (1): 3–24.
Juhász, R., M. P. Squicciarini, and N. Voigtländer. 2020. “Technology Adoption and Productivity Growth: Evidence from Industrialization in France.” NBER Working Paper 27503, National Bureau of Economic Research, Cambridge, MA.
Krueger, A. B. 1993. “How Computers Have Changed the Wage Structure: Evidence from Microdata, 1984–1989.” Quarterly Journal of Economics 108 (1): 33–60.
Lall, S. 2000. “The Technological Structure and Performance of Developing Country Manufactured Exports, 1985–98.” Oxford Development Studies 28 (3): 337–69.
Mansfield, E. 1961. “Technical Change and the Rate of Imitation.” Econometrica 29 (4): 741–66.
Mansfield, E. 1963. “Intrafirm Rates of Diffusion of an Innovation.” Review of Economics and Statistics 45 (4): 348–59.
Oliner, S. D., D. E. Sichel, and K. J. Stiroh. 2007. “Explaining a Productive Decade.” Brookings Papers on Economic Activity 2007 (1): 81–137.
Ryan, B., and N. Gross. 1943. “The Diffusion of Hybrid Seed Corn in Two Iowa Communities.” Rural Sociology 8 (1):15–24.
Stiroh, K. J. 2002. “Information Technology and the U.S. Productivity Revival: What Do the Industry Data Say?” American Economic Review 92 (5): 1559–76.
Suri, T. 2011. “Selection and Comparative Advantage in Technology Adoption.” Econometrica 79 (1): 159–209.
Trajtenberg, M. 1990. Economic Analysis of Product Innovation: The Case of CT Scanners. Harvard Economic Studies, Vol. 160. Cambridge, MA: Harvard University Press.
Van Ark, B., M. O’Mahoney, and M. P. Timmer. 2008. “The Productivity Gap between Europe and the United States: Trends and Causes.” Journal of Economic Perspectives 22 (1): 25–44.

47
2. Facts about Technology Adoption and Use in Developing Countries
Introduction
This chapter presents some stylized facts that have emerged from the Firm-level
Adoption of Technology (FAT) survey data in relation to the adoption and use of tech-
nology by firms. The data provide granular information for developing and high-
income countries to address some previously unexplored questions about the size of
the technology gaps between business functions, firms, sectors, regions, and countries.1
To this end, the technology index described in the previous chapter is used to charac-
terize the level of technology sophistication across and within firms.
Specifically, this chapter addresses the following questions:
■■ How far from the technology frontier are the average firms in developing
countries?
■■ What is the association between the average level of technology sophistication of
firms and the productivity of the regions where they are located?
■■ How does the technology gap vary across countries, regions, sectors, firms, and
business functions?
■■ Based on the patterns of adoption by firms, what do the data reveal about tech-
nology leapfrogging—jumping stages in the process of technology convergence,
such as from manual to advanced digital technologies?
■■ Are firms aware about their technology gap?
To address these questions, this chapter presents 10 stylized facts related to com-
parisons across countries, regions, sectors, firms, and business functions within firms.
Among the most novel findings are the large variations in the sophistication of tech-
nologies at all levels of aggregation (from countries to sectors to firms); the more micro
the unit of analysis—from country to business function within the firm—the larger the
variance in sophistication. Moreover, not only is the average technology sophistication
positively correlated with productivity, but so is the dispersion of technology sophisti-
cation across countries, firms, and business functions within a firm.
In line with a rich firm-level literature (see Syverson 2014), the analysis reveals con-
siderable heterogeneity across and within firms regarding the adoption and use of tech-
nology. It also demonstrates that this heterogeneity matters for performance. This
implies that firms have different incentives to upgrade different technologies.

48 Bridging the Technological Divide
Accordingly, policy support should consider that upgrading different technologies may
require different approaches and face different barriers.
Cross-Country Technology Facts
Fact 1. Most firms are far from the technology frontier.
Most firms, especially in developing countries, are far from the technology frontier. Figure
2.1 presents the estimated country average of technology sophistication in manufacturing
firms. First, the figure shows that the average firm (orange dot) in each country is far from
the frontier (starting in the shaded area).2 Second, using the top (20 percent) manufactur-
ing firms in the Republic of Korea and Poland as a benchmark to the frontier, most firms in
developing countries, including their best firms (brown dot), are far from the frontier.3 The
country rankings based on average technology sophistication tend to coincide with country
income levels. The results also show a gap between formal and informal firms in Senegal.
Agricultural and services firms are also far from the technology frontier
(figure 2.2). There are important peculiarities about those sectors. In agriculture
FIGURE 2.1 Estimated Technology Sophistication, by Country: Manufacturing
Source: Original figure based on Firm-level Adoption of Technology (FAT) survey data.Note: The figure plots for each country the average level of technology sophistication of the firm across all business functions (ABF), including general business functions (GBFs) and sector-specific business functions (SBFs). Results are based on ordinary least squares (OLS) estimation using sampling weights and controlling for sector, country, formality, firm size group, and age group.
Top 20% of firmsAverage firm
Korea, Rep.
Poland
Brazil
Vietnam
Kenya
India
Ghana
Bangladesh
Senegal—formal
Malawi
Senegal—informal
Burkina Faso
1.0 1.5 2.0 2.5 3.0
Technology index
3.5 4.0 4.5 5.0
Frontier

Facts about Technology Adoption and Use in Developing Countries 49
FIGURE 2.2 Estimated Technology Sophistication, by Country: Agriculture and Services
Source: Original figure based on Firm-level Adoption of Technology (FAT) survey data.Note: The figure plots for each country the average business function, which reflects the average level of technology sophistication of the firm across all business functions, including general business functions (GBFs) and sector-specific business functions (SBFs). Results are based on ordinary least squares (OLS) estimation using sampling weights and controlling for sector, country, formality, firm size group, and age group.
a. Agriculture
b. Services
Technology index
Technology index
Top 20% of firmsAverage firm
Frontier
Korea, Rep.
Poland
Brazil
Vietnam
Kenya
Ghana
Senegal—formal
Burkina Faso
Senegal—informal
1.0 1.5 2.0 2.5 3.0 3.5 4.0 4.5 5.0
Frontier
Brazil
Korea, Rep.
Poland
Vietnam
Kenya
Ghana
India
Malawi
Senegal—formal
Burkina Faso
Senegal—informal
1.0 1.5 2.0 2.5 3.0 3.5 4.0 4.5 5.0
50 Bridging the Technological Divide
(panel a), top firms in Brazil and Kenya tend to be relatively closer to top firms in
Korea and Poland, compared to manufacturing. This suggests that in some devel-
oping countries where agricultural exports are important, agricultural firms are
relatively closer to the frontier than in manufacturing. But as the discussion in
chapter 4 will clarify, there is still a large gap in agricultural firms in developing
countries driven by many informal and less capable firms, which still absorb many
workers with low levels of productivity. The pattern for services is different
(panel b): it is similar to agriculture and less correlated to a country’s income per
capita. This is partially explained by the rapid diffusion of certain technologies,
usually related to general business functions (GBFs) (such as digital payment sys-
tems) in some countries. Yet, as discussed in chapter 3 and as highlighted in the
fifth volume in the World Bank Productivity Project series (Nayyar, Hallward-
Driemeier, and Davies 2021), despite the relevance of digital technologies for pro-
viding economic opportunities for services in developing countries, there is
significant heterogeneity in adoption across services activities. Another important
aspect is the fact that these measures do not capture differences in the number of
firms (see fact 3), nor are they weighted by the number of workers they employ,
which has implications for the per capita GDP ranking.
Fact 2. More productive regions are closer to the technology frontier.
The strong positive association between the variation of technology sophistication
and labor productivity is observed not only across countries but also across regions
within countries. Figure 2.3 presents a scatterplot of the regional measures of tech-
nology sophistication against regional productivity as the weighted average of
firm-level variables for 44 subnational regions across 10 countries.4 The correla-
tion between these two variables is 0.87, confirming the cross-country association
highlighted earlier.5 There is also a strong positive correlation between technology
sophistication and productivity at the firm level, unconditional or conditional on
several firm characteristics (as will be discussed in chapter 4). The significant vari-
ation associated with technology and productivity across regions is also described
in the sixth volume of the World Bank Productivity Project series (Grover, Lall, and
Maloney 2022) when analyzing the several complementary factors driving the gap
in laggard regions.
Fact 3. Advanced economies have many more sophisticated firms.
Why is the technology gap between the average firm in Korea and the other coun-
tries not as large as the gap in per capita income? The technology gap across coun-
tries (and regions) is driven not only by the sophistication of average firms, but also
by the density (quantity of those firms per capita). There is a large difference

Facts about Technology Adoption and Use in Developing Countries 51
between the number of formal firms across countries. Comparing Korea and Kenya,
countries with similar populations (around 50 million), not only is the average firm
in Korea closer to the technology frontier but there are also many more of those
firms (with 5 or more workers) absorbing many more workers (see box 2.1). The
number of firms in Korea in the top 20 percent in terms of technology sophistica-
tion is almost double the full number of formal firms with 5 or more workers in
Kenya in the FAT sample. Figure 2.4 shows that the gap between Vietnam, Kenya,
and Senegal with respect to Korea is explained not only by the average sophistica-
tion (vertical axis), but also by having many more firms with those technologies
(circle size), and more workers absorbed by those firms (horizontal axis).6 This
highlights the importance of more capable entrepreneurs who are able to enter
developing countries’ markets, grow, and absorb the knowledge created elsewhere
(see the third volume in the World Bank Productivity Project series, Grover
Goswami, Medvedev, and Olafsen 2019).7
FIGURE 2.3 There Is a Strong Correlation between the Technology Sophistication of a Region and Regional Productivity
Source: Original figure based on Firm-level Adoption of Technology (FAT) survey data, following Cirera et al. 2020a.Note: The regional average of technology sophistication by business function (ABF) is plotted on the y-axis. The regional productivity is plotted on the x-axis. The regional productivity is measured as the average value added per worker based on a representative sample of the FAT data for each region, using sampling weights. Countries are as follows: Bangladesh (BD); Brazil (BR); Burkina Faso (BF); Ghana (GH); India (IN); Kenya (KE); Korea, Rep. (KR); Malawi (MW); Senegal (SN); and Vietnam (VT). The eight regions sampled in Vietnam (VT) are: Region 1 (Băc Ninh, Hài Phòng, Ninh Bình); Region 2 (Băc Giang, Thái Nguyên); Region 3 (Bình Đinh, Hà Tĩnh, Thanh Hoá); Region 4 (Kon Tum, Lâm Đông); Region 5 (Bình Duong, Đòng Nai); Region 6 (Long An, Vĩnh Long); Region 7 (Hà Nôi); and Region 8 (Hò Chì Minh City).
BR, Ceará
VT, Region 1
VT, Region 2
VT, Region 3VT, Region 4
VT, Region 5
VT, Region 6VT, Region 7
VT, Region 8
SN, Dakar
SN, DiourbelSN, Kaolac
SN, Kolda
SN, St. Louis
SN, Thies
SN, Ziguinchor
BD, ChattogramBD, Dhaka
BD, Khulna
BD, Rajshahi
KE, Nairobi
KE, other regions
GH, Ashanti
GH, Bono GH, Eastern
GH, Greater Accra
GH, Northern
GH, WesternMW, Blantyre
MW, Lilngwe
MW, Mzimba
MW, Mzuzu
IN, Uttar PradeshIN, Tamil Nadu
BF, CenterBF, other regions
KR, Gyeonggi-doKR, Gangwon-do
KR, Chungcheongbuk-doKR, Chungcheongnam-do
KR, Jeollabuk-do
KR, Jeollanam-do
KR, Gyeongsangbuk-doKR, Gyeongsangnam-do
1.0
1.5
2.0
2.5
Regi
onal
techn
olog
y sop
histi
catio
n (A
BF)
6 7 8 9 10 11 12
Log of regional productivity

52 Bridging the Technological Divide
BOX 2.1
The Large Gap in Technology Sophistication between Formal and Informal Firms
Is the difference between the Republic of Korea and Kenya in the number of firms with 5 or more workers explained by the informal nature of firms (informality)? The literature has documented that the share of firms not reported as formal establishments in developing countries tends to be more prevalent among micro firms (those with less than 5 workers), but informal firms are still present among firms with 5 or more workers, as suggested by the Firm-level Adoption of Technology (FAT) survey results for Senegal (see figure 2.4). The implication for some other countries in the sample—especially in Africa, where informality is more prevalent—is that if the informal sector were taken into account, the average technology sophistication would be reduced, increasing the average distance to the frontier. Malawi, for example, has about half the number of formal firms observed in Senegal, despite having a larger population, and thus has a higher incidence of informality.
Estimates from Senegal help explain the implications of informality on the differences in the number of firms, the aggregated distance from the frontier, and workers’ access to sophisticated technologies through firms. On a plot like that shown in figure 2.4, including informal firms increases the size of the circle (by adding more firms), but moves the circle down (farther away from the frontier) and to the right (adding more workers). Figure B2.1.1 shows that average
(Box continues on the following page.)
FIGURE 2.4 Cross-Country Differences in Technology Are Also Explained by the Number of Firms Using Sophisticated Technology
Source: Original figure based on Firm-level Adoption of Technology (FAT) survey data.Note: Technology index estimates at the firm level across all business functions. Results are based on ordinary least squares (OLS) estimation controlling for sector, country, formality, firm size group, age group, and using sampling weights (vertical axis), number of workers (horizontal axis), and number of firms (size of the bubble). All estimations are based on sampling weights. For Senegal, the total number of workers is adjusted based on the latest establishment census to cover firms from all regions.
2.6
Tech
nolo
gy in
dex
2.4
2.2
2.0
1.8
1.6
1.4
1.2Senegal—informal
Senegal—formal
Kenya
Korea, Rep.
Vietnam
1.00 2 4 6
Estimated number of workers (million)
8 10 12 14 16 18 20
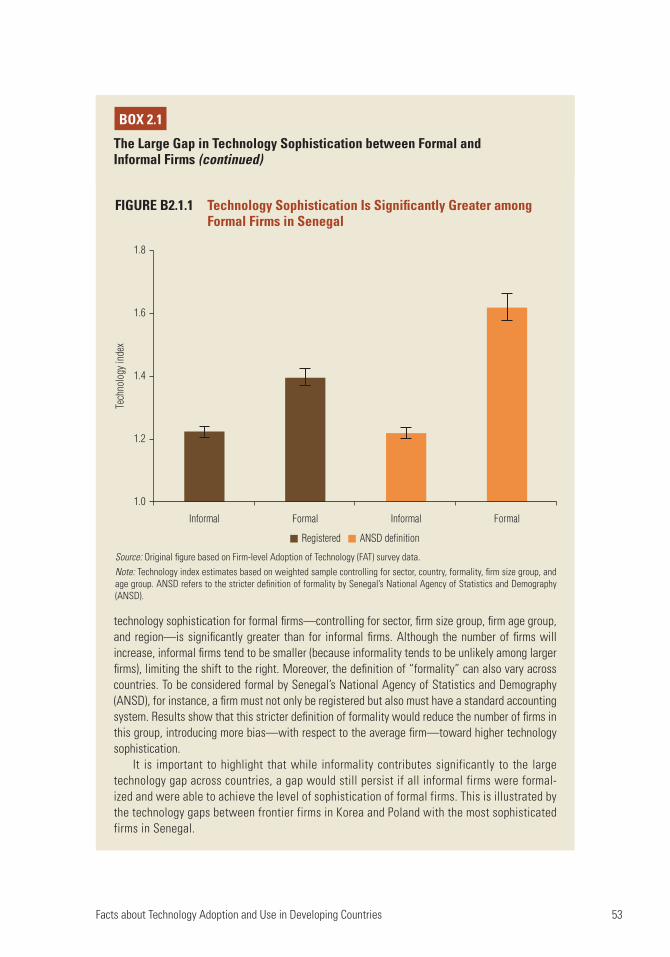
Facts about Technology Adoption and Use in Developing Countries 53
technology sophistication for formal firms—controlling for sector, firm size group, firm age group, and region—is significantly greater than for informal firms. Although the number of firms will increase, informal firms tend to be smaller (because informality tends to be unlikely among larger firms), limiting the shift to the right. Moreover, the definition of “formality” can also vary across countries. To be considered formal by Senegal’s National Agency of Statistics and Demography (ANSD), for instance, a firm must not only be registered but also must have a standard accounting system. Results show that this stricter definition of formality would reduce the number of firms in this group, introducing more bias—with respect to the average firm—toward higher technology sophistication.
It is important to highlight that while informality contributes significantly to the large technology gap across countries, a gap would still persist if all informal firms were formal-ized and were able to achieve the level of sophistication of formal firms. This is illustrated by the technology gaps between frontier firms in Korea and Poland with the most sophisticated firms in Senegal.
BOX 2.1
The Large Gap in Technology Sophistication between Formal and Informal Firms (continued)
FIGURE B2.1.1 Technology Sophistication Is Significantly Greater among Formal Firms in Senegal
Source: Original figure based on Firm-level Adoption of Technology (FAT) survey data.Note: Technology index estimates based on weighted sample controlling for sector, country, formality, firm size group, and age group. ANSD refers to the stricter definition of formality by Senegal’s National Agency of Statistics and Demography (ANSD).
1.0
Informal
Registered ANSD definition
InformalFormal Formal
Tech
nolo
gy in
dex
1.2
1.4
1.6
1.8

54 Bridging the Technological Divide
Cross-Firm Technology Facts
Fact 4. Technology sophistication varies across business functions.
Firms are closer to the technology frontier in some business functions than in others.
Figure 2.5 compares the average technology sophistication in seven general business
functions (GBFs)—business administration (accounting, finance, and human
resources); production or service operations planning; sourcing, procurement, and
supply chain management; marketing and product development; sales; payment meth-
ods; and quality control—across top firms (those in the 90th percentile, p90) with the
average across all firms (mean) and the median firms (50th percentile, p50), as well as
with firms in the bottom 10th percentile (p10) of technology sophistication. While, on
average, firms in the 90th percentile have higher scores than those in the 10th percen-
tile, there is great variation in proximity to the frontier across functions. Top firms tend
to score well on business administration, but poorly on quality control. The gap
between firms in the 90th and 10th percentiles is also larger in business administration
than in other GBFs. An important characteristic of some of these functions (such as
sourcing, marketing, sales, and payment) is that the intensive use of some of these tech-
nologies often also requires their adoption by customers and suppliers through
network effects, which may explain the distance from the frontier even among top
FIGURE 2.5 The Level of Technology Sophistication for General Business Functions Varies Greatly
Intensive margin
Source: Original figure based on Firm-level Adoption of Technology (FAT) survey data.Note: The figure covers all 11 countries in the sample. The intensive margin refers to the most frequently used technology to perform that particular task/business function. p90, p50, and p10 refer to the 90th, 50th, and 10th percentiles of firms, respectively. The mean is the average across all firms using sampling weights.
Business administration
Planning
Sourcing
MarketingSales
Payment
Quality control
1
2
3
4
5
Mean p90 p50 p10

Facts about Technology Adoption and Use in Developing Countries 55
firms. Many of these firms are using more sophisticated technologies in those func-
tions, but not as the most intensively used technology.
These patterns of heterogeneity in sophistication at the business level are also repli-
cated at the country level. First, the average sophistication level varies significantly
across business functions within each country. Second, differences across countries in
the use of technologies for particular business functions are not maintained. For exam-
ple, while there is a large gap in the technologies used more intensively for business
administration or planning across countries, the differences are very narrow for pay-
ment systems or quality control, where low adoption is common across countries
regardless of income. Technology gaps across countries vary depending on the business
function and level of aggregation.
Fact 5. Larger firms use more sophisticated technologies, but this scale effect varies across technologies.
The adoption and use of more sophisticated technologies are positively correlated with
the size of the firm. Figure 2.6 shows the average level of technology sophistication for
both general and sector-specific business functions (SBFs) by size groups for firms,
defined as small (5 to 19 workers), medium (20 to 99 workers), and large (100 or more
workers). Larger firms tend to use more sophisticated technologies, on average, for
GBFs and SBFs, as well as ABF (all business functions), which takes a simple average of
the index across all business functions.
There is, however, significant variation for different types of technologies and busi-
ness functions. Figure 2.7 shows the estimated probability of adopting particular
FIGURE 2.6 Technology Sophistication Varies across Firm Size
Source: Original figure based on Firm-level Adoption of Technology (FAT) survey data.Note: The figure covers all 11 countries in the sample. Marginal effect estimates based on weighted sample controlling for sector, country, formality, firm size group, and firm age group. Firm size refers to the number of workers: small (5–19), medium (20–99), and large (100 or more).
3
2
1Small Medium
a. All business functions b. General business function c. Sector-specific business function
Large
3
2
1Small Medium
Firm sizeFirm size Firm size
Estim
ated
techn
olog
y ind
ex
Estim
ated
techn
olog
y ind
ex
Estim
ated
techn
olog
y ind
ex
Large
3
2
1Small Medium Large

56 Bridging the Technological Divide
technologies that are in the frontier across different GBFs by firm size groups.
Sophisticated digital technologies for GBFs include enterprise resource planning
(ERP); sourcing, procurement, and supplier relationship management (SRM); cus-
tomer relationship management (CRM); use of online sales through digital platforms
or a firm’s own website (online commerce); use of online payment through platform or
commercial banks (online payment); and use of statistical software or automated sys-
tems for quality control (automated quality control). The comparison of the likelihood
of using these advanced technologies—in the frontier of different GBFs—across size
groups of firms shows that the gap between small and large firms regarding the adop-
tion of these technologies varies significantly. For example, the gap between small and
large firms is much wider for ERP than for e-payment.
This variation is also present, and even more pronounced, across sector-specific
functions. Figure 2.8 shows the estimated probability of adoption by size groups for
particular technologies that are in the frontier across sector-specific business functions in
agriculture (irrigation, harvesting, storage); manufacturing/food processing (input
FIGURE 2.7 The Likelihood of Adopting Frontier Technologies for General Business Functions Varies across Firm Size
Source: Original figure based on Firm-level Adoption of Technology (FAT) survey data.Note: Estimated probability of technology adoption using sampling weights and controlling for country, firm size, and sector. Firm size refers to the number of workers: small (5–19), medium (20–99), and large (100 or more).
a. Enterprise resourceplanning
0
20
40
60
80
100
Small Medium Large
Estim
ated
prob
abili
ty (%
)
b. Supplier relationshipmanagement
Small Medium Large0
20
40
60
80
100
Estim
ated
prob
abili
ty (%
)
c. Customer relationship management
Small Medium
Firm size Firm size Firm size
Firm size Firm size Firm size
Large0
20
40
60
80
100
Estim
ated
prob
abili
ty (%
)
d. Online commerce
Small Medium Large0
20
40
60
80
100
Estim
ated
prob
abili
ty (%
)
e. Online payment
Small Medium Large0
20
40
60
80
100
Estim
ated
prob
abili
ty (%
)
f. Automated qualitycontrol
Small Medium Large0
20
40
60
80
100
Estim
ated
prob
abili
ty (%
)

Facts about Technology Adoption and Use in Developing Countries 57
FIGURE 2.8 The Likelihood of Adopting Frontier Technologies for Sector-Specific Business Functions Varies across Firm Size
Source: Original figure based on Firm-level Adoption of Technology (FAT) survey data.Note: Estimated probability of technology adoption using sampling weights and controlling for country, firm size, and sector. Firm size refers to the number of workers: small (5–19), medium (20–99), and large (100 or more).
40
20
0
100
60
80
Small Medium Large
Estim
ated
prob
abili
ty (%
)
a1. Irrigation
Small Medium Large
a2. Harvesting
40
20
0
100
60
80
Estim
ated
prob
abili
ty (%
)Small Medium
Firm size Firm size Firm size
Firm size Firm size Firm size
Firm sizeFirm size Firm size
Large
a3. Storage
40
20
0
100
60
80
Estim
ated
prob
abili
ty (%
)
a. Agriculture
Small Medium Large
b1. Input testing
40
20
0
100
60
80
Estim
ated
prob
abili
ty (%
)
Small Medium Large
b2. Cooking
40
20
0
100
60
80
Estim
ated
prob
abili
ty (%
)
Small Medium Large
b3. Packaging
40
20
0
100
60
80
Estim
ated
prob
abili
ty (%
)
b. Food processing (manufacturing)
Small Medium Large
c1. Merchandising
40
20
0
100
60
80
Estim
ated
prob
abili
ty (%
)
Small Medium Large
c2. Inventory
40
20
0
100
60
80
Estim
ated
prob
abili
ty (%
)
Small Medium Large
c3. Advertising
40
20
0
100
60
80
Estim
ated
prob
abili
ty (%
)
c. Retail (services)
testing, cooking, packaging); and services/retail (merchandising, inventory, advertising).
The gap between small and large firms in the likelihood of adopting frontier technologies
in the functions related to food processing is larger than in agriculture and services.
Fact 6. The largest technology gaps occur within countries, not between countries.
Underlying the significant differences in the average technology sophistication across
countries, regions, sectors, and firm size lies a large variation of sophistication

58 Bridging the Technological Divide
across firms. A key advantage of a firm-level data set such as FAT is that it allows
researchers and practitioners to go beyond country or regional comparisons of aver-
age technology sophistication by characterizing the entire distribution of technology
sophistication across firms. Figure 2.9 plots the kernel density of the distribution of
the firm-level technology sophistication for Burkina Faso, Korea, and Vietnam. Visual
inspection of the densities suggests the possibility of consistent rank orderings (first-
order stochastic dominance), which suggests that for any point of the cumulative dis-
tribution of technology across firms in each country, firms in Korea tend to be more
or at least as sophisticated as firms in Vietnam, which tend to be more or at least as
sophisticated as firms in Burkina Faso.8
In addition, the within-country variance in technology sophistication is larger than
the between-country variation. Cirera et al. (2020b) conduct a variance-covariance
decomposition to measure the magnitude of the dispersion of firm-level technology
sophistication within and between countries. They find that there is significant disper-
sion in technology across firms within each country, which is consistent with large
cross-firm dispersion in management practices, as highlighted by Bloom and Van
Reenen (2007). The findings suggest that cross-firm differences in technology
FIGURE 2.9 Rank Orderings of the Distribution of Technology Sophistication Are Consistent across Select Countries
Source: Original figure based on Firm-level Adoption of Technology (FAT) survey data.Note: Average technology index (intensive) reflects the average sophistication of the technology most frequently used to perform all business functions performed by the firm using sampling weights.
Korea, Rep. VietnamBurkina Faso
0.5
0
1.0
1.5
2.0
Dens
ity
1.0 1.5 2.0 2.5 3.0 3.5 4.0Average technology index (intensive)

Facts about Technology Adoption and Use in Developing Countries 59
sophistication are larger than cross-country differences, regardless of the technology
measures considered and whether the focus is on general, sector-specific, or all business
functions. The implication of this finding is that contrary to some popular beliefs that
tend to associate technology gaps with cross-country differences, the largest technology
gaps occur within countries.
Fact 7. More productive regions have more dispersion in regional technology sophistication.
There is also a strong correlation between cross-firm variance and regional productiv-
ity levels. Figure 2.10 plots the cross-firm variance in technology sophistication in each
subnational region against the regional productivity level. The figure confirms the pos-
itive association between the two variables (with a correlation of 0.68). More-developed
FIGURE 2.10 Most Productive Countries and Regions Have Firms That Use More Sophisticated Technologies on Average
Source: Original figure based on Firm-level Adoption of Technology (FAT) survey data, following Cirera et al. 2020a.Note: The regional-level cross-firm variance of technology sophistication for all business functions (ABF) is on the y-axis. The regional productivity is on the x-axis. The regional productivity is measured as the average value added per worker based on a representative sample of the FAT data for each region using sampling weights. Countries are as follows: Bangladesh (BD); Brazil (BR); Burkina Faso (BF); Ghana (GH); India (IN); Kenya (KE); Korea, Rep. (KR); Malawi (MW); Senegal (SN); and Vietnam (VT). The eight regions sampled in Vietnam (VT) are: Region 1 (Băc Ninh, Hài Phòng, Ninh Bình); Region 2 (Băc Giang, Thái Nguyên); Region 3 (Bình Đinh, Hà Tĩnh, Thanh Hoá); Region 4 (Kon Tum, Lâm Đông); Region 5 (Bình Duong, Đòng Nai); Region 6 (Long An, Vĩnh Long); Region 7 (Hà Nôi); and Region 8 (Hò Chì Minh City).
BR, Ceará
VT, Region 1 VT, Region 3
VT, Region 4
VT, Region 2
VT, Region 5
VT, Region 6
VT, Region 7VT,Region 8
SN, Dakar
SN, DiourbelSN, Kaolack
SN, Kolda
SN, St. Louis
SN, Thies
SN, ZiguinchorBD,
Chattogram
BD, Dhaka
BD, Khulna
BD, RajshahiKE, Nairobi 5
KE, otherregions
GH, Ashanti
GH, Bono
GH, Eastern
GH, GreaterAccra
GH, Northern
GH,Western
MW,Blantyre
MW, LilngweMW, Mzimba
MW, Mzuzu
IN, UttarPradesh 6
IN, Tamil Nadu
BF, Center
BF, other regions KR, Gyeonggi-do
KR, Gangwon-do
KR, Chungcheongbuk-do
KR,Chungcheongnam-do
KR, Jeollabuk-do
KR,Jeollanam-do
KR, Gyeongsangbuk-doKR, Gyeongsangnam-do
2.5
2.0
1.5
1.0
0.5
0Regi
onal
cros
s-fir
m va
rianc
e in
techn
olog
y sop
histi
catio
n (A
BF)
6 7 8 9 10 11 12
Log of regional productivity
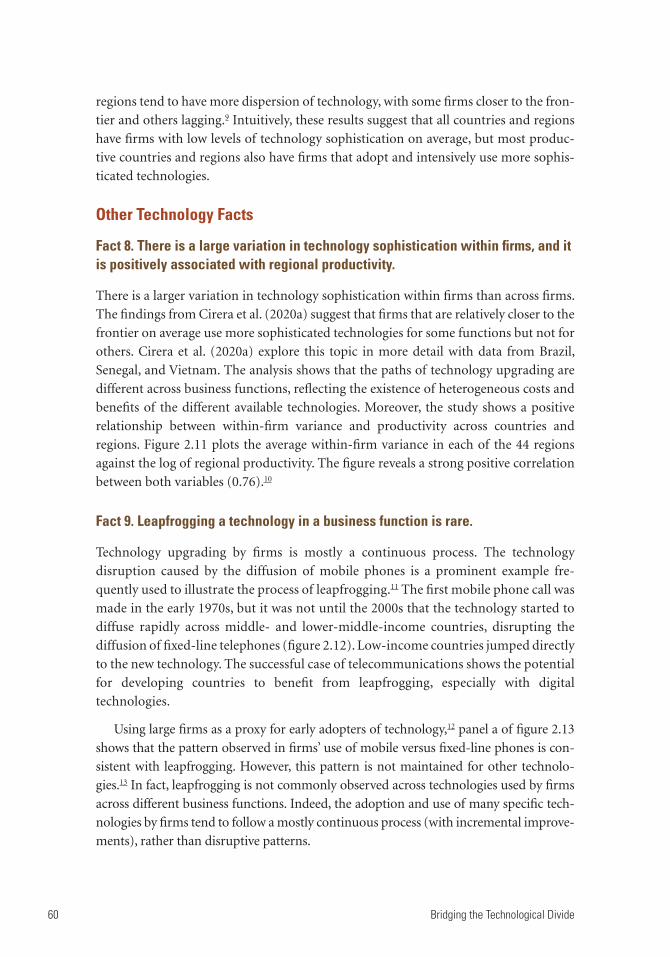
60 Bridging the Technological Divide
regions tend to have more dispersion of technology, with some firms closer to the fron-
tier and others lagging.9 Intuitively, these results suggest that all countries and regions
have firms with low levels of technology sophistication on average, but most produc-
tive countries and regions also have firms that adopt and intensively use more sophis-
ticated technologies.
Other Technology Facts
Fact 8. There is a large variation in technology sophistication within firms, and it is positively associated with regional productivity.
There is a larger variation in technology sophistication within firms than across firms.
The findings from Cirera et al. (2020a) suggest that firms that are relatively closer to the
frontier on average use more sophisticated technologies for some functions but not for
others. Cirera et al. (2020a) explore this topic in more detail with data from Brazil,
Senegal, and Vietnam. The analysis shows that the paths of technology upgrading are
different across business functions, reflecting the existence of heterogeneous costs and
benefits of the different available technologies. Moreover, the study shows a positive
relationship between within-firm variance and productivity across countries and
regions. Figure 2.11 plots the average within-firm variance in each of the 44 regions
against the log of regional productivity. The figure reveals a strong positive correlation
between both variables (0.76).10
Fact 9. Leapfrogging a technology in a business function is rare.
Technology upgrading by firms is mostly a continuous process. The technology
disruption caused by the diffusion of mobile phones is a prominent example fre-
quently used to illustrate the process of leapfrogging.11 The first mobile phone call was
made in the early 1970s, but it was not until the 2000s that the technology started to
diffuse rapidly across middle- and lower-middle-income countries, disrupting the
diffusion of fixed-line telephones (figure 2.12). Low-income countries jumped directly
to the new technology. The successful case of telecommunications shows the potential
for developing countries to benefit from leapfrogging, especially with digital
technologies.
Using large firms as a proxy for early adopters of technology,12 panel a of figure 2.13
shows that the pattern observed in firms’ use of mobile versus fixed-line phones is con-
sistent with leapfrogging. However, this pattern is not maintained for other technolo-
gies.13 In fact, leapfrogging is not commonly observed across technologies used by firms
across different business functions. Indeed, the adoption and use of many specific tech-
nologies by firms tend to follow a mostly continuous process (with incremental improve-
ments), rather than disruptive patterns.
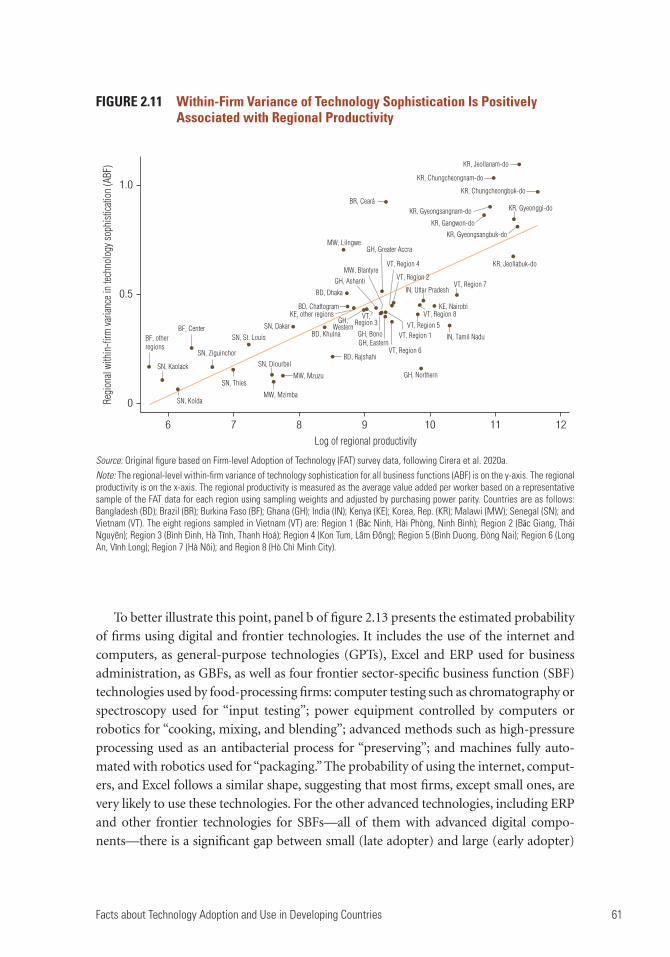
Facts about Technology Adoption and Use in Developing Countries 61
FIGURE 2.11 Within-Firm Variance of Technology Sophistication Is Positively Associated with Regional Productivity
Source: Original figure based on Firm-level Adoption of Technology (FAT) survey data, following Cirera et al. 2020a.Note: The regional-level within-firm variance of technology sophistication for all business functions (ABF) is on the y-axis. The regional productivity is on the x-axis. The regional productivity is measured as the average value added per worker based on a representative sample of the FAT data for each region using sampling weights and adjusted by purchasing power parity. Countries are as follows: Bangladesh (BD); Brazil (BR); Burkina Faso (BF); Ghana (GH); India (IN); Kenya (KE); Korea, Rep. (KR); Malawi (MW); Senegal (SN); and Vietnam (VT). The eight regions sampled in Vietnam (VT) are: Region 1 (Băc Ninh, Hài Phòng, Ninh Bình); Region 2 (Băc Giang, Thái Nguyên); Region 3 (Bình Đinh, Hà Tĩnh, Thanh Hoá); Region 4 (Kon Tum, Lâm Đông); Region 5 (Bình Duong, Đòng Nai); Region 6 (Long An, Vĩnh Long); Region 7 (Hà Nôi); and Region 8 (Hò Chì Minh City).
BR, Ceará
VT, Region 1
VT, Region 2
VT,Region 3 VT, Region 5
VT, Region 6
VT, Region 7
VT, Region 8
SN, Dakar
SN, DiourbelSN, Kaolack
SN, Kolda
SN, St. Louis
SN, Thies
SN, Ziguinchor
BD, Chattogram
BD, Dhaka
BD, Khulna
BD, Rajshahi
KE, Nairobi
GH, BonoGH, Eastern
GH, Greater Accra
GH, Northern
MW, Lilngwe
MW, Mzimba
MW, Mzuzu
IN, Tamil NaduBF, Center
BF, otherregions
KR, Gyeonggi-do
KR, Gangwon-do
KR, Chungcheongbuk-do
KR, Chungcheongnam-do
KR, Jeollabuk-do
KR, Jeollanam-do
KR, Gyeongsangbuk-do
KR, Gyeongsangnam-do
0
0.5
1.0
Regi
onal
with
in-fi
rm va
rianc
e in
techn
olog
y sop
histi
catio
n (A
BF)
6 7 8 9 10 11 12Log of regional productivity
IN, Uttar Pradesh
VT, Region 4
KE, other regions
MW, Blantyre
GH,Western
GH, Ashanti
To better illustrate this point, panel b of figure 2.13 presents the estimated probability
of firms using digital and frontier technologies. It includes the use of the internet and
computers, as general-purpose technologies (GPTs), Excel and ERP used for business
administration, as GBFs, as well as four frontier sector-specific business function (SBF)
technologies used by food-processing firms: computer testing such as chromatography or
spectroscopy used for “input testing”; power equipment controlled by computers or
robotics for “cooking, mixing, and blending”; advanced methods such as high-pressure
processing used as an antibacterial process for “preserving”; and machines fully auto-
mated with robotics used for “packaging.” The probability of using the internet, comput-
ers, and Excel follows a similar shape, suggesting that most firms, except small ones, are
very likely to use these technologies. For the other advanced technologies, including ERP
and other frontier technologies for SBFs—all of them with advanced digital compo-
nents—there is a significant gap between small (late adopter) and large (early adopter)
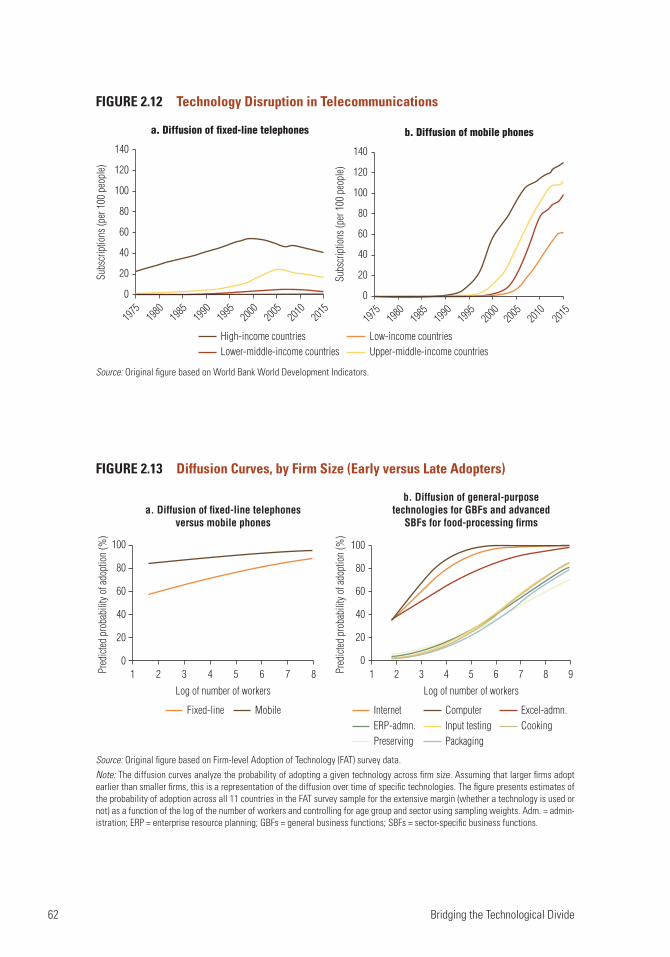
62 Bridging the Technological Divide
FIGURE 2.12 Technology Disruption in Telecommunications
Source: Original figure based on World Bank World Development Indicators.
High-income countriesLower-middle-income countries
Low-income countriesUpper-middle-income countries
0
1975
1980
1985
1990
1995
2000
2005
2010
2015
20
40
60
80
100
120
140
Subs
crip
tions
(per
100
peo
ple)
a. Diffusion of fixed-line telephones b. Diffusion of mobile phones
Subs
crip
tions
(per
100
peo
ple)
0
1975
1980
1985
1990
1995
2000
2005
2010
2015
20
40
80
60
100
120
140
FIGURE 2.13 Diffusion Curves, by Firm Size (Early versus Late Adopters)
Source: Original figure based on Firm-level Adoption of Technology (FAT) survey data.Note: The diffusion curves analyze the probability of adopting a given technology across firm size. Assuming that larger firms adopt earlier than smaller firms, this is a representation of the diffusion over time of specific technologies. The figure presents estimates of the probability of adoption across all 11 countries in the FAT survey sample for the extensive margin (whether a technology is used or not) as a function of the log of the number of workers and controlling for age group and sector using sampling weights. Adm. = admin-istration; ERP = enterprise resource planning; GBFs = general business functions; SBFs = sector-specific business functions.
a. Diffusion of fixed-line telephonesversus mobile phones
2 31 4 5 6 7 80
40
20
60
80
100
Pred
icted
pro
babi
lity o
f ado
ptio
n (%
)
Log of number of workers
b. Diffusion of general-purposetechnologies for GBFs and advanced
SBFs for food-processing firms
Pred
icted
pro
babi
lity o
f ado
ptio
n (%
)
Log of number of workers
21 43 65 87 9
60
40
20
0
80
100
Fixed-line Mobile Excel-admn.Cooking
InternetERP-admn.Preserving
ComputerInput testingPackaging

Facts about Technology Adoption and Use in Developing Countries 63
firms. The curve has an S-shape—a pattern that is well established in the literature on
technology diffusion (Gort and Klepper 1982; Skinner and Staiger 2007).
Technology upgrading within firms is mostly a continuous process. While using
Excel—an old technology—for business administration closely follows the pattern of the
adoption of computers and the internet, there is still a large gap with respect to ERP,
which follows a pattern that is much closer to the sector-specific technologies. Low-cost
digital technologies (such as standard software or social media) are easily available to
perform some of the GBFs (such as standard software or apps for business administra-
tion tasks and online payments). By contrast, SBFs usually require more sophisticated
and customized application of digital technologies, usually embedded in expensive
machines—such as global positioning system (GPS) in tractors or equipment controlled
by computers for mixing and cooking. Despite some differences across sectors and tech-
nologies, these patterns tend to be consistent across most functions, where earlier adopt-
ers (larger firms) tend to move much more quickly in adopting and using more
sophisticated technologies. This topic is discussed further in chapters 3 and 5.
Fact 10. Firms with low levels of technology sophistication are overconfident about their technological capabilities.
An important element to explain delayed adoption of more sophisticated technologies
is the willingness to adopt. Entrepreneurs can have important biases against adoption.
For example, if entrepreneurs or managers believe that they are already adopting more
sophisticated technologies in relative terms, it is unlikely that they will invest in adopt-
ing new technologies. Then the question is whether firms are aware of their actual
technology gap.
To address this question, figure 2.14 compares the entrepreneurs’ self-assessment of
their technology level with the actual measurement index in the survey. The FAT survey
asks for a self-assessment of technology from 1 to 10 (here rescaled to 1 to 5), comparing the
respondent’s firm with other firms within the country (here distributed by quintiles).14, 15
Along the 45-degree line, the predicted technology sophistication of the manager
matches the actual level of sophistication. However, the results suggest that firms with
lower levels of technological capabilities are more likely to overestimate their technol-
ogy sophistication in relation to other firms.16 These results capture a type of behav-
ioral bias labeled reference group neglect (Camerer and Lovallo 1999) by which
entrepreneurs tend to underestimate their competitors’ abilities—in this case, techno-
logical capabilities. The importance of this type of bias, as described in chapter 6, is that
firms may not upgrade their technologies if they do not perceive that they need them
to compete. Thus, reference group neglect can act as a strong deterrent for technology
upgrading and firms’ take-up of policy support programs. Chapter 7 highlights the
important role of public-private partnerships to address this bias by providing infor-
mation and benchmarking to firms.

64 Bridging the Technological Divide
Source: Original figure based on Firm-level Adoption of Technology (FAT) survey data.Note: The orange line shows the quadratic fit with 95 percent confidence interval using sampling weights. GBF = general business function; SBF = sector-specific business function.
b. In relation to other firms in the country
1
2
3
4
5
Self-
asse
ssm
ent o
f tec
hnol
ogy
2 3 4 5
SBF technology index (intensive, quintiles)
FIGURE 2.14 Firms with Lower Levels of Technological Capabilities Tend to Overestimate Their Technological Sophistication
5
4
3
2
1
Self-
asse
ssm
ent o
f tec
hnol
ogy
2 3 4 5
GBF technology index (intensive, quintiles)
a. In relation to other firms in the country

Facts about Technology Adoption and Use in Developing Countries 65
Summing Up
This chapter has presented results from implementing the novel methodology pro-
posed by the FAT survey to measure technology adoption and use at the firm level in
11 countries over 51 regions and all income levels. The chapter provides a snapshot of
old and new stylized facts that characterize the process of technology adoption and use
in developing countries. The results open the black box of the firm (Demsetz 1997) and
describe previously poorly understood elements of diffusion of technology within the
firm. While previous work on the diffusion of technology within a firm focused on the
increase in the intensity of use of a specific technology (Battisti and Stoneman 2005) or
the diffusion across establishments, the data presented here also describe the process of
diffusion within the firm across business functions and tasks.
Some of the stylized facts uncovered were already known and complement more
macro facts presented in Comin and Hobijn (2004), especially around cross-country dif-
ferences in technology sophistication. In this volume, however, the findings are presented
from the point of view of the firm as the main decision-maker on whether to adopt a
technology and for what purpose. Other findings are novel, adding nuance and rigor to
the identification of existing technology gaps. Specifically, the chapter shows that:
1. Most firms in developing countries are far from the technology frontier.
2. More productive regions are closer to the technology frontier.
3. Advanced economies have many more sophisticated firms.
4. Technology sophistication varies significantly across business functions, and
differences across countries are not maintained at the business function level.
5. Scale and size are important in explaining technology sophistication. Larger
firms use more sophisticated technologies, but this scale effect varies across
technologies.
6. The largest technology gaps occur within countries, not between countries.
7. More productive regions have more dispersion in regional technology
sophistication.
8. There is a large variation in technology sophistication within firms, and it is
positively correlated with productivity.
9. Technology upgrading by firms is a continuous process. Leapfrogging
technologies is rare.
10. Firms with low levels of technological capabilities are overconfident about their
capabilities to adopt and use technology.
The granularity that this methodology provides by focusing on the business
function or task opens a promising new research and policy agenda regarding what
technologies matter most for performance and whether policies should focus equally
on all technologies. The data can also provide important insights about the differences
in technology adoption across sectors and their role in structural transformation.

66 Bridging the Technological Divide
These are all elements that have been largely explored with aggregated data, but lack-
ing strong micro foundations.
While this chapter has provided a general characterization of firm-level technology
adoption and use, the next few chapters focus on specific elements that merit further
analysis, such as sector differences, the impact of technology on performance, and the
role of technologies for firms’ resilience to shocks.
Notes
1. The chapter presents and analyzes data collected in 11 representative countries varying across income levels, world regions, and differences in technology adoption and use: Bangladesh, Brazil, Burkina Faso, Ghana, India, Kenya, the Republic of Korea, Malawi, Poland, Senegal, and Vietnam. The sample for each country is nationally representative, except for Brazil (covering only the state of Ceará) and India (covering only the states of Tamil Nadu and Uttar Pradesh). This chapter reports some original findings from Cirera et al. (2020a, 2020b).
2. The analysis considers the frontier to be above an average of 3.5, which loosely corresponds to firms utilizing digital technologies for most business functions and using some frontier technolo-gies in sector-specific business functions, and using those intensively. A score of 5.0 corresponds to the use of frontier technologies for all business functions, which in the FAT survey sample occurs for only two firms in Korea.
3. This finding is consistent with a literature that links further investments of frontier firms in tech-nology in sectors close to the technology frontier (Aghion et al. 2009).
4. Poland is excluded in figure 2.3 because productivity estimates were not available for cross- country comparison.
5. This high and positive correlation also provides ex post validation of the team’s measure of tech-nology sophistication, originally based on experts’ assessments.
6. The sampling frames providing the number of establishments for Kenya, Korea, Senegal, and Vietnam were provided by the respective national statistical offices, based on the latest establish-ment census available in the respective country.
7. Maloney and Zambrano (2021) develop a model of entrepreneurial capital and show the impor-tance of migrants in explaining the industrialization process in Latin America.
8. Cirera et al. (2020b) test this hypothesis for Brazil (the state of Ceará), Senegal, and Vietnam, and find first-order stochastic dominance among these countries.
9. This contrasts with empirical results that show large productivity dispersion in developing econ-omies (Hsieh and Klenow 2009) and suggests that what may be driving these differences are distortions that create the wedges in revenue total factor productivity (TFPR), which are larger in developing countries.
10. For more details about these results, see Cirera et al. (2020a).
11. Both fixed-line telephones and mobile phones have high sunk costs. Yet, the lower marginal cost of diffusion associated with mobile phones has disrupted the slow expansion of the previous existing market of fixed-line phones.
12. Large firms use more sophisticated technologies, as illustrated in figure 2.6. If one assumes that they were also faster to adopt—earlier adopters—the likelihood of leapfrogging can be repre-sented by the likelihood that a small firm will use a new technology compared to a large firm. If the probability is similar and the technology is new and sophisticated, that implies that small firms adopt quickly and can leapfrog.

Facts about Technology Adoption and Use in Developing Countries 67
13. Is the leapfrog pattern observed at the country level (figure 2.12) also observed for firms? A con-straint to address this question with FAT data is the lack of a time series that allows one to observe adoption of a given technology by firms over time. Yet, under the assumption that larger firms are earlier adopters, it is possible to observe the pattern of adoption across firm size as a continuum variable. Given that only one point in time in the data can be observed (around the latest year of figure 2.12), one would expect: (a) a gap between mobile and fixed-line telephone use, with firms being more likely to use mobile phones; and (b) a smaller gap between mobile and fixed-line phone use among earlier adopters (larger firms). Panel a of figure 2.13 suggests that both condi-tions hold. On average, a very large share of firms is using mobile phones for business purposes, and there is no significant difference across firm size, after controlling for other characteristics, such as country fixed effects.
14. The question also asks the firm to compare with firms that are global technology leaders in their sector of activity.
15. The self-assessment question is asked before any of the technology adoption questions to prevent any bias in the self-assessment from potential framing.
16. These results are similar when using the actual technology sophistication index instead of quin-tiles of the distribution of the index within countries.
References
Aghion, P., R. Blundell, R.Griffith, P. Howitt, and S. Prantl. 2009. “The Effects of Entry on Incumbent Innovation and Productivity.” Review of Economics and Statistics 91 (1): 20–32.
Battisti, G., and P. Stoneman. 2005. “The Intra-Firm Diffusion of New Process Technologies.” International Journal of Industrial Organization 23 (1): 1–22.
Bloom, N., and J. Van Reenen. 2007. “Measuring and Explaining Management Practices across Firms and Countries.” Quarterly Journal of Economics 122 (4): 1351–408.
Camerer, C., and D. Lovallo. 1999. “Overconfidence and Excess Entry: An Experimental Approach.” American Economic Review 89 (1): 306–18.
Cirera, X., D. Comin, M. Cruz, and K. M. Lee. 2020a. “Anatomy of Technology in the Firm.” NBER Working Paper 28080, National Bureau of Economic Research, Cambridge, MA.
Cirera, X., D. Comin, M. Cruz, and K. M. Lee. 2020b. “Technology within and across Firms.” CEPR Discussion Paper 15427, Center for Economic and Policy Research, Washington, DC.
Comin, D., and B. Hobijn. 2004. “Cross-Country Technology Adoption: Making the Theories Face the Facts.” Journal of Monetary Economics 51 (1): 39–83.
Demsetz, H. 1997. “The Firm in Economic Theory: A Quiet Revolution.” American Economic Review 87 (2): 426–29.
Gort, M., and S. Klepper. 1982. “Time Paths in the Diffusion of Product Innovations.” Economic Journal 92 (367): 630–53.
Grover, A., S. V. Lall, and W. F. Maloney. 2022. Place, Productivity, and Prosperity: Revisiting Spatially Targeted Policies for Regional Development. World Bank Productivity Project series. Washington, DC: World Bank.
Grover Goswami, A., D. Medvedev, and E. Olafsen. 2019. High-Growth Firms: Facts, Fiction, and Policy Options for Emerging Economies. World Bank Productivity Project series. Washington, DC: World Bank.
Hsieh, C.-T., and P. J. Klenow. 2009. “Misallocation and Manufacturing TFP in China and India.” Quarterly Journal of Economics 124 (4): 1403–48.
Maloney, W. F., and A. Zambrano. 2021. “Learning to Learn: Experimentation, Entrepreneurial Capital, and Development.” Policy Research Working Paper 9890, World Bank, Washington, DC.

68 Bridging the Technological Divide
Nayyar, G., M. Hallward-Driemeier, and E. Davies. 2021. At Your Service? The Promise of Services-Led Development. World Bank Productivity Project series. Washington, DC: World Bank.
Skinner, J., and D. Staiger. 2007. “Technology Adoption from Hybrid Corn to Beta-Blockers.” In Hard-to-Measure Goods and Services: Essays in Honor of Zvi Griliches, edited by E. R. Berndt and C. R. Hulten, 545–70. University of Chicago Press for the National Bureau of Economic Research.
Syverson, C. 2014. “The Importance of Measuring Dispersion in Firm-level Outcomes.” IZA World of Labor 53: 1–53.

69
3. Adoption of Sector-Specific Technologies
Introduction
This chapter provides a deep dive into differences in production technologies adopted
by firms in different sectors. Agriculture has been the focus of many studies of technol-
ogy in the empirical microeconomic literature.1 The effects of cutting-edge production
technologies have also captured the public imagination. Images of robots carrying out
large-scale manufacturing, drones engaged in agriculture, or automated delivery of
goods and services appear in any discussion of Industry 4.0 and frontier technologies.
But as described in chapters 1 and 2, this advanced state of technology is not the reality
for most firms, particularly in developing countries. Connecting policy makers with
the reality of technology used in production is important for identifying and defining
key policy priorities that are feasible and relevant in a given context.2
A key challenge for measuring and comparing production technologies is that they
are usually specific to particular sectors because they implement sector-specific busi-
ness functions (SBFs). For example, while land preparation and irrigation are core
functions for agriculture, weaving is for apparel, and cooking is for food processing.
The Firm-level Adoption of Technology (FAT) survey takes these variations across sec-
tors into account. It not only measures technologies adopted to perform tasks that are
common across all firms (general business functions, GBFs) such as business adminis-
tration and payment, but it also collects data for sector-specific business functions that
reflect technology use in core production processes or provisions of services in selected
sectors. To account for the fact that the range and sophistication of technologies
available—the technology domain—is different in each sector and business function,
these sector-specific measures are normalized to the technology frontier in each busi-
ness function. This provides a comparable measure of sophistication that is relative to
the relevant technologies available in each function.
Sector-specific technology measures can also inform the discussion about outsourc-
ing, which is an important aspect of economic development.3 A firm’s decision to out-
source a sector-specific task is related to the availability and cost of technologies and
the overall capabilities of the firm to perform the task or outsource it. The FAT survey
asks whether the business function is performed by the establishment, insourced to
another establishment of the same firm, or outsourced. This level of detail allows for
further investigation in this topic.

70 Bridging the Technological Divide
The survey covers firms and SBFs in agriculture, manufacturing, and services. Thus,
it can analyze the relative technological gap in different sectors within those broad
industries, and differences in the process of technology upgrading, including leapfrog-
ging. Specifically, this chapter explores the following questions:
■■ Where do firms in specific sectors stand with respect to the technology frontier
for technologies they apply to general business functions (GBF technologies)
and sector-specific business functions (SBF technologies)?
■■ Is leapfrogging commonly observed for sector-specific technologies?
■■ What is the relationship between technology adoption and outsourcing in
sector-specific business functions?
Technology Differences across and within Sectors
Are the differences in technology sophistication observed across sectors driven by GBF
technologies or SBF technologies? As the previous chapter discussed, with respect to
GBFs, manufacturing is not the sector with the most sophisticated use of technology in
most countries in the sample, particularly upper-middle-income countries, such as
Brazil and Vietnam, and those with high per capita income levels, such as the Republic
of Korea. With respect to SBFs, agricultural firms in the FAT sample tend to be closer to
the technology frontier than manufacturing and services firms. The technology gap
between agriculture, manufacturing, and services tends to be larger for SBFs. These
differences can be partly attributed to the fact that while the GBF measure captures the
same functions and technologies for each firm, the SBF measure provides a compari-
son that is relative to specific frontiers, and the technology domains can be different.
For sector-specific technologies, figure 3.1 shows the cross-country differences for
four sectors: agriculture (crops and livestock); food processing; wearing apparel; and
wholesale and retail services. The patterns across countries are similar in terms of rank-
ings of technology sophistication. The patterns for food processing and apparel are
very similar (panels b and c), and there is less of a difference across countries for whole-
sale and retail services (panel d). In general, sophistication of technologies in services
appears to be more equal across countries on average than for other sectors.
Another important dimension of sector-specific technology is the variance of
technologies across business functions within sectors. As shown in chapter 2, there is
large variation in the use of GBF technologies. The discussion that follows provides a deep
dive into differences within sectors and SBF technologies in agriculture, manufacturing—
including two manufacturing activities of particular interest for developing countries, food
processing and wearing apparel—and retail activities in the services sector.
Agriculture
Agricultural firms face larger technology gaps with respect to the frontier in some gen-
eral and sector-specific business functions than manufacturing or services firms face.

Adoption of Sector-Specific Technologies 71
Firms tend to apply more sophisticated technologies to perform sector-specific core
functions and low levels of digitalization to perform GBFs. Figure 3.2 compares an
average agricultural firm in Brazil (state of Ceará), Kenya, and Senegal. It shows a con-
sistent pattern across countries, suggesting a smaller distance to the frontier for SBFs
than for GBFs. For example, the relative technology sophistication in irrigation is closer
to the frontier than in management and customer-related technologies (such as in
marketing and sales).
Many agricultural firms use relatively advanced technologies in irrigation, while using
very basic methods for storage or packaging. Photo 3.1 provides an example of a small
agricultural establishment located near Dakar, Senegal. It uses a drip irrigation system
(panel a), while relying on the most basic option for storage (defined by the FAT survey
questionnaire as “precarious facilities, with products totally or partially exposed to sun,
rain, and wind”) (panel b). These photos capture the typical reality of an average agricul-
tural establishment with 5 or more workers in Senegal—particularly among informal
firms, and reflect the heterogeneity of technology across business functions within firms.4
FIGURE 3.1 Firms in Agriculture Tend to Use More Sophisticated Technologies in Sector-Specific Business Functions
Source: Original figure based on Firm-level Adoption of Technology (FAT) survey data. Note: Technology index estimates controlling for size of the firm and age groups using sampling weights. GBF = general business function; SBF = sector-specific business function.
GBF SBF
1.0
0.5
0
0.5
0
1.5
2.0
2.5
3.0
Tech
nolo
gy in
dex
Tech
nolo
gy in
dex
1.0
1.5
2.0
2.5
3.0
Brazil
Burkina
Faso
Ghana
Kenya
a. Agriculture (crops and livestock) b. Food processing
Korea, R
ep.
Poland
Senegal
Vietnam
Banglad
eshBraz
il
Burkina
Faso
Ghana
India
Kenya
Korea, R
ep.
Malawi
Poland
Senegal
Vietnam
Tech
nolo
gy in
dex
Tech
nolo
gy in
dex
c. Wearing apparel d. Wholesale and retail services
1.0
0.5
0
0.5
0
1.5
2.0
2.5
3.0
1.0
1.5
2.0
2.5
3.0
Banglad
esh Brazil
Burkina
Faso
Ghana
India
Kenya
Korea, R
ep.
Poland
Senegal
Vietnam Braz
il
Burkina
Faso
Ghana
India
Kenya
Korea, R
ep.
Malawi
Poland
Senegal
Vietnam

72 Bridging the Technological Divide
FIGURE 3.2 The Technology Gaps Are Larger in General Business Functions in Agriculture Compared to Sector-Specific Business Functions
Source: Original figure based on Firm-level Adoption of Technology (FAT) survey data.Note: The figure covers three countries: Brazil (only the state of Ceará), Kenya, and Senegal. Technology index based on FAT survey using sampling weights.
KenyaCeará, Brazil Senegal
b. Sector-specific business functionsa. General business functions
Land preparation
Irrigation
Weeding
Harvesting
Storage
Packaging
12345
Business administration
Planning
Sourcing
MarketingSales
Payment
Quality control
12345
Manufacturing
Most manufacturing firms in developing countries are far from using advanced fabri-
cation technologies, such as robots or 3D printers (figure 3.3). Yet the experiences of
firms in advanced economies are often projected onto firms in developing countries,
citing the extraordinary advances (leapfrogging) made with cell phones or anecdotes
about exceptional firms. The reality of most manufacturing firms in developing
countries is far from Industry 4.0. On average, 83 percent of businesses use manual
PHOTO 3.1 Technologies Used for Irrigation and Storage in Senegal Vary Greatly in Sophistication
Source: World Bank.Note: Photos taken during the pilot of the Firm-level Adoption of Technology (FAT) survey in Senegal of a one-acre farm with eight workers.
a. Irrigation b. Storage

Adoption of Sector-Specific Technologies 73
FIGURE 3.3 Technology Sophistication for Fabrication in Manufacturing Is Low in Developing Countries
Share of firms
Source: Original figure based on Firm-level Adoption of Technology (FAT) survey data. Note: Average estimates across all 11 countries in the FAT survey sample using sampling weights. The extensive margin captures the share of firms using a technology. The intensive margin refers to the share of firms for which the technology is the most frequently used for fabrication.
20
0
40
60
80
100a. Extensive margin
Perc
ent
Manual Machineoperators
Machine/computers
Robots 3D printing Other advancedmanufacturing
Other
b. Intensive margin
29.1%
54.2%
14.7%
1.0%0.5%
0.5%
Manual Machine operators Machine/computers Robots 3D printingOther advanced manufacturing Other
processes or machines that are manually operated to fabricate their main product at the
intensive margin, but there are important variations across sectors (see box 3.1). Photo
3.2 shows a manual procedure for filling the bottle used by a food-processing business
in Bangladesh. Although this is not the stereotype of a manufacturing firm, the data
suggest that similar methods are indeed the most frequently used by firms in Bangladesh
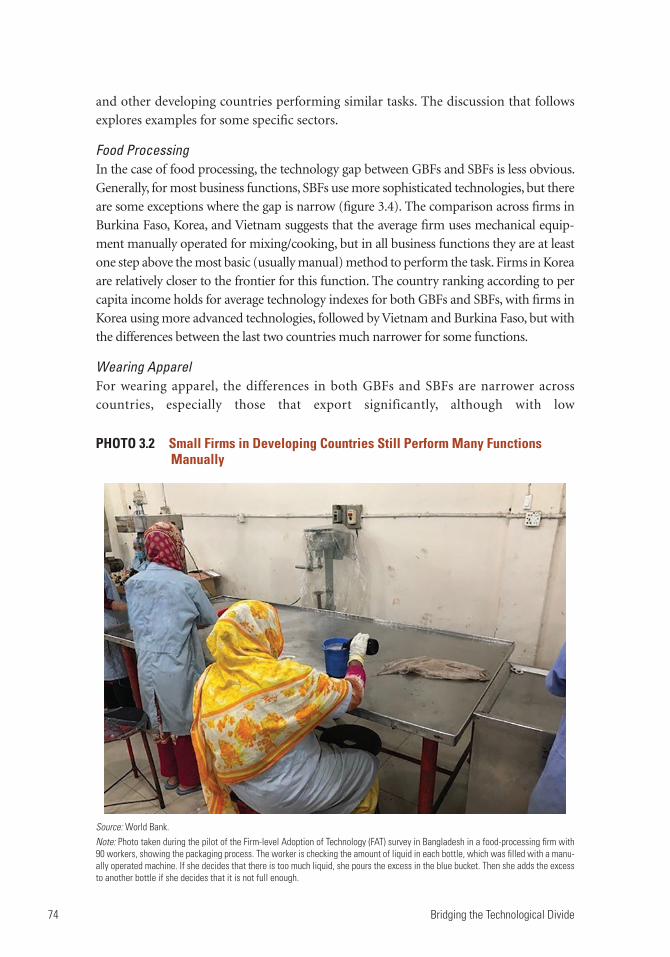
74 Bridging the Technological Divide
PHOTO 3.2 Small Firms in Developing Countries Still Perform Many Functions Manually
Source: World Bank.Note: Photo taken during the pilot of the Firm-level Adoption of Technology (FAT) survey in Bangladesh in a food-processing firm with 90 workers, showing the packaging process. The worker is checking the amount of liquid in each bottle, which was filled with a manu-ally operated machine. If she decides that there is too much liquid, she pours the excess in the blue bucket. Then she adds the excess to another bottle if she decides that it is not full enough.
and other developing countries performing similar tasks. The discussion that follows
explores examples for some specific sectors.
Food ProcessingIn the case of food processing, the technology gap between GBFs and SBFs is less obvious.
Generally, for most business functions, SBFs use more sophisticated technologies, but there
are some exceptions where the gap is narrow (figure 3.4). The comparison across firms in
Burkina Faso, Korea, and Vietnam suggests that the average firm uses mechanical equip-
ment manually operated for mixing/cooking, but in all business functions they are at least
one step above the most basic (usually manual) method to perform the task. Firms in Korea
are relatively closer to the frontier for this function. The country ranking according to per
capita income holds for average technology indexes for both GBFs and SBFs, with firms in
Korea using more advanced technologies, followed by Vietnam and Burkina Faso, but with
the differences between the last two countries much narrower for some functions.
Wearing Apparel For wearing apparel, the differences in both GBFs and SBFs are narrower across
countries, especially those that export significantly, although with low

Adoption of Sector-Specific Technologies 75
BOX 3.1
The Strong Sector Composition of the Use of Industry 4.0 Technologies
The world is undergoing a significant technological transformation. Some are calling it the fourth industrial revolution (Schabb 2016) or Industry 4.0, while others see this process as a continuation of the information and communication technology (ICT) revolution. The term “Industry 4.0” originated with a project led by the German government promoting the computerization of manufacturing. It is associated with a new industrial revolution, characterized by the adoption of cyber-physical systems such as robotics and drones, 3D printing, artificial intelligence (AI), and machine learning across all sectors of the economy, reshaping both the way in which and where manufacturing is done.
While Industry 4.0 is a concept that extends broadly across manufacturing activities, some of its technologies are very sector specific. In the case of robotics and despite the hype around it, most of the adoption of this technology has been concentrated in the motor vehicles and electronics sectors, although it is increasingly becoming more relevant to other manufacturing activities, data from the International Federation of Robotics suggest. Results from the Firm-level Adoption of Technology (FAT) survey also show this allocation of robots across sectors. Firms in the motor vehicles sector are signifi-cantly more likely to use robots than firms in other manufacturing sectors (see figure B3.1.1). Moreover, in sectors such as apparel and leather, 3D printing is a more relevant technology than robots.
FIGURE B3.1.1 The Likelihood of Adopting Advanced Manufacturing Technologies Varies Widely across Sectors
Source: Original figure based on Firm-level Adoption of Technology (FAT) survey data.Note: Average estimates across all 11 countries in the FAT survey sample using sampling weights, except for motor vehicles (excluding data from Bangladesh and Senegal) and pharmaceuticals (excluding data from Brazil and Senegal).
20
15
10
Prob
abili
ty of
adop
ting
(%)
5
0Motor vehicles Food processing Pharmaceuticals Apparel/leather
Robots 3D printing Other advanced manufacturing
(Box continues on the following page.)
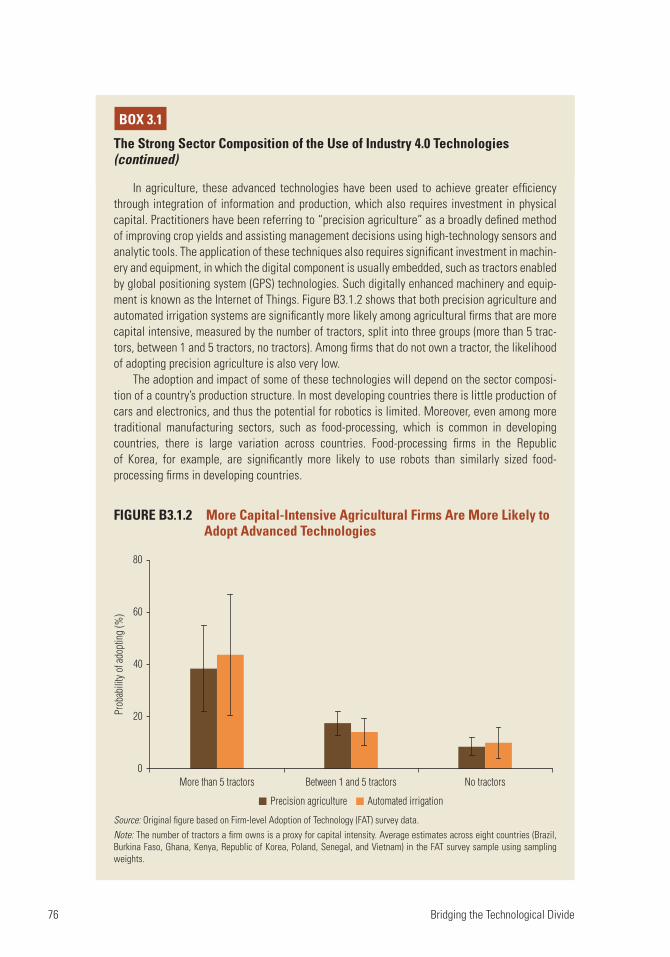
76 Bridging the Technological Divide
In agriculture, these advanced technologies have been used to achieve greater efficiency through integration of information and production, which also requires investment in physical capital. Practitioners have been referring to “precision agriculture” as a broadly defined method of improving crop yields and assisting management decisions using high-technology sensors and analytic tools. The application of these techniques also requires significant investment in machin-ery and equipment, in which the digital component is usually embedded, such as tractors enabled by global positioning system (GPS) technologies. Such digitally enhanced machinery and equip-ment is known as the Internet of Things. Figure B3.1.2 shows that both precision agriculture and automated irrigation systems are significantly more likely among agricultural firms that are more capital intensive, measured by the number of tractors, split into three groups (more than 5 trac-tors, between 1 and 5 tractors, no tractors). Among firms that do not own a tractor, the likelihood of adopting precision agriculture is also very low.
The adoption and impact of some of these technologies will depend on the sector composi-tion of a country’s production structure. In most developing countries there is little production of cars and electronics, and thus the potential for robotics is limited. Moreover, even among more traditional manufacturing sectors, such as food-processing, which is common in developing countries, there is large variation across countries. Food-processing firms in the Republic of Korea, for example, are significantly more likely to use robots than similarly sized food- processing firms in developing countries.
BOX 3.1
The Strong Sector Composition of the Use of Industry 4.0 Technologies (continued)
Source: Original figure based on Firm-level Adoption of Technology (FAT) survey data.Note: The number of tractors a firm owns is a proxy for capital intensity. Average estimates across eight countries (Brazil, Burkina Faso, Ghana, Kenya, Republic of Korea, Poland, Senegal, and Vietnam) in the FAT survey sample using sampling weights.
FIGURE B3.1.2 More Capital-Intensive Agricultural Firms Are More Likely to Adopt Advanced Technologies
80
60
40
Prob
abili
ty of
adop
ting
(%)
20
0More than 5 tractors Between 1 and 5 tractors No tractors
Precision agriculture Automated irrigation

Adoption of Sector-Specific Technologies 77
sophistication (figure 3.5). Design and ironing are the SBFs for which the most
firms are using manual processes. Firms in Bangladesh are particularly advanced in
the use of more sophisticated sewing machines, compared to firms in Vietnam,
while firms in Vietnam use more advanced technologies for GBFs, particularly pay-
ment and sales, on average. The pattern observed in Bangladesh could be explained
by a large insertion of their firms in global value chains for apparel, with
more specialization in sewing tasks. This proximity of the technology across the
average firm is not observed in other manufacturing sectors integrated into global
value chains, such as pharmaceutical products (see box 3.2).
Source: Original figure based on Firm-level Adoption of Technology (FAT) survey data.Note: Technology measures using sampling weights.
FIGURE 3.4 Differences in Technology across Countries Roughly Follow Income Differences in the Food-Processing Sector
Input testing
Mixing/cooking
Antibacterial processesPackaging
Food storage
12
45
b. Sector-specific business functions
Business administration
a. General business functions
Planning
Sourcing
MarketingSales
Payment
Quality control
12345
3
Korea, Rep. VietnamBurkina Faso
FIGURE 3.5 Cross-Country Comparisons in Wearing Apparel Are Not So Large among Exporter Countries
Business administrationa. General business functions
Planning
Sourcing
MarketingSales
Payment
Quality control
12345
b. Sector-specific business functionsDesign
Cutting
Sewing
Ironing12345
Korea, Rep. VietnamBangladesh
Source: Original figure based on Firm-level Adoption of Technology (FAT) survey data. Note: Technology measures using sampling weights.

78 Bridging the Technological Divide
Services–Retail
Most firms in retail are still at an early stage of digitalization applied to sector-specific
tasks (figure 3.6). The gap between average firms across countries, comparing Kenya,
Korea, and Vietnam, is wider among GBFs than SBFs in retail. Even if they adopt digital
technologies, they do not use them intensively. Retail is an important activity of the
services sector for developing countries because it usually represents a large share of
formal establishments and employment. Most firms in retail still rely on manual tech-
nologies as the most frequently used method to perform tasks related to customer
service, pricing, merchandising, inventory, and advertisement. Yet, the use of low-cost
digital technologies is increasing in the extensive margin.
BOX 3.2
The Closeness of Pharmaceutical Firms to the Technology Frontier
Pharmaceutical manufacturing firms in high-income countries tend to be close to the frontier for sector-specific business function (SBF) technologies. This sector became particularly relevant in the context of the COVID-19 pandemic. Figure B3.2.1 shows that, on average, firms in Poland are closer to the technology frontier in general business functions (GBFs) and most SBFs compared to India (based on the states of Tamil Nadu and Uttar Pradesh). India plays an important role as a global exporter in pharmaceutical products. Exports from India for pharmaceutical products repre-sented 3 percent of global value exported in 2020—considerably larger than the share from Poland (0.7 percent) or Vietnam (0.4 percent), data compiled by the Observatory of Economic Complexity suggest. Yet, results from the Firm-level Adoption of Technology (FAT) survey show that there is still significant room for an average pharmaceutical firm in India to upgrade its technology.
FIGURE B3.2.1 Pharmaceutical Firms Are Relatively Close to the Technology Frontier, but There Is Significant Room for Improvement in Developing Countries
Source: Original figure based on Firm-level Adoption of Technology (FAT) survey data.Note: Data for India are for two states only: Tamil Nadu and Uttar Pradesh. Technology measures using sampling weights.
PolandIndia Vietnam
Business administrationa. General business functions
Planning
Sourcing
MarketingSales
Payment
Quality control
12345
Facilities
Dispensing
Mixing
Encapsulation
Qualitycontrol
Packaging
12345
b. Sector-specific business functions

Adoption of Sector-Specific Technologies 79
Technology Upgrading and the Limits to Leapfrogging
Sector-Specific Technology Upgrading as a Continuous Process
Do certain technologies allow firms to skip some stages of technology upgrading and
jump from the most basic to the most sophisticated technologies? This question is
often asked by policy makers and is often part of the policy discussions related to the
potential of digital technologies.
Firms face many challenges to leapfrog in sector-specific technologies. As described
in chapter 2, given the lack of information over time in the FAT survey, the analysis
assumes that larger firms are earlier adopters. Based on this assumption and the fact
that more sophisticated technologies covered in the FAT survey tend to be relatively
newer than more basic technologies, two conditions for leapfrogging might be expected.
First, the predicted likelihood for leapfrogging with more sophisticated technologies
would occur on top of the diffusion of more basic technologies for smaller firms (late
adopters). Second, the gap between earlier adopters (large firms) and later adopters
(small firms) would be relatively small, with a high likelihood of adoption for all firms.
In addition, the probability of using technologies that are obsolete or are being phased
out would decrease over firm size.
There is no clear evidence of leapfrogging in sector-specific technologies. Figure 3.7
shows the predicted probability of adoption of technologies by firm size—the diffusion
curves—with different levels of sophistication for sector-specific business functions in
agriculture (weeding and harvesting, panels a and b), wearing apparel (design and
sewing, panels c and d), and retail (pricing and merchandising, panels e and f).
FIGURE 3.6 Digitalization of Sector-Specific Business Functions Is at an Early Stage in Retail Services
Source: Original figure based on Firm-level Adoption of Technology (FAT) survey data. Note: Technology measures using sampling weights.
Korea, Rep. VietnamKenya
Business administration
a. General business functions
Planning
Sourcing
MarketingSales
Payment
Quality control
b. Sector-specific business functions
Advertisement
Customer service
Pricing
MerchandisingInventory
12345
12345

80 Bridging the Technological Divide
FIGURE 3.7 The Diffusion Curves of Newer Sector-Specific Technologies Do Not Suggest Leapfrogging
80
60
40
20
0
100
a. Agriculture—weeding and pest control
b. Agriculture—harvesting, training, pruning
80
60
40
20
0
100
Pred
icted
pro
babi
lity (
%)
1 2 3 4 5 6 7 8 9 10
Log of number of workers
Manual Mechanical Biological methods Fully automated variable rateapplication
Drone application
Pred
icted
pro
babi
lity (
%)
1 2 3 4 5 6 7 8 9 10
Log of number of workers
Manual harvesting Animal-aided Human-operated machinesMechanized process Automated process
(Figure continues on the following page.)

Adoption of Sector-Specific Technologies 81
FIGURE 3.7 The Diffusion Curves of Newer Sector-Specific Technologies Do Not Suggest Leapfrogging (continued)
(Figure continues on the following page.)
1 2 3 4 5 6 7 8 9
Log of number of workers
10
Manual Digital 2D Computer-aided design (CAD)/3D
1 2 3 4 5 6 7 8 9 10
Log of number of workers
Manual sewing Machine sewing manually operated Semi-automated sewing machinesAutomated 3D knitting
80
60
40
20
0
100
c. Wearing apparel—design
d. Wearing apparel—sewing
Pred
icted
pro
babi
lity (
%)
80
60
40
20
0
100
Pred
icted
pro
babi
lity (
%)
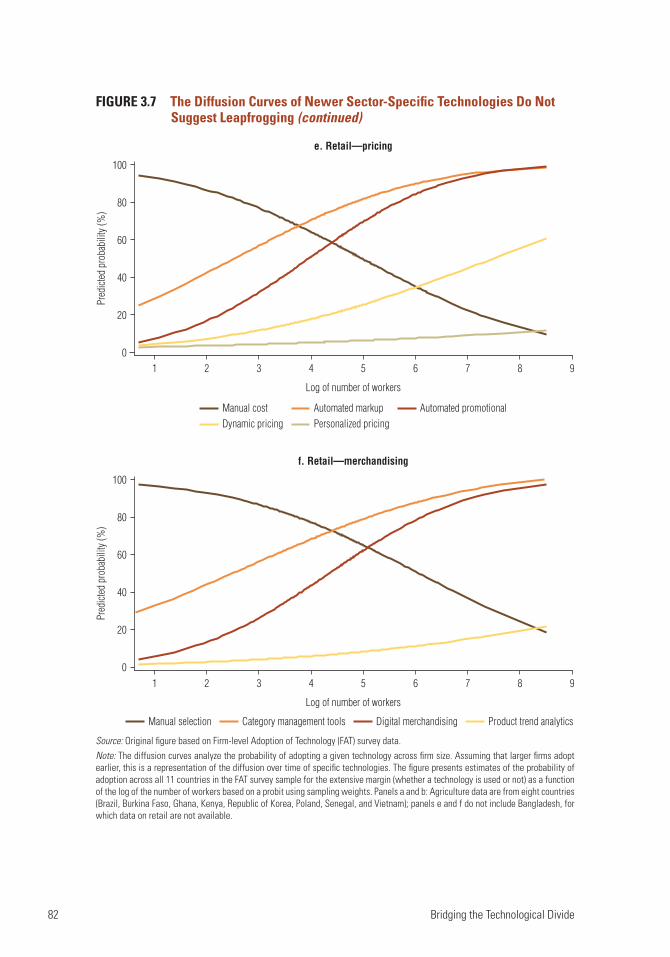
82 Bridging the Technological Divide
Source: Original figure based on Firm-level Adoption of Technology (FAT) survey data. Note: The diffusion curves analyze the probability of adopting a given technology across firm size. Assuming that larger firms adopt earlier, this is a representation of the diffusion over time of specific technologies. The figure presents estimates of the probability of adoption across all 11 countries in the FAT survey sample for the extensive margin (whether a technology is used or not) as a function of the log of the number of workers based on a probit using sampling weights. Panels a and b: Agriculture data are from eight countries (Brazil, Burkina Faso, Ghana, Kenya, Republic of Korea, Poland, Senegal, and Vietnam); panels e and f do not include Bangladesh, for which data on retail are not available.
FIGURE 3.7 The Diffusion Curves of Newer Sector-Specific Technologies Do Not Suggest Leapfrogging (continued)
Pred
icted
pro
babi
lity (
%)
1 2 3 4 5 6 7 8 9
Log of number of workers
Manual cost Automated markup Automated promotionalDynamic pricing Personalized pricing
1 2 3 4 5 6 7 8 9
Log of number of workers
Manual selection Category management tools Digital merchandising Product trend analytics
e. Retail—pricing
f. Retail—merchandising
80
60
40
20
0
100
Pred
icted
pro
babi
lity (
%)
80
60
40
20
0
100

Adoption of Sector-Specific Technologies 83
These functions have in common the fact that they can be performed manually
(the most basic option), but the most sophisticated technology is digital. As figure 3.7
shows, manual technologies are becoming obsolete at different speeds: obsolescence is
occurring more slowly in agriculture than in retail and in manufacturing.
The results are consistent across most business functions in the FAT data. They
support the hypothesis that technology upgrading is mostly a continuous process,
and the speed of upgrading for newer and more sophisticated technologies is slow.
The likelihood of adopting more sophisticated technologies increases with firm
size, following the order of sophistication of the technologies available. There are
two exceptions. The use of manual methods for harvesting (agriculture) is not
associated with firm size. The use of manually operated machines for sewing (wear-
ing apparel) follows a pattern similar to manual processes in general.5 In agricul-
ture, most of the frontier technologies are linked to the Internet of Things (IoT)
and the use of the global positioning system (GPS), which is embedded in frontier
technologies for weeding or harvesting, for example. Upgrading to these technolo-
gies has been very slow. For some frontier technologies, although the cost of adop-
tion might be low for replication of the necessary software, they still require
expensive equipment, good infrastructure, and/or high levels of capabilities. Thus,
there might be opportunities for leapfrogging in a few technologies, but they tend
to be rare.
Can Digital Platforms Support Leapfrogging in Sector-Specific Technologies?
Most peer-to-peer platforms focus on providing solutions that are more applicable
to general business functions (such as sales and payment). But there are some inter-
esting experiences built on the concept of the “sharing economy” that are trying to
reduce transaction costs and improve access to more sophisticated and efficient
equipment and machines applied to SBFs in agriculture. A well-known example is
“Hello Tractor,” an innovative digital platform based in Kenya that aims to connect
tractor owners to smallholder farmers searching for tractor service, resembling
breakthrough platforms like Uber. Such platforms, if successful, can help small firms
use more sophisticated technologies without bearing the full cost of upgrading.
The question is, therefore, when available, how often is this type of digital solution
being used?
Consider an illustration. Renting tractors was a common practice among farmers
before such digital platforms became available. This market has three important
characteristics: (1) the equipment is easily mobile; (2) there is seasonality in agricul-
tural activities that imply time peaks in use; and (3) the equipment is needed for a
limited period of time. This leads to allocation and coordination problems (for
example, the owner of a tractor could benefit from renting it in a period the machine
is not being used; or the acquisition of the machine is justified only if used by a group

84 Bridging the Technological Divide
of farmers). This is a sort of problem that can be efficiently addressed through better
(and cheaper) access to information through digital platforms if it is widely used by
actors interested in this market exchange.
Cross-country data for Brazil, Kenya, Senegal, and Vietnam suggest that on average 37
percent of establishments in agriculture (with 5 or more workers) rent tractors. Kenya has
the largest share of tractors rented (55 percent) as well as the largest share of tractors
rented through a digital platform. Among the establishments that report that they rent a
tractor, 37 percent use digital platforms, compared to 8 percent in Senegal, and none in
Brazil or Vietnam. Panel a of figure 3.8 shows a positive relationship between owning a
tractor and the level of a firm’s technology sophistication, controlling for the size of the
firm. This correlation is also positive and significant for renting, with a smaller coefficient,
and positive but not significant if the rental is through a digital platform. Panel b shows
the estimated probability of owning or renting a tractor by firm size. Small firms are sig-
nificantly more likely to rent a tractor than own it, and this is potentially an important
segment that could benefit from digital platforms. Yet, results based on FAT data suggest
that large firms are significantly more likely to rent tractors through digital platforms.6
These results do not imply a causal relationship and do not exclude the hypothesis
that under some conditions, digital platforms could improve the efficiency in the allo-
cation of existing resources to facilitate technology adoption—and potentially help
with leapfrogging. But as noted, there are several characteristics that are very specific to
this market and are unlikely to apply to other technologies.
Tractor (owned)
a. Type of access to tractor and harvesting
Tractor (rented) Tractor (rented—digital)
SBF EXT SBF INT
−0.4
−0.2
0
0.2
0.4
0.6
0.8
1.0
1.2
1.4
Coeffi
cient
FIGURE 3.8 Tractor Ownership, Renting, and Digital Renting Do Not Suggest Leapfrogging through Digital Platforms
(Figure continues on the following page.)

Adoption of Sector-Specific Technologies 85
b. Probability of using tractor, by firm size
Tractor (owned) Tractor (rented) Tractor (rented—digital)
Small Medium Large Small Medium Large Small Medium Large
60
40
20
0
Prob
abili
ty (%
)
Firm size Firm sizeFirm size
FIGURE 3.8 Tractor Ownership, Renting, and Digital Renting Do Not Suggest Leapfrogging through Digital Platforms (continued)
Source: Original figure based on Firm-level Adoption of Technology (FAT) survey data.Note: Estimation using sampling weights for Brazil, Burkina Faso, Ghana, Kenya, Republic of Korea, Poland, Senegal, and Vietnam. In panel a, SBF EXT refers to the extensive margin of the sector-specific business function; SBF INT refers to the intensive margin. In panel b, firm size refers to the number of workers: small (5–19), medium (20–99), and large (100 or more).
Specialization, Technology, and Outsourcing
For some tasks, firms face a choice between outsourcing or performing it internally
(in house), and if done in house, investing in a specific technology or delaying adop-
tion.7 These decisions are affected by the technologies available,8 but the boundaries of
the firm, which define what tasks are conducted within or outside the firm (Coase
1937; Williamson 1981), are also critically important in the process of technology
adoption: how specialized the firm is; what its core functions are; the scale of its opera-
tions; what markets it serves; and so on. A first-order question is what are the particular
tasks and functions that a firm needs to implement as it transforms resources in its
production process—what Demsetz (1997) called the “black box” of the firm.
As the world becomes more globalized, firms are becoming more integrated in
global value chains (GVCs) and specializing in particular tasks (Taglioni and Winkler
2016; World Bank 2020). GVCs are not only present in manufacturing; they have also
expanded rapidly in services and are important in agriculture. But manufacturing
activities, particularly those that are capital intensive (such as in basic metals and
chemicals), are driving participation in GVCs. Among manufacturing activities, three
low-end manufacturing sectors are of particular interest for developing countries: food

86 Bridging the Technological Divide
processing; wearing apparel; and leather and footwear. These are sectors for which the
entry costs are relatively lower and labor cost advantages are more important. They
have been often the entry point for a country’s industrialization process. The FAT sur-
vey data allow us to identify what sector-specific functions firms in these sectors have
outsourced, and investigate whether this has any association with levels of technology
adopted, insertion in GVCs, and economies of scale.
To start, there is a large variation in outsourcing decisions across sectors. Figure 3.9
shows that outsourcing in sector-specific business functions is not uncommon in vari-
ous sectors, even in developing countries. On average, 11 percent of firms outsource
some core functions. In some sectors, such as livestock, this figure reaches almost 40
percent of firms. In other sectors, such as health care, it is hard for firms to outsource
core functions given the way the service is delivered.
A deep dive in two important manufacturing sectors—wearing apparel and food
processing—reveals interesting differences across business functions in the sectors.
FIGURE 3.9 Across Sectors, There Is Large Heterogeneity in Outsourcing Sector-Specific Business Functions
Source: Original figure based on Firm-level Adoption of Technology (FAT) survey data. Note: The figure covers all 11 countries in the FAT survey sample. Estimates of outsourcing using sampling weights, except for the fol-lowing categories: accommodation (excluding Bangladesh, Brazil, Malawi, Senegal, and Vietnam); agriculture–crops (excluding Bangladesh, India, and Malawi); motor vehicles (excluding Bangladesh and Senegal); financial services (excluding Bangladesh, Brazil, and Burkina Faso); leather and footwear (excluding Brazil, Malawi, and Senegal); livestock (excluding Bangladesh, India, and Malawi); pharmaceuticals (excluding Brazil and Senegal); transportation (excluding Bangladesh); and wholesale and retail (excluding Bangladesh).
Agriculture–crops
Livestock
Food processing
Wearing apparel
Motor vehicles
Pharmaceuticals
Wholesale and retail
Financial services
Transportation
Health services
Leather and footwear
Accommodation
All firms
0 10
Percent of firms outsourcing at least one sector-specific business function
20 30 40 50 60

Adoption of Sector-Specific Technologies 87
FIGURE 3.10 Within Sectors, There Is Heterogeneity in the Degree of Outsourcing within Sector-Specific Business Functions
Source: Original figure based on Firm-level Adoption of Technology (FAT) survey data. Note: The panels cover all 11 countries in the FAT survey sample. Estimates of outsourcing using sampling weights.
a. Food processing
Input testing
Mixing/blending/cooking
Antibacterial processes
Packaging
Food storage
Overall
0 5 10 15 20
Percent of firms outsourcing at least one sector-specific business function
b. Wearing apparel
Design
Cutting
Sewing and joining parts
Finishing—ironing
Overall
0 5 10 15 20 25
Percent of firms outsourcing at least one sector-specific business function
About 18 percent of firms in wearing apparel outsource at least one sector-specific
function, while only 12 percent of firms do in food processing. This ranking, whereby
firms in apparel are more likely to outsource activities than firms in food processing,
is consistent with the larger share of GVC participation in the respective sectors
(World Bank 2020). Figure 3.10 shows that the most common function outsourced

88 Bridging the Technological Divide
by firms in wearing apparel is design (11 percent), while in food processing it is
antibacterial processes and input testing (4 percent).
One potential explanation for the decision to outsource is that less sophisticated firms
outsource those business functions that need more complex technologies. This would
imply a negative correlation between outsourcing and technology sophistication. The
FAT survey data reveal that outsourcing in design in apparel, controlling for country fixed
effects, is negatively associated with average levels of technology sophistication in other
functions (figure 3.11). Design is a knowledge-driven task that may require a higher level
of firm capabilities, which may not be economically viable for the average small firm.
However, as figure 3.11 shows, storage in food processing also exhibits a negative correla-
tion, which is likely to be more related to issues of scale and the fact that smaller firms
have lower levels of technology sophistication. The pattern for other business functions is
not pronounced, which suggests that other factors are at play.
Finally, to test the hypothesis of whether the decision of outsourcing these tasks
is associated with integration in GVCs, an empirical analysis was conducted to
FIGURE 3.11 The Significant Correlation between Outsourcing Tasks and Technology Sophistication (All Business Functions) Is Restricted to Some Business Functions
Source: Original figure based on Firm-level Adoption of Technology (FAT) survey data. Note: The y-axis shows the coefficient estimates for the relationship between outsourcing business functions and all business functions—including general business functions and sector-specific business functions—controlling by country for all 11 countries in the FAT survey sample. Estimates are weighted by sampling weights. The x-axis refers to specific business functions in each sector.
0.4
0.3
0.2
0.1
0
–0.2
–0.3
–0.1
–0.4
Estim
ated
coeffi
cient
s
Inputtesting
Mixing/blending/cooking
Antibacterialprocesses
Food processing Wearing apparel
Packaging Foodstorage
Design Cutting Sewingand joining
parts
Finishing—ironing

Adoption of Sector-Specific Technologies 89
FIGURE 3.12 There Are No Significant Differences between Traders and Nontraders in Outsourcing Business Functions
Source: Original figure based on Firm-level Adoption of Technology (FAT) survey data. Note: For each business function, this figure includes firms’ technologies from the 11 countries in the FAT survey sample, except for panel a that excludes Ghana and Malawi and panel b that excludes Ghana. Technology measures are weighted by sampling weights. Results are conditioned on not being a foreign firm.
a. Food processing
Input testing Cooking Antibacterial processes Packaging Storage
0
0.05
0.10
Coeffi
cient
Nontrader Exporter or importer
b. Wearing apparel
Design Cutting Sewing Finishing
0
0.05
0.10
0.15
0.20
Coeffi
cient
Nontrader Exporter or importer
investigate what business functions are more likely to be outsourced by firms
based on traders (exporters or importers) versus nontraders that do not participate
in international trade. Overall, the analysis does not find that the decision to out-
source is associated with trading status. For apparel, only one activity— cutting—is
more likely to be outsourced if a firm trades in international markets. For food pro-
cessing, only packaging seems to be more likely to be outsourced if the firms are
nontraders (figure 3.12). A potential explanation is that traders are not more likely
to outsource business functions because although participation in GVCs is likely to
90 Bridging the Technological Divide
lead to more sophisticated technologies, it does not necessarily lead to more domes-
tic specialization in terms of what business functions to perform in-house.
Summing Up
The chapter started by providing a basic comparison of technology adoption in specific
sectors. Having a more comprehensive and nuanced picture of what the key business
functions and technologies associated with them are in specific sectors, as well as where
firms stand on technology adoption, is critical to inform the policy debate and avoid a
biased view of production technologies used by firms. For example, a more detailed
analysis of technologies shows that despite the rapid diffusion of general-purpose digi-
tal technologies used by businesses, such as access to the internet and mobile phones,
there are still large gaps in technologies used to perform production tasks in agriculture
or light manufacturing (such as tractors for harvesting or electric sewing machines in
apparel).
The chapter also shows that the reality for most firms is that leapfrogging in SBF
technologies is rare and the diffusion of newer and more sophisticated technologies is
mostly gradual. Finally, the chapter shows that firms can outsource some business
functions or use platforms when they do not have sufficient capabilities to implement
them. But overall, most functions are implemented within the boundaries of the firm,
and the reasons for outsourcing go beyond production complexity and can include
scale and other factors.
Notes
1. Studies have focused on the types of production technologies (such as fertilizer, seeds, and trac-tors) that more directly affect the productivity of farms. Examples range from the seminal work of Griliches (1957) and Mansfield (1963) to more recent work by Conley and Udry (2010); Duflo, Kremer, and Robinson (2011); and Suri (2011). For an overview of the literature, see the fourth volume in the World Bank Productivity Project series (Fuglie et al. 2020).
2. Policy makers update their beliefs when informed of the findings of research, Hjort et al. (2021) show in an experiment in Brazil.
3. It also informs an even more important topic for economic development, structural change, which is discussed in the next chapter.
4. The owner reported that he did not have access to capital to build a more appropriate storage unit and conducts most GBFs manually—despite having access to a computer and the internet, and eventually using them with the support of his children.
5. The manual sewing machine is an old technology. It has been available since the 1930s and is relatively affordable.
6. If the subsample is restricted to small firms, renting a tractor through a digital platform becomes statistically significantly associated with more sophisticated technology at the intensive margin, but not for harvesting.
7. Acemoglu, Antràs, and Helpman (2007) develop a model based on the Grossman and Hart (1986) framework to explain adoption decisions, where a firm chooses its technology and investment

Adoption of Sector-Specific Technologies 91
levels in activities that can be contracted to suppliers of intermediate inputs, depending on the quality of the contracting institutions in the country.
8. Bakos and Brynjolfsson (1993) developed a model that explains the decisions to outsource based on new opportunities brought about by information and communication technologies. ICT lowers coordination costs, which in turn facilitates outsourcing of tasks domestically or abroad (offshoring). Using data for US manufacturing firms, Fort (2017) finds that the adoption of ICT technologies between 2002 and 2007 is associated with a 3.1 percentage point increase in its prob-ability of outsourcing. This effect is 20 percent higher in industries with production specifications that are easier to codify in an electronic format.
References
Acemoglu, D., P. Antràs, and E. Helpman. 2007. “Contracts and Technology Adoption.” American Economic Review 97 (3): 916–43.
Bakos, J. Y., and E. Brynjolfsson. 1993. “From Vendors to Partners: Information Technology and Incomplete Contracts in Buyer-Supplier Relationships.” Journal of Organizational Computing 3 (3): 301–28.
Coase, R. H. 1937. “The Nature of the Firm.” Economica 4 (16): 386–405.
Conley, T. G., and C. R. Udry. 2010. “Learning about a New Technology: Pineapple in Ghana.” American Economic Review 100 (1): 35–69.
Demsetz, H. 1997. “The Firm in Economic Theory: A Quiet Revolution.” American Economic Review 87 (2): 426–29.
Duflo, E., M. Kremer, and J. Robinson. 2011. “Nudging Farmers to Use Fertilizer: Theory and Experimental Evidence from Kenya.” American Economic Review 101 (6): 2350–90.
Fort, T. C. 2017. “Technology and Production Fragmentation: Domestic versus Foreign Sourcing.” Review of Economic Studies 84 (2): 650–87.
Fuglie, K., M. Gautam, A. Goyal, and W. F. Maloney. 2020. Harvesting Prosperity: Technology and Productivity Growth in Agriculture. World Bank Productivity Project series. Washington, DC: World Bank.
Griliches, Z. 1957. “Hybrid Corn: An Exploration in the Economics of Technological Change.” Econometrica 25 (4): 501–22.
Grossman, S. J., and O. D. Hart. 1986. “The Costs and Benefits of Ownership: A Theory of Vertical and Lateral Integration.” Journal of Political Economy 94 (4): 691–719.
Hjort, J., D. Moreira, G. Rao, and J. F. Santini. 2021. “How Research Affects Policy: Experimental Evidence from 2,150 Brazilian Municipalities.” American Economic Review 111 (5): 1442–80.
Mansfield, E. 1963. “Intrafirm Rates of Diffusion of an Innovation.” Review of Economics and Statistics 45 (4): 348–59.
Schwab, Klaus. 2016. The Fourth Industrial Revolution. New York: Crown Business.
Suri, T. 2011. “Selection and Comparative Advantage in Technology Adoption.” Econometrica 79 (1): 159–209.
Taglioni, D., and D. Winkler. 2016. Making Global Value Chains Work for Development. Washington, DC: World Bank Group.
Williamson, O. E. 1981. “The Economics of Organization: The Transaction Cost Approach.” American Journal of Sociology 87 (3): 548–77.
World Bank. 2020. World Development Report 2020: Trading for Development in the Age of Global Value Chains. Washington, DC: World Bank.

PART 2The Implications of the Technological
Divide for Long-Term Economic Growth


95
4. Technology Sophistication, Productivity, and Employment
Introduction
The centrality of technology in economic development rests on the relationship
between technology adoption and firm performance. At the macro level, economists
widely agree that variation in technology accounts for a large share of the differences in
GDP per capita across countries.1 This positive view of the aggregate impact of tech-
nology is supported by Joseph Schumpeter’s concept of “creative destruction,” and
more generally by the positive impact that technology-based firms have on disrupting
markets and enhancing business dynamism.
At the firm level, technology is a key driver of productivity growth. If firms use bet-
ter technologies, they are able to produce more and better-quality products and ser-
vices with the same inputs. This can allow for higher remuneration of all factors
involved in production, including higher wages for labor—given that the marginal
product of labor is likely to increase, and workers may also capture part of the eco-
nomic rents generated by the innovations brought to the market.
Yet every new wave of industrial revolution tends to raise concerns about job dis-
placement. Since the Luddites railed against modern technology in nineteenth-century
Europe, the potential negative effects of the diffusion of new technologies for the qual-
ity and quantity of jobs have been highlighted in the policy debate. This concern is
especially relevant for policy makers in developing countries that are facing an increas-
ing diffusion of advanced digital technologies and automation that could undermine
labor cost advantages. The question is whether the adoption of the latest round of
technologies is characterized by the same or different dynamics on employment than
past ones.
While many studies and a considerable body of evidence focus on the country level
and high-income economies, this chapter looks at these issues from the perspective of
the firm and developing countries. Specifically, the chapter addresses the following
questions:
■■ What is the relationship between adopting more sophisticated technologies and
productivity at the firm level?

96 Bridging the Technological Divide
■■ How are the technology and productivity gaps across sectors associated with
structural change?
■■ What is the association between technology adoption and employment growth
at the firm level?
■■ Is the adoption of more sophisticated technologies associated with better jobs,
proxied by higher wages?
Technology and Firm-Level Productivity
There are three main channels through which better technology can boost productivity
over time: (1) labor reallocation from less productive firms to more productive firms;
(2) technology upgrading within the firm across business functions; or (3) entry and
exit of firms. In the first case, workers are moving from firms that are far from the tech-
nology frontier to firms that are closer to the frontier. In the second case, firms upgrade
their technologies to become more efficient. In the third case, firms that are far from
the frontier exit the market and are replaced by new firms that are closer to the frontier.
Figure 4.1 provides a conceptual framework developed in the second volume in the
World Bank Productivity Project series (Cusolito and Maloney 2018) describing the
drivers of productivity growth through a decomposition exercise. Technology upgrad-
ing is central in explaining productivity gains within the firm and through the entry
margins, but it also likely affects reallocation across sectors. Estimates for Ethiopia,
India, Malaysia, and Slovenia suggest that within-firm performance upgrading may
account for a large share of productivity gains over the 2000s. Estimates range from
about one-third in Chile over 1996 to 2006 to more than half in China over 2000 to
2007 (Melitz and Polanec 2015; Cusolito and Maloney 2018).
FIGURE 4.1 Several Drivers Affect the Margins of Productivity Growth
Source: Cusolito and Maloney 2018.
Innovation shocks
Dynamic effects
Total factor productivity growth
Reallocation towardmore productive firms
Operating environment: resolving market failures and removing distortions
Within-firmperformance upgrading
Entry of high-productivity firms,exit of low-productivity firms
Human capital and innovative infrastructure: basic skills; entrepreneurial,managerial, and technological capabilities

Technology Sophistication, Productivity, and Employment 97
The Strong and Positive Association between Technology Sophistication and Labor Productivity
Evidence from the Firm-level Adoption of Technology (FAT) survey data show a
positive and robust relationship between technology and labor productivity. Given
the limitations of estimating total factor productivity (TFP) robustly without longitu-
dinal data,2 rather than estimating the contribution of these channels for productivity
growth, this section focuses on aggregate effects on labor productivity. Specifically, the
correlation between labor productivity (value added per worker)3 and technology is
estimated.4 Figure 4.2 plots a representation of the relationship between labor pro-
ductivity and the measure of the average sophistication of the technology index for all
business functions (ABF) at the intensive margin (that is, the average sophistication
of the technologies most intensively used for all business functions). While causal
interpretations cannot be drawn, the results reinforce the finding that the various
measures of technology used in this analysis are positively and significantly associated
with labor productivity.
FIGURE 4.2 Technology Sophistication Is Correlated with Labor Productivity
Source: Original figure based on Firm-level Adoption of Technology (FAT) survey data.Note: The figure plots the predicted productivity as a function of technology sophistication using sampling weights and controlling for country, sector, formality, and employment. Estimates based on 10 countries in the FAT survey sample (productivity data for Poland were not available). The x-axis plots the average technology sophistication across all business functions (ABF) at the intensive margin. ABF includes general business functions (GBFs) and sector-specific business functions (SBFs).
13.5
13.0
12.5
12.0
11.5
11.0
10.5
Log
of va
lue a
dded
per
wor
ker
1.0 1.5 2.0 2.5 3.0 3.5 4.0 4.5 5.0
Average technology index (intensive)
98 Bridging the Technological Divide
Sector Technology, the Productivity Gap, and Structural Change
As labor is reallocated toward activities with higher levels of productivity and
technology content, it can lead to large-scale sector reallocation of employment and
capital—a process commonly known as structural change or structural transforma-
tion (Kaldor 1961; Kuznets 1973; Maddison 1980). In most developed countries, this
process is characterized by increases in the share of manufacturing in the economy,
both in terms of jobs and value added. It is followed by a reduction in the share of
employment in agriculture and a continued increasing share of employment in ser-
vices, as workers migrate to urban areas to find job opportunities in other sectors.
Some recent literature has emphasized the predominant role of manufacturing in the
growth process (Rodrik 2011), the risks of premature deindustrialization (Rodrik
2016), and the prospects of services-led development (Nayyar, Cruz, and Zhu 2021;
Nayyar, Hallward-Driemeier, and Davies 2021).
A granular picture of FAT data yields a more nuanced view of manufacturing as a
technological leader. Figure 4.3 shows that in some cases, technology use is relatively
closer to the frontier in agriculture and some services sectors (such as financial and
health services). While technologies still may yield larger productivity gains in manu-
facturing than in agriculture and services, there is significant dynamism in these
other sectors too. Diao et al. (2021) suggest that one key problem in the process of
structural transformation in Africa may be related to the types of technologies that
are available, especially in manufacturing, which are more capital intensive than
those that would correspond to the region’s income per capita or factor endowments
(Africa’s abundance of land and unskilled labor)—which would favor more labor-
intensive and less skill-intensive use of technologies. While it is true that the tech-
nologies that are available for firms in Africa are similar to those in developed
economies, the FAT data reveal less adoption in African countries of more capital-
intensive and sophisticated technologies. For example, large firms in Kenya use
sector-specific technologies that are similar to those used by small firms in Brazil and
Vietnam, and that are much less sophisticated than those used by large firms in the
Republic of Korea. The extent to which these technologies are more labor saving
depends on the sector, but overall, actual adoption appears aligned with their income
levels and less capital-intensive endowments. What remains to be validated is whether
the reason not to upgrade to more sophisticated technologies and accelerate the pro-
cess of structural transformation is related to the mismatch in endowments or how
appropriate these technologies are—as Diao et al. (2021) suggest—or to some of the
factors described in chapter 6.
Cross-Country Productivity and Technology Gaps in Agriculture
Despite the controversies concerning the relative roles that manufacturing versus
services play in the relationship between structural change and economic

Technology Sophistication, Productivity, and Employment 99
development, there is more consensus among economists around the view that increas-
ing productivity in agriculture is key (see the fourth volume in the World Bank
Productivity Project series, Fuglie et al. 2020). As productivity increases in agriculture
due to mechanization and use of more advanced technologies, and the population’s
income grows in a way that the resulting increases in demand shift from basic food
products to manufacturing products and services, less employment is needed in
agriculture and more is required in manufacturing and services. This reduction of the
labor share in agriculture is observed across countries that have moved into
higher-income status (Comin, Lashkari, and Mestieri 2021).
In this context, one of the big puzzles in the productivity literature is the large varia-
tion across agriculture, manufacturing, and services sectors observed in productivity
differences across countries. In particular, Caselli (2005) shows that cross-country dif-
ferences in productivity are 10 times larger in agriculture than in nonagricultural sec-
tors.5 Panel a of figure 4.4 focuses on Korea and Senegal and compares the technology
FIGURE 4.3 The Level of Technology Sophistication Varies Considerably across Agriculture, Manufacturing, and Services Sectors
Source: Original figure based on Firm-level Adoption of Technology (FAT) survey data.Note: Average technology index across all 11 countries in the FAT survey sample using sampling weights and controlling for country, firm size, and sector. The higher the index measure (moving from brown to orange to yellow), the greater the level of technology sophistication. Firm size refers to the number of workers: small (5–19), medium (20–99), and large (100 or more).
a. General businessfunctions (GBFs)
Agriculture
Food processing
Apparel
Motor vehicles
Pharmaceuticals
Leather
Other manufacturing
Wholesale or retail
Financial services
Land transport
Serv
ices
Man
ufac
turin
g
Health services
Small
Medium Lar
ge
3.45
3.25
3.05
2.85
2.65
2.45
2.25
2.05
1.85
1.65
1.45
1.25
1.05
GBF
b. Sector-specific businessfunctions (SBFs)
Agriculture
Firm size Firm size
Food processing
Apparel
Motor vehicles
Pharmaceuticals
Leather
Other manufacturing
Wholesale or retail
Financial services
Land transport
Serv
ices
Man
ufac
turin
g
Health services
Small
Medium Lar
ge
3.45
3.25
3.05
2.85
2.65
2.45
2.25
2.05
1.85
1.65
1.45
1.25
1.05
SBF

100 Bridging the Technological Divide
gap between agriculture and nonagricultural sectors, based on FAT survey data.
It shows that the gap between agriculture is larger than the gap between nonagricul-
tural sectors, on average. Moreover, agricultural firms in Senegal are not relatively
closer to the technology frontier, unlike in Korea and other countries as observed in the
FAT survey data. Panel b shows that this pattern of a larger agriculture gap in Senegal
is driven mainly by informal firms, which are more prevalent among agricultural firms
in the country, even among those with 5 or more workers.
Part of the sectoral differences in productivity also reflect the larger cross-country
differences in firm size in agriculture compared to nonagricultural sectors. As smaller
production units tend to be less productive, the greater difference in average firm size
between higher-income and lower-income countries in agriculture versus nonagricul-
ture explains some of the cross-sector difference in the relative productivity gap.
Technology Adoption and Employment
For centuries, technology has been associated by some groups and commentators with
fear of mass unemployment. In the past decade, this negative view of the effects of
technology adoption on employment has gained significant traction with the emer-
gence of advanced labor-saving technologies and evidence in more advanced econo-
mies of job polarization (Acemoglu and Autor 2011; Autor 2015), with significant
decreases in the demand for routine and often medium-skilled occupations, and
resulting increases in income inequality. This evidence focuses mainly on advanced
economies. The few studies that focus on developing countries find different dynamics
of polarization (Maloney and Molina 2016).
FIGURE 4.4 Differences in Technology Sophistication between the Republic of Korea and Senegal Are Larger in the Agricultural Sector than in Nonagricultural Sectors and Are Driven Mainly by the Low Sophistication of Informal Firms
Source: Original figure based on Firm-level Adoption of Technology (FAT) survey data.Note: Estimated levels of technology index using sampling weights and controlling for sector, firm size, and country.
Agriculture Other sectors
Tech
nolo
gy in
dex
2.5
3.0
a. Comparing the Republic of Koreaand Senegal
b. Comparing formal andinformal firms in Senegal
2.0
1.5
1.0
0.5
0
Tech
nolo
gy in
dex
2.5
3.0
2.0
1.5
1.0
0.5
0Korea, Rep. Senegal Formal firms Informal firms

Technology Sophistication, Productivity, and Employment 101
This discussion of the impact of technology on employment, including the litera-
ture on polarization, refers to economywide effects over the medium and long term—
which cannot be analyzed with FAT survey data. Yet an important question is whether
a direct association between adopting more sophisticated technologies and changes in
employment can be observed. The survey directly asks firms how they adjust their
employment levels after they adopt new technologies: specifically, after they acquire a
new machine, equipment, or software. The survey results are summarized in figure 4.5.
The vast majority (84 percent) of firms report that they do not change the number of
workers (48 percent reported no changes at all; 36 percent reported they offer some
training to current workers). Only a small share of firms (4 percent) report a reduction
in the number of workers as a mechanism of adjustment for the acquisition of new
technologies. This share is much smaller than the number of firms that report an
increase in the number of workers with the same skills (8 percent) or hire more workers
with higher skills (4 percent). At face value, there is little evidence that technology
upgrading in these firms has led to job losses.
Technology Sophistication and Job Growth
Firms that use more sophisticated technology also have higher employment growth.
Figure 4.6 shows the association between technology sophistication and employ-
ment changes in the firm in the interval between the last fiscal year before the
FIGURE 4.5 Firms Generally Keep the Same Number of Jobs When They Adopt New Technologies
Source: Original figure based on Firm-level Adoption of Technology (FAT) survey data.Note: The figure covers six countries (Bangladesh, Brazil [only the state of Ceará], India [only the states of Tamil Nadu and Uttar Pradesh], Malawi, Senegal, and Vietnam) in the FAT survey sample using sampling weights.
4
8
4
36
48
0 20 40 60 80 100
Percent of firms
Hire more qualified workers
Hire more workers with same skills
Fired some workers
Same workers and some training
No changes

102 Bridging the Technological Divide
interview and two years earlier. The results suggest a positive and statistically signifi-
cant association between employment growth and technology sophistication for all
the technology indexes—for general business functions (GBFs), sector-specific busi-
ness functions (SBFs), and the aggregate index for all business functions (ABF)—
after controlling for firm characteristics such as the initial size of the firm, their age,
sector, region, foreign ownership, and exporting status. Although these results do
not infer a causal relationship, they are in line with other findings in the literature
suggesting that firms with better technologies tend to be more productive and ben-
efit from opportunities to expand. For example, evidence on the impact of innova-
tion on employment also suggests an expansion effect (see summary in Dosi and
Mohnen [2019] and other articles on the impact of innovation on employment in
the same volume).
The correlation between firms’ employment growth and the level of technology is
also robust for individual general business functions at the intensive margin. This sug-
gests that some of these general business functions have a stronger association with
employment growth. Indeed, figure 4.7 shows that the association of most GBFs with
employment growth is positive and statistically significant.
Technology and Skill Composition
Does adoption of more sophisticated technologies tilt the skill composition toward
skilled workers? The hypothesis of skill-biased technological change suggests that a
shift in the production technology may favor skilled over unskilled workers by
FIGURE 4.6 Firms That Have Adopted Better Technology Have Increased Employment
Source: Original figure based on Firm-level Adoption of Technology (FAT) survey data.Note: The figure provides the coefficients and 95 percent confidence intervals from regressions. Job growth is regressed on all business functions (ABF), general business function (GBF), and sector-specific business function (SBF) at the intensive margin using sampling weights, while controlling for sector, firm size, and regions. It includes 10 countries in the FAT survey sample (data for Poland not included).
0ABF GBF SBF
0.05
0.10
0.15
Coeffi
cient

Technology Sophistication, Productivity, and Employment 103
increasing skilled workers’ relative productivity and, therefore, their relative
demand. To investigate this relationship, the authors analyzed the correlation
between the technology index and changes in the skill composition of the firm
based on existing occupations. To measure the intensity of high-skilled workers, the
analysis uses the share of chief executive officers and managers, professionals, and
technicians to total workers. The low-skilled category includes clerks, production
workers, and services workers. The analysis then takes the difference of this share in
the interval between the last fiscal year before the interview and two years earlier,
and uses it as a dependent variable. Figure 4.8 shows a negative correlation between
changes in the skill intensity and the level of technology, controlling for the initial
size of the firm, their age, sector, and region. Results are not statistically significant
for the average index (ABF) and GBFs, for which no significant skills changes are
observed in the short term associated with increased technology sophistication. The
correlation is significant for sector-specific technology sophistication. The results
suggest that firms with higher level of technologies are generating more jobs and
not necessarily reducing the share of unskilled workers in their payroll. If anything,
the negative significant correlation with SBF suggests that for some technologies the
share of unskilled workers increases.6, 7
FIGURE 4.7 More Sophisticated Technologies in Some Business Functions Are More Associated with Employment Growth
Source: Original figure based on Firm-level Adoption of Technology (FAT) survey data.Note: The figure provides the coefficients and 95 percent confidence intervals from regressions. Job growth is regressed on each specific general business function at the intensive margin using sampling weights, while controlling for sector, firm size, and regions. It includes data for 10 countries in the FAT survey sample (data for Poland not available).
0.06
0.04
Coeffi
cient
0.02
0
Businessadministration
Planning Sourcing Marketing Sales Payment Qualitycontrol

104 Bridging the Technological Divide
These results are consistent with related work on knowledge hierarchies. Garicano
and Rossi-Hansberg (2015) suggest that managing firm expansion requires increasing
employment in low-skilled workers as well. More recently, Aghion et al. (2019) show
the complementarity between high- and low-skilled workers in innovative firms; the
increase in the demand for high-skilled workers from introducing an innovation in the
firm also demands additional tasks of low-skilled workers to complement and support
high-skilled workers, so the net effect can be zero or small.
Technology Adoption and the Wage Premium
Another important aspect of the impact of technology adoption on the labor market is
how the adoption of technology increases or decreases wages. In other words, is there a
wage premium associated with using more advanced technologies? An extensive litera-
ture has examined how firms’ characteristics affect wages. For instance, many findings
have indicated the existence of a wage premium associated with firms that are large
(Bloom et al. 2018), are foreign-owned (Hijzen et al. 2013), are exporters (Schank,
Schnabel, and Wagner 2008), or are more innovative (Cirera and Martins-Neto 2020;
Aghion et al. 2018). However, although technology adoption relates to some of these
characteristics, the literature has not explicitly examined the existence of a technology
wage premium. The FAT survey allows this hypothesis to be tested. In doing so, the
analysis focuses on data from the state of Ceará in Brazil. The analysis first matches FAT
survey data with 2018 data from a matched employer-employee database compiled by
FIGURE 4.8 Firms with a Higher Level of Technology Are Creating More Jobs but Not Changing Their Share of Low-Skilled Workers
Source: Original figure based on Firm-level Adoption of Technology (FAT) survey data.Note: The figure provides the coefficients and 95 percent confidence intervals from regressions. Change in the share of high-skilled occupations is regressed on all business functions (ABF), general business function (GBF), and sector-specific business function (SBF) at the intensive margin using sampling weights, while controlling for sector, firm size, and regions. It includes data for 10 countries in the FAT survey sample (data for Poland not included).
ABF
–0.015
–0.010
–0.005
0
0.005
GBF SBF
Coeffi
cient

Technology Sophistication, Productivity, and Employment 105
the Brazilian Ministry of Economy considered to be a high-quality census of the
Brazilian formal labor market (Relação Anual de Informações Sociais, RAIS). A Mincer-
type wage equation is then estimated controlling for firm and individual observable
characteristics.
Figure 4.9 shows the coefficients of regressions of the logarithm of workers’
monthly wages on the logarithm of the four different technology indexes. Regressions
control for individuals’ age, gender, length of employment, education, and occupa-
tion. At the establishment level, the regressions control for firm characteristics such
as sector, size, exporting status, and foreign ownership, as well as a dummy indicat-
ing whether the establishment has employees dedicated to research and development
(R&D). Vertical markers show estimated 95 percent confidence intervals based on
robust standard errors.
FIGURE 4.9 Firms Using More Sophisticated Technologies Pay Higher Wages
Source: Original figure based on Firm-level Adoption of Technology (FAT) survey data and RAIS data.Note: The figure uses data from the state of Ceará in Brazil. EXT = extensive margin; GBF = general business function; INT= intensive margin; SBF = sector-specific business function. RAIS is a matched employer-employee database covering formal firms and formal workers in Brazil.
0
0.2
0.4
0.6
0.8
1.0
Coeffi
cient
0
0.2
0.4
0.6
0.8
1.0
Coeffi
cient
GBF EXT GBF INT SBF EXT
a. All sectors b. Agriculture
c. Manufacturing d. Services
SBF INT
GBF EXT GBF INT SBF EXT SBF INT GBF EXT GBF INT SBF EXT SBF INT
GBF EXT GBF INT SBF EXT SBF INT
0
0.2
0.4
0.6
0.8
1.0
Coeffi
cient
0
–0.1
0.2
0.4
0.6
0.8
1.0
Coeffi
cient

106 Bridging the Technological Divide
There is a positive and significant wage premium associated with technology
adoption, especially for sector-specific business functions (figure 4.9).8 For
instance, an SBF index that is 1 percent higher at the intensive margin is associated
with 0.27 percent higher monthly wages. The results are significant even when con-
trolling for other important firms characteristics. Panels b, c, and d show the coef-
ficients of a similar exercise, now disaggregated by broad sectors. Panel b shows
that the premium is larger for firms in agriculture, but not significant for GBFs at
the intensive margin. In contrast, the premium is smaller for services and not sig-
nificant at the extensive margin for both GBFs and SBFs. Firms with more sophis-
ticated technologies pay higher wages.
Given the existence of a premium linked to the adoption of more sophisticated
technologies, another important question is whether higher-paid individuals capture
most of the premium with respect to those at the bottom of the distribution: that is,
whether technology is associated with within-firm wage inequality. Recent literature
has underlined the importance of within-firm variation in explaining earnings vari-
ance (see Song et al. 2018). For instance, Alvarez et al. (2018) document a significant
decrease in earnings inequality in Brazil from 1992 to 2012 and find that within-firm
variance accounts for 40 percent of the total decline in inequality.
To test for the relationship between technology adoption and wage inequality, the
authors used the matched database in the state of Ceará in Brazil and constructed, for
each establishment, a measure of wage inequality based on the ratio of the 90th to 10th
percentiles log wage differential. Figure 4.10 reports the coefficients of regressions of
the logarithm of wage inequality (90/10 log wage differential) on the logarithm of the
FIGURE 4.10 Technology Sophistication Contributes to Wage Inequality within Firms
Source: Original figure based on Firm-level Adoption of Technology (FAT) survey data and RAIS data.Note: The figure uses data from the state of Ceará in Brazil. EXT = extensive margin; GBF = general business function; INT= intensive margin; SBF = sector-specific business function. RAIS is a matched employer-employee database covering formal firms and formal workers in Brazil.
GBF EXT
0
0.1
0.2
Coeffi
cient
GBF INT SBF EXT SBF INT
Technology Sophistication, Productivity, and Employment 107
four different technology indexes. Regressions control for firm characteristics
(the establishment’s sector, size, exporting status, foreign ownership, share of high-
skilled occupations, and share of workers who are college graduates), as well as a
dummy indicating whether the establishment has employees dedicated to R&D. Vertical
markers show the estimated 95 percent confidence intervals based on robust standard
errors. The figure shows a small but significant association between technology sophis-
tication and wage inequality for all the intensive measures, indicating that technology
sophistication is also associated with larger within-firm wage inequality.
Summing Up
This chapter has illustrated the links between technology sophistication, productivity,
and employment. For productivity, a large literature has shown the importance of tech-
nology sophistication at the macro, meso, and micro levels. The evidence presented in
this chapter confirms the positive relationship between technology and labor produc-
tivity. This chapter has also emphasized the need to put technology adoption at the
center of the discussions on the agriculture productivity gap and on structural trans-
formation from one broad sector to another (see also the fourth and fifth volumes in
the World Bank Productivity Project series, Fuglie et al. 2020 and Nayyar, Hallward-
Driemeier, and Davies 2021), but to have a more nuanced view of technology and pro-
ductivity differences in particular sectors.
Regarding employment, the chapter shows that with respect to direct impacts on
firms, there is no evidence that technology sophistication is associated with job losses
in the firm and across skills groups. More sophisticated technologies are associated
with greater employment growth, including the growth of low-skilled jobs. This sug-
gests that the expansion effect of these technologies can be larger than any job losses
(labor savings). The many dimensions of technology included in the technology index
suggest that some of the labor-saving effects can be related more to automated
processes in production but less to adoption of other technologies in management
and general business functions. Finally, workers in firms utilizing more sophisticated
technology tend to receive higher wages, likely as a result of capturing some of the
productivity rents associated with working in more productive firms. Overall, these
results call for a more nuanced view of the impact of technology on employment by
business function and technology, but also highlight a positive impact of technology
sophistication on employment growth at the level of the firm.
Notes
1. Comin and Hobijn (2010) estimate that the cross-country variation in the adoption of technolo-gies accounts for at least one-quarter of per capita income differences.
2. For a review of methods to estimate TFP, see Van Biesebroeck (2007).
3. Specifically, labor productivity is measured as nominal value added in US dollars divided by the number of workers.

108 Bridging the Technological Divide
4. The following regression was estimated:
ln(V AP W )f,c = αc + βs + γ ∗ Tf,c + ρ ∗ Xf,c + vf,c,
where αc and βs are country and sector fixed effects, Tf,c is a vector of firm-level technology measures, and Xf,c is a vector of controls that includes the observable variables discussed plus 12 dummies for the sectors for which the sample includes data on sector-specific technologies and other services.
5. Caselli (2005) uses purchasing power parity (PPP) adjustments to compute sectoral productivity. This may induce additional discrepancies in cross-country productivity gaps across sectors if the PPP price index differs more across countries in agriculture than in nonagricultural sectors.
6. This does not necessarily mean that these technologies are biased toward unskilled workers, given that the results could be driven by the growth effect. Yet, evidence in the literature suggests that technologies such as online platforms used for export sales can lead to reduction in the wage skill premium (Cruz, Milet, and Olarreaga 2020).
7. There is, however, significant heterogeneity across countries. In Senegal, for example, there is a positive and strong correlation between technology sophistication and changes in the share of low-skilled workers.
8. The results do not claim any causal relationship, given that the analysis is unable to control for unobservable characteristics for workers and firms and the fact that more productive or higher-ability workers self-select into firms that use more advanced technologies.
References
Acemoglu, D., and D. Autor. 2011. “Skills, Tasks and Technologies: Implications for Employment and Earnings.” Chapter 12 in Handbook of Labor Economics, Vol. 4, edited by David Card and Orley Ashenfelter, 1043–171. Elsevier.
Aghion, P., U. Akcigit, A. Hyytinen, and O. Toivanen. 2018. “On the Returns to Invention within Firms: Evidence from Finland.” AEA Papers and Proceedings 108: 208–12.
Aghion, P., A. Bergeaud, R. Blundell, and R. Griffith. 2019. “The Innovation Premium to Soft Skills in Low-Skilled Occupations.” CEPR Discussion Paper 14102, Center for Economic and Policy Research, Washington, DC.
Alvarez, J., F. Benguria, N. Engbom, and C. Moser. 2018. “Firms and the Decline in Earnings Inequality in Brazil.” American Economic Journal: Macroeconomics 10 (1): 149–89.
Autor, D. A. 2015. “Why Are There Still So Many Jobs? The History and Future of Workplace Automation.” Journal of Economic Perspectives 29 (3): 3–30.
Bloom, N., F. Guvenen, B. S. Smith, J. Song, and T. von Wachter. 2018. “The Disappearing Large-Firm Wage Premium.” AEA Papers and Proceedings 108: 317–22.
Caselli, F. 2005. “Accounting for Cross-Country Income Differences.” Chapter 9 in Handbook of Economic Growth, Vol. 1, Part A, 679–741. Elsevier.
Cirera, X., and A. S. Martins-Neto. 2020. “Do Innovative Firms Pay Higher Wages? Micro-Level Evidence from Brazil.” Policy Research Working Paper 9442, World Bank, Washington, DC.
Comin, D., and B. Hobijn. 2010. “An Exploration of Technology Diffusion.” American Economic Review 100 (5): 2031–59.
Comin, D., D. Lashkari, and M. Mestieri. 2021. “Structural Change with Long-Run Income and Price Effects.” Econometrica 89 (1): 311–74.
Cruz, M., E. Milet, and M. Olarreaga. 2020. “Online Exports and the Skilled-Unskilled Wage Gap.” PLOS one 15 (5): e0232396.
Cusolito, A. P., and W. F. Maloney. 2018. Productivity Revisited: Shifting Paradigms in Analysis and Policy. World Bank Productivity Project series. Washington, DC: World Bank.
Technology Sophistication, Productivity, and Employment 109
Diao, X., M. Ellis, M. S. McMillan, and D. Rodrik. 2021. “Africa’s Manufacturing Puzzle: Evidence from Tanzanian and Ethiopian Firms.” NBER Working Paper 28344, National Bureau of Economic Research, Cambridge, MA.
Dosi, G., and P. Mohnen. 2019. “Innovation and Employment: An Introduction.” Industrial and Corporate Change 28 (1): 45–49.
Fuglie, K., M. Gautam, A. Goyal, and W. F. Maloney. 2020. Harvesting Prosperity: Technology and Productivity Growth in Agriculture. World Bank Productivity Project series. Washington, DC: World Bank.
Garicano, L., and E. Rossi-Hansberg. 2015. “Knowledge-Based Hierarchies: Using Organizations to Understand the Economy.” Annual Review of Economics 7 (1): 1–30.
Hijzen, A., P. Martins, T. Schank, and R. Upward. 2013. “Foreign-Owned Firms around the World: A Comparative Analysis of Wages and Employment at the Micro-Level.” European Economic Review 60 (C): 170–88.
Kaldor, N. 1961. “Capital Accumulation and Economic Growth.” The Theory of Capital: Proceedings of a Conference Held by the International Economic Association, edited by D. C. Hague, 177–222. London: Palgrave Macmillan UK.
Kuznets, S. 1973. “Modern Economic Growth: Findings and Reflections.” American Economic Review 63 (3): 247–58.
Maddison, A. 1980. “Economic Growth and Structural Change in the Advanced Countries.” In Western Economies in Transition: Structural Change and Adjustment Policies in Industrial Countries, edited by I. Leveson and J. Wheeler, 41–60. Boulder, CO: Westview Press.
Maloney, W. F., and C. A. Molina. 2016. “Are Automation and Trade Polarizing Developing Country Labor Markets, Too?” Policy Research Working Paper 7922, World Bank, Washington, DC.
Melitz, M. J., and S. Polanec. 2015. “Dynamic Olley-Pakes Productivity Decomposition with Entry and Exit.” Rand Journal of Economics 46 (2): 362–75.
Nayyar, G., M. Cruz, and L. Zhu. 2021. “Does Premature Deindustrialization Matter? The Role of Manufacturing versus Services in Development.” Journal of Globalization and Development 12 (1): 63–102.
Nayyar, G., M. Hallward-Driemeier, and E. Davies. 2021. At Your Service? The Promise of Services-Led Development. World Bank Productivity Project series. Washington, DC: World Bank.
Rodrik, D. 2011. “Unconditional Convergence.” NBER Working Paper 17546, National Bureau of Economic Research, Cambridge, MA.
Rodrik, D. 2016. “Premature Deindustrialization.” Journal of Economic Growth 21 (1): 1–33.
Schank, T., C. Schnabel, and J. Wagner. 2008. “Higher Wages in Exporting Firms: Self-Selection, Export Effect, or Both? First Evidence from German Linked Employer-Employee Data.” Friedrich-Alexander University Erlangen-Nuremberg, Labour and Regional Economics Discussion Paper 55.
Song, J., D. J. Price, F. Guvenen, N. Bloom, and T. von Wachter. 2018. “Firming Up Inequality.” Quarterly Journal of Economics 134 (1): 1–50.
Van Biesebroeck, J. 2007. “Robustness of Productivity Estimates.” Journal of Industrial Economics 55: 529–69.


111
5. Digital Technologies and Resilience to Shocks
Introduction
The widespread diffusion of computers, smartphones, and the internet has enabled a
wide variety of information and communication technologies (ICT) used for busi-
ness purposes. Indeed, the technology options firms use to perform general business
functions (GBFs) (such as business administration, business planning, sales, and pay-
ment) are predominantly digital, and they are applied by firms with different levels of
sophistication.1 In this regard, digitalization and technology sophistication are almost
synonymous. Policy and academic discussions for at least a decade—and well before
the COVID-19 pandemic—have focused on promoting digitalization to improve
productivity and promote growth (for an extended discussion in the context of
Europe, see Hallward-Driemeier et al. 2020). This focus has resulted in the prolifera-
tion of policy strategies that prioritize the digitalization of businesses and that include
other areas such as government services or finance.
As a response to the pandemic, businesses worldwide have significantly increased
their use of digital technologies. Despite this overall increase, the intensity in the use of
digital tools has varied considerably. For example, larger firms and firms that that had
already gone digital before the pandemic have intensified their digitalization more than
other types of firms. This trend is raising concerns that the digital divide between
countries and firms is widening. Thus, while the quick response from businesses to
adopt digital technologies represents an important opportunity for technology upgrad-
ing, additional efforts are needed to facilitate this process for laggard firms to avoid
leaving some firms and workers behind, but also closing the productivity gap and
increasing aggregate productivity. The next part of this chapter explores the patterns of
digitalization across firms and their implications.
The rest of the chapter explores the role of digital technologies in increasing firms’
resilience to shocks. Digital technologies allow firms to integrate information systems
into their operations, significantly reducing transaction costs. This has proven essential
to respond to the large and widespread shock caused by the COVID-19 pandemic and
highlights the role of technology as an engine for resilience to shocks, which is not
confined only to health shocks and future pandemics, but also to climate shocks. Both
climate change mitigation and adaptation require the adoption of technologies to
reduce emissions and adapt to increasing climate shocks and rising temperatures.
112 Bridging the Technological Divide
This chapter addresses the following questions:
■■ What are the patterns of digital adoption across firms?
■■ How does the supply side of digital business solutions affect technology adop-
tion by firms? To what extent do market concentration and anticompetitive
practices by suppliers of digital solutions raise prices, restrict access, or lower
quality and innovation in solutions?
■■ How much has the COVID-19 shock accelerated digitalization, and what are the
risks of an increasing digital gap across firms?
■■ What role has the “technology readiness” of firms before the pandemic played in
explaining their digital response and firm performance during the COVID-19
shock? Did firms that have been using more digital technologies perform better
in terms of curtailing the loss of sales and building sales—that is, were they more
resilient?
■■ How are firms mitigating climate change and adapting to climate shocks, and
how is this related to the overall technological capabilities of the firm?
Digital Technologies
As shown in previous chapters, a large share of firms in developing countries have
access to computers, smartphones, and the internet. These general-purpose technolo-
gies (GPTs) play an important role as enablers to access digital technologies, but as
discussed in chapter 1, many questions remain about the purposes for which firms are
using digital technologies and with what intensity. This section focuses on disentan-
gling those purposes and describes the patterns of digitalization within firms.
Understanding this process is critical for policy makers when considering digital
upgrading programs and more specifically about how to prioritize technologies for
support.
Patterns of Digitalization across Firms
The data from the Firm-level Adoption of Technology (FAT) survey show that there
are significant gaps across firms in the use of digital technologies, but this gap varies
across digital enablers. For example, there is a relatively small gap between large and
small firms in their access to the internet or the use of digital platforms that cost little
to access (such as social media) (figure 5.1, panels a and b), compared to the likelihood
of having their own website (figure 5.1, panel c). Reducing the gap between small and
large firms with respect to digital enablers may be a necessary condition for provid-
ing better opportunities for businesses in developing countries, but as discussed, it
will not be sufficient to guarantee adoption of digital technologies. Therefore, it is
important to understand how and for what purposes these businesses are using digital
technologies.

Digital Technologies and Resilience to Shocks 113
Digital technologies significantly reduce costs associated with searching, replica-
tion, transportation, tracking, and verification of information (Goldfarb and Tucker
2019). From this perspective, business functions comprising tasks that are intensive in
processing information (such as business administration, marketing, and sales) can be
expected to benefit more from digital technologies.
Indeed, the prevalence of digital technologies, defined by how many of the tech-
nologies mapped by the FAT survey are digital, varies across business functions.
Figure 5.2 displays the range of digital intensity in each business function, comparing
GBFs with a selected group of sector-specific business functions (SBFs). The heat map
shows that GBFs are more digitally intensive than SBFs. On average, 80 percent of the
technologies identified to perform GBFs are predominantly digital. Among SBFs, there
are important differences between agriculture and manufacturing firms, which tend to
have sophisticated digital technologies embedded in frontier technologies (such as new
machines and equipment), and services, which tend to have a wider variety of digital
technologies to perform each function. The important takeaway from figure 5.2 is the
fact that digital technologies cannot be equated with frontier technologies for all func-
tions of the firm, especially SBFs.
The Main Purposes for which Firms Are Using Digital Technologies Because digital technologies tend to be embedded in/applied to more sophisticated
machines and equipment in SBFs, firms’ use of digital technologies tends to start
through their application on GBFs (such as digital payment, online sales, and the use of
FIGURE 5.1 Use of Internet and Adoption of Applications of Digital Technologies Vary by Sophistication and Firm Size
Source: Original figure based on Firm-level Adoption of Technology (FAT) survey data. Note: Average estimates using sampling weights. Firm size refers to the number of workers: small (5–19), medium (20–99), and large (100 or more).
20
40
Perc
ent o
f firm
s
Perc
ent o
f firm
s
Perc
ent o
f firm
s
60
80
100
Small MediumFirm size Firm size Firm size
Large
a. Access to internet
20
40
60
80
100
Small Medium Large
c. Own website
20
0 00
40
60
80
100
Small Medium Large
b. Social media

114 Bridging the Technological Divide
Excel for administrative functions).2 As a result, digital adoption applied to GBFs
constitute most technology projects supported in government-backed policies and
programs aiming to promote digitalization of small and medium enterprises (SMEs).
These have been the functions (such as digital administrative tools, online marketing,
sales, and payment) for which rapid digital response became critical during the
pandemic and for which demand for support has been greatest.
In addition to differences in the extent of digitalization between GBFs and SBFs,
there is also important variation across GBFs. In part, these differences may be explained
by the fact that for some of these functions (such as sales, payment, and marketing)
there are significant network effects associated with the larger benefits of adopting
when customers and other firms also adopt (see chapter 1). Figure 5.3 plots patterns of
the likelihood of diffusion of different technologies to perform similar GBFs across
firm size. These functions were more likely to be used in adjusting to the COVID-19
pandemic. The plots are similar to the diffusion curves presented in chapter 3.3 While
the use of most basic technologies, usually involving manual methods (such as hand-
written methods for business administration), is in decline, the diffusion curves of
digital technologies increase with firm size, and tend to have an S-shape for more
sophisticated technologies. More important, some digital technologies such as enter-
prise resource planning (ERP) (panels a and b) seem to diffuse more rapidly than
customer relationship management (CRM) (panel c) or electronic orders (panel d).
Source: Original figure based on Firm-level Adoption of Technology (FAT) survey questionnaire.Note: Colors range from light green (least prevalent among technology options in the business function) to dark green (most prevalent). The values refer to the share of technologies identified as digital in that business function. In most cases, each business function has about five technologies, ranging from most basic to most sophisticated. Thus, a value of 0.8 suggests that four in five technologies identified to perform that task have a digital component, which is based on the technologies identified for the FAT questionnaire. Business functions (BFs) 1–7 refer to individual business functions associated with the general business function (GBF) or each sector-specific business function (SBF) described in the table. For example, for GBFs: business administration (BF1); planning (BF2); supply chain management (BF3); marketing (BF4); sales (BF5); payment (BF6); and quality control (BF7). For SBFs, for agriculture: land preparation (BF1); irrigation (BF2); weeding (BF3); harvesting (BF4); storage (BF5); and packaging (BF6). For food processing: input testing (BF1); cooking (BF2); antibacterial processes (BF3); packaging (BF4); and food storage (BF5). For other SBFs, see figure 1.5 in chapter 1 for agriculture, food processing, and retail, and the figures in appendix A for apparel, pharmacy, finance, and transport. n.a. = not applicable.
FIGURE 5.2 Digital Technology Intensity Varies across Sectors and Business Functions
BF1
Businessfunction GBFs
SBFs
Agriculture Food processing Apparel Pharmacy Retail Finance Transport
BF2
BF3
BF4
BF5
BF6
BF7
Average
0.8
0.8
0.8
0.8
0.8
0.7
0.8
0.8
0.3
0.2
0.3
0.2
0.2
0.5
n.a.
0.3
0.3
0.3
0.3
0.3
0.3
n.a.
n.a.
0.3
0.7
0.4
0.4
0.2
n.a.
n.a.
n.a.
0.4
0.1
0.2
0.3
0.2
0.5
0.6
n.a.
0.3
0.6
0.6
0.5
0.6
0.7
n.a.
n.a.
0.6
0.6
0.7
0.3
0.8
0.7
n.a.
n.a.
0.6
0.5
0.8
0.4
0.4
0.5
n.a.
n.a.
0.5

Digital Technologies and Resilience to Shocks 115
FIGURE 5.3 Some Technologies Diffuse More Rapidly than Others
Source: Original figure based on Firm-level Adoption of Technology (FAT) survey data.Note: The diffusion curves analyze the probability of adopting a given technology across firm size. Assuming that larger firms adopt earlier, this is a representation of the diffusion over time of specific technologies. The figures present estimates of the probability of adoption for each technology for the extensive margin (whether a technology is used or not) as a function of the log of the number of workers and age group based on a probit. For panel a, business administration includes processes related to accounting, finance, and human resources. CRM = customer relationship management; ERP = enterprise resource planning.
100a. Business administration
60
80
40
20
0
Pred
icted
pro
babi
lity (
%)
100
60
80
40
20
0
Pred
icted
pro
babi
lity (
%)
100
60
80
40
20
0
Pred
icted
pro
babi
lity (
%)
100
60
80
40
20
0
Pred
icted
pro
babi
lity (
%)
100
60
80
40
20
0
Pred
icted
pro
babi
lity (
%)
100
60
80
40
20
0
Pred
icted
pro
babi
lity (
%)
0 2 4 6 8 10Log of number of workers
b. Production or service operations planning
0 2 4 6 8 10Log of number of workers
Handwritten Standard software Mobile apps Specialized software ERP
c. Customer information for marketingand product development
0 2 4 6 8 10Log of number of workers
d. Sales methods
0 2 4 6 8 10Log of number of workers
Online chatCRM
Face-to-face chatStructured surveysBig data
At the establishmentSocial mediaOwn website
Phone, emailDigital platformsElectronic orders
e. Payment methods
0 2 4 6 8 10Log of number of workers
f. Quality control inspection
0 2 4 6 8 10Log of number of workers
Cash/exchange goods Check/bank wireDebit/credit card Online bankOnline platform Cryptocurrency
Manual, visual, written Support of computersSoftware monitoring Automated systems

116 Bridging the Technological Divide
This can be the result of higher costs of implementation, more demanding capabilities
required for implementing them, or, for the latter, the presence of network effects; inte-
grating orders may require suppliers or buyers to also have digital systems.
An important exception is for payment methods. In this case, the diffusion patterns
along firm size suggest potential leapfrogging. Panel e shows that the likelihood of
small businesses adopting online platforms is higher than their likelihood of using
credit or debit cards or online banking as a payment method. The likelihood of using
online platforms also decreases with firm size, suggesting wide opportunity for finan-
cial technology (fintech) to enhance the diffusion to financial instruments.
Digital Platforms and the Supply of Digital Business Solutions
An important factor to understand the adoption of digital technologies is to under-
stand the role of digital platforms and the supply of digital technologies. Digital plat-
forms can allow access to technologies and increasing firm performance, via the sharing
economy as well as access to markets and suppliers. Also, the role of the supply of digi-
tal solutions in the diffusion of digital technologies is often ignored in developing
countries.4
The Many Roles of PlatformsDigital technologies have made firm boundaries more flexible, facilitating outsourcing
of tasks in a timely and cost-effective manner (Cusolito 2021). One example is the
emergence of peer-to-peer technologies, commonly known as digital platforms. These
digital platforms create peer-to-peer markets (Einav, Farronato, and Levin 2016),
reducing matching, search, and transaction costs between supply and demand and
buyers and sellers, and allowing firms to expand their customer base and access talent
globally.
More important, this significant reduction in frictions and matching costs has
resulted in a reconfiguration of the boundaries of the firm. The use of digital platforms
allows firms to externalize the use of some technologies, in some cases reducing the
need to invest in technologies by using platform services. For example, sales and pay-
ments are often done through the platform marketplace, reducing the tasks done inter-
nally. At the same time, new tasks are adopted, increased, or outsourced. For instance,
for a firm to maintain its reputation in these platforms, it may need to significantly
increase its customer services. This can be accomplished by insourcing—increasing
tasks and personnel in the marketing department and customer services—or by out-
sourcing certain services to service providers that can perform those tasks for the firm.
These double-sided platforms extend beyond the goods marketplace (such as
Amazon, eBay, MercadoLibre, or Alibaba) to sharing platforms for equipment (Hello
Tractor, Grab) (see chapter 3); workers and hiring (Workable, WUZZUFF); and

Digital Technologies and Resilience to Shocks 117
payments (M-Pesa, Mercado Pago). More important, these platforms are not confined
to advanced economies. Developing countries are also experiencing a boom in the pro-
liferation of these platforms, which often allow the creation of new markets that either
were very imperfect or simply did not exist. Consider the role of M-Pesa in Kenya in
occupying and developing a financial market that was absent for the poorest segments
of the population.
Platforms such as Uber facilitate work arrangements between workers and consum-
ers through a shadow employer (Friedman 2014; Gandini 2019), while e-commerce
platforms such as MercadoLibre and eBay reduce transaction costs and facilitate digi-
talization and market access (UNCTAD 2019), especially for small and medium-size
enterprises (Jin and Hurd 2018). The results are apparent in many industries. Anderson
and Magruder (2012) show that positive restaurant ratings on Yelp.com increase
demand. Rivares et al. (2019) develop a proxy for platform use across four industries—
hotels, restaurants, taxis, and retail trade—and find evidence of productivity gains and
labor reallocation toward more productive firms in these industries. The authors also
find that “aggregator” platforms are associated with higher productivity, profits, and
employment of existing services firms. In contrast, more disruptive platforms that
enable new entrants are associated with a decline in markups, employment, and wages
of existing providers.
While much of the literature has focused on the employment effects of digital
platforms in high-income countries, the COVID-19 pandemic has reinforced the criti-
cal role those digital platforms can play in the economy (see discussion later in the
chapter). As an example, the pandemic has increased the number of average daily
tasks/jobs posted and filled on digital platforms (Umar, Xu, and Mirza 2020).
Adopting or integrating into these platforms often requires firms to make adjust-
ments that are different from those needed for more traditional nonplatform technolo-
gies and also present risks. Some of the obstacles to connect to these platforms are often
more related to regulatory issues. Moreover, the nature of digital technologies can favor
incumbents and lead to concentration of market power in the hands of a few major
platforms. In addition, platforms have used their intermediary role to take over firms
in “adjacent” subsectors and extend their activities into nondigital industries as they
become increasingly digitalized. These expansions are driven by economies of scope
from owning large amounts of data.
Digital SolutionsAccelerating businesses’ digital transformation requires strengthening the links of the
nondigital sector with the growth of the digital sector, and the opening of new market
opportunities.5 This includes ensuring that, on the supply side, digital entrepreneurs,
platforms, and sectors can grow, providing digital solutions to nondigital business.

118 Bridging the Technological Divide
Thus, understanding the supply side of digital technologies is important to foster
digitalization. In an effort to evaluate how the two forces are playing out, the World
Bank has built a global database of 200,000 investment-ready technology solution
firms in 190 countries (the digital business database), drawing from three different data
sources (CB Insights, PitchBook, Briter Bridges) and cross-checked with national eco-
nomic censuses when possible (Zhu et al., forthcoming). This data set allows examina-
tion of whether there is evidence regarding: (1) the existence of a digital growth pathway
in developing countries; (2) the digital divide between developed and developing coun-
tries; and (3) the digital market structure in both developed and developing countries
and the tendency toward conglomeration.
A first glance at the data confirms that building economies of scope and network
effects constitute key digital development pathways. This finding has implications for
how to incentivize traditional firms to enter digital platforms—or incorporate data-
intensive solutions if no network effects exist yet. This means that to identify market
and government failures, the unit of analysis relevant for policy interventions for tech-
nology adoption will likely have to include market-level analysis that yields a better
understanding of the dynamics of competition between firms and the vertical integra-
tion of digital services. For example, if a seller’s incentive to adopt a digital platform
depends on how many other sellers and buyers are already using the platform, or
whether a digital payment and fulfillment/logistics services exist, there is a need to eval-
uate digital market policies that enable the trusted use and scaling of online commerce
so more users and firms are crowded in. These policies could include e-transaction
laws, online consumer and supplier protection, and industry data policies that allow
data-driven market intelligence to be shared with sellers and customers.
Another key opportunity to drive technology adoption by leveraging supply-side
interventions is to incentivize local digital solution firms to design tailored business-to-
business (B2B) solutions that match local user needs, skills level, language(s), and
infrastructure endowments. A breakdown in the digital business database by subsector
in the number of digital solution firms and investment flows to these firms shows that
developing countries are generally catching up with consumer-facing digital solutions
such as e-commerce and fintech, but less so on B2B solutions. Incentivizing local firms
to develop B2B products tailored for local needs can not only increase supply but also
provide more technology options for traditional businesses that fit their specific needs,
lowering barriers to adoption.
New analysis based on the Enlyft database of digital technologies used by firms in
developing countries shows that the supply of digital technologies is moderately to
highly concentrated across all segments in all regions.6 Each digital technology market
segment typically has two providers that make up more than half the segment, with
one major company typically serving 30 percent to 40 percent of the market. The most
concentrated product segment is “intelligence and analytics.” Google is the major

Digital Technologies and Resilience to Shocks 119
provider in all regions through its web analytics services. Concentrations are also high
across all regions in other market segments that are key for job growth as shown by the
FAT survey—such CRM and ERP. Google holds the largest share of marketing/CRM,
and SAP holds the largest share of ERP across all regions (figure 5.4).
Market concentration and winner-takes-most dynamics in supply-side markets
may have implications for the exercise of market power, and therefore for market out-
comes such as access and affordability. They also raise the risk of anticompetitive
FIGURE 5.4 Market Concentration Poses a Challenge for the Supply of Digital Business Solutions
Source: Nyman and Ukhaneva, forthcoming.Note: Data are not available for Latin America and the Caribbean.
Google Yoast BV Mailchimp Oracle Tawk.to.inc Other
57 11 21 3 3 4
532121959
37 23 23 10 3 5
54 12 11 9 3 10
OtherSAP Microsoft Corporation Oracle Sage Group Infor
East Asia and Pacific
Europe and Central Asia
Middle East and North Africa
South Asia
Sub-Saharan Africa
Percent share
0 25 50 75 100
303381838
46 3133512
43 3124713
48 359 5 2 1
40 3114 6 4 5
a. Marketing and customer relationship management (CRM)
East Asia and Pacific
Europe and Central Asia
Middle East and North Africa
South Asia
Sub-Saharan Africa
0 25
Percent share
553101067
50 75 100
b. Enterprise resource planning (ERP)

120 Bridging the Technological Divide
practices by suppliers of digital solutions (such as collusion and abuse of dominance)
that can raise prices, restrict access, or lower quality and innovation in solutions.
Exclusionary abuse of dominance can also restrict potential competitors in supply-side
markets from entering or expanding and thus limit innovation in products provided.
A database compiled recently by the World Bank found more than 100 finalized anti-
trust cases involving digital platforms. Nearly 40 percent of those are in developing
countries. Meanwhile, antitrust scrutiny in other digital markets is steadily increasing.
For instance, the European Commission is currently investigating SAP over allegedly
abusing its dominance in the ERP market by preventing users from switching to other
vendors or connecting to competitors’ applications.
Further research is needed on the question of how these supply-side market dynam-
ics affect technology adoption by firms. In some cases, pricing of digital technologies
may play a lesser role in firms’ adoption compared to other types of inputs because a
number of digital solutions are provided at no cost or at a low price to the user, and free
open-source solutions are readily available. After digital technologies provided by
Google and Microsoft, the next most popular choice for digital technologies overall are
open-source systems (such as WordPress, PHP, and Apache). Together they provide
14 percent of all technologies in Sub-Saharan Africa, and 11 percent to 12 percent in
other regions. Smaller firms are more likely than their larger counterparts to use these
open-source technologies. The share of Apache and PHP (Hypertext Preprocessor)
used by small firms is twice the share used by large firms. At the same time, it is possible
that even if market power does not result in higher prices it may manifest in a lack of
incentives to develop products targeted to smaller firms, developing countries, or niche
markets.
Technology and Resilience
Technology is central to resilience to different shocks. Previous findings suggest that
firms with more diversified technologies are less subject to the impact of shocks such as
natural disasters (Hsu et al. 2018) or overall external shocks (Koren and Tenreyro
2013). The COVID-19 pandemic put those findings to the test. The discussion that fol-
lows uses granular data from both the FAT survey and the World Bank Business Pulse
Survey (BPS) to investigate the role that digital technologies, in particular, can play in
helping firms weather shocks.7
The discussion examines the role of digital readiness—whether firms that used
more sophisticated digital tools before a shock fare better during and after a shock. In
the case of the COVID-19 pandemic, firms with a high level of digital readiness per-
formed better, regardless of the extent and type of their digital response during the
pandemic. This finding also has implications for firms’ adjustment to climate change.
Firms’ adoption of green technologies to adapt to and mitigate climate change is exam-
ined at the end of this section.

Digital Technologies and Resilience to Shocks 121
Digital Responses to Adjust to the COVID-19 Pandemic
The COVID-19 pandemic was unique in imposing both supply shocks (associated with
measures to stop the pandemic, including restrictions that limited worker mobility,
curtailed or shut down operations on premises, and created supply chain bottlenecks)
and simultaneous demand shocks (stemming from restrictions on consumer mobility
and job losses), while being both sudden and worldwide. Businesses were plunged into
stress around the world.
The negative impact of the COVID-19 pandemic on sales has been large and wide-
spread across firms. Results from the BPS show that about 84 percent of firms on aver-
age, across more than 60 countries, reported a reduction in sales, compared to the same
period in the previous year, at the early stage of the pandemic (Apedo-Amah et al. 2020).
While the biggest impact of the COVID-19 crisis occurred during the initial shock in
March and April 2020, the drop in sales was persistently large even 10 weeks later. The
drop in sales was particularly significant for microenterprises and small firms, compared
to medium and larger businesses. By the end of 2020, firms started to recover (Cirera et
al. 2021), but for a large share of firms the negative change in sales persisted (figure 5.5).8
FIGURE 5.5 The Large Drop in Sales at the Beginning of the COVID-19 Pandemic Persisted for Many Firms, and the Loss Was Greater for Microenterprises and Small Firms
Source: Business Pulse Survey (BPS) data based on Avalos et al., forthcoming.Note: Wave 1 and Wave 2 refer to different rounds of the BPS. Firm size is defined in terms of number of workers.
–20
–10
0
–30
Chan
ge in
sales
(%)
–40
–50
–60Micro (0–4) Small (5–19) Medium (20–99) Large (100+)
Firm size
Wave 1 Wave 2
–53
–41
–30
–45
–25
–39
–51
–36

122 Bridging the Technological Divide
COVID-19 as an Unprecedented Driver of Digital AdoptionA significant amount of anecdotal evidence suggests that the COVID-19 shock led to an
unprecedented increase in the demand for digital technologies. Despite the lack of his-
torical data to address this question, data on online shopping trends and the BPS data
provide some evidence that reinforces the large increase in digitalization during the pan-
demic. First, there was a sharp spike in the interest for digital solutions. Google trend
indexes in different languages for measuring “online shopping” suggest that interest in
the use of digital technologies for this purpose reached an historical peak around the time
that further restrictions on mobility were adopted in response to the pandemic (figure 5.6,
panel a). Second, there was a significant increase in the share of firms that started using
digital technologies in response to COVID-19, as well as firms that increased their use of
technologies, in both developing and high-income countries (panel b). While a larger
share of firms in high-income countries use digital technologies, almost 40 percent were
already using and did not increase during the pandemic, while in developing countries 20
percent started using digital tools during the pandemic.
A more detailed examination of the type of digital investments shows that firms are
going digital across different dimensions. Cross-country data for more than 60 countries
suggest that around 45 percent of firms started or increased the use of digital platforms
in response to the pandemic; 44 percent used online sales; 28 percent invested in digital
solutions; and 23 percent increased telecommuting, allowing employees to work remotely
(figure 5.7).9 Comparing the BPS data for firms in which a panel is available with two
rounds of the BPS suggests that the probability of starting or increasing the use of digital
technologies in response to the COVID-19 shock continuously increased over time across
different firm size groups. Although the gap between large and small firms in the digital
response has shrunk, it has persisted as the shock has continued.
Among firms that started or increased the use of digital technologies in response to
the pandemic, there is also large variation in the business functions they digitalized.
Digital responses by firms were largely concentrated among functions related to cus-
tomer relations. Specifically, 64 percent of firms increased digitalization in marketing,
55 percent in sales, 52 percent used it for internal tasks (such as business administra-
tion), and 37 percent in payment (figure 5.8). Overall, among firms that have adopted
digital technologies in response to the pandemic, external functions (sales, marketing,
payment) have become more digitalized. This is consistent with the severity of the
demand shock. Another 34 percent used it only for external purposes, while around
10 percent used it only for internal tasks.
A Widening Digital DivideDespite the opportunities generated by an increasing demand for digitalization, there
is also the risk of widening the digital divide. The push for digitalization associated
with the pandemic and the intensification of digitalization have not been equal across
firms, sectors, and countries.

Digital Technologies and Resilience to Shocks 123
FIGURE 5.6 Demand for Digital Solutions Increased Greatly in Response to the COVID-19 Pandemic
Sources: Google trend data and World Bank Business Pulse Survey (BPS) data.Note: Panel a shows the trend for the expression “online shopping” in English, French, and Spanish. Panel b shows the estimated share of firms that started or increased the use of digital technologies in response to the COVID-19 pandemic, as well as the share of firms that used digital technology before COVID-19 but did not increase the use in response to the shock, by income group.
0
20
40
60
80
Cum
ulati
ve p
redi
cted
prob
abili
ty (%
)
Developing countries High-income countries
100
Used but did not increaseIncreasedStarted
b. Predicted probability of increasing use of digital technologies, by country income level
120
Goog
le tre
nd in
dex
80
60
40
20
0
Apr 20
19
July 2
019
Oct 201
9
Apr 20
20
July 2
020
Oct 202
0
Jan 20
20
Apr 20
21
July 2
021
Oct 202
1
Jan 20
21
Jan 20
19
100
English SpanishFrench
a. Google trend for the expression “online shopping”

124 Bridging the Technological Divide
FIGURE 5.7 A Large Share of Businesses Digitalized during the COVID-19 Pandemic
60
40
20Perc
ent o
f firm
s
0
Increase in digitalization
45 44
2823
Started or increaseduse of digital platforms
Used onlinesales
Invested in digitalsolutions
Allowed remotework
Source: Business Pulse Survey (BPS) data based on Avalos et al., forthcoming.
FIGURE 5.8 Among Firms That Used and Invested in Digital Technologies, Investments in Digitalizing External, Customer-Related Functions Dominated
Source: Business Pulse Survey (BPS) data based on Avalos et al., forthcoming. Note: Percentages are conditional on firms using digital platforms.
60
80
Perc
ent o
f firm
s
40
20
0
Business functions
Productionplanning
Servicedelivery
Supply chain management
Payment methods
Businessadministration
SalesMarketing
26 2631
37
525564
There are significant differences in the use and increase of digital tools across countries
(figure 5.9), and this variation is not explained by country income. Firms in some countries
in Africa and Latin America have responded with widespread digital investments, while
some other countries in Europe and Central Asia have shown a lower digital response. Part
of this regional composition may be related to the fact that firms in some European coun-
tries were already using digital technologies and did not need to start or increase the use of
digital technologies. Nevertheless, figure 5.9 shows that differences across countries and
regions in firms responding to the pandemic are quite heterogenous.
At the firm level, the gap between small and large firms has persisted during the
pandemic in the use of digital solutions and investment (figure 5.10), as well as in

Digital Technologies and Resilience to Shocks 125
FIGURE 5.9 There Is Large Variation across Countries in the Use of Digital Technologies to Respond to the COVID-19 Pandemic
100
Prob
abili
ty of
star
ting
or in
crea
sing
use o
f dig
ital t
echn
olog
y (%
) 80
60
40
20
0
BRA
TUR
MYS TUN
VNM
KHM
KEN
HND
MARMDA SL
VPA
KZW
EGT
MXK
XRO
UZA
FLV
AHR
VZM
BNI
CPS
EJO
RSE
NMOZ PO
LBG
RLT
USV
NCY
PMNG ES
TNP
LGE
O ITA GRC
CZE
TZA
SVK
PRT
HUN
BGD
MLT
Latest round First round
Source: Business Pulse Survey (BPS) data based on Avalos et al., forthcoming. Note: Results from probit estimates controlling for country, firm size, sector, severity of the shock from mobility restrictions, and their interactions with the wave. Results are weighted by the inverse of the number of observations by country-wave. Results are at means of the sample (bar chart) in the latest round and depicted by orange dots in the first round of data collection in the country. Country labels use International Organization of Standardization (ISO) country codes. Results for Brazil are based on one state—São Paulo— which likely overestimates the results.
Source: Business Pulse Survey (BPS) data based on Avalos et al., forthcoming. Note: Results from probit controlling for country, firm size, sector, severity of the shock from mobility restrictions, and their interactions with the wave. Results are weighted by the inverse of the number of observations by country-wave. Firm size is defined in terms of number of workers.
FIGURE 5.10 Smaller Firms Have Used and Invested Less in Digital Solutions
60
40
20
0
Pred
icted
pro
babi
lity (
%)
Micro (0–4) Small (5–19) Medium (20–99)
Firm size
34
20
43
29
50
38
52 49
Large (100+)
Increasing use of digital platforms Investing in digital solutions

126 Bridging the Technological Divide
FIGURE 5.11 The Probability of a Digital Response to the COVID-19 Pandemic Is Larger for Firms That Were Digitally Ready before the Pandemic
Source: Business Pulse Survey (BPS) data based on Avalos et al., forthcoming. Note: Results from probit estimates controlling for country, firm size, sector, severity of the shock from mobility restrictions, and their interactions with the wave. Results are weighted by the inverse of the number of observations by country-wave. Firm size is defined in terms of number of workers. The digital readiness score is based on four questions included in the BPS to measure digital readiness before COVID-19: (1) use of online sales and/or digital payment; (2) use of online tools for marketing and product development; (3) use of customer or supplier relationship management (CRM or SRM); (4) use of enterprise resource planning (ERP) for business administration. The digital readiness groups sort firms by the number of digital technologies used: either low (0 technologies); medium (1 or 2 technologies); or high (3 or 4 technologies). This is a simplified version of the questions extracted from the Firm-level Adoption of Technology (FAT) survey and incorporated into the BPS.
80
60
40
Pred
icted
pro
babi
lity (
%)
20
Low Medium
Digital readiness score (pre-pandemic)
High0
28
16
52
29
45
68
Increasing use of digital technology Investing in digital solutions
online sales and home-based work. Even if COVID-19 led to a significant response
from micro and small firms by starting and increasing the use of digital technologies,
because there was a large digital divide before the pandemic, the digital gap by firm size
might be increasing, particularly in the intensive margin. Therefore, to better under-
stand this process it is important to analyze this gap by taking into consideration the
level of digital technology sophistication used by firms (digital readiness) before the
pandemic.
This gap in the digital responses to COVID-19 between small and large firms
observed using the BPS data is also consistent with the digital gap observed using the
FAT data (before the pandemic). This persistence in the gap should not come as a sur-
prise, and it reinforces the hypothesis that “digital readiness” before the pandemic was
a key factor driving the capacity of firms to respond to the COVID-19 shock through
the use of more digital technologies. Figure 5.11, based on BPS data across several
countries, shows that digital readiness is strongly associated with the likelihood that
firms increased the use of digital technologies or invested in digital solutions.

Digital Technologies and Resilience to Shocks 127
Technology Readiness and Resilience to the COVID-19 ShockThese results lead to the key question of how the use of digital technologies affected
firm performance during the pandemic. Many factors might explain differences across
firms.10 As discussed, digital technologies played an important role, allowing firms to
reach out to consumers during closures and to reduce the impacts of restrictions to
mobility in the management of the business. Recent evidence on the increased use of
digital technologies in response to the pandemic suggests that the pandemic increased
the returns to digitalization (Apedo-Amah et al. 2020; Van Reenen and Valero 2021;
Bellmann et al. 2021).
Firms that increased their use of digital technologies (or invested) did have better
sales performance, regardless of their level of digital readiness before the pandemic
(figure 5.12). Yet, the results also show that firms with a high level of digital readiness—
that is, firms that used more sophisticated digital tools before the pandemic—per-
formed better, regardless of the extent and type of their digital response during the
pandemic. Because digital readiness also triggered a greater likelihood of increasing
the digital response during the pandemic, it is important to disentangle the direct
effects (from digital technologies in place before the pandemic) and indirect effects
(via increasing adoption) of technology readiness.
FIGURE 5.12 Sales Fell Less during the COVID-19 Pandemic for Firms That Increased the Use of and/or Investment in Digital Technologies during the Pandemic
Increased use of digital technologyDid not increase use of digital technology
Invested in digital solutionsDid not invest in digital solutions
Chan
ge in
sales
(%)
0
–10
–20
–30
–40Low
–28
–13
–33
–16
–35
–20
Medium
Digital readiness score (pre-pandemic)
a. Use of digital technologies b. Investment in digital technologies
High
–32
–18
–30
–13
–27
–11
Chan
ge in
sales
(%)
0
–10
–20
–30
–40Low Medium
Digital readiness score (pre-pandemic)
High
Source: Business Pulse Survey (BPS) data based on Avalos et al., forthcoming. Note: Results from ordinary least squares regression controlling for country, firm size, sector, severity of the shock from mobility restrictions, and their interactions with the survey wave. Results are weighted by the inverse of the number of observations by country-wave. The digital readiness score is based on four questions included in the BPS to measure digital readiness before COVID-19: (1) use of online sales and/or digital payment; (2) use of online tools for marketing and product development; (3) use of customer or supplier relationship management (CRM or SRM); (4) use of enterprise resource planning (ERP) for business administration. The digital readiness groups sort firms by number of digital technologies used: either low (0 technologies); medium (1 or 2 technologies); or high (3 or 4 technologies). This is a simplified version of the questions extracted from the Firm-level Adoption of Technology (FAT) survey and incorporated into the BPS.

128 Bridging the Technological Divide
The Indirect and Direct Effects of Technology Sophistication before the PandemicTo investigate the impact of technology on the performance during the pandemic,
Comin et al. (2022) combine information on digital adoption by firms before and after
the COVID-19 shock. They use data from Brazil, Senegal, and Vietnam for which gran-
ular measures of technology readiness before the pandemic are available from the FAT
survey, and information on digital response and firm performance during the pan-
demic available from the BPS. The analysis quantifies the direct and indirect effects of
technology sophistication before the pandemic using the treatment effect mediation
framework first developed by Baron and Kenny (1986) and more recently detailed in
Imai, Keele, and Yamamoto (2010) and Celli (2022).
More sophisticated businesses, for example, could better plan production ade-
quately to reduce potential supply chain bottlenecks, or more quickly switch to home-
based work (direct effect). Similarly, more sophisticated firms could more easily adopt
additional technology and transition into digital platforms to sell their products online
and reduce the impact of lower consumer mobility (indirect effect).
Firms with higher levels of technology before the pandemic were significantly more
likely to start using or increase their use of digital technologies during the COVID-19
crisis. In line with the previous results, the analysis—using much more granular
measures of technology sophistication from the FAT survey—shows that, on average,
a change in one unit of increase in the GBF technology index (intensive margin)
amounts to a 17 percentage point increase in the likelihood of starting or increasing the
use of digital technologies in response to COVID-19, yielding a statistically significant
coefficient (see figure 5.13).11 Moreover, the likelihood of adopting additional digital
solutions to respond to the crisis increases with technology sophistication. While busi-
nesses in the second quintile of technology sophistication were 25 percentage points
more likely to start or increase the use of digital solutions than the bottom 20 percent,
the additional likelihood for businesses in the third, fourth, and fifth quintiles is at least
35 percentage points.
Digital readiness helped firms become more resilient during the pandemic. The
direct impact of technology sophistication before the pandemic on sales is significantly
larger than the indirect effect through the adoption of digital solutions (figure 5.14).
Both direct and indirect effects on sales are positive and their magnitude increases
with pre-pandemic technology sophistication. The resulting total effect averages
6.5 percentage points (3.8 percentage points for an increase of one standard deviation
in technology sophistication), and ranges from 5 percentage points when comparing
businesses in the second quintile to those in the bottom 20 percent, to almost
14 percentage points for businesses in the fifth quintile. The direct effect accounts for
most of the impact of technology sophistication before the pandemic, as shown in
figure 5.14, because the impact of additional technology adoption on sales (6.6 percentage
points, on average) is mediated by an estimated probability of additional adoption that

Digital Technologies and Resilience to Shocks 129
FIGURE 5.13 Firms’ Likelihood of Adopting Additional Digital Solutions to Respond to the COVID-19 Crisis Increased with Technology Sophistication
Source: Comin et al. 2022.Note: The dots show the estimated average effect of the probability of increasing use of technology as a response to the pandemic across quintiles of the distribution from low (Q2) to most advanced (Q5) technology sophistication, relative to the most basic (Q1) technology sophistication. CI = confidence interval.
0.55
0.50
0.45
0.40
0.35
0.30
0.25
Chan
ge in
like
lihoo
d of
star
ting
or in
crea
sing
use
of d
igita
l tec
hnol
ogies
relat
ive to
bot
tom
20%
of
techn
olog
y sop
histi
catio
n
0.20
0.15
0.10
0.05
0Q2 Q3 Q4
Quintiles in the distribution of technology sophistication
Change from a one-unit increase in the technology index and 95% Cl
Effect across quintiles and 95% Cl
Q5
FIGURE 5.14 The Direct Effect of Technology Readiness before the COVID-19 Pandemic Is Much Larger than the Indirect Effect on the Change in Sales during the Pandemic
Source: Comin et al. 2022.Note: The figure shows the estimates of the direct and indirect effects of technology before the pandemic on the percentage change in sales following the treatment effect mediator framework, as described in Comin et al. (2022). The columns show the estimations across quintiles of the distribution from low (Q2) to the most advanced (Q5) technology sophistication, in relation to the most basic (Q1). The last column shows the total effect for the full sample.
0
2
4
6
8
10
12
14
Chan
ge in
sal
es (p
erce
ntag
e po
ints
)
Q2 Q3 Q4 Q5 Average
Quintiles in the distribution of technology sophistication
Indirect effect Direct effect

130 Bridging the Technological Divide
increases with technology sophistication but averages only 37 percent among the most
sophisticated firms.
The Types of Digital Solutions that Helped during the PandemicThese results are consistent across different types of digital solutions. In calculating
the effects of technology sophistication before the pandemic, Comin et al. (2022)
combine several measures of digital adoption during the crisis into a single indicator.
The indicator comprises any of the following: starting to use or increasing the use of
digital solutions; investing in new digital solutions; reporting a higher fraction of
sales online; and reporting a higher fraction of workers working from home.
Figure 5.15 shows the effects for the direct and indirect effects using each potential
type of digital response as an indirect channel for realizing the effect of technology
sophistication. The total effect remains close to 6.5 percentage points when the
response is the additional use of digital platforms or the new investment in equip-
ment, software, or digital solutions. When the response is more home-based work, the
effect increases by 1 percentage point, and by nearly 2 percentage points when the
response is a higher share of online sales.
FIGURE 5.15 The Direct and Indirect Effects of Digital Readiness Are Consistent across Different Types of Digital Solutions
Source: Comin et al. 2022.Note: The figure shows the estimates of the direct and indirect effects of technology before the pandemic on the percentage change in sales following the treatment effect mediator framework, as described in Comin et al. (2022), across different types of digital responses.
0
1
2
3
4
5
6
7
8
9
Chan
ge in
sal
es (p
erce
ntag
e po
ints
)
Started or increaseduse of digital platforms
Invested indigital solutions
Increased shareof online sales
Increasedhome-based work
Overall digitaladoption
Indirect effect Direct effect

Digital Technologies and Resilience to Shocks 131
Technology as an Engine of Resilience to Adapt to and Mitigate Climate Shocks
Looking forward, some of the greatest and potentially most damaging global shocks
may arise from climate change. Estimates of the impact of climate shocks suggest a
significant negative and tangible impact already occurring in the past few decades. In
low-income countries, a one-degree Celsius increase in temperature is associated with
a reduction in economic growth by 1.3 percentage points (Dell, Jones, and Olken 2012).
Rising temperatures have large negative impacts on agriculture and industrial value
added, not only on output levels but also on growth. Plant-level estimates for China
suggest that industrial output could decrease between 3 percent to 36 percent under the
slowest scenario of temperature increases (Chen and Yang 2019). The effects are also
important in other sectors beyond agriculture such as retail and tourism. Hsiang (2010)
estimates that a one-degree Celsius increase in the Caribbean and Central America
could result in a loss of output of 6.1 percent in retail, restaurants, and hotels and
4.2 percent in mining. These effects are similar in magnitude to the adverse effects of
rising temperatures on labor productivity. Excessive heat causes physical discomfort
and fatigue; affects cognitive functioning (Hancock, Ross, and Szalma 2007); increases
workplace injuries (Park, Pankratz, and Behrer 2021); and reduces productivity
(Seppanen, Fisk, and Lei 2006).
Minimizing the impact of these climate shocks requires adopting new technologies.
On the one hand, adaptation to climate shocks—such as rising temperatures, drought,
fire, cyclones, and flooding—requires technologies that account in real time to adjust
to weather changes in agriculture, reduce excess temperature in premises, and mini-
mize sourcing risks in supply chains for manufacturing and services. On the other
hand, mitigation efforts require greener and more energy-efficient production, espe-
cially in the context of increasing energy prices and other geopolitical shocks.
Regarding adaptation to climate change, the FAT data show that most firms do not
use supplier relationship management (SRM) software that can allow more flexibility
in managing the supply chain in the event of climate or other shocks (see figure 2.7 in
chapter 2). In fact, only 20 percent of firms in the sample, and less than 10 percent of
medium and small firms, used SRM systems. Similarly, for agriculture, precision agri-
culture that can support higher yields during climate shocks by improving land prepa-
ration, irrigation, or weeding is only used in more advanced firms in Brazil, Kenya, and
the Republic of Korea (see figure 2.8 in chapter 2). Most firms lag in the adoption of
certain technologies that can help adapt to the impact of climate shocks and rising
temperatures.
Recently collected data for 1,800 firms in Georgia expand the FAT survey question-
naire to include some information on green management practices and green tech-
nologies. Panel a of figure 5.16 shows the percentage of firms that use a set of

132 Bridging the Technological Divide
energy-efficient practices and technologies. On average, most firms do not use any of
these practices. Energy-efficient lighting and having VAC/HVAC (variable air volume/
heating, ventilation, and air conditioning) systems are the most used technologies, and
have been adopted by almost 40 percent of firms, but very few firms use energy- efficient
equipment, programmable thermostats, or sensors connected to the Internet of Things
(IoT). Panel b presents another example: the use of sustainable practices in retail. The
picture is similar, and adoption of retail sustainability practices is still incipient, with
the exception of use of recyclable materials for packaging and considering sustainabil-
ity when sourcing products. Overall, figure 5.16 shows a picture of very limited adop-
tion of green technologies and practices for climate mitigation.
A critical question for climate mitigation is related to how adoption of general and
sector-specific technologies is associated with adoption of green technologies. In other
words, are firms using more sophisticated technologies for SBFs or GBFs also using
more efficient energy and green practices and technologies? Energy efficiency can have
significant effects on productivity. For instance, energy-efficient LED lighting increased
productivity on hot days in Indian manufacturing plants, in addition to reducing
energy costs (Adhvaryu, Kala, and Nyshadham 2020). Figure 5.17 shows the correlation
between the FAT technology index and the adoption of energy-efficiency practices,
based on the recently collected FAT data in Georgia. More technologically sophisticated
firms, for both general and sector-specific business functions, tend to use more energy-
efficient technologies. There may be some complementarities in adoption via the
knowledge accumulated in the firm and a potential reduction in costs to adopt these
Source: Original figure based on the Firm-level Adoption of Technology (FAT) survey for Georgia. Note: Panel a: Percentage of firms that use: LEED (Leadership in Energy and Environmental Design) certified; Energy Star/efficiency rated equipment; energy-efficient lighting (LED light-emitting diode/CFL compact fluorescent lamps); VAV (variable air volume)/HVAC (heating, ventilation, and air conditioning) systems; programmable thermostats, timers, robots, and motion sensors; Internet of Things (IoT)-enabled systems to control premises temperature, lighting system, and/or refrigeration units. Panel b: Percentage of firms in retail using the following sustainability retail practices: makes recyclable shopping bags; uses recyclable materials for packaging; offers digital receipts; recycles packaging from shipments; considers sustainability standards when sourcing products.
FIGURE 5.16 Adoption of Green Practices Is at a Very Early Stage in Georgia
LEED certified
a. Energy-efficiency practices and technologies
Energy Star
Energy-efficientlighting
VAV/HVAC systems
Programmablethermostats
IoT-enabledtemperature
system
2040
6080
100
b. Retail sustainability practices
Considerssustainability
standardswhen sourcing
Makes recyclable shopping bags
Uses recyclablematerialsfor packaging
Offers digital receiptsRecycles packagingfrom shipments
20406080100

Digital Technologies and Resilience to Shocks 133
additional technologies. It also suggests that some of the barriers and drivers of tech-
nology adoption between “green” and “nongreen” technologies may be similar. More
and better data are needed to measure and identify these complementarities, but there
is a clear need to understand green technologies from the perspective of the firm and
how the dynamics of adoption relate to the drivers and obstacles that other technolo-
gies face (see the next chapter) and what obstacles and drivers are specific to green
technologies.
Summing Up
This chapter has described some key features of how digital technologies are used by
firms and has illustrated the important role they can play by helping firms be more
resilient to economic, health, and environmental shocks. It has also highlighted the
importance of having an adequate supply of digital solutions, and the potential benefits
of platforms to outsource certain tasks and the use of technologies. The potential ben-
efits, however, come at the expense of some risk of market dominance of platforms and
suppliers of digital solutions. Demand-side digital policies need to consider ways to
ensure the quality and affordability of supply of these digital solutions and the role
played by platforms.
Digital technologies provided firms with much-needed flexibility during the restric-
tions implemented to stop the COVID-19 pandemic, and those firms that were digitally
“ready” before the pandemic experienced a lower drop in sales and were more likely to
invest in more digital solutions. But the chapter also highlights the risks of an increasing
digital divide across firms. Mitigating the risks of this growing technology gap requires
removing existing barriers to adoption. The fact that firms in Brazil, Senegal, and Vietnam
FIGURE 5.17 There Is a Positive Correlation between Technology Sophistication and Use of Energy-Efficient Technologies in Georgia
Source: Original figure based on the Firm-level Adoption of Technology (FAT) survey for Georgia. Note: The technology indexes used in panels a and b refer to the intensive margin, which captures the most widely used technology across business functions. The y-axis measures the number of energy-efficient technologies and practices used by the firm.
b. Sector-specific technology adoption
1.5
1.0
0.5
00 1 2
Technology index (intensive)
Pred
icte
d nu
mbe
r of
ener
gy-e
ffici
ent p
ract
ices
3 4
a. General business function technology adoption
1.5
1.0
0.51 2
Technology index (intensive)
Pred
icte
d nu
mbe
r of
ener
gy-e
ffici
ent p
ract
ices
3 4
134 Bridging the Technological Divide
that were already more prepared with higher levels of technologies, particularly digital
technologies, before the pandemic were significantly more likely to accelerate adoption
during the pandemic suggests that existing barriers may be persistent. These barriers are
explored in detail in the next chapter, but include issues related to the lack of managerial
capabilities, uncertainty, and limited access to markets. Many of these conditions have
deteriorated disproportionally for small and female-led businesses during the pandemic,
which is further widening the digital divide.
The pandemic has increased the awareness about digital technologies and the
incentives to digitalize. As a result, governments and business-support organizations
are intensifying the use of policy instruments to promote digital adoption and
upgrading (see chapter 7). A recent survey conducted by the World Bank of public
programs supporting businesses in Kenya shows that many of these programs have
adjusted the services they provide by increasing support to digital solutions (Cruz
and Hernandez 2022). About 48 percent of the programs that existed before the pan-
demic reported that they have started to offer or have expanded their offer of training
and technical support related to digital solutions. Similarly, management extension
services in countries such as Brazil are experiencing a shift of demand toward digital
upgrading programs, and new programs are being created to tailor to the needs of
SMEs in this area. These programs combine the provision of information with tech-
nical assistance, and are taking advantage of greater interest among SMEs for tech-
nology upgrading. Policy makers should seize the opportunity to accelerate and
complete the digital transformation of SMEs. To do so, they need to understand the
main barriers and obstacles to technology adoption. That is the objective of the next
chapter.
Finally, the chapter has emphasized the central role of technology adoption to
support adaptation to and mitigation of climate shocks, and the need to understand
the adoption of green technologies from the perspective of the firm and the drivers
of and barriers to their adoption, and their complementarities with other
technologies.
Notes
1. The digital presence in sector-specific business technologies is usually different, especially for agriculture and manufacturing, where digital technologies are usually embedded in more sophis-ticated machinery and equipment that are, in most cases, frontier technologies.
2. The data show that small firms, which are on average later adopters of new technologies than large firms, are significantly more likely to adopt digital technologies applied to GBFs than SBFs, on average.
3. The assumption behind building the curves is the fact that larger firms are earlier adopters. See chapter 3.
4. This section draws heavily on Cusolito (2021), Nyman and Ukhaneva (forthcoming), World Bank (2021), and Zhu et al. (forthcoming).
Digital Technologies and Resilience to Shocks 135
5. The spread of digital platforms has raised concerns about the changing nature of employment status, ushering in a more flexible workforce and eroding traditional employer-employee rela-tionships. Blurring lines between formal and casual employment, characterized by independent or temporary work arrangements (such as on-call workers, contract workers, or freelancers) could be problematic. Workers face the risk of insecure working environments. Beyond occupa-tions in transportation such as drivers or delivery, these platforms are affecting other occupa-tions ranging from arts and design, media, and communication to other services. The growth of digital platforms has expanded the share of workers performing on-demand tasks—the so-called gig economy. With its allure of flexibility and compensation (Hall and Krueger 2018), the gig economy has grown exponentially and helped workers buffer against income and expense shocks (Farrell and Greig 2016). The incidence of alternative work arrangements has been rising in the United States, with the share of all workers growing from 10.7 percent in 2005 to as high as 15.8 percent in late 2015 (Katz and Krueger 2019).
6. Enlyft is a private digital platform providing a database on B2B technology based on machine learning.
7. The BPS is an initiative led by the World Bank Group to collect and harmonize firm-level data to understand the impact of COVID-19 on the private sector in developing countries. Apedo-Amah et al. (2020) summarize the first round of data collection. The severity of the effect of the COVID-19 shock on businesses has been well documented across countries and data sources. See Adams-Prassl et al. (2020); Bartik et al. (2020); Dai, Hu, and Zhang (2020); Fairlie (2020a, 2020b); and Humphries, Neilson, and Ulyssea (2020).
8. The average drop in sales in the first four weeks following the peak of the shock is between 60 percent and 75 percent. In the next four months, the drop in sales narrowed to 47 percent in week 8, 47 percent in week 12, and 43 percent after week 16. Although nearly 90 percent of businesses were open 10 weeks after the peak of the outbreak, the negative impact on sales still loomed large.
9. This section is based on Avalos et al. (forthcoming), a background paper for this volume.
10. This section is based on Comin et al. (2022), a background paper for this volume.
11. One standard deviation in pre-pandemic technology sophistication is associated with an increase of 10 percentage points in the likelihood of starting or increasing the use of digi-tal technologies. Firms whose technology sophistication index is one standard deviation (0.62 percentage points) higher than the average (1.78) tend to rely on specialized software to perform business administration or production planning and sourcing; online chat or internet to interact with customers; debit/credit card and online payment; and computers for quality control. Firms whose technology index of 2.78 is 1 percentage point higher than the average tend to be very close to the frontier in performing tasks such as business administration and planning (for example, use ERP systems) and use basic to more sophisticated digital technolo-gies in all other GBFs.
References
Adams-Prassl, A., T. Boneva, M. Golin, and C. Rauh. 2020. “Inequality in the Impact of the Coronavirus Shock: Evidence from Real Time Surveys.” Journal of Public Economics 189 (September): 104245.
Adhvaryu, A., N. Kala, and A. Nyshadham. 2020. “The Light and the Heat: Productivity Co-benefits of Energy-Saving Technology.” Review of Economics and Statistics 102 (4): 779–92.
Anderson, M., and J. Magruder. 2012. “Learning from the Crowd: Regression Discontinuity Estimates of the Effects of an Online Review Database.” Economic Journal 122 (563): 957–89.
Apedo-Amah, M. C., B. Avdiu, M. Cruz, X. Cirera, E. Davies, A. Grover, L. Iacovone, U. Kilinc, D. Medvedev, F. O. Maduko, S. Poupakis, J. Torres, and T. T. Tran. 2020. “Unmasking the Impact of COVID-19 on Business: Firm-Level Evidence from around the World.” Policy Research Working Paper 9434, World Bank, Washington, DC.

136 Bridging the Technological Divide
Avalos, E., X. Cirera, M. Cruz, I. Leonardo, D. Medvedev, G. Nayyar, and S. Reyes. Forthcoming. “Digital Divide across Firms through COVID-19: A Tale of Two Stories.” World Bank, Washington, DC.
Baron, R. M., and D. A. Kenny. 1986. “The Moderator-Mediator Variable Distinction in Social Psychological Research: Conceptual, Strategic, and Statistical Considerations.” Journal of Personality and Social Psychology 51 (6): 1173.
Bartik, A. W., M. Bertrand, Z. Cullen, E. L. Glaeser, M. Luca, and C. Stanton. 2020. “The Impact of COVID-19 on Small Business Outcomes and Expectations.” Proceedings of the National Academy of Sciences 117 (30): 17656–66.
Bellmann, L., P. Bourgeon, C. Gathmann, C. Kagerl, D. Marguerit, L. Martin, L. Pohlan, and D. Roth. 2021. “Digitalisierungsschub in Firmen während der Corona-Pandemie.” Working paper, Luxembourg Institute for Socio-Economic Research (LISER).
Celli, V. 2022. “Causal Mediation Analysis in Economics: Objectives, Assumptions, Models.” Journal of Economic Surveys 36 (1): 214–34.
Chen, X., and L. Yang. 2019. “Temperature and Industrial Output: Firm-Level Evidence from China.” Journal of Environmental Economics and Management 95 (C): 257–74.
Cirera, X., M. Cruz, A. Grover, L. Iacovone, D. Medvedev, M. Pereira-Lopez, and S. Reyes. 2021. “Firm Recovery during COVID-19: Six Stylized Facts.” Policy Research Working Paper 9810, World Bank, Washington, DC.
Comin, D. A., M. Cruz, X. Cirera, K. M. Lee, and J. Torres. 2022. “Technology and Resilience.” NBER Working Paper 29644, National Bureau of Economic Research, Cambridge, MA.
Cruz, M., and Z. Hernandez. 2022 “Entrepreneurship Ecosystems and MSMEs in Kenya: Strengthening Businesses in the Aftermath of the Pandemic.” World Bank, Washington, DC. Unpublished.
Cusolito, A. P. 2021. “The Economics of Technology Adoption.” World Bank, Washington, DC. Unpublished.
Dai, R., J. Hu, and X. Zhang. 2020. “The Impact of Coronavirus on China’s SMEs: Findings from the Enterprise Survey for Innovation and Entrepreneurship in China.” CGD Note, Center for Global Development, Washington, DC, and London.
Dell, M., B. F. Jones, and B. A. Olken. 2012. “Temperature Shocks and Economic Growth: Evidence from the Last Half Century.” American Economic Journal: Macroeconomics 4 (3): 66–95.
Einav, L., C. Farronato, and J. Levin. 2016. “Peer-to-Peer Markets.” Annual Review of Economics 8 (1): 615–35.
Fairlie, R. W. 2020a. “The Impact of Covid-19 on Small Business Owners: Evidence of Early-Stage Losses from the April 2020 Current Population Survey.” NBER Working Paper 27309, National Bureau of Economic Research, Cambridge, MA.
Fairlie, R. W. 2020b. “The Impact of COVID-19 on Small Business Owners: The First Three Months after Social-Distancing Restrictions.” NBER Working Paper 27462, National Bureau of Economic Research, Cambridge, MA.
Farrell, D., and F. Greig. 2016. “Paychecks, Paydays, and the Online Platform Economy: Big Data on Income Volatility.” Proceedings. Annual Conference on Taxation and Minutes of the Annual Meeting of the National Tax Association 109: 1–40.
Friedman, G. 2014. “Workers without Employers: Shadow Corporations and the Rise of the Gig Economy.” Review of Keynesian Economics 2 (2): 171–88.
Gandini, A. 2019. “Labour Process Theory and the Gig Economy.” Human Relations 72 (6): 1039–56.
Goldfarb, A., and C. Tucker. 2019. “Digital Economics.” Journal of Economic Literature 57 (1): 3–43.
Hall, J. V., and A. B. Krueger. 2018. “An Analysis of the Labor Market for Uber’s Driver-Partners in the United States.” ILR Review 71 (3): 705–32.

Digital Technologies and Resilience to Shocks 137
Hallward-Driemeier, Mary, Gaurav Nayyar, Wolfgang Fengler, Anwar Aridi, Indermit Gill. 2020. Europe 4.0: Addressing the Digital Dilemma. Washington, DC: World Bank.
Hancock, P. A., J. M. Ross, and J. L. Szalma. 2007. “A Meta-Analysis of Performance Response under Thermal Stressors.” Human Factors 49: 851–77.
Hsiang, S. 2010. “Temperatures and Cyclones Strongly Associated with Economic Production in the Caribbean and Central America.” Proceedings of the National Academy of Sciences 107: 15367–72. https://doi.org/10.1073/pnas.1009510107.
Hsu, P. H., H. H. Lee, S. C. Peng, and L. Yi. 2018. “Natural Disasters, Technology Diversity, and Operating Performance.” Review of Economics and Statistics 100 (4): 619–30.
Humphries, J. E., C. Neilson, and G. Ulyssea. 2020. “The Evolving Impacts of COVID-19 on Small Businesses since the CARES Act.” Cowles Foundation Discussion Paper 2230, Cowles Foundation for Research in Economics, Yale University, New Haven, CT.
Imai, K., L. Keele, and T. Yamamoto. 2010. “Identification, Inference and Sensitivity Analysis for Causal Mediation Effects.” Statistical Science 25 (1): 51–71.
Jin, H., and F. Hurd. 2018. “Exploring the Impact of Digital Platforms on SME Internationalization: New Zealand SMEs Use of the Alibaba Platform for Chinese Market Entry.” Journal of Asia-Pacific Business 19 (2): 72–95.
Katz, L. F., and A. B. Krueger. 2019. “The Rise and Nature of Alternative Work Arrangements in the United States, 1995–2015.” ILR Review 72 (2): 382–416.
Koren, M., and S. Tenreyro. 2013. “Technological Diversification.” American Economic Review 103 (1): 378–414.
Nyman, Sara, and Yana Ukhaneva. Forthcoming. “The Supply and Use of Digital Technologies by Businesses in Developing Countries: An Analysis Using Enlyft Data.” World Bank, Washington, DC.
Park, J., N. Pankratz, and A. Behrer. 2021. “Temperature, Workplace Safety, and Labor Market Inequality.” IZA Discussion Paper 14560, IZA Institute of Labor Economics, Bonn.
Rivares, A. B., P. Gal, V. Millot, and S. Sorbe. 2019. “Like It or Not? The Impact of Online Platforms on the Productivity of Incumbent Service Providers.” OECD Economics Department Working Paper 1548, Organisation for Economic Co-operation and Development, Paris.
Seppanen, O., W. Fisk, and Q. Lei. 2006. “Effect of Temperature on Task Performance in Office Environment.” Lawrence Berkeley National Laboratory, Berkeley, CA.
Umar, M., Y. Xu, and S. S. Mirza. 2020. “The Impact of Covid-19 on Gig Economy.” Economic Research-Ekonomska Istraživanja 34 (1): 2284–96.
UNCTAD (United Nations Conference on Trade and Development). 2019. Digital Economy Report 2019. Value Creation and Capture: Implications for Developing Countries. Geneva: UNCTAD.
Van Reenen, J., and A. Valero. 2021. “How Is Covid-19 Affecting Firms’ Adoption of New Technologies?” Economics Observatory, Science, Technology & Innovation, January 8.
World Bank. 2021. Antitrust and Digital Platforms: An Analysis of Global Patterns and Approaches by Competition Authorities. Equitable Growth, Finance and Institutions Insight. Washington, DC: World Bank.
Zhu, T. J., P. Grinsted, H. Song, and M. Velamuri. Forthcoming. “Digital Businesses in Developing Countries: New Insights for a Digital Development Pathway.” World Bank, Washington, DC.


PART 3What Countries Can Do to Bridge the
Technological Divide


141
6. What Constrains Firms from Adopting Better Technologies?
Introduction
If more sophisticated technologies lead to productivity gains, why don’t firms
adopt and use them more intensively? Understanding what drives firms to adopt a
specific technology is essential to improve the effectiveness of policies aiming to
support technology upgrading. This chapter analyzes the key obstacles firms face in
adopting sophisticated technologies. Specifically, it addresses the following
questions:
■■ What are the key determinants of technology adoption by firms highlighted by
the literature?
■■ What are the main drivers and obstacles for adoption that entrepreneurs and
managers themselves perceive?
■■ What is the association between the key determinants highlighted by the litera-
ture and the level of sophistication of the technology actually adopted by firms?
To respond to these questions, the first part of this chapter provides a brief sum-
mary of the literature on the main drivers of and barriers to adoption. The discus-
sion looks at technology adoption from the perspective of the firm.1 It then
describes what entrepreneurs themselves perceive as the main obstacles and moti-
vations to adopt new technologies. Finally, it analyzes the association between the
key drivers and obstacles highlighted by the literature and the level of technology
sophistication based on factual evidence from the Firm-level Adoption of
Technology (FAT) data.2
Firm-Level Determinants of Adoption
What factors impede or prevent a firm from deciding to adopt a more sophisticated
technology?3 A good place to start answering this question is to consider the possibility
of positive returns and profits for a firm. A general framework to empirically study
firms’ decisions to invest in a specific technology is described in Besley and Case (1993).
The framework is based on optimizing a dynamic profit function where the present
value of implementing a technology in time t depends on current profits and the dis-
counted expected value of the technology.4

142 Bridging the Technological Divide
In practice, estimating the returns to technology upgrading is challenging, given the
relevance of interacting factors inside and outside the firm.5 In an influential experi-
ment on the use of fertilizer in Kenya, Duflo, Kremer, and Robinson (2008) found that
even when returns to fertilizer use were high, and even when farmers were offered free
delivery in the period during the planting season that the fertilizer needed to be applied,
adoption was low. They surmised that behavioral biases were important. Suri (2011)
reexamined this empirical puzzle by using a methodology to estimate returns to specific
farmers in the adoption of hybrid maize in Kenya and found that farmers with low net
returns did not adopt the technology. These studies suggest that when looking at spatial
differences in returns—and assuming that the technology is known and there is suffi-
cient information about it—individual decision-makers will vary in their assessments
of the benefits and costs of technologies, and that will drive variations in adoption.
In a developing country context, technology upgrading might be more challenging
than in advanced economies because market failures and missing complementarities
are likely to be more acute. This lack of complementary factors also affects the returns
to technology upgrading for individual firms. This issue is documented in the first
volume of the World Bank’s Productivity Project series. Cirera and Maloney (2017)
identify “the innovation paradox,” noting that despite the vast potential returns to
innovation, developing countries invest far less in technology and innovation than
advanced economies, measured along a variety of dimensions. The main factor explain-
ing this paradox is the lack of complementary factors. Some of these factors are internal
investments in knowledge and management by the firm. Others are external to the
firm, such as skills available in the labor market, access to finance, the cost of doing
business, or the supply of knowledge and technologies.
More recently, Verhoogen (forthcoming) provides a comprehensive review of the
literature on firm-level upgrading in developing countries, including technology adop-
tion.6 Verhoogen presents a conceptual framework focusing on the drivers of upgrading
regarding the output side (such as exports and competition), the input side (such as
imported and domestic inputs), and know-how factors (such as entrepreneurial ability
and learning). The evidence reviewed suggests that international trade provides power-
ful channels to promote upgrading, but there is also an important role for learning.
In general, the literature has highlighted several factors that drive firm technology
adoption. Some of these factors are outside the control of the firm and can affect the
profits and returns of adopting a technology, but several factors relate to entrepreneurs
and capabilities of the firm. Figure 6.1 summarizes some of the key factors emphasized
by the literature, organized in two complementary sets of drivers: one internal to the
firm and one external. Organizing the discussion around these two broad topics can
help policy makers identify instruments that are available to support technology
upgrading.

What Constrains Firms from Adopting Better Technologies? 143
In addition to having access to an enabling infrastructure, such as electricity, inter-
net service, or a mobile network, other factors are important to explain firm-level
adoption. Internal factors are related to building firm capabilities. This includes the
knowledge and know-how accumulated and implemented through management and
organizational practices, as well as the information available and biases of the entrepre-
neurs in the decision to adopt a technology. External factors include market dynamics
and the regulatory environment, as well as access to funding to finance technology
projects. The supply of knowledge and technology solutions from other firms or from
public institutions is also very important. All these factors affect the decision to adopt
and the diffusion of existing technologies. Different market failures affect these
elements, from information frictions that result in the underprovision of finance to
externalities and spillovers that are not appropriated and reduce investment in technol-
ogy, or distortions that affect factor prices favoring more energy-intensive or labor-
intensive technologies, for example.7
The rest of this chapter provides some evidence about the importance of these
barriers as observed in the FAT data. First, entrepreneurs’ perceptions of the main
barriers they face are discussed. This analysis is complemented with factual data from
the FAT survey about some of the key barriers and drivers to adoption.
FIGURE 6.1 Technology Adoption Depends on a Set of Complementary Factors That Are External and Internal to the Firm
Source: Original figure for this volume.
External to the firm:
Potential market failures:Externalities and peer effects
Learning effectsAsymmetric information
Coordination failuresMisallocationInfrastructure
Internal to the firm:Management and
organizationKnow-how and skills
capabilitiesInformation and
behavioral biases
Firm adoptionof technology
Competition, demand,and regulations
Access to finance Supply of knowledgeand human capital
Markets
Firm capabilities

144 Bridging the Technological Divide
Perceived Drivers of and Obstacles to Technology Adoption
Drivers
The FAT survey asks firms about their main motivations for upgrading technologies.
Figure 6.2 shows the top motivations for adopting new technologies by firm size group.
The pressure of competition, an external factor, is the main motivation for most firms.
In particular, more than 40 percent of small and medium enterprises (SMEs) report
this as their main reason. This finding is consistent with some of the literature reviewed
in the first part of the chapter.
Interestingly, a second motivation is simply replacement from obsolescence or mal-
function of existing equipment. The third and fourth most reported motivations are
reducing costs to become more competitive and adjusting to new regulations. These
factors are more relevant for large firms than for SMEs. The pattern is similar for the
importance of other firms adopting. Product innovation and access to new markets is
the main reason for about 20 percent of firms. This is consistent with the fact that a
relatively small share of firms innovate and export.
FIGURE 6.2 Competition Is a Top Driver for Technology Adoption
Source: Original figure based on Firm-level Adoption of Technology (FAT) survey data.Note: Results are based on cross-country average using sampling weights. Firm size relates to the number of workers: small (5–19), medium (20–99), large (100 or more).
Competition
Depreciation or replacement
Reduce costs
Adjust to regulations
Produce new products
Access new markets
Other firms adopted
0 25 50 75
Percent of firms
Firm size: Small Medium Large

What Constrains Firms from Adopting Better Technologies? 145
Obstacles
Figure 6.3 shows the share of firms reporting the top three obstacles to adoption by
firm size group. The most common obstacle for all types of firms across countries is
concern about sufficient demand or uncertainty about demand to justify investment in
new technologies. More than 60 percent of firms cite this concern, which is an external
factor. The high percentage is homogeneous across firm size, from large to small firms.
The second most common factor reported is related to lack of capabilities, which
includes the overall technical skills and know-how to implement new technologies.
This is the main internal factor cited.
Around 20 percent to 25 percent of firms cite lack of finance and poor infrastruc-
ture, depending on the obstacle and firm size. Government regulations pose a critical
barrier for less than 25 percent of firms, although the share is much higher in certain
countries, such as Brazil. Compared with the review of the evidence, finance and
infrastructure play a more important role in the mind of entrepreneurs and managers
than the emphasis in the literature would suggest. In the case of infrastructure, this is
likely because entrepreneurs and managers in the FAT survey sample are more diverse
in sector and firm size and have a different focus than various studies looking more
FIGURE 6.3 Lack of Demand and Firm Capabilities Are Key Obstacles for Technology Adoption
Source: Original figure based on Firm-level Adoption of Technology (FAT) survey data.Note: The figure shows the share of firms reporting each obstacle as among its top three obstacles. Results based on cross-country average using sampling weights. Firm size refers to the number of workers: small (5–19), medium (20–99), large (100 or more). a. Uncertainty refers to uncertainty about future demand.
Firm size: Small Medium Large
Lack of demand and uncertaintya
Lack of finance
Poor infrastructure
Lack of capabilities
Government regulations
Other
0 25 50 75
Percent of firms

146 Bridging the Technological Divide
narrowly at some sectors in developing countries. There is also some heterogeneity
across countries regarding the identified main obstacle. Firms in Senegal cite lack of
capabilities, while firms in Vietnam mention lack of demand.
Learning about perceived obstacles is important for policy makers. Addressing
those issues that entrepreneurs already identify as main obstacles may facilitate polit-
ical support to implement reforms. Yet, perceived obstacles and drivers do not neces-
sarily imply that these are the most relevant issues faced by the firms. Firms do not
know what they do not know. Having more factual evidence, including impact evalu-
ations, about the elements that determine lack of adoption is critical to designing
policy well.
Factual Evidence on Drivers of and Obstacles to Technology Adoption
This section reviews the factual evidence reported in the FAT survey about key drivers
and obstacles for firm technology adoption. Following the framework in figure 6.1,
these factors are divided into two groups: those external to the firm and in the enabling
environment; and those internal to the firm. External factors that are part of the
enabling environment include infrastructure, markets and competition, financial con-
straints, and access to external knowledge. Internal factors to the firms that affect firms’
capabilities and knowledge include information and behavioral biases, management
quality and organization, and know-how and skills.
Factors External to the Firm: An Enabling Environment
InfrastructureInfrastructure in general, from electricity to roads and telecommunications, plays an
important role as an enabler of technology adoption by firms. Evidence across African
countries, for instance, suggests that the spread of fast internet connection has increased
firm entry, productivity, and exports in African countries (Hjort and Poulsen 2019).
The rapid spread of the internet, as described in chapter 1, and recent increase in the
demand for digital technologies due to the COVID-19 pandemic have heightened the
role of digital infrastructure.
To assess the effect of digital infrastructure on adoption, we use a unique data set for
Senegal that allows the impact of geographic proximity to internet infrastructure to be
measured.8 In the spirit of Hjort and Poulsen (2019), the analysis, described in Berkes
et al. (forthcoming), combines information on the GPS location of the firms that par-
ticipated in the FAT survey in Senegal with the location of the node of the Senegalese
internet backbone. It then explores the contribution of digital infrastructure to the
adoption of technologies through the effects of the proximity to the nodes, which
translate into having access to better quality internet service, which was improved
through the arrival of submarine internet cables in 2011.

What Constrains Firms from Adopting Better Technologies? 147
Map 6.1 shows the distribution of firms (blue dots) and the location of the nodes of
the Senegalese internet backbone (red dots). Panel a describes the distribution of firms
in the data, selected from a random sample drawn from the latest establishment census.
Panel b replicates this information for firms with internet access.
The results show that the distance to a node of the Senegalese internet backbone is
a strong predictor of having an internet connection. Specifically, doubling the distance
from a node reduces the likelihood of having an internet connection by 5 percentage
points (figure 6.4).9 Interestingly, the effect is even stronger (7 percentage points) when
considering only the subset of firms established more than 10 years ago, suggesting that
these firms already existed before the arrival of submarine internet cables. As expected,
proximity to a node increases the likelihood of having a high-speed DSL connection.10
More important, the analysis can be extended to explore the impact of having inter-
net on the sophistication of technology use, using instrumental variables to better
identify the causal effect.11 Figure 6.5 shows that the quality of internet service can
explain only adoption of more sophisticated technologies for general business func-
tions at the extensive margin, but not for sector-specific business functions, on average,
where digital may be less prevalent and internet service less of an enabler. Results are
robust when restricting the sample for firms with 10 or more years of age.
Overall, the results confirm the importance of digital infrastructure as an enabler of
technology for firms, but they also show that facilitating access to the internet due to
improvement of infrastructure does not explain a large variation of technology sophis-
tication across firms. In the case of sector-specific business functions (SBFs), the
results can be explained by the fact that many SBFs—particularly in agriculture and
manufacturing—are not fully digital or are embedded in sophisticated machines that
many firms cannot afford or that pose other types of barriers in terms of firms’ access
to information or know-how.
Markets, Competition, and RegulationMarket structure and competition are critical external drivers for technology adoption.
Competition provides incentives to adopt new technologies. For instance, competition
from China has driven increases in innovation and the adoption of information and com-
munication technologies (ICTs) in the United Kingdom (Bloom, Draca, and Van
Reenen 2016). However, since work by Aghion et al. (2005) found an inverted-U relation-
ship between innovation and competition, the literature has been more nuanced about this
relationship depending on the type of market in which the firms operate. Generally, greater
market competition can help enable innovation and technology adoption, especially in
cases where competition is low to start with, but this pattern varies greatly by sector, and the
regulatory environment can shape firms’ decisions (Hannan and McDowell 1984).
Regulatory issues are also critical when it comes to adoption of certain data-intensive tech-
nologies and access to digital platforms (see box 6.1).
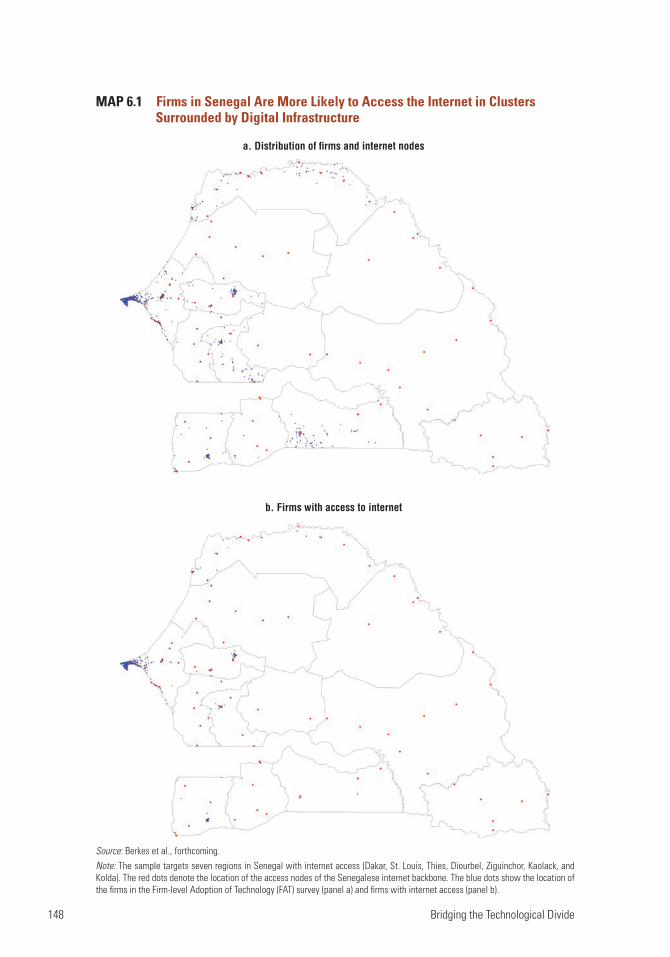
148 Bridging the Technological Divide
Source: Berkes et al., forthcoming.Note: The sample targets seven regions in Senegal with internet access (Dakar, St. Louis, Thies, Diourbel, Ziguinchor, Kaolack, and Kolda). The red dots denote the location of the access nodes of the Senegalese internet backbone. The blue dots show the location of the firms in the Firm-level Adoption of Technology (FAT) survey (panel a) and firms with internet access (panel b).
MAP 6.1 Firms in Senegal Are More Likely to Access the Internet in Clusters Surrounded by Digital Infrastructure
a. Distribution of firms and internet nodes
b. Firms with access to internet
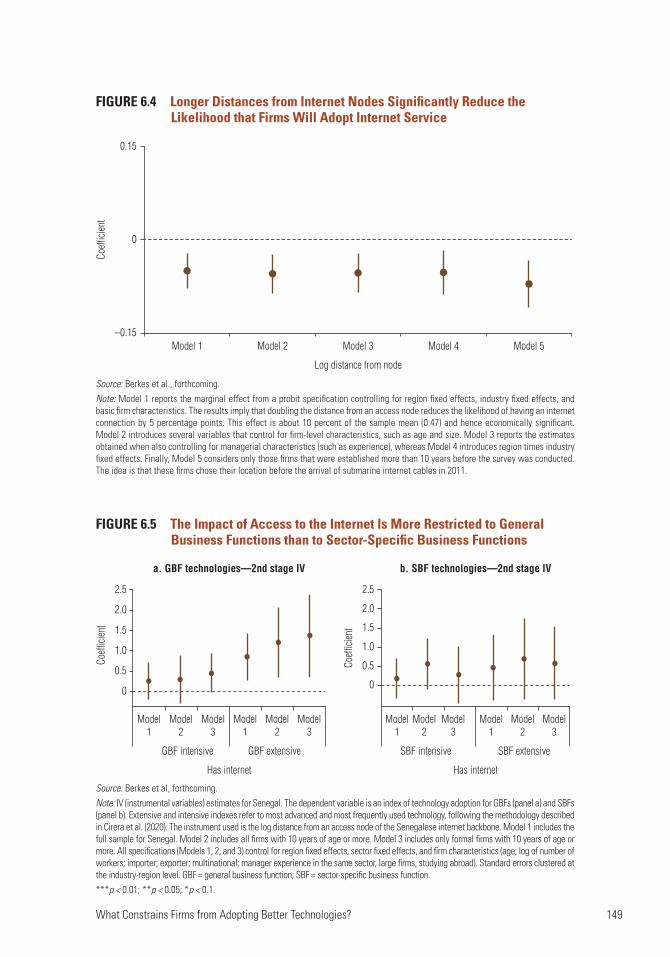
What Constrains Firms from Adopting Better Technologies? 149
FIGURE 6.4 Longer Distances from Internet Nodes Significantly Reduce the Likelihood that Firms Will Adopt Internet Service
0.15
0
–0.15Model 1 Model 2 Model 3
Log distance from node
Coeffi
cient
Model 4 Model 5
Source: Berkes et al., forthcoming.Note: Model 1 reports the marginal effect from a probit specification controlling for region fixed effects, industry fixed effects, and basic firm characteristics. The results imply that doubling the distance from an access node reduces the likelihood of having an internet connection by 5 percentage points. This effect is about 10 percent of the sample mean (0.47) and hence economically significant. Model 2 introduces several variables that control for firm-level characteristics, such as age and size. Model 3 reports the estimates obtained when also controlling for managerial characteristics (such as experience), whereas Model 4 introduces region times industry fixed effects. Finally, Model 5 considers only those firms that were established more than 10 years before the survey was conducted. The idea is that these firms chose their location before the arrival of submarine internet cables in 2011.
FIGURE 6.5 The Impact of Access to the Internet Is More Restricted to General Business Functions than to Sector-Specific Business Functions
2.5
2.0
1.5
1.0
0.5
0
2.5
2.0
1.5
1.0
0.5
0
Model1
GBF intensive GBF extensive SBF intensive SBF extensive
Model2
Model3
Model1
Model1
Model1
Model2
Model2
Model2
Model3
Model3
Model3
Has internet
Coeffi
cient
Coeffi
cient
a. GBF technologies—2nd stage IV b. SBF technologies—2nd stage IV
Has internet
Source: Berkes et al, forthcoming. Note: IV (instrumental variables) estimates for Senegal. The dependent variable is an index of technology adoption for GBFs (panel a) and SBFs (panel b). Extensive and intensive indexes refer to most advanced and most frequently used technology, following the methodology described in Cirera et al. (2020). The instrument used is the log distance from an access node of the Senegalese internet backbone. Model 1 includes the full sample for Senegal. Model 2 includes all firms with 10 years of age or more. Model 3 includes only formal firms with 10 years of age or more. All specifications (Models 1, 2, and 3) control for region fixed effects, sector fixed effects, and firm characteristics (age; log of number of workers; importer; exporter; multinational; manager experience in the same sector, large firms, studying abroad). Standard errors clustered at the industry-region level. GBF = general business function; SBF = sector-specific business function.***p < 0.01; **p < 0.05; *p < 0.1.

150 Bridging the Technological Divide
BOX 6.1
Specific Barriers to the Use of Digital Platforms
Despite the benefits that digital platforms can bring to the economy in developing countries, there are also important adoption challenges. Cusolito (2021) summarizes these technology adoption challenges in five categories: (1) coordination problems; (2) lack of trust; (3) weak standard compliance and enforcement; (4) self-deregulation; and (5) regulatory loopholes. Coordination problems and regulatory issues are very common in developing countries. Coordination problems happen in the presence of network effects, given that the benefits that adoption of a digital platform brings to a potential user depend primarily on the size of the net-work effects, which are a function of the adoption decisions of other firms. To address coordina-tion problems, many digital platforms try to subsidize or help firms (or service providers) with the initial investments they need to boost connection. This has significant implications for public policy given that the platform, rather than government, could solve the coordination problem. Indeed, several e-commerce platforms provide business support services to vendors. For exam-ple, the e-commerce platform Jumia has created Jumia University to train vendors to help them deliver the best shopping experience to their customers.a
Regulatory barriers can play an important role in delaying adoption. Platforms often face out-dated regulations applied to activities that have been primarily provided offline in the past (such as ride-sharing or accommodation). Regulatory bottlenecks are especially present in the area of e-commerce. Enabling regulations are needed regarding electronic documentation and signatures, financial law related to e-payments, consumer protection, intellectual property, cybersecurity, personal privacy, and data protection, Daza Jaller, Gaillard, and Molinuevo (2020) emphasize. But many countries lack a well-designed regulatory framework that can enable online intermedia-tion while protecting consumers. These regulatory bottlenecks apply not only to digital platforms but also to technologies more generally. For example, in Brazil, taxes on microchips and SIM cards, which were taxed individually, were impeding the diffusion of agricultural technologies connected to the Internet of Things.
Source: Cusolito 2021.a. Jin and Sun (2020) evaluate training provided by a platform operator and find that it increases new sellers’ likelihood of being found by consumers, improving the matching quality between consumers and sellers.
Access to international markets and competition in the domestic market are
important drivers of adoption. About 40 percent of firms report “competition” as a
key driver (see figure 6.2). Access to international markets has large effects on produc-
tivity via competition and learning, and these channels can also result in the use of
more sophisticated technologies.12 Panel a of figure 6.6 shows the relationship between
exporting status and the technology index, while panel c shows the results of a similar
exercise with importing status. Both exporting and importing activities have a signifi-
cant correlation with technology use. Panels b and d also show that larger firms are
significantly more likely to export and import, which is consistent with the behavior
observed by the trade literature (Wagner 1995).

What Constrains Firms from Adopting Better Technologies? 151
FIGURE 6.6 Globally Engaged Firms Are More Sophisticated Technologically
Source: Original figure based on Firm-level Adoption of Technology (FAT) survey data.Note: Panels a and c provide the coefficients and 95 percent confidence intervals from regressions. Each technology measure is regressed on exporter/importer dummies, respectively, while controlling for country, sector, and firm size. Panels b and d show the predicted probability of exporter/importer status on firm size from the probit regressions with controlling for other baseline characteristics. All estimates are weighted by sampling and country weights. EXT = extensive margin; GBF = general business function; INT = intensive margin; SBF = sector-specific business function.
0
0
0.1
0
10
20
30
40
50
60
0.2
0.3
0.4
0.5
GBF EXT GBF INT Small Medium Large
Small Medium Large
SBF INTSBF EXT
GBF EXT GBF INT SBF INTSBF EXT
0.1
0.2
0.3
60
50
40
30
20
10
0
0.4
0.5
a. Technology and exporters
c. Technology and importers d. Importers and firm size
b. Exporters and firm size
Coeffi
cient
Coeffi
cient
Pred
icted
pro
babi
lity (
%)
Pred
icted
pro
babi
lity (
%)
Scale and learning mechanisms through demand are important drivers of technol-
ogy adoption. Bustos (2011) and Lileeva and Trefler (2010) show that following trade
policy reforms for Argentina and Canada, scale effects through exports increased tech-
nology adoption by firms in both countries.
Firms integrated to international markets as exporters, importers, foreign-owned
entities, or multinationals tend to use more sophisticated technologies across different
business functions. Aside from payment methods, exporting companies use more
advanced technologies for general business functions. In the intensive margin, the gap is
particularly large for business administration tasks. The exercise of decomposing the
technology index between domestic and foreign-owned companies is repeated in
figure 6.7. Firms were considered to be foreign owned if they had more than 10 percent
foreign ownership. Interestingly and despite the previous results, the differences between
domestic and foreign-owned companies were found to be small on the intensive margin
(that is, on the technology used more intensively). Yet, foreign firms use more sophisti-
cated technologies, especially for business administration, planning, and sourcing.

152 Bridging the Technological Divide
FIGURE 6.7 Foreign-Owned Companies Tend to Have More Sophisticated Technologies across General Business Functions
Source: Original figure based on Firm-level Adoption of Technology (FAT) survey data.
Domestic Foreign owned
Business administration
a. Extensive margin
Planning
Sourcing
MarketingSales
Payment
Quality control
Business administration
b. Intensive margin
Planning
Sourcing
MarketingSales
Payment
Quality control
12345
12345
Financial ConstraintsAn inefficient financial system may make it harder for firms to access finance to invest
in technology, and thus may deter technology adoption. A significant number of entre-
preneurs and managers cited financial constraints as an important barrier to technol-
ogy adoption. Thus, an important question is how correlated adoption of sophisticated
technologies is to access to finance.
Panel a of figure 6.8 shows a positive and statistically significant relationship between
the technology adoption measures for both GBFs and SBFs at both the extensive (EXT)
and intensive (INT) margins and access to loans. The coefficient is larger for GBF-EXT,
suggesting that firms that have access to loans for purchasing machines or software tend
to use more sophisticated technologies in GBFs than in SBFs. Panel b shows the predicted
probability of having access to financial loans for the acquisition of machines or software
by firm size. Small firms have about a 22 percent probability of having a loan to acquire
machines or software, compared to large firms, which have around a 38 percent probabil-
ity. Given the correlation between access to finance and technology sophistication, the
financial channel is likely to be a constraint to technology upgrading for smaller firms,
which often need to use their own resources to finance technology.
This result is supported by some evidence in the literature. Previous studies sug-
gest that an inefficient financial system, with large information asymmetries or dis-
tortions to finance, may reduce and underfinance firm-level technology adoption
within a country even if the use of a technology would be more profitable. For exam-
ple, Midrigan and Xu (2014) find that financial frictions distort firm entry and tech-
nology adoption decisions, which results in lower levels of aggregate productivity.
Cole, Greenwood, and Sanchez (2016) show that the efficiency of the financial system
determines which technologies are adopted by firms across countries. Other studies

What Constrains Firms from Adopting Better Technologies? 153
have also found suggestive evidence that the improvement of local financial systems
increases firm-level technology adoption in the Russian Federation (Bircan and De
Haas 2019) and in agriculture in Ethiopia (Abate et al. 2016).
Access to External Knowledge and Human CapitalFirms can learn and improve their know-how through different sources, including
knowledge transfer through other firms, within the firm, and from consultant services.
Learning by exporting is another route. For instance, Atkin, Khandelwal, and Osman
(2017) focus on carpet producers in the Arab Republic of Egypt and show evidence of
learning by exporting that was induced by demand for high-quality products from
knowledgeable buyers in high-income countries. A large body of evidence has explored
the importance of learning and having access to better information for technology
adoption, mostly focusing on agricultural firms (Foster and Rosenzweig 1995; Gupta,
Ponticelli, and Tesei 2020; Beaman et al. 2021).
An important source of knowledge transfer to the firm may come from external consul-
tants. Panel a of figure 6.9 shows that using an external consultant is significantly associated
with a higher score in the technology index, by between 0.2 and 0.4 points. The likelihood
of using external consultant services varies between 14 percent for small firms and 48 per-
cent for large firms (panel b), suggesting that while half of large firms use these external
consultants, only around one in six small firms uses this form of external knowledge.
Panel c shows that the most common type of consultant is from local firms, fol-
lowed by business associations and foreign firms. Only a small share of firms benefit
FIGURE 6.8 Constraints to Financial Credit Are a Larger Barrier to Technology Upgrading for Smaller Firms
Source: Original figure based on Firm-level Adoption of Technology (FAT) survey data.Note: Panel a provides the coefficients and 95 percent confidence intervals from regressions. Each technology measure is regressed on a dummy for taking loans to purchase machines/software and interest rates, respectively, while controlling for formality, sector, size, and regions. Panel b shows the predicted probability of getting loans by firm size groups and confidence intervals from the probit regression while controlling for other baseline characteristics. All estimates are weighted by sampling and country weights. Firm size refers to the number of workers: small (5–19), medium (20–99), and large (100 or more). EXT = extensive margin; GBF = general business function; INT = intensive margin; SBF = sector-specific business function.
0 0
10
20
30
40
0.10
0.15
0.20
0.05
GBF EXT GBF INT SBF EXT SBF INT Small Medium Large
a. Technology adoption on loans forpurchasing machines/software
b. Probability of having a loan to purchase machines/software, by firm size
Coeffi
cient
Pred
icted
pro
babi
lity (
%)

154 Bridging the Technological Divide
FIGURE 6.9 Firms That Use External Business Consultants Have Higher Levels of Technology Sophistication
Source: Original figure based on Firm-level Adoption of Technology (FAT) survey data.Note: Panel a provides the coefficients and 95 percent confidence intervals from regressions. Each technology measure is regressed on a dummy for the use of external consultant by the firm, while controlling for country, sector, firm size, and regions. Panel b presents the likelihood that firms have used consultants by firm size group. Panel c shows the share of firms by type of consultant services received. Panel e shows the share of firms by main reason for not using a consultant. Panels d and f provide the coefficients and 95 percent confidence intervals from regressions analyzing the correlation between technology measures and the type of consultants or reason to not use consultants, controlling for country, sector, firm size, regions, and the use of consultants. All estimates are weighted by sampling and country weights. EXT = extensive margin; GBF = general business function; INT = intensive margin; SBF = sector-specific business function.
0
0.1
0.2
0.3
0.4
0.5
0.6
Coeffi
cient
a. Technology and externalconsultants
b. Probability of using an external consultant,by firm size
GBF EXT GBF INT SBF EXT SBF INT0
20
40
60
80
Pred
icted
pro
babi
lity (
%)
Small Medium Large
c. Main sources of consultant
0 105 20 25 35 4515 30 40 50 55
Percent of firms
University 5
Goverment 3
Foreign firms 14
Business association 15
Others 11
Local firms 52
d. Type of consultant and technology sophistication
–0.5
0.5
1.0
0Coeffi
cient
Univers
ity
Goverm
ent
Local
firms
Forei
gn fir
ms
Busines
s asso
ciatio
nOthe
rs
GBF INT SBF INT
e. Main reason for not using a consultant f. Main reason for not using a consultant andtechnology sophistication
Don’t know a consultant 7
Lack of trust 10
Too costly 13
No need 67
Others 2
0 20 40 60 80
Percent of firms
–0.3
–0.4
–0.1
0
–0.2
Coeffi
cient
Don’t k
now a c
onsul
tant
Lack o
f trust
Too c
ostly
No need Othe
rs
GBF INT SBF INT

What Constrains Firms from Adopting Better Technologies? 155
from consultants coming from a university or government. Panel d shows a positive
relationship between technology sophistication and different types of consultants rela-
tive to not using consultants. Consulting services provided by local and foreign firms
are both significantly correlated with technology sophistication, but the coefficient for
foreign firms is larger. Panel e examines the main reason firms do not use consultants.
The most common reason reported is the belief that firms do not need it. The negative
coefficients in panel f for the different reasons for not using a consultant and technol-
ogy sophistication, relative to using a consultant, reinforce the importance of accessing
external knowledge.
In a recent systematic review looking at interventions to promote technology adop-
tion, Alfaro-Serrano et al. (2021) find mixed evidence on the impact of various inter-
ventions to support technology adoption which are primarily based on the use of
external consultants (see next chapter). While the context of the intervention differs
from the normal use of external knowledge for technology adoption, the authors find
a positive impact on technology adoption in 19 out of 33 studies for manufacturing
and services firms. Providing access to external knowledge is a common type of
support in developed economies via extension services.
Another important source of knowledge is associated with the availability of
engineers, as a specialized type of human capital that plays a critical role on technology
absorption. Maloney and Valencia Caicedo (2022) build an indicator of engineer
intensity for US counties around 1880 and show that a one standard deviation increase
in engineers in 1880 accounts for a 16 percent increase in US county income today.
Maloney (2002) shows that one of the main reasons that explain the failure to take
advantage of growth opportunities in the early twentieth century in some countries
in Latin America, with similar factor endowments to Australia, Canada, and
Scandinavia, was low investment in human capital and scientific infrastructure, which
led to poor innovation and technology adoption.
Factors Internal to the Firm: Firm Capabilities
Information and Behavioral Biases An important element to explain a firm’s decision to adopt a more sophisticated tech-
nology is its willingness to do so. A behavioral bias that may influence this decision, as
discussed in chapter 2, is reference group neglect: that is, entrepreneurs believe them-
selves to have a particular skill but neglect to realize that they are competing with oth-
ers who also possess that skill (Camerer and Lovallo 1999). For example, if a firm
believes that it is already adopting more sophisticated technologies relative to its com-
petitors, it is unlikely that business will invest in additional technologies. Then the
question is whether firms are aware of their actual technology gap.
To address this question, the FAT survey includes a question to managers to self-
assess their technological level. The results of their self-assessment are compared with

156 Bridging the Technological Divide
the actual measurement index in the survey. Specifically, the FAT survey asks for a self-
assessment of technology from 1 to 10 (here rescaled to 1 to 5), comparing the respon-
dent’s firm with other firms within the country and with firms that are global technology
leaders in their sector.13
Figure 6.10 replicates and expands figure 2.14 in chapter 2 and shows the predicted
self-assessment of technology according to the technology adoption index and a 95 per-
cent confidence interval. The 45-degree line shows the point where self-assessed and
actual scores coincide. Panels a and b compare respondent firms with domestic firms,
while panels c and d compare respondent firms to global leaders in the sector—the fron-
tier. Interestingly, most firms are overconfident (shown by their location above the
45-degree line) since their perception of how sophisticated they are is greater than their
FIGURE 6.10 Firms with a Lower Level of Technology Are Especially Likely to Think They Are More Technologically Sophisticated than They Actually Are
Source: Original figure based on Firm-level Adoption of Technology (FAT) survey data.Note: The orange line shows the quadratic fit with 95 percent confidence interval using sampling weights. GBF = general business function; SBF = sector-specific business function.
a. In relation to other firms in the country
1
2
3
4
5
Self-
asse
ssm
ent o
f tec
hnol
ogy
1 2 3 4 5
GBF technology index (intensive margin, quintiles)
b. In relation to other firms in the country
1
2
3
4
5
Self-
asse
ssm
ent o
f tec
hnol
ogy
1 2 3 4 5
SBF technology index (intensive margin, quintiles)
c. In relation to the most advancedfirms in the world
1
2
3
4
5
Self-
asse
ssm
ent o
f tec
hnol
ogy
1 2 3 4 5
GBF technology index (intensive margin)
d. In relation to the most advancedfirms in the world
1
2
3
4
5
Self-
asse
ssm
ent o
f tec
hnol
ogy
1 2 3 4 5
SBF technology index (intensive margin)

What Constrains Firms from Adopting Better Technologies? 157
actual level of technology. More important, this excess confidence or reference group
neglect is larger for those firms that use less sophisticated technologies. This overconfi-
dence constrains their willingness to adopt and use more sophisticated technologies.
Firms’ overconfidence is greater when they compare themselves with domestic firms, and
it corrects itself when comparing with international firms. This pattern is common, on
average, in firms whose technology index for GBFs and SBFs is relatively low (less than 3
on a 5-point scale). This overconfidence, especially among those competing in local mar-
kets, is an important deterrent of adoption. Similar overconfidence results are found for
management quality (Bloom and Van Reenen 2007; Cirera and Maloney 2017), and sug-
gest that some of these biases are not uncommon when it comes to firm upgrading in
general, including upgrading management practices.
Flows of Information and Skills and Links to Large Firms and Multinational EnterprisesEven if potential returns are high, firms may not adopt a new technology if they lack
information about these returns, have difficulty evaluating uncertainty, or lack
knowledge about how to use the technology. In this context, learning is important.
The dominant approach to explain technology adoption has been to frame adoption
decisions in a learning environment where benefits and costs to the technologies are
homogeneous but unknown and are learned over time. This leads to diffusion processes
that resembles an S-shape, consistent with epidemic frameworks laid out by Griliches
(1957) and Mansfield (1963). Although learning and externalities dominate adoption
processes (Besley and Case 1993), uncertainty associated with market conditions and
demand also plays an important role in investment decisions.
Among formal and larger firms, the flows of information and skills with
multinational enterprises and other large firms can facilitate technology adoption.
These flows tend to happen when firms are geographically closer to other large firms
that produce similar products or provide similar services (Foster and Rosenzweig 1995;
Bandiera and Rasul 2006; Conley and Udry 2010), and do business with those firms as
well as with other multi national firms (Alipranti, Milliou, and Petrakis 2015). Figure
6.11, based on data from the FAT survey, shows a positive association between firms
that do business with multinationals or have chief executive officers (CEOs) or top
managers who have previous experience in large firms and technology adoption,
especially for larger firms. Assuming that these CEOs/top managers are exposed to
more firms with more advanced technologies, they become an important source of
information on technology adoption. The shares of formal and large firms with CEOs
or managers with previous experience in other large firms are more than twice the
shares of informal and small firms. More important, as shown in panel a, the sources of
information that are more correlated with higher scores on technology indexes are the
links to multinational enterprises as suppliers and buyers and the experience of CEOs/
top managers with larger firms.
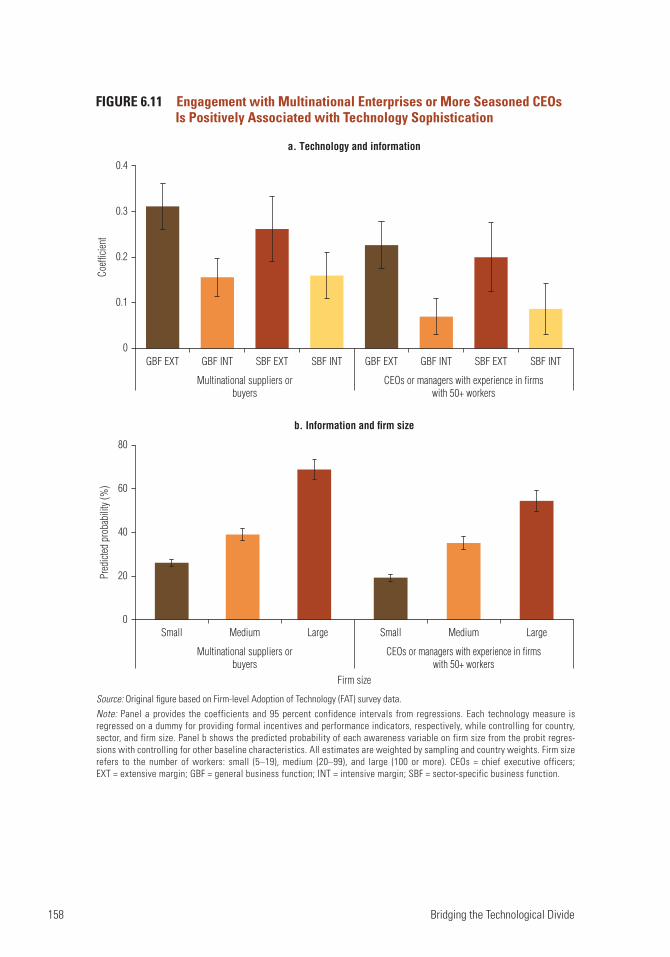
158 Bridging the Technological Divide
0
0.1
0.2
0.3
0.4
a. Technology and information
b. Information and firm size
Coeffi
cient
Multinational suppliers orbuyers
CEOs or managers with experience in firmswith 50+ workers
GBF EXT GBF INT SBF EXT SBF INT GBF EXT GBF INT SBF EXT SBF INT
0
20
40
60
80
Small Medium Large Small Medium Large
Multinational suppliers orbuyers
CEOs or managers with experience in firmswith 50+ workers
Firm size
Pred
icted
pro
babi
lity (
%)
FIGURE 6.11 Engagement with Multinational Enterprises or More Seasoned CEOs Is Positively Associated with Technology Sophistication
Source: Original figure based on Firm-level Adoption of Technology (FAT) survey data.Note: Panel a provides the coefficients and 95 percent confidence intervals from regressions. Each technology measure is regressed on a dummy for providing formal incentives and performance indicators, respectively, while controlling for country, sector, and firm size. Panel b shows the predicted probability of each awareness variable on firm size from the probit regres-sions with controlling for other baseline characteristics. All estimates are weighted by sampling and country weights. Firm size refers to the number of workers: small (5–19), medium (20–99), and large (100 or more). CEOs = chief executive officers; EXT = extensive margin; GBF = general business function; INT = intensive margin; SBF = sector-specific business function.

What Constrains Firms from Adopting Better Technologies? 159
Management Quality and OrganizationFirm capabilities can be defined as those elements of the production process that can-
not be bought “off the shelf” on the market and hence must be learned and accumu-
lated by the firm (Lall 1992; Sutton 2012). To accumulate these capabilities and manage
them, organizational structures (Garicano and Rossi-Hansberg 2006); management
practices (Bloom and Van Reenen 2007; Cirera and Maloney 2017); and worker skills
are needed. Knowledge is also required to master technologies, and elements that facili-
tate the accumulation of this knowledge are important drivers of the adoption of new
technologies. This process is emphasized in historical accounts of the East Asian mira-
cles, which stress the importance of learning and raising the technological capabilities
of firms (Kim and Nelson 2000).
An important source of firm capabilities is, therefore, the quality of management,
which starts with the human capital of the main manager. Figure 6.12 shows the correla-
tion between the human capital of managers (panel a) and technology use. The FAT data
show that having a manager who has a college degree or who has studied abroad is sig-
nificantly associated with higher levels of technology across different measures. Panel b
shows that large firms are more likely to have managers with greater human capital.
Managerial practices and organizational capabilities have been emphasized as
important drivers of technology adoption by the literature. For example, Atkin et al.
(2017) conducted an experimental evaluation to demonstrate the importance of orga-
nization and incentives in technology adoption. The authors provided producers of
leather soccer balls with an off-the-shelf technology to cut leather and produce balls
that was more cost-effective. However, many producers did not adopt this new technol-
ogy due to a misalignment of incentives within firms. Specifically, the key employees
(cutters and printers) were typically paid piece rates and had no incentive to reduce
waste and adopt the new technology. Given that the new technology slowed them
down, at least initially, and there were no incentives to reduce waste, the new technol-
ogy was not widely adopted.
The FAT survey also allows comparisons of the relationship between a firm’s
management practices and technology adoption. The questionnaire asks (1) whether
firms make use of formal incentives and (2) the number of performance indicators
they use as measures of the firm’s overall management quality. Our analysis uses these
two measures and correlates them with the GBF technology index. Panel c of figure 6.12
shows that firms that use formal incentives with workers have a higher index for both
the extensive and intensive margin of technology sophistication. Panel d also suggests
that firms with more performance monitoring indicators use more advanced technolo-
gies. Although the correlations are not large, the results highlight the importance of
management quality as a complement to technology adoption. This positive relation-
ship is also observed in the FAT survey data. Innovation and technology adoption are
often driven by workers when they have incentives to do so.

160 Bridging the Technological Divide
FIGURE 6.12 Firms with Better Management Characteristics, Management Practices, and Organizational Capabilities Have Higher Levels of Technology Sophistication
0
0.1
0.2
0.3
0.4
0.5a. Technology and top managers
b.Top managers and firm size
Coeffi
cient
Top manager with BA+ Top manager studied abroad
GBF EXT GBF INT SBF EXT SBF INT GBF EXT GBF INT SBF EXT SBF INT
0
50
100
Small Medium Large
Firm size
Small Medium Large
Top manager with BA+ Top manager studied abroad
Pred
icted
pro
babi
lity (
%)
(Figure continues on the following page.)

What Constrains Firms from Adopting Better Technologies? 161
FIGURE 6.12 Firms with Better Management Characteristics, Management Practices, and Organizational Capabilities Have Higher Levels of Technology Sophistication (continued)
c. Technology and formal incentives
d. Technology and performance monitoring
1−2 key performance indicators 3−9 key performance indicators 10 or more key performanceindicators
GBFEXT
GBF EXT
GBFINT
GBF INT
SBFEXT
SBF EXT
Formal incentives
SBFINT
SBF INT
GBFEXT
GBFINT
SBFEXT
SBFINT
GBFEXT
GBFINT
SBFEXT
SBFINT
0
0.2
0.4
0.8
0.6
Coeffi
cient
0
0.1
0.2
0.3
Coeffi
cient
Source: Original figure based on Firm-level Adoption of Technology (FAT) survey data.Note: Panel a provides the coefficients and 95 percent confidence intervals from regressions. Each technology measure is regressed on a dummy for the education of the top manager (such as a bachelor’s degree or higher degree [BA+] and study abroad), while controlling for country, sector, firm size, and regions. Panel b shows the predicted probability of having top managers with BA+ or studying abroad by firm formality and firm size, with confidence intervals from the probit regressions controlling for other baseline characteristics. Panels c and d provide the coefficients and 95 percent confidence intervals from regressions. Each technology measure is regressed on a dummy for providing formal incentives and performance indicators, respectively, while controlling for country, sector, firm size, and regions. All estimates are weighted by sampling and country weights. BA+ = a bachelor’s or higher degree; EXT = extensive margin; GBF = general business function; INT = intensive margin; SBF = sector-specific business function.

162 Bridging the Technological Divide
FIGURE 6.13 Firms Capable of Developing and Customizing Equipment and Software Are More Sophisticated Technologically
Source: Original figure based on Firm-level Adoption of Technology (FAT) survey data.Note: Panel a provides the coefficients and 95 percent confidence intervals from regressions. Each technology measure is regressed on dummy variables identifying whether the firm has developed or customized equipment or software, while controlling for country, sector, firm size, and regions. Panel b presents the likelihood of a firm developing and customizing equipment or software by firm size. All estimates are weighted by sampling and country weights. Firm size refers to the number of workers: small (5–19), medium (20–99), and large (100 or more). EXT = extensive margin; GBF = general business function; INT = intensive margin; SBF = sector-specific busi-ness function.
b. Probability of developing or customizingequipment or software, by firm size
a. Technology sophisticationand absorptive capabilities
0
10
20
30
40
Pred
icted
pro
babi
lity (
%)
Coeffi
cient
Small Medium LargeGBF EXT0
0.2
0.4
0.6
GBF INT SBF EXT SBF INT
Develop or customize equipment or software Firm size
Know-How and Skills Know-how and skills capabilities are a key ingredient to adopt more sophisticated tech-
nologies. Bartel, Ichniowski, and Shaw (2007), for instance, show how the spread of new
capital equipment enhanced by information technology (IT) coincides with increases in
the skill requirements of machine operators, notably technical and problem-solving
skills, and with the adoption of new human resource practices to support these skills.
Harrigan, Reshef, and Toubal (2021) show that increasing investment in ICT adoption—
measured by the number of workers who are engineers and technicians with skills and
experience in science, technology, engineering, and mathematics—has a positive effect
on productivity that goes beyond investment in research and development (R&D).
FAT survey data also demonstrate the importance of know-how and skills capabilities.
Figure 6.13 shows that a firm’s level of technology sophistication is positively and signifi-
cantly associated with the fact that these firms were able to develop or customize equipment
or software (panel a). This capacity increases with firm size (panel b). But what is the source
of these capabilities? Human capital of workers is an important source of know-how and
skills capabilities internalized by the firm.
The positive association between human capital and technology sophistication
suggests a strong complementary relationship, as highlighted by the literature. The FAT
data confirm this. Panel a of figure 6.14 shows that the different measures of technology
sophistication—for both GBFs and SBFs at the intensive and extensive margins—are
positively and significantly associated with the share of workers with vocational train-
ing and the share of workers with a college degree. Panel b also shows that the share of
workers with higher levels of human capital increases by firm size.

What Constrains Firms from Adopting Better Technologies? 163
0
0.002
0.004
0.006
0.008
0.010
a. Technology adoption and workers' top level of education
b. Workers' top level of education, by firm size
Coeffi
cient
% of workers with secondaryschool
% of workers with vocationaltraining
% of workers with collegedegree
% of workers with secondaryschool
% of workers with vocationaltraining
% of workers with collegedegree
0
10
20
30
40
Small Medium Large Small Medium Large Small Medium Large
Pred
icted
pro
babi
lity (
%)
GBFEXT
GBFINT
SBFEXT
SBFINT
GBFEXT
GBFINT
SBFEXT
SBFINT
GBFEXT
GBFINT
SBFEXT
SBFINT
FIGURE 6.14 Human Capital Is Higher among Firms with More Sophisticated Technologies
Source: Original figure based on Firm-level Adoption of Technology (FAT) survey data.Note: Panel a provides the coefficients and 95 percent confidence intervals from regressions. Each technology measure is regressed on the percent of workers with different education levels (such as secondary school, vocational training, and college degree), respec-tively, while controlling for country, sector, size, and regions. Panel b presents the predicted percent of workers with different educa-tion by formality and size from the linear regressions controlling for other baseline characteristics. All estimates are weighted by sampling and country weights. EXT = extensive margin; GBF = general business function; INT = intensive margin; SBF = sector-specific business function.
164 Bridging the Technological Divide
Summing Up
This chapter shows that a multiplicity of barriers explain the lack of technology adop-
tion by firms. The importance of these factors depends on the context, the type of
technology, and the type of firm.
When designing policies it is important to ensure that the key enablers external to
the firm are in place, including appropriate infrastructure, a favorable regulatory envi-
ronment, and a well-functioning financial market. In addition, it is also critical to build
the conditions that improve firms’ internal capacity to benefit from improvements in
infrastructure and market reforms. Firm capabilities to absorb, learn, and accumulate
know-how about production and service provision should not be taken for granted. In
many developing countries, the lack of human capital and dysfunctional institutions
impose constraints on workers’ and entrepreneurs’ ability to benefit from existing tech-
nologies that could potentially lead to economic transformation.
This chapter highlights four key policy lessons. First, firm capabilities are a key
driver of technology adoption. Therefore, any technology adoption support program
cannot focus only on “hardware” such as infrastructure, machinery, and equipment; it
must also focus on how to strengthen the capabilities—such as management, educa-
tion, and learning—needed to run these machines effectively in the firm. Second, pub-
lic policies should take into account the fact that very often entrepreneurs do not see
any positive value in upgrading because they lack information, the returns are uncer-
tain, or they are overconfident. Providing adequate information about the availability
of technologies and the importance of upgrading is key. Third, access to external
knowledge—by utilizing knowledge services, knowledge created in universities, or
learning from other firms via trade flows or relationships through global value chains—
is an important driver of technology adoption. Fourth, policies need to consider that
for some technologies, for example digital technologies that use data intensively or
create new business models, the main focus should concentrate in designing appropriate
regulatory frameworks to enable the adoption of these technologies.
Notes
1. For decades, economists and sociologists have been studying the uptake of technologies involved in production. Going back to the seminal works by Ryan and Gross (1943) and Griliches (1957) on the diffusion of hybrid varieties of corn, the dominant approach in this early work was to measure the process of diffusion of an advanced technology, especially in agriculture (Mansfield 1961). A common pattern observed though the diffusion literature is that the diffusion process across regions resembles an S-shaped function (such as a logistic function). In his seminal work, Griliches (1957) analyzed the technological gap across regions in the use of hybrid seed corn within the United States. Hybrid corn was a new method of breeding superior corn, but it was not immediately adopted everywhere. The differences in S-shaped curves across US states reflect two different problems associated with technology adoption. The first is the acceptance problem, which refers to differences in the rate of adop-tion of hybrids by farmers in states where the technology was already available. The second

What Constrains Firms from Adopting Better Technologies? 165
is the availability problem, which refers to the lag in the development of technologies (such as hybrid corn) adapted for specific areas. Several other studies provided some support for the S-shaped curves as a good fit to traditional measures of technology diffusion (Gort and Klepper 1982; Skinner and Staiger 2007). Mansfield (1961) analyzed the factors determining the speed of technology diffusion across firms. Despite some heterogeneity across industries, his findings also suggest that the growth over time in the number of firms having introduced an innovation conforms to a logistic function (S-shape). Mansfield found that the probabil-ity of a firm introducing a new technique is an increasing function of the proportion of firms already using it and the profitability of doing so, set against a decreasing function of the size of the investment required: hence, the S-shape.
2. This chapter builds on background papers describing the FAT results for the state of Ceará, Brazil (Cirera et al. 2021b), Senegal (Cirera et al. 2021a), and Vietnam (Cirera et al. 2021c). This chapter extended the analysis on drivers and obstacles for adoption to all 11 countries covered in this volume.
3. Cusolito (2021) provides a comprehensive review of barriers to adoption, including a detailed coverage of the literature specific to accessing digital platforms.
4. The framework becomes more complex in the presence of technology externalities because the decision is conditional to other firms adopting. Different types of externalities are associated with technologies. Direct network externalities arise when the value directly increases with the number of users, such as with automated teller machines (ATMs), credit cards, or some infrastructure. Some other externalities are more indirect. They arise as the result of learning, whereby users teach other users—such as farmers teaching other farmers to use seeds—or by increasing the provision of support and complementary services.
5. For a review of microeconomic approaches to estimating technology adoption, see Foster and Rosenzweig (2010).
6. While Verhoogen focuses the literature review on manufacturing, his conceptual framework can be generalized to other sectors.
7. An extensive literature has focused on the impact of energy prices on the adoption of energy-saving technologies. Popp (2002) shows that energy prices and existing knowledge largely affect the introduction of energy-saving technologies. Pizer et al. (2002) find that both energy prices and the financial situation of plants influence technology adoption among a sample of indus-trial plants in four heavily polluting sectors in the United States. In a completely different sector, Macher, Miller, and Osborne (2021) show for the cement industry how factor prices are impor-tant and how competition and demand change the responsiveness of technology adoption to factor prices.
8. The results in this section are based on Berkes et al. (forthcoming), which is a background paper for this volume.
9. This effect remains stable even after controlling for various firm and managerial characteristics, as well as industry times region fixed effects.
10. Some “placebo” tests were also run. As expected, they found that the quality of internet service does not have any predictive power on other types of connections (such as dial-up or satellite) or infrastructure (such as access to water).
11. As is common in an instrumental variable framework, there are two identifying assumptions. First, distance from the node needs to be a predictor of access to the internet. Second, distance needs to affect technology adoption only through the internet. The first assumption constitutes the first stage and was extensively tested by, for example, showing that distance to the internet node is not correlated with the access to other nondigital-related resources, such as access to water, or access to the internet through satellite or wireless service. The second assumption can-not be tested directly, but the evidence that the location relative to an access node does not seem to be correlated with access to other infrastructure, such as water, suggests that the “only through the internet” assumption is believable in this context.

166 Bridging the Technological Divide
12. Kugler and Verhoogen (2009) show that importers perform better by using better inputs for production.
13. The self-assessment question is asked before any of the technology adoption questions to prevent any bias in the self-assessment from potential framing.
References
Abate, G. T., S. Rashid, C. Borzaga, and K. Getnet. 2016. “Rural Finance and Agricultural Technology Adoption in Ethiopia: Does the Institutional Design of Lending Organizations Matter?” World Development 84 (C): 235–53.
Aghion, P., N. Bloom, R. Blundell, R. Griffith, and P. Howitt. 2005. “Competition and Innovation: An Inverted-U Relationship.” Quarterly Journal of Economics 120 (2): 701–28.
Alfaro-Serrano, D., T. Balantrapu, R. Chaurey, A. Goicoechea, and E. Verhoogen. 2021. “Interventions to Promote Technology Adoption in Firms: A Systematic Review.” Campbell Systematic Reviews 17 (4): 1–36.
Alipranti, M., C. Milliou, and E. Petrakis. 2015. “On Vertical Relations and the Timing of Technology Adoption.” Journal of Economic Behavior & Organization 120 (C): 117–29.
Atkin, D., A. Chaudhry, S. Chaudry, A. K. Khandelwal, and E. Verhoogen. 2017. “Organizational Barriers to Technology Adoption: Evidence from Soccer-Ball Producers in Pakistan.” Quarterly Journal of Economics 132 (3): 1101–64.
Atkin, D., A. K. Khandelwal, and A. Osman. 2017. “Exporting and Firm Performance: Evidence from a Randomized Experiment.” Quarterly Journal of Economics 132 (2): 551–615.
Bandiera, O., and I. Rasul. 2006. “Social Networks and Technology Adoption in Northern Mozambique.” Economic Journal 116 (514): 869–902.
Bartel, A., C. Ichniowski, and K. Shaw. 2007. “How Does Information Technology Affect Productivity? Plant-Level Comparisons of Product Innovation, Process Improvement, and Worker Skills.” Quarterly Journal of Economics 122 (4): 1721–58.
Beaman, L., A. BenYishay, J. Magruder, and A. M. Mobarak. 2021. “Can Network Theory-Based Targeting Increase Technology Adoption?” American Economic Review 111 (6): 1918–43.
Berkes, E., X. Cirera, D. Comin, and M. Cruz. Forthcoming. “Infrastructure, Productivity, and Technology Adoption.” Background paper for Bridging the Technological Divide. World Bank, Washington, DC.
Besley, T., and A. Case. 1993. “Modeling Technology Adoption in Developing Countries.” American Economic Review 83 (2): 396–402.
Bircan, C., and R. De Haas. 2019. “The Limits of Lending? Banks and Technology Adoption across Russia.” Review of Financial Studies 33 (2): 536–609.
Bloom, N., M. Draca, and J. Van Reenen. 2016. “Trade Induced Technical Change? The Impact of Chinese Imports on Innovation, IT and Productivity.” Review of Economic Studies 83 (1): 87–117.
Bloom, N., and J. Van Reenen. 2007. “Measuring and Explaining Management Practices across Firms and Countries.” Quarterly Journal of Economics 122 (4): 1351–408.
Bustos, P. 2011. “Trade Liberalization, Exports, and Technology Upgrading: Evidence on the Impact of MERCOSUR on Argentinian Firms.” American Economic Review 101 (1): 304–40.
Camerer, C., and D. Lovallo. 1999. “Overconfidence and Excess Entry: An Experimental Approach.” American Economic Review 89 (1): 306–18.
Cirera, X., D. Comin, M. Cruz, and K. M. Lee. 2020. “Technology within and across Firms.” Policy Research Working Paper 9476, World Bank, Washington, DC.
Cirera, X., D. Comin, M. Cruz, and K. M. Lee. 2021a. “Firm-Level Adoption of Technologies in Senegal.” Policy Research Working Paper 9657, World Bank, Washington, DC.

What Constrains Firms from Adopting Better Technologies? 167
Cirera, X., D. Comin, M. Cruz, K. M. Lee, and A. Soares Martins-Neto. 2021b. “Firm-Level Technology Adoption in the State of Ceará in Brazil.” Policy Research Working Paper 9568, World Bank, Washington, DC.
Cirera, X., D. Comin, M. Cruz, K. M. Lee, and A. Soares Martins-Neto. 2021c. “Firm-Level Technology Adoption in Vietnam.” Policy Research Working Paper 9567, World Bank, Washington, DC.
Cirera, X., and W. F. Maloney. 2017. The Innovation Paradox: Developing-Country Capabilities and the Unrealized Promise of Technological Catch-Up. World Bank Productivity Project series. Washington, DC: World Bank.
Cole, H. L., J. Greenwood, and J. M. Sanchez. 2016. “Why Doesn’t Technology Flow from Rich to Poor Countries?” Econometrica 84 (4): 1477–521.
Conley, T. G., and C. R. Udry. 2010. “Learning about a New Technology: Pineapple in Ghana.” American Economic Review 100 (1): 35–69.
Cusolito, A. P. 2021. “The Economics of Technology Adoption.” World Bank, Washington, DC. Unpublished.
Daza Jaller, L., S. Gaillard, and M. Molinuevo. 2020. The Regulation of Digital Trade: Key Policies and International Trends. Washington, DC: World Bank.
Duflo, E., M. Kremer, and J. Robinson. 2008. “How High Are Rates of Return to Fertilizer? Evidence from Field Experiments in Kenya.” American Economic Review 98 (2): 482–88.
Foster, A. D., and M. R. Rosenzweig. 1995. “Learning by Doing and Learning from Others: Human Capital and Technical Change in Agriculture.” Journal of Political Economy 103 (6): 1176–209.
Foster, A. D., and M. R. Rosenzweig. 2010. “Microeconomics of Technology Adoption.” Annual Review of Economics 2 (1): 395–424.
Garicano, L., and E. Rossi-Hansberg. 2006. “Organization and Inequality in a Knowledge Economy.” Quarterly Journal of Economics 121 (4): 1383–435.
Gort, M., and S. Klepper. 1982. “Time Paths in the Diffusion of Product Innovations.” Economic Journal 92 (367): 630–53.
Griliches, Z. 1957. “Hybrid Corn: An Exploration in the Economics of Technological Change.” Econometrica 25 (4): 501–22.
Gupta, A., J. Ponticelli, and A. Tesei. 2020. “Information, Technology Adoption and Productivity: The Role of Mobile Phones in Agriculture.” NBER Working Paper 27192, National Bureau of Economic Research, Cambridge, MA.
Hannan, T. H., and J. M. McDowell. 1984. “The Determinants of Technology Adoption: The Case of the Banking Firm.” RAND Journal of Economics 15 (3): 328–35.
Harrigan, J., A. Reshef, and F. Toubal. 2021. “Techies, Trade, and Skill-Biased Productivity.” NBER Working Paper 25295, National Bureau of Economic Research, Cambridge, MA.
Hjort, J., and J. Poulsen. 2019. “The Arrival of Fast Internet and Employment in Africa.” American Economic Review 109 (3): 1032–79.
Jin, Y., and Z. Sun. 2020. “Lifting Growth Barriers for New Firms: Evidence from an Entrepreneurship Training Experiment with Two Million Online Businesses.” https://docplayer.net/200049815 -Lifting-growth-barriers-for-new-firms.html.
Kim, L., and R. R. Nelson, eds. 2000. Technology, Learning, and Innovation: Experiences of Newly Industrializing Economies. Cambridge, UK: Cambridge University Press.
Kugler, M., and E. Verhoogen. 2009. “Plants and Imported Inputs: New Facts and an Interpretation.” American Economic Review 99 (2): 501–07.
Lall, S. 1992. “Technological Capabilities and Industrialization.” World Development 20 (2): 165–86.
Lileeva, A., and D. Trefler. 2010. “Improved Access to Foreign Markets Raises Plant-Level Productivity...for Some Plants.” Quarterly Journal of Economics 125 (3): 1051–99.

168 Bridging the Technological Divide
Macher, J. T., N. H. Miller, and M. Osborne. 2021. “Finding Mr. Schumpeter: Technology Adoption in the Cement Industry.” RAND Journal of Economics 52 (1): 78–99.
Maloney, W. F. 2002. “Missed Opportunities: Innovation and Resource-Based Growth in Latin America.” Policy Research Working Paper 2935, World Bank, Washington, DC.
Maloney, W. F., and F. Valencia Caicedo. 2022. “Engineering Growth.” Journal of the European Economic Association. https://doi.org/10.1093/jeea/jvac014.
Mansfield, E. 1961. “Technical Change and the Rate of Imitation.” Econometrica 29 (4, October): 741–66.
Mansfield, E. 1963. “Intrafirm Rates of Diffusion of an Innovation.” Review of Economics and Statistics 45 (4, November): 348–59.
Midrigan, V., and D. Y. Xu. 2014. “Finance and Misallocation: Evidence from Plant-Level Data.” American Economic Review 104 (2): 422–58.
Pizer, W. A., W. Harrington, R. J. Kopp, R. D. Morgenstern, and J. S. Shih. 2002. “Technology Adoption and Aggregate Energy Efficiency.” Discussion Paper 10616, Resources for the Future, Washington, DC.
Popp, D. 2002. “Induced Innovation and Energy Prices.” American Economic Review 92 (1): 160–80.
Ryan, B., and N. Gross. 1943. “The Diffusion of Hybrid Seed Corn in Two Iowa Communities.” Rural Sociology 8 (1): 15–24.
Skinner, J., and D. Staiger. 2007. “Technology Adoption from Hybrid Corn to Beta-Blockers.” In Hard-to-Measure Goods and Services: Essays in Honor of Zvi Griliches, edited by Ernst R. Berndt and Charles R. Hulten, 545–70. University of Chicago Press for the National Bureau of Economic Research.
Suri, T. 2011. “Selection and Comparative Advantage in Technology Adoption.” Econometrica 79 (1): 159–209.
Sutton, J. 2012. Competing in Capabilities: The Globalization Process. Oxford, UK: Oxford University Press.
Verhoogen, E. Forthcoming. “Firm-Level Upgrading in Developing Countries.” Journal of Economic Literature.
Wagner, J. 1995. “Exports, Firm Size, and Firm Dynamics.” Small Business Economics 7 (1): 29–39.

169
7. Policies and Instruments to Accelerate Technology Adoption
Introduction
This chapter analyzes what public policies can do to incentivize firms to upgrade their
technology and, more important, how to design these policies to deal with the barriers
described in the previous chapter. Specifically, it addresses the following questions:
■■ What are the key principles for designing policies to support technology
adoption?
■■ How can policy instruments to promote technology upgrading be identified,
designed, and refined by considering factors that are external and internal to the
firm?
■■ How can the results from the Firm-level Adoption of Technology (FAT) survey
inform policy design?
■■ What are the instruments available to support firm technology upgrading?
The discussion begins by describing some general good practices and processes to
formulate policies to promote technology adoption. It follows with general guidance
and a framework to prioritize policies. It then reviews some of the key policy instru-
ments to support technology upgrading, showcases some examples, and describes the
limited evidence of impact. The chapter concludes with key messages.
A Checklist to Design Technology Upgrading Programs
Policy makers around the world have been trying to directly address the problem of
lack of technology adoption with very mixed results. A recent systematic review of
impact evaluations of various instruments to promote technology adoption finds that
the impact on both adoption and performance outcomes is mixed, at best (Alfaro-
Serrano et al. 2021). More important, the results emphasize the importance of
context-specific factors and suggest that that there is no one-size-fits-all solution.
Given the complexities that surround the design and implementation of technology
adoption policies, the discussion that follows provides some guidance for policy makers
on how to structure policy support and minimize the risk of government failure.
The section builds on the first volume of the World Bank Productivity Project series,

170 Bridging the Technological Divide
Cirera and Maloney (2017), as well as Cirera et al. (2020), focusing more narrowly on
technology adoption and drawing on the evidence from the FAT survey.
1. Identify Market Failures
Technology adoption, like the process of innovation more broadly, is characterized by
market failures that can result in underinvestment in the adoption of new technologies.
For example, individual firms’ decisions to generate or to adopt technologies can
generate positive technological or knowledge externalities or spillovers in other firms
in the same cluster or location that the adopter or creator cannot fully appropriate. In
addition, some of the investments needed in knowledge are indivisible and may require
large up-front investments that firms may not be able to make or afford by themselves
(Cirera et al. 2020).
The policy response to these market failures has been a combination of tax incen-
tives, grants, and favorable finance (Bryan and Williams 2021). The recent mechanism
design literature has proposed a set of optimal policies that tailor the size of subsidy
and the cost of finance depending on the size of spillovers and externalities and the
extent of moral hazard or adverse selection (Lach, Neeman, and Schankerman 2021).1
In the case of off-the-shelf technologies or digital solutions, a critical question is
whether positive externalities or spillovers exist, and if so, how large they are. Adoption
of more sophisticated technologies can create positive spillovers across the value chain
or the spatial cluster of firms, or to society in general (such as green technologies).
Associated knowledge spillovers can be transmitted through the training of workers or
the creation of spinoffs.
An important question for policy is how large these positive spillovers need to be to
justify subsidies. Many public agencies assume that these spillovers exist. In many
developed countries, including Canada, Singapore, and the United Kingdom, govern-
ment agencies provide small subsidies in the form of vouchers and grants to small and
medium enterprises (SMEs) for basic technology upgrading and digitalization proj-
ects, in the belief that extensive digitalization of businesses generates positive externali-
ties. Public agencies in developing countries with more constrained resources need to
articulate and try to measure these externalities or spillovers, and also make sure that
these programs do not indirectly have a negative effect on market structure or consum-
ers (for an analysis of potential indirect negative effects of finance programs, see Cai
and Szeidl 2022).
Another relevant market failure, especially for some digital technologies, arises from
large network effects (see chapter 6). Some technologies require a sufficient number of
adopters for the technology to be profitable and for the development of additional
support services. In these cases, it may be optimal to subsidize early adopters, although
the uncertainty about the sustainability of the technology is a challenge for public
agencies.
Policies and Instruments to Accelerate Technology Adoption 171
Identifying what type of market failure justifies government support and the size of
the market failure, as well as articulating why and under what conditions government
support could lead to higher adoption and not waste public resources, are critical
initial steps for public policy.
2. Ensure High-Quality Infrastructure and Remove Regulatory Bottlenecks
The previous chapter examined several barriers to technology adoption and use, and
showed how these depend on the context, the entrepreneur or manager, and the type of
technology. Accordingly, policies must take these differences into account and ensure
that some key elements (enablers) are in place to foster the adoption of new technolo-
gies. Two enablers, in particular, need to be on policy makers’ list of priorities: access to
high-quality infrastructure and an appropriate regulatory framework.
■■ Access to high-quality infrastructure. A key message of this volume is that infra-
structure that provides access to general-purpose technologies is a necessary
although not a sufficient condition to promote the adoption of more sophisti-
cated technologies across firms, sectors, and countries. As discussed in chapter 1,
developing countries still face significant problems in guaranteeing the quality
of electricity infrastructure and the availability of internet services. Access to a
reliable electricity network is necessary to facilitate the use of all technologies,
and firms will hesitate to invest in sophisticated technologies when they must
contend with unreliable networks. Policies that facilitate rolling out internet
nodes or 5G infrastructure are also critical to facilitate access to advanced digital
technologies, such as the Internet of Things (IoT). Ensuring the minimum qual-
ity of and access to these technologies is the first step in fostering adoption of
sophisticated technologies.
■■ An appropriate and agile regulatory framework. As the digital economy expands,
policy makers are grappling with the challenge of transforming laws and regula-
tions governing trade, taxation, labor, finance, social security, and other spheres
that are increasingly inadequate for a digital world (Zhu et al., forthcoming). An
agile and appropriate regulatory framework is needed to deal with the regulatory
demands of constant technological changes, the frequent offering of new ser-
vices, and issues related to data management and privacy. Regulatory issues are
even more important for digital platforms, including those applied to financial
technology. Fintech holds the promise of increasing the financial access of SMEs
and underrepresented segments of consumers in low- and middle-income coun-
tries. But regulations to minimize investor and financial risks or concerns about
data privacy and fraud often prevent the development and growth of firms in the
sector. As discussed in chapter 5, two-sided platforms and some data-driven sec-
tors have a tendency toward market dominance, especially though horizontal
mergers. This requires strong competition and antitrust measures (see box 7.1).
172 Bridging the Technological Divide
BOX 7.1
Digital Platforms Are Prone to Market Concentration and Dominance
Three key features of the digital economy create a tendency for market concentration. The first is returns to scale, driven largely by technologies that have led to a rapid and steep decline in the costs of data storage, computation, and transmission. The second feature is network exter-nalities, which arise from the fact that the convenience (value) of using a product or service increases with the number of users that adopt it. The third feature is the intensive use and accumulation of personal data. Digital technologies allow companies to collect, store, and use large amounts of data that in turn lead to continuous improvements in business intelligence and more profitability.
These features erect barriers to entry and make certain digital markets, such as digital platform markets, prone to market tipping: that is, once a firm gains an initial advantage, it keeps building on that advantage at the expense of its competitors. This in turn creates condi-tions for a winner-take-most economy, leading to concentration of market power and wealth in a small number of global “big tech” firms and individuals. Although these features are not unique to the digital sectors, they tend to be much more relevant than in most traditional activities.
There is also evidence that firms based in high-income countries have been using anti- competitive practices in overseas markets to gain market dominance. An analysis of publicly avail-able information on 103 finalized antitrust cases around the world, as of January 2020, reveals that most cases concerning abuse of dominance and anticompetitive agreements have been filed in developing countries against firms headquartered abroad. This pattern calls for international cooperation to prevent such abuse, such as a coordinated effort on digital taxes, data interopera-bility policies, and adoption of standards to allow data flows across firms, industries, and borders so firms in developing countries also have a fair chance to scale.
Source: Zhu et al., forthcoming.
3. Ensure an Open Trade Regime that Supports Access to External Knowledge and Technology
As shown in the previous chapter, participation in international markets and global
value chains facilitates the adoption of technologies. While trade and investment
policies appear to be beyond the realm of technology policies, they are in fact inter-
twined. For example, high import tariffs or nontariff barriers on equipment, restric-
tions on hiring foreign engineers and managers, or restrictions on investors and
technology licensing can be critical barriers to technology adoption. Maloney (2002)
shows how in addition to lack of investments in knowledge institutions, inward poli-
cies focusing on import substitution played a key role in impeding economic growth
in Latin American countries. Ensuring access to external knowledge and the diffu-
sion of technologies is key, especially for most developing countries that adopt exist-
ing technologies.

Policies and Instruments to Accelerate Technology Adoption 173
4. Facilitate Access to Finance for Technology Upgrading
Financial market imperfections related to information asymmetries and lack of com-
petition in the financial sector make the financing of technology upgrading in develop-
ing countries difficult and costly. In many developing countries it is unusual for
commercial banks to finance technology upgrading projects. Firms must make these
investments with their own resources, which considerably limits their capacity to
invest, or they must deal with very high collateral requirements or very high interest
rates, which make investing in new technologies unprofitable.
Public agencies need to work with the financial sector to stimulate this type of lend-
ing by providing funds that reduce potential liquidity problems and lower the cost of
finance, or by providing credit guarantees. In addition, public agencies can support the
use of expert consultants and technology mentors to strengthen firms’ loan applica-
tions. More important, publicly backed finance programs can provide a demonstration
effect with commercial banks to show how to screen technology upgrading projects
and minimize risks while financing this type of project.
5. Provide Information and Build Institutions to Address Coordination Failures
Flows of specialized information are particularly important for small businesses, which
tend to be less informed about the latest technologies available in the market. While it
should be in their private interest to join forces to obtain this information, private firms
face a common coordination failure that pushes them to act independently. As a result,
there is a role for public policy to facilitate information and information flows. However,
public institutions are not always best placed to provide this type of specialized
information. Public-private partnerships with private sector organizations should be
prioritized to ensure information flows. Filling this information gap is important to
minimize entrepreneurs’ uncertainty about adoption. No information flow can
guarantee the returns to investing in such technology, but better information can help
entrepreneurs assess these returns and make more informed decisions.
Perhaps the most important role played by public agencies to support technology
upgrading is addressing coordination failures. A firm’s performance depends on the
actions of other firms. Market failures associated with economies of scale, spillovers, or
nonexcludability (where other firms can enjoy the benefits without paying for knowl-
edge) in the provisions of these inputs and services can lead to multiple equilibria,
which in turn require coordination to move from low to a high equilibrium (Rodríguez-
Clare 2006). Moreover, information frictions, irrational behavior, or path dependency,
among other factors, can lead also to a low equilibrium (Hoff 2000). Coordination to
deal with such failures is not always possible in the market.
Consider the fact that many firms do not upgrade their technologies because of
the lack of information or an adequate skilled labor force, as described in chapter 6.

174 Bridging the Technological Divide
A market solution is to coordinate with other firms in the industry so this information
and training are provided. However, industry associations sometimes respond to the
rent-seeking behavior of some of their more powerful associates, and participation in
those associations is often low, especially among smaller firms. Hoff (2000) provides
some examples of coordination failures in different contexts of developing countries.
The important takeaway is that private agents may not necessarily coordinate to achieve
a second-best outcome.
There is, therefore, a role for public policy in working with the private sector in
aligning interests and ensuring an efficient provision of physical infrastructure, infor-
mation, and skills. Perhaps the most important role is ensuring that firms of all sizes
have good information about what technologies and what types of support from tech-
nology and digital solutions providers are available, as well as supporting adequate
training for the labor force. This should be implemented jointly with private sector
associations that know the sectors better. In addition, in countries where there is sig-
nificant mistrust between the suppliers of technologies and digital solutions and local
firms concerning the quality of services provided public agencies can play a role in
matching supply and demand and ensuring some minimum quality standards that
reduce information asymmetries.
This important coordination role does not guarantee that public agencies will be
successful in achieving upgrading. Policy failure remains a risk (Besley and Case 1993),
especially when public agencies want to take roles where they have no expertise or
when interests diverge due to agency problems—when agents do not necessarily imple-
ment the interests of the agency. Public agencies need to take this risk seriously and
make sure that there are checks and balances in the design of support policies (see the
discussion later in this chapter).
6. Improve the Provision of and Markets for Business Advisory and Technology Extension Services
Access to knowledge through business advisory and technology extension services is an
important mechanism to build technological know-how and skills. They can enhance
not only the absorption of new technologies but also the capacity for further learning
(Cohen and Levinthal 1990). Although these services should not necessarily be pro-
vided by government agencies directly, many of them do so, and most important, there
is significant room for improving failures related to asymmetric and incomplete infor-
mation in these markets.
The potential market failure for knowledge has been well described by Arrow (1962)
in what is known as Arrow’s information paradox, which applies broadly to the
production of knowledge used by firms. The development and transfer of a technology
involves the production and transfer of information that has three properties:

Policies and Instruments to Accelerate Technology Adoption 175
indivisibility, nonappropriability, and uncertainty. The main idea is that unless the
information (such as business advice) is revealed, a potential buyer cannot accurately
assess its value, but once the information is known, a buyer may have little incentive to
pay the seller. These features present challenges to a well-functioning market for busi-
ness and technology information. While these issues can be partially addressed by
reputation mechanisms and contracts (Anton and Yao 2002), these instruments tend to
be challenging, particularly for SMEs in developing countries. Yet evidence suggests
potential productivity gains from these services (Bruhn, Karlan, and Schoar 2018).
These programs can also be used to prepare firms interested in instruments that require
further capabilities to benefit from them, such as export promotion.2 Thus, there is a
role for policy in improving the provision of and markets for business advisory and
technology extension services.
7. Enhance Awareness, Improving Targeting Mechanisms for Government Support and Strengthening Government Capabilities
Small firms are much less aware of government support programs and are also less
likely to benefit from them, as shown in figure 7.1. FAT survey data reveal that only
about 30 percent of small firms are aware of government support programs, compared
to about 46 percent of large firms. A very low share of small firms benefits from existing
support mechanisms. The gap between awareness and access is also larger in small
firms. On average, the probability of a small business receiving public support for tech-
nology adoption is around 13 percent versus more than 35 percent for large firms.
These results are associated with the fact that large firms have better access to informa-
tion and have managers and business organizations that are better prepared, as
described in chapter 6.
These results underscore the importance of disseminating information about gov-
ernment support programs to facilitate adoption, especially among SMEs. Smaller
firms also tend to participate less in industry associations, and their entrepreneurs and
managers have less time to participate in association activities. Thus, public agencies
need to make more of an effort to reach out to these smaller firms.
Targeting mechanisms also need to be effective. Mistargeting occurs when public
policies support unintended beneficiaries, either because they do not need the support
or because they are not the targeted group. For example, during the COVID-19
pandemic, around 20 percent of firms that did not experience a drop in sales received
support (figure 7.2).3 Among businesses whose sales dropped, large firms had a much
larger probability of getting support. As seen in figure 7.1, larger firms also get more
support for technology upgrading. This may be driven by barriers in terms of lack of
information and fixed costs to apply, which are more binding for smaller firms, but also
raise some potential political economy issues on how support may be implemented

176 Bridging the Technological Divide
(Besley 2007). Often the costs of targeting can be large, given the difficulties of identify-
ing those in need. This is also why the use of proper diagnostics is critical to inform the
program as well as to improve targeting.
Technology upgrading policies can be complex to implement, especially those
targeted to specific sectors, which require more specialized knowledge. Thus, it is
critical to invest in the capacity of government agencies to design and implement
policies.
Cirera and Maloney (2017) and Cirera et al. (2020) provide a general set of princi-
ples to improve the quality of policy making in the context of innovation policies. In
the case of technology policies, improvements are even more important, given the asso-
ciated complexities. Strengthening government capabilities goes beyond training and
adequate recruitment to include the use of good practices in public management and
the implementation of adequate evaluation mechanisms. The costs of not investing in
government capacities are high and deficiencies could result in government failure and
market distortions.
FIGURE 7.1 Large Firms Tend to Be More Aware of and Benefit More from Public Support of Technology Adoption than Small and Medium Firms
Source: Original figure based on Firm-level Adoption of Technology (FAT) survey data.Note: Estimated share of firms that benefit from government program or subsidy by size from the probit regressions controlling for country, sector, and other baseline characteristics. All estimates consider sampling design variables by country. Firm size refers to the number of workers: small (5–19), medium (20–99), and large (100 or more).
Small Medium Large Small Medium Large
Firm size Firm size
a. Aware of government programor subsidy
b. Benefit from government programor subsidy
0
10
20
30
40
50
60
Perc
ent o
f firm
s
0
10
20
30
40
50
60
Perc
ent o
f firm
s

Policies and Instruments to Accelerate Technology Adoption 177
In addition, joint implementation with the private sector is crucial. Joint
efforts with clusters of firms, platforms, and industry associations can address
coordination failures and better inform firms on what technologies are available
and what expertise is needed. This is also critical to reduce uncertainty in
adoption and minimize preference biases in government agencies that may favor
specific local technologies or universities when more efficient technologies are
available.
A Policy Design Checklist
Summing up, figure 7.3 presents an initial checklist of questions for policy makers
seeking to actively promote technology adoption. The first column highlights some of
the key questions that policy makers should ask themselves when designing this type of
policy and the considerations related to each question. The second column proposes
policy instruments. It is important to undertake these analyses before designing the
policy program to avoid policy failure. More important, the analysis is needed to better
understand the local context because what has worked in one country will not neces-
sarily work in another country.
FIGURE 7.2 A Considerable Share of Public Support to Businesses to Cope with the COVID-19 Pandemic Went to Firms That Did Not Need It
Source: Business Pulse Survey (BPS), based on Cirera et al. 2021.Note: Estimated share of firms controlling for country, sector, and other baseline characteristics. Firm size refers to the number of workers.
21
2023 23 23
29
3234
Small(5–19)
Micro(0–4)
Medium(20–99)
Large(100+)
Small(5–19)
Micro(0–4)
Medium(20–99)
Large(100+)
0
10
Perc
ent o
f firm
s
20
30
40
0
10Pe
rcen
t of fi
rms
Firm size Firm size
20
30
40
a. Firms that did not suffer any shocksbut received support
b. Firms that suffered shocks andreceived support
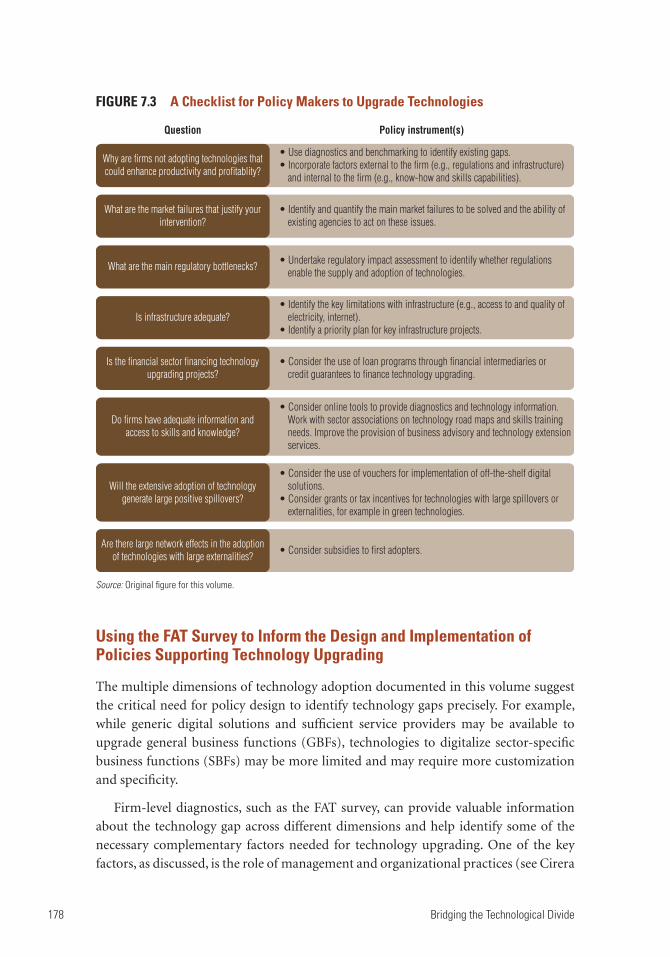
178 Bridging the Technological Divide
Using the FAT Survey to Inform the Design and Implementation of Policies Supporting Technology Upgrading
The multiple dimensions of technology adoption documented in this volume suggest
the critical need for policy design to identify technology gaps precisely. For example,
while generic digital solutions and sufficient service providers may be available to
upgrade general business functions (GBFs), technologies to digitalize sector-specific
business functions (SBFs) may be more limited and may require more customization
and specificity.
Firm-level diagnostics, such as the FAT survey, can provide valuable information
about the technology gap across different dimensions and help identify some of the
necessary complementary factors needed for technology upgrading. One of the key
factors, as discussed, is the role of management and organizational practices (see Cirera
FIGURE 7.3 A Checklist for Policy Makers to Upgrade Technologies
Source: Original figure for this volume.
Question Policy instrument(s)
• Use diagnostics and benchmarking to identify existing gaps.• Incorporate factors external to the firm (e.g., regulations and infrastructure)
and internal to the firm (e.g., know-how and skills capabilities).
Why are firms not adopting technologies thatcould enhance productivity and profitablity?
• Identify and quantify the main market failures to be solved and the ability ofexisting agencies to act on these issues.
What are the market failures that justify yourintervention?
• Undertake regulatory impact assessment to identify whether regulationsenable the supply and adoption of technologies.What are the main regulatory bottlenecks?
• Identify the key limitations with infrastructure (e.g., access to and quality ofelectricity, internet).
• Identify a priority plan for key infrastructure projects.Is infrastructure adequate?
• Consider the use of loan programs through financial intermediaries orcredit guarantees to finance technology upgrading.
Is the financial sector financing technologyupgrading projects?
• Consider online tools to provide diagnostics and technology information.Work with sector associations on technology road maps and skills trainingneeds. Improve the provision of business advisory and technology extensionservices.
Do firms have adequate information andaccess to skills and knowledge?
• Consider the use of vouchers for implementation of off-the-shelf digitalsolutions.
• Consider grants or tax incentives for technologies with large spillovers orexternalities, for example in green technologies.
Will the extensive adoption of technologygenerate large positive spillovers?
• Consider subsidies to first adopters.Are there large network effects in the adoptionof technologies with large externalities?
Policies and Instruments to Accelerate Technology Adoption 179
and Maloney 2017). Adopting some advanced technologies necessitates changes in
business models and organization. For example, adopting digital technologies for sales
requires adjustments in marketing strategies and the organization of the firm to bring
about a closer relationship with final consumers. Accordingly, diagnostic tools need to
be more holistic, looking beyond the technology in question to assess a firm’s “manage-
ment readiness” to implement and deal with these changes. If management and orga-
nization do not adapt, the returns to the investment in technologies are likely to be low.
A firm-level diagnostic can measure this readiness to upgrade and suggest complemen-
tary interventions to address these additional gaps.
Finally, a firm-level diagnostic can help address the problems of overconfidence and
reference group neglect (Camerer and Lovallo 1999) described in chapter 6. By provid-
ing an objective benchmark that can pinpoint not only a firm’s technology gaps but
also its relative technology sophistication with respect to other firms, firm managers
can have a more objective basis for decision-making, reducing behavioral biases. This
will have the additional benefit of increasing the take-up of technology support pro-
grams, which is often low, especially when the firm’s financing requirement is high.
Using Results from the FAT Survey to Design, Implement, and Evaluate Policy
Results from the FAT survey can aid policy makers in understanding the reality of the
technology gap, identifying key bottlenecks, and providing benchmark information to
firms. This potential contribution to inform policy was taken into consideration when
designing the FAT questionnaire, in collaboration with industry and policy experts, as
described in the previous chapters. The discussion that follows provides practical
examples of how information from the FAT survey can be utilized by practitioners
through the policy diagnostic and the implementation phases.
Diagnostic Phase
1. Measuring the distance to the technology frontier at the business function level. The
first contribution from the FAT data is providing granular measures of distance
from the technology frontier. As described in chapters 1, 2, and 3, the granular
measures of technology from the FAT data can be aggregated through different
dimensions (such as country, sector, or size of the firm) at the business function
level. This information can provide a clearer picture of the reality of firms in
developing countries, which is usually far from the reality observed in advanced
economies. For example, FAT data for Senegal show that a large share of firms
still rely on predigital technologies to perform GBFs. Cruz, Dutz, and Rodríguez-
Castelán (2022) highlight that technology upgrading policies for Senegal need to
adjust to this reality, for both formal and informal businesses. Another impor-
tant contribution from the FAT data is to disentangle the technology gap between
GBFs and SBFs.

180 Bridging the Technological Divide
2. Identifying key policy priorities for the country, region, or sector. The FAT survey
also provides information on factors that may play a role as barriers to or poten-
tial drivers of technology adoption. This information can be disaggregated by
type of firm, sector, or region. As described in chapter 6, the data capture both
perception-based and actual obstacles. Both measures are important for policy.
If there is a misconception about the perceived obstacles, the design of the inter-
vention needs to take this into consideration by providing better information
about the problems to be addressed. The data can be combined with additional
sources of information (such as census and administrative data), if available. For
example, FAT data have been combined with other sources to examine the effect
of firms’ proximity to internet nodes on their adoption of technology in Senegal
(see chapter 6) and the association between wages and technology sophistication
in Brazil (see chapter 4).
Implementation Phase When a program is being implemented, the FAT survey can be used to provide bench-
marks and monitor the effects of interventions at the firm level. These measures can
help firms understand how they compare to similar firms and can be used to develop a
work plan for technology upgrading.
1. Providing benchmark information to potential beneficiary firms. The FAT bench-
mark tool is being prepared to be used in interventions in Cambodia and Senegal
supported by the World Bank Group, with the potential to expand globally. It is
being piloted by public agencies and could ultimately be used by nongovern-
mental organizations and private institutions that aim to improve the market for
knowledge transfer and business advisory services in developing countries. The
tool includes measures of technology, management practices, innovation capa-
bilities, and performance. It allows firms to compare themselves with peer firms
in their country and identify the areas where they are lagging. It can also be used
by business advisory services, thus reducing the asymmetry of information that
firms face regarding the need for and quality of the business services provided.
Box 7.2 summarizes how the FAT survey can be used as a diagnostic tool to
inform policies.
2. Evaluating the impact of and learning from interventions. Information obtained
to conduct the firm-level technology diagnostic can also be used for monitoring
and evaluation and research purposes. The data can be collected from potential
beneficiary firms directly or indirectly, as supported through public programs,
and used as a baseline. A follow-up exercise can be implemented to monitor and
evaluate the impact at a very granular level, and across different dimensions of
technology adoption. This requires building a proper counterfactual group, ide-
ally through the design of the project. On a broader level, and of value to
researchers and policy makers, the analysis presented in chapters 4 and 5 sug-
gests the potential for using this information to understand how firms’ adoption

Policies and Instruments to Accelerate Technology Adoption 181
BOX 7.2
The Firm-Level Technology Diagnostic Tool
The first version of the firm-level technology diagnostic was designed to support the implementa-tion of public programs providing information and technical assistance for technology upgrading. Each diagnostic is generated for individual firms and can be comparable with other firms with simi-lar characteristics, such as sector or size, in the same country for which data from the Firm-level Adoption of Technology (FAT) survey are available.
Figure B7.2.1 provides an example of the information covered by the diagnostic. The front page summarizes where the firm stands with respect to other firms in the country along four dimensions: technology adoption, management practices, innovation capabilities, and performance (see panel a).
(Box continues on the following page.)
(Figure continues on the following page.)
FIGURE B7.2.1 The Firm-Level Technology Diagnostic
Firm technology diagnostica. Front page of benchmark
Technology adoption
Results summary overview
Your firm ranks 61st in technology adoption in Country X.
Technology sophistication is below the average.
Your firm: 1.27
5 (highest)1 (lowest)
Manufacturing 1.38
1.59
1.32
4.10
2.11
1.27
1 2 3Technology index
4 5
Medium/large
Benchmark
International
90th percentile
Your firm
Senegal ranking—out of 100 firms in Country X (1st is best)
International frontier—1 to 5 ranking (5 is best)
Technology adoption Management practices Innovation capabilities Performance
61st 73rd
1.27 1.1
73rd 90th

182 Bridging the Technological Divide
The technology adoption measure is based on the general business function (GBF) and sector-specific business function (SBF) indexes described in this volume, which also allows for international com-parison with respect to the global frontier. The index is calculated for the firm and compared to other firms with similar characteristics, including a reference for international comparison, based on results from top firms in the Republic of Korea (the frontier in the FAT data).
BOX 7.2
The Firm-Level Technology Diagnostic Tool (continued)
(Box continues on the following page.)
FIGURE B7.2.1 The Firm-Level Technology Diagnostic (continued)
Technology sophistication in general business functions (GBFs)
Most-used technology, by function (comparison with firms in Senegal)
Functions above the frontier firms
Functions below the frontier firmsBusiness administrationProduction planningProcurementMarketingSalesPaymentQuality control
Functions lacking intensive useMarketingPayment
Technology adoption versus usage by function
Your firm ranks 87th out of 100 in general technology adoption in Country X.
Your firm: 1.10
5 (highest)1 (lowest)
Business administration
Production planning
Procurement
Sales
1
45
Marketing
Payment
Quality control
Business administration
Production planning
Procurement
Marketing
Payment Sales
Quality control
Median firms Frontier firmsYour firm
AdoptionUse
b. Example of diagnostics for GBFs
23
1
45
23
Source: Original figure for this volume.
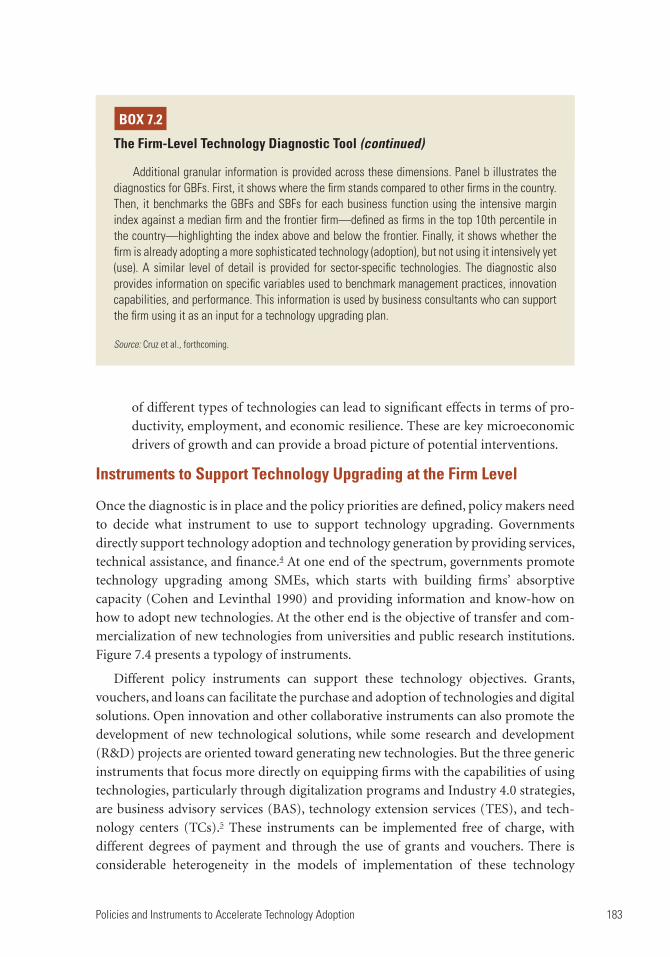
Policies and Instruments to Accelerate Technology Adoption 183
of different types of technologies can lead to significant effects in terms of pro-
ductivity, employment, and economic resilience. These are key microeconomic
drivers of growth and can provide a broad picture of potential interventions.
Instruments to Support Technology Upgrading at the Firm Level
Once the diagnostic is in place and the policy priorities are defined, policy makers need
to decide what instrument to use to support technology upgrading. Governments
directly support technology adoption and technology generation by providing services,
technical assistance, and finance.4 At one end of the spectrum, governments promote
technology upgrading among SMEs, which starts with building firms’ absorptive
capacity (Cohen and Levinthal 1990) and providing information and know-how on
how to adopt new technologies. At the other end is the objective of transfer and com-
mercialization of new technologies from universities and public research institutions.
Figure 7.4 presents a typology of instruments.
Different policy instruments can support these technology objectives. Grants,
vouchers, and loans can facilitate the purchase and adoption of technologies and digital
solutions. Open innovation and other collaborative instruments can also promote the
development of new technological solutions, while some research and development
(R&D) projects are oriented toward generating new technologies. But the three generic
instruments that focus more directly on equipping firms with the capabilities of using
technologies, particularly through digitalization programs and Industry 4.0 strategies,
are business advisory services (BAS), technology extension services (TES), and tech-
nology centers (TCs).5 These instruments can be implemented free of charge, with
different degrees of payment and through the use of grants and vouchers. There is
considerable heterogeneity in the models of implementation of these technology
Additional granular information is provided across these dimensions. Panel b illustrates the diagnostics for GBFs. First, it shows where the firm stands compared to other firms in the country. Then, it benchmarks the GBFs and SBFs for each business function using the intensive margin index against a median firm and the frontier firm—defined as firms in the top 10th percentile in the country—highlighting the index above and below the frontier. Finally, it shows whether the firm is already adopting a more sophisticated technology (adoption), but not using it intensively yet (use). A similar level of detail is provided for sector-specific technologies. The diagnostic also provides information on specific variables used to benchmark management practices, innovation capabilities, and performance. This information is used by business consultants who can support the firm using it as an input for a technology upgrading plan.
Source: Cruz et al., forthcoming.
BOX 7.2
The Firm-Level Technology Diagnostic Tool (continued)

184 Bridging the Technological Divide
FIGURE 7.4 A Typology of Instruments to Support the Firm-Level Adoption of Technology
Source: Cirera et al. 2020.Note: R&D = research and development.
Building absorptivecapacity
Technologyadoption
Businessadvisoryservices
Grants for(process)innovation
Loans forinnovation
(equipment)
Openinnovation
Firms
Technologyextension
Science/technology
parks
Technologytransferoffices
Universities/research
institutions
Technologytransfer
Supporting technologygeneration, commercialization,
and transfer
Technologygeneration
Technology/R&D centers
services instruments, especially in the case of BAS and TCs. The subsections that follow
describe these instruments in more detail.
But first, it is important to define how the multiple dimensions of technology can
be mapped to policies. This can help in the choice of instruments and the program
design. To this end, figure 7.5 provides a framework that links technologies to policy
instruments.
It is important to split the technology options of the firm into two broad groups:
GBFs and SBFs. Although they are complementary, policy instruments that support
these two types of business functions are usually different in terms of knowledge,
skills, and resources required. Efforts to upgrade the technology for GBFs are usually
served by BAS or TES. This includes digitalization programs, and often requires less
specialized knowledge because solutions are more readily available.6 Efforts to
upgrade technology for SBFs often require more specialized knowledge and, there-
fore, demand more specialized institutions such as TES or TCs that tend to focus on
particular sectors, such as Embrapa in Brazil (agriculture) and the Fraunhofer
Institutes in Germany (manufacturing). These TCs support not only technology
adoption but the creation of new technology applications with universities and
research centers.
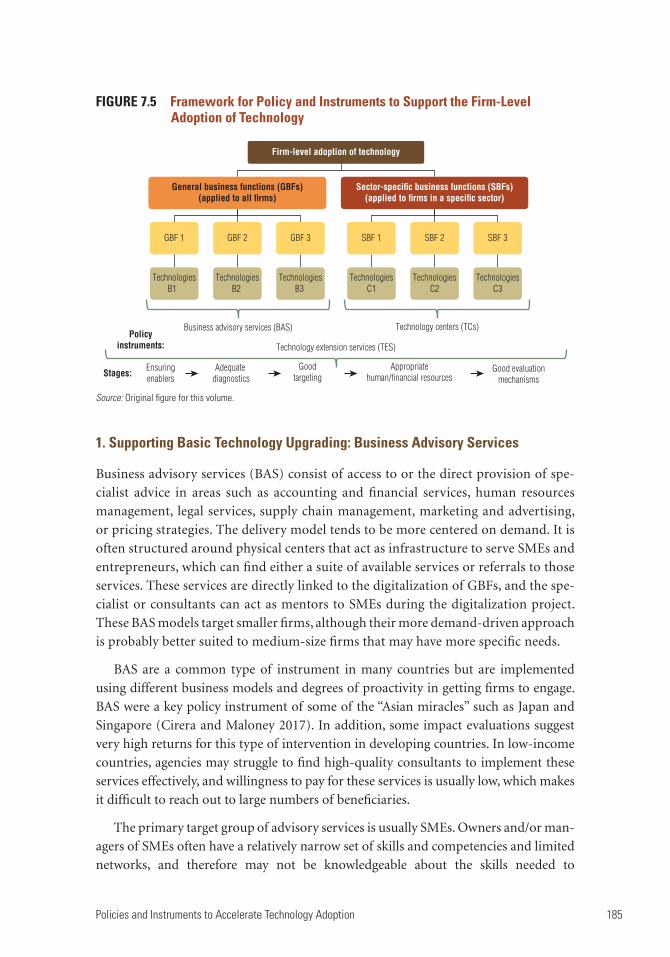
Policies and Instruments to Accelerate Technology Adoption 185
1. Supporting Basic Technology Upgrading: Business Advisory Services
Business advisory services (BAS) consist of access to or the direct provision of spe-
cialist advice in areas such as accounting and financial services, human resources
management, legal services, supply chain management, marketing and advertising,
or pricing strategies. The delivery model tends to be more centered on demand. It is
often structured around physical centers that act as infrastructure to serve SMEs and
entrepreneurs, which can find either a suite of available services or referrals to those
services. These services are directly linked to the digitalization of GBFs, and the spe-
cialist or consultants can act as mentors to SMEs during the digitalization project.
These BAS models target smaller firms, although their more demand-driven approach
is probably better suited to medium-size firms that may have more specific needs.
BAS are a common type of instrument in many countries but are implemented
using different business models and degrees of proactivity in getting firms to engage.
BAS were a key policy instrument of some of the “Asian miracles” such as Japan and
Singapore (Cirera and Maloney 2017). In addition, some impact evaluations suggest
very high returns for this type of intervention in developing countries. In low-income
countries, agencies may struggle to find high-quality consultants to implement these
services effectively, and willingness to pay for these services is usually low, which makes
it difficult to reach out to large numbers of beneficiaries.
The primary target group of advisory services is usually SMEs. Owners and/or man-
agers of SMEs often have a relatively narrow set of skills and competencies and limited
networks, and therefore may not be knowledgeable about the skills needed to
FIGURE 7.5 Framework for Policy and Instruments to Support the Firm-Level Adoption of Technology
General business functions (GBFs)(applied to all firms)
Firm-level adoption of technology
GBF 1
TechnologiesB1
GBF 2
TechnologiesB2
GBF 3
TechnologiesB3
Sector-specific business functions (SBFs)(applied to firms in a specific sector)
SBF 1
TechnologiesC1
SBF 2
TechnologiesC2
SBF 3
TechnologiesC3
Business advisory services (BAS) Technology centers (TCs)Policy
instruments:
Stages:
Technology extension services (TES)
Ensuringenablers
Adequate diagnostics
Goodtargeting
Appropriatehuman/financial resources
Good evaluationmechanisms
Source: Original figure for this volume.

186 Bridging the Technological Divide
implement in their business practices. Another important target group is advisory ser-
vice providers. This group may comprise public, private, and nonprofit organizations
involved in the provision of advisory, digital, and extension services, including regional
business support centers, chambers of commerce, and small business associations and
societies, in addition to private consultancy firms. Various organizations focus on spe-
cific types of services, firms, and local areas.
The main strengths of BAS need to be counterbalanced with the potential draw-
backs and risks. This instrument has several positive features. First, it can provide an
integrated suite of services to SMEs through a one-stop-shop approach, which can
substantially reduce advisory costs. Second, it can provide diagnostics that enable
programs to be tailored to SMEs. Third, it can support the building blocks of techno-
logical capabilities for SMEs. However, the design and implementation need to account
for several risks. First, there is risk of overcrowding the market and lack of coordination
between service providers, including government and nongovernmental organiza-
tions.7 Second, there might be a poor match between supply and demand for services
and weak demand from those that could benefit most from the instrument.
Despite the diversity of BAS programs, there are a few key elements for good policy
design that are likely to make them, and the firms they help, more effective. A common
model is to have an external expert make an assessment in an initial diagnostic stage. Then,
an action or improvement plan is developed, and further advice can be provided to help
implement this plan. The advantage of this type of sequenced approach is that SMEs may
misdiagnose their key problem, and an up-front assessment can improve the prioritization
of subsequent activities. Using a rapid standard diagnostic to quickly benchmark the firm
with respect to other firms with similar characteristics (such as the level of technology used
by other firms and how this is associated with performance) can demonstrate the value of
the information and build a relationship of trust between consultants and the firm.8
A key design issue is ensuring the quality and relevance of the business advice. As
discussed, one of the main market/system failures in this area is strong information
asymmetry that can result in adverse selection, where SMEs cannot determine the
value and quality of the consultancy services provider. To address this issue, one option
is to develop a vetted list of service providers that are known to provide quality services,
and help SMEs negotiate the scope of any work from consultants if they are unfamiliar
with the process. Given the severe information asymmetry that exists and lack of will-
ingness to pay, constant outreach and engagement by the program is critical.
Digital Upgrading Programs. One type of BAS instrument that has gained popularity in
recent years focuses on supporting the adoption of digital technologies. These programs
follow the same general structure as BAS. They address information gaps and provide
incentives and finance in different combinations. A difference is that they tend to concen-
trate on general business functions and tasks, with a large bias toward marketing and sales.
The digitization of more specific production processes, as well as the automation and use
Policies and Instruments to Accelerate Technology Adoption 187
of Industry 4.0 technologies, tends to be the role of instruments such as TES and TCs,
given the need for much more niche technologies and more specialized advice.
A review of 22 digital upgrading programs mainly in member-countries of the
Organisation for Economic Co-operation and Development shows that at least
40 percent use BAS as the main instrument (Balbontin, Cusolito, and Cirera 2021).9
The use of financial incentives is very widespread, with 36 percent using vouchers
and 27 percent using grants. At least 41 percent use outsourced expertise, even if
combined with in-house expertise. Interestingly, most programs support business
functions linked to transactions in marketing and sales as well as the processing of
information for administration. Two-thirds of the programs emphasize the need for
complementary investments.
Some of the support programs reviewed also aim to increase firms’ participation on
digital platforms. Support is concentrated in specific elements needed to sell online,
such as customer orientation, maintaining a good reputation, pricing, and quality con-
trol. As discussed, in most cases policy makers need to first assess why the platform
itself is not offering support to small firms to participate and what the appropriate role
of public policy is—which often should focus on ensuring compliance, regulating
noncompetitive practices, and addressing regulatory bottlenecks.
2. Supporting Technology Upgrading in Sector-Specific Technologies: Technology Extension Services
Technology extension services (TES) provide direct on-site assistance to SMEs through
extension staff, field offices, or dispersed technology centers to foster technological and
knowledge-based modernization. A key differentiation between TES and BAS relates to
the focus of services. TES tend to be more sophisticated, sector specific, and directly
focused on supporting production technology and innovation capability and activity.
While this type of instrument is a long-established model in agriculture (see box 7.3)
and in manufacturing, it is less common in services sectors, although manufacturing
extension services have often been utilized in sectors such as health care (for example,
in hospitals) where process efficiency is important.10 TES can also offer skills develop-
ment training, addressing both the demand for technology in the firm and the needed
supply of adequate labor skills.
Some extension centers offer both BAS and TES indistinguishably, as well as skills
development services and training. Some public research institutions also offer TES to
industry. They are a key instrument to implement Industry 4.0 strategies such as smart
manufacturing because they directly address the lack of technological capabilities.
TES and BAS usually address similar types of market and system failures. The
potential beneficiaries targeted in TES tend to be larger, given that TES involves more
sophisticated advice. TES also focuses on a third target group: knowledge providers,
such as research organizations, universities, and public laboratories.
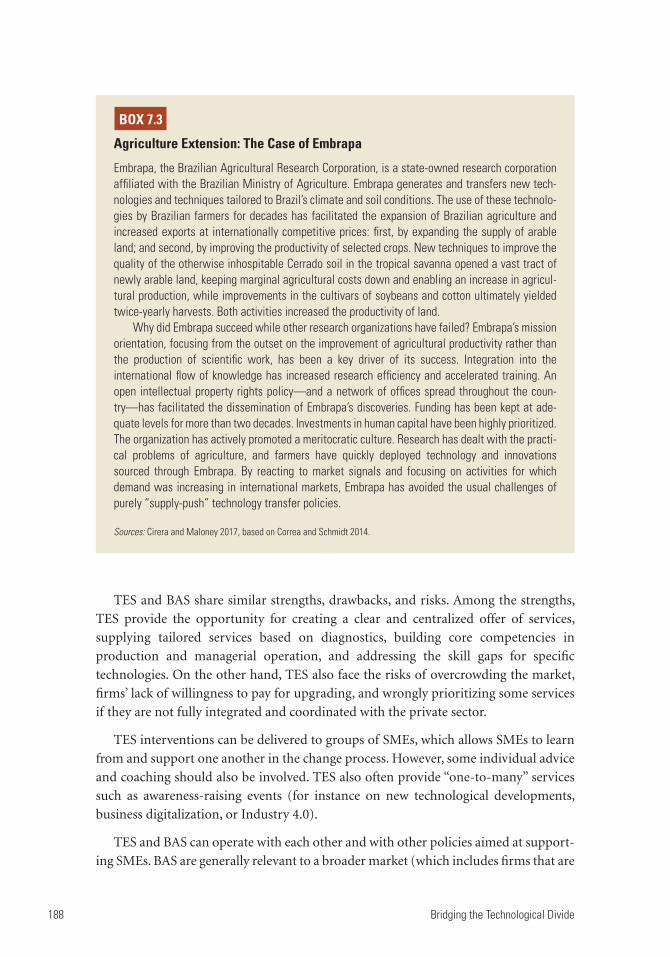
188 Bridging the Technological Divide
TES and BAS share similar strengths, drawbacks, and risks. Among the strengths,
TES provide the opportunity for creating a clear and centralized offer of services,
supplying tailored services based on diagnostics, building core competencies in
production and managerial operation, and addressing the skill gaps for specific
technologies. On the other hand, TES also face the risks of overcrowding the market,
firms’ lack of willingness to pay for upgrading, and wrongly prioritizing some services
if they are not fully integrated and coordinated with the private sector.
TES interventions can be delivered to groups of SMEs, which allows SMEs to learn
from and support one another in the change process. However, some individual advice
and coaching should also be involved. TES also often provide “one-to-many” services
such as awareness-raising events (for instance on new technological developments,
business digitalization, or Industry 4.0).
TES and BAS can operate with each other and with other policies aimed at support-
ing SMEs. BAS are generally relevant to a broader market (which includes firms that are
BOX 7.3
Agriculture Extension: The Case of Embrapa
Embrapa, the Brazilian Agricultural Research Corporation, is a state-owned research corporation affiliated with the Brazilian Ministry of Agriculture. Embrapa generates and transfers new tech-nologies and techniques tailored to Brazil’s climate and soil conditions. The use of these technolo-gies by Brazilian farmers for decades has facilitated the expansion of Brazilian agriculture and increased exports at internationally competitive prices: first, by expanding the supply of arable land; and second, by improving the productivity of selected crops. New techniques to improve the quality of the otherwise inhospitable Cerrado soil in the tropical savanna opened a vast tract of newly arable land, keeping marginal agricultural costs down and enabling an increase in agricul-tural production, while improvements in the cultivars of soybeans and cotton ultimately yielded twice-yearly harvests. Both activities increased the productivity of land.
Why did Embrapa succeed while other research organizations have failed? Embrapa’s mission orientation, focusing from the outset on the improvement of agricultural productivity rather than the production of scientific work, has been a key driver of its success. Integration into the international flow of knowledge has increased research efficiency and accelerated training. An open intellectual property rights policy—and a network of offices spread throughout the coun-try—has facilitated the dissemination of Embrapa’s discoveries. Funding has been kept at ade-quate levels for more than two decades. Investments in human capital have been highly prioritized. The organization has actively promoted a meritocratic culture. Research has dealt with the practi-cal problems of agriculture, and farmers have quickly deployed technology and innovations sourced through Embrapa. By reacting to market signals and focusing on activities for which demand was increasing in international markets, Embrapa has avoided the usual challenges of purely “supply-push” technology transfer policies.
Sources: Cirera and Maloney 2017, based on Correa and Schmidt 2014.

Policies and Instruments to Accelerate Technology Adoption 189
not innovators). These services often take a sequential approach that reflects the need
for SMEs to develop and build their absorptive capacities. A firm may first focus on
improving its basic managerial skills and technologies applied to GBFs before moving
into sector technology upgrading.
Most TES develop standardized assessment and benchmarking tools, and standard-
ized approaches to common SME upgrading problems (such as business planning,
production, and efficiency-lean manufacturing), but tailor the implementation and
sequencing to the specific circumstances of the client. There is evidence that TES
schemes (as well as BAS schemes) are often more effective when they are combined
with market development initiatives such as supplier linkages programs to large firms
or multinationals or new export markets, as these provide the motivation and incen-
tives to invest in internal improvements. They can also be accompanied by financial
support to companies to support implementation, usually through matching grants.
Such support can address the financial risk of implementing new technologies and
business models within SMEs.
3. Supporting More Sophisticated Technologies: Technology Centers
Technology centers (TCs) are a broad category of institutions that provide a range of
technological services to businesses, from the provision of basic or customized techno-
logical services to more sophisticated R&D projects and technological development.
TCs are often supported by government and implemented as public-private partner-
ships with industry or sector associations. They tend to be sector specific, often helping
to develop new technological solutions or adapting existing market technologies to the
needs of the private sector. TCs are an important actor in regional innovation systems,
given their location and proximity to industry clusters (for more on innovation systems,
see Cirera and Maloney 2017).
TCs can have very different functions in developing countries than in developed
countries. In developing countries, technology centers can serve as a policy vehicle to
house support measures such as provision of modern manufacturing equipment and
related training, testing, product design, development, and demonstration. They might
not have a strong focus on R&D. Instead, they tend to focus on the diffusion of tech-
nologies to SMEs. Typically, they offer workforce training (often for a fee) for the target
group. TCs address cross-cutting issues such as design and fabrication, as well as skills
gaps in new production technologies and processes. They also frequently involve BAS
and TES, as well as certification services. By contrast, in developed countries, TCs tend
to have less focus on mainstream workforce training and have moved up the value
chain, often providing practical advice on how to innovate and adopt new technolo-
gies, brokering applied R&D and providing technology awareness. In Japan, local pub-
lic technology centers not only provide small local firms with various technological
services, but also conduct their own research and patent inventions (Fukugawa 2009).

190 Bridging the Technological Divide
TCs may be stand-alone entities or part of a larger network. One of the best-known
networks globally is the Fraunhofer Society in Germany, a network of 72 applied research
centers that work closely with industry and other parts of the research sector.11 An exam-
ple of a network of technology centers in developing countries is the Indian Technology
Centers Network, which aimed to provide access to advanced manufacturing technologies and offer young workers opportunities for technical skills development.
The World Bank–funded initiative ran from 2015 to 2021. More recently, TCs
worldwide have been focusing on supporting smart manufacturing and Industry
4.0 technologies.
TCs are also an attempt to address coordination failures and asymmetric informa-
tion about existing technologies. While TCs target SMEs, other potential target groups
include large firms and other stakeholders such as industry associations, given that the
focus is usually more specific and geared toward more sophisticated technologies.
Some key strengths of this instrument are the provision of targeted training and ser-
vices close to industry and the creation and diffusion of technologies. Some potential
drawbacks and risks include the potential of being captured or rent seeking; the
challenge to remain close and relevant to industry; and the lack of proper governance
structure, leadership, staff, and service mix to deliver effective services, which risk turn-
ing these centers into dysfunctional physical infrastructure.
To lay the foundation for good policy design for TCs, policy makers need to make
appropriate decisions on a few crucial issues. First, the ownership of the program needs
strong engagement from industry and the private sector, rather than being run as a
fully government-owned scheme. Second, TCs require a sustainable business model.
Typical revenue sources include fees charged for training services, testing, certification
services, and use of equipment. Third, a strategic focus needs to be decided in collabo-
ration with the private sector. Most centers have a focus on specific industry sectors or
types of technology (such as subsectors of manufacturing), which need to match with
the demand coming from the private sector. Finally, it is critical to define a strategic
location to ensure that it is close to main industry customers.
4. Finance Instruments to Support Technology
Financial imperfections are pervasive in many developing countries and are particu-
larly severe for technology upgrading projects, especially for smaller firms, as discussed.
Many public and development banks, such as Brazil’s development bank (BNDES) and
Chile’s Production Development Corporation (CORFO), provide credit lines or loan
guarantees to businesses to finance the purchase of technologies. This is an extensive
practice in some countries, and should be a focus for policy makers, especially when the
potential externalities and spillovers are low and financial imperfections are obvious.
When externalities in an innovation project such as upgrading a technology are low
and public finance is costly, loans should be preferred to grants to induce innovation
Policies and Instruments to Accelerate Technology Adoption 191
efforts, as Lach, Neeman, and Schankerman (2021) show. However, depending on
whether the financial problem regarding information asymmetries centers on screen-
ing and identifying good projects from bad ones, or successful upgrading, the preferred
policy should be an interest rate that is higher or lower than the market rate. This con-
trasts with many public programs that finance technology acquisition, which almost
always provide a lower-than-market interest rate.
Credit guarantees provide a mechanism for lenders to mitigate risk and work as an
insurance scheme to cover some portion of the losses to lenders associated with extend-
ing credit to firms investing in risky technologies. For instance, the Korea Technology
Finance Corporation (KOTEC) provides an innovative policy instrument to finance
technology (see box 7.4). It offers credit guarantees based on a technology appraisal to
provide clear signaling to banks to finance the development and acquisition of new
technologies. While the model has been exported to other countries, the capacities
required to appraise the technologies suggest that this type of instrument is more likely
to be effective in upper-middle-income and high-income countries.
Policy makers should keep in mind some key elements in implementing finance
instruments (Cirera et al. 2020):
■■ The need to leverage the broader commercial environment. While government
loans are often justified in the context of a weak financial market, policy makers
should bear in mind that the ultimate objective is to create a competitive finan-
cial market that finances technology. Before launching a loan scheme, policy
makers need to consider the alternatives underpinned by commercial initiatives,
and work with the financial sector to reduce information asymmetries and
ensure future availability of finance from commercial banks for technology
upgrading.
■■ Complementary policy measures. Firms that face financing problems can also be
subject to weaknesses such as low capacity to exploit technology. In such cases,
BOX 7.4
Credit Guarantees for Technology through the Korea Technology Finance Corporation (KOTEC)
KOTEC (also known as Kibo), a nonprofit financial institution established in 1989 in the Republic of Korea, facilitates technology financing for innovative small and medium enterprises (SMEs), mainly through provision of technology appraisal services and credit guarantees (figure B7.4.1). Target beneficiaries are technologically viable but collateral-constrained SMEs with limited access to credit from traditional financial institutions.
KOTEC’s Kibo Technology Rating System (KTRS) appraises the future values of the technolo-gies retained by SMEs based on competency, marketability, and commercial viability of
(Box continues on the following page.)
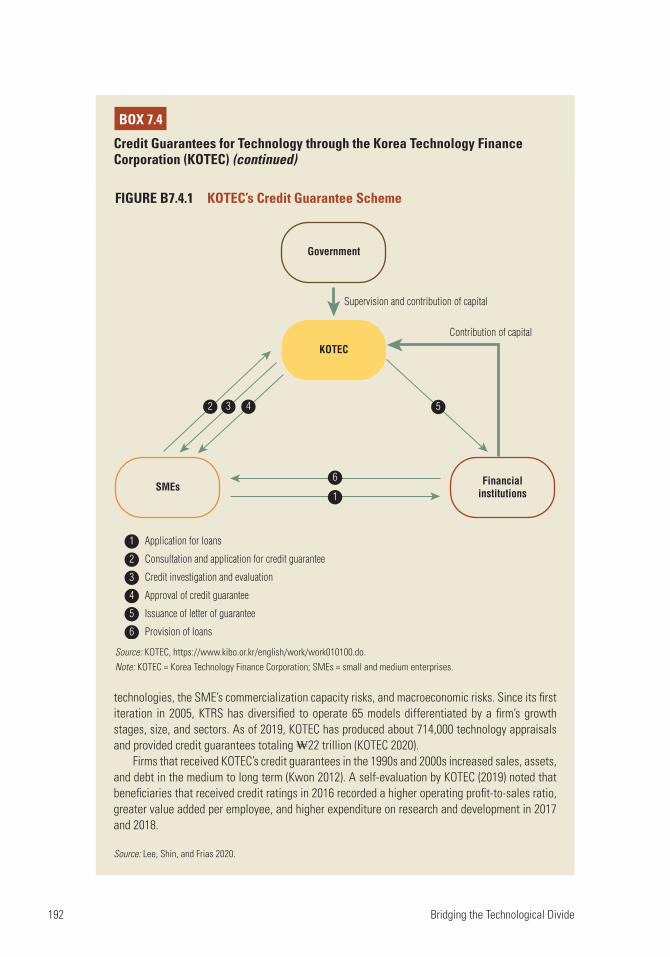
192 Bridging the Technological Divide
technologies, the SME’s commercialization capacity risks, and macroeconomic risks. Since its first iteration in 2005, KTRS has diversified to operate 65 models differentiated by a firm’s growth stages, size, and sectors. As of 2019, KOTEC has produced about 714,000 technology appraisals and provided credit guarantees totaling ₩22 trillion (KOTEC 2020).
Firms that received KOTEC’s credit guarantees in the 1990s and 2000s increased sales, assets, and debt in the medium to long term (Kwon 2012). A self-evaluation by KOTEC (2019) noted that beneficiaries that received credit ratings in 2016 recorded a higher operating profit-to-sales ratio, greater value added per employee, and higher expenditure on research and development in 2017 and 2018.
Source: Lee, Shin, and Frias 2020.
BOX 7.4
Credit Guarantees for Technology through the Korea Technology Finance Corporation (KOTEC) (continued)
Application for loans1
Consultation and application for credit guarantee2
Credit investigation and evaluation3
Approval of credit guarantee4
Issuance of letter of guarantee5
Provision of loans6
SMEs
KOTEC
Government
Supervision and contribution of capital
Contribution of capital
Financialinstitutions
6
1
2 3 4 5
FIGURE B7.4.1 KOTEC’s Credit Guarantee Scheme
Source: KOTEC, https://www.kibo.or.kr/english/work/work010100.do. Note: KOTEC = Korea Technology Finance Corporation; SMEs = small and medium enterprises.

Policies and Instruments to Accelerate Technology Adoption 193
complementary policy measures such as advisory services can step in to maxi-
mize the effects of financing provided by the loan scheme.
■■ A strong legal framework for upholding creditor rights. The feasibility of establish-
ing and maintaining a credit guarantee scheme depends on sound processes for
collection and recovery of assets in case of default and effective contract enforce-
ment. These are preconditions for the effective design, implementation, and
evaluation of a credit guarantee scheme.
5. Grants and Vouchers
Two common instruments to support technology upgrading are grants and vouchers
(see box 7.5). Grants are a direct allocation of funding from public agencies to finance
all or part of a technology project. In the case of matching grants, public agencies match
a percentage of the contribution made by the applicant to ensure the applicant’s com-
mitment to the activity. Vouchers are small, entitlement-based grants that do not need
to be repaid. They are used to incentivize firms to digitalize with simple projects that
require ready-made digital solutions, and to push firms to collaborate with technology
providers. With effective auditing, vouchers require only light management. The sim-
plicity of administration is a key attraction of voucher schemes; however, they require
BOX 7.5
The Difference between Vouchers and Grants
A voucher is a type of grant with specifically defined characteristics regarding the selection pro-cess, implementation mechanisms, and value of the grant. When choosing one instrument over the other, policy makers need to consider the following important features of vouchers compared to regular (matching) grants:
■■ Vouchers are entitlement based rather than competition or merit based; that is, applicants can get vouchers if they fulfill the selection criteria set in advance.
■■ Vouchers are small in value. Typically, the face value of vouchers is no more than a few thousand dollars, while regular grants can be much larger.
■■ Vouchers focus on behavior change: inducing small and medium enterprises and technol-ogy providers to collaborate and begin a process of technology upgrading, often of digital technologies. By contrast, regular grants typically focus on input additionality—imple-menting the adoption of a technology or digital solution—and are intended to crowd in private investment in technology projects.
■■ Vouchers rely heavily on brokers, which perform the functions of advertising, selecting technological solutions, vetting technology providers, monitoring, and ex post verification.
■■ Vouchers are simple to administer. Disbursement occurs when technology providers redeem vouchers, and firms often do not receive any value except the technical assistance.
Source: Cirera et al. 2020.

194 Bridging the Technological Divide
an established brokerage system to link recipients with digital solution providers and
ensure compliance through random audits or other mechanisms.
Both grants and vouchers are based on the idea that inducing more firms to upgrade
their technologies generates positive spillovers or externalities. One channel of spill-
overs is through the know-how embedded in workers and managers who use these
more sophisticated technologies that can spill over to other firms. It is important that
policy makers have in mind the idea of demonstrating such spillovers or externalities
when justifying this type of intervention.
Grants and vouchers are often used to subsidize part of the costs of the services of
extension services (BAS, TES, TCs). The government usually provides a voucher or
grant to the SMEs to purchase the services from a third party. When the government
provides the service directly, they generally have centers with advisers at the regional
and local levels that deliver the services to SMEs, as described. In this direct provision
model, it is critical that the advisers have knowledge and credibility and can quickly
add value to SMEs. This is often the critical failure for implementing this type of instru-
ment in developing countries.12 Therefore, a realistic assessment of the quality and
depth of the supply of these services is needed before deciding on the scope of the
delivery model.13 When implemented externally through the grants or vouchers, it is
important that public agencies maintain a list of technology and knowledge providers
that is monitored to guarantee the quality of services. In the case of vouchers, often
these lists are connected to a list of preapproved providers of technology solutions,
software licenses, customization services, and training.
An extensive description of how to design these types of instruments can be found
in Cirera et al. (2020). One important element in the case of grants is the matching
component. When matching rates by firms are high, they may not provide sufficient
incentive to compensate for the spillovers generated and take-up may be low. When
matching rates are too low, they may substitute for private funding and create low addi-
tionality. One good practice is to ask applicants to disclose in advance what percentage
of the project they require to be financed and without which they will not engage in the
technology upgrading project. That can help reveal beneficiaries’ willingness to pay and
maximize additionality.
6. Other Instruments to Support Technology
Other policy instruments to support technology tend to be more oriented toward the
generation and commercialization of technologies and the links to universities. Ideally,
public agencies should have mechanisms to link both supply and demand instruments,
so the supply of technologies targets the needs of the private sector.
Recently, there has been a proliferation of regulatory sandboxes, which aim to create
a regulation-free environment to develop and test certain digital technologies and
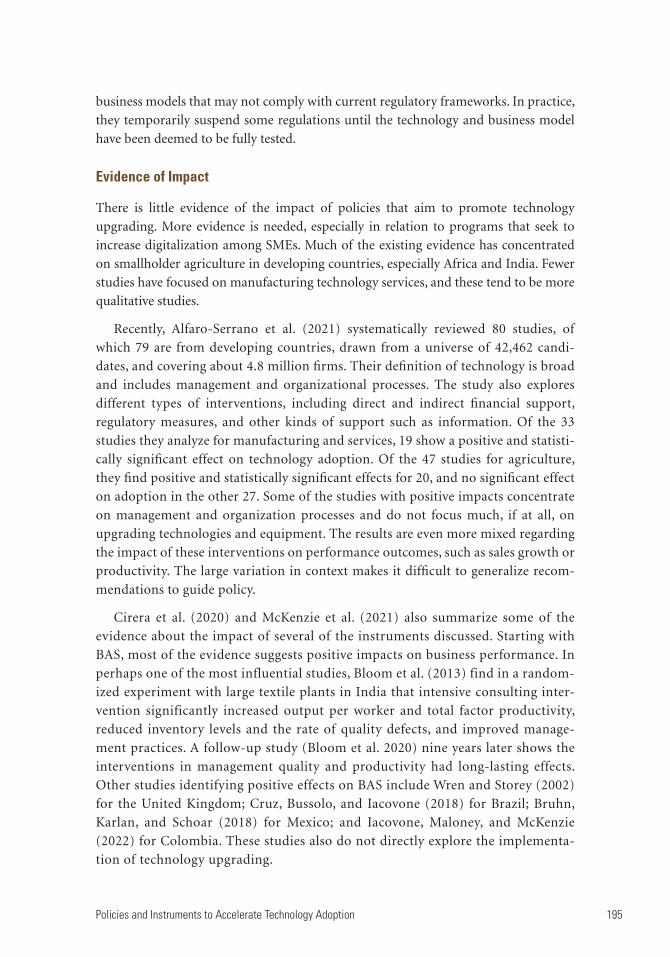
Policies and Instruments to Accelerate Technology Adoption 195
business models that may not comply with current regulatory frameworks. In practice,
they temporarily suspend some regulations until the technology and business model
have been deemed to be fully tested.
Evidence of Impact
There is little evidence of the impact of policies that aim to promote technology
upgrading. More evidence is needed, especially in relation to programs that seek to
increase digitalization among SMEs. Much of the existing evidence has concentrated
on smallholder agriculture in developing countries, especially Africa and India. Fewer
studies have focused on manufacturing technology services, and these tend to be more
qualitative studies.
Recently, Alfaro-Serrano et al. (2021) systematically reviewed 80 studies, of
which 79 are from developing countries, drawn from a universe of 42,462 candi-
dates, and covering about 4.8 million firms. Their definition of technology is broad
and includes management and organizational processes. The study also explores
different types of interventions, including direct and indirect financial support,
regulatory measures, and other kinds of support such as information. Of the 33
studies they analyze for manufacturing and services, 19 show a positive and statisti-
cally significant effect on technology adoption. Of the 47 studies for agriculture,
they find positive and statistically significant effects for 20, and no significant effect
on adoption in the other 27. Some of the studies with positive impacts concentrate
on management and organization processes and do not focus much, if at all, on
upgrading technologies and equipment. The results are even more mixed regarding
the impact of these interventions on performance outcomes, such as sales growth or
productivity. The large variation in context makes it difficult to generalize recom-
mendations to guide policy.
Cirera et al. (2020) and McKenzie et al. (2021) also summarize some of the
evidence about the impact of several of the instruments discussed. Starting with
BAS, most of the evidence suggests positive impacts on business performance. In
perhaps one of the most influential studies, Bloom et al. (2013) find in a random-
ized experiment with large textile plants in India that intensive consulting inter-
vention significantly increased output per worker and total factor productivity,
reduced inventory levels and the rate of quality defects, and improved manage-
ment practices. A follow-up study (Bloom et al. 2020) nine years later shows the
interventions in management quality and productivity had long-lasting effects.
Other studies identifying positive effects on BAS include Wren and Storey (2002)
for the United Kingdom; Cruz, Bussolo, and Iacovone (2018) for Brazil; Bruhn,
Karlan, and Schoar (2018) for Mexico; and Iacovone, Maloney, and McKenzie
(2022) for Colombia. These studies also do not directly explore the implementa-
tion of technology upgrading.

196 Bridging the Technological Divide
Evidence from interventions providing management training and equipment
directly suggest a complementary effect. Giorcelli (2019) compares the effects of man-
agement training trips for Italian managers to US firms that provided technologically
advanced machines to Italian companies.14 The results show that those firms that sent
their managers to the United States increased sales growth for at least 15 years after the
program. The effect was even larger for those firms that benefited from new machines
that were provided, suggesting these were complementary interventions. Firms that
only received new machines also improved the performance, but these gains flattened
out over time.
An alternative to consulting services emphasized by Anderson and McKenzie (2022)
is to provide businesses with support to insource or outsource knowledge by finding
specialized professionals to help perform general business functions, such as marketing
and business administration. Based on an experiment in Nigeria, the authors find that
this option led to more effective outcomes than consulting services. BAS can also be
used from a broader perspective, such as providing firms with diagnostics and advice
to find solutions in the market.
The other two instruments, TES and TCs, are more directly linked to the process of
technology upgrading, but evidence is even scarcer for them than for BAS, except in the
area of agriculture. An extensive body of studies provides evidence of the positive
impact of extension services for agriculture. A large share of this literature focuses on
small business in agriculture in developing countries (Owens, Hoddinott, and Kinsey
2003; Kondylis, Mueller, and Zhu 2017; Maertens, Michelson, and Nourani 2021),
suggesting positive effects for these interventions, which range from providing infor-
mation to training to showcasing the use of new technologies.
For manufacturing and services, there is some evidence, such as Jarmin (1999) and
Shapira, Youtie, and Kay (2011), but the use of randomized control trials or quasi-
experimental approaches is less common. The same applies for TCs. In terms of his-
torical experience, Japan has had a long history of utilizing TCs as a policy instrument
to boost regional innovation and competitiveness, dating back to the 1880s or so
(Fukugawa 2009). These technology centers have long served as the cornerstone of
local technology service provision in Japan (Shapira 1992).
Most of the existing studies evaluating TCs focus on design features, with little
emphasis on their impact, because it is difficult to randomize services within centers
and to find counterfactual firms. An exception is a recent study focusing on the
Fraunhofer Society, which suggests a positive effect of their interventions on firm
performance (see box 7.6).15
Overall, the evidence, although scarce, suggests that policy instruments to promote
technology tend to have a positive impact on technology upgrading and firm growth.
However, caution is warranted in interpreting this evidence. Most of the evidence

Policies and Instruments to Accelerate Technology Adoption 197
outside agriculture is concentrated in high-income countries, which suggests that some
of these policy instruments are more demanding in terms of human and financial
resources. Technology centers and extension services like Fraunhofer in Germany and
abroad, or the manufacturing extension partnerships in the United States, are also the
outgrowth of a more advanced productive sector that needs more specialized support
on sector-specific business functions. While these can be out of reach for most low-
income countries, creating the infrastructure to support some of the more general
business functions and their digitalization can play a critical role in increasing produc-
tivity in these countries.
Summing Up
This chapter has described a variety of policy options to support technology upgrad-
ing. These instruments can play an important role in addressing some of the barriers
highlighted in the previous chapter to promote technology diffusion and the digital
transformation of businesses. Public agencies have an important role to play to address
coordination and information failures. The starting point for policy makers should be
to make sure that the enabling conditions to adopt technologies are in place in terms of
access to infrastructure and information, the removal of regulatory bottlenecks and to
ensure access to external knowledge. When considering more direct support, public
agencies should identify and measure the type of market failure they are trying to
address and ponder whether their planned support can address these failures effec-
tively. To this end, implementing good diagnostics to identify key technology gaps
BOX 7.6
Fraunhofer Institutes
The Fraunhofer Society (FhG), comprising 72 research institutes across Germany, is considered to be the world’s largest public organization for applied research. It is dedicated to applied research and technological co-development with firms, rather than basic research, addressing searching and matching frictions to build technological knowledge. The research institutes employ approxi-mately 24,500 workers, who conduct applied research in all fields of science, leading to around 500 patents per year.
A relatively new initiative is the Industry 4.0 Competence Centers, which are intended to address cutting-edge technologies and to bring digitalization and networking technologies to German manufacturing small and medium enterprises.
A recent study suggests that a 1 percent increase in FhG expenditures results in 1.4 percent-age points of higher growth in turnover, and 0.7 percentage point in productivity for the German firms supported. German institutions are leading several initiatives to support adoption of new technologies, especially digital technologies, by manufacturing firms.
Source: Comin et al. 2019.

198 Bridging the Technological Divide
and better target firms, investing in adequate human and financial resources to imple-
ment the programs, and implementing good evaluation mechanisms are necessary
conditions.
The chapter also has reviewed some of the key policy instruments to support
technology upgrading. While there is some evidence that some instruments are effec-
tive in some contexts and countries, there are still large gaps in the evidence, and posi-
tive results are very specific to a particular context, which makes it difficult to guide the
choice of instrument. A critical objective of direct support instruments is to address
information and capability failures. The design and implementation of this type of
policy instrument increase in complexity when moving from general to sector-specific
business functions, as these require more specialized knowledge support.
A critical type of support is related to the financing of technology upgrading proj-
ects, given that financial markets in many developing countries suffer from large mar-
ket imperfections. Working with commercial banks to address this lack of finance can
help facilitate technology upgrading, especially for firms that have higher capabilities
to adopt but are financially constrained. However, these finance instruments may not
work in cases of firms with very low capabilities.
Finally, the COVID-19 crisis has been a wake-up call for many businesses around
the world about the need to upgrade their technologies, digital and nondigital. The
pandemic has increased the incentives of businesses to upgrade, reducing some of the
earlier overconfidence about their technological capabilities and making it more likely
that they will undertake upgrading programs. Policy makers should seize this opportu-
nity to minimize the risk of an increase in the technological divide across countries and
firms, and bring more sustained growth and prosperity to their economies.
Notes
1. In the context of financing a technology project, adverse selection is related to the difficulties the financier faces in screening and identifying good projects, while moral hazard is associated with the difficulties in monitoring the implementation of the technology upgrading project, thus transferring the risk of failure to the financier (Cirera et al. 2020).
2. Cruz, Bussolo, and Iacovone (2018) examine an exporting program in Brazil that advances funds to a business based on historic orders from buyers. They find that the program, which provided a detailed diagnostic and consulting services, had a positive impact on the reorganization of participating firms. This program was designed in response to the fact that many SMEs were not ready to benefit from more traditional export promotion instruments.
3. Targeting has been an important challenge for government programs supporting businesses during the pandemic. Emerging evidence highlights two main factors associated with mistarget-ing: (1) barriers to access to policy support, such as information and application costs, which are particularly large for smaller firms; and (2) the inability of public agencies to target the right beneficiaries (Cirera et al. 2021). This difficulty in targeting and the urgency to provide rapid support resulted in universal targeting.
4. This section draws heavily on Cirera et al. (2020); for a full description of these activities, readers should refer to that publication.
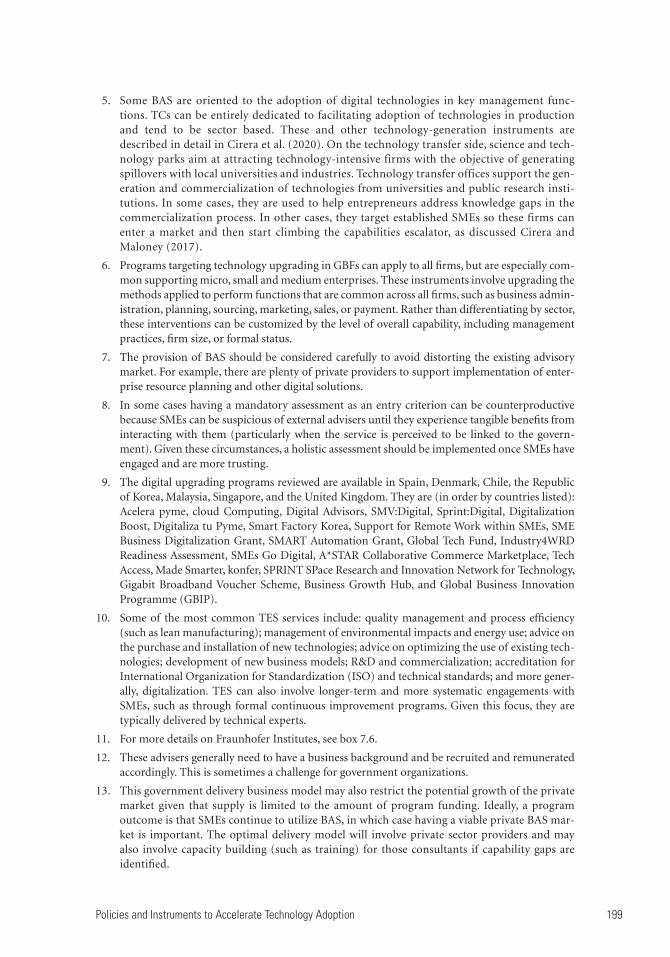
Policies and Instruments to Accelerate Technology Adoption 199
5. Some BAS are oriented to the adoption of digital technologies in key management func-tions. TCs can be entirely dedicated to facilitating adoption of technologies in production and tend to be sector based. These and other technology-generation instruments are described in detail in Cirera et al. (2020). On the technology transfer side, science and tech-nology parks aim at attracting technology-intensive firms with the objective of generating spillovers with local universities and industries. Technology transfer offices support the gen-eration and commercialization of technologies from universities and public research insti-tutions. In some cases, they are used to help entrepreneurs address knowledge gaps in the commercialization process. In other cases, they target established SMEs so these firms can enter a market and then start climbing the capabilities escalator, as discussed Cirera and Maloney (2017).
6. Programs targeting technology upgrading in GBFs can apply to all firms, but are especially com-mon supporting micro, small and medium enterprises. These instruments involve upgrading the methods applied to perform functions that are common across all firms, such as business admin-istration, planning, sourcing, marketing, sales, or payment. Rather than differentiating by sector, these interventions can be customized by the level of overall capability, including management practices, firm size, or formal status.
7. The provision of BAS should be considered carefully to avoid distorting the existing advisory market. For example, there are plenty of private providers to support implementation of enter-prise resource planning and other digital solutions.
8. In some cases having a mandatory assessment as an entry criterion can be counterproductive because SMEs can be suspicious of external advisers until they experience tangible benefits from interacting with them (particularly when the service is perceived to be linked to the govern-ment). Given these circumstances, a holistic assessment should be implemented once SMEs have engaged and are more trusting.
9. The digital upgrading programs reviewed are available in Spain, Denmark, Chile, the Republic of Korea, Malaysia, Singapore, and the United Kingdom. They are (in order by countries listed): Acelera pyme, cloud Computing, Digital Advisors, SMV:Digital, Sprint:Digital, Digitalization Boost, Digitaliza tu Pyme, Smart Factory Korea, Support for Remote Work within SMEs, SME Business Digitalization Grant, SMART Automation Grant, Global Tech Fund, Industry4WRD Readiness Assessment, SMEs Go Digital, A*STAR Collaborative Commerce Marketplace, Tech Access, Made Smarter, konfer, SPRINT SPace Research and Innovation Network for Technology, Gigabit Broadband Voucher Scheme, Business Growth Hub, and Global Business Innovation Programme (GBIP).
10. Some of the most common TES services include: quality management and process efficiency (such as lean manufacturing); management of environmental impacts and energy use; advice on the purchase and installation of new technologies; advice on optimizing the use of existing tech-nologies; development of new business models; R&D and commercialization; accreditation for International Organization for Standardization (ISO) and technical standards; and more gener-ally, digitalization. TES can also involve longer-term and more systematic engagements with SMEs, such as through formal continuous improvement programs. Given this focus, they are typically delivered by technical experts.
11. For more details on Fraunhofer Institutes, see box 7.6.
12. These advisers generally need to have a business background and be recruited and remunerated accordingly. This is sometimes a challenge for government organizations.
13. This government delivery business model may also restrict the potential growth of the private market given that supply is limited to the amount of program funding. Ideally, a program outcome is that SMEs continue to utilize BAS, in which case having a viable private BAS mar-ket is important. The optimal delivery model will involve private sector providers and may also involve capacity building (such as training) for those consultants if capability gaps are identified.
200 Bridging the Technological Divide
14. The analysis is based on a quasi-experimental approach under the United States Technical Assistance and Productivity Program (1952–58).
15. Some centers associated with Fraunhofer are multinational and have locations on all continents, focusing on specific technologies and sectors that are of key importance for the host country.
References
Alfaro-Serrano, D., T. Balantrapu, R. Chaurey, A. Goicoechea, and E. Verhoogen. 2021. “Interventions to Promote Technology Adoption in Firms: A Systematic Review.” Campbell Systematic Reviews 17 (4): e1181.
Anderson, S. J., and D. McKenzie. 2022. “Improving Business Practices and the Boundary of the Entrepreneur: A Randomized Experiment Comparing Training, Consulting, Insourcing, and Outsourcing.” Journal of Political Economy 130 (1): 157–209.
Anton, J. J., and D. A. Yao. 2002. “The Sale of Ideas: Strategic Disclosure, Property Rights, and Contracting.” Review of Economic Studies 69 (3): 513–31.
Arrow, K. 1962. “Economic Welfare and the Allocation of Resources for Invention.” In The Rate and Direction of Inventive Activity: Economic and Social Factors, compiled by the Universities–National Bureau Committee for Economic Research and the Committee on Economic Growth of the Social Science Research Council, 609–26. Princeton, NJ: Princeton University Press.
Balbontin, R., A. Cusolito, and X. Cirera. 2021. “A Review of Digital Upgrading Programs.” Unpublished.
Besley, T. 2007. Principled Agents? The Political Economy of Good Government. Oxford, UK: Oxford University Press.
Besley, T., and A. Case. 1993. “Modeling Technology Adoption in Developing Countries.” American Economic Review 83 (2): 396–402.
Bloom, N., B. Eifert, A. Mahajan, D. McKenzie, and J. Roberts. 2013. “Does Management Matter? Evidence from India.” Quarterly Journal of Economics 128 (1): 1–51.
Bloom, N., A. Mahajan, D. McKenzie, and J. Roberts. 2020. “Do Management Interventions Last? Evidence from India.” American Economic Journal: Applied Economics 12 (2): 198–219.
Bruhn, M., D. Karlan, and A. Schoar. 2018. “The Impact of Consulting Services on Small and Medium Enterprises: Evidence from a Randomized Trial in Mexico.” Journal of Political Economy 126 (2): 635–87.
Bryan, K. A., and H. L. Williams. 2021. “Innovation: Market Failures and Public Policies.” NBER Working Paper 29173, National Bureau of Economic Research, Cambridge, MA.
Cai, J., and A. Szeidl. 2022. “Indirect Effects of Access to Finance.” NBER Working Paper 29813, National Bureau of Economic Research, Cambridge, MA.
Camerer, C., and Davies, Lovallo. 1999. “Overconfidence and Excess Entry: An Experimental Approach.” American Economic Review 89 (1): 306–18.
Cirera, X., M. Cruz, E. Davies, A. Grover, L. Iacovone, J. E. Lopez Cordova, D. Medvedev, F. O. Maduko, G. Nayyar, S. R. Ortega, and J. Torres. 2021. “Policies to Support Businesses through the COVID-19 Shock: A Firm-Level Perspective.” World Bank Research Observer 36 (1): 41–66.
Cirera, X., J. Frias, J. Hill, and Y. Li. 2020. A Practitioner’s Guide to Innovation Policy: Instruments to Build Firm Capabilities and Accelerate Technological Catch-Up in Developing Countries. Washington, DC: World Bank.
Cirera, X., and W. F. Maloney. 2017. The Innovation Paradox: Developing-Country Capabilities and the Unrealized Promise of Technological Catch-Up. World Bank Productivity Project series. Washington, DC: World Bank.

Policies and Instruments to Accelerate Technology Adoption 201
Cohen, W. M., and D. A. Levinthal. 1990. “Absorptive Capacity: A New Perspective on Learning and Innovation.” Administrative Science Quarterly 35 (1): 128–52.
Comin, D., G. Licht, M. Pellens, and T. Schubert. 2019. “Do Companies Benefit from Public Research Organizations? The Impact of the Fraunhofer Society in Germany.” Discussion Paper 19–006, ZEW–Leibnitz Center for European Economic Research, Mannheim, Germany.
Correa, P., and C. Schmidt. 2014. “Public Research Organizations and Agricultural Development in Brazil: How Did Embrapa Get It Right?” Economic Premise 145: 1–10.
Cruz, M., M. Bussolo, and L. Iacovone. 2018. “Organizing Knowledge to Compete: Impacts of Capacity Building Programs on Firm Organization.” Journal of International Economics 111 (March): 1–20.
Cruz, M., X. Cirera, N. Dalvit, and K. Lee. Forthcoming. “Implementing the Firm-Level Diagnostic Tool: Operation Manual.” World Bank, Washington, DC.
Cruz, M., M. A. Dutz, and C. Rodríguez-Castelán. 2022. Digital Senegal for Inclusive Growth: Technological Transformation for Better and More Jobs. International Development in Focus series. Washington, DC: World Bank.
Fukugawa, N. 2009. “Determinants of Licensing Activities of Local Public Technology Centers in Japan.” Technovation 29 (12): 885–92.
Giorcelli, M. 2019. “The Long-Term Effects of Management and Technology Transfers.” American Economic Review 109 (1): 121–52.
Hoff, K. 2000. “Beyond Rosenstein-Rodan: The Modern Theory of Underdevelopment Traps.” Proceedings of the World Bank Annual Conference on Development Economics. Washington, DC: World Bank.
Iacovone, L., W. F. Maloney, and D. McKenzie. 2022. “Improving Management with Individual and Group-Based Consulting: Results from a Randomized Experiment in Colombia.” Review of Economic Studies 89 (1): 346–71.
Jarmin, R. S. 1999. “Evaluating the Impact of Manufacturing Extension on Productivity Growth.” Journal of Policy Analysis and Management 18 (1): 99–119.
Kondylis, F., V. Mueller, and J. Zhu. 2017. “Seeing Is Believing? Evidence from an Extension Network Experiment.” Journal of Development Economics 125 (C): 1–20.
KOTEC (Korea Technology Finance Corporation). 2019. 2019 Evaluation of Microeconomic Impact of 2019 Technology Finance Support Program. Busan: KOTEC.
KOTEC (Korea Technology Finance Corporation). 2020. KOTEC 2019 Annual Report. Busan: KOTEC.
Kwon, S. 2012. “A Study on the Characteristics and the Performances of the Technology-Based Guaranteed SMEs.” Journal of Industrial Economics 25 (3): 2069–87.
Lach, S., Z. Neeman, and M. Schankerman. 2021. “Government Financing of R&D: A Mechanism Design Approach.” American Economic Journal: Microeconomics 13 (3): 238–72.
Lee, H., K. Shin, and J. Frias. 2020. “An Overview of KOTEC’s Credit Guarantee Scheme.” Unpublished.
Maertens, A., H. Michelson, and V. Nourani. 2021. “How Do Farmers Learn from Extension Services? Evidence from Malawi.” American Journal of Agricultural Economics 103 (2): 569–95.
Maloney, W. F. 2002. “Missed Opportunities: Innovation and Resource-Based Growth in Latin America.” Policy Research Working Paper 2935. World Bank, Washington, DC.
McKenzie, D., C. Woodruff, K. Bjorvatn, M. Bruhn, J. Cai, J. Gonzalez-Uribe, S. Quinn, T. Sonobe, and M. Valdivia. 2021. “Training Entrepreneurs: Issue 2.” VoxDevLit 1 (1): 3.
Owens, T., J. Hoddinott, and B. Kinsey. 2003. “The Impact of Agricultural Extension on Farm Production in Resettlement Areas of Zimbabwe.” Economic Development and Cultural Change 51 (2): 337–57.

202 Bridging the Technological Divide
Rodríguez-Clare, A. 2006. “Coordination Failure, Clusters, and Microeconomic Interventions.” Economia 6 (1): 1–42.
Shapira, P. 1992. “Modernizing Small Manufacturers in Japan: The Role of Local Public Technology Centers.” Journal of Technology Transfer 17 (1): 40–57.
Shapira, P., J. Youtie, and L. Kay. 2011. “Building Capabilities for Innovation in SMEs: A Cross-Country Comparison of Technology Extension Policies and Programmes.” International Journal of Innovation and Regional Development 3 (3–4): 254–72.
Wren, C., and D. J. Storey. 2002. “Evaluating the Effect of Soft Business Support upon Small Firm Performance.” Oxford Economic Papers 54 (2): 334–65.
Zhu, T. J., P. Grinsted, H. Song, and M. Velamuri. Forthcoming. “Digital Businesses in Developing Countries: New Insights for a Digital Development Pathway.”

203
Appendix A. The Firm-level Adoption of Technology (FAT) Survey, Implementation, and Data Set
The Firm-level Adoption of Technology (FAT) data set is based on multicountry,
multisector, representative firm-level surveys. The data set provides information
about the technologies used by firms in particular general business functions (GBFs)
and sector-specific business functions (SBFs) that encompass the key activities that
each firm conducts. The survey measures four dimensions of technology adoption:
which technologies firms use; what business functions firms use them for; how inten-
sively firms use them; and how sophisticated those technologies are. More detailed
information on data collection, implementation, and robustness is provided by
Cirera et al. (2020).
Business Functions and Relevant Technologies
To identify business functions and relevant technologies associated with them, the
team developed a methodology that follows three steps, involving more than 50 indus-
try experts. First, the team reviewed journal articles and technical reports. Based on this
initial research, the team implemented several internal review processes with sector
specialists at the World Bank Group to confirm these business functions and technolo-
gies for each sector. Then, the team conducted a thorough external review process with
senior private sector technology experts outside of the World Bank. These experts had
experience in production processes in each specific sector of both advanced economies
and developing countries, so they could easily map the variety, scope and complexity of
different technologies.
The series of figures that follow focus on SBFs and associated technologies cov-
ered by the FAT survey for various sectors. One sector in agriculture is covered: live-
stock (figure A.1). For manufacturing, four sectors are included: wearing apparel
(figure A.2); leather and footwear (figure A.3); motor vehicles (figure A.4); and phar-
maceuticals (figure A.5); along with the business functions and associated technolo-
gies common across fabrication (figure A.6). For services, four sectors are featured:
land transport (figure A.7); financial services (figure A.8); accommodation (figure
A.9); and health services (figure A.10). Additional sectors in agriculture (crops),
manufacturing (food processing), and services (retail and wholesale), as well as the
GBFs and their respective technologies are shown in figure 1.5 in chapter 1.

204 Bridging the Technological Divide
FIGURE A.1 Livestock: Sector-Specific Business Functions and Technologies
Source: Original figure based on the Firm-level Adoption of Technology (FAT) survey.
1. Breeding andgenetics
Breed substitution
2. Nutrition
Household waste orfibrous crop residues
Natural grasslands
Integrated crop-livestock systems:
crop-pasture
Forage crops
Supplementaryfeed to grazing
pastures: hay, silage,grains feed
Manufacturing ormixing of feed
Genetically modifiedfeed
3. Animal health care 4. Herd managementand monitoring 5. Transport
Rapid diagnostictests
Human monitoring Manual transport
Nonmotorizedvehicles Animal-aided
monitoringPest sprays
Vaccines(live-attenuated,inactivated, or
subunit vaccines)
Motorized vehicles
Specialized/climate-controlled vehicles
DNA orRNA-based
vaccine
Diseasemedication
Analog trackingdevices attached
to animals
Digital trackingdevice attached
to animal
Unmanned aerialvehicles (drones)
Feedlots or grazingsystem
Automated camerasand video
Inbreeding orcrossbreeding
Artificialinsemination
Molecular genetics
FIGURE A.2 Wearing Apparel: Sector-Specific Business Functions and Technologies
Source: Original figure based on the Firm-level Adoption of Technology (FAT) survey.Note: 2D = two-dimensional; 3D = three-dimensional.
Manual design andhand drawing
Cutting machine manuallyoperated
Semi-automatic cuttingmachine (straight knife, round
knife, die-cutting machine)
Automatic or computerizedcutting machine (no laser:
water jet, knife, other)
Automatic or computerizedcutting machine (laser)
Manual cutting
2. Cutting1. Design 3. Sewing 4. Ironing
Basic manual ironing
Electric high-pressuresteam iron
Tunnel finisher
Form-finishingmachine
High-tech pressingmachine
Manual sewing
Sewing machinemanually operated
Semi-automatedsewing machines
Automated sewingmachines
3D knitting
Digital or semi-digital design using specialized
2D drawing software
Computer-aided design,3D design, virtual
prototyping
Appendix A 205
FIGURE A.3 Leather and Footwear: Sector-Specific Business Functions and Technologies
Source: Original figure based on the Firm-level Adoption of Technology (FAT) survey.Note: 2D = two-dimensional; 3D = three-dimensional.
Manual design andhand drawing
Cutting machine manuallyoperated
Semi-automatic cuttingmachine (straight knife, round
knife, die-cutting machine)
Automatic or computerizedcutting machine (no laser:
water jet, knife, other)
Automatic or computerizedcutting machine (laser)
Manual cutting
2. Cutting1. Design 3. Sewing 4. Finishing
Manual one station–basedfinishing and assembly method
Conveyor-based finishing andassembly method (static/semi-automated conveyor system)
Conveyor-based finishing andassembly method (dynamic/automated conveyor system)
Injection machine and finishingline with direct injection
process
3D printing/assembly
Manual sewing
Sewing machinemanually operated
Semi-automatedsewing machines
Automated sewingmachines
3D knitting
Digital or semi-digital design using specialized
2D drawing software
Computer-aided design,3D design, virtual
prototyping
FIGURE A.4 Motor Vehicles: Sector-Specific Business Functions and Technologies
Source: Original figure based on the Firm-level Adoption of Technology (FAT) survey.Note: 3D = three-dimensional.
1. Assembly 2. Body pressing 3. Painting
Water-based paintingusing operators
4. Plastic injectionmolding
5. Productive assetsmanagement
Molding ofnonvisible interior
plastic componentsusing operators
Breakdownmaintenance system
Preventive orpredictive maintenance
system
Model-basedcondition monitoring
Molding of plasticexterior body parts
using operators
Molding ofnonvisible interior
plastic componentsautomated using
robotics
Molding of plasticexterior body parts
automated usingrobotics
Solvent-basedpainting using
operators
Water-based paintingautomated using
robotics
Solvent-basedpainting automated
using robotics
Pressing of skinpanels using
operators
Pressing of skinpanels using robotics
Pressing of structuralcomponents using
operators
Pressing of structuralcomponents using
robotics
Welding of mainbody using operators
Welding of main bodyusing robotics
Machines controlledby operators
Flexiblemanufacturing cells
(FMC) or flexiblemanufacturingsystems (FMS)
Lasers
Computer numericallycontrolled (CNC)
machinery
Robot(s)
Additive manufacturing or 3D printers

206 Bridging the Technological Divide
FIGURE A.5 Pharmaceuticals: Sector-Specific Business Functions and Technologies
Source: Original figure based on the Firm-level Adoption of Technology (FAT) survey.Note: HEPA = high-efficiency particulate air filter.
1. Facilities2. Raw materialweighing and
dispensing
3. Mixing andcompounding
4. Compression,encapsulation
(not for syrups ordry powders)
5. Quality control 6. Packaging
Beam scales
Analogscales
Electronicscales
Automatedweighingsystems
Manual filling ofpills in bottles OR
placement of syrups,powders in bottles
or pouches
For pills: Slat counters,cottoners, cappers,
labelers OR machinefilling of syrups,
powders in bottlesor pouches
Automated, integratedpackaging lines
Manual,titrimetric/
chromatographicanalyses
Electronicchromatography
Electronicchromatography
with dataacquisition
Manualcompression,encapsulation
with dosing dies
Motorizedcompression,encapsulation
Automatedcompression,encapsulation
Integratedcompression,encapsulation
Manual mixing
Planetarymixers OR
homogenizers
High-speed,high-sheargranulators
Fluid bedprocessors(not withsyrups)
Automatedcompounding
Unfiltered airin filling space
Basic airfiltration
HEPA airfiltration
Ultra HEPA air,pressurization
control
FIGURE A.6 Manufacturing (Fabrication): Sector-Specific Business Functions and Technologies
Source: Original figure based on the Firm-level Adoption of Technology (FAT) survey.Note: “Manufacturing” here excludes the food-processing and wearing apparel sectors. 3D = three-dimensional.
Fabrication technology and automation
Manual processes
Machines controlled by operators
Machines controlled by computers
Robots
Additive manufacturing including rapidprototyping and 3D printers
Other advanced manufacturing processes(e.g., laser, plasma sputtering, high-speed machine,
e-beam, micromachining)

Appendix A 207
FIGURE A.7 Land Transport: Sector-Specific Business Functions and Technologies
Source: Original figure based on the Firm-level Adoption of Technology (FAT) survey.Note: ERP = enterprise resource planning; ETM = equipment and tool management; GPS = global positioning system; MS = Microsoft.
1. Transportationplanning
2. Transportationplan execution
Manual process withthe support of fax,text, or phone calls
3. Transportationmonitoring
4. Transportationperformancemeasurement
Manually monitoredand reported
Information collectedby electronic file and
shared throughemail or fax
Batch informationcollected by software
installed ontransportation
equipment—ETM(engine monitoring)
Real-time informationby online software
interface with ERP tomanage, document,
and reportfleet asset status
All-manual paper-driven system
Nonspecializedsoftware,
MS applications:Excel, Word,
PowerPoint, etc.
Computer or appswith specializedtransportation
reporting applicationsby service and costperformance metrics
Specialized softwareinstalled on thetransportation
equipment (e.g., GPS,e-log—driver status,
load monitoring)
File exchange between ERP-integrated applications
and delivery equipmentsoftware applications
Event-driven atpredetermined
checkpoints of loadtransactions
5. Fleet assetmanagement/maintenance
Event-driven atpredetermined intervals
with the support ofdigital platforms or
mobile apps
Paper documentationexchange on daily,weekly, or monthly
intervals
File exchange betweenERP-integrated
applications anddelivery equipment
software applications
Information collectedby software installedon the transportation
equipment
Informationexchanged via
web-basedcommunication
protocol (e.g., email or WhatsApp)
Specialized softwareinterface via internet,
including GPS,dynamic routing(weather, traffic),
e-log, driver statusand safety,
load monitoring
File exchangebetween
ERP-integratedapplications and
delivery equipment
Handwritteninformation to
create load plans
Informationcollected by
electronic file share(e.g., email or fax)
Batch informationcollected by software
installed ERP tocreate ERP-generated
load plans
Real-timeinformation byonline software
interface with ERPto create load plans
FIGURE A.8 Financial Services: Sector-Specific Business Functions and Technologies
Source: Original figure based on the Firm-level Adoption of Technology (FAT) survey.
1. Customerservices
Teller (face-to-face)
2. Clientidentification
3. Loanapplications
Paper-basedapplications
4. Approvalprocess
5. Operationalsupport
Writing records fromemployees
Digital accounting
Digital network
Analysts based onpaper applications
Analysts based ondigital information
Automated decisionmechanisms
Artificial intelligenceor big data analytics
Mobile/phoneapplication
Channel partners, loanofficer, paper-based
Internet applicationsor mobile apps
Teller withdocumentation
Online passwords
Online passwordsand token devices
Digital authenticationprovided
by specialized firms
Biometric identityverification
Blockchain
Automated tellermachines
Online on companywebsite
Mobile application ofthe company
Mobile banking

208 Bridging the Technological Divide
FIGURE A.9 Accommodation: Sector-Specific Business Functions and Technologies
Source: Original figure based on the Firm-level Adoption of Technology (FAT) survey.
1. Reservations/ bookings/room inventory
Handwritten process Manual cost
Automated markup(Excel or similar)
Automated promotional(e.g., planning prices based
on seasonality or otherpredictable events)
Dynamic pricing systems(using specific software to
predict demand andadjust prices)
Digital reservation recordsusing standard software,such as Excel and Word
Dedicated reservation/booking specialized software
Property managementsystem (PMS) software
Cloud-based systemsintegrated to analyticaland management tools Personalized pricing driven
by predictive analytics(e.g., data mining,machine learning)
Handwritten process Manual
Domesticwashing machines
Industrial washingmachines withoutautomatic bedsheet
folding
Industrial washingmachines with automatic
bedsheet folding
Digital room recordsusing standard software,such as Excel and Word
Dedicated housekeepingmanagement specialized
software
Property managementsystem (PMS) software
Cloud-based systemsintegrated to analyticaland management tools
2. Pricing 3. Housekeepingsystem 4. Laundry
FIGURE A.10 Health Services: Sector-Specific Business Functions and Technologies
Source: Original figure based on the Firm-level Adoption of Technology (FAT) survey.Note: The intensive margin of technology for business functions 4–7 for health is based on the level of availability of these technolo-gies for patients. SMS = short message service (text message).
1. Schedulingappointments
Personal visitand paper
Phone call,SMS, email
Specializedsoftware or
mobile app forappointment
without automatedreminders
Specializedsoftware or
mobile app forappointment
with automatedreminders andconfirmation
2. Managementof patientrecords
Manual/ paper
process
Digitalinformation
system
Electronichealth
records withspecialized
software
Cloud-basedelectronic
healthrecords
3. Medicationmanagement
Handwrittenmonitoring
administrationof medicine
4. Diagnosisand treatment
of sepsis
Treatmentwith
antibiotics
Cesareansection
High-risklabor
Resuscitation,mechanicalventilation,
glucosecontrol, andrenal control
5. Childbirth 6. Trauma
Traction(closedfracture)
Opentreatmentof fracture
7. Myocardialinfarction
Defibrillation
Coronaryangiography
or multivesselcoronary
revascularization
Barcodeidentificationfor medicine
administrationto patients

Appendix A 209
The Firm Adoption of Technology Index
The FAT survey asks two types of questions about the technologies used to perform a
business function. The first type of question regards the use of each of the technologies
listed by the experts as relevant in a given business function (corresponding to whether
or not firms adopt technology). The answer to this question characterizes the full array
of technologies that the firm uses. The second type of question gathers information
about which of the technologies used is employed more intensively (corresponding to
what and how firms use technology). The answer to this question is used to construct
technology measures that reflect the nature of the most frequently used technology in
the business function (the intensive margin) as opposed to the array of technologies
used by the firm (the extensive margin). This distinction is relevant because firms do
not use all the technologies available to perform a business function with the same
intensity, and the impact of a technology on the firm’s productivity may depend on the
importance of the technology used most intensively.
To measure technology sophistication, the technology options are combined into
an index, following the methodology proposed by Cirera et al. (2020), capturing the
proximity to the technology frontier for each business function. The technology
indexes are defined as
EXTf,j
= 1 + 4 × ̂r f,jEXT
INTf,j
= 1 + 4 × ̂r f,jINT
EXTf,j is the most advanced technology (extensive margin) used in a business func-
tion f within a firm j. INTf,j is the index for most widely used technology (intensive
margin). r̂f is a relative rank of technology defined as rRf
f
1
1
−
−, where r
f is a rank of tech-
nology and Rf is the maximum rank in a business function. The technology index
ranges from 1 to 5, where 1 stands for the most basic level of technology and 5 reflects
the most sophisticated. With the help of experts for each industry, a rank was assigned
to the technologies in each business function according to their sophistication. The
analysis presented in this volume relies mostly on the INT index, except if the use of
EXT is explicitly specified. More details about the index and robustness checks are
available in Cirera et al. (2020).
Sampling Frame
The sampling frames for the FAT survey were based on the most comprehensive and
latest establishment census available from national statistical agencies or the adminis-
trative business register in each country. Table A.1 describes the main source of data,
the sampling frame, and the year and mode of data collection.
The universe of study includes establishments with 5 or more workers in agricul-
ture, manufacturing, and services. The sector classification is based on the International
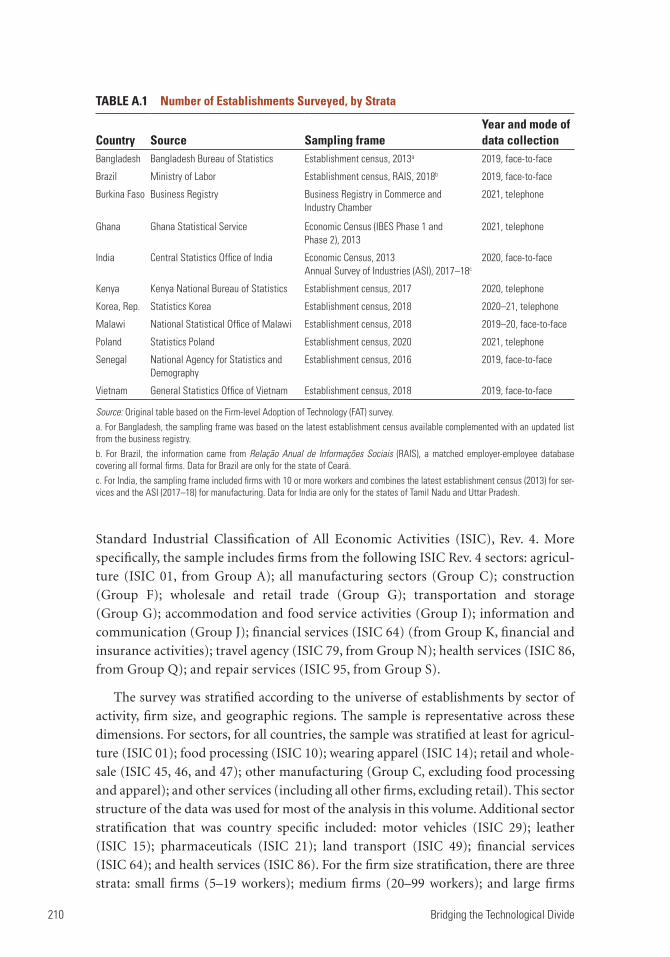
210 Bridging the Technological Divide
TABLE A.1 Number of Establishments Surveyed, by Strata
Country Source Sampling frameYear and mode of data collection
Bangladesh Bangladesh Bureau of Statistics Establishment census, 2013a 2019, face-to-face
Brazil Ministry of Labor Establishment census, RAIS, 2018b 2019, face-to-face
Burkina Faso Business Registry Business Registry in Commerce and Industry Chamber
2021, telephone
Ghana Ghana Statistical Service Economic Census (IBES Phase 1 and Phase 2), 2013
2021, telephone
India Central Statistics Office of India Economic Census, 2013Annual Survey of Industries (ASI), 2017–18c
2020, face-to-face
Kenya Kenya National Bureau of Statistics Establishment census, 2017 2020, telephone
Korea, Rep. Statistics Korea Establishment census, 2018 2020–21, telephone
Malawi National Statistical Office of Malawi Establishment census, 2018 2019–20, face-to-face
Poland Statistics Poland Establishment census, 2020 2021, telephone
Senegal National Agency for Statistics and Demography
Establishment census, 2016 2019, face-to-face
Vietnam General Statistics Office of Vietnam Establishment census, 2018 2019, face-to-face
Source: Original table based on the Firm-level Adoption of Technology (FAT) survey.a. For Bangladesh, the sampling frame was based on the latest establishment census available complemented with an updated list from the business registry. b. For Brazil, the information came from Relação Anual de Informações Sociais (RAIS), a matched employer-employee database covering all formal firms. Data for Brazil are only for the state of Ceará.c. For India, the sampling frame included firms with 10 or more workers and combines the latest establishment census (2013) for ser-vices and the ASI (2017–18) for manufacturing. Data for India are only for the states of Tamil Nadu and Uttar Pradesh.
Standard Industrial Classification of All Economic Activities (ISIC), Rev. 4. More
specifically, the sample includes firms from the following ISIC Rev. 4 sectors: agricul-
ture (ISIC 01, from Group A); all manufacturing sectors (Group C); construction
(Group F); wholesale and retail trade (Group G); transportation and storage
(Group G); accommodation and food service activities (Group I); information and
communication (Group J); financial services (ISIC 64) (from Group K, financial and
insurance activities); travel agency (ISIC 79, from Group N); health services (ISIC 86,
from Group Q); and repair services (ISIC 95, from Group S).
The survey was stratified according to the universe of establishments by sector of
activity, firm size, and geographic regions. The sample is representative across these
dimensions. For sectors, for all countries, the sample was stratified at least for agricul-
ture (ISIC 01); food processing (ISIC 10); wearing apparel (ISIC 14); retail and whole-
sale (ISIC 45, 46, and 47); other manufacturing (Group C, excluding food processing
and apparel); and other services (including all other firms, excluding retail). This sector
structure of the data was used for most of the analysis in this volume. Additional sector
stratification that was country specific included: motor vehicles (ISIC 29); leather
(ISIC 15); pharmaceuticals (ISIC 21); land transport (ISIC 49); financial services
(ISIC 64); and health services (ISIC 86). For the firm size stratification, there are three
strata: small firms (5–19 workers); medium firms (20–99 workers); and large firms

Appendix A 211
(100 or more workers). Table A.2 shows the distribution of the universe of establish-
ments by sector (agriculture, manufacturing, and services) and firm size (small,
medium, and large). In the geographic stratification, subnational regions are used. To
calculate the optimal distribution of the sample, the team followed a methodology
described in World Bank (2022). The sample size for each country was aligned with the
degree of stratification of the sample. Table A.3 presents the number of firms surveyed
by aggregated sector and by firm size.
Survey Weights
FAT surveys are cross-sectional surveys and rely on probability samples. Before starting
the survey in each country, an independent and entirely new sample was randomly
selected from the most recent and comprehensive sampling frame available. Therefore,
for any FAT survey, the initial weights to be attached to sampled units (which are
establishments) are design weights: they are equivalent to unit inclusion probabilities.
For any given country, the target population of the FAT survey is the population of estab-
lishments that (1) exist at the reference time of the survey; (2) are located within a specific
set of regions; (3) operate within a specific set of sectors; and (4) have at least 5 workers.
All FAT surveys adopt a stratified one-stage element sampling design. Establishments
are randomly selected with equal probabilities within strata, by sector, region, and firm
size groups. Because the sample is not proportionally allocated to the strata, inclusion
probabilities differ between strata. The statistical analysis of FAT survey data presented
in this volume is performed using the weights to properly account for the selection of
sample units with unequal probabilities. FAT weights were adjusted for nonresponse by
means of a simple Response Homogeneity Groups (RHG) model (Särndal, Swensson,
and Wretman 1992), with groups determined by sampling strata.
Because of the different number of establishments in each country, when comput-
ing global statistics for the data, weights were rescaled so that all countries are equally
weighted. This means that for results between strata presented in this volume that are
not country specific, the weights represent the cross-country average, such that each
country has similar weights. Technical details about the weights used in the FAT data
are described by Zardetto (forthcoming). In addition, given the significant differences
in economic structure, formality, and other economic characteristics of the samples
included in the FAT survey, regression tools with controls (e.g., size, sector, and coun-
try) are used to adjust some of the statistics shown for the whole sample with different
countries and sectors, and to facilitate the comparisons.
Implementation, Quality Control, and Validation
A critical objective of the data collection effort is to obtain robust and comparable
measures of the sophistication of technologies used across countries, sectors, firms, and
business functions. This requires fully harmonized implementation processes across
countries that minimize potential nonresponse, enumerator, and respondent biases.
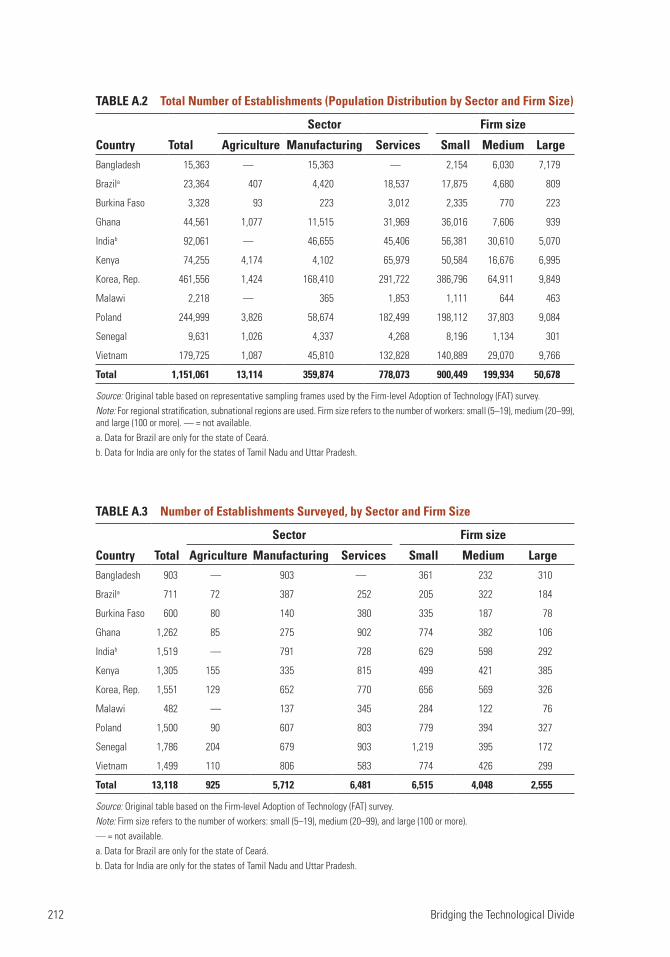
212 Bridging the Technological Divide
TABLE A.3 Number of Establishments Surveyed, by Sector and Firm Size
Country Total
Sector Firm size
Agriculture Manufacturing Services Small Medium LargeBangladesh 903 — 903 — 361 232 310
Brazila 711 72 387 252 205 322 184
Burkina Faso 600 80 140 380 335 187 78
Ghana 1,262 85 275 902 774 382 106
Indiab 1,519 — 791 728 629 598 292
Kenya 1,305 155 335 815 499 421 385
Korea, Rep. 1,551 129 652 770 656 569 326
Malawi 482 — 137 345 284 122 76
Poland 1,500 90 607 803 779 394 327
Senegal 1,786 204 679 903 1,219 395 172
Vietnam 1,499 110 806 583 774 426 299
Total 13,118 925 5,712 6,481 6,515 4,048 2,555
Source: Original table based on the Firm-level Adoption of Technology (FAT) survey.Note: Firm size refers to the number of workers: small (5–19), medium (20–99), and large (100 or more).— = not available.a. Data for Brazil are only for the state of Ceará.b. Data for India are only for the states of Tamil Nadu and Uttar Pradesh.
TABLE A.2 Total Number of Establishments (Population Distribution by Sector and Firm Size)
Country Total
Sector Firm size
Agriculture Manufacturing Services Small Medium LargeBangladesh 15,363 — 15,363 — 2,154 6,030 7,179
Brazila 23,364 407 4,420 18,537 17,875 4,680 809
Burkina Faso 3,328 93 223 3,012 2,335 770 223
Ghana 44,561 1,077 11,515 31,969 36,016 7,606 939
Indiab 92,061 — 46,655 45,406 56,381 30,610 5,070
Kenya 74,255 4,174 4,102 65,979 50,584 16,676 6,995
Korea, Rep. 461,556 1,424 168,410 291,722 386,796 64,911 9,849
Malawi 2,218 — 365 1,853 1,111 644 463
Poland 244,999 3,826 58,674 182,499 198,112 37,803 9,084
Senegal 9,631 1,026 4,337 4,268 8,196 1,134 301
Vietnam 179,725 1,087 45,810 132,828 140,889 29,070 9,766
Total 1,151,061 13,114 359,874 778,073 900,449 199,934 50,678
Source: Original table based on representative sampling frames used by the Firm-level Adoption of Technology (FAT) survey.Note: For regional stratification, subnational regions are used. Firm size refers to the number of workers: small (5–19), medium (20–99), and large (100 or more). — = not available. a. Data for Brazil are only for the state of Ceará.b. Data for India are only for the states of Tamil Nadu and Uttar Pradesh.
Appendix A 213
The survey was initially implemented face to face. After 2020, with the start of the
COVID-19 pandemic, phone interviews were used. To ensure the accuracy of the
responses and the comparability of the data collected across countries, a standardized
process for implementation was used across all countries. The same terms of reference
across all countries were used for the organizations that implemented the survey. These
include the requirement that both the organizations, as well as the main team of inter-
viewers, supervisors, and managers, have ample experience in collecting firm-level data
in their respective country and follow similar procedures for implementing the survey.
Enumerators, supervisors, and managers leading the data implementation in each
country received a standard training. The same questionnaire was administered
through face-to-face or telephone interviews with Computer Assisted Personal
Interviewing (CAPI)/Computer Assisted Telephone Interviewing (CATI) in all coun-
tries. The questionnaire was implemented at the establishment level. In the sample,
86 percent of the observations refer to single-establishment firms. In the case of multi-
establishment firms, the questionnaire was applied to the specific unit of production
that was randomly selected.
Minimizing Potential Nonresponse Bias
Survey implementation was designed to minimize nonresponse through the use of
well-prepared agencies and institutions to administer the survey and the presentation
of adequate supporting letters to encourage participation. Response rates varied
between 24 percent and 80 percent. The response rates were higher when the survey
was implemented by national statistical agencies.
The sampling weights were adjusted to minimize response bias. To check the pos-
sibility that variation in response rates could lead to biases in the analyses, the team
implemented a series of ex post tests in countries with additional data available. For
example, the team investigated whether, in the sample of contacted firms, there were
significant differences between firms that responded and firms that declined partici-
pating or could not be reached. The team also checked whether common variables were
similar on average to other available surveys. For details on the overall protocol for
sampling weights of the FAT data and several robustness checks implemented by the
team, see Zardetto (forthcoming) and Cirera et al. (2020).
References
Cirera, X., C. Comin, M. Cruz, and K. M. Lee. 2020. “Anatomy of Technology in the Firm.” NBER Working Paper 28080, National Bureau of Economic Research, Cambridge, MA.
Särndal, C. E., B. Swensson, and J. Wretman. 1992. Model Assisted Survey Sampling. New York: Springer Verlag.
World Bank. 2022. “Enterprise Surveys: Sampling Methodology.” World Bank, Washington, DC.
Zardetto, D. Forthcoming. “Firm-level Adoption of Technology (FAT) Survey Program: Proposal of a Standardized Weights Calculation Procedure.” World Bank, Washington, DC.

ECO-AUDIT
Environmental Benefits Statement
The World Bank Group is committed to reducing its environmental footprint. In support of this commitment, we leverage electronic publishing options and print-on-demand technology, which is located in regional hubs worldwide. Together, these initiatives enable print runs to be lowered and shipping distances decreased, resulting in reduced paper consumption, chemical use, greenhouse gas emis-sions, and waste.
We follow the recommended standards for paper use set by the Green Press Initiative. The majority of our books are printed on Forest Stewardship Council (FSC)–certified paper, with nearly all containing 50–100 percent recycled con-tent. The recycled fiber in our book paper is either unbleached or bleached using totally chlorine-free (TCF), processed chlorine–free (PCF), or enhanced elemen-tal chlorine–free (EECF) processes.
More information about the Bank’s environmental philosophy can be found at http://www.worldbank.org/corporateresponsibility.

SKU 211826
ISBN 978-1-4648-1826-4
9 0 0 0 0
9 781464 818264
Many of the main problems facing developing countries today and tomorrow—growth, poverty
reduction, inequality, food insecurity, job creation, recovery from the COVID-19 pandemic, and
adjustment to climate change—hinge on adopting better technology, a key driver of economic
development. Access to technology is not enough: firms have to adopt it. Yet it is precisely the
uptake of technology that is lagging in many firms in developing countries.
Bridging the Technological Divide: Technology Adoption by Firms in Developing Countries
helps open the “black box” of technology adoption by firms. The seventh volume in the
World Bank’s Productivity Project series, it will further both research and policy that can be
used to support technology adoption by firms in developing countries.
“Diego Comin is the leading scholar in the economics profession on the past and recent
history of technology adoption in developing countries. This new book by Comin, coauthored
with Xavier Cirera and Marcio Cruz, deploys a remarkable new data set on technology within
firms. It shows the surprising amount of variation in successful technology adoption not
only between countries, but between firms in the same country and even between different
parts of the same firm. This technological divide makes it more urgent than ever to find
policies to promote the catchup of poor to rich countries through technological upgrading.”
William EasterlyProfessor of economics and co-director of the Development Research Institute, New York University
“Why are firms in some countries so much more successful in adopting frontier technologies
than others? This fascinating study of thousands of firms across industries in 11 countries
provides state-of-the-art answers. From handwritten records to drones in agriculture, from
simple markups to personalized pricing in retail, and from manual packaging to robots in
manufacturing, technologies in countries like Brazil, Ghana, and Vietnam are placed under
the microscope. I highly recommend it!”
Charles I. JonesProfessor of economics, Graduate School of Business, Stanford University
Brid
gin
g th
e Te
chn
olo
gica
l Divid
e
Related Documents