----- Prices ----- $Low Cash Dividends Paid $High 9 & 7/8 8 $.07 9 & 3/4 8 & 1/2 $.07 12 & 15/16 9 & 1/4 $.07 13 12 $.07 13 11.88 $.07 13 12.80 $.07 Fiscal Quarter Ended January 28, 2000 April 28, 2000 July 28, 2000 November 3, 2000 February 2, 2001 May 4, 2001 August 3, 2001 13.85 12.23 $.07 Bridgford Foods Corporation and its subsidiaries manufacture and/or distribute refrigerated, frozen and snack food products. The Company markets its products throughout the United States. The Company sells its products through wholesale outlets, restaurants and institutions. The products are sold by the Company’s own sales force, brokers, cooperatives, wholesalers and independent distributors. Products are currently sold through approximately 38,000 retail food stores in forty-eight states within the continental United States, Hawaii and Canada that are serviced by Company-owned service routes. Company products are also sold throughout the country to approximately another 20,000 retail outlets and 23,000 restaurants and institutions. The following summary represents the approximate percentage of net sales by class of product for each of the last five fiscal years: 2001 2000 1999 1998 1997 Products manufactured or processed by the Company 69 68 69 76 82 Products manufactured or processed by others 31 32 31 24 18 Total 100 100 100 100 100 COMMON STOCK AND DIVIDEND DATA The common stock of the Company is traded in the national over-the-counter market and is authorized for quotation on The Nasdaq National Market under the symbol “BRID”. The following table reflects the high and low closing prices and cash dividends paid as quoted by Nasdaq for each of the last eight fiscal quarters. November 2, 2001 14.25 12.45 $.07 ANNUAL SHAREHOLDERS MEETING The 2002 annual shareholders meeting will be held at the Four Points Sheraton, 1500 South Raymond Avenue, Fullerton, California at 10:00 a.m. on Wednesday March 13, 2002.

Welcome message from author
This document is posted to help you gain knowledge. Please leave a comment to let me know what you think about it! Share it to your friends and learn new things together.
Transcript
----- Prices -----
$Low Cash Dividends Paid$High
9 & 7/8 8 $.07
9 & 3/4 8 & 1/2 $.07
12 & 15/16 9 & 1/4 $.07
13 12 $.07
13 11.88 $.07
13 12.80 $.07
Fiscal Quarter Ended
January 28, 2000
April 28, 2000
July 28, 2000
November 3, 2000
February 2, 2001
May 4, 2001
August 3, 2001 13.85 12.23 $.07
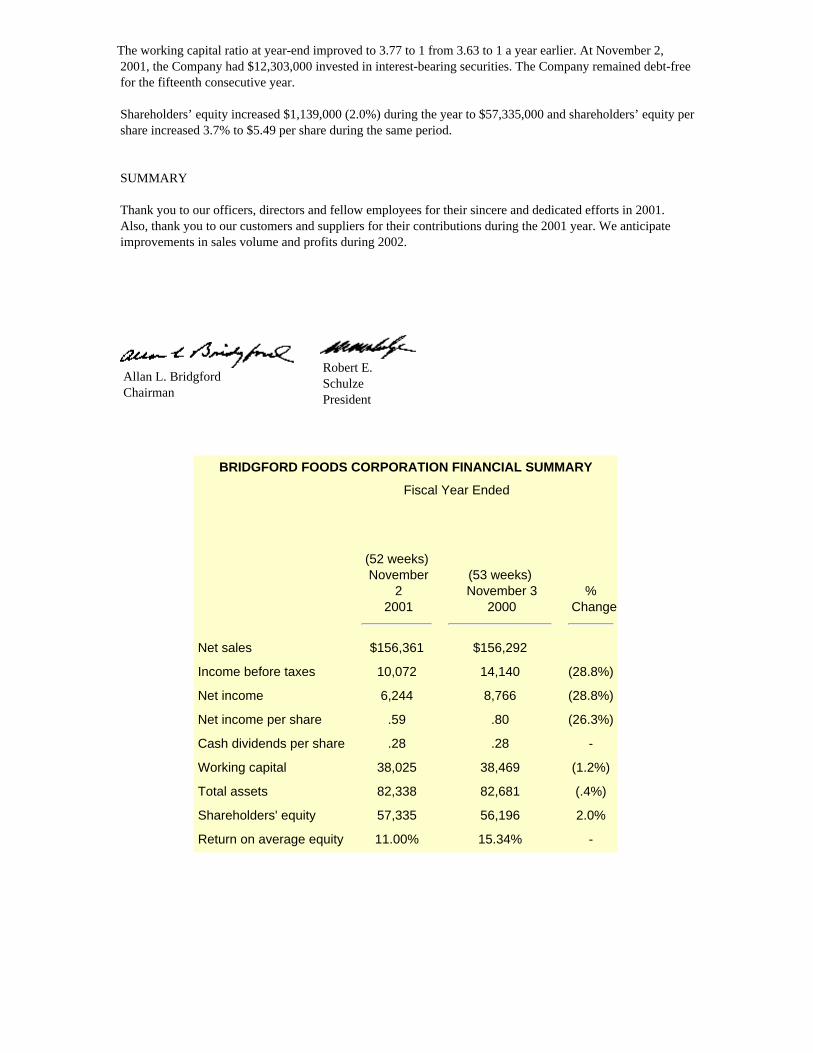
Bridgford Foods Corporation and its subsidiaries manufacture and/or distribute refrigerated, frozen and snack food products. The Company markets its products throughout the United States. The Company sells its products through wholesale outlets, restaurants and institutions. The products are sold by the Company’s own sales force, brokers, cooperatives, wholesalers and independent distributors. Products are currently sold through approximately 38,000 retail food stores in forty-eight states within the continental
United States, Hawaii and Canada that are serviced by Company-owned service routes. Company products are also sold throughout the country to approximately another 20,000 retail outlets and 23,000 restaurants and institutions. The following summary represents the approximate percentage of net sales by class of product for each of the last five fiscal years:
2001 2000 1999 1998 1997
Products manufactured or processed by the Company 69 68 69 76 82
Products manufactured or processed by others 31 32 31 24 18
Total 100 100 100 100 100
COMMON STOCK AND DIVIDEND DATA
The common stock of the Company is traded in the national over-the-counter market and is authorized for quotation on The Nasdaq National Market under the symbol “BRID”. The following table reflects the high and low closing prices and cash dividends paid as quoted by Nasdaq for each of the last eight fiscal quarters.
November 2, 2001 14.25 12.45 $.07
ANNUAL SHAREHOLDERS MEETINGThe 2002 annual shareholders meeting will be held at the Four Points Sheraton, 1500 South
Raymond Avenue, Fullerton, California at 10:00 a.m. on Wednesday March 13, 2002.

TO OUR SHAREHOLDERS:
2001 was a challenging year for Bridgford Foods. Our business was adversely affected by the recession and the tragic events of September 11. Sales reached a record level in 2001, but profits were down substantially compared to the prior year. Meat raw materials, energy and fuel costs were higher than anticipated for most of fiscal 2001, while competition was especially strong in the food service area and the meat snack business.
SALES AND EARNINGS
Sales totaled $156,361,000 in the 52 week 2001 fiscal year, a slight gain over sales in the 53 week 2000 year. This was our sixteenth consecutive year of record high sales.
Beef Jerky sales continued strong while new single – serve portions of Kippered Beef Steaks, Beef & Cheese Sticks, Spicy Beef Sticks, and Red Hot Pickled Sausages were added to our meat snack line. New “Club Pack Biscuits” and “Club Pack Bake & Serve Rolls” were added to our frozen bakery products group in 2001.
Our direct store distribution system continued to expand in the 2001 year. We now operate 256 company owned routes in 49 states. Net income in 2001 was $6,244,000, a 29% decline from income in the 2000 fiscal year. Contributing to our income decline were: lower operating margins in our processed meat business due to higher raw material costs; higher energy and fuel costs during the first three quarters; one less week of operations than in the 53 week 2000 year; and high costs related to development of our new computer system. Also, the year 2000 had a non-recurring gain of $675,000 from the sale of land in San Diego.
OPERATIONS
We recently completed the new freezer expansion project at our Superior Foods plant in Dallas, Texas. This adds 750 pallet spaces to our frozen warehouse capacity. We are installing a new specialty dough product line at our North Carolina bakery. Packaging capacity at our Chicago meat processing facility was increased and improved in 2001. An additional high-speed packaging line will be installed during 2002 to accommodate increased demand for Bridgford dry sausage products. The more than $4,000,000 computer hardware and software project approved last year is now on-line at our Anaheim headquarters.
State of the art financial, cost accounting and route accounting systems should be installed during the first half of 2002. This will provide outstanding management information systems throughout the Company.
FINANCIAL MATTERS
The Company purchased 167,041 shares of its outstanding common stock on the open market during the 2001 fiscal year at an average cost of $12.88 per share. Since the inception of the stock repurchase plan in 1999,the Company has acquired a total of 921,541 shares at an average cost of $10.63 per share. In 2001, the Board of Directors increased the number of shares authorized to be purchased under the plan from 1,000,000 to 1,500,000.
The annual cash dividend rate of $ .28 per share remained the same during the year, but total cash dividends paid during 2001 were $108,000 less than the prior year due to fewer shares of common stock outstanding.
Working capital at November 2, 2001 totaled $38,025,000, a 1.2% decrease for the year. The change in working capital primarily relates to the $4,590,000 invested in additions to property, and equipment during the year.
The working capital ratio at year-end improved to 3.77 to 1 from 3.63 to 1 a year earlier. At November 2, 2001, the Company had $12,303,000 invested in interest-bearing securities. The Company remained debt-free for the fifteenth consecutive year.
Shareholders’ equity increased $1,139,000 (2.0%) during the year to $57,335,000 and shareholders’ equity per share increased 3.7% to $5.49 per share during the same period.
SUMMARY
Thank you to our officers, directors and fellow employees for their sincere and dedicated efforts in 2001. Also, thank you to our customers and suppliers for their contributions during the 2001 year. We anticipate improvements in sales volume and profits during 2002.
Allan L. Bridgford Chairman
Robert E. Schulze President
BRIDGFORD FOODS CORPORATION FINANCIAL SUMMARY
Fiscal Year Ended
(52 weeks) November
2 2001
(53 weeks) November 3
2000%
Change
Net sales $156,361 $156,292
Income before taxes 10,072 14,140 (28.8%)
Net income 6,244 8,766 (28.8%)
Net income per share .59 .80 (26.3%)
Cash dividends per share .28 .28 -
Working capital 38,025 38,469 (1.2%)
Total assets 82,338 82,681 (.4%)
Shareholders' equity 57,335 56,196 2.0%
Return on average equity 11.00% 15.34% -
SELECTED FINANCIAL DATANovember 2
2001*November 3
2000*October 29
1999October 30
1998
Net Sales $156,361,000 $156,291,805 $138,786,260 $134,815,787 Net Income 6,244,000 8,766,469 10,024,505 8,720,430 Basic Earnings Per Share .59 .80 .88 .77 Current Assets ** 51,777,000 53,099,779 57,236,926 50,558,938 Current Liabilities ** 13,752,000 14,630,542 13,476,726 13,307,736 Working Capital ** 38,025,000 38,469,237 43,760,200 37,251,202 Property, Plant and Equip., Net 19,471,000 18,964,335 17,764,652 16,197,108 Deferred Taxes on Income 3,441,000 3,781,172 4,605,530 3,738,976 Total Assets 82,338,000 82,680,999 85,469,476 75,792,941 Shareholders' Equity 57,335,000 56,196,327 58,134,865 50,842,248 Cash Dividends Per Share .28 .28 .24 .22
* 53 weeks** Certain financial statement reclassifications have been recorded in years prior to 1997 toconform to the current year presentation.
MANAGEMENT’S DISCUSSION AND ANALYSIS OF FINANCIAL CONDITION AND RESULTS OF OPERATIONS
Certain statements under “Management’s Discussion and Analysis of Financial Condition and Results of Operations” and elsewhere in this report constitute “forward-looking statements” within the meaning of the Securities Act of 1933 and the Securities Exchange Act of 1934. Such forward looking statements involve known and unknown risks, uncertainties, and other factors which may cause the actual results, performance, or achievements of Bridgford Foods Corporation to be materially different from any future results, performance or achievements expressed or implied by such forward looking statements. Such factors include, among others, the following; general economic and business conditions; the impact of competitive products and pricing; success of operating initiatives; development and operating costs; advertising and promotional efforts; adverse publicity; acceptance of new product offerings; consumer trial and frequency; changes in business strategy or development plans; availability, terms and deployment of capital; availability of qualified personnel; commodity, labor, and employee benefit costs; changes in, or failure to comply with, government regulations; weather conditions; construction schedules; and other factors referenced in this report.
The Company’s operating results are heavily dependent upon the prices paid for raw materials. The marketing of the Company’s value-added products does not lend itself to instantaneous changes in selling prices. Changes in selling prices are relatively infrequent and do not compare with the volatility of commodity markets. The impact of inflation on the Company’s financial position and results of operations has not been significant during the last three years. Management is of the opinion that the Company’s strong financial position and its capital resources are sufficient to provide for its operating needs and capital expenditures.

RESULTS OF OPERATIONS
2001 compared to 2000 Sales in fiscal year 2001 (52 weeks) remained essentially flat when compared to sales of the prior year (53 weeks). Average weekly sales increased approximately 2% in fiscal 2001 compared to the prior 53-week year. The sales increase is primarily a result of increased selling prices and changes in product mix. Cost of products sold remained essentially flat when compared to the prior year. The gross margin was approximately 38% in 2001, 39% in 2000 and 42% in 1999. Commodity costs over the course of the 2001 fiscal year were generally comparable to fiscal year 2000 and higher than the historical lows experienced during 1999. Selling, general and administrative expenses increased $2,867 (6.7%) when compared to the prior 53-week year. Weekly average costs increased 8.7% compared to a weekly average sales increase of only 2%. Higher costs related to advertising and product promotions, fuel and insurance were the primary contributors to these increases. Interest income also declined significantly which adversely impacted these costs. The Company’s capital expansion projects remained at levels consistent with the prior year. The Company expects to continue the growth and modernization of facilities and equipment used in the business. The effective tax rate remained consistent with the prior year at 38%.
2000 compared to 1999
Sales in fiscal year 2000 increased $17,506 (12.6%) when compared to sales of the prior year, primarily as a result of increased unit sales volume. Cost of products sold increased by $14,751 (18.3%) when compared to the prior year. The gross margin was approximately 39% in 2000, 42% in 1999, and 40% in 1998. Costs for pork commodity products increased in 2000 compared to the historical lows experienced during 1999. Flour costs continued to be favorable in 2000, 1999 and 1998. Selling, general and administrative expenses increased $4,303 (11.1%) when compared to the prior year. This increase was generally consistent with the overall increase in sales. The Company’s capital expansion projects remained at levels consistent with the prior year. The Company expects to continue the growth and modernization of facilities and equipment used in the business. The effective tax rate remained consistent with the prior year at 38%.
1999 compared to 1998
Sales in fiscal year 1999 increased $3,970 (2.9%) when compared to sales of the prior year, primarily as a result of increased sales volume. Cost of products sold decreased by $332 when compared to the prior year. The gross margin was approximately 42% in 1999 and 40% in 1998. Costs for pork
commodity products remained at historically low levels and flour costs continued to be favorable in 1999 and 1998.
Selling, general and administrative expenses increased $1,844 (5.0%) when compared to the prior year. This increase was generally consistent with the overall increase in sales. Selling expenses slightly outpaced sales growth due to an increased sales force and higher performance bonuses due to record profitability. The Company’s capital expansion projects increased compared to recent years. The Company expects to continue the growth and modernization of facilities and equipment used in the business. The effective tax rate remained consistent with the prior year at 38%.
LIQUIDITY AND CAPITAL RESOURCES (in thousands)
Favorable operating results over the past several years have continued to provide significant liquidity to the Company. Net cash provided by operating activities was $4,308 in the 2001 fiscal year and $8,348 in 2000. Accounts receivable balances increased $915 in 2001 due to slower collections. Inventories increased $974 in 2001 and $2,042 in 2000 due to higher unit quantities and values. Accounts payable and accrued expenses decreased $1,089 in 2001 due to lower capital project levels and lower accruals due to lower earnings. Accounts payable and accrued expenses increased $1,901 in 2000 due to higher purchasing activity to support strong fourth quarter sales.
The Company’s capital improvement expenditures remained consistent in 2001 compared to the prior year. Significant projects in process at November 2, 2001 included $1.2 million for an updated management information system, which will be fully activated in the first half of fiscal 2002. Cash and cash equivalents decreased $5,327 in 2001 and $6,720 in 2000 (26.9%). The decreases were primarily a result of capital expenditures in the amounts of $4,590 and $5,124; common stock repurchases of $2,151 and $7,643, and higher inventory and refundable income tax balances. The Company also funded its defined benefit pension plan in the amounts of $756 and $3,000 during fiscal years 2001 and 2000, respectively. Cash and cash equivalents increased $2,749 in 1999 (12.3%). The increase was lower than in prior years due to higher tax payments, increased capital expenditures and higher accounts receivable and inventory balances. The Company has remained free of interest-bearing debt for fifteen consecutive years. Working capital decreased $5,291 (12.1%) in 2000. The overall change in working capital in fiscal 2001 was insignificant. The decrease in working capital in 2000 primarily resulted from the common stock

Consolidated Balance Sheets (in thousands)
ASSETSNovember
2 2001
November 3
2000
Current assets:Cash and cash equivalents $12,974 $18,301Accounts receivable, less allowance for doubtful
accounts of $779 and $694 14,282 13,642Inventories 19,165 18,191Prepaid expenses 864 528Refundable income taxes 2,041 Deferred income taxes 2,451 2,438
Total current assets 51,777 53,100
Property, plant and equipment, net of accumulated depreciation of $35,378 and $31,599
19,471 18,964Other non-current assets 7,649 6,836Deferred income tax benefits 3,441 3,781
$82,338 $82,681
LIABILITIES AND SHAREHOLDERS' EQUITYNovember
2 2001
November 3
2000
Current liabilities:Accounts payable $6,958 $7,723Accrued payroll and other expenses 6,464 6,788Income taxes payable 330 120
Total current liabilities 13,752 14,631
Non-current liabilities 11,251 11,854
Contingencies and commitments (Note 6) Shareholders' equity:
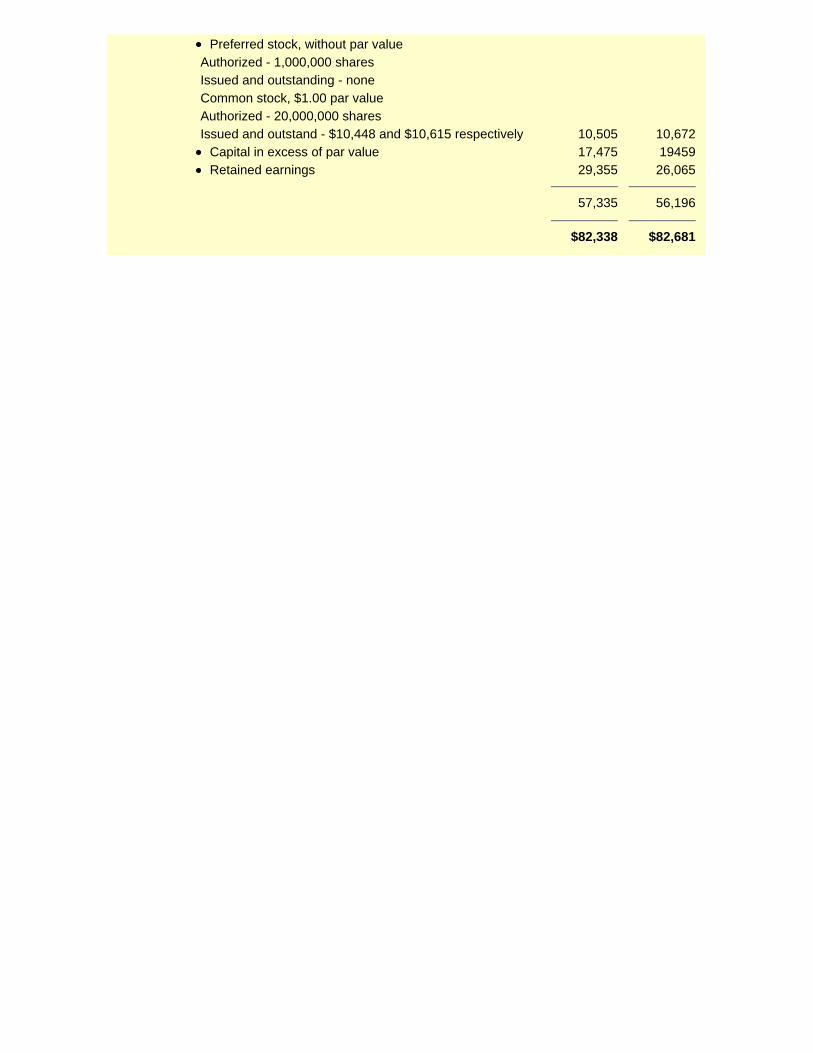
Preferred stock, without par value Authorized - 1,000,000 shares Issued and outstanding - none Common stock, $1.00 par value Authorized - 20,000,000 shares Issued and outstand - $10,448 and $10,615 respectively 10,505 10,672
Capital in excess of par value 17,475 19459Retained earnings 29,355 26,065
57,335 56,196
$82,338 $82,681

Consolidated Statements of Income (in thousands, except per share amounts)
Fiscal year ended
(52 weeks) November
2 2001
(53 weeks) November
3 2000
(52 weeks) October
29 1999
Net sales $156,361 $156,292 $138,786
Cost of products sold, excluding depreciation 96,305 95,296 80,544Selling, general and administrative expenses 45,951 43,084 38,780Depreciation 4,033 3,772 3,292
146,289 142,152 122,616
Income before taxes 10,072 14,140 16,170Provision for taxes on income 3,828 5,374 6,145
Net income $6,244 $8,766 $10,025
Net income per share $0.59 $0.80 $0.88
Shares used to compute basic earnings per share 10,538,091 10,907,701 11,369,812Diluted earnings per share $0.59 $0.80 $0.88
Shares used to compute diluted earnings per share 10,595,091 10,926,630 11,374,714
CONSOLIDATED STATEMENTS OF SHAREHOLDERS' EQUITY (in thousands)
Common stock Capital in excess of
parRetained earnings
Total shareholder's
equityShares Amount
Balance, October 30, 1998 11,370 $11,427 $26,347 $13,068 $50,842- Net income (52 weeks) 10,025 10,025- Cash dividends paid ($.24per share) (2,732) (2,732)
Balance, October 29, 1999 11,370 11,427 26,347 20,361 58,135- Net income (53 weeks) 8,766 8,766- Cash dividends paid ($.28per share) (3,062) (3,062)
- Shares repurchased andretired (755) (755) (6,888) (7,643)

Balance, November 3, 2000 10,615 10,672 19,4597 26,065 56,196- Net income (52 weeks) 6,244 6,244- Cash dividends paid ($.28per share) (2,954) (2,954)
- Shares repurchased andretired (167) (167) (1,984) (2,151)
Balance, November 2, 2001 10,448 $10,505 $17,475 $29,355 $57,335

Consolidated Statements of Cash Flows (in thousands)
Fiscal year ended
(52 weeks) November
2, 2001
(53 weeks) November
3, 2000
(52 weeks) October
29, 1999
Cash flows from operating activities: Net income $6,244 $8,766 $10,025 Income charges not affecting cash: Depreciation 4,033 3,772 3,292 Provision for losses on accounts receivable 275 325 222 Gain on sale of assets (10) (609) (705)
Changes in assets and liabilities: Accounts receivable (915) (277) (1,838) Inventories (974) (2,042) (2,083) Prepaid expenses (336) (259) (35) Deferred income tax benefits 327 495 (1,061) Other non-current assets (813) (973) (566) Accounts payable and accrued expenses (1,089) 1,901 892 Income taxes payable (1,831) (747) (723) Non-current liabilities (603) (2,004) 2,215
Net cash provided by operating activities 4,308 8,348 9,635
Cash used in investing activities: Proceeds from sale of assets 60 761 748 Additions to property, plant and equipment (4,590) (5,124) (4,902)
Net cash used in investing activities (4,530) (4,363) (4,154)
Cash used in financing activities: Shares repurchased (2,151) (7,643) Cash dividends paid (2,954) (3,062) (2,732)
Cash used in financing activities (5,105) (10,705) (2,732)Net (decrease) increase in cash and cash equivalents (5,327) (6,720,) 2,749
Cash and cash equivalents at beginning of year18,301 25,021 22,272
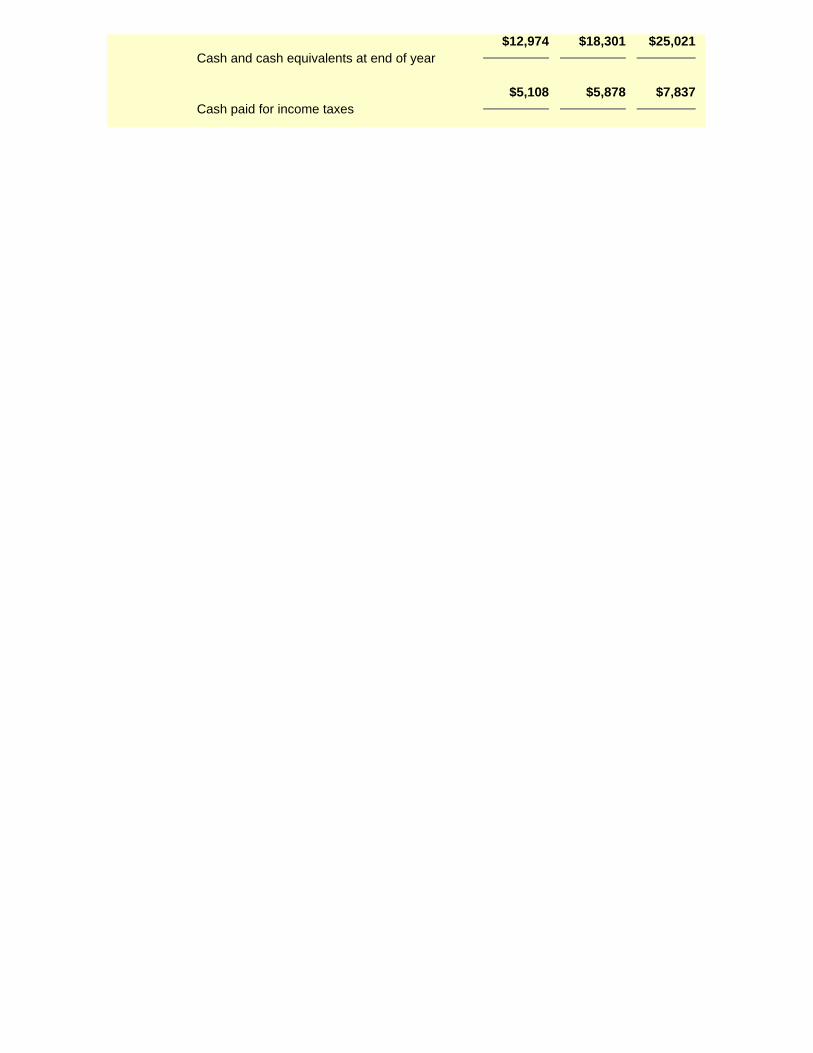
Cash and cash equivalents at end of year$12,974 $18,301 $25,021
Cash paid for income taxes$5,108 $5,878 $7,837

Notes to Consolidated Financial Statements
NOTE 1 - THE COMPANY AND SUMMARY OF SIGNIFICANT ACCOUNTING POLICIES (in thousands): The consolidated financial statements include the accounts of the Company and its subsidiaries, all of which are wholly owned. All intercompany transactions have been eliminated. Concentrations of credit risk The Company’s credit risk is diversified across a broad range of customers and geographic regions. Losses due to credit risk have been immaterial. The carrying amount of cash and cash equivalents, accounts and other receivables, accounts payable and accrued liabilities approximate fair market value due to the short maturity of these instruments. Business segment The Company and its subsidiaries operate in one business segment - the processing and/or distributing of refrigerated, frozen and snack food products. Fiscal year The Company maintains its accounting records on a 52-53 week fiscal basis. Fiscal year 2000 included 53 weeks. Fiscal years 2001 and 1999 include 52 weeks each. Revenues Revenues are recognized upon passage of title to the customer typically upon product shipment or delivery to customers. Cash equivalents The Company considers all investments with original maturities of three months or less to be cash equivalents. Cash equivalents include treasury bills of $12,303 at November 2, 2001 and $18,179 at November 3, 2000. Inventories Inventories are stated at the lower of cost (determined on a first-in, first-out basis) or market. Property, plant and equipment Property, plant and equipment are carried at cost less accumulated depreciation. Major renewals and betterments are charged to the asset accounts while the cost of maintenance and repairs is charged to income as incurred. When assets are sold or otherwise disposed of, the cost and accumulated depreciation are removed from the respective accounts and the resulting gain or loss is credited or charged to income. Depreciation is computed on the straight-line basis over 10 to 20 years for buildings and improvements, 5 to 10 years for machinery and equipment and 3 to 5 years for transportation equipment. Income taxes Deferred taxes are provided for items whose financial and tax bases differ. A valuation allowance is provided against deferred tax assets when it is expected that it is more likely than not, that the related asset will not be fully realized. Stock-based compensation Statement of Financial Accounting Standards (SFAS No. 123), “Accounting for Stock-Based Compensation,” encourages, but does not require, companies to record compensation cost for stock-based employee compensation plans based on the fair market value of options granted. The Company has chosen to account for stock based compensation using the intrinsic value method prescribed in Accounting Principles Board Opinion No. 25, “Accounting for Stock Issued to Employees,” and related interpretations. Accordingly, compensation for stock options is measured as the excess, if any, of the fair market value of the Company’s stock price at the date of grant as determined by the Board of Directors over the amount an employee must pay to acquire the stock. Basic and diluted earnings per share Basic earnings per share is calculated based on the weighted average number of shares outstanding for all periods presented. Diluted earnings per share is calculated based on the weighted average number of shares outstanding plus shares issuable on conversion or exercise of all potentially dilutive securities.

NOTE 2 - COMPOSITION OF CERTAIN FINANCIAL STATEMENT CAPTIONS:
2001 (in thousands) 2000 (in thousands)
Property, plant and equipment:Land $1,614 $1,614Buildings and improvements 12,649 12,649Machinery and equipment 31,718 28,546Transportation equipment 8,868 7,754
54,849 50,563Accumulated depreciation (35,378) (31,599)
$19,471 $18,964Inventories:Meat, ingredients and supplies $3,757 $3,909Work in progress 1,324 2,193Finished goods 14,084 12,089
$19,165 $18,191Accrued payroll and other expenses: Payroll, vacation and payroll taxes $5,790 $6,005Property taxes 328 287Other 346 495
$6,464 $6,787

Notes to Consolidated Financial Statements
NOTE 3 - RETIREMENT AND BENEFITS PLANS:
The Company has noncontributory-trusteed defined benefit retirement plans for sales, administrative, supervisory and certain other employees. The benefits under these plans are primarily based on years of service and compensation levels. The Company’s funding policy is to contribute annually the maximum amount deductible for federal income tax purposes. Net pension cost consisted of the following (in thousands):
2001 2000 1999
Cost of benefits earned during the year $827 $746 $646Interest cost on projected benefit obligation 1,142 1,025 958Actual return on plan assets 1,372 (1,059) (990)Deferral of unrecognized gain (loss) on plan assets (2,609) 40 138Amortization of unrecognized gain (88) (95) (68)Amortization of transition asset (15.2 years) (76) (76) (76)Amortization of unrecognized prior service costs 36 36 36
Net pension cost $604 $617 $644
The 1987 transition asset is being amortized using the straight-line method over the average remaining service period of active plan participants at the date of adoption of the plan. At November 2, 2001, 2.93 years of amortization remained. The discount rate in determining the projected benefit obligation was 7% for fiscal year 2001 and 7.75% for fiscal years 2000 and 1999. The expected long-term rate of return used in determining the projected benefit obligation for fiscal years 2001, 2000 and 1999 was 8%. The assumed rate of future compensation increases for fiscal years 2001, 2000 and 1999 was 4%.
Plan assets are primarily invested in marketable equity securities, corporate and government debt securities and real estate and are administered by an investment management company. The funded status of the plan is as follows:
(in thousands)2001 2000 1999
Plan assets at fair market value$14,464 $15,323 $11,455
Actuarial present value of benefit obligations:Accumulated benefits based on current salary levels, including vested benefits of $15,272, $13,184 and $12,162 16,523 14,166 12,970Additional benefits based on estimated future salary levels
2,321 849 946
Projected benefit obligation18,844 15,015 13,916

Projected benefit obligation in excess of plan assets (4,380) 308 (2,461)Unrecognized prior service costs 162 197 233Unrecognized gain on plan assets 1,972 (2,829) (2,404)
Unrecognized net transition asset(219) (294) (369)
Accrued pension cost $(2,465) $(2,618) $(5,001)
In fiscal year 1991, the Company adopted a non-qualified supplemental retirement plan for certain key employees. Benefits provided under the plan are equal to 60% of the employee’s final average earnings, less amounts provided by the Company’s defined benefit pension plan and amounts available through Social Security. Total annual benefits are limited to $120 for each participant in the plan. Effective January 1, 1991 the Company adopted a deferred compensation savings plan for certain key employees. Under this arrangement, selected employees contribute a portion of their annual compensation to the plan. The Company contributes an amount to each participant’s account by computing an investment return equal to Moody’s Average Seasoned Bond Rate plus 2%. Employees receive vested amounts upon death, termination or retirement. Total benefit expense recorded under these plans for fiscal years 2001, 2000 and 1999 was $393, $351 and $320 respectively. Benefits payable related to these plans and included in other non-current liabilities in the accompanying financial statements were $5,018 and $4,860 at November 2, 2001 and November 3, 2000, respectively. In connection with this arrangement the Company is the beneficiary of life insurance policies on the lives of certain key employees. The aggregate cash surrender value of these policies, included in non-current assets, was $7,649 and $6,836 at November 2, 2001 and November 3, 2000, respectively. The Company provides a deferred compensation plan for certain key executives, which is based upon the Company’s pretax income and return on shareholders’ equity. The payment of these amounts is generally deferred over a five-year period. The total amount payable related to this arrangement was $5,168 and $5,813 at November 2, 2001 and November 3, 2000, respectively. Future payments are approximately $1,730, $1,445, $1,012, $752 and $229 for fiscal years 2002 through 2006, respectively. Postretirement health care benefits in the approximate amount of $330 and $340 are included in non-current liabilities at November 2, 2001 and November 3, 2000, respectively. The Company’s 1999 Stock Incentive Plan (“the Plan”) was approved by the Board of Directors on January 11, 1999 and 275,000 options were granted on April 29, 1999. Under the Plan, the maximum aggregate number of shares which may be optioned and sold is 900,000 shares of common stock, subject to adjustment upon changes in capitalization or merger. Generally, options granted under the plan vest in annual installments over four years following the date of grant (as determined by the Board of Directors) subject to the optionee’s continuous service. Options expire ten years from the date of grant with the exception of an incentive stock option granted to an optionee who owns stock representing more than 10% of the voting power of all classes of stock of the Company, in which case the term of the option is five years. Options generally terminate three months after termination of employment or one year after termination due to permanent disability or death. Options are generally granted at a fair market value determined by the Board of Directors subject to the following: With respect to options granted to an employee or service provider who, at the time of grant owns stock representing more than 10% of the voting power of all classes of stock of the Company; the per share exercise price shall be no less than 110% of the fair market value on the date of grant. With respect to options granted to an employee or service provider other than described in the preceding paragraph, the exercise price shall be no less than 100% for incentive stock options and 85% for non-statutory stock options of the fair market value on the date of grant. As of October 29, 1999, 275,000 options were outstanding at an exercise price of $10.00 per share. No shares were exercisable at October 31, 1999. During fiscal year 2000, 25,000 options with a weighted average exercise price of $10.00 were cancelled. As November 2, 2001, 250,000 options were outstanding at an exercise price of $10.00 per share.
Options Outstanding Options Exercisable
Exercise
Weighted average
remaining life
Weighted average exercise
Weighted average exercise
price
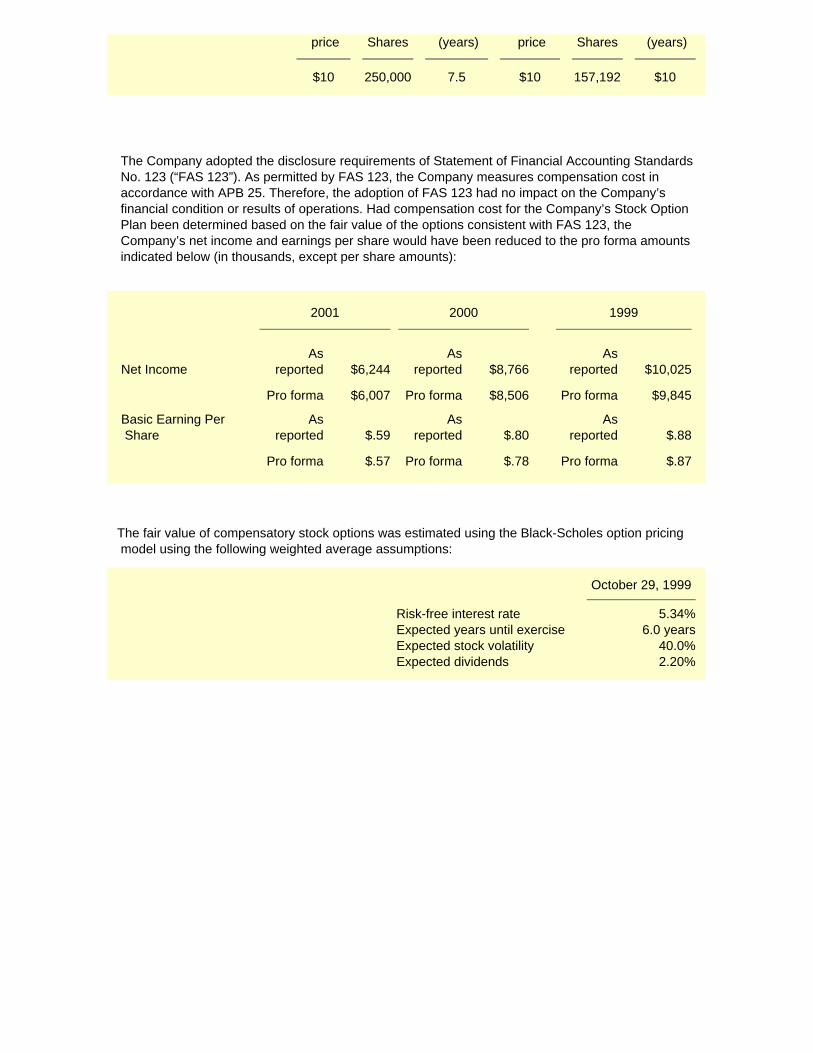
price Shares (years) price Shares (years)
$10 250,000 7.5 $10 157,192 $10
The Company adopted the disclosure requirements of Statement of Financial Accounting Standards No. 123 (“FAS 123”). As permitted by FAS 123, the Company measures compensation cost in accordance with APB 25. Therefore, the adoption of FAS 123 had no impact on the Company’s financial condition or results of operations. Had compensation cost for the Company’s Stock Option Plan been determined based on the fair value of the options consistent with FAS 123, the Company’s net income and earnings per share would have been reduced to the pro forma amounts indicated below (in thousands, except per share amounts):
2001 2000 1999
Net IncomeAs
reported $6,244As
reported $8,766As
reported $10,025
Pro forma $6,007 Pro forma $8,506 Pro forma $9,845
Basic Earning Per Share
As reported $.59
As reported $.80
As reported $.88
Pro forma $.57 Pro forma $.78 Pro forma $.87
The fair value of compensatory stock options was estimated using the Black-Scholes option pricing model using the following weighted average assumptions:
October 29, 1999
Risk-free interest rate 5.34%Expected years until exercise 6.0 yearsExpected stock volatility 40.0%Expected dividends 2.20%

Notes to Consolidated Financial Statements
NOTE 4 - INCOME TAXES:
The provision for taxes on income includes the following (in thousands):
2001 2000 1999
Current: Federal $2,830 $4,060 $6,034 State 671 819 1,172
3,501 4,879 7,206
Deferred: Federal 292 444 (867) State 35 51 (194)
327 495 (1,061)
$3,828 $5,374 $6,145
The total tax provision differs from the amount computed by applying the statutory federal income tax rate to income before income taxes as follows: (in thousands)
2001 2000 1999
Provision for federal income taxes at the applicable statutory rate $3,424 $4,808 $5,498Increase in provision resulting from: State income taxes, net of federal income tax benefit 376 521 596Other, net 28 45 51
$3,828 $5,374 $6,145
Deferred income taxes result from differences in the bases of assets and liabilities for tax and accounting purposes. (in thousands)
2001 2000
Receivables allowance $319 $284

Inventory capitalization 406 387Deferred compensation 614 590Franchise tax 148 148Employee benefits 862 903Other 102 126
Current tax assets, net 2,451 2,438
Deferred compensation 1,408 1,649Pension and health care benefits 3,198 3,192Depreciation (1,165) (1,060)
Non-current tax assets, net 3,441 3,781
No valuation allowance was provided against deferred tax assets in the accompanying statements.

Notes to Consolidated Financial Statements
NOTE 5 - LINE OF CREDIT: Under the terms of a revolving line of credit with Bank of America, the Company may borrow up to $2,000 through April 30, 2003. At any time prior to May 2002, the Company may convert borrowings, if any, into a three-year term loan with principal and interest payable monthly commencing May 31, 2002. The interest rate is at the bank’s reference rate unless the Company elects an optional interest rate. The borrowing agreement contains various covenants, the more significant of which require the Company to maintain certain levels of shareholders’ equity and working capital. The Company was in compliance with all provisions of the agreement during the year. There were no borrowings under this line of credit during the year.
NOTE 6 - CONTINGENCIES AND COMMITMENTS: The preparation of financial statements in conformity with generally accepted accounting principles requires management to make certain estimates and assumptions that affect the reported amounts of assets and liabilities and disclosure of contingent assets and liabilities at the date of the financial statements and the reported revenues and expenses during the respective reporting periods. Actual results could differ from those estimates. The Company leases certain transportation equipment under an operating lease expiring in 2006. The terms of the lease provide for annual renewal options and contingent rental payments based upon mileage and adjustments of rental payments based on the Consumer Price Index. Minimum rental payments were $340 in fiscal year 2001 and were $320 in fiscal years 2000 and 1999. Contingent payments were $110 in fiscal years 2001 and 2000 and $102 in fiscal year 1999. Future minimum lease payments are approximately $340 in the years 2002 through 2004 and $270 in 2005 and $20 in 2006.

Report of Independent Accountants
PricewaterhouseCoopers LLP
To the Board of Directors and Shareholders of Bridgford Foods Corporation
In our opinion, the accompanying consolidated balance sheets and the related consolidated statements of income, shareholders’ equity and cash flows present fairly, in all material respects, the financial position of Bridgford Foods Corporation and its subsidiaries at November 2, 2001 and November 3, 2000, and the results of their operations and their cash flows for each of the three years in the period ended November 2, 2001, in conformity with accounting principles generally accepted in the United States. These financial statements are the responsibility of the Company’s management; our responsibility is to express an opinion on these financial statements based on our audits. We conducted our audits of these statements in accordance with auditing standards generally accepted in the United States, which require that we plan and perform the audit to obtain reasonable assurance about whether the financial statements are free of material misstatement. An audit includes examining, on a test basis, evidence supporting the amounts and disclosures in the financial statements, assessing the accounting principles used and significant estimates made by management, and evaluating the overall financial statement presentation. We believe that our audits provide a reasonable basis for the opinion expressed above.
Orange County. California December 21, 2001
Related Documents