B R I D G E D E C K C 0 N D I T I 0 N SURVEY PART 1 - OUTLINE OF THE PROJECT AND 'FINDINGS FROM THE SURVEY by J. G. Darroch Research Statistician and Howard L. Furr, P.E. Research Engineer Research Report· 106-lF Part 1 Study 2-lf 106 Statistical Evaluatj f Bridge Deck Condition Survey Data Sponsored by The Texas Highway Department in cooperation with the Department of Transportation, Federal Highway Administration May 1970 TEXAS TRANSPORTATION INSTITUTE Texas A&M University College Station, Texas

Welcome message from author
This document is posted to help you gain knowledge. Please leave a comment to let me know what you think about it! Share it to your friends and learn new things together.
Transcript

B R I D G E D E C K C 0 N D I T I 0 N SURVEY
PART 1 - OUTLINE OF THE PROJECT AND 'FINDINGS FROM THE SURVEY
by
J. G. Darroch Research Statistician
and
Howard L. Furr, P.E. Research Engineer
Research Report· 106-lF Part 1
Study 2-lf 106 Statistical Evaluatj f Bridge Deck
Condition Survey Data
Sponsored by
The Texas Highway Department in cooperation with the
Department of Transportation, Federal Highway Administration
May 1970
TEXAS TRANSPORTATION INSTITUTE Texas A&M University
College Station, Texas

ACKNOWLEDGEMENT
Many individuals contributed to the collection and evaluation of
the information used in this report. These contributions are gratefully
acknowledged. Special acknowledgement is made to Mr. Dale Shafer, Texas
Transportation Institut~ and to Mr. Charles Shupp, Automation Division,
Texas Highway Department, for their contribution in computer programming
and processing.
ii

PREFACE
This report consists of three parts.
Part 1 .... A summary report giving s·urvey methodology, description
of data, principal findings, conclusions and recommendations. Apart
from some graphical sunnnaries no supporting data are given in this
part.
Part 2 - Relative frequency tables displaying associations between
structural characters and deck conditions. This contains the supporting
data in the form of tables for all structural character/deck condition
combinations that the authors judged to be of significance - see Part 1,
Table 3 for a graphic summary of these combinations.
Part 3 - Computer tabulations. A limited edition of four complete
sets of the computer tabulations are ilable for examination - see
Part 2 for their locations. Each se nsists of three volumes. Volume
1 contains the 585 pairs of tables result] from cross-tabulating the
45 structural characters against each of t 13 deck conditions. Each
pair of tables consists of·a pour frequency table ·and a relative fre
quency table, where the relative frequencies are computed on a row
basis; i.e.; the distribution of pour conditions within a given struc
tural category. Volume 2 contains 809 of the possible 990 cross-tabula
tion combinations of the 45 structural characters. Volume 3 contains the
78 cross-tabulation combinations of the 13 deck condition characters.
iii

ABSTRACT
The bridge dfack survey herein reported was based on a stratified
random sample of bridges. The primary strata were in 25 Texas Highway
Department districts; while, within each district, stratification was
based on age and/or type of structure. Bridges within the secondary
strata were randomly selected at a rate of 20 percent. This ensured an
adequate representation of all types of bridges currently in. use on highways
throughout Texas.
Structure evaluations were made in each THD district by a team from
that district. Training and monitoring for consistency were handled by
THD D~l8 personnel.
The documentation on each bridge included type o.f construction, age,
traffic, location~ and other structure-related information. The on-site
examination of the bridge deck was done on the·b of individual concrete
pours. These were scored with respect to scalin~~ !lamination, cracking,
and general deck condition. The results of examining ~ 5, 300 bridges,
whose decks were made up of about 36,000 pours, were t~
summarization.
available for
A complete tabulation of the 45 structural characters versus the
13 deck condition items was made. These association tables were examined
and the subset of some 300+, judged by the authors to be of significance,
are presented in the form of relative frequency tables. Cross tabulations
among structural characters and among condition characters were also made
and, while not reported directly, we~e considered in some of the writte·n
iv

discussion. The computer tabulations can be made available for further
study.
This study represents a joint effort by THD and Tex:as Transportation
Insti"tute personnel. THD personnel conducted the time-consuming field
survey, and the transfer of data from survey sheets via cards to magnetic
tape. TTl personnel assisted in selecting the sample and supervised the
data summarization, evaluated the results, and prepared the final report.
* * * * The opinions, findings, and conclusions eltpressed in this report
are those of the authors and not necessarily those of the Federal Highway
Administration.
v

SUMMARY
This report sunnnarizes the findings of a statewide survey of high
way bridge decks in Texas. Each structure selected ·in the stratified
random sam.ple. was scored by a survey team. This team wa8 comprised of'
district personnel selected to provide representation from the various
technologies involved. Each team was responsible only for surveying
those structures falling within its home district. The teams were
trained, and their reports monitored for consistency, by THD D-18
personnel. Altogether in the state these teams examined and recorded
information on approximately 36,000 deck pours on some 5,300 bridges.
Tne information was classified as to structural variables and
condition variables. There were forty-five structural characteristics,
such as bridge type, age, design specification, traffic density, etc.,
and 13 deck condition variables, such as degrc- -·-.d extent of scaling,
cracking, delamination, and general deck condj The structural
characteristics were paired with condition variables · tables showing
both frequency of pours and percentage of pours unde ach condition.
All tables were appraised as to whether· or not there were evidences of
statistical association between the structural characteristics and the
condition variables. A relative frequency table was then prepared for
each combination which gave evidence of real association.
The study has been able to point to only general trends displayed
in the data. · It revealed that there are interrelationships between
vi
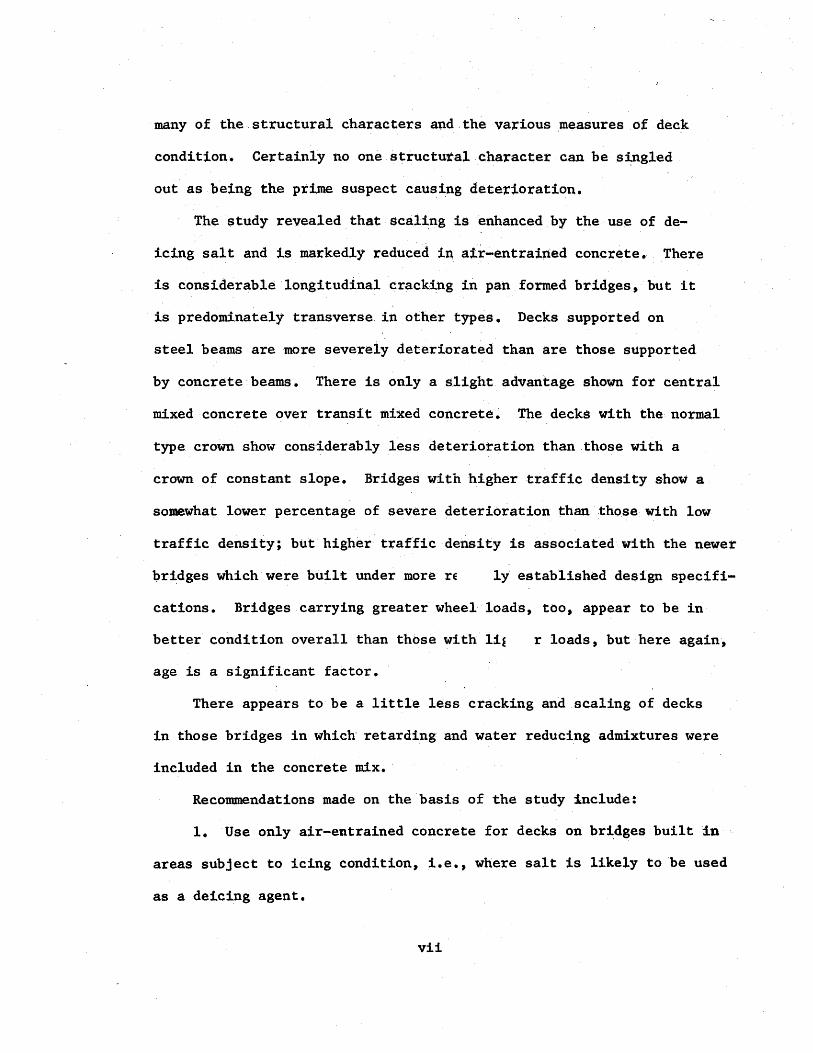
many of the structural characters and.the various measures of deck
condition. Certainly no one.structutal.charactet: can be s~ngled
out as being the prime suspect causing deterioration.
The study revealed that scal~ng is enhanced by the use of de-
icing salt and is mal'kedly ;reduced in air-entrained concrete. There
is considerable longitudinal cracking in pan formed bridges, but it
is predominately transverse_ in other types. Decks supported on
steel beams are more seve-rely deteriorated than are those supported
by concrete beams. There is only a Slight advantage shown for central
mixed concrete over transit mixed concrete. The decks with the normal
type crown show considerably less deterioration than those with a
crown of constant slope. Bridges with higher traffic density show a
somewhat lower percentage of severe deterioration than thosewith low
traffic density; but higher traffic density is associatedwith the newer
bridges which were built under more rE ly' established design specifi
cations. Bridges carrying greater wheel loads, too, appear to be in
better condition overall than those with li~
age is a significant factor.
r loads, but here again,
There appears tobe a little less cracking and scaling of decks
in those bridges in which< retarding and water reducing admixtures were
included in the concrete mix. ·
Recommendations made on the basis of the study include:
1. Use only air-entrained concrete for decks on bridges built ·in
areas subject to icing condition, i.e., where salt is likely to be used
as a deicing agent.
vii

2. A controlled study should be made to determine if retarders
and water reduci.ng admixtures provi.de bettericoncrete for bridge
decks.
3. Determine why slabs supported on steel beams have not been
as durable as those supported on concrete beams.
4·. There is some i.ndication that slabs using Type III cement are
more durable than those using Type I cement. Other variables, pri
marily age, doubtless play a part, but it should be determined if
there is a difference in deck performance due to type of cement.
5. Develop and maintain a formal program of inspection and record
keeping on every structure; this would lead to a better understanding
of the deterioration process. This would also be of considerable
value in establishing the cost of service of a·structure and lttould
also serve as a basis for the modification of design, construction,
and maintenance criteria.
viii

IMPLEMENTATION
The interrelation of events of nature, design details, construc
tion practices, service conditions, and maintenance practices on the
performance of bridge decks can be se~n in the data in Parts 2 and 3
of this report.
It i:s impossib'le to single out any one factor as the prime cause of
a particular deterioration condition. Nevertheless, it is possible to
make certain recommendations which should lead to improved performance.
The recommendations made here are based on information gathered
in the survey, common knowledge of the technology necessary to produce
high quality durable concrete, and judgment as to the long range value
of condition surveys such as was made in collecting the data treated in
this report.
It is recommended that the folloo_ ___ "" steps be taken to strengthen-
current practices for producing high perfon e bridge de.cks, to add
to knowledge desirable for improvement of p1 ices, and to provide a
base from which service costs and service life of structures might be
firmly established.
1. Use only air-entrained concrete for decks on bridges built in
areas subject to icing conditions, i.e., where chlorides are likely to be
used for deicing.
2. The data indicate that crack spacing is reduced and scaling is
less severe in concrete in which retarders and water reducers have been
incorporated. Field observations should Qe made to determine the extent
ix

of benefits resulting from the use of these agents.
3. Determine why slabs supported on steel beams have not been as
durable as those supported on concrete beams.
4. There is some indication that slabs using Type III cement are
more durable than those usirtg Type I cement. Other variables, primarily
age, doubtless play a part, but it should be determined if there is a
difference in deck performance due to type of cement.
5. Develop and maintain a formal program of inspection and record
keeping on e-very structure which woulrl lead to a better understanding
of the deterioration process. Such a program would also be of considerable
value in establishing the cost of service of a stTUcture, and could
serve as a basis for the modification of design, construction, and
maintenance criteria.
6. The data analyses carried out to date, and herein reported,
have not fully probed the possibilities inheren· the large mass of
data collected. Further examination of the data would seem to be
warranted, since only individual structural characterl Lve been examined
i~ 4etail against the cond~tion variables. Cross-classifications among
two or more structural characters, as these affect the condition re~ponse
variables, could shed light on such aspects as the influence of age of
structure upon other structural characters and their resultant performance.
Age of structure is one such character but there are several others
which may merit similar examination.
X

PART 1- OUTLlNE·OF THE PROJECT
AND FINDINGS FROM THE SURVEY
1-1

TABLE OF CONTENTS
Acknowledgement •
!'ref ace
Abstract
Summary •
Implementation
I. Introduction.
A. General Information • .. B. The Design of the Sample
c. Collection, Editing, and Tape Preparation of Field Data
D. Data Analysis
II. Conclusions
III. Results of the Study.
A. Basis of the Evaluation •
B. General Deck Condition
c. Cracking
D. Scaling •
E. De1amina tion
IV. Appendix
1-2
Page ii
iii
iv
vi
ix
1-3
1-3
1-4
1-6
1-7
1-14
1--17
1-17
1-17
1-24
1-27
1-30
~-40
BRIDGE DECK CONDITION SURVEY .._ PART 1
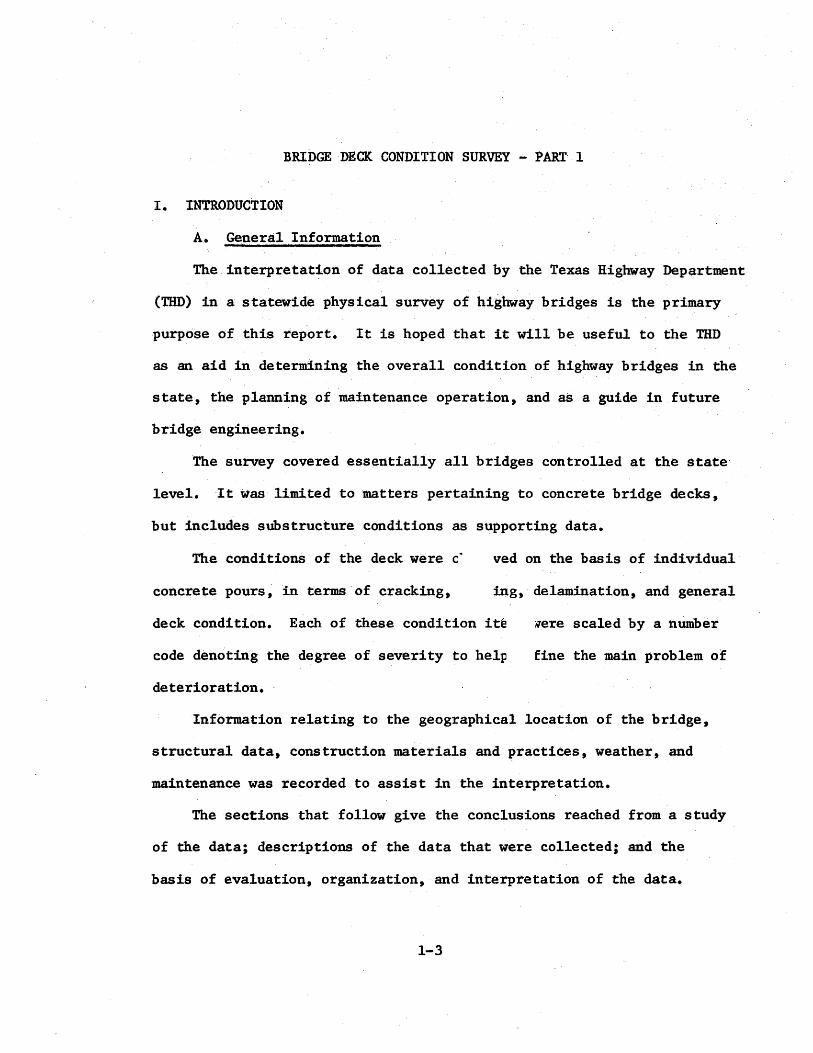
I. INTRODUCTION
A. General Information
The. interpretation of data collected by the Texas Highway Department
(THD) in a statew-ide physical survey of highway bridges is the primary
purpose of this report. It is hoped that it will be useful to the THD
as an aid in determining the overall condition of highway bridges in the
state, the planning of maintenance operation, and as a guide in future
bridge engineering.
The survey covered essentially all bridges controlled at the state
level. It ~as limited to matters pertaining to concrete bridge decks,
but includes substructure conditions as supporting data.
The conditions of the deck were c4 ved on the basis of individual
concrete pours, in terms of cracking, ing, delamination, and general
deck condition. Each of these condition ite qere scaled by a nUmber
code denoting the degree of severity to help fine the main problem of
deterioration. ·
Information relating to the geographical location of the bridge,
structural data, construction materials and practices, weather, and
maintenance was recorded to assist in the interpretation.
The sections that follow give the conclusions reached from a study
of the data; descriptions of the data that were collected; and the
basis of evaluation, organization, and interpretation of the data.
1-3

B. The Design of the Sample
The chief consideration in selecting any sample is that it be rep
resentative of the population from which it is drawn. The sampling
plan selected and used in this survey is co:mmonly known as a stratified
random sample. By stratifying and drawing random samples from within
the strata it is possible to insure a closer approach to a representa
tive sample than could be obtained by simply selecting a random sample
from the designated population.
The basis of stratification recogniz~d the possible influence of
geographical location, age of bridge, and general type of strueture.
The primary strata were the 25 THD Districts, thus blanketing all of the
geographical variation in the state. Eight substrata were defined with
in a district as follows:
1. Structures completed before 1946 - Type I.
2. Structures completed before 1946 - Type
3. Structures completed 1946 - 1955 - Type l..
4. Structures completed 1946 - 1955 - Type II.
5. Structures completed after 1955 - Type I.
6. Structures completed after 1955 -Type II.
7. All ages - Type III and IV.
B. Timber structures.
The age component was partitioned somewhat arbitrarily but with the
following general considerations in mind:
Before 1946 - included all structures of pre World War II construction
still being used in the highway system;
1-4

1946-1955 - during this period the use of continuous steel construction
increased rapidly;
After 1955- the increased construction activity due to adoption,of the
Interstate Highway Program and the bulk of all prestressed con
crete construction occurred during this period.
The structure types group the structures as follows:
Type I - Concrete deck supported by steel stringers
Type II - Concrete bridges and certain timber structures
Type III - Truss bridges
Type IV - Miscellaneous bridge types
Type V -·culverts and other types.
·All of the eight substrata listed above were sampled, but number 8 -
Timber Structures, was not included in the survey summaries. Since the
primary target of the survey ~as bridge condition, the structures grouped
tmder Type V were not included in the le. For the purposes of this
survey, any structure with a span tweu~~ vr more feet long was classed as
a bridge.
The actual selection of the sample of e, ___ ctures to be examined was
carried out in the following manner. From structure information already
on magnetic tape within THD a.new tape was prepared which listed the
structures by dis·tricts and by substrata within districts. Sample struc
tures were selected within each substratum utilizing·a psuedo random
number generator. Initially a ten percent sampling rate was used, but
this was later increased to twenty percent. As the individual structures
were selected from the substratawithin a district, loeational and other

pertinent information was recovered from the master tape and a printed
listing prepared for transmission to the individual districts, thus
giving them a prepared listing of structures to be evaluated.
The Districts also evaluated and submitted completed data forms
for additional structures "'hich were conside:ted to be in a deteriorated
condition. This evaluation was to be processed separately from the ten
percent random sample to support deterioration findings or to determine
actual deterioration quantities.
The total number of bridges in the defined population was 12,160.
All types of culverts, as "'ell as bridges not having concrete decks, were
excluded from the study. A ten percent sample consisted of 1,218 bridges
and ultimately a twenty percent sample (2, 436 bridges) was drawn. Eventually,
the twenty percent sample was augmented by many other bridges which in-
dividual Districts reported. For example, one of the Districts had,
evaluated seventy percent of the structures under control. Thus, tQe
report is based on an evaluation of 5,282 bridges, Ulure than forty per-
cent of the total in the state.
c. Collection, Editing, and Tape Preparation of F ___ J Data
The major responsibility for the activi,ties of collection and editing
of the field data rested with the THD Maintenance Division (D-18). Their
staff, together with personnel from the Bridge Division, participated in
the training sessions with .the individual District teams • A manual (1)
1Procedure for In~erpreting General Deck Condition in Recording Data on Bridge Deck Survey Form No. 1102, Texas Highway Department, Maintenance Operations Division, Austin, Texas. August 1965.
1-6

on procedure for determining deck· condition was used by each field survey
team to achieve optimum tmiformity in interpreting bridge conditions.
The completed survey records were sent to D-18 where they were carefully
scrutinized for consistency of the evaluattons, completeness, etc. If
therewere questions or obvious errors, missing information, etc., the
forms were returned to the District: for clarification and, if necessary,
re-evaluation of the structure(s) in question. This was a massive
editing job which had to be worked in along with the regular work load•
Once the ~urvey forms were accepted as satisfactory they were passed
along to· the Division of Automation. There the data were ptmched on
cards, verified and then placed·on magnetic tape for further processing.
The survey form appears in the appendix.
D. Data Analysis
This project was set up to take the survey data tapes as the
starting point and, from this mass of
information as might exist.
~tion, extract such meaningful
The basic analysis was one of preparing 1 interpreting tabulations
involving the 45 structure associated variab___ and the 13 deck condition
variables, see Table 1. Additional studies had b'een proposed in the
project outline as approved, but were not accomplished because of time
limitations.
Rather than looking only at a subset of data tables believed to be of
importance, it was decided to prepare all possible summary tables and then
report on those showing meaningful associations. Table 2 shows all of
the possible 13 x 45 = 585 tables that were constructed by cross-tabulating
1-7

NUMBER 1
2
3
4
5
6
7
8
9
10
11
12
13
14
15
16
17
18
19
20
21
22
23
24
25
26
27
28
29
30
TABLE 1
BRIDGE DECK CLASSIFICATION CODES
FACTORS ASSOCIATED WITH THE STRUCTURE
NAME District number (of the THD)
Design specification (by year only)
Design loading (by AASHO loading)
Span type
Structure type
Main member type
Stringer spacing
Skew (degrees)
Crown type
Type of deck (kind of concrete)
Simple or continuous structure
Span length of simple span
Span length of beginning span of a continuous 'tmit
Span length of second span of ~ ,_ontinuous unit
Total length of continuous ut
Number of spans in continuous un~t
Unsymmetrical unit (yes or no)
Substructure type
Slab thickness
Traffic volume (vehicles per day)
Structure classification
Heaviest wheel load (kips)
Transit mix (yes or no)
Percentage of entrained air
Type admix
Type cement
Source of cement
Cement, sacks per cubic yard of· concrete
Type of aggregate
Type of finish
1-8

31
32
33
34
35
36
37
38
39
40
41
42
43
44
45
NUMBER
50
51
52
53
54
55
56
57
58
59
60
61
62
Table 1 (Cont'd)
Month slab placed
Year slab placed
Month bridge opened to traffic
Year bridge opened to traffic
Type of overlay
Month overlay applied
Year overlay applied
Condition of overlay
First year salt applied
Salt applications per year (number)
Sulfate stream (yes or no - does bridge cross sulfate stream?)
Condition of substructure
Slab drainage (good, fair, poor)
Weather at pouring
Moment Condition
CONDITIONS ASSOCIATED WIT' >!VIDUAL POURS
Cracking, degree
Cracking, type
Cracking, average spacing
C_racking, location (on the deck)
Scaling, degree
Scaling, depth
Scaling, percent area
Scaling, location (on the deck)
Delamination, degree
Delamination, visual cracking (yes or no)
Delamination, percent area
Delamination, location (on the deck)
General Deck Condition
1-9

each one of the. 45 ·structural ite1DS against each of the 13 condition
items.
A rather general table-producing computer program was prepared
and the following sets of tables produced, using the edited data tapes:
1. Structure (45) by condition (13) - 585 tables;
2. All possible different combinations among the 13 conditions - 78
tables;
3. Almost all possible different combinations among the 45 structure
associated characters - 809 out of a possible 990 tables•
4. Structures (45) by joint condition (4) - 180 tables.
Thus, 1,652 pairs of tables were produced.
The pair of tables consisted of a frequency table, either on the
basis of concrete pours (36,058) or of structures (5,282), depending upon
the table. group; and of a relative frequency table using row totals as
the basis. These latter tables were especially u l in assessing the
information compiled for structures versus condit1ons, in which the
rows were the categories within a structural character.
The distribution of frequencies in the cells of th~~~ tables was
such that the use of the chi-square test for independence was n.ot sen
sitive to changes because there were too many cells with either very low
or zero frequencies. For this reason, when it came to screening the tables
for evidences of association be~een variables, a visual assessment was
resorted to. Each author screened the 'table set independently then, for
those tables where the decision was not unanimous, they reviewed the
particular tables in conference and rendered a decision.
1-10

TABLE 2, A LISTING ot• IH:SIGN AND t:ONIHTION I'ARAMF.TF.RS
INDICATING TIIF.IR ASSOCIATIONS
Note I X 1nd.icates that the association between the parameters ie s1Anif1cant.
1. THD District
2, Deeign Specification
3, DeSign Loading
4, Span Type
5, Structure Type
6, Main Member Type
7. Stringer Spacing
a·, Skew Degrees
9, Type of Crown
10, Type of Deck
11. Continuous or Simple
12. Simple Span Length
13, Cont. Unit let Span Lgth.
14, Cont, Unit 2nd Span L&th.
15. Cont. Unit Total Lath.
16. Cont. Unit Nmbr of Spans
17.
18.
19,
20.
Cont. Unaya.. Unit
Structure Type
Slab Thickneas
Traffic Volulllt!/llay
21. Structure ClassiUcatlon
22, Heavieat Wheel t.oad
23. Transit Mix
24, Pctg, of Air Entrained
25, Type of Ad111ix
26, Type of Cement
27. Source of Cement
28. ·sacka of Cement/C,Y,
29, Type of Aggregate
30. Type of Finish
U. Month Slab Placed
32, Year Slab Placed
33, Month lridge Opened
34, Year llridae Opened
35, Type oC Overlay
36, Month OverlAy Appllt-d
31. Year Overlay Applied
38, Condition of Ovl!rlay
39. tllr.t Year Salt Applh•d
40, Salt Appltut lunw/Yl•or
41.
42,
4'J.
44.
45.
Sulf nt" St rL'Illll
Cundltlup of Sulu.Uruct.ur••
Slub llrainall•'
WcathPr at l'ourinK
HonK.•nt t:ondit tun
X X X X X
X X X X X X
X X X X X X X X X X X X X X X X X X X
X X X X X X X X X X X
X X X X X X X X X X X X x·
X X X X X
X
X X X X X X X X X X
X X X X X
X X
X
X
X X x·
X
X X X X
X
X
X X X X X X
11 11
X
X
X
X X X X
X X
X X
X
X X X X X
j X X X X
X X X X
X X X X X X
X X
X X
X X X X
X X X
X X
X
X X X
X
X
X
X
X
X X X X X X X X
X X X X X X X X X X X X X X X X X X X X X X
X X X X X X X X X X X X
X X X X X X X
X X X X X
X X X X X X X X X X X X X
X
X X X
X
X X
X X X
X
X X
X
X X X
X X
X
1-11
X X X X X X
X X X X X X X
X X
X X X
X X X X X X X
X X X X
X X X X
X X
X
X
X
X
XXX XXX X X X X X
X X
X
X
X
X
X
X
X
X X
X
X X
X

This summary report (Part 1) covers only Item 1 in the listing of
table groups presented earlier in this section. The subsets of these
tables, evaluated by the authors as showing meaningful associations,
are reported individually in Part 2. Part 3 (three volumes of computer
output) contains all of the 1652 sets of tables which were prepared
but no further summary reports are planned for issue under this project.
All tables included in this report are based on use of all·of the
available data. This course of action was decided upon after preparing
the various sets of tables using only the bridges selected in the
original ten percent sample, and comparing these against the comparable
tables compiled from the data for all structures observed. The agree
ment between the two sets of tables was sufficiently striking to justify
utilizing all available data.
Table 3 summarizes the information presented in Table 2. The 13
condition variables are ranked in decreasing ord f the frequency of
significant associations. This serves to point uu.L the relative sensi-
tivity of the various eondition variables - ranging fr legree of crack-
ing, degree of scaling, and general deck condition bei .... 0 aaost sensitive,
to scaling, cracking and delamination location being least sensitive.
There are a number of degrees of intensity of each condition item
and there are very f~w cases where significant association is so clear
that no question can arise in its interpretation. It is for that reason
that the interpretations given in this report are judgement oriented,
at least to some degree.
1-12

TABLE 3
Condition variables rartkedwith respect to decreasing frequency
of significant associations with the 45 structural characters.
CONDITION PROPORTION RANK VARIABLE D$SCki.PTION SIGNIFICANT*
1 50 Cracking, degree 37/45
1 54 Scaling, degree 37/45
2 62 General deck condition 34/45
3 55 Scaling, depth., 33/45
4 56 Scaling, percent area 30/45
5 52 Cracking, average spacing 28/45
6 60 Delamination, perc~tlt area 25/45
7 58 Delamina- · degree 21/45
8 51 Cracking e 20/45
9 59 Delamination v ~Jle cracking 20/45
10 57 Scaling locati 18/45
11 53 Cracking location 17/45
12 61 Delamination loca'tion. 14/45
*(Number of significant tables)/(Total number of structural characters)
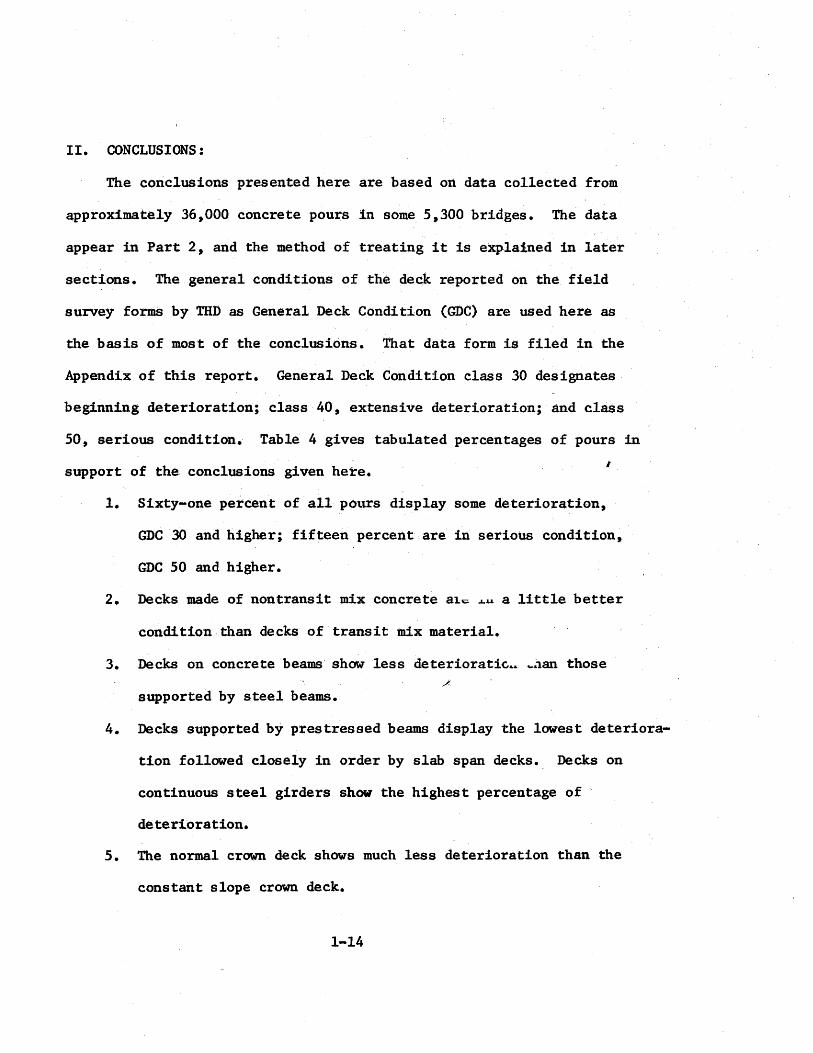
II. CONCLUSIONS:
The conclusions presented here are based on data collected from
approximately 36,000 concrete pours in some 5,300 bridges. The data
appear in Part 2, and the method of treating it is explained in later
sections. The general conditions of the deck reported on the field
survey forms by THD as General Deck Condition (GDC) are used here as
the basis of most of the conclusions. That data form is filed in the
Appendix of this report. General Deck Condition class 30 designates
beginning deterioration; class 40, extensive deterioration; and class
50, serious condition. Table 4 gives tabulated percentages of pours in
support of the conclusions given here. i
1. Sixty-one percent of all p01.1rs display some deterioration,
GDC 30 and higher; fifteen percent are in serious condition,
GDC 50 and higher.
2. Decks made of nontransit mix concrete a1.c ..~.u. a little better
condition than decks of transit mix material.
3. Decks on concrete beams show less deterioratic ........ i1an those
supported by steel beams.
4. Decks supported by prestressed beams display the lowest deteriora
tion followed closely in order by slab span decks. Decks on
continuous steel girders show the highest percentage of
deterioration.
5. The normal crown deck shows much less deterioration than the
constant slope crown deck.
1-14

TABLE 41
PERCENTAGE OF CONCRETE POURS OF THE VARIOUS CLASSIFICATIONS OF GEN!RAL DECK CONDITION
m
General Deck Condition (62) ~ ~ $-1
m <U en <U <U :::1
~~ ~~ bOO as~
r-l"r"f !"""{"r"f +J!"""{ u:x: c..> :X: s:: ctl
Uc<S Uc<S <U4-J C) 0
Structural Character ~ €So .... E-4
10 20 30 31 32 33 40 44 so c.!>O <U M "' Jl-4~
0
Total Percentage of 12 27 15 2 9 13 3 4 11 61 15 100 All Pours.
Transit Mix (23) Yes 12 26 14 2 11 15 3 4 8 62 15 61 No 13 30 18 3 8 13 · .. 3 5 s 57 7 39
Beam Type: (06) Steel !-Beam 6 20 16 3 9 14 3 6 15 74 23 37 Plate Girder 4 20 13 1 11 21 4 12 6 76 14 4 Reinforced Concrete 14 32 15 2 9 12 2 2 11 54 12 47 Prestressed Concrete 33 29 12 3 9 7 4 2 1 38 1 9.
Span Type: (04) Continuous Steel 6 19 14 3 9 17 4 7 13 75 21 29 Simple Steel 6 24 21 ~ 7 10 4 6 14 70 20 14 ~
Pan-formed Rein£. Cone 10 28 11 J 4 17 1 3· 14 62 15 19 Rein£. Cone. Beam 16 32 15 I 7 11 2 2 11 52 13 10
& Slab ... Rein£. Cone. Slab 18 37 18 3 5 8 2 1 6 45 8 16 Prestressed Beam 29 30 13 3 9 7 4 2 2 41 3 9
Crown Type (09) Normal 13 30 16 2 7 10 2 3 13 57 17 71 Constant Slope 6 19 4 2 12 21 4 6 7 75 26 25.
Traffic: (20) 0 to 2k/clay 15 32 15 2 6 8 2 2 18 53 18 43 2k to 5k 10 30 16 3 8 13 4 4 9 60 12 19 Sk to lSk 11 21 15 2 10 20 2 4 8 68 15 22
1Sk to 30k 8 19 15 2 11 19 3 14 3 73 9 9
Heaviest Wheel Load {Z2)
5 kips to 6 kips 14 32 7 8 8 6 1 0 23 54 24 3 7 kips to 8 kips 15 30 14 1 6 8 2 2 20 55 22 16 9 kips to 10 kips 14 31 16 3 7 9 2 2 11 56 16 39
11 kips to 12 kips 9 22 15 2 11 18 4 7 6 69 ·12 40
1-15

6. Bridges with lower traffic density (vehicles per day) display
the same GDC 30 deterioration as those with high density traffic.
GDC 50 deterioration is greatest with low traffic density, and
low traffic density is associated with older bridges.
1-16

I II. RESULTS OF THE STUDY
A. Basis of the Evaluation
Detailed data collected in.the survey are contained in Part 3 of
this report, and those data are organized into tables in Part 2. The
results given in this section ware drawn entirely from the data contained
in Parts 2 and 3. Only that portion of the data related to deterioration
is shown here.
Over 5,000 bridges consisting of more than 35;000 concrete pours
were studied. The decks were examined for cracking, scaling, delamina
tion, artd general condition. Each of theefe categories was broken down
into sub-sets i~ the effort to identify the causes and extent of the
deterioration that was found in the survey. The data were collected by
a field crew in each district of THD and they were recorded on the form
shown in the Appendix.
Analyses of the data show only g~ i.l trends in causes of deteri-
oration. It. has not isolated any one specific construction or maintenance,
or design detail which is the sole catlse of ~rioration. The results are
discussed in the text that follows.
B. General Deck Condition
This general condition is classified ort the survey form as follows:
GENERAL DECK CONDITION, (GDC) • See Figure 1 and the THD Survey
Form in the Appendix.
Deterioration begins with GDC 30. GDC 40 represents extensive
deterioration and a GDC 50 deck is in a serious state of deterioration.
Evaluations, then, of the condition ofbridges in the state are here
1-17

GDC NUMBER DESCRIPTION
10.· GOOD: ~0 CRACKING, ,SPALLING, SCALING, DELAMINATION OR ROUGHNESS.
20. MINOR FINE CRACKING, SLIGHT ROUGHNESS OR VERY SLIGHT, SHALLOW AND INFREQUENT SPALLING OR SCALING, OR COMBINATION THEREOF. NO DELAMINATION.
30. MODERATE CRACKmG, SPALLING OR SCALING. MINOR AND INFREQUENT DELAMINATION. MINOR SURFACE LOSS. OR COMBINATION THEREOF •
31. TRANSVERSE CRACKS ON BOTTOM OF DECK· SHOWING LEAKAG~ •
32. LEAKING TRANSVERSE CRACKS COMBINED WITH 20.
33. LEAKING TRANSVERSE CRAcKS COMBINED WITH 30.
40. EXTENSIVE CRACKING, SPALLING OR SCALING. MODERATE DELAMINATION AND SURFACE LOSS WITH OCCASIONAL POP-OUTS OR POT HOLES. LOOSE OR ROTTEN CONCRETE. OR COMBINATION THEREOF.
44. LEAKING CRACKS ON BOTTOM OF DECK COMBINED WITH 40.
50. SEVERE CRACKING, SPALLING OR SCAJ EXTENSIVE DELAMINATION. EXTENSIVE SuRFACE , WITH RUSTY STEEL SHOWING.· EXTENSIVE LOOSE ( 1TTEN CONCRETE. EARLY OR BEGINNING TENSION CRACKS ON BOTTOM OF DECK. OR COMBINATION THEREOF.
51. LEAKING CRACKS ON BOTTOM OF DECK COMBili WITH 50. . .
52. EXTENSIVE OR SEVERE TENSION CRACKING ON BOTTOM OF DECK COMBINED WITH ANY OF THE ABOVE.- (REPLACE LAST DIGIT, 2, TO DENOTE COMBINATION. i.e., 54 INDICATES 52 COMBINED WITH 40 ~ .
60. DECK FAILURE: . CRACKING THROUGH DECK WITH LOSS OF INTEGRITY BETWEEN CONCRETE AND STEEL OR HOLES COMPLETELY THROUGH DECK.
Figure 1. General Deck Co~dition Classification.
1-18

based on conditions ranging from GDC 30 through GDC SO. GDC's 31, 32,
33 and 44 indicate that· the deck is cracked completely through. It
:would be expected that steel in decks with those classifications is
open to chemical attack, and that the decks are in·the process of
rapid deterioration or conditioned for it.
The statewide distribution of GDC lO and higher is shown in
Figure 2. Throughout the state 61 percent of the pours are classed
30 and higher; and 15 percent are classed 50 and higher. Districts
with the highest percentage of serious deterioration are spread along
an east-west band in the northern portion of the state.
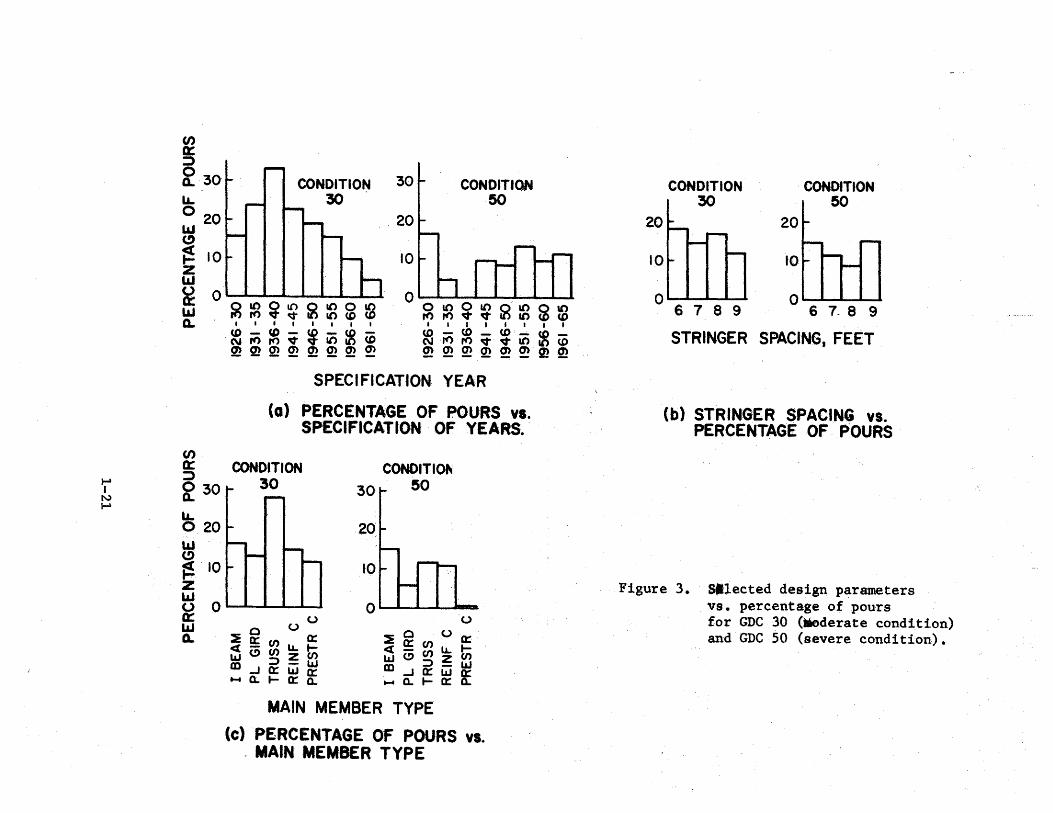
FigurE! 3 shows the relationship between a few selected design
parameters ~nd general deck condition. In that figure it is seen
that the percentage of GDC 30 pourEr increases with decreasing specifi
cation year; i.e., the older the brid.-- 4-.'le higher the- percentage of
pours beginning to deteriorate. The trend may be seen in Part 2
of this report in the table of general cond · ~ · -~n of the deck vs. year
the slab was placed. No such trend is seen · GDC so.
Figure 3 shows a.slight advantage in fav:or of concrete main mem
bers as compared with steel !-beams. However, from Table 3 it may be
seen that the condition is influencedby a number of other fact,ors as well.
Evaluation of the data has shown that there is an association between
a number of design and service factors arid the condition of the bridge
decks. The newer bridges have. greater stringer spacing, ~igure ~ 4, and
the source of materials is highly related to g~ographical location as
is the use of salt on br~;lges, Figure 5. These are but a few of the
1-19·

4
A STATEWIDE AVERAGE OF 61 PER'CENT OF ALL POURS IS Goc~----.~ '--------"" CLASS 30 AND HIGHER. SHADED · 21 AREAS ARE HIGHER THAN AVERAGE.
Figure 2. Distribution of General Deck Condition 30 and higher. The percentage of pours is shown in brackets for each numbered THD district. The districtswith higher than average percentages are shaded.
1---& I N 1---&
(/) a:: :)
~ 30 ~ 0 20 LLI (!)
~ 10 z L&.l
CONDITION 30.
30
20
10
CONDITION 50
~ 0' I I I I I I I I 0' 1 a 1 1 1. 1. I I
•.• o_. &O o 10 o &O o &O o l() o l() o &O o &O ~ ~~~~~lt)~~ ~~~~~lt)~~ Q,. I I I I I I I I I I I I I I I f
(/) 0: ::l ~ 30
~ 0 20 LIJ (!) !'\( '10 F z
~-~-~-w- ~-~-~-~-N~~~~lt>~~ N~~~·lO~~ ~~m~~~~~ ~~~m~~mm
SPECIFICATION YEAR
(a) PERCENTAGE OF POURS vs. SPECIFICATION OF YEARS.
CONDITIO.. 30L 50
20
10
~ 0' I I I I I 0 I I I I
0: LIJ a..
u 0 00::
::E~CJ)U..I<t(!)CJ)ZU'> w =>-w m...Jo::wo:: .... a.t-o::a_
u ;:eO 00::: c:t!!:CJ)u..lw<!>~z(J) m_.o::Lij~ ..... a.t-0::0.
MAIN MEMBER TYPE
(c) PERCENTAGE OF POURS vs. . MAIN MEMBER TYPE
20
CONDITION 30
CONDITION 50
0 I I I I. I O' I I I I
6 1 8 9 6 7. 8 9
STRINGER SPACING, FEET
(b) STRINGER SPACING vs.
Figure 3.
PERCENTAGE OF POURS
Sllected design parameters vs. percentage of pours for GDC 30 (lioderate condition) and GDC 50 (severe condition).

(!) z 0
l ...-: I.L
en
0 0 <0 v
-0 t-=f "-en CD I I
I I I
0 i <0
(!) z 0
' -t: ,.._
0 <0
(!) z u ·~ (I)
.,.: 1.1.
U)
0 0 U) q-
0 (\1
I I 0 N 0
0 N
0
g9- 1961 09-$61 gg- lg61
og-9~61
gv-lv61 op...-.gz61
g9-1961 09-9~61
gg- lg61 OS-9t161 gp.-ltJt61 OtJt-g<:61
g9-196f og-ggs~
gg-lg61 OS-9v61 gt;:r- lt161
ov- gzst
S3901~ .:10 39'/.lN~3d
1-22
a: <( L&J >-z 0 ~

NO SALT APPLICATIONS 100 I"" ,..... ·- ~
80 ~
60 !-
~ ~ ~ -
~ 40
.·.
- r r -1--
~
- C\1 rt)~&() c.t> ,..._ CD en ~ - (\lrt) .. It) U) I"-:- a) (J) 0 N~ • It)
20
0 -----------NNC\INC\IC\1
I - 5 SALT APPLICATIONS PER YEAR 100 r- ,..._
,.._
(/) 80 ,..... -~
~ 0 60 - 1- -cr m LL. 40
1--1-
0
UJ 20 <!)
~ 0 z w
0
1-
n >_ U>_· ,...._ c:o en o - N ,., . 10
- - N N N C\J ·"' N cr w a..
MORE THAN 5 SALT APPLICATIONS PER YEAR (ONLY I OIST. HAD MORE THAN 15)
60
40
20
0 ~<n·O-Nrt)VIC)U>~tO~O-Nrt)VIO ----------NNN·NNN
TEXAS HIGHWAY DEPARTMENT DISTRICT NUMBER
Figure 5. Percentage of bridges vs. THD districts (01) for each of three salt application groupings (40).
1-23

interrelationships that bear on the complex deterioration problem.
C. Cracking
The survey collected data on cracking in respect to degree, type,
spacing, and locatio~ on the deck.
Sixty-seven percent of all pours have zero to minor cracking, and
27 percent have moderate cracking, Figure 6. Districts 2, 3, 8, 15,
and 17 show the highest percentages of extensive cracking. Districts
2, 3, and 8 are in the same region of the state, but other districts
in that region have much less extensive cracking. The spacing of cracks
decreases as the age of the structure increases.
Cracking type is predominantly trans-uerse with no geographical
pattern of type or spacing. The longitudinal cracking percentage is
low, but what there is of it occurs primarily between beams jn very
thin slabs such as are constructed with pan fo~~ There is more cracking
in wheel paths than in any other specific loca1
generally scattered over the deCk area.
although it is more
The small percentage of extensive cracking, 5 1 ent of all pours,
is scattered over the decks. This is as one might expect because it
has progressed through minor and major stages, spreading as it pro
gressed.
Figure 7 shows that the degree of cracking increases with the type
of supporting beam in the following order: prestressed concrete,
reinforced concrete, steel I-beam, and steel plate girder. Generally,
too, continuous spans have more cracks than simple spans. Traffic
volume and transit mix are not factors in degree of cracking, but
1-24

C/) a= 5 Q..
~
~ ~ LLJ 0 0:: IJJ a..
C/) a=
60
50
40
30
20
10
70
60
::::> 50 ~ ~ 40 ~ ~ ~ 30
a= ~ 20
10
0
.-
~
....
r--
-~
~
.... r--
r--
-1--
I--
-~
NO CRACKING ( DEGREE I )
,..._. ,..._.
...-- ...-
1--
~ ..... ~ 1--
1-- I--
~ ~
~
..
THO DISTRICT NUMBER
0 MOOERATE CR-ACKING (DEGREE 3)
II 1'!XTENSIVE CRACKING (DEGREE 4)
0') 0 -N rt> ~ 10 CD,.._ CD 0') 0 ----------N THO DISTRI-CT NUMBER
Figure 6. Percentage of peurs vs. THD districts (01) for each of three degrees of cracking (50).
_1-25

~ I
N 0\
t.&.. 0
100 LU UJ 80
~~ 60 ~e 4o LU ~ 20 (.) 0::
1 I .. 0 1 ~ LU ,_ o a.. uz
a::zo LIJ 0 (.) 0(.)·
...:::: 0:: a::
.:; - LL: t<t (!) z en LLJ • - L&J m ..J w a:: ..!.t a.. 0::: 0..
.u 0 z
a::zo . lLJ 0 0
::E 0 (.) . <X 0: 0.: L&J (5 LL." teo z en
' .• - LIJ I _..:J L&J 0:::
.... 0.. 0::: 0..
0::
""' 20 c:xa:: w~ m~ I..J HQ.
0:: l&J
20 <a:!! w (!)' m . I..J Ha..
0 ·z ~0 oo (.) . a: IJ.:. tzcn -LLJ L&Ja:: Q:o..
DEGREE 5 (SEVERE)
.u a:: ~·- ~ woo
~ 00 . co: 0:: <t..:..u;tL&J <!> ·z en CD .-L&J I..JWO::
1-ttl..O:::O..
Figure 7. Percental five deg1
- ->ridges vs. ma*n member type (06) for each of : cracking (50).

cracking is reduced when water reducing admixtures· are used. Entrained air
and set retarders are associated with greater spacing between cracks, but the
main factor in that association could possibly be age of slab rather than ad
mix. The degree of cracking is higher the earlier the year of the first salt
application. But, here again, age of structure must be taken into_ account.
D. Scaling
The survey data rate scaling by degree, depth, and percentage of
area of deck scaled, as well as loca-tion on the deck. No distinction was made
on the survey forms bebWeen scaling and spalling. Some of the deeper scaling,
3/4 inch or more, possibly should be cla8sified as spalling, although no such
classification is made here.
Scaling does not appear to be a serious problem on bridge decks in Texas.
Figure 8 shows the degree of scaling for the various highway districts. Those
districts with the most severe cases of scaling are located generally in the
north and west parts of the state. Those with the higher percentages of pours
with moderate and higher ratings are ger. ly in the urban areas shaded in
Figure 9.
Of all bridges surveyed, 40 percent of 1 pours had no scaling, 41
per.cent had minor scaling,. 14 percent had moderat~ scaling, and 5 percent
were scaled more seriously. Forty percent of the pour area had no scaling
and 62 percent of the area had 5 percent or less scaled surface area. Twenty
nine pe·rcent of all pours was scaled 0. 20 inches or less in depth. Four
percent was scaled deeper than 3/4 inch. About 25 percent of the pours was
scaled in wheel paths, 11 percent in gutters, and 52 percent of the scaling
was scattered over the slab.
There is some indication that post World War II bridges are somewhat
more seriously scaled than those constructed prior to that period.
1-27

60 {/)
-~ 40 0 0. LL 20 0
0
~ -~
~
~
~
~
~ -~
f.-
1--
DEGREE I (NO SCALING)
OEGftEE 2
--- ....
DE:GREE 3.
Q=
DEGREE 4
DEGREE 5
,..... --~
TEXAS HIGHWAY DEPARTMENT DISTRICT NUMBER
-,...._
~
Figure 8. Percentage of p~urs vs. THD districts (01) for each of five degrees of scaling (54).
1-28

( 14 o/o)
6
8
(20°/o)
THE STATEWIDE AVERAGE OF POURS WITH DEGREE 3 AND HIGHER SCALING IS . 19 PERCENT.
THE SHADED AREAS HAVE 30 . PERCENT OR MORE POURS WITH MODERATE SCALING.
Figure 9. The percentage of pours with moderate (3) and higher degrees of .scaling are shewn in parentheses within the districts.

Amo_ng the br~dges constructed after World War II, scal~ng is a little
more advanced in the older ones. Salt application was light prior
to about 1950 (reference Part III, Table 34/39) and traffic volume
began to increase rapidly about that year ·(reference P~irt III, Table
20/34). Scal~ng increases with both of those factors.
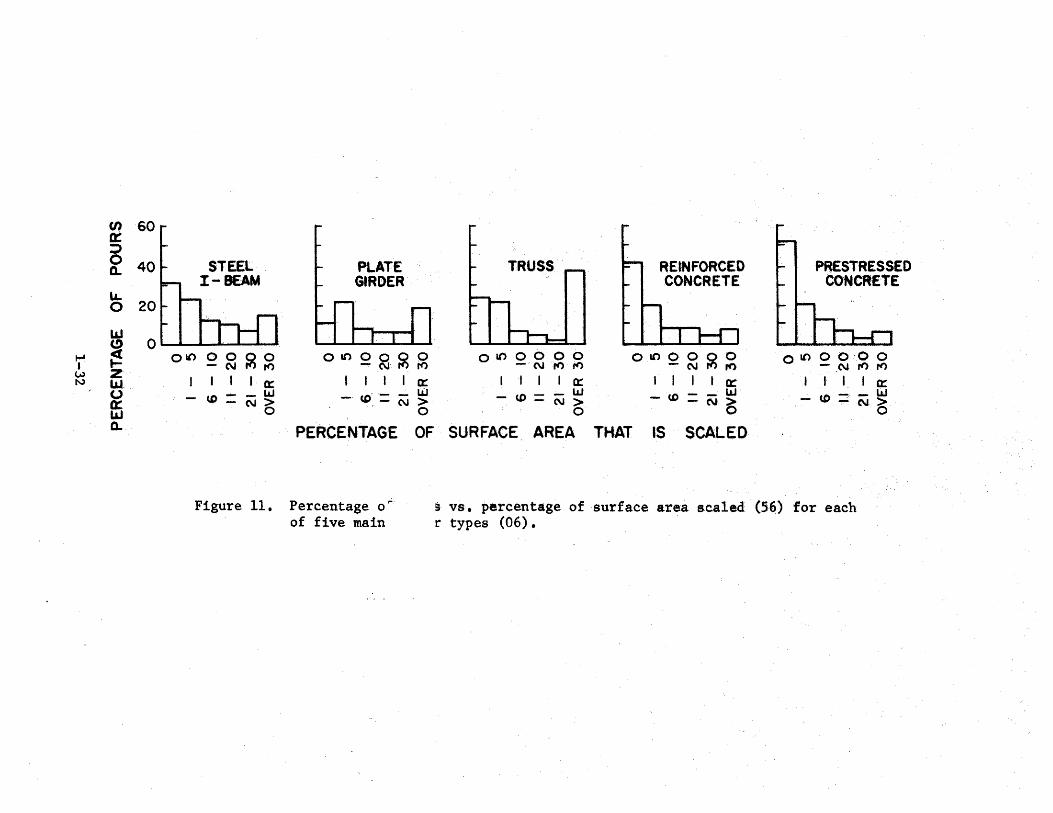
Scal~ng is a little less serious in.degree and extent of area in
slabs suppor,ted by concrete beams although the difference is not great.
See Figures 10 and 11. Thicker slabs, too, show less tendency to
scale than thinner ones, and scaling is reduced with more closely
spaced beams.
The crown of constant slope, crown type 2 in the survey, shows a
trend toward increased scaling when compared with the normal type
crown. The same trend is shown for continuous spans compared with
simple spans.
All of the admixes (water reducers, reta: ; , and air-entraining
agents) are associated with reduced scaling. The findings are not
definitive enough to indicate possible design level:
ment as an.aid in reducing scaling.
1r air entrain-
Low cement factor is closely associated with scaling, as might
be expected. The higher cement factors produce more resistant concrete.
Scaling grows more serious with the number of years of salt application
and the number of applications per year•
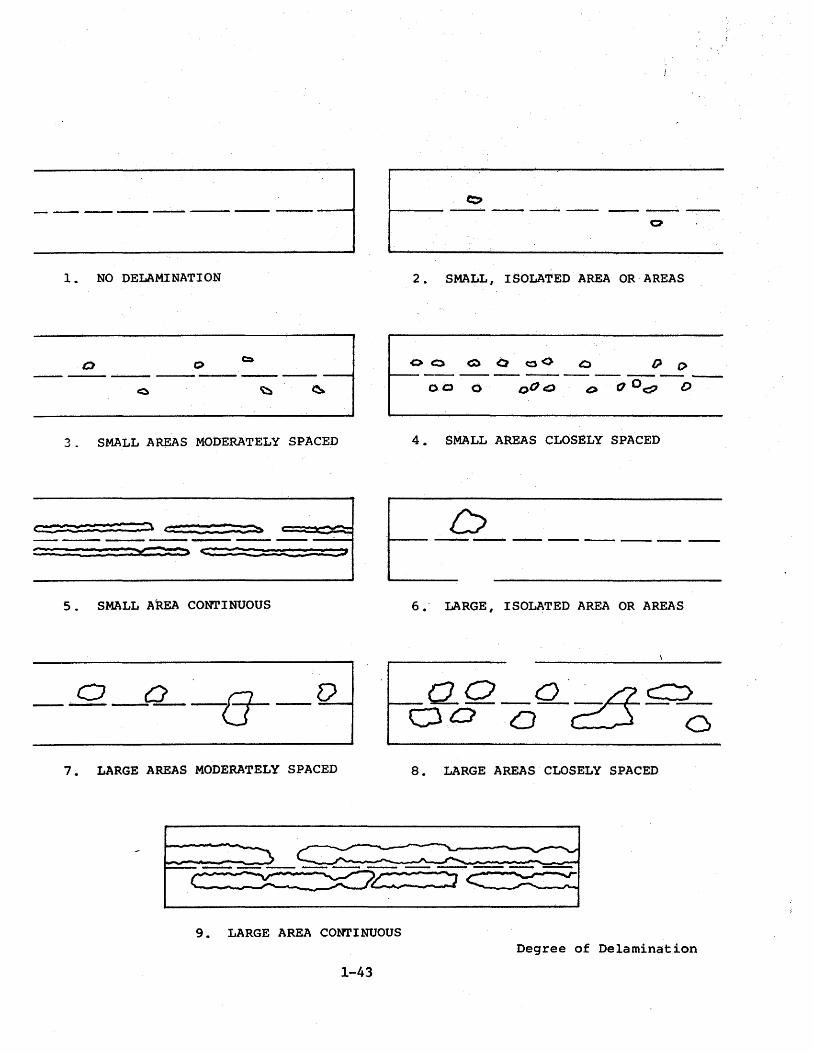
E. Delamination
Delamination data collected in the field show degree, location
on the deck, and extent of delaminated area.
1-30
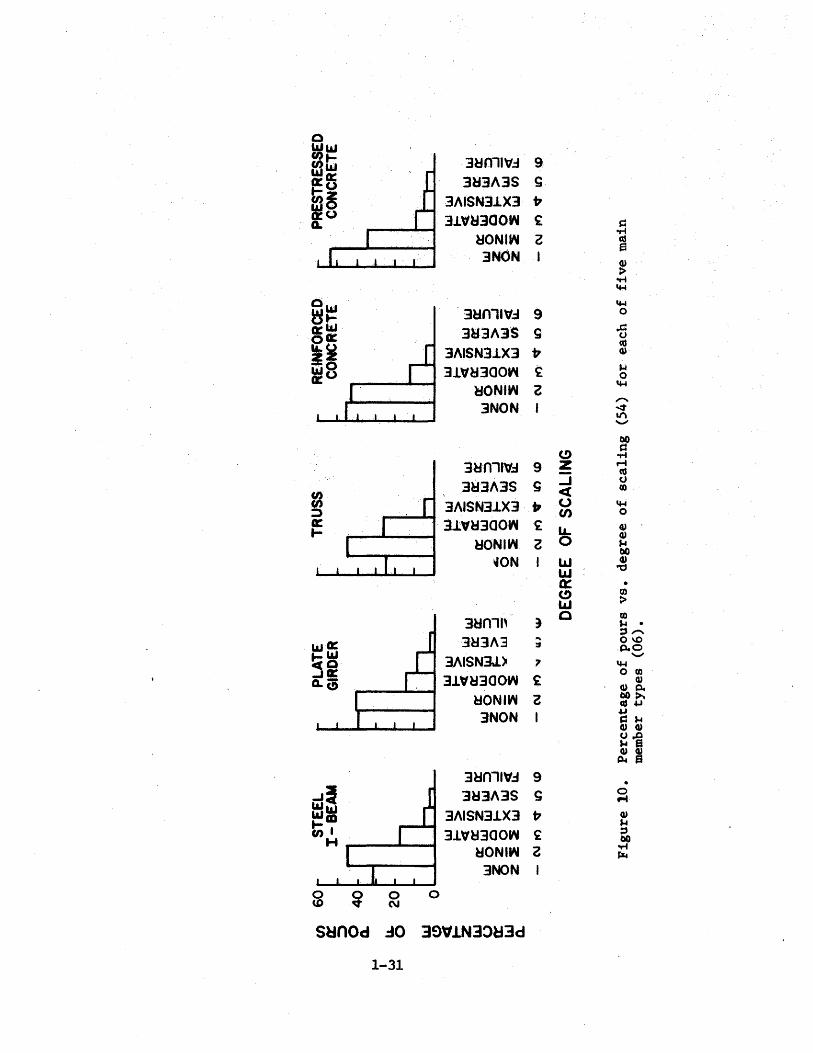
0 ww 0t-
3~n11\f:J 9 U>w "'o:: 3l:J3A3S g a:u
;~ 3AISN3l.X3 ~
CL 3.l~~3COW £ ~
~ONIW -r-1 z "' 3NON I s G)
> .,.... -....
Ow -.... tje- 3~n11'1.:1 9 0
a:taJ 3~,3A:3S ~ ..c:
oa: u
"' ~~ 3AISN3lX3 ~ G)
iljO 3.l\f~300W £ ,..
a:U 0
~ONIW z -.... ,......
3NON """ "' """ bO
(.!) .a 3~n1nt:J 9 z r-1
"' 3~3A3S g ..J u
~ <( co
3AISN3J.X3 tr 0 -.... (/) 0
&1: llV~300W £ ~
G) 1- G)
l:IONIW z ... bO
~ON LLI G)
L&J ~
0:: . (!) co LLI >
3~n,,, ~ 0 co ,.. .
::3,.....
....,a: 3l:I3A3 ""' 0\0 :2 ~0
~~ 3AISN3J.) """ 7 -.... ..JCI:
3..L\f~300W £ 0 co
CL(.; OJ G)~
l:IONIW z CO>-. QS~
3NON ""' d,.. OJ G)
~~ ~~
3l:ln11V:J 9 . _,J 3~3A3S g 0 .,_., WI&J
3AISN3..LX3 ~ G) "'m ln•
,.. 3l\fl:I300W £ ::3
H co l:IONIW z -r-1
~
3NON
0 ~ 0 0 U) N
s~nod ~0 39\1J.N3:>~3d
1-31
, ct: 5 d.
LL 0
~ 1-' ~ I w z N LU.
0 «r LU 0..
60
40h STEEL t PLATE I-BEAM GIRDER
20
0 01.0 0 0 ~ 0 -N l'f')
01.000~0 -N l'f')
I I I Ia: I I I Ia: <D---W CD--W - ·-N> - -N>
0 0
PERCENTAGE
Figure 11. Percentage o~ of five main
OF
OlOOOOO -Nrt)rt'>
I I I I a:: - ,,.. -- w ...,_N>
0
REINFORCED CONCRETE
01.00000··· -(\Jfl)pt')
1 I I I c:r -w=N~
SURFACE. AREA THAT IS SCALED
PRESTRESSED CONCRETE
o.noooo -_N l'f') l'f')
I .1 I I a::: -<D~(\j~
0
9 vs. percentage of surface area seale.d (5.6) for each r types (06).

Among the 35,658 pours studied, 81 percent revealed no delamina
tion. Roughly, this is the equivalent of one bridge in a hundred
being completely delaminated. Only small, isolated areas were found
in 13 percent of the pours, and 6 percent were delaminated more exten
sively. Figure 12 shows that the northwest half of the state, is the
area more extensively affected by delamination and Figure 13 shows the
distribution of delamination by districts throughout the state.
Visible cracking over the delamination was found in 90 percent
of the pours observed to be delaminated. Most of the delamination was
found to be either generally scattered over the deck, or in wheel
paths. No clear pattern was established.
Delamination is more prevalent in heavily traveled bridges and
those designed for heavier loads. It appears to be more of a problem
in slabs from 5-1/2 to 6-1/2 inches thick than in thinner or thicker
ones, see·Figure 14, and grows more se s as the number of salt
applications per year increases.
The age of a bridge plays a definite ro
constructed in the 1960's show considerably
ln delamination. Those
_ J deterioration than
the older ones, and· age is probably a major factor in some of the
associations mentioned later.
Plate girder structures display more delamination than other types,
followed in order by steel I-bea~, prestressed concrete, and reinforced
concrete. Figures 15 and 16 show, however, that differences are not
great. Age possibly is a contributing factor. The steel beam bridges
are, in general, older than the prestressed beam bridges, but not
1-33

KEY:
SMALL, MODERATELY SPACED
AREAS {0/o)
CLOSELY SPACED,· SMALL AREAS A TO LARGE, CONTINUOUS AREAS L&.
UNSHADED AREAS HAVE NO DE LAM I NATION OF MODERATE DEGREE OR HIGHER
Figure 12. Delamination of moderate degree and higher; percentage of pours by districts.
1-34

100
75
50
DEGREE I NO DELAMINATION
25
DEGREE 2 SMALL IS 'ED AREAS
CLOSELY SPACED SMALL AREAS, DEGREE 4,
IO r ~ L;;GE, CONTINUOUS AREAS, nDEGREE 9
olllikuJ II~ D. -N~v~~~~mo_-_N_~v~~~~mo-N~v~~
-------NNC\INC\IC\1~
TEXAS HIGHWAY DEPARTMENT DISTRICT NUMBER
Figure 13. Percentage of pours vs. THD disJricts (01) for each of four levels of delamination (58).
1 _"H;:

SLAB THICKNESS lN J·NCHES (19)
U) 100 a:: 5 80 0..
~ 60~ I 5.6 TO 6.5 6.6 TO 7.5 7.6. TO 8.5 8.6 TO 9.5 J-1 I LLI w
<!> 40 0\
~ z LLI 20 :f LaJ 0... 0
123456789 123456789 I 23456789 I 2 3 4 5 6 7 8 9
DEGREE OF DELAMINATION (58)
Figure 14. Percentage of pou degree of delamination (58) for.four slab bhicknesses (19).

.-I w ......
en 100 a: :l 0 80 a. LL. o so~ 1 I:-BEAM UJ
~ 40 z ~ 20 a: UJ 0.. 0
123456789 "' "2· •
PLATE GIRDER
A 5 6 7 8 9
REINFORCED CONCRETE
I 23456789
uEGREE OF DELAMINATION. (58)
PRESTRESSED CONCRETE
123456789
Figure 15. Percentage of pours versus degree of delamination (58) for each of four main member types (06).

J-1 I w 00
(/) 100 a::: ::> ~ 80
~.·
UJ
~ z L&J (.) a: laJ Q_
60
40
20
I- BEAM PLATE GIRDER'
o• ' r=t==w ~(v ~\od\00\~0\o d\o ~(v~\od\oO\~\~d\o
~o / /~ tt; ~ "'j ~o / / ~ 'V ~ ,-~ .//~ ·~ //~ .::\0,.!\0o\o o\o _ \«; · .::-\0,.!\oo\oo\o _ \~• · ..
" " ~ <S" v ~ ~ <S"
REINFORCED CONCRETE
· ~(v o\O ~\0 o\O o\O .g\O 0~ ':5 ,v ~o "lo _,v ~ / / / / ::_\o o\oo\o o\o fv~ <O,"~ ~
PER--.. ·-.. ~GE OF AREA DELAM·INATEO
PRESTRESSED CONCRETE
~(v ~\0 ~\OO\~d\0~\0 ~0 / /~/q;/~ ~ ~\0,.~\0;p\O o\O ~fv~
v ,,~ 0
Figure 16. Percentage of pours versus percentage of area delaminated (60) for each of four main member types (06).

necessarily older than those of reinforced concrete. The crown of
constant slope appears to contribute to delamination problems. There
is less trouble seen in the data in decks with the normal crown.
Almost all of the concrete used in decks is made of Type I cement;
but the 2 percent that is made of Type III cement shows less delamina
tion. It should be noted, however, that the latter tyPe was used
very little prior to the 1960's. Lightweight concrete, accounting
for 3 percent of the pours studied, has less deterioration than the
more widely used normal weight material. Here; again, age could be a
strong factor beeause of the rather recent introduction of lightweight
concrete for use in bridge decks.
Retarders and water reducers are associated with less delamination.
The belt finished concrete is somewhat more highly delaminated
than is the float finished material.
There is a marked decrease in del ation in pours placed between
the years 1959 to 1960. The data indicate that significant air entrain
ment was begun in 1960. This fact may be re ed to the apparent
decrease in delamination.
1-39


IV. APPENDIX
THD BRIDGE DECK SURVEY FORM
1-40

----Transverse
) \--r l I _.,j ........ T
-
-, j
-
Checkerboard
- .... )
-
Longitudinal Diagonal
Map, AlligCJtor or Random
Types of Cracking 1-41

GENEJW:. DEcK CONDITION
10~
. ~~.20. ~ -30
DEGREE CRA~ ... ING . . . . - ------ • SCALING) ------ .
1. NONE ..........- ~ 31. 2. MINOR. ~ · . 32. 3. MODERATE 33. 4 • EX'l'ENSI VE 40 • S.SEVJ!i~
6. FAILURE'-._ --------
--------- 44. 50.
Sl. 52.
60.
GOOD: 11) CRACKI~, SPALLI~, SCALIRG, DELAiuliiATJ:OII OR ROUGHIIESS. Mlli)R I'IRE CRACKIRG, SLIGB'l' ROUGitN!:SS OR VBRY SLIGB'l', SHALLOW AND IIIFREQUER'l' SPALLIRG OR SCALING. OR OOH-. BINATIOR 'iBER!X>F • 11) DBLAMIDTIOR. M>D~TE CRACKiliG, SPALLiiiG OR SCALIRG. JaiiOit. AND INFlUlQUBNT DELAJUIIATIOB. MiiiOR SURPACE LOSS. OR COMBDaT10ir THBRBOF. 1'RABSVBRSE CRACKS ON BO'l"l''H OF DBCk SHOWl:liJG LEAICAGE. LEAKING TRMISVERSB CRACKS cciMsiJI1BD WI'l'B 20. LEAKIJiG TRABSVBRSE CRACKS COMBiiiBD WITH 30. ~IVB CRACKIRG, SPALLING OR SCALIRG. K>DBRATB DELAIIIlmTIOB A11D SURFACE LOSS WI:'M occASZOJIIU, POPOUTS OR POT !IlLES. LOOSE OR RO'l"l'EB OORCRB'rll. OR COJlBIIIIP.TIOii 1'II£RBOP. LEAJCIJiO CRACKS OR BOT'l'OM OF DECK OJMBiliED WI:TR 40. SEVERE CRAO:IRG, SPALLIIIG OR SCALING. BXTBRS:lvB DBLAHINAT.ION. BXTEBS:lVE sURPACB LOSS WI'l'B RUS'lY STEEL SBOWDJG.. EX'l'ERSlvE LOOSE OR. RO'l"l'BN OO!'ICRETB. ~y OR BEG:lNRl:NG TBBSI.OR CRACICS,ON BO'l"l''M OP DECK. OR OOMBI.TION TBERBOP. LIWtlliJG CRACJCS 011 BO'l"l'OM OF DECK COMBI!IED WI:TR SO. BXTIDISIVB OR SEVERE TBHSION CRACKIRG ON BO'l'TOM OP DECK COMBINED WI'ftf ANY OP THE ABOVB. (RBPIACI. US'l' DIGIT, 2, TO DENOTE COMBIIfATION. i.e., 54 INDICATES 52 COMBIN!b WITH 40. DECK FAiLURE 1 CRAO:IRG 'l'RROUGB DECK WITH LOSS OP IH'l'!lGRI'l'Y BE'l'WBBN OJIICRB'l'B AND STBBL OR BJLBS COMPLftELY '!'BROUGH DECK.
Relationship Beween Classifications
1-42
---------· ------ t---- -- -- -- -- -- -- --
1. NO DELAMINATION 2. SMALL, ISOLATED AREA OR AREAS
a OQ Q 0 c:l<) 0 /) t>
o.o -;---oOa --o-(10~-D-
3. SMALL AREAS MODERATELY SPACED 4. SMALL AREAS CLOSELY SPACED
D ------------- ----~ 1-----------------
5. SMALL AREA CONTINUOUS 6 •· LARGE, ISOLATED AREA OR AREAS
_O_Q__a-_D
7. LARGE AREAS MODERATELY SPACED 8. LARGE AREAS CLOSELY SPACED
9. LARGE AREA CONTINUOUS Degree of Delamination
1-43
Related Documents