Bridge Building Introduction: This lab was designed to explain the concepts of tension and compression in structures such as bridges. The main goal is to understand the role of tension and compression forces in building bridges. The one specific type of bridge used in this lab is a Warren Truss bridge. The compression and tension forces act in different ways in different types of bridges. This experiment will analyze the forces in a Warren Truss bridge, and see how the correct combination of compression and tension make the bridge possible. Background: There are many types of bridges. For example, beam bridges, truss bridges, arch bridges and suspension bridges. All of these look different, and are made using separate techniques. Suspension bridges such as the Golden Gate Bridge in San Francisco use cables. Beam bridges use horizontal beams to support weight. Truss bridges, the type analyzed in this lab experiment, make use of triangular structures, in order to spread the weight out. There are many types of truss bridges, but the one built in this lab is a Warren Truss bridge, named after James Warren. A lot of truss bridges are built by adding vertical supports between the triangles of a Warren truss bridge, to add stability. However, Warren truss bridges are still very stable and capable of handling load. Due to the web configuration of these bridges, the compression and tension forces are split between different beams. Under a uniform load, different beams are subject to either tensile or compressive stress. As a load crosses the bridge, the beams are subject to stress reversal, distributing the load, and making it easier for the bridge to handle it. Figure 1 shows the calculations of tension (in red) and compression (in blue) for a simple Warren truss bridge with a weight going across it. The equilateral triangles make it

Bridge Building Lab Report
Dec 26, 2015
Bridge Building Lab Report analyzing tension, strain, etc. when building model bridges with sensors on them.
Welcome message from author
This document is posted to help you gain knowledge. Please leave a comment to let me know what you think about it! Share it to your friends and learn new things together.
Transcript
Bridge Building
Introduction:
This lab was designed to explain the concepts of tension and compression in structures such as bridges. The
main goal is to understand the role of tension and compression forces in building bridges. The one specific type of
bridge used in this lab is a Warren Truss bridge. The compression and tension forces act in different ways in
different types of bridges. This experiment will analyze the forces in a Warren Truss bridge, and see how the correct
combination of compression and tension make the bridge possible.
Background:
There are many types of bridges. For example, beam bridges, truss bridges, arch bridges and suspension
bridges. All of these look different, and are made using separate techniques. Suspension bridges such as the Golden
Gate Bridge in San Francisco use cables. Beam bridges use horizontal beams to support weight. Truss bridges, the
type analyzed in this lab experiment, make use of triangular structures, in order to spread the weight out.
There are many types of truss bridges, but the one built in this lab is a Warren Truss bridge, named after
James Warren. A lot of truss bridges are built by adding vertical supports between the triangles of a Warren truss
bridge, to add stability. However, Warren truss bridges are still very stable and capable of handling load.
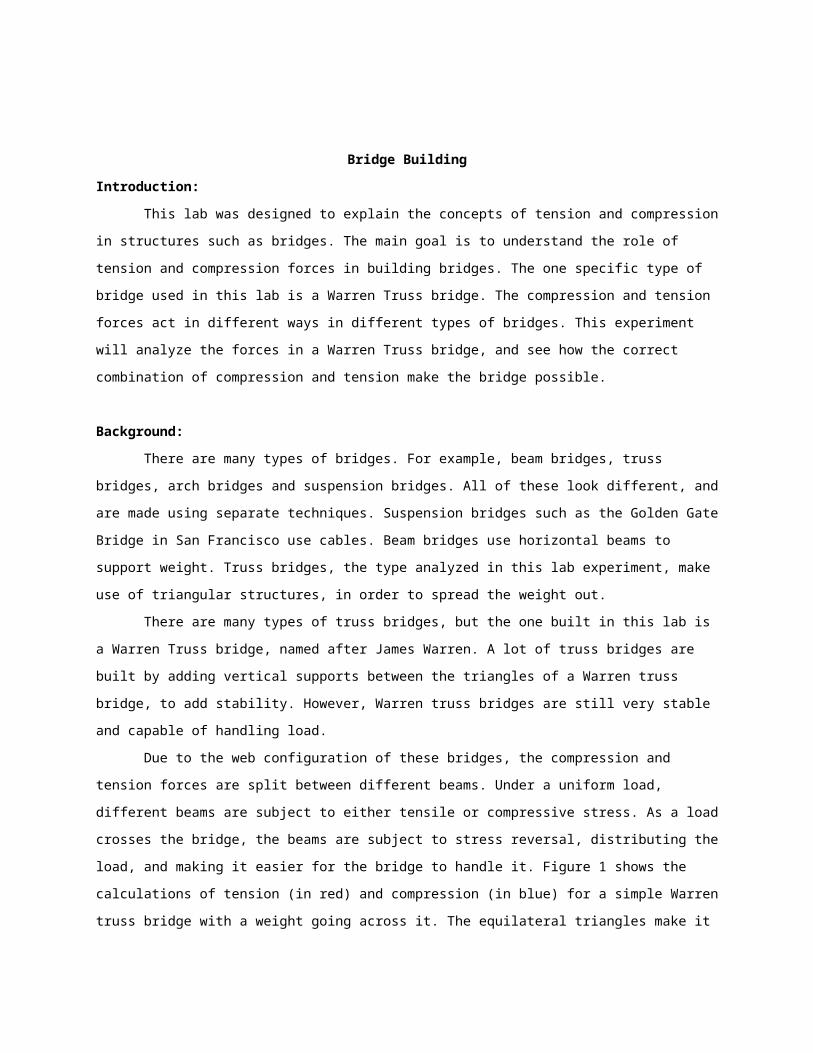
Due to the web configuration of these bridges, the compression and tension forces are split between
different beams. Under a uniform load, different beams are subject to either tensile or compressive stress. As a load
crosses the bridge, the beams are subject to stress reversal, distributing the load, and making it easier for the bridge
to handle it. Figure 1 shows the calculations of tension (in red) and compression (in blue) for a simple Warren truss
bridge with a weight going across it. The equilateral triangles make it possible for the diagonal forces to be equal.
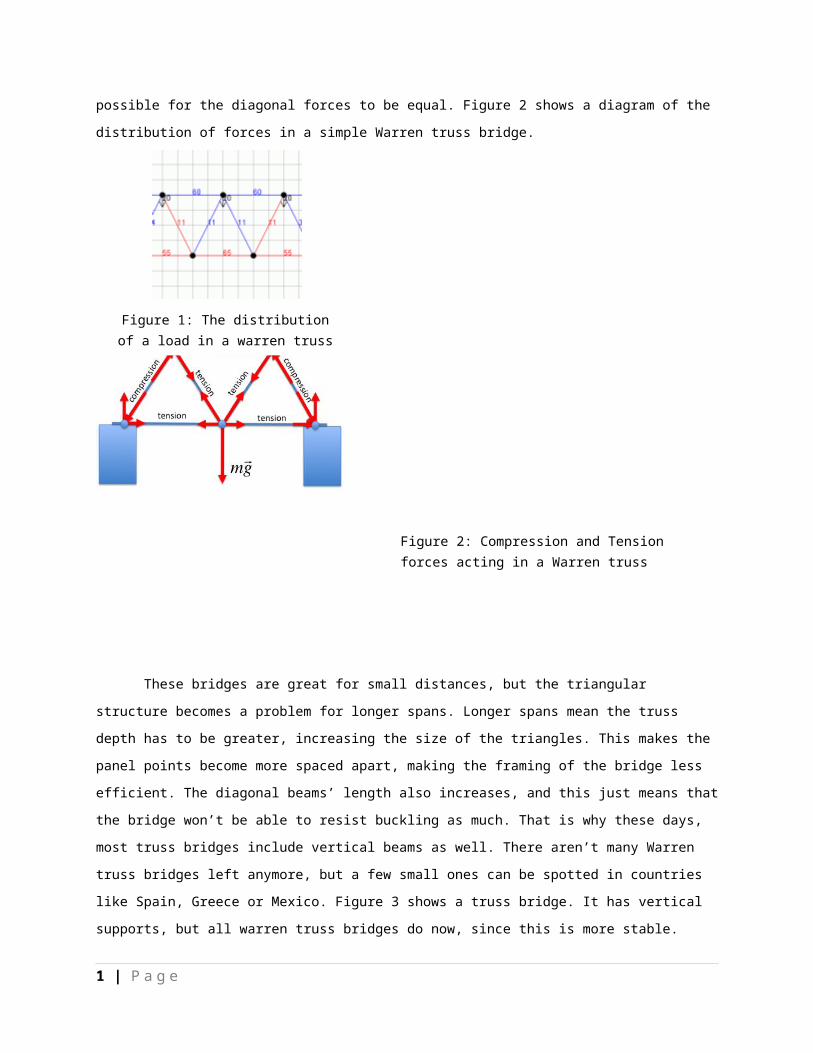
Figure 2 shows a diagram of the distribution of forces in a simple Warren truss bridge.
Figure 1: The distribution of a load in a
warren truss bridge.
Figure 2: Compression and Tension forces acting in a Warren truss bridge
These bridges are great for small distances, but the triangular structure becomes a problem for longer spans.
Longer spans mean the truss depth has to be greater, increasing the size of the triangles. This makes the panel points
become more spaced apart, making the framing of the bridge less efficient. The diagonal beams’ length also
increases, and this just means that the bridge won’t be able to resist buckling as much. That is why these days, most
truss bridges include vertical beams as well. There aren’t many Warren truss bridges left anymore, but a few small
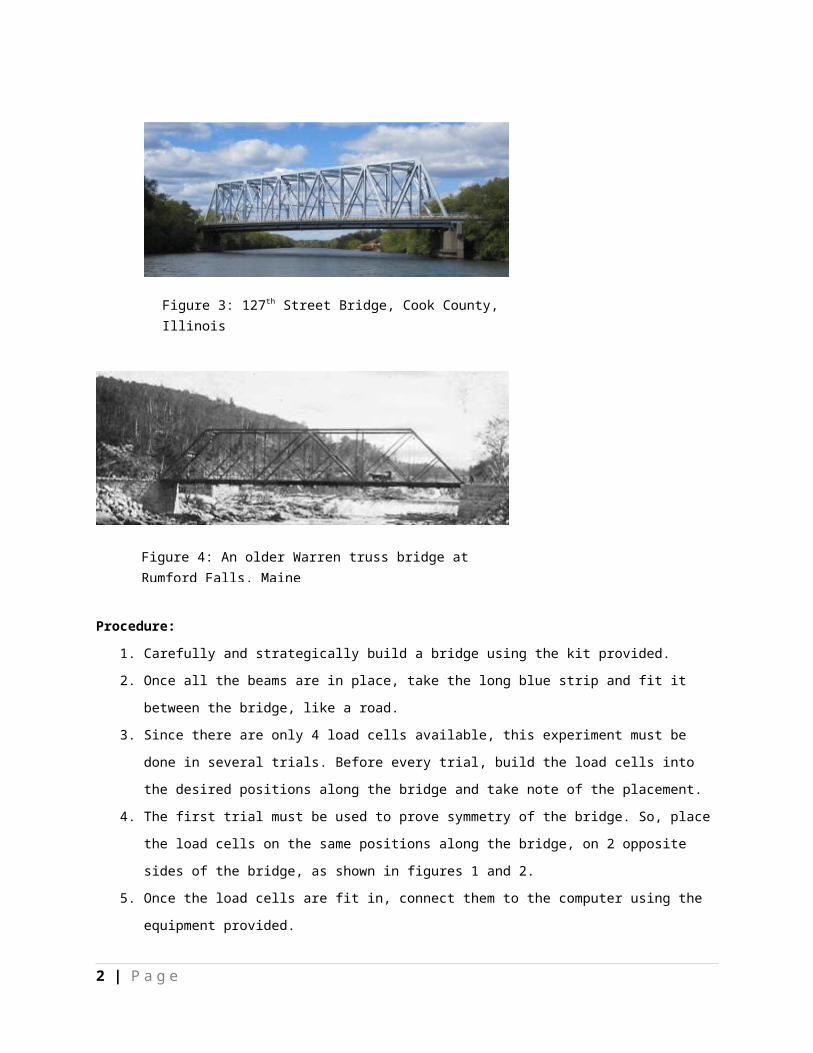
ones can be spotted in countries like Spain, Greece or Mexico. Figure 3 shows a truss bridge. It has vertical
supports, but all warren truss bridges do now, since this is more stable.
Procedure:
1. Carefully and strategically build a bridge using the kit provided.
2. Once all the beams are in place, take the long blue strip and fit it between the bridge, like a road.
3. Since there are only 4 load cells available, this experiment must be done in several trials. Before every trial,
build the load cells into the desired positions along the bridge and take note of the placement.
4. The first trial must be used to prove symmetry of the bridge. So, place the load cells on the same positions
along the bridge, on 2 opposite sides of the bridge, as shown in figures 1 and 2.
5. Once the load cells are fit in, connect them to the computer using the equipment provided.
1 | P a g e
Figure 3: 127th Street Bridge, Cook County, Illinois
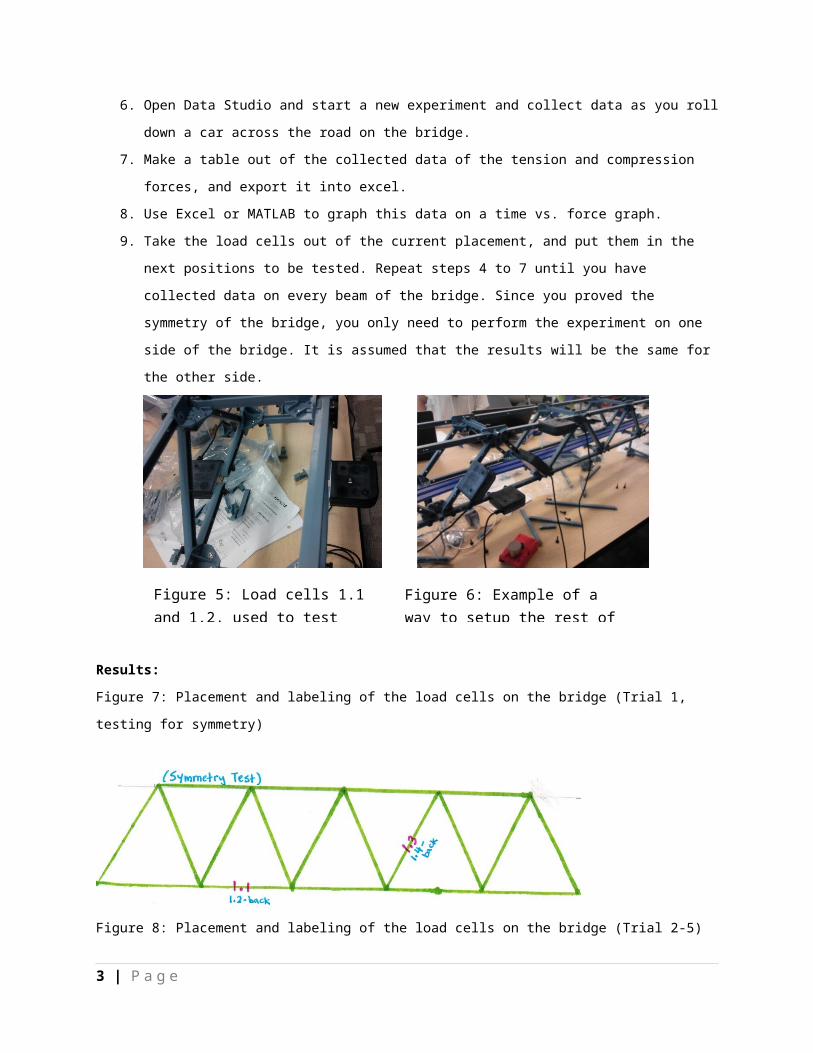
Figure 4: An older Warren truss bridge at Rumford Falls, Maine
6. Open Data Studio and start a new experiment and collect data as you roll down a car across the road on the
bridge.
7. Make a table out of the collected data of the tension and compression forces, and export it into excel.
8. Use Excel or MATLAB to graph this data on a time vs. force graph.
9. Take the load cells out of the current placement, and put them in the next positions to be tested. Repeat
steps 4 to 7 until you have collected data on every beam of the bridge. Since you proved the symmetry of
the bridge, you only need to perform the experiment on one side of the bridge. It is assumed that the results
will be the same for the other side.
Results:
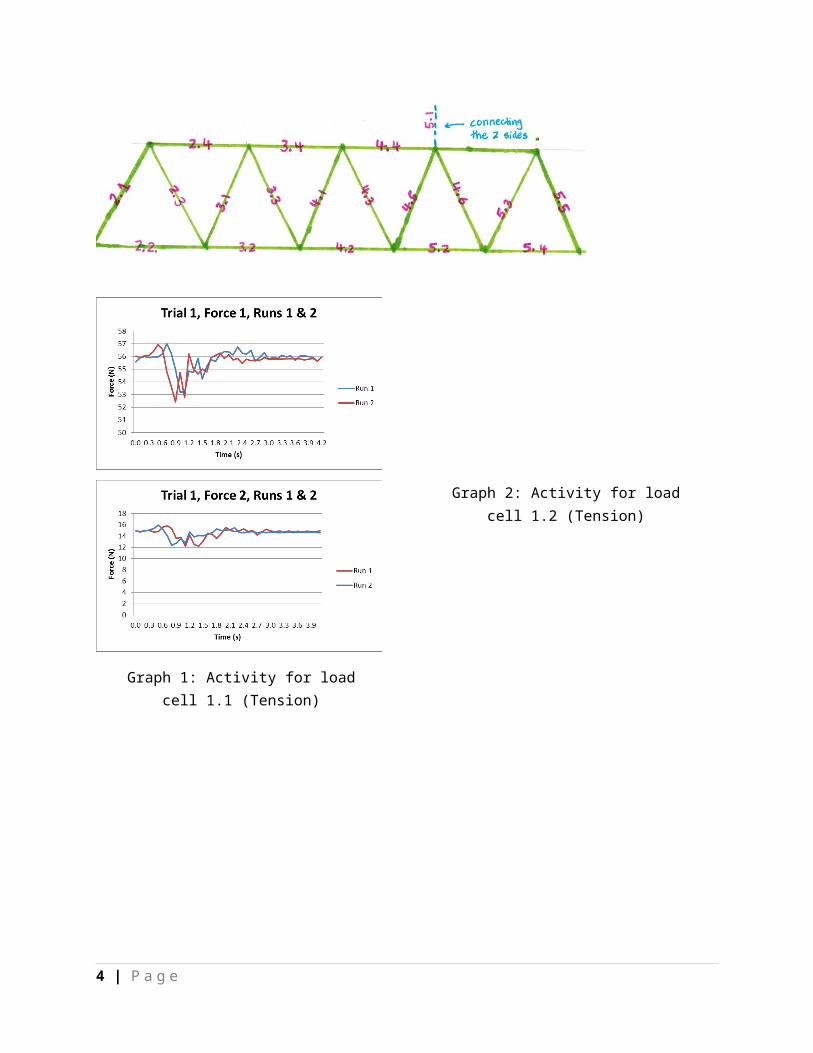
Figure 7: Placement and labeling of the load cells on the bridge (Trial 1, testing for symmetry)
Figure 8: Placement and labeling of the load cells on the bridge (Trial 2-5)
2 | P a g e
Figure 5: Load cells 1.1 and 1.2, used to test symmetry.
Figure 6: Example of a way to setup the rest of the trials, after trail 1.
Graph 1: Activity for load cell 1.1 (Tension)
Graph 2: Activity for load cell 1.2 (Tension)
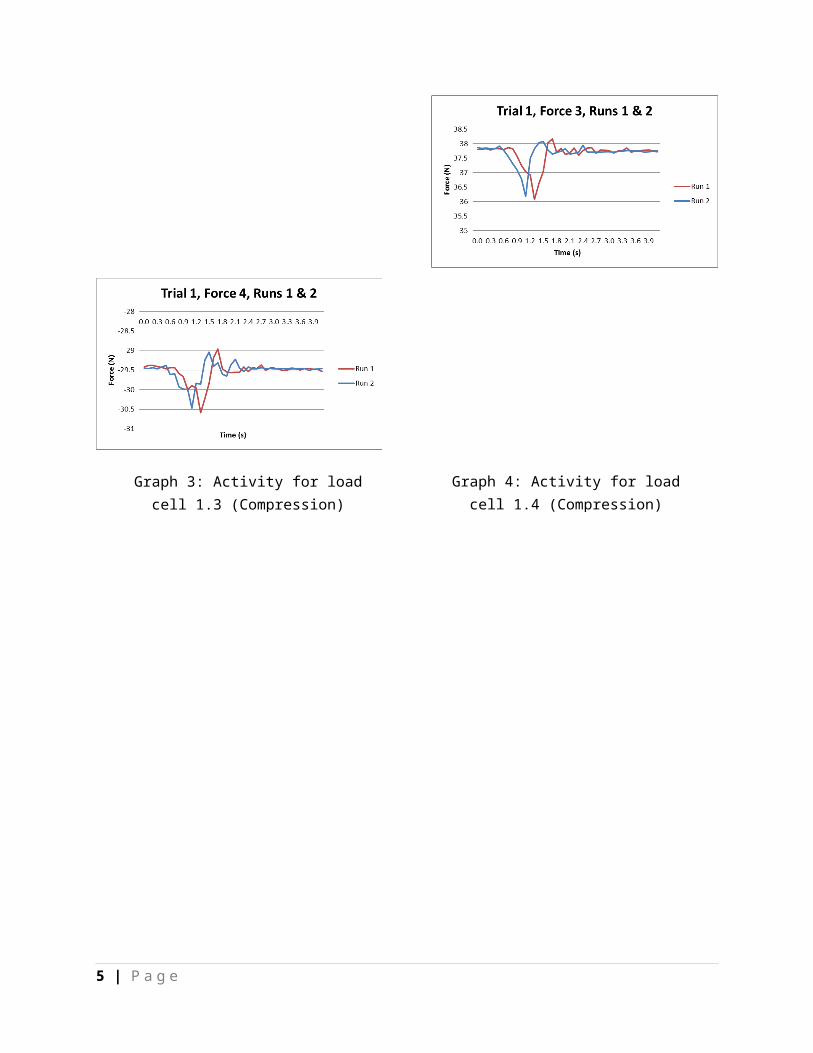
Graph 4: Activity for load cell 1.4 (Compression)
Graph 3: Activity for load cell 1.3 (Compression)
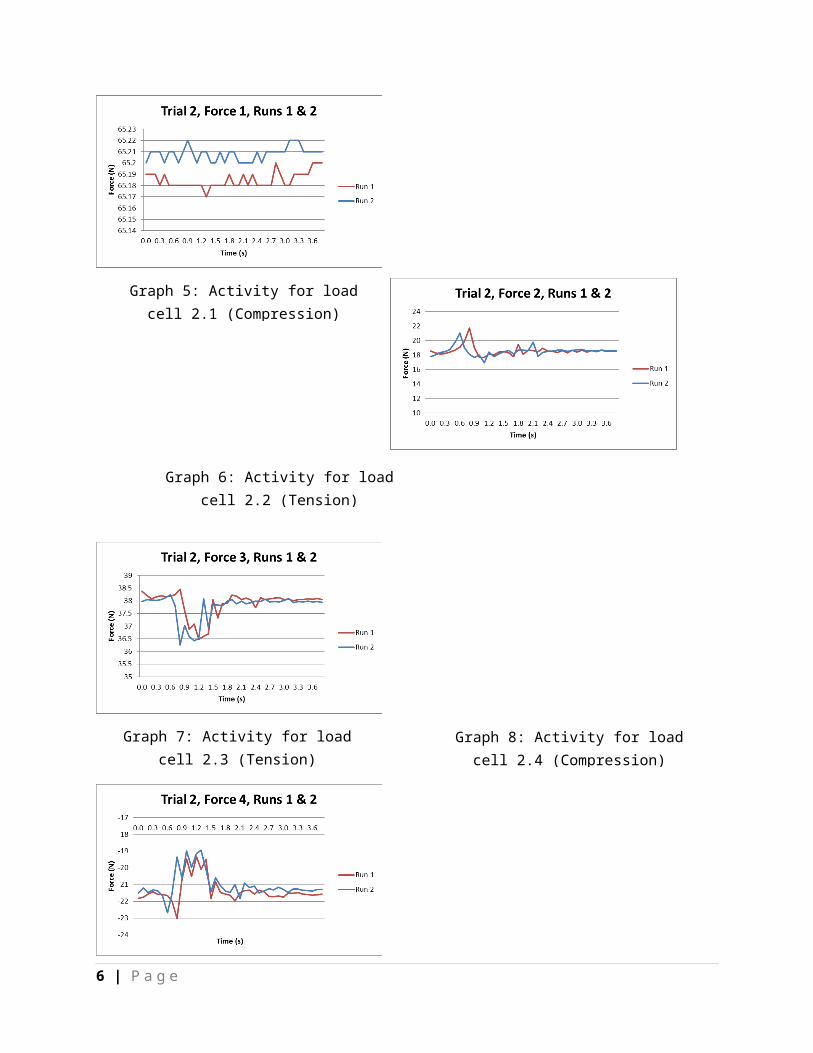
Graph 5: Activity for load cell 2.1 (Compression)
Graph 6: Activity for load cell 2.2 (Tension)
3 | P a g e
Graph 8: Activity for load cell 2.4 (Compression)
Graph 7: Activity for load cell 2.3 (Tension)
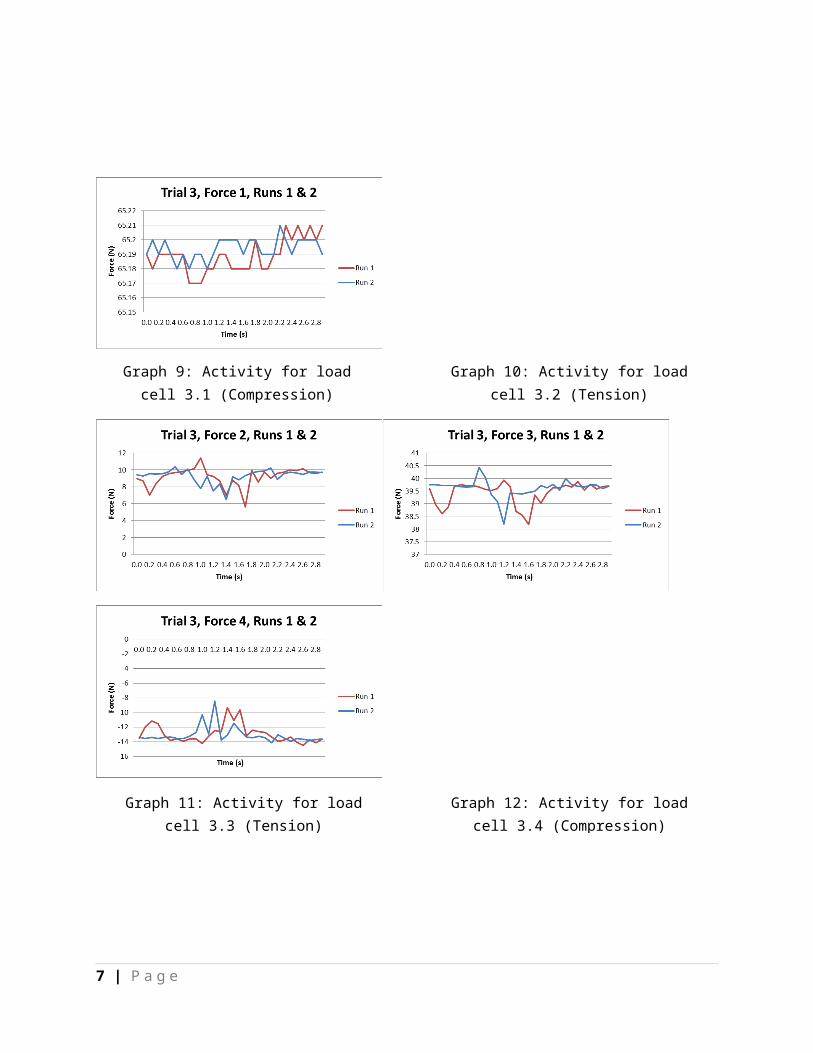
Graph 11: Activity for load cell 3.3 (Tension)
Graph 12: Activity for load cell 3.4 (Compression)
Graph 10: Activity for load cell 3.2 (Tension)
Graph 9: Activity for load cell 3.1 (Compression)
4 | P a g e
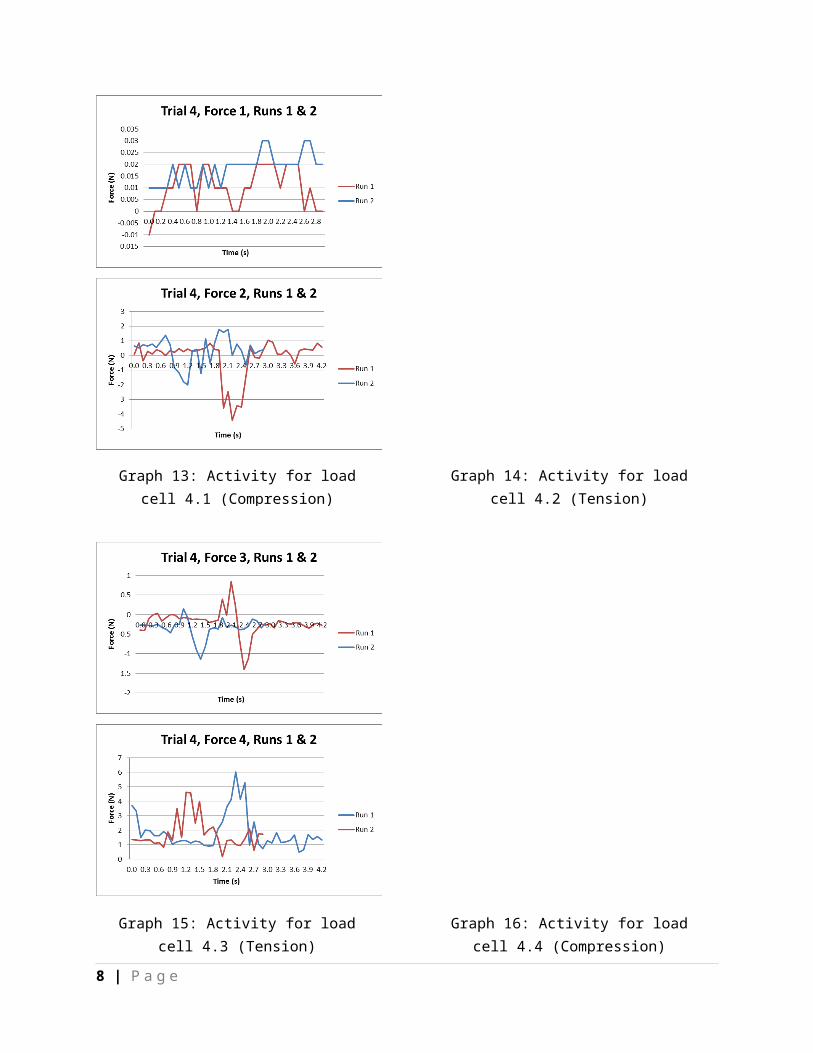
Graph 14: Activity for load cell 4.2 (Tension)
Graph 13: Activity for load cell 4.1 (Compression)
Graph 16: Activity for load cell 4.4 (Compression)
Graph 15: Activity for load cell 4.3 (Tension)
5 | P a g e
Graph 18: Activity for load cell 4.6 (Compression)
Graph 17: Activity for load cell 4.5 (Compression)
Graph 20: Activity for load cell 5.2 (Tension)
Graph 19: Activity for load cell 5.1 (Compression AND Tension)
Graph 22: Activity for load cell 5.4 (Tension)
Graph 21: Activity for load cell 5.3 (Compression)
6 | P a g e
Graph 23: Activity for load cell 5.5 (Compression)
Discussion:
All bridges must show symmetry, i.e., the forces on one side of the bridge must be the same as the forces
on the other side. Otherwise, the bridge will be unstable, and will fail. Trial 1 of this lab shows this. Load cell 1.1
and 1.2 were places at the same positions along the bridge, but on the 2 opposite sides of the bridge. Their graphs
were very similar and showed tension at the same point of time. The same goes for load cells 1.3 and 1.4. We were
able to thoroughly prove symmetry on the bridge.
As shown in figure 2, a truss bridge, forces on the beams at the bottom and the diagonal beams in the center
are tension forces. Compression exists on the beams at the top and the 2 diagonal beams on the outside. Based on
figure 2, the load cells that should have shown compression are 2.1 and 5.5. The slope is positive a majority of the
time in the graphs of these 2 load cells, showing compression. The beams at the bottom (2.2, 3.2, 4.2, 5.3 and 5.4)
all very clearly show a negative slope in the graph, indicating that there is tension. The graphs for the beams at the
top (2.4, 3.4 and 4.4) have a positive slope for a majority of the time, so there is compression. Another type of beam
tested was a beam that connected the 2 sides of the bridge, over the top. It showed a positive slope followed by a
negative slope, showing compression followed by tension, due to its placement.
The results of the graphs of the rest of the beams (the diagonals) weren’t all the same, like the previous
ones. There was some tension and some compression. This is because due to the triangular structure and the
distribution of forces, some of the diagonals are under compression while others are under tension. Overall, the
results from the graphs are as expected. I expected all of the diagonals to show tension more, but realized that they
showed both tension and compression.
Summary:
This lab showed the distribution of tension and compression in a Warren truss bridge. It showed how the
triangular structure helps the bridge carry loads easier by balancing out the tensile and compressive strength. The
beams at the top of the bridge show compression (positive slope) and the ones at the bottom show tension (negative
slope). As for the diagonal beams, some show compression, while other show tension because the triangular
structure distributes the force.
7 | P a g e
Works Cited
"Lecture 21 - Physic of Material." Lecture 21. N.p., n.d. Web. 25 Sept. 2012.
<http://www.ic.sunysb.edu/Class/phy141md/doku.php?id=phy141:lectures:21>.
"Model Bridge Design." Garrett's Bridges. N.p., n.d. Web. 26 Sept. 2012.
<http://www.garrettsbridges.com/design/warren-truss/>.
"Warren Truss." Bridgehunter.com: Historic Bridges of the United States. N.p., n.d. Web. 26 Sept. 2012.
<http://bridgehunter.com/category/tag/warren-truss/page2/>.
"David Guise | The Evolution of the Warren, or Triangular, Truss | The Journal of The Society For Industrial
Archeology, 32.2 | The History Cooperative." David Guise | The Evolution of the Warren, or Triangular,
Truss | The Journal of The Society For Industrial Archeology, 32.2 | The History Cooperative. N.p., n.d.
Web. 27 Sept. 2012. <http://www.historycooperative.org/journals/sia/32.2/guise.html>.
8 | P a g e
Related Documents