1 Breeding tomato for fruit production with urban sewage water By Shameem Raja M.Sc (Hons) Agriculture (Plant Breeding and Genetics) A thesis submitted in partial fulfillment of the requirements for the degree of Doctor of Philosophy IN Plant Breeding and Genetics UNIVERSITY OF AGRICULTURE FAISALABAD, PAKISTAN

Welcome message from author
This document is posted to help you gain knowledge. Please leave a comment to let me know what you think about it! Share it to your friends and learn new things together.
Transcript

1
Breeding tomato for fruit production with urban sewage water
By
Shameem Raja
M.Sc (Hons) Agriculture (Plant Breeding and Genetics)
A thesis submitted in partial fulfillment of the requirements for the degree of
Doctor of Philosophy
IN
Plant Breeding and Genetics
UNIVERSITY OF AGRICULTURE
FAISALABAD, PAKISTAN

2
To
The Controller of Examinations,
University of Agriculture,
Faisalabad.
We, the Supervisory Committee, certify that the contents and form of the thesis
submitted by Shameem Raja, Regd. No. 2003-ag-1879
have been found satisfactory and recommend that it be processed for the award of degree.
SUPERVISORY COMMITTEE:
Chairman :
(Prof. Dr. Asif Ali Khan )
Member :
(Dr. H. Masooma Naseer Cheema )
Member :
(Dr. Bilquees Fatima )

3
In the name of Allah, the most beneficent and the merciful.
DEDICATED
To
My loving Mother
Who taught me
The first word I spoke
The first alphabet I wrote
&
The first step I walked
May Allah bestow her a
Long Happy Life (Aameen)

4
ACKNOWLEDGEMENTS
Words are always lost whenever I want to say thanks to the Almighty ALLAH for
His unlimited blessings, favor and Rehmat. No script in any language of the world is fit to
express my heartiest gratitude for my ALLAH, the one, the creator, the eternal, the utmost
source of knowledge and the He;
“WHO TAUGHT WRITING BY THE PEN. TAUGHT MAN WHAT NOT.” (AL-
QURAAN; SURAH AL-ALAQ, Ver. No. 4 and 5)
How can I forget to acknowledge the ever-great personality of the world, Hazrat
Muhammad (PBUH) who has always been a role model for me in the way of knowledge?
With deep sense of acknowledgement, I would like to express my humble gratitude to
my worthy supervisor Prof. Dr. Asif Ali Khan for his dynamic supervision, intellectual vigor
and adroit guidance. His intelligible dissemination of knowledge helped me to understand the
science of plant Breeding and Genetics in its true sense. He is not only a spectacular teacher
for me but also a brilliant scientist. My work would not have seen the day light without his
constant encouragement and moral support.
I am also very grateful to Dr Masooma Naseer Cheema for her unstinted help in
conducting experiments and for providing me best educational and research facilities and a
great deal of knowledge. I am indebted to Dr. B. Fatima Usman (Horticulture) for providing
me great deal of knowledge.
My special thanks are reserved for my Lab fellows; Waqas Malik, Ihsan Karim and
Usman Aslam for their moral support, scientific discourse and lending me helping hands for
my research work.In the last but not least my heartiest gratitude is for my Husband, Mother
in law, father in law, dear sisters; Nasreen, Nasi, khutija, khursheed and Zubaida for their
selfless care, love and prayers throughout my educational career. I would like to pay
ineffable tribute to my Brother Ghulam Mhuammad whose desire and care always
empowered me to get this destination. My acknowledgement could never adequately express
obligation to my beloved Ammi Jan who has always been with me since the writing of ABC
to this dissertation along with her prayers, dreams and efforts.
5
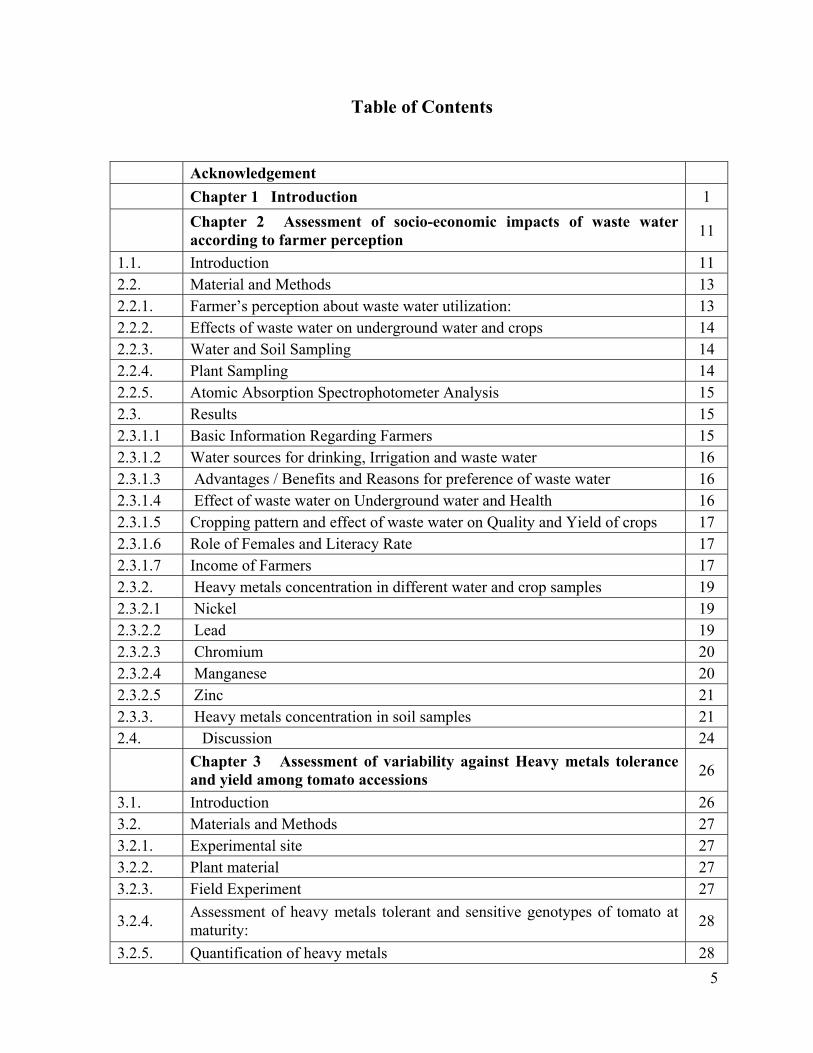
Table of Contents
Acknowledgement
Chapter 1 Introduction 1
Chapter 2 Assessment of socio-economic impacts of waste water according to farmer perception
11
1.1. Introduction 11 2.2. Material and Methods 13 2.2.1. Farmer’s perception about waste water utilization: 13 2.2.2. Effects of waste water on underground water and crops 14 2.2.3. Water and Soil Sampling 14 2.2.4. Plant Sampling 14 2.2.5. Atomic Absorption Spectrophotometer Analysis 15 2.3. Results 15 2.3.1.1 Basic Information Regarding Farmers 15 2.3.1.2 Water sources for drinking, Irrigation and waste water 16 2.3.1.3 Advantages / Benefits and Reasons for preference of waste water 16 2.3.1.4 Effect of waste water on Underground water and Health 16 2.3.1.5 Cropping pattern and effect of waste water on Quality and Yield of crops 17 2.3.1.6 Role of Females and Literacy Rate 17 2.3.1.7 Income of Farmers 17 2.3.2. Heavy metals concentration in different water and crop samples 19 2.3.2.1 Nickel 19 2.3.2.2 Lead 19 2.3.2.3 Chromium 20 2.3.2.4 Manganese 20 2.3.2.5 Zinc 21 2.3.3. Heavy metals concentration in soil samples 21 2.4. Discussion 24
Chapter 3 Assessment of variability against Heavy metals tolerance and yield among tomato accessions
26
3.1. Introduction 26 3.2. Materials and Methods 27 3.2.1. Experimental site 27 3.2.2. Plant material 27 3.2.3. Field Experiment 27
3.2.4. Assessment of heavy metals tolerant and sensitive genotypes of tomato at maturity:
28
3.2.5. Quantification of heavy metals 28

6
3.2.6. Statistical Analysis 29 3.3. Results 30 3.3.1. Analysis of Variance 30 3.3.2. Determination of heavy metals concentration 30 3.3.3. Classification and Selection of Genotypes against heavy metals tolerance 31 3. 3.4. Correlation Coefficient for metals uptake in different parts 33 3.3.5. Classification and Selection of Genotypes for yield related traits 33 3.4. Heavy Metals accumulation under Hydroponic Conditions 34 3.5. Discussion 49
Chapter 4 Assessment of genetic basis of Heavy Metals tolerance and yield related traits
52
4.1. Introduction 52 4.2. Material and Methods 53 4.2.1. Emasculation 53 4.2.2. Pollen collection 53 4.2.3. Pollination 53 4.2.4. Seed Extraction 54 4.2.5. Assessment of Plant material for genetic studies 54 4.3.5. Statistical Analysis 54 4.4.6. Heritability Estimate 55 4.4.7. North Carolina Design-II matting scheme 56 4.4. R Results 57 4.4.1. Analysis of Variance 57 4.4.2. Yield Related Traits 58 4.4.4. Heavy metals Tolerance 59 4.3. Discussion 64
Chapter 5 Assessment of Molecular basis of heavy metals tolerance 67
5.1. I Introduction 67 5.2. Material and Methods 70 5.2.1. Plant Growth 70 5.2.3. Sample Collection 70 5.2.4. Protocol for RNA Extraction 70 5.2.5. DNAase treatment 70 5.2.6. First strand cDNA synthesis 71 5.2.7. Primer Designing 71 5.2.8. Primer validation 71 5.2.9. Real Time quantitative expression analysis 71 5.2.10 Data Analysis 71

7
5.3. Results 73 5.4. Discussion 78
Chapter 6 Biochemical and Molecular Diagnosis of Salmonella enteric in waste water and tomato fruit
80
6. 1. Introduction 80 6.2. Material and Methods 81 6.2.2. Bacterial DNA isolation 84 6.2.3. Detection of Salmonella enteric through polymerase chain reaction 84 6.3.5 Gel electrophoresis 86 6.4. Results 86 6.3. Discussion 92 Chapter 7 92 General Discussion 92 Chapter 8 99 Summary 99 References 102 Appendix 122
8
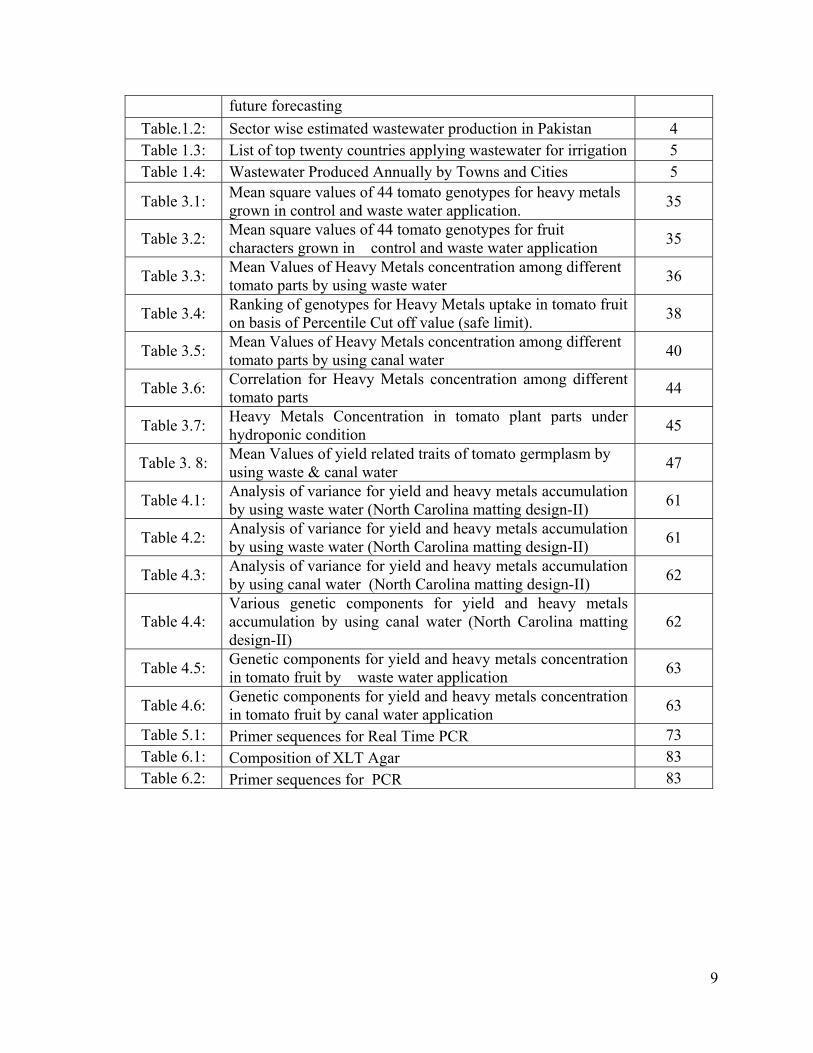
LIST OF TABLES
Table No. Title Page No. Table 1.1: Present status of Water Requirements and Availability in 4
9
future forecasting
Table.1.2: Sector wise estimated wastewater production in Pakistan 4 Table 1.3: List of top twenty countries applying wastewater for irrigation 5 Table 1.4: Wastewater Produced Annually by Towns and Cities 5
Table 3.1: Mean square values of 44 tomato genotypes for heavy metals grown in control and waste water application.
35
Table 3.2: Mean square values of 44 tomato genotypes for fruit characters grown in control and waste water application
35
Table 3.3: Mean Values of Heavy Metals concentration among different tomato parts by using waste water
36
Table 3.4: Ranking of genotypes for Heavy Metals uptake in tomato fruit on basis of Percentile Cut off value (safe limit).
38
Table 3.5: Mean Values of Heavy Metals concentration among different tomato parts by using canal water
40
Table 3.6: Correlation for Heavy Metals concentration among different tomato parts
44
Table 3.7: Heavy Metals Concentration in tomato plant parts under hydroponic condition
45
Table 3. 8: Mean Values of yield related traits of tomato germplasm by using waste & canal water
47
Table 4.1: Analysis of variance for yield and heavy metals accumulation by using waste water (North Carolina matting design-II)
61
Table 4.2: Analysis of variance for yield and heavy metals accumulation by using waste water (North Carolina matting design-II)
61
Table 4.3: Analysis of variance for yield and heavy metals accumulation by using canal water (North Carolina matting design-II)
62
Table 4.4: Various genetic components for yield and heavy metals accumulation by using canal water (North Carolina matting design-II)
62
Table 4.5: Genetic components for yield and heavy metals concentration in tomato fruit by waste water application
63
Table 4.6: Genetic components for yield and heavy metals concentration in tomato fruit by canal water application
63
Table 5.1: Primer sequences for Real Time PCR 73 Table 6.1: Composition of XLT Agar 83 Table 6.2: Primer sequences for PCR 83

10
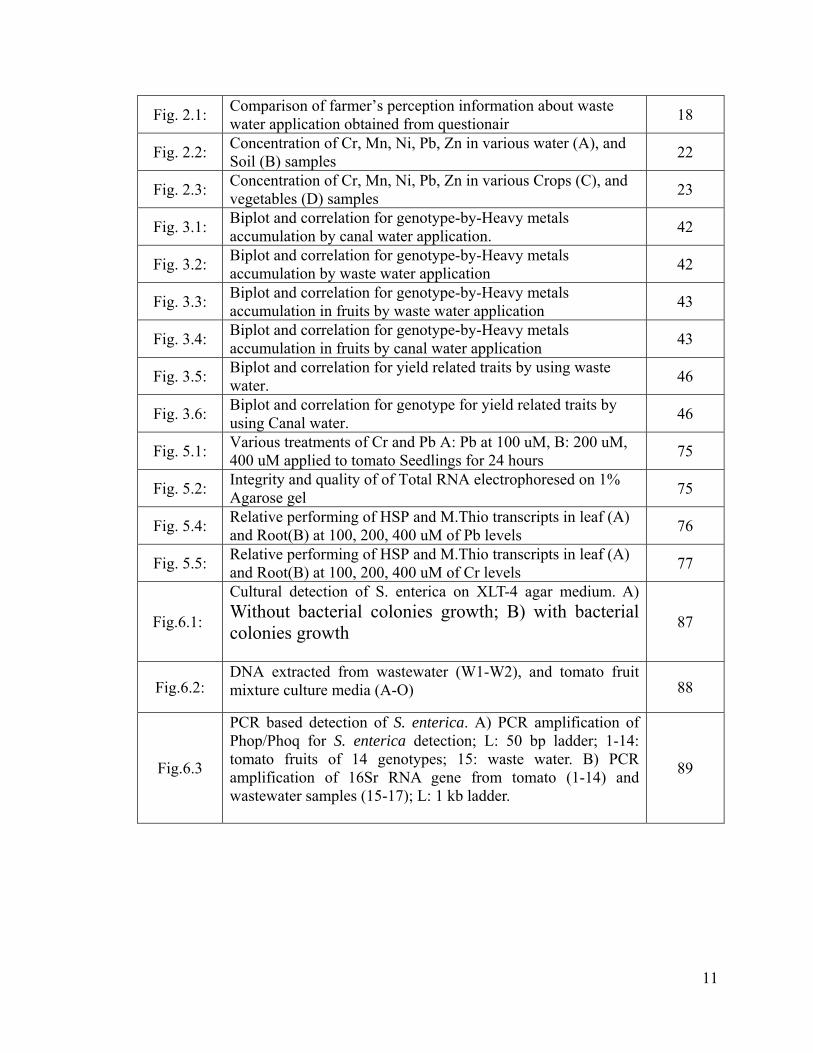
LIST OF FIGURES
Figure No.
Title Page No
11
Fig. 2.1: Comparison of farmer’s perception information about waste water application obtained from questionair
18
Fig. 2.2: Concentration of Cr, Mn, Ni, Pb, Zn in various water (A), and Soil (B) samples
22
Fig. 2.3: Concentration of Cr, Mn, Ni, Pb, Zn in various Crops (C), and vegetables (D) samples
23
Fig. 3.1: Biplot and correlation for genotype-by-Heavy metals accumulation by canal water application.
42
Fig. 3.2: Biplot and correlation for genotype-by-Heavy metals accumulation by waste water application
42
Fig. 3.3: Biplot and correlation for genotype-by-Heavy metals accumulation in fruits by waste water application
43
Fig. 3.4: Biplot and correlation for genotype-by-Heavy metals accumulation in fruits by canal water application
43
Fig. 3.5: Biplot and correlation for yield related traits by using waste water.
46
Fig. 3.6: Biplot and correlation for genotype for yield related traits by using Canal water.
46
Fig. 5.1: Various treatments of Cr and Pb A: Pb at 100 uM, B: 200 uM, 400 uM applied to tomato Seedlings for 24 hours
75
Fig. 5.2: Integrity and quality of of Total RNA electrophoresed on 1% Agarose gel
75
Fig. 5.4: Relative performing of HSP and M.Thio transcripts in leaf (A) and Root(B) at 100, 200, 400 uM of Pb levels
76
Fig. 5.5: Relative performing of HSP and M.Thio transcripts in leaf (A) and Root(B) at 100, 200, 400 uM of Cr levels
77
Fig.6.1:
Cultural detection of S. enterica on XLT-4 agar medium. A) Without bacterial colonies growth; B) with bacterial colonies growth
87
Fig.6.2: DNA extracted from wastewater (W1-W2), and tomato fruit mixture culture media (A-O) 88
Fig.6.3
PCR based detection of S. enterica. A) PCR amplification of Phop/Phoq for S. enterica detection; L: 50 bp ladder; 1-14: tomato fruits of 14 genotypes; 15: waste water. B) PCR amplification of 16Sr RNA gene from tomato (1-14) and wastewater samples (15-17); L: 1 kb ladder.
89
12
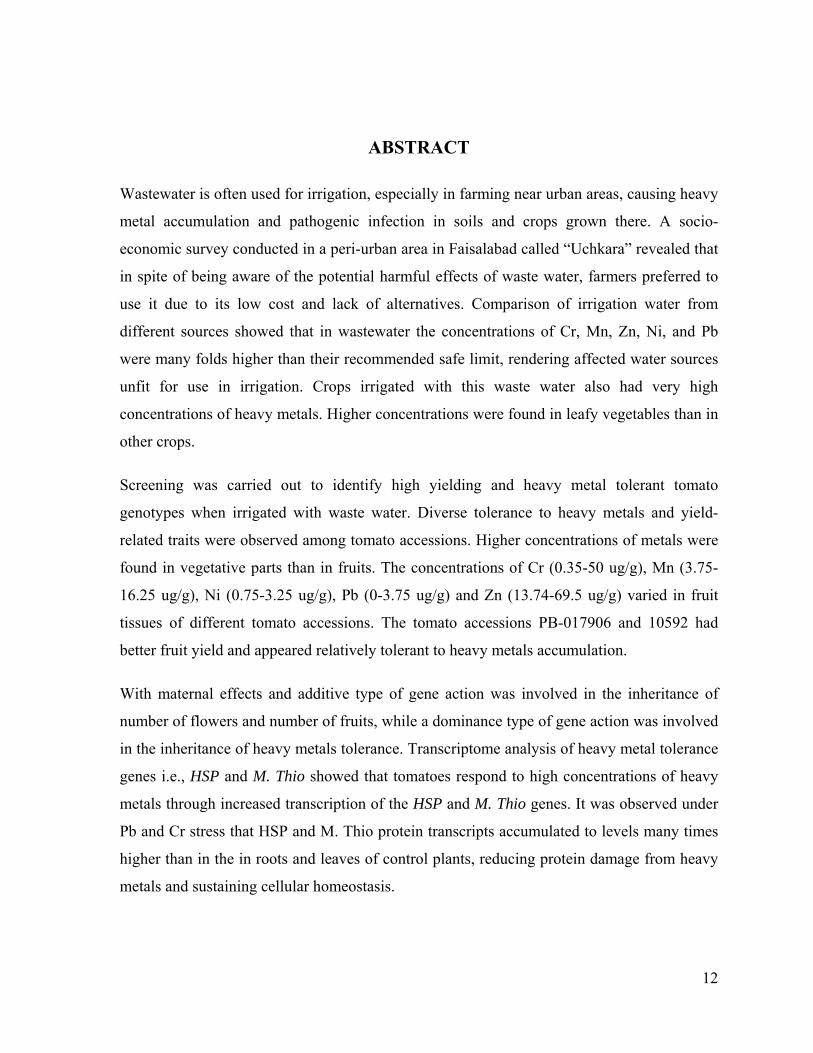
ABSTRACT
Wastewater is often used for irrigation, especially in farming near urban areas, causing heavy
metal accumulation and pathogenic infection in soils and crops grown there. A socio-
economic survey conducted in a peri-urban area in Faisalabad called “Uchkara” revealed that
in spite of being aware of the potential harmful effects of waste water, farmers preferred to
use it due to its low cost and lack of alternatives. Comparison of irrigation water from
different sources showed that in wastewater the concentrations of Cr, Mn, Zn, Ni, and Pb
were many folds higher than their recommended safe limit, rendering affected water sources
unfit for use in irrigation. Crops irrigated with this waste water also had very high
concentrations of heavy metals. Higher concentrations were found in leafy vegetables than in
other crops.
Screening was carried out to identify high yielding and heavy metal tolerant tomato
genotypes when irrigated with waste water. Diverse tolerance to heavy metals and yield-
related traits were observed among tomato accessions. Higher concentrations of metals were
found in vegetative parts than in fruits. The concentrations of Cr (0.35-50 ug/g), Mn (3.75-
16.25 ug/g), Ni (0.75-3.25 ug/g), Pb (0-3.75 ug/g) and Zn (13.74-69.5 ug/g) varied in fruit
tissues of different tomato accessions. The tomato accessions PB-017906 and 10592 had
better fruit yield and appeared relatively tolerant to heavy metals accumulation.
With maternal effects and additive type of gene action was involved in the inheritance of
number of flowers and number of fruits, while a dominance type of gene action was involved
in the inheritance of heavy metals tolerance. Transcriptome analysis of heavy metal tolerance
genes i.e., HSP and M. Thio showed that tomatoes respond to high concentrations of heavy
metals through increased transcription of the HSP and M. Thio genes. It was observed under
Pb and Cr stress that HSP and M. Thio protein transcripts accumulated to levels many times
higher than in the in roots and leaves of control plants, reducing protein damage from heavy
metals and sustaining cellular homeostasis.

13
PCR-based diagnostics showed that the waste water had S. enterica bacterium. In contrast,
tomato fruits were free of S. enterica contamination in 14 out of 16 (87.5%) tomato
accessions, showing that most of the time S. enterica was physiologically blocked from
gaining access to the tomato fruit.
Although waste water application is the need of time the resulting information from this
research will be helpful in the development of low metal-accumulators as well as S. enterica
tolerant tomato genotypes suitable for heavy metals and bacterial problems by the use of
wastewater.

14
Chapter 1
INTRODUCTION
In Pakistan, main water resources are surface water (rainfall, river flows, and glaciers) and
groundwater. More than 95% of the country’s water resources are used for agriculture, which
contributes 24 % of total GDP and 60% of the country’s population, depends on agriculture
and its allied industries. The cultivated area in Pakistan has increased from 14.70 Mha in
1947 to 23.5 Mha in 2008, while water availability is decreasing (Asif et al., 2009). Demand
for water by the agricultural sector is 210 BCM in contrast to supply of only 190 BCM, and it
has been estimated that this 20 BCM shortfall will increase to 27 BCM by 2015 (Hussain et
al., 2011). Per capita water availability decreased from 5,260 m3 in 1951 to 1,050 m3 in 2008.
Water needs and available resource in Pakistan (Table 1.1) showed the alarming rate of
decrease in per capita water consumption, largely due to river flow reduction and population
increase. As a result of surface water shortage, dependency on groundwater has increased.
However, groundwater is of inferior quality, expensive and unaffordable by poor farmers.
The scarcity of fresh water is a major issue regarding agriculture throughout the world. As an
alternate, application of urban waste water for irrigation has been practiced since long,
particularly for olericulture in urban and peri urban areas of the world (Ahmed et al., 2004;
Asano et al., 2007). In 50 cities of Asia, Latin America and Africa Three-fourth of the cities
are irrigated with waste water (Mustafa, 2002; Bashmakov et al., 2005).In Pakistan due to
unavailability of canal water the use of waste water is becoming a practice and about 30,000
ha are being irrigated with untreated waste water mainly for fodder and vegetables
cultivation (Khan et al., 2003; Anonymous, 2006). Estimated waste water produced in
Pakistan by different sectors is given in Table 1.2. In peri urban areas of Pakistan, vegetables
are grown mainly by waste water without any treatment, which resulted in a number of
drawbacks like metals accumulation in agricultural land and crops (Mussarat et al., 2007).
Even canal water is not safe with respect to heavy metals pollution (Aftab et al., 2011).
Water discharged from domestic or industrial usage and containing waste products is called
wastewater. Domestic waste water is discharged from institutions, households, and
commercial buildings. The waste products may be in liquid or solid form, and they can be
15
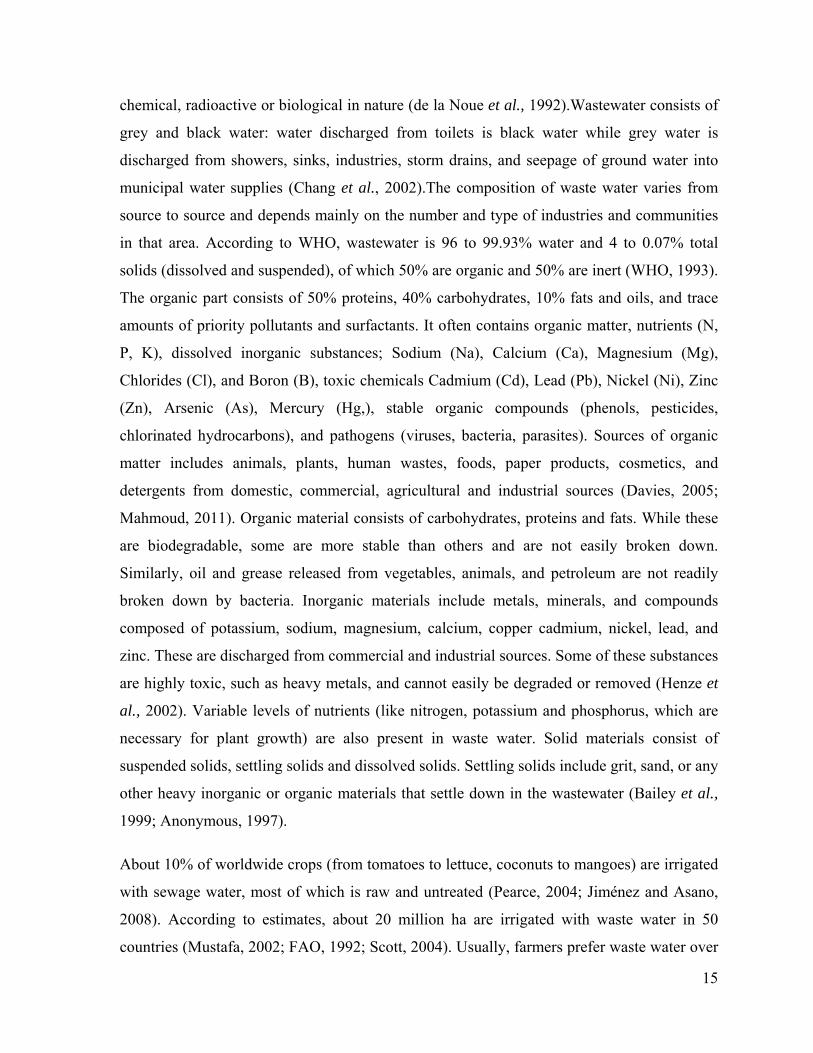
chemical, radioactive or biological in nature (de la Noue et al., 1992).Wastewater consists of
grey and black water: water discharged from toilets is black water while grey water is
discharged from showers, sinks, industries, storm drains, and seepage of ground water into
municipal water supplies (Chang et al., 2002).The composition of waste water varies from
source to source and depends mainly on the number and type of industries and communities
in that area. According to WHO, wastewater is 96 to 99.93% water and 4 to 0.07% total
solids (dissolved and suspended), of which 50% are organic and 50% are inert (WHO, 1993).
The organic part consists of 50% proteins, 40% carbohydrates, 10% fats and oils, and trace
amounts of priority pollutants and surfactants. It often contains organic matter, nutrients (N,
P, K), dissolved inorganic substances; Sodium (Na), Calcium (Ca), Magnesium (Mg),
Chlorides (Cl), and Boron (B), toxic chemicals Cadmium (Cd), Lead (Pb), Nickel (Ni), Zinc
(Zn), Arsenic (As), Mercury (Hg,), stable organic compounds (phenols, pesticides,
chlorinated hydrocarbons), and pathogens (viruses, bacteria, parasites). Sources of organic
matter includes animals, plants, human wastes, foods, paper products, cosmetics, and
detergents from domestic, commercial, agricultural and industrial sources (Davies, 2005;
Mahmoud, 2011). Organic material consists of carbohydrates, proteins and fats. While these
are biodegradable, some are more stable than others and are not easily broken down.
Similarly, oil and grease released from vegetables, animals, and petroleum are not readily
broken down by bacteria. Inorganic materials include metals, minerals, and compounds
composed of potassium, sodium, magnesium, calcium, copper cadmium, nickel, lead, and
zinc. These are discharged from commercial and industrial sources. Some of these substances
are highly toxic, such as heavy metals, and cannot easily be degraded or removed (Henze et
al., 2002). Variable levels of nutrients (like nitrogen, potassium and phosphorus, which are
necessary for plant growth) are also present in waste water. Solid materials consist of
suspended solids, settling solids and dissolved solids. Settling solids include grit, sand, or any
other heavy inorganic or organic materials that settle down in the wastewater (Bailey et al.,
1999; Anonymous, 1997).
About 10% of worldwide crops (from tomatoes to lettuce, coconuts to mangoes) are irrigated
with sewage water, most of which is raw and untreated (Pearce, 2004; Jiménez and Asano,
2008). According to estimates, about 20 million ha are irrigated with waste water in 50
countries (Mustafa, 2002; FAO, 1992; Scott, 2004). Usually, farmers prefer waste water over

16
canal and underground water because of its low cost and high levels of nitrates and
phosphates. This preference, along with the lack of availability of other water sources makes
banning its application impossible. Wastewater is often used untreated because of the high
cost of treatment (Shuval, 1990). Twenty countries account for the largest volumes of
wastewater used for irrigation (Table 1.3). Mexico is the leading user of wastewater,
followed by Jordan and Pakistan (Haruvy, 1997). In suburban areas of Pakistan, mostly
untreated waste water is used for about one quarter of all vegetable production (Zafar, 2003).
In Faisalabad 129 million cubic meter per year (106 m3/y) of wastewater is produced and out
of this total waste water only 25.6 percent is treated to primary level while rest is discharged
to River Ravi, River Chenab and vegetable farms (Table 1.4).Because wastewater treatment
is expensive, the percentage of wastewater that is treated depends mainly on the average
income level of a given country (Scott et al., 2004). In high-income countries like in North
America, about 90% of all wastewater is treated to secondary or tertiary levels. In the
European Union, over 68% of wastewater is treated on average, but the actual treatment
percentage varies among countries (Bartone, 1997). In low income countries wastewater used
for irrigation largely goes untreated (Stephenson et al.,2000; Rowan et al., 2003). According
to WHO standards, the cost of water treatment for a population of 1 million has been
estimated at Rs 750 million annually. However, under standards of the United States
Environmental Protection Agency (USEPA), this cost doubles.
Therefore the main reason behind the use of untreated wastewater for irrigation is the lack of
technology and funding for treatment. Many farmers use untreated wastewater simply due to
a lack of freshwater facilities and wastewater treatment plants (Henze, 1997; Henze,2002;
Wiesmann et al.,2007). Wastewater application has resulted in variety of harmful effects on
human health, crops, soil, and underground water as well as on ecological, natural, social and
property values. Along with negative effects, there are some positive impacts of waste water
application in Agriculture.. It adds substantial quantities of N, P and K to soil, ranging from
116 to 195 kg/ha, 7 to 21 kg/ha and 108 to 249 kg/ha respectively. For normal plant growth,
these quantities of N and K are sufficient while levels of P should be supplemented. It has
been estimated that up to 2030 waste water application will add 1,110 kg ha-1 of N, 1,580 kg
ha-1 of P and K into soil per cropping season (Ensink et al., 2002). The presence of these
nutrients and micronutrients can help to lessen the cost of fertilization which resulted in

17
reducing the cost of production by 10-20 percent. One of the other advantages of waste water
application is that it reduces the pollution of rivers, canals and other water bodies.
Table.1.1: Present status of Water Requirements and Availability in future forecasting
Year 2000 2013 2025
Population (Million) 148 207 267
Water Requirement
Irrigation 143.1 206.4
Non-irrigation 5.9 8.7
Total Requirements 149.0 215.1 277.4*
Water Availability
Total Surface and
Groundwater 108.7 107.3 126.6
Shortfall 40.3 107.8 150.8
Source: Afzal, 1996
Table 1.2: Sector wise estimated wastewater production in Pakistan
Source: Pakistan’s Wetlands Action Plan, 2000, prepared by NNCW and WWF
Sr. No.
Source Volume
106 m3 y-1 Percent %
1 Industry 395 6
2 Commercial 266 5
3 Urban residential 1,628 25
4 Rural residential 3,059 48
5 Agriculture 1,036 16
Total 6,414 100

18
Table 1.3: List of top twenty countries applying wastewater for irrigation
Sr. No Country Wastewater used for
irrigation (m3/d) Sr. No Country
Wastewater used for
irrigation (m3/d)
1 Mexico 4,493,000 11 Iran 422,000
2 Egypt 1,918,000 12 Chile 380,000
3 China 1,239,000 13 Jordan 225,000
4 Syria 1,182,000 14 UAE 200,000
5 Spain 932,000 15 Turkey 137,000
6 USA 911,000 16 Argentina 130,000
7 Israel 767,000 17 unisia 118,000
8 Italy 741,000 18 Libya 110,000
9 Saudi
Arabia 595,000 19 Qatar 80,000
10 Kuwait 432,000 20 Cyprus 68,000
Source: Jiménez and Asano, 2008.

19
Table 1.4: Wastewater Produced Annually by Towns and Cities
Source: Master Plan for Urban Wastewater (Municipal and Industrial) Treatment Facilities in Pakistan. Final
Report, Lahore: Engineering, Planning and Management Consultants, 2002.
City Urban
population
(1998
census)
Total
wastewater
produced (106
m3/y)
% of
Total
% of
Treated
Receiving water Body
Lahore 5,143,495 287 12.5 0.01 River Ravi, irrigation canals,
vegetable farms
Faisalabad 2,008,861 129 5.6 25.6 River Ravi, River Chenab and
vegetable farms
Gujranwala 1,132,509 71 3.1 - SCARP drains, vegetable farms
Rawalpindi 1,409768 40 1.8 - River Soan and vegetable farms
Sheikhupura 870,110 15 0.7 - SCARP drains
Multan 1,197,384 66 2.9 - River Chenab, irrigation canals
and farms
Sialkot 713,552 19 0.8 - River Ravi, irrigation canals
and farms
Karachi 9,339,023 604 26.3 15.9 Arabian Sea
Hyderabad 1,166,894 51 2.2 34.0 River Indus, irrigation canals
and SCARP drains
Peshawar 982,816 52 2.3 36.2 Kabul River
Other 19,475,588 967 41.8 0.7 -
Total Urban 43,440,000 2,301 100.0 7.7 -

20
The improved soil fertility increased crop yield and the range of crops that can be irrigated in
arid and semi-arid areas (FAO, 1992; Jimenez, 2005; Qadir et al., 2010).
Meanwhile, the long term application of wastewater has resulted in the accumulation of salts,
dissolved solids, nutrients and chemicals (including heavy metals) in the soil, all of which
affects crop quality and yield. It has also resulted in the contamination of underground water
due to leaching (Bond, 1999; Hussain et al., 2001). Such long term application has resulted
in problems related to salinity, heavy metals, and pH, which consequently have reduced soil
productivity and crop yield. Unfavorable soil pH causes imbalances of micronutrients, which
can create habitats for harmful microorganisms (Mapanda et al., 2007; Al-Lahham et al.,
2003).
The excess of N and P levels usually resulted in unnecessary vegetative growth, weed
growth, lodging, delayed ripening and reduced crop yield (Asano and Pettygrove, 1987;
Murtaza et al., 2010). Such effects of excessive N have been seen in tomatoes, potatoes,
citrus and grapes (Bouwer and Idelovitch, 1987). It also resulted in algal blooms and other
excessive aquatic plant growth, which deplete oxygen levels in water bodies and adversely
affect aquatic life. The main risk of untreated wastewater application to consumers’ health is
exposure to microbes and chemicals. Wastewater can contain disease-causing viruses,
protozoa, bacteria, and helminthes from discharges of hospitals, farms, houses, food
processing plants, and schools (Rincón and Pulgarin, 2005). These excreta-related diseases
can be spread to persons applying the wastewater and to consumers of uncooked foods that
have been irrigated with wastewater. Consumption of such foods is one mode of transmission
of these pathogens (Bitton, 2005). Viruses in waste water, such as adenoviruses,
enteroviruses (including poliovirus), hepatitis A virus, reoviruses, norovirus and rotavirus
can infect a host’s intestinal tract later may be passed in feces (Payment et al., 2001). Some
bacteria present in wastewater are essential, non-pathogenic species required for proper
functioning of the intestinal tract (Chang, 2002). Some bacteria can cause diseases, including
diarrhea (Salmonella and Campylobacter), bacillary dysentery (Shigella), typhoid fever
(Salmonella typhi) and cholera (Vibrio cholera) (Laitinen et al., 1994). Bacterial diseases like
diarrhea and cholera are often transmitted through wastewater-irrigated raw crops, such as
salad vegetables, which are eaten uncooked (Shuval et al., 1986). One g of human feces may
contain ~109−1011 bacteria and one liter of wastewater may contain 105 bacteria (Feachem et

21
al., 1983). Several species of pathogenic protozoa can also be present in waste water, such as
Entamoeba histolytica causing amebic disentery, and Cryptosporidium parvum, C. hominis,
and Giardia lamblia, which cause severe diarrhea (Wagner et al., 2002). One liter of waste
water can have between 10 and 103 protozoa along with various intestinal worms such as
Trichuris trichiura (whipworm), Ascaris lumbricoides (roundworm), Necator americanus,
and Ancylostoma duodenale (hookworm) and the cestode worms Taenia solium and T.
saginata (the beef and pork tapeworms). Eggs of all these helminths can be present in
wastewater (WHO, 2008).
Some heavy metals (Cu, Zn, Mn, Ni, Fe, Mo,Co) found in wastewater are essential at low
concentration (Salt et al., 1998; Parelta et al., 2000). These are required for plant and human
enzymes, proteins (metallothionin), and cellular structures, such as chloroplasts (Babula et
al., 2008; Kennedy and Gonsalves, 1989; Ren et al., 1993). Other heavy metals (V, Co, W,
Cr, As, Hg, Ag, Sb, Cd, Pb, U) are nonessential and cause toxicity, damaging plant growth
and development even at low concentrations (Breckle, 1991; Nies, 1999). High levels of both
essential and non-essential heavy metals can result in failure of plant growth and
development (Monni et al., 2000; Blaylock and Huang, 2000). The main sources of heavy
metal pollution are industrial waste, fertilizers, automobiles, and minerals (Opeolu et al.,
2010). Discharge of industrial waste into water bodies used for irrigation resulted in
accumulation of heavy metals in soil and crops, and the food chain as a whole, causing
serious threats to human health. For plants, different heavy metals have different permissible
levels as per WHO & FAO (Ladipo et al., 201). These are Zn (60), Pb (0.3), Cu (40), Cr (2),
Cd (0.2), Mn (500), and Ni (68) mg/kg dry weight (William et al., 2011; Abdul et al., 2011).
The toxic ranges for metals varies by crop, e,g., Pb (3-20), Zn (60-400), Cr (0.5- 10), Ni (1-
20), Mn (30) mg/kg (Mami et al., 2011). At lethal concentrations, both essential and non-
essential heavy metals disrupt cell structure and inhibit plant growth by reducing
physiological and biochemical activities (Peralta et al., 2000; Chojnacka et al., 2005). Heavy
metals affect organisms by binding with ligands containing nitrogen, sulfur, oxygen groups,
and also with active sites of enzymes. This inhibits the enzymes to function properly
especially metallo enzymes, due to the replacement of essential elements like Ca, Mg, Fe,
Mo and P through chemical similarity and competition (Babula et al., 2008). Similarly,
heavy metals result in the formation of free radicals and reactive oxygen species, (Pietrini et

22
al., 2003; Milone et al., 2003), which affect cell and organelle membrane permeability and
disturb electron transport, anchoring points for proteins, ATP generation, solute transport, ion
channels, and carrier proteins (William, 1976). As roots are the first plant part exposed to
heavy metals, root elongation, root depth, number of root hairs, and root structure are all
severely affected (Patterson and Olson, 1983; Minnich et al., 1987; Foyetal., 1995; Ren et
al., 1993). Subsequently, heavy metal stress can cause curling and rolling of young leaves,
inhibition of lateral branches, collapse of growing points, small dark green leaves, death of
leaf tips, late maturity, reduced transpiration, reduced uptake of nutrients and water and
stunted stem growth (Taylor and Foy, 1985; Zhu and Alva, 1993; Brune et al., 1994; Lee et
al., 1996; Sullivan et al., 1997: Choi et al., 1996). The photosynthetic activity of plants is
also affected by heavy metals stress. As Mn is the structural component of chlorophyll, some
of other heavy metals replace Mn and Mg, resulting in the disruption of chlorophyll structure,
which leads to photosynthesis reduction(van Assche and Clijsters, 1986; Ouzounidou et al.,
1992; Luna et al., 1994; Ouzounidou et al., 1994,). In the same way, heavy metals can result
in calcium and phosphorus deficiency or reduced transport within plants, thus affecting the
active groups of ADP and ATP. Heavy metals stress can also lead to chromosomal
aberrations and inhibition of cell division (Chakravarty and Srivastava, 1992; Arduini et al.,
1995). All of these disorders cause poor plant growth and development.
Similarly high concentration of heavy metals results in serious problems to human health e.g.
cadmium results in itai itai disease, while mercury is related to minamita disease, and other
heavy metals are related to heart, respiratory, and central nervous system problems (Mukesh,
2008; Martin, 2009).
When waste water treatment is not affordable, waste water can still be used by adopting some
precautionary measures. By use of different chemical, physical or biological management
practices, the heavy metals in contaminated soil can be remediated for agricultural purposes
(McEldowney, 1993). One of these practices is the application of Farm Yard Manure FYM
alone and in combination with inorganic fertilizers, which is a cost effective technique for
reducing the availability of heavy metals (Singh, 2011). Other methods are the use of
removing metal contaminated soil and use it in the landfills (McNeil 1992; Elliott, 1989), use
of lime for increasing pH and thus immobilizing heavy metals (Wills, 1988), EDTA
treatment to remove heavy metals from soil by leaching them into groundwater. Soil dilution
23
with clean soil as well as deep plugging to mix top soil with deeper soil, soil washing and
extraction of heavy metals are also alternatives (Musgrove, 1991). Of the above mentioned
methods, the most effective and cheapest is the use of non-edible, fast-growing plants with a
tolerance for heavy metals for phytoremediation (Lan et al. 1997). Over 400 vascular plants
have been determined to be hyperaccumulating species suitable for phytoremediation
(Roosens et al., 2003). One of these is Thlaspi caerulescens, which can tolerate up to 3,000
ug/g dry weight of Cd and 40,000 ug/g of Zn in its shoots (Brown et al., 1995). One of the
solutions to this problem is the development of the transgenic plants that have increased
resistance to heavy metals and greater uptake rates. For example, the ZntA gene (Zinc
Tolerance A gene) has been transferred from Arabidopsis to other plants for improved
tolerance of Pb and Cd (Joohyun et al., 2003). Another possible solution is the use of low
metal-accumulators genotypes of a given crop with reduced rates of uptake of heavy metals
into the desired edible part.
As waste water application is the result of the unavailability of surface water, this study was
conducted to determine the socio-economic impacts of waste water application from the
farmers’ perspective. To determine the suitability of waste water for crop irrigation in
relation to heavy metals concentration, wastewater and surface water used for irrigation in
Pakistan were analyzed for different heavy metals concentrations. In addition, different crops
and vegetables irrigated with waste water were analyzed for heavy metals content. Different
accessions of tomato were screened against heavy metals (Ni, Mn, Zn, Cr, Pb) stress to test
the genetic potential for heavy metals tolerance.
Molecular and biochemical diagnosis of wastewater and various genotypes of tomato fruits
were carried out to establish the presence and transmission of Salmonella enterica from root
to fruit. The objectives of this study are to
Determine the suitability of waste water irrigation for crop cultivation with present
state of practices and management.
Evaluate various tomato genotypes for their tolerance to heavy metal contaminated
irrigation water.
Determine the genetic and molecular basis of heavy metal tolerance.
Trace the transmission of S. enterica to tomato fruit by diagnostic tools.

24
Chapter 2
ASSESSMENT OF THE SOCIO-ECONOMIC IMPACTS OF WASTE-
WATER IRRIGATION FROM THE FARMER’S PERSPECTIVE
2.1. Introduction
Water scarcity is a critical problem for crop production in dry areas all over the world. Where
water is scarce, waste water is often used for irrigation. This practice was first reported in
Melbourne, Australia, where sewage farms were established in 1897 (Shuval, 1991). In
Pakistan two main sources of water are used for irrigation: canal and ground water (Mustafa
et al., 2002). Due to the increasing scarcity of surface water, the dependency on groundwater
has increased. However, not only is groundwater expensive, it is largely of inferior quality
with respect to heavy metals pollution. One of the alternate sources for irrigation therefore is
wastewater. In developing countries, about 80% of wastewater is used for irrigation (Mara
and Cairncross, 1989; Cooper, 1991). Worldwide, 20 million ha in 50 countries are irrigated
with urban waste water (Scott et al., 2004). In Pakistan about 30% of waste water is directly
used to irrigate around 32,500 ha (Ensink et al., 2004), while 64% is discharged into rivers
without any treatment (FAO, 1992). It has been estimated that of the total wastewater
produced in Pakistan, about 8% is treated through sedimentation while only 1% is treated
with bacterial digestion of organic matter (Pak-SCEA, 2006). In Khyber Pakhtun Khawh
(KPK) province, 0.701 × 10⁹ m3/yr of industrial effluents containing toxic pollutants is
discharged into the River Kabul (SOE, 2005). In Sindh, only two sugar mills out of 34 treat
their wastewater, while in Lahore only 3 out of 100 industrial enterprises do so. Although
70% of Pakistan’s industry is located in Karachi, none of the treatment plants in that region is
in working order (UNIDO, 2000). Therefore, in KPK, Sindh, Lahore, and Karachi, all
wastewater produced is discharged directly without any treatment.
Soil application of untreated wastewater raises the values of electric conductivity (EC), total
dissolved solids (TDS), sodium adsorption ratio (SAR), residual sodium carbonate (RSC)
and heavy metal concentrations compared with the National Environmental Quality
Standards (NEQS) for soil Wastewater used for irrigation has the benefits of conserving
water and nutrients, reducing the pollution of rivers and canals, providing micronutrients,

25
organic matter, all required nitrogen, and much of the required phosphorus and potassium for
normal crop production (FAO, 1992). With the use of wastewater, the cost of crop
production can be reduced by 10-20%. However, with these advantages waste water
application has a number of drawbacks, including the contamination of groundwater, a build-
up of chemicals (heavy metals) in the soil, and the creation of habitat for harmful
microorganisms (Mapanda et al., 2007; Al-Lahham et al., 2003). The main drawback of
waste water application is the accumulation of heavy metals (Henze et al., 2001). These
heavy metals enter the food chain and can result in a number of disorders to human health
when concentrations exceed safety limits (Martin, 2009). Opinions are divided about the
value of wastewater for irrigation. Some studies have found that fields irrigated for 8-10
years with wastewater were not salinized (Abdul et al., 1996) while opponents claimed that
use of wastewater would be an act of criminal negligence due to its health effects and should
be banned (Sial et al., 2005).
Vegetables are an important part of the human diet, providing fiber for digestion, increasing
appetite, and counteracting constipation and acids produced by digestion of fats (Robinson,
1990). Vegetables are high in carbohydrates, proteins, vitamins A, B, and C, and minerals
(Hanif et al., 2006). In Pakistan, about 0.22 million ha are under vegetable cultivation
(excluding potatoes), accounting for 2.88 million tons of production in 2002-2003 (ASP,
2002-2003). Due to shortage of water, wastewater is used to irrigate vegetables, usually
without any prior treatment, on farms near urban areas in Pakistan (Qadir and Gafoor, 1997).
Farmers in general do not have accurate information about the drawbacks of this practice,
and have a different perspective on its application (Zafar and Akhtar, 2003). About 26% of
all vegetables grown in Pakistan are irrigated using untreated wastewater, and locally
produced vegetables are about 60% cheaper than imported vegetables due to lower costs for
fertilizer and transportation to markets (Ensink et al., 2004). As no alternative to wastewater
irrigation exists in some areas of Pakistan, some precautionary measures, such as mixing
wastewater with freshwater before application, should be taken to reduce the drawbacks of
the use of wastewater (Mahmood and Maqbool, 2006). This study sought to answer the
following questions:
What is the farmer’s perception about the use of wastewater?

26
What is the concentration of heavy metals in underground water, wastewater, and
canal water?
Does variability exist among different crops irrigated with wastewater for their ability
in heavy metals uptake and accumulation?
2.2. Material and Methods
2.2.1. Base line survey:
2.2.1.1. Farmer’s perception about waste water utilization:
A survey was conducted in peri urban area of Faisalabad (Uchkara) located in north of
Faisalabad, having a human population of 12,000 where untreated wastewater irrigates more
or less 10,000ha (Mahmood and Maqbool, 2006). Main objective of this survey was to gather
information about farmer’s awareness about the harmful effects of waste water, reasons of
waste water application and perception of farmers about socio economic impacts of waste
water. Quartile method of survey as described by Vasconcellos et al (2003) was adopted for
data collection regarding health and socio economic impacts of waste water application. In
Quartile method of survey whole area was divided into four equal groups, each group
includes 25 members and interviewed regarding following questions. The farmers were
selected randomly for interview from all categories of different ages. Complete questioner
performa is given in appendix 2.1
i. Age of Farmers
ii. Waste water application History
iii. Income of Farmers
iv. Water for Drinking
v. Irrigation water
vi. Source of waste water
vii. Is waste water beneficial / harmful
viii. Reasons of waste water application
ix. Preference for waste water
x. Impact of waste water on ground water
27
xi. Disease Caused
xii. Industries situated in targeted area
xiii. Cropping Pattern
xiv. Impact of waste water on crop stand
xv. Education / Sex
2.2.2. Effects of waste water on underground water and crops:
In the target area waste water was being used for irrigation from a long period of time. Heavy
metals types and concentrations were determined in different water samples i.e. waste water
used for irrigation in Uchkara, underground water of Uchkara, waste water used for irrigation
in UAF and canal water. Mainly Cr, Mn, Zn, Ni and Pb heavy metals were observed in these
water samples therefore crops and vegetables grown in targeted area were also analysed for
these metals.
2.2.3. Water and Soil Sampling
Waste water used for irrigation in Uchkara, UAF waste water, canal water and underground
water samples were collected in plastic bottles from three sites for heavy metals
concentration determination. Soil sampling was carried at two layers, 0-20 (upper layer) cm
and 20-40cm (lower layer) from three different locations. About 1kg of soil sample was
collected from each layer at each point, air-dried for 7 days, crushed and sieved to obtain< 2
mm fraction. From this soil 25 g dried soil sample was mixed with 50 mL of ammonium
bicarbonate, DTPA (diethylene triamin penta acetic acid) solution. This mixture of soil and
solution was kept on shaker at 120 rpm for 30 minutes. The mixture was filtered through
Whatman filter paper 42 for sample collection for heavy metal concentration determination
(Lindsay and Norvell, 1978).
2.2.4. Plant sampling
The major crop species growing in the area of study were selected. The plant samples were
collected randomly in three replicates. Edible part of each crop was freshly harvested from
three farms, washed with water and packaged into paper bags. For wheat and rice grain parts
were used while for Berseem, Sorghum, Maize, Lucerne and Sugarcane whole plant except

28
roots was used because mostly in the concerned area farmers used these crops for fodder
purpose. Similarly for vegetables i.e. Spinach, cabbage, cauliflower, Mustard leaves and
round guard desired edible portion were used for heavy metals analysis.
The collected plant samples were sun dried for 3-4 days then oven dried at 80 °C until the
samples were completely dried and ground in tissue grinder machine. These ground samples
were passed through sieve to separate large particles and to get fine powdered material. One
gram ground powdered plant sample of each crop and vegetables in triplicate were
transferred to 250 ml conical flask (Abdullahi et al., 2007). Five ml of nitric acid and 5ml of
perchloric acid were added into each of the sample and kept overnight. 5ml nitric acid was
added next day and digested on hot plate until the brown vapors were converted into
colorless fumes. When brown fumes were turned into colorless fumes a colorless liquid
sample was obtained. These colorless samples were added into plastic bottles and 50 ml
volume was maintained by adding distill water (Miller, 1998; Singh et al., 2012).
For water sample preparation 100 ml of water samples was taken in 250 ml conical flask.
5ml of nitric acid and 5ml of perchloric acid were added into each of the sample and kept
overnight. Next day 5ml nitric acid was added and digested on hot plate until the brown
vapors were converted into colorless fumes. When brown fumes were turned into colorless
fumes a colorless liquid sample was obtained. These colorless samples were added into
plastic bottles and 50 ml volume was maintained by adding distill water.
2.2.5. Atomic Absorption Spectrophotometer Analysis
Types and concentration of heavy metals from water, soil and plant samples were determined
by using atomic absorption spectrophotometer as described by Singh et al. (1999).
2.3. Results
2.3.1 Profile of Farmers in Survey Region
The survey was carried out in “Uchkara” Faisalabad, Pakistan. Most of the farmers of the
Uchkara region are illiterate, and untreated wastewater is their only source for irrigation. The
age of the survey respondents ranged from 20 to 90 years but most were about 60 years old.
Farmers had different views about the local history of wastewater application, but most

29
thought that wastewater had been used for irrigation for the last 40 years. 98% of farmers
were small land holders and did not have any other sources of income. Average monthly
farmer income from all sources including agriculture was below the poverty level, as most
families (60%) earned less than Rs. 10,000 per month. Monthly income of the farmers was
often lower than their expenses (Fig. 2.1).
2.3.1.2. Water sources for drinking, irrigation and wastewater.
Wastewater application leaches salts and heavy metals into underground water. For drinking
water, about 94% of the farmers in the study used a municipal water supply, while 6% used
underground water sources. Because farmers were accustomed to their drinking water
sources, they did not feel any side effects. For irrigation, 94% of the farmers used
wastewater, 4% used canal water and 2% were using both canal and wastewater. Regarding
the sources of wastewater used for irrigation, 95% of the farmers thought that it was a
combination of industrial and house wastewater, while 1% thought it was only industrial
wastewater (Fig. 2.1).
2.3.1.3. Advantages /benefits and reasons for preference of wastewater.
Though wastewater has number of advantages and disadvantages, 80% of the farmers
thought that wastewater was beneficial. The remaining 20% were of the opinion that it was
not beneficial, but that canal water was not available and groundwater was not suitable for
crop cultivation due to presence of different chemicals. According to 96% of the farmers, the
reason behind this preference for use of wastewater for irrigation was of the reduced need for
fertilizer application due to presence of organic matter in the wastewater. The remaining 4%
felt that wastewater irrigation had no beneficial effect but they were bound to use it due to
lack of alternatives (Fig. 2.1).
2.3.1.4. Effect of waste water on underground water and health
Wastewater irrigation had a major effect on underground water quality due to leaching of
salts and metals present in wastewater rendering the underground water unsafe for drinking.
According to 90% of the farmers surveyed, underground water was unfit for drinking, and
felt underground water had a salty taste and bad odor. Meanwhile, 4% suggested that this
taste was due to leaching of salts from wastewater irrigation, and 2% thought that wastewater

30
irrigation had no harmful effects on the underground water. While wastewater application
can result in diseases such as skin allergies, hepatitis, tuberculosis, influenza and fevers, 52%
of farmers felt that wastewater application did not have any role in the spread of such
diseases, while 48% of farmers viewed wastewater as being a cause of these different
diseases (Fig. 2.1).
2.3.1.5. Cropping pattern and effect of wastewater on quality and yield of crops
The farmers in the study produced many different crops using wastewater. About 78% of
farmers were growing a blend of fodder, vegetables and wheat, while 10% were growing
either wheat, fodder or rice on a given land holding. Wastewater had a negative effect on the
quality of crops but a positive effect on yield. All the farmers surveyed felt that irrigating
with wastewater negatively affected crop quality and taste compared to crops irrigated with
canal water. Meanwhile, 98% of the farmers felt that wastewater irrigation resulted in higher
yield compared to canal water irrigation, some even noted that they could grow two crops per
season compared to one when canal water was used (Fig. 2.1).
2.3.1.6. Role of females and literacy rate
The majority (84%) of the farmers interviewed were male, females also help their males in
farming therefore 16% of the interviewer were females. The literacy rate of the farmers
interviewed was very low, and 74% did not know how to read and write, while 12% were
below 10th grade education and only 2% were higher secondary school certificates (Fig. 2.1).

31
Fig. 2.1: C
omp
arison of farm
er’s perception
abou
t waste w
ater app
lication ob
tained
from qu
estionn
aire
32
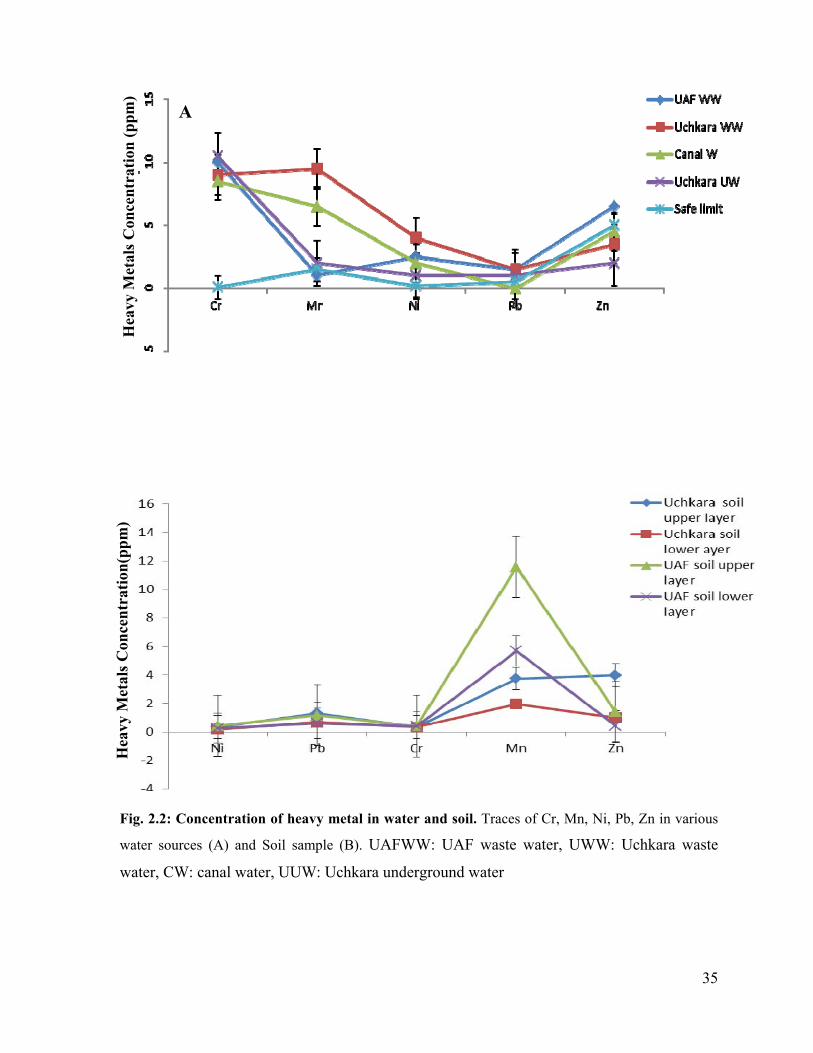
2.3.2. Heavy metals concentration in water and crop samples
2.3.2.1. Nickel
Levels of nickel (Ni) varied in different water samples. Average concentrations in University
of Agriculture Faisalabad (UAF) wastewater, Uchkara wastewater, canal water and
underground water of Uchkara were observed to be 2.5, 4, 2, and 1 ppm, respectively.
Uchkara wastewater contained two times the concentration of Ni then UAF wastewater.
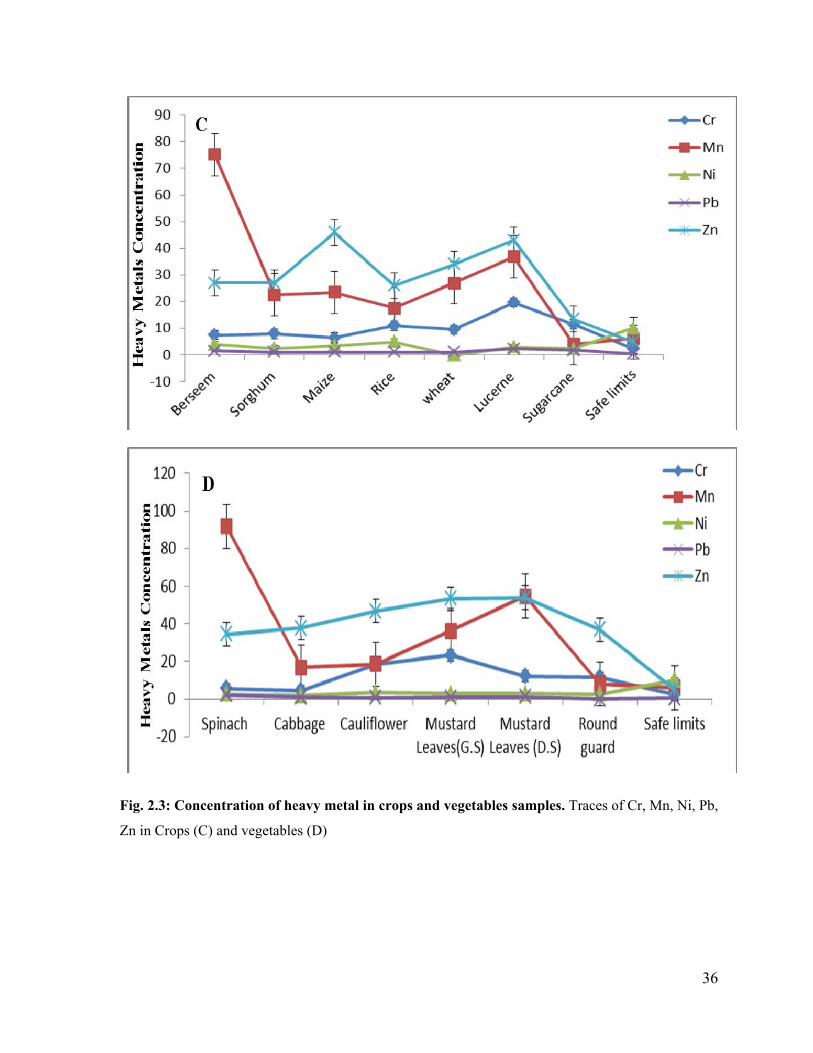
Underground water from Uchkara and canal water also contained Ni traces but at a lower
level (Fig 2.2). Nickel concentrations among crops was in the order of rice > berseem >
maize > lucerne > sorghum > sugarcane > wheat. This trend suggests that rice uptakes higher
concentrations of Ni, while wheat was hardly affected at all. Mean Ni concentrations were
observed to be 5, 4, 3.5, 3, 2.5, 2.3 and 0 (mg/kg) in rice, berseem, maize, Lucerne, sorghum,
sugarcane and wheat respectively (Fig. 2.3). In edible parts of vegetables, Ni accumulation
ranged from 1.75-3.33 mg/kg. Ni concentration was observed to be 2.5, 1.75, 3.33, 2.8, 2.75
and 2.5 mg/kg in spinach, cabbage, cauliflower, mustard leaves (Desi Sarso), mustard leaves
(Ghobi Sarso), and round gourd, respectively (Fig 2.3).
2.3.2.2. Lead
When different water samples were compared for lead concentration to check their suitability
for irrigation, it was found that except for canal water, all other water sources had lead
pollution at levels rendering them unfit for irrigation (Fig. 2.2). Marked differences were
observed for Pb uptake among different vegetables and crops, with the highest concentration
of Pb found in lucerne (2.25 mg/kg) and spinach (2 mg/kg). Other crops had almost equal
concentrations (1-1.8 mg/kg) of Pb when these crops were irrigated with Pb-contaminated
wastewater. Edible parts of crops such spinach, mustard greens, and cabbage showed Pb
levels of 2, 1, and 0.75 mg/kg. Lead concentrations just exceeded the safe limit in other
vegetables, with the exception of spinach (Fig. 2.3).

33
2.3.2.3. Chromium
Canal water was found to have the highest concentration (12 ppm) of Cr, followed by UAF
wastewater (10 ppm), Uchkara underground water (10 ppm), and Uchkara wastewater (9
ppm) (Fig. 2.2). All water sources contained more heavy metals than the safe limit, and none
of the water sources was safe for irrigation due to this level of Cr pollution.
Among different crops and vegetables, marked differences were observed for chromium
uptake and accumulation. Average Cr recorded among different crops ranged from 6.5 to
19.7 mg/kg (Fig. 2.3). Average accumulation of Cr in Berseem, Sorghum, Maize, Rice,
Wheat, Lucerne and Sugarcane was recorded 7.5, 8, 6.5, 11, 9.45, 19.68, 11.48 (mg/kg)
respectively. The average Cr accumulation recorded for various vegetables was observed to
be 5.5, 4.5, 18.31, 23.27, 12.08 and 11.5 mg / kg in Spinach, cabbage, cauliflower, Mustard
leaves (Desi Sarso), Mustard leaves (Ghobi Sarso) and round guard respectively (Fig. 2.3).
Mustard leaves had the highest (23.3 mg/kg) concentration while cauliflower had the lowest
(4.5 mg/kg). In all vegetables and crops, Cr concentrations exceeded safe limits according to
the FAO.
2.3.2.4. Manganese
The lowest Mn concentration (1 mg/kg) was found in UAF wastewater while Uchkara
wastewater had the highest concentration (9.5 mg/kg). Manganese traces were also found in
underground water and even canal water (Fig. 2.2). The highest concentration of Mn was
recorded in berseem (75 mg/kg), while the lowest concentration was found in sugarcane (4.2
mg/kg). Mean Mn concentration in berseem, sorghum, maize, rice, wheat, lucerne and
sugarcane was found to be 75, 22.5, 23.5, 17.5, 27, 36.8, and 4.2 (mg/kg), respectively (Fig.
2.3). Marked differences were also observed in Mn uptake among different vegetables, with
average concentrations of 91.8, 16.8, 18.5, 36.3, 54.8and 8 mg/kg in spinach, cabbage,
cauliflower, mustard leaves (Desi Surso), mustard leaves (Ghobi Sarso) and round guard,
respectively (Fig. 2.3). Maximum Mn uptake (91.75 mg/kg) was observed in spinach leaves,
while round guard had the lowest concentration (4.5 mg/kg).
34
2.3.2.5. Zinc
Zinc uptake varied in crops and vegetables irrigated with wastewater, from 13.5-46 mg/kg
for crops and 34.5-53.33 mg/kg for vegetables. The following increasing order was observed:
for maize (46 mg/kg) lucerne ( 43 mg/kg), wheat (34 mg/kg), sorghum (27 mg/kg), berseem
(27 mg/kg), rice (26 mg/kg) and sugarcane (13.5mg/kg) (Fig. 2.3). Similarly, for vegetables,
Zn concentrations were observed of 34.5, 37.8, 46.7, 53.3, 54 and 37 mg/kg in spinach,
cabbage, cauliflower, mustard leaves (Desi Surso), mustard leaves (Ghobi Sarso) and round
guard respectively (Fig. 2.3). Mustard leaves took up more Zn (53.3 and 54 mg/kg) then
other vegetables. Compared to pollution by other metals, almost all the tested water sources
were fit for irrigation regarding Zn concentrations, except for UAF wastewater, which
contained more Zn (6.5 ppm) then the safe limit (Fig. 2.2).
2.3.3. Heavy metals concentration in soil samples
Different levels of Ni, Mn, Cr, Pb, and Zn were found in Uchkara and UAF soil samples.
Concentrations of Ni, Mn and Cr were all higher than safe limits in both soil samples, while
Pb was found to be within safe limits. Meanwhile, Zn concentrations were found to be within
safe limits except in the upper Uchkara soil layer. Higher concentrations were observed in
the upper soil layers (0-20 cm) of both locations compared to the lower soil layers (20-40
cm) (Fig. 2.2).
35
Fig. 2.2: Concentration of heavy metal in water and soil. Traces of Cr, Mn, Ni, Pb, Zn in various
water sources (A) and Soil sample (B). UAFWW: UAF waste water, UWW: Uchkara waste
water, CW: canal water, UUW: Uchkara underground water
A
B
Hea
vy M
etal
s C
once
ntr
atio
n(p
pm
) H
eavy
Met
als
Con
cen
trat
ion
(p
pm)
36
Fig. 2.3: Concentration of heavy metal in crops and vegetables samples. Traces of Cr, Mn, Ni, Pb,
Zn in Crops (C) and vegetables (D)

37
2.4. Discussion
Wastewater is an important source of water, especially for arid and semi-arid areas of
Pakistan. It is also the best source of irrigation in peri urban farming areas where canal water
is unavailable and underground water is unfit for irrigating crops. Although wastewater
application results in a number of side effects, mostly untreated wastewater is used
throughout Pakistan for irrigation (Anonymous, 2006). Survey results of this study showed
that farmers used untreated wastewater because they had no alternative (Mahmood et al.,
2006). 48% of the farmers were aware of its health-related drawbacks, but they preferred to
apply it due to its organic matter content. It reduced the need for fertilizer application,
thereby decreasing the cost of production (Anwar et al., 2010). Farmers felt that land
irrigated with wastewater was more productive than that irrigated with canal water,
increasing both the number of crops they could grow in a season and their yield (Ibrahim and
Salmon, 1992). Farmers were also aware of the social impact of wastewater irrigation in term
of health-related problems and its effects on crops and underground water (Habbari et al.,
2000; Alebel et al., 2010).
Though poverty cut off point for rural and urban areas is Rs. 1,854 and Rs.2,248 per month
per capita for rural and urban areas, respectively (Naseem, 2012; Jamal, 2013)., the average
monthly income of the farmers surveyed was below this poverty line. 10,000 amount is not
sufficient to fulfill the requirements of 6-7 family members. So Rs. 1428 per month per
capita income is less than poverty cut off point. Therefore, although farmers were well aware
of the drawbacks of wastewater irrigation, they feel bound to use it to lessen their cost of
production.
Accumulation of high levels of heavy metals in agricultural land is a serious problem related
to crop productivity. One main source of heavy metals pollution is untreated wastewater,
which when used for irrigation for many years lead to heavy metal accumulation in the soil.
Routine practice of farmers in Uchkara was to remove the upper layer of soil periodically to
sell it for construction purpose and increase their income. A side advantage of this practice
was the removal of upper layer of soil, heavily contaminated with heavy metals. It reduces
heavy metals uptake and accumulation in plants to some extent. In Pakistan, all water sources
are used for irrigation, and analysis of these water sources found that none of them was free
from heavy metal pollution. Particularly wastewater harbored Mn, Pb, Ni, Cr, and Zn at

38
levels many fold higher than the safe limits as similar results were reported by Fatoba et al.,
2012. The concentration of Ni, Pb and Mn levels were higher in canal and underground water
than in wastewater, clearly indicating that nearby industries discharge effluents into canal
water without any treatment (Mussarat et al., 2007; Aftab et al., 2011). Long term
wastewater application results in heavy metal accumulation in the soil to toxic levels, which
in turn lead to a degradation of soil productivity. Higher levels of heavy metals in soil than
the recommended safe limits might result in crop plant toxicity (FAO, 1985; WHO, 2007).
However, the severity of the negative effects of wastewater irrigation depends on its source,
composition, treatment before use and management at its source and farm (Drechsel et al.,
2009). Different patterns were observed for heavy metals accumulation in the edible parts of
different crops and vegetables when wastewater was used for irrigation. In almost all the
vegetables and crops we tested, concentrations of these metals exceeded the safe limit as
similar results were observed by Jamil et al., 2010; John et al., 2012. Edible parts of leafy
vegetables showed higher accumulation of metals than other vegetables these results
counterpart with the findings of Tomas, 2012. A similar pattern of heavy metals
accumulation was found in leafy crops. To a greater or lesser extent, all vegetables and crops
grown using wastewater were contaminated with Cr, Zn, Ni, and Pb, leading us to conclude
that although the practice of wastewater irrigation has many socio-economic benefits, it is
neither sustainable in the long-term nor safe. Poverty is also one of the factors leading
farmers to adopt waste water irrigation practice along with non-availability of standard
irrigation water, knowing its harmful effects. By adopting some precautionary measures,
these disadvantages of wastewater can be reduced, making it one of the best water sources
for agriculture. Another alternate can be the use of low metal-accumulators genotypes of
crops and vegetables having ability to tolerate and take up lower amounts of heavy metals in
the desired plant part.
From the above study it was concluded that although waste water application have many
socio economic negative impacts but farmers preferred to use waste water due to its low cost.
it was observed that along with waste water, canal water was not found safe and fit for
irrigation in relation to heavy metals problem. From the above findings it was noted that the
concentration of heavy metals were found many folds higher than recommended safe limit in
waste water irrigated crops and vegetables.
39
Chapter 3
ASSESSMENT OF VARIABILITY IN HEAVY METAL TOLERANCE
AND YIELD AMONG TOMATO ACCESSIONS
3.1. Introduction.
Vegetables, being rich in range of nutrients, are important for health and normal body
function (Hanif et al., 2006). Tomato (Solanum lycopersicon) is an important nutritious
vegetable of semi-arid regions of the world with diverse uses. It is widely adapted to different
soils and climatic conditions.
Tomato is being grown on about 29 thousands ha having 31 thousands tons production
annually in the world (Anonymous, 2003). In 2009-10 its production was about 561.89
thousand tons from 53.4 thousand ha (FAO STAT Database, 2009). Its health benefits
include treatment for high blood pressure, eye disorders, night blindness, urinary tract
infection, liver disorders, jaundice, indigestion, morning sickness, constipation, diarrhea,
intestinal disorders, diabetes, prostate cancer, weight loss, obesity. Tomato also increases
white blood cells, red blood cells and Haematocrit in blood (Manesh et al., 1994; John and
Marc, 2000; Thompson et al., 2006).
Population is increasing with passage of time but resources are decreasing, therefore to meet
the nutritional requirements of increasing population, yield improvement is the necessity of
time. This is possible to exploit the existing variability for selection of best performing
genotypes in relation to high yield and biotic and abiotic stresses. Through breeding approach
yield and heavy metals tolerance characters can be improved by generating variability in
existing germplasm from different sources and selection of superior accessions for
hybridization programme. A wide range of heritable genetic variability exists in tomato for
many different characteristics (Hussain et al., 2001: Islam et al., 2012). Tomato possesses
heritable variability regarding yield contributing traits (Pettygrove et al.,1999; Ghosh et al.,
2010; Naz et al., 2011). Meanwhile heritable genetic variability was observed for heavy
metal tolerance in tomato (Bondada and Ma, 2003).

40
Breeders are trying to improve tomato germplasm in relation to traits such as yield and heavy
metal tolerance using pre-existing variability. In Pakistan, tomatoes are commonly irrigated
with heavy metal polluted wastewater, which resulted in accumulation of the heavy metals in
tomato fruits to toxic levels (Dikinya and Areola, 2010). Heavy metal tolerance may be
defined as the ability of plant species to grow efficaciously on heavy metals contaminated
soils, where some other plant species would fail to grow (Nies, 1999). It means tolerance can
be determined by analyzing the ability of heavy metals accumulation in various plant parts
with sustainable yield. The present study was conducted to answer the following questions:
Does variability exist among different tomato genotypes for their ability of heavy metals
accumulation in fruits, roots, stems and leaves?
How much variability exists among different tomato genotypes for yield, when irrigated
with waste water?
3.2. Materials and Methods
3.2.1. Experimental site
The research work was carried out at the experimental Farm of the University of Agriculture,
Faisalabad (Altitude=184.4m, Latitude = 31o-26’N, Latitude = 73o-06’E,).
3.2.2. Plant material
The available germplasm of tomato (Appendix.3.1) was used in the research. The seed of 44
genotypes were sown in trays filled with soil at glasshouse, Department of Plant Breeding
and Genetics, University of Agriculture, Faisalabad.
3.2.3. Field Experiment
The 45 days old seedlings were transplanted to the experimental field with two treatments i.e.
waste water and canal water and three replications under randomized complete block design.
To control the seepage from waste water irrigated field to canal water irrigated field there
was another field between these two fields. Waste water discharged from different areas of
Faisalabad, was blend of houses and different factories effluents (Hassan et al., 2013).

41
3.2.4. Assessment of heavy metals tolerant and sensitive genotypes of tomato at
maturity:
The polluted waste water was used as stress to screen out tomato genotypes against heavy
metals which were assumed to be in waste water and later on results also confirmed it.. After
transplanting till maturity waste water was applied as irrigation. At maturity three plants were
selected randomly from each replication of each genotype. Different plant parts i.e. root;
stem, leaves and fruits of the selected plants were analyzed for heavy metals concentration.
3.2.5. Quantification of heavy metals
For assessment of heavy metals concentration in different plant parts of tomato, tomato fruit
were cut into small pieces and sun dried for 3-4 days similarly other plant parts i.e. root,
shoot and leaves were also sun dried for 3-4 days. The next protocol was similar as described
in section 2.2.4 (John and Kakulu, 2012). After sample preparation the heavy metals
concentration was quantified in tomato plant parts by using atomic absorption
spectrophotometer analysis as described by Shekar et al., (2011).
3.2.6. Assessment of germplasm for Yield
Five plants were selected randomly from each replication at maturity stage and data
regarding different yield related traits was recorded at appropriate maturity stage.
3.2.7. Number of flowers per Truss
From each replication five plants were selected randomly and from each plant three trusses
were selected and number of flowers per truss was counted. The average of these flowers was
used for further analysis
3.2.8. Fruits per plant
Five plants were selected randomly from each replication and from each plant number of
fruits per truss was counted. The average of these fruits was used for further analysis.
3.2.9. Fruits per cluster
From each replication five plants were selected randomly and from each plant three trusses
were selected and number of fruits per truss was counted. The average of these flowers was
used for further analysis.
42
3.2.10. Root length
Root length of five randomly selected plants was measured at seedling stage. The average of
these values was used for further analysis.
3.2.11. Shoot length
Root length of five randomly selected plants was measured at seedling stage. The average of
these values was used for further analysis.
3.2.12. Fruit weight
From each replication five plants were selected randomly and from each plant fruit was taken
randomly and weighted on electrical balance. The average of these flowers was used for
further analysis.
3.2.13. Fruit pH
From each replication fruits were taken randomly and pH of each fruit was noted using pH
meter. The average of these values was used for further analysis.
3.2.14. Fruit TDS (total dissolved solids)
From each replication fruits were taken randomly and TDS of each fruit was noted using pH
meter. Average of these values was used for further analysis.
3.2.15. Fruit EC
From each replication fruits were taken randomly and EC of each fruit was noted using pH
meter.
3.2.16. Statistical Analysis
The data regarding heavy metals accumulation in different plant parts and yield related traits
were subjected to analysis of variance to observe the significance of genotypic differences
(Steel et al., 1997). Biplots was performed to check the performance, relationship of
genotypes for heavy metals accumulation in different plant parts and for selection of best
performing genotypes using Genstat 12th edition software.
43
3.3. Results
3.3.1. Analysis of Variance
Considerable variation was observed in the degree of heavy metal accummulation among 44
tomato genotypes (Table 3.1, Appendix 3.2). The effect of tomato genotype was significant
for Zn, Pb, Ni, and Cr accumulation ( P< 0.001; Table 3.1), but not for Mn. Treatment
differences for Zn, Mn, Ni and Cr were significant, while treatment differences for Pb were
not significant. The genotype × treatment interactions for all heavy metals were also
significant at P< 0.001, indicating that different genotypes respond differently to stress from
different heavy metals. Analysis of variance likewise showed significant genotypic
differences at P < 0.001 for uptake of heavy metals among different plant parts, such as
roots, shoots, fruits and leaves among the 44 genotypes (Appendices 3.5 - 3.8).
Genotype (i.e., tomato accessions) significantly affected several yield-related traits, such as
number of fruits, number of flowers, and fruit weight (P < 0.001). The effect of treatment on
number of fruits was also significant, the effect on the number of flowers was non-
significant. Meanwhile, the genotype treatment interactions for number of fruits and flowers
were significant. For fruit quality-related characteristics such as total dissolved salts, pH, and
EC, the effect of genotype was significant. Treatment effects were also significant except for
total dissolved salts, while genotype * treatment interactions were significant for fruit-related
characteristics (Table 3.2).
3.3.2. Determination of Heavy metals accumulation
Different behavior was observed in different tomato genotypes for heavy metal accumulation
in different plant parts when plants were irrigated with wastewater. When tomato genotypes
were compared for heavy metals (Ni, Mn, Cr, Zn, Pb) accumulation, it was observed that
fruit tissues of PB-017906 and PB-017909 genotypes accumulated the lowest concentration
of Cr (0.35 and 2.46 mg/kg), respectively, while the highest accumulation (50 and 32.8
mg/kg, respectively) was observed in the RIOGRANDI and 19894 genotypes. The lowest
Mn concentration (3.75 mg/kg for both varieties) was observed in PB-017906 and LA-2711,
while the highest concentration of Mn (16.25 and 16 mg/kg) was found in genotypes PAKIT
and CLN-1621-L, respectively. . The lowest Ni concentration (0.75 mg/kg for both varieties)
was observed in the LA-1401 and LA-2711 genotypes while the highest concentrations (3.25
44
and 3 mg/kg) were observed in BL-1079 and CLN - 2001A, respectively. Compared to other
genotypes, PB-017906 and LO-2752 were highly low metal-accumulators of Pb, with no lead
accumulation in either genotype, while HIT-9076-08 and LO-2875 had the highest Pb
concentrations (3.75 and 3 mg/kg). Similarly, the lowest concentrations of Zn were observed
in genotypes PB-017906 (13.8), CLN-2418A (26.5), and highest concentrations were
observed in BL-1077(60.3) , LO-4379(69.5)(Table 3.3).
Compared to levels in the fruit, higher concentrations of heavy metals were observed in other
plant parts, with considerable variation among genotypes for metal accumulation (Fig. 3.2).
In general, it was observed that genotype LA-0716 accumulated comparatively more heavy
metals in all plant parts, while genotype LO-3715 showed the lowest concentrations of most
metals in its roots, shoots and leaves. When canal water was used for irrigation, which was
found contaminated with heavy metals, different behavior was observed by the same
genotypes. With canal water irrigation, PB-017909 was low metal-accumulators out of all
metals, with minimal accumulation in fruit tissue, while PB-017906 and CLN-2418A were
only moderately low metal-accumulators of all metals (Fig. 3.4). Similarly, when canal water
was used for irrigation, the lowest concentrations of Ni, Mn, Pb, Cr, and Zn were found in
CLN-1621-L in all plant parts, while the highest concentrations of these metals were
observed in 6233 (Fig. 3.1).
3.3.3. Classification and selection of genotypes for heavy metal tolerance
Mean values of tolerance for heavy metals for 44 tomato genotypes Table 3.3 were classified
using Biplot analysis on the basis of the percentile cut off value (safety limit) of heavy metal
concentrations in fruit of different genotypes. Genotypes were classified into three groups: A
(low metal accumulators), B high metal accumulators), and C (intermediate metal
accumulators), on the basis of heavy metal accumulation in fruits. Group A included ten
genotypes with the lowest heavy metal concentrations considered as low metal-accumulators,
while Group B included ten genotypes with the highest heavy metal concentrations
considered as high metal-accumulators. Group C included moderately low metal-accumulator
genotypes. Genotypes possessing minimum concentration of heavy metals (Mn, Cr, Ni, Zn,
and Pb) in fruit tissue were labeled as low metal-accumulators and ranked as priority
varieties for production to reduce contamination in market tomatoes.

45
Biplot analysis was performed for identification and selection of the best performing
genotypes (high metal tolerance, low metal accumulation). PB-017906 and CLN-2418A
genotypes, which possessed obtuse angles for vectors of all metals and low tissue
concentrations of all metals, were thus categorized as low metal-accumulators (Fig. 3.3).
Vector length, which was longer for PB-017906 than for CLN-2418A suggests that the
former genotype is more low metal-accumulators of the two. With respect to relationship
between genotypes it was noted that PB-017906 and CLN-2418A genotypes had strong
positive association with minute metals concentration. Figure 3.3 and Table 3.4 showed that
PB-017906, PB-017909, and PAKIT were significantly different from the other genotypes
for Cr accumulation having low residues of 0.10, 0.7, and 0.7 mg/kg respectively in fruit
tissue. Meanwhile, RIOGRANDI and 19894 had 14.7 and 9.5 mg/kg Cr in fruit tissues and
were ranked as high metal-accumulators. For Mn, PB-017906, CLN-2418A, and LA-2711
showed the least uptake while PAKIT and CLN-1621-L showed the most uptake, and these
groups were significantly different from other genotypes and classified as low metal-
accumulators and high metal-accumulators. Genotypes LA-1401, LA-2711 17860, 17869,
and CHILO had the lowest concentration of Ni (0.1 mg/kg) and were considered low metal-
accumulators. Ni residues were accumulated at 0.433 mg/kg in BL-1079, classifying it as
high metal-accumulators. As minute amounts of Pb resulted in toxicity, so only those
genotypes that had no traces of lead in fruits were selected as low metal-accumulators.
Genotypes PB-017906, LO-2752, 17869 with obtuse angles in the Biplot had zero Pb traces
in fruit tissue and were classified as low metal-accumulators. Meanwhile HIT-9076-08 with
the highest lead concentration was considered to be high metal-accumulators. Genotypes PB-
017906 and BL-1077 had the highest and lowest accumulation of Zn and were selected as
low metal-accumulators and high metal-accumulators, respectively. Of the 44 genotypes, PB-
017906 had the least accumulation of all metals in the tomato fruit. To some extent,
genotypes CLN-2418A, LA-2711, and LA-2662 were low metal-accumulators of some
metals (Table 3.4). Under waste water irrigation, when the accumulation of heavy metals was
considered in plant parts other than fruit, LA-0716 and LO-3715 were found to have the
highest and lowest accumulations, respectively (Table 3.3). Similarly, for canal water
irrigation, CLN-1621-L was significantly more low metal-accumulator than other genotypes,
with minimum uptake and accumulation in roots, shoots, and leaves, while genotype 6233
46
was observed to be high metal-accumulators in these plant parts (Table 3.5). In general, Zn
uptake was greater than that of other metals. The order of observed concentration in fruit
tissues was Zn >Mn> Cr >Pb> Ni (Fig. 3.3). In contrast, the order of their concentration in
wastewater was Cr >Mn> Zn > Ni >Pb.
3. 3.4. Correlation coefficients for metal uptake among different plant parts
Among the various metals studied, both positive and negative associations for metal
concentrations were found in various plant tissues across tomato varieties. In fruits, Zn and
Mn were positively associated while Pb and Cr were negatively associated. Residues of lead
in fruit and leaves were positively associated with Mn residues in leaves. Similarly, Zn levels
in shoots and in roots, while Ni in leaves and fruit were positively associated with Mn in
roots. Significant positive associations were also observed between Ni levels in shoots and
roots with Cr in shoots and Mn in roots when wastewater was used for irrigation (Fig. 3.2).
Since fruit is the edible part of tomato, selection was based on metal concentrations in fruit
tissue. When canal water was used for irrigation almost all metals were positively associated
for accumulation in all plant tissues (Fig. 3.1).
3.3.5. Classification and selection of genotypes for yield-related traits
Wide variability was observed among tomato genotypes for yield-related traits (Appendix
3.5), e.g., total flowers ranged from 18 to 282.5, total fruits from 9.5 to 242, and weight per
fruit from 8.8 to 68.01 grams.
Of the 44 genotypes, 10592 and LA-1401 had the best performance, with the most flowers
(282.5 and 269.7) and fruits (242 and 229.75). These genotypes were also best performing
regarding yield/ plant i.e. 10592(12502.8g) and LA-1401(13681.6g). These two genotypes
were followed by HIT-9076-08 and LA-2711 for number of flowers (167.7 and 163.7) and
number of fruits (137.8 and 137.2). Meanwhile, genotypes 17869 and LO-2752 were the
poorest performing, with the fewest flowers (18, 19.5) and fruits (9.5 and 12) compared to
other genotypes (Table 3.8). Average individual fruit weights of LA-1401, 10592, 17869 and
LO-2752 were 23.5, 25.51, 35.45 and 31.7 g, respectively, under wastewater irrigation.
47
Under canal water irrigation, the total number of flowers ranged from 20 to 287.67 and the
total number of fruits ranged from 11.17 to 231.33. Similarly, the individual fruit weight
ranged from 22.12 to 133 g. Genotypes 10592 and LA–1401 had the most fruits (231.33 to
198.33) and flowers (269 to 287.67) compared to other genotypes. Regarding yield /Plant
genotype LA–1401 (13149.3) perform best while genotype 10592 (5117.1) behaved
moderate under canal water irrigation as compared to waste water irrigation. Meanwhile,
genotypes 17869 and LO-2752 had the fewest flowers (11.17 and 14) and fruits (20 and
20.67). Individual fruit weight of LA–1401, 10592, 17869 and LO-2752 was 26.32, 22.12,
79.21 and 37.6 g, respectively. Regarding yield /Plant genotype 6235 was poorest performing
under both treatments.
Regarding the association between yield-related traits, it was observed that the total number
of flowers and total number of fruits, fc and FC, were positively associated (Fig. 3.5).
3.4. Heavy metals accumulation under hydroponic conditions
To establish a benchmark, heavy metals concentration in different plant parts was determined
under controlled hydroponic conditions for three genotypes: the two low metal-accumulators
types PB-017906 and CLN-2418A, and the high metal-accumulators type RIOGRANDI.
Genotype selection was based on heavy metals concentration in fruit tissues when
wastewater was used for irrigation.
Similar patterns of heavy metals concentration were observed in these genotypes. Low
concentrations of Ni, Cr, Pb, Mn, and Zn were observed in the fruit tissue of PB-017906
(0.02, 0.58, 0.12, 2.10, and 1.63, respectively), and to some extent in CLN-2418A (0.08,
2.40, 1.30, 4.58, and 5.02, respectively), while higher concentrations were observed in fruits
of RIOGRANDI (0.89, 5.99, 1.27, 8.20, and 5.58, respectively). In contrast to the varying
heavy metals accumulation in fruit tissues, these genotypes had similar heavy metal
accumulation in other plant parts.

48
Table 3.1: Mean square values of 44 tomato genotypes for heavy metals grown in control and waste water application.
SOV DF Zn Pb Ni Mn Cr
G 43 78.49** 0.9766* 0.8129** 6.73 ns 64.43**
T 1 8308.19** 0.1600ns 0.3788* 1720.74** 1381.92**
G×T 43 77.08 ** 1.0457* 0.6849** 8.10** 44.73**
Error 44 71.05 0.4176 0.5568 12.37** 32.40
**= significant, ns= non-significant at P < 0.01, P< 0.05. Mn = Manganese, Ni = Nickle, Pb = Lead, Zn = Zinc,
Cr = Chromium
Table 3.2: Mean square values of 44 tomato genotypes for fruit characters grown in control and waste water application
NOF= Number of fruits, NOFL=Number of flowers, FW= Fruit weight, TDS= Total dissolved salts
SOV DF FW EC pH NOF NOFL TDS
G 43 525.5** 1.072** 0.114** 13301.7* 20652.0** 0.719**
T 1 17812.4* 2.576** 0.077** 5985.0** 110.1ns 0.683**
G*T 43 496.6 ** 0.956** 0.094** 466.8** 43.7** 0.384ns
Error 176 122.5** 0.657** 0.067** 66.0 337.9** 0.903**
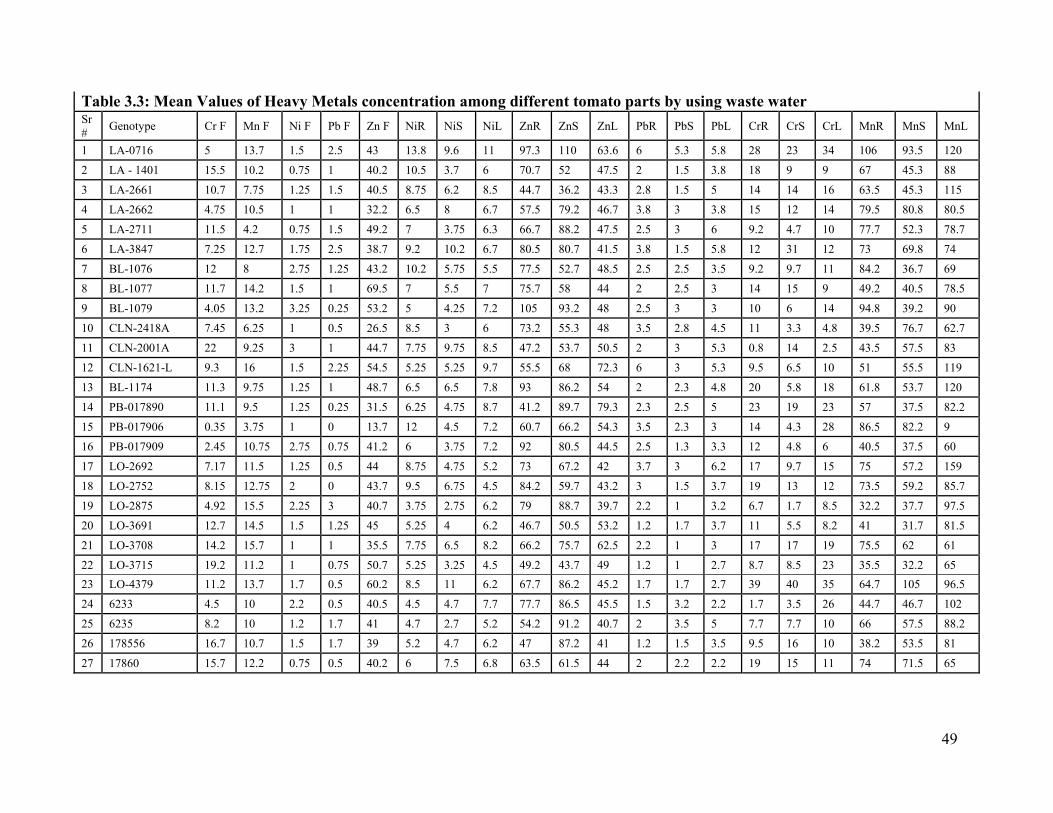
49
Table 3.3: Mean Values of Heavy Metals concentration among different tomato parts by using waste water Sr #
Genotype Cr F Mn F Ni F Pb F Zn F NiR NiS NiL ZnR ZnS ZnL PbR PbS PbL CrR CrS CrL MnR MnS MnL
1 LA-0716 5 13.7 1.5 2.5 43 13.8 9.6 11 97.3 110 63.6 6 5.3 5.8 28 23 34 106 93.5 120
2 LA - 1401 15.5 10.2 0.75 1 40.2 10.5 3.7 6 70.7 52 47.5 2 1.5 3.8 18 9 9 67 45.3 88
3 LA-2661 10.7 7.75 1.25 1.5 40.5 8.75 6.2 8.5 44.7 36.2 43.3 2.8 1.5 5 14 14 16 63.5 45.3 115
4 LA-2662 4.75 10.5 1 1 32.2 6.5 8 6.7 57.5 79.2 46.7 3.8 3 3.8 15 12 14 79.5 80.8 80.5
5 LA-2711 11.5 4.2 0.75 1.5 49.2 7 3.75 6.3 66.7 88.2 47.5 2.5 3 6 9.2 4.7 10 77.7 52.3 78.7
6 LA-3847 7.25 12.7 1.75 2.5 38.7 9.2 10.2 6.7 80.5 80.7 41.5 3.8 1.5 5.8 12 31 12 73 69.8 74
7 BL-1076 12 8 2.75 1.25 43.2 10.2 5.75 5.5 77.5 52.7 48.5 2.5 2.5 3.5 9.2 9.7 11 84.2 36.7 69
8 BL-1077 11.7 14.2 1.5 1 69.5 7 5.5 7 75.7 58 44 2 2.5 3 14 15 9 49.2 40.5 78.5
9 BL-1079 4.05 13.2 3.25 0.25 53.2 5 4.25 7.2 105 93.2 48 2.5 3 3 10 6 14 94.8 39.2 90
10 CLN-2418A 7.45 6.25 1 0.5 26.5 8.5 3 6 73.2 55.3 48 3.5 2.8 4.5 11 3.3 4.8 39.5 76.7 62.7
11 CLN-2001A 22 9.25 3 1 44.7 7.75 9.75 8.5 47.2 53.7 50.5 2 3 5.3 0.8 14 2.5 43.5 57.5 83
12 CLN-1621-L 9.3 16 1.5 2.25 54.5 5.25 5.25 9.7 55.5 68 72.3 6 3 5.3 9.5 6.5 10 51 55.5 119
13 BL-1174 11.3 9.75 1.25 1 48.7 6.5 6.5 7.8 93 86.2 54 2 2.3 4.8 20 5.8 18 61.8 53.7 120
14 PB-017890 11.1 9.5 1.25 0.25 31.5 6.25 4.75 8.7 41.2 89.7 79.3 2.3 2.5 5 23 19 23 57 37.5 82.2
15 PB-017906 0.35 3.75 1 0 13.7 12 4.5 7.2 60.7 66.2 54.3 3.5 2.3 3 14 4.3 28 86.5 82.2 9
16 PB-017909 2.45 10.75 2.75 0.75 41.2 6 3.75 7.2 92 80.5 44.5 2.5 1.3 3.3 12 4.8 6 40.5 37.5 60
17 LO-2692 7.17 11.5 1.25 0.5 44 8.75 4.75 5.2 73 67.2 42 3.7 3 6.2 17 9.7 15 75 57.2 159
18 LO-2752 8.15 12.75 2 0 43.7 9.5 6.75 4.5 84.2 59.7 43.2 3 1.5 3.7 19 13 12 73.5 59.2 85.7
19 LO-2875 4.92 15.5 2.25 3 40.7 3.75 2.75 6.2 79 88.7 39.7 2.2 1 3.2 6.7 1.7 8.5 32.2 37.7 97.5
20 LO-3691 12.7 14.5 1.5 1.25 45 5.25 4 6.2 46.7 50.5 53.2 1.2 1.7 3.7 11 5.5 8.2 41 31.7 81.5
21 LO-3708 14.2 15.7 1 1 35.5 7.75 6.5 8.2 66.2 75.7 62.5 2.2 1 3 17 17 19 75.5 62 61
22 LO-3715 19.2 11.2 1 0.75 50.7 5.25 3.25 4.5 49.2 43.7 49 1.2 1 2.7 8.7 8.5 23 35.5 32.2 65
23 LO-4379 11.2 13.7 1.7 0.5 60.2 8.5 11 6.2 67.7 86.2 45.2 1.7 1.7 2.7 39 40 35 64.7 105 96.5
24 6233 4.5 10 2.2 0.5 40.5 4.5 4.7 7.7 77.7 86.5 45.5 1.5 3.2 2.2 1.7 3.5 26 44.7 46.7 102
25 6235 8.2 10 1.2 1.7 41 4.7 2.7 5.2 54.2 91.2 40.7 2 3.5 5 7.7 7.7 10 66 57.5 88.2
26 178556 16.7 10.7 1.5 1.7 39 5.2 4.7 6.2 47 87.2 41 1.2 1.5 3.5 9.5 16 10 38.2 53.5 81
27 17860 15.7 12.2 0.75 0.5 40.2 6 7.5 6.8 63.5 61.5 44 2 2.2 2.2 19 15 11 74 71.5 65

50
Mn= Manganese, Ni= Nickle, Pb= Lead, Zn= Zinc, Cr= Chromium, R= Root, S= Shoot, L= Leaf, F: Fruit
28 17862 4.9 9.2 1.75 0.7 38.5 7 3.7 7 48.2 65.2 54.5 2.5 2.2 3.2 14 7.5 13 65.5 36.7 81
29 17869 13.7 14.7 0.75 0 41.2 6.2 4.2 8.5 51.5 66.5 38.7 1.5 1.5 3.3 12 5.7 13 43.5 42.7 114
30 17871 8 6.7 1 2 33.7 8.2 4.2 6.2 98.2 78.5 40.7 2 1.7 3.5 16 6.2 13 73.5 39 100
31 CHILO 9.7 12.7 0.75 0.5 37.5 8.2 9.7 8.2 43 81.7 48.5 1.5 1.7 3.5 41 36 17 69.5 82.7 88.5
32 MACHIA 5.7 10.7 1.2 1 42 8.5 6.7 7.2 96.7 126 71.7 1.7 2.2 5.3 21 12 55 56.2 60.2 178
33 PAKIT 2.5 16.2 1 1 44.7 3.7 5.5 6.5 54.5 84.7 53.5 1 2.5 4.5 7.5 8.8 34 31.5 38.2 95.5
34 TWL-23 8.6 13.75 1.75 1 42.7 14 12 8.2 102 166 58.5 4.3 3.8 3.3 35 32 9.8 119 85.7 91
35 10592 10.5 12.5 1.25 0.75 49.5 6.25 5.25 5.7 82.7 44.7 29.7 2 3 3 3.3 2.5 9.3 51.5 76 70.7
36 19894 32.7 8.25 1.25 0.5 37.7 8.7 5.2 7.2 41.7 79.5 43 1.8 1.8 3 33 10 5 48.8 64.2 89
37 CIM-1927 14.5 7.75 1.25 1 42.7 17.5 14.7 8.7 69.5 63.5 43.5 2.8 1.5 3 45 4.8 12 75 23.2 80
38 17872 11 11.75 1 1.25 50.7 9.5 6 8.2 72.7 64.7 72.5 2.8 1.5 3.8 13 16 27 78.5 31.2 76.5
39 HIT-9076-08 4.75 10.5 1.25 3.75 32.7 6.25 5 6.7 90 90.5 47 2.8 4 3.5 2.5 11 26 40.5 93.5 81.5
40 RIOGRANDI 50.7 11.5 1.75 1.5 50.7 7.25 2.75 8 100 122 43 2.3 1 3.5 15 3.5 15 65.5 32 89
41 TY-8A 4.95 9.5 1.25 1 33.7 7 6 8 54 104 46.5 2.8 3.8 3.3 15 5.5 18 76 42.7 82
42 VRIT-44 20 7.5 2.5 0.75 38.2 7.75 3.25 7.2 64.2 78.7 43 5.8 4.3 3 2.8 8.8 22 89.7 87.7 78.5
43 VRIT-45 22.7 12.25 2.25 1.75 39.7 9.75 9.25 19 78.2 82.5 65.7 2.3 1.8 3.8 20 16 12 81.7 80.5 94.5
44 VRIT-47 5.7 10.75 1.75 0.5 51.5 8.5 3.75 81.2 107 83.8 4.8 3.8 5.3 13 13 30 55 81.2 119
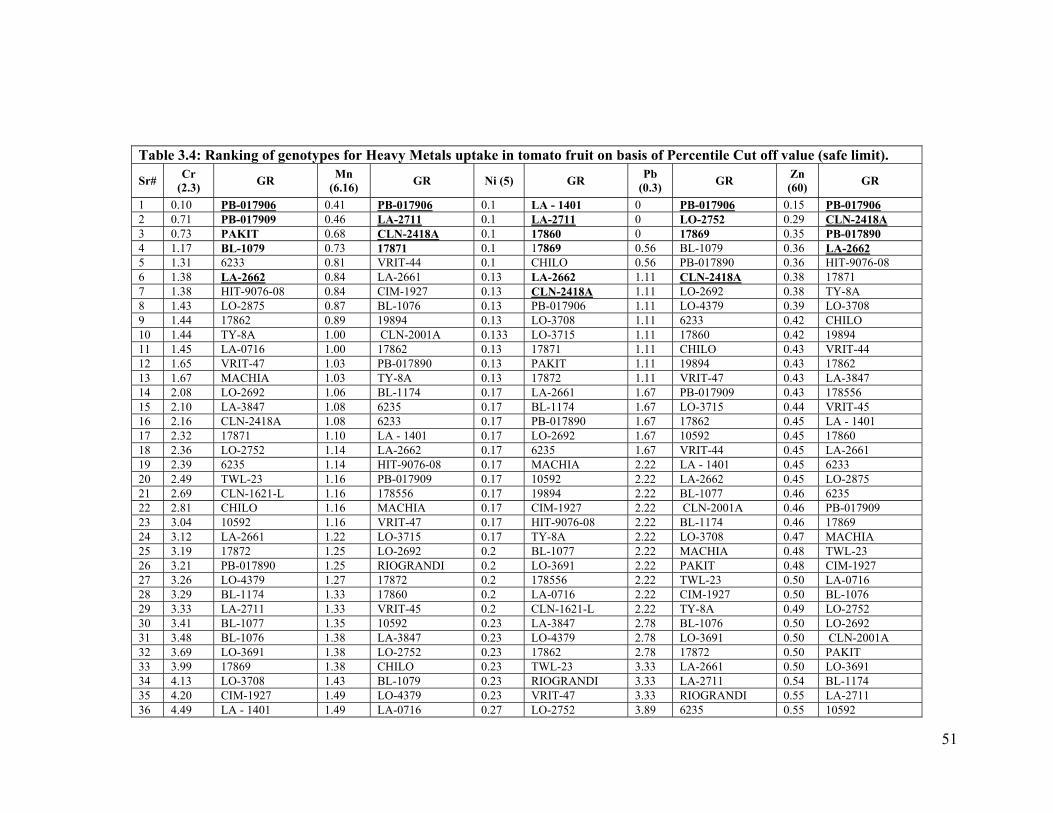
51
Table 3.4: Ranking of genotypes for Heavy Metals uptake in tomato fruit on basis of Percentile Cut off value (safe limit).
Sr# Cr
(2.3) GR
Mn (6.16)
GR Ni (5) GR Pb
(0.3) GR
Zn (60)
GR
1 0.10 PB-017906 0.41 PB-017906 0.1 LA - 1401 0 PB-017906 0.15 PB-017906 2 0.71 PB-017909 0.46 LA-2711 0.1 LA-2711 0 LO-2752 0.29 CLN-2418A 3 0.73 PAKIT 0.68 CLN-2418A 0.1 17860 0 17869 0.35 PB-017890 4 1.17 BL-1079 0.73 17871 0.1 17869 0.56 BL-1079 0.36 LA-2662 5 1.31 6233 0.81 VRIT-44 0.1 CHILO 0.56 PB-017890 0.36 HIT-9076-08 6 1.38 LA-2662 0.84 LA-2661 0.13 LA-2662 1.11 CLN-2418A 0.38 17871 7 1.38 HIT-9076-08 0.84 CIM-1927 0.13 CLN-2418A 1.11 LO-2692 0.38 TY-8A 8 1.43 LO-2875 0.87 BL-1076 0.13 PB-017906 1.11 LO-4379 0.39 LO-3708 9 1.44 17862 0.89 19894 0.13 LO-3708 1.11 6233 0.42 CHILO 10 1.44 TY-8A 1.00 CLN-2001A 0.133 LO-3715 1.11 17860 0.42 19894 11 1.45 LA-0716 1.00 17862 0.13 17871 1.11 CHILO 0.43 VRIT-44 12 1.65 VRIT-47 1.03 PB-017890 0.13 PAKIT 1.11 19894 0.43 17862 13 1.67 MACHIA 1.03 TY-8A 0.13 17872 1.11 VRIT-47 0.43 LA-3847 14 2.08 LO-2692 1.06 BL-1174 0.17 LA-2661 1.67 PB-017909 0.43 178556 15 2.10 LA-3847 1.08 6235 0.17 BL-1174 1.67 LO-3715 0.44 VRIT-45 16 2.16 CLN-2418A 1.08 6233 0.17 PB-017890 1.67 17862 0.45 LA - 1401 17 2.32 17871 1.10 LA - 1401 0.17 LO-2692 1.67 10592 0.45 17860 18 2.36 LO-2752 1.14 LA-2662 0.17 6235 1.67 VRIT-44 0.45 LA-2661 19 2.39 6235 1.14 HIT-9076-08 0.17 MACHIA 2.22 LA - 1401 0.45 6233 20 2.49 TWL-23 1.16 PB-017909 0.17 10592 2.22 LA-2662 0.45 LO-2875 21 2.69 CLN-1621-L 1.16 178556 0.17 19894 2.22 BL-1077 0.46 6235 22 2.81 CHILO 1.16 MACHIA 0.17 CIM-1927 2.22 CLN-2001A 0.46 PB-017909 23 3.04 10592 1.16 VRIT-47 0.17 HIT-9076-08 2.22 BL-1174 0.46 17869 24 3.12 LA-2661 1.22 LO-3715 0.17 TY-8A 2.22 LO-3708 0.47 MACHIA 25 3.19 17872 1.25 LO-2692 0.2 BL-1077 2.22 MACHIA 0.48 TWL-23 26 3.21 PB-017890 1.25 RIOGRANDI 0.2 LO-3691 2.22 PAKIT 0.48 CIM-1927 27 3.26 LO-4379 1.27 17872 0.2 178556 2.22 TWL-23 0.50 LA-0716 28 3.29 BL-1174 1.33 17860 0.2 LA-0716 2.22 CIM-1927 0.50 BL-1076 29 3.33 LA-2711 1.33 VRIT-45 0.2 CLN-1621-L 2.22 TY-8A 0.49 LO-2752 30 3.41 BL-1077 1.35 10592 0.23 LA-3847 2.78 BL-1076 0.50 LO-2692 31 3.48 BL-1076 1.38 LA-3847 0.23 LO-4379 2.78 LO-3691 0.50 CLN-2001A 32 3.69 LO-3691 1.38 LO-2752 0.23 17862 2.78 17872 0.50 PAKIT 33 3.99 17869 1.38 CHILO 0.23 TWL-23 3.33 LA-2661 0.50 LO-3691 34 4.13 LO-3708 1.43 BL-1079 0.23 RIOGRANDI 3.33 LA-2711 0.54 BL-1174 35 4.20 CIM-1927 1.49 LO-4379 0.23 VRIT-47 3.33 RIOGRANDI 0.55 LA-2711 36 4.49 LA - 1401 1.49 LA-0716 0.27 LO-2752 3.89 6235 0.55 10592
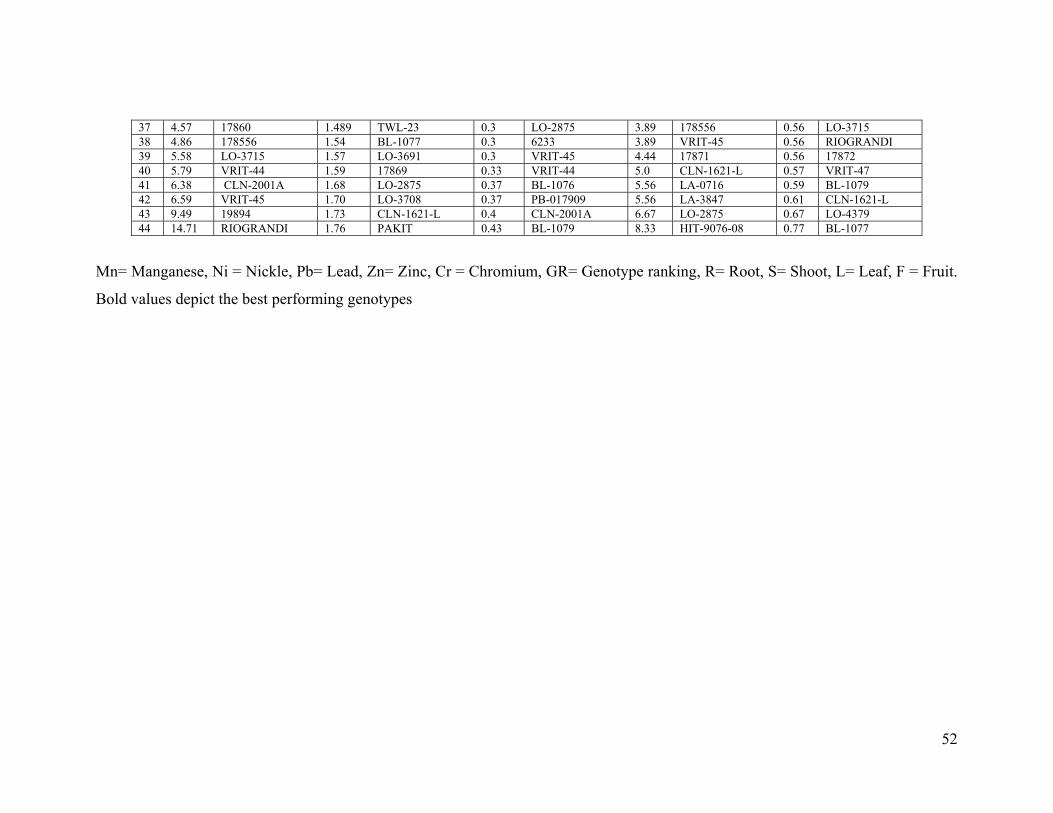
52
Mn= Manganese, Ni = Nickle, Pb= Lead, Zn= Zinc, Cr = Chromium, GR= Genotype ranking, R= Root, S= Shoot, L= Leaf, F = Fruit.
Bold values depict the best performing genotypes
37 4.57 17860 1.489 TWL-23 0.3 LO-2875 3.89 178556 0.56 LO-3715 38 4.86 178556 1.54 BL-1077 0.3 6233 3.89 VRIT-45 0.56 RIOGRANDI 39 5.58 LO-3715 1.57 LO-3691 0.3 VRIT-45 4.44 17871 0.56 17872 40 5.79 VRIT-44 1.59 17869 0.33 VRIT-44 5.0 CLN-1621-L 0.57 VRIT-47 41 6.38 CLN-2001A 1.68 LO-2875 0.37 BL-1076 5.56 LA-0716 0.59 BL-1079 42 6.59 VRIT-45 1.70 LO-3708 0.37 PB-017909 5.56 LA-3847 0.61 CLN-1621-L 43 9.49 19894 1.73 CLN-1621-L 0.4 CLN-2001A 6.67 LO-2875 0.67 LO-4379 44 14.71 RIOGRANDI 1.76 PAKIT 0.43 BL-1079 8.33 HIT-9076-08 0.77 BL-1077

53
Table 3.5: Mean Values of Heavy Metals concentration among different tomato parts by using canal water Sr #
Genotype Cr F
MnF NiF PbF ZnF NiR NiS NL ZnR ZnS ZnL PbR PbS PbL CrR CrS CrL MnR MnS MnL
1 LA-0716 5.26 1.77 1.4 1.76 26.9 12 4 11 54.4 36.8 34.8 7.2 1.6 10 17 4 9.6 86.8 31 126
2 LA - 1401 4.4 1.44 1.3 0.97 28.1 10 6 11 39.6 69.6 38.8 6.8 5.6 9.2 12 6 10 75.6 43 123
3 LA-2661 4.8 1.69 1.1 1.88 23.8 10 4 10 50.2 72.4 32.8 10 2.4 6.8 14 4 8 70 25 98
4 LA-2662 8.07 1.2 1.5 1.22 20.9 8.3 2 8.4 62 46.8 28 7.2 5.6 19 11 3 6.8 91 42 96.8
5 LA-2711 4.65 1.52 1.2 0.74 20.3 5.2 6 9.6 24.4 48.4 31.6 1.2 1.2 7.2 2.8 3 6.4 24.8 26 96.4
6 LA-3847 7.46 3.66 2.2 0.44 27 11 4 15 49.1 60 46.8 6.2 5 12 12 7 14 87 30 152
7 BL-1076 7.07 4.11 1.6 1.17 30.8 8 4 11 80 41.2 42 4.8 6.4 11 16 3 11 70.8 32 125
8 BL-1077 4.49 0.71 1.4 2.09 19.8 14 7 14 83.2 83.2 38.4 12 4 10 13 6 10 92.4 57 126
9 BL-1079 4.69 3.23 0.9 0.84 19.4 9.2 4 11 63.2 36.4 64.4 6.4 5.6 12 9.2 3 7.6 83.6 38 111
10 CLN-2418A 4.78 0.67 0.6 0.34 14.2 8.3 5 11 54.2 62.5 57 4.9 5.7 13 8 5 10 50 27 110
11 CLN-2001A 18.5 4.04 1.4 2.72 19.8 8.8 4 7.2 76 50.8 25.2 10 8.8 22 10 4 5.2 71.6 33 77.2
12 CLN-1621-L 3.58 1.42 0.6 0.84 20.5 3.2 2 7.2 62 62.4 26.8 2 3.2 7.6 4.8 3 5.6 26 17 79.2
13 BL-1174 10.3 3.12 1.7 0.38 18.2 4.8 5 6.8 98 64.4 49.6 2 2 4.8 5.2 5 5.2 36.4 41 74.4
14 PB-017890 4.69 2.72 1.1 0.69 21.7 8 3 8.4 69.2 75.6 30.8 0.4 1.6 5.6 9.6 6 11 42.4 39 94
15 PB-017906 15.5 1.46 1.4 0.34 17.6 12 6 10 115 62.8 37.2 47 7.2 16 15 5 11 56 27 101
16 PB-017909 3.51 0.43 0 0.09 9.56 16 7 6 68.4 64 31.2 6.4 3.2 5.2 18 10 6.8 113 54 67.6
17 LO-2692 17.7 3.5 1.5 1.42 20.8 13 5 9.2 49.2 97.2 32 6.9 3.6 7.2 13 6 8.8 110 34 102
18 LO-2752 3.9 1.42 2.3 0.48 14.2 8 4 14 50.4 42.4 34 3.6 1.2 7.2 8.8 5 9.2 41.2 25 113
19 LO-2875 4.51 2.92 1.1 0.84 29.2 11 6 13 91.2 60.8 37.6 8.1 3.6 7.2 12 7 11 89 42 117
20 LO-3691 19.4 1.46 0.7 1.37 11 10 4 12 68.8 54.4 41.2 0.8 0 5.2 14 7 9.6 63.2 26 115
21 LO-3708 3.4 1.14 0 0.49 12.8 5.2 4 7.6 102 116 44 2.4 0.4 6.8 6.4 4 6.8 34.4 35 87.6
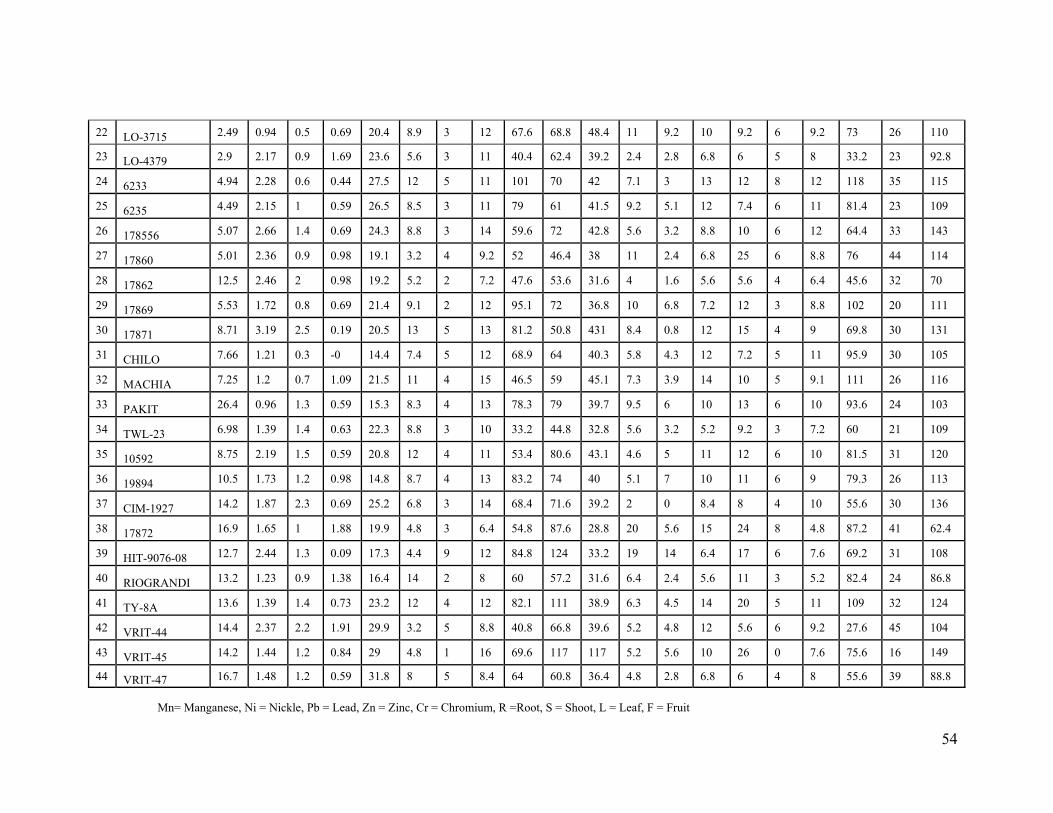
54
22 LO-3715 2.49 0.94 0.5 0.69 20.4 8.9 3 12 67.6 68.8 48.4 11 9.2 10 9.2 6 9.2 73 26 110
23 LO-4379 2.9 2.17 0.9 1.69 23.6 5.6 3 11 40.4 62.4 39.2 2.4 2.8 6.8 6 5 8 33.2 23 92.8
24 6233 4.94 2.28 0.6 0.44 27.5 12 5 11 101 70 42 7.1 3 13 12 8 12 118 35 115
25 6235 4.49 2.15 1 0.59 26.5 8.5 3 11 79 61 41.5 9.2 5.1 12 7.4 6 11 81.4 23 109
26 178556 5.07 2.66 1.4 0.69 24.3 8.8 3 14 59.6 72 42.8 5.6 3.2 8.8 10 6 12 64.4 33 143
27 17860 5.01 2.36 0.9 0.98 19.1 3.2 4 9.2 52 46.4 38 11 2.4 6.8 25 6 8.8 76 44 114
28 17862 12.5 2.46 2 0.98 19.2 5.2 2 7.2 47.6 53.6 31.6 4 1.6 5.6 5.6 4 6.4 45.6 32 70
29 17869 5.53 1.72 0.8 0.69 21.4 9.1 2 12 95.1 72 36.8 10 6.8 7.2 12 3 8.8 102 20 111
30 17871 8.71 3.19 2.5 0.19 20.5 13 5 13 81.2 50.8 431 8.4 0.8 12 15 4 9 69.8 30 131
31 CHILO 7.66 1.21 0.3 -0 14.4 7.4 5 12 68.9 64 40.3 5.8 4.3 12 7.2 5 11 95.9 30 105
32 MACHIA 7.25 1.2 0.7 1.09 21.5 11 4 15 46.5 59 45.1 7.3 3.9 14 10 5 9.1 111 26 116
33 PAKIT 26.4 0.96 1.3 0.59 15.3 8.3 4 13 78.3 79 39.7 9.5 6 10 13 6 10 93.6 24 103
34 TWL-23 6.98 1.39 1.4 0.63 22.3 8.8 3 10 33.2 44.8 32.8 5.6 3.2 5.2 9.2 3 7.2 60 21 109
35 10592 8.75 2.19 1.5 0.59 20.8 12 4 11 53.4 80.6 43.1 4.6 5 11 12 6 10 81.5 31 120
36 19894 10.5 1.73 1.2 0.98 14.8 8.7 4 13 83.2 74 40 5.1 7 10 11 6 9 79.3 26 113
37 CIM-1927 14.2 1.87 2.3 0.69 25.2 6.8 3 14 68.4 71.6 39.2 2 0 8.4 8 4 10 55.6 30 136
38 17872 16.9 1.65 1 1.88 19.9 4.8 3 6.4 54.8 87.6 28.8 20 5.6 15 24 8 4.8 87.2 41 62.4
39 HIT-9076-08 12.7 2.44 1.3 0.09 17.3 4.4 9 12 84.8 124 33.2 19 14 6.4 17 6 7.6 69.2 31 108
40 RIOGRANDI 13.2 1.23 0.9 1.38 16.4 14 2 8 60 57.2 31.6 6.4 2.4 5.6 11 3 5.2 82.4 24 86.8
41 TY-8A 13.6 1.39 1.4 0.73 23.2 12 4 12 82.1 111 38.9 6.3 4.5 14 20 5 11 109 32 124
42 VRIT-44 14.4 2.37 2.2 1.91 29.9 3.2 5 8.8 40.8 66.8 39.6 5.2 4.8 12 5.6 6 9.2 27.6 45 104
43 VRIT-45 14.2 1.44 1.2 0.84 29 4.8 1 16 69.6 117 117 5.2 5.6 10 26 0 7.6 75.6 16 149
44 VRIT-47 16.7 1.48 1.2 0.59 31.8 8 5 8.4 64 60.8 36.4 4.8 2.8 6.8 6 4 8 55.6 39 88.8
Mn= Manganese, Ni = Nickle, Pb = Lead, Zn = Zinc, Cr = Chromium, R =Root, S = Shoot, L = Leaf, F = Fruit

55
20
43
21
44
23
19251
27 2
29
331
433
5 35
6
37
7
39
8
41
9
22
10
26
11
30
12
34
13
38
14
42
15
28
3640
24
32
16
17
18
CrL
CrR
CrS
Cr_F
MnL
MnS
Mn_F
Mn_R
NiL
NiR
NiS
Ni_F
PbL
PbS
Pb_F
Pb_R
ZnL
ZnRZnS
Zn_F
-4
-4
-2
0
0
4
2
4
-2 2
Fig. 3.1: Biplot and correlation for genotype-by-Heavy metals accumulation by canal water application. (Numbers depicts the genotypes as shown in Table 3.3)
18
41
19
42
21
4323
44
25
17
27
1
29
2
31
3
33
435
5
37
6
39
7
20
8
24
9
2810
32
11
36
12
40
13
26
34
3822 30
14
15
16
CrL
CrSCr_F
MnL
MnR
MnS
Mn_F
NiL
NiRNiS
Ni_F
PbL
PbR
PbSPb_F
ZnL
ZnRZnS
Zn_f
g
-4 0 2
-4
-2
4
0
2
4
-2 6
Fig. 3.2: Biplot and correlation for genotype-by-Heavy metals accumulation by waste water application

56
3
4
22
44
21
42
20
40
19
38
18
36
34
17
3216
30
1528
14
26
1324
12
43
11
39
1035
9
31
827
7 23
6
3729
2541
33
5
1
2
Cr_F
Mn_F
Ni_F
Pb_F
Zn_f
4
4
2
3
0
2
-2
1
-4
0-1-2-3-4
3
-1
-3
1
Fig. 3.3: Biplot and correlation for genotype-by-Heavy metals accumulation in fruits by waste water application
15
16
22
44
2142
20
40
19
38
18
36 17
34
32
1
30
228
3
26
4
245
43
639
7
35
8
31
9
2710
23
11
37292541
33
12
13
14
C_Ni
C_Pb
C_ZnCr_C
Mn_C
21
1
0
-1
-1
-3
-2-3
2
-2
0
Fig. 3.4: Biplot and correlation for genotype-by-Heavy metals accumulation in
fruits by canal water application

57
** = Correlation significant at the 0.01 or 0.05 levels (2-tailed). Mn = Manganese, Ni = Nickle, Pb = Lead, Zn = Zinc, Cr = Chromium, R = Root, S = Shoot, L = Leaf, F = Fruit.
Cr F Mn F Ni F Pb F Zn F Ni R Ni S Ni L Zn R Zn S Zn L Pb R Pb S Pb L Cr R Cr S CrL MnR MnS
Mn F -0.04
Ni F 0.04 0.08
Pb F -0.02 0.15 0.03
Zn F 0.21 .48** 0.22 0.01
Ni R 0.05 -0.28 -0.07 -0.06 -0.16
Ni S -0.03 0.16 0.02 0.03 0.07 .64**
Ni L 0.19 0.14 0.15 0.18 -0.05 0.27 .38*
Zn R -0.10 0.09 .32* 0.23 0.20 0.24 0.08 0.06
Zn S 0.001 0.14 0.11 0.17 -0.01 0.13 0.18 0.20 .47**
Zn L -0.14 0.12 -0.03 -0.02 0.03 0.15 0.08 .42** 0.02 0.31*
Pb R -0.19 -0.05 0.15 0.18 -0.07 0.39** 0.12 0.19 0.24 0.22 0.32*
Pb S -.331* -0.12 0.13 0.13 -0.03 0.08 0.04 0.08 0.18 0.35* 0.19 0.58**
Pb L -0.16 -0.08 -0.09 0.26 0.05 0.07 0.02 0.08 0.01 0.12 .35* 0.36* 0.29
Cr R 0.11 0.06 -0.26 -0.23 0.02 .63** .66** 0.23 0.01 0.28 0.15 0.01 -0.16 -0.09
Cr S -0.035 .310* -0.042 0.02 0.13 .31* .64** 0.18 -0.04 0.29 0.21 0.09 0.02 0.09 .56**
Cr L -0.26 0.07 -0.17 -0.03 0.007 0.07 0.09 0.05 0.18 0.36* .48** 0.06 0.21 0.12 0.13 0.23
MnR -0.05 -0.15 0.08 -0.08 -0.11 .62** .42** 0.27 .35* .36* 0.14 .50** .34* 0.04 .39** .34* 0.07
Mn S -0.13 0.002 -0.06 0.06 -0.19 0.23 .33* 0.19 0.13 0.27 0.08 .43** .47** 0.08 0.20 .52** 0.24 .31*
Mn L -0.16 0.11 -0.08 0.03 0.12 0.08 0.04 0.14 0.21 .32* 0.29 0.18 0.19 .49** 0.14 0.01 .51** 0.04 0.09
Table 3.6: Correlation for Heavy Metals concentration among different tomato parts

58
Table 3.7: Heavy Metals Concentration in tomato plant parts under hydroponic condition
Genotypes Ni Cr Pb Mn Zn
RIOGRANDI R 2.18 3.28 11.35 20.49 17.77
CLN-2418A R 1.58 8.69 8.13 20.71 13.87
PB-017906 R 1.47 5.36 14.47 11.99 9.17
RIOGRANDI L 2.97 2.17 5.40 12.93 25.15
CLN-2418A L 2.04 1.47 3.41 12.60 25.70
PB-017906 L 2.60 2.51 6.80 14.89 27.97
RIOGRANDI S 0.77 2.07 2.48 6.35 6.97
CLN-2418A S 0.85 3.89 3.48 12.00 18.76
PB-017906 S 2.05 2.05 5.08 23.09 20.70
RIOGRANDI F 0.89 5.99 1.27 8.20 5.58
CLN-2418A F 0.08 2.40 1.30 4.58 5.02
PB-017906 F 0.02 0.58 0.12 2.10 1.63
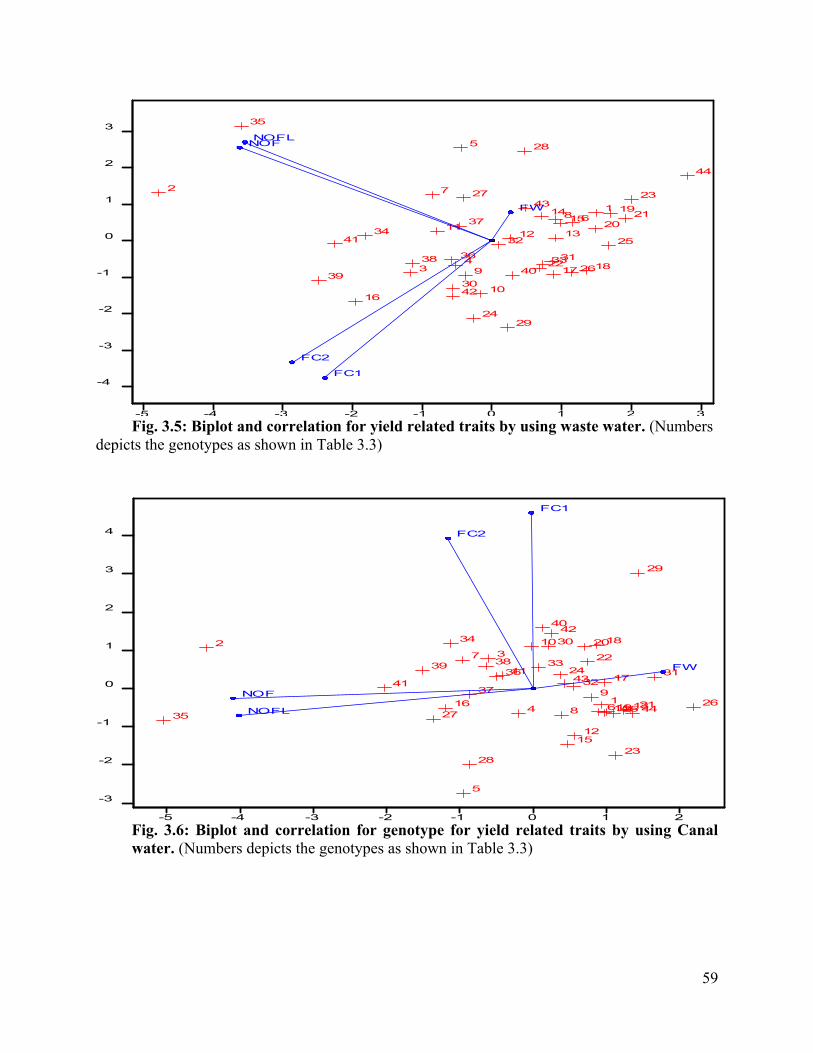
59
5
6
22
44
21
42
20
40
19
3818
36
34
17
32
16
30
15
28
14
26
13
24
12
43
11
39
10
35
9
31
8
27723
1
37
29
2541
33
2
34
FC1
FC2
FW
NOFNOFL
3
2
2
0
1
-2
0
-4
-1-2-3-4-5
3
-1
-3
1
Fig. 3.5: Biplot and correlation for yield related traits by using waste water. (Numbers depicts the genotypes as shown in Table 3.3)
7
8
22
4421
42
20
40
19
38
18
36
34
1732
16
30
15
28
142613
24
12
4311
39
10
35
9
31
1
27
2
23
3
37
29
25
41
33
4
5
6
FC1
FC2
FW
NOF
NOFL
2
3
1
1
0
-1
-1
-3
-2-3-4-5
2
-2
0
4
Fig. 3.6: Biplot and correlation for genotype for yield related traits by using Canal water. (Numbers depicts the genotypes as shown in Table 3.3)
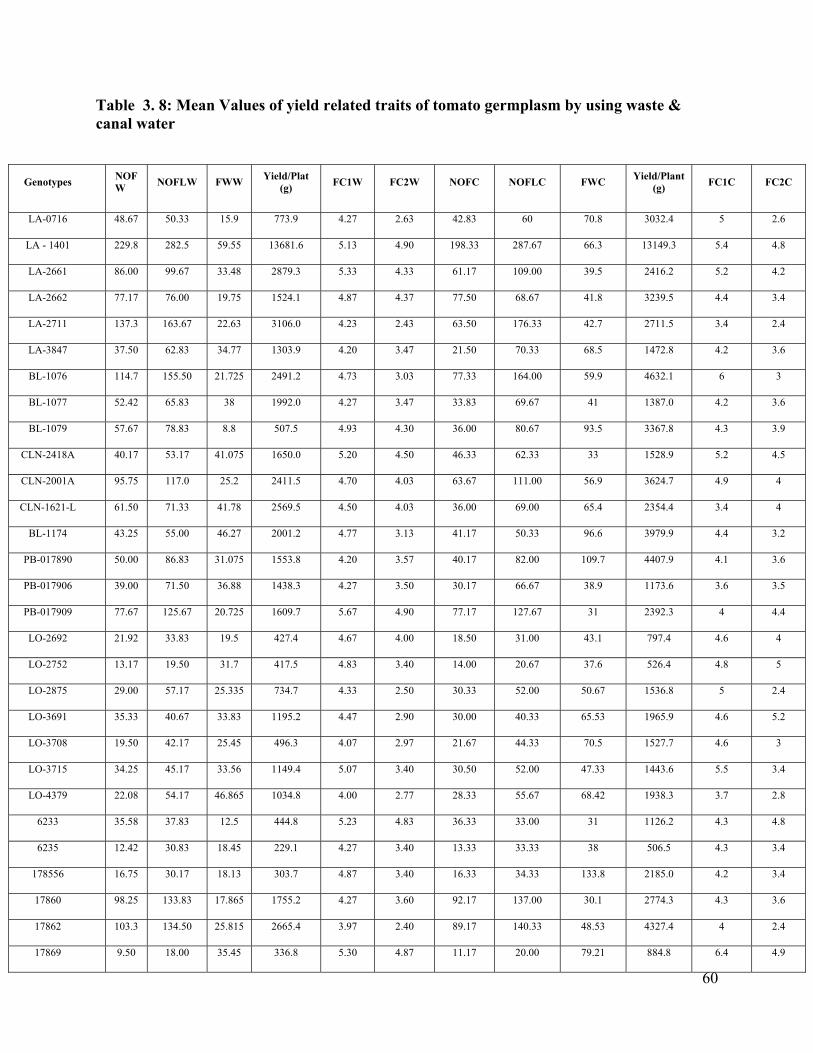
60
Table 3. 8: Mean Values of yield related traits of tomato germplasm by using waste & canal water
Genotypes NOFW
NOFLW FWW Yield/Plat
(g) FC1W FC2W NOFC NOFLC FWC
Yield/Plant(g)
FC1C FC2C
LA-0716 48.67 50.33 15.9 773.9 4.27 2.63 42.83 60 70.8 3032.4 5 2.6
LA - 1401 229.8 282.5 59.55 13681.6 5.13 4.90 198.33 287.67 66.3 13149.3 5.4 4.8
LA-2661 86.00 99.67 33.48 2879.3 5.33 4.33 61.17 109.00 39.5 2416.2 5.2 4.2
LA-2662 77.17 76.00 19.75 1524.1 4.87 4.37 77.50 68.67 41.8 3239.5 4.4 3.4
LA-2711 137.3 163.67 22.63 3106.0 4.23 2.43 63.50 176.33 42.7 2711.5 3.4 2.4
LA-3847 37.50 62.83 34.77 1303.9 4.20 3.47 21.50 70.33 68.5 1472.8 4.2 3.6
BL-1076 114.7 155.50 21.725 2491.2 4.73 3.03 77.33 164.00 59.9 4632.1 6 3
BL-1077 52.42 65.83 38 1992.0 4.27 3.47 33.83 69.67 41 1387.0 4.2 3.6
BL-1079 57.67 78.83 8.8 507.5 4.93 4.30 36.00 80.67 93.5 3367.8 4.3 3.9
CLN-2418A 40.17 53.17 41.075 1650.0 5.20 4.50 46.33 62.33 33 1528.9 5.2 4.5
CLN-2001A 95.75 117.0 25.2 2411.5 4.70 4.03 63.67 111.00 56.9 3624.7 4.9 4
CLN-1621-L 61.50 71.33 41.78 2569.5 4.50 4.03 36.00 69.00 65.4 2354.4 3.4 4
BL-1174 43.25 55.00 46.27 2001.2 4.77 3.13 41.17 50.33 96.6 3979.9 4.4 3.2
PB-017890 50.00 86.83 31.075 1553.8 4.20 3.57 40.17 82.00 109.7 4407.9 4.1 3.6
PB-017906 39.00 71.50 36.88 1438.3 4.27 3.50 30.17 66.67 38.9 1173.6 3.6 3.5
PB-017909 77.67 125.67 20.725 1609.7 5.67 4.90 77.17 127.67 31 2392.3 4 4.4
LO-2692 21.92 33.83 19.5 427.4 4.67 4.00 18.50 31.00 43.1 797.4 4.6 4
LO-2752 13.17 19.50 31.7 417.5 4.83 3.40 14.00 20.67 37.6 526.4 4.8 5
LO-2875 29.00 57.17 25.335 734.7 4.33 2.50 30.33 52.00 50.67 1536.8 5 2.4
LO-3691 35.33 40.67 33.83 1195.2 4.47 2.90 30.00 40.33 65.53 1965.9 4.6 5.2
LO-3708 19.50 42.17 25.45 496.3 4.07 2.97 21.67 44.33 70.5 1527.7 4.6 3
LO-3715 34.25 45.17 33.56 1149.4 5.07 3.40 30.50 52.00 47.33 1443.6 5.5 3.4
LO-4379 22.08 54.17 46.865 1034.8 4.00 2.77 28.33 55.67 68.42 1938.3 3.7 2.8
6233 35.58 37.83 12.5 444.8 5.23 4.83 36.33 33.00 31 1126.2 4.3 4.8
6235 12.42 30.83 18.45 229.1 4.27 3.40 13.33 33.33 38 506.5 4.3 3.4
178556 16.75 30.17 18.13 303.7 4.87 3.40 16.33 34.33 133.8 2185.0 4.2 3.4
17860 98.25 133.83 17.865 1755.2 4.27 3.60 92.17 137.00 30.1 2774.3 4.3 3.6
17862 103.3 134.50 25.815 2665.4 3.97 2.40 89.17 140.33 48.53 4327.4 4 2.4
17869 9.50 18.00 35.45 336.8 5.30 4.87 11.17 20.00 79.21 884.8 6.4 4.9

61
17871 55.92 65.33 55.3 3092.4 5.27 4.67 52.50 68.67 69.5 3648.8 5 4.7
CHILO 37.75 36.67 42.155 1591.4 5.07 3.20 33.83 34.67 107.8 3646.9 5.1 3.2
MACHIA 67.75 73.17 43.655 2957.6 5.00 3.43 28.83 77.00 49.05 1414.1 5.1 3.2
PAKIT 32.00 49.50 26.51 848.3 4.93 3.43 78.33 52.00 50.98 3993.3 5.4 3.4
TWL-23 99.42 167.67 52.18 5187.7 4.97 4.70 86.83 168.33 93.4 8109.9 5.2 4.7
10592 242.8 269.67 51.505 12502.8 4.53 3.83 231.33 269.00 22.12 5117.0 4.5 3.8
19894 68.58 103.50 32.78 2248.1 5.43 3.40 71.83 96.33 36 2585.9 5.3 3.4
CIM-1927 94.58 100.83 35.85 3390.7 4.60 3.97 92.83 97.33 42.73 3966.6 4.5 4
17872 79.00 113.83 53.75 4246.3 5.37 4.23 73.00 112.00 55 4015.0 5 4.2
HIT-9076-08 137.8 115.00 35.5 4893.0 5.57 5.03 128.33 110.00 63.6 8161.8 4.4 5
RIOGRANDI 34.75 56.33 18.5 642.9 4.73 4.30 22.33 69.67 31.26 698.0 5.3 5
TY-8A 124.5 163.00 37.8 4706.1 5.23 4.57 108.33 164.67 38.4 4159.9 4.4 4.6
VRIT-44 45.08 71.67 36.1 1627.4 5.27 4.67 40.67 75.67 65.06 2646.0 5.3 4.7
VRIT-45 58.08 103.17 50.85 2953.4 4.50 3.20 26.17 96.33 52.89 1384.1 5.2 3.2
VRIT-47 27.58 30.67 68.01 1875.7 4.23 1.40 32.33 29.33 43.46 1405.1 5.6 1.4

62
3.5. Discussion
The use of wastewater for irrigation has been practiced in many developing countries for
centuries due to scarcity of surface water. Use of wastewater for irrigation has advantages along
with some disadvantages, posing a challenge to policy makers, city planners, environmentalists,
health workers, and residents to determine appropriate solutions. This need for solutions places a
burden on plant breeders to find genotypes that accumulate low burdens of heavy metals in
edible crop tissues. If wastewater application is well managed, it can potentially resolve water
shortages, reduce pollution and improve soil fertility (Jimenez, 2005). Different approaches can
be adopted for waste water treatment to reduce its side effects in relation to heavy metals.
The recommended safe dose of these trace metals is 12-15mg for Zn, while the recommended
daily dietary intake limit for Cu, Mn and Cr is 0.9 mg, 11 mg and 25-35 ug, respectively
(Lawrence et al., 1993: Hashmi et al., 2007). Crop tolerance to one metal (in the sense of low
accumulation levels in crop tissues) does not imply tolerance to other metals (Nelson, 1983).
Various levels of metal accumulation were observed in tomato germplasm for different heavy
metals and in different plant parts.
In general, uptake and accumulation of different heavy metals in fruit was lower than in roots,
shoots, or leaves (Khan et al., 2011). We found that heavy metal accumulations increased in
different parts of tomato plants in the following orders: R >L >S >F for Ni, S > R >L >F for Zn,
L > R > S >F for Pb, L > R > S >F for Cr and L > R > S > F for Mn, all of which clearly
indicates higher accumulation of heavy metals in vegetative parts compared to fruits (Khan et al.,
2011; Rejeb, 2011). Higher concentrations of Mn and Zn were found in tomatoes compared to
Pb, Cr, and Ni, due to high concentrations of Mn and Zn in wastewater used for irrigation. In all
plant parts of tomato genotypes, heavy metals concentrations were higher than safe limits
determined by the National Environmental Quality Standards (NEQS) (John et al., 2012).
Genotypes can be compared through Biplot analysis on the basis of traits and interrelationships
between traits (Yan and Rajcan, 2002; Yan and Tinker, 2006). Comparison of genotypes is
depicted by the perpendicular distance between any two trait vectors (Yan and Kang, 2003).
Biplot analysis and the ranking table indicated that PB-017906 was the best all-around
performing genotype as it possessed tolerance (i.e. low accumulation) for all of the tested heavy
metals. Genotype PB-017906 vector length from the origin was longest, indicating the best
63
performance for different heavy metal tolerance (Yan et al., 2007). CLN-2418A and LA-2662
were the next best performing genotypes as they possessed minimum Ni, Mn, Cr, Zn and Pb
concentrations in fruit tissue. Cr is required as a trace element in minute amount, high
concentration of Cr and Pb results in severe health problems, so while making selection against
these two metals strict criteria were followed. Along with PB-017906, CLN-2418A, and LA-
2662, the genotypes PB-017909 and LO-2752 were also chosenfor their Cr and Pb tolerances,
with minimum uptake of these metals. Selection against these two metals was also done because
these are highly toxic for human health, if present in food, as compared to Mn, Ni and Zn, each
of which are required in small amounts as trace elements. On the other hand, some contrasting
genotypes were selected, like LA-26620, which was high metal-accumulator for all five metals,
while genotypes 19894, PAKIT, BL-1079, HIT-9076-08, and BL-1077 were high metal-
accumulators for Cr, Mn, Ni, Pb, and Zn, respectively.
Genotypes LO-4379 and VRIT- 45 were selected because of their maximum uptake of Cr and
Mn in shoot and leaves, which resulted in phytoremediation as described in the appendix (Table
3.4). Because in tomatoes only the fruit is eaten, phytoremediation using the other parts of the
plant would be a strategy for removing heavy metals from the soil while still producing a
saleable crop. Interestingly, the occurrence of one metal may increase or decrease the uptake of
other metals (Joan et al., 1992).
Traces of heavy metals were also observed in canal water, and in crops irrigated with this canal
water (Jamil et al., 2010) but compared to plants irrigated with wastewater, the concentration of
heavy metals was lower. In addition, different behavior was observed in the same genotypes,
which indicated that tolerance was dependent on the concentration of the metal. Low metal-
accumulators genotypes such as PB-017906 can be used in those areas where no alternative
exists to the use of wastewater for irrigation. Typically, the objective of breeding research is
improved yield and fruit quality, and breeding for improved heavy metal tolerance will help met
this goal. Heavy metal tolerance is the product of metal accumulation and yield of a particular
genotype. It can be defined as the plants growing in soil contaminated with heavy metals, still
producing sustainable yield, whether they are high or low metal accumulators (Macnair et al.,
2000). Wide variation was observed among tomato germplasm for yield-related traits.
64
Of the observed genotypes, 10592 and LA–1401 had the highest yield/Plant, and genotype 6235
was observed to be poorest performing for yield/Plant under both treatments. Individual fruit
weights of genotypes 10592 and LA – 1401 were lower, but the plants had the highest number of
fruits (Islam et al., 2012). Hybridization may be effective in the development of genotypes
having high yield with good fruit weight. For such crop improvement, correlation studies are
important (Kumar et al., 2003; Chaudhary and Sharma, 2003; Kumar and Sharma, 2006). Strong
positive correlation exists between the number of flowers and number of fruits (Ghosh et al.,
2010). Unfortunately, all of high yielding genotypes were high metal-accumulators to Cr and Mn
accumulation, moderately low metal-accumulators of Ni and Pb, and moderately high metal-
accumulators to Zn. In conclusion we need to select low metal accumulator genotype like PB-
017906 for further hybridization scheme with the objective of improving their yield as well as
heavy metals tolerance. Marked differences were observed for heavy metals accumulation and
yield among different tomato accessions. Higher concentration were observed in vegetative part
as compared to fruit tissues. The resulting information from this research will be helpful in the
development of low metal-accumulators tomato genotype suitable for soil contaminated with
heavy metals by the use of wastewater.

65
Chapter 4:
ASSESSMENT OF GENETIC BASIS OF HHEAVY MMETALS TOLERANCE AND
YIELD RELATED TRAITS
4.1. Introduction
Tomato (Solanum lycopersicon) is a perennial, short lived vegetable grown worldwide in
temperate climates. In Pakistan, acreage devoted to tomato production increased 54% between
1997 and 2014, but average yield has stagnated (MINFAL, 2007). In 2009-10, 63,000 ha of
tomato were cultivated in Pakistan, with a production of 562,900 tons for a yield of 1,052 kg/ha
(Agricultural Statistics of Pakistan, 2010). Comparatively, the average yield in developed
countries is about 50% greater (1,562 kg/ha). This difference in yield is due to several biotic and
abiotic factors. Yield and heavy metal tolerance are complex traits affected by genetic factors as
well as various stresses. A wide range of genetic heritable variability exists in tomato for
different characteristics (Gabal et al., 1985; Hussain et al., 2001). Heterosis (Hedrick and Booth,
1968) plays an important role in raising production in tomato, conferring greater vigor, resistance
to different biotic and abiotic stresses, faster development, higher productivity, and early yield
(Choudhary et al., 1965; Yordanov, 1983).
Heavy metal tolerance (i.e., resistance to metal accumulation in plant tissues with sustainable
yield) is governed by several major and modifier genes (McNair et al., 2000; Schat et al., 2000).
In wheat, a few genes are responsible for Mn tolerance. In alfalfa, Mn tolerance is attributed to
additive effects of several genes, while in lettuce it is controlled by one to four genes and in
soybean it is controlled by multiple genes (Graham et. al., 1988). Plant breeding methods
provide information about type of gene action (additive, dominant or epistasis) in particular
cases. Different biometrical techniques are available for genetic analysis such as the North
Carolina Model, generation mean analysis, and Diallel and line*Tester (Eshghi and Aakhundova,
2009). Of these, the North Carolina Model 11 is one of the best biometrical techniques to obtain
information about the type of gene action acting in particular breeding programs.
Wastewater is one of the best alternatives to surface water for irrigation in areas of water
scarcity, but due to presence of heavy metals, its application carries serious risks for soils, plant
yield and human health. Study of the genetic basis of heavy metal tolerance (resistance to

66
accumulation with sustainable yield) is important to develop heavy metal tolerant genotypes of
vegetables and crops for production in fields irrigated with wastewater. Tomato is one of the
most important vegetables grown in peri urban farming areas, where it is commonly irrigated
with wastewater. We therefore screened tomato germplasm to determine the best performing
genotypes in relation to both heavy metal accumulation and yield when wastewater was used for
irrigation. Heavy metals tolerance facilitates plants in sustaining growth even in the presence of
toxic metal concentrations (Clemens 2006). Keeping in mind the limitations of wastewater and
unavailability of surface water, the main objective of this study was to assess the genetics of
heavy metals tolerance and yield improvement under waste and canal water irrigation.
4.2. Material and Methods
Genotypes were selected as tolerant and susceptible On the basis of atomic absorption
spectrophotometer (Table 3.7). The seeds of the selected genotypes were sown in trays and after 45
days of seedling establishment, the seedlings were transplanted in the field in three replications and
two treatments i.e. waste water and canal water. At maturity crossing was done according to North
Carolina Design-II matting.
4.2.1. Emasculation
The flower buds were emasculated with the help of forceps that were about 2 days before opening
and cover with butter paper bag. All the opened flowers were removed on the same or nearby
inflorescences that may shed pollen on the exposed stigma.
4.2.2. Pollen collection
The desired male flowers were collected in clean plastic bottles and dried enough so that they
opened up to release pollen. Heating of anthers in oven to dry is not well because it may kill the
pollen. Anthers were dried in the sun or under an incandescent lamp for at least 18" away so that
the pollen seems to work well. At the cap of the bottle cloth was tied for pollen collection. The
bottles were shacked well so that the pollens were separated and collected in the cap of the bottles.
4.2.3. Pollination

67
Pollen were applied to the exposed stigma with a dissecting needle, also the style was dipped into
the Petri dish containing pollen to make sure that the stigma had plenty of pollen to ensure good
seed set. In a few days the ovary enlarged, the first signs of successful pollination. For best results,
emasculation and pollination were done on same day. After each cross pollinating tools were
cleaned with 95% ethanol.
4.2.4. Seed Extraction
At maturity fruits of F1 and selected parents were collected in bags, crushed and fermented. Seeds
were washed with fresh water to remove flesh and skin. The floating pieces were removed gently
and washing was repeated many times by adding fresh water to remove flesh and gel completely.
Clean seeds was collected, dried and stored.
4.2.5. Assessment of Plant material for genetic studies
To determine the inheritance pattern of heavy metals tolerance and yield related traits the seeds of
F1 and selected parents were sown in trays during normal crop season in November 2013 and after
45 days of seedling establishment, the seedlings were transplanted in the field in three replications
with two treatments i.e. waste water and canal water to develop plant material for genetic studies.
At maturity the data was collected regarding yield and heavy metals concentration determination in
fruit.
1. Number of flowers per truss
2. Number of fruits per cluster
3. Ni concentration in fruit
4. Zn concentration in fruit
5. Mn concentration in fruit
6. Cr concentration in fruit
7. Pb concentration in fruit
4.3.5. Statistical Analysis

68
The data were analyzed statistically in order to find out significant differences by using analysis
of variance technique (Steel et al. 1997), and genetic components of variation were derived
following Kearsey (1965) and Lawrence (1984).
Significantly varying genotypes were subjected to North Carolina Design II matting scheme
(Comstock and Robinson, 1948, 1952) to estimate their gene action.
trait theofmean Grand__
X
p2
= phenotypic variance, g2
= genotypic variance
Broad sense heritability for each recorded trait was calculated as a ratio of the genotypic
variances to phenotypic variances.
Genetic advance (GA) was calculated by the following formula (Falconer, 1989).
GA = σp × h2 × i
Where: σp = the phenotypic standard deviation; h2= Estimate of broad sense heritability; i =
constant value (1.755) that reflects selection intensity (10%).
As suggested by Johnson et al., (1955a), genetic advance as percentage values is categorized as
follows:
Low: Less than 10%
Moderate: 10-20%
High: More than 20%
4.4.6. Heritability Estimate
Broad sense heritability was calculated by using genotypic, phenotypic and environmental
variances according to Burton, 1951.
Broad sense heritability = (2g + 2
e) - 2e × 100
2g + 2
e
69
2g = Genotypic variance, 2
e = Environmental variance, 2g + 2
e = Phenotypic variance
(2g + 2
e) - 2e = Genotypic variance
As suggested by Johnson et al., (1955a), heritability values are categorized as follows:
Low: Less than 30%
Moderate: 30-60%
High: More than 60%
4.4.7. North Carolina Design-II matting scheme
Male (n1) and female (n2) were selected against desired traits and crossed in all possible
combinations (n1× n2). The n1× n2 progenies were grown in replicated trails. The variations in the
families were divided between and within the full-sib families. The variations between families
were further divided into components due to differences among the males, females and male×
female interaction. Following statistical model was used:
Yijk = µ + m1 + f1 + (m× f)ij+ eijk
Where, Yijk= the kth observation on i × jth progeny
µ = the general mean
m1 = the effect of ith males
f1 = the effect of jth females
(m× f)ij = the interaction effects
eijk = error effects due to each observation
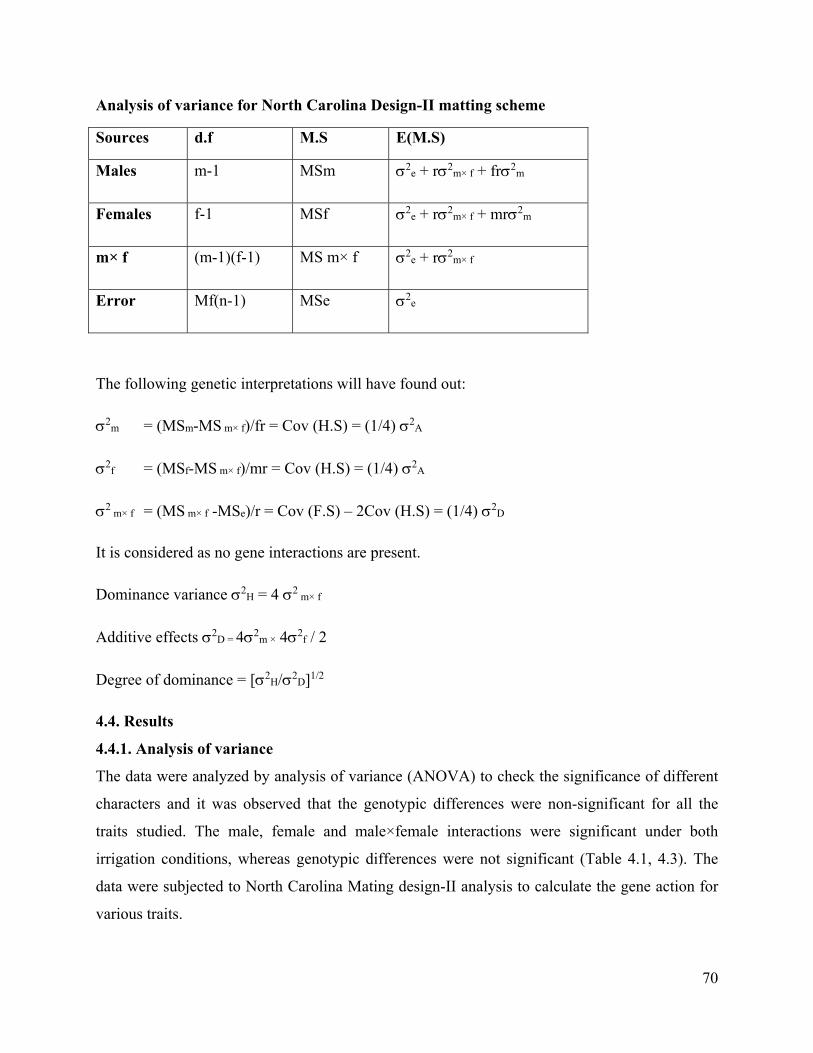
70
Analysis of variance for North Carolina Design-II matting scheme
Sources d.f M.S E(M.S)
Males m-1 MSm 2e + r2
m× f + fr2m
Females f-1 MSf 2e + r2
m× f + mr2m
m× f (m-1)(f-1) MS m× f 2e + r2
m× f
Error Mf(n-1) MSe 2e
The following genetic interpretations will have found out:
2m = (MSm-MS m× f)/fr = Cov (H.S) = (1/4) 2
A
2f = (MSf-MS m× f)/mr = Cov (H.S) = (1/4) 2
A
2 m× f = (MS m× f -MSe)/r = Cov (F.S) – 2Cov (H.S) = (1/4) 2
D
It is considered as no gene interactions are present.
Dominance variance 2H = 4 2
m× f
Additive effects 2D = 42
m × 42f / 2
Degree of dominance = [2H/2
D]1/2
4.4. Results
4.4.1. Analysis of variance
The data were analyzed by analysis of variance (ANOVA) to check the significance of different
characters and it was observed that the genotypic differences were non-significant for all the
traits studied. The male, female and male×female interactions were significant under both
irrigation conditions, whereas genotypic differences were not significant (Table 4.1, 4.3). The
data were subjected to North Carolina Mating design-II analysis to calculate the gene action for
various traits.

71
4.4.2.1. Yield related traits
Significant differences in number of flowers and fruits were observed among genotypes (Table
4.1). Analyses showed that 2m = male additive variance (601.3), and 2
f = female additive
variance (8,329.1) were higher than 2m×f = m×f interaction additive variance (268.9) for the
total number of fruits. Higher values of cumulative additive variance (11,907.2) than dominance
variance (1,075.4) revealed that this characteristic is controlled by an additive type of gene
action. Meanwhile, the degree of dominance was less than 1 (i.e. 0.30), which showed a partial
type of dominance for the number of fruits (Table 4.2). A similar pattern of gene action was
observed for the number of flowers, in which genotypic differences were significant for the
number of flowers (Table 4.1). 2f = Female additive variance (7,576.3) was higher than 2
m =
male additive variance (342.2), and 2m×f = m×f interaction additive variance (745.5). The higher
value of cumulative additive variance than dominance variance revealed that this characteristic
was controlled by an additive type of gene action. The degree of dominance was 0.53, which
showed partial dominance under wastewater irrigation (Table 4.2).
When canal water was used for irrigation, a similar pattern of gene action was observed for total
number of flowers and total number of fruits. Female additive variances (6,639.95) were higher
than male additive variances (424.15) and the male × female interaction (474.31) for the total
number of fruits. Similarly, the female additive variances for the total number of flowers
(7,300.9) were higher than male additive variances (377) and the male × female interaction
(551.3). That the cumulative additive variance was higher than the dominance variance for both
traits revealed that these characteristics were controlled by an additive type of gene action. The
degree of dominance was lower than 1 and partial dominance was observed for both
characteristics. Female and male (MSf/MSm) square ratios were both significant for the number
of flowers and the number of fruits under both treatments (wastewater and canal water
irrigation), indicating the involvement of extra chromosomal inheritance for yield by these traits.
However, this inheritance was not included in the female additive variance. Heritability of yield
related traits was 0.99, while the genetic advance was 111.8 and 106.3 for the number of fruits
and the number of flowers when wastewater was used. Under canal water irrigation the broad
sense heritability (0.91, 0.99) and genetic advance (106) were observed for both the number of
fruits and the number of flowers (Table 4.5).
72
4.4.4. Heavy metals tolerance
Different types of gene action were observed for heavy metals tolerance in fruit tissue as
compared to yield related traits, suggesting that genotypes possess significant differences in
heavy metal tolerance (Table.4.1). Analyses indicated that 2f = female additive variance was
higher than 2m = male additive variance, but 2
m×f = m×f interaction additive variance was
higher than either male or female additive variance. However, the values of dominance variance
(4.83, 16.1, 4.69, 76.95 and 249.37) were higher than cumulative additive variance (0.18, 2.36,
0.19, -0.27 and 14.14) for Ni, Cr, Pb, Mn, and Zn, respectively (Table 4.2). From Table 4.2, it
can be seen that dominance variance was higher than additive variance for heavy metals
tolerance. The degree of dominance for Ni, Cr, Pb, Mn and Zn, uptake was 5.1, 2.5, 4.9, -16.7
and 4.2, respectively, when wastewater was used for irrigation. Degree of dominance >1
revealed over dominance for all metals tolerance. Broad sense heritability of Cr, Mn, Ni, Pb, and
Zn were 0.70, 0.85, 0.62, 0.73 and 0.85, respectively, under wastewater application, while
genetic advance was 91, 113.3, 73.8, 65.1 and 36.1 for Cr, Mn, Ni, Pb, and Zn, respectively
(Table 4.5).
Similar gene action was observed for heavy metal tolerance when canal water was used for
irrigation. Significant differences were observed for heavy metal tolerance among genotypes
(Table 4.3). Analyses indicated that 2f = female additive variance was higher than 2
m = male
additive variance. However, 2m×f = m×f interaction additive variance was higher than either
male or female additive variance for all heavy metals. The values of dominance variance (1.44,
5.81, 1.66, 15.8 and 100.73) were higher than those of cumulative additive variance (0.10, 0.54,
0.23, 0.12 and 6.67) for Ni, Cr, Pb, Mn, and Zn, respectively (Table 4.4). From Table 4.4, it can
be seen that dominance variance was higher than cumulative additive variance for all heavy
metals tolerance. The degree of dominance for Ni, Cr, Pb, Zn, and Mn uptake was 3.8, 3.3, 2.7,
11.5, and 3.9, respectively, when canal water was used for irrigation. The values of degree of
dominance higher than 1 revealed over dominance for all metals tolerance. Both female and male
MSf/MSm square ratios were significant for Ni, Cr, Pb, Mn andZn tolerance under both
treatments (wastewater and canal water), indicating the involvement of extra chromosomal
inheritance for heavy metals tolerance. However, this inheritance was not included in female
additive variance.
73
When canal water was used for irrigation the broad sense heritability was 0.51, 0.72, 0.60, 0.69,
and 0.82 for and the genetic advance was 77.7, 98.5, 79.9, 81.9 and 41.8 for Ni, Cr, Pb, Zn, and
Mn respectively (Table 4.6).

74
Table 4.1: Analysis of variance for yield and heavy metals accumulation by using waste water (North Carolina matting design-II)
SOV/Traits NOF NOFL Ni Cr Pb Mn Zn
Replication 8 ns 71 ns 0.2448 ns 0.235 ns 0.004 ns 0.363 ns 0.69 ns
Males 13438** 9478** 1.3642** 5.125** 4.679** 17.358** 160.37**
Females 225698** 206852** 11.4952** 73.505** 8.863** 118.965** 549.45**
M × F 811** 2293** 4.1853** 14.057** 4.775** 64.257** 205.25**
Error 5 56 0.5652 1.979 1.255 6.542 18.22
MSf/MSm 16.79 21.82 8.42 14.34 1.89 6.85 3.43
SOV = Source of Variation, NOF = Number of fruits, NOFL = Number of flowers, Ni = Nickle, Cr = Chromium, Pb = Lead, Mn = Manganese,
Zn =Zinc
Table 4.2: Analysis of variance for yield and heavy metals accumulation by using waste water (North Carolina matting design-II)
* = Significant at 1 % significance level, ** = Significant at 5 % significance level, ns = Non-signifiant2m = male additive
variance, 2f = Female additive variance, 2
m×f = m×f interaction additive variance, 2H = Dominace variance, 2
D = commulative additive variance, [2
H/2D]1/2 = Degree of dominance
SOV/Traits NOF NOFL Ni Cr Pb Mn Zn
2m 601.3 342.2 -0.13434 -0.4254 -0.00457 -2.2333 -2.137
2f 8329.1 7576.3 0.27074 2.2018 0.15141 2.0262 12.748
2m×f 268.9 745.5 1.20671 4.0260 1.17327 19.2385 62.343
2D 11907.2 10557.9 0.18187 2.3686 0.19578 -0.2761 14.148
2H 1075.4 2981.9 4.82684 16.1039 4.69310 76.9539 249.372
[2H/2
D]1/2 0.30 0.53 5.13 2.54 4.89 -16.69 4.19

75
Table 4.3: Analysis of variance for yield and heavy metals accumulation by using canal water (North Carolina matting design-II)
SOV/Traits
NOF NOFL Ni Cr Pb Mn Zn
Replication
27ns 2ns 0.2419 ns 0.0871 ns 0.0695 ns 0.259 ns 0.130 ns
Males 10383** 9601** 1.0211** 2.6534** 1.2923** 11.652** 29.208**
Females 180755** 198808** 3.6906** 18.3007** 6.6098** 19.598** 283.268**
M × F 1476** 1683** 1.3026 ** 4.7114** 1.5910** 14.064** 81.290**
Error 53 29 0.2240 0.3506 0.3447 2.215 5.743
MSf/MSm
17.41 20.70 3.6 6.90 5.123 1.68 9.69
SOV = Source of Variation, NOF = Number of fruits, NOFL = Number of flowers, Ni = Nickle, Cr = Chromium, Pb = Lead, Mn = Manganese,
Zn =Zinc
Table 4.4: Various genetic components for yield and heavy metals accumulation by using canal water (North Carolina matting design-II)
SOV/Traits NOF NOFL Ni Cr Pb Mn Zn
2m 424.15 377.0 -0.01340 -0.09800 -0.01422 -0.1149 -2.480
2f 6639.95 7300.9 0.08845 0.50331 0.18588 0.2050 7.481
2m×f 474.31 551.3 0.35953 1.45358 0.41544 3.9496 25.182
2D 9418.80 10237.3 0.10006 0.54042 0.22888 0.1202 6.667
2H 1897.22 2205.2 1.43811 5.81432 1.66177 15.7984 100.729
[2H/2
D]1/2 0.45 0.46 3.79 3.28 2.69 11.46 3.88
* = Significant at 1 % significance level, ** = Significant at 5 % significance level, ns = Non-significant 2m = male
additive variance, 2f = Female additive variance, 2
m×f = m×f interaction additive variance, 2H = Dominance
variance, 2D = commulative additive variance, [2
H/2D]1/2 = Degree of dominance
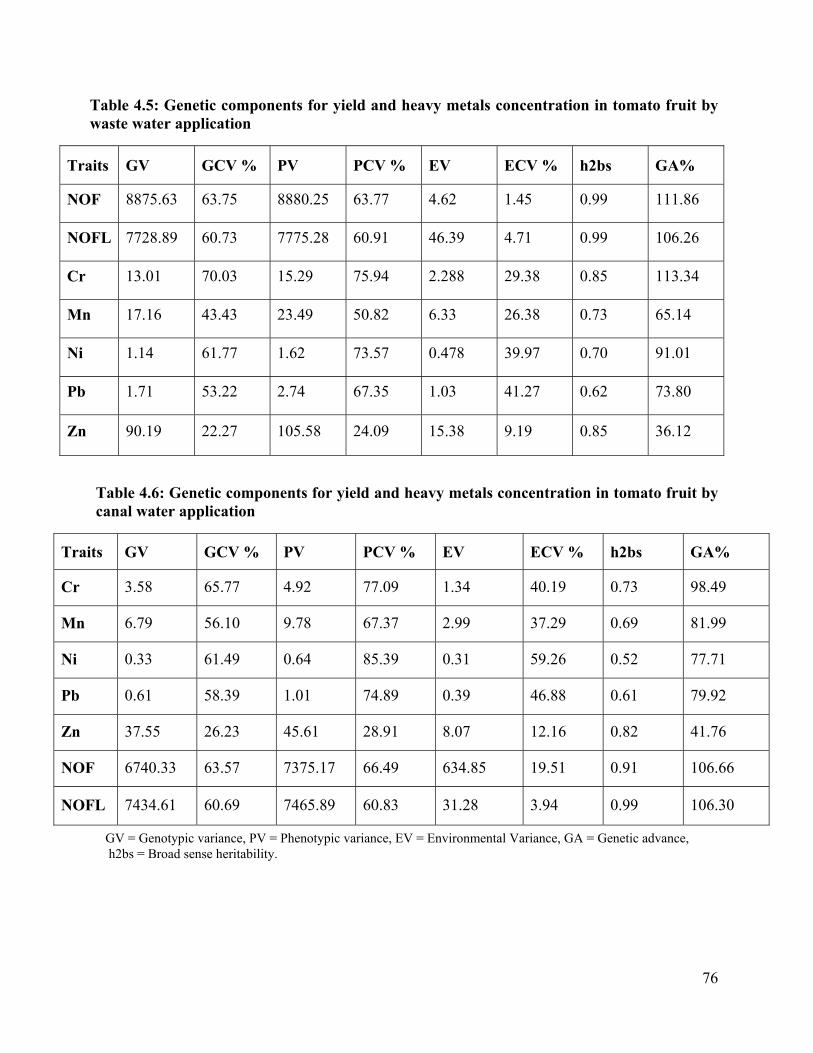
76
Table 4.5: Genetic components for yield and heavy metals concentration in tomato fruit by waste water application
Traits GV GCV % PV PCV % EV ECV % h2bs GA%
NOF 8875.63 63.75 8880.25 63.77 4.62 1.45 0.99 111.86
NOFL 7728.89 60.73 7775.28 60.91 46.39 4.71 0.99 106.26
Cr 13.01 70.03 15.29 75.94 2.288 29.38 0.85 113.34
Mn 17.16 43.43 23.49 50.82 6.33 26.38 0.73 65.14
Ni 1.14 61.77 1.62 73.57 0.478 39.97 0.70 91.01
Pb 1.71 53.22 2.74 67.35 1.03 41.27 0.62 73.80
Zn 90.19 22.27 105.58 24.09 15.38 9.19 0.85 36.12
Table 4.6: Genetic components for yield and heavy metals concentration in tomato fruit by canal water application
Traits GV GCV % PV PCV % EV ECV % h2bs GA%
Cr 3.58 65.77 4.92 77.09 1.34 40.19 0.73 98.49
Mn 6.79 56.10 9.78 67.37 2.99 37.29 0.69 81.99
Ni 0.33 61.49 0.64 85.39 0.31 59.26 0.52 77.71
Pb 0.61 58.39 1.01 74.89 0.39 46.88 0.61 79.92
Zn 37.55 26.23 45.61 28.91 8.07 12.16 0.82 41.76
NOF 6740.33 63.57 7375.17 66.49 634.85 19.51 0.91 106.66
NOFL 7434.61 60.69 7465.89 60.83 31.28 3.94 0.99 106.30
GV = Genotypic variance, PV = Phenotypic variance, EV = Environmental Variance, GA = Genetic advance, h2bs = Broad sense heritability.
77
4.3. Discussion
Genetic variation plays an important role in developing potential plant material for improved
yield and heavy metals tolerance. For the efficient use of variation, the desired characters should
be genetically controlled (Shannon, 1978). Selection of breeding procedures adopted for the
improvement of desired traits like heavy metals tolerance and yield is possible if knowledge of
genetic effects governing the inheritance is available. In this instance, additive and non-additive
(dominance) genetic effects were involved in the inheritance of these traits. Assessment of these
yield and heavy metal accumulation traits can be carried out through simple genetic models but
due to the polygenic nature, the interaction effects disturbs the Mendelian ratio and leads to
undesirable phenotypes. North Carolina Mating Design II (NCM II) provides precise information
about additive, non-additive and maternal effects involved in the genetic control of different
traits. Along with this, a large number of female and male parents can be used in the crossing
plan, although the main drawback of this design is that it cannot provide any information about
epitasis effects. To analyze the genetic behavior (additive and non-additive) of the desired traits
in tomato, NCM II was used (Comstock and Robinson, 1952). The inheritance pattern of yield in
tomato is complex and involved interaction between three or more genes (Chahal et al., 2004).
Genetic effects and inheritance patterns for yield and heavy metals tolerance was determined,
and in tomato, the number of flowers per branch, the number of fruits per branch and fruit weight
are all major yield-contributing traits and are controlled by multiple genes (Zdravković et al.,
2011).
From the results it can be seen that both additive and non-additive gene actions as well as
maternal effects were involved in controlling different traits like yield and heavy metals
tolerance in tomato showing the involvement of cytoplasm. Higher values of additive variance
for the number of flowers and the number of fruits clearly showed that these traits were
controlled by an additive type of gene action, and that therefore for the improvement of these
characteristics, selection would be effective in subsequent generations (Joshi et al., 2004;
Rahaman et al., 2012; Kumar et al., 2013). For this breeding program, recurrent selection would
be required (Ghosh et al., 2010). Higher values of additive variance and lower values of degree
of dominance [2H/2
D]1/2 than 1 showed partial dominance for the number of flowers and the
number of fruits, and confirmed that these characteristics were controlled by an additive type of

78
gene action. Along with additive and non-additive gene effects, maternal effects were also found
to be involved in the control of the number of flowers, the number of fruits and heavy metals
tolerance involvement of cytoplasm in heavy metals tolerance. Similar results were obtained by
Khan and McNeilly, 2000, who reported the involvement of maternal effects for Al and Mn
tolerance. Mitochondria, chloroplast, and plastid DNA are involved in the inheritance of traits,
along with nuclear genes (Levings and Pring, 1977; Corriveau and Coleman, 1988). Cell walls,
vacuoles as well as plasma membranes all play important roles in heavy metals tolerance
(Harvey et al., 1972; Machado et al., 1978). This study demonstrated the involvement of some
extra chromosomal inheritance (maternal effects) for heavy metals tolerance as well as yield
related traits.
Heritability is considered an excellent index for transmission of characteristics to subsequent
generations, so to realize improvement in yield-contributing traits, a plant breeder must have a
clear assessment of the amount of heritability present in the breeding population. This also
informs the performance of later generations and their target traits to any breeding procedure.
Variances (both genotypic and environmental) can be used to estimate the amount of heritability
and genetic advance, which shows the amount of genetic variation in relation to environmental
variations. Both heritability and genetic advance were high with high additive gene effects for
the number of flowers and fruits, and therefore direct selection without hybridization may be
helpful for the improvement of these characteristics (Saleem et al., 2010; Mohamed et al., 2012;
Al-Aysh et al ., 2012). These results suggest that for tomato, while both additive and dominant
gene effects were significant, dominance variance was higher than additive variance for heavy
metals tolerance (Gartside and Mcneilly, 1974). Therefore, hybrid development may be effective
for metals tolerance using males and females in the next generations, and progeny testing may be
necessary for hybrid development (Haq et al., 2010). Metals tolerance was controlled by
dominant gene action which indicates that hybrid production is the best way to use the existing
variability for this trait (Wilkins, 1960; Broker, 1963). Higher values of female than male
additive variance indicate that the improvement of metals tolerance selection for females will be
effective in subsequent generations because through selection the additive portion can be fixed.
The higher values of degree of dominance [2H/2
D]1/2 showed over dominance for the control of
heavy metals tolerance which indicates that heavy metals tolerance is controlled by both additive
79
and non-additive genetic effects.
Heritability and genetic advance estimates also provide reasonable information about inheritance
patterns of yield and heavy metal tolerance. Traits possessing higher genetic advance with high
or low heritability estimates are desirable because of higher additive genetic effects; therefore,
selection may be effective on the basis of genetic advance. Higher heritability estimates with
lower genetic advance are not desirable because of non-additive genetic effects, which show that
the traits’ expression is regulated by environmental effects and for such traits, selection is not
effective. Heritability and genetic advance was high to moderate for Pb, Cr, Mn, and Ni
tolerance but not for Zn, and therefore direct selection without hybridization may be helpful for
these characteristics (Saleem et al., 2011). Because genetic advance is the direct measure of
additive variance but the accumulative additive variance was less than dominance variance for
heavy metal tolerance, high heritability and genetic advance for Pb, Cr, Mn, and Ni may be due
to the female plants, which possess higher values of additive variance (Rahaman et al., 2012;
Islam et al., 2102).
Estimates for different genetic components revealed that an additive genetic effect was
responsible for inheritance of yield-related traits such as the number of flowers and the number
of fruits per plant, while a dominance genetic effect was responsible for inheritance of different
heavy metals tolerance. From the above results it was observed that along with additive and non-
additive genetic effect maternal effects were involved in controlling different traits like yield and
heavy metals tolerance in tomato showing the involvement of cytoplasm. An evaluation of large
number of hybrids/accessions is recommended to develop low metal-accumulators tomato
genotypes with higher yield. Because the above results are from a limited set of tomato
germplasm, they cannot be generalized for all tomato genotypes.
80
Chapter 5
TRANSCRIPTOME PROFILING OF HEAVY METALS TOLERANCE
RELATED GENES
5.1. Introduction
Abiotic factors such as drought, salinity, heavy metals, and high or low temperature are stresses
often responsible for reduction in crop yield (Confalonieri, 2009). While heavy metals are
important both industrially and biologically, they are not degraded by any process (Sharmaa et
al., 2007), and one of the most alarming future threats to crop productivity is heavy metal stress
(Wang et al., 2001). Plants are responsible for transferring heavy metals from abiotic to biotic
systems, thereby introducing these elements into the food web (Horsfall et al., 2004; Mukesh,
2008). The availability of heavy metals to plants depends on a number of factors, including the
concentration and chemical form of the metal, surface area, reduction/oxidation, hydrous oxide
cation exchange capacity (CEC) pH, organic matter,and texture of soil (Mantovi et al., 2004;
Fracios et al., 2004). In addition, one metal may increase or decrease the uptake of other metals
(Cosio et al., 2004). Water soluble heavy metals with high mobility enter the roots and reach the
xylem via an apoplastic/symplastic pathway, through the cortical tissue and spread throughout
the plant (Salt et al., 1995). However, it has been hypothesized that heavy metals accumulate in
fruits through phloem transport, resulting in a diffusion of heavy metals throughout the whole
plant (Benavides et al., 2005). Toxicity of heavy metals depends on concentration and type of
ion, along with plant physiology and growth stage. Lethal concentrations of essential and non-
essential heavy metals disrupt cell structure and inhibit plant growth by reducing physiological
and biochemical activities (Chojnacka et al., 2005). Heavy metals become bound with ligands
containing nitrogen, sulfur, or oxygen groups. Metals also bind with active sites of enzymes,
interfering with enzyme function, especially the metallo enzymes. These chemical interactions
result in the substitution of toxic metals for essential elements like Ca, Mg, Fe, Mo, and P due to
chemical similarities and competition for binding sites. As a result of such substitutions,
deficiencies of these essential elements can occur in important enzymes, reducing enzymatic
activity (Babula et al., 2008). Similarly, heavy metals cause the formation of free radicals and
reactive oxygen species, which affect membrane permeability of cells and organelles. Electron

81
transport, anchoring points for proteins, ATP generation, solute transport, ion channels, and
carrier proteins systems are thereby disturbed by such metals (William, 1976: Pietrini et al.,
2003; Milone et al., 2003).
Plants possess various molecular mechanisms of tolerance that allow them to cope with elevated
concentrations of heavy metals, including reduced uptake, chelation by root exudates, binding of
heavy metals with cell walls, movement of heavy metals out of plasma membranes, localization
of heavy metals into vacuoles, repair of proteins damaged by high metal concentrations, and
chelation by ligands such as metallothionine and metal binding proteins (Yang et al., 2003; Hall,
2002; Pall et al., 2006. Epidermal cell walls of root are in direct contact with metals present in
the surrounding soil; such cells play important roles in reducing the damage from heavy metals.
Some heavy metals are bound by proteins in epidermal cells reducing the translocation and
accumulation of heavy metals to upper parts of the plant (Ernst et al., 1994: Bringezu et al.,
1999). Similarly, root exudates such as oxalic acid, histidine, citrate and malic acid play
important roles in a plant’s tolerance of heavy metals. These products induce chelation of heavy
metals in soil water, rendering them unavailable for plants. However, even if such chelated forms
are taken up by plants, they are non-toxic and are stored in different plant parts such as leaves
(Huang et al., 1996: Salt et al., 2000). Under Ni stress, histidine and citrate production in plants
increased many folds, which resulted in Ni detoxification through chelation. Similarly, under Al
stress, buckwheat secretes more oxalic acid, resulting in Al chelation and loss of Al toxicity (Ma
et al., 1997).
Intracellular tolerance of metals by plants is due to the formation of complexes between heavy
metals and chelating agents such as organic acids (oxalate, malate, citrate), phytochelators (PC),
and metallothionin (Wang et al., 2001). Phytochelators are produced by plants, and are metal-
binding, cysteine-rich non-protein peptides responsible for transfer of essential metals to
different parts of the plant. These chelators bind to the heavy metals, forming a ring-like
structure, resulting in the metal’s detoxification and inactivation and, ultimately, storage in
vacuoles (Shak and Nongkynrih, 2007). Heavy metal tolerance and exclusion by plants may be
due to the release of organic acids from roots, which results in chelation in the rhizosphere,
preventing the entry of these metals into roots. Similarly, the production of compatible solutes,
ion compartmentalization, facilitated membrane transport and hormonal balance are also

82
responsible for reducing the negative effects of high concentrations of heavy metals
(Bhattacharya et al., 2010: Fatima et al., 2011; Achakzai et al., 2011).
Another tolerance mechanism possessed by plants against high concentrations of heavy metals is
the altered expression of some special genes, such as the over expression of some stress-related
proteins, signaling proteins related to stress regulation, and expression of tolerance pathways
mediated by glutathione (Thapa et al., 2012). Metallothioneins (M.thio) are metal-binding,
cysteine-rich proteins that help in regulation of essential metals through their chelation and
detoxification when they are present at or above threshold levels. They are also involved in the
translocation and storage of the resultant detoxified, chelated compounds into vacuoles (Steffens,
1990; Cobbett and Goldsbrough 2003; Thomas, 2003). The expression of M. thio genes depends
on plant growth stage, environmental conditions, and the type of metal ions, and therefore
tolerance to one metal does not necessarily mean tolerance to another metal (Rauser, 1999). Heat
shock proteins (HSP) present in all organisms act as chaperons under normal conditions but
under stress conditions, HSPs genes can protect and repair proteins that have been damaged by
high concentrations of heavy metals (Neumann et al., 1994; Lewis et al., 2001). Under normal
conditions, HSPs act as chaperones, but under stress they revert to protecting and repairing
damaged proteins (Neumannet al., 1994; Lewis et al., 2001). Transgenic plants with heavy metal
tolerance are one of the solutions for phytoremidiation and sustainable production from
agricultural soils, contaminated by heavy metals. For example, the ZntA (ZnII)-translocating P-
type ATPase) gene was transferred from Arabidopsis to other plants to improve tolerance against
Pb and Cd stress (Joohyun et al., 2003). The mechanism of metals tolerance varies from crop to
crop; the development of crops that accumulate lower concentrations of toxic metals in the edible
parts is needed. The objective of this study was to assess the main molecular mechanisms
governing heavy metals tolerance in tomato, particularly the role of heat shock proteins and
metallothionin (M. thio).

83
5.2. Material and Methods
5.2.1. Plant Growth
The seed of three genotypes i.e. PB-017906, CLN-2418A and Riograndi were sown in pots filled
with sand. The sand washed with distilled water to remove all the heavy metals traces present in
the sand. After three weeks the seedling were transferred in hydroponics media. After one week
of transplanting and seedlings establishment the stress of heavy metals i.e. Pb and Cr was applied
artificially in four different treatments including control i.e. 0, 100uM, 200uM and 400 uM
separately according to the method by Goupil et al (2009).
5.2.3. Sample Collection
Leaf and root parts were separated from seedlings after 24 hour of stress using autoclaved
scissor, washed with distill water thoroughly to remove dirt and wrapped in tissue paper to
remove moisture. These Leaves and root parts were collected in eppendorf tube separately and
used for total RNA extraction.
5.2.4. Protocol for RNA Extraction
RNA is very sensitive to degradation due to less thermo stability and presence of RNAses,
therefore before RNA isolation all the apparatus were autoclaved. The working bench was
cleaned properly with bleach, ethanol and RNases away solution. Total RNA was extracted by
adding RNA reagent (Invitrogen USA) according to the manufacturer’s protocol from the
collected plant sample.
Quality of RNA extracted was observed by electrophoresis; therefore 0.2 ul of RNA mixed with
0.2 ul of bromophenol blue dye and 0.8 uL of DEPC (diethyl pyrocarbonate) treated water and
run on 1% agarose gel.
5.2.5. DNAase treatment
DNA band was also present along with RNA. To minimize the DNA polymerization, DNAase
treatment was carried out to remove the DNA by using the Kit.

84
Some temperature modifications were done in the prescribed protocol because high temperature
for long period may degrade RNA. In first incubation stage the sample was kept for 5 minutes at
30c instead of 30 minutes and in the second incubation stage the sample was kept for 4-5
minutes at 62 C, otherwise degradation of RNA occurred (Nano Drop-20, Thermo Scientific,
USA).
5.2.6. First strand cDNA synthesis
Totalextracted mRNA was converted into first strand cDNA (complementary DNA) by using
oligo-dT primers with help of Revert Aid First Strand cDNA synthesis kit, (Fermentas, USA).
5.2.7. Primer Designing
Internal control gene (UBQ) and heavy metal tolerance (HSP, M.Thio) genes cDNA sequence
was retrieved from NCBI database using Primer 3.0 software for primer designing (Table 6.1).
5.2.8. Primer validation
To eliminate primer dimmer formation primer validation was done for optimum annealing
temperature before Real Time PCR analysis. Optimum annealing temperature was maintained by
gradient PCR and amplified product was electrophoresed on 2% agarose gel.
5.2.9. Real Time quantitative expression analysis
The synthesized cDNA was used as template in Real time-PCR for relative quantification of the
transcriptomes. Normalized expression of heavy metal tolerant genes i.e. HSP and M. thio was
measured by Real Time PCR analysis using Syber Green chemistry for Cr and Pb heavy metals
at four stress levels. Each PCR plate had three replications for each level and plant part of three
genotypes. 25uL final reaction volume concentrations of PCR reagents (Fermentas, USA) were
used.
5.2.10. Data Analysis
To measure the normalized relative gene expression Ct (Cycles threshold) were used, using
inbuilt software tools. UBQ gene was used as reference gene while HSP and M. Thio genes were
used as target gene. The ∆∆Ct values were used to draw graphs using Microsoft Excel software.
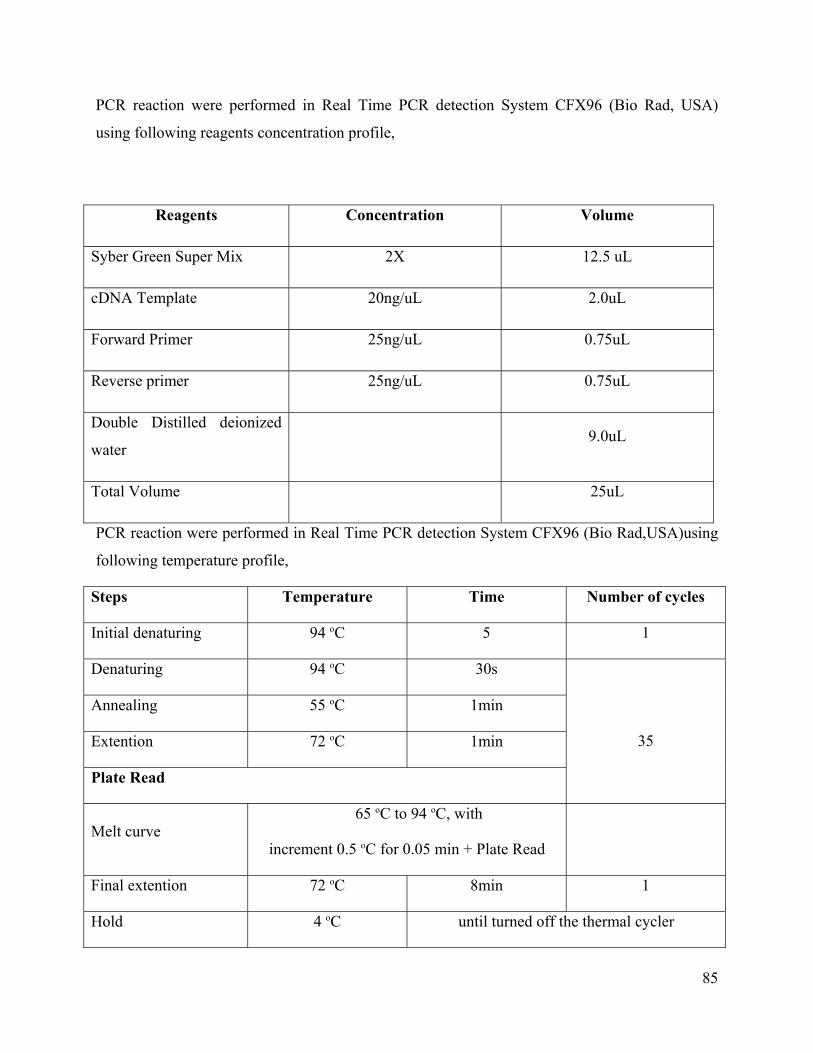
85
PCR reaction were performed in Real Time PCR detection System CFX96 (Bio Rad, USA)
using following reagents concentration profile,
Reagents Concentration Volume
Syber Green Super Mix 2X 12.5 uL
cDNA Template 20ng/uL 2.0uL
Forward Primer 25ng/uL 0.75uL
Reverse primer 25ng/uL 0.75uL
Double Distilled deionized
water 9.0uL
Total Volume 25uL
PCR reaction were performed in Real Time PCR detection System CFX96 (Bio Rad,USA)using
following temperature profile,
Steps Temperature Time Number of cycles
Initial denaturing 94 oC 5 1
Denaturing 94 oC 30s
35
Annealing 55 oC 1min
Extention 72 oC 1min
Plate Read
Melt curve 65 oC to 94 oC, with
increment 0.5 oC for 0.05 min + Plate Read
Final extention 72 oC 8min 1
Hold 4 oC until turned off the thermal cycler
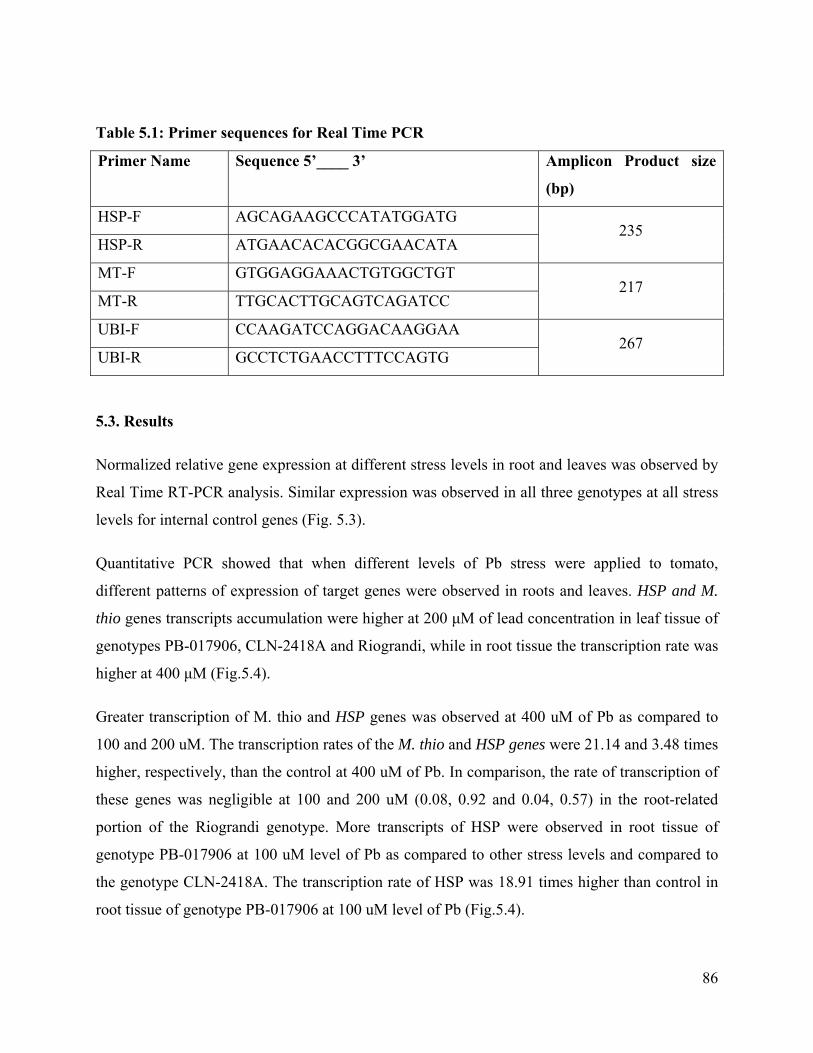
86
Table 5.1: Primer sequences for Real Time PCR
Primer Name Sequence 5’____ 3’ Amplicon Product size
(bp)
HSP-F AGCAGAAGCCCATATGGATG 235
HSP-R ATGAACACACGGCGAACATA
MT-F GTGGAGGAAACTGTGGCTGT 217
MT-R TTGCACTTGCAGTCAGATCC
UBI-F CCAAGATCCAGGACAAGGAA 267
UBI-R GCCTCTGAACCTTTCCAGTG
5.3. Results
Normalized relative gene expression at different stress levels in root and leaves was observed by
Real Time RT-PCR analysis. Similar expression was observed in all three genotypes at all stress
levels for internal control genes (Fig. 5.3).
Quantitative PCR showed that when different levels of Pb stress were applied to tomato,
different patterns of expression of target genes were observed in roots and leaves. HSP and M.
thio genes transcripts accumulation were higher at 200 μM of lead concentration in leaf tissue of
genotypes PB-017906, CLN-2418A and Riograndi, while in root tissue the transcription rate was
higher at 400 μM (Fig.5.4).
Greater transcription of M. thio and HSP genes was observed at 400 uM of Pb as compared to
100 and 200 uM. The transcription rates of the M. thio and HSP genes were 21.14 and 3.48 times
higher, respectively, than the control at 400 uM of Pb. In comparison, the rate of transcription of
these genes was negligible at 100 and 200 uM (0.08, 0.92 and 0.04, 0.57) in the root-related
portion of the Riograndi genotype. More transcripts of HSP were observed in root tissue of
genotype PB-017906 at 100 uM level of Pb as compared to other stress levels and compared to
the genotype CLN-2418A. The transcription rate of HSP was 18.91 times higher than control in
root tissue of genotype PB-017906 at 100 uM level of Pb (Fig.5.4).

87
A varying pattern of M. thio and HSP expression was observed in leaf tissue under Pb stress.
Ttranscription of HSP and M. Thio was higher in Riograndi at 200 uM of Pb as compared to
other stress levels and other genotypes (69.27 and 40.81 times more than control, respectively).
Similarly, in genotype CLN-2418A, the expression of M. thio gene was 24.49 and 26.84 times
more than the control in leaf tissue, at 200 and 400 μM of Pb (Fig. 5.4).
Varying rates of M. thio and HSP gene transcription was observed under chromium stress in root
and leaf tissues. In the variety, Riograndi, transcript accumulation of M. thio was comparatively
higher (4.20 and 13.69 times the control, respectively), in root and leaf tissues at 200 uM
concentration of Cr as compared to other concentrations (100, 400 uM). Meanwhile, there was
more expression of M. thio in root tissue of genotype PB-017906 at 100 and 200 uM compared
to 400 uM concentration of Cr (Fig. 5.5). In leaves, the highest response was observed at 200 uM
(96.8 times the control). Higher level of M. thio transcript accumulation was detected in tomato
genotypes PB-017906 and CLN-2418A than in Riograndi, at 200 μM and 400 μM. Similarly,
greater accumulations of HSP gene transcripts were observed in root tissues of genotypes PB-
017906 and CLN-2418A than in Riograndi (Fig. 5.5). In leaf tissue, the expression of this gene
was higher in Riograndi and CLN-2418A at 100 μM and 200 μM than 400 μM. HSP and M. thio
gene transcripts accumulation was greater in root tissue of genotype PB-017906 at 100, 200, and
400 μM, but in Riograndi more expression of HSP was observed at 200 uM and greater
expression of M. thio was observed at 400 μM. As compared to the Riogandi genotype, CLN-
2418A was found to perform best due to higher rates of transcription, and as a result greater
tolerance of Cr stress, at all levels.

88
Fig 5.1: Various treatments of Cr and Pb A: Pb at 100 uM, B: 200 uM, 400 uM applied to tomato Seedlings for 24 hours
Fig 5.2: A: integrity and quality of total RNA electrophoresed on 1% Agarose gel. B: RT- PCR of UBQ gene (an internal control), used for data normalization for HSP and M. thio transcript profiling
A
B

89
Fig 5.4: Relative profiling of HSP and M. Thio genes transcripts in leaf (A) and Root (B) at 100, 200, 400 uM of Pb levels

90
Fig 5.5: Relative performing of HSP and M.Thio transcripts in leaf (A) and Root(B) at 100, 200, 400 uM of Cr levels

91
5.4. Discussion
Different molecular mechanisms are responsible for tolerance against high concentrations of
heavy metals. Tolerance mechanisms depend upon heavy metal type and different molecular
mechanisms provide tolerance to different metals (Turner, 1996; Abdul, 2001). Transcriptome
profiling of abiotic stress-related genes was carried out in the heavy metal-resistant genotypes.
Expression analysis of the candidate genes in the resistant and high metal-accumulators
genotypes helped to determine the role of these genes in heavy metal tolerance. At elevated
concentrations of heavy metals, the expression level of some special genes was altered, such as
the over expression of some stress related proteins (HSP, M. thio), signaling that proteins related
to stress regulations are expressed by tolerance pathways mediated by glutathione (Thapa et al.,
2012).Heat shock proteins (HSP), meanwhile, are present in all organisms but vary in quantity
and expression and play their role by repairing proteins damaged by heavy metal stress (Vierling
et al., 1991). However the induction of Hsp is very sensitive to heavy metals stress (Del Razo et
al., 2001). Under heavy metals stress the production of these compounds (M. thio, HSPs) is
increased many fold (Kramer et al., 1996; Clemens et al., 2001) in plants, but the transcription
level varies from genotype to genotype, tissue to tissue, and with the type and concentration of
metal ions. In this study, transcripts of HSP 90 and M. thio increased many fold under heavy
metal stress, which might result in improved heavy metal tolerance (Lewis et al., 1999).
In this study, tomato plants responded to high concentrations of Cr and Pb by inducing HSPs and
M. thio protein transcription in root and leaf tissues as tolerance mechanisms for protection
against heavy metals toxicity, reducing protein damage and sustaining cellular homeostasis
(Goupil et al., 2009). HSP and M. thio protein transcript accumulation was higher in leaves than
roots under Cr stress, and was higher at 200 uM than 100 and 400 uM in leaves. One might
expect to have gradual increase of transcription parallel to increasing stress levels, but highest
level of Cr stress might be damaging the transcriptional machinery of cell resulting in lower
amount of transcripts. Similarly, more expression of HSP at 100 uM and of M. thio at 400 uM
was observed in roots under Pb stress. Higher HSP and M. thio transcription was observed in
roots and leaves under Pb stress than under Cr stress, suggesting that expression of these genes
varies with the type of heavy metal (Neumann et al., 1994; Palmiter and Findley 1995, Cobbett,

92
2000). It also suggests varying approach of cell to tackle different types of heavy metal stresses
indicating that heavy metal tolerance mechanism is not independent of stress type.
Poor transcription rates of HSPs and M. thio would suggest that a tomato genotype lacked
molecular mechanism for protection against Cr and Pb toxicity via M. thio and HSP pathways
(Goupil et al., 2009). In this study, we found that HSPs and M. thio expression varied with plant
tissue and metal concentration. Previous studies also support this results that, there was at times
very low or no expression of HSPs even in presence of heavy metal stress (Hall, 2002). As the
concentration of metals increased, the transcription rate of these genes decreased and above a
certain threshold level of heavy metals the expression of these genes stopped. The highest metal
concentration resulted in withered plants due to high levels of reactive oxygen species (ROS)
induced by redox metals. ROS caused cellular membrane alterations and disrupted the function
of these genes, ending their expression (Panda and Choudhury, 2005).
From these studies, it was found that differential patterns of transcription of HSP and M. thio
genes exist in different plant parts of various tomato genotypes for heavy metals tolerance.
93
Chapter 6
TRACING TRANSMISSION OF SALMONELLA ENTERICA TO
TOMATO FRUITS
6.1. Introduction
Escalating population levels are linked with increasing environmental pollution, which
ultimately affects human health as well as reducing crop yield. Various biotic and abiotic factors
are responsible for reduction and poor quality of crops, of which ppathogens are one of the most
important biotic factors. Due to water scarcity for crop production, using wastewater
contaminated with a number of pathogens for irrigation is a common practice in the world. Three
main types of pathogens (viruses [Picornaviruses, Adenoviruses and Rotaviruses], protozoan
/Helminth [Entamoeba, Giardia, Trichomonas], and Bacteria [Salmonella, Shigella,
Mycobacterium, Klebsiella, Clostridium]) are found in wastewater (Englebrecht, 1978; National
Research Council, 1996). These pathogens can survive for days to months in soil and on crops,
but their survival rate depends on a number of factors such as soil pH, moisture content,
moisture-holding capacity, organic matter, soil temperature, and sunlight (Shuval et al., 1990).
These pathogens result in disease transmission when pathogen-contaminated wastewater is used
for irrigation (Mapanda et al., 2007; Al-Lahham et al., 2003). Different factors are responsible
for the transmission of pathogens from fields to crops, such as the method of irrigation with
wastewater, the type of crop grown, and harvesting practices. Of these, crop type is one the most
important factors determining pathogenic disease severity. Different sources of these pathogens
exist, from animal and human feces, to eggs, poultry, sea foods, juices, beef, milk, cheese, fruits,
and vegetables irrigated with wastewater (Zhao et al., 2008). Vegetables cultivated using
wastewater can be a source of infection for various lethal diseases for consumers. Among these,
bacterial pathogens are those that are most commonly present in wastewater and causing
diseases. These bacterial pathogens cause a number of diseases like diarrhea, cholera, typhoid,
and dysentery. A bacterial species commonly present in wastewater is Salmonella enterica,
which can cause food poisoning, diarrhea, typhoid fever and pneumonia (Toze, 1997).
Contamination of a crop by S. enterica can occur before or after harvesting, and transmission of
S. enterica from soil to different plant parts depends on the crop. In general, crops in which the
94
edible part is above the soil surface (such as tomato) are less contaminated than low growing
crops like lettuce and parsley (Melloul et al., 2001).
S. enterica can persist in primary roots, it is most concentrated at root tips and lateral branches,
and many plants have developed molecular tolerance mechanisms against different pathogenic
infections (Cooley et al., 2003). Although food contaminated by S. enterica is more dangerous to
human health when consumed raw. The objective of this study was to detect the presence of S.
enterica in wastewater and determine whether its transmission occurred into tomato fruits
through roots when plants were irrigated with S. enterica-contaminated wastewater.
6.2. Material and Methods
Waste water used for irrigation was composed of water discharged from hospitals, domestic
usage, commercial buildings, industries and factories. It was analyzed for the presence of
Salmonella enterica. For this purpose the samples were collected in sterile plastic bottles from
three different sites. For S. enterica growth XLT-4 agar was used as culture medium which is
specific for bacterial growth. Waste water samples were streaked on XLT-4 solid growth media
through sterile loop. The streaked culture plates were incubated for 16-18 hours at 37 ºC. After
16-18 hours, visible growth of bacteria occurred in the form of red colonies. Each presumptive
colony was collected and transferred into XLT-4 liquid medium and kept at 37°C for 24 hours
(Leslie et al., 2008). After 24 hours the DNA was extracted from XLT-4 liquid medium. To
check the transmission of S. enteric from root to tomato fruit different tomato accessions were
analyzed for diagnosis of S. enteric after S. enteric contaminated waste water irrigation from
transplanting to maturity. There were 36 total samples, two waste water samples and 16 tomato
accessions with two replications. The following tomato genotypes were used for S. enteric
diagnosis .i.e. LO-2752(A), PB-017909(B), LA-2662(C), LA-1401(D), LA-2711(E), PB-
017906(F), CLN-2418A(G),VRIT-47(H),178556(I),PAKIT(J),HIT-9076-08(K),BL-1079(L),LO-
4379(M), RIOGRANDI (N), BL-1077(O), LO-3691(P).
Fully ripened tomato fruits were picked in triplicates and collected in sterile plastic bags. These
collected tomatoes were surface sterilized by 70% ethanol, dried under laminar flow hood until
ethanol disappeared completely (Miles et al., 2009). Sterilized tomatoes were collected in sterile
stomacher bags individually and stomached until a homogenous mixture was obtained. Later on

95
the obtained homogenous mixture was streaked on XLT-4 solid growth media through sterile
loop. The streaked plates were incubated for 16-18 hours at 37 ºC (Leslie et al., 2008). After 16-
18 hours visible growth of bacteria occurred in the form of red colonies. Each presumptive
colony was collected and transferred into XLT-4 liquid growth medium and kept at 37°C for 24
hours (Leslie et al., 2008). DNA was extracted from XLT-4 liquid medium after 24 hours.
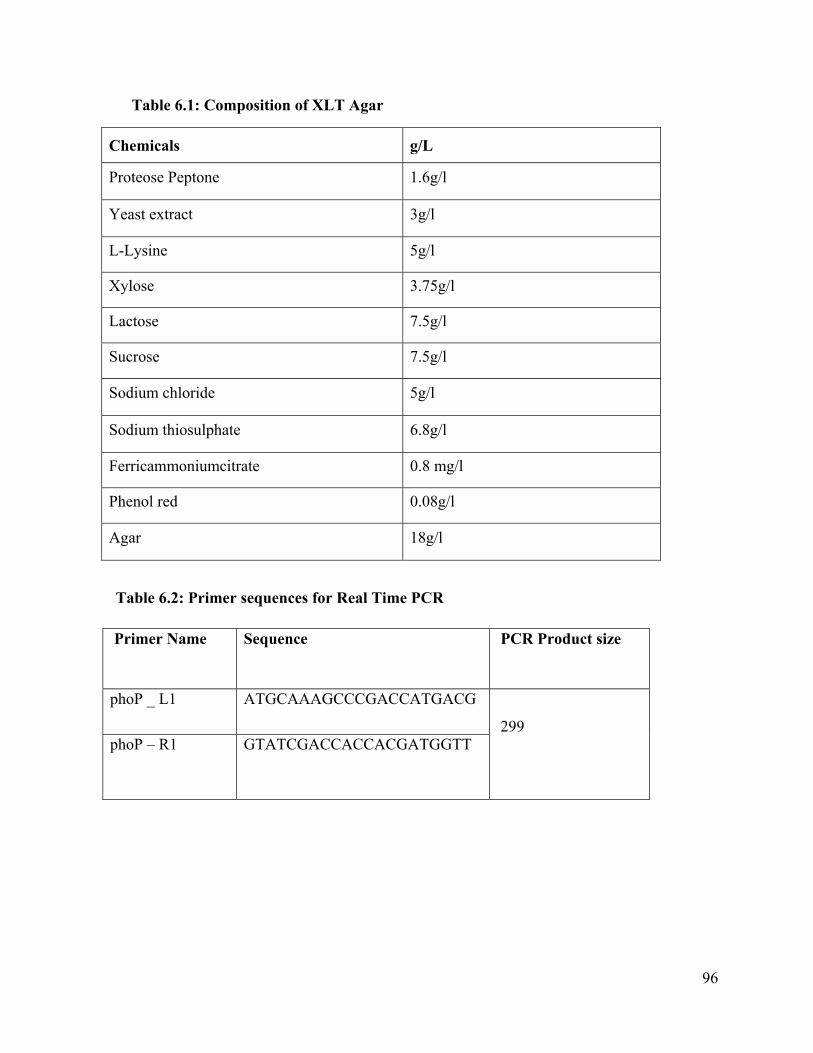
96
Table 6.1: Composition of XLT Agar
Chemicals g/L
Proteose Peptone 1.6g/l
Yeast extract 3g/l
L-Lysine 5g/l
Xylose 3.75g/l
Lactose 7.5g/l
Sucrose 7.5g/l
Sodium chloride 5g/l
Sodium thiosulphate 6.8g/l
Ferricammoniumcitrate 0.8 mg/l
Phenol red 0.08g/l
Agar 18g/l
Table 6.2: Primer sequences for Real Time PCR
Primer Name Sequence PCR Product size
phoP _ L1 ATGCAAAGCCCGACCATGACG
299 phoP – R1 GTATCGACCACCACGATGGTT

97
6.2.2. BACTERIAL DNA ISOLATION
Total bacterial genomic DNA was extracted by using the following protocol;
STEP 1
Bacterial culture was grown up to saturation.1.5 ml culture was taken in 2 ml eppendorf and spin
for 2 minutes to get bacterial cell pellet.
STEP 2
570 ul TE BUFFER was added and Vortex to dissolve pellet thoroughly. Incubated for 1 hour at
370C.
STEP 3
100 ul of 5 M NaCl was added& mixed well. Later on 80 ul CTAB/NaCl solutions was added
and mixed well and incubated at 65 C for 10 minutes.
STEP 4
700-ul 24:1 Chloroform/Isoamyl alcohol was added and spin for 5 minutes.
Step 5
500 ul of supernatant was taken into new eppendorf, 500 Phenol /Chloroform / Isoamylalcohol
was added and spin for 5 minutes
Step 6
Supernatant was collected in new eppendorf, 600 ul of 100 % ETHANOL was added and
incubated at -20 for 20 minutes
STEP 7
Later on incubated sample was spin for 15 minutes and ethanol was removed. Pellet was washed
with 70 % Ethanol
STEP 8
Ethanol was removed completely and pellet was dried at 37 C.50 ul of dH2O was added to
dissolve the pellet for further usage in PCR.
6.2.3. Detection of Salmonella enteric through polymerase chain reaction
Polymerase chain reaction (PCR) was performed using phoP/phoq primer and concentrations of
PCR reagents were as follows’
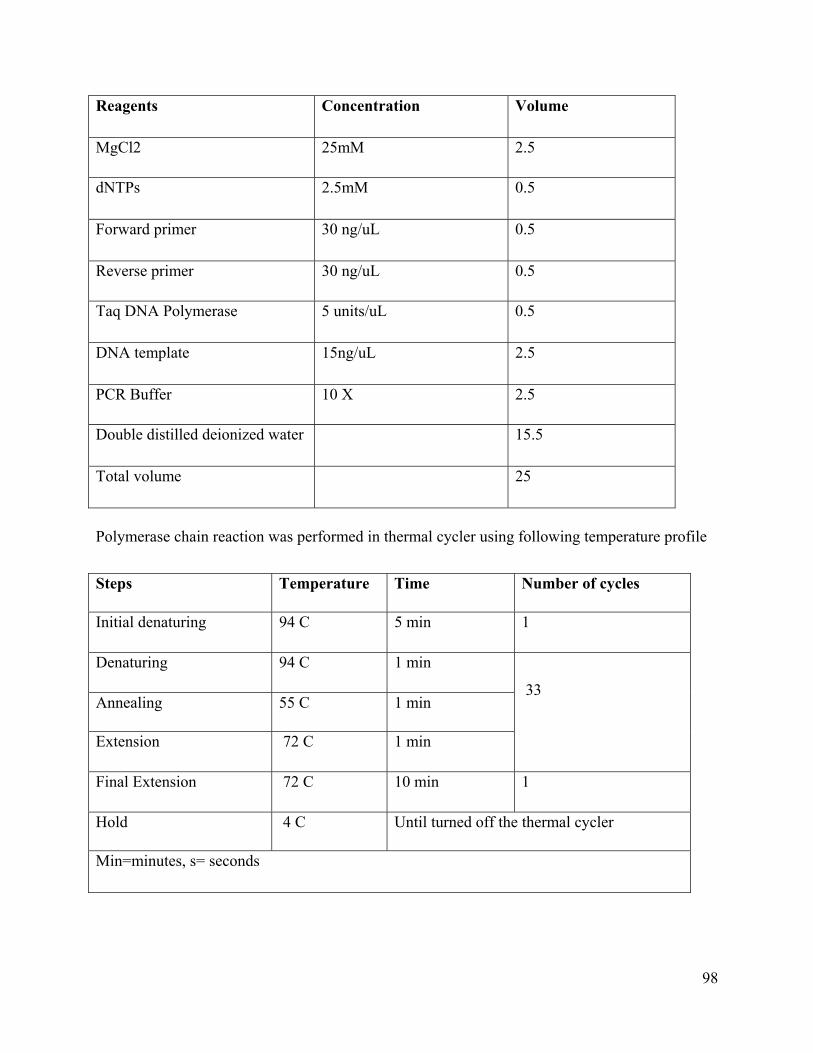
98
Reagents Concentration Volume
MgCl2 25mM 2.5
dNTPs 2.5mM 0.5
Forward primer 30 ng/uL 0.5
Reverse primer 30 ng/uL 0.5
Taq DNA Polymerase 5 units/uL 0.5
DNA template 15ng/uL 2.5
PCR Buffer 10 X 2.5
Double distilled deionized water 15.5
Total volume 25
Polymerase chain reaction was performed in thermal cycler using following temperature profile
Steps Temperature Time Number of cycles
Initial denaturing 94 C 5 min 1
Denaturing 94 C 1 min
33 Annealing 55 C 1 min
Extension 72 C 1 min
Final Extension 72 C 10 min 1
Hold 4 C Until turned off the thermal cycler
Min=minutes, s= seconds

99
6.3.5 Gel electrophoresis
PCR products were visualized on 1.5% agarose gel. Agarose gel electrophoresis was used for
PCR amplified products detection.
6.4. Results
Wastewater samples showed positive results for S. enterica as red bacterial colonies with black
centers (due to H2S production) on XLT-4 solid growth media (Fig. 6.1). Similarly, positive
results were obtained from XLT-4 liquid growth media after 24 hours as the color of the media
change from dark to light brown due to bacterial growth. DNA was isolated from wastewater
culture media (Fig. 6.2). Because colonies of other bacteria may appear on XLT-4 medium (red
with black centers indicating H2S production), polymerase chain reaction (PCR) was performed
using phoP/phoQ gene primer to confirm that the bacteria were in fact S. enterica . PhoP/phoQ
loci were specific for S. enterica. PCR of these water samples also showed positive results for S.
enterica through positive amplification of the PhoP/phoQ gene band (Fig. 6.3).
When a homogenized tomato fruit mixture was streaked on XLT-4 growth media, red bacterial
colonies appeared in 14 out of 16samples (Fig. 6.1). The 14 samples were further processed for
PCR based detection of S. enterica. Good quality DNA was obtained from cultured media (Fig.
6.2) which was used as template in subsequent PCRs.PCR results showed the positive
amplification of pHoP gene confirming the presence of S. enterica. It confirmed that only two
tomato genotypes (178556 and LO-2752) were internally infected with S. enterica. In PCRs,
employing 16s Ribosomal RNA gene primer as a positive control, all genotypes showed
amplification (Fig 6.2), indicating that 12 genotypes were also infected with some bacteria other
than S. enterica.
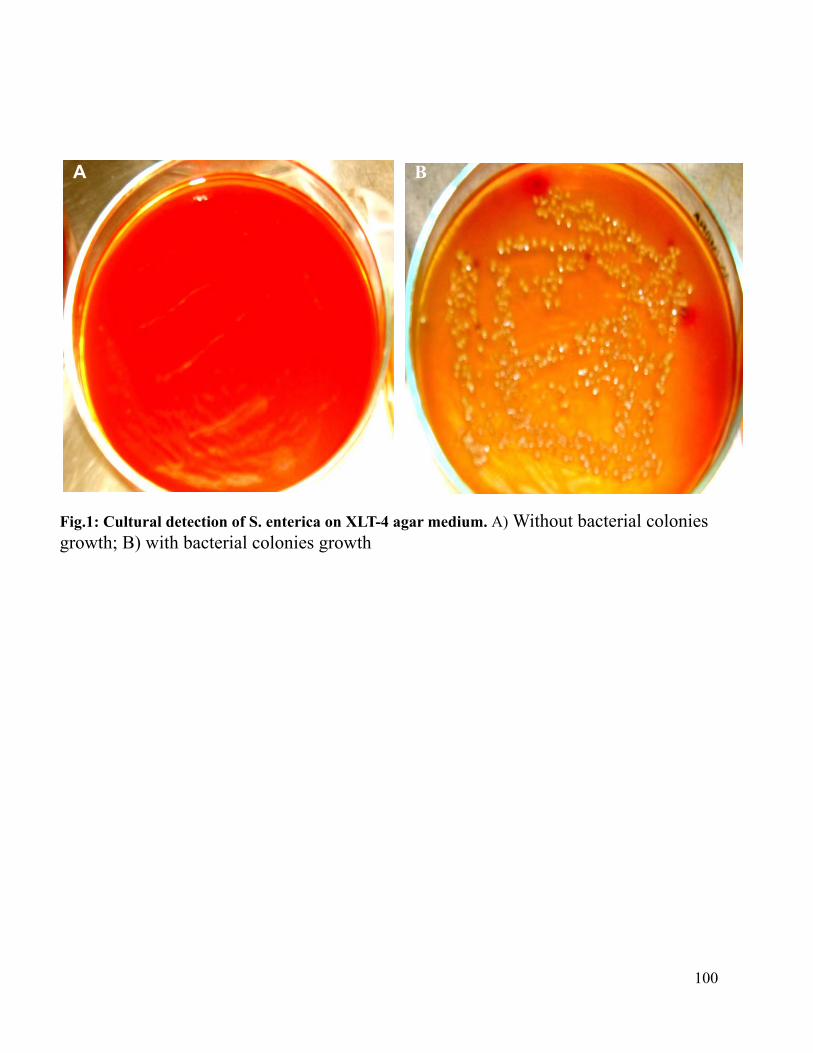
100
Fig.1: Cultural detection of S. enterica on XLT-4 agar medium. A) Without bacterial colonies growth; B) with bacterial colonies growth
A B
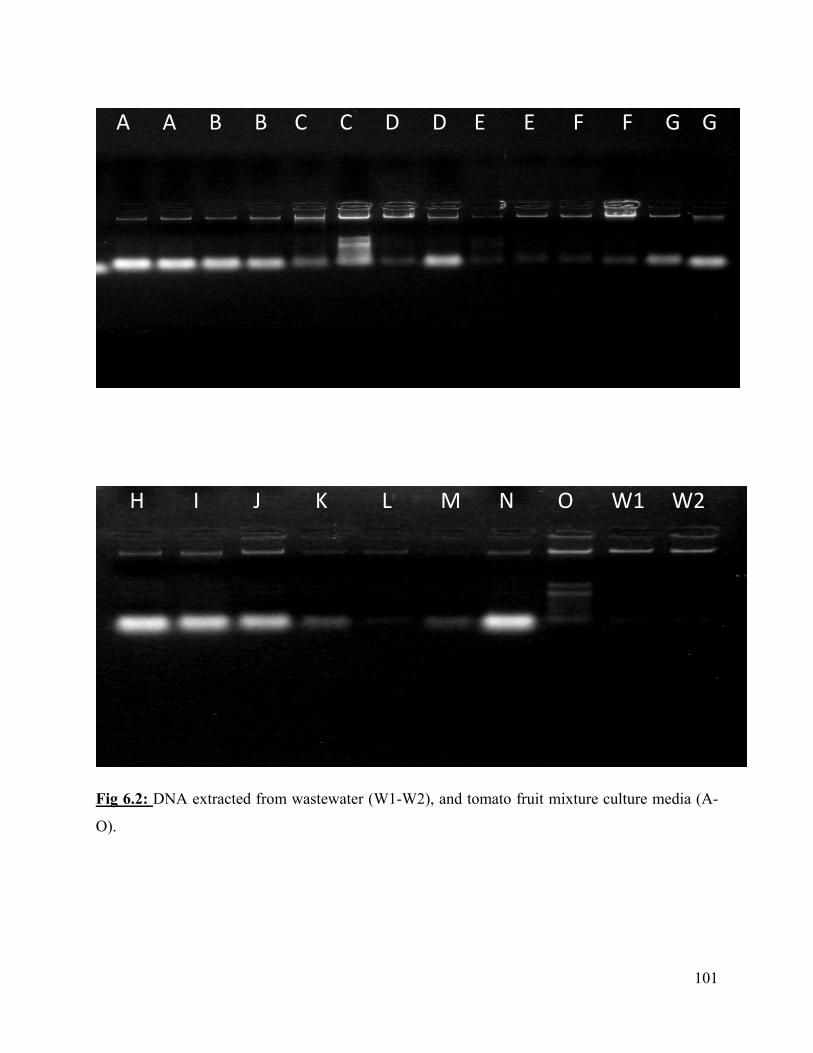
101
Fig 6.2: DNA extracted from wastewater (W1-W2), and tomato fruit mixture culture media (A-
O).
A A B B C C D D E E F F G G
H I J K L M N O W1 W2

102
A B C D E F G H I J K L M W
399 bp
1
2
Fig. 6.3: PCR based detection of S. enterica. A) PCR amplification of Phop/Phoq for S. enterica detection; L: 50 bp ladder; 1-14: tomato fruits of 14 genotypes; 15: waste water. B) PCR amplification of 16Sr RNA gene from tomato (1-14) and wastewater samples (15-17); L: 1 kb ladder.
103
6.3. Discussion
Wastewater irrigation can result in the spread of bacterial infection and disease. One of the main
bacterial pathogens present in wastewater is S. enterica (Walczak et al., 2009; Zaki et al., 2009).
Typically, the dense, compact network of fibers in plant cell walls do not allow micro-organisms
entry into the plant, but if the cell wall is ruptured then micro-organisms can enter the plant and
gain access to plant protoplast. Therefore, S. enterica entry and transmission from roots to fruit
may take place passively through wounds in the pericycle, mesophyl, and periderm of secondary
lateral roots or natural openings resulting through damage during transplanting or growth
(Hallman et al., 1997; Dong et al., 2003). In previous studies, different results were found
regarding entry, internalization, and transmission of bacterial pathogens to different plant parts
when wastewater contaminated with different bacterial pathogens was used for irrigation. In
previous study, internalization of S. enterica was observed in hypocotyls, cotyledons, stems, and
leaves of tomato seedlings when S. enterica contamination was present in hydroponic media
(Guo et al., 2002; Jablasone et al., 2004; Miles et al., 2009). In this study, bacterial culture and
PCR-based diagnostics of S. enteric in tomato fruit and wastewater found that wastewater used
for irrigation was contaminated with S. enteric while internal infection was detected only in 2 out
of 16genotypes. Previous studies also endorsed our results regarding the variability of tomato
genotypes for bacterial immobilization in tomato fruit (Leslie et al. 2010; Miles et al., 2009).
Thereforeit is not necessary that if S. enterica is present in irrigation water it will contaminate
tomato fruit. However, of the 16 genotypes we tested, 12 were found contaminated with bacterial
growth other than S. enterica .
Different treatments can remove pathogens from wastewater before it is used for irrigation
(Schaub and Sorber, 1977). Lime coagulation, oxidation ponds, chlorination, activated carbon
treatment, filtration and activated sludge treatment processes can remove 50-90% of pathogens
from wastewater (Cloette et al., 1998). In addition, wastewater should be applied primarily to
industrial crops or those not consumed by people (such as cotton, sunflower, sisal). Crops
irrigated with wastewater should be processed by drying or heating before human use (such as
with oilseeds, grains or sugar beets). Fruits or vegetables grown entirely for canning or
processing, which destroys pathogens, are also good choices for wastewater irrigation, as are
those fodder crops that are harvested and sun-dried before being feed to animals. Wastewater can
104
also be safely applied to landscapes in fenced areas without community contact (forests,
nurseries, green belts). Wastewater contaminated with pathogens should not be applied to green
fodder crops, pasture and to those crops that are used directly or in raw form in salads, such as
lettuce, cucumber, or tomato. Due to the lack of available canal water, if wastewater application
is necessary, then these crops should be well cooked before human consumption (eggplant,
potatoes, beetroot), or the wastewater should be used to grow those crops whose edible part is
least affected by pathogens (such as citrus fruits, melons, nuts, bananas, or groundnuts) (Shuval
et al.,1986). Tomato should not be grown using waste water or if there is no other alternative
then cooked well before consumption to minimize the pathogenic infection.
It is concluded from the above results that it is not necessary that if S. enterica is present in
irrigation water it will contaminate tomato fruit.
105
Chapter 7
GENERAL DISCUSSION
Water demand is increasing due to industrial development, population growth, and subsequent
increased area devoted to agriculture. At the same time, available water resources are decreasing,
affecting industrial and agricultural sectors (Brown and Halweil,1998; (3). The use of treated
wastewater is one of the best alternatives to minimize, to some extent, this water scarcity. The
treatment of wastewater and soils contaminated with heavy metals is often not possible through
engineering and agronomic techniques due to high cost, particularly in low-income countries like
Pakistan. Under such scenarios of surface water scarcity and high wastewater treatment costs,
untreated wastewater application is becoming a major practice, especially in arid and semi-arid
regions of world. In developing countries, 80% of wastewater is used for irrigation (Cooper,
1991). In Latin America, 500,000 hectares are irrigated with untreated wastewater (Moscosco,
1996). Along with supplying crops needs for water, this practice also partially fulfills the
nutritional requirement of crop plants, thus reducing farmers’ cost of production (Jiménez, 2006;
Al-Karaki, 2011). Due to these economic benefits, the use of wastewater is increasing. Its
application, however, can result in a number of important problems, such as pathogenic infection
and heavy metal accumulation in the soil, in underground water and in crops at toxic levels
(Amiri et al., 2008; Chandran et al., 2012; Ibrahim et al., 2013). As a result of such heavy metal
accumulation soil productivity may be destroyed and crop production affected (Kibria et al.,
2012).
One of the best ways to meet the nutritional requirements of an increasing world population is
the development of improved crop cultivars that possess tolerance for heavy metals with high
yield. To meet this goal, plant breeders must target crops that have as much heritable genetic
diversity as possible within the species for the selection of desired traits in a breeding program
(Zhang et al., 2011).
The present studies were conducted to assess the socio-economic impacts of wastewater
irrigation and obtain information about the reasons behind its application from the farmers’
perspective. Because the main drawback of wastewater irrigation are accumulation of toxic
heavy metals and spread of pathogenic infections, this study also sought to analyze the

106
accumulation of heavy metals in wastewater, canal water, underground water, soil and crops
irrigated with waste water or canal water along with diagnosing S. entericin the tomato fruit .
Another objective of this research was to screen the available tomato germplasm to determine the
genotypes with the best performance limiting heavy metal accumulation and spread of
pathogenic infections. We also investigated the genetic and molecular basis of such heavy metals
tolerance.
To get a real image of any problem, data collection is of primary importance. Accurate
information depends on the method adopted for data collection. The quartile method is a
powerful method for data collection which provides precise information (Andreoli and Tellarini,
2000). The quartile method was used to generate the survey that sought to determine the reasons
for and socio-economic impacts of wastewater irrigation. In general, farmers were of the opinion
that wastewater use was due to the unavailability of adequate surface water and the unsuitability
of ground water. They also recognized that while wastewater irrigation lowered their cost of
production (Baig et al., 2011), it resulted in serious environmental and health problems.
However, because their monthly incomes were typically below the poverty line, they felt they
had little choice but to use wastewater for irrigation, as it was the cheapest option.
One of the main drawbacks of wastewater application is the accumulation of heavy metals to
toxic levels. While different approaches can be used to determine heavy metals concentrations,
the atomic absorption spectrophotometer (AAS) is the best method (Buszewski et al., 2000). The
results of AAS showed that the observed concentrations of heavy metals were higher than safe
limits in all samples of wastewater, underground water, surface water and soil, similar to results
obtained by Lone et al. (2013) and Yahia et al. (2013). High concentrations in wastewater were
present because industries are allowed to discharge their heavy metal-polluted effluents without
treatment (Galavi et al., 2010). But high concentrations in groundwater and soil are the result of
wastewater irrigation over a long period, resulting in heavy metals accumulation in the soil and
leaching of metals into underground aquifers (Maldonado et al., 2008). Similarly, high
concentrations of heavy metals in canal water might be due to the discharge of industrial
effluents without any treatment into the canal water (Aftab et al., 2011). When the heavy metal-
polluted wastewater was used for irrigation, considerable variation was observed in heavy metal
accumulation among crops and vegetables (Khan et al., 2013). Different responses were
107
observed for different heavy metals and no correlation was found between different metals
(Karatas et al., 2006). Concentrations higher than safe limits were found in all the observed
vegetables and crops, and similar results were obtained by Bigdeli and Seilsepour (2008). We
observed the highest concentrations in leafy vegetables (Spinach, Mustard Leaves, Cauliflower )
and crops (Lucerne , Berseem , Maize), as did several previous studies which found higher levels
of heavy metals in the edible parts of vegetables and crops grown using wastewater (Sharma and
Shukla, 2013; Chandran et al., 2012; Naaz and Pandey, 2010). In case of maize leaf and stem
portion was used for metal detection because farmer mostly used this for fodder purpose in that
area. On the other hand, Hampton et al, (2005) found that metals uptake and accumulation varied
from species to species.
Breeders aim towards the selection of plants that display tolerance of stress conditions (Aremu,
2011). Soil is the most suitable medium for screening plants against stressful conditions, because
the behavior of crop plants differs in response to environmental conditions, and therefore testing
plants under similar environmental conditions but with differing soils is the best way to only
have one variable. The second important factor in the selection of the best performing genotype
is the presence of enough genetic variability (Fernie et al., 2006; Takeda and Matsuoka, 2008).
Therefore, the available tomato accessions were first screened under natural field conditions
using heavy metals polluted wastewater for irrigation. The genotypes were ranked on the basis of
heavy metals accumulation capacity in their different plant parts. The heavy metals
concentrations were determined by atomic absorption spectrophotometer (Babu et al., 2013:
Thomsen, 2006). Considerable variation was observed for Zn, Ni, Cr, Mn, and Pb accumulation
in different plant parts and among different tomato accessions (Varavipour et al., 2009). The
concentrations of heavy metals were higher than safe limits in most of the tomato accessions,
results similar to the findings of Singh et al. (2010) and Yadav et al. (2013). Selection was done
on the basis of fruit tissue, because tomato fruits are the part that is eaten. But higher
accumulation in other plant parts can be desirable as this would increase the phytoremediation
value of the crop (Hooda, 2007).Those accessions which possess little or no residues of heavy
metals in fruit tissue were selected as low metal-accumulators and those that accumulated high
concentrations were termed high metal-accumulators.

108
Genotype performance can be compared through Biplot on the basis of traits and
interrelationships between traits (Yan and Rajcan, 2002). Comparisons of genotypes can be made
by observing the perpendicular distance between any two trait vectors (Yan and Kang, 2003).
Therefore Biplot is an important method for the selection of accessions on the basis of their
performance (Farshadfar et al., 2011). Biplot analysis was done on the basis of heavy metals
accumulation in different plant parts, which showed wide variation among genotypes. In general,
however, higher metal concentrations were found in leaf tissues and lower concentrations in
fruits (Khan et al., 2013). Only minimum concentrations of the studied heavy metals were found
in fruit tissue of genotypes PB-017906 and CLN-2418A, which were therefore identified as the
best performing accessions in relation to heavy metals tolerance. Different responses were
observed in different accessions for heavy metals uptake and accumulation. Diverse positive and
negative associations were observed through Biplot between genotypes, between heavy metals,
and in the genotype by heavy metal interactions. Positive associations between desirable traits
meant that these traits discriminated the accessions in a similar fashion (Hussain et al., 2010).
High variability among the genotypes for heavy metals uptake and accumulation indicated the
absence of a relationship among different accessions for different metals, suggesting that no
physiolocal relationship exists between genotypes for metal tolerance (Brar et al., 2010). A
strong negative association was observed in genotype PB-017906 and to some extent in CLN-
2418A for heavy metals accumulation, making them the two best-performing accessions.
Genotype PB-017906 was low metal-accumulators of all the observed meals as was, to a lesser
extent, CLN-2418A.The physiological and genetic data showed the absence of associations with
tomato genotypes for tolerance to multiple heavy metals. Similar results were observed by
Tilstone and Macnair (2001), who suggested that tolerance to more metals is the result of
multiple independent metal tolerance genes, caused by independent genetic mechanisms for
specific metals.
A better understanding of the genes that PB-017906 and CLN-2418A possess, making them low
metal-accumulators of so many heavy metals would be valuable for enhancing the heavy metals
tolerance of other crop plants. In relation to yield performance, these genotypes performed
moderately well, perhaps suggesting that a negative correlation exists between heavy metals
tolerance and genes for high yield. A similar pattern of negative association was observed in the
high yielding genotypes for heavy metals tolerance.
109
The inheritance of desirable characteristic is crucial for any breeding program, and therefore the
study of the inheritance pattern for tolerance to heavy metals is important for the selection and
breeding. Information about the genetic basis (additive and non-additive) of a desired trait can
help the breeder select the most effective breeding method and the best accessions (Zdravković
et al., 2011; Shankar et al., 2013). The North Carolina Mating 2 biometrical technique provides
comprehensive basic information about the inheritance pattern of heavy metals tolerance at the
maturity stage. Along with information on additive and non-additive effects, it provides
information about maternal effects (Holland et al., 2003). Optimal use of heavy metals tolerance
is only possible if this trait is genetically controlled. Heavy metal-polluted wastewater was used
to estimate the genetic control of heavy metal tolerance in tomato. In self-pollinated crops like
tomato, after screening the heavy metal-low metal-accumulators genotypes like PB-017906 and
CLN-2418A can be used in a hybridization program for the development of genetically superior
hybrids. The results of this study clearly demonstrated that heavy metal tolerance is genetically
controlled. Genetic variation for metal tolerance was found to be influenced by genes with both
additive and non-additive effects. But for heavy metal tolerance, dominant genetic effects were
observed to be most common (Gartside and Mcneilly, 1974), which is useful for breeding
superior hybrid tomato genotypes. In tomato, maternal effects are also involved in the
inheritance of some traits ((1), including heavy metal tolerance. Such maternal effects are
inherited through genes located in plasmids ((2). In contrast, yield-related traits were mainly
determined by additive genetic effects (Joshi et al., 2004; Mohamed et al., 2012), although
maternal effects were observed for the inheritance of the number of flowers and number of fruits
in tomato (e.g., Saleem et al.,2013).
Although the biochemical and molecular mechanisms involved in heavy metals tolerance are not
well understood (Zagorchev et al., 2013), knowledge of the molecular mechanism for heavy
metals tolerance would help plant breeders develop low metal-accumulators genotypes (Hossain
et al., 2012). Plants respond to high concentrations of heavy metals by activating molecular
defense mechanisms to reduce the toxic effects of the metals (Clemens, 2006). Under high
concentrations of metals, some genes like HSPs and M. thio are over expressed. The protein
transcripts of these two genes increased to levels many fold higher than in that in the control,
protecting cell proteins from damage and sustaining cellular homeostasis (Thierry et al., 2009).
However, the exact mechanism by which these genes’ transcripts act is unknown (Hassinen,
110
2009). This study found that the transcript accumulation of HSPs and M. thio increased many
fold higher in both PB-017906 and CLN-2418A (low metal-accumulators) and in Riograndi
(non-low metal-accumulators) genotypes under heavy metals stress compared to control
conditions, similar to results obtained by Memon et al. (2001) and Macovei et al. (2010).
However, the expression of these genes was higher in low metal-accumulators genotypes than in
high metal-accumulators ones (Leopold et al., 1999).
Wastewater irrigation can often result in bacterial (S. enterica) infection (Anthony et al., 2010).
While the dense network of fibers in a plant’s cell wall typically do not allow micro-organisms
entry, if the cell wall is ruptured, either through wounds or during transplanting, then micro-
organisms can enter the plant and gain access to plant protoplast (Salem et al., 2010;
Gunasegaran et al., 2011). Biochemical and molecular diagnosis of S. enterica was conducted to
determine its presence in wastewater and tomato fruits (Girones et al., 2010). In this study, S.
enetrica contamination was observed in wastewater (Way et al., 1993), but PCR results found
only two tomato genotypes to be infested with this bacteria. Meanwhile, 12 other accessions did
not show S. enterica infection but rather infection by some other bacteria, results similar to those
of Jablasone et al. (2004). Therefore it is not guaranteed that if S. enterica is present in irrigation
water it will contaminate the tomato fruit.
This series of experiments revealed that heritable genetic variability exists for heavy metal
tolerance and resistance to bacterial infection among crops and vegetables, especially tomato.
This heavy metal tolerance variability can be used by breeding programs to further develop
heavy metal-low metal-accumulators crop cultivars for use in those areas where wastewater
irrigation is necessary due to a lack of other available water sources. Similarly, a better
understanding of the molecular mechanisms involved in heavy metals tolerance would be
advantageous to breeding programs. Under such circumstances of surface water scarcity it is not
possible to sanction waste water application although it resulted in negative impacts in term of
heavy metals and pathogens problems. As waste water application is the need of the need of
time, the resulting information from this research will be helpful in the development of low
metal-accumulators tomato genotype which is suitable for soil contaminated with heavy metals
by the use of wastewater. Similarly the above findings help in the development of S. enterica
bacteria tolerant genotypes of tomato which are suitable under wastewater application. The

111
above low metal-accumulators and S. enterica bacteria tolerant tomato genotypes can be used in
breeding programme to develop high yielding, heavy metals and pathogens tolerant genotypes of
tomato to recommend for those areas where waste water application is the need of time.

112
Chapter 8
SUMMARY
The experiments in this study were conducted at the Department of Plant Breeding and Genetics
at the University of Agriculture in Faisalabad, Pakistan. The objective of this research was to
assess the suitability of wastewater for irrigation in relation to heavy metals and pathogenic
infection problems. Wastewater is one of the main sources of water for irrigation and as a result
of water scarcity is used worldwide for crop production. A survey was conducted in Uchkara, a
suburb of Faisalabad where farmers have been using wastewater for irrigation for the last 45
years. The survey’s purpose was to gather information regarding the farmers’ perceptions of the
socio-economic impacts of wastewater irrigation and heavy metals accumulation in the soil, in
underground water and in crops and vegetables. Two contrasting views were observed in the
farmers about wastewater irrigation. Over 90% preferred to use wastewater due to its low cost of
waste water and nutrient load. In contrast, they were also largely of the opinion that wastewater
use had serious negative effects on human health and the quality of the groundwater. Although
farmers were well aware of these negative effects, they continued to use it for irrigation either
because they could not afford the higher cost of production that came with the use of cleaner
water sources, or because there simply were no other options. Most of the farmers surveyed were
illiterate, and they adopted mixed cropping patterns that included wheat, rice, vegetables,
sugarcane and fodder. Traces of Cr, Mn, Zn, Ni and Pb were observed in Uchkara groundwater,
wastewater and canal water, and UAF wastewater and soil. These metals traces were found above
the recommended threshold limits in soil, and no water source was found to be safe for irrigation
in terms of heavy metals pollution. Therefore, wastewater irrigated crops and vegetables were
analyzed to determine their levels of heavy metals uptake and accumulation. Concentrations of
Cr, Mn, Zn and Pb were observed at higher than safe limits in all the analyzed vegetables
(spinach, cabbage, cauliflower, mustard leaves and round gourd) and crops (berseem, sorghum,
maize, rice, wheat, lucerne, sugarcane). Heavy metals concentrations ranged from 0-2.25, 13.5-
54, 4.17-91.75, 0-4, and 4.5-23.27 mg/kg of dry weight of Pb, Zn, Mn, Ni, and Cr, respectively, in
crops and vegetables. Higher uptake and accumulation was observed in leafy vegetables like
spinchand crops Lucerne as compared to Round guard (vegetable) and sugarcane (crop).
113
Tomato (S. lycopersicon) germplasm lines were screened for heritable variation in yield, heavy
metal accumulation, and infection by S. enterica under wastewater irrigation. A wide range of
variation was observed among tomato germplasm lines for heavy metals accumulation and yield-
related traits such as the number of flowers, the number of fruits and fruit weight. Heavy metal
concentrations ranged from 0.35-50 for Cr, 3.75-16.25 for Mn, 0.75-3.25 for Ni, 0-3.75 for Pb,
and 13.75- 69.5 for Zn. The following increasing order was observed for accumulation of metals
in different plant parts: R >L >S >F for Ni; S > R >L >F for Zn; L > R > S >F for Pb; L > R > S
>F for Cr; and L > R > S > F for Mn. Marked differences were observed for heavy metal
accumulation among different plant tissues, and higher concentrations were found in vegetative
tissues compared to fruits. Similarly, clear differences were observed among genotypes in
relation to heavy metals tolerance and yield. Genotype PB-017906 was found to be the best
performing in terms of heavy metals tolerance, with the least concentration in fruit tissue, while
genotypes 10592 and LA–1401 were found to be the best performing in terms of yield. However,
these two genotypes were found to be high metal-accumulators to Cr and Mn accumulation, only
moderately low metal-accumulators of Ni and Pb and moderately high metal-accumulators to Zn.
A wide range of variability was observed for yield related traits, and the total number of flowers
and fruits ranged from 18-282.5 and 9.5-242, respectively, among the observed genotypes.
Under canal water irrigation the same genotypes had different responses for metals tolerance and
yield. Low concentrations of heavy metals were found in plant parts of the observed genotypes.
North Carolina mating design-II analysis depicted the nature and magnitude of gene action for
inheritance of different plant traits. The estimates for different genetic components showed that
along with both additive and non-additive (dominance) genetic effects, maternal effects were
involved in inheritance of heavy metal tolerance and yield-related traits. The results also
suggested that in tomato, an additive type of gene action affected inheritance of the number of
flowers and the number of fruits. While both additive and dominant genetic effects were
significant for heavy metals tolerance, accumulative dominance variance was higher than
additive variance, indicating that a dominance type of gene action was involved in the
inheritance of heavy metals tolerance.
Heat shock proteins (HSP) and Metathionine (M. thio) genes are over expressed under heavy
metal stress. Quantitative Real Time PCR analysis of these two structural genes revealed that the
transcription rate varied with plant part (root and leaf), metal type and degree of metal
114
accumulation. Under Pb and Cr stress, HSPs and M. thio transcripts accumulated at levels many
times higher than in the control root and leaf tissues as a tolerance mechanism for protection
against heavy metals stress, helping to lessen protein damage and sustain cellular homeostasis.
Under Pb stress, M. thio and HSP transcript accumulation was comparatively higher in roots and
leaves of Riograndi as compared to genotypes PB-017906 and CLN-2418A. Meanwhile, the
transcription rate of these genes was higher in roots and leaves of genotypes PB-017906 and
CLN-2418A than Riograndi under Cr stress.
A major drawback of wastewater application is the presence of the lethal disease causing
bacterium S. enterica. Molecular and biochemical diagnosis of S. enterica was carried out in
wastewater and tomato fruits after wastewater irrigation. While molecular results revealed that
the wastewater was indeed contaminated with S. enterica, infection by this bacterium was
confirmed in only two of 16 tomato fruit samples, although an additional 12 samples were
infected with some other, unidentified strains of bacteria.
115
REFERENCES
Abdul, R.M., D. Aktoprakligül, A. Zdemür, A. Vertii and T. Bütak. 2001. Heavy Metal
accumulation and detoxification mechanisms in plants. Turk J. Bot. 25: 111-121.
Abdullahi, M., A. Uzairu, G. Harrison and M. Balarabe. 2007. Trace metals screening of
tomatoes and onions from irrigated farmlands on the bank of River Challawa, Kano,
Nigeria. Electron. J. Environ. Agri. Food Chem. 6: 1869-1878.
Achakzai, A.K.K., Z.A. Bazai and S.A. Kayani. 2011. Accumulation of heavy metals by lettuce
(Lactuca sativa l.) Irrigated with different levels of wastewater of Quetta city. Pak. J. Bot.
43: 2953-2960.
Adams, M., J. Antoniw and C. Fauquet . 2004. Molecular criteria for genus and species
discrimination within the family Potyviridae. Arch Virol. 150: 459 - 479.
Adefemi, O.S. and E.E. Awokunmi. 2013. Uptake of Heavy Metals by Tomato (Lycopersicum
esculentus) Grown on Soil Collected from Dumpsites in Ekiti State, South West, Nigeria.
Int. J. Chem. 5(3).
Adhi Shankar, R.V., S.K. Reddy, M. Sujatha and M. Pratap. 2013. Combining ability and gene
action studies for yield and yield contributing traits in tomato (Solanum lycopersicum L.).
Helix. 6: 431-435.
Aftab, T., T. Shafiq, B. Khan and M.N. Chaudhry. 2011. Physicochemical Properties,
Contamination and Suitability of Canal Water for Irrigation, Lahore Branch Pakistan.
Pakistan. J. Anal. Environ. Chem. 12.
Afzal, M. 1996. Managing Water Resources for Environmentally Sustainable Irrigated
Agriculture in Pakistan. The Pakistan Development Rev. 35: 4 Part II (Winter 1996) pp.
977-988.
Agricultural Statistics of Pakistan. 2003-2004. Govt. of Pakistan, Ministry of Food, Agri and
livestock. (Economic-wing) Islamabad, Pakistan.
Ahmed, I., S. Attar, M. Parande. 1990. Removal of hexavalent chromium from industrial
wastewater by using biomass adsorbent rice husk carbone.

116
Alauddin, T .1975. Mass Poverty in Pakistan-a further study. The Pakistan Development
Review: 431-450.
Alebel, B.W. 2010. Wastewater use in crop production in peri-urban areas of Addis Ababa:
impacts on health in farm households. Environ. Develop. Eco. page 1 of 25.
Al-Karaki, G.N. 2011. Utilization of treated sewage wastewater for green forage production in a
hydroponic system. Emir. J. food. agri. 23.
Amiri, S.S., H. Maralian and A. Aghabarati. 2008. Heavy metal accumulation in under crown
Olea europaea L forest irrigated with wastewater. African J. Biotech. 7(21).
Andreoli, M., and Tellarini, V. 2000. Farm sustainability evaluation: methodology and practice.
Agri. Ecosyst. Environ. 77: 43-52.
Anonamous. 1997. Basic waste water characteristics. Pipeline. 8 (4)
Anonymous. 2007. Agricultural Statistics of Pakistan. MINFAL, Islamabad, Pakistan.(Ahmed,
Attar, and Parande).
Anwar, H.N., F. Nosheen, S. Hussain and W. Nawaz. 2010. Socio-economics consequences of
reusing wastewater in agriculture in Faisalabad. Pakistan. J. Life. Soc. Sci. 8: 102-105.
Arduini, I., D.L. Godbold and A. Onnis. 1995. Influence of copper on root growth and
morphology of Pinus pinea L and Pinus pinaster Ait. seedlings. Tree Physiol. 15: 411-
415.
Aremu, C. 2011. Genetic diversity: A review for need and measurements for intraspecies crop
improvement. J. Microbiol. Biotechnol. Res. 1: 80-85.
Asano, T. and G.S. Pettygrove. 1987. Using reclaimed municipal wastewater for irrigation.
California agric. 41: 15-18.
Asano, T. and A.D. Levine. 1996. Wastewater reclamation, recycling and reuse: past, present
and future. Water Sci. Technol. 33: 1-14.
Asano, T., F.L. Burton, H. Leverenz, R. Tsuchihashi, and G. Tchobanoglous. 2007. Water
Reuse: Issues, Technologies, and Applications. New York, NY: McGraw Hill.

117
Pearce, F. 2004.Sewage waters a tenth of world's irrigated crops. New Scientist, available at:
http://www.newscientist.com/article/dn6297.
Ashfaq, M., P. Amerasinghe and I. Baig. 2010. Economic valuation of benefits and costs of
wastewater irrigation in Pakistan. Draft report: Intl. Water Management Institute.
Bhatti, A.M., P. Suttinon and S. Nasu. 2009. Agriculture Water Demand Management In
Pakistan: A. Review And Perspective. Society for Social Management Systems (SSMS-
2009). Postdoctoral Research Fellow, COE, Kochi University of Technology, Kochi,
Japan. Director, MoT Department, Kochi University of Technology, Kochi.
Babu, K., V.B. Rajkishore, J. Narayanan and T. Margesan. 2013. Analysis of heavy metals and
inorganic element content in Stereospermum colais leaves. Intl. Current Pharmaceutical
J. 2: 63-66.
Babula, P., V.A.R. Opatrilova, J. Zehnalek and L.H.R. Kizek. 2008. Uncommon heavy metals,
metalloids and their plant toxicity. Environ. Chem. Lett. 6:189-213.
Baig, I., M. Ashfaq, I. Hassan, M. Javed, W. Khurshid and A. Ali. 2011. Economic impacts of
wastewater irrigation in Punjab. Pakistan. J. Agric. Res. 49: 5-14.
Bailey, S.E., T.J. Olin, R.M. Bricka and D.D. Adrian.1999. A review of potentially low-cost
sorbents for heavy metals. Water Res. 33: 2469-2479.
Baker, A. 1981. Accumulators and excluders strategies in the response of plants to heavy metals.
J. plant nutrition, 3: 643-654.
Banerjee, D., H. Bairagi, S. Mukhopadhyay, A. Pal, D. Bera and L. Ray. 2010. Heavy metal
contamination in fruits and vegetables in two districts of West Bengal, India. Electron. J.
Environ. Agric. Food Chem. 9(9).
Bartone, C. 1997. Financing Wastewater Management.In: Helmer, R and I. Hespanhol(eds.)
Water Pollution Control: A Guide to the Use of Water Quality Management Principles.
London: E&FN SPON, pp 191-218.
Benavides, M.P., S.M. Gallego and M.L. Tomaro. 2005. Cadmium toxicity in plants. Brazilian J.
Plant Physiol. 17: 21-34.

118
Bhattacharya, T., S. Chakraborty and D. Banerjee. 2010. Heavy metal uptake and its effect on
macronutrients, chlorophyll, protein, and peroxidase activity of Paspalum distichum
grown on sludge-dosed soils. Environ. Monit. Assess. 169: 15-26.
Bigdeli, M. and M. Seilsepour. 2008. Investigation of metals accumulation in some vegetables
irrigated with waste water in Shahre Rey-Iran and toxicological implications. Am. J.
Agri. Environ. Sci. 4: 86-92.
Bitton, G. 2005. Wastewater microbiology. John Wiley & Sons.
Blaylock, M.J. and J.W. Huang. 2000. Phytoextraction of metal. In: Phytoremediation of toxic
metal: Using plants to clean. Up the environmental. (Ed: I. Raskin and B.D. Ensley). John
Wiley & Sons, Torento, Canada. 53-70.
Bondada, B.R. and L.Q. Ma. 2003. Tolerance of heavy metals in vascular plants: arsenic
hyperaccumulation by Chinese brake fern (Pteris vittata L.), pp. 397-420, Pteridology in
the new millennium. Springer.
Bouwer, H. and E. Idelovitch. 1987. Quality requirements for irrigation with sewage water. J.
Irrigat. Drain. Engg. 113: 516-535.
Brar, K., P. Singh, V. Mittal, P. Singh, M. Jakhar, S.M. Yadav, U. Shekhawat and C. Kumar.
2010. GGE biplot analysis for visualization of mean performance and stability for seed
yield in taramira at diverse locations in India. J. Oilseed Brassica. 1: 66-74.
Bringezu, K., O. Lichtenberger, I. Leopold and D. Neumann. 1999. Heavy metal tolerance of
Silene vulgaris. J. Plant Physiol. 154: 536-546.
Briscoe, J. and U. Qamar. 2006. Pakistan's water economy: running dry. Karachi. Oxford
University Press.
Brown, J., A. Idris, K. Ostrow, N. Goldberg, R. French and D. Stenger. 2005. Genetic and
phenotypic variation of the pepper golden mosaic virus complex. Phytopathol. 95: 1217-
1224.
Brown, L.R. and B. Halweil. 1998. China’s water shortage could shake world food security.
World watch. 11: 10-21.
119
Brune, A., W. Urbach and K.J. Dietz. 1994. Compartmentation and transport of zinc in barley
primary leaves as basic mechanisms involved in zinc tolerance. Plant Cell. Environ. 17:
153-162.
Budhaka, B., M. Srikajorn and V. Boonkird. 2001. Thailand country report on investment in
water. Investment in land and water proceedings of the regional consultation at Bangkok,
Thailand. 3-5.
Bull, S., R. Briddon, W. Sserubombwe, K. Ngugi, P. Markham and J. Stanley. 2006. Genetic
diversity and phylogeography of cassava mosaic viruses in Kenya. J. Genet. Virol. 87:
3053-3065.
Bull, S., R. Briddon, W. Sserubombwe, K. Ngugi, P. Markham and J. Stanley. 2007. Infectivity,
pseudorecombination and mutagenesis of Kenyan cassava mosaic begomoviruses. J.
Genet. Virol. 88: 1624-1633.
Burton, G.W. and E.H. Devane. 1953. Establishing heritability in tall fescue from replicated
clonal material. Agron. J. 45: 478-81.
Buszewski, B., A. Jastrzębska, T. Kowalkowski and A. Gorna-Binkul. 2000. Monitoring of
selected heavy metals uptake by plants and soils in the area of Toruń, Poland. Polish J.
Environ. Stud. 9: 511-515.
Chahal, D., M. Dhaliwal and D. Ruma. 2004. Genetic analysis of yield and its component
characters in tomato (Lycopersicon esculentum) under low temperature. Veg. Sci. 31:
118-124.
Chakravarty, B. and S. Srivastava. 1992. Toxicity of some heavy metals in vivo and in vitro in
Helianthus annuus. Mutation Res. 283: 287-294.
Chang, I.S., P. Le-Clech, B. Jefferson, and S. Judd. 2002. Membrane fouling in membrane
bioreactors for wastewater treatment. J. Environ. Engg. 128: 1018-1029.
Chojnacka, K., A. Chojnacki, H. Gorecka and H. Gorecki. 2005. Bioavailability of heavy metals
from polluted soils to plants. Sci. Environ. 337: 175-182.
Clemens, S. 2001. Molecular mechanisms of plant metal tolerance and homeostasis. Planta. 212:
475-486.

120
Clemens, S. 2006. Toxic metal accumulation, responses to exposure and mechanisms of
tolerance in plants. Biochimie. 88: 1707-1719.
Cloete, T.E., E. Da-Silva and L.H. Nel. 1998. Removal of waterborne human enteric viruses and
coliphages with oxidized coal. Current microbiol. 37: 23-27.
Cobbett, C.S. 2000. Phytochelatin biosynthesis and function in heavy metal detoxification. Curr.
Opin. Plant. Biol. 3: 211-216.
Cobbett, C. and P. Goldsbrough. 2002. Phytochelatins and metallothioneins: roles in heavy metal
detoxification and homeostasis. Annu. Rev. plant Biol. 53: 159-182.
Comstock, R.E. and H.F. Robinson. 1952. Genetic parameters, their estimation and significance.
Proc. 6th Intern. Grassland Cong. 1: 248-291.
Cooper, R.C. 1991. Public health concerns in wastewater reuse. Water Sci. Technol. 24: 55-65.
Corriveau, J.L. and A.W. Coleman. 1988. Rapid screening method to detect potential biparental
inheritance of plastid DNA and results for over 200 angiosperm species. Am. J. Bot.
1443-1458.
Cosio, C., E. Martinoia and C. Keller. 2004. Hyperaccumulation of cadmium and zinc in Thlaspi
caerulescens and Arabidopsis halleri at the leaf cellular level. Plant. Physiol. 134: 716-
725.
Dar, R.A., J.P. Sharma, A. Nabi and S. Chopra. 2012. Germplasm evaluation for yield and fruit
quality traits in tomato (Solanum lycopersicon L.). Afr. J. Agri. Res. 7: 6143-6149.
Davies, P.S. 2005. The biological basis of wastewater treatment. Strathkelvin Instruments Ltd
United Kingdom.
De-la-Noüe, J., G. Laliberté and D. Proulx. 1992. Algae and waste water. J. Appl. Physiol. 4:
247-254.
De-Villiers, E., C. Fauquet, T. Broker, H. Bernard and H. zur-Hausen. 2004. Classification of
papilloma viruses. Virol. 324: 17-27.
Dikinya, O. and O. Areola. 2010. Comparative analysis of heavy metal concentration in
secondary treated wastewater irrigated soils cultivated by different crops. Int. J. Environ.
Sci. Technol. 7: 337-346.

121
Doganlar, S., A. Frary and S. Tanksley. 2000. The genetic basis of seed-weight variation: tomato
as a model system. Theor. Appl. Genet. 100: 1267-1273.
Drechsel, P., C.A. Scott, L. Raschid-Sally, M. Redwood and A. Bahri. 2009. Wastewater
irrigation and health. assessing and mitigating risk in low-income countries. London:
Earthscan.
Dutta, T.K and V. Mukta. 2012. Trace elements. Medicine. 22.
Elliott, H., J. Linn and G. Shields. 1989. Role of Fe in extractive decontamination of Pb-polluted
soils. Hazardous waste and hazardous materials. 6: 223-229.
Engelbrecht, R. 1978. Microbial hazards associated with the land application of wastewater and
sludge. Public Health Engineer. 6: 219-26.
Ensink, J.H., T. Mahmood and A. Dalsgaard. 2007. Wastewater irrigated vegetables: market
handling versus irrigation water quality. Trop. Med. Int. health. 12: 2-7.
Ensink, J.H., T. Mahmood, W. van der Hoek, L. Raschid-Sally and F.P. Amerasinghe. 2004. A
nationwide assessment of wastewater use in Pakistan: An obscure activity or a vitally
important one? Water Policy. 6: 197-206.
Ensink, J.H., W. Van der Hoek, Y. Matsuno, S. Munir and M.R. Aslam. 2002. Use of Untreated
Wastewater in Peri-Urban Agriculture in Pakistan.
EPA/540/S-92/018. 1992. Behaviour of metals in soils. USEPA Ground Water Issue. McLean, J.
B. Bledsoe.
Ernst, W.H.O. 1994. Wirkungen erhohter Bodengehalte an Arsen, Blei und Cadmium auf
Panzen. In: G. Kreysa and J. Urgen Weisner (eds), Boden Von Ballungsgebieten: Arsen,
Blei und Cadmium, pp. 319±333. Dechema, Frankfurt.
Falconer, D.1989. Introduction to quantitative genetics. 3rd edn. Longman, London.
Falkenmark, M. and G. Lindh. 1993.Water and Economic Development.In: Gleick, P.H.(ed.)
Water in Crisis: A Guide to the World’s Fresh Water Resources. New York:Oxford
University Press, pp. 80-91.
F.A.O. 1992. Wastewater Treatment and Use in Agriculture. F.A.O. (Food and Agriculture
Organization) Irrigation and Drainage Paper. 47: pp. 16-17.
122
F.A.O. 1985. Water quality for irrigation for agriculture. Irrigation and Drainage Paper. 29
Revision. 1: 1-130.
Farshadfar, E., H. Zali and R. Mohammadi. 2011. Evaluation of phenotypic stability in chickpea
genotypes using GGE-Biplot. Annu. Biol. Res. 2.
Fatima. I., M.R. Anjum, A.N. Mamon and T.G. Kazi. 2011. Trace metal contents of vegetables
and fruits of Hyderabad retail market. Pakistan. J. Nutr. 10: 365-372.
Fatoba, P., C. Ogunkunle, A. Oyedeji and O. Oladimejio. 2012. Assessment of heavy metal
contents of Lycopersicum esculentum mill. (tomato) and Capsicum chinense L. (pepper)
irrigated with treated and untreated detergent and soap wastewaters. Ethiop J. Environ.
Stud. Manag. 5: 506-510.
Feachem, R.G., D.J. Bradley, H. Garelick and D.D. Mara. 1983. Sanitation and Disease: Health
Aspects of Excreta and Wastewater Management. Chichester: John Wiley & Sons.
Fernie, A.R., Y. Tadmor and D. Zamir. 2006. Natural genetic variation for improving crop
quality. Curr. Opin. Plant. Biol. 9: 196-202.
Fisher, A., Fullerton, D., Hatch, N., & Reinelt, P. 1995. Alternatives for managing drought: A
comparative cost analysis. Journal of Environmental Economics and Management. 29(3):
304-320.
Foy, C.D., R.R. Weil and C.A. Coradetti. 1995. Differential manganese tolerances of cotton
genotypes in nutrient solution. J. Plant. Nutr. 18: 685-706.
Freas, K., L. van der Tak, J. Kepke, P. Pasteris and P. Karney. 2010. Confronting Climate
Change: An Early Analysis of Water and Wastewater Adaptation Costs Through 2050.
Proceed. Water Environ. Federation. 1940-1966.
Gabal, M., I. Abd-Allah, I. Abed, F. Hassan and S. Hassanen. 1985. Evaluation of some
American tomato cultivars grown for early summer production in Egypt. Annals of
Agriculture Science, Moshtohor (Egypt).
Galavi, M., A. Jalali, M. Ramroodi, S.R. Mousavi and H. Galavi. 2010. Effects of Treated
Municipal Wastewater on Soil Chemical Properties and Heavy Metal Uptake by
Sorghum (Sorghum Bicolor L.). J. Agri. Sci. (1916-9752), 2(3).
123
Gartside, D. and T. McNeilly. 1974. Genetic studies in heavy metal tolerant plants. Heredity, 32:
287-297.
Gerba, C.P. and J.E. Smith. 2005. Sources of pathogenic microorganisms and their fate during
land application of wastes. J. Environ. Qual. 34: 42-48.
Ghosh, R., S. Paul, S. Das, P. Palit, S. Acharyya, A. Das, J. Mir, S. Ghosh and A. Roy. 2008.
Molecular evidence for existence of a New World begomovirus associated with yellow
mosaic disease of Corchorus capsularis in India. Aus. Plant Dis. Notes 3: 59-62
Ghosh, K., A. Islam, M. Mian and M. Hossain. 2010. Variability and character association in F2
segregating population of different commercial hybrids of tomato (Solanum
lycopersicum L.). J. Appl. Sci. Environ. Manag. 14(2).
Girones, R., M.A. Ferrús, J.L. Alonso, J. Rodriguez-Manzano, B. Calgua, A. de Abreu Corrêa,
A. Hundesa, A. Carratala and S. Bofill-Mas. 2010. Molecular detection of pathogens in
water-the pros and cons of molecular techniques. Water Res. 44: 4325-4339.
Gladfelter, H., P. Eagle, E. Fontes, L. Batts and L. Hanley-Bowdoin. 1997. Two domains of the
AL1 protein mediate geminivirus origin recognition. Virol. 239: 186-197.
Golani, I., D. Mehta, V. Purohit, H. Pandya and M. Kanzariya. 2007. Genetic variability,
correlation and path coefficient studies in tomato. Indian J. Agri. Res. 41: 146-149.
Goupil, P., D. Souguir, E. Ferjani, O. Faure, A. Hitmi and G. Ledoigt. 2009. Expression of stress
related genes in tomato plants exposed to arsenic and chromium in nutrient solution. J.
Plant. Physiol. 166: 1446-1452.
Gul, R., H. Rahman, I.H. Khalil, S.M.A. Shah and A. Ghafoor. 2010. Heterosis for flower and
fruit traits in tomato (Lycopersicon esculentum Mill.). Afr. J. Biotechnol. 9: 4144-4151.
Gunasegaran, T., Rathinam, X., Kasi, M., Sathasivam, K., Sreenivasan, S., & Subramaniam, S.
(2011). Isolation and identification of < i> Salmonella </i> from curry samples and its
sensitivity to commercial antibiotics and aqueous extracts of <i> Camelia sinensis
</i>(L.) and< i> Trachyspermum ammi</i>(L.). Asian. Pac. J. Trop. Biomed. 1(4): 266-
269.
124
Guo, W.J., W. Bundithya and P.B. Goldsbrough. 2003. Characterization of the Arabidopsis
metallothionein gene family: tissue-specific expression and induction during senescence
and in response to copper. The New Phytologist. 159: 369-381.
Habbari, K., A. Tifnouti, G. Bitton and A. Mandil. 2000. Geohelminthic infections associated
with raw wastewater reuse for agricultural purposes in Beni-Mellal, Morocco. Int. J.
Parasitol. 48: 249-254.
Hall, J.L. 2002.Cellular mechanism for heavy metal detoxification and tolerance. J. Exp. Bot. 53:
1-11.
Hanif, R., Z. Iqbal, M. Iqbal, S. Hanif and M. Rasheed. 2006. Use of vegetables as nutritional
food: role in human health. J. Agri. Biol Sci. 1: 18-22.
Harold, C. Passam1., Ioannis C. Karapanos., Penelope J. Bebeli., Dimitrios Savvas1. 2007.A
Review of Recent Research on Tomato Nutrition, Breeding and Post-Harvest Technology
with Reference to Fruit Quality. Euro. J. Plant Sci. Biotech. 1(1): 1-21.
Harvey, P., C. LevingsIII and E. Wernsman. 1972. The role of extra chromosomal inheritance in
plant breeding. Adv. Agron. 24: 1-27.
Hashmi, D.R., S. Ismail and G. Shaikh. 2007. Assessment of the level of trace metals in
commonly edible vegetables locally available in the markets of Karachi city. Pakistan J.
Bot. 39: 747-751.
Hassan, N.U., Q. Mahmood, A. Waseem, M. Irshad and A. Pervez. 2013. Assessment of heavy
metals in wheat plants irrigated with contaminated wastewater. Pol. J. Environ. Stud.
22(1).
Hassinen, V.H. 2009.Search for metal-responsive genes in plants.University of Kuopio,
Department of Environmental Science.
Haydar, A., M.A. Mandal, M.B. Ahmed, M.M. Hannan, R. Karim, M. A. Razvy, U. K. Roy and
M. Salahin. 2007. Studies on Genetic Variability and Interrelationship among the
Different Traits in Tomato(Lycopersicon esculentum Mill.). Middle. East. J. Sci. Res. 2:
139-142.

125
Hedrick, U.P. and N.O. Booth. 1907. Mendelian characters in tomatoes. Proceedings Am. Soc.
Hort. Sci. 5: 19-24.
Henze, M., P. Harremoës, J. la Cour Jansen and E. Arvin. 2002. Wastewater Treatment:
Biological and Chemical Processes, 3rd ed, Springer-Verlag, Berlin.
Henze, M. 1997. Trends in advanced wastewater treatment. Water. Sci. Technol. 35: 1-4.
Hintz, L.D., R.R. Boyer, M.A. Ponder, R.C. Williams and S.L. Rideout. 2010. Recovery of
Salmonella enterica Newport introduced through irrigation water from tomato
(Lycopersicum esculentum) fruit, roots, stems, and leaves. Hort. Sci. 4: 675-678.
Hintz, R.B., M.A. Ponder and R.C. Williams. 2010. Recovery of Salmonella enteric newport
introduced through irrigation water from tomato (Lycopersicum esculentum) fruit, roots,
stems and leaves. Hort. Sci. 45: 675-678.
Holland, J.B., W.E. Nyquist and C.T.Cervantes-Martínez. 2003. Estimating and interpreting
heritability for plant breeding: An update. Plant Breed Rev. 22: 9-112.
Hooda, V. 2007. Phytoremediation of toxic metals from soil and waste water. J. Environ. Biol.
28.
Horsfall, M and Spiff A.I . 2004. Studies on the Effect of pH on the sorption of Pb2+ and Cd2+
ions from aqueous Solutions by Caladium bicolor (Wild cocoyam) Biomass. Electronic J.
Biotech. 7(3): 14-15.
Hossain, M.A., P. Piyatida, J.A.T. da Silva and M. Fujita. 2012. Molecular mechanism of heavy
metal toxicity and tolerance in plants: central role of glutathione in detoxification of
reactive oxygen species and methylglyoxal and in heavy metal chelation. J. Bot.
Huang, R.N. and T.C. Lee. 1996. Cellular uptake of trivalent arsenite and pentavalent arsenate in
KB cells cultured in phosphate-free medium. Toxicol. Appl. Pharmacol. 136: 243-249.
Hussain, M., S. Mansoor, S. Iram, A. Fatima and Y. Zafar. 2005. The nuclear shuttle protein of
Tomato leaf curl New Delhi virus is a pathogenicity determinant. J. Virol. 79: 4434-4439
Hussain, I., L. Raschid, M.A. Hanjra, F. Marikar and W. van der Hoek. 2001. A Framework for
Analyzing Socioeconomic, Health and Environmental Impacts of Wastewater Use in
Agriculture astewater Use in Agriculture in Developing Countries.

126
Hussain, S. I., K.M. Khokhar, T. Mahmood, M.H. Laghari, M.M. Mahmud, H. Vegetable Crops,
I. NARC and N. HRI. 2001. Yield potential of some exotic and local tomato cultivars
grown for summer production. Pakistan. J. Biol. Sci. 10(14): 1215-1216.
Ibrahim, M. and S. Salmon. 1992. Chemical composition of Faisalabad-city [Pakistan] sewage
effluent: I. Nitrogen, phosphorus and potassium contents. J. Agri. Res. 30.
Islam, M., H. Mohanta, M. Ismail, M. Rafii and M. Malek. 2013. Genetic variability and trait
relationship in cherry tomato (Solanum lycopersicum L. var. cerasiforme (Dunnal) A.
Gray). Bangl. J. Bot. 41: 163-167.
Ismail, F., M. Anjum, A. Mamon and T. Kazi. 2011. Trace metal content of vegetables and fruits
of hyderabad retail market. Pakistan. J. Nutr. 10(4).
Jacob, J.O. and S.E. Kakulu. 2012. Assessment of heavy metal bioaccumulation in spinach, jute
mallow and tomato in farms within Kaduna Metropolis, Nigeria. Am. J. Chem. 2: 13-16.
Jamal., H. 2013. Pakistan Poverty Statistics: Estimates for 2011. Research Report No.84.
Jamil, M., M.S. Zia and M. Qasim. 2010. Contamination of agro-ecosystem and human health
hazards from wastewater used for irrigation. J. Chem. Soc. Pakistan. 32: 370-378.
Jani, D., L.S. Meena, Q.M. Rizwan-ul-Haq, Y. Singh, A.K. Sharma and A.K. Tyagi. 2002.
Expression of cholera toxin B subunit in transgenic tomato plants. Transgenic Res. 11:
447-454.
Janssens, T.K., D. Roelofs and N.M. Van Straalen. 2009. Molecular mechanisms of heavy metal
tolerance and evolution in invertebrates. Insect Sci. 16: 3-18.
Jiménez, B. 2005. Treatment technology and standards for agricultural wastewater reuse: a case
study in Mexico. Irrigat. Drain. 54: S23-S33.
Jiménez, B. and T. Asano. 2008b. Water reclamation and reuse around the World. Chapter 1 in
Water Reuse: An International Survey of Current Practice, Issues and Needs, Jiménez, B
and T. Asano (eds), IWA Publishing, London, pp. 648.
Joan, E.M. and B.E. Bledsoe. 1992. Behavior of Metals in Soils. Environ and Planning A. 24: 1-
25.

127
John, O.J. and S.E. Kakulu. 2012. Assessment of Heavy Metal Bioaccumulation in Spinach, Jute
Mallow and Tomato in Farms Within Kaduna Metropolis, Nigeria. Am. J. Chem. 2: 13-
16.
John, P., P. Sivalingam, Q. Haq, N. Kumar, A. Mishra, R. Briddon and V. Malathi. 2008.
Cowpea golden mosaic disease in Gujarat is caused by a Mungbean yellow mosaic India
virus isolate with a DNA B variant. Arch. Virol. 153: 1359-1365
Johnson, H.W., H.E. Robinson and R.E. Comstock. 1955. Estimates of genetic and
environmental variability in soybeans. Agron. J. 47: 314-318.
Joshi, A., A. Vikram and K. Thakur. 2004. Genetics of yield and horticultural traits in tomato
(Lycopersicon esculentum Mill.). Veg. Sci. 31: 112-117.
Jung, M.C. 2008. Heavy metal concentrations in soils and factors affecting metal uptake by
plants in the vicinity of a Korean Cu-W mine. Sensors. 8: 2413-2423.
Kaplan, L., A. Pesce and S. Kazmierczak. 1993. Theory, analysis, correlation. Clinical
Chemistry 4th Ed., Published by Mosby. 707.
Karatas, M., S. Dursun, E. Guler, C. Ozdemir and M.E. Argun. 2006. Heavy metal accumulation
in wheat plants irrigated by waste water. Cell. Chem. Technol. 40(7): 575.
Kathy. F., V.D.T. Laurens, K. Jacqueline, P. Phillip, K. Patrick. 2010. Confronting climate
change: an early analysis of water and wastewater adaptation costs through 2050.
proceedings of the water environment federation, WEFTEC 2010: Session 31 through
Session. 40: 1940-1966.
Kearsey, M.J. 1965. Biometrical analysis of a random mating population: Comparison of five
experimental designs. Heredity, 20: 205-235.
Khan, M.J., M.T. Jan, N. Farhatullah, M.A. Khan, S. Perveen, S. Alam and A. Jan. 2011. The
effect of using wastewater for tomato. Pak. J. Bot. 43: 1033-1044.
Khan, A., S. Javid, A. Muhmood, T. Mjeed, A. Niaz and A. Majeed. 2013. Heavy metal status of
soil and vegetables grown on pen-urban area of Lahore district. Soil. Environ. 32(1).
Khan, A.A. and T. McNeilly. 2000. Genetic analysis of aluminium aand manganese tolerance in
maize (Zea mays L.). J. Genet. Breed. 54:245-249.

128
Khan, A.A. and T. McNeilly. 2005. Triple test cross analysis for salinity tolerance based upon
seedling root length in maize (Zea mays L.). Breed. Sci. 55: 321-325.
Khan, M.J., M.T. Jan, N. Farhatullah, M.A. Khan, S. Perveen, S. Alam and A. Jan. 2011. The
effect of using wastewater for tomato. Pakistan. J. Bot. 43: 1033-1044.
Kibria, M., M. Islam and M. Alamgir. 2012. Influence of wastewater irrigation on heavy metal
accumulation in soil and plant. Int. J. Appl. Nat. Sci. 1: 43-54.
Kihampa, C., W.J. Mwegoha and R.S. Shemdoe. 2011. Heavy metals concentrations in
vegetables grown in the vicinity of the closed dumpsite. Int. J. Environ. Sci. 2: 889-895.
Kivaisi, A.K. 2001. The potential for constructed wetlands for wastewater treatment and reuse in
developing countries: a review. Ecol. Engg. 16: 545-560.
Krämer, U., J.D. Cotter-Howells, J.M. Charnock, A.J.M. Baker and A.C. Smith. 1996. Free
histidine as a metal chelator in plants that accumulate nickel. Nature, 379: 635-638.
Laitinen, S., J. Kangas, M. Kotimaa, J. Liesivuori, P.J. Martikainen, A. Nevalainen, R. Sarantila
and K. Husman. 1994. Workers' exposure to airborne bacteria and endotoxins at
industrial wastewater treatment plants. Am. Ind. Hyg. Assoc. 55: 1055-1060.
Lawrence, K.A., A.J. Pesce and S.C. Kazmierczak. 1993. Clinical Chemistry, 4th ed., Theory,
Analysis, Correlation, ISBN 0-323-01716-9, Published by Mosby Inc. USA. 707-721.
Lawrence, M.J. 1984. The genetical analysis of ecological traits. In: Evolutionary Ecology.
(Ed.):B. Shorrocks. pp. 27-63. Blackwell Sci. Publ. Oxford, London, Edinburgh.
Lee, C.W., M.B. Jackson, M.E. Duysen, T.P. Freeman and J.R. Self. 1996. Induced
micronutrient toxicity in Towndown Kentucky bluegrass. Crop Sci. 36: 705-712.
Leopold, I., D. Günther, J. Schmidt and D. Neumann. 1999. Phytochelatins and heavy metal
tolerance. Phytochem. 50: 1323-1328.
Levings, C. and D. Pring. 1977. Diversity of mitochondrial genomes among normal cytoplasms
of maize. J. Heredity, 68: 350-354.
Lewis, S., M.E. Donkin and M.H. Depledge. 2001. Hsp70 expression in Enteromorpha
intestinalis (Chlorophyta) exposed to environmental stressors. Aquatic Toxicol. 51: 277-
291.

129
Lewis, S., R.D. Handy, B. Cordi, Z. Billinghurst and M.H. Depledge. 1999. Stress proteins
(HSPs): methods of detection and their use as an environmental biomarker. Ecotoxicol. 8:
351-368.
Li, Z., X. Zhou, X. Zhang and Y. Xie. 2004. Molecular characterization of tomato-infecting
begomoviruses in Yunnan, China. Arch. Virol. 149: 1721-1732.
Lindsay, W.L. and W.A. Norvell. 1978. Development of a DTPA soil test for Zn, Fe, Mn and
Cu. Soil. Sci. Soc. Am. J. 42: 421-428.
Lone, A.H., E.P. Lal, S. Thakur, S. Ganie and M. Saleem. 2013. Accumulation of heavy metals
on soil and vegetable crops grown on sewage and tube well water irrigation. Sci. Res.
Essays. 8: 2187-2193.
Luna, C.M., C.A. Gonzalez and V.S. Trippi. 1994. Oxidative damage caused by an excess of
copper in oat leaves. Plant Cell Physiol. 35: 11-15.
Ma, L.Q., K.M. Komar, C. Tu, W. Zhang, Y. Cai and E.D. Kennelley. 2001. A fern that
hyperaccumulates arsenic. Nature, 409: 579-579.
Machado, V.S., J. Bandeen, G. Stephenson and P. Lavigne. 1978. Uniparental inheritance of
chloroplast atrazine tolerance in Brassica campestris. Can. J. Plant Sci. 58: 977-981.
Macnair, M.R., G.H. Tilstone and S.E. Smith. 2000. The genetics of metal tolerance an
accumulation in higher plants. In: Terry N, Banuelos G eds. Phytoremediation of
contaminated soil and water. CRC press LLC. 235-250.
Macovei, A., L. Ventura, M. Donà, M. Faè, A. Balestrazzi and D. Carbonera. 2010. Effect of
heavy metal treatments on metallothionein expression profiles in white poplar (Populus
alba L.) cell suspension cultures. Annu. Univ. Oradea-Fascic Biol. 2: 274-279.
Mahmood, S. and A. Maqbool. 2006. Impacts of wastewater irrigation on water quality and on
the health of local community in Faisalabad [Pakistan]. Pakistan J. Water Res. 10.
Mahmoud, N. 2011. Wastewater characteristics. Ecological Sanitation Training Course
Majeed., Z and A. Piracha. 2011. Water Conservation of Pakistan’s Agricultural, Municipal and
Industrial Water. Intl. J. Water Res. & Arid Environ. 1: 232-238.

130
Maldonado, V., H.R. Arias, R. Quintana, R. Saucedo, M. Gutierrez, J. Ortega and G. Nevarez.
2008. Heavy metal content in soils under different wastewater irrigation patterns in
Chihuahua, Mexico. Int. j. environ. Res. Public Health. 5: 441-449.
Mami, M., G. Ahmadi, M. Shahmoradi and H.R. Gorbani-African. 2011. Influence of different
concentration of heavy metals on the seed germination and growth of tomato. J. Environ.
Sci. Technol. 5: 420-426.
Mansoor, S., S. Khan, A. Bashir, M. Saeed, Y. Zafar, K. Malik, R. Briddon, J. Stanley and P.
Markham. 1999. Identification of a novel circular single-stranded DNA associated with
cotton leaf curl disease in Pakistan. Virol. 259: 190-199.
Mapanda, F., E. Mangwayana, J. Nyamangara and K.E. Giller. 2007. Uptake of heavy metals by
vegetables irrigated using wastewater and the subsequent risks in Harare, Zimbabwe.
Phys. Chem. Earth. 32: 1399-1405.
Mara, D.D., S. Cairncross and W.H. Organization 1989.Guidelines for the safe use of wastewater
and excreta in agriculture and aquaculture. World Health Organization Geneva. 187.
Martin, D., E. Walt, D. Posada and E. Rybicki. 2005. The evolutionary value of recombination is
constrained by genome modularity. PLoS Genet 1: e51.
Martin, S. and W. Griswold. 2009. Human health effects of heavy metals. Environmental science
and technology briefs for citizens. Center for Hazardous Substance Research, Kansas
State University. 15.
McNeil, K.R. and S. Waring. 1992. Vitrification of contaminated soils. in contaminated land
treatment technologies (Edited by J. F. Rees), Society of Chemical Industry. Elsvier
Applied Sciences, London. 143-159.
Melloul, A.A., L. Hassani and L. Rafouk. 2001. Salmonella contamination of vegetables
irrigated with untreated wastewater. World J. Microbiol. Biotechnol.17: 207-209.
Memon, A., D. Aktoprakligil, A.A. Ozdemir and A. Vertii. 2001. Heavy metal accumulation and
detoxification mechanisms in plants. Turkish J. Bot. 25: 111-121.

131
Miller, R. 1998. Nitric-perchloric acid wet digestion in an open vessel. In Handbook of
Reference Methods for Plant Analysis.(Ed. YP Kalra) pp. 57-61. CRC Press: Boca Raton,
FL.
Milone, M.T., C. Sgherri, H. Clijters and F. Navari-Izzo. 2003. Antioxidative responses of wheat
treated with realistic concentrations of cadmium. Environ. Exp. Bot. 50: 265-273.
MINFAL. 2007. In: Agricultural Statistics of Pakistan 2006-07. Ministry of Food, Agriculture
and Livestock, Food Agriculture and Livestock Statistics Division, Islamabad,
Government of Pakistan. pp. 278.
Minnich, M.M., M.B. McBride and R.L. Chaney. 1987. Copper activity in soil solution. II.
Relation to copper accumulation in young snapbeans. Soil. Sci. Soc. Am. J. 51: 573-578.
Mohamed, S., E. Ali and T. Mohamed. 2012. Study of heritability and genetic variability among
different plant and fruit characters of Tomato (Solanum lycopersicon L.). Int. J.
Sci.Technol. Res.1: 55-58.
Monni, S., M. Salemaa and N. Miller. 2000. Environmental Pollution. 109: 221-229.
Moscosco, J. 1996. Aquaculture using treated effluents from the San Juan stabilization ponds,
Lima, Peru. recycling waste for agriculture: the rural-urban connection. 23-24.
Mosleh, Y.Y. and O.A.E.H. Almagrabi. Heavy metal accumulation in some vegetables irrigated
with treated wastewater. Int. J. Green. Herb. Chem. 111: 811-815.
Raikwar, M.K., P. Kumar, M. Singh and A. Singh. 2008. Toxic effect of heavy metals in
livestock health. Veterinary World. 1: 28-30
Murtaza, G., A. Ghafoor and M. Qadir. 2008. Accumulation and implications of cadmium,
cobalt and manganese in soils and vegetables irrigated with city effluent. J. Sci. Food.
Agri. 88: 100-107.
Murtaza, G., A. Ghafoor, M. Qadir, G. Owens, M. Aziz and M. Zia. 2010. Disposal and use of
sewage on agricultural lands in Pakistan: A review. Pedosphere. 20: 23-34.
Mussarat, M., A.U. Bhatti and F.U. Khan. 2007. Concentration of metals in sewage and canal
water used for irrigation in Peshawar. Sarhad J. Agr. 23: 335.

132
Mustafa. 2009. Molecular and biochemical diagnosis of Salmonella in wastewater. J. Appl. Sci.
Environ. Manage. 13: 83-92.
Naaz, S. and S. Pandey. 2010. Effects of industrial waste water on heavy metal accumulation,
growth and biochemical responses of lettuce (Lactuca sativa L.). J. Environ. Biol. 31.
Naika, S. 2005. Cultivation of tomato: Production, processing and marketing. Agromisa
Foundation and CTA.
Naseem, S.M. A Review of Studies on Poverty in Pakistan: Origin, Evolution, Thematic.
National Research Council, 1996.Chapter 5, public health concerns and infectious disease
agent.Use of Reclaimed Water and Sludge in Food Crop Production. Chapter 5: 89-99
National Academy Press. Washington, D.C.
Naz, F., I. Haq, S. Asghar, A.S. Shah and A. Rahman. 2011. Studies on growth, yield and
nutritional composition of different tomato cultivars in Battal Valley of District
Mansehra, Khyber PakhtunKhwa Pakistan. Sarhad J. of Agric. 27: 469-471.
Neumann, D., O. Lichtenberger, D. Günther, K. Tschiersch and L. Nover. 1994. Heat shock
proteins induce heavy metal tolerance in higher plants. Planta. 194: 360-367.
Nichols, P. 1991.Social survey methods: a field guide for development workers. Vol. 6 Oxfam.
Nies, D.H. 1999. Microbial heavy-metal resistance. Appl. Microbiol. Biotechnol. 51: 730-750.
NNCW and WWF. 2000. Pakistan wetlands action plan.
Okoh, A.I., T. Sibanda and S.S. Gusha. 2010. Inadequately treated wastewater as a source of
human enteric viruses in the environment. Int J. environ. Res. Public health. 7: 2620-
2637.
Opeolu, B.O., O.O. Adenuga, P.A. Ndakidemi and O.O. Olujimi. 2010. Assessment of phyto-
toxicity potential of lead on tomato (Lycopersicon esculentum L) planted on
contaminated soils. Int. J. Phys. Sci. 5: 068-073.
Ouzounidou, G. 1994. Root growth and pigment composition in relationship to element uptake in
Silene compacta plants treated with copper. J. Plant Nutr. 17: 933-943.

133
Ouzounidou, G., E.P. Eleftheriou and S. Karataglis. 1992. Ecophysical and ultrastructural effects
of copper in Thlaspi ochroleucum. Can J. Bot. 70: 947-957.
Ozores-Hampton, M., P.A. Stansly and T.A. Obreza. 2005. Heavy metal accumulation in a sandy
soil and in pepper fruit following long-term application of organic amendments. Compost
science & utilization. 13: 60-64.
Pakistan Water Sector Strategy (PWSS). 2002. National water sector profile, volume 5, October
2002, Ministry of Water and Power, Office of the Chief Engineering Advisor. Available
at http://waterinfo.net.pk/cms/pdf/vol5.pdf
Pak-SCEA. 2006. Pakistan; Strategic Country Environmental Assessment Report: Rising to the
Challenges, May, 2006.
Pál1, M. E. Horváth1, T. Janda1, E. Páldi1, and G. Szalai1. 2006. Physiological changes and
defense mechanisms induced by cadmium stress in maize. J. Plant Nutr. Soil Sci. 169:
239-246.
Palmiter, R.D. and S.D. Findley. 1995. Cloning and functional characterization of a mammalian
zinc transporter that confers resistance to zinc. EMBO J. 14: 639-649.
Passam, H.C., I.C. Karapanos, P.J. Bebeli and D. Savvas. 2007. A review of recent research on
tomato nutrition, breeding and post-harvest technology with reference to fruit quality. Eur
J. Plant Sci. Biotechnol. 1: 1-21.
Paterson, A.H., S. Damon, J. Hewitt, D. Zamir, H. Rabinowitch, S. Lincoln, E. Lander and S.
Tanksley. 1991. Mendelian factors underlying quantitative traits in tomato: comparison
across species, generations and environments. Genet. 127: 181-197.
Patterson, W. and J.J. Olson. 1983. Effects of heavy metals on radicle growth of selected woody
species germinated on filter paper, mineral and organic soil substrates. Can J. For. Res.
13: 233-238.
Payment, P., R. Plante and P. Cejka. 2001. Removal of indicator bacteria, human enteric viruses,
Giardia cysts, and Cryptosporidium oocysts at a large wastewater primary treatment
facility. Can. J. Microbiol. 47: 188-193.
134
Pearce, F. 2004.Sewage waters a tenth of world's irrigated crops. New Scientist, available at:
http://www.newscientist.com/article/dn6297.
Peralta, J.R., R.T.L. Gardea, K.L. Thiemann, E. Gomez, S.R.E. Arteaga and J.G. Parsons. 2000.
Study of the effects of heavy metals on seed germination and plant growth of alfalfa plant
(Medicagos sativa) grown in solid media. Proceedings of the 2000 conference of
hazardous waste research. 135: 1-6.
Pescod, M. 1992. Wastewater treatment and use in agriculture-FAO irrigation and drainage
paper 47: Food and Agriculture Organization of the United Nations. Natural Resources
Management and Environment Department http://www fao org/docrep/T0551E/t0551e06
htm 4.
Pettygrove, G., S. Upadhyaya, J. Young, E. Miyao, and M. Pelletier. 1999. Tomato yield
variability related to soil texture and inadequate phosphorus supply. Better Crops. 83:7-9.
Pietrini, F., M.A. Iannelli, S. Pasqualini and A. Massacci. 2003. Interaction of Cadmium with
glutathione and photosynthesis in developing leaves and chloroplasts of Phragmites
australis (Cav.) Trin. Steudel Plant Physiol.133: 829-837.
Qadir, M., A. Ghafoor, S. Hussain, G. Murtaza and T. Mahmood. 1997. Proc. Environmental
Polution: third Natl. Symp. Modern Trends in Contemporary Chemistry.
Raikwar, M.K., P. Kumar, M. Singh and A. Singh. 2008. Toxic effect of heavy metals in
livestock health. Veterinary world. 1: 28-30.
Rauser, W.E. 1999. Structure and function of metal chelators produced by plants. Cell biochem.
biophys. 31: 19-48.
Rehman, F., F. Khan, D. Varshney, F. Naushin and J. Rastogi. 2011. Effect of cadmium on the
growth of tomato. Biol Med. 3: 187-190.
Rejeb, S., F. Gharbi, A. Mouneimne and M. Ghorbal. 2011. Effects of sludge on the metals
levels of various edible crops grown in the field. J. Agri. Biol. Sci. 6.
Ren, F., T. Liu, H. Liu and B. Hu. 1993. Influence of zinc on the growth, distribution of
elements, and metabolism of one-year old American ginseng plants. J. Plant Nutr. 16:
393-405.

135
Rincón, A.-G., and Pulgarin, C. 2005. Use of coaxial photocatalytic reactor (CAPHORE) in the
TiO< sub> 2</sub> photo-assisted treatment of mixed< i> E</i>.< i> coli</i> and< i>
Bacillus</i> sp and bacterial community present in wastewater. Catalysis Today. 101:
331-344.
Robinson, D.S. 1987.Food-biochemistry and nutritional value. Longman Scientific & Technical.
Rowan, A. K., Snape, J. R., Fearnside, D., Barer, M. R., Curtis, T. P., and Head, I. M. 2003.
Composition and diversity of ammonia oxidising bacterial communities in wastewater
treatment reactors of different design treating identical wastewater. FEMS Microbiol.
Ecol. 43: 195-206.
Ruf, S., M. Hermann, I.J. Berger, H. Carrer and R. Bock. 2001. Stable genetic transformation of
tomato plastids and expression of a foreign protein in fruit. Nature biotechnol.19: 870-
875.
Sacks, E.J. and D.A.S. Clair. 1996. Cryogenic storage of tomato pollen: effect on fecundity.
Hort. Sci. 31: 447-448.
Sahar, Z., A. Desouky, E. Ehab and M. Marwa. 2009. Molecular and biochemical diagnosis of
Salmonella in wastewater. J. Appl. Sci. Environ. Manage. 13.
Saleem, M.Y., M. Asghar, Q. Iqbal, Attiq-Ur-Rahman and M. Akram. 2013. Diallel analysis of
yield and some yield components in tomato (Solanum lycopersicum L.). Pakistan J. Bot.
45: 1247-1250.
Salem, I.B., M. Aouni And R. Mzoughi. 2010. Specific Detection of Salmonella spp. in Food by
Multiplex Polymerase Chain Reaction. Adv. Stud. Biol. 2: 73-88.
Salt, D.E., R.C. Prince, I.J. Pickering and I. Raskin. 1995. Mechanisms of cadmium mobility and
accumulation in Indian mustard. Plant Physio. 109: 1427-1433.
Sandhu, A.P.S., R.V. Abdelnoor and S.A. Mackenzie. 2007. Transgenic induction of
mitochondrial rearrangements for cytoplasmic male sterility in crop plants. Proceedings
of the National Academy of Sciences. 104: 1766-1770.
136
Schat, H., M. Llugany, R. Vooijs, J.H. Whitaker and P.M. Bleeker. 2002. The role of
phytochelatins in constitutive and adaptative heavy metal tolerance in hyperaccumulator
and non-hyperaccumulator metallophytes. J. Exp. Bot. 379: 2381- 2392.
Schaub, S.A. and C.A. Sorber. 1977. Virus and bacteria removal from wastewater by rapid
infiltration through soil. Appl. Environ Microbiol. 33: 609-619.
Scott, C.A., J.A. Zarazúa and G. Levine 2000.Urban-wastewater reuse for crop production in the
water-short Guanajuato river basin, Mexico.41 IWMI.
Scott, C.A., N.I. Faruqui and L. Raschid-Sally 2004.Wastewater use in irrigated agriculture:
Confronting the livelihood and environmental realities.CABI.
Sharma, D. and A. Shukla. 2013. Analysis of heavy metals in soil and vegetables irrigated with
wastewater in Meerut city region. Int. J. Adv. Life Sci. 6: 287-292.
Sharmaa, R.K., M. Agrawala, F. Marshall. 2007. Heavy metal contamination of soil and
vegetables in suburban areas of Varanasi, India Ecotoxicology and Environmental Safety.
Science Direct. 66: 258-266.
Shuval, H.I. 1990. Wastewater irrigation in developing countries: health effects and technical
solutions. Water and Sanitation Discussion Paper Series UNDP World Bank.
Shuval, H.I., A. Adin, B. Fattal, E. Rawitz and P. Yekutiel. 1986. Wastewater irrigation in
developing countries: health effects and technical solutions. Technical Paper Number 51.
World Bank, Washington DC. pp. 324.
Singh, A., R.K. Sharma, M. Agrawal and F.M. Marshall. 2010. Health risk assessment of heavy
metals via dietary intake of foodstuffs from the wastewater irrigated site of a dry tropical
area of India. Food. Chem. Toxicol. 48: 611-619.
Singh, D., P. Chhonkar and R. Pandey. 1999. Soil plant water analysis: a methods manual.
Indian Agricultural Research Institute, New Delhi, 120-121.
Singh, S., M. Zacharias, S. Kalpana and S. Mishra. 2012. Heavy metals accumulation and
distribution pattern in different vegetable crops. J. Environ. Chem. Ecotoxicology 4: 75-
81.

137
Sooksa-nguan, T., B. Yakubov, V.I. Kozlovskyy, C.M. Barkume, K.J. Howe, T.W. Thannhauser,
M.A. Rutzke, J.J. Hart, L.V. Kochian and P.A. Rea. 2009. Drosophila ABC Transporter,
DmHMT-1, Confers Tolerance to Cadmium DmHMT-1 AND ITS YEAST HOMOLOG,
SpHMT-1, are not essential for vacuolar phytochelatin sequestration. J. Biol. Chem. 284,
354-362.
Steel, R. G.D., J.H. Torrie and D. A. Dickney., 1997. Principles and procedures of statistics, A
Biometrical Approach. Singapore: 3rd Ed. McGraw Hill Book co. Inc.
Steffens, J.C. 1990. The heavy metal-binding peptides of plants. Annu. Rev. Plant Physiol. Plant
Mol. Biol. 41: 553-575.
Stephenson, T., K. Brindle, S. Judd, and B. Jefferson. 2000. Membrane bioreactors for
wastewater treatment. SWITCH PROJECT IEWS, Birzeit University, 25-2.
Takeda, S. and M. Matsuoka. 2008. Genetic approaches to crop improvement: responding to
environmental and population changes. Nature Rev. Gene. 9: 444-457.
Taylor, G.J and C.D. Foy.1985. Differential uptake and toxicity of ionic and chelated copper in
Triticum aestivum. Can. J. Bot. 63: 1271-1275.
Tchobanoglous, G. and F.L. Burton. 1991. Wastewater engineering. Management. 7: 1-4.
Thapa, G., A. Sadhukhan, S.K. Panda and L. Sahoo. 2012. Molecular mechanistic model of plant
heavy metal tolerance. Biometals. 25: 489-505.
Thomsen, V. 2006. A timeline of atomic spectroscopy. Spectroscopy-Springfield Then Eugene
Then Duluth. 21: 32.
Tilstone, G.H and M. Macnair. 2001. Multiple metal tolerance to nickel in Mimulus guttatus
Fischer ex DC. S AFR J. SCI. 97: 539-544.
Tiwari, J. and D. Upadhyay. 2011. Correlation and path-coefficient studies in tomato
(Lycopersicon esculentum Mill.). Res J. Agric. Sci. 2: 63-68.
Tomáš, J., J. Árvay and T. Tóth. 2012. Heavy metals in productive parts of agricultural plants. J.
Microbiol. Biotech. Food Sci. 1: 819-827.

138
Turner, R.G. 1996. Heavy metals tolerance in .In: Ecological aspects of the mineral nutrition of
plants (Ed.by I.H. Rorison), British ecological society symposium. 9: 399-410.blackwell
scientific publication, oxford.
United Nations Industrial Development Organization (UNIDO). 2000. Industrial Policy and the
Environment in Pakistan. UNIDO, Vienna, Austria.
Van Assche, F and H. Clijsters. 1986. Inhibition of photosynthesis in Phaseolus vulgaris by
treatment with toxic concentration of zinc: effect on ribulose-1,5-biphosphate
carboxylase/oxygenase. J. Plant Physiol. 125: 355-360.
Varavipour, M., S. GIVEHCHI and M. Mashal. 2009. Heavy Metals Distributions and Uptake in
Field-Grown Maize after Application of Sewage Sludge in Soil of South Eastern, Iran.
Asian J. Chem. 21: 23-30.
Vörösmarty, C.J., P. Green, J. Salisbury and R.B. Lammers. 2000. Global water resources:
vulnerability from climate change and population growth. Science, 284-289.
Wagner, M., A. Loy, R. Nogueira, U. Purkhold, N. Lee and H. Daims. 2002. Microbial
community composition and function in wastewater treatment plants. Antonie Van
Leeuwenhoek. 81: 665-680.
Walczak, M. and E. Lalke-Porczyk. 2009. Occurrence of bacteria Salmonella spp. in sewage
sludge used in agriculture. Environ. Prot. Eng. 35: 5-12.
Wang, H., M.O. Kimberley and M. Schlegelmilch. 2001. Biosolids derived nitrogen
mineralization and transformation in forest soils. J. Environ. Qual. 32: 1851-1856.
Wang, H., M.O. Kimberley and M. Schlegelmilch. 2003. Biosolids-derived nitrogen
mineralization and transformation in forest soils. J. Environ. Qual. 32: 1851-1856.
Watson, M. L. 1958. Staining of tissue sections for electron microscopy with heavy metals. J.
Biophys. Biochem. Cytol. 4: 475-478.
Way, J.S., K.L. Josephson, S.D. Pillai, M. Abbaszadegan, C.P. Gerba and I.L. Pepper. 1993.
Specific detection of Salmonella spp. by multiplex polymerase chain reaction. Appl.
Environ. Microbiol. 59:1473-1479.

139
Weldesilassie, A.B., E. Boelee, P. Drechsel and S. Dabbert. 2011. Wastewater use in crop
production in peri-urban areas of Addis Ababa: impacts on health in farm households.
Environ. Dev. Econ. 16: 25-49.
WHO. 2007. Joint FAO/WHO Expert standards program codex Alimentation Commission.
Geneva, Switzerland. Available online http://www.who.int [Accessed 10/09/2012].
WHO. 2008. Microbial fact sheets.In Guidelines for Drinking-water Quality, Third Edition
Incorporating the First and Second Addenda - Volume 1: Recommendations, pp. 221-95.
Geneva: World Health Organization.
WHO/FAO. 2007. Joint FAO/WHO Food Standard Programme Codex Alimentarius
Commission 13th Session. Report of the Thirty Eight Session of the Codex Committee on
Food Hygiene. Houston, United States of America.
Wiesmann, U., S.I. Choi and E.M. Dombrowski. 2007. Fundamentals of biological wastewater
treatment. John Wiley & Sons.
Williams, L.E., J.K. Pittman and J.L. Hall. 2000. Emerging mechanisms for heavy metal
transport in plants. Biochimica et Biophysica Acta 1465: 104-126.
Worldwide Fund for Nature (WWF). 2007. Pakistan’s waters at risk: Water & health related
issues in Pakistan & key recommendations, Available at
http://www.wwfpak.org/pdf/water-report.pdf
Yadav, A., P.K. Yadav and D. Shukla. Investigation of Heavy metal status in soil and vegetables
grown in urban area of Allahabad, Uttar Pradesh, India.
Yan, W. and N.A. Tinker. 2006. Biplot analysis of multi-environment trial data: Principles and
applications. Can J. plant. Sci. 86: 623-645.
Yang, Z.M., J. Wang, S.H. Wang and L.L. Xu. 2003. Salicylic acid-induced aluminum tolerance
by modulation of citrate efflux from roots of Cassia tora L. Planta. 217: 168-174.
Yordanov, M. 1983. Heterosis in tomato. In: R. Frankel [ed.], Heterosis: Reappraisal of Theory
and Practice. Springer-Verlag, pp. 189-219.
Zafar, A. and S. Akhtar. 2003. Farmers perception about social impact and constraints in
wastewater irrigation. Pakistan J. Agric. Sci. 40: 210-213.

140
Zagorchev, L., C.E. Seal, I. Kranner and M. Odjakova. 2013. A central role for thiols in plant
tolerance to abiotic stress. Int J Mol Sci.14: 7405-7432.
Zdravković, J., N. Pavlović, Z. Girek, M. Brdar-Jokanović, D. Savić, M. Zdravković and D.
CVIKIĆ. 2011. Generation mean analysis of yield components and yield in tomato
(Lycopersicon esculentum Mill.). Pakistan. J. Bot. 43: 1575-1580.
Zeid, I.M., S. Ghazi and D. Nabawy. 2013. Alleviation of heavy metals toxicity in waste water
used for plant irrigation. Intl J. Agron. Plant. Prod. 4: 976-983.
Zhang, W., N. Olson, T. Baker, L. Faulkner, M. Agbandje-McKenna, M. Boulton, J. Davies, and
R. McKenna. 2001. Structure of the Maize streak virus geminate particle. Virol. 279:
471-477.
Zhang, Y. and J. Liu. 2011. Transgenic alfalfa plants co-expressing glutathione S-transferase
(GST) and human CYP2E1 show enhanced resistance to mixed contaminates of heavy
metals and organic pollutants. J. Hazard. Mater. 189: 357-362.
Zhao, S., D. White, S. Friedman, A. Glenn, K. Blickenstaff, S. Ayers, J. Abbott, E. Hall-
Robinson and P. McDermott. 2008. Antimicrobial resistance in Salmonella enterica
serovar Heidelberg isolates from retail meats, including poultry, from 2002 to 2006.
Appl. Environ. Microbiol. 74: 6656-6662.
Zhou, X., Y. Xie, X. Tao, Z. Zhang, Z. Li and C. Fauquet. 2003. Characterization of DNAbeta
associated with begomoviruses in China and evidence for co-evolution with their cognate
viral DNA-A. J. Gen. Virol. 84: 237 - 247.
Zhu, B. and A.K. Alva. 1993. Effect of pH on growth and uptake of copper by swingle
citrumelo seedlings. J. Plant. Nutr. 16:1837-1845.
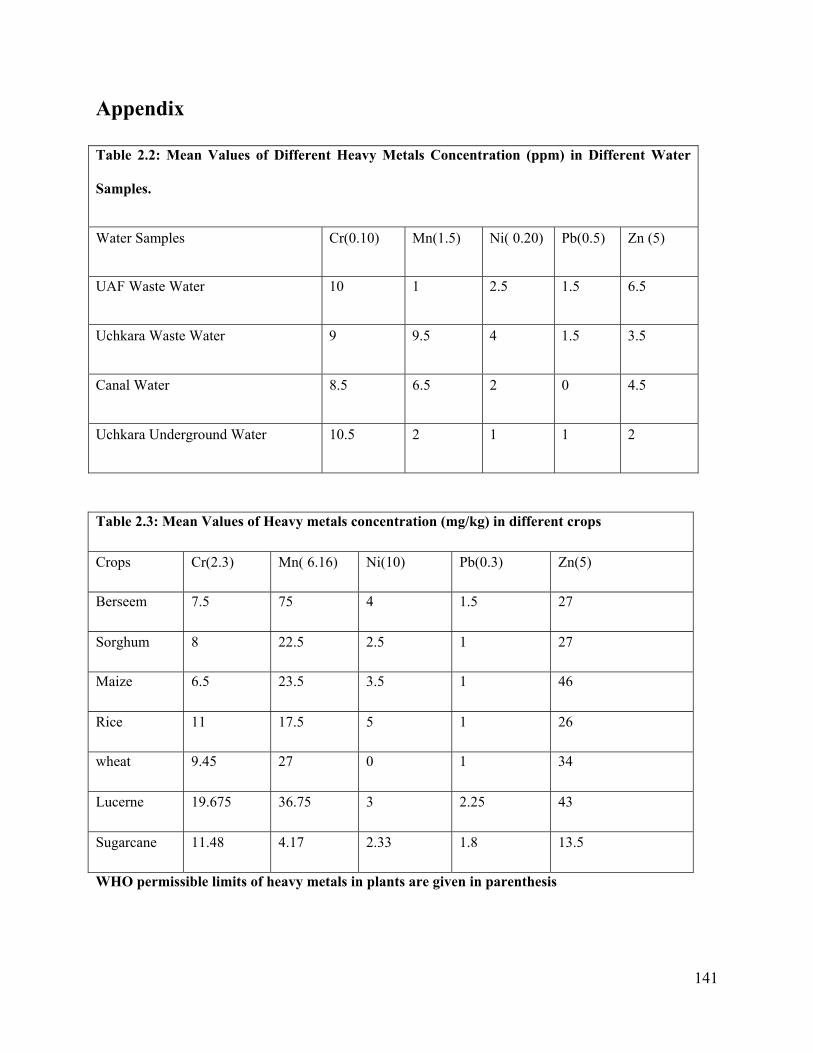
141
Appendix
Table 2.2: Mean Values of Different Heavy Metals Concentration (ppm) in Different Water
Samples.
Water Samples Cr(0.10) Mn(1.5) Ni( 0.20) Pb(0.5) Zn (5)
UAF Waste Water 10 1 2.5 1.5 6.5
Uchkara Waste Water 9 9.5 4 1.5 3.5
Canal Water 8.5 6.5 2 0 4.5
Uchkara Underground Water 10.5 2 1 1 2
Table 2.3: Mean Values of Heavy metals concentration (mg/kg) in different crops
Crops Cr(2.3) Mn( 6.16) Ni(10) Pb(0.3) Zn(5)
Berseem 7.5 75 4 1.5 27
Sorghum 8 22.5 2.5 1 27
Maize 6.5 23.5 3.5 1 46
Rice 11 17.5 5 1 26
wheat 9.45 27 0 1 34
Lucerne 19.675 36.75 3 2.25 43
Sugarcane 11.48 4.17 2.33 1.8 13.5
WHO permissible limits of heavy metals in plants are given in parenthesis

142
Table 2.4: Mean Values of Heavy metals concentration (mg/kg) in different Vegetables
Crops Cr(2.3) Mn( 6.16) Ni(10) Pb(0.3) Zn(5)
Spinach 5.5 91.75 2.5 2 34.5
Cabbage 4.5 16.75 1.75 0.75 37.75
Cauliflower 18.31 18.5 3.33 0.5 46.67
Mustard Leaves 23.27 36.33 2.8 0.83 53.33
Mustard Leaves 12.075 54.75 2.75 1 54
Round guard
11.5 8 2.5 0 37
WHO permissible limits of heavy metals in plants are given in parenthesis
Table 2.5: Mean Values of Heavy metals concentration mg/ml soil samples
Soil Sample Ni Pb Cr Mn Zn
Uchkara soil upper layer 0.37 1.32 0.35 3.75 3.98
Uchkara soil lower ayer 0.18 0.68 0.33 1.97 1.01
UAF soil upper layer 0.43 1.16 0.41 11.57 1.41
UAF soil lower layer 0.26 0.62 0.4 5.69 0.43
Safe limit 0.2 5 0.2 2

143
Table 3.5: Mean square values of 44 tomato genotypes for heavy metals in Fruit
SOV DF Zn Pb Ni Mn Cr
G 43 118.8** 0.97776** 0.78945** 8.90** 115.316**
T 1 19657.8 1.73213 3.86158 3607.24 250.397
Error 44 82.9 0.71402 0.65254 9.13 74.888
Table 3.6: Mean square values of 44 tomato genotypes for heavy metals in Root
SOV DF Zn R Pb R Ni R Mn R Cr R
G 43 622.113** 19.631** 14.3159** 875.14** 147.482**
T 1 130.131 715.240 42.4405 2178.12 248.724
Error 44 355.455 18.125 7.3877 340.03 76.962
Table 3.7: Mean square values of 44 tomato genotypes for heavy metals in Shoot
SOV DF Zn S Pb S Ni S Mn S Cr S
G 43 1126.51** 3.9296** 11.1614** 658.3** 108.00**
T 1 2353.16 98.2921 78.2102 15430.3 1000.89
Error 44 388.21 3.1049 4.7772 484.2 50.09
Table 3.8: Mean square values of 44 tomato genotypes for heavy metals in Leaf
SOV DF Zn L Pb L Ni L Mn L Cr L
G 43 1469.75** 7.62** 8.249** 700.44** 140.15**
T 1 3.62 1027.79 342.786 9916.17 1211.33
Error 44 1275.17
6.02 5.901 518.24 159.37

144
Table 3.5: Mean square values of 44 tomato genotypes for heavy metals in Fruit
SOV DF Zn Pb Ni Mn Cr
G 43 118.8** 0.97776** 0.78945** 8.90** 115.316**
T 1
19657.8
1.73213 3.86158 3607.24 250.397
Error 44 82.9 0.71402 0.65254 9.13 74.888
Table 3.6: Mean square values of 44 tomato genotypes for heavy metals in Root
SOV DF Zn R Pb R Ni R Mn R Cr R
G 43 622.113** 19.631** 14.3159** 875.14** 147.482**
T 1 130.131 715.240 42.4405 2178.12 248.724
Error 44 355.455 18.125 7.3877 340.03 76.962
Table 3.7: Mean square values of 44 tomato genotypes for heavy metals in Shoot
SOV DF Zn S Pb S Ni S Mn S Cr S
G 43 1126.51** 3.9296** 11.1614** 658.3** 108.00**
T 1 2353.16 98.2921 78.2102 15430.3 1000.89
Error 44 388.21 3.1049 4.7772 484.2 50.09
Table 3.8: Mean square values of 44 tomato genotypes for heavy metals in Leaf
SOV DF Zn L Pb L Ni L Mn L Cr L
G 43 1469.75** 7.62** 8.249** 700.44** 140.15**
T 1 3.62 1027.79 342.786
9916.17 1211.33
Error 44 1275.17
6.02 5.901 518.24 159.37
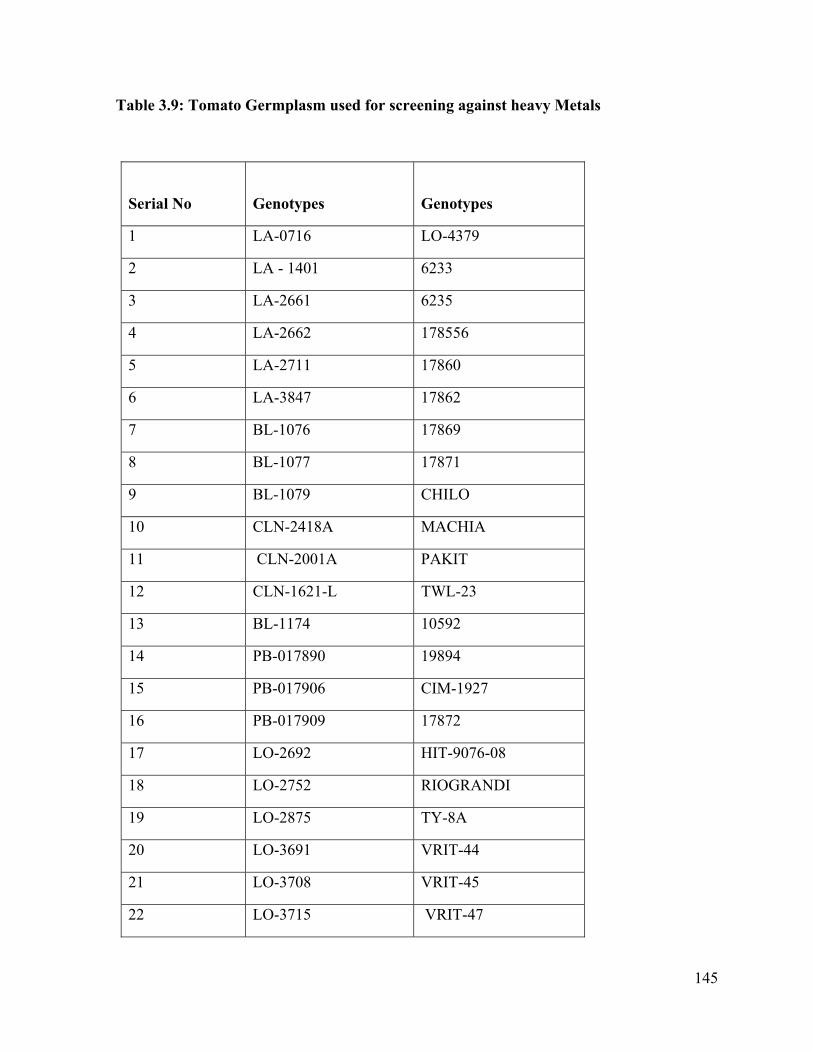
145
Table 3.9: Tomato Germplasm used for screening against heavy Metals
Serial No
Genotypes
Genotypes
1 LA-0716 LO-4379
2 LA - 1401 6233
3 LA-2661 6235
4 LA-2662 178556
5 LA-2711 17860
6 LA-3847 17862
7 BL-1076 17869
8 BL-1077 17871
9 BL-1079 CHILO
10 CLN-2418A MACHIA
11 CLN-2001A PAKIT
12 CLN-1621-L TWL-23
13 BL-1174 10592
14 PB-017890 19894
15 PB-017906 CIM-1927
16 PB-017909 17872
17 LO-2692 HIT-9076-08
18 LO-2752 RIOGRANDI
19 LO-2875 TY-8A
20 LO-3691 VRIT-44
21 LO-3708 VRIT-45
22 LO-3715 VRIT-47
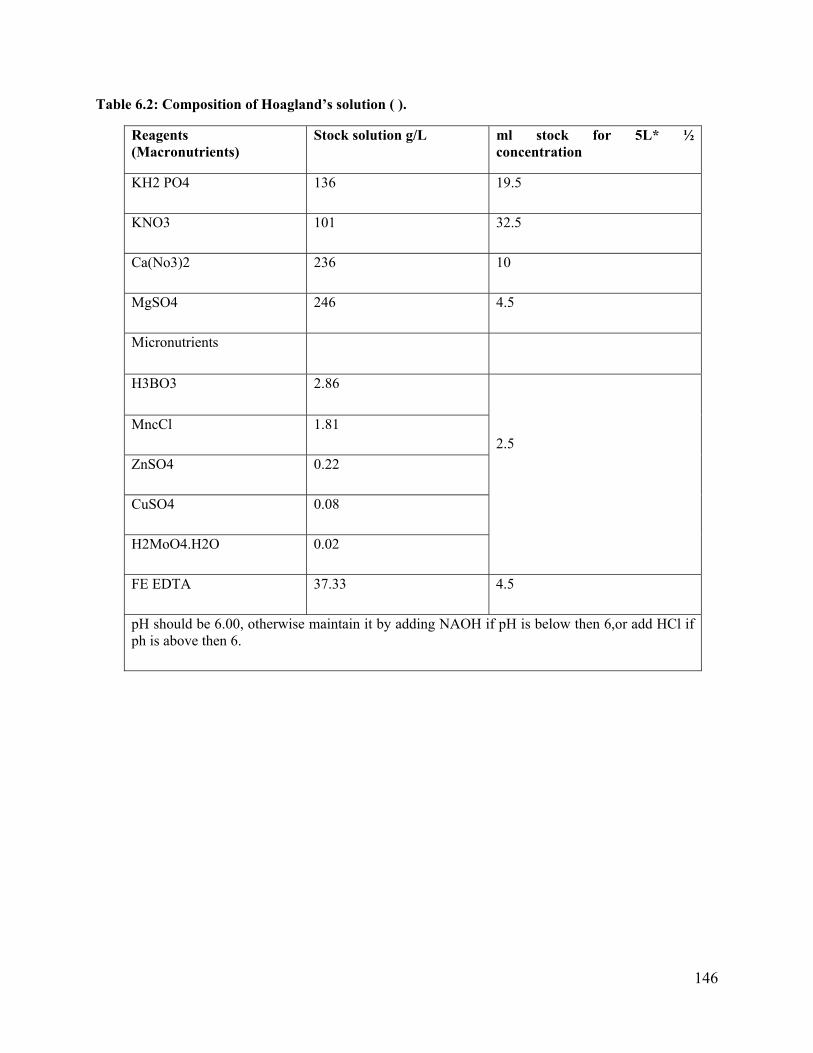
146
Table 6.2: Composition of Hoagland’s solution ( ).
Reagents (Macronutrients)
Stock solution g/L ml stock for 5L* ½ concentration
KH2 PO4 136 19.5
KNO3 101 32.5
Ca(No3)2 236 10
MgSO4 246 4.5
Micronutrients
H3BO3 2.86
2.5 MncCl 1.81
ZnSO4 0.22
CuSO4 0.08
H2MoO4.H2O 0.02
FE EDTA 37.33 4.5
pH should be 6.00, otherwise maintain it by adding NAOH if pH is below then 6,or add HCl if ph is above then 6.
Related Documents