Wilson Bull., 93(Z), 1981, pp. 218-242 BREEDING BIRD POPULATIONS IN THE GREAT SMOKY MOUNTAINS, TENNESSEE AND NORTH CAROLINA S. CHARLES KENDEIGH AND BEN J. FAWVER The analysis of bird populations in mountain systems, such as the Great Smoky Mountains, is of special interest because of the relations of these populations to the mosaic of vegetation types and to variations in climate and physical conditions that occur. The Great Smoky Mountains of eastern Tennessee and western North Carolina lie at the southern end of the Appalachian Mountain System, escaped glaciation during the Pleistocene epoch, have sufficient elevation to provide a considerable gradient of tem- perature and contain a variety of slope exposures with striking contrasts in moisture conditions (Shanks 1954, Whittaker 1956). The many different types of vegetation in the Great Smoky Mountains National Park are in nearly virgin condition. The deciduous plant com- munities have remained relatively undisturbed since the early Tertiary, and their diversity of plant species is the richest within the deciduous forest biome. Coniferous forests of different types and past history occur at both low and high elevations. Breeding bird censuses were taken in 26 areas, representing 8 types of climax or relatively stable vegetation and 4 seral stages. The fieldwork was carried out during June and July 1947 and from May through July 1948. PLANT COMMUNITIES The vegetation shows a continuum of change with elevation and slope exposures (Fig. 1). For convenience, however, separate plant communities are recognized, based on their dom- inant species (Whittaker 1956). Cove hardwoods occur characteristically at lower elevations in moist shaded coves and on north-facing slopes. Eastern hemlock (Tsuga canadensis) occurs in some cove forests in mixed or nearly pure stands. Chestnut oak (Quercus p&us) (chestnut) and oak-hickory forests prevail on east and west slopes, while on exposed, drier south and southwest slopes, subject also to more frequent fires, southern pine (Pinus spp.) forest or pines with an un- dergrowth of heath predominate. At intermediate elevations, cove forests extend up into beech forests in gaps between mountains or on sheltered slopes, northern red oak (Q. rubra) (chestnut) and white oak (Q. &a) (chestnut) forests replace the chestnut oak (chestnut) forest, while on exposed ridges grassy balds replace trees. Chestnut (Castanea) is, of course, no longer a dominant, although at the time of this study many dead stubs scattered through the forest indicated their former importance. At cooler high elevations, spruce (Picea)-fir (A&es) forests predominate, al- though they give way to heath balds on xeric exposed ridges. 218

Welcome message from author
This document is posted to help you gain knowledge. Please leave a comment to let me know what you think about it! Share it to your friends and learn new things together.
Transcript

Wilson Bull., 93(Z), 1981, pp. 218-242
BREEDING BIRD POPULATIONS IN THE GREAT SMOKY MOUNTAINS, TENNESSEE AND
NORTH CAROLINA
S. CHARLES KENDEIGH AND BEN J. FAWVER
The analysis of bird populations in mountain systems, such as the Great
Smoky Mountains, is of special interest because of the relations of these
populations to the mosaic of vegetation types and to variations in climate
and physical conditions that occur. The Great Smoky Mountains of eastern
Tennessee and western North Carolina lie at the southern end of the
Appalachian Mountain System, escaped glaciation during the Pleistocene epoch, have sufficient elevation to provide a considerable gradient of tem-
perature and contain a variety of slope exposures with striking contrasts
in moisture conditions (Shanks 1954, Whittaker 1956).
The many different types of vegetation in the Great Smoky Mountains
National Park are in nearly virgin condition. The deciduous plant com- munities have remained relatively undisturbed since the early Tertiary, and their diversity of plant species is the richest within the deciduous forest biome. Coniferous forests of different types and past history occur
at both low and high elevations. Breeding bird censuses were taken in 26 areas, representing 8 types of
climax or relatively stable vegetation and 4 seral stages. The fieldwork
was carried out during June and July 1947 and from May through July 1948.
PLANT COMMUNITIES
The vegetation shows a continuum of change with elevation and slope exposures (Fig. 1). For convenience, however, separate plant communities are recognized, based on their dom- inant species (Whittaker 1956).
Cove hardwoods occur characteristically at lower elevations in moist shaded coves and on north-facing slopes. Eastern hemlock (Tsuga canadensis) occurs in some cove forests in mixed or nearly pure stands. Chestnut oak (Quercus p&us) (chestnut) and oak-hickory forests prevail on east and west slopes, while on exposed, drier south and southwest slopes, subject also to more frequent fires, southern pine (Pinus spp.) forest or pines with an un- dergrowth of heath predominate.
At intermediate elevations, cove forests extend up into beech forests in gaps between mountains or on sheltered slopes, northern red oak (Q. rubra) (chestnut) and white oak (Q. &a) (chestnut) forests replace the chestnut oak (chestnut) forest, while on exposed ridges grassy balds replace trees. Chestnut (Castanea) is, of course, no longer a dominant, although at the time of this study many dead stubs scattered through the forest indicated their former importance. At cooler high elevations, spruce (Picea)-fir (A&es) forests predominate, al- though they give way to heath balds on xeric exposed ridges.
218

Kendeigh andFawver~ GREAT SMOKY MOUNTAIN BREEDING BIRDS 219
Meters Feet 200( 1
I Spruce -Fir Forest
Grassy Bald\
Heath Bald
/ I ’ / Iwhite\
1500- Beech Forest
_--- ---
S ‘e
!? * Lu
- Cove Forest
1000 -
500 -
-I. at
-E
_I .
_L .
\
--1
\
-1
I
5500
SO00
5500
mxl
1500
1000
3500
3000
2500
2000
I500
Mesic+-----_--_-_--- ____ -+-,Xeric
coves, sheltered slopes exposed slopes, ridges
FIG. 1. Mosaic of plant communities showing variations with elevation and slope expo-
sure (modified from Whittaker 1956).
METHODS OF ANALYSIS
Bin1 populations.-The spot-map method for censusing breeding birds was used where
the terrain and available time permitted. Areas varied in size and shape depending on terrain
and slope. They ranged from 6-12 ha (Table l), which are rather small areas, but since each
major vegetation type was censused at different localities, the total area covered in each
220 THE WILSON BULLETIN * Vol. 93, No. 2, June 1981
vegetation type was at least 23 ha and usually over 40 ha. Boundaries were measured with
a steel tape or by pacing and mapped to scale. Use was made of natural landmarks and of
numbered white cards nailed to trees at 50-m intervals for locating birds, especially singing
males, on maps. In several instances, areas were long strips along trails and only 1 line of
markers was used. Bird counts were obtained in each area at least 4 times in 1947 and 5
times in 1948.
Cruising counts only were taken of singing males in several areas. These areas were of
known size and thoroughly covered on each count. Two to 6 counts were made on each area;
the largest number of each species observed on any count was taken as the population of
that species. This follows Palmgren’s (1930) procedure except that no corrections were made
for smaller values often obtained with fewer than 4 or 5 counts. Ten comparable censuses
obtained by spot-map and cruising procedures in 5 different types of vegetation, although
not in the same area the same year, showed only a slight tendency for population size
estimates to be lower with the cruising procedure.
Species occurring in different plots of the same vegetation type have been combined and
their population sizes averaged (Table 2). Persons wishing the precise location, more com-
plete description of the vegetation and data on the bird population of each sample plot should
consult the doctorate thesis of the junior author (Fawver 1950) filed in the University of
Illinois Library, Urbana.
Data.-Coefficients of species similarity (Ss) were calculated with the Serenson equation
(Able and Noon 1976):
S, = 2C/(A + B). 100
where C represented number of species common to the 2 communities and A and B total
number of species in each community. Multiplying by 100 transfers coefficients into per-
centages. In these comparisons, species were included with less than 0.5 pairs/40 ha (shown
by + marks in Table 2). Larger-sized sampling areas would doubtless have permitted quan-
tification of their densities. Percentages higher than 50 indicate that the 2 communities have
more species alike than different.
The above equation does not evaluate the difference in abundance (number of pairs) of a species when it occurs in both communities. Coefficients of population similarity (S,,) were
obtained by:
.y,, = 1.0 - +J+ ,I h
where p. is the population of a species in community a and pb in community b and P, and
P,, are total populations of all species in communities a and b, respectively (Odum 1950). In
this calculation the plus sign in Table 2 was taken as zero population.
The Shannon-Weiner species diversity index (H’ = Zp lo&p) and equitability index (J’ =
H’IH’,,,) were calculated for the birds in each plant community where p is the proportion
each species population is of the whole and HI,,,,,, the maximum possible diversity for the
given population size and number of species, is the logarithm of the number of species
(Pielou 1966, Sheldon 1969).
Mean number of pairs per species (p/s) and median population of each species were also
determined. Skewness (g,) in the distribution of population sizes among species in a com-
munity was calculated with the equation (Zar 1974):
(x - x)”
g’ = (nl)(n-
where x1 = p/s for a species, .r is the mean p/s, n is number of species, and sd is standard
deviation. Testing for statistical significance was performed using Table D25 of Zar (1974).

Kendeigh and Fawver - GREAT SMOKY MOUNTAIN BREEDING BIRDS 221
TABLE 1 CENSUS AREAS AND BIRD CENSUSING METHODS
Plant community and locatmn Size (ha)
Spot-mapping
1947 1948
Cruising COUPES
1947 1948
Pine-oak forest
Mature, 6.4 km NW of Gatlinburg
Seral, opposite Park Headquarters
Seral, 1.6 km farther south
Cove forest
Porters Creek
Porters Creek
Ramsey Prong
Ramsey Prong
Ramsey Prong
Hemlock-deciduous forest
Roaring Fork
Roaring Fork
Brushy Mountain
Chestnut oak (chestnut) forest
Bullhead Trail
Greenbrier Pinnacle Trail
Red oak (chestnut) forest
Greenbrier Pinnacle Trail
Thomas Divide, N.C.
Thomas Divide, N.C.
Pine heath
Bullhead Trail
Greenbrier Pinnacle Trail
Gray beech forest
Double Springs Gap
West of Siler’s Bald
Spruce-fir forest
Climax, between Newfound Gap and
Clingmans Dome
Fraser fir, Clingmans Dome
Early seral, Mount Buckley
Mid-seral, Forney Ridge
Late seral, north of Andrew Bald
Heath bald .
Bullhead Trail
Brushy Mountain
12.0
10.2
6.0
7.2
9.2
12.8
6.8 v
6.0
10.0
8.0
11.6 v
7.6 v
9.0
7.5
10.0
7.2
12.0 v
10.0
7.6 -\/
8.0
11.6 -\/
6.8
6.6 -\/
5.6
7.7
4.0
10.0
5
5
3
2
4
6
3
2
2
3
2
3
3
3
2
2

222 THE WILSON BULLETIN - Vol. Y3, No. 2, June 1981
CENSUS AREAS
Pineaakforest and sere.-The mature forest was an open stand of trees with a shrub layer
of Kalmia and other Ericaceae. The ground was covered with a dry litter of pine and broad
leaves. Two samples of a seral stage leading to the above forest contained both deciduous
and pine trees, 1.8-6 m high, scattered through shrubs and open areas. Shrubs were pre-
dominantly greenbrier (Smilax spp.), smooth sumac (Rhas &bra) and briers (Rubus spp.).
A luxurious growth of herbs covered most of the ground.
Cove forest.-All 5 areas censused were in the Greenbrier section of the Park. In 2 areas
along Porters Creek, trees were widely spaced but made a deciduous canopy 25-45 m,
occasionally 60 m, above the ground. Great rhododendron (Rhododendron maximum) made
dense tangled thickets along the stream and herbs were luxuriant. The larger area had been
censused by Aldrich and Goodrum (1946) the previous year. The 3 areas along Ramsey Prong
are listed in ascending elevations. The lowest area had previously been cut over but had
regained a closed canopy. The shrub layer in the highest area included sevenbark (Hyrlran-
gea arborescens) prominently, as well as rhododendron.
Mixerl hemlockdeciduous forest.-Although eastern hemlock occurred prominently in the
cove forest, it was the principal dominant in 3 areas censused. Hemlock attained diameters
over 1 m and heights of 30 m. Beech formed an understory at low elevations and sweet
(Bet& lenta) and yellow (B. allegheniensis) birches at high elevations. Rhododendron and
sevenbark were the principal shrubs. Herbs were much reduced compared with the cove
forest, and the ground was covered with a thick layer of dry leaf litter.
Chestnut oak (chestnut) forest.-Trees in this forest rarely exceeded 0.5 m diameter and
were usually only 6-18 m tall. Ericaceous shrubs were dense, especially at high elevations.
Reel oak (chestnut)forest.-No tree counts were taken in this forest, but northern red oak
was most prominent. The tree canopy was more closed than in the chestnut oak forest
because of fewer dead chestnut trees and the shrub stratum was greatly reduced.
Pine heath.-Pines were widely spaced and only 6-12 m high. The shrub stratum was
dense. The herb stratum was greatly reduced and contained bracken fern (Pteridium sp.)
and some creeping vines.
Gray beech j&est.-Beech (Fagus granrltj&z) here is probably a different variety than
occurs at low elevations (Camp 1950). Trees were generally 8-12 m tall, widely spaced and
with intervening space covered with grasses, sedges and shrubs.
Spruce-$rforest and sere.-The climax forest contained dense tangles of mountain rose
bay (Rhododendron catawbiense) and the ground was covered everywhere with thick spongy
moss, low herbs and ferns. Numerous fallen trees were covered with mosses and lichens.
At the highest elevation on Clingmans Dome, the forest consisted principally of Fraser fir
(Abiesfraseri) and included a few mountain ash (Sorbus americana) with the ground covered
with thick mosses and @x&s. Trees were numerous but only 12-15 m high.
A recently burned over area was well covered (90%) with shrubby vegetation, 0.6-1.5 m
high, composed of fire cherry (Prunes pennsylvanicus), red maple (Acer rubrum), blackberry
(Rubus canadensis), sevenhark, red-berried elder (Sambucus pubens) and several species of
Ericaceae. Dead stubs of spruce and fir were scattered. The herb layer was dense and covered 70% of the ground. A second area, burned over earlier, had a dense stand of fire
cherry, 1.8-3 m high. The area with most advanced vegetation, 36 m high, had serviceberry
(Amelanchier), fire cherry, yellow birch and a few small spruce.
A heath bald along Bullhead Trail was covered mostly with mountain laurel (Kalmia
Lzti~oLiolia) but contained some fire cherry and sourwood (Oxydendrum arboreum). The vege-
tation was dense and about 3 m high. Another heath bald on Brushy Mountain contained
chiefly mountain rose bay l-2 m high.

Kendeigh and Fawuer - GREAT SMOKY MOUNTAIN BREEDING BIRDS 223
BIRD POPULATIONS
The data on species populations (Table 2) are listed in taxonomic order and the plant communities in which they were found. The plant commu- nities are arranged as to whether they are seral or mature (climax), ac- cording to zones of altitude, and in horizontal gradients from north-facing
slopes, coves, or gaps around the mountains to south-facing slopes.
Succession.-The shrubby seral stage at low elevations had a high per-
centage of restricted species and hence low S, and S, compared with
either pine-oak or cove forest (Table 3). It likewise had little similarity with shrubby seral stages at high elevations. In contrast, the shrubby seral
stages at high elevations had an avifauna with considerable similarity to
that of the spruce-fir forest. Heath balds consist of very dense shrubby
vegetation of uncertain successional status and contained only 3 species, none of them restricted: Gray Catbird (2.5 pairs/40 ha), Black-throated
Blue Warbler (19 pairs), Rufous-sided Towhee (11 pairs). Forest communities.-The forest contains both deciduous and conifer-
ous species, in mixed or relatively pure stands, and with physiognomies
varying from tall, luxuriant cove forest to short-statured gray beech “or- chard” to open stands of pine heath. Relatively high S, occurred among bird populations in cove, chestnut oak, red oak and hemlock-deciduous
forests (Table 3). Likewise there was similarity between cove forest avi- fauna (after those species commonly associated with hemlock were elim-
inated) and pine-oak avifauna. Individual bird species extended widely among these deciduous plant communities although at different population levels.
When bird species commonly associated with deciduous trees were
eliminated from the hemlock-deciduous forest, the remaining “hemlock”
avifauna was similar to that of the spruce-fir forest. There was consider-
able similarity also between avifaunas of spruce-fir forest and high seral
stages, even though these plant communities are of different vegetation
types. The avifauna of the pine heath was not closely similar to any other
avifauna nor did any of its 14 species reach maximum population here.
Many of its species occurred commonly in deciduous forests or shrub stages.
The above classification of avifaunas into separate units has been based largely on coefficients of S,. However, no S, above 50 has a value of S,
lower than 31, and no S, below 50 has a value above 20. Slope exposure (moisture).-North slopes and coves in the mountains
are moist and shady, east and west slopes intermediate and south slopes
dry and sunny. Correlated with changes in habitat is a continuum of plant

224 THE WILSON BULLETIN * Vol. 93, No. 2, June 1981
? m +
+
m A
0
cr;
m d
Lo
d
Lr, n
Y


Kendeigh andFawuer* GREAT SMOKY MOUNTAIN BREEDING BIRDS 229
I Kilometers
0 5
612345 Miles
Silers Ml. Bold Buckley _.\I& \“‘__ _ -,;f - .- -5,T$.
Double Springs GOP
/
-\ Clingmons ‘.4
DOllW J“ I’,,
- 3 n-’ \ ‘, Forney ! Ridge
$-Andrew Bald Divide
FIG. 2. Map of region in which census areas were located
II T 6
communities. At low elevations, there was no observable difference be-
tween total bird species and total pairs between cove and hemlock-decid- uous forests on north slopes and chestnut oak on intermediate slopes, but
fewer species and smaller populations occurred in pine-oak forests on
south slopes (Table 4). At higher elevations, there was an observable de-
crease in both total species and pairs from red oak forests on intermediate
slopes to pine heath on exposed south slopes.
Bond (1957), working in southern Wisconsin with a continuum of plant
communities in the ecotone between grassland and deciduous forest,
found an increase in number of bird species and total populations from moist to intermediate stages and then a decline to the dry end. Individual
species varied in their point of greatest abundance along the gradient.
Likewise, Smith (1977) observed 3 of the 8 species studied restricted to the moist end of a deciduous forest continuum in the Ozark Mountains of
Arkansas and only I species extending to the extreme dry end.

230 THE WILSON BULLETIN - Vol. 93, No. 2, June 1981
TABLE 3 COMPARISON OF SPECIES COMPOSITION AND POPULATIONS BETWEEN COMMUNITIES
Restncted species
Communities compared
181 2nd Similarity COllllIlU”lfy community indices
N % N % I s s.
Low seral pine-oak forest stage: 13 57 13 57 44 5 Low seral cove forest stage: 8 35 23 74 30 5 Low seral stage: high and early mid-seral stages 19 83 10 71 22 10 High seral stages: spruce-fir forest 5 36 6 40 62 40 Cove forest: chestnut oak forest 8 26 9 28 73 31 Chestnut oak forest: red oak forest 11 34 4 16 74 41 Cove forest: beech forest gray 23 74 5 38 36 20 Gray beech forest: high seral stages 2 15 8 42 69 58 Cove forest: hemlock-deciduous forest 10 32 5 19 74 55 Cove forest: spruce-fir forest 21 68 5 33 22 18 “Hemlock” foresta: spruce-fir forest 2 13 2 13 87 34 Pine heath: spruce-fir forest 8 57 9 60 21 9 Pine heath: pine-oak forest 8 57 17 74 32 5 Pine-oak forest: “deciduous cove forest”” 10 44 10 44 56 35
a “Deciduous forest bird species” eliminated from the hemlock-deciduous forest b “Hemlock bird species” eliminated.
Elevation.-Increase in altitude or elevation brings lower temperatures,
more precipitation including snowfall, shorter growing seasons, greater
wind velocities, and more cloudiness and fog (Shanks 1954). Vertical ranges of the Black-capped and Carolina chickadees over-
lapped in the chestnut oak (chestnut) forest (Table 5), but the Black- capped was there only in 1947 and the Carolina Chickadee only in 1948.
The 2 species have nearly identical territorial requirements, and compet-
itive interrelations of the two are well established (Tanner 1952, Brewer 1963).
The Wood Thrush and Veery overlapped broadly in vertical distribution
and in the same census plots. Cavanaugh and Magee (1967) observed that
when 1 species was numerous in a mixed coniferous-deciduous forest, the
other was less so with the situation reversing in another year, which in- dicated the possibility of conflict between them. Bent (1949) cited several
instances of the Veery and American Robin being driven from their ter-
ritories by the Wood Thrush, and he observed a Veery driving a Wood Thrush from its territory. Bertin (197’7) suggested that in mixed forest

Ken&i& and Fawver . GREAT SMOKY MOUNTAIN BREEDING BIRDS 231
TABLE 4 STATISTICS ON BIRD POPULATIONS IN PLANT COMMUNITIES
Pairs per species
Plant community Elevation
Cm) Total
species Total pairs
Species Equita- skew-
divFity bility mean median ness
J’ P/S P/S 61
Pine-oak forest
Seral Mature
Cove forest Hemlock-deciduous
forest Chestnut oak
(chestnut) forest Red oak (chestnut)
forest Pine heath Gray beech forest
Spruce-fir forest
Early seral Mid-seral Late seral Climax
455488 23 172+ 2.707 0.904 7.5 5.0 0.99 411-488 23 140+ 2.397 0.814 6.1 1.6 1.8
640-1250 31 254+ 2.206 0.669 8.2 2.0 4.5
873-1356 26 376+ 2.574 0.810 14.5 5.0 1.4
817-1074 32 247+ 2.706 0.851 7.7 3.2 1.7
1222-1506 25 204 2.762 0.858 8.2 3.7 1.3 1219-1349 14 108+ 1.707 0.741 7.7 1.6 1.7 1646-1713 13 177+ 1.821 0.733 13.6 2.6 1.5
1890-1950 12 369+ 1.527 0.734 30.8 4.5 1.6 1798-1920 10 288 1.824 0.792 28.8 18.0 2.2 1740-1795 14 328+ 1.974 0.794 17.0 5.0 2.2 1760-1790 15 314+ 1.889 0.760 20.9 6.5 2.7
the Veery may segregate into sites with cooler microclimates than those preferred by the Wood Thrush.
Yellow-throated, Red-eyed and Solitary vireos were all present in pine- oak plots and Red-eyed and Solitary vireos occurred in red oak (chestnut)
at higher elevations. The Yellow-throated Vireo feeds and nests in both
deciduous and pine trees and may be a competitor of the Solitary Vireo in the pine forests of the Piedmont region (Odum 1948). Both Solitary and Red-eyed vireos were abundant in the cove forest but only the Solitary Vireo occurred in the hemlock forest. The Solitary Vireo commonly sang
and fed in both deciduous and coniferous trees from 2 m-ca. 12 m above
the ground. The Red-eyed Vireo was never observed in coniferous trees
and in deciduous trees carried on its activities from 2 m above ground to
the tree tops. This agrees in general with observations of the 2 species in
mixed forests in New York state (Kendeigh 1945).
The vertical ranges of the 2 nuthatches broadly overlapped but the White-breasted Nuthatch was largely confined to deciduous stands and the Red-breasted Nuthatch to coniferous ones. The ranges of warbler species from the upper and lower elevations did not overlap except for the Hooded and Canada warblers in the cove forest.


Kendeigh and Fawver - GREAT SMOKY MOUNTAIN BREEDING BIRDS 233
Summer and Scarlet tanagers both occurred in the pine-oak census plot but in different years. Stupka (1963) states that the 2 species commonly meet at 457-610 m.
DISCUSSION
Local factors.-The predominant factor controlling bird distribution in
the Great Smoky Mountains is the relation of bird species to plant com-
munities. The change in moisture gradients from north to south slopes and temperature gradients with elevation are of secondary importance. Plant
communities are identified by life forms of their dominant plant species
(deciduous tree, coniferous tree, shrub), physiognomy (dense closed for-
est, open forest, heath), location (cove, bald) and species composition.
Each plant community, or at least vegetation type, provides a different
environment for birds with respect to microclimate (modification of the
macroclimate), plant structure (dimensions, branching, leaf size and ar- rangement) and food supplies (seeds, nuts, fruit, foliage, insects and other
invertebrates). Each bird species has evolved adjustments to these factors
but little new information concerning their precise niche requirements and
role in the community can be provided beyond those discussed for many of these species by Kendeigh (1945, 1947), MacArthur (1958), James (1971), Anderson and Shugart (1974) and Rabenold (1978).
The difference in bird species composition between seral shrubs and mature pine-oak forest at low elevation appears clearly related to change in life form of the conspicuous plants and the physiognomy of their stands.
Forest species with the largest populations are segregated into either de- ciduous or needle-leaved coniferous vegetation types.
Food resources may be a factor affecting population size. Whittaker
(1952) has shown that productivity of foliage insects in the Great Smoky Mountains decreases with slope exposure from moist cove forests to dry
oak and pine types and with elevation. Bond (1957) found that foliage
insect gleaners decreased and plant feeders increased from moist to dry
forests in Wisconsin. Circumstantial evidence indicated that competition as well as changes
in vegetation affected vertical limits of some species in the Great Smoky
Mountains. Able and Noon (1976) f ound no convincing cases of altitudinal
competitive exclusion between species in the temperate mountain forests
of New York and Vermont. Upper and lower distributional limits of species
coincided with ecotones in vegetation. In the tropical forests of New Guinea,
Diamond (1973) believed competition to be more important than changes
in vegetation in controlling vertical distribution. In the tropical mountains of
Peru, Terborgh (1971) ascribed changes in vegetation to account for less
than 20% of the altitudinal limits of species, competition for about 33%

234 THE WILSON BULLETIN * Vol. 93, No. 2, June 1981
and gradually changing physical and other biological conditions for about 50%. Included in this latter category were not only changes in temperature
and cloudiness, but also changes in net annual plant productivity, density
of insects and importance of epiphytic plants in the vegetation. Geography.-Avifaunas in similar plant communities at different local-
ities tend to be similar in species composition (Ss) but not identical. Of
301 species recorded in 6 comparisons of localities (Table 6), 62% occurred in both communities, 21% were found in other plant communities in the
vicinity, 11% were absent because the locality was beyond their geograph- ic ranges, while 6% were not recorded in the locality. Failure to record a
species in a locality within its distributional range may indicate that the sampling area was too small, and this may also be partly responsible for finding species only in other plant communities.
Other factors, however, often affect local occurrence of species. For
instance, presence of Red-breasted Nuthatch, Brown Creeper, Winter
Wren and Golden-crowned Kinglet in hemlock communities in the Great
Smoky Mountains and not on the Heldenberg Plateau of New York may
represent an overflow from large populations of these species in nearby spruce-fir communities. In New York state, spruce-fir forests are sepa-
rated by 25-60 km from the hemlock areas censused. Another local factor is the presence of competing species. In hemlock-deciduous forests on the
Highlands Plateau of North Carolina, the Carolina Chickadee replaces the
Black-capped Chickadee. The bird species composition varies, of course, when the plant com-
munity is beyond the limit of distribution of the bird species. The Scarlet Tanager was not recorded in the pine-oak community on the Piedmont Plateau of Georgia because it is rare or absent there; the Brown-headed Nuthatch (Sitta pusilla) recorded in the Georgia area is rare or absent in
the Great Smoky Mountains. Nineteen species found in spruce-fir forests of northern Maine do not extend their ranges south as far as the Great Smoky Mountains. The decrease in species richness in Appalachian
spruce-fir forests from north to south is a progressive one (Rabenold 1978). Coefficients of population similarity, S,, were not used in these com-
parisons of avifaunas. They are more sensitive indicators of similarity
because they depend not only on the presence or absence of a species as
does S,, but on the replication of identical characteristics of the environ-
ment to permit equal sized populations to develop. Populations may also vary locally in sex and age ratios and other properties that would affect
realization of comparable population sizes. In our comparisons of avifauna.s
in different localities, there was an additional complication in that cen-
suses were taken in different years, and population sizes in a locality
fluctuate from year to year.


236 THE WILSON BULLETIN * Vol. 93, No. 2, June 1981
Bird communities, their origins and history.-Hubbard (1971) has a gen-
eral discussion of the origins of avifaunas in the southern Appalachians but we wish to consider these origins and history from a somewhat differ-
ent viewpoint. Our analysis above of succession, forest communities, and
geography shows considerable similarity in the species composition of avi-
faunas that occur in plant communities of the same vegetation type, par- ticularly deciduous forest, needle-leaved coniferous forest and shrubby
vegetation at low elevations. Each combination of avifaunas in the same vegetation type or bird community shows little similarity to either of the
others (Table 3). “Preference” of bird species for particular types of vege- tation is indicated by maximum populations being attained in them. Such
maximum populations suggest a high degree of anatomical, physiological and behavioral adaptation through association with the vegetation over a
long period of geological time. In Table 2, each species is assigned to the
bird community to which it most characteristically belongs, although most
species have enough flexibility that they occur in small numbers in other
communities as well. Much concerning the origin and geological history
of each bird community can be learned from the presence of associated
plant species in the fossil record of various localities and times, as was
traced by Kendeigh (1974). The uniqueness of the low elevation shrub avifauna is the result of
intermingling of bird species belonging to the deciduous forest-edge com-
munity (FE) and what we have called the southeastern mixed community (SM). Belonging to this latter are the southern pines and several bird species
found in the pine-oak community. This vegetation is derived from the Madro-Tertiary Geoflora originating on the Mexican Plateau, which during
the Miocene or earlier extended continuously around the Gulf of Mexico.
The southeastern portion and its avifauna became separated when prairie vegetation penetrated to the Gulf of Mexico.
The deciduous forest (DF) and forest-edge (FE) communities are derived from the temperate unit of the Arcto-Tertiary Geoflora that during the Eocene epoch extended from southeastern United States to Alaska (Ken-
deigh 1974). This forest and its seral stages have been much buffeted by
climatic changes during the last 65 million years and are now largely lim-
ited to the eastern United States. The mixed mesophytic forest of the south- ern Appalachian Mountains, best represented here by the cove forest, has
been little affected by these changes and may be the oldest forest stand
at any locality in temperate North America (Braun 1950). The gray beech forest, unique to the Appalachian Mountain System, is
a segregate from the mixed mesophytic forest (Braun 1950). It is a young
forest geologically, and since it is subjected to more climatic stresses than
the deciduous forest at lower elevations, only a few bird species from the

Kendeigh and Fawner * GREAT SMOKY MOUNTAIN BREEDING BIRDS 237
deciduous forest community have been able to occupy it. Instead, it has
become occupied by species from the spruce-fir coniferous forest com- munity.
Seral stages at high elevations became extensive only in recent times
as the result of fires and human disturbances. Although a few species have
invaded from shrubby seral stages of the lowlands, most of the avifauna is of boreal origin. There are no unique species here, although the Veery
and Chestnut-sided Warbler reach peak populations in this vegetation and in the gray beech forest.
The spruce-fir forest (BF) is derived mainly from the boreal unit of the Arcto-Tertiary Geoflora (Kendeigh 1974). In the early Tertiary period, this
unit was widely spread over northern North America. During the Pleis- tocene epoch it became fragmented, with the eastern portion becoming restricted and isolated in the northeastern United States and south through
the Appalachian Mountains. During the height of glaciation, the spruce-
fir forest in the Great Smoky Mountains probably extended to lower ele-
vations and occupied mountain tops farther south than at present. During
the warm dry xerothermic period, beginning some 8000-9000 years ago
following the retreat of the last major or Wisconsin glacier, this forest
retreated to higher elevations and became eliminated from lower peaks
south of Clingmans Dome. During this period the southern distributional
limits of many bird species probably retreated northward. The cooler, moister climate of the last 2000-3000 years may have again permitted the
spruce-fir forest to expand down the slopes and bird species to extend their ranges southward. The gray beech forest probably originated during these up and down movements of the vegetation (Whittaker 1956).
The eastern hemlock forest lies geographically between boreal and de- ciduous forests but occurs more often in mixed stands with deciduous
trees than with spruce and fir. It was subjected to several contractions
and extensions of range during the Pleistocene and Holocene epochs. It differs from the boreal forest in the luxurious development of rhododendron
and other shrubs in the Appalachian Mountain System, which together with a more temperate and moist climate presents a somewhat different envi- ronment for birds. This has led to a secondary differentiation of its avi-
fauna from that of the spruce-fir forest which is more evident when the 2
forests are some distance apart, as on the Helderberg Plateau of New
York, than in the Great Smoky Mountains. Other variations in avifaunas of the boreal forest have been described by Erskine (1977).
The fact that 2 species in hemlock forests of New York and 19 species
in spruce-fir forests of Maine were not found as breeding birds in the Great Smoky Mountains may be the result, in part, of these historical shifts in
the vegetation. Since the last contraction of their ranges northward, time

238 THE WILSON BULLETIN * Vol. 93, No. 2, June 1981
may not have been sufficient for them to reoccupy southward all favorable breeding areas that have become available. These areas are scattered and require even migratory bird species to jump from one mountain to another
for breeding purposes. For example, Golden-crowned Kinglet, Winter
Wren, Black-capped Chickadee and Black-throated Green Warbler, al-
though common in the Great Smoky Mountains, were not found in the
census areas on the Highlands Plateau of the Blue Ridge Mountains. The
Black-throated Green Warbler is of special interest as the Highlands Pla- teau lies in a hiatus between the ranges of the subspecies in the mountains
(Dendroica II. sirens) and the coastal subspecies (D. V. wayrzei). Odum
(1950) has suggested that in dispersal of the species southward, the ranges of the mountain population became split from the coastal population and
that the plateau has not yet become occupied by the mountain race.
In addition to slow dispersal rates southward, restriction of species
southward may also be in response to unfavorable climate, food resources,
or inter-species competition. Rabenold (1978) ignores the probable influ-
ence of the post-glacial xerothermic period on bird distribution in the Appalachians and argues that the lower species richness is related to lower
food levels during the reproductive season. Community structure.-The structure of bird communities is commonly
analyzed in terms of species richness (s), equitability or eveness of distri- bution of populations (1’) and segregation of species into different niches. The first 2 factors are usually combined into a species diversity index (H’). We are not here concerned with analysis of ecological niches. In our data
(Table 4), H’ varied positively with s (r = 0.87, P < 0.001) but J’ varied
independently of S. We agree with Hurlbert (1971) that the usefulness of H’ is limited. There is little advantage in combining the 2 components.
Levels of population size attained by different species in communities or areas is important. Where the distribution of different population sizes
follows a normal or Gaussian curve, mean number of pairs per species (p/s) is a reliable estimate. In each of our plant communities, however, the
distribution of populations was skewed in that the median population was
less than the mean, and the mode, usually poorly defined, was less than
the median. The difference (* SD) between the mean and median p/s
averaged 65 + 17% of the mean. The degree to which distribution of
populations was skewed (gi) is indicated in Table 4, all populations being significantly different from symmetrical (P < 0.05), although that of the
seral stage to pine-oak forest (g, = 0.99) was borderline. There is a highly significant negative correlation between g, and J’ (r =
0.69, P < 0.0025). A high value of g, and a low value of J’ both indicate wide scattering of p/s, hence there is no need to use both indices. The
distribution of measurements of biological variables commonly adheres to

Kendeigh and Fawver * GREAT SMOKY MOUNTAIN BREEDING BIRDS 239
a normal curve, and since g, indicates the departure from symmetry it is preferable to J’ which indicates departure from equality, which is rare or
absent in biological phenomena. P/s varied negatively with s (r = 0.69, P < 0.025) and this was related
to altitude. At elevations below 1600 m, average s per community was 25
and pls 8.6; above 1600 m, s was 13 and pls 22.2. Skewness, g, , was not statistically correlated with s and varied from 0.99 in the seral shrub stage
to 4.5 in the cove forest, both at low elevations (Table 4). If the cove forest
is excluded for reasons given beyond, g, averaged 1.5 below and 2.0 above
1600 m. At 1800 m elsewhere in the Great Smoky Mountains, s, p/s and
g, values were intermediate (Table 6, Alsop 1969). In spruce-fir forests occurring at low elevations in Maine, s was higher and pls lower than in
the spruce-fir forest at high elevation in the Great Smoky Mountains, but
g, was higher (Table 6). At both low and high elevations, g, was lower in
seral shrubby stages than in forests (Table 4). Able and Noon (1976) state that decreasing s and increasing p/s with elevation seem to be a general
rule in forested regions. Other investigators agree that fewer species and
greater variability in population size tend to occur in rigorous environments with variable weather and other conditions than in moderate ones (Tramer 1969, Kricher 1972, Rotenberry 1978, Rotenberry et al. 1979).
The considerably skewed distribution of populations in the cove forest (g, = 4.5) is caused by 1 of the 31 species present, Black-throated Blue
Warbler, having 41% of the total number of pairs. This species sings, nests and feeds in rhododendron and other ericaceous shrubs and in the rich herbaceous stratum. Rhodendron maximum is a characteristic dom-
inant in the undergrowth of southern Appalachian Mountains but very
local or absent from mixed mesophytic forests elsewhere (Braun 1950).
The warbler has exploited this special niche and without effective com-
petition from other species, its population has exploded in size. The high
g, of hemlock-deciduous forests on the Highlands Plateau of North Car-
olina (Table 6) was also caused by the predominance of this species. High values of g, found in gray beech and high elevation mid- and late
seral communities are correlated with exploitation of favorable local niches
by the Dark-eyed Junco and Chestnut-sided Warbler. The early seral stage has even larger populations of these 2 species, but g, is lower because 3
other species also have large populations so as to give a better balance among the 12 species that occur. The climax spruce-fir forest has several species with large populations, but g, is high because the Dark-eyed Junco
comprised 40% of the total. Inter-species competition is reduced in these high elevation communities because other potentially competitive boreal
species have not extended their ranges this far south. The high g, for pine forests on the Piedmont Plateau of Georgia (Table

240 THE WILSON BULLETIN * Vol. 93, No. 2, June 1981
6) resulted from the Pine Warbler constituting 25% of the total populations of all 29 species. Pine Warblers nest and feed in long-leaved pines.
In the spruce-fir forest of Maine, the high g, resulted from Bay-breasted
(Dendroica castanea) and Magnolia (D. magnolia) warblers making up
30% of total populations even with 44 species present. This may be a
temporary unbalance, however, as these species were favored by feeding
on the spruce budworm insect infestation then in progress.
Pairs per species (p/s) in hemlock-deciduous and spruce-fir forests of
the Great Smoky Mountains are higher and in the chestnut oak and red oak forests lower than at other localities (Table 6). In each comparison, p/s varied inversely with s. It appears that when few species are present
the fundamental niches for at least some species may be almost fully occupied so that populations are large. On the other hand, with many
species present to provide inter-species competition, realized niches are smaller, hence smaller populations.
SUMMARY
Species composition and population sizes of birds were determined in 12 plant communities
of the Great Smoky Mountains during the summers of 1947 and 1948. Plant communities
form a mosaic of seral and climax stages that varies with altitude and slope exposure.
Coefficients of species and population similarities indicated that distinct bird communities
may be identified, associated with deciduous forest, forest-edge, boreal forest and a south-
eastern mixed complex. Each type of vegetation with its bird life has had a different geological
history that affects its present composition and characteristics. Bird species are classified
to the vegetation type to which they appear best adapted as indicated by their attainment of
highest populations.
Composition of bird species within particular stands of a vegetation type is influenced by
the location of the stand in respect to species’ ranges, neighboring avifaunas, annual fluc-
tuations (especially of the less common species), inter-species competition and responses to
temperature and possibly moisture as determined by elevation and slope exposure.
The species diversity index (H’) varied positively with species richness (s) and was of
limited value in comparing bird populations. Distributions of bird population sizes in all plant communities was positively skewed. Skewness (gl) varied negatively with (J’) and is preferred
as an index as it indicates degree of departure from a symmetrical distribution rather than
from equal population sizes of species.
Increasing elevation was correlated with lower species richness (s), larger number of pairs
per species (p/s) and a tendency toward higher g, , although the latter also varied indepen-
dently of altitude. Avifaunas with g, greater than 2.0 contained one or more species with
high abundance resulting from local prevalence of favored vegetation niches and lack of
inter-species competition or with temporary super-abundance of a food resource. Values of
p/s may be compared when the g, of avifaunas are similar. P/s varied negatively with s,
indicating that with larger number of species present, inter-species competition caused fun-
damental niches not to be fully realized, with the consequence that growth of populations
for individual species was limited.
ACKNOWLEDGMENTS
The junior author was responsible for the fieldwork and a preliminary analysis of data for
Kendeigh and Fawver * GREAT SMOKY MOUNTAIN BREEDING BIRDS 241
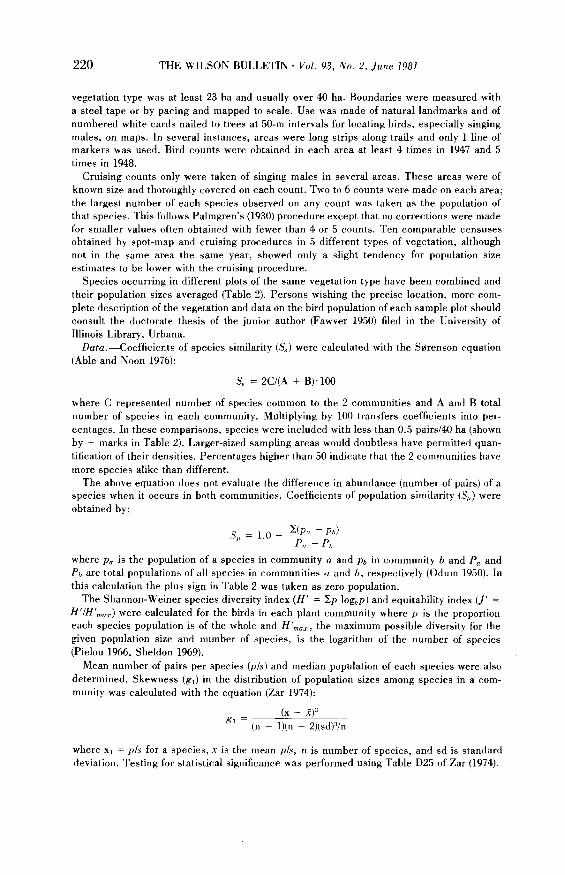
his doctorate thesis at the University of Illinois. The senior author revised and up-dated the
manuscript. We are grateful to Robert H. Whittaker for providing vegetation analyses for several of the census areas and for cooperation in other ways and to Arthur Stupka, at that time Park Naturalist, for pointing out and providing access to suitable study areas in the various types of vegetation. James R. Karr, Frances C. James, James F. Parnell and Jerrold H. Zar provided helpful comments on early drafts of the manuscript.
LITERATURE CITED
ABLE, K. P. AND B. R. NOON. 1976. Avian community structure along elevational gradients in the northeastern United States. Oecologia (Berl.) 26:275-295.
ALDRICH, J. W. AND P. GOODRUM. 1946. Tenth breeding bird census: virgin hardwood forest. Audubon Mag. 48:144-145.
ALSOP, F. J., III. 1969. Thirty-third breeding bird census: virgin spruce-fir forest. Audubon Field Notes 23:716.
ANDERSON, S. H. AND H. H. SHUGART, JR. 1974. Habitat selection of breeding birds in an east Tennessee deciduous forest. Ecology 55:828-837.
BENT, A. C. 1949. Life histories of North American thrushes, kinglets, and their allies. U.S. Natl. Mus. Bull. 196.
BERTIN, R. I. 1977. Breeding habitats of the Wood Thrush and Veery. Condor 79:303--311. BOND, R. R. 1957. Ecological distribution of breeding birds in the upland forests of southern
Wisconsin. Ecol. Monogr. 27:351384. BRAUN, E. L. 1950. Deciduous forests of eastern North America. The Blakiston Co., Phila-
delphia, Pennsylvania. BREWER, R. 1963. Ecological and reproductive relationships of Black-capped and Carolina
chickadees. Auk 80:947. CAMP, W. H. 1950. A biogeographic and paragenetic analysis of the American beech (Fa-
gus). Am. Philos. Sot. Yearbook 1950:166-169. CAVANAUGH, J. AND A. MAGEE. 1967. Thirty-first breeding bird census: climax hemlock-
white pine forest, with transitional hardwood. Audubon Field Notes 21:626427. DIAMOND, J. M. 1973. Distributional ecology of New Guinea birds. Science 179(4075):759-
769. ERSKINE, A. J. 1977. Birds in boreal Canada: communities, densities and adaptations.
Canadian Wildl. Serv., Rept. Ser. 41:1-71. FAWVER, B. J. 1950. An analysis of the ecological distribution of breeding bird populations
in eastern North America. Ph.D. thesis, Univ. Illinois, Champaign, Illinois. HUBBARD, J. P. 1971. The avifauna of the southern Appalachians: past and present. Pp.
197-232 in The distributional history of the biota of the southern Appalachians, Pt. III, Vertebrates (P. C. Holt, ed.). Virginia Polytechnic Inst. and State Univ., Res. Div. Monogr. 4, Blacksburg, Virginia.
HURLBERT, S. H. 1971. The nonconcept of species diversity: a critique and alternative explanations. Ecology 52:577-586.
JAMES, F. C. 1971. Ordinations of habitat relationships among breeding birds. Wilson Bull. 83:215-236.
JOHNSTONE, D. W. AND E. P. ODUM. 1956. Breeding bird populations in relation to plant succession on the Piedmont of Georgia. Ecology 37:50-62.
KENDEIGH, S. C. 1945. Community selection by birds on the Helderberg Plateau of New York. Auk 62:418-436.
-. 1946. Breeding birds of the beech-maple-hemlock community. Ecology 27:226-244.

242 THE WILSON BULLETIN * Vol. 93, No. 2, Jane 1981
-. 1947. Bird population studies in the coniferous forest biome during a spruce bud- worm outbreak. Dept. Lauds and Forests Ontario, Canada, Div. Res., Biol. Bull. l:l- 100.
-. 1974. Ecology with special reference to animals and man. Prentice-Hall, Inc., Englewood Cliffs, New Jersey.
KRICHER, J. C. 1972. Bird species diversity: the effect of species richness and equitability on the diversity index. Ecology 53:278-282.
MACARTHUR, R. H. 1958. Population ecology of some warblers of northeastern coniferous forests. Ecology 39:599419.
ODUM, E. P. 1948. Nesting of the Mountain Vireo at Athens, Georgia, conclusive evidence of a southward invasion. Oriole 13:17-20.
-. 1950. Bird populations of the Highlands (North Carolina) Plateau in relation to plant succession and avian invasion. Ecology 31:587-605.
PALMGREN, P. 1930. Quantitative Untersuchungen iiber die Vogelfauna in den Waldern Siidfinnlands mit besonderer Beriicksuchtingung Alands. Acta. Zool. Fenn. 7:1-219.
PIELOU, E. C. 1966. The measurement of diversity in different types of biological conditions. J. Theoret. Biol. 13:131-144.
RABENOLD, K. N. 1978. Foraging strategies, diversity, and seasonality in bird communities of Appalachian spruce-fir forests. Ecol. Monogr. 48:397424.
ROTENBERRY, J. T. 1978. Components of avian diversity along a multifactorial climatic gradient. Ecology 59:693-699.
-, R. E. FITZNER AND W. H. RICKARD. 1979. Seasonal variation in avian community structure: differences in mechanisms regulating diversity. Auk 96:499-505.
SHANKS, R. E. 1954. Climates of the Great Smoky Mountains. Ecology 35:354-361. SHELDON, A. L. 1969. Equitability indices: dependence on the species count. Ecology
50:466-467. SMITH, K. G. 1977. Distribution of summer birds along a forest moisture gradient in au Ozark
watershed. Ecology 58:810-819. STEWART, R. E. AND J. W. ALDRICH. 1952. Ecological studies of breeding bird populations
in northern Maine. Ecology 33:226-238. STUPKA, A. 1963. Notes on the birds of Great Smoky Mountains National Park. Univ.
Tennessee Press, Kingsport, Tennessee. TANNER, J. R. 1952. Black-capped and Carolina chickadees in the southern Appalachian
Mountains. Auk 69:407-424. TERBORGH, J. 1971. Distribution on environmental gradients: theory and a preliminary
interpretation of distributional patterns in the avifauna of the Cordillera Vilcabamba, Peru. Ecology 52:2340.
TRAMER, E. J. 1969. Bird species diversity: components of Shannon’s formula. Ecology 50:927-929.
WHITTAKER, R. H. 1952. A study of summer foliage insect communities in the Great Smoky Mountains. Ecol. Monogr. 22:1-44.
-. 1956. Vegetation of the Great Smoky Mountains. Ecol. Monogr. 26:180. ZAR, J. H. 1974. Biostatistical analysis. Prentice-Hall, Inc., Englewood Cliffs, New Jersey.
VIVARIUM BLDG., UNIV. ILLINOIS, CHAMPAIGN, ILLINOIS 61820 AND BIOLOGY
DEPT., SOUTHWESTERN OREGON COLL., COOS BAY, OREGON 97420. ACCEPTED 1 MAY 1980.
Related Documents