Breeder Mortality Calculator User Manual (Version 1, May 2013) Page 1 of 17 Breeder Mortality Calculator User Manual Contents 1 Introduction .................................................................................................................................. 2 2 Brief overview of the approach .................................................................................................... 2 3 Breeder Mortality Calculator 1.0 Simple ...................................................................................... 4 3.1 Data entry worksheet ................................................................................................... 4 3.2 Output worksheet......................................................................................................... 6 4 Breeder Mortality Calculator 2.0 Advanced ............................................................................... 11 4.1 Data entry worksheet ................................................................................................. 11 4.2 Other input worksheets .............................................................................................. 13 4.3 Output worksheet....................................................................................................... 16 5 Acknowledgements ................................................................................................................... 17 Contact: Meat & Livestock Australia Ph: 1800 023 100 Published by: Meat & Livestock Australia Limited ABN: 39 081 678 364 May 2013 © Meat & Livestock Australia Limited, 2013 This publication is published by Meat & Livestock Australia (MLA). Care is taken to ensure the accuracy of the information in the publication; however, MLA and the contributors to this publication cannot accept any responsibility for the accuracy or completeness of the information or opinions contained in the publication. Readers should rely on their own enquiries in making decisions concerning their interests. The inclusion of trade or company names in this publication does not imply endorsement of any product or company by MLA or any contributor to this publication. MLA and the contributors to this publication are not liable to you or any third party for any losses, costs or expenses resulting from any use or misuse of the information contained in this publication. Reproduction in whole or part of this publication is prohibited without prior written consent of Meat & Livestock Australia (MLA). Meat & Livestock Australia acknowledges the matching funds provided by the Australian Government to support the research and development detailed in this report.

Welcome message from author
This document is posted to help you gain knowledge. Please leave a comment to let me know what you think about it! Share it to your friends and learn new things together.
Transcript

Breeder Mortality Calculator User Manual (Version 1, May 2013) Page 1 of 17
Breeder Mortality Calculator User Manual
Contents
1 Introduction .................................................................................................................................. 2
2 Brief overview of the approach .................................................................................................... 2
3 Breeder Mortality Calculator 1.0 Simple ...................................................................................... 4
3.1 Data entry worksheet ................................................................................................... 4
3.2 Output worksheet......................................................................................................... 6
4 Breeder Mortality Calculator 2.0 Advanced ............................................................................... 11
4.1 Data entry worksheet ................................................................................................. 11
4.2 Other input worksheets .............................................................................................. 13
4.3 Output worksheet....................................................................................................... 16
5 Acknowledgements ................................................................................................................... 17
Contact: Meat & Livestock Australia Ph: 1800 023 100 Published by: Meat & Livestock Australia Limited ABN: 39 081 678 364 May 2013 © Meat & Livestock Australia Limited, 2013 This publication is published by Meat & Livestock Australia (MLA). Care is taken to ensure the accuracy of the information in the publication; however, MLA and the contributors to this publication cannot accept any responsibility for the accuracy or completeness of the information or opinions contained in the publication. Readers should rely on their own enquiries in making decisions concerning their interests. The inclusion of trade or company names in this publication does not imply endorsement of any product or company by MLA or any contributor to this publication. MLA and the contributors to this publication are not liable to you or any third party for any losses, costs or expenses resulting from any use or misuse of the information contained in this publication. Reproduction in whole or part of this publication is prohibited without prior written consent of Meat & Livestock Australia (MLA). Meat & Livestock Australia acknowledges the matching funds provided by the Australian Government to support the research and development detailed in this report.

Breeder Mortality Calculator User Manual (Version 1, May 2013) Page 2 of 17
1 Introduction
This user manual is intended to accompany an Excel® spreadsheet calculator which can be downloaded and used by beef producers to estimate mortality in male and female cattle. The calculator was developed as part of research project B.NBP.0664 Determining property-level rates of breeder cow mortality in northern Australia. Users should download the calculator from the MLA website and then open it in Microsoft Excel®. Two forms of the calculator have been produced:
Breeder Mortality Calculator 1.0 Simple Based on annual livestock schedule counts. Referred to in document as BMC1.0 Simple.
Breeder Mortality Calculator 2.0 Advanced Based on annual counts for various livestock classes. Referred to in document as BMC2.0 Advanced.
2 Brief overview of the approach
The livestock scheduling approach that forms the basis of the Breeder Mortality Calculator was developed by the project team with assistance from Mr Fred Chudleigh (agricultural economist from Queensland Department of Agriculture, Fisheries and Forestry).The approach is based on opening and closing numbers in each of multiple classes (non-breeding females, breeding females and steers), as well as sales and purchases. This approach requires accurate estimates of numbers in each of several classes of livestock. If estimates can be generated using this approach then it can be possible to directly estimate mortalities as the discrepancy between opening and closing numbers after adjusting for sales and purchases. The benefits of this approach are that it is intuitively understandable and is relatively easily set up using modifications of existing schedule approaches or setting up in a spread sheet. A simplistic flow diagram is provided below (Figure 1) to illustrate the concept, based on an understanding of a northern beef property that may conduct two rounds of musters per year. Figure 1 diagram is outlining an approach for all female animals but can be easily adapted to breeders or steers. Most properties will start the year with an opening count of females (including branded heifers from previous year, and all older females on the property from the previous year). During the year there will be various animal movements both off the property (sales) and onto the property (purchases) and movements of animals into the recorded female herd (heifers branded during the year). The mustering rounds will also provide an estimate of all females on the property during the year (assuming all animals are mustered during the year).

Breeder Mortality Calculator User Manual (Version 1, May 2013) Page 3 of 17
Figure 1: Flow chart of livestock scheduling approach for female cattle
The diagram shows two separate interim closing counts. One is outlined under the heading of book entries and is the opening count adjusted by actual estimates of animal movements (sales, purchases and branded heifers). The closing count (book) does not incorporate any adjustment for deaths and therefore is an over-estimate of the actual number of animals on the property at the end of the year. The second interim closing count is derived from yard counts during the year and incorporates the exact same adjustments for animal movements (sales, purchases and branded heifers). The closing count derived from yard data is always expected to be lower than the closing count derived from book entries because of missing animals (missing & alive, and missing & dead) that cannot be counted in the yard counts because there were not yarded. The closing count (yard data) can be considered to be an under-estimate of the actual number of females on the property with the level of under-estimation directly dependent on the number of missing and alive (which is related to mustering efficiency). There may also be a number of animals killed for rations through the year that should be separately recorded so they are not recorded as deaths. The numeric difference between the two interim closing counts is an estimate of the sum of missing & alive plus missing & dead.
CLOSING COUNT (book) - CLOSING COUNT (yard data) = MISSING & ALIVE + MISSING & DEAD + RATIONS
If mustering efficiency is high (close to 100%) then there will be very few animals that are missing and that may still be alive. If we then adjust to remove any effect due to rations then the difference between the two interim closing counts can be considered to be a direct estimate of the number of dead females.
Book Entries Yard counts during the year
SALESmovements off the property
PURCHASESmovements onto the property
BRANDED HEIFERSmovements into the female herd
OPENING COUNTcurrent year YARD COUNTS
count of females from mustersduring the year
CLOSING COUNT(yard data)
CLOSING COUNT(book)
ADJUSTED CLOSING COUNTprevious year
(‐) (‐)
(+)
(+)(+)
(+)
MISSING& ALIVE
MISSING & DEAD
ADJUSTED CLOSING COUNTcurrent year
OPENING COUNTnext year
RATIONS

Breeder Mortality Calculator User Manual (Version 1, May 2013) Page 4 of 17
If mustering efficiency is less than 100% then the difference between the two interim closing counts is an over-estimate of the number of dead females with the level of over-estimation dependent on the mustering efficiency. It is expected that most properties will then use some form of adjustment based on a best-estimate of the number of missing animals that may be alive. In some cases these adjustments take place through the year as data are collected on each mustering round and in others the adjustments may take place at the end of the year. The result is an adjusted closing count which is intended to reflect as closely as possible the number of live females on the property at the end of the year. The difference between the opening count and the adjusted closing count is then a direct estimate of the number of deaths through the year. This approach is the basis of the livestock scheduling approach derived in the Breeder Mortality project and applied to the development of the calculators described in this manual.
3 Breeder Mortality Calculator 1.0 Simple
The BMC1.0 Simple is based on annual livestock schedule counts. It is an easier version compared to BMC2.0 Advanced, which is based on annual counts for various livestock classes. BMC1.0 Simple has two worksheets. The first worksheet is labelled ‘Data Entry’ and is where users enter data relating to livestock counts and also answer some initial set-up questions. The second worksheet is labelled ‘Output’ and is where the outputs of the calculations are displayed. 3.1
3.2 Data entry worksheet
The upper part of the data entry sheet asks for input for three set-up questions.
1. How many years of data are you going to enter? Enter a number between 1 and 10. The calculator will automatically fill in the year numbers (Year 1, Year 2, …) up to the number you enter.
2. Enter the proportion of branded animals that are expected to be female. The default for this is 0.5 (50%) but the user may enter a different value if they wish.
3. Enter the expected proportion of deaths per year in young females (non-breeding females). The default value is 0.03 (3%) per year.
The lower part of the data entry sheet for BMC1.0 Simple is where the user can enter counts of animals. The table below (Table 1) shows the first two years of data from an example file but the calculator has the capacity to allow users to enter up to 10 years of data. Where records have been adjusted as described in the previous paragraph, users should enter the adjusted counts as well as the adjustment rate. The calculator then automatically back-calculates the unadjusted counts. For the purposes of this calculator, a year is approximately a calendar year (January to December). The opening count at the start of the year (January) is assumed to be equal to the closing count from the last muster of the previous year. Closing counts for the year are based on the musters that have been conducted during that year.
Breeder Mortality Calculator User Manual (Version 1, May 2013) Page 5 of 17
Table 1: Layout of the ‘Data entry’ worksheet (Worked example from Breeder Mortality Calculator 1.0 Simple)
Opening females: Estimate of the closing number of females on the property from the end of the previous year – serves as the opening number for the next year. Represents all females that have been branded prior to opening estimates (includes weaners, unjoined heifers, joined heifers and cows).
o Note that this figure should not include calves that will be branded during the course of the year – this is entered further down.
Opening breeders: All animals that were mated in the current year. o Includes heifers and cows.
Female sales: This figure includes any female (any animal that is branded) that was sold during that year. There is no way of determining accurately the number of animals in any component class that were sold from these data (weaners, branded calves, heifers or cows), or of knowing whether any older females that were sold were bred, pregnant/empty or had calves at foot or not.
Female purchases: Similarly this is simply an overall estimate of anything that was branded and female and that was purchased in the current year.
o Females that were purchased as calves at foot (unbranded) are not counted in this total. They should be counted in the number of animals branded in that year.
Rations (female only): Count of the number of females that were killed during the year for rations.
Closing females: Estimate of the closing number of females on the property at the end of the last muster of the year.
o Should be derived from muster counts during the year. o Includes all branded females on the property by the end of the year so it does include
females that were branded during the year.

Breeder Mortality Calculator User Manual (Version 1, May 2013) Page 6 of 17
Branded count during year (males and females): count of all animals (male + female) that were branded in the current year.
o Includes animals that were branded and weaned and animals that might be branded and left on the cows
o Enter the total number here (males + females). The proportion entered as an answer for question 2 in the upper part of the data entry sheet will be used in combination with the total number branded to estimate the number of branded females and males.
Opening steers: Count of all branded steers on the property based on the closing count from the end of the previous year.
o Does not include any animals that were branded in the current year.
Steer sales: Count of all steers sold through the year. o Only includes branded animals.
Steer purchases: Count of all steers purchased that were branded at the time of purchase.
Rations (steers only): Count of the number of steers that were killed during the year for rations (only count branded animals).
Closing steers: Count of all branded steers on the property at the end of the year. o Includes all branded males on the property by the end of the year so it does include males
that were branded during the year. o Should be derived from muster counts.
3.3 Output worksheet
Once you have completed data entry in the ‘Data Entry’ worksheet, move to the ‘Output’ worksheet. The ‘Output’ worksheet is a display sheet only – it will display a summary of the data entry sheet in three sections: 1. Summary from entered data (Section 1) 2. Calculations using entered data to derive additional estimates (Section 2) 3. Mortality rate estimates (Section 3).

Breeder Mortality Calculator User Manual (Version 1, May 2013) Page 7 of 17
Summary from entered data (Section 1)
This section displays an aggregate (sum) of the years of data entered in the ‘Data Entry’ worksheet and also presents the entered responses for the four initial questions ( Table 1). Table 1: Summary from entered data (Section 1) of the ‘Output’ worksheet (Worked example from Breeder Mortality Calculator 1.0 Simple)
Summary from entered data
Number of years of records 5 Opening females 132,959Opening breeders 90,300 Female sales 20,674 Female purchases 0 Rations (females only) 0 Closing females adjusted for rations 131,078Branded during year 52,517 Opening steers 35,145 Sales of steers 31,867 Purchase of steers 2,666 Rations (steers only) 98 Closing steers adjusted for rations 29,349 Calculations using entered data to derive additional estimates (Section 2) This section displays a series of interim calculations that use the entered data as inputs. These outputs are explained below and an example shown in Table 2. Count of branded heifers: Count of total animals branded during the year * (= multiplied by)
proportion of branded animals that are female.
Closing females count - BOOK: Opening females - female sales + female purchases + count of branded heifers (referred to as a book count because it uses the opening count from the book entry for the start of the year as the count of females on the property).
At-risk-females #1: Opening females + 0.5*branded heifers + 0.5*female purchases. o Not adjusted for sales. o Provides an estimate of the number of females at risk of mortality which serves as a
denominator for estimating mortality rate in females.
At-risk non-breeding females: Opening females - opening breeders + 0.5*branded heifers. o Assumes all purchased females are breeding animals. o Not adjusted for sales of females. o Provides an estimate of the number of non-breeding females at risk of mortality which
serves as a denominator for estimating mortality in non-breeding females.
Deaths in all females: Calculated as the difference between the two different estimates of closing females.
o Estimate 1 = Closing females count - BOOK. o Estimate 2 = Closing females adjusted for rations. This count should be derived from
mustering counts through the year and should also incorporate sales, purchases and transfers (branded heifers). Any rations are added back to this number in order to avoid counting rations as female mortalities.
Breeder Mortality Calculator User Manual (Version 1, May 2013) Page 8 of 17
o The difference between these two estimates is the estimated mortality. It is actually an estimate of difference and may include missing animals as well as deaths. In situations where there may be a lot of missing animals, this estimate may be expected to over-estimate actual mortality.
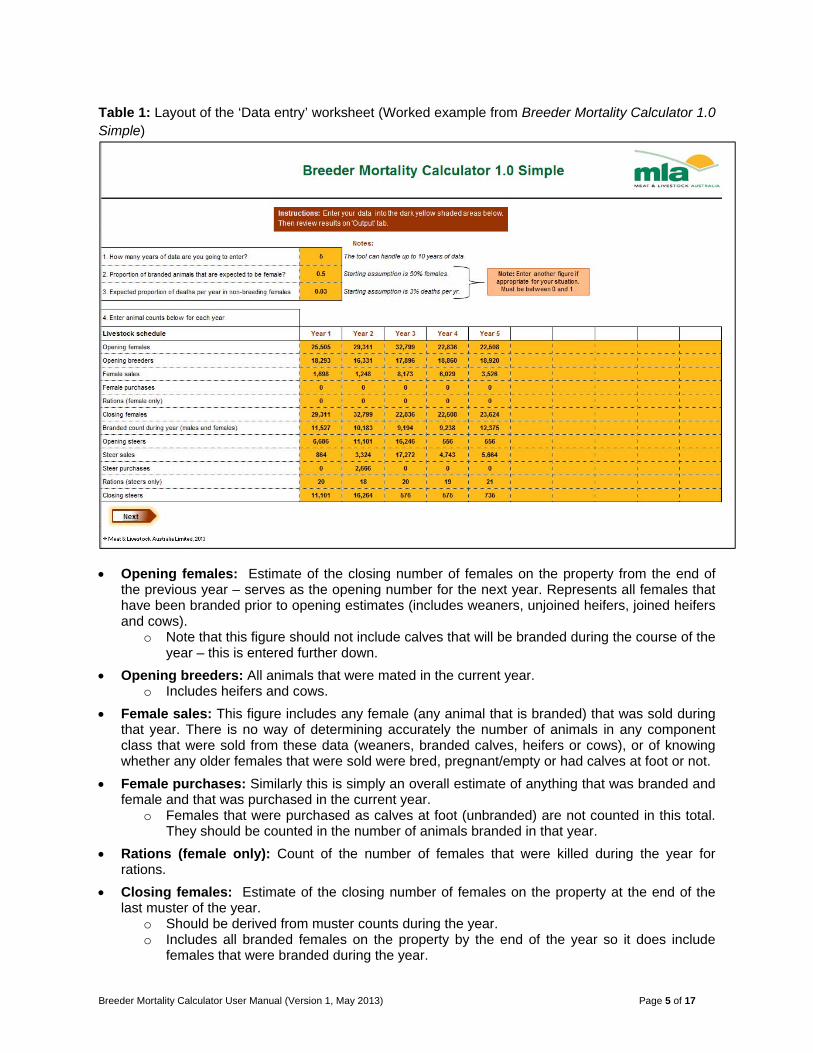
Deaths in non-breeding females: Estimated by applying the expected proportion of deaths in non-breeding females to the estimated count of non-breeding females at risk of mortality.
Deaths in breeding females: Estimated by subtracting the deaths in non-breeding females from the estimated total female deaths.
Count of branded steers: Count of total animals branded during the year * (1-proportion of branded animals that are female).
Closing steer count - BOOK: Opening males - male sales + male purchases + count of branded steers in that year.
At-risk-steers #1: Opening steers + 0.5*branded steers + 0.5*purchased steers. o Not adjusted for sales. o Provides an estimate of the number of males at risk of mortality which serves as a
denominator for estimating mortality rate in males.
Deaths in steers: Calculated as the difference between the two different estimates of closing males.
o Estimate 1 = Closing steer count - BOOK. o Estimate 2 = Closing steers adjusted for rations. This count should be derived from
mustering counts through the year and should also incorporate sales, purchases and branded steers. Any rations are added back to this number in order to avoid counting rations as steer mortalities.
o The difference between these two estimates is the estimated mortality. It is actually an estimate of difference and may include missing animals as well as deaths. In situations where there may be a lot of missing animals, this estimate may be expected to over-estimate actual mortality.
At-risk-females #2: Opening females + 0.5*branded heifers + 0.5*female purchases - 0.5*female sales.
o Adjusted for sales. o Provides an estimate of the number of females at risk of mortality which serves as a
denominator for estimating mortality rate in females.
At-risk-steers #2: Opening males + 0.5*branded steers + 0.5*male purchases - 0.5*male sales. o Adjusted for sales. o Provides an estimate of the number of males at risk of mortality which serves as a
denominator for estimating mortality rate in males.
Breeder Mortality Calculator User Manual (Version 1, May 2013) Page 9 of 17
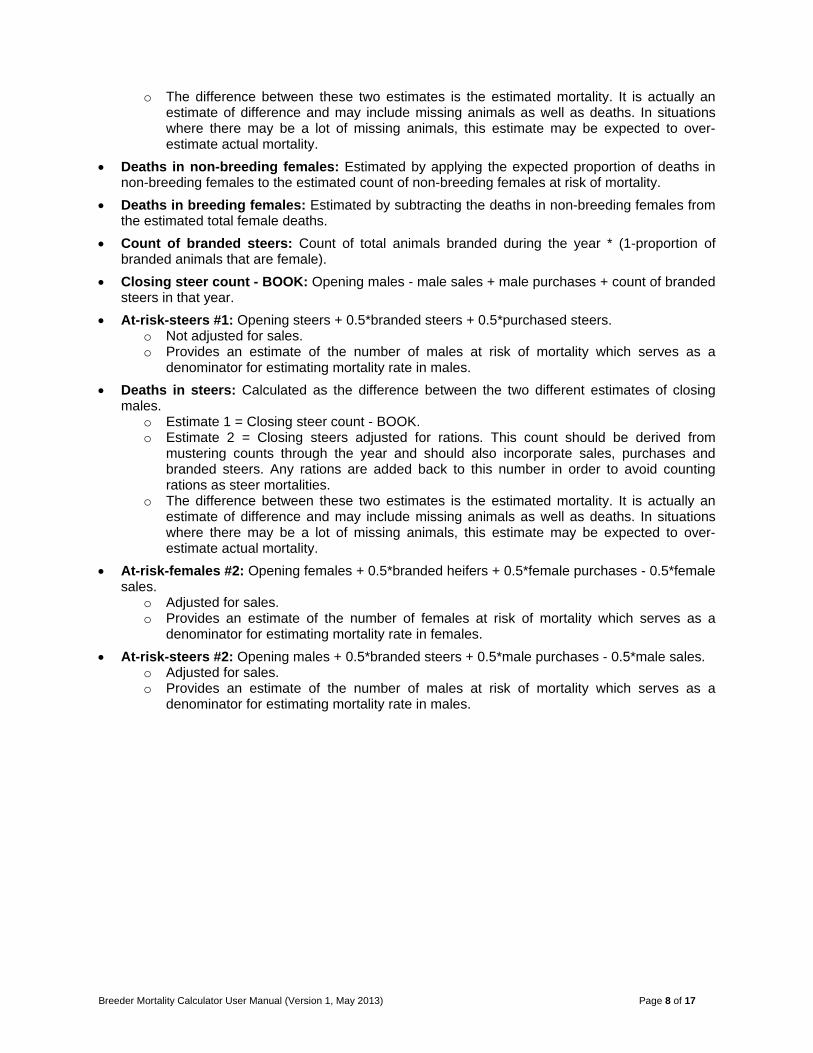
Table 2: Calculations using entered data to derive additional estimates (Section 2) of the ‘Output’ worksheet (Worked example from Breeder Mortality Calculator 1.0 Simple)
Calculations using entered data to derive additional estimates
26,259 Count of branded heifers
138,544 Closing female count - BOOK (opening count - sales + purchases + branded heifers)
146,088 At-risk-females #1 (opening_females + 0.5*branded_heifers+0.5*female_purchases)
55,788 At-risk non-breeding females
7,466 Deaths in all females
1,674 Deaths in non-breeding females
5,792 Deaths in breeding females
26,259 Count of branded steers
32,203 Closing steer count - BOOK (opening count - sales + purchases + branded steers)
49,607 At-risk-steers #1 (opening_steers + 0.5*branded_steers + 0.5*steer_purchases)
2,854 Deaths in steers
135,751 At-risk-females #2 (opening_females + 0.5*branded_heifers + 0.5*purchases - 0.5*sales)
33,674 At-risk-steers #2 (opening_steers + 0.5*branded_steers + 0.5*purchases - 0.5*sales)
Mortality rate estimates (Section 3)
This section shows two alternative methods for estimating mortality rate in females and steers. Estimating a mortality rate requires a numerator and a denominator. The numerator is a count of the number of new deaths that have occurred within a defined time period (one year). The denominator is an estimate of the number of animals that were at risk of mortality during that year. Both methods use the same numerator (estimated count of deaths). The two methods differ only in how they estimate a denominator with one method not incorporating adjustment for sales (At-risk #1 from above), and the other method including adjustment for sales (At-risk #2 from above). See Table 3.
Breeder Mortality Calculator User Manual (Version 1, May 2013) Page 10 of 17
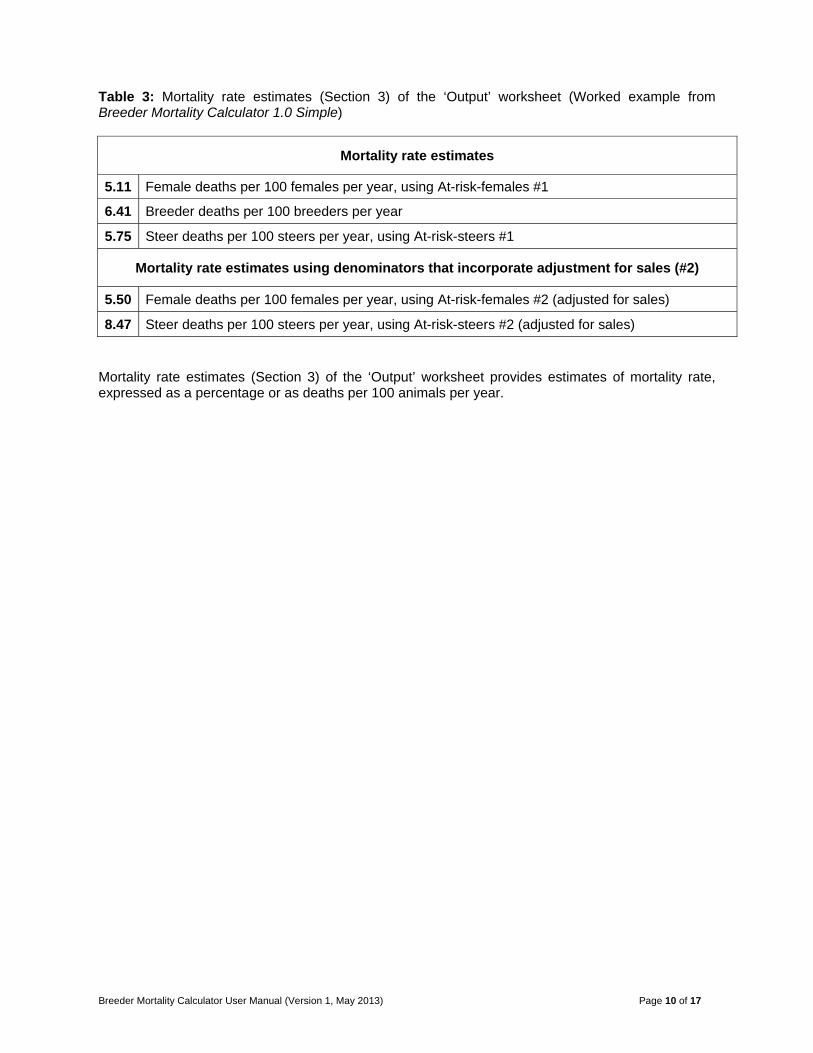
Table 3: Mortality rate estimates (Section 3) of the ‘Output’ worksheet (Worked example from Breeder Mortality Calculator 1.0 Simple)
Mortality rate estimates
5.11 Female deaths per 100 females per year, using At-risk-females #1
6.41 Breeder deaths per 100 breeders per year
5.75 Steer deaths per 100 steers per year, using At-risk-steers #1
Mortality rate estimates using denominators that incorporate adjustment for sales (#2)
5.50 Female deaths per 100 females per year, using At-risk-females #2 (adjusted for sales)
8.47 Steer deaths per 100 steers per year, using At-risk-steers #2 (adjusted for sales)
Mortality rate estimates (Section 3) of the ‘Output’ worksheet provides estimates of mortality rate, expressed as a percentage or as deaths per 100 animals per year.

Breeder Mortality Calculator User Manual (Version 1, May 2013) Page 11 of 17
4 Breeder Mortality Calculator 2.0 Advanced
Breeder Mortality Calculator 2.0 Advanced (BMC2.0 Advanced) has the same starting layout to BMC1.0 Simple but incorporates a month by month breakdown of animal movements onto and off the property (sales, purchases and brandings) to allow more accurate adjustment of the denominators for mortality estimates. Where users have month by month data for animal movements, BMC2.0 Advanced will produce more accurate estimates of mortality rates than BMC1.0 Simple. Individuals who are interested in BMC2.0 Advanced should read the initial part of this manual describing BMC1.0 Simple to gain an understanding of the more basic version prior to reading this part of the manual. 4.1 Data entry worksheet
The ‘Data Entry’ worksheet for BMC2.0 Advanced has a similar lay out to BMC1.0 Simple but users are asked to go to separate worksheets to enter month by month counts for sales, purchases and brandings. Table 4: ‘Data Entry’ worksheet (Worked example from Breeder Mortality Calculator 2.0 Advanced)
Breeder Mortality Calculator User Manual (Version 1, May 2013) Page 12 of 17
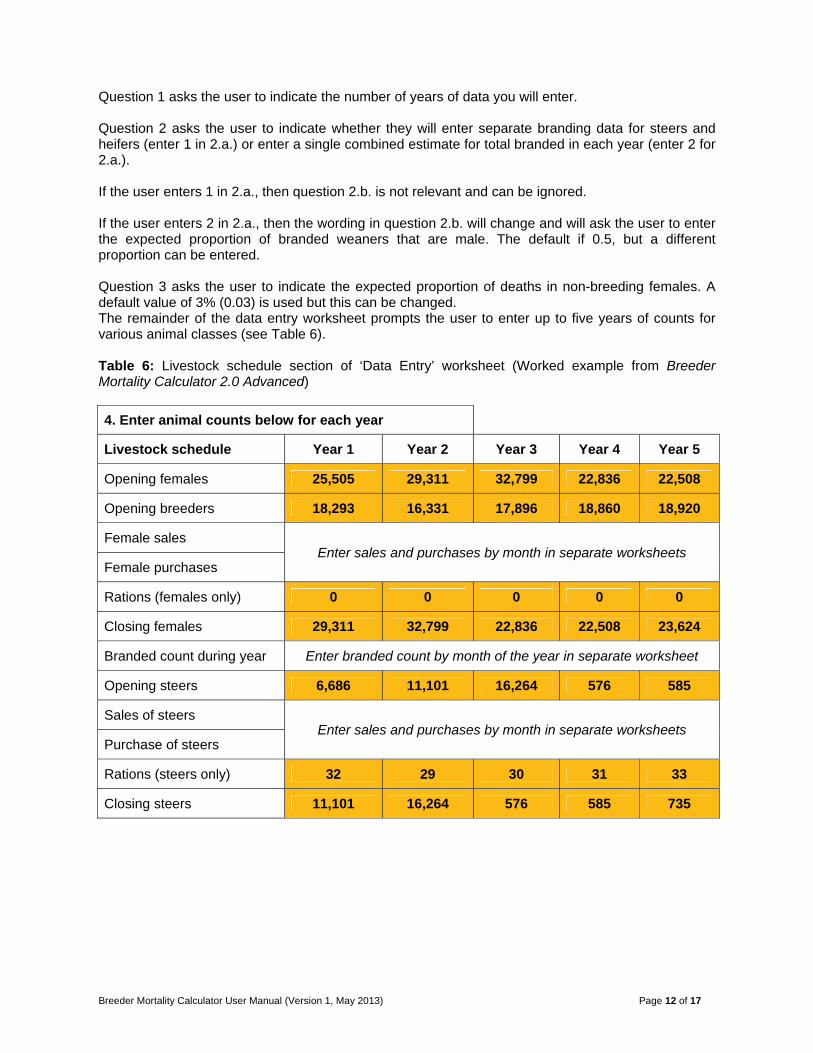
Question 1 asks the user to indicate the number of years of data you will enter. Question 2 asks the user to indicate whether they will enter separate branding data for steers and heifers (enter 1 in 2.a.) or enter a single combined estimate for total branded in each year (enter 2 for 2.a.). If the user enters 1 in 2.a., then question 2.b. is not relevant and can be ignored. If the user enters 2 in 2.a., then the wording in question 2.b. will change and will ask the user to enter the expected proportion of branded weaners that are male. The default if 0.5, but a different proportion can be entered. Question 3 asks the user to indicate the expected proportion of deaths in non-breeding females. A default value of 3% (0.03) is used but this can be changed. The remainder of the data entry worksheet prompts the user to enter up to five years of counts for various animal classes (see Table 6). Table 6: Livestock schedule section of ‘Data Entry’ worksheet (Worked example from Breeder Mortality Calculator 2.0 Advanced)
4. Enter animal counts below for each year
Livestock schedule Year 1 Year 2 Year 3 Year 4 Year 5
Opening females 25,505 29,311 32,799 22,836 22,508
Opening breeders 18,293 16,331 17,896 18,860 18,920
Female sales Enter sales and purchases by month in separate worksheets
Female purchases
Rations (females only) 0 0 0 0 0
Closing females 29,311 32,799 22,836 22,508 23,624
Branded count during year Enter branded count by month of the year in separate worksheet
Opening steers 6,686 11,101 16,264 576 585
Sales of steers Enter sales and purchases by month in separate worksheets
Purchase of steers
Rations (steers only) 32 29 30 31 33
Closing steers 11,101 16,264 576 585 735

Breeder Mortality Calculator User Manual (Version 1, May 2013) Page 13 of 17
4.2 Other input worksheets
Table 7 shows the first year of the worksheet for sales. The user is asked to enter separate counts for sales of breeding females, non-breeding females (branded calves, heifers too young to be mated and spayed females) and steers. There is an option of using calendar year or financial year but caution is urged that users need to use the same approach for all data entry. It is expected that most users will use a 12 month calendar year (January to December). Table 7: Sales section of ‘Sales by Month’ worksheet (Worked example from Breeder Mortality Calculator 2.0 Advanced)
Year = 1
Sales by month for each class
MONTH
Breeders (eligible to be
joined that year)
Female non-breeders
(only if branded)
Steers (only if
branded)
January
February
March 800
April 864
May 898
June
July
August
September
October
November
December
TOTALS 1,698 0 864 A separate worksheet (Purchases by Month) is then used for entry of purchase data for breeding females, non-breeding females and steers. The layout is identical to the sheet used for sales. The last worksheet for data entry (Brandings by Month) is then used to enter branding data by month (see Table 8). Notice that there are three columns where data may be entered. The columns used will depend on the response to Question 2.a. on the ‘Data Entry’ worksheet. Users who enter 1 to Question 2.a. on the ‘Data Entry’ worksheet should enter separate counts for branded heifers and branded steers in the columns labelled. Table 8: First two years of data entry for count of brandings by month for each year. Entered data to include both steer and heifer brandings i.e. all animals branded.

Breeder Mortality Calculator User Manual (Version 1, May 2013) Page 14 of 17
Table 8: Data entered for brandings on ‘Brandings by Month’ worksheet when users enter data separately for each sex (Worked example from Breeder Mortality Calculator 2.0 Advanced)
Year = 1 Brandings by month for heifers & steers
MONTH
Branded heifers
Branded steers
Not applicable
January
February
March 550 550
April 800 930
May 1,000 1,300
June 1,400 1,000
July 750 750
August 550 550
September 680 717
October
November
December
TOTAL by year & sex 5,730 5,797 Users who enter 2 to Question 2.a on the ‘Data Entry’ worksheet should enter a single combined count for brandings (heifers and steers combined) in the third column. Once a 2 is entered to Question 2.a. on the ‘Data Entry’ worksheet the appearance of the ‘Brandings by Month’ worksheet will automatically change to prompt the user to enter data in the correct column (See Table 9).

Breeder Mortality Calculator User Manual (Version 1, May 2013) Page 15 of 17
Table 9: Example data entered on ‘Brandings by Month’ worksheet for the first year when users intend to enter combined branding counts (heifers and steers combined) and have entered 2 in response to Question 2.a. on the ‘Data Entry’ worksheet (Worked example from Breeder Mortality Calculator 2.0 Advanced)
Year = 1 Brandings by month for heifers & steers
MONTH
Branded heifers
Branded steers
Not applicable
January
February
March 1,100
April 1,730
May 1,300
June 2,400
July 1,500
August 1,100
September 1,397
October
November
December
TOTAL by year & sex 10,527 The reason that month by month data collection of sales, purchases and brandings is important is that an animal is not considered eligible to die once it has left the property (sales) and similarly should not be considered eligible to die until it has entered the property (purchases or brandings). The month by month breakdown is then used to adjust the count of animals at risk (denominator in a mortality rate estimate) to accurately reflect the number of animal years at risk of mortality for that property.
Breeder Mortality Calculator User Manual (Version 1, May 2013) Page 16 of 17
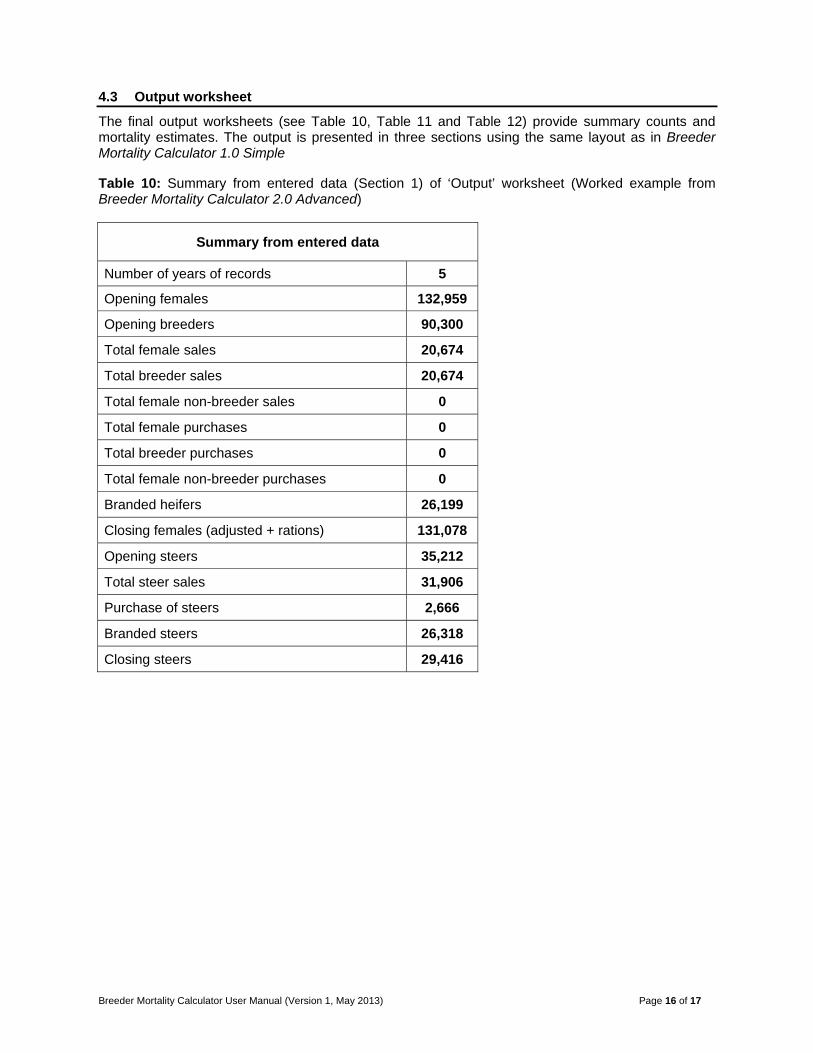
4.3 Output worksheet
The final output worksheets (see Table 10, Table 11 and Table 12) provide summary counts and mortality estimates. The output is presented in three sections using the same layout as in Breeder Mortality Calculator 1.0 Simple Table 10: Summary from entered data (Section 1) of ‘Output’ worksheet (Worked example from Breeder Mortality Calculator 2.0 Advanced)
Summary from entered data
Number of years of records 5
Opening females 132,959
Opening breeders 90,300
Total female sales 20,674
Total breeder sales 20,674
Total female non-breeder sales 0
Total female purchases 0
Total breeder purchases 0
Total female non-breeder purchases 0
Branded heifers 26,199
Closing females (adjusted + rations) 131,078
Opening steers 35,212
Total steer sales 31,906
Purchase of steers 2,666
Branded steers 26,318
Closing steers 29,416
Breeder Mortality Calculator User Manual (Version 1, May 2013) Page 17 of 17
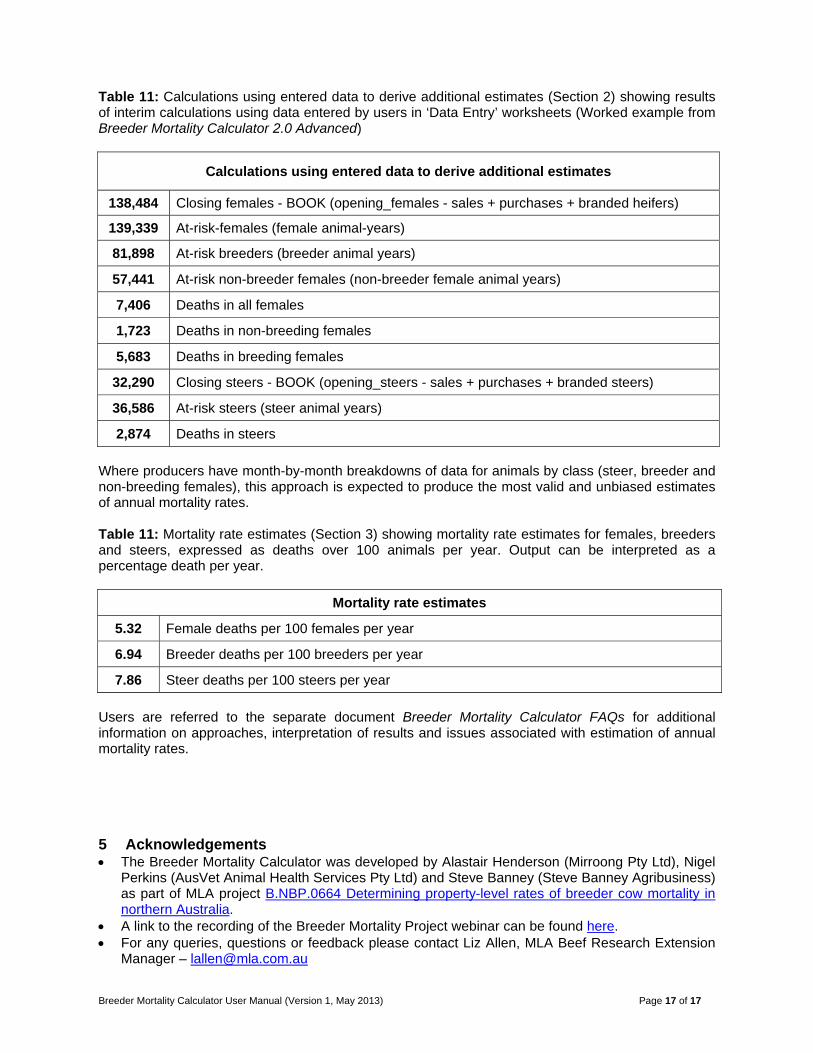
Table 11: Calculations using entered data to derive additional estimates (Section 2) showing results of interim calculations using data entered by users in ‘Data Entry’ worksheets (Worked example from Breeder Mortality Calculator 2.0 Advanced)
Calculations using entered data to derive additional estimates
138,484 Closing females - BOOK (opening_females - sales + purchases + branded heifers)
139,339 At-risk-females (female animal-years)
81,898 At-risk breeders (breeder animal years)
57,441 At-risk non-breeder females (non-breeder female animal years)
7,406 Deaths in all females
1,723 Deaths in non-breeding females
5,683 Deaths in breeding females
32,290 Closing steers - BOOK (opening_steers - sales + purchases + branded steers)
36,586 At-risk steers (steer animal years)
2,874 Deaths in steers
Where producers have month-by-month breakdowns of data for animals by class (steer, breeder and non-breeding females), this approach is expected to produce the most valid and unbiased estimates of annual mortality rates. Table 11: Mortality rate estimates (Section 3) showing mortality rate estimates for females, breeders and steers, expressed as deaths over 100 animals per year. Output can be interpreted as a percentage death per year.
Mortality rate estimates
5.32 Female deaths per 100 females per year
6.94 Breeder deaths per 100 breeders per year
7.86 Steer deaths per 100 steers per year
Users are referred to the separate document Breeder Mortality Calculator FAQs for additional information on approaches, interpretation of results and issues associated with estimation of annual mortality rates. 5 Acknowledgements The Breeder Mortality Calculator was developed by Alastair Henderson (Mirroong Pty Ltd), Nigel
Perkins (AusVet Animal Health Services Pty Ltd) and Steve Banney (Steve Banney Agribusiness) as part of MLA project B.NBP.0664 Determining property-level rates of breeder cow mortality in northern Australia.
A link to the recording of the Breeder Mortality Project webinar can be found here. For any queries, questions or feedback please contact Liz Allen, MLA Beef Research Extension
Manager – [email protected]
Related Documents