CANCER SERIES NO. 86 BreastScreen Australia monitoring report 2011–2012 AIHW

Welcome message from author
This document is posted to help you gain knowledge. Please leave a comment to let me know what you think about it! Share it to your friends and learn new things together.
Transcript
CANCER sERiEs No. 86
BreastScreen Australia monitoring report 2011–2012
The BreastScreen Australia monitoring report 2011–2012 presents the latest national statistics on this national screening program, which aims to reduce illness and death resulting from breast cancer through organised screening to detect cases of unsuspected breast cancer in women, thus enabling early intervention. Around 55% of women in the target age group of 50–69 took part in the program, with more than 1.7 million women screening in 2011–2012.
Breast cancer mortality is at an historic low, at 44 deaths per 100,000 women.
Breastscreen Australia monitoring report 2011–2012
AIH
W


CANCER SERIES No. 86
Australian Institute of Health and Welfare Canberra
Cat. no. CAN 83
BreastScreen Australia monitoring report 2011–2012

The Australian Institute of Health and Welfare is a major national agency which provides reliable, regular and relevant information and statistics
on Australia’s health and welfare. The Institute’s mission is authoritative information and statistics to promote better health and wellbeing.
© Australian Institute of Health and Welfare 2014
This product, excluding the AIHW logo, Commonwealth Coat of Arms and any material owned by a third party or protected by a trademark, has been released under a Creative Commons BY 3.0 (CC-BY 3.0) licence. Excluded material owned by third parties may include, for example, design and layout, images obtained under licence from third parties and signatures. We have made all reasonable efforts to identify and label material owned by third parties.
You may distribute, remix and build upon this work. However, you must attribute the AIHW as the copyright holder of the work in compliance with our attribution policy available at <www.aihw.gov.au/copyright/>. The full terms and conditions of this licence are available at <http://creativecommons.org/licenses/by/3.0/au/>.
Enquiries relating to copyright should be addressed to the Head of Digital and Media Communications Unit, Australian Institute of Health and Welfare, GPO Box 570, Canberra ACT 2601.
The rights to the following material are owned by third parties and are excluded from the CC-BY 3.0 licence: Illustration ‘Anatomy: The breast and adjacent lymph nodes’, reproduced with permission from the National Cancer Institute.
This publication is part of the Australian Institute of Health and Welfare’s Cancer series. A complete list of the Institute’s publications is available from the Institute’s website <www.aihw.gov.au>.
ISSN 1039-3307 ISBN 978-1-74249-639-9
Suggested citation Australian Institute of Health and Welfare 2014. BreastScreen Australia monitoring report 2011–2012. Cancer series no. 86. Cat. no. CAN 83. Canberra: AIHW.
Australian Institute of Health and Welfare Board Chair Dr Mukesh Haikerwal AO
Director David Kalisch
Any enquiries about or comments on this publication should be directed to: Digital and Media Communications Unit Australian Institute of Health and Welfare GPO Box 570 Canberra ACT 2601 Tel: (02) 6244 1032 Email: [email protected]
Published by the Australian Institute of Health and Welfare This publication is printed in accordance with ISO 14001 (Environmental Management Systems) and ISO 9001 (Quality Management Systems). The paper is sourced from sustainably managed certified forests.
Please note that there is the potential for minor revisions of data in this report. Please check the online version at <www.aihw.gov.au> for any amendments.

iii
Contents Acknowledgments.............................................................................................................................. iv
Abbreviations ....................................................................................................................................... v
Summary .............................................................................................................................................. vi
Data at a glance .................................................................................................................................. vii
Section 1 Introduction ......................................................................................................................... 1
This report ....................................................................................................................................... 1
Overview ......................................................................................................................................... 2
Data .................................................................................................................................................. 6
Terminology and concepts ............................................................................................................ 7
Section 2 Performance indicators ...................................................................................................... 9
Indicator 1 Participation ................................................................................................................ 9
Indicator 2 Rescreening ............................................................................................................... 17
Indicator 3 Recall to assessment ................................................................................................. 22
Indicator 4 Invasive breast cancer detection ............................................................................ 27
Indicator 5 Ductal carcinoma in situ detection ........................................................................ 33
Indicator 6a Interval cancers ....................................................................................................... 37
Indicator 6b Program sensitivity ................................................................................................ 41
Indicator 7a Invasive breast cancer incidence .......................................................................... 44
Indicator 7b Ductal carcinoma in situ incidence ...................................................................... 54
Indicator 8 Mortality .................................................................................................................... 57
Appendix A Additional data ............................................................................................................ 66
Appendix B BreastScreen Australia information ......................................................................... 67
Appendix C Data sources and classifications ............................................................................... 70
Appendix D BreastScreen Australia 2011–2012 Data Quality Statement ............................... 74
Appendix E Statistical methods ....................................................................................................... 77
Glossary ................................................................................................................................................ 79
References ............................................................................................................................................ 82
List of tables ........................................................................................................................................ 85
List of figures ...................................................................................................................................... 87
Related publications .......................................................................................................................... 89

iv BreastScreen Australia monitoring report 2011–2012
Acknowledgments Biljana Tanevska, Alison Budd, Wendy Ho and Justin Harvey prepared this report under the direction of Lisa McGlynn.
This report was produced in collaboration with BreastScreen Australia. Thanks are extended to the state and territory program and data managers listed below for providing the data, expertise and assistance in producing this document.
Thanks are also extended to all state and territory cancer registries—the source of data on breast cancer incidence (through the Australian Cancer Database) and ductal carcinoma in situ incidence, and to all state and territory Registrars of Births, Deaths and Marriages—the source of data on breast cancer mortality (through the National Mortality Database).
The financial support and professional assistance of the Screening Section of the Australian Government Department of Health is gratefully acknowledged.
BreastScreen Australia
New South Wales Sarah McGill Karen Clark Matthew Warner-Smith Carina Mok
Victoria Louise Galloway Vicki Pridmore Suzen Maljevac
Queensland Craig Carey Alison Thompson Nathan Dunn
Western Australia Liz Wylie Jan Tresham
South Australia Lou Williamson Andrew Holmes Ada Childs
Tasmania Gail Ward Dylan Sutton Carol Ramsay
Australian Capital Territory Yvonne Epping Stuart Watts Renuka Umbarker
Northern Territory Karen Forster Guillermo Enciso
Australian Government Department of Health Tracey Bessell Kim Dobbie

v
Abbreviations ABS Australian Bureau of Statistics
ACT Australian Capital Territory
AIHW Australian Institute of Health and Welfare
AS age-standardised
ASGC Australian Standard Geographic Classification
CI confidence interval
DCIS ductal carcinoma in-situ
ICD International Classification of Diseases
NAS National Accreditation Standards
NSW New South Wales
NT Northern Territory
Qld Queensland
SA South Australia
SEIFA Socioeconomic Indexes for Areas
Tas Tasmania
Vic Victoria
WA Western Australia
Symbols . . not applicable
≤ less than or equal to
≥ greater than or equal to
< less than
> greater than
favourable trend
unfavourable trend
no trend, or not applicable
vi BreastScreen Australia monitoring report 2011–2012
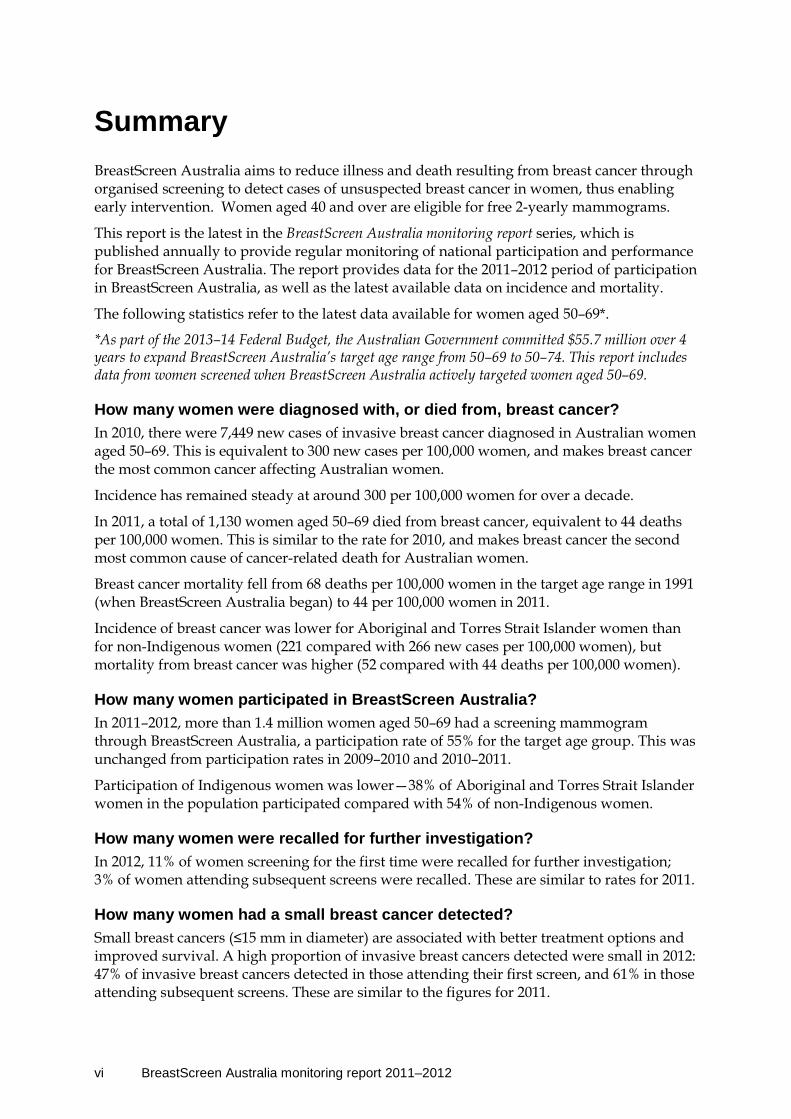
Summary BreastScreen Australia aims to reduce illness and death resulting from breast cancer through organised screening to detect cases of unsuspected breast cancer in women, thus enabling early intervention. Women aged 40 and over are eligible for free 2-yearly mammograms.
This report is the latest in the BreastScreen Australia monitoring report series, which is published annually to provide regular monitoring of national participation and performance for BreastScreen Australia. The report provides data for the 2011–2012 period of participation in BreastScreen Australia, as well as the latest available data on incidence and mortality.
The following statistics refer to the latest data available for women aged 50–69*.
*As part of the 2013–14 Federal Budget, the Australian Government committed $55.7 million over 4 years to expand BreastScreen Australia’s target age range from 50–69 to 50–74. This report includes data from women screened when BreastScreen Australia actively targeted women aged 50–69.
How many women were diagnosed with, or died from, breast cancer? In 2010, there were 7,449 new cases of invasive breast cancer diagnosed in Australian women aged 50–69. This is equivalent to 300 new cases per 100,000 women, and makes breast cancer the most common cancer affecting Australian women.
Incidence has remained steady at around 300 per 100,000 women for over a decade.
In 2011, a total of 1,130 women aged 50–69 died from breast cancer, equivalent to 44 deaths per 100,000 women. This is similar to the rate for 2010, and makes breast cancer the second most common cause of cancer-related death for Australian women.
Breast cancer mortality fell from 68 deaths per 100,000 women in the target age range in 1991 (when BreastScreen Australia began) to 44 per 100,000 women in 2011.
Incidence of breast cancer was lower for Aboriginal and Torres Strait Islander women than for non-Indigenous women (221 compared with 266 new cases per 100,000 women), but mortality from breast cancer was higher (52 compared with 44 deaths per 100,000 women).
How many women participated in BreastScreen Australia? In 2011–2012, more than 1.4 million women aged 50–69 had a screening mammogram through BreastScreen Australia, a participation rate of 55% for the target age group. This was unchanged from participation rates in 2009–2010 and 2010–2011.
Participation of Indigenous women was lower—38% of Aboriginal and Torres Strait Islander women in the population participated compared with 54% of non-Indigenous women.
How many women were recalled for further investigation? In 2012, 11% of women screening for the first time were recalled for further investigation; 3% of women attending subsequent screens were recalled. These are similar to rates for 2011.
How many women had a small breast cancer detected? Small breast cancers (≤15 mm in diameter) are associated with better treatment options and improved survival. A high proportion of invasive breast cancers detected were small in 2012: 47% of invasive breast cancers detected in those attending their first screen, and 61% in those attending subsequent screens. These are similar to the figures for 2011.
vii
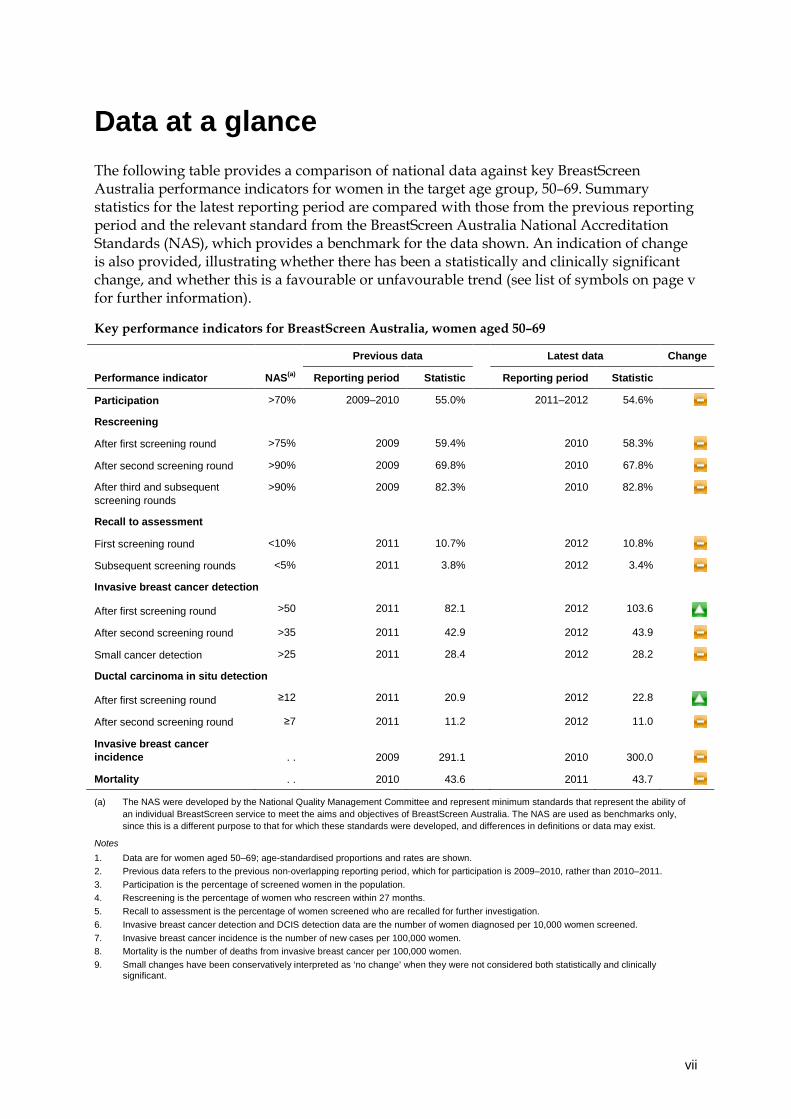
Data at a glance The following table provides a comparison of national data against key BreastScreen Australia performance indicators for women in the target age group, 50–69. Summary statistics for the latest reporting period are compared with those from the previous reporting period and the relevant standard from the BreastScreen Australia National Accreditation Standards (NAS), which provides a benchmark for the data shown. An indication of change is also provided, illustrating whether there has been a statistically and clinically significant change, and whether this is a favourable or unfavourable trend (see list of symbols on page v for further information).
Key performance indicators for BreastScreen Australia, women aged 50–69
Previous data Latest data Change
Performance indicator NAS(a) Reporting period Statistic Reporting period Statistic
Participation >70% 2009–2010 55.0% 2011–2012 54.6%
Rescreening
After first screening round >75% 2009 59.4% 2010 58.3%
After second screening round >90% 2009 69.8% 2010 67.8%
After third and subsequent screening rounds
>90% 2009 82.3% 2010 82.8%
Recall to assessment
First screening round <10% 2011 10.7% 2012 10.8%
Subsequent screening rounds <5% 2011 3.8% 2012 3.4%
Invasive breast cancer detection
After first screening round >50 2011 82.1 2012 103.6
After second screening round >35 2011 42.9 2012 43.9
Small cancer detection >25 2011 28.4 2012 28.2
Ductal carcinoma in situ detection
After first screening round ≥12 2011 20.9 2012 22.8
After second screening round ≥7 2011 11.2 2012 11.0
Invasive breast cancer incidence . .
2009
291.1
2010 300.0
Mortality . . 2010 43.6 2011 43.7
(a) The NAS were developed by the National Quality Management Committee and represent minimum standards that represent the ability of an individual BreastScreen service to meet the aims and objectives of BreastScreen Australia. The NAS are used as benchmarks only, since this is a different purpose to that for which these standards were developed, and differences in definitions or data may exist.
Notes 1. Data are for women aged 50–69; age-standardised proportions and rates are shown. 2. Previous data refers to the previous non-overlapping reporting period, which for participation is 2009–2010, rather than 2010–2011. 3. Participation is the percentage of screened women in the population. 4. Rescreening is the percentage of women who rescreen within 27 months. 5. Recall to assessment is the percentage of women screened who are recalled for further investigation. 6. Invasive breast cancer detection and DCIS detection data are the number of women diagnosed per 10,000 women screened. 7. Invasive breast cancer incidence is the number of new cases per 100,000 women. 8. Mortality is the number of deaths from invasive breast cancer per 100,000 women. 9. Small changes have been conservatively interpreted as ‘no change’ when they were not considered both statistically and clinically
significant.


BreastScreen Australia monitoring report 2011–2012 1
Section 1 Introduction
This report The first section of this report presents an overview of breast cancer in Australia; it also outlines the process of breast cancer screening, and describes the development and management of BreastScreen Australia. As well, it details the performance indicators used for monitoring the program, and provides a brief summary of technical issues that should be considered when interpreting information in this report.
The second section of this report presents the latest national data against the eight BreastScreen Australia performance indicators. Each performance indicator section starts with a summary that includes a definition of the performance indicator and its rationale; this is followed by key results indicating the main findings. More detailed analyses, as well as background information where appropriate, follow this summary material.
More detailed data than those shown in this report are available in the BreastScreen Australia monitoring report 2011–2012: supplementary data tables. These tables can be downloaded for free from the AIHW website <www.aihw.gov.au/publications>.
The BreastScreen Australia monitoring report 2011–2012 is part of an annual series. Earlier editions and any published subsequently can be downloaded for free from the AIHW website <http://www.aihw.gov.au/publications>. The website also includes information on ordering printed copies.
2 BreastScreen Australia monitoring report 2011–2012
Overview
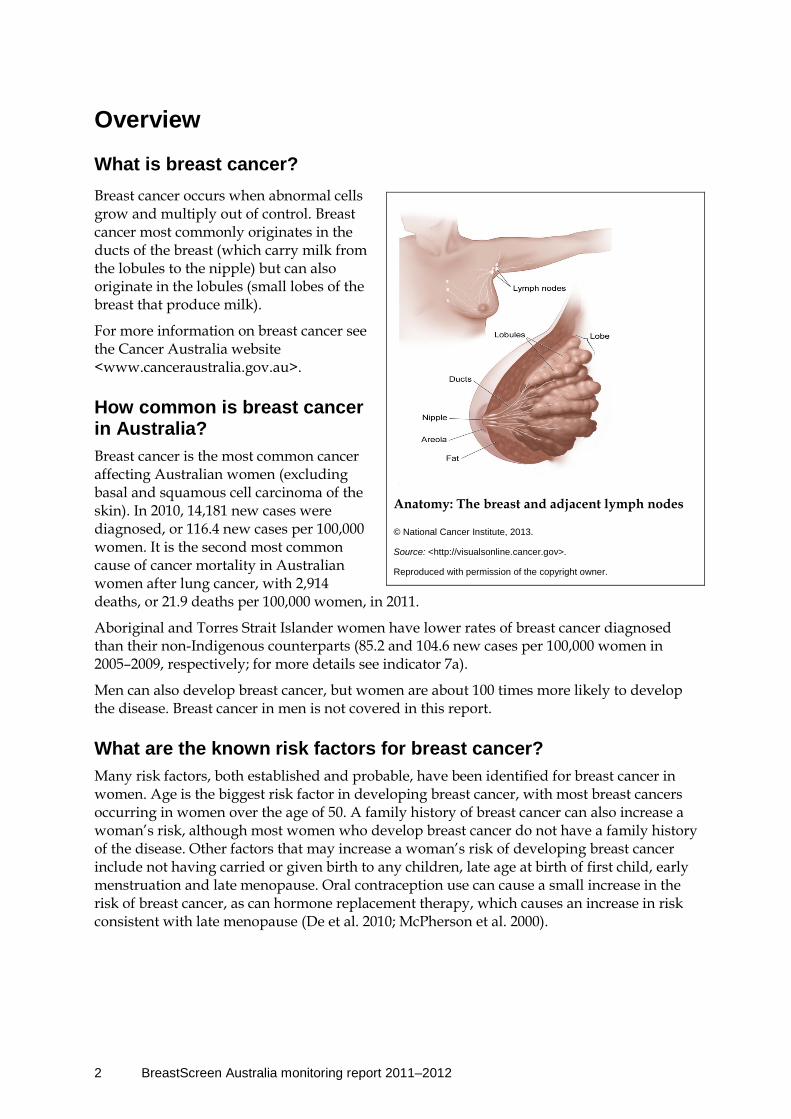
What is breast cancer? Breast cancer occurs when abnormal cells grow and multiply out of control. Breast cancer most commonly originates in the ducts of the breast (which carry milk from the lobules to the nipple) but can also originate in the lobules (small lobes of the breast that produce milk).
For more information on breast cancer see the Cancer Australia website <www.canceraustralia.gov.au>.
How common is breast cancer in Australia? Breast cancer is the most common cancer affecting Australian women (excluding basal and squamous cell carcinoma of the skin). In 2010, 14,181 new cases were diagnosed, or 116.4 new cases per 100,000 women. It is the second most common cause of cancer mortality in Australian women after lung cancer, with 2,914 deaths, or 21.9 deaths per 100,000 women, in 2011.
Aboriginal and Torres Strait Islander women have lower rates of breast cancer diagnosed than their non-Indigenous counterparts (85.2 and 104.6 new cases per 100,000 women in 2005–2009, respectively; for more details see indicator 7a).
Men can also develop breast cancer, but women are about 100 times more likely to develop the disease. Breast cancer in men is not covered in this report.
What are the known risk factors for breast cancer? Many risk factors, both established and probable, have been identified for breast cancer in women. Age is the biggest risk factor in developing breast cancer, with most breast cancers occurring in women over the age of 50. A family history of breast cancer can also increase a woman’s risk, although most women who develop breast cancer do not have a family history of the disease. Other factors that may increase a woman’s risk of developing breast cancer include not having carried or given birth to any children, late age at birth of first child, early menstruation and late menopause. Oral contraception use can cause a small increase in the risk of breast cancer, as can hormone replacement therapy, which causes an increase in risk consistent with late menopause (De et al. 2010; McPherson et al. 2000).
Anatomy: The breast and adjacent lymph nodes
© National Cancer Institute, 2013.
Source: <http://visualsonline.cancer.gov>.
Reproduced with permission of the copyright owner.
BreastScreen Australia monitoring report 2011–2012 3
How do we screen for breast cancer? Mammography (X-ray of the breast) is the test used in breast cancer screening. In screening mammography, two views are taken of each breast, and the images are reviewed by radiologists to look for suspicious characteristics that require further investigation. Screening mammography, like the screening tests used in other programs such as bowel and cervical screening, is not intended to be diagnostic; rather, it aims to identify people who are more likely to have breast cancer, and therefore require further investigation from diagnostic tests. In contrast to screening mammography, diagnostic mammography targets a specific area of the breast using multiple views, which makes it appropriate for women with symptoms that may indicate the presence of breast cancer.
Why screen for breast cancer? Organised breast cancer screening aims to detect cases of unsuspected breast cancer in women, thus enabling intervention when the cancer is at an early stage. Finding breast cancer early often means that the cancer is small, which is associated with increased treatment options (NBOCC 2009) and improved survival (AIHW & NBCC 2007).
Twenty-eight per cent (28%) of the breast cancers detected outside BreastScreen Australia are small; in comparison, 58% of breast cancers detected by BreastScreen Australia are small. As well, treatment of breast cancers detected by BreastScreen Australia is more likely to be breast-conserving surgery (74% compared with 56% outside the program) (NBOCC 2009), which is associated with decreased morbidity.
Further, it was recently estimated that 8.8 and 5.7 breast cancer deaths were prevented per 1,000 women screened using data from the Swedish Two-Country Trial and England’s breast cancer screening program, respectively (Duffy et al. 2010), and a recent evaluation of BreastScreen Australia estimated that breast cancer mortality has been reduced by 21–28% (BreastScreen Australia EAC 2009a).
How is breast cancer screening managed in Australia? Australia’s national breast cancer screening program was established in 1991 as the National Program for the Early Detection of Breast Cancer. This program is now known as BreastScreen Australia, and is a joint program of the Australian and state and territory governments. BreastScreen Australia aims to reduce mortality and morbidity from breast cancer. A list of its aims and objectives is presented in Overview Box 1.
BreastScreen Australia provides free biennial breast cancer screening to women through dedicated screening and assessment services. Women have a screening mammogram performed at a screening unit (which may be fixed, relocatable or mobile). Women whose images are suspicious for breast cancer are recalled for further investigation by a multidisciplinary team at an assessment centre. Further investigation may include clinical examination, mammography, ultrasound and biopsy procedures. Most women who are recalled for assessment are found not to have breast cancer.
Who is eligible to participate in BreastScreen Australia? In 2011–2012 (the period covered in this report) BreastScreen Australia actively invited women aged 50–69 to have free biennial breast cancer screening. Women aged 40–49 and 70 or over were also eligible to attend. Women aged 50–69 are targeted because they have a
4 BreastScreen Australia monitoring report 2011–2012
relatively high incidence of breast cancer, and screening mammography is known to be effective in reducing mortality in this age group (BreastScreen Australia 2004). Screening mammography is less effective in women aged under 50 because of biological differences in the breast tissue of pre-menopausal women. This results in more investigations and missed breast cancers (false negative results) due to the lower sensitivity of screening mammography in this age group (Irwig et al. 1997).
In 2013-14, BreastScreen Australia’s target age range was expanded by five years, from women 50-69 years of age to women 50-74 years of age. This was a key recommendation of the evidence-based BreastScreen Australia Evaluation (2009).
How is BreastScreen Australia monitored?
Performance indicators The performance of a population-based cancer screening program such as BreastScreen Australia needs to be assessed as it relates to the underlying aims of the program. At the national level, this is achieved by reporting data against a series of performance indicators to allow screening outcomes to be monitored, and positive and negative trends identified early.
BreastScreen Australia has been monitored since 1996–1997 using performance indicators developed and endorsed by the former National Screening Information Advisory Group and by jurisdictional BreastScreen programs. These national performance indicators represent key measures of the progress BreastScreen Australia is making towards reducing morbidity and mortality from breast cancer; they are listed in the table below.
BreastScreen Australia performance indicators
1 Participation The percentage of women aged 50–69 who have a screening mammogram through BreastScreen Australia in a 2-year period
2 Rescreening The proportion of women screened who return for a rescreen within 27 months
3 Recall to assessment The proportion of women screened who are recalled for further investigation
4 Invasive breast cancer detection The number of women with invasive breast cancer detected through BreastScreen Australia
5 Ductal carcinoma in situ detection The number of women with DCIS detected through BreastScreen Australia
6 Sensitivity The ability of screening mammography to successfully detect cancers
6a Interval cancers
6b Program sensitivity
7 Incidence The number of new cases of invasive breast cancer or DCIS
7a Invasive breast cancer incidence
7b Ductal carcinoma in situ incidence
8 Mortality The number of deaths from invasive breast cancer

BreastScreen Australia monitoring report 2011–2012 5
Overview Box 1: Aims and objectives of BreastScreen Australia Aims To ensure that the program is implemented in such a way that statistically significant reductions can be achieved in morbidity and mortality attributable to breast cancer. To maximise the early detection of breast cancer in the target population. To ensure that screening for breast cancer in Australia is provided in dedicated and accredited screening and assessment services as part of the BreastScreen Australia Program. To ensure equitable access for women aged 50−69 years to the program. To ensure that services are acceptable and appropriate to the needs of the eligible population. To achieve high standards of program management, service delivery, monitoring and evaluation, and accountability.
Objectives To achieve a 70 per cent participation rate in the BreastScreen Australia Program by women in the target group (50–69) and access to the program for women aged 40–49 years and 70–79 years. To rescreen all women in the program at two-yearly intervals. To achieve agreed performance outcomes which minimise recall rates, retake images, invasive procedures, ‘false negatives’ and ‘false positives’, and maximise the number of cancers detected, particularly the number of small cancers. To refer to appropriate treatment services and collect information about the outcome of treatment. To fund, through state coordination units, screening and assessment services which are accredited according to agreed National Accreditation Standards and to ensure that those standards are monitored and reviewed by appropriate national and state and territory accreditation committees. To recognise the real costs to women of participation in the program and to minimise those costs. This includes the provision of services at minimal or no charge, and free to eligible women who would not attend if there was a charge. To make information about mammographic screening and the BreastScreen Australia program available in a variety of easily comprehensible and appropriate forms, to women and health-care providers in particular. To achieve patterns of participation in the program which are representative of the socioeconomic, ethnic and cultural profiles of the target population. To provide services in accessible, non-threatening and comfortable environments by staff with appropriate expertise, experience and training. To provide appropriate service in that: the provision of counselling, education and information is an integral part of the program; sensitive procedures for notification of recall are in place; and the time between the initial screen and assessment is minimised. To achieve high levels of participation in the development and management of the program by members of significant professional and client groups. To collect and analyse data sufficient to monitor the implementation of the program, to evaluate its effectiveness and efficiency and to provide the basis for future policy and program development decisions. (BreastScreen Australia 2004)
6 BreastScreen Australia monitoring report 2011–2012
Accreditation standards The NAS were developed by the National Quality Management Committee for accreditation of individual BreastScreen services. The NAS represent minimum standards to measure a service’s performance against the aims and objectives of BreastScreen Australia (BreastScreen Australia 2004).
A number of NAS are consistent with the performance indicators in this report. For this reason, where appropriate, the data in this report are benchmarked against the NAS. These benchmarks are useful in helping to interpret the data presented, since the NAS were not designed to be used as standards for the BreastScreen Australia performance indicators.
In 2011, the Standing Committee on Screening approved a review of the BreastScreen Australia accreditation system. The aim of the review is to ensure BreastScreen Australia services continue to deliver safe, high quality breast screening services to women, while maximising the efficiency of the accreditation system. During the 2011-2012 reporting period, BreastScreen Australia services were accredited against the 2004 system.
See <www.cancerscreening.gov.au> for further information about BreastScreen Australia.
Data
Data sources The main sources of data for performance indicators are the state and territory BreastScreen registers. Analyses of these data allow monitoring of participation, rescreening, recall to assessment, detection of invasive breast cancer, detection of DCIS, and sensitivity (Indicators 1 to 6). Note that state and territory BreastScreen registers are ‘live’ registers. As such, the data in this report can be viewed as accurately describing the data held by the registers only at a particular moment in time, since any results or clinical information received by the BreastScreen registers after data are provided to the Australian Institute of Health and Welfare (AIHW) are unable to be captured in this report. Data in this report can be considered accurate as at December 2013.
Additional to these sources are the AIHW Australian Cancer Database, which is the source of breast cancer incidence data (Indicator 7a); the state and territory cancer registries, which are the source of DCIS incidence data (Indicator 7b); and the National Mortality Database, which is the source of breast cancer mortality data (Indicator 8). More detail on these data sources and classifications is provided in Appendix C.
Note that for each performance indicator, the latest available national data are used, which differ depending on both the data source and specifications of each performance indicator.
Aboriginal and Torres Strait Islander women Of the performance indicators that use state and territory BreastScreen register data to monitor BreastScreen Australia, only participation is disaggregated by Indigenous status.
Women who attend for a screening mammogram at a BreastScreen Australia service are asked to complete a form that includes personal and demographic details, as well as personal and family history of breast cancer. The form also contains a question on Indigenous status, where women can identify as being ‘Aboriginal’, ‘Torres Strait Islander’, ‘both Aboriginal and Torres Strait Islander’, or ‘neither Aboriginal nor Torres Strait Islander’.
BreastScreen Australia monitoring report 2011–2012 7
This information is recorded by the state and territory BreastScreen registers, with the responses aggregated into the categories of ‘Aboriginal and Torres Strait Islander’ and ‘non-Indigenous’, with a third ‘not stated’ category for women who choose not to answer this question.
Other performance indicators based on BreastScreen register data are not routinely disaggregated by Indigenous status due to concerns about stability and comparability of rates from small numbers. However, further data on Aboriginal and Torres Strait Islander women can be found in more detailed analyses of BreastScreen Australia performance indicators conducted to inform the BreastScreen Australia Evaluation (BreastScreen Australia EAC 2009b).
Reporting women with symptoms In principle, women who have symptoms that could indicate the presence of invasive breast cancer or DCIS (such as a lump, or clear or bloody discharge from the nipple) at the time of a breast cancer screen should be excluded from all performance indicators reported, since these women are more likely to have a breast cancer or DCIS detected by the screening process. However, the management policy of women with symptoms is not uniform across states and territories, with some women with symptoms screened. Therefore, in practice, data in this report include both symptomatic and asymptomatic women.
Terminology and concepts
Reporting periods This report presents monitoring data over 1-year, 2-year, 3-year and 5-year reporting periods:
• Participation data are presented over a 2-year reporting period in line with the recommended 2-year screening interval of BreastScreen Australia.
• Most other data are presented over a 1-year period, including rescreening, recall to assessment, detection of invasive breast cancer, detection of DCIS, and invasive breast cancer incidence and mortality.
• Sensitivity data are presented over a 3-year reporting period to improve stability and comparability of rates due to small numbers.
• A 5-year reporting period is used when invasive breast cancer incidence and mortality data are disaggregated into different population groups, again, to improve stability and comparability of rates due to small numbers.
Age groups Data are presented for women aged 50–69 who, as the target age group of BreastScreen Australia, are actively invited to participate in the program. Where appropriate, data are also presented for women aged 40–49 and 70 and over, who are also eligible to have free screening mammograms through BreastScreen Australia. More detailed data for these age groups can be accessed in the BreastScreen Australia monitoring report 2011–2012: supplementary data tables.
8 BreastScreen Australia monitoring report 2011–2012
Crude versus age-standardised This report presents crude and age-standardised rates. Crude is the ‘true’ proportion or rate, and is appropriate when a single year or reporting period is reported (for example, crude participation in 2011–2012 was 55.0%). However, comparisons over time, or across states/territories or population subgroups require that crude rates are age-standardised to remove the underlying differences in age structure over time or between groups. These allow analyses of trends and differentials, and are therefore preferentially reported in these situations (for example, participation in 2011–2012, age-standardised using the Australian population in 2001, was 54.6%).
Confidence intervals Confidence intervals are presented in this report only where it has been deemed important to show the degree of error due to rare events in small populations; this is done to avoid potential misinterpretation of data and/or to present data consistent with other publications. This includes breast cancer and DCIS detection, interval cancers, incidence of breast cancer and DCIS, and mortality from breast cancer.
Where shown, 95% confidence intervals can be used to determine if a statistically significant difference exists between compared values: where the confidence intervals do not overlap, the difference between rates is greater than that which could be explained by chance and is regarded as statistically significant. Because overlapping confidence intervals do not imply that the difference between two rates is definitely due to chance, it can be stated only that no statistically significant differences were found, and not that no differences exist.
Judgment should be exercised in deciding whether or not any differences shown are of clinical significance.
Overview Box 2: Symbols Symbols are used in this report at the commencement of each performance indicator to aid in interpretation of trends. Since many of the data in this report can go back for decades, only recent trends (generally the previous 3 years) are reflected by the symbol used in the trends box provided. Symbols used in the trends boxes represent one of the following.
A favourable recent trend
An unfavourable recent trend
No trend, or there is a trend present but it is neither favourable or unfavourable
BreastScreen Australia monitoring report 2011–2012 9
Section 2 Performance indicators
Indicator 1 Participation
What you need to know about participation Definition: The percentage of women aged 50–69 screened through BreastScreen Australia in a 2-year period.
Rationale: BreastScreen Australia aims to maximise the early detection of breast cancer in the target population, women aged 50–69. High attendance for screening by women in this age group maximises the reductions in mortality from breast cancer (BreastScreen Australia 2004). The NAS recommend that at least 70% of women aged 50–69 participate in screening in the most recent 24–month period (NAS 1.1.1) (BreastScreen Australia 2004).
Guide to interpretation: Participation is measured over 2 years to align with the recommended screening interval of BreastScreen Australia. Participation is based on the number of women screened, not the number of screening mammograms performed.
Data are presented for women aged 50–69 (the target age group), as well as for women aged 40–49 and 70 and over where appropriate. No attempt has been made to adjust the population for women who have previously had breast cancer and are therefore not eligible for breast cancer screening through BreastScreen Australia. It should be noted that states and territories have different policies on screening women who have previously been diagnosed with breast cancer.
The most recent participation data are for the 2011–2012 reporting period.
What the data tell us about participation
Trend Participation in BreastScreen Australia ranged between 55% and 57% for most years from 1996–1997 (when reporting began) to 2011–2012, and has remained steady at 55% since 2007–2008.
The recent trend is therefore one of no substantive change.
2011–2012 In 2011–2012, a total of 1,779,524 women participated in BreastScreen Australia, of whom 1,407,065 were aged 50–69. This is 55.0% of women in the target age group which, when age-standardised to allow analyses of trends, equates to a participation rate of 54.6%. Participation in BreastScreen Australia by Aboriginal and Torres Strait Islander women was lower with only 37.8% participating, compared to the 54.4% of non-Indigenous women.

10 BreastScreen Australia monitoring report 2011–2012
Detailed analyses
Participation in 2011–2012 In 2011–2012, 1,779,524 women participated in BreastScreen Australia (that is, they had at least one screening mammogram over the 2 years), of whom 1,407,065 were aged 50–69. These 1,407,065 women represent 55.0% of those aged 50–69 in the population which, when age-standardised to allow analysis of trends and differentials, equates to a participation rate of 54.6%.
Although the NAS for participation has not been met at the national level (NAS 1.1.1 being that at least 70% of women aged 50–69 participate in screening in the most recent 24–month period), a reduction in breast cancer mortality has been observed with the current participation rate of around 55%.
Participation trends Table 1.1 shows the trend in participation nationally, from 1996–1997 (when reporting began) to 2011–2012.
Table 1.1: Number and age-standardised rate of women aged 50–69 participating in BreastScreen Australia, 1996–1997 to 2011–2012
Reporting period Participants(a) Population(b) AS rate(c)
1996–1997 845,143 1,645,331 51.5
1997–1998 927,735 1,700,951 54.6
1998–1999 976,182 1,754,254 55.7
1999–2000 1,012,184 1,809,735 55.9
2000–2001 1,064,246 1,868,832 57.0
2001–2002 1,102,642 1,928,878 57.1
2002–2003 1,118,823 1,989,802 56.2
2003–2004 1,145,008 2,051,480 55.7
2004–2005 1,188,955 2,114,036 56.1
2005–2006 1,242,210 2,177,660 56.9
2006–2007 1,262,334 2,242,133 56.1
2007–2008 1,273,317 2,308,680 54.9
2008–2009 1,319,771 2,376,559 55.2
2009–2010 1,352,112 2,444,680 55.0
2010–2011 1,373,731 2,497,963 54.6
2011–2012 1,407,065 2,557,284 54.6
(a) Participants are the number of women screened through BreastScreen Australia in each 2-year reporting period. The screening periods cover 1 January of the first year to 31 December of the second year for each period.
(b) Population is the average of the Australian Bureau of Statistics (ABS) estimated resident population for women aged 50–69 for the 2 reporting years.
(c) Age-standardised (AS) rate is the number of women aged 50–69 screened in each 2-year reporting period as a percentage of the ABS estimated resident population for women aged 50–69, age-standardised to the Australian population at 30 June 2001.
Source: AIHW analysis of BreastScreen Australia data.
BreastScreen Australia monitoring report 2011–2012 11
The age-standardised rate of participation for women aged 50–69 was 51.5% in 1996–1997 when reporting began. This increased to a peak of 57.1% in 2001–2002 and thereafter remained steady at between 55 and 57% before decreasing slightly to around 55% from 2007–2008. In 2011–2012, the age-standardised rate of participation was 54.6% (Table 1.1).
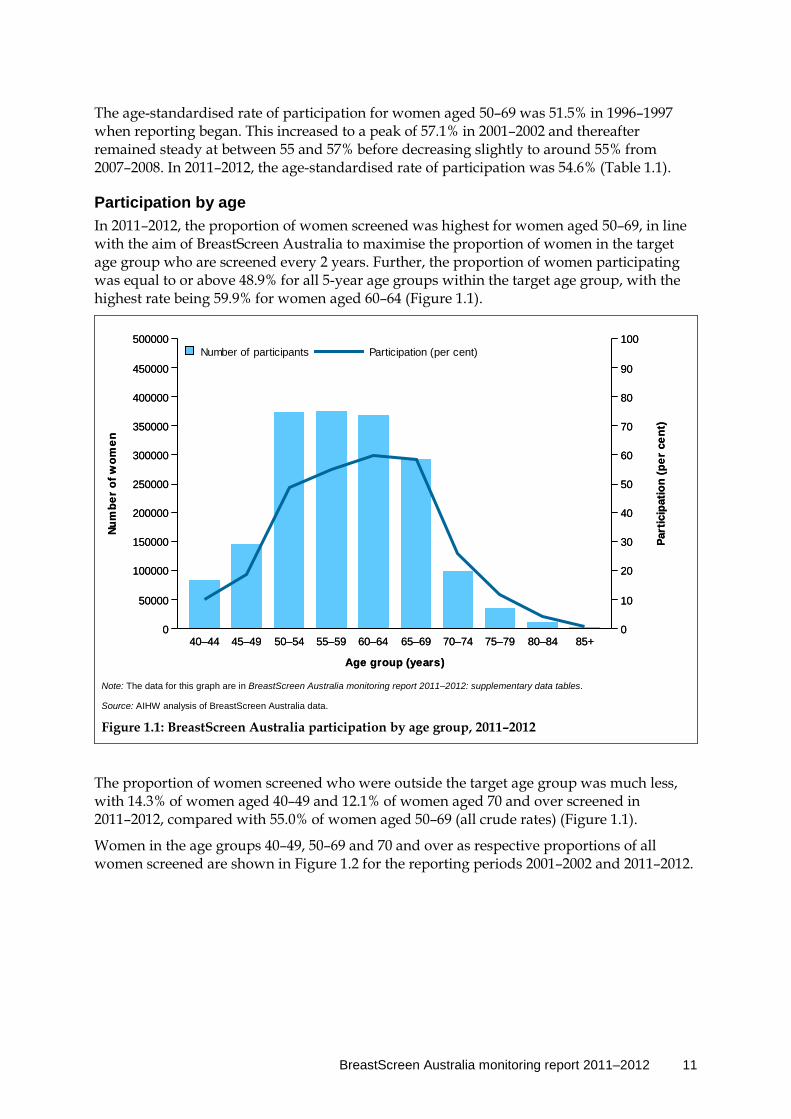
Participation by age In 2011–2012, the proportion of women screened was highest for women aged 50–69, in line with the aim of BreastScreen Australia to maximise the proportion of women in the target age group who are screened every 2 years. Further, the proportion of women participating was equal to or above 48.9% for all 5-year age groups within the target age group, with the highest rate being 59.9% for women aged 60–64 (Figure 1.1).
Note: The data for this graph are in BreastScreen Australia monitoring report 2011–2012: supplementary data tables.
Source: AIHW analysis of BreastScreen Australia data.
Figure 1.1: BreastScreen Australia participation by age group, 2011–2012
The proportion of women screened who were outside the target age group was much less, with 14.3% of women aged 40–49 and 12.1% of women aged 70 and over screened in 2011–2012, compared with 55.0% of women aged 50–69 (all crude rates) (Figure 1.1).
Women in the age groups 40–49, 50–69 and 70 and over as respective proportions of all women screened are shown in Figure 1.2 for the reporting periods 2001–2002 and 2011–2012.
40–44 45–49 50–54 55–59 60–64 65–69 70–74 75–79 80–84 85+
Age group (years)
0
50000
100000
150000
200000
250000
300000
350000
400000
450000
500000
Num
ber
of w
omen
0
10
20
30
40
50
60
70
80
90
100
Part
icip
atio
n (p
er c
ent)
Participation (per cent)Number of participants
40–44 45–49 50–54 55–59 60–64 65–69 70–74 75–79 80–84 85+
Age group (years)
0
50000
100000
150000
200000
250000
300000
350000
400000
450000
500000
Num
ber
of w
omen
0
10
20
30
40
50
60
70
80
90
100
Part
icip
atio
n (p
er c
ent)
Participation (per cent)Number of participants
12 BreastScreen Australia monitoring report 2011–2012
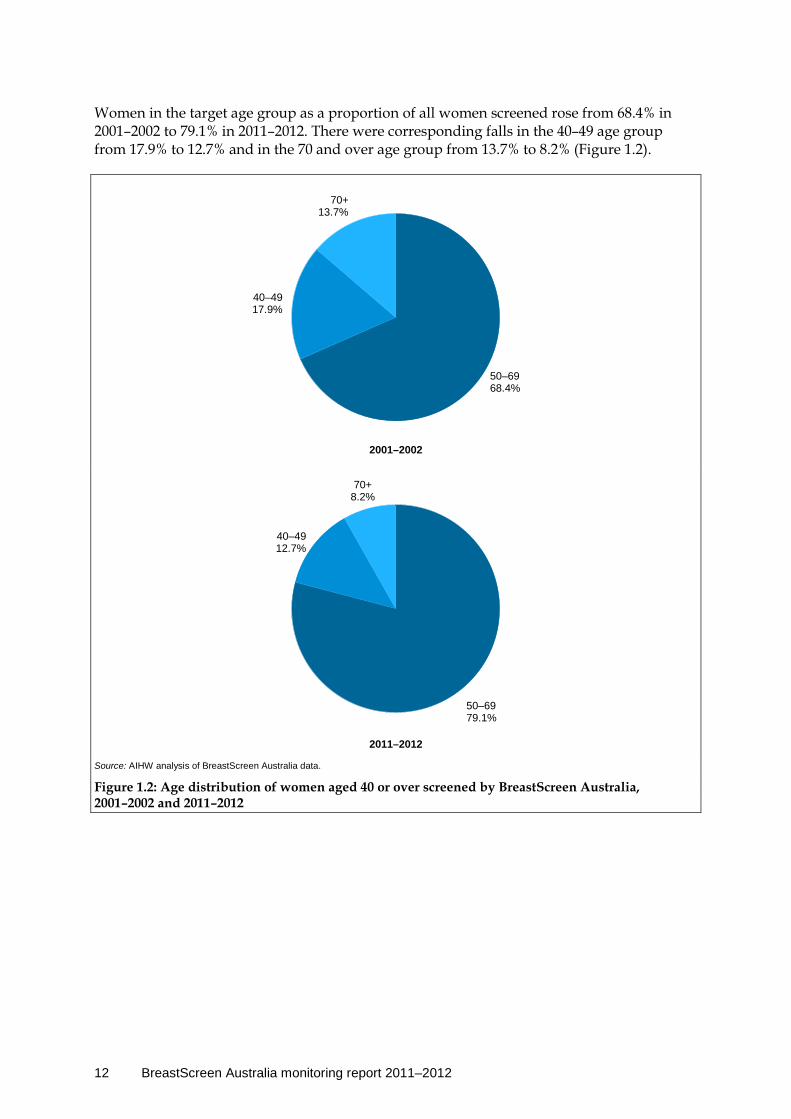
Women in the target age group as a proportion of all women screened rose from 68.4% in 2001–2002 to 79.1% in 2011–2012. There were corresponding falls in the 40–49 age group from 17.9% to 12.7% and in the 70 and over age group from 13.7% to 8.2% (Figure 1.2).
Source: AIHW analysis of BreastScreen Australia data.
Figure 1.2: Age distribution of women aged 40 or over screened by BreastScreen Australia, 2001–2002 and 2011–2012
50–6968.4%
40–4917.9%
70+13.7%
50–6979.1%
40–4912.7%
70+8.2%
2001–2002
2011–2012

BreastScreen Australia monitoring report 2011–2012 13
Participation by state and territory In 2011–2012, participation across all states and territories was within 12.6 percentage points of the national average of 54.6%, ranging from 42.0% to 58.8% (Table 1.2; Figure 1.3).
Table 1.2: BreastScreen Australia participation by state and territory, women aged 50–69, 2011–2012
NSW Vic Qld WA SA Tas ACT NT Australia
Number 429,711 345,070 292,571 151,324 119,706 38,887 21,338 8,458 1,407,065
AS rate 51.0 54.5 57.4 57.9 58.8 57.8 53.4 42.0 54.6
Notes 1. Participants are the number of women screened through BreastScreen Australia in each 2-year reporting period. Period covers 1 January
2011 to 31 December 2012. 2. Rates are the number of women screened as a percentage of the eligible female population, calculated as the average of the ABS’s
estimated resident population and age-standardised to the Australian population at 30 June 2001. 3. Direct comparisons between the states and territories of Australia are not advised due to the substantial differences that exist between the
jurisdictions including population size and composition, geographic size and structure, policies and other factors.
Source: AIHW analysis of BreastScreen Australia data.
Source: AIHW analysis of BreastScreen Australia data.
Figure 1.3: BreastScreen Australia participation by state and territory, women aged 50–69, 2011–2012
0
10
20
30
40
50
60
70
80
90
100
State/Territory
NSW Vic Qld WA SA Tas ACT NT Australia
Participation (per cent)
14 BreastScreen Australia monitoring report 2011–2012
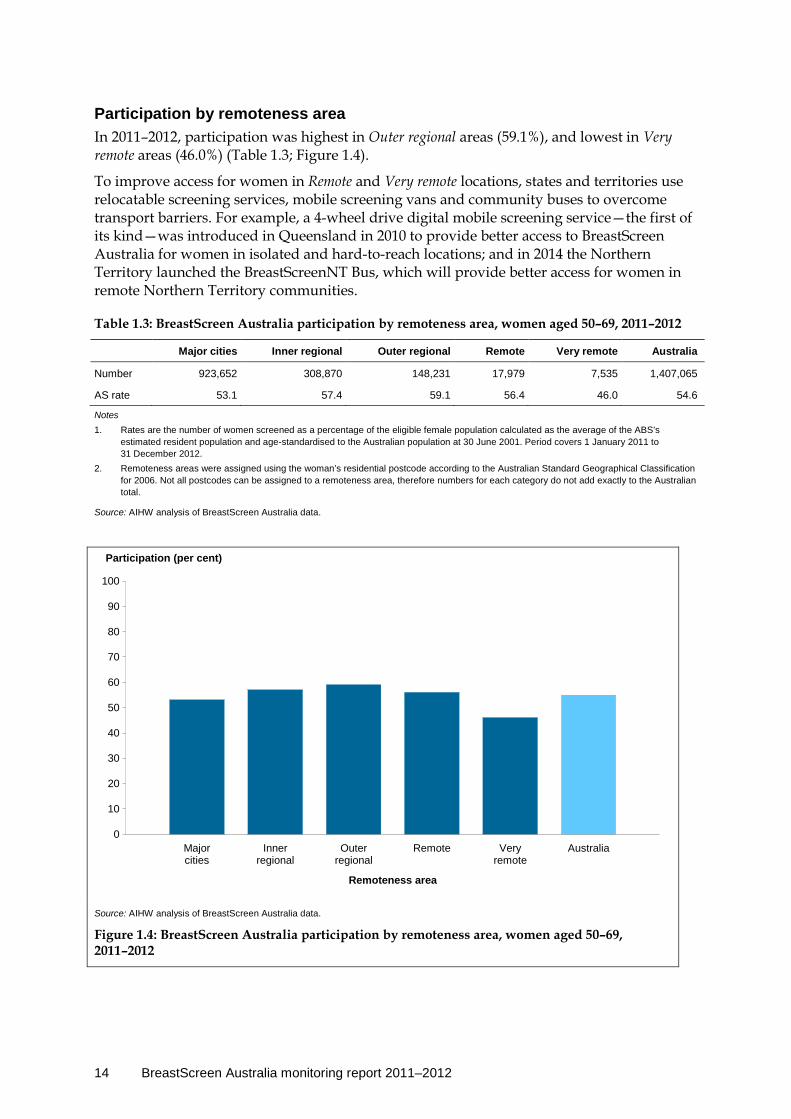
Participation by remoteness area In 2011–2012, participation was highest in Outer regional areas (59.1%), and lowest in Very remote areas (46.0%) (Table 1.3; Figure 1.4).
To improve access for women in Remote and Very remote locations, states and territories use relocatable screening services, mobile screening vans and community buses to overcome transport barriers. For example, a 4-wheel drive digital mobile screening service—the first of its kind—was introduced in Queensland in 2010 to provide better access to BreastScreen Australia for women in isolated and hard-to-reach locations; and in 2014 the Northern Territory launched the BreastScreenNT Bus, which will provide better access for women in remote Northern Territory communities.
Table 1.3: BreastScreen Australia participation by remoteness area, women aged 50–69, 2011–2012
Major cities Inner regional Outer regional Remote Very remote Australia
Number 923,652 308,870 148,231 17,979 7,535 1,407,065
AS rate 53.1 57.4 59.1 56.4 46.0 54.6
Notes 1. Rates are the number of women screened as a percentage of the eligible female population calculated as the average of the ABS’s
estimated resident population and age-standardised to the Australian population at 30 June 2001. Period covers 1 January 2011 to 31 December 2012.
2. Remoteness areas were assigned using the woman’s residential postcode according to the Australian Standard Geographical Classification for 2006. Not all postcodes can be assigned to a remoteness area, therefore numbers for each category do not add exactly to the Australian total.
Source: AIHW analysis of BreastScreen Australia data.
Source: AIHW analysis of BreastScreen Australia data.
Figure 1.4: BreastScreen Australia participation by remoteness area, women aged 50–69, 2011–2012
0
10
20
30
40
50
60
70
80
90
100
Remoteness area
Majorcities
Innerregional
Outerregional
Remote Veryremote
Australia
Participation (per cent)

BreastScreen Australia monitoring report 2011–2012 15
Participation by socioeconomic status There was little variation in participation across socioeconomic groups, with all groups having participation rates between 52.7% and 55.8% (Table 1.4; Figure 1.5).
Table 1.4: BreastScreen Australia participation by socioeconomic status, women aged 50–69, 2011–2012
1 (lowest) 2 3 4 5 (highest) Australia
Number 278,000 291,765 277,348 275,153 281,536 1,407,065
AS rate 52.7 55.8 54.5 55.0 54.3 54.6
Notes 1. Rates are the number of women screened as a percentage of the eligible female population calculated as the average of the ABS’s
estimated resident population and age-standardised to the Australian population at 30 June 2001. Period covers 1 January 2011 to 31 December 2012.
2. Socioeconomic status was assigned using the woman’s residential postcode according to the Socioeconomic Index for Areas (SEIFA) Index of Relative Socioeconomic Disadvantage for 2006; 1 (lowest socioeconomic group) corresponds to the most disadvantaged socioeconomic status and 5 (highest socioeconomic group) to the least disadvantaged socioeconomic status. Not all postcodes could be assigned to a socioeconomic category, therefore numbers for each category do not add exactly to the Australian total.
Source: AIHW analysis of BreastScreen Australia data.
Source: AIHW analysis of BreastScreen Australia data.
Figure 1.5: BreastScreen Australia participation by socioeconomic status, women aged 50–69, 2011–2012
0
10
20
30
40
50
60
70
80
90
100
Socioeconomic status
1(lowest)
2 3 4 5(highest)
Australia
Participation (per cent)
16 BreastScreen Australia monitoring report 2011–2012
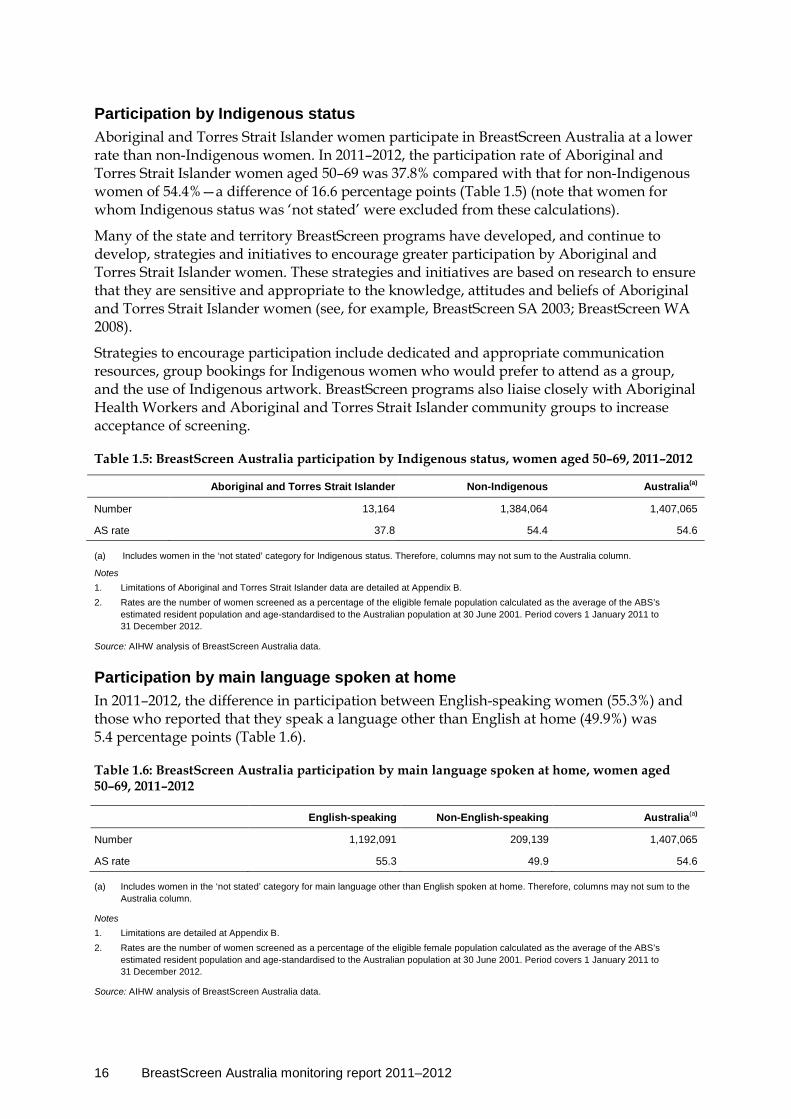
Participation by Indigenous status Aboriginal and Torres Strait Islander women participate in BreastScreen Australia at a lower rate than non-Indigenous women. In 2011–2012, the participation rate of Aboriginal and Torres Strait Islander women aged 50–69 was 37.8% compared with that for non-Indigenous women of 54.4%—a difference of 16.6 percentage points (Table 1.5) (note that women for whom Indigenous status was ‘not stated’ were excluded from these calculations).
Many of the state and territory BreastScreen programs have developed, and continue to develop, strategies and initiatives to encourage greater participation by Aboriginal and Torres Strait Islander women. These strategies and initiatives are based on research to ensure that they are sensitive and appropriate to the knowledge, attitudes and beliefs of Aboriginal and Torres Strait Islander women (see, for example, BreastScreen SA 2003; BreastScreen WA 2008).
Strategies to encourage participation include dedicated and appropriate communication resources, group bookings for Indigenous women who would prefer to attend as a group, and the use of Indigenous artwork. BreastScreen programs also liaise closely with Aboriginal Health Workers and Aboriginal and Torres Strait Islander community groups to increase acceptance of screening.
Table 1.5: BreastScreen Australia participation by Indigenous status, women aged 50–69, 2011–2012
(a) Includes women in the ‘not stated’ category for Indigenous status. Therefore, columns may not sum to the Australia column.
Notes 1. Limitations of Aboriginal and Torres Strait Islander data are detailed at Appendix B. 2. Rates are the number of women screened as a percentage of the eligible female population calculated as the average of the ABS’s
estimated resident population and age-standardised to the Australian population at 30 June 2001. Period covers 1 January 2011 to 31 December 2012.
Source: AIHW analysis of BreastScreen Australia data.
Participation by main language spoken at home In 2011–2012, the difference in participation between English-speaking women (55.3%) and those who reported that they speak a language other than English at home (49.9%) was 5.4 percentage points (Table 1.6).
Table 1.6: BreastScreen Australia participation by main language spoken at home, women aged 50–69, 2011–2012
(a) Includes women in the ‘not stated’ category for main language other than English spoken at home. Therefore, columns may not sum to the Australia column.
Notes 1. Limitations are detailed at Appendix B. 2. Rates are the number of women screened as a percentage of the eligible female population calculated as the average of the ABS’s
estimated resident population and age-standardised to the Australian population at 30 June 2001. Period covers 1 January 2011 to 31 December 2012.
Source: AIHW analysis of BreastScreen Australia data.
Aboriginal and Torres Strait Islander Non-Indigenous Australia(a)
Number 13,164 1,384,064 1,407,065
AS rate 37.8 54.4 54.6
English-speaking Non-English-speaking Australia(a)
Number 1,192,091 209,139 1,407,065
AS rate 55.3 49.9 54.6
BreastScreen Australia monitoring report 2011–2012 17
Indicator 2 Rescreening
What you need to know about rescreening Definition: The proportion of women screened in a given year, whose screening outcome was a recommendation to return for screening in 2 years, and who returned for a screen within 27 months.
Rationale: A high rescreen rate is important to increase the likelihood of breast cancers being detected early and to maintain overall participation. The NAS for rescreening require that at least 75% of women aged 50–67 who attend for their first screen are rescreened within 27 months (NAS 1.2.1). The NAS also recommend that at least 90% of women aged 50–67 who attend for their second and subsequent screens are rescreened within 27 months (NAS 1.2.2) (BreastScreen Australia 2004).
Guide to interpretation: The screening interval of 27 months is used instead of the recommended screening interval of 2 years to allow for potential delays in screening availability and data transfer.
Note that although the BreastScreen Australia target age group is 50–69, only women aged 50–67 are reported for the rescreen rate because women aged 68–69 in the index year will be outside the target age group 27 months after their index screen.
The denominator (the number of women screened in each index year) has not been adjusted to remove women who died or developed an interval cancer after their screen in the index year and therefore would not go on to rescreen.
The most recent rescreening data are for women screened in the index year 2010. This small lag in data availability is because 27 months needs to have passed since a woman’s last screen to know whether or not she has rescreened within this interval.
What the data tell us about rescreening
Trend Rescreen rates fell slightly between 2009 and 2010, from 59.4% to 58.3% after the first screening round and from 69.8% to 67.8% after the second screening round. For the same period, there was a small increase from 82.3% to 82.8% after the third and subsequent screening rounds.
The recent trend is therefore one of no substantive change, with very little difference between rescreening after a screen in 2009 compared with rescreening after a screen in 2010, regardless of the screening round.
Women rescreening after a screen in 2010 The proportion of women aged 50–67 who screened in 2010 and rescreened within 27 months ranged from 58.3% after the first screening round to 67.8% after the second screening round, and to 82.8% after the third and subsequent screening rounds.

18 BreastScreen Australia monitoring report 2011–2012
More information about rescreening The rescreening indicator measures the proportion of women who return for screening at a BreastScreen service within the recommended interval. The interval between screens is an important factor influencing the level of cancer detection. BreastScreen Australia national policy states that women should be screened every 2 years. It has been shown that screening intervals longer than 2 years reduce mortality benefits from screening and result in an increase in interval cancers (BreastScreen Australia 2004). This is because increased time between screening may allow a tumour to grow to the point where symptoms become evident, thus eliminating the advantage of screening.
Box 2.1: Screening round terminology The first screening round is a woman’s first visit to a BreastScreen service; the second screening round is a woman’s second visit to a service (that is, has been screened once before); a subsequent screening round is any visit to a service after a first visit. The term third and subsequent screening rounds includes both the woman’s third screening round and all screening rounds thereafter.
Detailed analyses
Rescreening after a screen in 2010 The proportion of women aged 50–67 who returned for a rescreen within 27 months increased with the number of screens previously attended (see Box 2.1; Figure 2.1).
Note: Rates are the number of women rescreening within 27 months as a percentage of women screened and age-standardised to the population of women attending a BreastScreen service in 2008.
Source: AIHW analysis of BreastScreen Australia data.
Figure 2.1: Rescreening by screening round, women aged 50–67 screened during 2010
0
10
20
30
40
50
60
70
80
90
100
Screening round
First Second Third and subsequent
Per cent of women rescreening within 27 months
BreastScreen Australia monitoring report 2011–2012 19
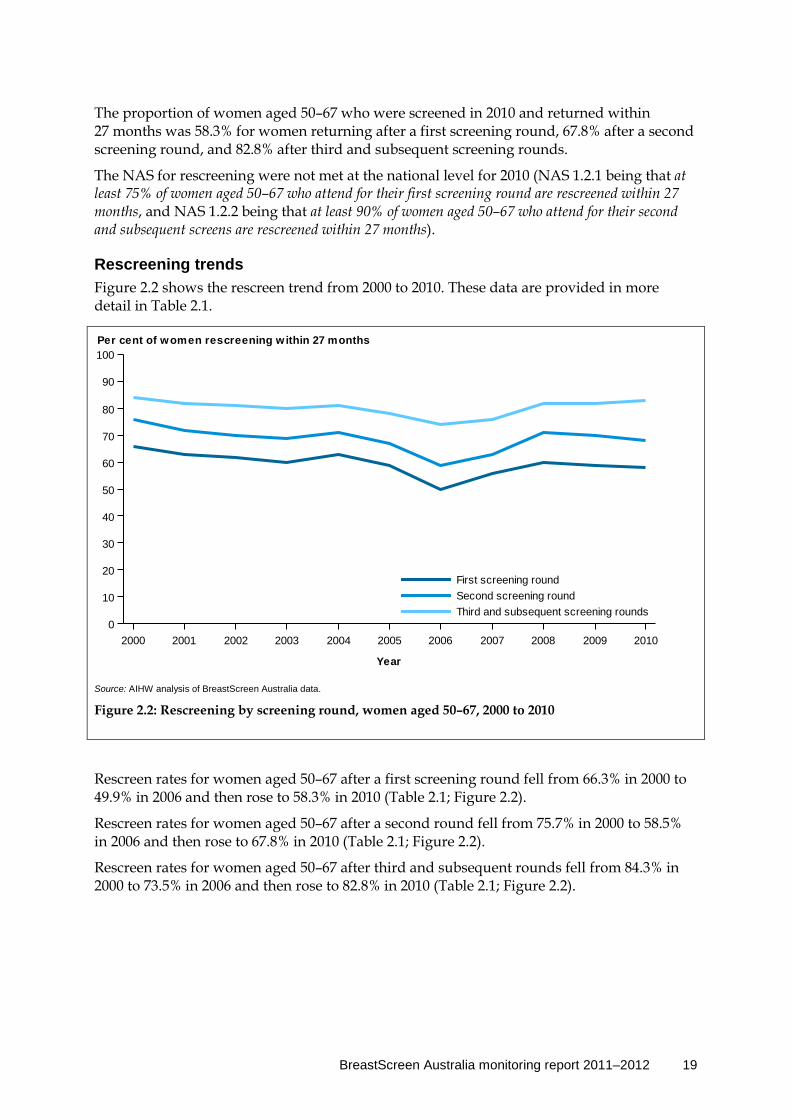
The proportion of women aged 50–67 who were screened in 2010 and returned within 27 months was 58.3% for women returning after a first screening round, 67.8% after a second screening round, and 82.8% after third and subsequent screening rounds.
The NAS for rescreening were not met at the national level for 2010 (NAS 1.2.1 being that at least 75% of women aged 50–67 who attend for their first screening round are rescreened within 27 months, and NAS 1.2.2 being that at least 90% of women aged 50–67 who attend for their second and subsequent screens are rescreened within 27 months).
Rescreening trends Figure 2.2 shows the rescreen trend from 2000 to 2010. These data are provided in more detail in Table 2.1.
Rescreen rates for women aged 50–67 after a first screening round fell from 66.3% in 2000 to 49.9% in 2006 and then rose to 58.3% in 2010 (Table 2.1; Figure 2.2).
Rescreen rates for women aged 50–67 after a second round fell from 75.7% in 2000 to 58.5% in 2006 and then rose to 67.8% in 2010 (Table 2.1; Figure 2.2).
Rescreen rates for women aged 50–67 after third and subsequent rounds fell from 84.3% in 2000 to 73.5% in 2006 and then rose to 82.8% in 2010 (Table 2.1; Figure 2.2).
Source: AIHW analysis of BreastScreen Australia data.
Figure 2.2: Rescreening by screening round, women aged 50–67, 2000 to 2010
2000 2001 2002 2003 2004 2005 2006 2007 2008 2009 2010
Year
0
10
20
30
40
50
60
70
80
90
100
Third and subsequent screening roundsSecond screening roundFirst screening round
Per cent of women rescreening within 27 months
20 BreastScreen Australia monitoring report 2011–2012
Table 2.1: Rescreening by screening round, women aged 50–67, 2000 to 2010
2000 2001 2002 2003 2004 2005 2006 2007 2008 2009 2010
First screening round
AS rate 66.3 62.8 61.5 60.4 62.7 59.3 49.9 55.9 59.9 59.4 58.3
Second screening round
AS rate 75.7 71.9 70.2 69.3 70.5 66.8 58.5 62.6 71.2 69.8 67.8
Third and subsequent screening rounds
AS rate 84.3 81.9 80.8 80.2 81.0 78.4 73.5 76.1 81.6 82.3 82.8
Note: Rates are the number of women rescreened within 27 months as a percentage of women screened, age-standardised to the population of women attending a BreastScreen Australia service in 2008.
Source: AIHW analysis of BreastScreen Australia data.
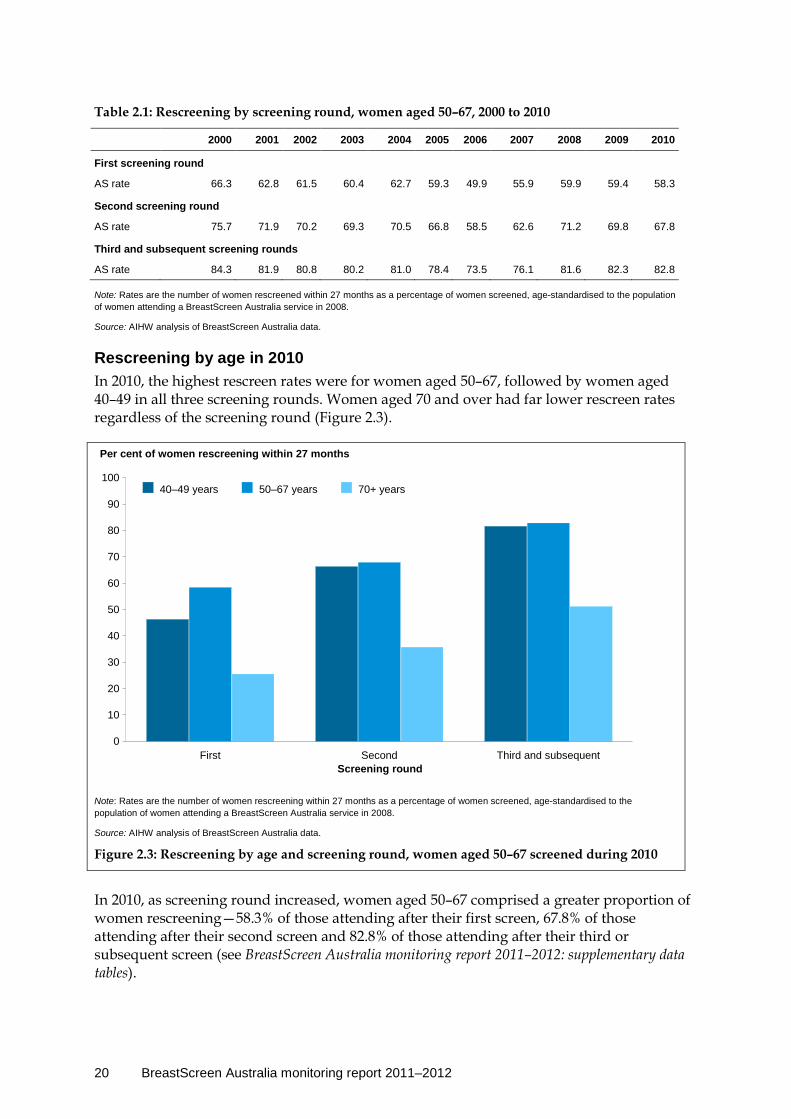
Rescreening by age in 2010 In 2010, the highest rescreen rates were for women aged 50–67, followed by women aged 40–49 in all three screening rounds. Women aged 70 and over had far lower rescreen rates regardless of the screening round (Figure 2.3).
Note: Rates are the number of women rescreening within 27 months as a percentage of women screened, age-standardised to the population of women attending a BreastScreen Australia service in 2008.
Source: AIHW analysis of BreastScreen Australia data.
Figure 2.3: Rescreening by age and screening round, women aged 50–67 screened during 2010
In 2010, as screening round increased, women aged 50–67 comprised a greater proportion of women rescreening—58.3% of those attending after their first screen, 67.8% of those attending after their second screen and 82.8% of those attending after their third or subsequent screen (see BreastScreen Australia monitoring report 2011–2012: supplementary data tables).
40–49 years 50–67 years 70+ years
0
10
20
30
40
50
60
70
80
90
100
First Second Third and subsequent
Per cent of women rescreening within 27 months
Screening round
BreastScreen Australia monitoring report 2011–2012 21
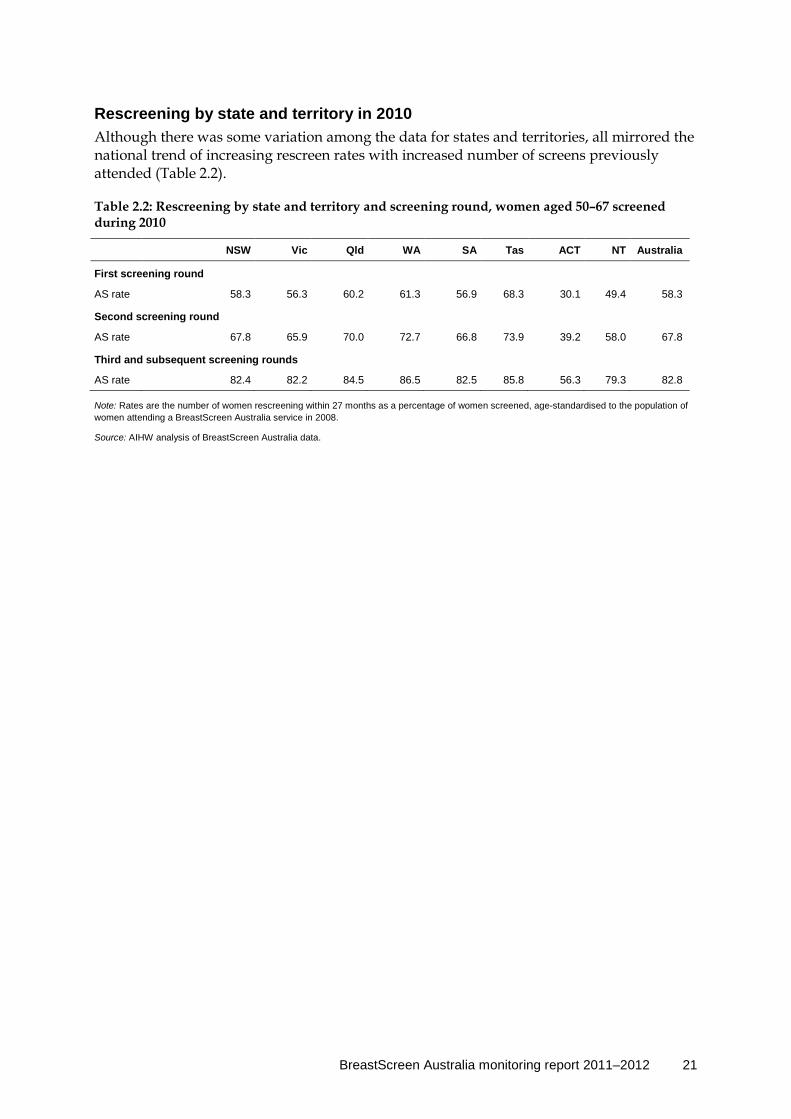
Rescreening by state and territory in 2010 Although there was some variation among the data for states and territories, all mirrored the national trend of increasing rescreen rates with increased number of screens previously attended (Table 2.2).
Table 2.2: Rescreening by state and territory and screening round, women aged 50–67 screened during 2010
NSW Vic Qld WA SA Tas ACT NT Australia
First screening round
AS rate 58.3 56.3 60.2 61.3 56.9 68.3 30.1 49.4 58.3
Second screening round
AS rate 67.8 65.9 70.0 72.7 66.8 73.9 39.2 58.0 67.8
Third and subsequent screening rounds
AS rate 82.4 82.2 84.5 86.5 82.5 85.8 56.3 79.3 82.8
Note: Rates are the number of women rescreening within 27 months as a percentage of women screened, age-standardised to the population of women attending a BreastScreen Australia service in 2008.
Source: AIHW analysis of BreastScreen Australia data.

22 BreastScreen Australia monitoring report 2011–2012
Indicator 3 Recall to assessment
What you need to know about recall to assessment Definition: The proportion of women screened in a given year who are recalled for assessment.
Rationale: Women are recalled to assessment for further investigation if their screening mammogram is found to be suspicious for breast cancer. BreastScreen Australia aims to maximise the number of cancers detected while minimising the number of unnecessary investigations. Recall to assessment can cause anxiety as a result of uncertainty and the requirement to undergo additional procedures. The NAS recommend that less than 10% of women aged 50–69 who attend for their first screen are recalled for assessment (NAS 2.6.1), and that less than 5% of women aged 50–69 who attend for their second or subsequent screen are recalled for assessment (NAS 2.6.2) (BreastScreen Australia 2004).
Guide to interpretation: Recall to assessment is disaggregated into first and subsequent screening rounds because a woman is more likely to be recalled to assessment the first time she visits a BreastScreen service than at subsequent visits. This is for two reasons: firstly, a woman is more likely to have an invasive breast cancer detected on her first visit; secondly, with no previous images with which to compare her first screening mammography images, it is more difficult to distinguish between what is normal and what might be suspicious (BreastScreen WA 2008).
Changes to recall to assessment rates should be considered alongside corresponding invasive cancer detection rates, as a higher recall to assessment rate may be considered acceptable if it leads to higher breast cancer detection rates.
The most recent recall to assessment data are for women screened in 2012.
What the data tell us about recall to assessment
Trend After a small but steady rise from 6% to 11% between 1996 and 2009, recall to assessment for the first screening round has remained stable at around 11% from 2009 to 2012. Recall to assessment for subsequent screening rounds, after remaining steady at 4% for most years from 1996 to 2011, has fallen slightly to 3% for women screening in 2012.
The recent trend is therefore one of no substantive change for the first screening round, and a small decrease of indeterminate consequence for subsequent screening rounds.
Women screened in 2012 For women aged 50–69, 10.8% of women screened for the first time were recalled to assessment, while 3.4%of women who attended subsequent screens were recalled.
BreastScreen Australia monitoring report 2011–2012 23
More information on recall to assessment A woman is recalled to assessment for mammographic reasons if her screening mammography images are found to be suspicious for breast cancer.
Assessment of women recalled involves further investigation by a multidisciplinary team at an assessment centre. This may include clinical examination, additional mammography, ultrasound and, if required, a biopsy. Most women recalled to assessment are found not to have breast cancer (BreastScreen SA 2010).
Detailed analyses
Recall to assessment after a screen in 2012 In 2012, of the 78,072 women aged 50–69 attending their first screen, 8,395 (10.8%) were recalled to assessment (also 10.8% when age-standardised). The NAS for recall to assessment for women who attend for their first screen was not met at the national level for 2012 (NAS 2.6.1 being that less than 10% of women aged 50–69 who attend for their first screen are recalled for assessment).
Of the 663,426 women aged 50–69 attending a subsequent screen in 2012, 22,406 (3.4%) were recalled to assessment (also 3.4% when age-standardised). These rates are well within the NAS for women attending a subsequent screen (NAS 2.6.2 being that less than 5% of women aged 50–69 who attend for their second or subsequent screen are recalled for assessment).
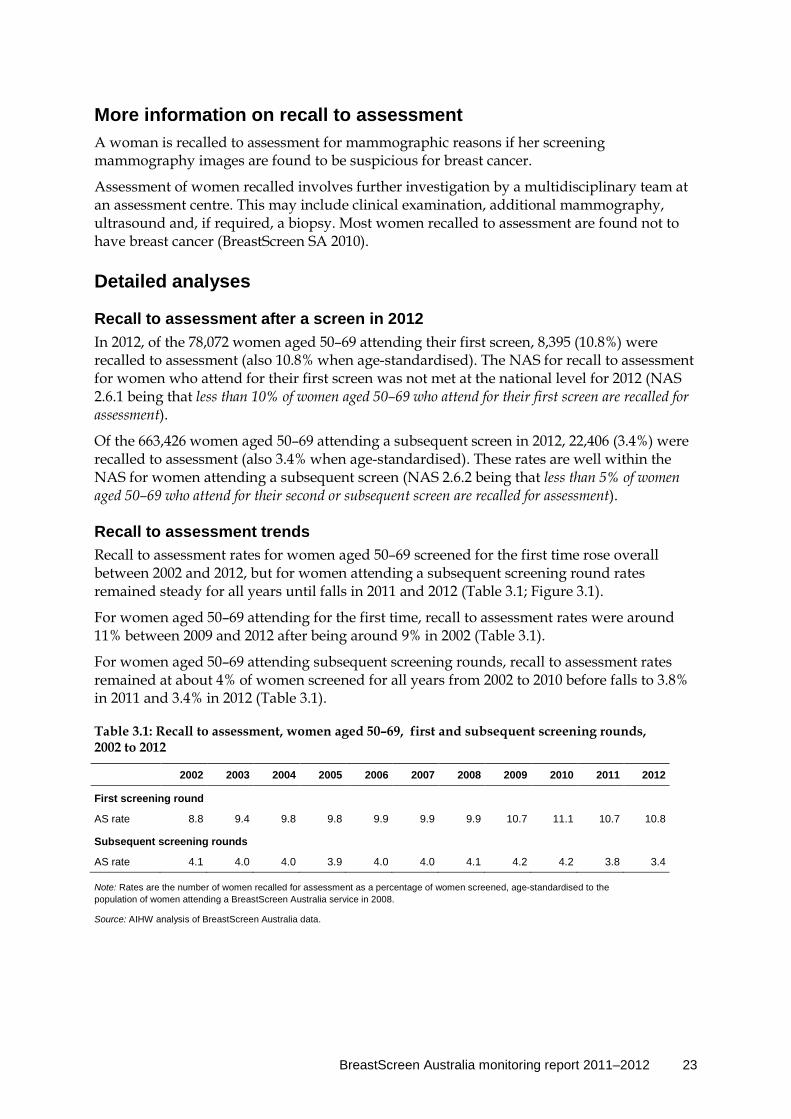
Recall to assessment trends Recall to assessment rates for women aged 50–69 screened for the first time rose overall between 2002 and 2012, but for women attending a subsequent screening round rates remained steady for all years until falls in 2011 and 2012 (Table 3.1; Figure 3.1).
For women aged 50–69 attending for the first time, recall to assessment rates were around 11% between 2009 and 2012 after being around 9% in 2002 (Table 3.1).
For women aged 50–69 attending subsequent screening rounds, recall to assessment rates remained at about 4% of women screened for all years from 2002 to 2010 before falls to 3.8% in 2011 and 3.4% in 2012 (Table 3.1).
Table 3.1: Recall to assessment, women aged 50–69, first and subsequent screening rounds, 2002 to 2012
2002 2003 2004 2005 2006 2007 2008 2009 2010 2011 2012
First screening round
AS rate 8.8 9.4 9.8 9.8 9.9 9.9 9.9 10.7 11.1 10.7 10.8
Subsequent screening rounds
AS rate 4.1 4.0 4.0 3.9 4.0 4.0 4.1 4.2 4.2 3.8 3.4
Note: Rates are the number of women recalled for assessment as a percentage of women screened, age-standardised to the population of women attending a BreastScreen Australia service in 2008.
Source: AIHW analysis of BreastScreen Australia data.
24 BreastScreen Australia monitoring report 2011–2012
Source: AIHW analysis of BreastScreen Australia data.
Figure 3.1: Recall to assessment, women aged 50–69, first and subsequent screening rounds, 1996 to 2012
Recall to assessment by age
Source: AIHW analysis of BreastScreen Australia data.
Figure 3.2: Recall to assessment by age, first and subsequent screening rounds, 2012
1996 1997 1998 1999 2000 2001 2002 2003 2004 2005 2006 2007 2008 2009 2010 2011 2012
Year
0
5
10
15
20Subsequent screening roundsFirst screening round
Recall to assessment (per cent)
40–44 45–49 50–54 55–59 60–64 65–69 70+
Age group (years)
0
5
10
15
20Subsequent screening roundsFirst screening round
Recall to assessment (per cent)
BreastScreen Australia monitoring report 2011–2012 25
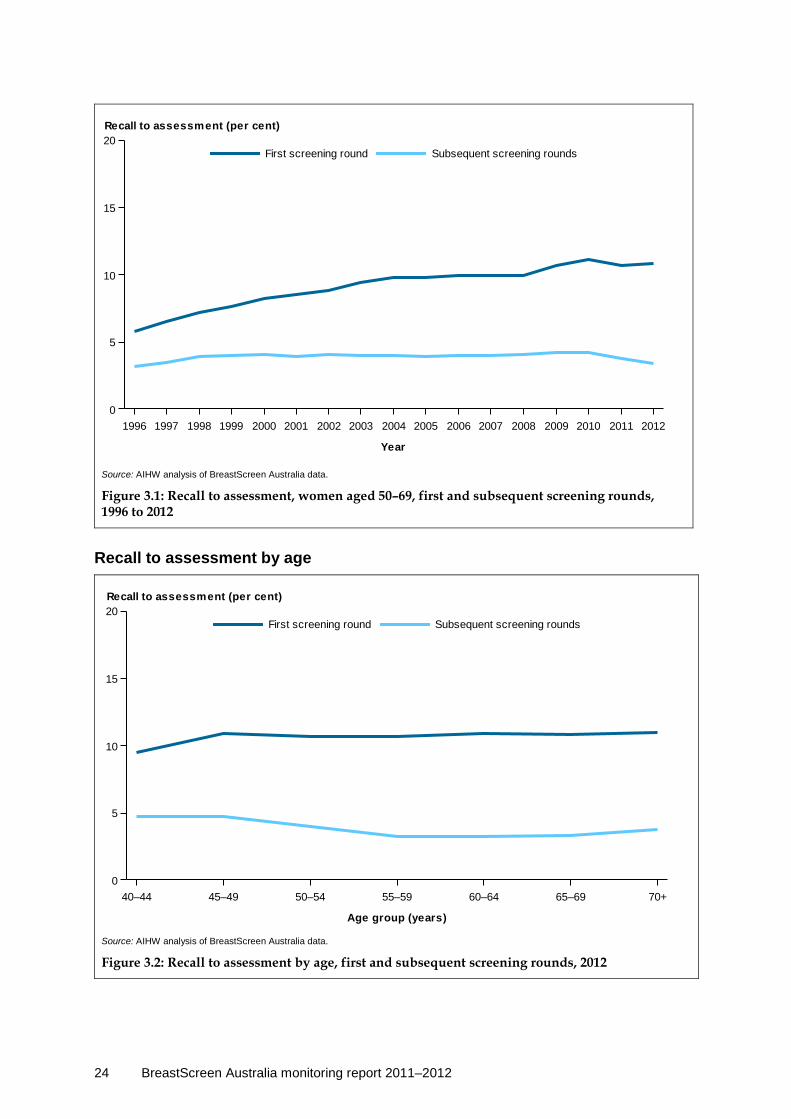
In 2012, recall to assessment rates for the first screening round were highest for women aged 70 and over at 11.0% and lowest for women aged 40–44 at 9.5%. In subsequent screening rounds, recall to assessment rates were highest for women aged 40–44 and 45–49 at 4.7% and lowest for women aged 55–59 and 60–64 at 3.2% (Figure 3.2).
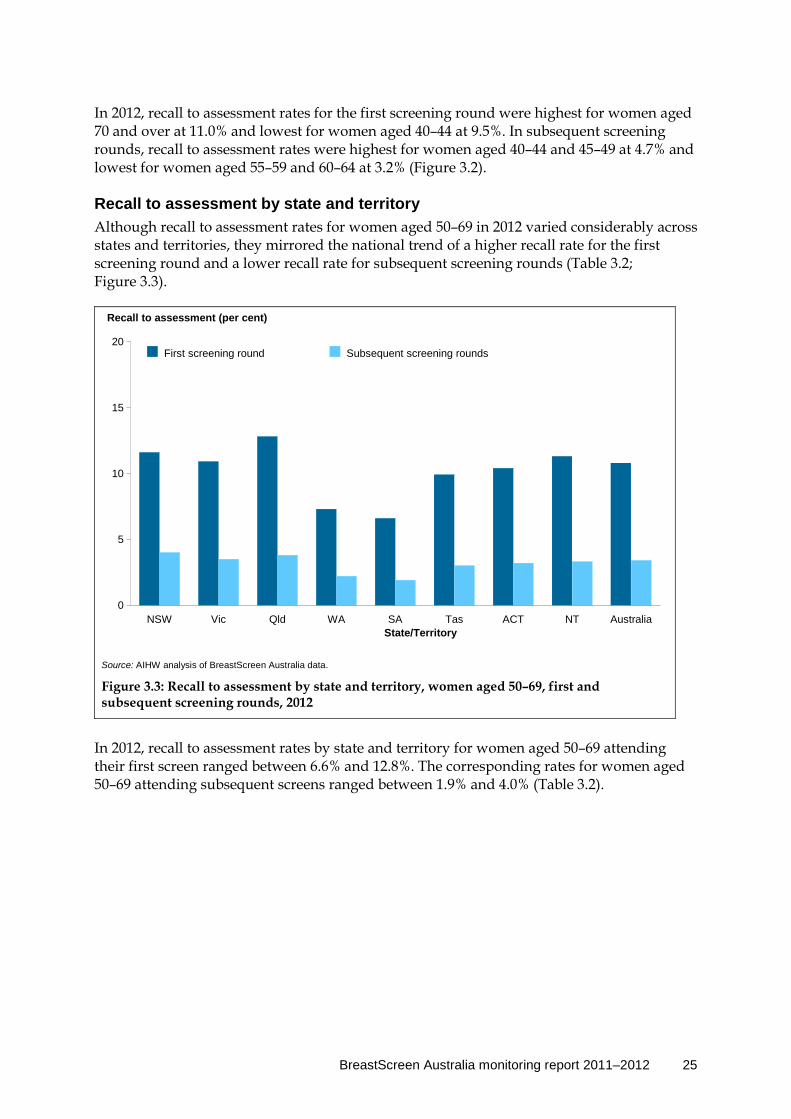
Recall to assessment by state and territory Although recall to assessment rates for women aged 50–69 in 2012 varied considerably across states and territories, they mirrored the national trend of a higher recall rate for the first screening round and a lower recall rate for subsequent screening rounds (Table 3.2; Figure 3.3).
Source: AIHW analysis of BreastScreen Australia data.
Figure 3.3: Recall to assessment by state and territory, women aged 50–69, first and subsequent screening rounds, 2012
In 2012, recall to assessment rates by state and territory for women aged 50–69 attending their first screen ranged between 6.6% and 12.8%. The corresponding rates for women aged 50–69 attending subsequent screens ranged between 1.9% and 4.0% (Table 3.2).
First screening round Subsequent screening rounds
0
5
10
15
20
NSW Vic Qld WA SA Tas ACT NT Australia
Recall to assessment (per cent)
State/Territory

26 BreastScreen Australia monitoring report 2011–2012
Table 3.2: Recall to assessment by state and territory, women aged 50–69, first and subsequent screening rounds, 2012
NSW Vic Qld WA SA Tas ACT NT Australia
First screening round
Number 2,865 2,441 1,529 719 436 147 146 112 8,395
AS rate 11.6 10.9 12.8 7.3 6.6 9.9 10.4 11.3 10.8
Subsequent screening rounds
Number 8,163 5,170 5,407 1,648 1,023 581 308 106 22,406
AS rate 4.0 3.5 3.8 2.2 1.9 3.0 3.2 3.3 3.4
Note: Rates are the number of women recalled for assessment as a percentage of women screened, age-standardised to the population of women attending a BreastScreen Australia service in 2008.
Source: AIHW analysis of BreastScreen Australia data.

BreastScreen Australia monitoring report 2011–2012 27
Indicator 4 Invasive breast cancer detection
What you need to know about invasive breast cancer detection Definition: The number of women with invasive breast cancer detected through BreastScreen Australia per 10,000 women screened. The rate is reported for breast cancers of all sizes, as well as for a subset of breast cancers that are small (having a diameter less than or equal to 15 mm).
Rationale: The overarching aim of BreastScreen Australia is to reduce morbidity and mortality from breast cancer. This can be achieved by detecting cases of unsuspected breast cancer before women have symptoms, enabling early intervention. BreastScreen Australia strives to maximise the detection of invasive breast cancers, particularly small cancers, to achieve the desired reductions in morbidity and mortality.
The NAS outline that at least 50 women per 10,000 women screened aged 50–69 who attend for their first screen are diagnosed with invasive breast cancer (NAS 2.1.1), at least 35 women per 10,000 women screened aged 50–69 who attend for subsequent screens are diagnosed with invasive breast cancer (NAS 2.1.2), and that at least 25 women per 10,000 women screened aged 50–69 who attend for screening are diagnosed with small (≤15 mm) invasive breast cancer (NAS 2.2.1) (BreastScreen Australia 2004).
Guide to interpretation: Detection of invasive breast cancers is disaggregated into first and subsequent screening rounds because a woman is more likely to have a breast cancer detected the first time she visits a BreastScreen service than in subsequent visits. This is because a woman’s first visit detects prevalent cancers that may have been present for some time rather than incident cancers that have grown between screens (Kavanagh et al. 1999). Detection of small invasive cancers is presented for all screening rounds combined.
The most recent cancer detection data are for women screened in 2012.
What the data tell us about invasive breast cancer detection
Trend Invasive breast cancer detection in the first screening round was relatively stable at between 70 and 80 per 10,000 women screened before increasing in 2010, reaching a peak of 103.6 per 10,000 women screened in 2012. This trend was not mirrored for detection in subsequent screening rounds, with this rate remaining steady at around 43–44 per 10,000 women screened for most years. The recent trend of increased cancer detection in the first screening round is favourable and in subsequent rounds is one of no substantive change .
2012 In 2012, for every 10,000 women screened aged 50–69, 103.6 had an invasive breast cancer detected in the first screening round, and 43.9 in subsequent screening rounds. For women aged 50–69, 58.3% of all invasive breast cancers detected were small (≤15 mm), which is associated with increased treatment options and improved survival.
28 BreastScreen Australia monitoring report 2011–2012
Detailed analyses
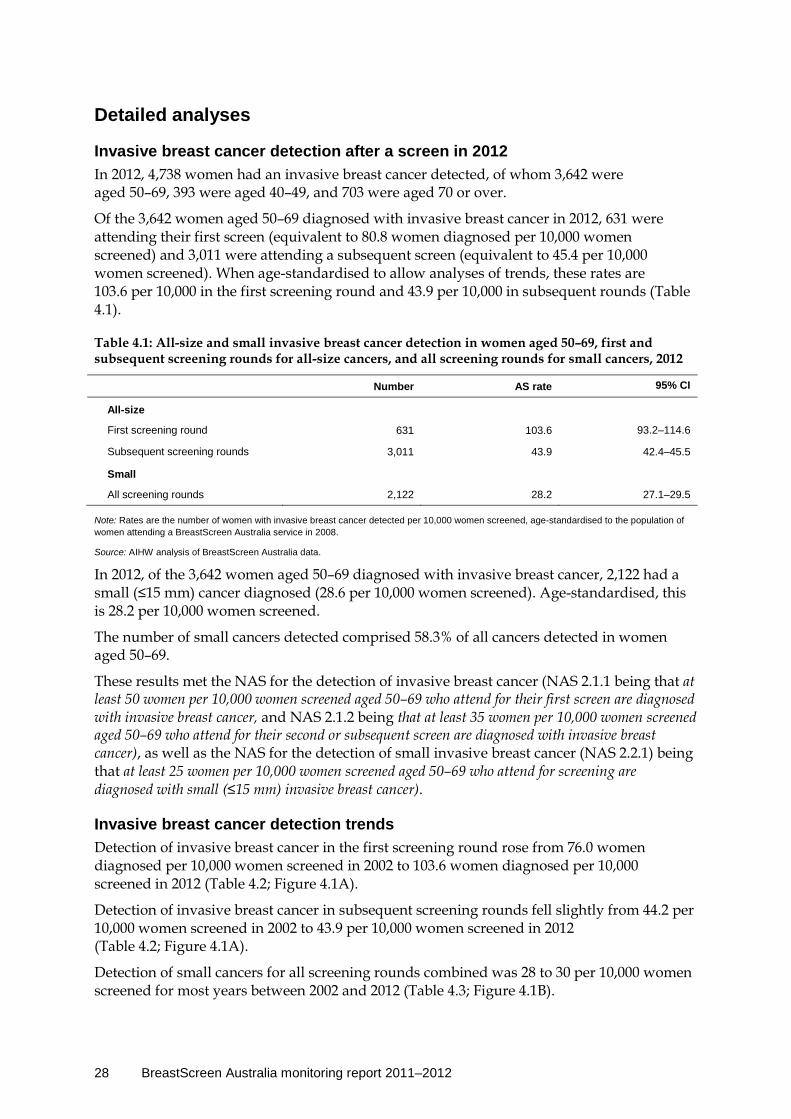
Invasive breast cancer detection after a screen in 2012 In 2012, 4,738 women had an invasive breast cancer detected, of whom 3,642 were aged 50–69, 393 were aged 40–49, and 703 were aged 70 or over.
Of the 3,642 women aged 50–69 diagnosed with invasive breast cancer in 2012, 631 were attending their first screen (equivalent to 80.8 women diagnosed per 10,000 women screened) and 3,011 were attending a subsequent screen (equivalent to 45.4 per 10,000 women screened). When age-standardised to allow analyses of trends, these rates are 103.6 per 10,000 in the first screening round and 43.9 per 10,000 in subsequent rounds (Table 4.1).
Table 4.1: All-size and small invasive breast cancer detection in women aged 50–69, first and subsequent screening rounds for all-size cancers, and all screening rounds for small cancers, 2012
Number AS rate 95% CI
All-size
First screening round 631 103.6 93.2–114.6
Subsequent screening rounds 3,011 43.9 42.4–45.5
Small
All screening rounds 2,122 28.2 27.1–29.5
Note: Rates are the number of women with invasive breast cancer detected per 10,000 women screened, age-standardised to the population of women attending a BreastScreen Australia service in 2008.
Source: AIHW analysis of BreastScreen Australia data.
In 2012, of the 3,642 women aged 50–69 diagnosed with invasive breast cancer, 2,122 had a small (≤15 mm) cancer diagnosed (28.6 per 10,000 women screened). Age-standardised, this is 28.2 per 10,000 women screened.
The number of small cancers detected comprised 58.3% of all cancers detected in women aged 50–69.
These results met the NAS for the detection of invasive breast cancer (NAS 2.1.1 being that at least 50 women per 10,000 women screened aged 50–69 who attend for their first screen are diagnosed with invasive breast cancer, and NAS 2.1.2 being that at least 35 women per 10,000 women screened aged 50–69 who attend for their second or subsequent screen are diagnosed with invasive breast cancer), as well as the NAS for the detection of small invasive breast cancer (NAS 2.2.1) being that at least 25 women per 10,000 women screened aged 50–69 who attend for screening are diagnosed with small (≤15 mm) invasive breast cancer).
Invasive breast cancer detection trends Detection of invasive breast cancer in the first screening round rose from 76.0 women diagnosed per 10,000 women screened in 2002 to 103.6 women diagnosed per 10,000 screened in 2012 (Table 4.2; Figure 4.1A).
Detection of invasive breast cancer in subsequent screening rounds fell slightly from 44.2 per 10,000 women screened in 2002 to 43.9 per 10,000 women screened in 2012 (Table 4.2; Figure 4.1A).
Detection of small cancers for all screening rounds combined was 28 to 30 per 10,000 women screened for most years between 2002 and 2012 (Table 4.3; Figure 4.1B).

BreastScreen Australia monitoring report 2011–2012 29
Table 4.2: All-size invasive breast cancer detection in women aged 50–69, first and subsequent screening rounds, 2002 to 2012
2002 2003 2004 2005 2006 2007 2008 2009 2010 2011 2012
First screening round
AS rate 76.0 74.2 82.2 76.6 71.8 77.6 75.5 79.5 91.6 82.1 103.6
95% CI 68.3–84.2
66.0–82.9
73.3–91.8
68.4–85.4
63.8–80.4
69.8–86.0
68.5–82.9
71.7–87.7
82.6–101.2
73.5–91.3
93.2–114.6
Subsequent screening rounds
AS rate 44.2 44.2 43.3 42.1 44.0 42.3 47.8 45.4 44.4 42.9 43.9
95% CI 42.4–46.1
42.4–46.1
41.5–45.1
40.5–43.9
42.3–45.7
40.7–44.0
46.0–49.6
43.8–47.1
42.8–46.1
41.3–44.5
42.4–45.5
Note: Rates are the number of women with invasive breast cancer detected per 10,000 women screened, age-standardised to the population of women attending a BreastScreen Australia service in 2008.
Source: AIHW analysis of BreastScreen Australia data.
A
B
Source: AIHW analysis of BreastScreen Australia data.
Figure 4.1: All-size (A) and small (≤15 mm)(B) invasive breast cancer detection in women aged 50–69, first and subsequent screening rounds for all-size cancers, and all screening rounds for small cancers, 1996 to 2012
Table 4.3: Small (≤15 mm) invasive breast cancer detection in women aged 50–69, all screening rounds, 2002 to 2012
2002 2003 2004 2005 2006 2007 2008 2009 2010 2011 2012
All screening rounds
AS rate 30.3 29.4 29.6 28.7 29.2 28.0 31.4 30.5 29.2 28.4 28.2
95% CI 28.9–31.8
28.0–30.9
28.3–31.0
27.4–30.1
27.9–30.5
26.7–29.3
30.1–32.8
29.2–31.8
27.9–30.4
27.2–29.7
27.1–29.5
Note: Rates are the number of women with small invasive breast cancer detected per 10,000 women screened, age-standardised to the population of women attending a BreastScreen Australia service in 2008.
Source: AIHW analysis of BreastScreen Australia data.
1996 1998 2000 2002 2004 2006 2008 2010 2012
Year
0
20
40
60
80
100
Subsequent screening roundsFirst screening round
Number per 10,000 women screened, all size
1996 1998 2000 2002 2004 2006 2008 2010 2012
Year
0
20
40
60
80
100Number per 10,000 women screened, small

30 BreastScreen Australia monitoring report 2011–2012
Proportion of invasive breast cancers detected that are small A woman is more likely to be diagnosed with a small cancer in subsequent screening visits than her first visit, since her first screening mammogram detects prevalent cancers that may have been present for some time, whereas subsequent screens detect incident cancers that have grown between screens (Kavanagh et al. 1999). Because they have had less time to grow, incident cancers are more likely to be small.
Accordingly, in 2012, the proportion of small cancers detected in women aged 50–69 was lower in the first screening round at 47.2% than in subsequent screening rounds at 60.6%.
Source: AIHW analysis of BreastScreen Australia data.
Figure 4.2: Number of invasive breast cancers, showing the proportion of small (≤15 mm) to other-size (>15 mm), detected in women aged 50–69, all screening rounds, 1996 to 2012
Table 4.4: Proportion of small (≤15 mm) invasive breast cancers detected in women aged 50–69, all screening rounds, 2002 to 2012
2002 2003 2004 2005 2006 2007 2008 2009 2010 2011 2012
Proportion (%) 63.8 62.2 63.5 63.1 62.6 61.4 61.5 62.6 60.2 61.1 58.3
Note: Rates are the number of women with small invasive breast cancer detected as a proportion of the number of women with invasive breast cancer detected.
Source: AIHW analysis of BreastScreen Australia data.
The proportion of small invasive breast cancers in 2012 was lower in younger age groups—49.1% of all cancers for women aged 40–49 compared with 58.3% for women aged 50–69 and 61.3% for women aged 70 and over (BreastScreen Australia monitoring report 2011–2012: supplementary data tables, Table S4.7). The lower proportion of small invasive cancers in young age groups may be related to greater breast density in younger women, which makes small invasive breast cancers more difficult to detect using screening mammography (Irwig et al. 1997). More than half of all invasive breast cancers detected through BreastScreen
> 15mm < or = 15mm
0
1000
2000
3000
4000
Year
1996 1997 1998 1999 2000 2001 2002 2003 2004 2005 2006 2007 2008 2009 2010 2011 2012
Number of cancers
BreastScreen Australia monitoring report 2011–2012 31
Australia in women aged 50–69 were small (≤15 mm), with rates above 60% for all years between 2002 and 2011 and a small decrease to 58.3% in 2012 (Table 4.4; Figure 4.2).
Invasive breast cancer detection by age In 2012, invasive breast cancer detection rates ranged from 24.3 per 10,000 women screened for women aged 40–44 to 86.7 per 10,000 women screened for women aged 70 or over.
Detection of small cancers ranged from 9.2 per 10,000 women screened for women aged 40–44 to 53.1 per 10,000 women screened for women aged 70 or more (Table 4.5; Figure 4.3).
Table 4.5: All-size and small (≤15 mm) invasive breast cancer detection by age, all screening rounds, 2012
Age group (years)
40–44 45–49 50–54 55–59 60–64 65–69 70+
All-size Number 108 285 839 783 1,048 972 703
Rate 24.3 37.5 43.0 39.6 54.7 62.0 86.7
Small Number 41 152 450 460 625 587 431
Rate 9.2 20.0 23.0 23.2 32.6 37.4 53.1
Note: Rates are the number of women with small invasive breast cancer detected per 10,000 women screened. Source: AIHW analysis of BreastScreen Australia data.
Source: AIHW analysis of BreastScreen Australia data.
Figure 4.3: All-size and small (≤15 mm) invasive breast cancer detection by age, all screening rounds, 2012
40–44 45–49 50–54 55–59 60–64 65–69 70+
Age group (years)
0
10
20
30
40
50
60
70
80
90
100Small-sizeAll-size
Number per 10,000 women screened
32 BreastScreen Australia monitoring report 2011–2012
Invasive breast cancer detection by state and territory The number of women with invasive breast cancer diagnosed per 10,000 women screened showed considerable variation among states and territories. These data should be interpreted with caution due to small numbers and broad confidence intervals (Table 4.6).
Table 4.6: All-size and small (≤15 mm) invasive breast cancer detection by state and territory, women aged 50–69, 2012
NSW Vic Qld WA SA Tas ACT NT Australia
All-size, first screening round
Number 217 157 110 70 32 20 16 9 631
AS rate 111.9 83.7 106.8 100.9 52.3 161.6 218.7 145.3 103.6
95% CI 93.9–131.8 65.0–104.8 84.6–132.4 70.3–137.4 25.3–87.4 91.6–259.6 82.1–417.6 60.1–286.3 93.2–114.6
All size, subsequent screening rounds
Number 933 665 703 351 214 88 45 12 3,011
AS rate 42.6 42.9 48.5 45.9 38.4 44.0 43.0 34.8 43.9
95% CI 39.9–45.5 39.6–46.3 44.9–52.2 41.2–51.0 33.3–44.0 35.2–54.3 31.1–57.9 17.9–60.9 42.4–45.5
Small, all screening rounds
Number 657 493 459 241 151 75 31 15 2,122
AS rate 27.5 28.3 29.5 28.9 24.5 35.2 27.0 36.0 28.2
95% CI 25.4–29.7 25.8–30.9 26.8–32.3 25.3–32.7 20.8–28.8 27.7–44.2 18.3–38.3 20.1–59.5 27.1–29.5
Notes 1. Rates are the number of women with invasive breast cancer detected per 10,000 women screened, age-standardised to the population of
women attending a BreastScreen Australia service in 2008; rates based on numbers less than 20 should be interpreted with caution. 2. State and territory differences, along with the size of the 95% confidence intervals (particularly in the smaller states and territories), need to
be taken into consideration when interpreting cancer detection results. 3. In some states and territories, age-standardised rates vary considerably from crude rates. Crude rates are available in the BreastScreen
Australia monitoring report 2011–2012: supplementary data tables. 4. A small number of women may be screened in one jurisdiction but have their cancer detected in another.
Source: AIHW analysis of BreastScreen Australia data.
BreastScreen Australia monitoring report 2011–2012 33
Indicator 5 Ductal carcinoma in situ detection
What you need to know about DCIS detection Definition: The number of women with ductal carcinoma in situ (DCIS) detected through BreastScreen Australia per 10,000 women screened.
Rationale: Women with DCIS are at an increased risk of later developing invasive breast cancer (AIHW 2010a; WHO & IARC 2002). Research has shown that invasive breast cancer may also occur after treated cases of DCIS, either in the opposite breast or independently of the original DCIS in the same breast (Kerlikowske et al. 2010).
It is not currently possible to predict which DCIS cases might progress to invasive breast cancer. However, given the increased risk of invasive breast cancer after a diagnosis of DCIS, and that the detection and subsequent treatment of high-grade DCIS is likely to prevent deaths from invasive breast cancer (Eusebi et al. 1994), BreastScreen Australia aims to maximise the detection of DCIS. This is reflected in the NAS for detection of DCIS that requires that, for women aged 50–69, at least 12 women per 10,000 women screened who attend their first screen are diagnosed with DCIS (NAS 2.3.1), and that at least 7 women per 10,000 women screened who attend for subsequent screens are diagnosed with DCIS (NAS 2.3.2) (BreastScreen Australia 2004).
Guide to interpretation: DCIS is disaggregated into first and subsequent screening rounds because a woman is more likely to have DCIS diagnosed at her first screen than subsequent screens, since her first visit detects prevalent cases, not just incident cases.
To produce stable, comparable rates from the relatively small number of DCIS cases, detection of DCIS is reported by 10-year age groups and, when disaggregated by state and territory, is presented for all screening rounds combined.
The most recent DCIS detection data are for women screened in 2012.
What the data tell us about DCIS detection
Trend DCIS detection varies from year to year due to small numbers, but remained relatively steady at around 20 per 10,000 women screened from 2009 to 2012, with a slight increase from 20.9 in 2011 to 22.8 in 2012 for the first screening round and no change from 11 per 10,000 women screened for subsequent screening rounds.
The recent trend is therefore one of no substantive change, although possibly the start of an upward trend for the first screening round, which would be considered favourable.
2012 For every 10,000 women screened aged 50–69, 22.8 had DCIS detected in the first screening round, and 11.0 in subsequent screening rounds.
34 BreastScreen Australia monitoring report 2011–2012
More information on DCIS DCIS is a non-invasive tumour that arises from the lining of the ducts that carry milk from the milk-producing lobules to the nipple. The changes to the cells lining the milk ducts seen in DCIS are similar to those in invasive breast cancer. However, unlike breast cancer, DCIS does not invade the surrounding breast tissue and is, instead, contained entirely within the milk duct.
Most cases of DCIS are asymptomatic. They are usually detected as a change on a mammogram or as a chance finding on a breast biopsy for another condition (BreastScreen Australia 2004). DCIS was rarely discovered before the introduction of screening mammography. The introduction and progressive expansion of national organised screening mammography from 1991 (in the form of BreastScreen Australia) resulted in a substantial increase in its detection (Luke et al. 2006; NBBC et al. 2000).
Women with DCIS are at an increased risk of later developing invasive breast cancer (AIHW 2010a; WHO & IARC 2002). Research has shown that invasive breast cancer may also occur after treated cases of DCIS, either in the opposite breast or independently of the original DCIS in the same breast (Kerlikowske et al. 2010). BreastScreen Australia therefore aims to maximise the detection of DCIS in Australian women.
Detailed analyses
DCIS detection after a screen in 2012 In 2012, 1,199 women were diagnosed with DCIS by BreastScreen Australia, of whom 903 were aged 50–69. Of these 903 women, 153 were attending their first screen (equivalent to 22.8 women diagnosed per 10,000 women screened) and 750 were attending a subsequent screen (equivalent to 11.0 per 10,000 women screened) (Table 5.1).
Table 5.1: DCIS detection in women aged 50–69, first and subsequent screening rounds, 2012
Number AS rate 95% CI
First screening round 153 22.8 18.1–28.0
Subsequent screening rounds 750 11.0 10.3–11.9
Note: Rates are the number of women with DCIS detected per 10,000 women screened, age-standardised to the population of women attending a BreastScreen Australia service in 2008.
Source: AIHW analysis of BreastScreen Australia data.
These results met the NAS for the detection of DCIS (NAS 2.3.1 being that at least 12 women per 10,000 women screened aged 50–69 who attend their first screen are diagnosed with DCIS, and NAS 2.3.2 being that at least 7 women per 10,000 women screened aged 50–69 who attend for subsequent screens are diagnosed with DCIS).

BreastScreen Australia monitoring report 2011–2012 35
DCIS detection trends Detection of DCIS in women aged 50–69 in the first screening round varied between 15 and 23 per 10,000 women screened over the years 2002 to 2012, with these rates having relatively broad confidence intervals (Table 5.2; Figure 5.1).
Detection of DCIS in women aged 50–69 in subsequent screening rounds increased from about 9.3 in 2002 to range between 11 and 12 per 10,000 women screened for all years from 2007 to 2012 (Table 5.2; Figure 5.1).
Note: Rates are the number of women with DCIS detected per 10,000 women screened, age-standardised to the population of women attending a BreastScreen Australia service in 2008; rates based on numbers less than 20 should be interpreted with caution.
Source: AIHW analysis of BreastScreen Australia data.
Figure 5.1: DCIS detection by year, women aged 50–69, 1996 to 2012
Table 5.2: DCIS detection by year, women aged 50–69, first and subsequent screening rounds, 2002 to 2012
2002 2003 2004 2005 2006 2007 2008 2009 2010 2011 2012
First screening round
AS rate 21.4 16.7 20.4 14.5 18.8 21.3 15.6 19.6 17.9 20.9 22.8
95% CI 17.6– 25.8
13.0– 21.0
16.1– 25.4
11.2– 18.4
14.9– 23.3
17.3– 25.7
12.7– 18.8
16.0– 23.6
14.1–22.1
16.7– 25.7
18.1– 28.0
Subsequent screening rounds
AS rate 9.3 10.3 10.7 11.0 9.7 11.1 11.5 11.7 11.5 11.2 11.0
95% CI 8.5– 10.2
9.4– 11.2
9.8– 11.6
10.2– 11.9
8.9– 10.6
10.3– 12.0
10.7– 12.4
10.9– 12.6
10.7–12.4
10.4– 12.1
10.3– 11.9
Note: Rates are the number of women with DCIS detected per 10,000 women screened, age-standardised to the population of women attending a BreastScreen Australia service in 2008.
Source: AIHW analysis of BreastScreen Australia data.
1996 1997 1998 1999 2000 2001 2002 2003 2004 2005 2006 2007 2008 2009 2010 2011 2012
Year
0
5
10
15
20
25
Subsequent screening roundsFirst screening round
Number per 10,000 women screened
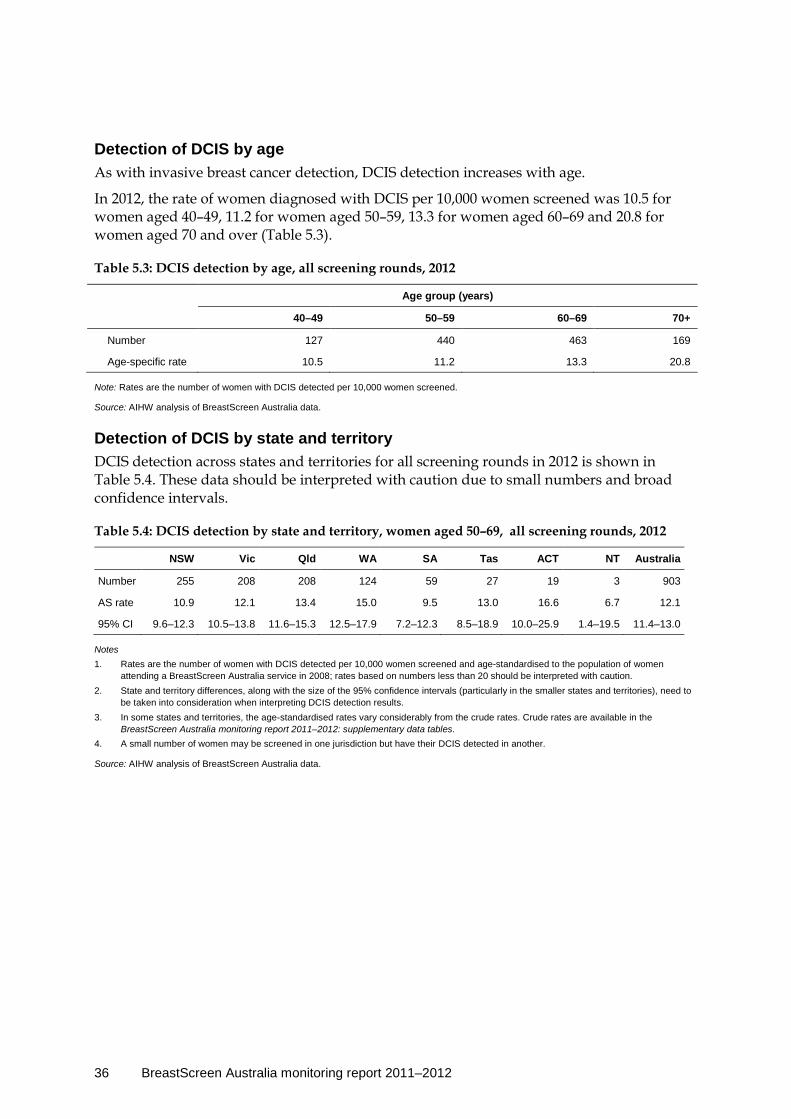
36 BreastScreen Australia monitoring report 2011–2012
Detection of DCIS by age As with invasive breast cancer detection, DCIS detection increases with age.
In 2012, the rate of women diagnosed with DCIS per 10,000 women screened was 10.5 for women aged 40–49, 11.2 for women aged 50–59, 13.3 for women aged 60–69 and 20.8 for women aged 70 and over (Table 5.3).
Table 5.3: DCIS detection by age, all screening rounds, 2012
Age group (years)
40–49 50–59 60–69 70+
Number 127 440 463 169
Age-specific rate 10.5 11.2 13.3 20.8
Note: Rates are the number of women with DCIS detected per 10,000 women screened.
Source: AIHW analysis of BreastScreen Australia data.
Detection of DCIS by state and territory DCIS detection across states and territories for all screening rounds in 2012 is shown in Table 5.4. These data should be interpreted with caution due to small numbers and broad confidence intervals.
Table 5.4: DCIS detection by state and territory, women aged 50–69, all screening rounds, 2012
NSW Vic Qld WA SA Tas ACT NT Australia
Number 255 208 208 124 59 27 19 3 903
AS rate 10.9 12.1 13.4 15.0 9.5 13.0 16.6 6.7 12.1
95% CI 9.6–12.3 10.5–13.8 11.6–15.3 12.5–17.9 7.2–12.3 8.5–18.9 10.0–25.9 1.4–19.5 11.4–13.0
Notes 1. Rates are the number of women with DCIS detected per 10,000 women screened and age-standardised to the population of women
attending a BreastScreen Australia service in 2008; rates based on numbers less than 20 should be interpreted with caution. 2. State and territory differences, along with the size of the 95% confidence intervals (particularly in the smaller states and territories), need to
be taken into consideration when interpreting DCIS detection results. 3. In some states and territories, the age-standardised rates vary considerably from the crude rates. Crude rates are available in the
BreastScreen Australia monitoring report 2011–2012: supplementary data tables. 4. A small number of women may be screened in one jurisdiction but have their DCIS detected in another.
Source: AIHW analysis of BreastScreen Australia data.

BreastScreen Australia monitoring report 2011–2012 37
Indicator 6a Interval cancers
What you need to know about interval cancers Definition: The number of invasive breast cancers detected in women screened through BreastScreen Australia that arise during an interval between two screening rounds, per 10,000 women-years.
Rationale: The ability of screening mammography to successfully detect invasive breast cancer in women in the target age group can be assessed by considering the relative number of: • invasive breast cancers detected at screening episode • invasive breast cancers diagnosed 0–12 months after a screening episode detected no
cancer • invasive breast cancers diagnosed 13–24 months after a screening episode detected no
cancer. The goal of BreastScreen Australia is to have a high proportion of invasive breast cancers detected within screening episodes and a low proportion diagnosed after a screening episode detected no cancer (interval cancers).
This is reflected in NAS for interval breast cancers that require that less than 7.5 interval cancers per 10,000 women aged 50–69 are diagnosed in women who attend for screening less than 12 months after a negative screening episode (NAS 2.4.2[a]) (BreastScreen Australia 2004).
Guide to interpretation: Interval cancer rates are disaggregated into time since screening (0–12 months, 13–24 months and 0–24 months) and screening round (first and subsequent).
To produce comparable rates from the relatively small number of cases, interval cancer rates are reported by 10-year age groups, and aggregated over 3 years.
The most recent interval cancer data are for women screened in the index years 2007, 2008 and 2009. This small lag in data availability is because 2 years need to have passed since a woman’s last screen to know whether she was diagnosed with an interval cancer.
What the data tell us about interval cancers
Interval cancers for the index years 2007, 2008 and 2009 In the 0–12 months after a woman’s first negative screening episode, there were 6.1 interval cancers per 10,000 women-years. In the 0–12 months after subsequent negative screening episodes, there were 6.4 interval cancers per 10,000 women-years. In the 13–24 months after a woman’s first negative screening episode, there were 12.0 interval cancers per 10,000 women-years. In the 13–24 months after subsequent negative screening episodes, there were 12.2 interval cancers per 10,000 women-years.
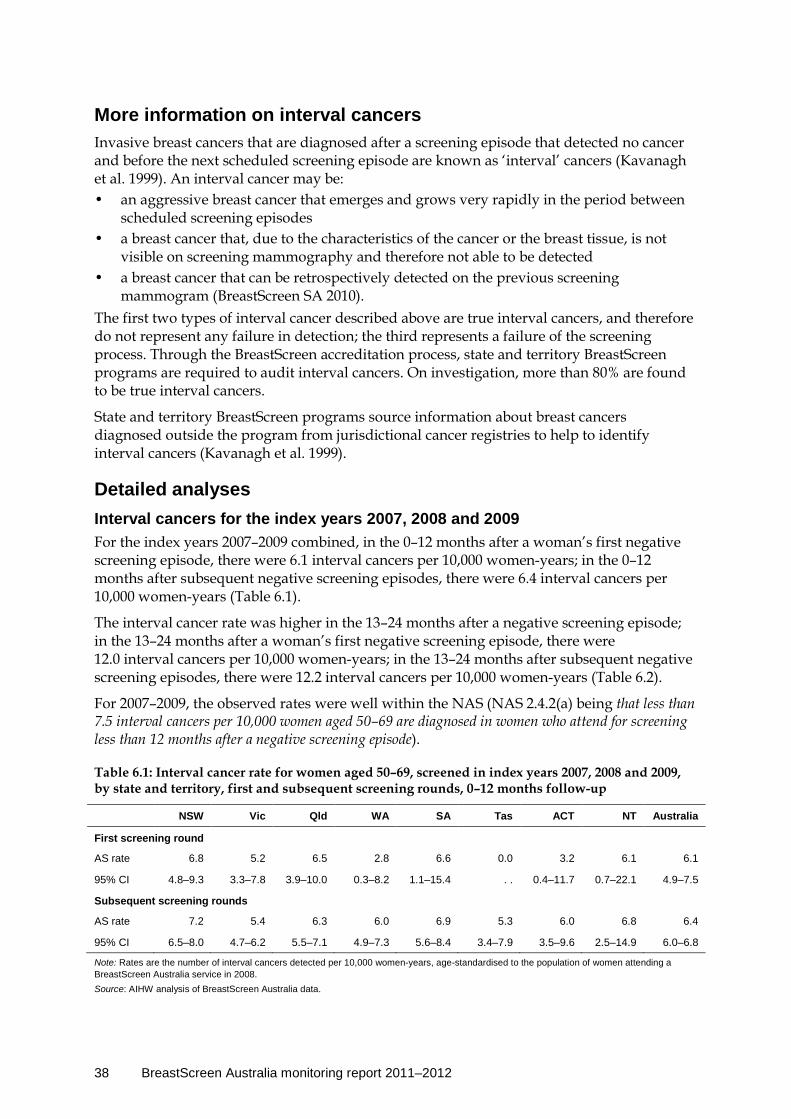
38 BreastScreen Australia monitoring report 2011–2012
More information on interval cancers Invasive breast cancers that are diagnosed after a screening episode that detected no cancer and before the next scheduled screening episode are known as ‘interval’ cancers (Kavanagh et al. 1999). An interval cancer may be: • an aggressive breast cancer that emerges and grows very rapidly in the period between
scheduled screening episodes • a breast cancer that, due to the characteristics of the cancer or the breast tissue, is not
visible on screening mammography and therefore not able to be detected • a breast cancer that can be retrospectively detected on the previous screening
mammogram (BreastScreen SA 2010). The first two types of interval cancer described above are true interval cancers, and therefore do not represent any failure in detection; the third represents a failure of the screening process. Through the BreastScreen accreditation process, state and territory BreastScreen programs are required to audit interval cancers. On investigation, more than 80% are found to be true interval cancers.
State and territory BreastScreen programs source information about breast cancers diagnosed outside the program from jurisdictional cancer registries to help to identify interval cancers (Kavanagh et al. 1999).
Detailed analyses Interval cancers for the index years 2007, 2008 and 2009 For the index years 2007–2009 combined, in the 0–12 months after a woman’s first negative screening episode, there were 6.1 interval cancers per 10,000 women-years; in the 0–12 months after subsequent negative screening episodes, there were 6.4 interval cancers per 10,000 women-years (Table 6.1).
The interval cancer rate was higher in the 13–24 months after a negative screening episode; in the 13–24 months after a woman’s first negative screening episode, there were 12.0 interval cancers per 10,000 women-years; in the 13–24 months after subsequent negative screening episodes, there were 12.2 interval cancers per 10,000 women-years (Table 6.2).
For 2007–2009, the observed rates were well within the NAS (NAS 2.4.2(a) being that less than 7.5 interval cancers per 10,000 women aged 50–69 are diagnosed in women who attend for screening less than 12 months after a negative screening episode).
Table 6.1: Interval cancer rate for women aged 50–69, screened in index years 2007, 2008 and 2009, by state and territory, first and subsequent screening rounds, 0–12 months follow-up
NSW Vic Qld WA SA Tas ACT NT Australia
First screening round
AS rate 6.8 5.2 6.5 2.8 6.6 0.0 3.2 6.1 6.1
95% CI 4.8–9.3 3.3–7.8 3.9–10.0 0.3–8.2 1.1–15.4 . . 0.4–11.7 0.7–22.1 4.9–7.5
Subsequent screening rounds
AS rate 7.2 5.4 6.3 6.0 6.9 5.3 6.0 6.8 6.4
95% CI 6.5–8.0 4.7–6.2 5.5–7.1 4.9–7.3 5.6–8.4 3.4–7.9 3.5–9.6 2.5–14.9 6.0–6.8
Note: Rates are the number of interval cancers detected per 10,000 women-years, age-standardised to the population of women attending a BreastScreen Australia service in 2008. Source: AIHW analysis of BreastScreen Australia data.

BreastScreen Australia monitoring report 2011–2012 39
Table 6.2: Interval cancer rate for women aged 50–69, screened in index years 2007, 2008 and 2009, by state and territory, first and subsequent screening rounds, 13–24 months follow-up
NSW Vic Qld WA SA Tas ACT NT Australia
First screening round
AS rate 11.5 10.7 12.4 12.1 8.8 24.1 28.1 0.0 12.0
95% CI 8.9–14.6 7.3–14.8 8.4–17.4 6.3–19.8 2.7–17.9 9.5–47.7 3.2–77.1 . . 10.2–13.9
Subsequent screening rounds
AS rate 10.6 13.4 13.2 9.1 13.5 15.9 15.1 12.8 12.2
95% CI 9.8–11.6 12.3–14.6 12.0–14.4 7.6–10.7 11.6–15.6 12.4–20.2 10.6–21.0 6.3–22.9 11.6–12.7
Note: Rates are the number of interval cancers detected per 10,000 women-years, age-standardised to the population of women attending a BreastScreen Australia service in 2008.
Source: AIHW analysis of BreastScreen Australia data.
There were no appreciable differences in the interval cancer rate between first and subsequent screening rounds for either 0–12 months or 13–24 months after a negative screening episode. This indicates that although women are more likely to have an invasive breast cancer detected in their first screening round compared with subsequent screening rounds, they are no more likely to have an interval cancer diagnosed after their first screen than after any other screen at a BreastScreen Australia service.
Box 6.1: What is a screening episode? A screening episode includes all attendances for screening and assessment within 6 months relating to a particular round of screening. It starts at the date of attendance for screening. It is completed when: • a recommendation is made to return the woman to routine rescreening • a recommendation is made for early review at 6 months or more from the screening
date • a diagnosis of cancer is made • the woman fails to attend for technical recall or assessment within 6 months • the woman dies.
Interval cancer by age The interval cancer rate was lowest for women aged 50–59, followed by the rate for those aged 60–69, and was generally higher for women outside the target age group (Table 6.3).
Table 6.3: Interval cancer rate for women screened in index years 2007, 2008 and 2009, by age, all screening rounds, 0–12 months and 13–24 months follow-up
Time since screen (months)
Age group (years)
40–49 50–59 60–69 70+
0–12 months Number 295 686 549 146
Crude rate 8.4 6.3 6.4 7.3
13–24 months Number 395 1,170 1,114 297
Crude rate 11.9 11.1 13.6 15.7
Note: Rates are the number of interval cancers detected per 10,000 women-years.
Source: AIHW analysis of BreastScreen Australia data.

40 BreastScreen Australia monitoring report 2011–2012
Interval cancer by state and territory Interval cancer rates are shown for states and territories in Tables 6.1, 6.2 and 6.4.
Please note that differences in state and territory policies for managing women with symptoms may affect interval cancer rates.
For example, in some jurisdictions, women with a negative screening mammogram but who have symptoms are referred for diagnostic follow-up outside BreastScreen Australia, rather than being recalled to assessment within BreastScreen Australia; any cancers found in these women will be counted as interval cancers, leading to a higher apparent interval cancer rate. Conversely, states and territories that do recall women to assessment if they have symptoms (even in the face of a negative screening mammogram) may have lower apparent interval cancer rates. This affects the comparability of this indicator between jurisdictions.
Table 6.4: Interval cancer rate for women aged 50–69, screened in index years 2007, 2008 and 2009, by state and territory, first and subsequent screening rounds, 0–24 months follow-up
NSW Vic Qld WA SA Tas ACT NT Australia
First screening round
AS rate 9.1 8.0 9.4 7.8 7.7 11.5 15.2 3.1 9.0
95% CI 7.4–11.0 6.0–10.3 7.0–12.3 4.5–12.1 3.4–13.5 4.6–22.5 2.5–37.6 0.4–11.1 7.9–10.2
Subsequent screening rounds
AS rate 8.9 9.4 9.7 7.5 10.1 10.2 10.2 9.8 9.2
95% CI 8.3–9.5 8.8–10.1 9.0–10.5 6.6–8.5 8.9–11.3 8.2–12.5 7.7–13.4 5.7–15.7 8.9–9.5
Note: Rates are the number of interval cancers detected per 10,000 women-years, age-standardised to the population of women attending a BreastScreen Australia service in 2008.
Source: AIHW analysis of BreastScreen Australia data.
BreastScreen Australia monitoring report 2011–2012 41
Indicator 6b Program sensitivity
What you need to know about program sensitivity Definition: Program sensitivity is directly related to interval cancers. It is the proportion of invasive breast cancers detected by BreastScreen Australia (screen-detected cancers) out of all invasive breast cancers (interval cancers plus screen-detected cancers) diagnosed in program-screened women in the screening interval.
Rationale: High program sensitivity indicates that few cancers in screened women are missed by BreastScreen Australia—that is, most breast cancers are detected by BreastScreen Australia as reported in Indicator 4 rather than as interval cancers.
While there are no NAS that directly relate to the program sensitivity indicator, high sensitivity is desirable.
Guide to interpretation: Program sensitivity is disaggregated into time since screening (0–12 months and 0–24 months) and screening round (first and subsequent).
To produce comparable rates from the relatively small number of cases, interval cancer rates are reported by 10-year age groups, and aggregated over 3 years.
The most recent program sensitivity data are for women screened in the index years 2007, 2008 and 2009. This small lag in data availability is because 2 years need to have passed since a woman’s last screen to know whether she was diagnosed with an interval cancer.
What the data tell us about program sensitivity
Program sensitivity for the index years 2007, 2008 and 2009 Program sensitivity for 0–12 months was 92.8% for the first screening round and 87.4% for subsequent screening rounds. Program sensitivity for 0–24 months was 82.4% for the first screening round and 72.8% for subsequent screening rounds. For all screening rounds combined, program sensitivity for 0–12 months increased with age, from 77.6% in women aged 40–49 to 86.5% and 90.6% for women aged 50–59 and 60–69, respectively, and to 92.5% for women aged 70 or over.
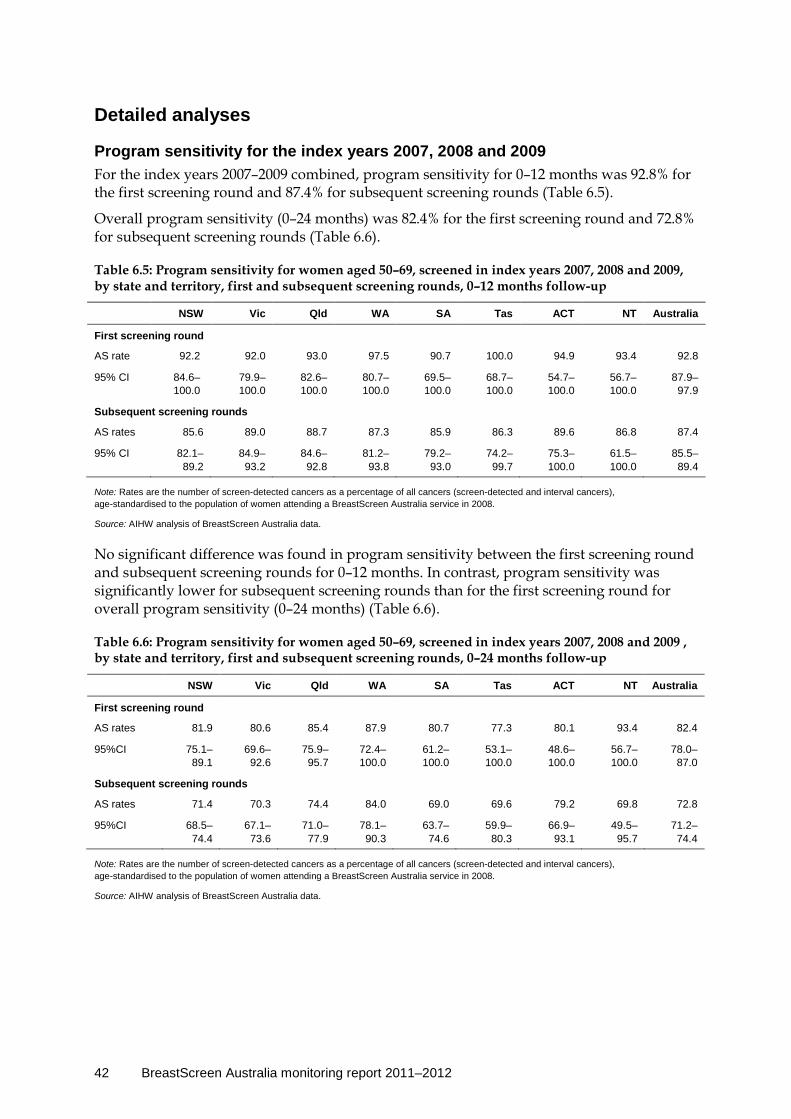
42 BreastScreen Australia monitoring report 2011–2012
Detailed analyses
Program sensitivity for the index years 2007, 2008 and 2009 For the index years 2007–2009 combined, program sensitivity for 0–12 months was 92.8% for the first screening round and 87.4% for subsequent screening rounds (Table 6.5).
Overall program sensitivity (0–24 months) was 82.4% for the first screening round and 72.8% for subsequent screening rounds (Table 6.6).
Table 6.5: Program sensitivity for women aged 50–69, screened in index years 2007, 2008 and 2009, by state and territory, first and subsequent screening rounds, 0–12 months follow-up
NSW Vic Qld WA SA Tas ACT NT Australia
First screening round
AS rate 92.2 92.0 93.0 97.5 90.7 100.0 94.9 93.4 92.8
95% CI 84.6–100.0
79.9–100.0
82.6–100.0
80.7–100.0
69.5–100.0
68.7–100.0
54.7–100.0
56.7–100.0
87.9– 97.9
Subsequent screening rounds
AS rates 85.6 89.0 88.7 87.3 85.9 86.3 89.6 86.8 87.4
95% CI 82.1–89.2
84.9– 93.2
84.6– 92.8
81.2– 93.8
79.2– 93.0
74.2– 99.7
75.3–100.0
61.5–100.0
85.5– 89.4
Note: Rates are the number of screen-detected cancers as a percentage of all cancers (screen-detected and interval cancers), age-standardised to the population of women attending a BreastScreen Australia service in 2008.
Source: AIHW analysis of BreastScreen Australia data.
No significant difference was found in program sensitivity between the first screening round and subsequent screening rounds for 0–12 months. In contrast, program sensitivity was significantly lower for subsequent screening rounds than for the first screening round for overall program sensitivity (0–24 months) (Table 6.6).
Table 6.6: Program sensitivity for women aged 50–69, screened in index years 2007, 2008 and 2009 , by state and territory, first and subsequent screening rounds, 0–24 months follow-up
NSW Vic Qld WA SA Tas ACT NT Australia
First screening round
AS rates 81.9 80.6 85.4 87.9 80.7 77.3 80.1 93.4 82.4
95%CI 75.1–89.1
69.6–92.6
75.9–95.7
72.4–100.0
61.2–100.0
53.1–100.0
48.6–100.0
56.7–100.0
78.0–87.0
Subsequent screening rounds
AS rates 71.4 70.3 74.4 84.0 69.0 69.6 79.2 69.8 72.8
95%CI 68.5–74.4
67.1–73.6
71.0–77.9
78.1–90.3
63.7– 74.6
59.9– 80.3
66.9– 93.1
49.5– 95.7
71.2–74.4
Note: Rates are the number of screen-detected cancers as a percentage of all cancers (screen-detected and interval cancers), age-standardised to the population of women attending a BreastScreen Australia service in 2008.
Source: AIHW analysis of BreastScreen Australia data.

BreastScreen Australia monitoring report 2011–2012 43
Program sensitivity by age In 2007–2009, program sensitivity was lowest in women aged 40–49, and thereafter greater with increasing age (Table 6.7).
Lower sensitivity means that BreastScreen Australia is less able to detect invasive breast cancers in women aged 40–49 who attend for screening.
Table 6.7: Program sensitivity for women screened in index years 2007, 2008 and 2009, all screening rounds, by age, 0–12 months and 0–24 months follow-up
Time since screen (months)
Age group (years)
40–49 50–59 60–69 70+
0–12 77.6 86.5 90.6 92.5
0–24 62.1 71.9 77.0 81.0
Note: Rates are the number of interval cancers detected per 10,000 women-years.
Source: AIHW analysis of BreastScreen Australia data.
Program sensitivity by state and territory Program sensitivity is shown for states and territories in Tables 6.5 and 6.6.
As noted for the interval cancer indicator, both interval cancers and sensitivity rates in each state and territory are affected by the varying policies for managing symptomatic women. This affects the comparability of this indicator between jurisdictions.
44 BreastScreen Australia monitoring report 2011–2012
Indicator 7a Invasive breast cancer incidence
What you need to know about invasive breast cancer incidence Definition: The number of new cases of invasive breast cancer per 100,000 estimated resident female population in a 12-month period.
Rationale: Incidence data provide information about the underlying level of invasive breast cancer in Australia. Annual monitoring of these data with various stratifications (such as age or location) may reveal findings of concern or positive trends that can be used to inform BreastScreen Australia as well as broader policies for breast cancer in Australian women.
Guide to interpretation: These data include both screen-detected breast cancers (detected through BreastScreen Australia) and breast cancers detected outside BreastScreen Australia.
Incidence data are reported per 100,000 women in the population.
Incidence of invasive breast cancer by state and territory, remoteness area, socioeconomic status and Indigenous status is reported over a 5-year (instead of a 12-month) period. This is to improve the stability and comparability of rates due to the small number of new cases in less populated areas and in Aboriginal and Torres Strait Islander women.
The Australian Cancer Database is the source of breast cancer incidence data.
The most recent invasive breast cancer incidence data are for new cases diagnosed in 2010 (note that 2010 incidence data include estimates for NSW and the ACT).
What the data tell us about invasive breast cancer incidence
Trend The number of new breast cancer cases in women aged 50–69 more than doubled between 1982 and 2010 from 2,445 new cases to 7,449 new cases. Over this same time, the incidence rate increased from 174.6 to 300.0 new cases per 100,000 women; however the incidence rate has been stable at around 300 new cases per 100,000 women for the past decade.
The recent trend is therefore one of no substantive change.
2010 There were 7,449 new cases of breast cancer in women aged 50–69, the target population of BreastScreen Australia, or 300.0 new cases per 100,000 women. There were 14,181 new cases in women of all ages, or 116.4 new cases per 100,000 women.
Incidence by Indigenous status In 2005–2009, invasive breast cancer incidence in Aboriginal and Torres Strait Islander women was significantly lower than that for non-Indigenous women, at 220.9 new cases per 100,000 women aged 50–69 compared with the non-Indigenous rate of 265.8 per 100,000.
BreastScreen Australia monitoring report 2011–2012 45
More information on incidence Registration of cancer cases is required by law in each state and territory in Australia. Data are collected by state and territory cancer registries and compiled in the national Australian Cancer Database (ACD), held by the AIHW. The data include clinical and demographic information about people with newly diagnosed cancer.
Invasive breast cancer incidence measures the number of new cases of breast cancer diagnosed each year, sourced from the ACD. Only primary breast cancers are included—secondary breast cancers and breast cancers that are a reoccurrence of a primary breast cancer are not counted. Note that incidence data refer to the number of new cases diagnosed and not the number of women diagnosed (although it is rare for a woman to be diagnosed with more than one primary breast cancer in the same year).
The main data source for this chapter was the 2010 Australian Cancer Database.
Detailed analyses
Invasive breast cancer incidence in 2010 There were 14,181 new cases of breast cancer in Australian women in 2010. This is equivalent to 128.2 new cases for every 100,000 women in the population which, when age-standardised to allow analysis of trends and differentials, equates to an incidence rate of 116.4.
Of the 14,181 new cases, 7,449 (52.5%) were in women aged 50–69, equivalent to 303.9 new cases for every 100,000 women in the population. When age-standardised to allow analyses of trends and differentials, this equates to an incidence rate of 300.0 for women aged 50–69.
Box 7.1: How many breast cancers were detected through BreastScreen Australia?
It is estimated that 46% of invasive breast cancers diagnosed in women aged 50–69, and 33% of breast cancers in women aged 40 and over were detected through BreastScreen Australia in 2010.
In the broader context of cancers diagnosed in Australian women, breast cancer was the most commonly diagnosed cancer (excluding basal cell and squamous cell carcinoma of the skin) in Australian women in 2010. The risk of being diagnosed with breast cancer was 1 in 11 by age 75 and 1 in 8 by age 85 (AIHW 2014).
Invasive breast cancer incidence trends The number of new breast cancer cases in women aged 50–69 tripled during the 27 years between 1982 (the year in which national incidence data were first available) and 2010. There were 2,445 new cases in 1982, and 7,449 in 2010 (Figure 7.1; BreastScreen Australia monitoring report 2011–2012: supplementary data tables, Table S7.1).
For all age groups combined, the overall increase in the number of new cases of invasive breast cancer more than doubled from 5,303 in 1982 to 14,181 in 2010, an increase of 167.4% (BreastScreen Australia monitoring report 2011–2012: supplementary data tables, Table S7.1).
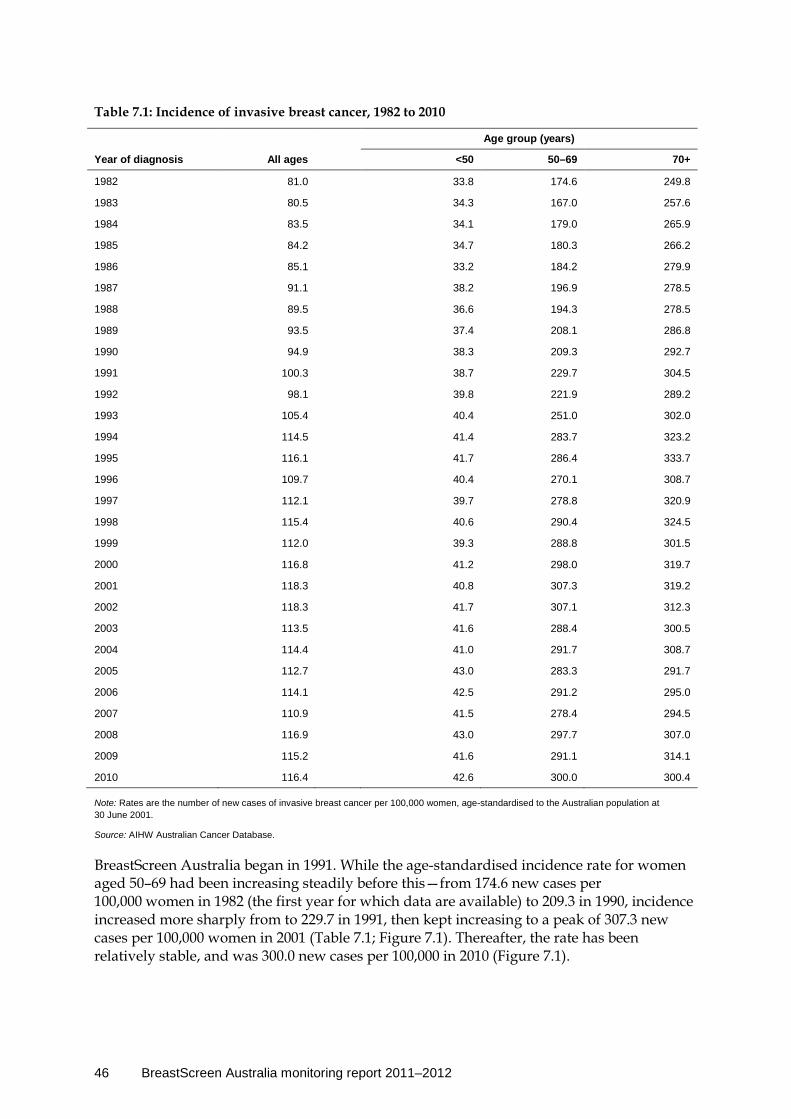
46 BreastScreen Australia monitoring report 2011–2012
Table 7.1: Incidence of invasive breast cancer, 1982 to 2010
Age group (years)
Year of diagnosis All ages <50 50–69 70+
1982 81.0 33.8 174.6 249.8
1983 80.5 34.3 167.0 257.6
1984 83.5 34.1 179.0 265.9
1985 84.2 34.7 180.3 266.2
1986 85.1 33.2 184.2 279.9
1987 91.1 38.2 196.9 278.5
1988 89.5 36.6 194.3 278.5
1989 93.5 37.4 208.1 286.8
1990 94.9 38.3 209.3 292.7
1991 100.3 38.7 229.7 304.5
1992 98.1 39.8 221.9 289.2
1993 105.4 40.4 251.0 302.0
1994 114.5 41.4 283.7 323.2
1995 116.1 41.7 286.4 333.7
1996 109.7 40.4 270.1 308.7
1997 112.1 39.7 278.8 320.9
1998 115.4 40.6 290.4 324.5
1999 112.0 39.3 288.8 301.5
2000 116.8 41.2 298.0 319.7
2001 118.3 40.8 307.3 319.2
2002 118.3 41.7 307.1 312.3
2003 113.5 41.6 288.4 300.5
2004 114.4 41.0 291.7 308.7
2005 112.7 43.0 283.3 291.7
2006 114.1 42.5 291.2 295.0
2007 110.9 41.5 278.4 294.5
2008 116.9 43.0 297.7 307.0
2009 115.2 41.6 291.1 314.1
2010 116.4 42.6 300.0 300.4
Note: Rates are the number of new cases of invasive breast cancer per 100,000 women, age-standardised to the Australian population at 30 June 2001.
Source: AIHW Australian Cancer Database.
BreastScreen Australia began in 1991. While the age-standardised incidence rate for women aged 50–69 had been increasing steadily before this—from 174.6 new cases per 100,000 women in 1982 (the first year for which data are available) to 209.3 in 1990, incidence increased more sharply from to 229.7 in 1991, then kept increasing to a peak of 307.3 new cases per 100,000 women in 2001 (Table 7.1; Figure 7.1). Thereafter, the rate has been relatively stable, and was 300.0 new cases per 100,000 in 2010 (Figure 7.1).
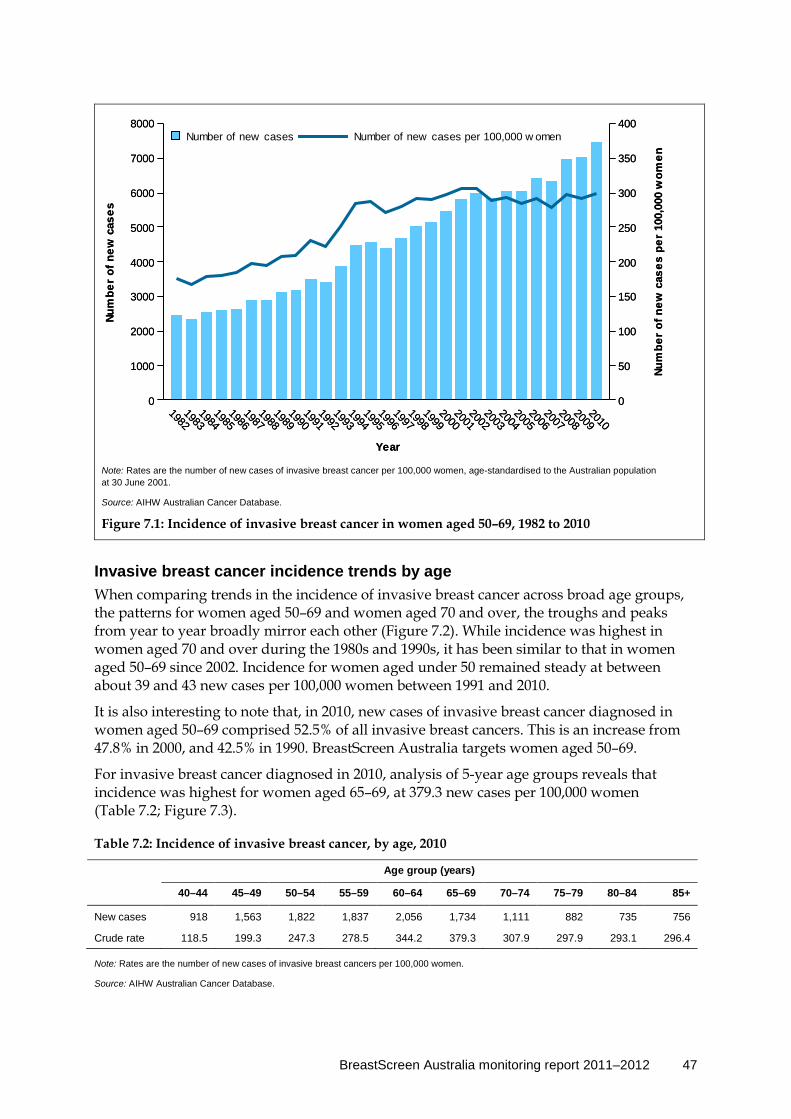
BreastScreen Australia monitoring report 2011–2012 47
Note: Rates are the number of new cases of invasive breast cancer per 100,000 women, age-standardised to the Australian population at 30 June 2001.
Source: AIHW Australian Cancer Database.
Figure 7.1: Incidence of invasive breast cancer in women aged 50–69, 1982 to 2010
Invasive breast cancer incidence trends by age When comparing trends in the incidence of invasive breast cancer across broad age groups, the patterns for women aged 50–69 and women aged 70 and over, the troughs and peaks from year to year broadly mirror each other (Figure 7.2). While incidence was highest in women aged 70 and over during the 1980s and 1990s, it has been similar to that in women aged 50–69 since 2002. Incidence for women aged under 50 remained steady at between about 39 and 43 new cases per 100,000 women between 1991 and 2010.
It is also interesting to note that, in 2010, new cases of invasive breast cancer diagnosed in women aged 50–69 comprised 52.5% of all invasive breast cancers. This is an increase from 47.8% in 2000, and 42.5% in 1990. BreastScreen Australia targets women aged 50–69.
For invasive breast cancer diagnosed in 2010, analysis of 5-year age groups reveals that incidence was highest for women aged 65–69, at 379.3 new cases per 100,000 women (Table 7.2; Figure 7.3).
Table 7.2: Incidence of invasive breast cancer, by age, 2010
Age group (years)
40–44 45–49 50–54 55–59 60–64 65–69 70–74 75–79 80–84 85+
New cases 918 1,563 1,822 1,837 2,056 1,734 1,111 882 735 756
Crude rate 118.5 199.3 247.3 278.5 344.2 379.3 307.9 297.9 293.1 296.4
Note: Rates are the number of new cases of invasive breast cancers per 100,000 women.
Source: AIHW Australian Cancer Database.
19821983
19841985
19861987
19881989
19901991
19921993
19941995
19961997
19981999
20002001
20022003
20042005
20062007
20082009
2010
Year
0
1000
2000
3000
4000
5000
6000
7000
8000Nu
mbe
r of
new
cas
es
0
50
100
150
200
250
300
350
400
Num
ber
of n
ew c
ases
per
100
,000
wom
en
Number of new cases per 100,000 w omenNumber of new cases

48 BreastScreen Australia monitoring report 2011–2012
Note: Rates are the number of new cases of invasive breast cancer per 100,000 women and age-standardised to the Australian population at 30 June 2001.
Source: AIHW Australian Cancer Database.
Figure 7.2: Incidence of invasive breast cancer, by age, 1982 to 2010
Source: AIHW Australian Cancer Database.
Figure 7.3: Incidence of invasive breast cancer, by age, 1990, 2000 and 2010
1982 1984 1986 1988 1990 1992 1994 1996 1998 2000 2002 2004 2006 2008 2010
Year
0
50
100
150
200
250
300
350
400
450
500
70+ years<50 years50–69 yearsAll ages
Number of new cases per 100,000 women
40–44 45–49 50–54 55–59 60–64 65–69 70–74 75–79 80–84 85+
Age group (years)
0
50
100
150
200
250
300
350
400
450
500
201020001990
Number of new cases per 100,000 women
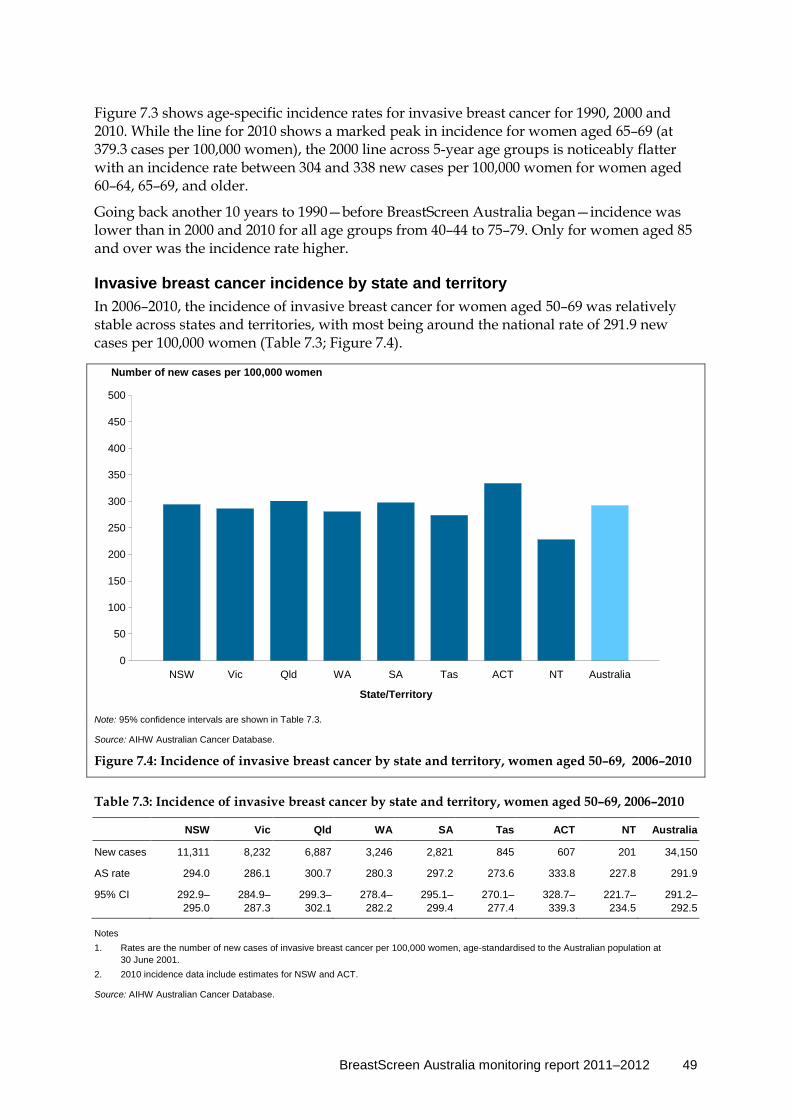
BreastScreen Australia monitoring report 2011–2012 49
Figure 7.3 shows age-specific incidence rates for invasive breast cancer for 1990, 2000 and 2010. While the line for 2010 shows a marked peak in incidence for women aged 65–69 (at 379.3 cases per 100,000 women), the 2000 line across 5-year age groups is noticeably flatter with an incidence rate between 304 and 338 new cases per 100,000 women for women aged 60–64, 65–69, and older.
Going back another 10 years to 1990—before BreastScreen Australia began—incidence was lower than in 2000 and 2010 for all age groups from 40–44 to 75–79. Only for women aged 85 and over was the incidence rate higher.
Invasive breast cancer incidence by state and territory In 2006–2010, the incidence of invasive breast cancer for women aged 50–69 was relatively stable across states and territories, with most being around the national rate of 291.9 new cases per 100,000 women (Table 7.3; Figure 7.4).
Note: 95% confidence intervals are shown in Table 7.3.
Source: AIHW Australian Cancer Database.
Figure 7.4: Incidence of invasive breast cancer by state and territory, women aged 50–69, 2006–2010
Table 7.3: Incidence of invasive breast cancer by state and territory, women aged 50–69, 2006–2010
NSW Vic Qld WA SA Tas ACT NT Australia
New cases 11,311 8,232 6,887 3,246 2,821 845 607 201 34,150
AS rate 294.0 286.1 300.7 280.3 297.2 273.6 333.8 227.8 291.9
95% CI 292.9–295.0
284.9–287.3
299.3–302.1
278.4–282.2
295.1–299.4
270.1–277.4
328.7–339.3
221.7–234.5
291.2–292.5
Notes 1. Rates are the number of new cases of invasive breast cancer per 100,000 women, age-standardised to the Australian population at
30 June 2001. 2. 2010 incidence data include estimates for NSW and ACT.
Source: AIHW Australian Cancer Database.
0
50
100
150
200
250
300
350
400
450
500
State/Territory
NSW Vic Qld WA SA Tas ACT NT Australia
Number of new cases per 100,000 women

50 BreastScreen Australia monitoring report 2011–2012
The exceptions were the least populated of the states and territories—the Australian Capital Territory, with a higher incidence of 333.8 new cases per 100,000 women, and the Northern Territory, with a lower incidence of 227.8. Data for the two least-populated jurisdictions are, however, subject to variation due to smaller numbers, even with 5 years of data combined.
Invasive breast cancer incidence by remoteness area The incidence of invasive breast cancer in women aged 50–69 decreased with increasing level of remoteness. In 2006–2010, incidence ranged from 271.7 new cases per 100,000 women in Inner regional locations to 204.1 in Very remote locations (Table 7.4; Figure 7.5).
Note: 95% confidence intervals are shown in Table 7.4.
Source: AIHW Australian Cancer Database.
Figure 7.5: Incidence of invasive breast cancer by remoteness area, women aged 50–69, 2006–2010
Table 7.4: Incidence of invasive breast cancer by remoteness area, women aged 50–69, 2006–2010
Major cities Inner regional Outer regional Remote Very remote Australia
New cases 21,058 6,947 3,036 403 129 34,150
AS rate 270.9 271.7 263.0 268.8 204.1 291.9
95% CI 270.2–271.7 270.4–272.9 261.2–264.9 263.7–274.2 197.3–211.6 291.2–292.5
Notes 1. Rates are the number of new cases of invasive breast cancer per 100,000 women, age-standardised to the Australian population at
30 June 2001. 2. Remoteness areas were assigned using the woman’s residential postcode according to the Australian Standard Geographical Classification
for 2006. Not all postcodes can be assigned to a remoteness area, therefore categories do not add exactly to the total for Australia.
Source: AIHW Australian Cancer Database.
0
50
100
150
200
250
300
350
400
450
500
Remoteness area
Majorcities
Innerregional
Outerregional
Remote Veryremote
Australia
Number of new cases per 100,000 women
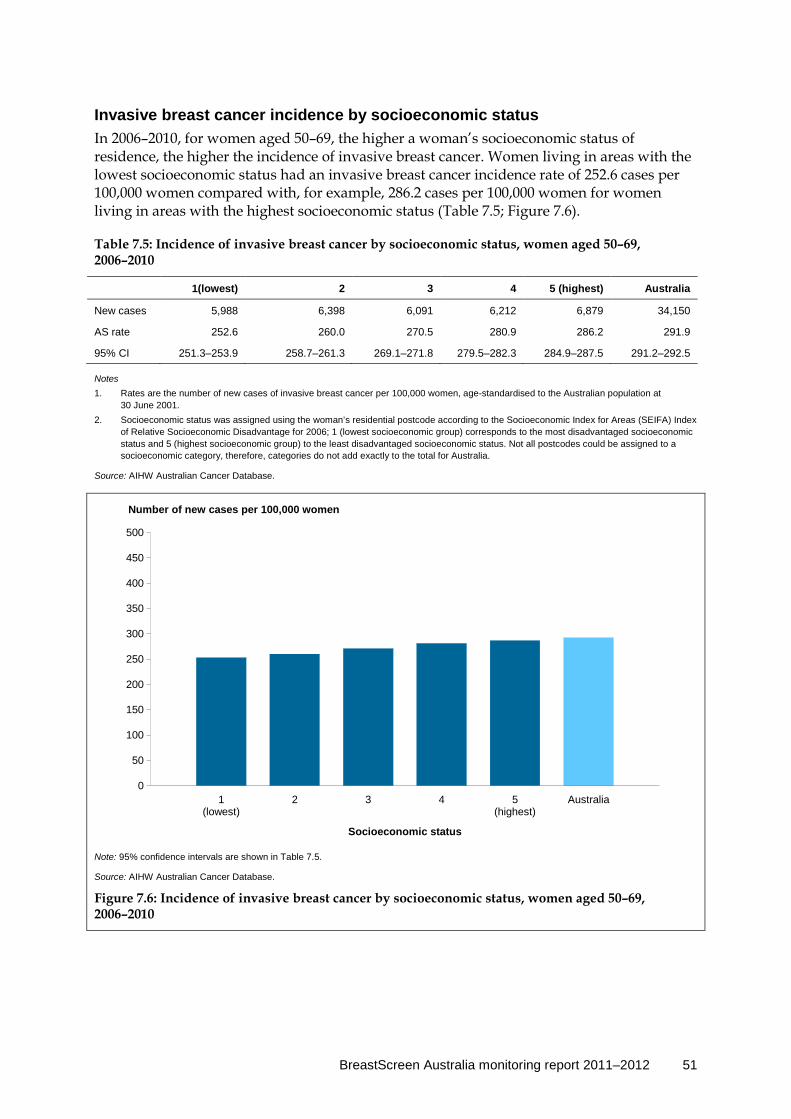
BreastScreen Australia monitoring report 2011–2012 51
Invasive breast cancer incidence by socioeconomic status In 2006–2010, for women aged 50–69, the higher a woman’s socioeconomic status of residence, the higher the incidence of invasive breast cancer. Women living in areas with the lowest socioeconomic status had an invasive breast cancer incidence rate of 252.6 cases per 100,000 women compared with, for example, 286.2 cases per 100,000 women for women living in areas with the highest socioeconomic status (Table 7.5; Figure 7.6).
Table 7.5: Incidence of invasive breast cancer by socioeconomic status, women aged 50–69, 2006–2010
1(lowest) 2 3 4 5 (highest) Australia
New cases 5,988 6,398 6,091 6,212 6,879 34,150
AS rate 252.6 260.0 270.5 280.9 286.2 291.9
95% CI 251.3–253.9 258.7–261.3 269.1–271.8 279.5–282.3 284.9–287.5 291.2–292.5
Notes 1. Rates are the number of new cases of invasive breast cancer per 100,000 women, age-standardised to the Australian population at
30 June 2001. 2. Socioeconomic status was assigned using the woman’s residential postcode according to the Socioeconomic Index for Areas (SEIFA) Index
of Relative Socioeconomic Disadvantage for 2006; 1 (lowest socioeconomic group) corresponds to the most disadvantaged socioeconomic status and 5 (highest socioeconomic group) to the least disadvantaged socioeconomic status. Not all postcodes could be assigned to a socioeconomic category, therefore, categories do not add exactly to the total for Australia.
Source: AIHW Australian Cancer Database.
Note: 95% confidence intervals are shown in Table 7.5.
Source: AIHW Australian Cancer Database.
Figure 7.6: Incidence of invasive breast cancer by socioeconomic status, women aged 50–69, 2006–2010
0
50
100
150
200
250
300
350
400
450
500
Socioeconomic status
1(lowest)
2 3 4 5(highest)
Australia
Number of new cases per 100,000 women

52 BreastScreen Australia monitoring report 2011–2012
Invasive breast cancer incidence by Indigenous status The collection of reliable information by the state and territory cancer registries on the Indigenous status of individuals diagnosed with cancer is problematic. This is because primary cancer diagnosis information is sourced from pathology forms which, in most states and territories, currently do not have the capacity to record this information. The registries collect information about Indigenous status from additional sources such as hospital records and death records, which affects the completeness and correctness of these data.
This means that reliable national data on the incidence of cancer for Aboriginal and Torres Strait Islander Australians are not available, because in some jurisdictions the level of identification of Indigenous status is not considered sufficient to enable meaningful analysis.
Over the 5-year period 2005–2009, data for New South Wales, Queensland, Western Australia and the Northern Territory were considered of sufficient quality and have been used to examine the incidence of invasive breast cancer by Indigenous status.
While the majority (84%) of Aboriginal and Torres Strait Islander people reside in these four jurisdictions (ABS 2009), the degree to which these data are representative of data for all Aboriginal and Torres Strait Islander people in Australia is unknown.
Notes
1. Some states and territories use an imputation method for determining Indigenous cancers that may lead to differences between these data and those shown in jurisdictional cancer incidence reports.
2. The rates were age-standardised to the Australian population as at 30 June 2001.
3 95% confidence intervals are shown in Table 7.6.
Source: AIHW Australian Cancer Database.
Figure 7.7: Incidence of breast cancer (New South Wales, Queensland, Western Australia and the Northern Territory), by Indigenous status, women aged 50–69, 2005–2009
0
50
100
150
200
250
300
350
400
450
500
Indigenous status
Indigenous Non-Indigenous Total
Number of new cases per 100,000 women
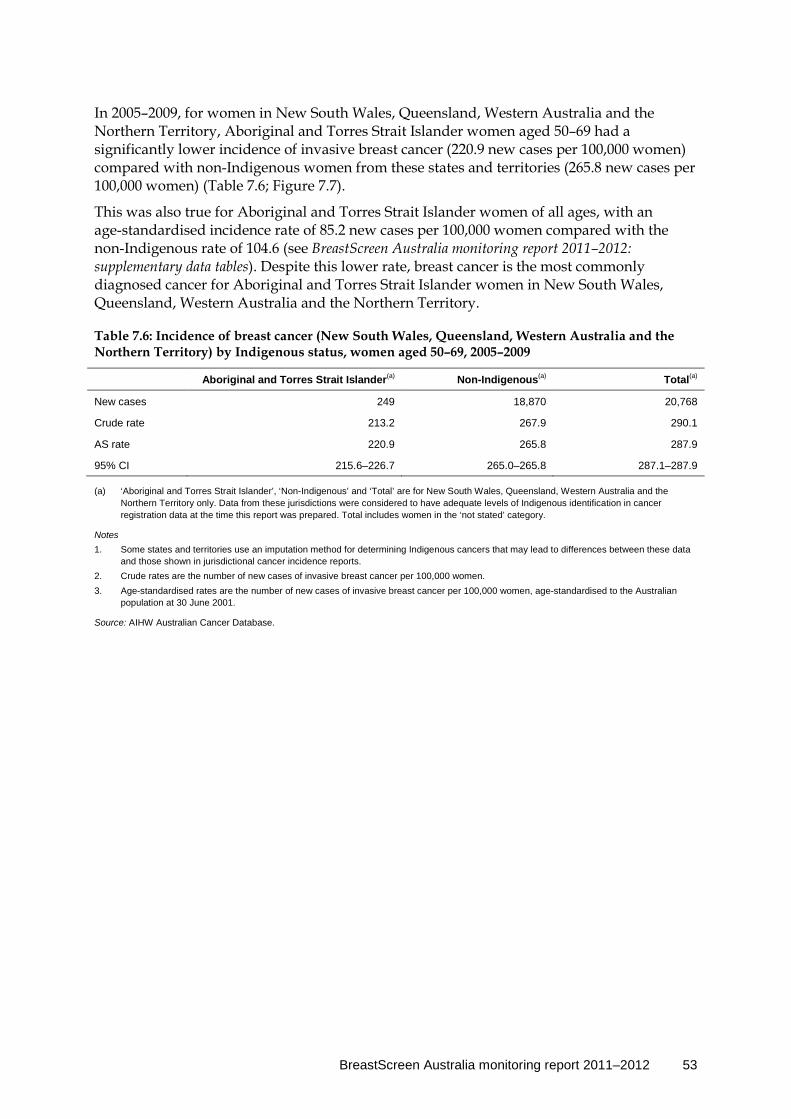
BreastScreen Australia monitoring report 2011–2012 53
In 2005–2009, for women in New South Wales, Queensland, Western Australia and the Northern Territory, Aboriginal and Torres Strait Islander women aged 50–69 had a significantly lower incidence of invasive breast cancer (220.9 new cases per 100,000 women) compared with non-Indigenous women from these states and territories (265.8 new cases per 100,000 women) (Table 7.6; Figure 7.7).
This was also true for Aboriginal and Torres Strait Islander women of all ages, with an age-standardised incidence rate of 85.2 new cases per 100,000 women compared with the non-Indigenous rate of 104.6 (see BreastScreen Australia monitoring report 2011–2012: supplementary data tables). Despite this lower rate, breast cancer is the most commonly diagnosed cancer for Aboriginal and Torres Strait Islander women in New South Wales, Queensland, Western Australia and the Northern Territory.
Table 7.6: Incidence of breast cancer (New South Wales, Queensland, Western Australia and the Northern Territory) by Indigenous status, women aged 50–69, 2005–2009
Aboriginal and Torres Strait Islander(a) Non-Indigenous(a) Total(a)
New cases 249 18,870 20,768
Crude rate 213.2 267.9 290.1
AS rate 220.9 265.8 287.9
95% CI 215.6–226.7 265.0–265.8 287.1–287.9
(a) ‘Aboriginal and Torres Strait Islander’, ‘Non-Indigenous’ and ‘Total’ are for New South Wales, Queensland, Western Australia and the Northern Territory only. Data from these jurisdictions were considered to have adequate levels of Indigenous identification in cancer registration data at the time this report was prepared. Total includes women in the ‘not stated’ category.
Notes 1. Some states and territories use an imputation method for determining Indigenous cancers that may lead to differences between these data
and those shown in jurisdictional cancer incidence reports. 2. Crude rates are the number of new cases of invasive breast cancer per 100,000 women. 3. Age-standardised rates are the number of new cases of invasive breast cancer per 100,000 women, age-standardised to the Australian
population at 30 June 2001.
Source: AIHW Australian Cancer Database.
54 BreastScreen Australia monitoring report 2011–2012
Indicator 7b Ductal carcinoma in situ incidence
What you need to know about DCIS incidence Definition: The number of new cases of ductal carcinoma in situ (DCIS) per 100,000 estimated resident female population in a 12-month period.
Rationale: DCIS incidence data provide information about the underlying level of DCIS in Australia. DCIS was rarely detected before breast screening was introduced. Since the introduction of screening mammography, detection of DCIS has increased. Annual monitoring of these data with various stratifications (such as age or location) may reveal findings of concern or positive trends that can be used to inform BreastScreen Australia as well as broader policies for DCIS in Australian women.
Guide to interpretation: These data include both screen-detected DCIS cases (through BreastScreen Australia) and DCIS cases detected outside the screening program.
Incidence data are reported per 100,000 women in the population.
Incidence of DCIS by state and territory is reported over a 5-year instead of a 12-month period to improve the stability and comparability of rates due to the small number of new cases in less-populated areas. Further, to produce comparable rates from the relatively small number of DCIS cases, incidence of DCIS is reported by 10-year age groups.
State and territory cancer registries are the source of DCIS incidence data.
The most recent incidence of DCIS data are for new cases diagnosed in 2008.
What the data tell us about DCIS incidence
Trend Incidence of DCIS for women aged 50–69 increased over time from 29.9 new cases per 100,000 women in 1996 to a peak of 45.7 new cases in 2001, thereafter remaining steady at about 42 to 46 new cases per 100,000 women. In 2008, the incidence in women aged 50–69 was 45.6 new cases per 100,000 women.
The recent trend is therefore one of no substantive change.
2008 For women aged 50–69, there were 1,075 new cases of DCIS, or 45.6 new cases per 100,000 women. In the same year, there were 1,673 new cases, or 14.3 new cases per 100,000, for women of all ages.

BreastScreen Australia monitoring report 2011–2012 55
More information about DCIS DCIS is a non-invasive tumour arising from the lining of the ducts that carry milk from the milk-producing lobules to the nipple. Cell changes seen in DCIS are similar to those in invasive breast cancer. However, unlike invasive breast cancer, DCIS does not invade surrounding breast tissue, and is instead contained entirely within the milk duct.
Incidence of DCIS measures the number of new cases of DCIS diagnosed each year. DCIS is presently not included in the Australian Cancer Database; however, state and territory cancer registries have been routinely collecting data on DCIS for more than 10 years, and are the source of DCIS incidence data reported here. Similar to invasive breast cancer incidence data, DCIS data refer to the number of new cases diagnosed and not the number of women diagnosed. Further, if a woman is diagnosed with DCIS and invasive breast cancer, only the more serious diagnosis of invasive breast cancer is counted.
Detailed analyses
DCIS incidence 2008 There were 1,673 new cases of DCIS in Australian women in 2008. This is equivalent to 15.5 new cases per 100,000 women in the population, which, when age-standardised to allow analyses of trends and differentials, equates to an incidence rate of 14.3.
Of the 1,673 new cases, 1,075 were in women aged 50–69, the target population of BreastScreen Australia. These 1,075 new cases represent 45.9 new cases for every 100,000 women in the population. When age-standardised, this equates to an incidence rate of 45.6.
Box 7.2: How many DCIS cases were detected through BreastScreen Australia?
It was estimated that 76% of DCIS cases diagnosed in women aged 50–69, and 64% of DCIS cases in women aged 40 or over were detected through BreastScreen Australia in 2008.
DCIS incidence trends Incidence of DCIS has increased over time (Table 7.7). For women aged 50–69, it has increased steadily from 29.9 new cases per 100,000 women in 1996 to a peak of 45.7 new cases in 2001, thereafter remaining steady at about 42 to 46 new cases per 100,000 women. In 2008, the incidence in women aged 50–69 was 45.6 new cases per 100,000.
Table 7.7: Incidence of DCIS, women aged 50–69, 1996 to 2008
1996 1997 1998 1999 2000 2001 2002 2003 2004 2005 2006 2007 2008
AS rate 29.9 33.3 37.0 37.9 41.0 45.7 42.6 41.9 44.3 43.4 43.1 43.4 45.6
95% CI
27.3–32.7
30.6–36.2
34.2–40.0
35.1–40.8
38.1–44.0
42.7–48.9
39.7–45.6
39.1–44.8
41.5–47.2
40.6–46.3
40.4–45.9
40.7–46.2
42.9–48.4
Note: Rates are the number of new cases of DCIS per 100,000 women and age-standardised to the Australian population at 30 June 2001.
Source: AIHW analysis of state and territory cancer registry data.
56 BreastScreen Australia monitoring report 2011–2012
DCIS incidence by age In 2008, the highest incidence of DCIS was for women aged 60–69, with 52.5 new cases per 100,000 women; this was followed by women aged 50–59, with 41.1 (Table 7.8).
Table 7.8: Incidence of DCIS, by age, 2008
Age group (years)
40–49 50–59 60–69 70+
New cases 299 559 516 246
Crude rate 19.3 41.1 52.5 21.9
Note: Rates are the number of new cases of DCIS per 100,000 women.
Source: AIHW analysis of state and territory cancer registry data.
DCIS incidence by state and territory In 2004–2008, the incidence of DCIS across the states and territories for women aged 50–69 varied between 33.0 and 54.2 new cases per 100,000 women (Table 7.9), although caution should be used when interpreting rates from small numbers such as these.
Table 7.9: Incidence of DCIS by state and territory, women aged 50–69, 2004–2008
NSW Vic Qld WA SA Tas ACT NT Australia
New cases 1,485 1,232 1,021 584 328 121 76 26 4,873
AS rate 40.7 45.0 47.1 54.2 36.3 41.8 44.8 33.0 44.0
95% CI 38.6–42.8 42.5–47.6 44.2–50.1 49.9–58.8 32.5–40.4 34.7–50.0 35.3–56.1 21.3–48.6 42.7–45.2
Note: Rates are the number of new cases of DCIS per 100,000 women and age-standardised to the Australian population at 30 June 2001.
Source: AIHW analysis of state and territory cancer registry data.
BreastScreen Australia monitoring report 2011–2012 57
Indicator 8 Mortality
What you need to know about mortality Definition: The number of deaths from breast cancer per 100,000 estimated resident female population in a 12-month period.
Rationale: BreastScreen Australia aims to reduce mortality from breast cancer.
Guide to interpretation: These data include mortality from all breast cancers, whether or not they were detected through BreastScreen Australia.
Mortality data are reported per 100,000 women in the population.
Mortality from breast cancer by state and territory, remoteness area, socioeconomic status and Indigenous status is reported over a 5-year period to improve the stability and comparability of rates due to the small number of deaths in less populated areas and in Aboriginal and Torres Strait Islander women.
The National Mortality Database is the source of breast cancer mortality data.
The most recent data for mortality from breast cancer are deaths in 2011.
What the data tell us about mortality
Trend Mortality fell from 68.2 deaths per 100,000 women in 1991, when BreastScreen Australia commenced, to 43.7 per 100,000 women in 2011.
The recent trend is favourable, with a continuation of this fall in recent years, from 48.1 deaths per 100,000 women in 2007 to 43.7 deaths per 100,000 women in 2011.
2011 In 2011, there were 1,130 deaths from breast cancer in women aged 50–69 (the target population of BreastScreen Australia), or 43.7 deaths per 100,000 women. There were 2,914 deaths, or 21.9 deaths per 100,000 women, for women of all ages.
Mortality by Indigenous status In 2007–2011 mortality from breast cancer was significantly higher in Aboriginal and Torres Strait Islander women (52.3 deaths per 100,000) from New South Wales, Queensland, Western Australia, South Australia and the Northern Territory compared with non-Indigenous women (44.4 deaths per 100,000) from these states and territories.
58 BreastScreen Australia monitoring report 2011–2012
More information about mortality Mortality statistics are one of the most comprehensively collected national data sets. Registration of death is a legal requirement in Australia and, as a result, the data set is considered to have high coverage and completeness. Registration of deaths is the responsibility of the Registrar of Births, Deaths and Marriages in each state and territory. The mortality data used here were provided by the Registries of Births, Deaths and Marriages and the National Coronial Information System and coded by the ABS. These data are maintained at the AIHW in the National Mortality Database.
Mortality from breast cancer measures the number of deaths each year for which breast cancer was the underlying cause of death. Analyses are based on the year of death, except for 2011 (the latest year for which mortality data are available), which is based on the year of registration of death. Note that about 5% of deaths are not registered until the year following the death (ABS 2012). Further, as noted in Appendix C, deaths registered in 2009 and earlier are based on the final version of cause of death data; deaths registered in 2010 and 2011 are based on revised and preliminary versions, respectively and are subject to further revision by the ABS.
Detailed analyses
Mortality in 2011 In 2011, there were 2,914 deaths from breast cancer in Australian women. This is equivalent to 26.0 deaths for every 100,000 women in the population, which, when age-standardised to allow analysis of trends and differentials, equates to a mortality rate of 21.9 per 100,000 women.
Of the 2,914 deaths, 1,130 were in women aged 50–69, the target population of BreastScreen Australia. These 1,130 deaths represent 44.8 deaths for every 100,000 women aged 50–69 in the population. When age-standardised to allow analysis of trends and differentials, this equates to a mortality rate of 43.7 deaths per 100,000 women for women aged 50–69.
In the broader context of cancer deaths in Australian women, breast cancer was the second most common cancer causing death in Australian women in 2011 (behind lung cancer). In 2011, the risk of dying from breast cancer was 1 in 64 by age 75 and 1 in 38 by age 85 (AIHW 2014).
Mortality trends Mortality from breast cancer has decreased over time in Australia.
For women aged 50–69, mortality remained relatively steady between 1982 and 1990 (the year before BreastScreen Australia began).
However, it decreased from 68.2 deaths per 100,000 women in 1991, when BreastScreen Australia started, to 43.7 per 100,000 in 2011 (the latest year for which data are available) (Table 8.1; Figure 8.1). This was a fall of 35.9% between 1991 and 2011.
The fall in breast cancer mortality in women aged 50–69 has been attributed in part to the early detection of breast cancer through BreastScreen Australia, along with advances in the management and treatment of breast cancer (BreastScreen Australia EAC 2009a).
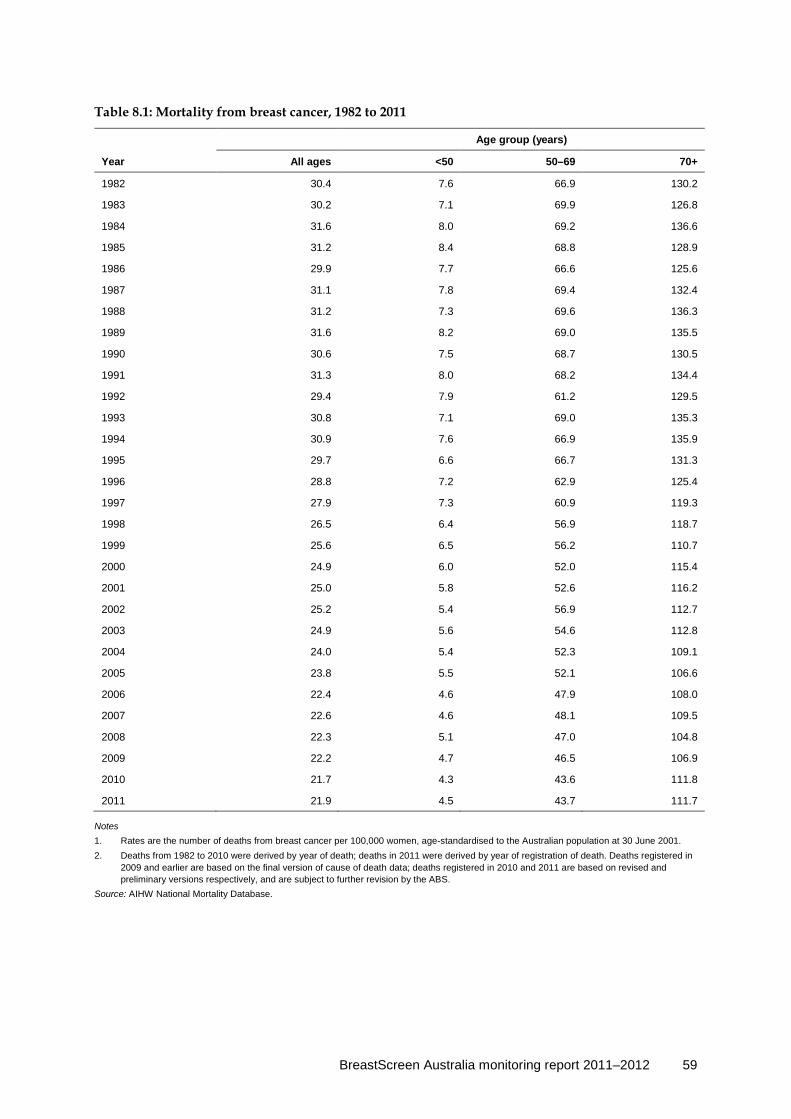
BreastScreen Australia monitoring report 2011–2012 59
Table 8.1: Mortality from breast cancer, 1982 to 2011
Age group (years)
Year All ages <50 50–69 70+
1982 30.4 7.6 66.9 130.2
1983 30.2 7.1 69.9 126.8
1984 31.6 8.0 69.2 136.6
1985 31.2 8.4 68.8 128.9
1986 29.9 7.7 66.6 125.6
1987 31.1 7.8 69.4 132.4
1988 31.2 7.3 69.6 136.3
1989 31.6 8.2 69.0 135.5
1990 30.6 7.5 68.7 130.5
1991 31.3 8.0 68.2 134.4
1992 29.4 7.9 61.2 129.5
1993 30.8 7.1 69.0 135.3
1994 30.9 7.6 66.9 135.9
1995 29.7 6.6 66.7 131.3
1996 28.8 7.2 62.9 125.4
1997 27.9 7.3 60.9 119.3
1998 26.5 6.4 56.9 118.7
1999 25.6 6.5 56.2 110.7
2000 24.9 6.0 52.0 115.4
2001 25.0 5.8 52.6 116.2
2002 25.2 5.4 56.9 112.7
2003 24.9 5.6 54.6 112.8
2004 24.0 5.4 52.3 109.1
2005 23.8 5.5 52.1 106.6
2006 22.4 4.6 47.9 108.0
2007 22.6 4.6 48.1 109.5
2008 22.3 5.1 47.0 104.8
2009 22.2 4.7 46.5 106.9
2010 21.7 4.3 43.6 111.8
2011 21.9 4.5 43.7 111.7
Notes 1. Rates are the number of deaths from breast cancer per 100,000 women, age-standardised to the Australian population at 30 June 2001. 2. Deaths from 1982 to 2010 were derived by year of death; deaths in 2011 were derived by year of registration of death. Deaths registered in
2009 and earlier are based on the final version of cause of death data; deaths registered in 2010 and 2011 are based on revised and preliminary versions respectively, and are subject to further revision by the ABS.
Source: AIHW National Mortality Database.

60 BreastScreen Australia monitoring report 2011–2012
Notes
1. Rates are the number of deaths from breast cancer per 100,000 women, age-standardised to the Australian population at 30 June 2001.
2. Deaths from 1982–2010 were derived by year of death; deaths in 2011 were derived by year of registration of death. Deaths registered in 2009 and earlier are based on the final version of cause of death data; deaths registered in 2010 and 2011 are based on revised and preliminary versions respectively, and are subject to further revision by the ABS.
Source: AIHW analysis of the National Mortality Database.
Figure 8.1: Mortality from breast cancer, women aged 50–69, 1982 to 2011
Breast cancer mortality by age For all age groups combined, mortality from breast cancer fell from 31.3 deaths per 100,000 women in 1991, when BreastScreen Australia was introduced, to 21.9 deaths per 100,000 women in 2011 (Table 8.1). Trends by broad age groups are shown in Figure 8.2.
Analysis of 5-year age groups reveals that, in 2011, mortality increased with age, from 13.1 deaths per 100,000 women aged 40–44 to 196.6 for women aged 85 and over (Table 8.2). This pattern was similar to those for 2001 and 1991, respectively (Figure 8.3).
Table 8.2: Mortality from breast cancer, by age, 2011
Age group (years)
40–44 45–49 50–54 55–59 60–64 65–69 70–74 75–79 80–84 85+
Deaths 105 176 221 267 335 307 308 269 338 520
Crude rate 13.1 22.6 29.3 39.6 54.5 64.0 83.2 89.7 133.4 196.6
Notes 1. Rates are the number of deaths from breast cancer per 100,000 women. 2. Deaths in 2011 were derived using year of registration. Deaths registered in 2011 are based on the preliminary version of cause of death
data and are subject to further revision by the ABS.
Source: AIHW National Mortality Database.
19821983
19841985
19861987
19881989
19901991
19921993
19941995
19961997
19981999
20002001
20022003
20042005
20062007
20082009
20102011
0
100
200
300
400
500
600
700
800
900
1000
1100
1200
1300
1400
1500Nu
mbe
r of
dea
ths
0
10
20
30
40
50
60
70
80
90
100
Num
ber
of d
eath
s pe
r 10
0,00
0 w
omen
Number of deaths per 100,000 w omenNumber of deaths
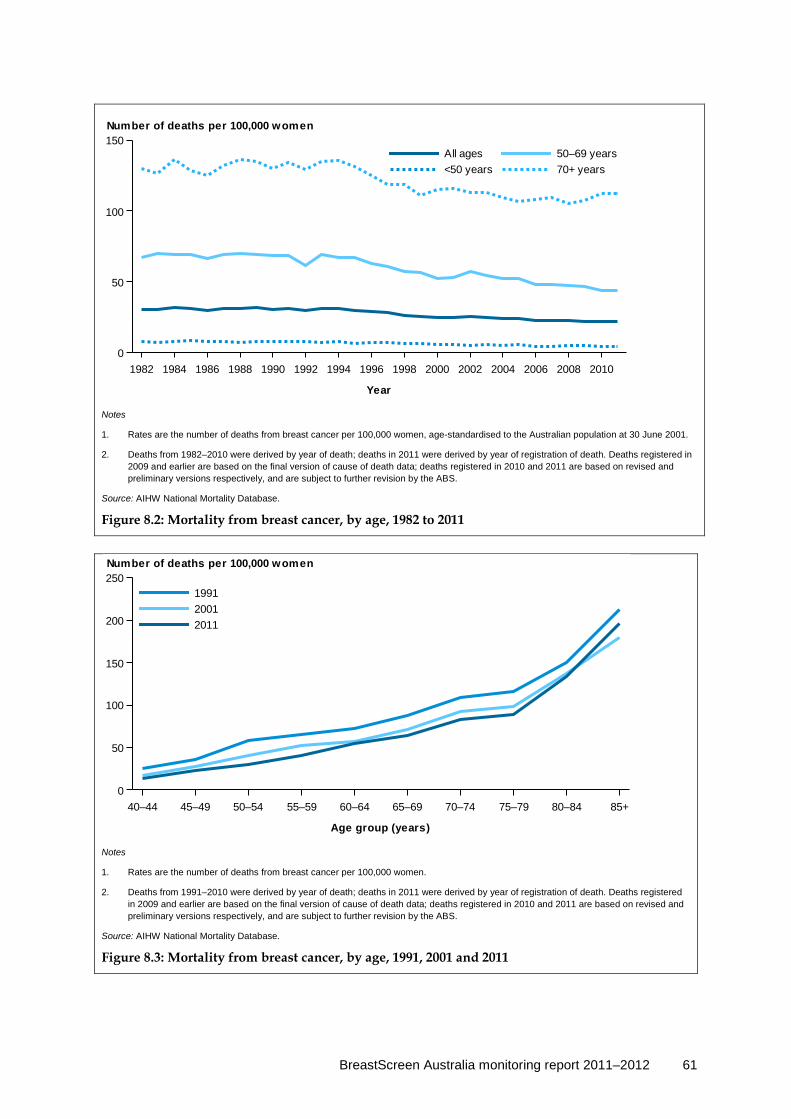
BreastScreen Australia monitoring report 2011–2012 61
Notes
1. Rates are the number of deaths from breast cancer per 100,000 women, age-standardised to the Australian population at 30 June 2001.
2. Deaths from 1982–2010 were derived by year of death; deaths in 2011 were derived by year of registration of death. Deaths registered in 2009 and earlier are based on the final version of cause of death data; deaths registered in 2010 and 2011 are based on revised and preliminary versions respectively, and are subject to further revision by the ABS.
Source: AIHW National Mortality Database.
Figure 8.2: Mortality from breast cancer, by age, 1982 to 2011
Notes
1. Rates are the number of deaths from breast cancer per 100,000 women.
2. Deaths from 1991–2010 were derived by year of death; deaths in 2011 were derived by year of registration of death. Deaths registered in 2009 and earlier are based on the final version of cause of death data; deaths registered in 2010 and 2011 are based on revised and preliminary versions respectively, and are subject to further revision by the ABS.
Source: AIHW National Mortality Database.
Figure 8.3: Mortality from breast cancer, by age, 1991, 2001 and 2011
1982 1984 1986 1988 1990 1992 1994 1996 1998 2000 2002 2004 2006 2008 2010
Year
0
50
100
150
70+ years<50 years50–69 yearsAll ages
Number of deaths per 100,000 women
40–44 45–49 50–54 55–59 60–64 65–69 70–74 75–79 80–84 85+
Age group (years)
0
50
100
150
200
250
201120011991
Number of deaths per 100,000 women

62 BreastScreen Australia monitoring report 2011–2012
Mortality from breast cancer by state and territory In 2007–2011, mortality from breast cancer for women aged 50–69 was similar across most states and territories (Table 8.3; Figure 8.4).
Table 8.3: Mortality from breast cancer by state and territory, 2007–2011
NSW Vic Qld WA SA Tas ACT NT Australia
50–69 years
Deaths 1,849 1,385 1,047 504 501 153 81 33 5,553
AS rate 46.4 46.3 43.6 41.9 51.3 47.9 42.8 37.1 45.7
95% CI 46.0–46.8 45.8–46.8 43.1–44.2 41.2–42.7 50.4–52.2 46.5–49.6 41.1–44.8 34.8–40.2 45.5–45.9
All ages
Deaths 4,767 3,621 2,505 1,245 1,226 376 198 66 14,004
AS rate 22.5 22.7 21.1 20.8 23.0 22.9 22.8 20.7 22.1
95% CI 21.7–23.3 21.8–23.6 20.2–22.0 19.5–22.1 21.3–24.8 20.0–26.1 19.8–26.1 17.9–24.1 21.7–22.6
Notes 1. Rates are the number of deaths from breast cancer per 100,000 women, age-standardised to the Australian population at 30 June 2001. 2. Deaths between 2007 and 2010 are derived from year of death; deaths in 2011 are derived from year of registration. Deaths registered in
2009 and earlier are based on the final version of cause of death data; deaths registered in 2010 and 2011 are based on revised and preliminary versions respectively, and are subject to further revision by the ABS.
Source: AIHW National Mortality Database.
Notes
1. 95% confidence intervals are shown in Table 8.3.
2. Deaths from 2002–2010 were derived by year of death; deaths in 2011 were derived by year of registration of death. Deaths registered in 2009 and earlier are based on the final version of cause of death data; deaths registered in 2010 and 2011 are based on revised and preliminary versions respectively, and are subject to further revision by the ABS.
Source: AIHW National Mortality Database.
Figure 8.4: Mortality from breast cancer by state and territory, women aged 50–69, 2007–2011
0
10
20
30
40
50
60
70
80
90
100
State/Territory
NSW Vic Qld WA SA Tas ACT NT Australia
Number of deaths per 100,000 women

BreastScreen Australia monitoring report 2011–2012 63
Mortality from breast cancer by remoteness area In 2007–2011, mortality from breast cancer for women aged 50–69 was highest in Remote areas at 52.3 (Table 8.4; Figure 8.5).
Table 8.4: Mortality from breast cancer, by remoteness area, 2007–2011
Major cities Inner regional Outer regional Remote Very remote Australia
50–69 years
Deaths 3,698 1,227 511 81 26 5,553
AS rate 45.9 45.8 42.7 52.3 40.6 45.7 95% CI 45.6–46.2 45.3–46.3 42.0–43.4 50.2–54.8 37.7–44.2 45.5–45.9
All ages
Deaths 9,471 3,038 1,262 147 57 14,004
AS rate 22.2 22.2 21.6 21.0 22.2 22.1 95% CI 21.7–22.7 21.1–23.2 20.2–23.0 17.9–24.3 18.8–26.2 21.7–22.6
Notes 1. Rates are the number of deaths from breast cancer per 100,000 women, age-standardised to the Australian population at 30 June 2001. 2. Deaths between 2007 and 2010 are derived from year of death; deaths in 2011 are derived from year of registration. Deaths registered in
2009 and earlier are based on the final version of cause of death data; deaths registered in 2010 and 2011 are based on revised and preliminary versions respectively, and are subject to further revision by the ABS.
3. Remoteness areas were assigned using the woman’s residential postcode according to the Australian Standard Geographical Classification for 2006. Not all postcodes can be assigned to a remoteness area, therefore categories do not add exactly to the totals for Australia.
Source: AIHW National Mortality Database.
Notes
1. 95% confidence intervals are shown in Table 8.3.
2. Deaths from 2002–2010 were derived by year of death; deaths in 2011 were derived by year of registration of death. Deaths registered in 2009 and earlier are based on the final version of cause of death data; deaths registered in 2010 and 2011 are based on revised and preliminary versions respectively, and are subject to further revision by the ABS.
Source: AIHW National Mortality Database.
Figure 8.5: Mortality from breast cancer by remoteness area, women aged 50–69, 2007–2011
0
10
20
30
40
50
60
70
80
90
100
Remoteness area
Majorcities
Innerregional
Outerregional
Remote Veryremote
Australia
Number of deaths per 100,000 women
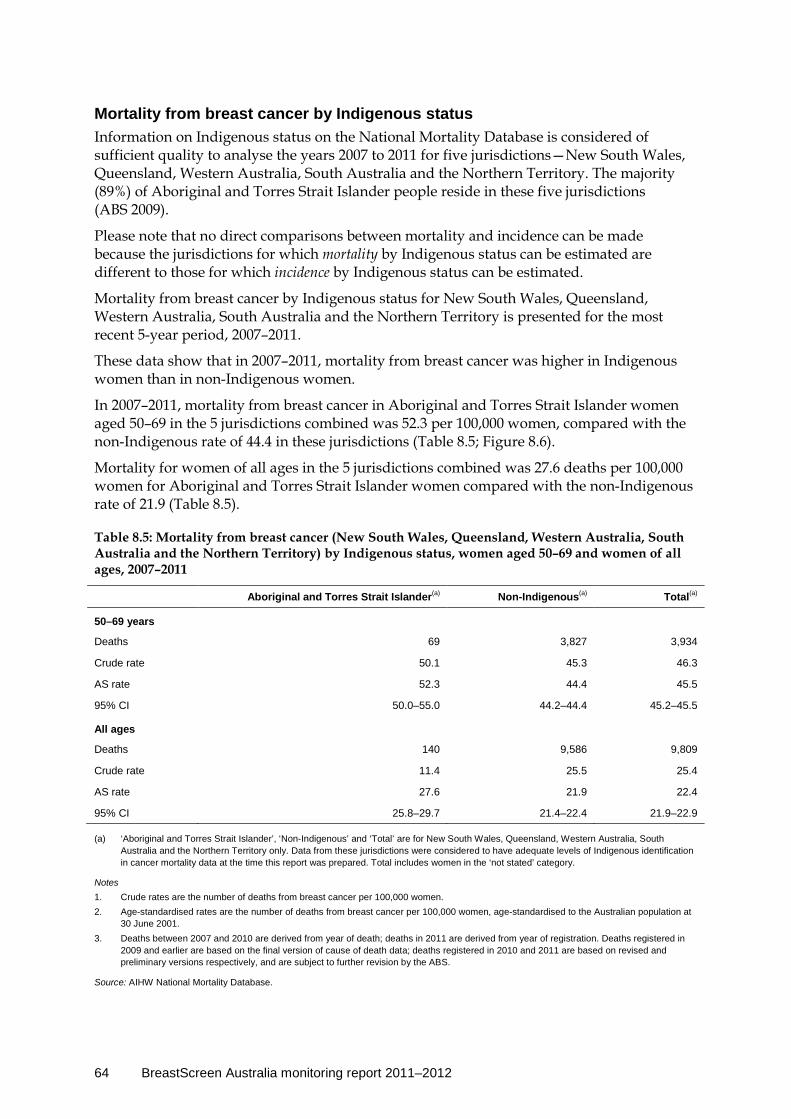
64 BreastScreen Australia monitoring report 2011–2012
Mortality from breast cancer by Indigenous status Information on Indigenous status on the National Mortality Database is considered of sufficient quality to analyse the years 2007 to 2011 for five jurisdictions—New South Wales, Queensland, Western Australia, South Australia and the Northern Territory. The majority (89%) of Aboriginal and Torres Strait Islander people reside in these five jurisdictions (ABS 2009).
Please note that no direct comparisons between mortality and incidence can be made because the jurisdictions for which mortality by Indigenous status can be estimated are different to those for which incidence by Indigenous status can be estimated.
Mortality from breast cancer by Indigenous status for New South Wales, Queensland, Western Australia, South Australia and the Northern Territory is presented for the most recent 5-year period, 2007–2011.
These data show that in 2007–2011, mortality from breast cancer was higher in Indigenous women than in non-Indigenous women.
In 2007–2011, mortality from breast cancer in Aboriginal and Torres Strait Islander women aged 50–69 in the 5 jurisdictions combined was 52.3 per 100,000 women, compared with the non-Indigenous rate of 44.4 in these jurisdictions (Table 8.5; Figure 8.6).
Mortality for women of all ages in the 5 jurisdictions combined was 27.6 deaths per 100,000 women for Aboriginal and Torres Strait Islander women compared with the non-Indigenous rate of 21.9 (Table 8.5).
Table 8.5: Mortality from breast cancer (New South Wales, Queensland, Western Australia, South Australia and the Northern Territory) by Indigenous status, women aged 50–69 and women of all ages, 2007–2011
Aboriginal and Torres Strait Islander(a) Non-Indigenous(a) Total(a)
50–69 years
Deaths 69 3,827 3,934
Crude rate 50.1 45.3 46.3
AS rate 52.3 44.4 45.5
95% CI 50.0–55.0 44.2–44.4 45.2–45.5
All ages
Deaths 140 9,586 9,809
Crude rate 11.4 25.5 25.4
AS rate 27.6 21.9 22.4
95% CI 25.8–29.7 21.4–22.4 21.9–22.9
(a) ‘Aboriginal and Torres Strait Islander’, ‘Non-Indigenous’ and ‘Total’ are for New South Wales, Queensland, Western Australia, South Australia and the Northern Territory only. Data from these jurisdictions were considered to have adequate levels of Indigenous identification in cancer mortality data at the time this report was prepared. Total includes women in the ‘not stated’ category.
Notes 1. Crude rates are the number of deaths from breast cancer per 100,000 women. 2. Age-standardised rates are the number of deaths from breast cancer per 100,000 women, age-standardised to the Australian population at
30 June 2001. 3. Deaths between 2007 and 2010 are derived from year of death; deaths in 2011 are derived from year of registration. Deaths registered in
2009 and earlier are based on the final version of cause of death data; deaths registered in 2010 and 2011 are based on revised and preliminary versions respectively, and are subject to further revision by the ABS.
Source: AIHW National Mortality Database.
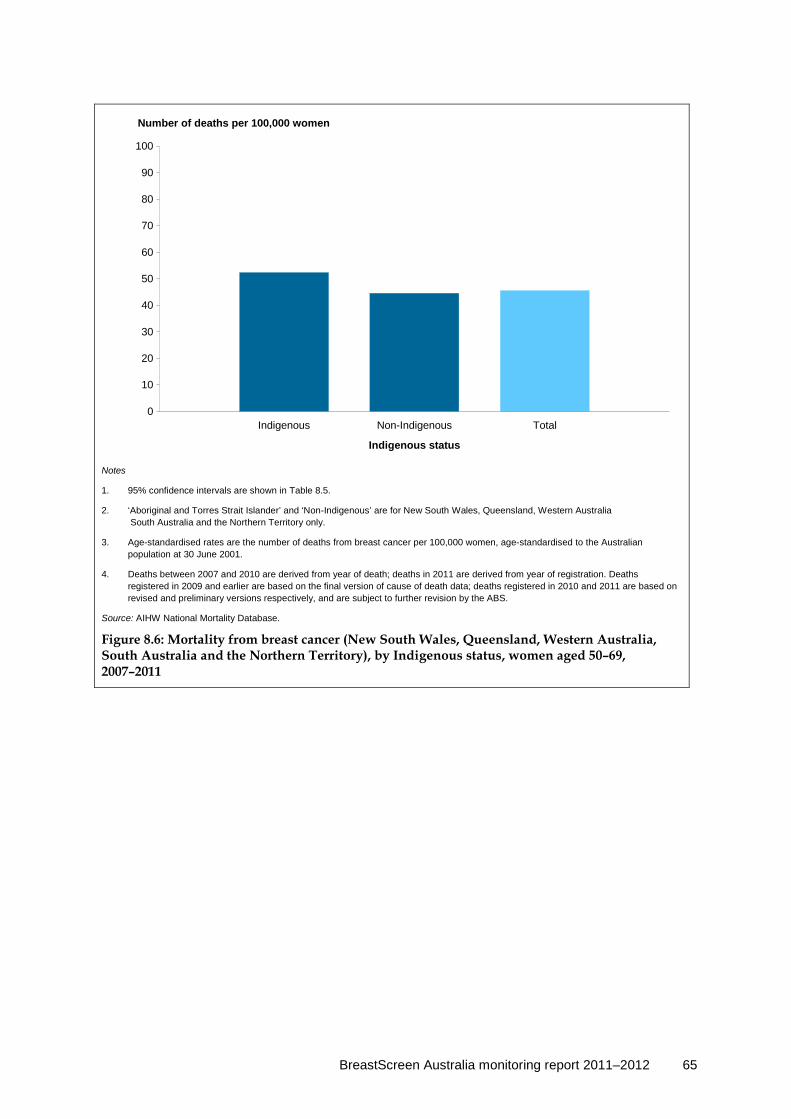
BreastScreen Australia monitoring report 2011–2012 65
Notes
1. 95% confidence intervals are shown in Table 8.5.
2. ‘Aboriginal and Torres Strait Islander’ and ‘Non-Indigenous’ are for New South Wales, Queensland, Western Australia South Australia and the Northern Territory only.
3. Age-standardised rates are the number of deaths from breast cancer per 100,000 women, age-standardised to the Australian population at 30 June 2001.
4. Deaths between 2007 and 2010 are derived from year of death; deaths in 2011 are derived from year of registration. Deaths registered in 2009 and earlier are based on the final version of cause of death data; deaths registered in 2010 and 2011 are based on revised and preliminary versions respectively, and are subject to further revision by the ABS.
Source: AIHW National Mortality Database.
Figure 8.6: Mortality from breast cancer (New South Wales, Queensland, Western Australia, South Australia and the Northern Territory), by Indigenous status, women aged 50–69, 2007–2011
0
10
20
30
40
50
60
70
80
90
100
Indigenous status
Indigenous Non-Indigenous Total
Number of deaths per 100,000 women
66 BreastScreen Australia monitoring report 2011–2012
Appendix A Additional data
Notes
1. The symbols represent the average 2011 and 2012 ABS estimated resident population for women aged 50–69.
2. The lighter shaded symbols represent the proportion of women screened in 2011–2012.
3. The darker shaded symbols represent the proportion of women recalled to assessment in 2012.
4. The single darkest symbol (set within a screened box) represents the proportion of women who have an invasive breast cancer detected through BreastScreen Australia.
Source: AIHW analysis of BreastScreen Australia data.
Figure A1: Women in BreastScreen Australia aged 50–69, 2011–2012
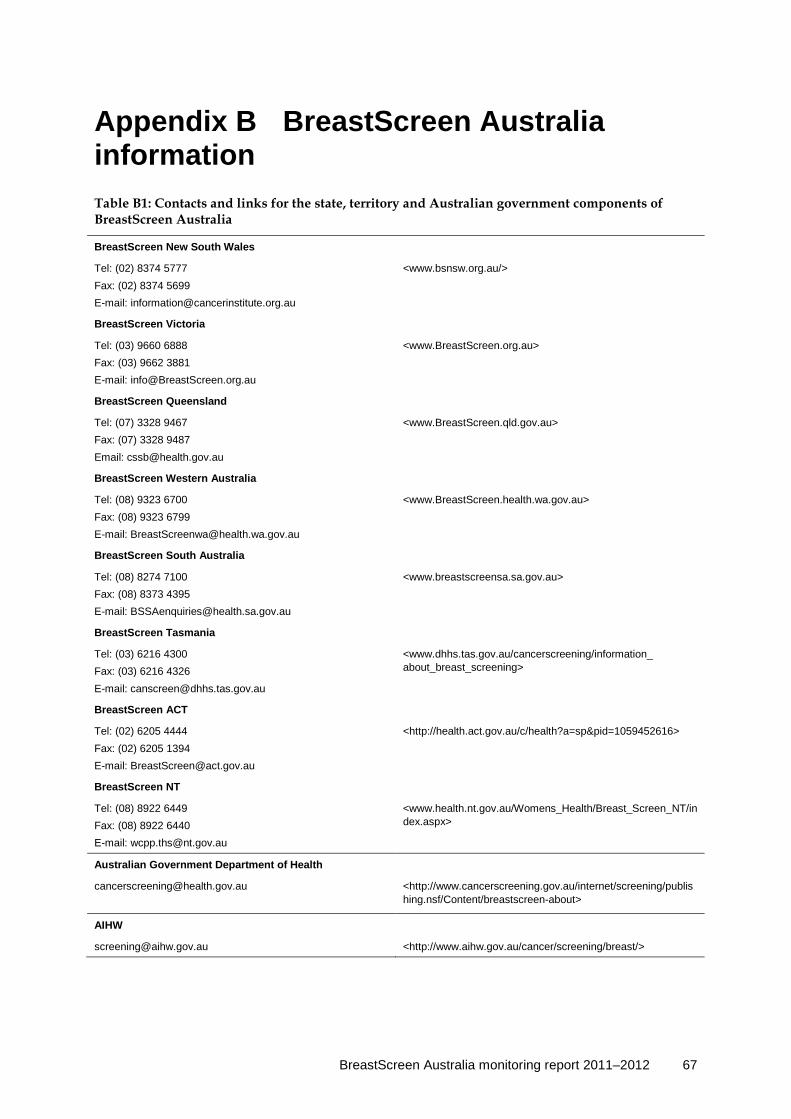
BreastScreen Australia monitoring report 2011–2012 67
Appendix B BreastScreen Australia information Table B1: Contacts and links for the state, territory and Australian government components of BreastScreen Australia
BreastScreen New South Wales
Tel: (02) 8374 5777 Fax: (02) 8374 5699 E-mail: [email protected]
<www.bsnsw.org.au/>
BreastScreen Victoria
Tel: (03) 9660 6888 Fax: (03) 9662 3881 E-mail: [email protected]
<www.BreastScreen.org.au>
BreastScreen Queensland
Tel: (07) 3328 9467 Fax: (07) 3328 9487 Email: [email protected]
<www.BreastScreen.qld.gov.au>
BreastScreen Western Australia
Tel: (08) 9323 6700 Fax: (08) 9323 6799 E-mail: [email protected]
<www.BreastScreen.health.wa.gov.au>
BreastScreen South Australia
Tel: (08) 8274 7100 Fax: (08) 8373 4395 E-mail: [email protected]
<www.breastscreensa.sa.gov.au>
BreastScreen Tasmania
Tel: (03) 6216 4300 Fax: (03) 6216 4326 E-mail: [email protected]
<www.dhhs.tas.gov.au/cancerscreening/information_ about_breast_screening>
BreastScreen ACT
Tel: (02) 6205 4444 Fax: (02) 6205 1394 E-mail: [email protected]
<http://health.act.gov.au/c/health?a=sp&pid=1059452616>
BreastScreen NT
Tel: (08) 8922 6449 Fax: (08) 8922 6440 E-mail: [email protected]
<www.health.nt.gov.au/Womens_Health/Breast_Screen_NT/index.aspx>
Australian Government Department of Health
<http://www.cancerscreening.gov.au/internet/screening/publishing.nsf/Content/breastscreen-about>
AIHW
[email protected] <http://www.aihw.gov.au/cancer/screening/breast/>

68 BreastScreen Australia monitoring report 2011–2012
BreastScreen Australia definitions
Target age group Women aged 50–69. BreastScreen Australia selects women on the basis of age alone. BreastScreen Australia actively targets women aged 50–69 through recruitment strategies and reminder letters.
Indigenous status Participation can be reported by Indigenous status because this is recorded on state and territory BreastScreen registers. Women who attend for a screening mammogram at a BreastScreen Australia service are asked to complete a form that includes personal and demographic details, as well as personal and family history of breast cancer. The form also includes a question on Indigenous status where the respondent can identify as ‘Aboriginal’, ‘Torres Strait Islander’, ‘both Aboriginal and Torres Strait Islander’, or ‘neither Aboriginal or Torres Strait Islander’. There is an additional ‘not stated’ category for women who choose not to answer this question.
This aligns with the BreastScreen Australia data dictionary (AIHW & DoHA 2005) which specifies that ‘Indigenous status’ (currently ‘Indigenous status’ in the dictionary) should be coded as:
• Aboriginal • Torres Strait Islander • both Aboriginal and Torres Strait Islander • not Indigenous, or • not stated. For the purposes of this report, these categories were amalgamated and the data stratified into three categories:
• Aboriginal and Torres Strait Islander • not Indigenous, or • not stated. While self-reported data are generally a robust source of data on Indigenous status (AIHW 2010b), it should be noted that some Aboriginal and Torres Strait Islander women may choose not to identify as such when presenting to a BreastScreen Australia service. Thus, some Aboriginal and Torres Strait Islander women may be incorrectly assigned non-Indigenous status. This means that the analysis based upon Indigenous status should be interpreted with caution.
Aboriginal and Torres Strait Islander women comprise a small proportion of women, both in the population and within BreastScreen Australia. Aboriginal and Torres Strait Islanders make up about 2.5% of the Australian population, with 1.3% of the 2010 female population aged 50–69 estimated to be Aboriginal or Torres Strait Islander, based on estimates in Aboriginal and Torres Strait Islander population projections (ABS cat. no. 3238.0) (ABS 2009)

BreastScreen Australia monitoring report 2011–2012 69
Main language spoken at home Main language spoken at home is also a self-reported category that is supplied at the time of screening. Women who are reported as ‘non-English-speaking’ have reported that they speak a language other than English at home, which can be interpreted as indicating ‘active ethnicity’. Since a different cultural and linguistic background may present a barrier to screening, this self-reported category is used to identify women who may have difficulties accessing services due to their cultural or language background.
The BreastScreen Australia data dictionary (AIHW & DoHA 2005) specifies that ‘main language spoken at home’ be coded according to the 4-digit ABS Australian Standard Classification of Languages, 1997 (ABS cat. no. 1267.0). This report has collapsed the classification into the simple dichotomy of ‘English’ and ‘other language’.
Although this stratification is reported as ‘main language spoken at home’, practice varies between the jurisdictions as to how this information is collected. Thus, in some jurisdictions, there may be some lack of comparability with the BreastScreen Australia data dictionary definition of ‘main language’.
Some jurisdictions do not allow for the ‘not stated’ category, which means some women who speak a language other than English at home will be incorrectly assigned to the ‘English only’ category.
Tumour size Tumour size is the size in millimetres of the malignant lesion, and applies to invasive cancers only. For more details, see the definition given in the BreastScreen Australia data dictionary (AIHW & DoHA 2005).
Screening round The BreastScreen Australia data dictionary (AIHW & DoHA 2005) distinguishes between a woman’s screening round in the national program and her round in the state or territory program. The screening round in the state or territory program is used for this stratification in this report.
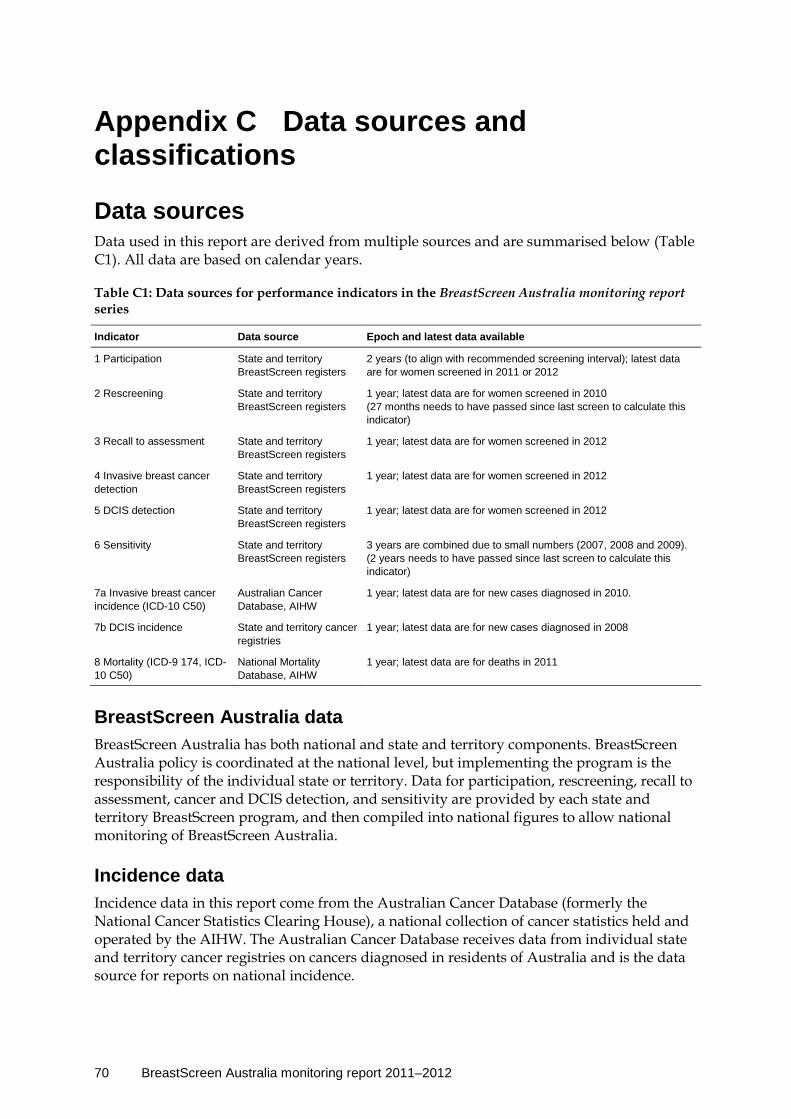
70 BreastScreen Australia monitoring report 2011–2012
Appendix C Data sources and classifications
Data sources Data used in this report are derived from multiple sources and are summarised below (Table C1). All data are based on calendar years.
Table C1: Data sources for performance indicators in the BreastScreen Australia monitoring report series
Indicator Data source Epoch and latest data available
1 Participation State and territory BreastScreen registers
2 years (to align with recommended screening interval); latest data are for women screened in 2011 or 2012
2 Rescreening State and territory BreastScreen registers
1 year; latest data are for women screened in 2010 (27 months needs to have passed since last screen to calculate this indicator)
3 Recall to assessment State and territory BreastScreen registers
1 year; latest data are for women screened in 2012
4 Invasive breast cancer detection
State and territory BreastScreen registers
1 year; latest data are for women screened in 2012
5 DCIS detection State and territory BreastScreen registers
1 year; latest data are for women screened in 2012
6 Sensitivity State and territory BreastScreen registers
3 years are combined due to small numbers (2007, 2008 and 2009). (2 years needs to have passed since last screen to calculate this indicator)
7a Invasive breast cancer incidence (ICD-10 C50)
Australian Cancer Database, AIHW
1 year; latest data are for new cases diagnosed in 2010.
7b DCIS incidence State and territory cancer registries
1 year; latest data are for new cases diagnosed in 2008
8 Mortality (ICD-9 174, ICD-10 C50)
National Mortality Database, AIHW
1 year; latest data are for deaths in 2011
BreastScreen Australia data BreastScreen Australia has both national and state and territory components. BreastScreen Australia policy is coordinated at the national level, but implementing the program is the responsibility of the individual state or territory. Data for participation, rescreening, recall to assessment, cancer and DCIS detection, and sensitivity are provided by each state and territory BreastScreen program, and then compiled into national figures to allow national monitoring of BreastScreen Australia.
Incidence data Incidence data in this report come from the Australian Cancer Database (formerly the National Cancer Statistics Clearing House), a national collection of cancer statistics held and operated by the AIHW. The Australian Cancer Database receives data from individual state and territory cancer registries on cancers diagnosed in residents of Australia and is the data source for reports on national incidence.

BreastScreen Australia monitoring report 2011–2012 71
The Data Quality Statement for the 2010 ACD can be found on the AIHW website at <http://meteor.aihw.gov.au/content/index.phtml/itemId/500417>.
Data have been analysed using the year of diagnosis of cancer. This is a more accurate reflection of incidence during a particular year than year of registration data.
Some states and territories use an imputation method for determining Indigenous cancers that may lead to differences between these data and those shown in jurisdictional cancer incidence reports.
Mortality data Mortality data in this report come from the AIHW National Mortality Database, which is a national collection of de-identified information for all deaths in Australia. Information on the characteristics and causes of death of the deceased is provided by the Registrars of Births, Deaths and Marriages and the National Coronial Information System and coded by the Australian Bureau of Statistics (ABS). Information on the cause of death is supplied by the medical practitioner certifying the death, or by a coroner. The data are updated each calendar year.
The data quality statements underpinning the AIHW National Mortality Database can be found in the following ABS publications:
ABS quality declaration summary for Causes of death, Australia (Cat. no. 3303.0) www.abs.gov.au/ausstats/[email protected]/mf/3303.0/
ABS quality declaration summary for Deaths, Australia (Cat. no. 3302.0) www.abs.gov.au/ausstats/[email protected]/mf/3302.0/
For more information on the AIHW National Mortality Database see http://www.aihw.gov.au/deaths/aihw-deaths-data/#nmd.
Analyses are based on the year of death, except for 2011 (the latest year for which mortality data are available), which is based on year of registration of death. Note that about 5% of deaths are not registered until the year following the death (ABS 2012).
Deaths registered in 2009 and earlier are based on the final version of cause of death data; deaths registered in 2010 and 2011 are based on revised and preliminary versions, respectively and are subject to further revision by the ABS. For more information about revisions to mortality data, refer to ABS (2012) Causes of death 2010 (Catalogue number 3303.0).
Population data The ABS estimated resident female population was used to calculate participation, incidence and mortality rates in this report.
Participation rates were calculated using the average of the estimated resident female population for 2-year reporting periods. Denominators for participation rates have been calculated using the average of the ABS estimated resident population for 2011 and 2012 and other periods. Because the ABS does not calculate the estimated resident population by socioeconomic status or language spoken at home, alternative methods were used to calculate the denominators for these rates. In the case of language spoken at home, the denominator was calculated by applying the age-specific distribution from the language question in the Census to the relevant age-specific estimated resident population counts. The
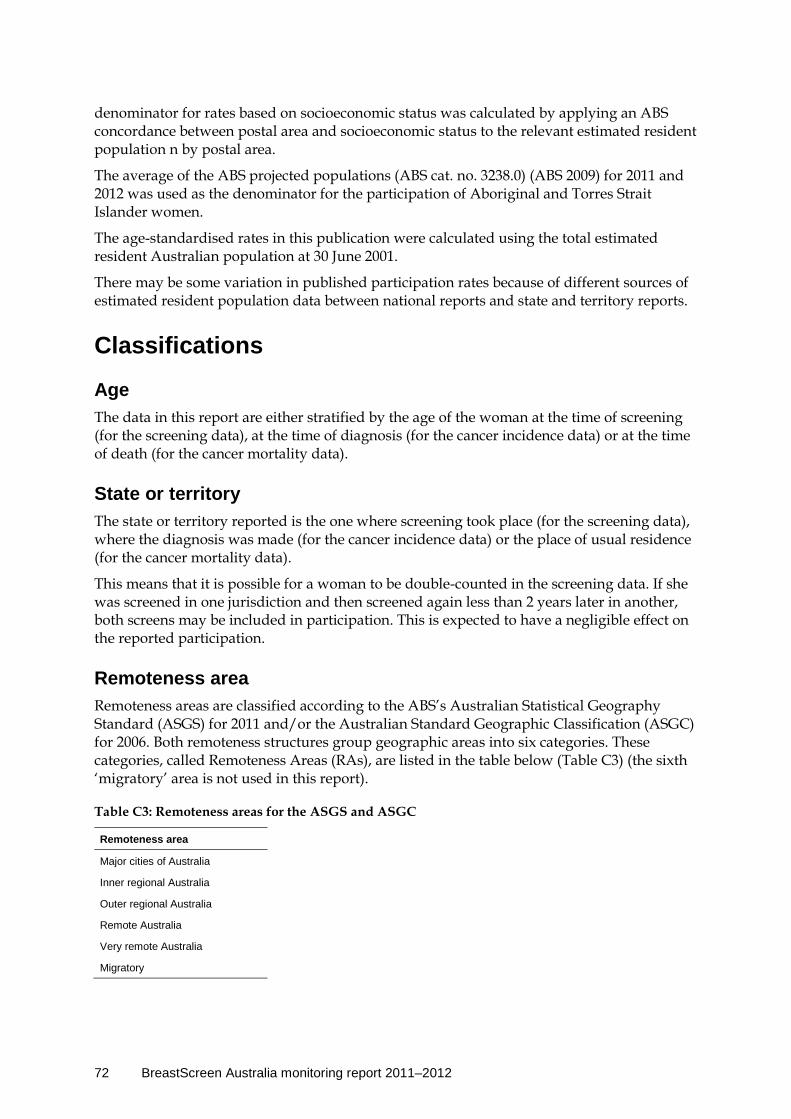
72 BreastScreen Australia monitoring report 2011–2012
denominator for rates based on socioeconomic status was calculated by applying an ABS concordance between postal area and socioeconomic status to the relevant estimated resident population n by postal area.
The average of the ABS projected populations (ABS cat. no. 3238.0) (ABS 2009) for 2011 and 2012 was used as the denominator for the participation of Aboriginal and Torres Strait Islander women.
The age-standardised rates in this publication were calculated using the total estimated resident Australian population at 30 June 2001.
There may be some variation in published participation rates because of different sources of estimated resident population data between national reports and state and territory reports.
Classifications
Age The data in this report are either stratified by the age of the woman at the time of screening (for the screening data), at the time of diagnosis (for the cancer incidence data) or at the time of death (for the cancer mortality data).
State or territory The state or territory reported is the one where screening took place (for the screening data), where the diagnosis was made (for the cancer incidence data) or the place of usual residence (for the cancer mortality data).
This means that it is possible for a woman to be double-counted in the screening data. If she was screened in one jurisdiction and then screened again less than 2 years later in another, both screens may be included in participation. This is expected to have a negligible effect on the reported participation.
Remoteness area Remoteness areas are classified according to the ABS’s Australian Statistical Geography Standard (ASGS) for 2011 and/or the Australian Standard Geographic Classification (ASGC) for 2006. Both remoteness structures group geographic areas into six categories. These categories, called Remoteness Areas (RAs), are listed in the table below (Table C3) (the sixth ‘migratory’ area is not used in this report).
Table C3: Remoteness areas for the ASGS and ASGC
Remoteness area
Major cities of Australia
Inner regional Australia
Outer regional Australia
Remote Australia
Very remote Australia
Migratory

BreastScreen Australia monitoring report 2011–2012 73
For participation, women were allocated to a remoteness area using their residential postcode supplied at the time of screening. Caution is required when examining differences across remoteness areas. First, postcodes used to allocate women may not represent their location of residence. Second, because these are based on the 2011 census, the accuracy of remoteness area classifications diminishes due to subsequent changes in demographics. Third, some postcodes (and hence women) are unable to be allocated to a remoteness area.
For new cases and deaths, women were allocated to a remoteness area based on their assigned statistical local area or statistical area level 2.
Socioeconomic status Socioeconomic status classifications are based on the ABS Index of Relative Socioeconomic Disadvantage (ABS 2008). Postal areas are assigned a score based on attributes such as low income, low educational attainment, high unemployment and jobs in relatively unskilled occupations. The score does not refer to the socioeconomic situation of a particular individual but instead refers to the postal area in which a person lives. A low score means a postal area has many low-income families, people with little training and high unemployment, and may be considered disadvantaged relative to other areas. Postal areas with high index scores may be considered less disadvantaged relative to other areas.
Socioeconomic status groups based on the level of the index are used for analysis where 1 (lowest) represents the most disadvantaged and 5 (highest) the least disadvantaged.
For participation, women were allocated to a socioeconomic status using their residential postcode supplied at the time of screening. Caution is required when examining differences across socioeconomic status for several reasons. First, postcodes used to allocate women may not represent their location of residence. Second, because these are based on the 2011 census, the accuracy of socioeconomic status classifications diminishes due to subsequent changes in demographics. Third, many postcodes (and hence women) are unable to be allocated to a socioeconomic status group.
For new cases, women were allocated to a socioeconomic status based on their assigned statistical local area.

74 BreastScreen Australia monitoring report 2011–2012
Appendix D BreastScreen Australia 2011–2012 Data Quality Statement
Summary of key data quality issues • All states and territories maintain a population-based BreastScreen register which
records the data collected during a woman’s contact with a BreastScreen service. • The AIHW compiles BreastScreen Australia data supplied from state and territory
BreastScreen registers in order to monitor BreastScreen Australia annually at a national level.
• State and territory BreastScreen registers change every day, adding new records and improving the quality of existing records as new information becomes available. BreastScreen Australia data may therefore change.
• Data for all jurisdictions were available for 2011–2012.
Description BreastScreen Australia is Australia’s national, population-based breast cancer screening program and is a joint program of the Australian and state and territory governments.
BreastScreen registers in each state and territory record data collected during a woman’s contact with a BreastScreen service.
Each BreastScreen program supplies BreastScreen data annually to the AIHW. These data are compiled into the BreastScreen Australia database, held at the AIHW to enable national monitoring of BreastScreen Australia.
Some BreastScreen data are supplied as aggregate data, which are not included in the BreastScreen Australia database.
The majority of screening mammography performed in Australia is through BreastScreen Australia. However, a relatively small amount of screening mammography occurs through services other than BreastScreen Australia, which are not within the scope of these data.
Institutional environment The AIHW is a major national agency set up by the Australian Government under the Australian Institute of Health and Welfare Act 1987 (Cwlth) to provide reliable, regular and relevant information and statistics on Australia’s health and welfare. It is an independent statutory authority established in 1987, governed by a management Board, and accountable to the Australian Parliament through the Health and Ageing portfolio.
The AIHW aims to improve the health and wellbeing of Australians through better health and welfare information and statistics. It collects and reports information on a wide range of topics and issues, ranging from health and welfare expenditure, hospitals, disease and injury, and mental health, to ageing, homelessness, disability and child protection.
The Institute also plays a role in developing and maintaining national metadata standards. This work contributes to improving the quality and consistency of national health and welfare statistics. The Institute works closely with governments and non-government
BreastScreen Australia monitoring report 2011–2012 75
organisations to achieve greater adherence to these standards in administrative data collections to promote national consistency and comparability of data and reporting.
One of the main functions of the AIHW is to work with the states and territories to improve the quality of administrative data and, where possible, to compile national data sets based on data from each jurisdiction, to analyse these data sets and disseminate information and statistics.
The Australian Institute of Health and Welfare Act 1987, in conjunction with compliance to the Privacy Act 1988 (Cwlth), ensures that the data collections managed by the AIHW are kept securely and under the strictest conditions with respect to privacy and confidentiality.
For further information see the AIHW website <www.aihw.gov.au>.
The AIHW has been receiving BreastScreen data since 1996.
Timeliness BreastScreen data are available within about 6–12 months of activity (it can take up to 12 months for final pathology results on all breast tissue samples to be received by BreastScreen registers.) The BreastScreen Australia database cannot be fully compiled until the final jurisdiction supplies its data.
Participation data for the previous calendar year are supplied in July each year; rescreening and invasive breast cancer and DCIS detection data for the previous calendar year are supplied July–December each year. (Rescreening and sensitivity data lag behind, as the specifications for these require a specified period of time to pass before they can be accurately calculated.)
The current BreastScreen Australia database contains data on women who participated in BreastScreen Australia between 1996 and 2012.
Accessibility BreastScreen Australia data are published annually in the BreastScreen Australia monitoring report available on the AIHW website <http://www.aihw.gov.au/breast-cancer-screening/> where they can be downloaded without charge. Supplementary data tables presenting more detailed data accompany each report and these, too, are available on the AIHW website where they can be downloaded without charge.
General enquiries about AIHW publications can be made to the Digital and Media Communications Unit on (02) 6244 1032 or via email to <[email protected]>.
Interpretability While many concepts in the BreastScreen Australia monitoring report are easy to interpret, other concepts and statistical calculations are more complex. All concepts are explained within the body of the report presenting these data, along with footnotes to provide further details and caveats. The appendixes provide additional detail on the data sources and classifications, and on the statistical methods used.
Relevance Breast cancer screening data are highly relevant for monitoring trends in breast screening participation and the detection of invasive breast cancer and DCIS, as well as other measures of program performance such as recall rates and sensitivity measures. The data are used for

76 BreastScreen Australia monitoring report 2011–2012
many purposes by policy makers and researchers, but are supplied and analysed specifically to monitor and inform BreastScreen Australia.
Accuracy All data provided by state and territory BreastScreen programs, once analysed, are supplied back to the jurisdictional BreastScreen programs for verification.
Women attending a BreastScreen service are able to self-report Indigenous status; this database field is therefore considered to be of high quality. However, use of the ‘not stated’ category has changed substantially over time, which makes trend data difficult to interpret.
State and territory BreastScreen databases change every day, and not just because new records are added; existing records are changed if new, more precise information becomes available or if typographical errors are discovered by routine data checking procedures. As a result, the number of women participating, as well as DCIS and invasive breast cancer cases reported by the AIHW for any particular year, may change slightly over time. Further, data published by a jurisdictional BreastScreen program at a certain point in time may differ slightly from what is published by the AIHW at a different time.
Coherence BreastScreen data are reported and published annually by the AIHW.

BreastScreen Australia monitoring report 2011–2012 77
Appendix E Statistical methods
Comparisons and tests of statistical significance This report includes statistical tests of the significance of comparisons of rates between population groups. Any statistical comparison applied to one variable must take account of any other potentially relevant variables. For example, any comparison of participation by state must also take account of differences in the distribution of age between the states. These other variables are known as ‘confounding’ variables.
Crude rates A crude rate is defined as the number of events over a specified period of time (for example, a year) divided by the total population. For example, a crude cancer incidence rate is defined as the number of new cases of cancer in a specified period of time divided by the population at risk.
Crude mortality rates and cancer incidence rates are expressed in this report as number of deaths or new cases per 100,000 population. Crude participation rate is expressed as a percentage.
Age-specific rates Age-specific rates are calculated by dividing the number of cases occurring in each specified age group by the corresponding population in the same age group, expressed as a percentage or a number per 1,000 or 100,000 population. This rate may be calculated for particular age and sex groupings. For example:
Age-specific breast cancer incidence rate in females aged 50–54: = (New cases aged 50–54 over Female population aged 50–54) times 100,000 = (1.822 over 736,829) times 100,000 = 247.3 per 100,000.
Age-standardised rates Rates are adjusted for age to facilitate comparisons between populations that have different age structures; for example, between youthful and ageing communities. There are two different methods commonly used to adjust for age.
This publication uses direct standardisation, in which the age-specific rates are multiplied by a constant population (the 2001 Australian Standard Population, unless otherwise specified). This effectively removes the influence of the age structure on the summary rate.
It important to note that, for some data presented in this report, indirect age standardisation would be more appropriate due to small numbers (most commonly for the Australian Capital Territory and the Northern Territory); however, direct age standardisation has been used for consistency. This can result in relatively large differences between crude and age-standardised rates. In these cases, crude rates should also be considered when interpreting data.
78 BreastScreen Australia monitoring report 2011–2012
The method used for this calculation comprises that first, the age-specific rate is calculated (as shown above) for each age group. Second, the expected number of cases in each 5-year age group is calculated by multiplying the age-specific rates by the corresponding standard population and dividing by the appropriate factor (that is, 100,000 for mortality and incidence rates, and 100 for participation). Third, to give the age-standardised rate, the expected number of cases in each group are summed, divided by the total of the standard population and multiplied by the appropriate factor (for example 100,000 for mortality and incidence rate, and 100 for participation).
Confidence intervals Population numbers for incidence and mortality and screening have a natural level of variability for a single year above and below what might be expected in the mean over many years. The percentage variability is small for large population numbers but high for small numbers such as mortality in a young age group. One measure of the likely difference is the standard error, which indicates the extent to which a population number might have varied by chance in only 1 year of data. In the 95% confidence interval, there are about 19 chances in 20 that the difference will be less than two standard errors.
There are several methods for calculating confidence intervals. The 95% confidence intervals in this report were calculated using a method developed by Dobson et al. (1991). This method calculates approximate confidence intervals for a weighted sum of Poisson parameters.
Interpretation of confidence intervals Some indicators have a 95% confidence interval presented along with the rates. This is because the observed value of a rate may vary due to chance, even where there is no variation in underlying value of the rate. The 95% confidence interval represents a range (interval) over which variation in the observed rate is consistent with this chance variation. In other words, there is a 95% confidence that the true value of the rate is somewhere within this range.
These confidence intervals can be used as a guide to whether differences in a particular rate are consistent with chance variation. Where the confidence intervals do not overlap, the difference between rates is greater than that which could be explained by chance and is regarded as statistically significant.
It is important to note that overlapping confidence intervals does not imply that the difference between two rates is definitely due to chance. Instead, an overlapping confidence interval represents a difference in rates that is too small to allow differentiation between a real difference and one that is due to chance variation. It can therefore only be stated that no statistically significant differences were found, and not that no differences exist.
The approximate comparisons presented might understate the statistical significance of some differences, but they are sufficiently accurate for the purposes of this report.
As with all statistical comparisons, care should be exercised in interpreting the results of the comparison. If two rates are statistically significantly different from each other, this means that the difference is unlikely to have arisen by chance. Judgment should, however, be exercised in deciding whether or not the difference is of any clinical significance.
BreastScreen Australia monitoring report 2011–2012 79
Glossary Aboriginal or Torres Strait Islander: A person of Aboriginal and/or Torres Strait Islander descent who identifies as an Aboriginal and/or Torres Strait Islander. See also Indigenous.
age-specific rate: a rate for a specific age group. The numerator and denominator relate to the same age group.
age-standardised rate: a method of removing the influence of age when comparing populations with different age structures. This is usually necessary because the rates of many diseases vary strongly (usually increasing) with age. The age structures of the different populations are converted to the same ‘standard’ structure, which allows comparison of disease rates.
Australian Standard Geographical Classification (ASGC): Common framework defined by the Australian Bureau of Statistics for collection and dissemination of geographically classified statistics. The ASGC was implemented in 1984 and the final release was in 2011. It has been replaced by the Australian Statistical Geography Standard (ASGS).
Australian Statistical Geography Standard (ASGS): Common framework defined by the Australian Bureau of Statistics for collection and dissemination of geographically classified statistics. The ASGS replaced the Australian Standard Geographical Classification (ASGC) in July 2011.
assessment: further investigation of a mammographic abnormality or symptom reported at screening.
benign: not malignant.
biopsy: small sample of tissue that is taken to obtain a definitive diagnosis of an abnormality.
cancer (malignant neoplasm): a large range of diseases in which some of the body’s cells become defective, and begin to multiply out of control. These cells can invade and damage the area around them, and can also spread to other parts of the body to cause further damage.
cancer death: a death where the underlying cause of death is indicated as cancer. People with cancer who die of other causes are not counted in the mortality statistics in this publication.
confidence interval: a range determined by variability in data, within which there is a specified (usually 95%) chance that the true value of a calculated parameter lies.
ductal carcinoma in situ: a non-invasive tumour of the mammary gland (breast) arising from cells lining the ducts.
false negative: a test that has incorrectly observed that the disease is not present.
false positive: a test that has incorrectly observed that the disease is present.
first screening round: see screening round.
ICD-10: International Classification of Diseases—the World Health Organization’s internationally accepted classification of death and disease. The 10th revision is currently in use. In this publication, ICD-10 is used to identify the primary site of a malignancy.
80 BreastScreen Australia monitoring report 2011–2012
Indigenous: A person of Aboriginal and/or Torres Strait Islander descent who identifies as an Aboriginal and/or Torres Strait Islander. See also Aboriginal or Torres Strait Islander.
in situ: a Latin term meaning in place or position; undisturbed.
incidence: the number of new cases (for example, of an illness or event) occurring during a given period, usually 1 year.
index screening year: the year for which an interval cancer rate and program sensitivity rate are determined.
index screens: all screening examinations performed within the index screening year.
International Classification of Diseases: see ICD-10.
interval cancer (invasive) (as defined for national reporting purposes by Kavanagh et al. 1999, with minor changes endorsed by the then-named National Advisory Committee):
• an invasive breast cancer diagnosed after completion of a negative screening episode and before the next screening examination (within 24 months from the date of the previous screen)
• a case of invasive breast cancer that is diagnosed at early review or in the interval between assessment and early review, where the recommendation for early review is 6 months or more from the screening date
• breast cancer diagnosed in a woman by BreastScreen Australia within 24 months of a negative screen (early rescreen) if the woman presents with a breast lump and/or clear or blood-stained nipple discharge in the breast in which the breast cancer was diagnosed
• an invasive breast cancer diagnosed between 6 and 24 months after a recommendation for assessment is made and a woman fails to attend assessment.
invasive cancer: a tumour whose cells have the potential to spread to nearby healthy or normal tissue or to more distant parts of the body.
malignant: abnormalities in cells or tissues consistent with cancer.
mammogram: a radiographic depiction of the breast.
metastasis: the process by which cancerous cells are transferred from one part of the body to another, for example, via the lymphatic system or the bloodstream.
morbidity: illness.
mortality: the number of deaths occurring during a given period.
new cancer case: a person who has a new cancer diagnosed for the first time. One person may have more than once cancer and therefore may be counted twice in incidence statistics if it is decided that the 2 cancers are not of the same origin. This decision is based on a series of principles set out in more detail in a publication by Jensen et al. (1991).
rescreening: the next screening examination after the screening episode in the index screening year.
risk factor: an attribute or exposure that is associated with an increased probability of a specified outcome, such as the occurrence of a disease. Risk factors are not necessarily the causes of disease.
screening: the performance of tests on apparently well people in order to detect a medical condition at an earlier stage than would otherwise be the case.
BreastScreen Australia monitoring report 2011–2012 81
screening episode: all attendances for screening and assessment within 6 months relating to a particular round of screening. It starts at the date of attendance for screening. It is completed when:
• a recommendation is made to return the woman to routine rescreening • a recommendation is made for early review at 6 months or more from the screening date • a diagnosis of cancer is made • the woman fails to attend for technical recall or assessment within 6 months • the woman dies. screening round: the first screening round is a woman’s first visit to a mammography screening service; a subsequent screening round means that she has been screened before. For example, if she attends for a fourth screening round, she has been screened three times before.
significant difference: where rates are referred to as significantly different, or one rate is deemed significantly higher or lower than another, these differences are statistically significant. Rates are deemed statistically significantly different when their confidence intervals do not overlap, since their difference is greater than what could be explained by chance. See ‘confidence intervals’ in Appendix E for more information.
symptom: any evidence of disease apparent to the patient. For the purposes of this report, symptoms refer to a self-reported breast lump and/or blood-stained or watery nipple discharge.
target population: women aged 50–69.
tumour: an abnormal growth of tissue. Can be benign (not a cancer) or malignant (cancer).
the Institute: the Australian Institute of Health and Welfare.
ultrasound: diagnostic method based on the reflection of ultrasonic sound waves generated through scanning of, in this case, the breast. The reflections are viewed on a computer screen or photograph, and checked for variations in images.
underlying cause of death: the condition, disease or injury initiating the sequence of events leading directly to death; that is, the primary, chief or principal cause.
Note: Terms in bold are defined elsewhere in the glossary.
82 BreastScreen Australia monitoring report 2011–2012
References ABS (Australian Bureau of Statistics) 2006. Statistical geography volume 1—Australian Standard Geographical Classification (ASGC). Canberra: ABS. Viewed 22 July 2013, <http://www.abs.gov.au/AUSSTATS/[email protected]/Lookup/1216.0Main+Features1Jul%202006?OpenDocument>.
ABS 2008. Information paper: an Introduction to Socio-Economic Indexes for Areas (SEIFA) 2006. Canberra: ABS. Viewed 22 July 2013, <http://www.abs.gov.au/ausstats /[email protected]/mf/2039.0/>.
ABS 2009. Experimental estimates and projections, Aboriginal and Torres Strait Islander Australians, 1991 to 2021. ABS Cat. no. 3238.0. Canberra: ABS.
ABS 2011. Australian Standard Classification of Languages, 2011. ABS Cat. no. 1267.0. Canberra: ABS.
ABS 2012. Deaths, Australia, 2011. Canberra: ABS. Viewed 22 July 2013, <http://www.abs.gov.au/AUSSTATS/[email protected]/Lookup/3302.0Explanatory%20Notes12006?OpenDocument>.
AIHW (Australian Institute of Health and Welfare) 2010a. Risk of invasive breast cancer in women diagnosed with ductal carcinoma in situ in Australia between 1995 and 2005. Cancer series no. 51. Cat. no. CAN 47. Canberra: AIHW.
AIHW 2010b. National best practice guidelines for collecting Indigenous status in health data sets. Cat. no. IHW 29. Canberra: AIHW.
AIHW 2011. BreastScreen Australia monitoring report 2008–2009. Cancer series no. 63. Cat. no. CAN 60. Canberra: AIHW.
AIHW 2014. Australian Cancer Incidence and Mortality (ACIM) books: Cervical cancer. Canberra: AIHW. <http://www.aihw.gov.au/acim-books>.
AIHW & DoHA (Australian Government Department of Health and Ageing) 2005. BreastScreen Australia Data Dictionary. Viewed 8 October 2013, <http://www.cancerscreening.gov.au/internet/screening/publishing.nsf/Content/br-dictionary/$File/bsa-dd.pdf>.
AIHW & NBCC (National Breast Cancer Centre) 2007. Breast cancer survival by size and nodal status. Cancer series no. 39. Cat. no. CAN 34. Canberra: AIHW.
American Cancer Society 2011. Breast cancer overview. Georgia. American Cancer Society. Viewed 22 July 2013, <http://www.cancer.org/Cancer/BreastCancer/ OverviewGuide/breast-cancer-overview-what-causes>.
BreastScreen Australia 2004. BreastScreen Australia National Accreditation Standards, developed by the National Quality Management Committee of BreastScreen Australia, endorsed by the Australian Screening Advisory Committee, November 2004. Canberra: DoHA.
BreastScreen Australia EAC (Evaluation Advisory Committee) 2009a. BreastScreen Australia evaluation: evaluation final report. Canberra: DoHA. Viewed 22 July 2013, < http://www.cancerscreening.gov.au/internet/screening/publishing.nsf/Content/br-evaluation-report-cnt>.
BreastScreen Australia monitoring report 2011–2012 83
BreastScreen Australia EAC 2009b. BreastScreen Australia evaluation: participation and performance trends. Canberra: DoHA. Viewed 22 July 2013, <http://www.cancerscreening.gov.au/internet/screening/publishing.nsf/ Content/br-participation-cnt>.
BreastScreen Queensland 2009. Every woman: Aboriginal and Torres Strait Islander women. Brisbane: BreastScreen Queensland. Viewed 22 July 2013, <http://www.health.qld.gov.au/breastscreen/aboriginal-tsi-women.asp>.
BreastScreen SA (South Australia) 2003. Keeping abreast: screening Indigenous women in SA. Vol. 3. Adelaide: SA Health, Government of South Australia.
BreastScreen SA 2010. The impact of BreastScreen SA, 20 year report 1989–2008: with trend data for 1989–2004. Adelaide: Central Northern Adelaide Health Service, SA Health, Government of South Australia.
BreastScreen WA (Western Australia) 2008. BreastScreen WA: statistical report 2000–2005. Perth: BreastScreen WA.
Cancer Australia 2009. Lobular carcinoma in situ (LCIS) and atypical hyperplasias (AH). Sydney: Cancer Australia. Viewed 22 July 2013, <http://www.canceraustralia.gov.au/clinical-best-practice/breast-cancer/lobular-carcinoma-situ-lcis-and-atypical>.
De P, Neutel CI, Olivotto I & Morrison H 2010. Breast cancer incidence and hormone replacement therapy in Canada. Journal of the National Cancer Institute 102:1489-95.
Dobson AJ, Kuulasma K, Eberle E & Scherer J 1991. Confidence intervals for weighted sums of Poisson parameters. Statistics in Medicine 10:457–462.
Duffy SW, Tabar L, Olsen AH, Vitak B, Allgood PC, Chen TH et al. 2010. Absolute numbers of lives saved and overdiagnosis in breast cancer screening, from a randomized trial and from the Breast Screening Programme in England. Journal of Medical Screening 17:25–30.
Eusebi V, Feudale E, Foschini MP, Micheli A, Conti A, Riva C et al. 1994. Long-term follow-up of in situ carcinoma of the breast. Seminars in Diagnostic Pathology 11:223–35.
Irwig L, Glasziou P, Barratt A & Salkeld G 1997. Review of the evidence about the value of mammographic screening in 40–49 year old women. Sydney: NHMRC (National Health and Medical Research Council) NBCC.
Jensen O, Parkin D, MacLennan R, Muir C & Skeet Re (eds) 1991. Cancer registration: principles and methods. IARC scientific publication no. 95. Lyon: International Agency for Research on Cancer.
Kavanagh AM, Amos AF & Marr GM 1999. The ascertainment and reporting of interval cancers within the BreastScreen Australia Program. Sydney: NHMRC (National Health and Medical Research Council) & NBCC.
Kerlikowske K, Molinaro AM, Gauthier ML, Berman HK, Waldman F, Bennington J et al. 2010. Biomarker expression and risk of subsequent tumors after initial ductal carcinoma in situ diagnosis. Journal of the National Cancer Institute 102:627–37.
Luke C, Priest K & Roder D 2006. Changes in incidence of in situ and invasive breast cancer by histology type following mammography screening. Asian Pacific Journal of Cancer Prevention 7:69–74.
84 BreastScreen Australia monitoring report 2011–2012
McPherson K, Steel CM & Dixon JM 2000. Breast cancer—epidemiology, risk factors, and genetics. British Medical Journal 321:624–8.
NBCC, AACR (Australasian Association of Cancer Registries), BreastScreen Australia, DHAC (Australian Government Department of Health and Aged Care) & AIHW 2000. Ductal carcinoma in situ (DCIS). Cancer Monitoring. No 1. December 2000. Canberra: AIHW.
NBCC 2006. Advice about familial aspects of breast cancer and epithelial ovarian cancer: a guide for health professionals. Camperdown: NBCC.
NBOCC (National Breast and Ovarian Cancer Centre) 2009. National Breast and Ovarian Cancer Centre and Royal Australasian College of Surgeons National Breast Cancer audit. Public Health Monitoring Series 2007 data. Sydney: NBOCC.
Virnig BA, Tuttle TM, Shamliyan T & Kane RL 2010. Ductal carcinoma in situ of the breast: a systematic review of incidence, treatment, and outcomes. Journal of the National Cancer Institute 102:170–8.
WHO (World Health Organization) & IARC (International Agency for Research on Cancer) 2002. Breast cancer screening. IARC handbooks of cancer prevention. Lyon: IARC Press.

BreastScreen Australia monitoring report 2011–2012 85
List of tables Key performance indicators for BreastScreen Australia, women aged 50–69 ........................................... vii
Table 1.1: Number and age-standardised rate of women aged 50–69 participating in BreastScreen Australia, 1996–1997 to 2011–2012 ......................................................................... 10
Table 1.2: BreastScreen Australia participation by state and territory, women aged 50–69, 2011–2012 .......................................................................................................................................... 13
Table 1.3: BreastScreen Australia participation by remoteness area, women aged 50–69, 2011–2012 .......................................................................................................................................... 14
Table 1.4: BreastScreen Australia participation by socioeconomic status, women aged 50–69, 2011–2012 .......................................................................................................................................... 15
Table 1.5: BreastScreen Australia participation by Indigenous status, women aged 50–69, 2011–2012 .......................................................................................................................................... 16
Table 1.6: BreastScreen Australia participation by main language spoken at home, women aged 50–69, 2011–2012 .................................................................................................................... 16
Table 2.1: Rescreening by screening round, women aged 50–67, 2000 to 2010........................................... 20
Table 2.2: Rescreening by state and territory and screening round, women aged 50–67 screened during 2010 ...................................................................................................................... 21
Table 3.1: Recall to assessment, women aged 50–69, first and subsequent screening rounds, 2002 to 2012 ...................................................................................................................................... 23
Table 3.2: Recall to assessment by state and territory, women aged 50–69, first and subsequent screening rounds, 2012 ................................................................................................................... 26
Table 4.1: All-size and small invasive breast cancer detection in women aged 50–69, first and subsequent screening rounds for all-size cancers, and all screening rounds for small cancers, 2012 .......................................................................................................................... 28
Table 4.3: Small (≤15 mm) invasive breast cancer detection in women aged 50–69, all screening rounds, 2002 to 2012 ........................................................................................................................ 29
Table 4.4: Proportion of small (≤15 mm) invasive breast cancers detected in women aged 50–69, all screening rounds, 2002 to 2012 .................................................................................... 30
Table 4.5: All-size and small (≤15 mm) invasive breast cancer detection by age, all screening rounds, 2012 ..................................................................................................................................... 31
Table 4.6: All-size and small (≤15 mm) invasive breast cancer detection by state and territory, women aged 50–69, 2012 ................................................................................................................ 32
Table 5.1: DCIS detection in women aged 50–69, first and subsequent screening rounds, 2012 ............. 34
Table 5.2: DCIS detection by year, women aged 50–69, first and subsequent screening rounds, 2002 to 2012 ...................................................................................................................................... 35
Table 5.3: DCIS detection by age, all screening rounds, 2012 ....................................................................... 36
Table 5.4: DCIS detection by state and territory, women aged 50–69, all screening rounds, 2012 .................................................................................................................................................... 36
Table 6.1: Interval cancer rate for women aged 50–69, screened in index years 2007, 2008 and 2009, by state and territory, first and subsequent screening rounds, 0–12 months follow-up .......................................................................................................................................... 38
86 BreastScreen Australia monitoring report 2011–2012
Table 6.2: Interval cancer rate for women aged 50–69, screened in index years 2007, 2008 and 2009, by state and territory, first and subsequent screening rounds, 13–24 months follow-up .......................................................................................................................................... 39
Table 6.3: Interval cancer rate for women screened in index years 2007, 2008 and 2009, all screening rounds, by age, 0–12 months and 13–24 months follow-up .................................... 39
Table 6.4: Interval cancer rate for women aged 50–69, screened in index years 2007, 2008 and 2009, by state and territory, first and subsequent screening rounds, 0–24 months follow-up .......................................................................................................................................... 40
Table 6.5: Program sensitivity for women aged 50–69, screened in index years 2007, 2008 and 2009, by state and territory, first and subsequent screening rounds, 0–12 months follow-up .......................................................................................................................................... 42
Table 6.6: Program sensitivity for women aged 50–69, screened in index years 2007, 2008 and 2009 , by state and territory, first and subsequent screening rounds, 0–24 months follow-up .......................................................................................................................................... 42
Table 6.7: Program sensitivity for women screened in index years 2007, 2008 and 2009, all screening rounds, by age, 0–12 months and 0–24 months follow-up ...................................... 43
Table 7.1: Incidence of invasive breast cancer, 1982 to 2010 .......................................................................... 46
Table 7.2: Incidence of invasive breast cancer, by age, 2010 ......................................................................... 47
Table 7.3: Incidence of invasive breast cancer by state and territory, women aged 50–69, 2006–2010 .......................................................................................................................................... 49
Table 7.4: Incidence of invasive breast cancer by remoteness area, women aged 50–69, 2006–2010 .......................................................................................................................................... 50
Table 7.5: Incidence of invasive breast cancer by socioeconomic status, women aged 50–69, 2006–2010 .......................................................................................................................................... 51
Table 7.6: Incidence of breast cancer (New South Wales, Queensland, Western Australia and the Northern Territory) by Indigenous status, women aged 50–69, 2005–2009...................... 53
Table 7.7: Incidence of DCIS, women aged 50–69, 1996 to 2008 ................................................................... 55
Table 7.8: Incidence of DCIS, by age, 2008 ....................................................................................................... 56
Table 7.9: Incidence of DCIS by state and territory, women aged 50–69, 2004–2008 ................................. 56
Table 8.1: Mortality from breast cancer, 1982 to 2011 .................................................................................... 59
Table 8.2: Mortality from breast cancer, 2011 .................................................................................................. 60
Table 8.3: Mortality from breast cancer by state and territory, 2007–2011 .................................................. 62
Table 8.4: Mortality from breast cancer, by remoteness area, 2007–2011 ................................................... 63
Table 8.5: Mortality from breast cancer (New South Wales, Queensland, Western Australia, South Australia and the Northern Territory) by Indigenous status, women aged 50–69 and women of all ages, 2007–2011 ..................................................................................... 64
Table B1: Contacts and links for the state, territory and Australian government components of BreastScreen Australia .................................................................................................................... 67
Table C1: Data sources for performance indicators in the BreastScreen Australia monitoring report series ....................................................................................................................................... 70
BreastScreen Australia monitoring report 2011–2012 87
List of figures Anatomy: The breast and adjacent lymph nodes ............................................................................................. 2
Figure 1.1: BreastScreen Australia participation by age group, 2011–2012 ................................................. 11
Figure 1.2: Age distribution of women aged 40 or over screened by BreastScreen Australia, 2001–2002 and 2011–2012 ............................................................................................................... 12
Figure 1.3: BreastScreen Australia participation by state and territory, women aged 50–69, 2011–2012 .......................................................................................................................................... 13
Figure 1.4: BreastScreen Australia participation by remoteness area, women aged 50–69, 2011–2012 .......................................................................................................................................... 14
Figure 1.5: BreastScreen Australia participation by socioeconomic status, women aged 50–69, 2011–2012 .......................................................................................................................................... 15
Figure 2.1: Rescreening by screening round, women aged 50–67screened during 2010 ........................... 18
Figure 2.2: Rescreening by screening round, women aged 50–67, 2000 to 2010 ......................................... 19
Figure 2.3: Rescreening by age and screening round, women aged 50–67 screened during 2010 ........... 20
Figure 3.1: Recall to assessment, women aged 50–69, first and subsequent screening rounds, 1996 to 2012 ...................................................................................................................................... 24
Figure 3.2: Recall to assessment by age, first and subsequent screening rounds, 2012 ............................. 24
Figure 3.3: Recall to assessment by state and territory, women aged 50–69, first and subsequent screening rounds, 2012 ................................................................................................................... 25
Figure 4.1: All-size (A) and small (≤15 mm), (B) invasive breast cancer detection in women aged 50–69, first and subsequent screening rounds for all-size cancers, and all screening rounds for small cancers, 1996 to 2012 ......................................................................................... 29
Figure 4.2: Number of invasive breast cancers, showing the proportion of small size (≤15 mm) to other size (>15 mm), detected in women aged 50–69, all screening rounds, 1996 to 2012 .................................................................................................................................................... 30
Figure 4.3: All-size and small (≤15 mm) invasive breast cancer detection by age, all screening rounds, 2012 ..................................................................................................................................... 31
Figure 5.1: DCIS detection by year, women aged 50–69, 1996 to 2012 ......................................................... 35
Figure 7.1: Incidence of invasive breast cancer in women aged 50–69, 1982 to 2010 ................................. 47
Figure 7.2: Incidence of invasive breast cancer, by age, 1982 to 2010 .......................................................... 48
Figure 7.3: Incidence of invasive breast cancer, by age, 1990, 2000 and 2010 ............................................. 48
Figure 7.4: Incidence of invasive breast cancer by state and territory, women aged 50–69, 2006–2010 .......................................................................................................................................... 49
Figure 7.5: Incidence of invasive breast cancer by remoteness area, women aged 50–69, 2006–2010 .......................................................................................................................................... 50
Figure 7.6: Incidence of invasive breast cancer by socioeconomic status, women aged 50–69, 2006–2010 .......................................................................................................................................... 51
Figure 7.7: Incidence of breast cancer (New South Wales, Queensland, Western Australia and the Northern Territory), by Indigenous status, women aged 50–69, 2005–2009 ..................... 52
Figure 8.1: Mortality from breast cancer, women aged 50–69, 1982 to 2011 ............................................... 60
88 BreastScreen Australia monitoring report 2011–2012
Figure 8.2: Mortality from breast cancer, by age, 1982 to 2011 ..................................................................... 61
Figure 8.3: Mortality from breast cancer, by age, 1991, 2001 and 2011 ........................................................ 61
Figure 8.4: Mortality from breast cancer by state and territory, women aged 50–69, 2007–2011 ............. 62
Figure 8.5: Mortality from breast cancer by remoteness area, women aged 50–69, 2007–2011 ................ 63
Figure 8.6: Mortality from breast cancer (New South Wales, Queensland, Western Australia, South Australia and the Northern Territory), by Indigenous status, women aged 50–69, 2007–2011 ............................................................................................................................. 65
Figure A1: Women in BreastScreen Australia aged 50–69, 2011–2012 ......................................................... 66

BreastScreen Australia monitoring report 2011–2012 89
Related publications The BreastScreen Australia monitoring report is an annual report.
This and previous BreastScreen Australia monitoring reports and their supplementary data tables are available at <http://www.aihw.gov.au/publications/breast-cancer/>.
You may also be interested in the following related publications:
AIHW 2014. Cervical screening in Australia 2011–2012. Cancer series no. 82. Cat. no. CAN 79. Canberra: AIHW.
AIHW 2014. National Bowel Cancer Screening Program: monitoring report 2012–2013. Cancer series 84. Cat. no. CAN 81. Canberra: AIHW.
AIHW & AACR (Australasian Association of Cancer Registries) 2012. Cancer in Australia: an overview, 2012. Cancer series no. 74. Cat. no. CAN 70. Canberra: AIHW.
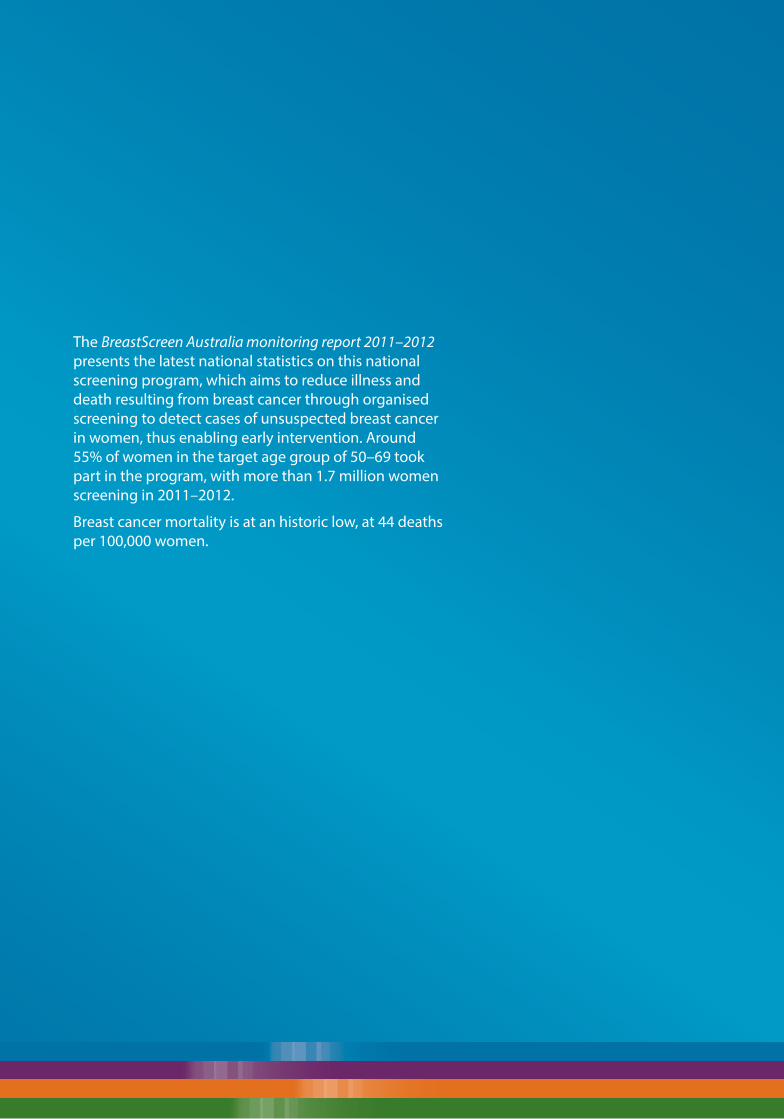
CANCER sERiEs No. 86
BreastScreen Australia monitoring report 2011–2012
The BreastScreen Australia monitoring report 2011–2012 presents the latest national statistics on this national screening program, which aims to reduce illness and death resulting from breast cancer through organised screening to detect cases of unsuspected breast cancer in women, thus enabling early intervention. Around 55% of women in the target age group of 50–69 took part in the program, with more than 1.7 million women screening in 2011–2012.
Breast cancer mortality is at an historic low, at 44 deaths per 100,000 women.
Breastscreen Australia monitoring report 2011–2012
AIH
W
Related Documents