
Welcome message from author
This document is posted to help you gain knowledge. Please leave a comment to let me know what you think about it! Share it to your friends and learn new things together.
Transcript

Clinical White Paper
healthcare within reach

INVITED SPECIAL COMMUNICATION
Breast ElastographyHow to Perform and Integrate Into a “Best-Practice” PatientTreatment Algorithm
Richard G. Barr, MD, PhD
Breast elastography has been available for more than 15 years but is not widelyincorporated into clinical practice. Many publications report extremely highaccuracy for various breast elastographic techniques. However, results in the lit-erature are extremely variable. This variability is most likely due to variations intechnique, a relatively steep learning curve, and variability in methods betweenvendors. This article describes our protocol for performing breast elastographyusing both strain elastography and shear wave elastography, which produces highsensitivity and specificity. Additionally, we will describe the most commonlyknown false-positive and false-negative lesions as well as how to detect them.
Key Words—breast; breast cancer; breast tumors; elastography;sonoelastography; strain elastography; shear wave elastography
B reast elastography has been clinically available for more than15 years. Based on in vitro studies, elastography should behighly sensitive and specific for characterizing breast lesions, as
the stiffness of malignant lesions is substantially greater than that ofbenign lesions with very little overlap.1 However, elastography has notbeen widely accepted as a standard procedure in breast imaging. Thisis likely due to variations in technique, a relatively steep learning curve,and differences in methods between vendors. A similar problem hasbeen seen in assessments of liver stiffness by 2-dimensional shear waveelastography (2D-SWE) in patients with chronic liver disease, althoughthis variability has been minimized by the Quantitative ImagingBiomarker Association, which has worked with vendors to standardizetheir systems.2 To date, no such attempt has been made for breastelastographic imaging. Both strain elastography (SE) and 2D SWEhave been used to evaluate breast lesions, and numerous studies havereported improvement in characterization of breast lesions to variousdegrees using elastography.3–14
Strain imaging is a relative technique. The elastogram doesnot provide a specific numeric value of lesion stiffness but insteadreflects relative stiffness compared with other tissues in the field ofview.15 A unique feature of breast elastography for both SE andSWE is that malignant breast lesions appear larger on elastographythan on B-mode ultrasound (US) images, whereas benign breastlesions appear smaller on elastography than on the correspondingB-mode images.15 The mechanism of this difference in size ispoorly understood. For SE, 3 techniques have been proposed forinterpretation of the elastogram (Figure 1). First, a 5-point colorscale can be used, with a score of 1 when the lesion is soft, a scoreof 2 when there are both soft and stiff components in the lesion, a
Received August 5, 2019, from the Depart-ment of Radiology, Northeastern Ohio Medi-cal University, Rootstown, Ohio, USA; andSouthwoods Imaging, Youngstown, Ohio,USA. Manuscript accepted for publicationSeptember 9, 2019.
The author thanks Carmine Tinelli,MD, PhD, and Annalisa De Silvestri, PhD,for statistical analysis. The author receivesresearch grants from Philips Healthcare, Sie-mens Medical Solutions, Mindray, GEHealthcare, SuperSonic Imagine, and B&KUltrasound. He is on the speakers bureaus ofPhilips Healthcare, Mindray, Siemens Medi-cal Solutions, and Bracco Diagnostics. He ison the advisory boards of Bracco Diagnosticsand Lantheus Medical Imaging. He receivesroyalties from Thieme Publishers.
Guest Editor: Andrej Lyshchik, MD, PhD.
Address correspondence to RichardG. Barr MD, PhD, Southwoods Imaging, 7623Market St, Youngstown, OH 44512 USA.
E-mail: [email protected]
Abbreviations2D, 2-dimensional; BI-RADS, BreastImaging Reporting and Data System; E/B, elastographic-to-B-mode; ROI, region ofinterest; SE, strain elastography; SWE,shear wave elastography; US, ultrasound
doi:10.1002/jum.15137
© 2019 by the American Institute of Ultrasound in Medicine | J Ultrasound Med 2020; 39:7–17 | 0278-4297 | www.aium.org

Figure 1. The 3 proposed methods for interpretation of breast strain elastography for a 24-year-old patient with a known fibroadenoma. A,On the 5-point color scale with blue as stiff and red as soft, the lesion (dotted line) is stiff, whereas the fatty tissue is soft. The lesion appearssmaller than the B-mode image. Therefore, this would have a score of 3. B, To calculate the strain ratio, an ROI is placed in the lesion and infatty tissue. In this case, the strain of fat is 0.675, whereas the strain of the lesion is 0.082, giving a ratio of 8.2, suggestive of a malignantlesion. This measurement is highly dependent on the amount of precompression and the specific US vendor. C, To calculate the E/B ratio,the lesion is measured on the B-mode image and on the elastogram. The ratio calculated in this case is 0.69/0.82, equal to 0.84, which issuggestive of a benign lesion.
Barr—Breast Elastography
8 J Ultrasound Med 2020; 39:7–17
score of 3 when the lesion is stiff and smaller than onthe B-mode image, a score of 4 when the lesion is stiffand the same size as on the B-mode image, and ascore of 5 when the lesion is stiff and larger thanon the B-mode image. Second, a semiquantitativemethod, the fat-to-lesion ratio, also known as thestrain ratio, has been proposed. Since fat in the breasthas relatively constant stiffness between patients, itcan be used as a reference standard. In this technique,a region of interest (ROI) is placed on the lesion andalso in an area of fat, preferably at the same depth ofthe lesion. The US system then calculates the ratio oflesion stiffness compared to fat. The third methodcompares the size of the lesion on elastography andB-mode imaging by measuring the length of thelesion on the elastogram in the longest dimensionand dividing this number by the length of the lesionon the comparable B-mode image, yielding theelastographic-to-B-mode (E/B) ratio. For the 5-pointmethod, a cutoff score of 3 is usually considered themost accurate in differentiating benign from malig-nant lesions, with scores of 4 and 5 suggestive ofmalignancy. For the strain ratio method, each vendorhas its own method of determining the strain value ofan ROI, and the fat-to-lesion ratio is, therefore, veryvendor dependent.4 Additionally, compression of thetissue will also add variance to the measurement, asthe stiffness of fat increases faster than that of othertissues in the breast with compression.15 The E/Bmethod requires that the lesion be accurately mea-sured on both the B-mode image and the elastogram,which are obtained and displayed simultaneously. AnE/B ratio of 1 or higher is reported as malignant,whereas an E/B ratio lower than 1 is reported asbenign. A meta-analysis of the literature on SE foundthat the E/B ratio was more sensitive and specificthan the other 2 methods.
Shear wave elastography provides a quantitativeestimate of the lesion stiffness based on the speed ofshear waves generated by applying an acoustic radiationforce impulse push pulse. The shear wave movement istracked by B-mode tracking pulses, and the shear wavespeed is estimated.4 Shear wave elastography can be per-formed in a single ROI (point SWE) or over a largerfield of view (2D SWE). A color map is used to displaythe shear wave velocities in 2D SWE. As breast cancerstiffness is very heterogeneous, point SWE should notbe used, as the area of maximum stiffness cannot be
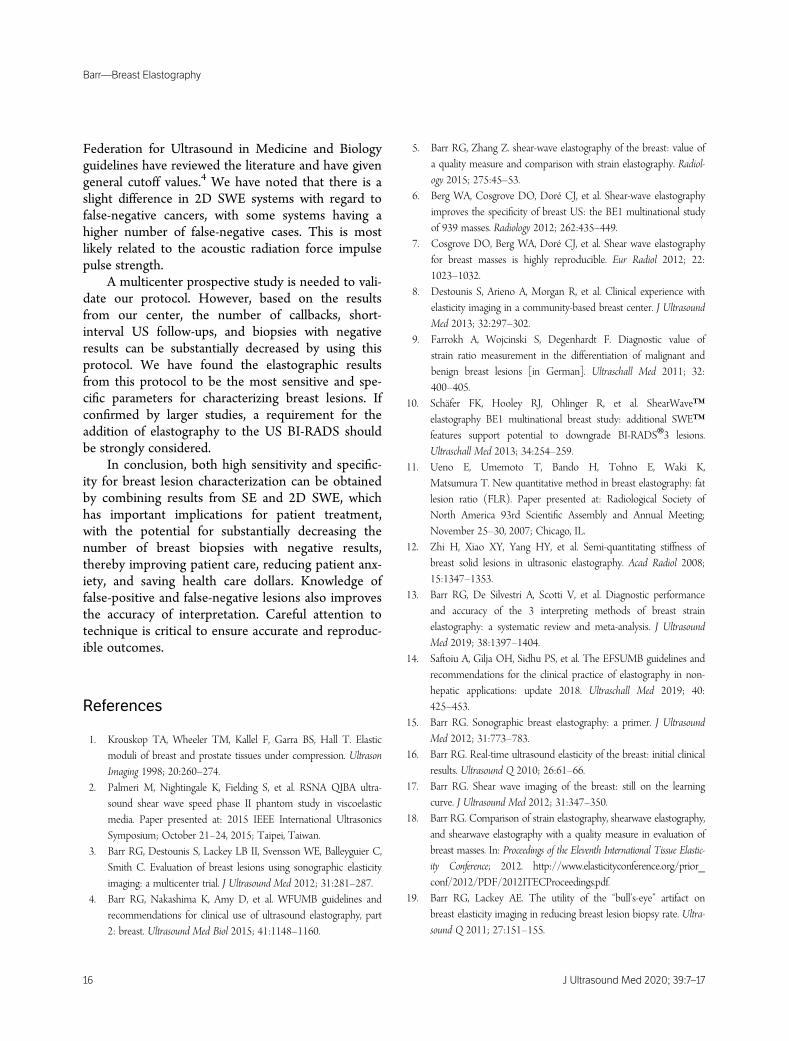
readily identified. With 2D SWE, the various stiffnessvalues within the breast cancer or adjacent few millime-ters can be visualized, and the area of maximal stiffnesscan be selected for measurement. Several articles havedemonstrated improvement in breast lesion characteri-zation using SWE. However, shear wave propagationdoes not occur in many breast cancers. These will notbe color coded, as the system cannot estimate a shearwave speed. There may be a ring of high stiffness sur-rounding the tumor. In some cancers, only noise isidentified, and the US system therefore estimates this asa slow shear wave speed, which could be interpreted asa false-negative finding. The addition of a quality map,which evaluates the quality of the shear waves, is helpfulin identifying these false-negative cases (Figure 2).5
These “blue” or “soft” cancers are usually category 4B,4C, or 5 lesions according to the American College ofRadiology Breast Imaging Reporting and Data System(BI-RADS).
The major reasons for the lack of acceptance ofthese elastographic techniques are nonreproducibility,poor technique, and application and vendor variabil-ity. In this article, we review our technique and proto-col using both SE and SWE, which has produced highsensitivity and specificity in characterization of breastlesions. We highlight the requirements that have hel-ped us obtain high-quality, reproducible results in ourclinical practice. In addition, we will demonstrate howwe integrate the results from breast elastography inour clinical practice to improve sensitivity and speci-ficity in the evaluation of breast masses, therebyreducing unnecessary biopsies, patient anxiety, andhealth care costs without decreasing sensitivity in thediagnosis of breast cancers. This article details ourmethod of performing breast elastography, which wehave developed over the last 10 years. The protocolwas developed on the basis of our priorstudies3,5,13,16–20 with the knowledge gained regardingfalse-positive and false-negative cases. The combina-tion of both SE and 2D SWE overcomes many of theproblems encountered in each when performedindividually.
Methods
A standard US evaluation of the breast is performed byusing grayscale and color Doppler imaging, and a BI-RADS
Barr—Breast Elastography
J Ultrasound Med 2020; 39:7–17 9

category score is assigned to each lesion or area of interest.We then perform both SE and 2D SWE on each lesion orarea of concern. Institutional Review Board approval wasnot required for this report, as it is a review article.
Strain Elastographic TechniqueUltrasound systems with SE that does not require manualcompression/release are used. Strain elastography shouldbe performed with a linear transducer. Most systems have
Figure 2. A–C, Images from a 39-year-old patient with a history of bilateral breast reductions who presented with a new palpable mass. Her mam-mographic findings were negative; however, she had density D breasts. A, Elastogram shows that the lesion (dotted line) measures 1.89 cm on B-mode imaging and 2.07 cm on SE, with an E/B ratio of 1.1, suggestive of a malignant lesion. B, Two-dimensional SWE of the lesion shows that themaximum stiffness in the lesion is 5.02 m/s, consistent with a malignant lesion. C, The quality map corresponding to B shows high quality (green)throughout the 2D SWE. The lesion proved to be fat necrosis on biopsy, a known cause of a false-positive result.D, B-mode images from a 32-year-old patient with an abnormal mammogram shows a 1.1-cm BI-RADS category 4C lesion. E, On 2D SWE, the lesion has a maximum stiffness value of3.9 m/s, which is suggestive of a benign lesion. However, on the quality map (F), the shear wave quality is poor (yellow), so the measurement shouldnot be trusted. In this case, the SE image (not shown) was suggestive of a malignant lesion. The lesion was poorly differentiated invasive ductal can-cer, which was estrogen receptor positive, progesterone receptor positive, and human epidermal growth factor receptor 2 negative on biopsy.
Barr—Breast Elastography
10 J Ultrasound Med 2020; 39:7–17

linear transducers from 9 to 18 MHz that can be used forSE breast imaging. In larger breasts, a lower-frequencytransducer may provide better images. Using these sys-tems, simply holding the transducer still will providehigh-quality elastograms, with the applied stress comingfrom patient breathing and heartbeat cardiac pulsations.There are 2 primary signal-processing approaches forgenerating a strain image: either estimating the strainbased on the radiofrequency/quadrature data or estimat-ing the strain based on the (log-magnitude) detectedimage. The systems (Siemens Medical Solutions [Moun-tain View, CA], Philips Healthcare [Bothell, WA], andMindray [Mahwah, NJ]) that we have validated withreproducible results use the radiofrequency/quadraturedata to estimate the strain.
We chose to use a grayscale map, as this has beenshown to be the most accurate in a meta-analysis.13
The most important technical factor is not to com-press the breast with the transducer.20 The use ofample coupling gel is helpful. After obtaining theB-mode image, the transducer is lifted until it justbarely contacts the skin to ensure that the breastis not compressed by the transducer when theelastogram is obtained. It is helpful to choose andobserve a structure in the far field as the transducer islifted. The object in the far field will move deeper tothe skin surface as the transducer is lifted. Theelastogram is obtained when the object is as deep inthe far field as possible and adequate contact is stillmaintained. The B-mode image may suffer, but this isimportant for obtaining an optimal elastogram. Withthis technique, there should be consistent imageson a cine clip from SE, confirming that the appropri-ate technique is being used. It may be difficult tokeep the transducer stable without movement and tomaintain the same amount of minimal pressure.Supporting the arm or wrist on the patient is impor-tant for controlling the transducer pressure. Anelastographic maximum length–to–B-mode maximumlength (E/B) ratio is used as a semiquantitativemethod of analysis. The measurement can be taken inany plane and any location, although the center of thelesion is preferred. The E/B ratio can be up to 3;therefore, taking the measurement in an area of thelesion that is approximately 1 cm is recommended.An E/B ratio lower than 1 is classified as a benignlesion, whereas an E/B ratio of 1 or higher is consid-ered malignant. Low-grade tumors such as mucinous
cancers and ductal carcinoma in situ can have ratiosclose to 1.21 Three measurements are made, and theone with the highest ratio is used.
When a benign lesion such as a fibroadenoma orfibrocystic change is present in fibroglandular tissue,the stiffness of these benign lesions and fibroglandulartissue is similar. Therefore, identifying the length ofthe lesion becomes problematic. In this situation,comparing the stiffness with the fibroglandular tissueis helpful. If the lesion is benign, the stiffness is simi-lar to the fibroglandular tissue, whereas if it is malig-nant, the lesion will be easily identified, as it issubstantially stiffer than the fibroglandular tissue(Figure 3).
Two-Dimensional SWE TechniqueIn our experience, the 2D SWE systems from multi-ple vendors provide similar results with less inter-vendor variability compared with SE. A lineartransducer that is optimized for breast elastographyshould be used. The frequency varies by vendor andcan range from 9 to 15 MHz. With a higher-frequency transducer, imaging of denser or largebreasts may not provide shear wave results greaterthan 4 cm deep. As in SE, pressure from the trans-ducer markedly affects the elastographic results. Amethod of obtaining consistent results has beendescribed.20 Breast cancers often are not color codedor give false-negative results due to the marked stiff-ness of breast cancers.5,17 These are sometimesreferred to as “blue cancers” or “soft cancers” (ie, verystiff cancers may look soft on SWE). The use of aquality map is helpful in identifying this artifact. Theartifact is discussed in detail elsewhere.5 We use a cut-off value of 4.5 m/s (60 kPa) to characterize breastlesions based on our previous studies, and this num-ber is applicable for multiple vendors. However, thiscutoff is extremely dependent on the amount of pres-sure applied with the transducer. Each center shouldhave a standard method of controlling the degree ofcompression, so that all examiners perform the mea-surements uniformly. Three measurements are takenwithin the lesion or the surrounding ring if present(3 mm) in the area with the highest stiffness. TheROI should only include the area with the higheststiffness. The stiffest value in the ROI is used. Theaverage of the 3 maximum values is used as the finalresult.
Barr—Breast Elastography
J Ultrasound Med 2020; 39:7–17 11

Figure 3.When a benign lesion such as a fibrocystic change is present surrounded by glandular tissue, the stiffness values of both are sim-ilar, and it is difficult to identify the lesion on SE. A, On this SE image of a 60-year-old patient with a palpable lump and negative mammo-graphic findings, the lesion (dotted line) is seen in the B-mode image (left). On SE, the lesion is difficult to identify. The dotted line on the B-mode image has been copied to the SE image. This is because the lesion has similar stiffness as the surrounding tissue. B, However, on 2DSWE, it has benign stiffness with a stiffness value of 2.42 m/s. If the lesion were malignant, it would be stiffer than the surrounding glandulartissue, as in C. Note that the white arrows point to the glandular tissue, whereas the dotted line measures the mass on B-mode imagingand SE. The malignant lesion is clearly identified on SE as black; the glandular tissue is light gray; and fat is white. In this case, the E/B ratiois 1.51, concordant with the biopsy result of invasive ductal cancer.
Barr—Breast Elastography
12 J Ultrasound Med 2020; 39:7–17

Interpretation and Integration Into a Best-PracticePatient Treatment AlgorithmIn our experience, SE has higher sensitivity for thedetection of malignancy in breast lesions, whereas 2DSWE has higher specificity in characterization of breastlesions as benign or malignant.5 However, it is impor-tant to recognize that SE and 2D SWE are complemen-tary imaging techniques. A major interpretationproblem with SE is that benign lesions have similar stiff-ness as fibroglandular tissue. Therefore, benign lesionsare often difficult to identify in glandular tissue, makingit difficult to perform an accurate E/B measurement.However, if the lesion is the same stiffness as the sur-rounding glandular tissue, it has a high probability ofbeing benign. On the other hand, if the lesion is sub-stantially stiffer than the surrounding glandular tissue, ithas a high probability of malignancy. Also, these lesionscan be identified by 2D SWE as benign, as these lesionsall have low stiffness values even though they may notbe clearly distinguished from the fibroglandular tissuebased on the color map. An example of this is presentedin Figure 3. On the other hand, 2D SWE often doesnot provide a stiffness value or may provide a false-negative stiffness value in malignant lesions.5 Oftenthese false-negative values can be detected by using aquality map that evaluates the displacement curves usedto estimate the stiffness value. The map uses a “stop-light” color map: green indicating go (good data); yel-low, caution (poor data); and red, stop (inaccuratedata). However, in solid lesions where the velocity mapis not color coded or soft, but the quality map is poor
(yellow or red), the SE results should be consideredpositive (Figure 2). In these cases, the SE results sug-gest malignancy. Thus, the use of both SE and 2D SWEcan overcome the problems of each individually.Hence, SE and 2D SWE are best considered as comple-mentary techniques.
When both SE and 2D SWE suggest that a breastlesion is malignant, biopsy should be performed regard-less of the BI-RADS category score. False-positivelesions include fat necrosis,22 mastitis,23 complex scleros-ing lesions (radial scars), and a small number offibroadenomas.22 Some cases of fat necrosis and all casesof mastitis have surrounding edema, which is poorlyvisualized on B-mode imaging but substantially increasesthe stiffness of the surrounding tissue. If the patient hasclinical symptoms of mastitis, the patient is treated, anda follow-up examination in 3 to 6 months is performedto confirm complete resolution. If the patient’s mammo-gram has calcifications suggestive of fat necrosis, a6-month follow-up is advised. Also, if the patient hashad surgery at the site and fat necrosis is suspected, con-sideration of a 6-month follow-up is recommended.
When both SE and 2D SWE are suggestive of abenign lesion with a BI-RADS category score of 4A orless, the lesion is classified as benign. For BI-RADS cat-egory 4B lesions with SE and 2D SWE findings consis-tent with a benign lesion, either a 6-month follow-upor biopsy is advised according to the patient’s prefer-ence. Our previous published results confirm that witha pretest probability of 50% (all BI-RADS category 4Band lower lesions) and SE results suggestive of a
Figure 4. With some US systems (those vetted in this article), both simple and complex cysts have a bull’s eye artifact. This artifact is com-posed of a black outer rim (blue arrow), a white central dot (red arrow), and a distal white dot (green arrow). This artifact is 100% sensitiveand 100% specific for a benign simple or complicated cyst.
Barr—Breast Elastography
J Ultrasound Med 2020; 39:7–17 13

Figure 5. Recurrence in a surgical scar can be detected with elastography. The recurrence is stiffer than the surgical scar. This 85-year-oldpatient had a left lumpectomy 12 years previously and presented with a changing scar on a physical examination. A, B-mode image of thepostsurgical scar (white arrows). The lesion is an irregular hypoechoic mass. B, A Doppler evaluation shows a small amount of flow in thesuperior portion of the mass. C, On SE, the upper third of the scar (yellow arrows) is very stiff, whereas the remainder of the scar is soft (redarrows). D, On 2D SWE, the same stiffness pattern is identified, with the superior third having a stiffness value of 7.3 m/s (yellow arrows) andthe remainder of the scar having a stiffness value of 2.1 m/s (red arrows). Biopsy of the stiff portion of the scar confirmed recurrence of inva-sive ductal cancer. It is important to note that elastography can be used to help direct and focus biopsy.
Barr—Breast Elastography
14 J Ultrasound Med 2020; 39:7–17

benign lesion, the posttest probability of malignancy is2%.13 Brest Imaging Reporting and Data System cate-gory 4C and 5 lesions are biopsied even if theelastographic results are suggestive of benign disease.The only false-negative lesion that we have observed islymphoma. Lymphoma in the breast, whether primaryor secondary, presents as a well-circumscribed hypo-echoic lesion with markedly increased blood flow oncolor or power Doppler imaging24 and is soft onelastography. Lesions with these characteristics of lym-phoma are biopsied, especially if the patient has aknown diagnosis of lymphoma.
If SE is suggestive of a malignant lesion and 2DSWE is suggestive of a benign lesion, but the 2DSWE results are of poor quality, the lesion is biopsied.These cases reflect the artifact seen in 2D SWE. If thelesion is suggestive of malignancy on SE, biopsy isrecommended whether the 2D SWE image is consis-tent with a benign lesion with high 2D SWE qualityor a malignant lesion.
If SE is suggestive of a benign lesion and 2DSWE is suggestive of a malignant lesion, the first thingto do is to confirm that minimal transducer pressurewas used when obtaining the 2D SWE image. Also,one should confirm that the stiffness of fat in theimage is within the normal range (1.2–1.4 m/s). Ifhigh stiffness is confirmed on 2D SWE, the lesion isbiopsied. In our experience, this is a rare occurrence.
Special Cases
Bull’s Eye ArtifactWith the validated SE vendors, there is an artifact(bull’s eye artifact) that is specific for benign cysticlesions, whether simple or complex (Figure 4). Thisartifact occurs when all of the material within the cystis mobile. However, it may not occur if the fluid isextremely viscous. If there is a solid component in thecyst, it will appear as a defect in the artifact (Figure 4).This has been validated in a large study using the Sie-mens system19 and had 100% sensitivity and 100%specificity for a benign cystic lesion. The artifact doesnot occur in mucinous or colloid cancers.
Postsurgical ScarsPostsurgical scars are often intermediate in stiffness(below the cutoff value for malignancy). When a
residual or recurrent tumor is present, it will appearas a stiffer area, usually above the cutoff value formalignancy (Figure 5).22
Architectural DistortionIf there are areas of architectural distortion or a palpa-ble mass is present, but no B-mode abnormality isidentified, elastography is also extremely helpful. Ifthe area is stiff (above the cutoff value for 2D SWEand stiffer than glandular tissue on SE), the area isbiopsied. This can be seen in cases of ductal carci-noma in situ and invasive lobular cancer.
These guidelines have been retrospectively appliedto a previously published prospectively collected dataset of US-guided breast lesions.5 Applying thesecriteria to our previously published series,5 we wouldhave had sensitivity of 100% (95% confidence interval,94.2%–100%), specificity of 90.3% (83.2%–95.0%), apositive predictive value of 84.9% (74.6%–92.2%),a negative predictive value of 100% (96.4%–100%), apositive likelihood ratio of 10.3 (5.9–17.5), and a neg-ative likelihood ratio of 0 (0–0.6). A multicenter pro-spective study is needed to fully validate our protocoland patient treatment algorithm.
Discussion
When high-quality reproducible elastography can beperformed on breast lesions, the number of breastbiopsies with negative results can be substantiallydecreased. Since we incorporated elastography in ourpractice over the last 10 years, our positive biopsyrate has increased from approximately 20%16 to 80%without missing breast cancers.
It is our observation that SE systems that requiremanual compression and release have more artifactsand have a substantial learning curve, making theirresults less accurate and reproducible. We also believethat using color maps in which small stiffness changestranslate into large color changes is also problematic.This was also reported in a large meta-analysis of SEfor characterization of breast lesions.13
Although, to our knowledge, no study comparingthe stiffness values of various vendors using 2D SWEhas been published, in our experience, there is nonotable difference between vendors, although thecutoff values may be slightly different. The World
Barr—Breast Elastography
J Ultrasound Med 2020; 39:7–17 15
Federation for Ultrasound in Medicine and Biologyguidelines have reviewed the literature and have givengeneral cutoff values.4 We have noted that there is aslight difference in 2D SWE systems with regard tofalse-negative cancers, with some systems having ahigher number of false-negative cases. This is mostlikely related to the acoustic radiation force impulsepulse strength.
A multicenter prospective study is needed to vali-date our protocol. However, based on the resultsfrom our center, the number of callbacks, short-interval US follow-ups, and biopsies with negativeresults can be substantially decreased by using thisprotocol. We have found the elastographic resultsfrom this protocol to be the most sensitive and spe-cific parameters for characterizing breast lesions. Ifconfirmed by larger studies, a requirement for theaddition of elastography to the US BI-RADS shouldbe strongly considered.
In conclusion, both high sensitivity and specific-ity for breast lesion characterization can be obtainedby combining results from SE and 2D SWE, whichhas important implications for patient treatment,with the potential for substantially decreasing thenumber of breast biopsies with negative results,thereby improving patient care, reducing patient anx-iety, and saving health care dollars. Knowledge offalse-positive and false-negative lesions also improvesthe accuracy of interpretation. Careful attention totechnique is critical to ensure accurate and reproduc-ible outcomes.
References
1. Krouskop TA, Wheeler TM, Kallel F, Garra BS, Hall T. Elasticmoduli of breast and prostate tissues under compression. UltrasonImaging 1998; 20:260–274.
2. Palmeri M, Nightingale K, Fielding S, et al. RSNA QIBA ultra-sound shear wave speed phase II phantom study in viscoelasticmedia. Paper presented at: 2015 IEEE International UltrasonicsSymposium; October 21–24, 2015; Taipei, Taiwan.
3. Barr RG, Destounis S, Lackey LB II, Svensson WE, Balleyguier C,Smith C. Evaluation of breast lesions using sonographic elasticityimaging: a multicenter trial. J Ultrasound Med 2012; 31:281–287.
4. Barr RG, Nakashima K, Amy D, et al. WFUMB guidelines andrecommendations for clinical use of ultrasound elastography, part2: breast. Ultrasound Med Biol 2015; 41:1148–1160.
5. Barr RG, Zhang Z. shear-wave elastography of the breast: value ofa quality measure and comparison with strain elastography. Radiol-ogy 2015; 275:45–53.
6. Berg WA, Cosgrove DO, Doré CJ, et al. Shear-wave elastographyimproves the specificity of breast US: the BE1 multinational studyof 939 masses. Radiology 2012; 262:435–449.
7. Cosgrove DO, Berg WA, Doré CJ, et al. Shear wave elastographyfor breast masses is highly reproducible. Eur Radiol 2012; 22:1023–1032.
8. Destounis S, Arieno A, Morgan R, et al. Clinical experience withelasticity imaging in a community-based breast center. J UltrasoundMed 2013; 32:297–302.
9. Farrokh A, Wojcinski S, Degenhardt F. Diagnostic value ofstrain ratio measurement in the differentiation of malignant andbenign breast lesions [in German]. Ultraschall Med 2011; 32:400–405.
10. Schäfer FK, Hooley RJ, Ohlinger R, et al. ShearWave™elastography BE1 multinational breast study: additional SWE™features support potential to downgrade BI-RADS®3 lesions.Ultraschall Med 2013; 34:254–259.
11. Ueno E, Umemoto T, Bando H, Tohno E, Waki K,Matsumura T. New quantitative method in breast elastography: fatlesion ratio (FLR). Paper presented at: Radiological Society ofNorth America 93rd Scientific Assembly and Annual Meeting;November 25–30, 2007; Chicago, IL.
12. Zhi H, Xiao XY, Yang HY, et al. Semi-quantitating stiffness ofbreast solid lesions in ultrasonic elastography. Acad Radiol 2008;15:1347–1353.
13. Barr RG, De Silvestri A, Scotti V, et al. Diagnostic performanceand accuracy of the 3 interpreting methods of breast strainelastography: a systematic review and meta-analysis. J UltrasoundMed 2019; 38:1397–1404.
14. Saftoiu A, Gilja OH, Sidhu PS, et al. The EFSUMB guidelines andrecommendations for the clinical practice of elastography in non-hepatic applications: update 2018. Ultraschall Med 2019; 40:425–453.
15. Barr RG. Sonographic breast elastography: a primer. J UltrasoundMed 2012; 31:773–783.
16. Barr RG. Real-time ultrasound elasticity of the breast: initial clinicalresults. Ultrasound Q 2010; 26:61–66.
17. Barr RG. Shear wave imaging of the breast: still on the learningcurve. J Ultrasound Med 2012; 31:347–350.
18. Barr RG. Comparison of strain elastography, shearwave elastography,and shearwave elastography with a quality measure in evaluation ofbreast masses. In: Proceedings of the Eleventh International Tissue Elastic-ity Conference; 2012. http://www.elasticityconference.org/prior_conf/2012/PDF/2012ITECProceedings.pdf.
19. Barr RG, Lackey AE. The utility of the “bull’s-eye” artifact onbreast elasticity imaging in reducing breast lesion biopsy rate. Ultra-sound Q 2011; 27:151–155.
Barr—Breast Elastography
16 J Ultrasound Med 2020; 39:7–17

20. Barr RG, Zhang Z. Effects of precompression on elasticity imagingof the breast: development of a clinically useful semiquantitativemethod of precompression assessment. J Ultrasound Med 2012; 31:895–902.
21. Grajo JR, Barr RG. Strain elastography in the prediction of breastcancer tumor grade. J Ultrasound Med 2014; 33:129–134.
22. Barr RG. Breast Elastography. New York, NY: Thieme Publishers;2014.
23. Sousaris N, Barr RG. Sonographic elastography of mastitis.J Ultrasound Med 2016; 35:1791–1797.
24. Sousaris N, Barr RG. Sonoelastography of breast lymphoma. Ultra-sound Q 2016; 32:208–211.
Barr—Breast Elastography
J Ultrasound Med 2020; 39:7–17 17
Related Documents


![Ultrasound elastography in neuromuscular and movement ......acoustic radiation force imaging (ARFI), and transient elastography (TE) [33]. 2.1. Ultrasound strain elastography Ultrasound](https://static.cupdf.com/doc/110x72/5f02150f7e708231d4027b6b/ultrasound-elastography-in-neuromuscular-and-movement-acoustic-radiation.jpg)


