BreakDancer: An algorithm for high resolution mapping of genomic structural variation Ken Chen 1,* , John W. Wallis 1 , Michael D. McLellan 1 , David E. Larson 1 , Joelle M. Kalicki 1 , Craig S. Pohl 1 , Sean D. McGrath 1 , Michael C. Wendl 1 , Qunyuan Zhang 2 , Devin P. Locke 1 , Xiaoqi Shi 1 , Robert S. Fulton 1 , Timothy J. Ley 1 , Richard K. Wilson 1 , Li Ding 1 , and Elaine R. Mardis 1 1 The Genome Center, Washington University School of Medicine, St. Louis, MO 63108 2 Division of Statistical Genomics, Washington University School of Medicine, St. Louis, MO 63108 Abstract Detection and characterization of genomic structural variation are important for understanding the landscape of genetic variation in human populations and in complex diseases such as cancer. Recent studies demonstrate the feasibility of detecting structural variation using next-generation, short-insert, paired-end sequencing reads. However, the utility of these reads is not entirely clear, nor are the analysis methods under which accurate detection can be achieved. The algorithm BreakDancer predicts a wide variety of structural variants including indels, inversions, and translocations. We examined BreakDancer's performance in simulation, comparison with other methods, analysis of an acute myeloid leukemia sample, and the 1,000 Genomes trio individuals. We found that it substantially improved the detection of small and intermediate size indels from 10 bp to 1 Mbp that are difficult to detect via a single conventional approach. Introduction Genomic structural variation is commonly considered to be any DNA sequence alteration other than a single nucleotide substitution 1 . Instances of structural variants in germ and somatic cells contribute respectively to heritable genetic diseases 2,3 and cancers 4-6 . Numerous types of structural variation exist, including indels, copy number variants (CNVs), inversions, and translocations. Many inherited CNVs (> 30 kb) have been discovered using array comparative genomic hybridization (CGH) 7 and high density SNP arrays 8 . Alignment of DNA sequences from different sources has been used to identify small or balanced rearrangements not detectable by arrays 9,10 . Recent sequencing and assembly of individual genomes have revealed larger numbers of structural variants than originally expected, especially in the smaller size range (< 1 kb) 11,12 . However, precise characterization and genotyping of structural variants are still difficult and expensive due to limitations in sequencing technology and detection methods. Much of the recent advance in structural variation detection can be attributed to next- generation sequencing (NGS) instruments 13 , which have dramatically economized paired- * Corresponding author: Dr. Ken Chen, 4444 Forest Park Blvd., The Genome Center, Washington University School of Medicine, St. Louis, MO 63108, Phone: 314-286-1825 (o), Fax: 314-286-1810, [email protected]. Author's Contributions: E.R.M, R.K.W, L.D., and T.J.L.: project conception and oversight. K.C.: algorithm design and implementation. J.W.W.: variant assembly. J.M.K, M.D.M, and R.S.F.: experimental validation. C.S.P. and L.D.: primer design. S.D.M and D.P.L.: Illumina library preparation. Q.Z. and M.C.W.: statistical insight. J.W.W., D.E.L., X.S., and D.P.L: variant characterization and visualization. K.C., E.R.M., M.C.W., L.D., and J.W.W.: manuscript preparation. NIH Public Access Author Manuscript Nat Methods. Author manuscript; available in PMC 2013 May 22. Published in final edited form as: Nat Methods. 2009 September ; 6(9): 677–681. doi:10.1038/nmeth.1363. NIH-PA Author Manuscript NIH-PA Author Manuscript NIH-PA Author Manuscript

Welcome message from author
This document is posted to help you gain knowledge. Please leave a comment to let me know what you think about it! Share it to your friends and learn new things together.
Transcript
BreakDancer: An algorithm for high resolution mapping ofgenomic structural variation
Ken Chen1,*, John W. Wallis1, Michael D. McLellan1, David E. Larson1, Joelle M. Kalicki1,Craig S. Pohl1, Sean D. McGrath1, Michael C. Wendl1, Qunyuan Zhang2, Devin P. Locke1,Xiaoqi Shi1, Robert S. Fulton1, Timothy J. Ley1, Richard K. Wilson1, Li Ding1, and Elaine R.Mardis1
1The Genome Center, Washington University School of Medicine, St. Louis, MO 631082Division of Statistical Genomics, Washington University School of Medicine, St. Louis, MO63108
AbstractDetection and characterization of genomic structural variation are important for understanding thelandscape of genetic variation in human populations and in complex diseases such as cancer.Recent studies demonstrate the feasibility of detecting structural variation using next-generation,short-insert, paired-end sequencing reads. However, the utility of these reads is not entirely clear,nor are the analysis methods under which accurate detection can be achieved. The algorithmBreakDancer predicts a wide variety of structural variants including indels, inversions, andtranslocations. We examined BreakDancer's performance in simulation, comparison with othermethods, analysis of an acute myeloid leukemia sample, and the 1,000 Genomes trio individuals.We found that it substantially improved the detection of small and intermediate size indels from10 bp to 1 Mbp that are difficult to detect via a single conventional approach.
IntroductionGenomic structural variation is commonly considered to be any DNA sequence alterationother than a single nucleotide substitution1. Instances of structural variants in germ andsomatic cells contribute respectively to heritable genetic diseases2,3 and cancers4-6.Numerous types of structural variation exist, including indels, copy number variants(CNVs), inversions, and translocations. Many inherited CNVs (> 30 kb) have beendiscovered using array comparative genomic hybridization (CGH)7 and high density SNParrays8. Alignment of DNA sequences from different sources has been used to identify smallor balanced rearrangements not detectable by arrays9,10. Recent sequencing and assembly ofindividual genomes have revealed larger numbers of structural variants than originallyexpected, especially in the smaller size range (< 1 kb)11,12. However, precisecharacterization and genotyping of structural variants are still difficult and expensive due tolimitations in sequencing technology and detection methods.
Much of the recent advance in structural variation detection can be attributed to next-generation sequencing (NGS) instruments13, which have dramatically economized paired-
*Corresponding author: Dr. Ken Chen, 4444 Forest Park Blvd., The Genome Center, Washington University School of Medicine, St.Louis, MO 63108, Phone: 314-286-1825 (o), Fax: 314-286-1810, [email protected].
Author's Contributions: E.R.M, R.K.W, L.D., and T.J.L.: project conception and oversight. K.C.: algorithm design andimplementation. J.W.W.: variant assembly. J.M.K, M.D.M, and R.S.F.: experimental validation. C.S.P. and L.D.: primer design.S.D.M and D.P.L.: Illumina library preparation. Q.Z. and M.C.W.: statistical insight. J.W.W., D.E.L., X.S., and D.P.L: variantcharacterization and visualization. K.C., E.R.M., M.C.W., L.D., and J.W.W.: manuscript preparation.
NIH Public AccessAuthor ManuscriptNat Methods. Author manuscript; available in PMC 2013 May 22.
Published in final edited form as:Nat Methods. 2009 September ; 6(9): 677–681. doi:10.1038/nmeth.1363.
NIH
-PA Author Manuscript
NIH
-PA Author Manuscript
NIH
-PA Author Manuscript
end, whole-genome sequencing. One widely used instrument, the Illumina GenomeAnalyzer (GA) II, employs DNA fragments between 100 and 500 bp and requires little inputDNA (∼1 μg) for sufficient genome-wide coverage. Recent whole genome resequencingprojects14,15 have obtained paired end sequence coverage of 20-40 × and have predictedthousands of structural variants using end sequencing profiling (ESP) methods that discernsvariants via perceived anomalies in the separation lengths or orientation of aligned readpairs16,17.
Many substantive issues regarding the analysis of paired-end data, however, remainunresolved. Open questions include whether the procedures and heuristics established forfosmids and BACs can be extrapolated to short inserts, how the expected false positive andnegative rates vary with coverage, insert size, and read length, and how predictionconfidence should be established. As NGS data begin to dominate whole genomeresequencing projects, there is a pressing need both to obtain precise answers and to providepractical solutions for data analysis.
Here, we address these questions using a combination of computational and experimentalapproaches. Our software package, collectively called BreakDancer consists of twocomplementary algorithms. The first, BreakDancerMax, provides genome-wide detection offive types of structural variants: deletions, insertions, inversions, intra-chromosomal andinter-chromosomal translocations from one or a pool of DNA samples sequenced by GA II(Fig .1). The second, BreakDancerMini, focuses on detecting small indels (typically between10-100 bp) that are not routinely detected by BreakDancerMax. Together, they providesensitive and accurate detection for a wide variety of structural variants, as demonstrated inboth simulation and real data analysis14,18,19.
ResultsSimulation
To quantify BreakDancer's performance with respect to different parameter settings, weproduced synthetic data based on 844 structural variants identified on chromosome 17 of J.Craig Venter's genome11, which include 425 deletions, 415 insertions, and 4 inversionsranging from 20 bp to 7953 bp. We excluded indels shorter than 20 bp since they arerelatively easy to detect via Smith-Waterman algorithm (Supplementary Fig. 1). Manyvariants in this set occur in repetitive regions that are difficult to map or assemble(Supplementary Notes).
We considered a deletion or an inversion as detected if it overlapped 50% reciprocally witha predicted variant. We considered an insertion as detected if its single breakpoint overlaps apredicted variant.
We simulated 50 bp paired-end reads from the chromosome 17 nucleotide sequence ofVenter's genome using MAQ-0.7.120 with normally distributed insert size of a 200 bp meanand a 20 bp standard deviation (s.d.). We analyzed the set of reads that were confidentlymapped (MAQ mapping quality > 10) using BreakDancerMax at a separation threshold of 3s.d. Among the 365 (43.2%) variants whose flanking regions contain 2 or more anomalouslymapped reads at 100 ×, 324 (89%) were detected with a 1.48% false positive rate (FPR)including 147 that are shorter than 60 bp (Fig. 2 and Supplementary Table 1).
The 324 detected SVs included 214 deletions, 109 insertions, and 3 inversions with varyingtrue positive rate (TPR) in different size ranges and coverages (Online Methods andSupplementary Fig. 2). Of the 214 deletions, 203 (95%) were correctly predicted asdeletions with accurate sizes (Pearson's r = 0.92) (Supplementary Fig. 3a). In comparison,
Chen et al. Page 2
Nat Methods. Author manuscript; available in PMC 2013 May 22.
NIH
-PA Author Manuscript
NIH
-PA Author Manuscript
NIH
-PA Author Manuscript
only 72/109 (66%) known insertions were correctly predicted as insertions with lessaccurate sizes (r = 0.65) and breakpoints (Supplementary Fig. 3a,b). Longer deletions weremore accurately predicted in terms of both size and breakpoint.
The confidence score we derived to prioritize BreakDancerMax predictions (OnlineMethods) demonstrated improved statistical properties when compared to simply using thenumber of anomalously mapped read pairs (ARPs), which remains the de facto standardmetric21-23. It provides finer distinction among variants that are supported by identicalnumber of ARPs (Supplementary Fig. 4). It also reduces the result's dependency on theseparation threshold and leads to relatively consistent TPRs and FPRs. (Supplementary Fig.5).
We ran BreakDancerMini on the same data and required the anomalous regions having two-sample Kolmogorov–Smirnov test statistics Dnn′ ≥ 2.3 (Online Methods and SupplementaryFig. 6). We observed dramatic improvement in detecting small indels (Fig. 2). At 100 ×physical coverage, BreakDancerMini detected 543 (64.3%) variants with a 7.3% FPR,including 407 (75.0%) that are shorter than 60 bp. We merged the indels (< 100 bp) detectedby BreakDancerMini with those detected by BreakDancerMax and obtained a non-redundant set of 683 variants, including 365 deletions, 290 insertions, and 21 inversions.Altogether, 621 (74%) of the known variants were detected with a 9.1% FPR.
We repeated this simulation under identical conditions but included indels between 10 and20 bp. On this set, BreakDancerMax alone only detected 24% of the 1897 known variantswith a 7% FPR. However, in combination with BreakDancerMini, we detected 68.0% with a10.3% FPR, 62.6% of which are between 10 and 20 bp. The size of indels appeared to bereasonably accurately predicted throughout the range (Supplementary Fig. 7a,b).
Comparison with other methodsWe compared BreakDancer with to recently published structural variant detection toolsVariationHunter24 and MoDIL25. Noticeably, these tools both use a different mappingalgorithm, MrFast (http://mrfast.sourceforge.net/) than BreakDancer. MoDIL andBreakDancerMini both utilize the Kolmogorov–Smirnov test26, but differ in manyalgorithmic details.
We ran BreakDancerMax and BreakDancerMini on the obtained MAQ map files of theYoruban genome14 (Online Methods) with a conservative threshold of 4 s.d. forBreakDancerMax, Dnn′ ≥ 2.3. for BreakDancerMini and MAQ mapping quality > 10.BreakDancerMax returned a set of 9,202 deletions, 4,901 insertions, and 665 inversionswhile BreakDancerMini returned a set of 21,433 deletions, 17,029 insertions that are shorterthan 100 bp. After merging them by position, we obtained a non-redundant set of 27,092deletions, 19,305 insertions, and 665 inversions.
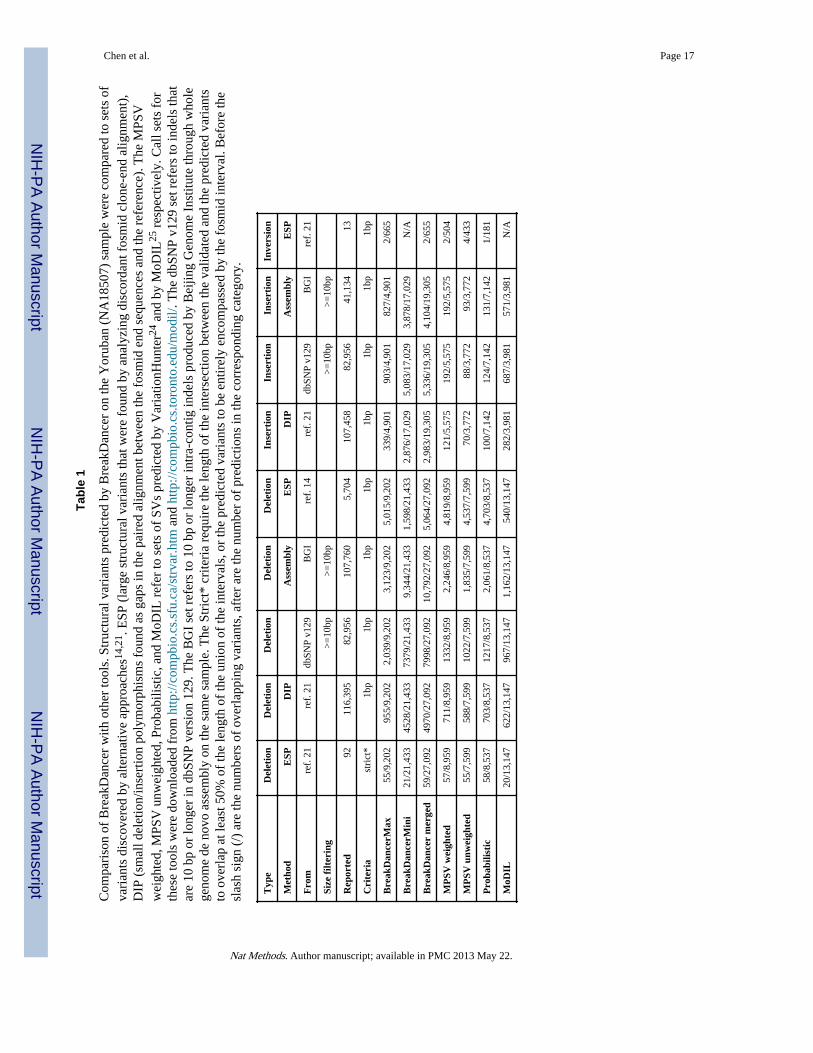
We examined the overlap between the predicted variants with those obtained throughalternative approaches (Table 1). Altogether, BreakDancer detected a total of 59/92 (64.1%)large fosmid deletions21, which is comparable to VariationHunter under identicalconditions24. Among the deletions predicted by BreakDancerMini, 21.1% overlapped atleast 1 bp with 4528 known deletion polymorphisms21, 34.4% with dbSNP v129, and 43.6%with the intra-contig deletions produced by Beijing Genome Institute (BGI) through wholegenome de novo assembly (unpub. data). Among the insertions predicted byBreakDancerMini, 16.9% overlapped with 2876 known insertion polymorphisms21, 29.8%with dbSNP v129, and 22.8% with BGI insertions. Indels < 10bp in the dbSNP and in theBGI sets were excluded in the comparison. All these percentages are substantially higherthan those obtained by VariationHunter or MoDIL. The variant sizes estimated by
Chen et al. Page 3
Nat Methods. Author manuscript; available in PMC 2013 May 22.
NIH
-PA Author Manuscript
NIH
-PA Author Manuscript
NIH
-PA Author Manuscript
BreakDancerMini were highly correlated with the deletion or insertion polymorphisms21 (r> 0.8).
In addition, 54.3% of the deletions predicted by BreakDancerMax overlapped with 87.7% ofthe deletions originally reported14. Both percentages are higher in comparison to thoseobtained by VariationHunter24, possibly because BreakDancerMax uses algorithms similarto the in the original article14.
Detecting variants in an AML sampleWe performed variant detection using data obtained from the tumor and the normal samplesof an individual with cytogenetically normal AML19. we obtained 21 × paired-end haploidcoverage for both the tumor and the normal genomes, corresponding to 63.5 × and 39.9 ×physical coverage, respectively.
We jointly analyzed data from six libraries using BreakDancerMax with library specificseparation thresholds and MAQ mapping quality > 35. At a confidence score threshold of Q≥ 60, 7087 variants were predicted, including 3170 deletions, 1570 insertions, 1382inversions, and 965 intra-chromosomal translocations (Fig. 2 and Supplementary Table 2).46.4% of these deletions overlapped (50% interval) with known inherited CNVs in thedatabase of genomic variants v5 (DGV). The percent of overlap became 5-8% higher henculling variants based on the confidence scores instead of the number of ARPs alone(Supplementary Fig. 8). A recent study using Affymetrix 6.0 array identified 116 inheritedCNVs on the same individual27, 37 (31.90%) of which overlap with our predictions. Theseoverlapping CNVs range from 131 bp to 1.5 Mbp with no noticeable bias in size.
We extracted variants that were detected only in the tumor and derived a set of 223 putativesomatic variants including 100 deletions, 67 insertions (< 100 bp), 22 inversions, and 34intra-chromosomal translocations. We attempted a local assembly for each of the 167 indels,using the reads mapped to the predicted variant interval (Methods). We were able to callvariants from the assemblies in 153 of the 167 instances, with 100 confirming the variants(79 both in the tumor and in the normal, 17 only in the tumor, and 4 only in the normal).
We submitted the set of 167 indels for experimental validation (Methods). 110 (69 deletionsand 41 insertions) were validated both in the tumor and in the normal, 31 were not validatedeither in the tumor or in the normal, and 26 were not called due to lo data quality(Supplementary Table 3). This suggested a 78% validation rate, excluding the no-calls.Noticeably, 16 of the 20 deletions that were not validated received a confidence score below80 (Supplementary Fig. 9). Therefore, the validation rate became 89% at Q ≥ 80. The size ofthe deletions determined by BreakDancerMax shoed good correlation with those determinedindependently from the validation experiment (r = 0.867).
Local assembly clearly improved overall accuracy in that 79 variants were correctlyidentified in both the tumor and the normal. Although the false negative rate of the assemblycalls as relatively high: 26 (49%) of the 53 non-variant calls were validated in theexperiment, the FPR as fairly lo: only six (6%) variant calls could not be validated. Thisobservation suggested using assembly in a confirmatory role, rather than as a mechanism tolimit false negatives. The assembly also improved the size estimation of small indels (Fig.3).
Among the identified insertions, three appeared to be ancient alleles that are closer to chimpthan to the human reference. In at least 4 inherited deletions we identified, there are stretchesof 10-20 bp AT-rich microhomologous sequences inserted between the deletion breakpoints,likely formed by transposons hen they inserted into the genome.
Chen et al. Page 4
Nat Methods. Author manuscript; available in PMC 2013 May 22.
NIH
-PA Author Manuscript
NIH
-PA Author Manuscript
NIH
-PA Author Manuscript
We were only able to obtain high quality validation data for 13 inversions and 6 intra-chromosomal translocations. Of these, four inversions and to intra-chromosomaltranslocations were validated both in the tumor and in the normal (Supplementary Fig. 10a-f).
Detecting variants in a 1,000 Genomes datasetWe applied BreakDancerMax to the 1,000 Genomes Project18 data and compared ourdeletion calls with those that were previously known via fosmid ESP21 and array CGH28 onchromosome 5 of the CEU and the YRI trio individuals.
Each CEU individual had reads from to paired-end libraries with ∼15 × physical coverage(Supplementary Table 4). At the threshold of 4 s.d., mapping quality > 35 and Q ≥ 40, 125deletions were detected in NA12878, 79 (63%) of which overlap DGV. Around 25-35% ofknown deletions were present in our calls (Supplementary Table 5). This percentageincreased substantially to 35%-45% after lowering mapping quality threshold to 10, whilethe DGV concordance dropped to 54%. Reducing the separation distance cutoff from 4 s.d.to 3 s.d. increased the total number of Q ≥ 40 predictions by about 20%, but did not increasethe numbers of known variants that were detected. Interestingly, 40-57% of known variantswere detected when we jointly analyzed reads from all three individuals with library specificseparation thresholds. There as a substantial overlap among the predicted deletions of thetrio individuals: 88/120 (73%) deletions in the father (NA12891) and 98/133 (74%) in themother (NA12892) were independently detected in the child (NA12878).
We repeated the same set of analyses using data from the YRI trio individuals. Eachindividual had reads from to paired-end libraries with about 50 × to 70 × physical coverage(Supplementary Table 4). At the threshold of 4 s.d., mapping quality > 35 and Q ≥ 40, 246deletions were detected in NA19240, 123 (50%) of which overlapped DGV. Around50%-100% known deletions were present in our calls (Supplementary Table 6). Noadditional known variants were detected after lowering mapping quality threshold to 10 orby performing pooled analysis. There as a substantial overlap among the deletions of the trioindividuals: 168/235 (72%) deletions in the father (NA19239) and 126/164 (77%) in themother (NA19238) were also independently detected in the child (NA19240).
In contrast to these substantial familial overlaps, the degree of overlap between individualsin different families as noticeably lower (31-37%).
DiscussionOur study indicates that BreakDancer has achieved accurate and sensitive structural variantdiscovery based on short-insert paired-end read mapping. The pooled analysis frameworkimplemented in BreakDancer produces unified segmentation across pooled samples andlibraries. In a family-/population-based study, it enhances the detection of common variants,as demonstrated in our analysis of the CEU trio. In a tumor-normal paired study, it improvesthe specificity of somatic variant prediction through effective elimination of inheritedvariants. This is particularly important hen discovery power is not matched in the pairedgenomes due to different insert size.
It is possible to further improve BreakDancer's performance by systematically integratingmore information in confidence scoring. For example, it may be beneficial to incorporate themapping quality rather than applying a fixed threshold. Moreover, there is evidencesuggesting that integrating read depth may help improve segmentation and genotyping29,although an effective integration method is yet to be discovered. Our goal is to derive phred-style quality scores that accurately predict the error probability.
Chen et al. Page 5
Nat Methods. Author manuscript; available in PMC 2013 May 22.
NIH
-PA Author Manuscript
NIH
-PA Author Manuscript
NIH
-PA Author Manuscript
Some types of structural variants, such as inversions and translocations, appeared to be moredifficult to detect and validate. Many putative predictions overlapped with regions of tandemor inverted repeat and required further sequence analysis and filtering, or the use ofadditional longer reads and longer inserts. Nonetheless, BreakDancer as able to identifybona fide instances of inversions and intra-chromosomal translocations in this study, andsomatic inter-chromosomal translocations in our study of glioblastoma multiforme, ovarian,and other AML samples (data not shown).
The algorithms we implemented in BreakDancer are generic and can potentially beexpanded to analyze data of different insert sizes or produced by different sequencingtechnologies. It can also be expanded to analyze paired-end data obtained from mRNAsequencing to identify instances of gene fusion and alternative splicing.
MethodsBreakDancerMax
Our first algorithm BreakDancerMax starts with the map files produced by MAQ20 (Fig.1a). Read pairs mapped to a reference genome with sufficient mapping quality areindependently classified into six types (Fig. 1b): normal, deletion, insertion, inversion, intra-chromosomal translocation, and inter-chromosomal translocation. This classification processis based on 1) the separation distance and alignment orientation between the paired reads, 2)the user-specified threshold, and 3) the empirical insert size distribution estimated from thealignment of each library contributing genome coverage. The algorithm then searches forgenomic regions that anchor significantly more anomalous read pairs (ARPs) than expectedon average. A putative structural variant is derived from the identification of one or moreregions that are interconnected by at least to ARPs. A confidence score is estimated for eachvariant based on a Poisson model that takes into consideration the number of supportingARPs, the size of the anchoring regions and the coverage of the genome. The dominant typeof associated ARPs in a particular region determines the type of structural variant. The startand the end coordinates are defined as the inner boundaries of the constituent regions thatare closest to the suspected breakpoints, while the size is estimated by subtracting the meaninsert size from the average spanning distance in each library and then averaging acrosslibraries.
Confidence score estimationIt is important to derive confidence scores that quantify the underlying error probabilities ofthe predicted structural variants. The accuracy of the score depends on many factors, forexample, whether the set of reads represents an unbiased sampling of the genome and allalleles, whether the reads are mapped to correct locations, and whether the amount ofobserved evidence is significant.
One of the primary signals for the presence of a structural variant is the clustering of ARPs.Therefore, it is important to measure the degree of clustering from the perspective of bothdepth and breadth. We assume that under the null hypothesis of no variant, the genomiclocation of one particular type of insert is uniformly distributed14. For studies that definemore than one insert type, the number of inserts at a particular location forms a mixturePoisson distribution with each mixture component representing one of the insert types. Thestatistic that summarizes the degree of clustering of a particular insert type is the probabilityof having more than the observed number of inserts in a given region:
Chen et al. Page 6
Nat Methods. Author manuscript; available in PMC 2013 May 22.
NIH
-PA Author Manuscript
NIH
-PA Author Manuscript
NIH
-PA Author Manuscript
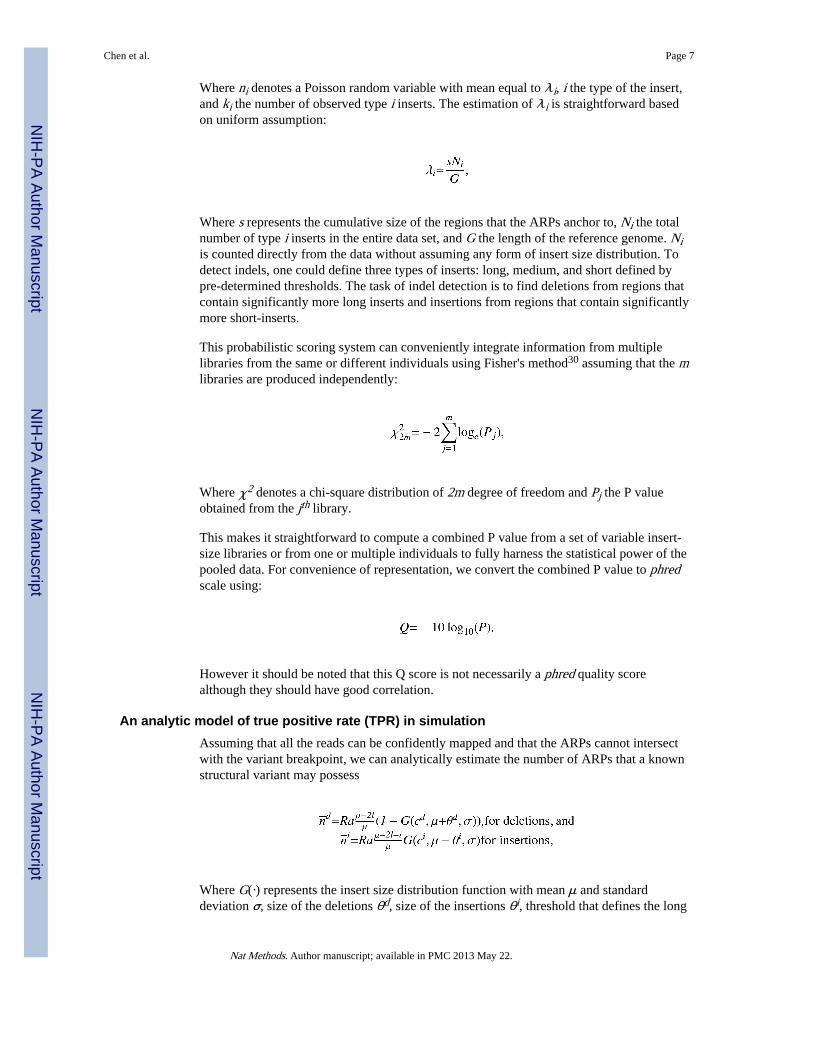
Where ni denotes a Poisson random variable with mean equal to λi, i the type of the insert,and ki the number of observed type i inserts. The estimation of λi is straightforward basedon uniform assumption:
Where s represents the cumulative size of the regions that the ARPs anchor to, Ni the totalnumber of type i inserts in the entire data set, and G the length of the reference genome. Niis counted directly from the data without assuming any form of insert size distribution. Todetect indels, one could define three types of inserts: long, medium, and short defined bypre-determined thresholds. The task of indel detection is to find deletions from regions thatcontain significantly more long inserts and insertions from regions that contain significantlymore short-inserts.
This probabilistic scoring system can conveniently integrate information from multiplelibraries from the same or different individuals using Fisher's method30 assuming that the mlibraries are produced independently:
Where χ2 denotes a chi-square distribution of 2m degree of freedom and Pj the P valueobtained from the jth library.
This makes it straightforward to compute a combined P value from a set of variable insert-size libraries or from one or multiple individuals to fully harness the statistical power of thepooled data. For convenience of representation, we convert the combined P value to phredscale using:
However it should be noted that this Q score is not necessarily a phred quality scorealthough they should have good correlation.
An analytic model of true positive rate (TPR) in simulationAssuming that all the reads can be confidently mapped and that the ARPs cannot intersectwith the variant breakpoint, we can analytically estimate the number of ARPs that a knownstructural variant may possess
Where G(·) represents the insert size distribution function with mean μ and standarddeviation σ, size of the deletions θd, size of the insertions θi, threshold that defines the long
Chen et al. Page 7
Nat Methods. Author manuscript; available in PMC 2013 May 22.
NIH
-PA Author Manuscript
NIH
-PA Author Manuscript
NIH
-PA Author Manuscript
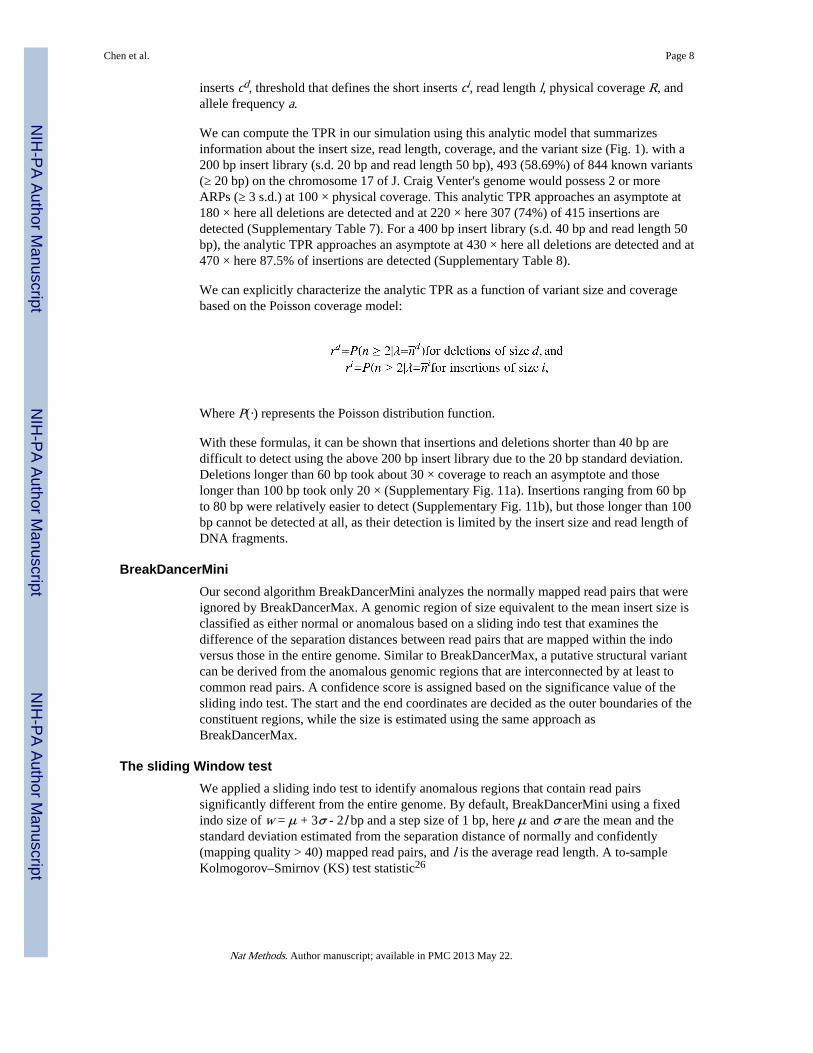
inserts cd, threshold that defines the short inserts ci, read length l, physical coverage R, andallele frequency a.
We can compute the TPR in our simulation using this analytic model that summarizesinformation about the insert size, read length, coverage, and the variant size (Fig. 1). with a200 bp insert library (s.d. 20 bp and read length 50 bp), 493 (58.69%) of 844 known variants(≥ 20 bp) on the chromosome 17 of J. Craig Venter's genome would possess 2 or moreARPs (≥ 3 s.d.) at 100 × physical coverage. This analytic TPR approaches an asymptote at180 × here all deletions are detected and at 220 × here 307 (74%) of 415 insertions aredetected (Supplementary Table 7). For a 400 bp insert library (s.d. 40 bp and read length 50bp), the analytic TPR approaches an asymptote at 430 × here all deletions are detected and at470 × here 87.5% of insertions are detected (Supplementary Table 8).
We can explicitly characterize the analytic TPR as a function of variant size and coveragebased on the Poisson coverage model:
Where P(·) represents the Poisson distribution function.
With these formulas, it can be shown that insertions and deletions shorter than 40 bp aredifficult to detect using the above 200 bp insert library due to the 20 bp standard deviation.Deletions longer than 60 bp took about 30 × coverage to reach an asymptote and thoselonger than 100 bp took only 20 × (Supplementary Fig. 11a). Insertions ranging from 60 bpto 80 bp were relatively easier to detect (Supplementary Fig. 11b), but those longer than 100bp cannot be detected at all, as their detection is limited by the insert size and read length ofDNA fragments.
BreakDancerMiniOur second algorithm BreakDancerMini analyzes the normally mapped read pairs that wereignored by BreakDancerMax. A genomic region of size equivalent to the mean insert size isclassified as either normal or anomalous based on a sliding indo test that examines thedifference of the separation distances between read pairs that are mapped within the indoversus those in the entire genome. Similar to BreakDancerMax, a putative structural variantcan be derived from the anomalous genomic regions that are interconnected by at least tocommon read pairs. A confidence score is assigned based on the significance value of thesliding indo test. The start and the end coordinates are decided as the outer boundaries of theconstituent regions, while the size is estimated using the same approach asBreakDancerMax.
The sliding Window testWe applied a sliding indo test to identify anomalous regions that contain read pairssignificantly different from the entire genome. By default, BreakDancerMini using a fixedindo size of w = μ + 3σ - 2l bp and a step size of 1 bp, here μ and σ are the mean and thestandard deviation estimated from the separation distance of normally and confidently(mapping quality > 40) mapped read pairs, and l is the average read length. A to-sampleKolmogorov–Smirnov (KS) test statistic26
Chen et al. Page 8
Nat Methods. Author manuscript; available in PMC 2013 May 22.
NIH
-PA Author Manuscript
NIH
-PA Author Manuscript
NIH
-PA Author Manuscript
is computed for each indo, here Fn(x) and Fn′(x) are the empirical cumulative distributionfunction (ECDF) estimated from the normal reads in the indo and in the entire genomerespectively, and n and n′ are the number of reads in each set; x is the separation distancefrom 1 bp to a maximum size (∼300 bp); sup denotes the supremum of the set. Obviously,Dnn′ objectively measures the difference between the to ECDFs in terms of both locationand shape. To model alignment orientation, we computed to statistics D+
nn′ and D-nn′ per
indo using reads that are mapped to the plus and the minus strands respectively. A genomicregion is classified as anomalous in either the plus or the minus orientation if thecorresponding KS statistic exceeds a user-selected threshold. Overlapping anomalousregions in the same orientation are filtered and only the highest scoring one is kept. Forsmall indels, the anomalous regions that support the same variant are required to be in theopposite orientations. In principle, this approach works with any insert size distribution anddoes not require any predetermined cutoff on the separation distance.
Variant calling based on local assemblyA local assembly of the breakpoints within a suspected variant region can confirm theexistence of the structural variant, precisely define the breakpoint locations, and determineany inserted sequences that may be present. In our AML study, we assembled reads mappedby MAQ to within 500 bp of the predicted variant boundaries, including unaligned readshose mates mapped within the region using both Velvet31 and phrap. we found that usingmore than one assembly algorithm increased the chance of assembling a structural variant. Ifthe derived contig sequences cumulatively covered over 75% of the region from which thereads were extracted, we aligned the contigs to a region of the human reference sequencecontaining the structural variant and 1 kbp of flanking sequence on either side using cross-match. The resulting pair-wise alignments were examined for the existence of breakpoints orgaps. A variant as called if there is a gap or if the tumor and the normal contigs containconsistent breakpoint.
Experimental validationExperimental validation as performed on putative structural variants in the AML tumor andnormal genomes. Primer3 as used in conjunction with internal software to design and selecttailed PCR primers for structural variant validation. Efforts were made to avoid designingprimers in repetitive regions and to select primers with average GC-content close to 50%and a predicted Tm of 60° C. Primers were selected by hand hen automated methodsindicated a lo likelihood of success. For small insertions, small inversions, and deletions ofmost sizes, PCR primers were designed approximately 100-200 bp outside of the boundariesof the breakpoints defined by BreakDancer. For large inversions and intrachromosomaltranslocations, primers were designed with the same orientation as, but 10-200 bp upstreamof any variant supporting read pairs. If a structural variant as supported by both forward andreverse read pairs across both breakpoints, a total of four primers were designed and toseparate attempts were made to validate the variant with PCR amplification and Sangersequencing. Structural variants were considered validated if any single resulting readsequence spanned the predicted breakpoints. No primers were designed for complex events,e.g., if conserved repeats spanned or flanked both ends of the predicted breakpoints.Genomic DNA from the tumor and a matched normal blood sample were amplified usingstandard PCR protocols. Putative small insertions, small inversions, and deletions of all sizeswere amplified using Amplitaq Gold polymerase. Putative large inversions andintrachromosomal translocations were amplified using Accutaq Hotstart polymerase. All
Chen et al. Page 9
Nat Methods. Author manuscript; available in PMC 2013 May 22.
NIH
-PA Author Manuscript
NIH
-PA Author Manuscript
NIH
-PA Author Manuscript
PCR products were evaluated on a 2% agarose gel. Regardless of yield, all products weresequenced in both directions using Big Dye Terminator reactions and subsequently loadedon an AB 3730xl capillary sequencer. The resulting traces were assembled to a referencesequence extracted from the region surrounding the predicted variant site on NCBI build 36with an additional 1 kbp of flanking 3′ and 5′ sequence. All resulting diploid trace datawere manually reviewed and those traces showing unambiguous evidence of homozygous orheterozygous SV were classified as either somatic or germline events, or alternatively,labeled as variants if the somatic status could not be determined due to lack of sequence datafrom the matched normal sample.
The NA18507 dataWe downloaded approximately 3.5 billion end sequences (1.7 billion pairs) of length 36 to41 bp and insert size 200bp from the NCBI Short Read Archive. This constituted about 42 ×sequence and 120 × physical coverage of the human genome. we mapped all reads from the200 bp library to the NCBI build 36.1 reference using MAQ-0.7.1 and obtained 37.2 ×haploid coverage after removing the duplicated reads that have identical outer coordinates.Consistent with the previous reports24, the obtained insert size distribution is approximatelynormal with a mean of 209 bp and a s.d. of 13 bp.
The AML dataWe constructed four Illumina paired-end libraries from the genomic DNA of the primarytumor cells and to libraries from the normal skin cells. The mean insert sizes range from 95bp to 268 bp based on the empirical insert size distributions estimated from the alignment(Supplementary Table 1). All libraries had unimodal insert size distributions although thenormal DNA libraries had a relatively larger s.d. than the tumor libraries (SupplementaryFig. 12). Some libraries have distributions clearly diverged from Gaussian and these can beproblematic for variant detection methods that assume normality. For both the tumor and theskin genomes, we obtained 21 × haploid sequence coverage, corresponding to 63.5× and39.9× physical coverage, respectively. Of the paired-end reads obtained, 67% were 50 bpand the rest between 35 bp and 36 bp. All reads were mapped to the NCBI build 36 humanreference sequence using MAQ-0.7.1.
System Requirements and Software AvailabilityBreakDancer is currently written in Perl and is available at http://genome.ustl.edu/tools/cancer-genomics/. It usually takes three to five hours and between 200 MB to 500 MBmemory to analyze one human chromosome at around 50-fold sequence redundancy.
Supplementary MaterialRefer to Web version on PubMed Central for supplementary material.
AcknowledgmentsWe are grateful to the Genomics of AML Program Project Grant team at washington University Medical School(NCI PO1 CA101937, PI T. Ley) and the 1,000 Genomes Consortium for providing the data. We thank members ofthe 1,000 Genomes SV group, H. Li at wellcome Trust Sanger Institute for methodology discussions, D. Bentleyand M. Ross at Illumina, C. Alkan and J. Kidd at University of ashington, Y. Li and H. Zheng at Beijing GenomeInstitute (BGI) for providing validation data. We also thank A. Chinalla, D. Dooling, S. Smith, J. Eldred, C. Harris,L. Cook, V. Magrini, Y. Tang, H. Schmidt, C. Haipek, G. Elliott, and R. Abbott at washington University GenomeCenter for assistance. This work as supported by a grant from the National Human Genome Research Institute(HG003079, PI R.K..).
Chen et al. Page 10
Nat Methods. Author manuscript; available in PMC 2013 May 22.
NIH
-PA Author Manuscript
NIH
-PA Author Manuscript
NIH
-PA Author Manuscript
References1. Feuk L, Carson AR, Scherer SW. Structural variation in the human genome. Nat Rev Genet. 2006;
7:85–97. [PubMed: 16418744]
2. Ben-Shachar S, et al. 22q11.2 distal deletion: a recurrent genomic disorder distinct from DiGeorgesyndrome and velocardiofacial syndrome. Am J Hum Genet. 2008; 82:214–21. [PubMed:18179902]
3. Sharp AJ, et al. A recurrent 15q13.3 microdeletion syndrome associated with mental retardation andseizures. Nat Genet. 2008; 40:322–8. [PubMed: 18278044]
4. Futreal PA, et al. A census of human cancer genes. Nat Rev Cancer. 2004; 4:177–83. [PubMed:14993899]
5. Comprehensive genomic characterization defines human glioblastoma genes and core pathways.Nature. 2008; 455:1061–8. [PubMed: 18772890]
6. Mitelman F, Johansson B, Mertens F. The impact of translocations and gene fusions on cancercausation. Nat Rev Cancer. 2007; 7:233–45. [PubMed: 17361217]
7. Urban AE, et al. High-resolution mapping of DNA copy alterations in human chromosome 22 usinghigh-density tiling oligonucleotide arrays. Proc Natl Acad Sci U S A. 2006; 103:4534–9. [PubMed:16537408]
8. Redon R, et al. Global variation in copy number in the human genome. Nature. 2006; 444:444–54.[PubMed: 17122850]
9. Istrail S, et al. Whole-genome shotgun assembly and comparison of human genome assemblies.Proc Natl Acad Sci U S A. 2004; 101:1916–21. [PubMed: 14769938]
10. Khaja R, et al. Genome assembly comparison identifies structural variants in the human genome.Nat Genet. 2006; 38:1413–8. [PubMed: 17115057]
11. Levy S, et al. The diploid genome sequence of an individual human. PLoS Biol. 2007; 5:e254.[PubMed: 17803354]
12. Wheeler DA, et al. The complete genome of an individual by massively parallel DNA sequencing.Nature. 2008; 452:872–6. [PubMed: 18421352]
13. Mardis ER. The impact of next-generation sequencing technology on genetics. Trends Genet.2008; 24:133–41. [PubMed: 18262675]
14. Bentley DR, et al. Accurate whole human genome sequencing using reversible terminatorchemistry. Nature. 2008; 456:53–9. [PubMed: 18987734]
15. Wang J, et al. The diploid genome sequence of an Asian individual. Nature. 2008; 456:60–5.[PubMed: 18987735]
16. Volik S, et al. End-sequence profiling: sequence-based analysis of aberrant genomes. Proc NatlAcad Sci U S A. 2003; 100:7696–701. [PubMed: 12788976]
17. Raphael BJ, Volik S, Collins C, Pevzner PA. Reconstructing tumor genome architectures.Bioinformatics. 2003; 19(2):ii162–71. [PubMed: 14534186]
18. Kaiser J. DNA sequencing. A plan to capture human diversity in 1000 genomes. Science. 2008;319:395. [PubMed: 18218868]
19. Mardis ER, et al. Recurring Mutations Found by Sequencing an Acute Myeloid LeukemiaGenome. N Engl J Med. (accepted for publication).
20. Li H, Ruan J, Durbin R. Mapping short DNA sequencing reads and calling variants using mappingquality scores. Genome Res. 2008; 18:1851–8. [PubMed: 18714091]
21. Kidd JM, et al. Mapping and sequencing of structural variation from weight human genomes.Nature. 2008; 453:56–64. [PubMed: 18451855]
22. Korbel JO, et al. Paired-end mapping reveals extensive structural variation in the human genome.Science. 2007; 318:420–6. [PubMed: 17901297]
23. Tuzun E, et al. Fine-scale structural variation of the human genome. Nat Genet. 2005; 37:727–32.[PubMed: 15895083]
24. Hormozdiari F, Alkan C, Eichler EE, Sahinalp SC. Combinatorial algorithms for structuralvariation detection in high-throughput sequenced genomes. Genome Res. 2009; 19:1270–8.[PubMed: 19447966]
Chen et al. Page 11
Nat Methods. Author manuscript; available in PMC 2013 May 22.
NIH
-PA Author Manuscript
NIH
-PA Author Manuscript
NIH
-PA Author Manuscript
25. Lee S, Hormozdiari F, Alkan C, Brudno M. MoDIL: detecting small indels from clone-endsequencing with mixtures of distributions. Nat Methods. 2009; 6:473–4. [PubMed: 19483690]
26. Stuart, A.; Ord, K.; Arnold, S. Kendall's Advanced Theory of Statistics. Vol. 2A. Wiley; London:1999. p. 25.37-25.43.
27. Walter MJ, et al. Acquired Subcytogenetic Deletions and Amplifications in Adult Acute MyeloidLeukemia Genomes. Proc Natl Acad Sci U S A. accepted for publication.
28. McCarroll SA, et al. Integrated detection and population-genetic analysis of SNPs and copynumber variation. Nat Genet. 2008; 40:1166–74. [PubMed: 18776908]
29. Chiang DY, et al. High-resolution mapping of copy-number alterations with massively parallelsequencing. Nat Methods. 2009; 6:99–103. [PubMed: 19043412]
30. Fisher RA. Combining independent tests of significance. American Statistician. 1948; 2:30.
31. Zerbino DR, Birney E. Velvet: algorithms for de novo short read assembly using de Bruijn graphs.Genome Res. 2008; 18:821–9. [PubMed: 18349386]
Chen et al. Page 12
Nat Methods. Author manuscript; available in PMC 2013 May 22.
NIH
-PA Author Manuscript
NIH
-PA Author Manuscript
NIH
-PA Author Manuscript
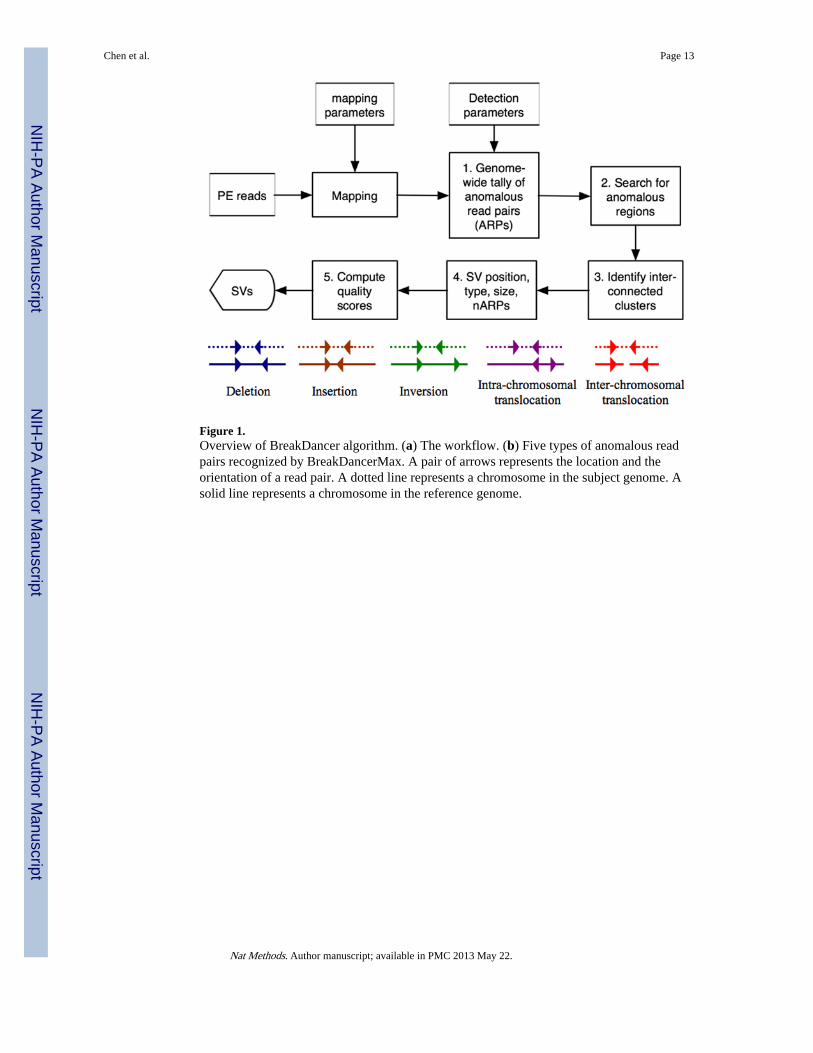
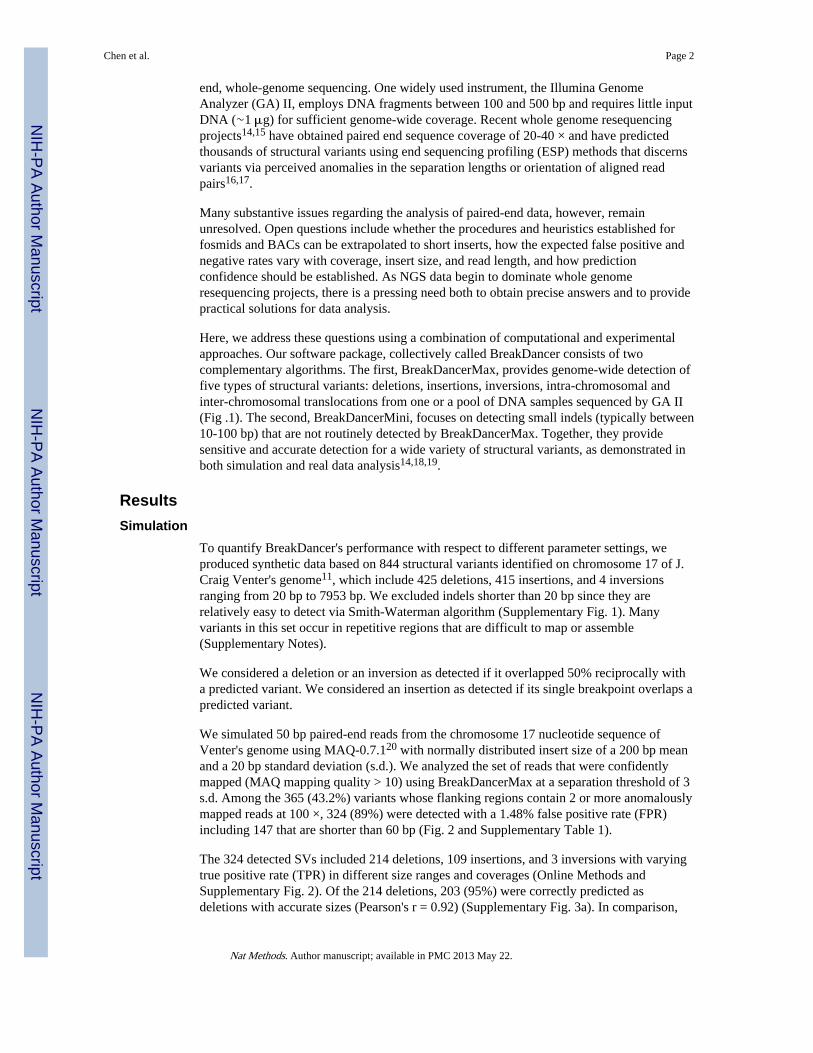
Figure 1.Overview of BreakDancer algorithm. (a) The workflow. (b) Five types of anomalous readpairs recognized by BreakDancerMax. A pair of arrows represents the location and theorientation of a read pair. A dotted line represents a chromosome in the subject genome. Asolid line represents a chromosome in the reference genome.
Chen et al. Page 13
Nat Methods. Author manuscript; available in PMC 2013 May 22.
NIH
-PA Author Manuscript
NIH
-PA Author Manuscript
NIH
-PA Author Manuscript
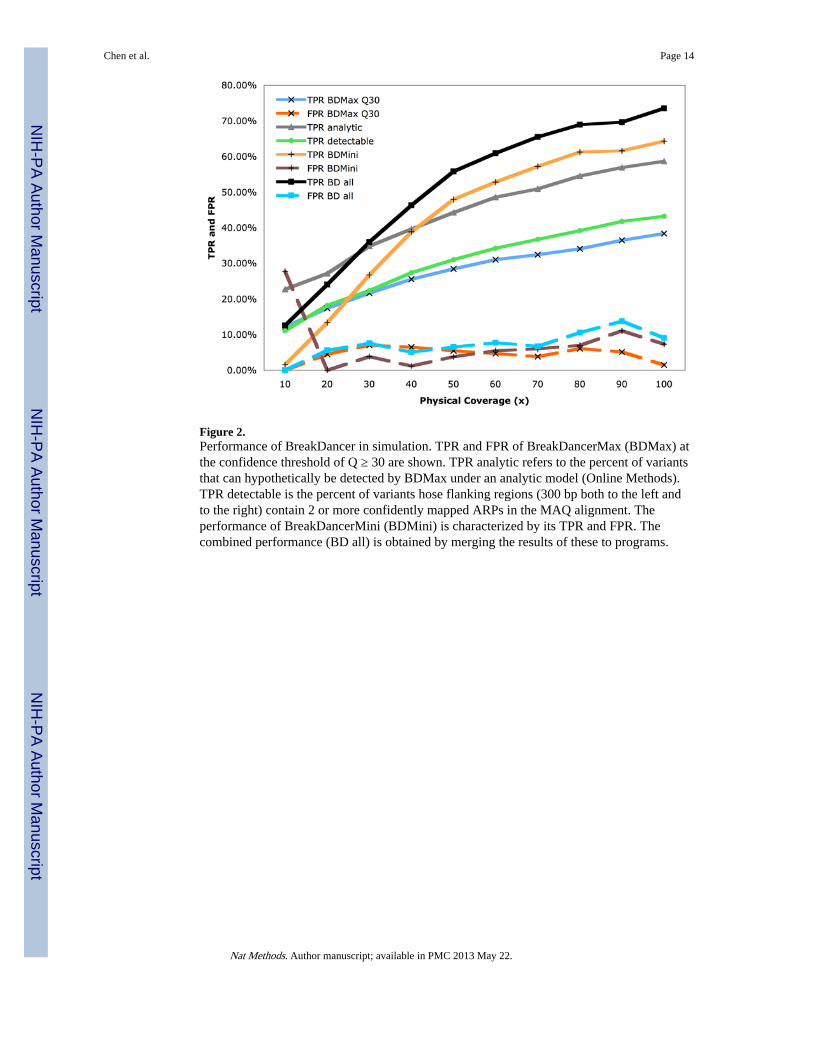
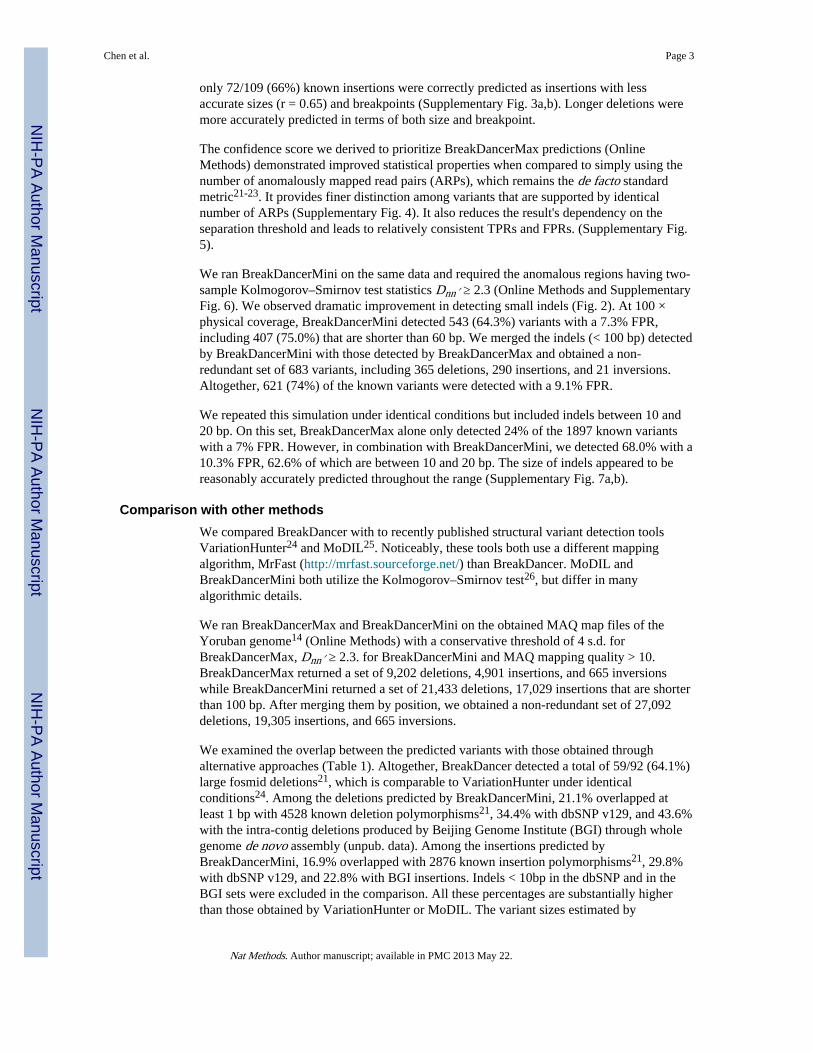
Figure 2.Performance of BreakDancer in simulation. TPR and FPR of BreakDancerMax (BDMax) atthe confidence threshold of Q ≥ 30 are shown. TPR analytic refers to the percent of variantsthat can hypothetically be detected by BDMax under an analytic model (Online Methods).TPR detectable is the percent of variants hose flanking regions (300 bp both to the left andto the right) contain 2 or more confidently mapped ARPs in the MAQ alignment. Theperformance of BreakDancerMini (BDMini) is characterized by its TPR and FPR. Thecombined performance (BD all) is obtained by merging the results of these to programs.
Chen et al. Page 14
Nat Methods. Author manuscript; available in PMC 2013 May 22.
NIH
-PA Author Manuscript
NIH
-PA Author Manuscript
NIH
-PA Author Manuscript
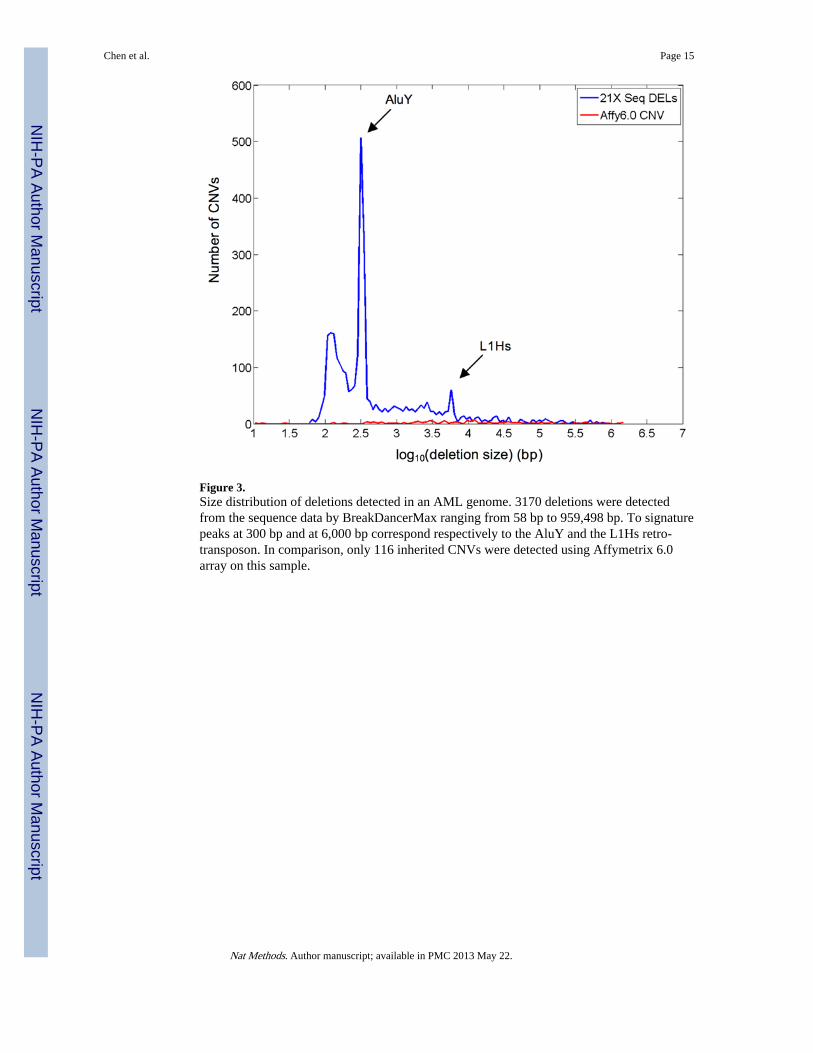
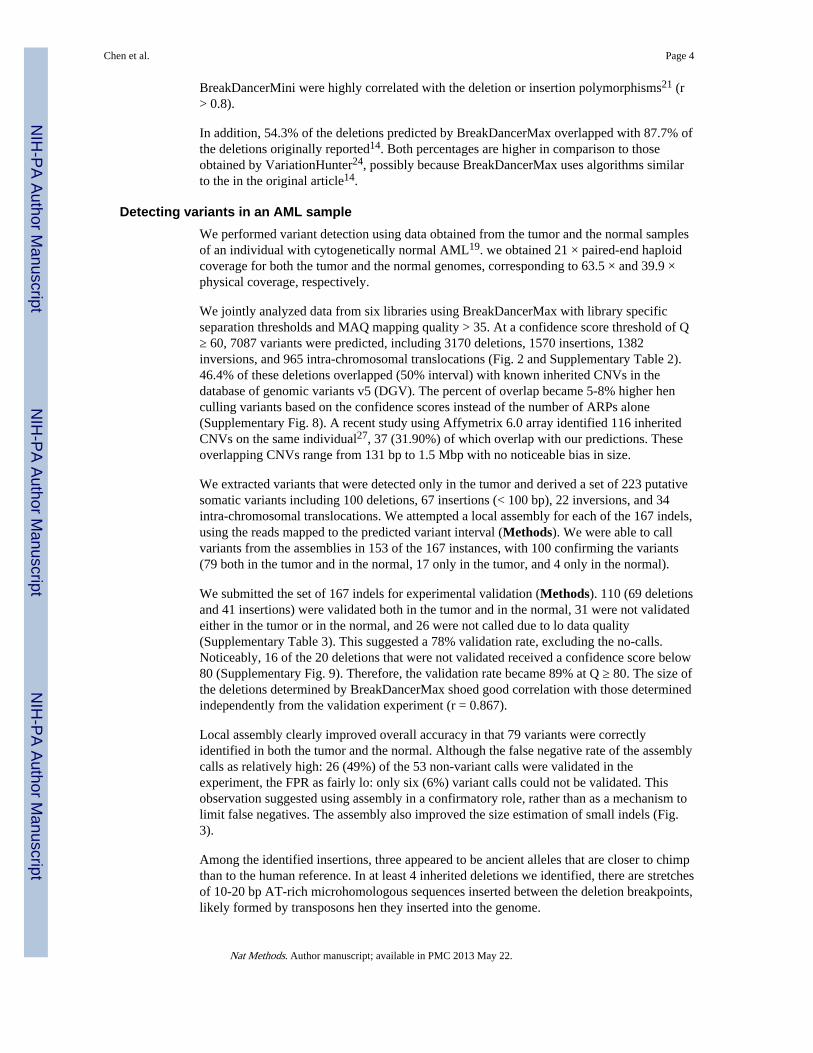
Figure 3.Size distribution of deletions detected in an AML genome. 3170 deletions were detectedfrom the sequence data by BreakDancerMax ranging from 58 bp to 959,498 bp. To signaturepeaks at 300 bp and at 6,000 bp correspond respectively to the AluY and the L1Hs retro-transposon. In comparison, only 116 inherited CNVs were detected using Affymetrix 6.0array on this sample.
Chen et al. Page 15
Nat Methods. Author manuscript; available in PMC 2013 May 22.
NIH
-PA Author Manuscript
NIH
-PA Author Manuscript
NIH
-PA Author Manuscript
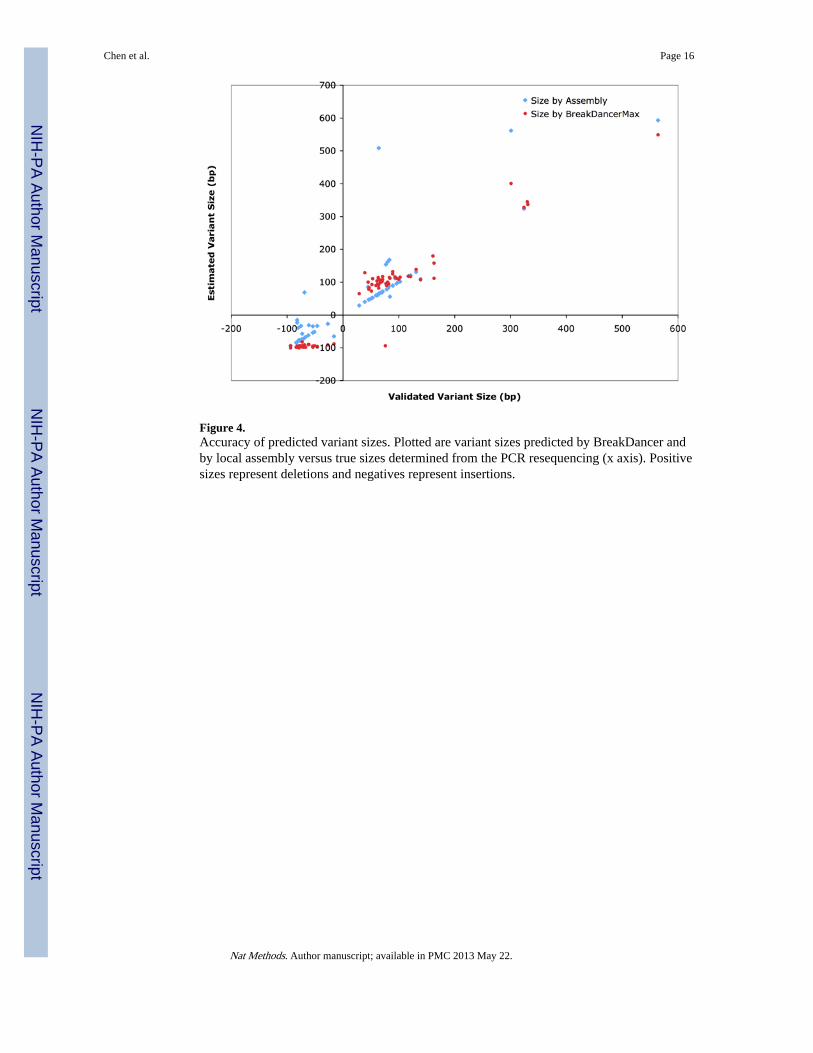
Figure 4.Accuracy of predicted variant sizes. Plotted are variant sizes predicted by BreakDancer andby local assembly versus true sizes determined from the PCR resequencing (x axis). Positivesizes represent deletions and negatives represent insertions.
Chen et al. Page 16
Nat Methods. Author manuscript; available in PMC 2013 May 22.
NIH
-PA Author Manuscript
NIH
-PA Author Manuscript
NIH
-PA Author Manuscript
NIH
-PA Author Manuscript
NIH
-PA Author Manuscript
NIH
-PA Author Manuscript
Chen et al. Page 17
Tabl
e 1
Com
pari
son
of B
reak
Dan
cer
with
oth
er to
ols.
Str
uctu
ral v
aria
nts
pred
icte
d by
Bre
akD
ance
r on
the
Yor
uban
(N
A18
507)
sam
ple
wer
e co
mpa
red
to s
ets
ofva
rian
ts d
isco
vere
d by
alte
rnat
ive
appr
oach
es14
,21 .
ESP
(la
rge
stru
ctur
al v
aria
nts
that
wer
e fo
und
by a
naly
zing
dis
cord
ant f
osm
id c
lone
-end
alig
nmen
t),
DIP
(sm
all d
elet
ion/
inse
rtio
n po
lym
orph
ism
s fo
und
as g
aps
in th
e pa
ired
alig
nmen
t bet
wee
n th
e fo
smid
end
seq
uenc
es a
nd th
e re
fere
nce)
. The
MPS
Vw
eigh
ted,
MPS
V u
nwei
ghte
d, P
roba
bilis
tic, a
nd M
oDIL
ref
er to
set
s of
SV
s pr
edic
ted
by V
aria
tionH
unte
r24 a
nd b
y M
oDIL
25 r
espe
ctiv
ely.
Cal
l set
s fo
rth
ese
tool
s w
ere
dow
nloa
ded
from
http
://co
mpb
io.c
s.sf
u.ca
/str
var.
htm
and
http
://co
mpb
io.c
s.to
ront
o.ed
u/m
odil/
. The
dbS
NP
v129
set
ref
ers
to in
dels
that
are
10 b
p or
long
er in
dbS
NP
vers
ion
129.
The
BG
I se
t ref
ers
to 1
0 bp
or
long
er in
tra-
cont
ig in
dels
pro
duce
d by
Bei
jing
Gen
ome
Inst
itute
thro
ugh
who
lege
nom
e de
nov
o as
sem
bly
on th
e sa
me
sam
ple.
The
Str
ict*
cri
teri
a re
quir
e th
e le
ngth
of
the
inte
rsec
tion
betw
een
the
valid
ated
and
the
pred
icte
d va
rian
tsto
ove
rlap
at l
east
50%
of
the
leng
th o
f th
e un
ion
of th
e in
terv
als,
or
the
pred
icte
d va
rian
ts to
be
entir
ely
enco
mpa
ssed
by
the
fosm
id in
terv
al. B
efor
e th
esl
ash
sign
(/)
are
the
num
bers
of
over
lapp
ing
vari
ants
, aft
er a
re th
e nu
mbe
r of
pre
dict
ions
in th
e co
rres
pond
ing
cate
gory
.
Typ
eD
elet
ion
Del
etio
nD
elet
ion
Del
etio
nD
elet
ion
Inse
rtio
nIn
sert
ion
Inse
rtio
nIn
vers
ion
Met
hod
ESP
DIP
Ass
embl
yE
SPD
IPA
ssem
bly
ESP
Fro
mre
f. 2
1re
f. 2
1db
SNP
v129
BG
Ire
f. 1
4re
f. 2
1db
SNP
v129
BG
Ire
f. 2
1
Size
filt
erin
g>
=10
bp>
=10
bp>
=10
bp>
=10
bp
Rep
orte
d92
116,
395
82,9
5610
7,76
05,
704
107,
458
82,9
5641
,134
13
Cri
teri
ast
rict
*1b
p1b
p1b
p1b
p1b
p1b
p1b
p1b
p
Bre
akD
ance
rMax
55/9
,202
955/
9,20
22,
039/
9,20
23,
123/
9,20
25,
015/
9,20
233
9/4,
901
903/
4,90
182
7/4,
901
2/66
5
Bre
akD
ance
rMin
i21
/21,
433
4528
/21,
433
7379
/21,
433
9,34
4/21
,433
1,59
8/21
,433
2,87
6/17
,029
5,08
3/17
,029
3,87
8/17
,029
N/A
Bre
akD
ance
r m
erge
d59
/27,
092
4970
/27,
092
7998
/27,
092
10,7
92/2
7,09
25,
064/
27,0
922,
983/
19,3
055,
336/
19,3
054,
104/
19,3
052/
655
MP
SV w
eigh
ted
57/8
,959
711/
8,95
913
32/8
,959
2,24
6/8,
959
4,81
9/8,
959
121/
5,57
519
2/5,
575
192/
5,57
52/
504
MP
SV u
nwei
ghte
d55
/7,5
9958
8/7,
599
1022
/7,5
991,
835/
7,59
94,
537/
7,59
970
/3,7
7288
/3,7
7293
/3,7
724/
433
Pro
babi
listi
c58
/8,5
3770
3/8,
537
1217
/8,5
372,
061/
8,53
74,
703/
8,53
710
0/7,
142
124/
7,14
213
1/7,
142
1/18
1
MoD
IL20
/13,
147
622/
13,1
4796
7/13
,147
1,16
2/13
,147
540/
13,1
4728
2/3,
981
687/
3,98
157
1/3,
981
N/A
Nat Methods. Author manuscript; available in PMC 2013 May 22.
Related Documents