BRAZORIA, TEXAS WATER PARK FEASIBILITY STUDY THE INSTITUTE OF URBAN STUDIES SCHOOL OF URBAN AND PUBLIC AFFAIRS THE UNIVERSITY OF TEXAS AT ARLINGTON 9/28/2012

Welcome message from author
This document is posted to help you gain knowledge. Please leave a comment to let me know what you think about it! Share it to your friends and learn new things together.
Transcript
BRAZORIA, TEXAS
WATER PARK FEASIBILITY STUDY
THE INSTITUTE OF URBAN STUDIES
SCHOOL OF URBAN AND PUBLIC AFFAIRS
THE UNIVERSITY OF TEXAS AT ARLINGTON
9/28/2012


TABLE OF CONTENTS TABLE OF FIGURES ................................................................................................................................ III
ACKNOWLEDGEMENTS ........................................................................................................................... V
EXECUTIVE SUMMARY ........................................................................................................................... 1
CHAPTER 1: PROJECT BACKGROUND ........................................................................................................ 4
1.1GOALS AND STRATEGIES ............................................................................................................... 5
CHAPTER 2: WATER PARK INDUSTRY ....................................................................................................... 6
2.1 INDUSTRY DESCRIPTIONS .............................................................................................................. 7
2.2 WATER PARK GUIDE ................................................................................................................... 7
2.3 WATER PARK OPTIONS FOR BRAZORIA .......................................................................................... 15
CHAPTER 3: BRAZORIA MARKET............................................................................................................ 16
3.1 BRAZORIA SITE CONSIDERATIONS .................................................................................................. 16
3.2 DEMOGRAPHICS – BRAZORIA AND SURROUNDING MARKET AREA ...................................................... 23
3.3 DRIVE-TIME ANALYSIS ............................................................................................................... 24
3.4 TAPESTRY SEGMENTS FOR BRAZORIA ............................................................................................ 27
3.5 TAPESTRY IMPLICATIONS FOR BRAZORIA DRIVE TIMES ...................................................................... 29
3.6 NEARBY AQUATIC FACILITIES ....................................................................................................... 29
3.7 TOURISM IN BRAZORIA COUNTY ................................................................................................... 32
3.8 ECO-TOURISM AND NATURAL AMENITIES ...................................................................................... 35
3.9 BUSINESS ANALYSIS, FUTURE TRENDS ........................................................................................... 36
3.10 PROXIMITY OF WATER PARKS TO RECREATIONAL ACTIVITIES ........................................................... 38
CHAPTER 4: FINANCIAL IMPACT ............................................................................................................ 40
4.1 CAPACITY ANALYSIS ................................................................................................................... 40
4.2 PROJECTED ATTENDANCE ........................................................................................................... 41
4.3 REVENUE PROJECTION ............................................................................................................... 43
4.4 OPERATING EXPENSE PROJECTION ............................................................................................... 45
4.5 OPINION OF FINANCIAL PERFORMANCE ......................................................................................... 46
4.6 RECAPTURE RATE AND SUPPORTABLE DEBT CALCULATION ................................................................ 47
4.7 DEVELOPMENT COSTS ............................................................................................................... 48
FEASIBILITY STUDY ii
CHAPTER 5: RV PARK COMPONENT ....................................................................................................... 50
5.1 RV PARK MARKET .................................................................................................................... 50
5.2 LOCATION CONSIDERATIONS ....................................................................................................... 51
5.3 RV PRICING ............................................................................................................................. 53
5.4 COORDINATION WITH WATER PARK ............................................................................................. 54
CHAPTER 6: CONCLUSION .................................................................................................................... 56
APPENDIX A ...................................................................................................................................... 60
APPENDIX B ...................................................................................................................................... 64
APPENDIX C ...................................................................................................................................... 66
APPENDIX D ...................................................................................................................................... 68
REFERENCES ...................................................................................................................................... 73
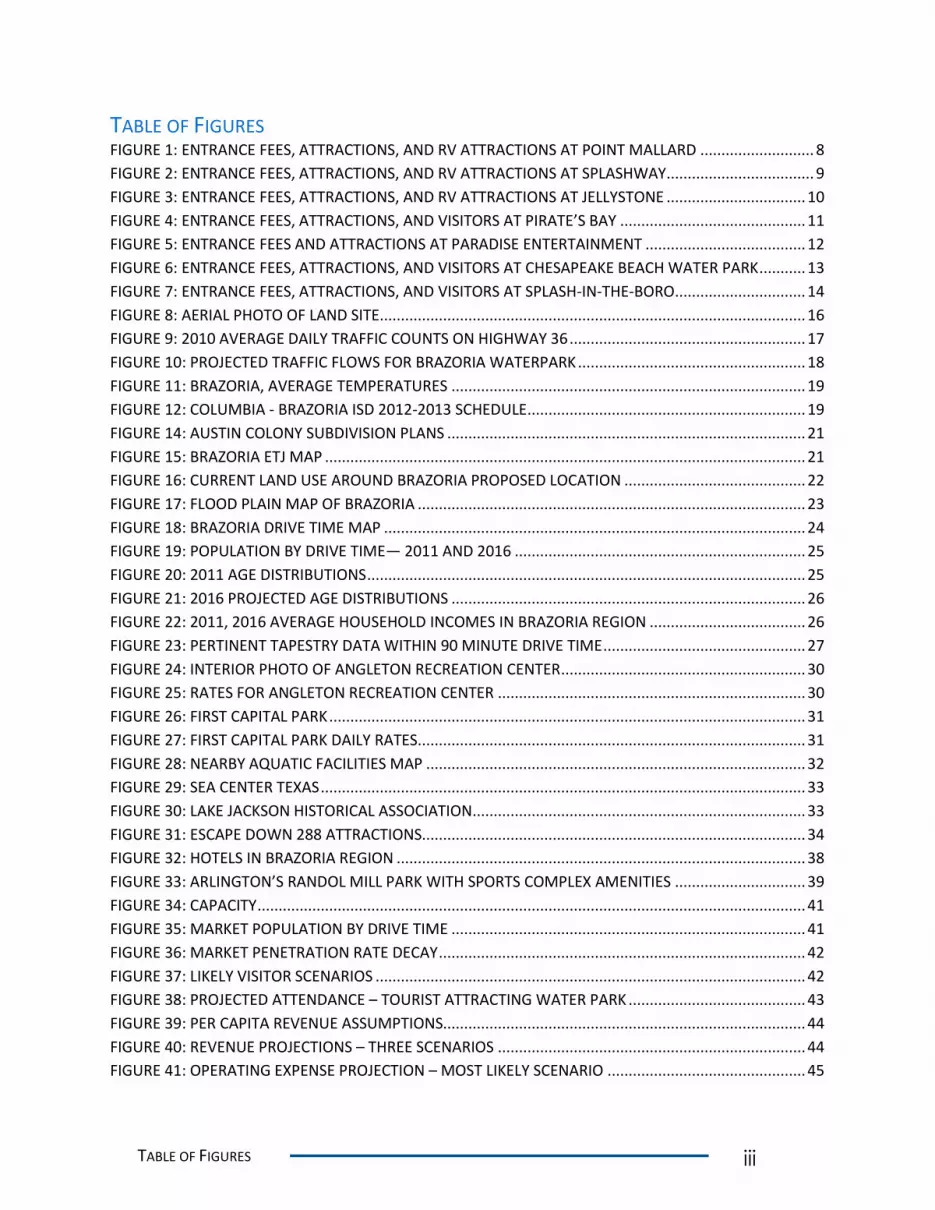
iii TABLE OF FIGURES
TABLE OF FIGURES FIGURE 1: ENTRANCE FEES, ATTRACTIONS, AND RV ATTRACTIONS AT POINT MALLARD ........................... 8
FIGURE 2: ENTRANCE FEES, ATTRACTIONS, AND RV ATTRACTIONS AT SPLASHWAY ................................... 9
FIGURE 3: ENTRANCE FEES, ATTRACTIONS, AND RV ATTRACTIONS AT JELLYSTONE ................................. 10
FIGURE 4: ENTRANCE FEES, ATTRACTIONS, AND VISITORS AT PIRATE’S BAY ............................................ 11
FIGURE 5: ENTRANCE FEES AND ATTRACTIONS AT PARADISE ENTERTAINMENT ...................................... 12
FIGURE 6: ENTRANCE FEES, ATTRACTIONS, AND VISITORS AT CHESAPEAKE BEACH WATER PARK ........... 13
FIGURE 7: ENTRANCE FEES, ATTRACTIONS, AND VISITORS AT SPLASH-IN-THE-BORO ............................... 14
FIGURE 8: AERIAL PHOTO OF LAND SITE ..................................................................................................... 16
FIGURE 9: 2010 AVERAGE DAILY TRAFFIC COUNTS ON HIGHWAY 36 ........................................................ 17
FIGURE 10: PROJECTED TRAFFIC FLOWS FOR BRAZORIA WATERPARK ...................................................... 18
FIGURE 11: BRAZORIA, AVERAGE TEMPERATURES .................................................................................... 19
FIGURE 12: COLUMBIA - BRAZORIA ISD 2012-2013 SCHEDULE .................................................................. 19
FIGURE 14: AUSTIN COLONY SUBDIVISION PLANS ..................................................................................... 21
FIGURE 15: BRAZORIA ETJ MAP .................................................................................................................. 21
FIGURE 16: CURRENT LAND USE AROUND BRAZORIA PROPOSED LOCATION ........................................... 22
FIGURE 17: FLOOD PLAIN MAP OF BRAZORIA ............................................................................................ 23
FIGURE 18: BRAZORIA DRIVE TIME MAP .................................................................................................... 24
FIGURE 19: POPULATION BY DRIVE TIME— 2011 AND 2016 ..................................................................... 25
FIGURE 20: 2011 AGE DISTRIBUTIONS ........................................................................................................ 25
FIGURE 21: 2016 PROJECTED AGE DISTRIBUTIONS .................................................................................... 26
FIGURE 22: 2011, 2016 AVERAGE HOUSEHOLD INCOMES IN BRAZORIA REGION ..................................... 26
FIGURE 23: PERTINENT TAPESTRY DATA WITHIN 90 MINUTE DRIVE TIME ................................................ 27
FIGURE 24: INTERIOR PHOTO OF ANGLETON RECREATION CENTER .......................................................... 30
FIGURE 25: RATES FOR ANGLETON RECREATION CENTER ......................................................................... 30
FIGURE 26: FIRST CAPITAL PARK ................................................................................................................. 31
FIGURE 27: FIRST CAPITAL PARK DAILY RATES ............................................................................................ 31
FIGURE 28: NEARBY AQUATIC FACILITIES MAP .......................................................................................... 32
FIGURE 29: SEA CENTER TEXAS ................................................................................................................... 33
FIGURE 30: LAKE JACKSON HISTORICAL ASSOCIATION ............................................................................... 33
FIGURE 31: ESCAPE DOWN 288 ATTRACTIONS........................................................................................... 34
FIGURE 32: HOTELS IN BRAZORIA REGION ................................................................................................. 38
FIGURE 33: ARLINGTON’S RANDOL MILL PARK WITH SPORTS COMPLEX AMENITIES ............................... 39
FIGURE 34: CAPACITY .................................................................................................................................. 41
FIGURE 35: MARKET POPULATION BY DRIVE TIME .................................................................................... 41
FIGURE 36: MARKET PENETRATION RATE DECAY ....................................................................................... 42
FIGURE 37: LIKELY VISITOR SCENARIOS ...................................................................................................... 42
FIGURE 38: PROJECTED ATTENDANCE – TOURIST ATTRACTING WATER PARK .......................................... 43
FIGURE 39: PER CAPITA REVENUE ASSUMPTIONS...................................................................................... 44
FIGURE 40: REVENUE PROJECTIONS – THREE SCENARIOS ......................................................................... 44
FIGURE 41: OPERATING EXPENSE PROJECTION – MOST LIKELY SCENARIO ............................................... 45

FEASIBILITY STUDY iv
FIGURE 42: NET REVENUE / (EXPENSE) - TOURIST ATTRACTING WATER PARK ......................................... 46
FIGURE 43: RECAPTURE RATES ................................................................................................................... 47
FIGURE 44: SUPPORTABLE DEBT CALCULATIONS ....................................................................................... 47
FIGURE 45: DEVELOPMENT COST ESTIMATES ............................................................................................ 49
FIGURE 46: RV PARK ESTABLISHMENTS IN 2010 ........................................................................................ 51
FIGURE 47: MAP OF AREA RV PARKS AND NATURAL FEATURES ................................................................ 52
FIGURE 48: COST STRUCTURE AT AREA RV PARKS AND CAMPGROUNDS .................................................. 53
FIGURE 49: INDUSTRY COST STRUCTURE ................................................................................................... 54
v ACKNOWLEDGMENTS
ACKNOWLEDGEMENTS
The following individuals are recognized for their significant contributions to the preparation of
this report.
Consulting Team
INSTITUTE OF URBAN STUDIES, UNIVERSITY OF TEXAS AT ARLINGTON
Dean Barbara Becker – Executive Director
Brian Guenzel- Director
Joanne Lovito-Nelson- Director
Alan Klein- Assistant Director
Jason Aprill (Project Organizer)
Shawna Murray (Research Associate)
Sharmila Gurung Shrestha (Research Associate)
Kiranmayi Raparthi (Research Associate)
City of Brazoria
Mayor, Ken Corley
City Manager, Teresa Borders
Photo Credit (cover image): exploregeorgia.org

1 EXECUTIVE SUMMARY
EXECUTIVE SUMMARY
The City of Brazoria proposes to construct a water park on a portion of thirty-five acres of land
located in the southern portions of the City.
The Institute of Urban Studies (IUS) conducted a feasibility study to examine the location and to
determine if a water park would be successful, and if so, what kind of water park would be
approporiate. The analysis includes identification of key water park industry metrics and
determines whether the Brazoria location could support a water park. As requested by the
City, IUS also analyzed a Recreational Vehicle (RV) park component and the unique RV park
industry characteristics.
Brazoria has strengths that are necessary in creating a successful tourist-generating water park.
The proposed water park is located within a 90 minute drive time of 5 million potential visitors,
is located near established tourist attractions within an active tourism market, and there is a
lack of competing tourist-generating water parks in the surrounding vicinity. The unique
natural tourism, or eco-tourism, opportunities available in Brazoria County appeal to an
available demographic segment and to age and interest groups that would likely attend a water
park and/or stay in a well-appointed RV park.
The feasibility study includes several components:
A detailed examination of the water park industry and market dynamics
The water park industry is growing quickly, especially in the state of Texas. Almost a third of all
large water parks nationally are municipally owned. Nationally, average attendance at water
parks has been increasing by 1 to 3 percent each year. Water parks of all kinds have been
found to benefit communities because they appeal to a broad demographic.
A site assessment
The Brazoria location is within a 90 minute drive of almost 5 million residents, many of whom
live in the Greater Houston area. The site meets the criteria that outdoor water park developers
find necessary, such as a generally warm and sunny climate, a mostly flat parcel of undeveloped
land, and low to moderate average prevailing winds. Other site features were analyzed as well.
The site is not in a flood plain, can achieve strong visibility due to its proximity to State Highway
36, is near police, fire, and medical emergency services, and proposed visitor traffic flows show
that visitors from the Houston area can easily reach the site via State Highway 288 or State
Highway 36.

FEASIBILITY STUDY 2
A market analysis of the unique natural tourism (eco-tourism) market in Brazoria
County
A major strength to the Brazoria location includes its proximity to many natural amenities, such
as rivers, state parks and wildlife refuges, and the Gulf of Mexico. In particular, outdoor hobbies
such as fishing, hunting, boating, and birding can do particularly well. The demographics of
average RV patrons are similar to the demographics of “eco-tourists” who enjoy bird-watching
and outdoor recreation.
An economic analyisis, including detailed prospective attendance scenarios, per capita
spending projection, revenue and operating expense projections, and recapture rate
and supportable debt calculations
The analysis indicates that the park would exceed the required 45,207 visitors needed to
achieve 100% recapture of projected operating expenses, but fall short of the 90,534 visitors
needed to fund projected operating expenses plus debt service. The economic analysis begins
with three likely visitor scenarios (low, high, and most likely) in order to provide a range of likely
financial performance for the proposed water park. Projected Year 1 results include:
o Attendance: 49,000 to 75,000 visitors
o Per Capita Spending: $18.15
o Revenue: between $881,000 and $1,400,000
o Operating Expenses: between $799,000 and $832,000 in operating expenses
o Net Operating Income: between $81,000 and $538,000
o Recapture Rate: between 110% and 165%
o Development Costs: between $9,000,000 and $9,400,000 to construct
A transportation analysis including accessibility options and connectivity to the
surrounding communities and the greater Houston area
The Brazoria location is easily accessible by automobile, but other forms of transportation to
the site are absent. Most visitors to the site would travel on Highway 288, Highway 36, or
Highway 322 (from Lake Jackson/Angleton). By automobile, visitors from the Greater Houston
area could reach the location on Highway 288, a four-lane expressway or State Highway 36, a
typical 2-lane highway. The location is not currently connected to the city of Brazoria by
sidewalk.

3 EXECUTIVE SUMMARY
An analysis of the RV park industry and Brazoria area market
The RV park industry is currently rebounding from the 2008 recession. A combination of better
economic conditions and emerging demand from aging baby boomers has caused the RV
industry to expand again. At the national level, the average age of an RV owner is 48 and the
average household income is $62,000. State and national parks and other natural amenities,
are large draws for RVers. The Brazoria region has an assortment RV parks and campgrounds,
likely clustered in the region because of the large presence of natural amenities.
An analysis of potential complementary commercial and recreational uses that might
further develop or enhance the appeal of and financial return from a municipally
owned water park.
An inventory of recreation, hospitality, and food and beverage service surrounding the water
park location showed that the area can offer potential visitors the following services: a large
Golf Course, a bed-and-breakfast, three RV parks, and many fast-food restaurants, specifically
in the Lake Jackson and Angleton area. It was found that the lack of hotel or other recreational
activities in Brazoria could be an obstacle in creating a vibrant water park destination.
The water park industry is growing, and the municipally owned segment is growing even faster.
In order to better understand industry dynamics and key success elements, the feasibility study
examines various successful water parks throughout the state of Texas and the United States
and identifies what amenities are found in tourist-generating water parks. In addition, the
study also identifies specific success characteristics, attractions, pricing, and development costs
for seven water parks chosen for their locational similarity to Brazoria and other releveant
features. Key findings include: appropriate variety of attractions, likely construction costs, likely
revenue and expense ranges, successful combination of RV and water parks, possible
complementary commercial and recreational activities such as restaurants, retail service
businesses, and public amphitheaters.

FEASIBILITY STUDY 4
CHAPTER 1: PROJECT BACKGROUND
The City of Brazoria is seeking to develop 35 acres of donated land located in the southern
portion of the city. The City is investigating the possibility of constructing a water park on the
land. The water park industry is large, varied, and complex; therefore, Brazoria has asked the
Institute of Urban Studies to analyze the potential strengths and weaknesses of the Brazoria
region and the specific parcel within the City as a location for a municipally owned water park.
The Institute of Urban Studies (IUS) conducted a feasibility study, which includes a market and
industry analysis, to determine if the addition of a water park to the City would be sustainable,
and if so, what kind of water park would flourish in the community. IUS, along with the School
of Urban and Public Affairs (SUPA) at the University of Texas at Arlington (UTA) has had
extensive experience in providing market analyses, economic development plans, strategic
visioning, and other city and regional planning analyses to communities large and small
throughout the state of Texas. The Institute was established in 1967 in order to conduct
applied research and provide technical and planning assistance to cities, county governments,
non-profit organizations, and public agencies throughout the state of Texas.
PROJECT BACKGROUND
BACKGROUND 5
1.1 GOALS AND STRATEGIES
The City of Brazoria expects that the addition of a water park to the community will not only
add recreation and entertainment for the citizens of Brazoria, but will also become a source of
revenue for other city projects.
The goals for the study include the following:
Identify if a water park will be fiscally sustainable and will bring in revenue dollars for
the City of Brazoria.
Identify what are the needed water park amenities to ensure the facility will be
competitive with other pools and water parks and will be attractive to tourists
throughout the region.
Identify options to include a Recreational Vehicle (RV) park on the available land, in
addition to the water park.
Evaluate the potential for adding restaurants, shopping, and other recreational activities
in the vicinity of the water park.
To best assist the City meet their expressed needs and analyze whether the proposed project is
feasible, members of the IUS implemented the following strategies during the project:
Evaluate publicly and privately owned water parks in Texas and across the country in
similar demographic and geographic areas as Brazoria
Understand the range in size, level of amenities, and historical attendance and fee
structure for a city owned waterpark.
Analyze core demographics for Brazoria and the surrounding region
Evaluate existing area/regional aquatic recreation providers
Identify alternative water park amenities to present to the City of Brazoria
Develop project development cost estimates
Estimate potential revenues, labor costs, and operating expenses
Determine recapture rates and supportable debt levels
Research the RV park industry to identify core attributes and success factors for the RV
park in conjunction with a water park.
FEASIBILITY STUDY 6
CHAPTER 2: WATER PARK INDUSTRY
The water park industry is diverse and growing. Municipally owned water parks are among the
fastest growing segment of the market. 1 Approximately 69% of outdoor water parks are
privately owned, while 31% are municipally owned.2 As of 2009, there were 330 outdoor water
parks and more than 130 indoor water parks located throughout the United States. Texas has
the third highest number of outdoor water parks in the United States. From 2005 to 2009,
attendance at the largest North American water parks increased by about 11%, compared with
less that 3% at large theme parks. 3
Water parks continue to offer increasing consumer appeal for a number of reasons. These
include increased disposable incomes , less desire to swim in natural bodies of water, and the
appeal of “thrill” rides to younger citizens.4 Municipalities have often found that providing
citizens with a mix of activites and experiences that cannot be found in the traditional “public
pool” results in increased attendance and revenue. For example, the attendance at
Brownwood Texas’ aquatic facilties increased from approximately 2,200 to over 15,000 upon
completion of the Camp Bowie Family Aquatic Center. 5
7 WATER PARK INDUSTRY
2.1 INDUSTRY DESCRIPTIONS
While a water park can be either privately owned or municipally owned, success is often
measured differently in the public versus the private sector. For municipally owned water
parks, a successful park is defined as one that earns enough through revenues to cover the daily
operating costs, provides a surplus to fund expansion, helps fund other facilities within the
city’s parks and recreation system, and/or funds the repair costs of existing municipal pools. 6
Average attendance at water parks in North America has been increasing by 1 to 3 percent each
year. 7 The construction of water parks within the state of Texas has been increasing.
Counsilman-Hunsaker, a major water park design and construction firm, has built 28 water
parks in Texas within the past decade.8 This growth is driven by a number of factors. First,
waterparks offer a relatively high level of safety and security that appeals to a broad audience
for aquatic recreation. Second, waterparks can take advantage of their primary appeal to
children, tweens, and teens. Waterparks are increasing their appeal to the aging baby-boomer
generation by not only providing entertainment options for children and grandchildren, but by
providing older adults with access to hydrotherapy, aquatic fitness, and spa services. 9
2.2 WATER PARK GUIDE
Local and regional water park industry dynamics can be derived from an analysis of similar
water parks. To that end, IUS researchers interviewed various water park managers throughout
the state of Texas and across the nation. The goal was to find trends in the industry and to find
water park sizes and attractions that are appropriate for the researched Brazoria demographics.
Wherever possible, water parks were chosen and pinpointed for further research based on
whether they contained broad similarities to Brazoria in terms of demographics, geographic
location relative to a large urban area, and geographic location relative to natural amenities,
like the ocean or state and national wildlife areas.
In the following section, seven water parks located in Texas and across the nation are
discussed. Their individual entrance fees, amenities and - when possible - visitor tally, is
displayed.
FEASIBILITY STUDY 8
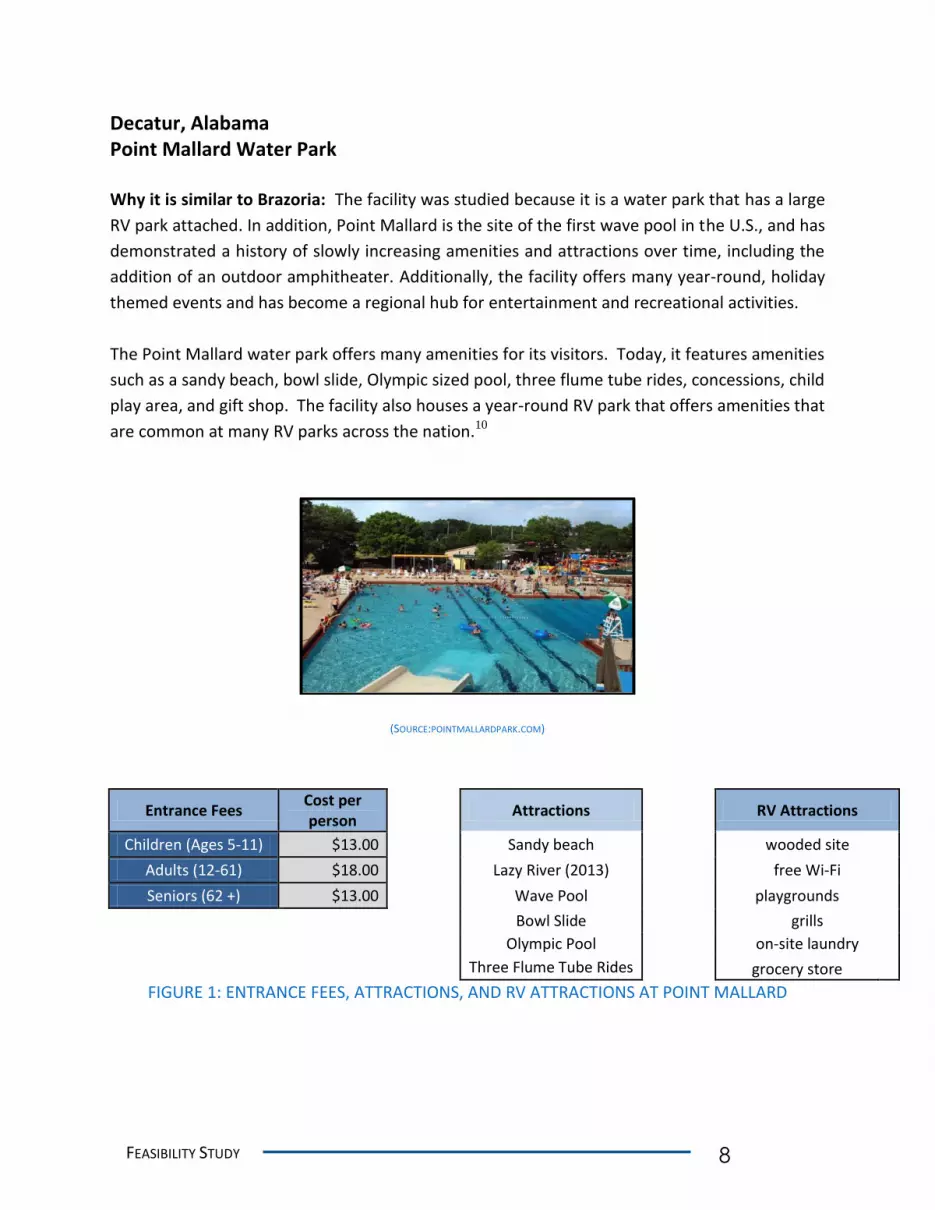
Decatur, Alabama Point Mallard Water Park Why it is similar to Brazoria: The facility was studied because it is a water park that has a large
RV park attached. In addition, Point Mallard is the site of the first wave pool in the U.S., and has
demonstrated a history of slowly increasing amenities and attractions over time, including the
addition of an outdoor amphitheater. Additionally, the facility offers many year-round, holiday
themed events and has become a regional hub for entertainment and recreational activities.
The Point Mallard water park offers many amenities for its visitors. Today, it features amenities
such as a sandy beach, bowl slide, Olympic sized pool, three flume tube rides, concessions, child
play area, and gift shop. The facility also houses a year-round RV park that offers amenities that
are common at many RV parks across the nation.10
(SOURCE:POINTMALLARDPARK.COM)
Entrance Fees Cost per person
Attractions
RV Attractions
Children (Ages 5-11) $13.00
Sandy beach
wooded site
Adults (12-61) $18.00
Lazy River (2013)
free Wi-Fi
Seniors (62 +) $13.00
Wave Pool
playgrounds
Bowl Slide
grills
Olympic Pool
on-site laundry
Three Flume Tube Rides
grocery store
FIGURE 1: ENTRANCE FEES, ATTRACTIONS, AND RV ATTRACTIONS AT POINT MALLARD

9 WATER PARK INDUSTRY
Sheridan, Texas Splashway Waterpark Why it is similar to Brazoria: Splashway water park was chosen as a case study because it is
located in a rural community. Unlike Brazoria, however, it is not located near large
metropolitan regions. In fact, it is about 2 hours from San Antonio, Austin, and Houston, yet
demonstrates success despite this distant location. Splashway water park is also presented as
another example of an RV park connected to the water park facility. Splashway has, like many
other water parks, started with one mix of attractions, then expanded over time.
Splashway water park offers visitors many slides, a lazy river, a large wave pool, toddler and
youth play areas, and concessions. Of important note, the facility is connected to a large RV
area designed for camping. Travelers at the RV park are able to do more than just camp— the
facility is designed as a two-in-one water park and RV park. The RV portion offers campers
hiking, walking, biking, restrooms, showers, and many other amenities found at RV park.11
SOURCE: SPLASHWAY FAMILY WATER PARK FACEBOOK PAGE
Entrance Fees Cost per person
Attractions
RV Attractions
Guest over 42" tall $19.99
toddler play area
Wooded sites
Guest under 42" tall $15.99
youth play area
restrooms/showers
Guest under 32" tall $5.99
slides
fishing
wave pool
walking trails
lazy river
full hook ups
concessions
RV Camping
FIGURE 2: ENTRANCE FEES, ATTRACTIONS, AND RV ATTRACTIONS AT SPLASHWAY

FEASIBILITY STUDY 10
Burleson, Texas North Texas Jellystone Park
Why it is similar to Brazoria: Jellystone Park is located about 10 minutes south of Fort Worth,
Texas. The facility was studied because it is an RV park that has recently added a new water
park, called Pirate’s Cove. Jellystone is an example of a large RV park and a large water park
that are operating as the same facility. Jellystone also broadens its appeal with complementary
“dry” attractions, such as paintball and laser tag.
Jellystone offers RV campsites that are more up-scale (with flower beds, attractive landscaping,
and many amenities). The Pirate’s Cove water park was recently built on the site and gives
discounts to RV patrons, but also welcomes non-RVing patrons.12
(SOURCE: HAVINGFUNINTHETEXASSUN.COM)
Entrance Fees
Cost per person
Attractions
RV Attractions
Over 42" tall $12.99
water slides
electric service
Under 42" tall $9.99
cabanas
Internet
Admission (with RV pass)
$7.99
Dumping Buckets
City water /sewer
Aquatic Games
laundry
Lounge pool
attractive landscaping
FIGURE 3: ENTRANCE FEES, ATTRACTIONS, AND RV ATTRACTIONS AT JELLYSTONE

11 WATER PARK INDUSTRY
Baytown, Texas Pirate’s Bay Water Park Why it is similar to Brazoria: Pirate’s Bay was chosen as a comparative water park because it is
municipally owned and is located on the fringes of the city of Houston. Pirate’s Bay offers
insight into attraction mix, local construction costs, and likely visitor numbers.
Pirate’s Bay offers many amenities for families to enjoy. The facility has four winding slides,
including one tube slide. The ‘Flow Rider’ surf machine provides people with the opportunity to
work on their surfing skills. The facility also features ‘mat racers’, where riders can race each
other down long slides on mats. A 671 foot long lazy river also winds throughout the park.
Pirate’s Bay also has pavilion and cabana rentals that serve as ideal venues for parties and get-
togethers. Indoor pavilions are also available. 13 Development cost was $10.5 million.14
SOURCE: AQUATICSINTL.COM
Entrance Fees Cost per person
Attractions
48” and above $17.00
Children’s play area with dumping bucket
Below 48” $12.00
Flow rider
Individual (resident) $85.00
Lazy River
2011 Visitors
Family of 3 (resident) $235.00
Multiple tube slides
170,000 +
Family of 4 (resident) $300.00
Concessions
Family of 5 (resident) $365.00
Body slides
Individual (non-resident) $125.00
Obstacle course
Family of 3 (non-resident) $365.00
Showers and changing facility
Family of 4 (non-resident) $460.00
Family of 5 (non-resident) $565.00
Spectators $5.00
FIGURE 4: ENTRANCE FEES, ATTRACTIONS, AND VISITORS AT PIRATE’S BAY
FEASIBILITY STUDY 12
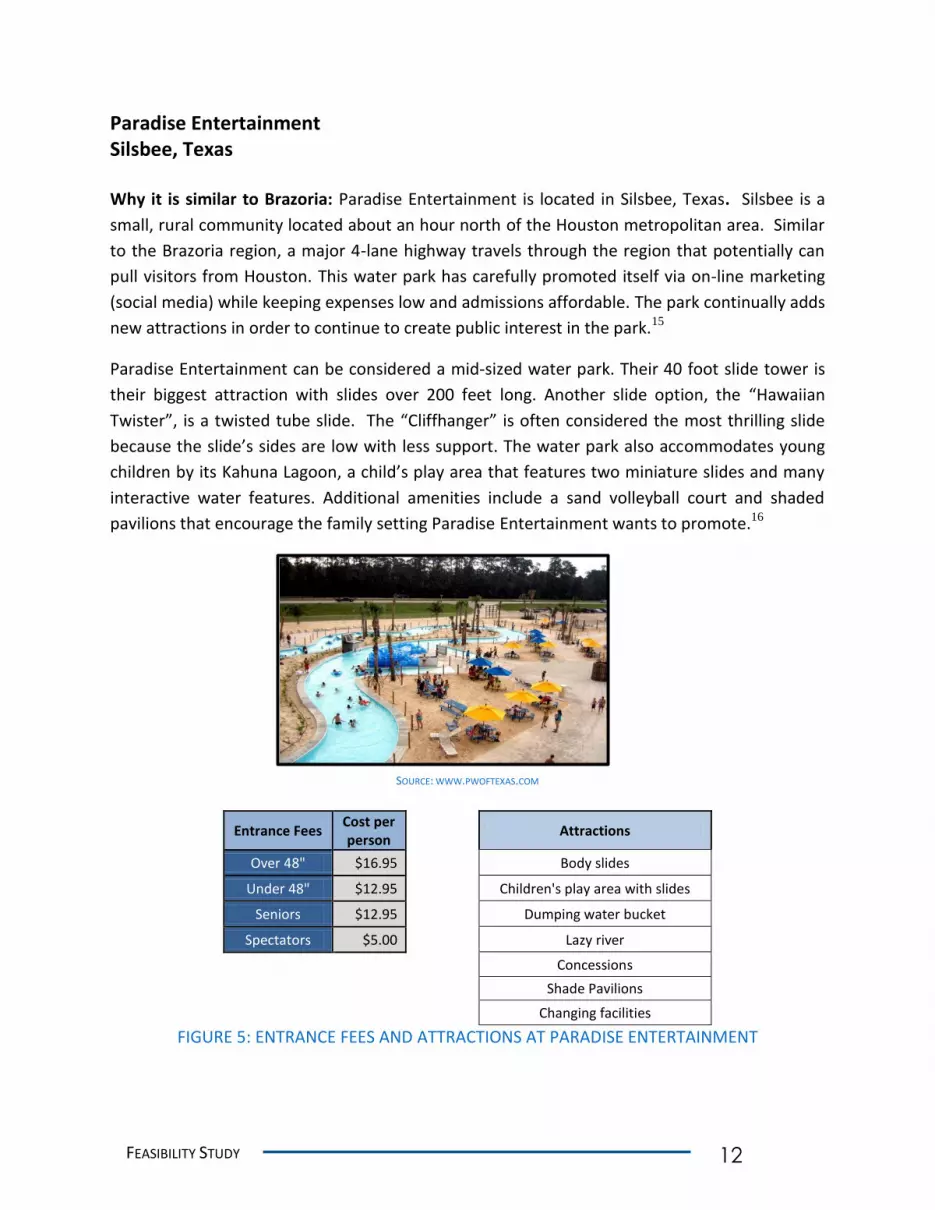
Paradise Entertainment Silsbee, Texas
Why it is similar to Brazoria: Paradise Entertainment is located in Silsbee, Texas. Silsbee is a
small, rural community located about an hour north of the Houston metropolitan area. Similar
to the Brazoria region, a major 4-lane highway travels through the region that potentially can
pull visitors from Houston. This water park has carefully promoted itself via on-line marketing
(social media) while keeping expenses low and admissions affordable. The park continually adds
new attractions in order to continue to create public interest in the park.15
Paradise Entertainment can be considered a mid-sized water park. Their 40 foot slide tower is
their biggest attraction with slides over 200 feet long. Another slide option, the “Hawaiian
Twister”, is a twisted tube slide. The “Cliffhanger” is often considered the most thrilling slide
because the slide’s sides are low with less support. The water park also accommodates young
children by its Kahuna Lagoon, a child’s play area that features two miniature slides and many
interactive water features. Additional amenities include a sand volleyball court and shaded
pavilions that encourage the family setting Paradise Entertainment wants to promote.16
SOURCE: WWW.PWOFTEXAS.COM
Entrance Fees Cost per person
Attractions
Over 48" $16.95
Body slides
Under 48" $12.95
Children's play area with slides
Seniors $12.95
Dumping water bucket
Spectators $5.00
Lazy river
Concessions
Shade Pavilions
Changing facilities
FIGURE 5: ENTRANCE FEES AND ATTRACTIONS AT PARADISE ENTERTAINMENT
13 WATER PARK INDUSTRY
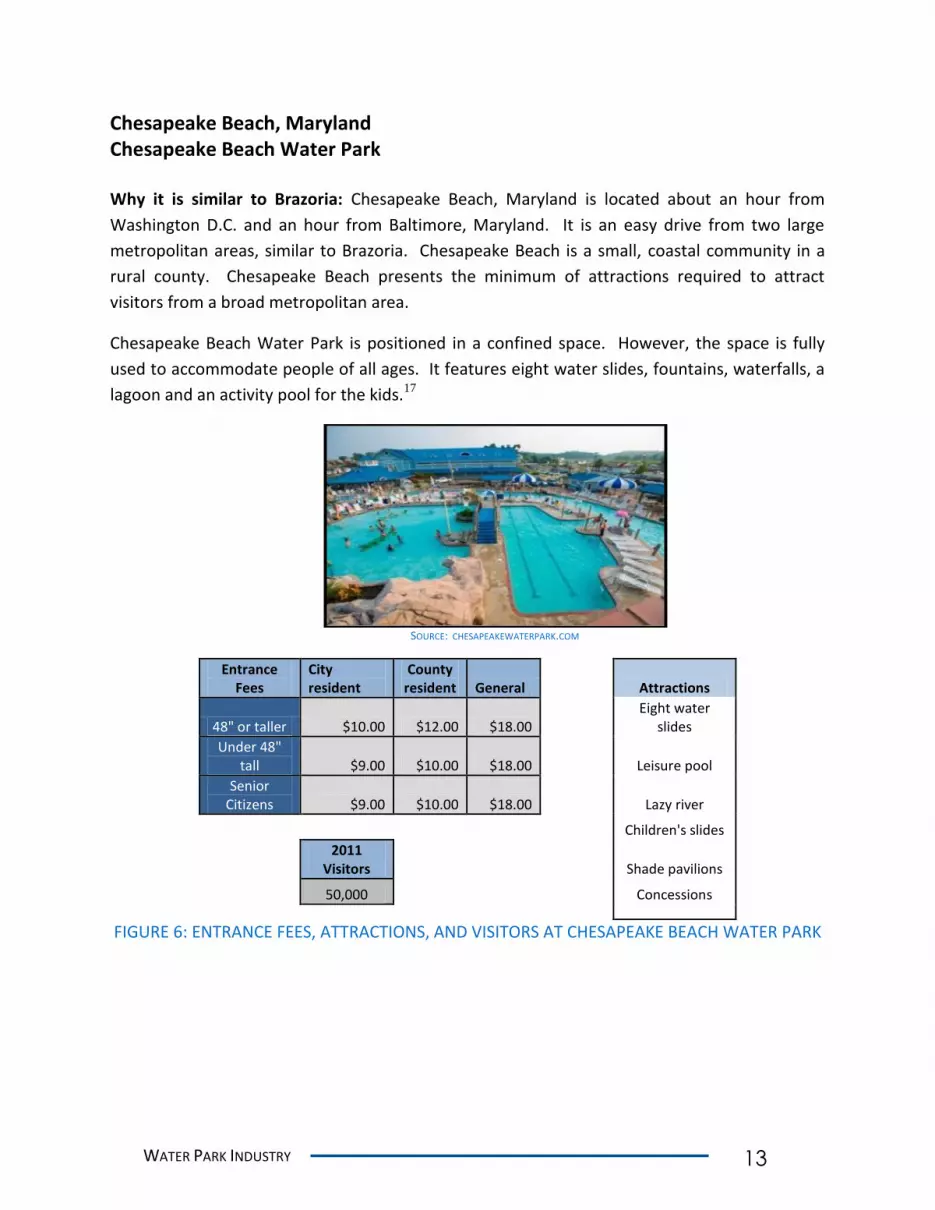
Chesapeake Beach, Maryland Chesapeake Beach Water Park
Why it is similar to Brazoria: Chesapeake Beach, Maryland is located about an hour from
Washington D.C. and an hour from Baltimore, Maryland. It is an easy drive from two large
metropolitan areas, similar to Brazoria. Chesapeake Beach is a small, coastal community in a
rural county. Chesapeake Beach presents the minimum of attractions required to attract
visitors from a broad metropolitan area.
Chesapeake Beach Water Park is positioned in a confined space. However, the space is fully
used to accommodate people of all ages. It features eight water slides, fountains, waterfalls, a
lagoon and an activity pool for the kids.17
SOURCE: CHESAPEAKEWATERPARK.COM
Entrance Fees
City resident
County resident General
Attractions
48" or taller $10.00 $12.00 $18.00
Eight water slides
Under 48" tall $9.00 $10.00 $18.00
Leisure pool
Senior Citizens $9.00 $10.00 $18.00
Lazy river
Children's slides
2011 Visitors
Shade pavilions
50,000
Concessions
FIGURE 6: ENTRANCE FEES, ATTRACTIONS, AND VISITORS AT CHESAPEAKE BEACH WATER PARK
FEASIBILITY STUDY 14
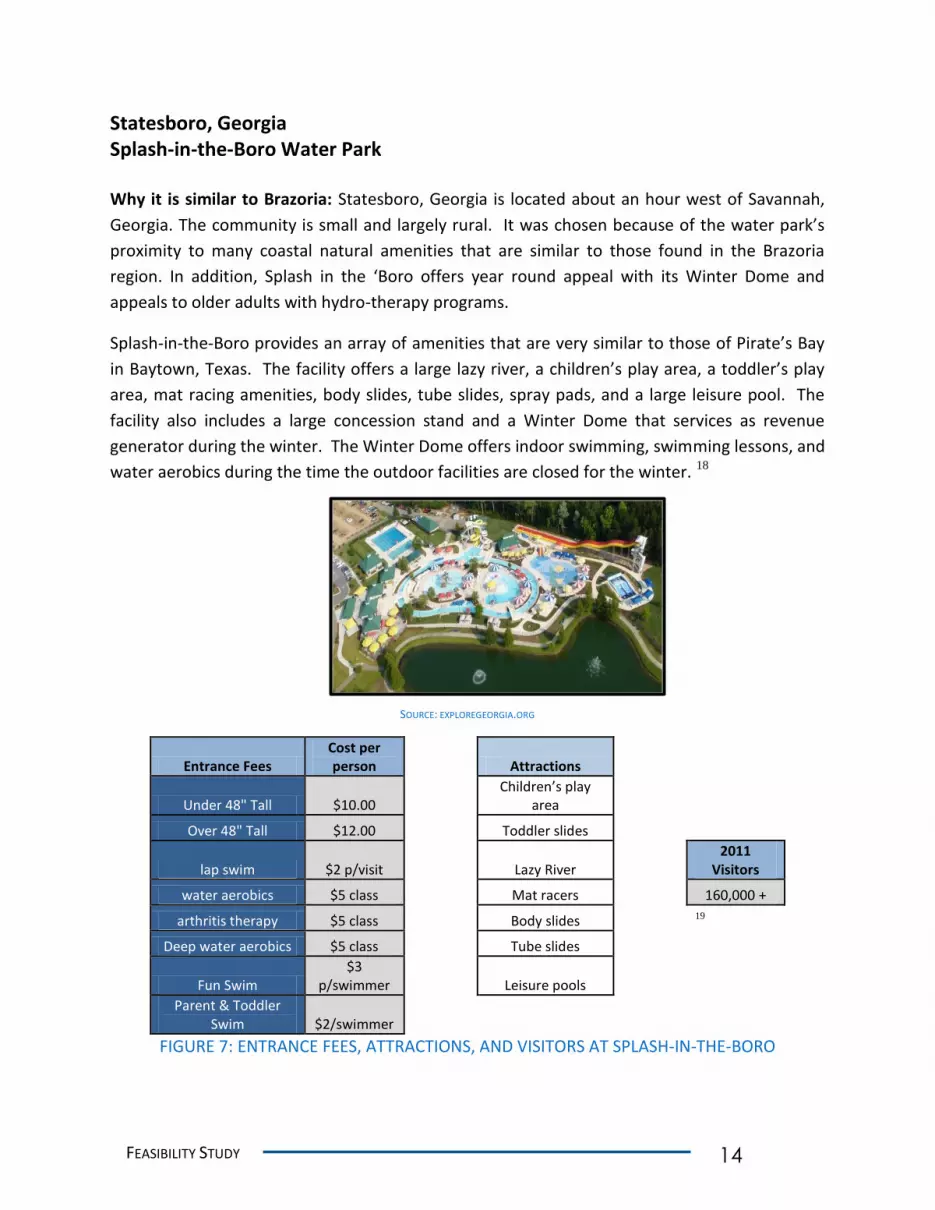
Statesboro, Georgia Splash-in-the-Boro Water Park
Why it is similar to Brazoria: Statesboro, Georgia is located about an hour west of Savannah,
Georgia. The community is small and largely rural. It was chosen because of the water park’s
proximity to many coastal natural amenities that are similar to those found in the Brazoria
region. In addition, Splash in the ‘Boro offers year round appeal with its Winter Dome and
appeals to older adults with hydro-therapy programs.
Splash-in-the-Boro provides an array of amenities that are very similar to those of Pirate’s Bay
in Baytown, Texas. The facility offers a large lazy river, a children’s play area, a toddler’s play
area, mat racing amenities, body slides, tube slides, spray pads, and a large leisure pool. The
facility also includes a large concession stand and a Winter Dome that services as revenue
generator during the winter. The Winter Dome offers indoor swimming, swimming lessons, and
water aerobics during the time the outdoor facilities are closed for the winter. 18
SOURCE: EXPLOREGEORGIA.ORG
Entrance Fees Cost per person
Attractions
Under 48" Tall $10.00
Children’s play area
Over 48" Tall $12.00
Toddler slides
lap swim $2 p/visit
Lazy River
2011 Visitors
water aerobics $5 class
Mat racers
160,000 +
arthritis therapy $5 class
Body slides
19
Deep water aerobics $5 class
Tube slides
Fun Swim $3
p/swimmer
Leisure pools Parent & Toddler
Swim $2/swimmer FIGURE 7: ENTRANCE FEES, ATTRACTIONS, AND VISITORS AT SPLASH-IN-THE-BORO
15 WATER PARK INDUSTRY
2.3 WATER PARK OPTIONS FOR BRAZORIA
In addition to a water park, Brazoria is seeking to evaluate the potential for an RV park on the
donated property. Therefore, two models are presented in the next section: a large tourist
generating water park and a large tourist generating water park with an RV park. The models
presented are designed to be an amenity guide.
OPTION 1: LARGE, TOURIST GENERATING WATER PARK
This option offers amenities:
a lap swimming pool
locker rooms,
spray water area,
lounge areas,
playgrounds,
zero beach area,
concession stands,
lazy river,
multiple slides.
Generally, as the size of the water park increases, the amount of time patrons stay at the park
increases. In addition, the longer patrons plan to stay at a park, the farther they are willing to
drive to get there.20 In other words, a larger park will attract people from farther away because
they plan to spend more time at the park and consider the extra drive time worth the cost. A
larger water park, therefore, offers more amenities that will appeal to a larger group of
potential patrons and tourists.
OPTION 2: LARGE, TOURIST GENERATING WATER PARK WITH RV COMPONENT
This option offers the same amenities described in Option 1 above, however, Option 2 includes
an RV Park component. In this model, the RV Park is located near the water park. Patrons of
the RV park would have access to the water park. The RV Park would be constructed on the
approximately 25 acres not consumed by the water park.
Additionally, an RV park and water park combination should feature sidewalks and connectivity.
It is important that the RV park and water park be connected by attractive pedestrian paths
FEASIBILITY STUDY 16
CHAPTER 3: BRAZORIA MARKET
There are common characteristics that are required to operate a successful water park. Water
park feasibility should be seen through the lens of six key factors: site features, demographics,
the tourist market, competition, weather, and the school year schedule.21 Other site
characteristics were also analyzed and are discussed throughout Chapter 3.
3.1 BRAZORIA SITE CONSIDERATIONS
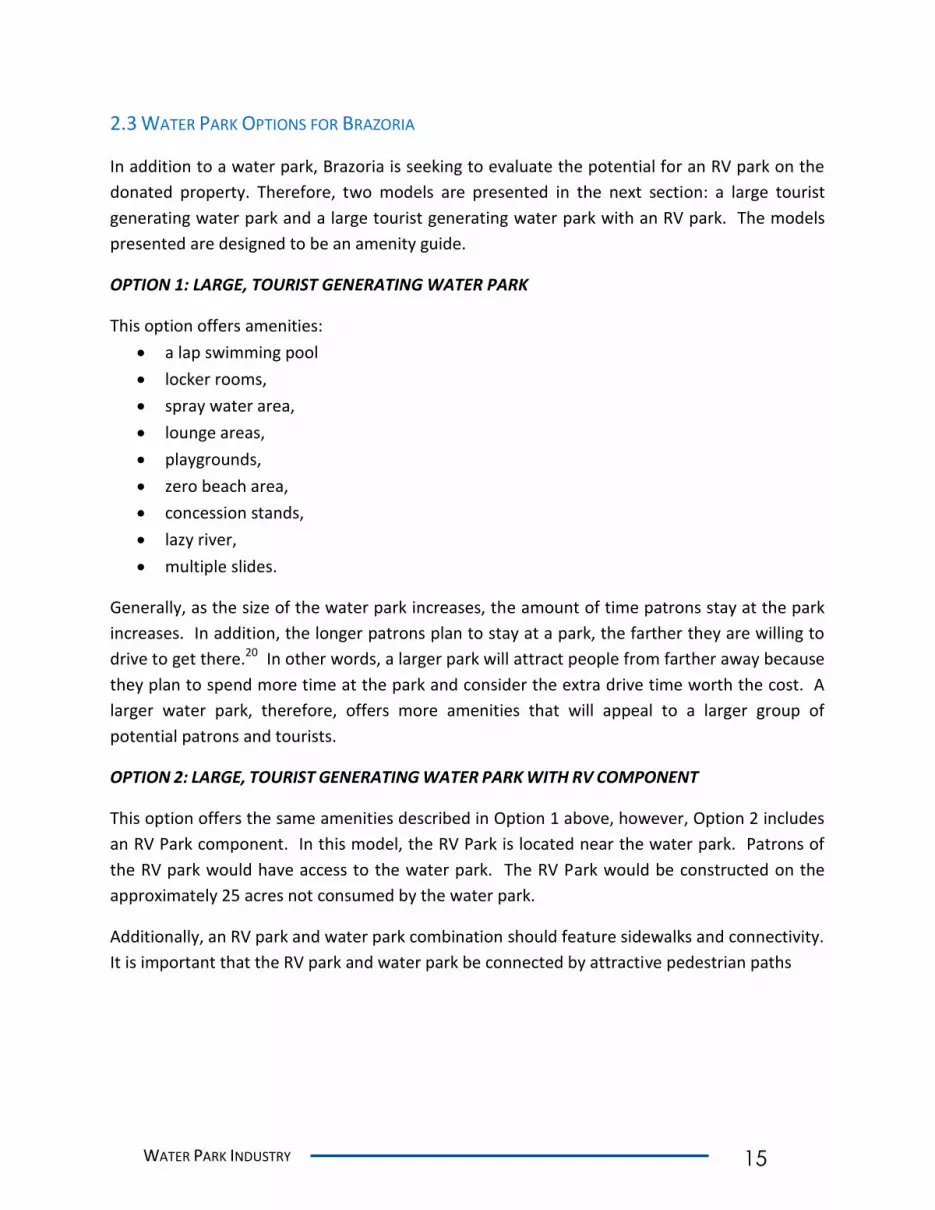
Site Features: The site is one of the most important factors that affect a potential water park.
The thirty-five acre water park site is located along Texas Highway 36. The flat and lightly
wooded parcel is located on the extreme southern edge of the city, north of County Road 429
(Andrews Road) and south of Mulberry Lane.
(SOURCE: GOOGLE.COM/MAPS)
FIGURE 8: AERIAL PHOTO OF LAND SITE
Visibility and Transportation: Excellent visibility can be achieved on this site because of the
proximity to Highway 36, a major thoroughfare through the City of Brazoria. The developable
land is located directly on Highway 36. Motorists would be able to see signage and/or the
17 BRAZORIA MARKET
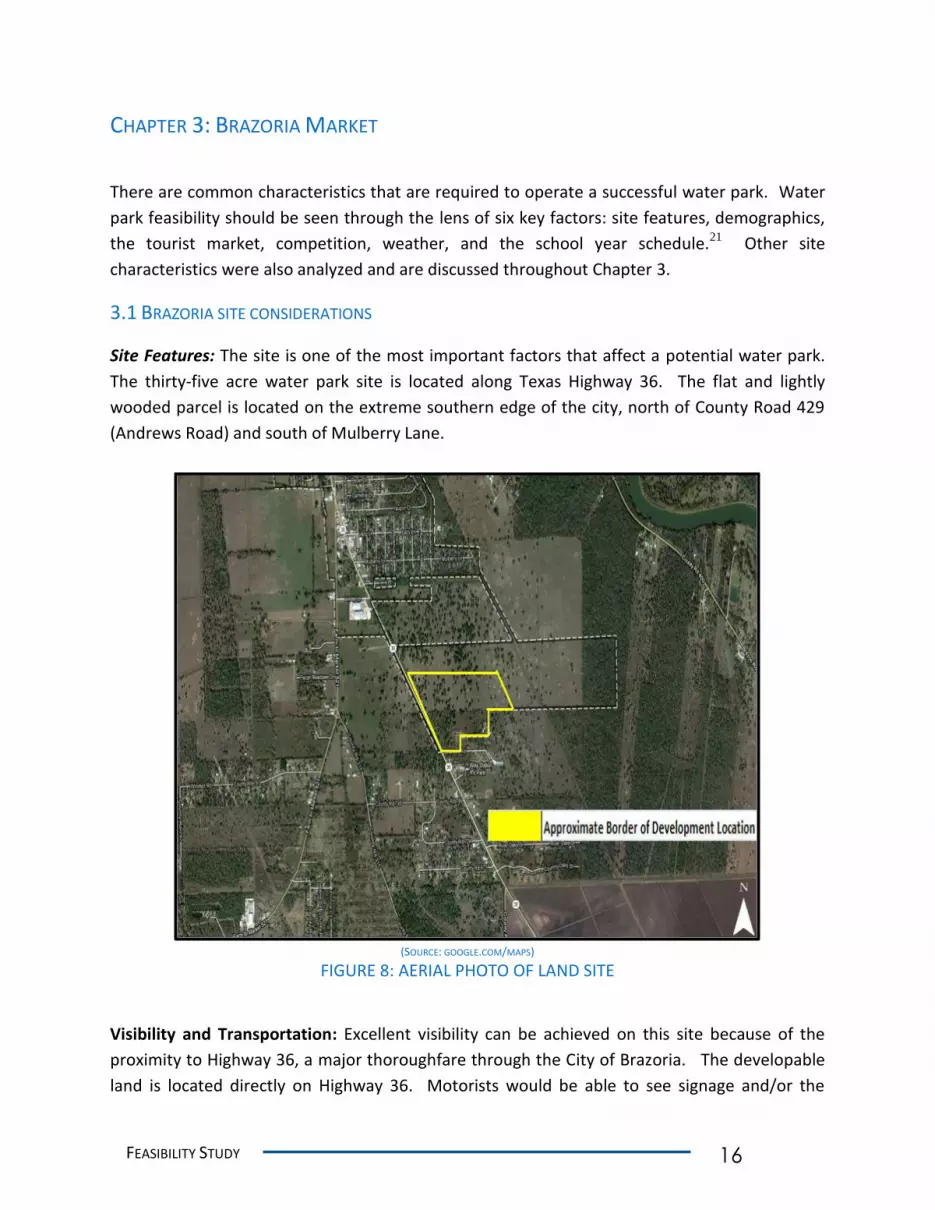
water park structure as they pass by the land. Highway 36 received an average daily traffic
count between 5,400 and 7,600 in the year 2010.22
(SOURCE: TEXAS DEPARTMENT OF TRANSPORTATION)
FIGURE 9: 2010 AVERAGE DAILY TRAFFIC COUNTS ON HIGHWAY 36
The site offers easy highway access to the greater Houston area. A 90 minute drive from the
site can reach the majority of Houston and its suburbs. A proportion of potential visitors,
therefore, would likely be from the Houston area. It should be noted, however, that the
location is not easily reached by any means other than a car. The location is not currently
connected to the City’s sidewalk network, nor is it on a transit route. All visitors to the site
would rely on auto transport.
The 2010 average daily traffic counts on Highway 36 to Brazoria is 12,400.23 Highway 332,
which is accessible from Highway 288 (likely to be used by visitors travelling from Houston,
eastern suburbs of Houston and Angleton), has an average daily traffic count of 6,800. This high
traffic count on State Highway 36 and Highway 332 further strengthens our observation that
these routes are most likely to be chosen by the visitors of the potential water park. The map
below shows the highways to approach the park and Traffic counts on the Highways.
FEASIBILITY STUDY 18
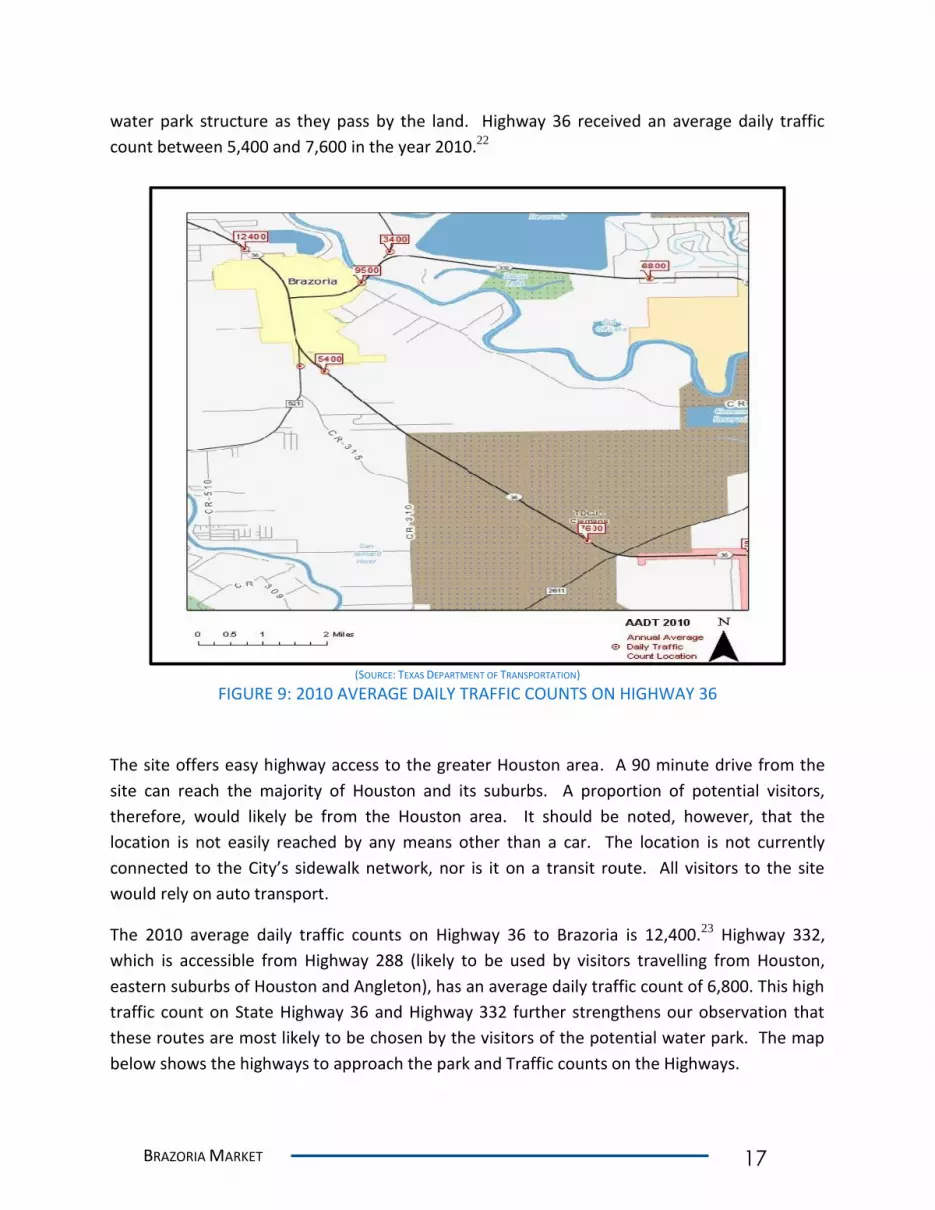
(Source: Texas Department of Transportation)
FIGURE 10: PROJECTED TRAFFIC FLOWS FOR BRAZORIA WATERPARK
Potential Visitor Trip: A large portion of the potential visitors to the water park would be from
Houston and its suburbs. Visitors traveling from Houston and the eastern suburbs of Houston
would likely take Highway 288, travel south on Highway 288, and then travel west on Highway
322. Likewise, visitors traveling from Fort Bend County and other western suburbs of Houston
would likely take Highway 36 south to reach the water park.
Those visitors who would opt to stay in a hotel would likely reside in Angleton or Lake Jackson,
where there are many nearby hotels. Angleton visitors would travel south on Highway 288,
then west on Highway 322. Lake Jackson visitors would travel west on Highway 322 to get to
the water park.
Solar Orientation: “Sun-bathing” is a popular pastime for many visitors to a water park.
Outdoor water park facilities are subject to the elements and facilities should be designed to
capture positive weather elements (like sunshine) and diminish negative weather elements (like
rain). In addition, the proposed pavilion spaces will be available to alleviate excessive heat
from the Texas sun. Pavilion rental is also an additional opportunity for in-park revenue.24

19 BRAZORIA MARKET
Weather and Average Precipitation: Most outdoor water parks have an approximate 90 day
season. The next figure shows the average temperatures for the City of Brazoria and illustrates
the number of months warm enough for visitors to enjoy the water park. Brazoria’s climate is
well-suited for a water park.
(SOURCE: WEATHER.COM)
FIGURE 11: BRAZORIA, AVERAGE TEMPERATURES
School Year Schedules: Nearly all water parks have a schedule that mirrors the local school
system calendars. As mentioned earlier, teenagers and younger residents are part of the
largest demographic that frequently attends water parks. Most water parks are open less than
100 days and are open throughout May, June, July, and August.
Columbia-Brazoria ISD School Calendar (2012-2013)
27-AUG FIRST DAY OF CLASSES
DECEMBER 24-JANUARY 3 WINTER BREAK
MARCH 11- 15 SPRING BREAK
30-MAY SUMMER BREAK BEGINS (SOURCE: COLUMBIA-BRAZORIA ISD)
FIGURE 12: COLUMBIA - BRAZORIA ISD 2012-2013 SCHEDULE
Prevailing Winds: Prevailing winds are another major weather element that must be
considered before the development of a water park.25 A water park that is exposed to high
winds will not provide a positive experience for patrons. According to the National Oceanic and
Atmospheric Administration, Brazoria normally experiences average wind speeds.26
Safety: An obvious, but important, aspect of maintaining a water park is the safety of patrons at
the facility. The proposed water park location is located less than 2 miles from two fire stations
0
20
40
60
80
100
Jan Feb Mar Apr May Jun Jul Aug Sep Oct Nov Dec
Brazoria Average Temps (˚F)
Avg. High Avg. Low
FEASIBILITY STUDY 20
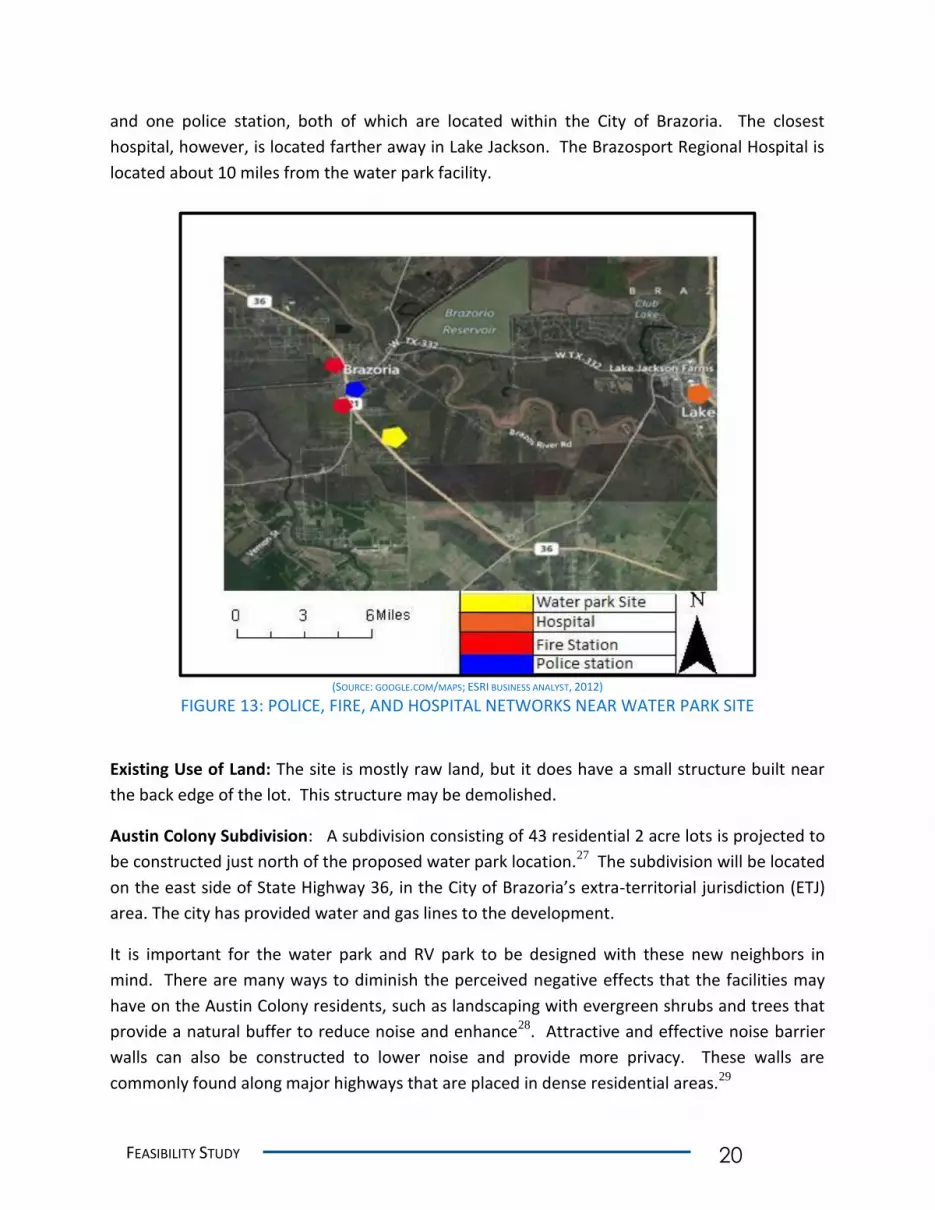
and one police station, both of which are located within the City of Brazoria. The closest
hospital, however, is located farther away in Lake Jackson. The Brazosport Regional Hospital is
located about 10 miles from the water park facility.
(SOURCE: GOOGLE.COM/MAPS; ESRI BUSINESS ANALYST, 2012)
FIGURE 13: POLICE, FIRE, AND HOSPITAL NETWORKS NEAR WATER PARK SITE
Existing Use of Land: The site is mostly raw land, but it does have a small structure built near
the back edge of the lot. This structure may be demolished.
Austin Colony Subdivision: A subdivision consisting of 43 residential 2 acre lots is projected to
be constructed just north of the proposed water park location.27 The subdivision will be located
on the east side of State Highway 36, in the City of Brazoria’s extra-territorial jurisdiction (ETJ)
area. The city has provided water and gas lines to the development.
It is important for the water park and RV park to be designed with these new neighbors in
mind. There are many ways to diminish the perceived negative effects that the facilities may
have on the Austin Colony residents, such as landscaping with evergreen shrubs and trees that
provide a natural buffer to reduce noise and enhance28. Attractive and effective noise barrier
walls can also be constructed to lower noise and provide more privacy. These walls are
commonly found along major highways that are placed in dense residential areas.29

21 BRAZORIA MARKET
(SOURCE: PROVIDED BY THE CITY OF BRAZORIA)
FIGURE 14: AUSTIN COLONY SUBDIVISION PLANS
Extra-Territorial Jurisdiction: According to Chapter 42 of the Texas Local Government Code, an
extra-territorial jurisdiction (ETJ) for a city with a population fewer than 5,000 individuals is a
one-half mile boundary around the city limits.30 The ETJ of Brazoria is shown in FIGURE 15.
(SOURCE: BRAZORIA COUNTY)
FIGURE 15: BRAZORIA ETJ MAP
FEASIBILITY STUDY 22
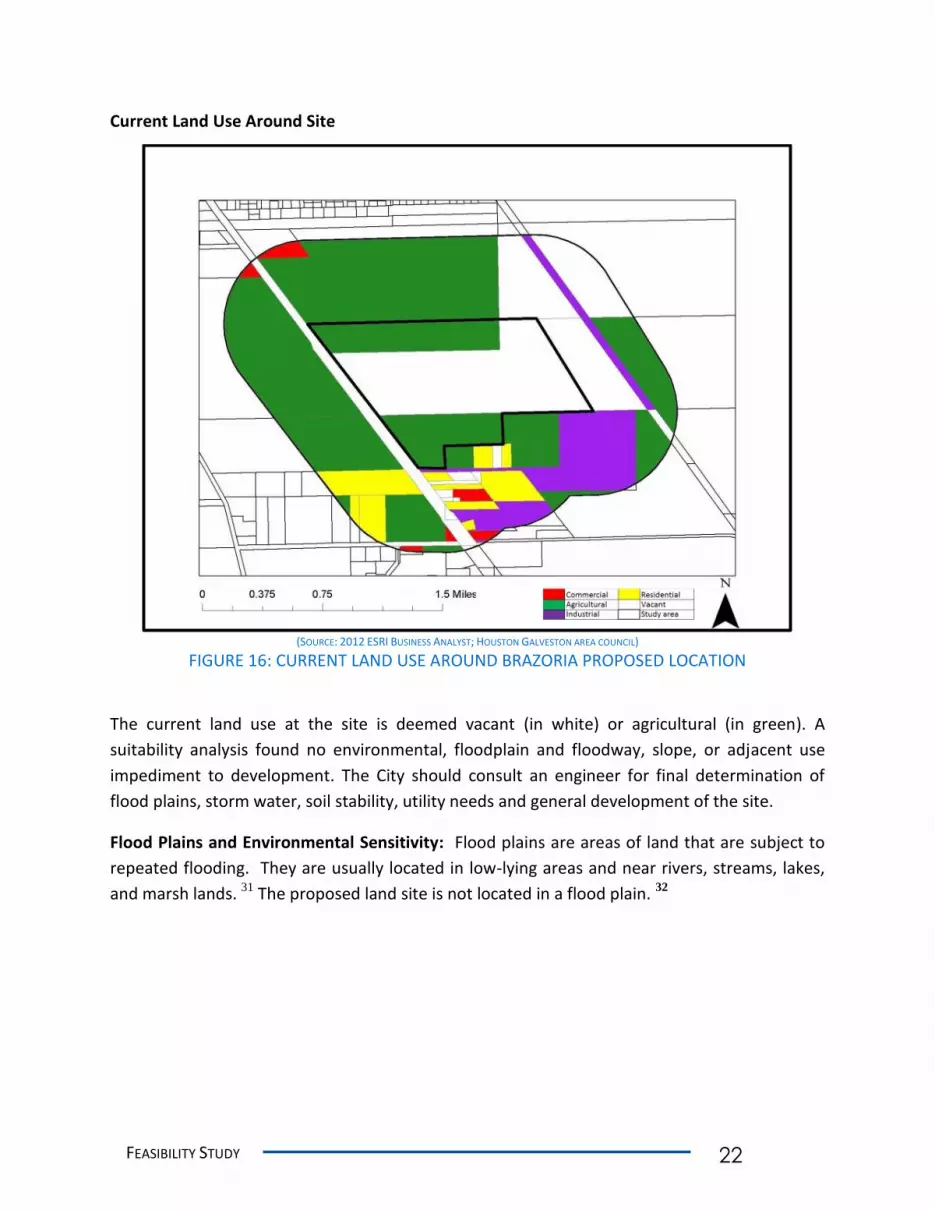
Current Land Use Around Site
(SOURCE: 2012 ESRI BUSINESS ANALYST; HOUSTON GALVESTON AREA COUNCIL)
FIGURE 16: CURRENT LAND USE AROUND BRAZORIA PROPOSED LOCATION
The current land use at the site is deemed vacant (in white) or agricultural (in green). A
suitability analysis found no environmental, floodplain and floodway, slope, or adjacent use
impediment to development. The City should consult an engineer for final determination of
flood plains, storm water, soil stability, utility needs and general development of the site.
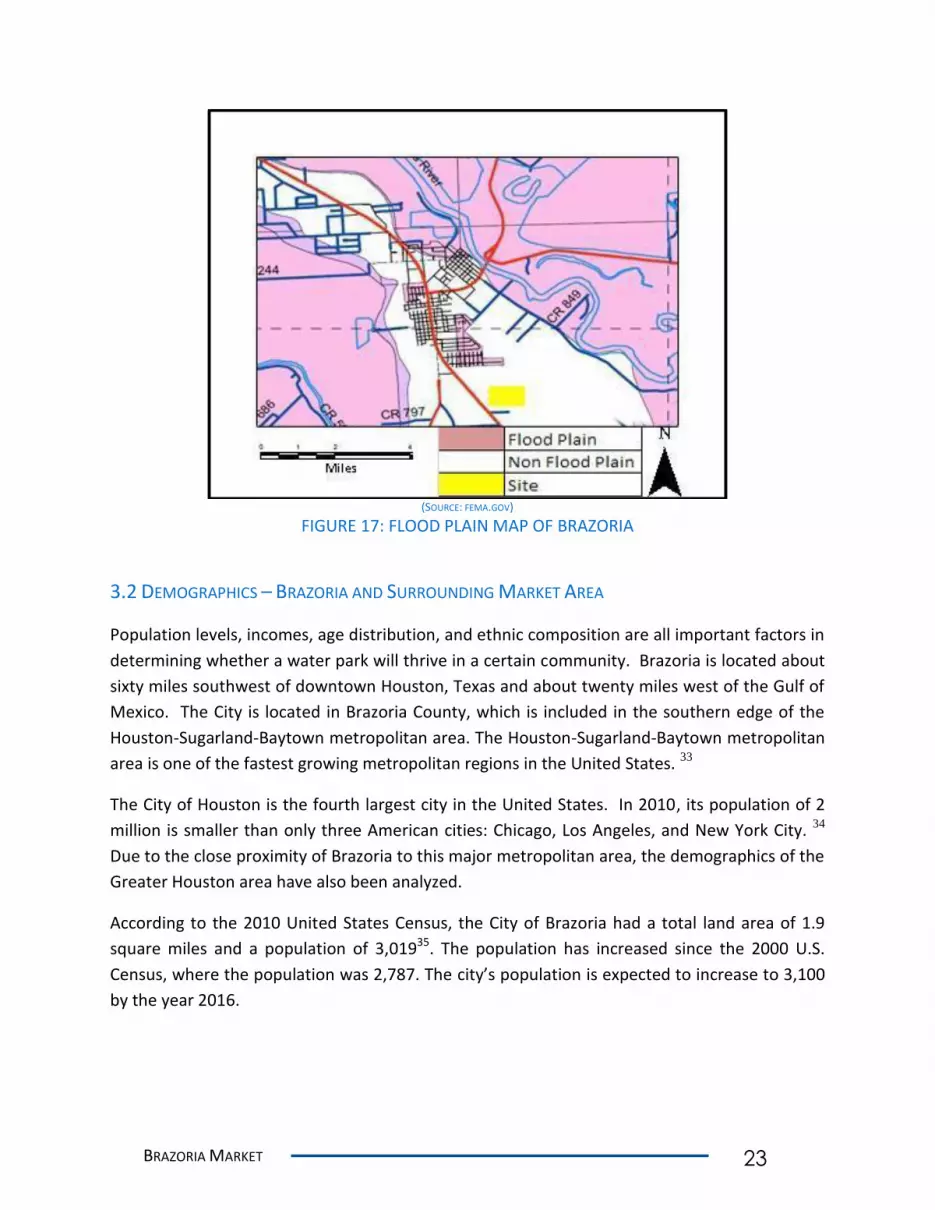
Flood Plains and Environmental Sensitivity: Flood plains are areas of land that are subject to
repeated flooding. They are usually located in low-lying areas and near rivers, streams, lakes,
and marsh lands. 31 The proposed land site is not located in a flood plain. 32
23 BRAZORIA MARKET
(SOURCE: FEMA.GOV)
FIGURE 17: FLOOD PLAIN MAP OF BRAZORIA
3.2 DEMOGRAPHICS – BRAZORIA AND SURROUNDING MARKET AREA
Population levels, incomes, age distribution, and ethnic composition are all important factors in
determining whether a water park will thrive in a certain community. Brazoria is located about
sixty miles southwest of downtown Houston, Texas and about twenty miles west of the Gulf of
Mexico. The City is located in Brazoria County, which is included in the southern edge of the
Houston-Sugarland-Baytown metropolitan area. The Houston-Sugarland-Baytown metropolitan
area is one of the fastest growing metropolitan regions in the United States. 33
The City of Houston is the fourth largest city in the United States. In 2010, its population of 2
million is smaller than only three American cities: Chicago, Los Angeles, and New York City. 34
Due to the close proximity of Brazoria to this major metropolitan area, the demographics of the
Greater Houston area have also been analyzed.
According to the 2010 United States Census, the City of Brazoria had a total land area of 1.9
square miles and a population of 3,01935. The population has increased since the 2000 U.S.
Census, where the population was 2,787. The city’s population is expected to increase to 3,100
by the year 2016.
FEASIBILITY STUDY 24
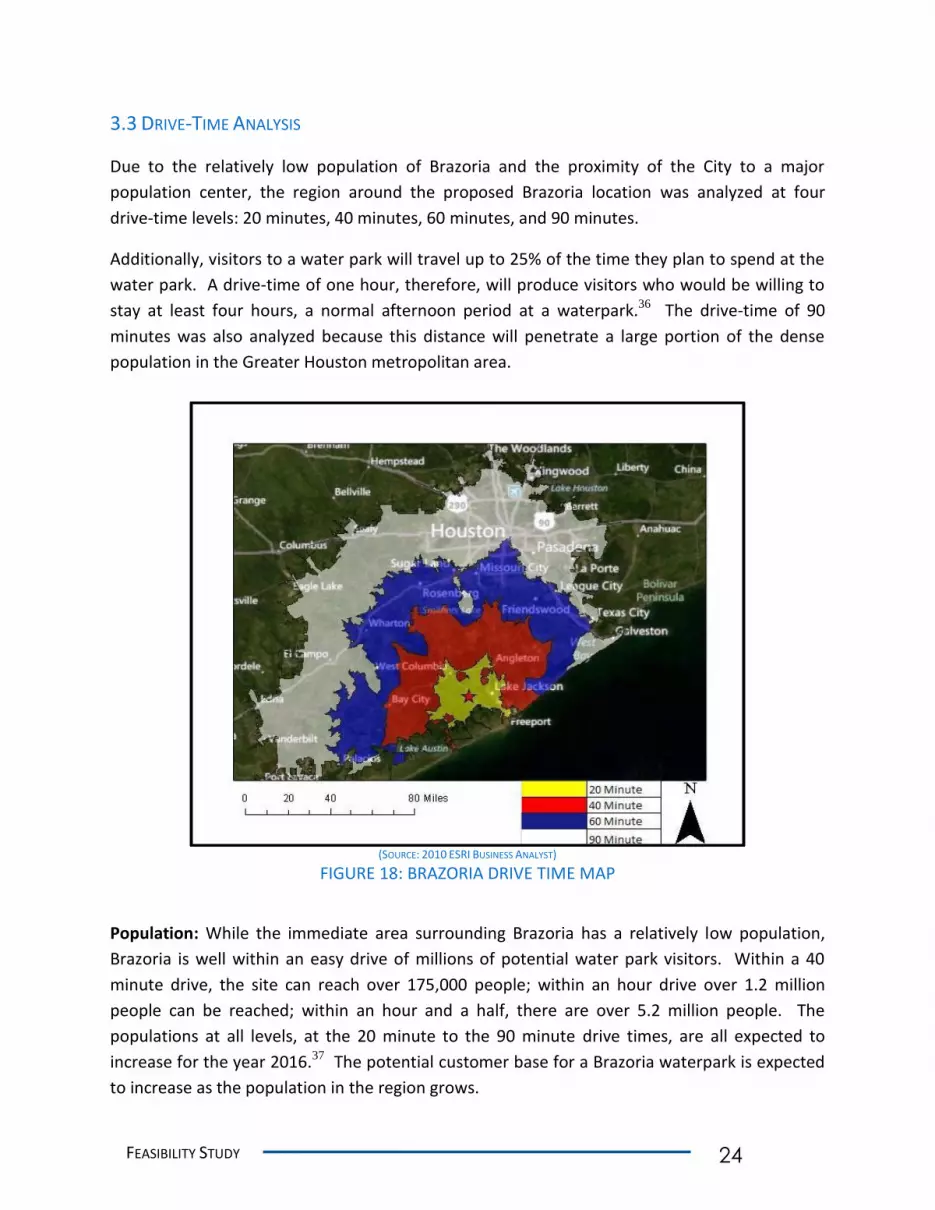
3.3 DRIVE-TIME ANALYSIS
Due to the relatively low population of Brazoria and the proximity of the City to a major
population center, the region around the proposed Brazoria location was analyzed at four
drive-time levels: 20 minutes, 40 minutes, 60 minutes, and 90 minutes.
Additionally, visitors to a water park will travel up to 25% of the time they plan to spend at the
water park. A drive-time of one hour, therefore, will produce visitors who would be willing to
stay at least four hours, a normal afternoon period at a waterpark.36 The drive-time of 90
minutes was also analyzed because this distance will penetrate a large portion of the dense
population in the Greater Houston metropolitan area.
(SOURCE: 2010 ESRI BUSINESS ANALYST)
FIGURE 18: BRAZORIA DRIVE TIME MAP
Population: While the immediate area surrounding Brazoria has a relatively low population,
Brazoria is well within an easy drive of millions of potential water park visitors. Within a 40
minute drive, the site can reach over 175,000 people; within an hour drive over 1.2 million
people can be reached; within an hour and a half, there are over 5.2 million people. The
populations at all levels, at the 20 minute to the 90 minute drive times, are all expected to
increase for the year 2016.37 The potential customer base for a Brazoria waterpark is expected
to increase as the population in the region grows.
25 BRAZORIA MARKET
2011 2016
20 Minute 81,255 86,088
40 Minute 175,575 185,657
60 Minute 1,264,262 1,397,098
90 Minute 5,261,925 5,739,329 SOURCE: 2012 ESRI BUSINESS ANALYST
FIGURE 19: POPULATION BY DRIVE TIME— 2011 AND 2016
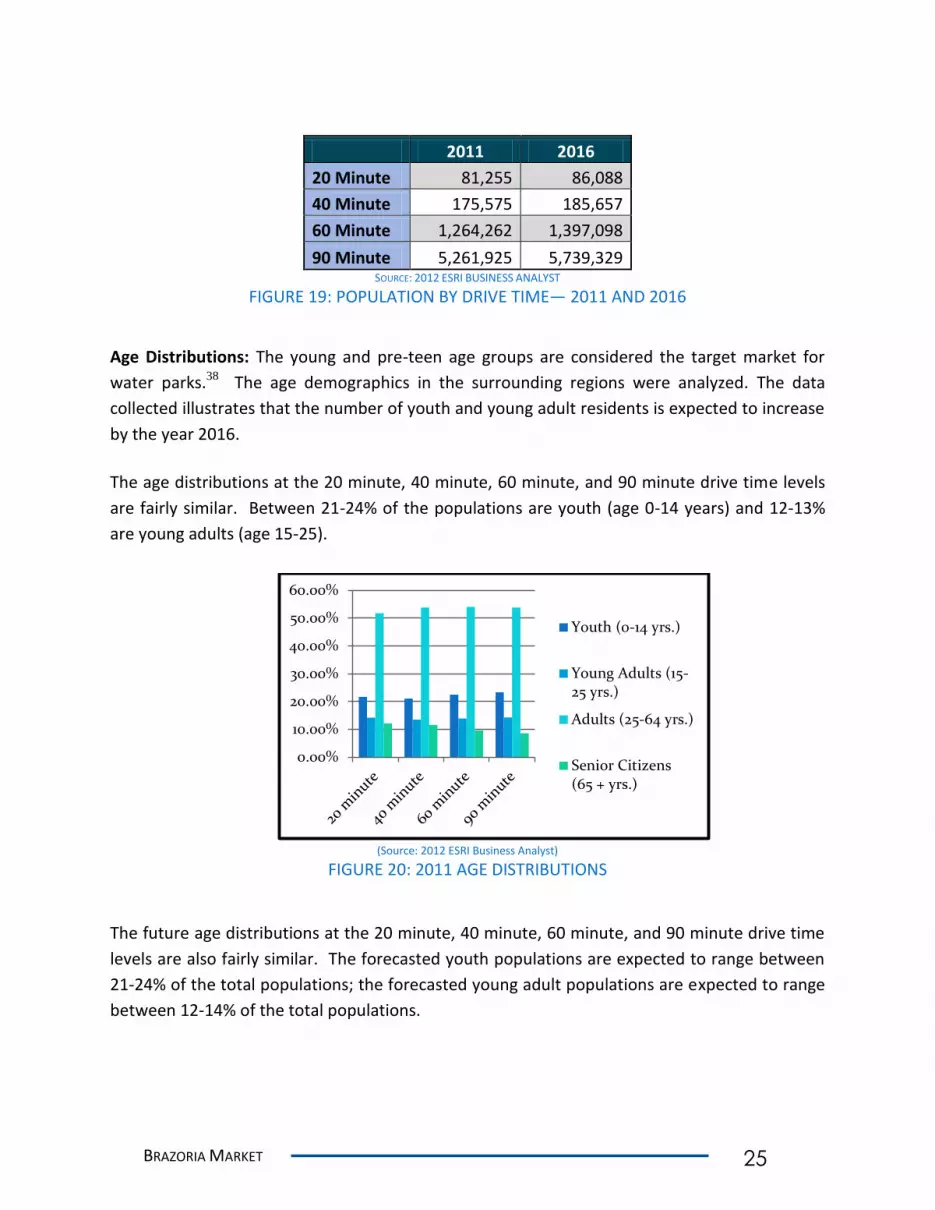
Age Distributions: The young and pre-teen age groups are considered the target market for
water parks.38 The age demographics in the surrounding regions were analyzed. The data
collected illustrates that the number of youth and young adult residents is expected to increase
by the year 2016.
The age distributions at the 20 minute, 40 minute, 60 minute, and 90 minute drive time levels
are fairly similar. Between 21-24% of the populations are youth (age 0-14 years) and 12-13%
are young adults (age 15-25).
(Source: 2012 ESRI Business Analyst)
FIGURE 20: 2011 AGE DISTRIBUTIONS
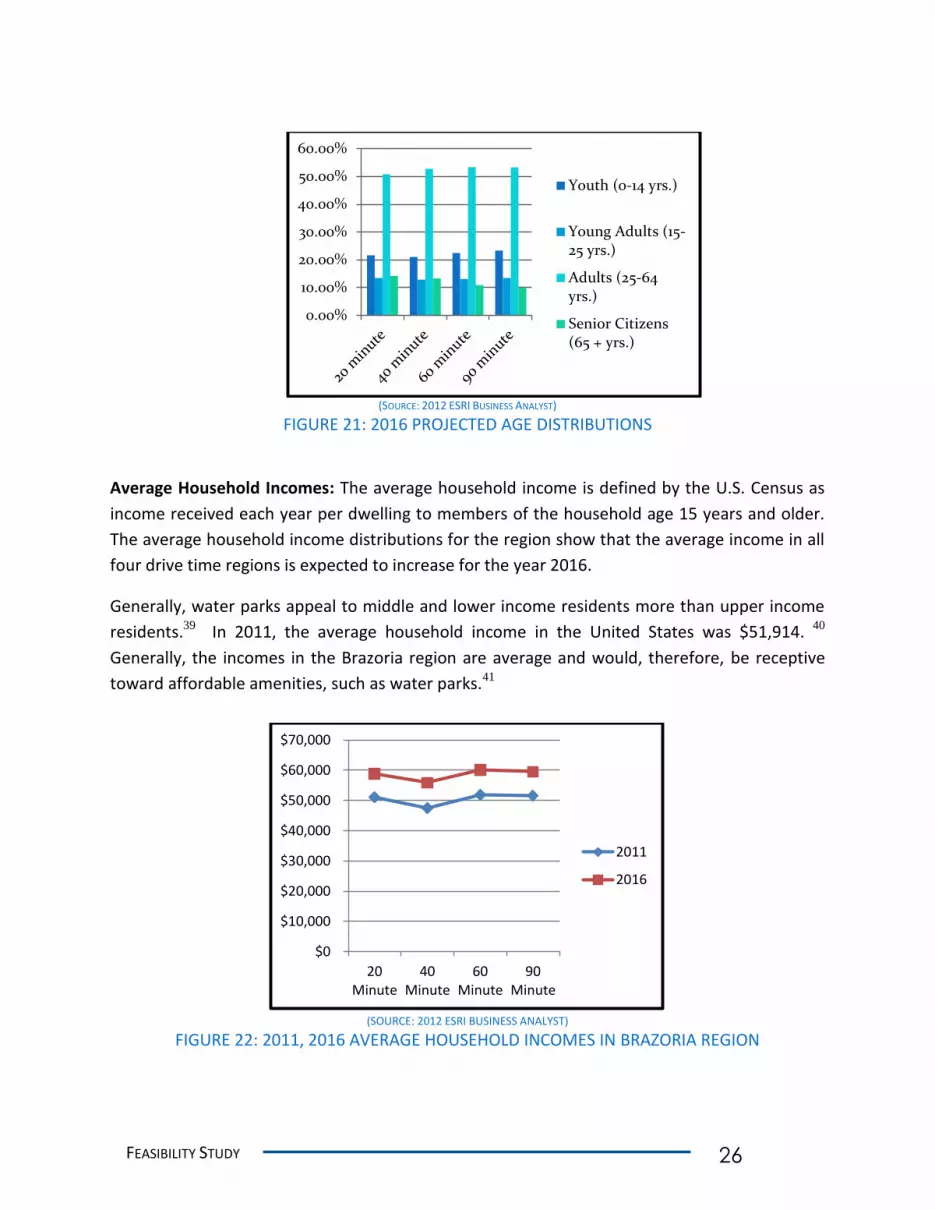
The future age distributions at the 20 minute, 40 minute, 60 minute, and 90 minute drive time
levels are also fairly similar. The forecasted youth populations are expected to range between
21-24% of the total populations; the forecasted young adult populations are expected to range
between 12-14% of the total populations.
0.00%
10.00%
20.00%
30.00%
40.00%
50.00%
60.00%
Youth (0-14 yrs.)
Young Adults (15-25 yrs.)
Adults (25-64 yrs.)
Senior Citizens(65 + yrs.)
FEASIBILITY STUDY 26
(SOURCE: 2012 ESRI BUSINESS ANALYST)
FIGURE 21: 2016 PROJECTED AGE DISTRIBUTIONS
Average Household Incomes: The average household income is defined by the U.S. Census as
income received each year per dwelling to members of the household age 15 years and older.
The average household income distributions for the region show that the average income in all
four drive time regions is expected to increase for the year 2016.
Generally, water parks appeal to middle and lower income residents more than upper income
residents.39 In 2011, the average household income in the United States was $51,914. 40
Generally, the incomes in the Brazoria region are average and would, therefore, be receptive
toward affordable amenities, such as water parks.41
(SOURCE: 2012 ESRI BUSINESS ANALYST)
FIGURE 22: 2011, 2016 AVERAGE HOUSEHOLD INCOMES IN BRAZORIA REGION
0.00%
10.00%
20.00%
30.00%
40.00%
50.00%
60.00%
Youth (0-14 yrs.)
Young Adults (15-25 yrs.)
Adults (25-64yrs.)
Senior Citizens(65 + yrs.)
$0
$10,000
$20,000
$30,000
$40,000
$50,000
$60,000
$70,000
20Minute
40Minute
60Minute
90Minute
2011
2016

27 BRAZORIA MARKET
3.4 TAPESTRY SEGMENTS FOR BRAZORIA
Segmentation theory suggests that people with similar lifestyles will seek others with the same
lifestyle. In other words, “like seeks like”. Tapestry segmentation is a tool developed by ESRI
Business Analyst and can be used to better understand the unique personalities of
communities. Over the past thirty years, over sixty-five segmentation groups have been
identified and are used to model how demographic communities live. Business and retail
groups most often use tapestry segments in order to understand the potential retail needs of
the community.1
The tapestry segments can be helpful in analyzing Brazoria market area demographics because
they indicate whether some demographic segments are likely to spend money on
amusement/water park vacations, whether they prefer to stay close-to-home for vacations, and
whether they will be frugal with their money.
Of the 11 tapestry segments found within a 90 minute drive time of Brazoria, seven illustrate
that the local demographics could be conducive to establishing a successful water park and/or
RV park.2 At least four segments describe their demographics as likely to attend theme parks
and water parks for vacations. These segments are: ‘Aspiring Young Families’, ‘Milk and
Cookies’, ‘Up and Coming Families’, and ‘Boomburbs’. At least three segments fit other
demographic characteristics necessary to frequent a local water park, including a strong desire
to spend time with families and/or have a strict and balanced budget. These segments are:
‘Rustbelt Traditions’, ‘Industrious Urban Fringe’, and ‘Crossroads’.
20 Minute 40 Minute 60 Minute 90 Minute
Rustbelt Traditions (8.30%)*
Crossroads (6.90%)
Up and Coming Families (13.3%)
Milk and Cookies (10.9%)
Industrious Urban Fringe (7.40%)
Milk and Cookies (6.50%) Boomburbs (8.40%)
Industrious Urban Fringe (8.6%)
Aspiring Young Families (7.10%)
Milk and Cookies (7.90%)
Up and Coming Families (8.0%)
*PERCENTAGE OF RESIDENTS IN EACH TAPESTRY SEGMENT PER DRIVE TIME REGION (SOURCE: 2012 ESRI BUSINESS ANALYST)
FIGURE 23: PERTINENT TAPESTRY DATA WITHIN 90 MINUTE DRIVE TIME
1 See Appendix A
2 See Appendix B

FEASIBILITY STUDY 28
Rustbelt Traditions: The ‘Rustbelt Traditions’ tapestry segment has the following demographic
characteristics: median age is 35.9 years old; median household income is $42,337; most
worked in manufacturing industries but do not work in service industries; more than 84% have
a high school diploma while 15% have a bachelor’s or graduate degree; live in modest single-
family homes built before 1960; these residents tend to stay close to home for entertainment
and recreation; these residents are also frugal; enjoy fishing, hunting, and racing.
Industrious Urban Fringe: The ‘Industrious Urban Fringe’ tapestry segment has the following
demographic characteristics: median household income is $40,400; high level of Hispanic origin;
most have children; home ownership rate is 62%; balance budgets carefully and are
apprehensive to spend money.
Crossroads: The ‘Crossroads’ tapestry segment has the following demographic characteristics:
median age of 33.6 years; one in five members are of Hispanic origin; median household
income is $37,185; 39% have attended college; most work in manufacturing, retail,
construction, or service industries; home ownership is 69%; children are major focus of the
‘Crossroads’ resident’s life; very frugal and careful with their money.
Aspiring Young Families: The ‘Aspiring Young Families’ tapestry segment has the following
demographic characteristics: typically live in southern and western U.S. metropolitan areas;
young married couples planning to have children or new parents; median age is 31.1 years old;
median household income is $46,275; 87% have graduated from high school while 24% hold a
bachelor’s or graduate degree; 47% own their homes; most spend discretionary income on
baby and children’s products; most likely to go to a theme park as a vacation destination.
Milk and Cookies: The ‘Milk and Cookies’ tapestry segment has the following demographic
characteristics: young and affluent couples who are just starting families; median age is 34.1
years; median household income is $57,170; 20% hold a bachelor’s or graduate degree; prefer
single-family homes in the southern United States; very likely to visit theme parks on vacation
like Six Flags or Sea World.
Up and Coming Families: The ‘Up and Coming Families’ tapestry segment has the following
demographic characteristics: median age is 32.6 years old; most of the residents are Caucasian;
20% have a bachelor’s degree; most live in single-family housing; likely to take children to
theme parks on vacations.
Boomburbs: The ‘Boomburb’s tapestry segment has the following demographic characteristics:
median age is 36.1 years old; most residents are Caucasian; 50% have a bachelor’s degree; the
median household income is $104,395; most live in homes built after 1989; many commute
long distances; family vacations are a top priority and theme parks are a popular choice.
29 BRAZORIA MARKET
3.5 TAPESTRY IMPLICATIONS FOR BRAZORIA DRIVE TIMES
Tapestry segments are tools that can help researchers get a snapshot of a local community.
This is a qualitative data method that is based on direct demographic data, such as income, age,
or ethnicity. The segments divide populations into categories that generalize what type of
consumers the residents are expected to be. In order words, tapestry segments can help
researchers understand consumer spending habits in more qualitative measures. The findings
of the tapestry segments suggest that, generally, the demographics of the Brazoria region bode
well for the support of a water park.
Members of the ‘Rustbelt Traditions’ tapestry segment, for example, tend to prefer to stay
nearer home for their vacations, suggesting that at a large segment of the population would
frequent a local water park over a far-off water park, like Galveston’s Schlitterbahn. The
‘Aspiring Young Families’, ‘Milk and Cookies’, ‘Boomburbs’, and ‘Up and Coming Families’
tapestry segments all have a high prevalence in the number of families who prefer to vacation
at theme parks and water parks. Finally, water parks can be economical getaways for many
families. The Brazoria region is home to many “budget-conscious consumers”, such as
residents found in the ‘Crossroads’ and ‘Industrious Urban Fringe’ tapestry segments.
The tapestry data suggest that a significant portion of the population located within a 90
minute drive of the theme park would frequent the water park based on their propensities to
go to water parks on vacation, stay near their homes for entertainment, and their desire to
spend their money wisely.
3.6 NEARBY AQUATIC FACILITIES
There are only two aquatic facilities within twenty miles and neither is a water park. We have
described them below in brief.
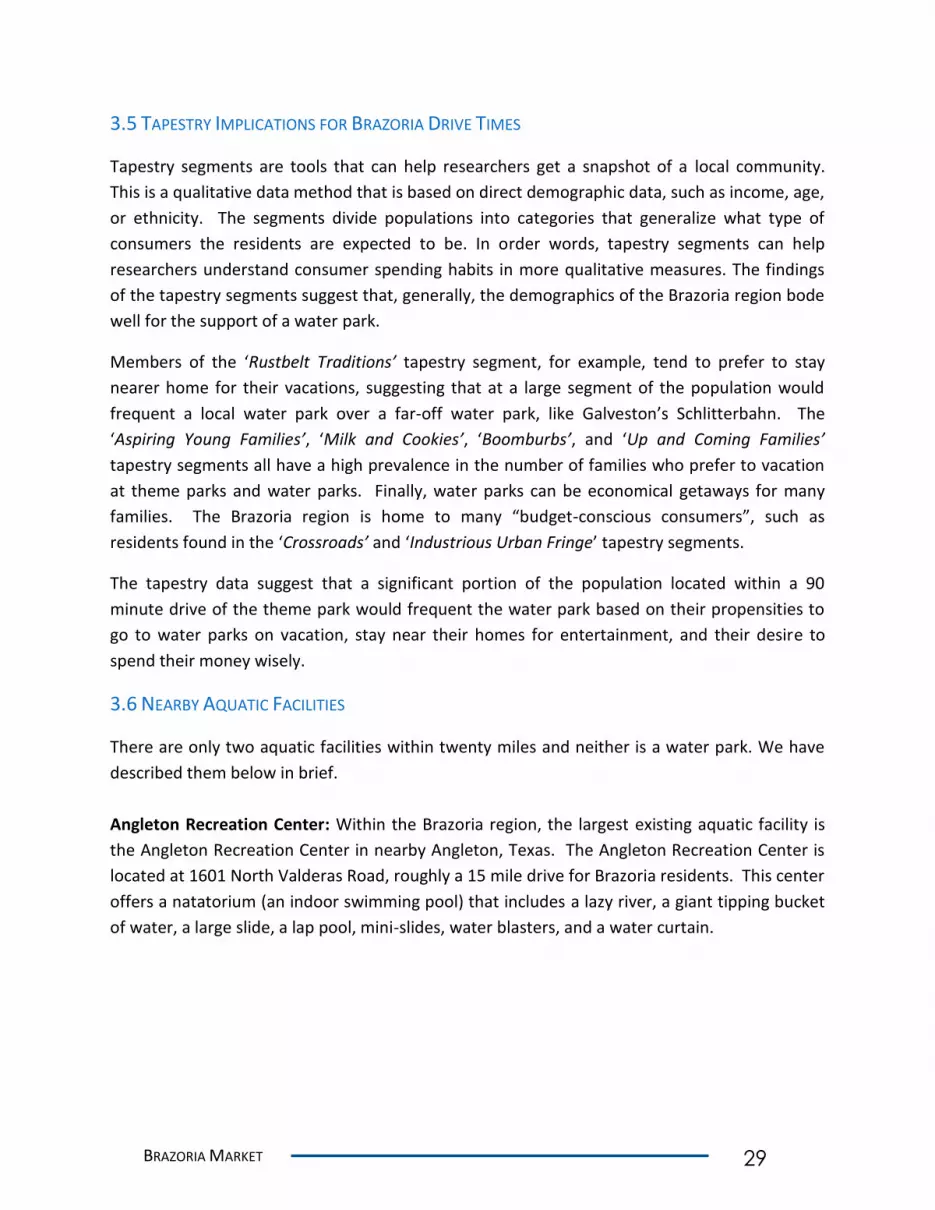
Angleton Recreation Center: Within the Brazoria region, the largest existing aquatic facility is
the Angleton Recreation Center in nearby Angleton, Texas. The Angleton Recreation Center is
located at 1601 North Valderas Road, roughly a 15 mile drive for Brazoria residents. This center
offers a natatorium (an indoor swimming pool) that includes a lazy river, a giant tipping bucket
of water, a large slide, a lap pool, mini-slides, water blasters, and a water curtain.
FEASIBILITY STUDY 30
(SOURCE: ANGLETON RECREATION CENTER)
FIGURE 24: INTERIOR PHOTO OF ANGLETON RECREATION CENTER
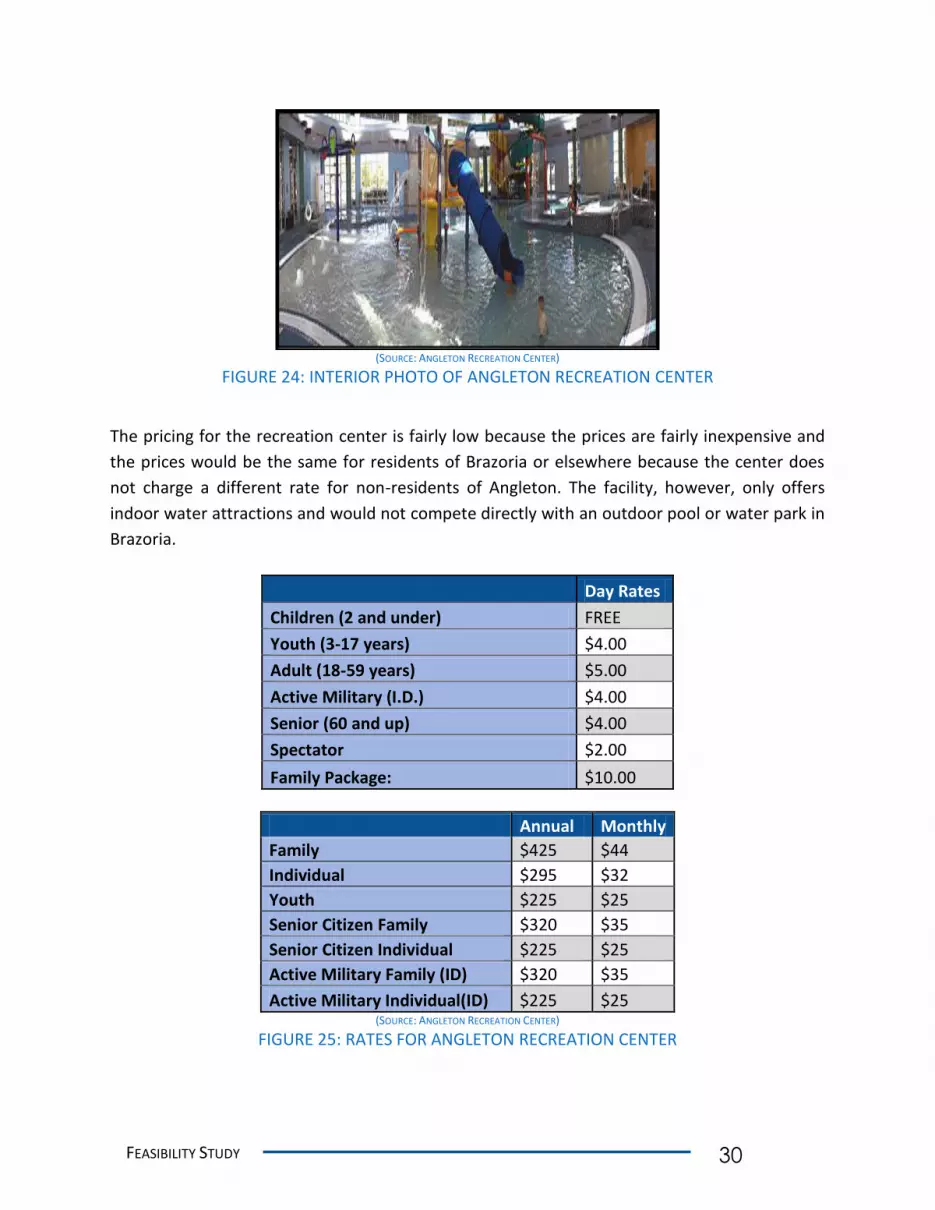
The pricing for the recreation center is fairly low because the prices are fairly inexpensive and
the prices would be the same for residents of Brazoria or elsewhere because the center does
not charge a different rate for non-residents of Angleton. The facility, however, only offers
indoor water attractions and would not compete directly with an outdoor pool or water park in
Brazoria.
Day Rates
Children (2 and under) FREE
Youth (3-17 years) $4.00
Adult (18-59 years) $5.00
Active Military (I.D.) $4.00
Senior (60 and up) $4.00
Spectator $2.00
Family Package: $10.00
Annual Monthly
Family $425 $44
Individual $295 $32
Youth $225 $25
Senior Citizen Family $320 $35
Senior Citizen Individual $225 $25
Active Military Family (ID) $320 $35
Active Military Individual(ID) $225 $25 (SOURCE: ANGLETON RECREATION CENTER)
FIGURE 25: RATES FOR ANGLETON RECREATION CENTER

31 BRAZORIA MARKET
(SOURCE: FIRST CAPITAL PARK)
FIGURE 26: FIRST CAPITAL PARK
First Capital Park: First Capital Park is located in nearby West Columbia, Texas— roughly a 10
mile trip for residents of Brazoria. First Capital Park is located at 1300 North 13th Street. This
facility offers many outdoor activities, such as walking trails, fishing, softball, volleyball, and
soccer. The facility houses a large indoor swimming pool. The facility also offers swim lessons,
water aerobics courses, and areas for parties.
COST AGE
$1.00 SPECTATORS
$1.00 6 YRS & UNDER
$2.50 7 YRS TO 17 YRS
$3.00 18 YRS & OVER
$1.50 DAYCARES/SENIOR CITIZENS 60+ (SOURCE: FIRST CAPITAL PARK)
FIGURE 27: FIRST CAPITAL PARK DAILY RATES
Often, the presence of other swimming facilities in an area can actually be a boon to a local
water park. 42 NRH20, a municipally owned water park in North Richland Hills, Texas has found
that the presence of swimming facilities increases the chance of success for a water park
because the swimming facilities expose the residents to swimming and will make them more
likely to frequent a water park.
FEASIBILITY STUDY 32
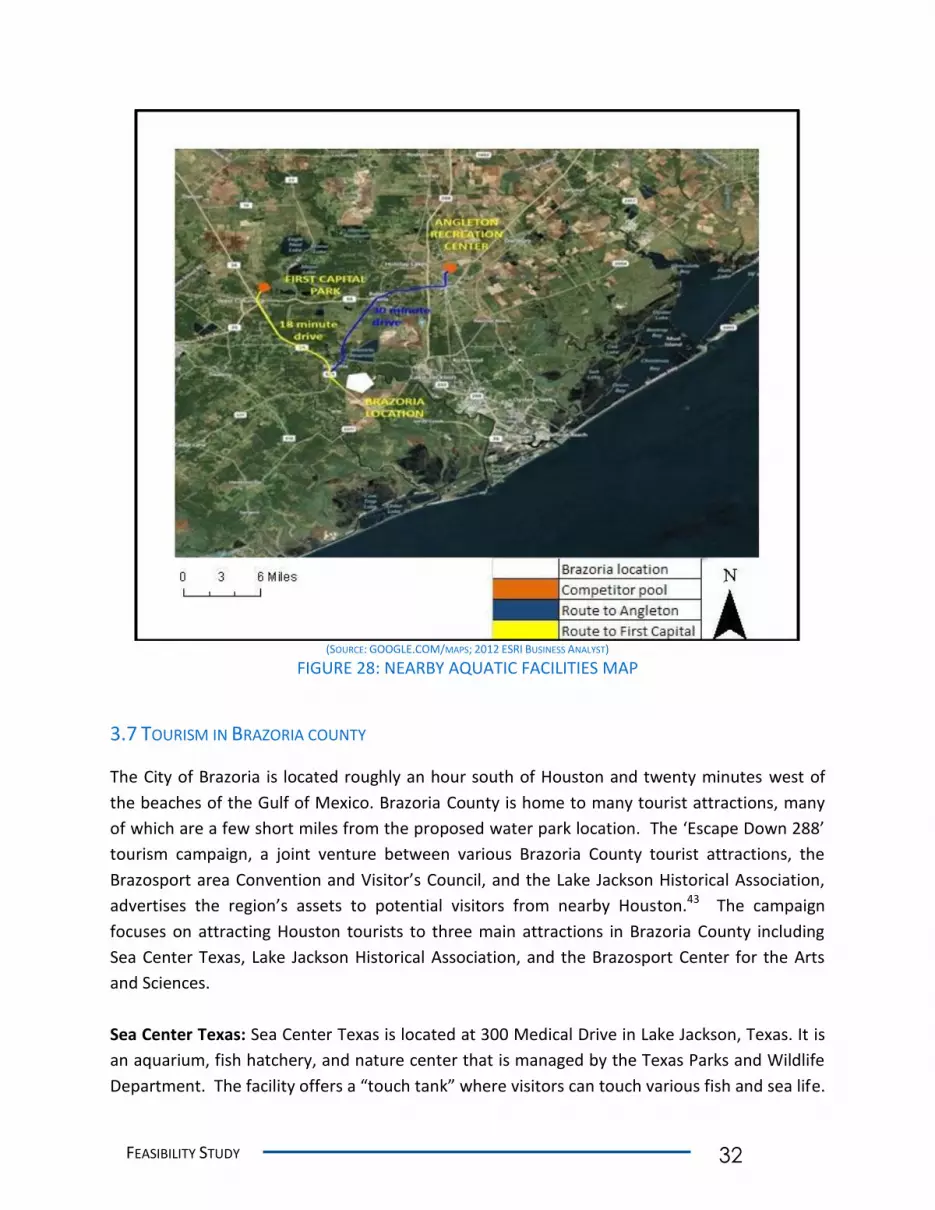
(SOURCE: GOOGLE.COM/MAPS; 2012 ESRI BUSINESS ANALYST)
FIGURE 28: NEARBY AQUATIC FACILITIES MAP
3.7 TOURISM IN BRAZORIA COUNTY
The City of Brazoria is located roughly an hour south of Houston and twenty minutes west of
the beaches of the Gulf of Mexico. Brazoria County is home to many tourist attractions, many
of which are a few short miles from the proposed water park location. The ‘Escape Down 288’
tourism campaign, a joint venture between various Brazoria County tourist attractions, the
Brazosport area Convention and Visitor’s Council, and the Lake Jackson Historical Association,
advertises the region’s assets to potential visitors from nearby Houston.43 The campaign
focuses on attracting Houston tourists to three main attractions in Brazoria County including
Sea Center Texas, Lake Jackson Historical Association, and the Brazosport Center for the Arts
and Sciences.
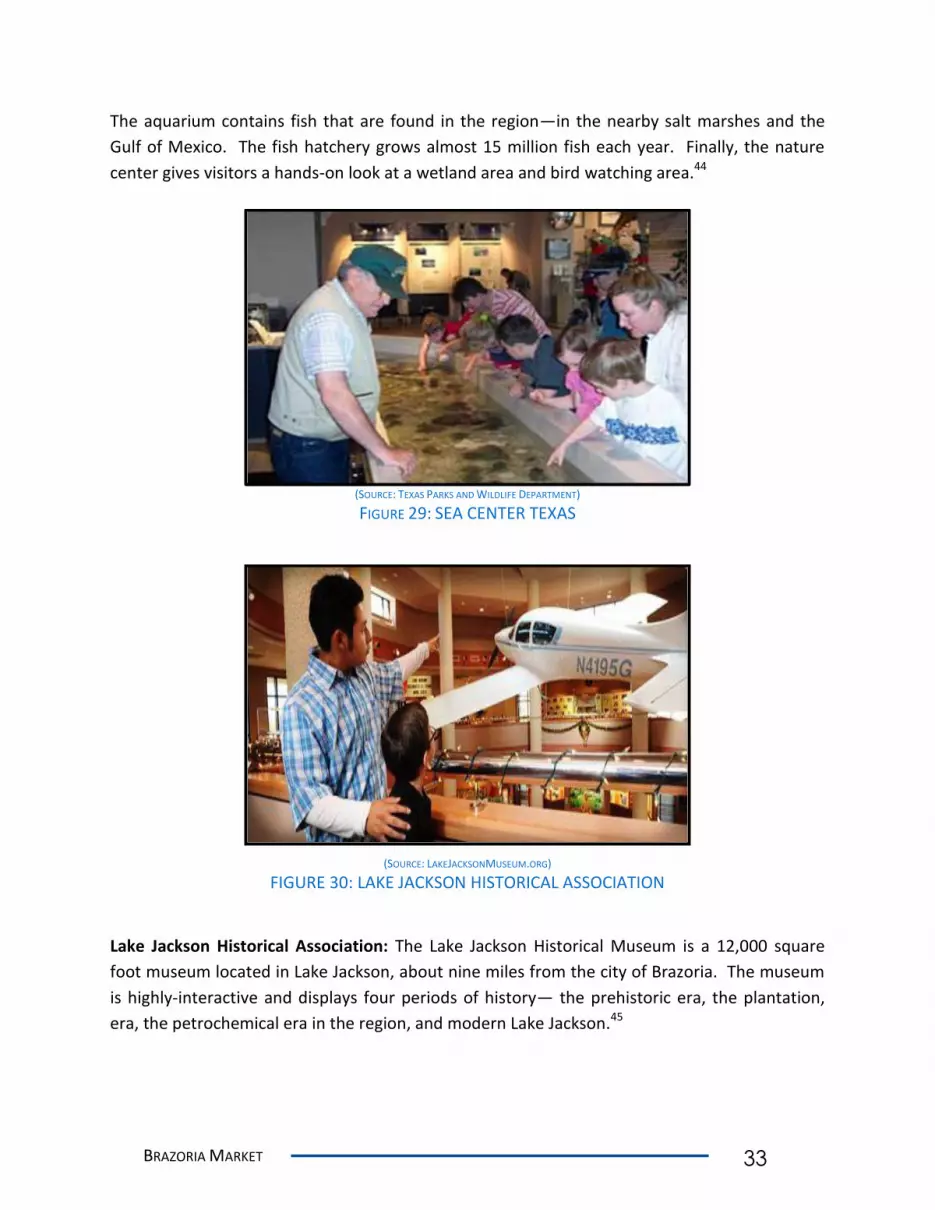
Sea Center Texas: Sea Center Texas is located at 300 Medical Drive in Lake Jackson, Texas. It is
an aquarium, fish hatchery, and nature center that is managed by the Texas Parks and Wildlife
Department. The facility offers a “touch tank” where visitors can touch various fish and sea life.
33 BRAZORIA MARKET
The aquarium contains fish that are found in the region—in the nearby salt marshes and the
Gulf of Mexico. The fish hatchery grows almost 15 million fish each year. Finally, the nature
center gives visitors a hands-on look at a wetland area and bird watching area.44
(SOURCE: TEXAS PARKS AND WILDLIFE DEPARTMENT) FIGURE 29: SEA CENTER TEXAS
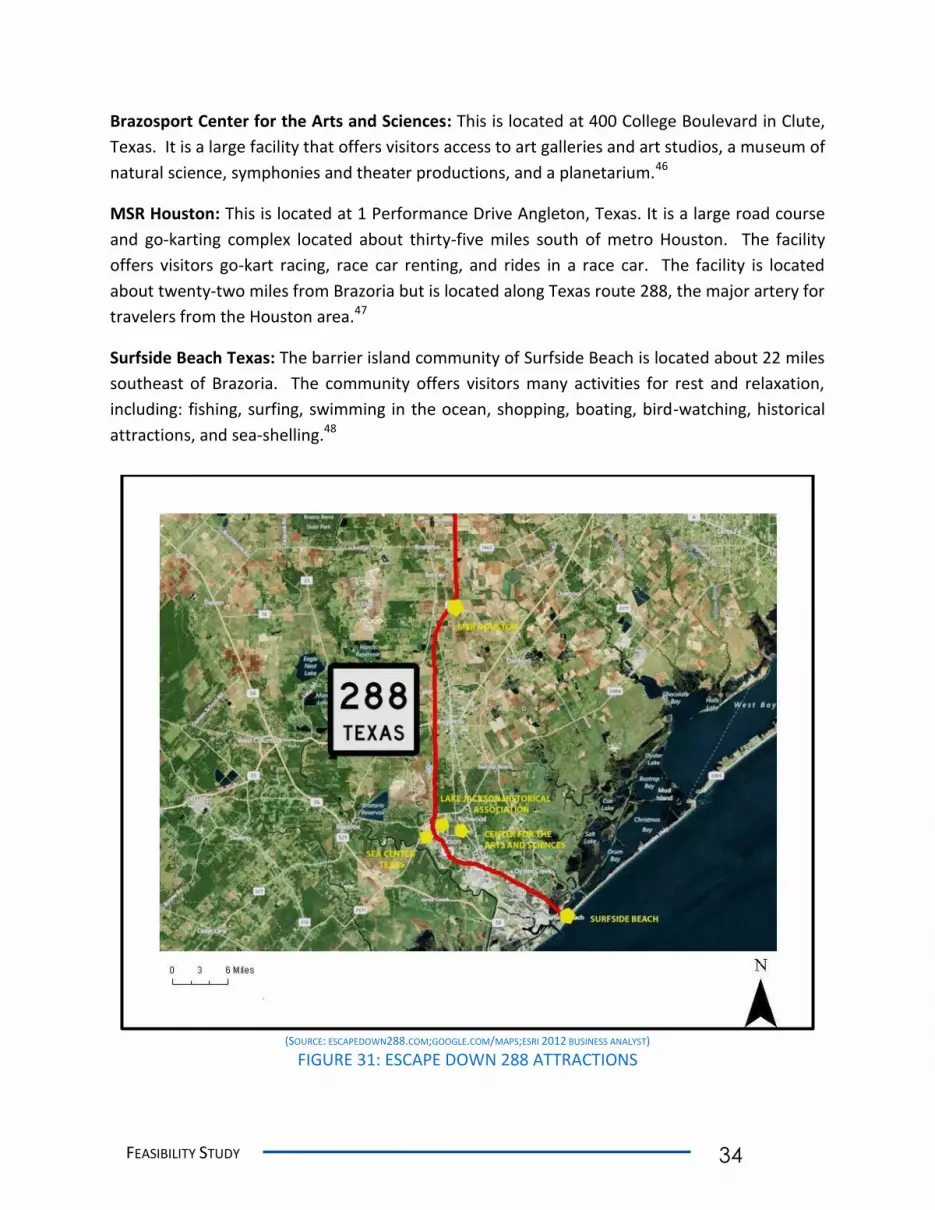
(SOURCE: LAKEJACKSONMUSEUM.ORG)
FIGURE 30: LAKE JACKSON HISTORICAL ASSOCIATION
Lake Jackson Historical Association: The Lake Jackson Historical Museum is a 12,000 square
foot museum located in Lake Jackson, about nine miles from the city of Brazoria. The museum
is highly-interactive and displays four periods of history— the prehistoric era, the plantation,
era, the petrochemical era in the region, and modern Lake Jackson.45
FEASIBILITY STUDY 34
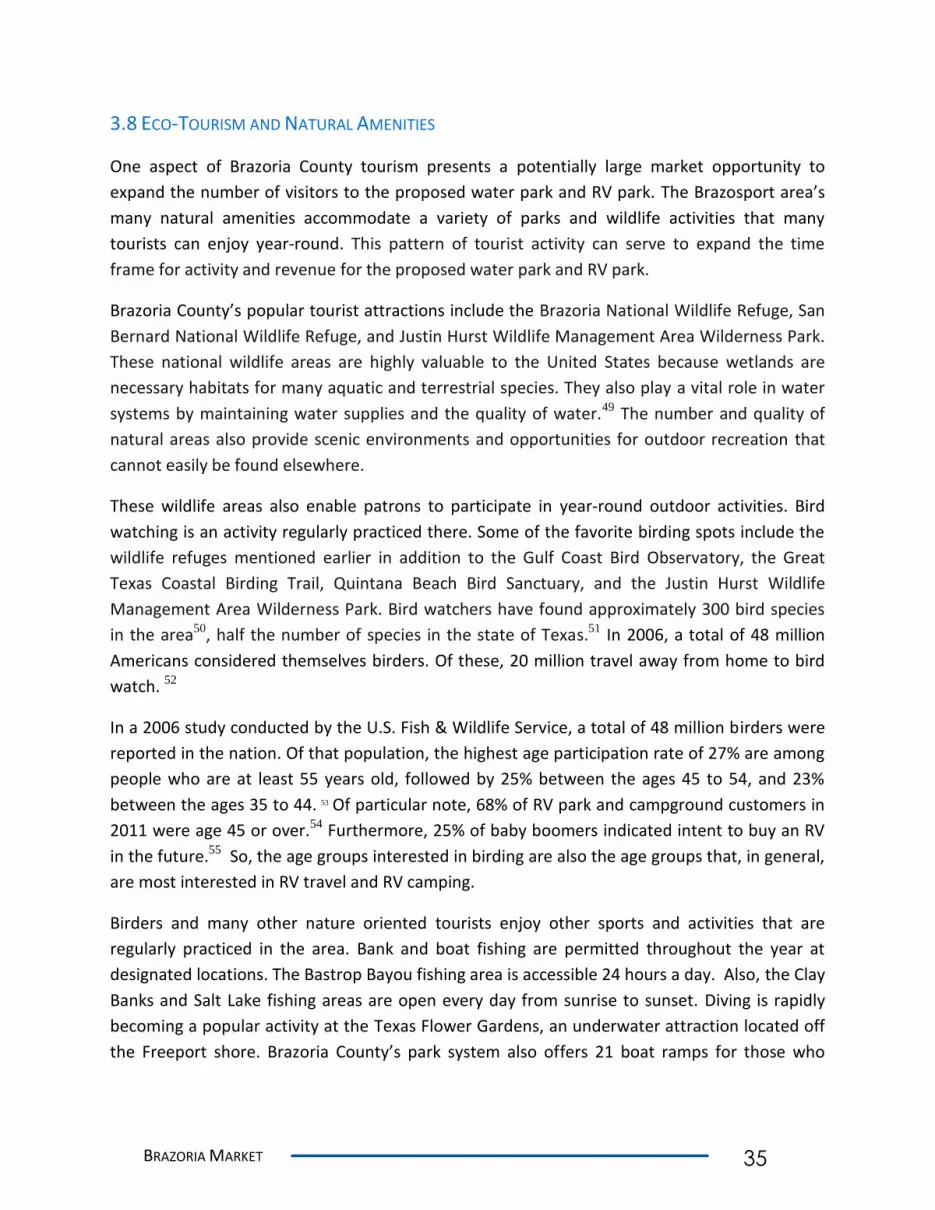
Brazosport Center for the Arts and Sciences: This is located at 400 College Boulevard in Clute,
Texas. It is a large facility that offers visitors access to art galleries and art studios, a museum of
natural science, symphonies and theater productions, and a planetarium.46
MSR Houston: This is located at 1 Performance Drive Angleton, Texas. It is a large road course
and go-karting complex located about thirty-five miles south of metro Houston. The facility
offers visitors go-kart racing, race car renting, and rides in a race car. The facility is located
about twenty-two miles from Brazoria but is located along Texas route 288, the major artery for
travelers from the Houston area.47
Surfside Beach Texas: The barrier island community of Surfside Beach is located about 22 miles
southeast of Brazoria. The community offers visitors many activities for rest and relaxation,
including: fishing, surfing, swimming in the ocean, shopping, boating, bird-watching, historical
attractions, and sea-shelling.48
(SOURCE: ESCAPEDOWN288.COM;GOOGLE.COM/MAPS;ESRI 2012 BUSINESS ANALYST)
FIGURE 31: ESCAPE DOWN 288 ATTRACTIONS
35 BRAZORIA MARKET
3.8 ECO-TOURISM AND NATURAL AMENITIES
One aspect of Brazoria County tourism presents a potentially large market opportunity to
expand the number of visitors to the proposed water park and RV park. The Brazosport area’s
many natural amenities accommodate a variety of parks and wildlife activities that many
tourists can enjoy year-round. This pattern of tourist activity can serve to expand the time
frame for activity and revenue for the proposed water park and RV park.
Brazoria County’s popular tourist attractions include the Brazoria National Wildlife Refuge, San
Bernard National Wildlife Refuge, and Justin Hurst Wildlife Management Area Wilderness Park.
These national wildlife areas are highly valuable to the United States because wetlands are
necessary habitats for many aquatic and terrestrial species. They also play a vital role in water
systems by maintaining water supplies and the quality of water.49 The number and quality of
natural areas also provide scenic environments and opportunities for outdoor recreation that
cannot easily be found elsewhere.
These wildlife areas also enable patrons to participate in year-round outdoor activities. Bird
watching is an activity regularly practiced there. Some of the favorite birding spots include the
wildlife refuges mentioned earlier in addition to the Gulf Coast Bird Observatory, the Great
Texas Coastal Birding Trail, Quintana Beach Bird Sanctuary, and the Justin Hurst Wildlife
Management Area Wilderness Park. Bird watchers have found approximately 300 bird species
in the area50, half the number of species in the state of Texas.51 In 2006, a total of 48 million
Americans considered themselves birders. Of these, 20 million travel away from home to bird
watch. 52
In a 2006 study conducted by the U.S. Fish & Wildlife Service, a total of 48 million birders were
reported in the nation. Of that population, the highest age participation rate of 27% are among
people who are at least 55 years old, followed by 25% between the ages 45 to 54, and 23%
between the ages 35 to 44. 53 Of particular note, 68% of RV park and campground customers in
2011 were age 45 or over.54 Furthermore, 25% of baby boomers indicated intent to buy an RV
in the future.55 So, the age groups interested in birding are also the age groups that, in general,
are most interested in RV travel and RV camping.
Birders and many other nature oriented tourists enjoy other sports and activities that are
regularly practiced in the area. Bank and boat fishing are permitted throughout the year at
designated locations. The Bastrop Bayou fishing area is accessible 24 hours a day. Also, the Clay
Banks and Salt Lake fishing areas are open every day from sunrise to sunset. Diving is rapidly
becoming a popular activity at the Texas Flower Gardens, an underwater attraction located off
the Freeport shore. Brazoria County’s park system also offers 21 boat ramps for those who

FEASIBILITY STUDY 36
enjoy water sports.56 Patrons can also participate in many other activities including— but not
limited to— camping, golf, and tennis at their many tourist attractions.
A water park and RV park offer affordable accommodations and family friendly outdoor
activities that can appeal to the “eco” or nature tourist market. Younger family members or
spouses who may not participate in birding, fishing, hunting, or diving can spend their day at
the Waterpark.
3.9 BUSINESS ANALYSIS, FUTURE TRENDS
Projecting potential business that will serve patrons at the water park should be based on
current demographics, existing/complimentary businesses, and categories of clients that
patronize these facilities. This information is examined first at city level then within an
estimated market threshold of approximately twenty miles (covering the nearest urbanized
area).
Unlike golf course and country clubs, water parks do not necessarily attract a large
number of clients who can be defined as wealthy. Water parks tend to appeal to blue
collar individuals more than white collar individuals.57 The most prevalent clients are
preteens and teenage cohorts. These may be individuals or families.
Currently the city has mainly domestic small businesses that cater to household service.
There are some car dealerships and medical services which might be registering the
highest sales volume.
Analysis: Due to the relatively low population of Brazoria, larger businesses that locate in the
city will rely on residents and nonresidents as customers. Brazoria has a population of 3,01958
with at least 48% of the household earning between $50,000- $100,000 per annum.
When the data is examined, however, in aggregate within a 20 mile radius (which is a
conservative estimate for a market range for the water park); there are endless possibilities for
businesses, predominantly in the service sector. The area within 20 miles has a population of
132,000 that does not overlap with the city of Houston boundaries. According to ESRI Business
Analyst, by 2016 the spending potential on entertainment and recreation is projected at
approximately $142 million, while food industries will account for $338 million, of which about
41% will be spent on dining out. In addition within a 20 mile radius, 48% of the population has
income ranging from$50,000- 100,000. This includes the cities of Lake Jackson and Freeport,
which could present immediate competition to businesses in the city of Brazoria.59
37 BRAZORIA MARKET
The above finding may suggest ample opportunity to support medium sized businesses that
complement the waterpark.
An inventory of existing venues of recreation, hospitality and food and beverage service within
a twenty mile radius reveals a Golf center, one Bed and Breakfast, and three RV parks. There
are also at least ten fast food restaurants within a five to ten mile radius. An examination of
Lake Jackson and Brazos Freeport shows that there is a higher concentration of the
aforementioned businesses which may present competition. Offering these kinds of
restaurants, accommodations, and recreational activities in close proximity to the water park
may offer some advantages to those businesses, however.
Findings:
With complementarity as a key criterion in developing synergy between businesses,
initial analysis suggests coupling entertainment and food services industries. These are
businesses that could potentially retain an anchor within the city in and off season.
While there may be already several food and beverage service competitors, the key to
attracting new clients is focusing on unique restaurants and entertainment venues
Secondly with demographic characteristics in mind, complimentary businesses could
include bike and skate parks in addition to urban camp sites with amphitheaters for live
music. Additional recreation could include mini-golf, laser tag, paintball, and
entertainment venues that offer services like Dave and Busters ©.
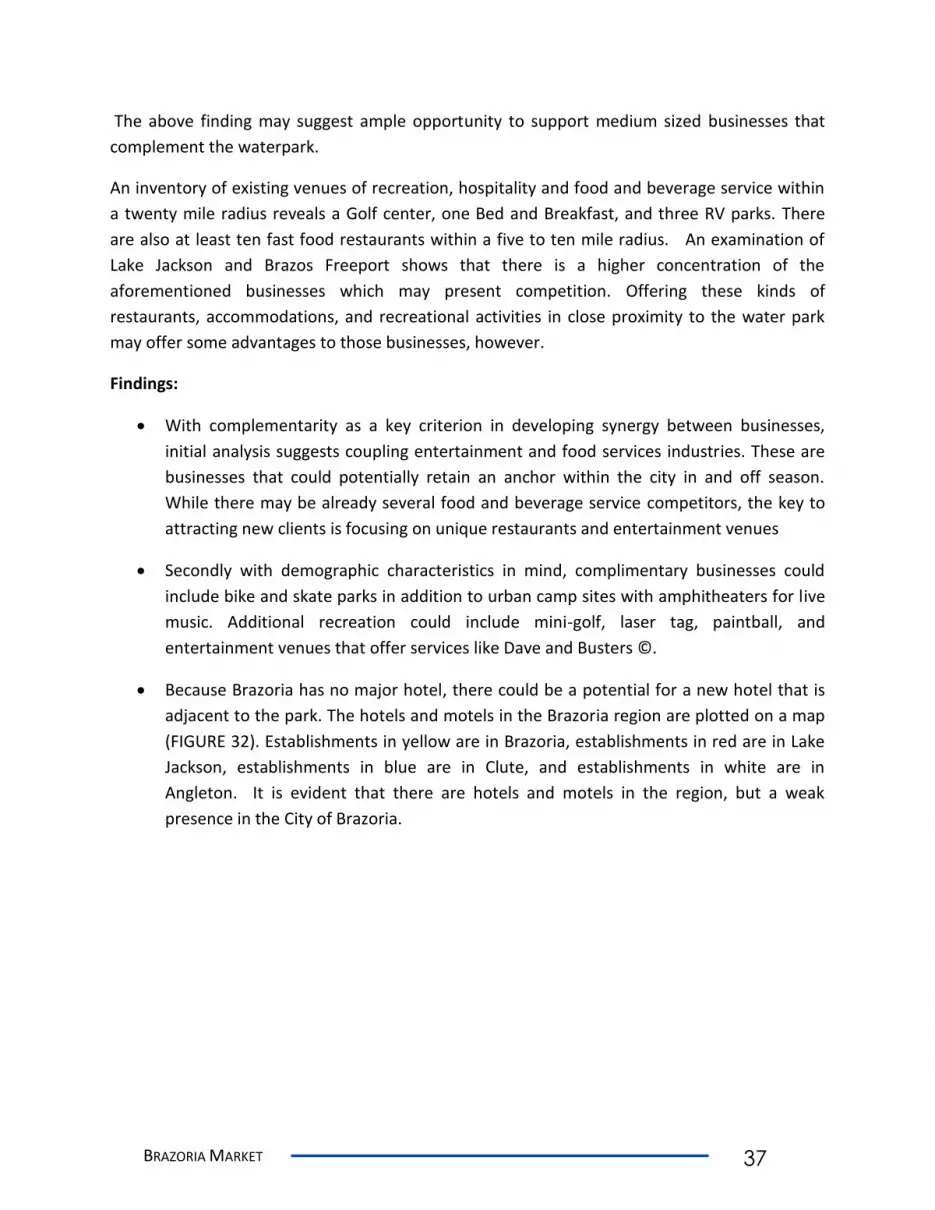
Because Brazoria has no major hotel, there could be a potential for a new hotel that is
adjacent to the park. The hotels and motels in the Brazoria region are plotted on a map
(FIGURE 32). Establishments in yellow are in Brazoria, establishments in red are in Lake
Jackson, establishments in blue are in Clute, and establishments in white are in
Angleton. It is evident that there are hotels and motels in the region, but a weak
presence in the City of Brazoria.
FEASIBILITY STUDY 38
(SOURCE: GOOGLE.COM/MAPS; ESRI BUSINESS ANALYST 2011)
FIGURE 32: HOTELS IN BRAZORIA REGION
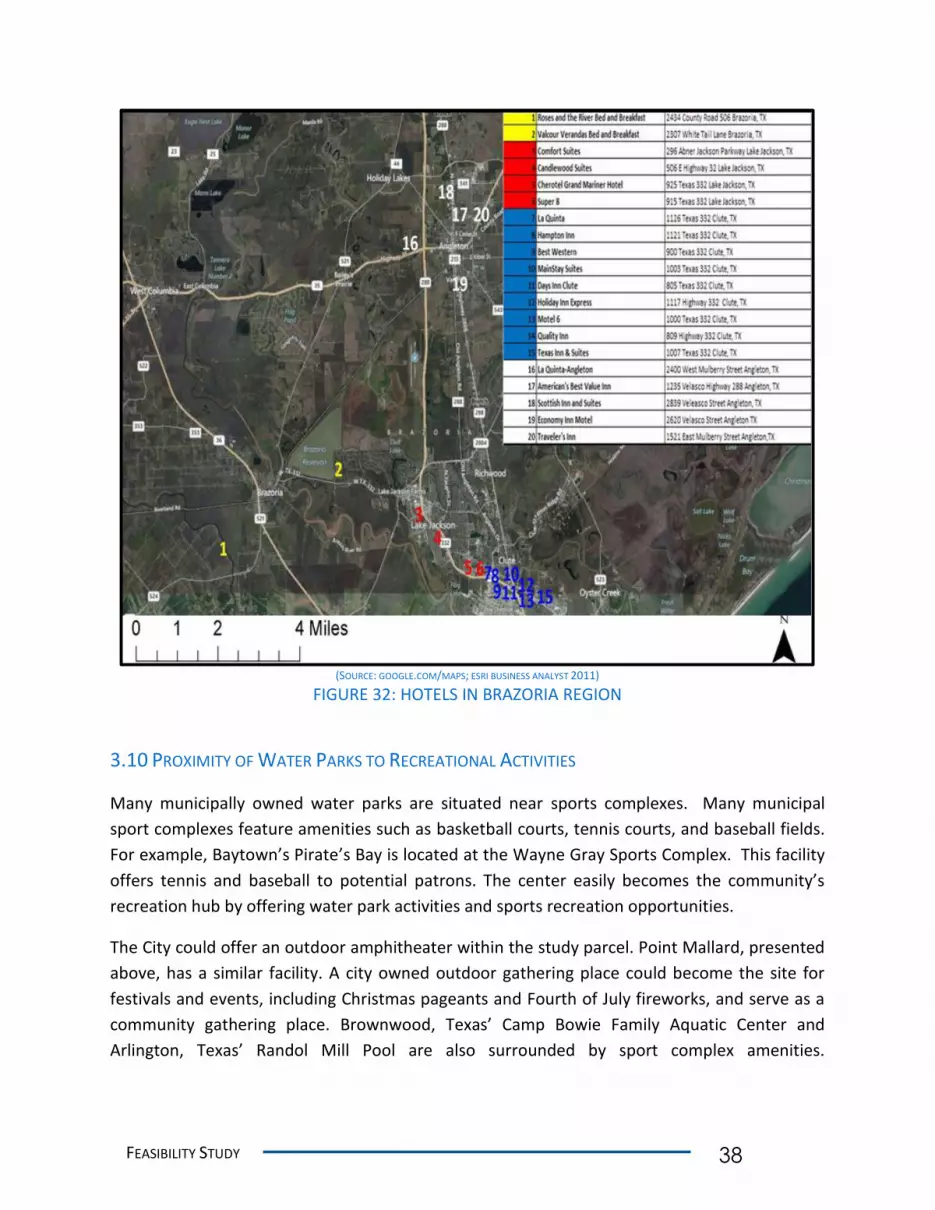
3.10 PROXIMITY OF WATER PARKS TO RECREATIONAL ACTIVITIES
Many municipally owned water parks are situated near sports complexes. Many municipal
sport complexes feature amenities such as basketball courts, tennis courts, and baseball fields.
For example, Baytown’s Pirate’s Bay is located at the Wayne Gray Sports Complex. This facility
offers tennis and baseball to potential patrons. The center easily becomes the community’s
recreation hub by offering water park activities and sports recreation opportunities.
The City could offer an outdoor amphitheater within the study parcel. Point Mallard, presented
above, has a similar facility. A city owned outdoor gathering place could become the site for
festivals and events, including Christmas pageants and Fourth of July fireworks, and serve as a
community gathering place. Brownwood, Texas’ Camp Bowie Family Aquatic Center and
Arlington, Texas’ Randol Mill Pool are also surrounded by sport complex amenities.
39 BRAZORIA MARKET
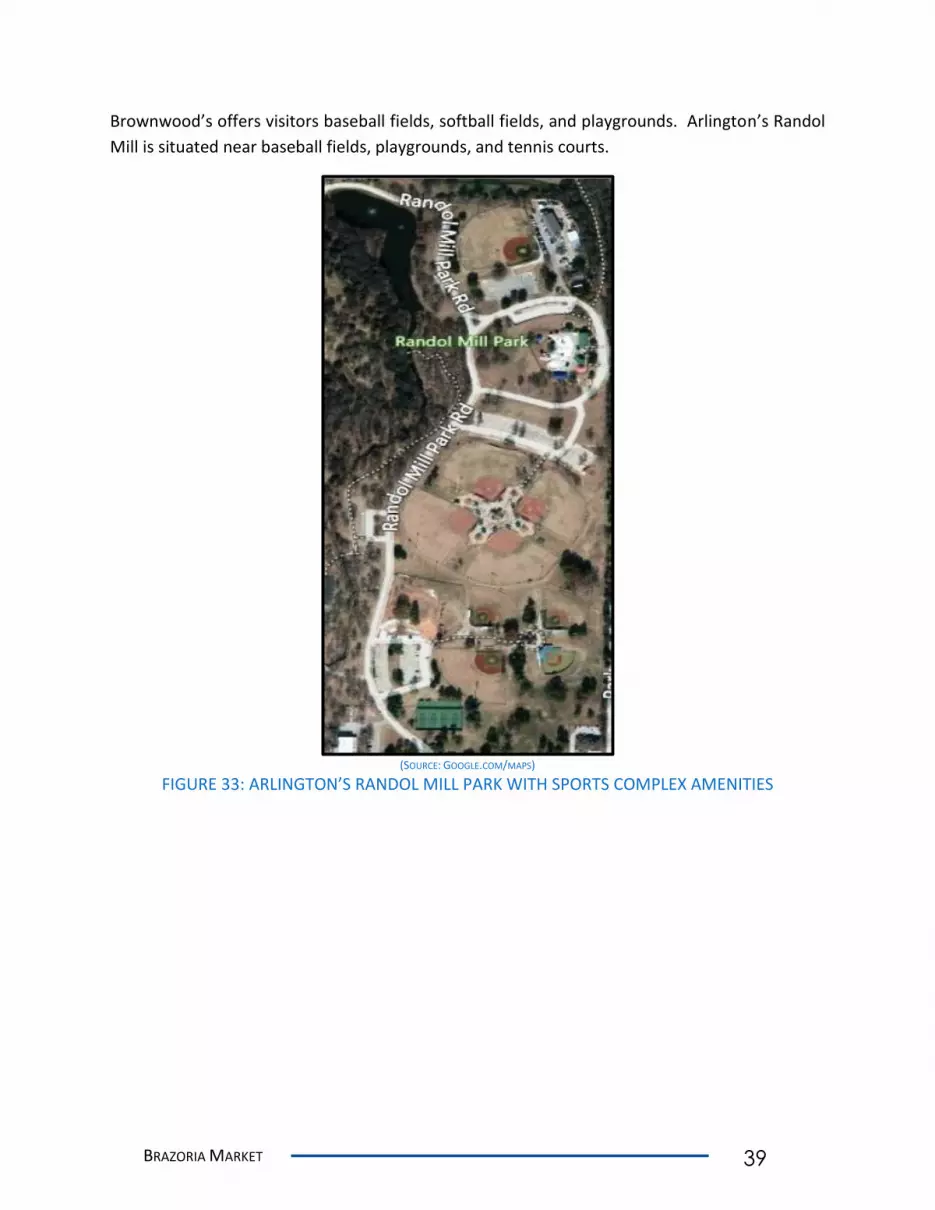
Brownwood’s offers visitors baseball fields, softball fields, and playgrounds. Arlington’s Randol
Mill is situated near baseball fields, playgrounds, and tennis courts.
(SOURCE: GOOGLE.COM/MAPS)
FIGURE 33: ARLINGTON’S RANDOL MILL PARK WITH SPORTS COMPLEX AMENITIES

FEASIBILITY STUDY 40
CHAPTER 4: FINANCIAL IMPACT
Financial feasibility in the waterpark industry can be expressed in three ways: recapture ratio,
net operating income, and amount of supportable debt. Recapture ratio represents the
percentage of operating expenses that are covered by generated revenue. Net operating
income is surplus or loss of operating revenue minus operating costs. A supportable debt
calculation provides the amount of debt that can be serviced through the surplus of operating
revenue over operating costs.
Four determining factors affect the profitability of a water park. Based on the three pro-forma
visitor assumptions, the water park would in its first year:
Attendance: attract between 49,000 to 75,000 visitors
Per Capita Spending: generate between $881,000 to $1,400,000 in revenue, based on
projected per capita spending of $18.15
Operating Expenses: incur between $799,000 and $832,000 in operating expenses,
producing net operating income of between $81,000 to $538,000
Development Costs: cost between $9,000,000 to $9,400,000 to construct
These are discussed in below in detail, along with pertinent assumptions for a tourist attracting
water park.
4.1 CAPACITY ANALYSIS
Capacity analysis is crucial to estimating attendance. As previously discussed, the size and
number of amenities a water park offers determines its attractiveness in terms of average time
spent in the park and the distance potential customers are willing to travel to visit the
waterpark. In terms of capacity, it is assumed that recreational swimmers require a minimum of
25 square feet of pool area per person.60 Considering the average projected stay, and an
average 10 hour park open time, the visitors in the park will turn over 2.5 times in an average
day.

FINANCIAL IMPACT 41
LARGE TOURIST
ATTRACTING WATERPARK
SQUARE FOOTAGE OF
POOL AREA 14,000
CAPACITY AT 25
SF./PERSON 560
DAILY TURNOVER1 2.5
DAILY CAPACITY 1,400 1 Assumes 4 hour average stay
FIGURE 34: CAPACITY
4.2 PROJECTED ATTENDANCE
In order to develop an estimate of potential attendance at a Brazoria waterpark, it is necessary
to know two factors: market population and market penetration rates. Market penetration is
defined as the population participation multiplied by the attendance frequency. Market
penetration estimates and resultant attendance projections are presented below.
Population figures are presented for drive time rings up to 60 minutes. Visitors from outside the
60 minute drive time are estimated based upon research of attendance at other Brazoria area
attractions. While penetration rates decay rapidly over distance from a waterpark, the estimate
for tourist attendance is thus extremely conservative.
Note that a 90 minute drive time puts 5,261,925 people within reach of a waterpark in Brazoria.
MARKET POPULATION 2012 2013 2014 2015 2016
0 - 20 MINUTES 82,222 83,200 84,189 85,191 86,088
20- 40 MINUTES 95,370 96,431 97,505 98,590 99,569
40 - 60 MINUTES 1,113,238 1,138,324 1,163,956 1,190,147 1,211,441
TOURIST POPULATION* 75,000 76,898 78,843 80,838 82,883
*Tourist population estimates are generated by taking established visitor numbers at Brazoria area attractions and adjusting for population
increase over time.
FIGURE 35: MARKET POPULATION BY DRIVE TIME
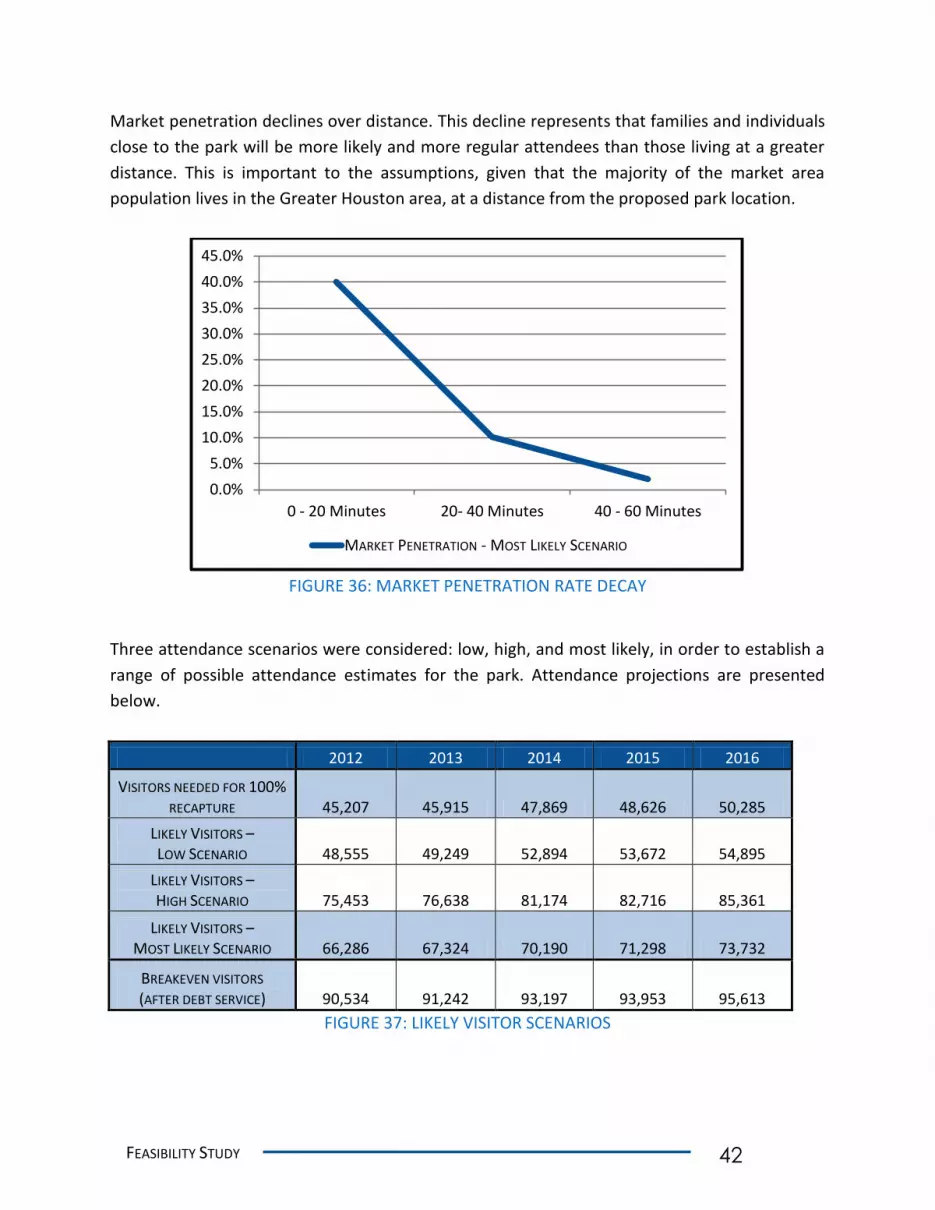
FEASIBILITY STUDY 42
Market penetration declines over distance. This decline represents that families and individuals
close to the park will be more likely and more regular attendees than those living at a greater
distance. This is important to the assumptions, given that the majority of the market area
population lives in the Greater Houston area, at a distance from the proposed park location.
FIGURE 36: MARKET PENETRATION RATE DECAY
Three attendance scenarios were considered: low, high, and most likely, in order to establish a
range of possible attendance estimates for the park. Attendance projections are presented
below.
2012 2013 2014 2015 2016
VISITORS NEEDED FOR 100%
RECAPTURE 45,207 45,915 47,869 48,626 50,285
LIKELY VISITORS – LOW SCENARIO 48,555 49,249 52,894 53,672 54,895
LIKELY VISITORS – HIGH SCENARIO 75,453 76,638 81,174 82,716 85,361
LIKELY VISITORS – MOST LIKELY SCENARIO 66,286 67,324 70,190 71,298 73,732
BREAKEVEN VISITORS (AFTER DEBT SERVICE) 90,534 91,242 93,197 93,953 95,613
FIGURE 37: LIKELY VISITOR SCENARIOS
0.0%
5.0%
10.0%
15.0%
20.0%
25.0%
30.0%
35.0%
40.0%
45.0%
0 - 20 Minutes 20- 40 Minutes 40 - 60 Minutes
MARKET PENETRATION - MOST LIKELY SCENARIO
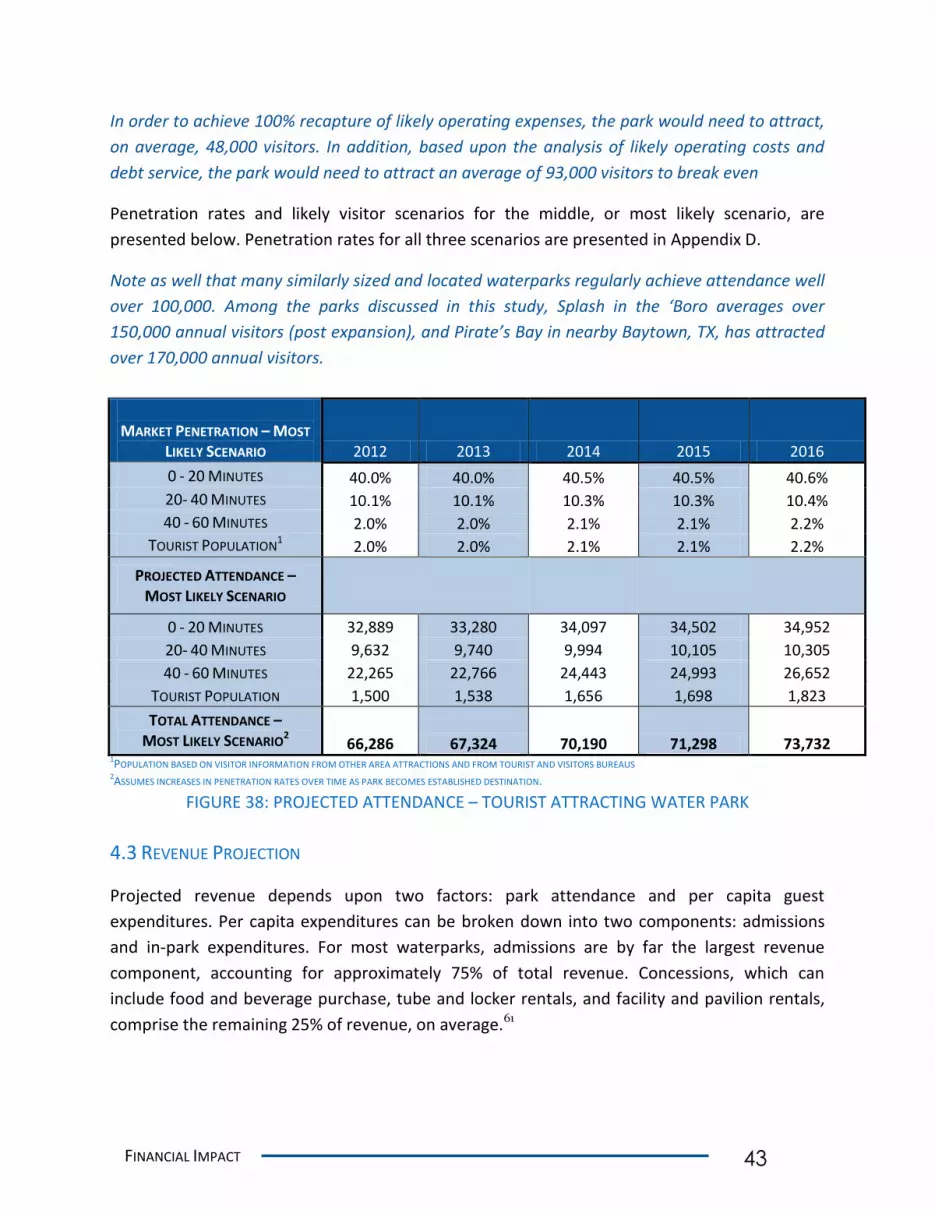
FINANCIAL IMPACT 43
In order to achieve 100% recapture of likely operating expenses, the park would need to attract,
on average, 48,000 visitors. In addition, based upon the analysis of likely operating costs and
debt service, the park would need to attract an average of 93,000 visitors to break even
Penetration rates and likely visitor scenarios for the middle, or most likely scenario, are
presented below. Penetration rates for all three scenarios are presented in Appendix D.
Note as well that many similarly sized and located waterparks regularly achieve attendance well
over 100,000. Among the parks discussed in this study, Splash in the ‘Boro averages over
150,000 annual visitors (post expansion), and Pirate’s Bay in nearby Baytown, TX, has attracted
over 170,000 annual visitors.
MARKET PENETRATION – MOST
LIKELY SCENARIO 2012 2013 2014 2015 2016
0 - 20 MINUTES 40.0% 40.0% 40.5% 40.5% 40.6%
20- 40 MINUTES 10.1% 10.1% 10.3% 10.3% 10.4%
40 - 60 MINUTES 2.0% 2.0% 2.1% 2.1% 2.2%
TOURIST POPULATION1
2.0% 2.0% 2.1% 2.1% 2.2%
PROJECTED ATTENDANCE –
MOST LIKELY SCENARIO
0 - 20 MINUTES 32,889 33,280 34,097 34,502 34,952
20- 40 MINUTES 9,632 9,740 9,994 10,105 10,305
40 - 60 MINUTES 22,265 22,766 24,443 24,993 26,652
TOURIST POPULATION 1,500 1,538 1,656 1,698 1,823
TOTAL ATTENDANCE – MOST LIKELY SCENARIO
2 66,286 67,324 70,190 71,298 73,732
1POPULATION BASED ON VISITOR INFORMATION FROM OTHER AREA ATTRACTIONS AND FROM TOURIST AND VISITORS BUREAUS 2ASSUMES INCREASES IN PENETRATION RATES OVER TIME AS PARK BECOMES ESTABLISHED DESTINATION.
FIGURE 38: PROJECTED ATTENDANCE – TOURIST ATTRACTING WATER PARK
4.3 REVENUE PROJECTION
Projected revenue depends upon two factors: park attendance and per capita guest
expenditures. Per capita expenditures can be broken down into two components: admissions
and in-park expenditures. For most waterparks, admissions are by far the largest revenue
component, accounting for approximately 75% of total revenue. Concessions, which can
include food and beverage purchase, tube and locker rentals, and facility and pavilion rentals,
comprise the remaining 25% of revenue, on average.61

FEASIBILITY STUDY 44
In general, per capita spending in a waterpark increases from $4 to $5 per hour.62 Therefore,
Brazoria’s proposed tourist attracting water park, which seeks to achieve a four hour average
length of stay, should target per capita revenue at between $16 and $20. As discussed in the
market area segment above, park size and length of stay influence the drawing power and
perceived customer value of a waterpark.
Admission price for the proposed larger facility is set at the general admission adult price of
$17.00. However, achieving the highest attendance necessitates discounting. Therefore, lower
admission fees for children and season passes would also be available. Figure 39 shows the
possible admission rates, projected attendance distribution, projected in park concession
revenue, and resultant per capita revenue.
CATEGORY RATE % OF
ADMISSIONS PER UNIT
GENERAL ADMISSION ADULT $ 17 50% $ 8.50
CHILDREN $ 12 40% $ 4.80
ANNUAL PASS INDIVIDUAL $ 85 10% $ 0.31
SUBTOTAL
100% $ 13.61
FOOD/MERCHANDIZE/OTHER
$ 4.54
TOTAL PER CAPITA
$ 18.15
FIGURE 39: PER CAPITA REVENUE ASSUMPTIONS
Revenue projections are a result of per capita expenditures multiplied by projected park
visitors.
2012 2013 2014 2015 2016
PROJECTED REVENUE: LOW SCENARIO $881,425 $894,029 $960,197 $974,314 $996,505
PROJECTED REVENUE: HIGH SCENARIO $1,369,702 $1,391,211 $1,473,552 $1,501,555 $1,549,570
PROJECTED REVENUE: MOST LIKELY SCENARIO $1,203,291 $1,222,136 $1,274,160 $1,294,287 $1,338,468
FIGURE 40: REVENUE PROJECTIONS – THREE SCENARIOS
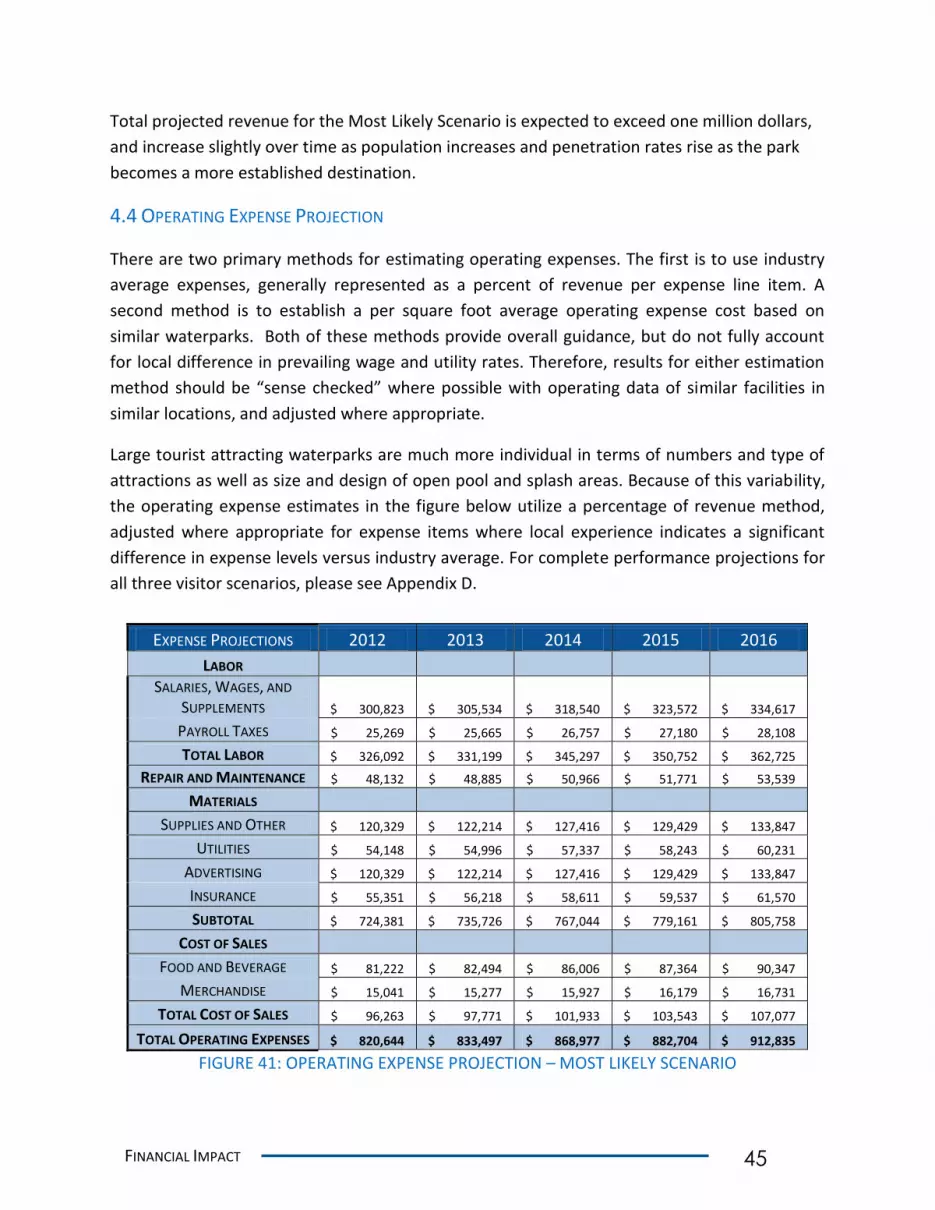
FINANCIAL IMPACT 45
Total projected revenue for the Most Likely Scenario is expected to exceed one million dollars,
and increase slightly over time as population increases and penetration rates rise as the park
becomes a more established destination.
4.4 OPERATING EXPENSE PROJECTION
There are two primary methods for estimating operating expenses. The first is to use industry
average expenses, generally represented as a percent of revenue per expense line item. A
second method is to establish a per square foot average operating expense cost based on
similar waterparks. Both of these methods provide overall guidance, but do not fully account
for local difference in prevailing wage and utility rates. Therefore, results for either estimation
method should be “sense checked” where possible with operating data of similar facilities in
similar locations, and adjusted where appropriate.
Large tourist attracting waterparks are much more individual in terms of numbers and type of
attractions as well as size and design of open pool and splash areas. Because of this variability,
the operating expense estimates in the figure below utilize a percentage of revenue method,
adjusted where appropriate for expense items where local experience indicates a significant
difference in expense levels versus industry average. For complete performance projections for
all three visitor scenarios, please see Appendix D.
EXPENSE PROJECTIONS 2012 2013 2014 2015 2016
LABOR
SALARIES, WAGES, AND
SUPPLEMENTS $ 300,823 $ 305,534 $ 318,540 $ 323,572 $ 334,617
PAYROLL TAXES $ 25,269 $ 25,665 $ 26,757 $ 27,180 $ 28,108
TOTAL LABOR $ 326,092 $ 331,199 $ 345,297 $ 350,752 $ 362,725
REPAIR AND MAINTENANCE $ 48,132 $ 48,885 $ 50,966 $ 51,771 $ 53,539
MATERIALS
SUPPLIES AND OTHER $ 120,329 $ 122,214 $ 127,416 $ 129,429 $ 133,847
UTILITIES $ 54,148 $ 54,996 $ 57,337 $ 58,243 $ 60,231
ADVERTISING $ 120,329 $ 122,214 $ 127,416 $ 129,429 $ 133,847
INSURANCE $ 55,351 $ 56,218 $ 58,611 $ 59,537 $ 61,570
SUBTOTAL $ 724,381 $ 735,726 $ 767,044 $ 779,161 $ 805,758
COST OF SALES
FOOD AND BEVERAGE $ 81,222 $ 82,494 $ 86,006 $ 87,364 $ 90,347
MERCHANDISE $ 15,041 $ 15,277 $ 15,927 $ 16,179 $ 16,731
TOTAL COST OF SALES $ 96,263 $ 97,771 $ 101,933 $ 103,543 $ 107,077
TOTAL OPERATING EXPENSES $ 820,644 $ 833,497 $ 868,977 $ 882,704 $ 912,835
FIGURE 41: OPERATING EXPENSE PROJECTION – MOST LIKELY SCENARIO
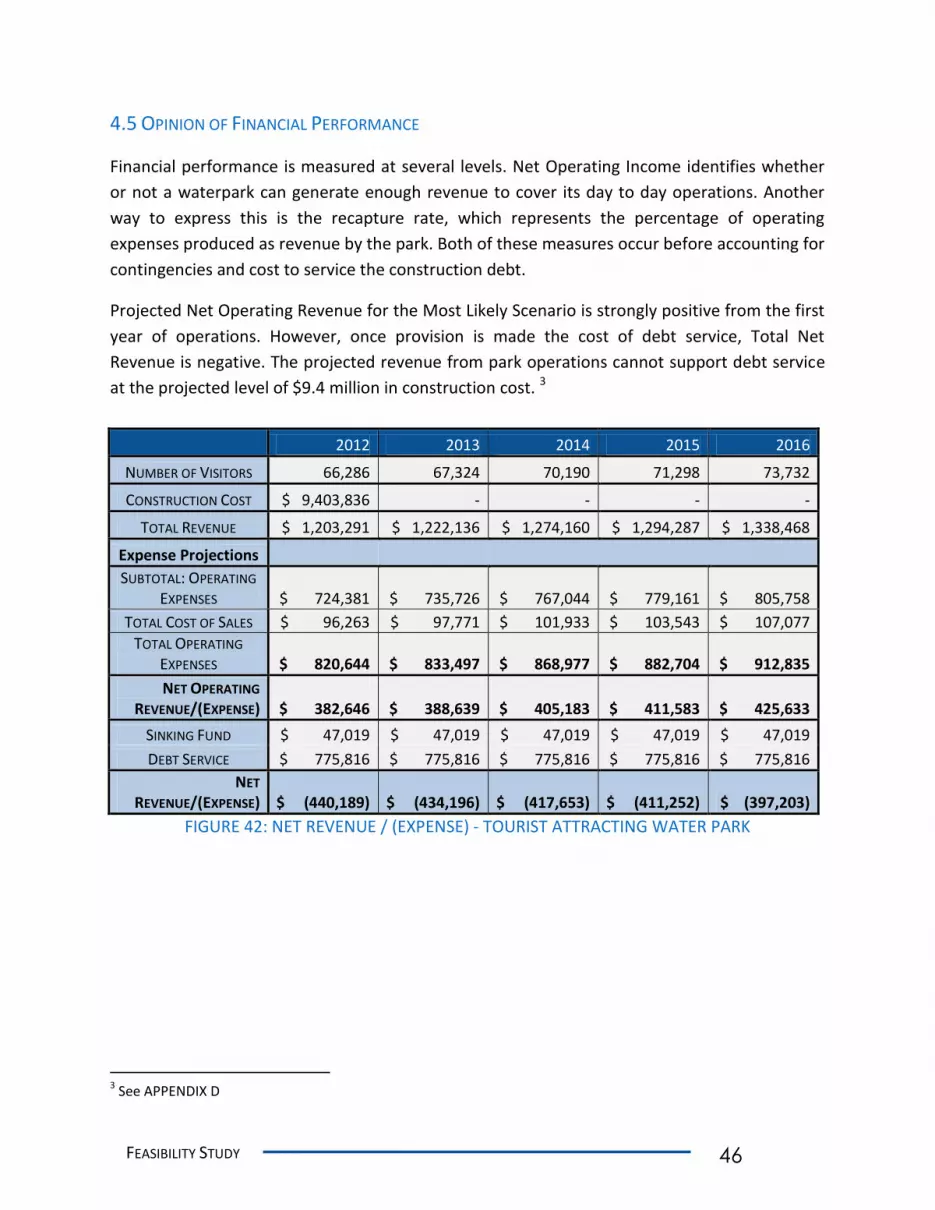
FEASIBILITY STUDY 46
4.5 OPINION OF FINANCIAL PERFORMANCE
Financial performance is measured at several levels. Net Operating Income identifies whether
or not a waterpark can generate enough revenue to cover its day to day operations. Another
way to express this is the recapture rate, which represents the percentage of operating
expenses produced as revenue by the park. Both of these measures occur before accounting for
contingencies and cost to service the construction debt.
Projected Net Operating Revenue for the Most Likely Scenario is strongly positive from the first
year of operations. However, once provision is made the cost of debt service, Total Net
Revenue is negative. The projected revenue from park operations cannot support debt service
at the projected level of $9.4 million in construction cost. 3
2012 2013 2014 2015 2016
NUMBER OF VISITORS 66,286 67,324 70,190 71,298 73,732
CONSTRUCTION COST $ 9,403,836 - - - -
TOTAL REVENUE $ 1,203,291 $ 1,222,136 $ 1,274,160 $ 1,294,287 $ 1,338,468
Expense Projections SUBTOTAL: OPERATING
EXPENSES $ 724,381 $ 735,726 $ 767,044 $ 779,161 $ 805,758
TOTAL COST OF SALES $ 96,263 $ 97,771 $ 101,933 $ 103,543 $ 107,077
TOTAL OPERATING
EXPENSES $ 820,644 $ 833,497 $ 868,977 $ 882,704 $ 912,835
NET OPERATING
REVENUE/(EXPENSE) $ 382,646 $ 388,639 $ 405,183 $ 411,583 $ 425,633
SINKING FUND $ 47,019 $ 47,019 $ 47,019 $ 47,019 $ 47,019
DEBT SERVICE $ 775,816 $ 775,816 $ 775,816 $ 775,816 $ 775,816
NET
REVENUE/(EXPENSE) $ (440,189) $ (434,196) $ (417,653) $ (411,252) $ (397,203)
FIGURE 42: NET REVENUE / (EXPENSE) - TOURIST ATTRACTING WATER PARK
3 See APPENDIX D
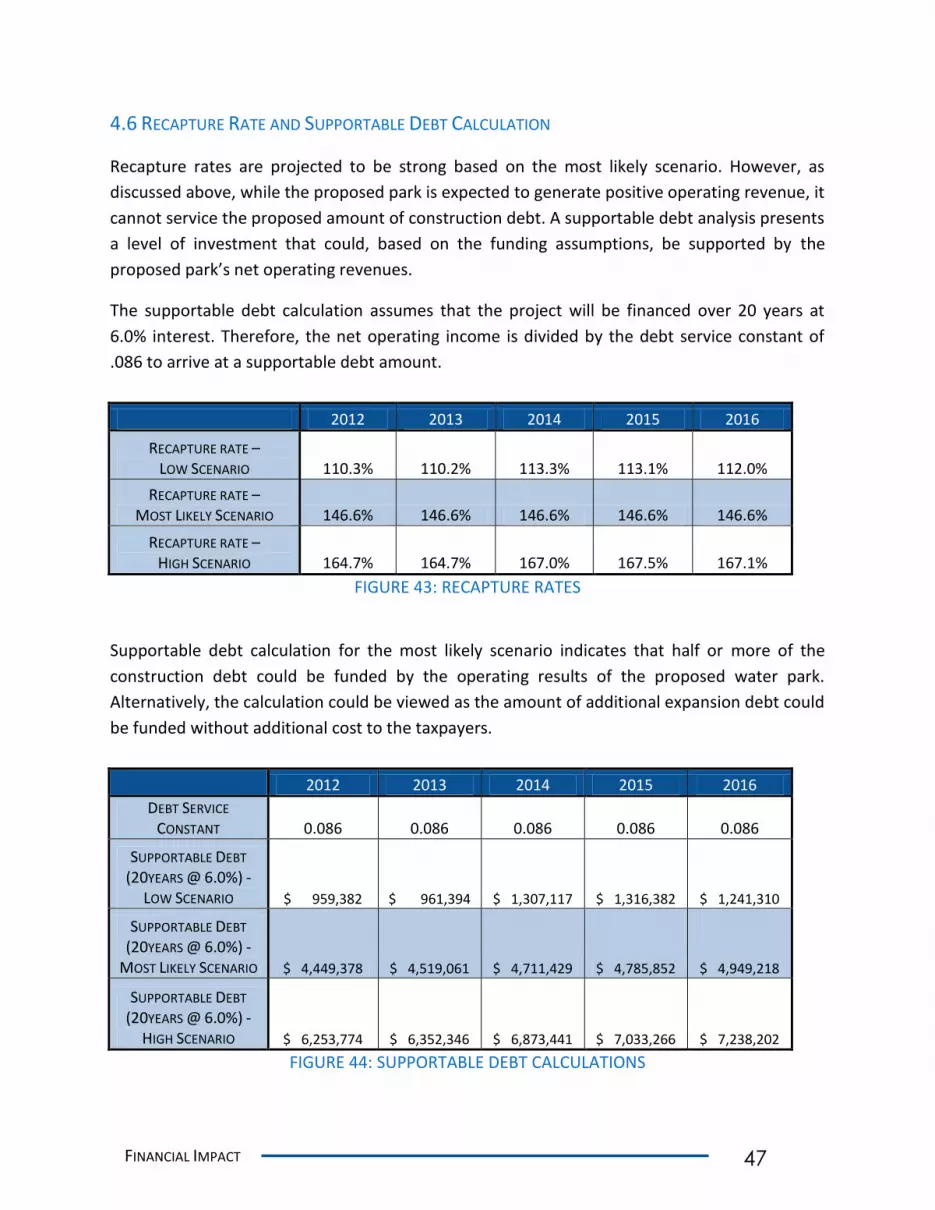
FINANCIAL IMPACT 47
4.6 RECAPTURE RATE AND SUPPORTABLE DEBT CALCULATION
Recapture rates are projected to be strong based on the most likely scenario. However, as
discussed above, while the proposed park is expected to generate positive operating revenue, it
cannot service the proposed amount of construction debt. A supportable debt analysis presents
a level of investment that could, based on the funding assumptions, be supported by the
proposed park’s net operating revenues.
The supportable debt calculation assumes that the project will be financed over 20 years at
6.0% interest. Therefore, the net operating income is divided by the debt service constant of
.086 to arrive at a supportable debt amount.
2012 2013 2014 2015 2016
RECAPTURE RATE – LOW SCENARIO 110.3% 110.2% 113.3% 113.1% 112.0%
RECAPTURE RATE – MOST LIKELY SCENARIO 146.6% 146.6% 146.6% 146.6% 146.6%
RECAPTURE RATE – HIGH SCENARIO 164.7% 164.7% 167.0% 167.5% 167.1%
FIGURE 43: RECAPTURE RATES
Supportable debt calculation for the most likely scenario indicates that half or more of the
construction debt could be funded by the operating results of the proposed water park.
Alternatively, the calculation could be viewed as the amount of additional expansion debt could
be funded without additional cost to the taxpayers.
2012 2013 2014 2015 2016
DEBT SERVICE
CONSTANT 0.086 0.086 0.086 0.086 0.086
SUPPORTABLE DEBT
(20YEARS @ 6.0%) -
LOW SCENARIO $ 959,382 $ 961,394 $ 1,307,117 $ 1,316,382 $ 1,241,310
SUPPORTABLE DEBT
(20YEARS @ 6.0%) -
MOST LIKELY SCENARIO $ 4,449,378 $ 4,519,061 $ 4,711,429 $ 4,785,852 $ 4,949,218
SUPPORTABLE DEBT
(20YEARS @ 6.0%) -
HIGH SCENARIO $ 6,253,774 $ 6,352,346 $ 6,873,441 $ 7,033,266 $ 7,238,202
FIGURE 44: SUPPORTABLE DEBT CALCULATIONS
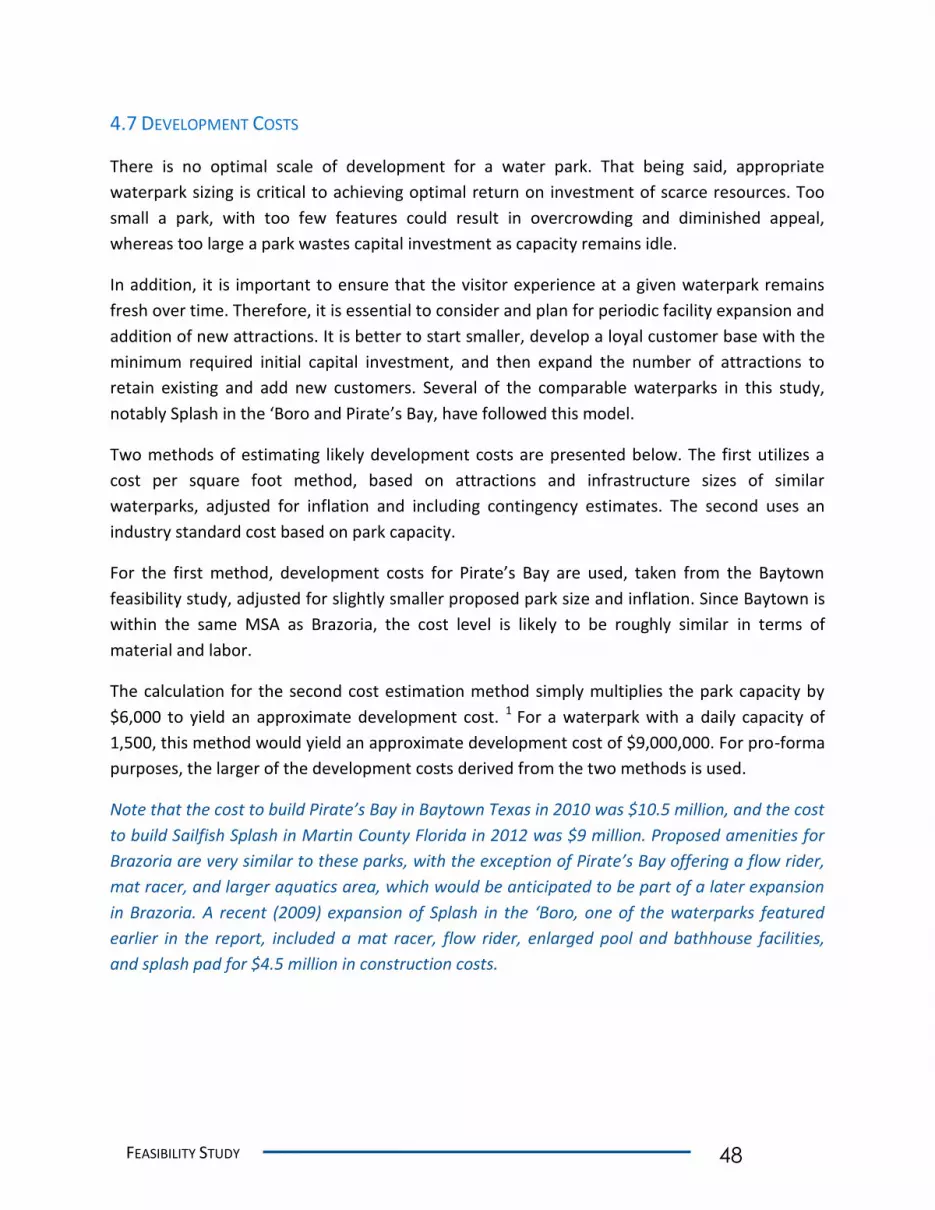
FEASIBILITY STUDY 48
4.7 DEVELOPMENT COSTS
There is no optimal scale of development for a water park. That being said, appropriate
waterpark sizing is critical to achieving optimal return on investment of scarce resources. Too
small a park, with too few features could result in overcrowding and diminished appeal,
whereas too large a park wastes capital investment as capacity remains idle.
In addition, it is important to ensure that the visitor experience at a given waterpark remains
fresh over time. Therefore, it is essential to consider and plan for periodic facility expansion and
addition of new attractions. It is better to start smaller, develop a loyal customer base with the
minimum required initial capital investment, and then expand the number of attractions to
retain existing and add new customers. Several of the comparable waterparks in this study,
notably Splash in the ‘Boro and Pirate’s Bay, have followed this model.
Two methods of estimating likely development costs are presented below. The first utilizes a
cost per square foot method, based on attractions and infrastructure sizes of similar
waterparks, adjusted for inflation and including contingency estimates. The second uses an
industry standard cost based on park capacity.
For the first method, development costs for Pirate’s Bay are used, taken from the Baytown
feasibility study, adjusted for slightly smaller proposed park size and inflation. Since Baytown is
within the same MSA as Brazoria, the cost level is likely to be roughly similar in terms of
material and labor.
The calculation for the second cost estimation method simply multiplies the park capacity by
$6,000 to yield an approximate development cost. 1 For a waterpark with a daily capacity of
1,500, this method would yield an approximate development cost of $9,000,000. For pro-forma
purposes, the larger of the development costs derived from the two methods is used.
Note that the cost to build Pirate’s Bay in Baytown Texas in 2010 was $10.5 million, and the cost
to build Sailfish Splash in Martin County Florida in 2012 was $9 million. Proposed amenities for
Brazoria are very similar to these parks, with the exception of Pirate’s Bay offering a flow rider,
mat racer, and larger aquatics area, which would be anticipated to be part of a later expansion
in Brazoria. A recent (2009) expansion of Splash in the ‘Boro, one of the waterparks featured
earlier in the report, included a mat racer, flow rider, enlarged pool and bathhouse facilities,
and splash pad for $4.5 million in construction costs.
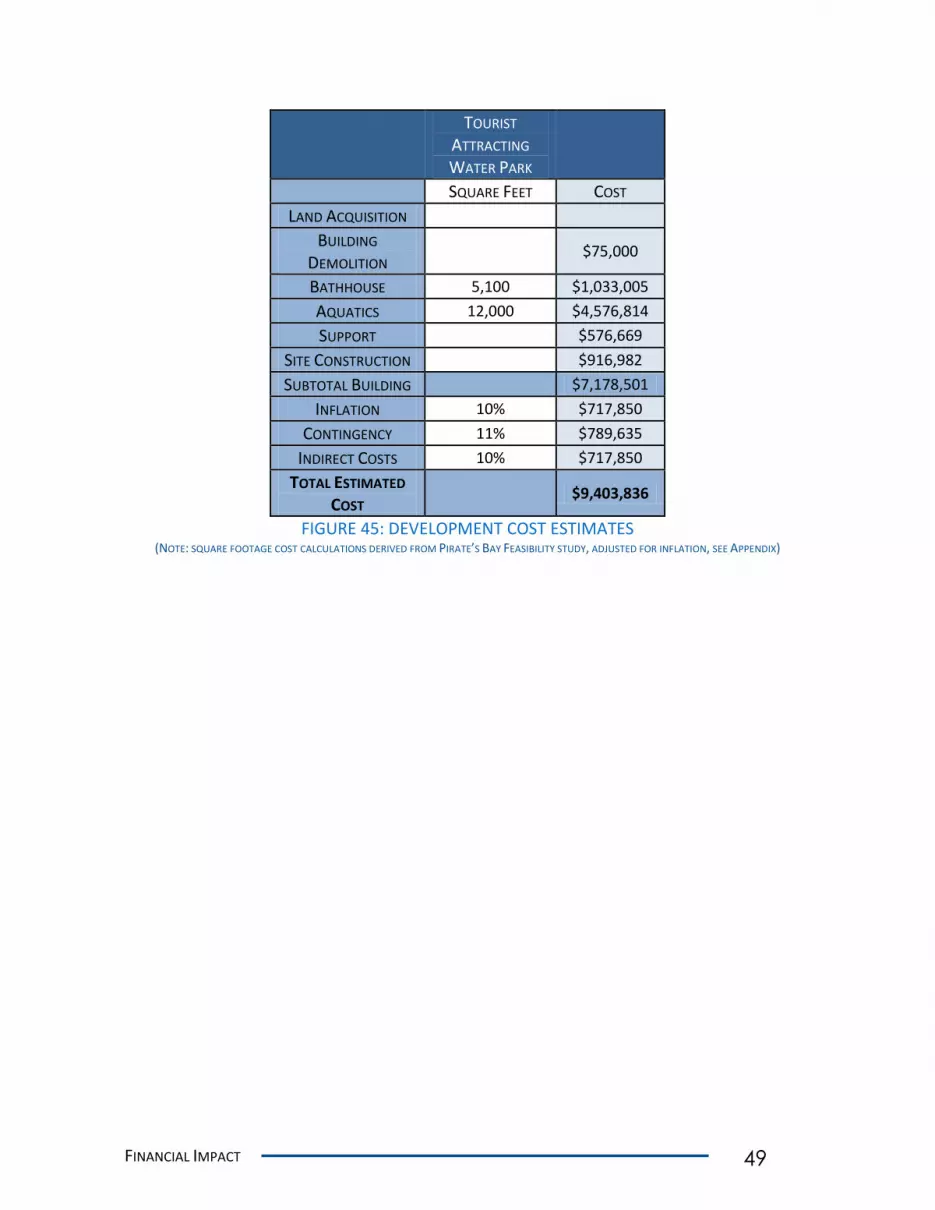
FINANCIAL IMPACT 49
TOURIST
ATTRACTING
WATER PARK
SQUARE FEET COST
LAND ACQUISITION
BUILDING
DEMOLITION $75,000
BATHHOUSE 5,100 $1,033,005
AQUATICS 12,000 $4,576,814
SUPPORT
$576,669
SITE CONSTRUCTION
$916,982
SUBTOTAL BUILDING
$7,178,501
INFLATION 10% $717,850
CONTINGENCY 11% $789,635
INDIRECT COSTS 10% $717,850
TOTAL ESTIMATED
COST $9,403,836
FIGURE 45: DEVELOPMENT COST ESTIMATES (NOTE: SQUARE FOOTAGE COST CALCULATIONS DERIVED FROM PIRATE’S BAY FEASIBILITY STUDY, ADJUSTED FOR INFLATION, SEE APPENDIX)

FEASIBILITY STUDY 50
CHAPTER 5: RV PARK COMPONENT
As requested by Brazoria city leaders, the IUS team also researched the possibility of a water
park/RV park combination on the developable land. Of the thirty-five acres of developable land
in the city of Brazoria, the proposed water park is expected to be placed on 5 or less acres. This
leaves many acres of the land to go to other uses. The city wishes that this land be dedicated to
parking, sports activities, and RV use. In the following portion of the report, the unique aspects
of the RV industry will be discussed, as well as location considerations that must be taken into
account.
Members of the IUS team gathered industry information from various academic sources and
discussed the industry with RV park managers and experts from across Texas and the nation.
5.1 RV PARK MARKET
The RV and RV park industry underwent a large decrease during the 2008 recession. Demand,
however, is expected to increase over the next few years due to a maturing baby boomer
population. Over the next 5 years, the RV industry is expected to increase at 2.3% per year.63
In 2011 the national average RVer was 48 years old.64 The national median income of RVers was
$62,000. 4.9% of RV owners are under the age of 35. This indicates that, overall, the
demographics for RVers in the United States are generally older than middle-age and medium
income.
State and national parks are big draws for RVers. According to a 2012 Recreation Vehicle
Industry Association survey, 72 percent of RVers plan to visit a national park within a year’s
time and 74% plan to visit a state park. 65
The United States Census defines the RV park industry as “establishments primarily engaged in
operating recreational vehicle parks and campgrounds and recreational and vacation camps.
These establishments cater to outdoor enthusiasts and are characterized by the type of
accommodation and by the nature and the range of recreational facilities and activities
provided to their clients.” 66 The Census defines the RV Parks and Recreational camp industry
as NAICS code 7212. According to the NAICS data, in 2010 there were 7, 185 RV parks in the
United States, 404 in the state of Texas, and 2 in Brazoria County.
RV Parks primarily appeal to one of two markets: “en route” customers who stop on the way
between destinations and longer term travelers, who stay at an RV park located near a popular
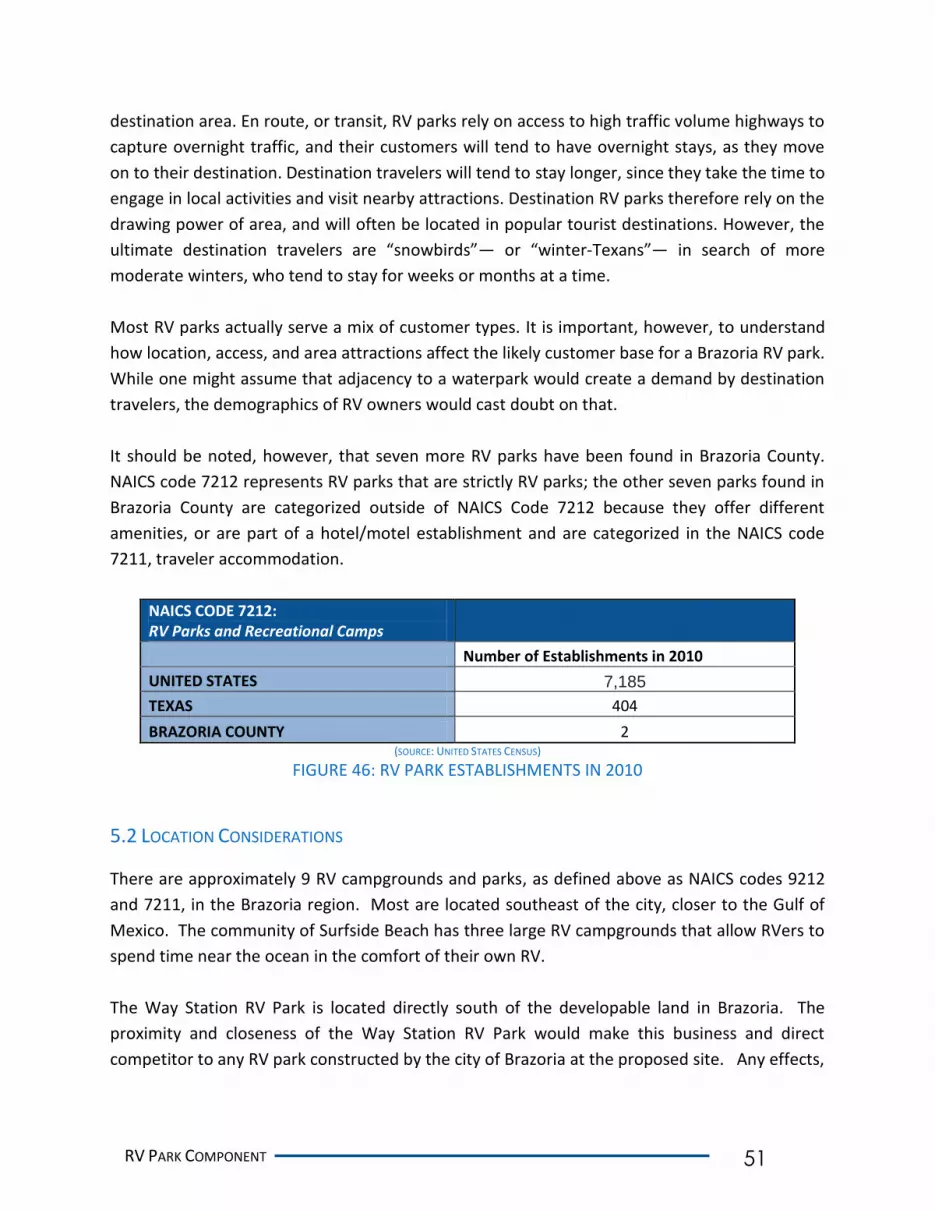
RV PARK COMPONENT 51
destination area. En route, or transit, RV parks rely on access to high traffic volume highways to
capture overnight traffic, and their customers will tend to have overnight stays, as they move
on to their destination. Destination travelers will tend to stay longer, since they take the time to
engage in local activities and visit nearby attractions. Destination RV parks therefore rely on the
drawing power of area, and will often be located in popular tourist destinations. However, the
ultimate destination travelers are “snowbirds”— or “winter-Texans”— in search of more
moderate winters, who tend to stay for weeks or months at a time.
Most RV parks actually serve a mix of customer types. It is important, however, to understand
how location, access, and area attractions affect the likely customer base for a Brazoria RV park.
While one might assume that adjacency to a waterpark would create a demand by destination
travelers, the demographics of RV owners would cast doubt on that.
It should be noted, however, that seven more RV parks have been found in Brazoria County.
NAICS code 7212 represents RV parks that are strictly RV parks; the other seven parks found in
Brazoria County are categorized outside of NAICS Code 7212 because they offer different
amenities, or are part of a hotel/motel establishment and are categorized in the NAICS code
7211, traveler accommodation.
NAICS CODE 7212: RV Parks and Recreational Camps
Number of Establishments in 2010
UNITED STATES 7,185
TEXAS 404
BRAZORIA COUNTY 2 (SOURCE: UNITED STATES CENSUS)
FIGURE 46: RV PARK ESTABLISHMENTS IN 2010
5.2 LOCATION CONSIDERATIONS
There are approximately 9 RV campgrounds and parks, as defined above as NAICS codes 9212
and 7211, in the Brazoria region. Most are located southeast of the city, closer to the Gulf of
Mexico. The community of Surfside Beach has three large RV campgrounds that allow RVers to
spend time near the ocean in the comfort of their own RV.
The Way Station RV Park is located directly south of the developable land in Brazoria. The
proximity and closeness of the Way Station RV Park would make this business and direct
competitor to any RV park constructed by the city of Brazoria at the proposed site. Any effects,
FEASIBILITY STUDY 52
positive or negative, due to the close proximity of the Way Station RV Park should be closely
and carefully evaluated by Brazoria city leaders before construction of an RV park is initiated.
(SOURCE: GOOGLE.COM/MAPS; 2012 ESRI BUSINESS ANALYST)
FIGURE 47: MAP OF AREA RV PARKS AND NATURAL FEATURES
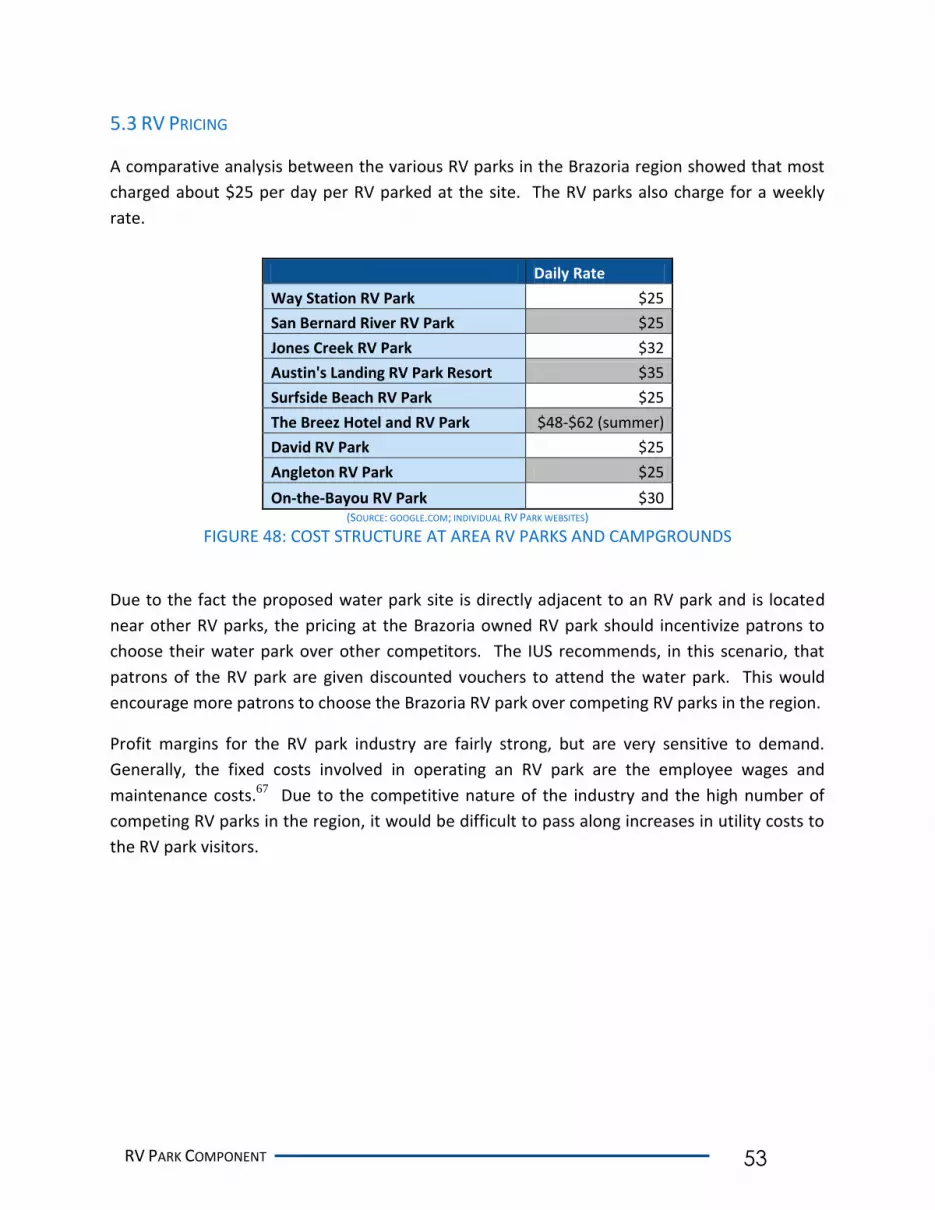
RV PARK COMPONENT 53
5.3 RV PRICING
A comparative analysis between the various RV parks in the Brazoria region showed that most
charged about $25 per day per RV parked at the site. The RV parks also charge for a weekly
rate.
Daily Rate
Way Station RV Park $25
San Bernard River RV Park $25
Jones Creek RV Park $32
Austin's Landing RV Park Resort $35
Surfside Beach RV Park $25
The Breez Hotel and RV Park $48-$62 (summer)
David RV Park $25
Angleton RV Park $25
On-the-Bayou RV Park $30 (SOURCE: GOOGLE.COM; INDIVIDUAL RV PARK WEBSITES)
FIGURE 48: COST STRUCTURE AT AREA RV PARKS AND CAMPGROUNDS
Due to the fact the proposed water park site is directly adjacent to an RV park and is located
near other RV parks, the pricing at the Brazoria owned RV park should incentivize patrons to
choose their water park over other competitors. The IUS recommends, in this scenario, that
patrons of the RV park are given discounted vouchers to attend the water park. This would
encourage more patrons to choose the Brazoria RV park over competing RV parks in the region.
Profit margins for the RV park industry are fairly strong, but are very sensitive to demand.
Generally, the fixed costs involved in operating an RV park are the employee wages and
maintenance costs.67 Due to the competitive nature of the industry and the high number of
competing RV parks in the region, it would be difficult to pass along increases in utility costs to
the RV park visitors.
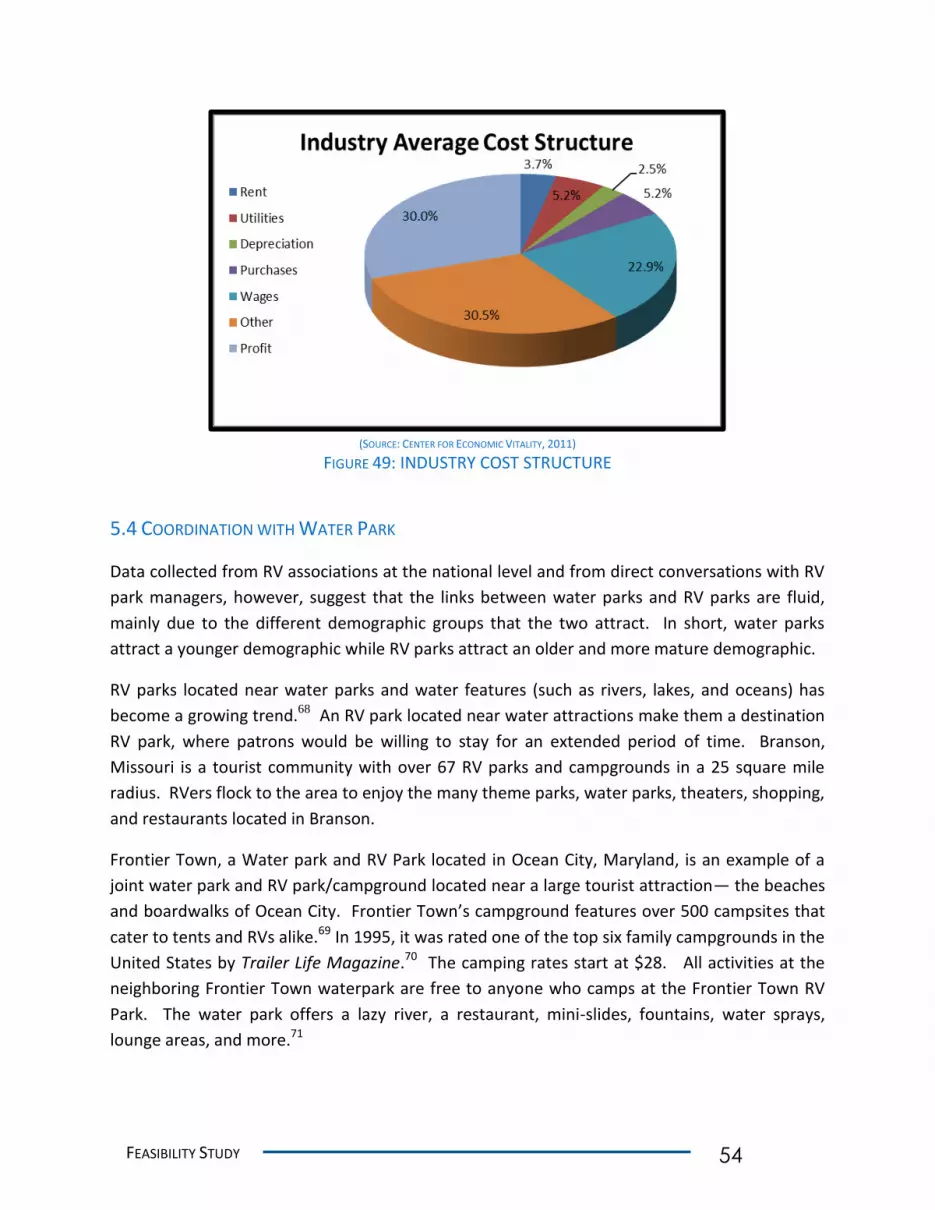
FEASIBILITY STUDY 54
(SOURCE: CENTER FOR ECONOMIC VITALITY, 2011)
FIGURE 49: INDUSTRY COST STRUCTURE
5.4 COORDINATION WITH WATER PARK
Data collected from RV associations at the national level and from direct conversations with RV
park managers, however, suggest that the links between water parks and RV parks are fluid,
mainly due to the different demographic groups that the two attract. In short, water parks
attract a younger demographic while RV parks attract an older and more mature demographic.
RV parks located near water parks and water features (such as rivers, lakes, and oceans) has
become a growing trend.68 An RV park located near water attractions make them a destination
RV park, where patrons would be willing to stay for an extended period of time. Branson,
Missouri is a tourist community with over 67 RV parks and campgrounds in a 25 square mile
radius. RVers flock to the area to enjoy the many theme parks, water parks, theaters, shopping,
and restaurants located in Branson.
Frontier Town, a Water park and RV Park located in Ocean City, Maryland, is an example of a
joint water park and RV park/campground located near a large tourist attraction— the beaches
and boardwalks of Ocean City. Frontier Town’s campground features over 500 campsites that
cater to tents and RVs alike.69 In 1995, it was rated one of the top six family campgrounds in the
United States by Trailer Life Magazine.70 The camping rates start at $28. All activities at the
neighboring Frontier Town waterpark are free to anyone who camps at the Frontier Town RV
Park. The water park offers a lazy river, a restaurant, mini-slides, fountains, water sprays,
lounge areas, and more.71
RV PARK COMPONENT 55
The Brazosport area accommodates many parks and wildlife activities that many RVers can
enjoy. Bird watching is an activity regularly practiced there. Some of the favorite birding spots
include the Brazoria National Wildlife Refuge, San Bernard National Wildlife Refuge, Gulf Coast
Bird Observatory, the Great Texas Coastal Birding Trail, Quintana Beach Bird Sanctuary, and the
Justin Hurst Wildlife Management Area Wilderness Park. Bird watchers have found
approximately 300 bird species in the area.72 Diving is also rapidly becoming a popular activity
at the Texas Flower Gardens, an underwater attraction located off the Freeport shore. Patrons
can also participate in many other activities including but not limited to camping, golf, tennis,
and boating at the many tourist attractions mentioned earlier.
FEASIBILITY STUDY 56
CHAPTER 6: CONCLUSION
The water park industry is a growth industry in Texas. Municipalities nationwide, especially in
the state of Texas, have been building water parks in their communities to promote community
and economic development. Water parks, depending on design (e.g. number of wet and dry
amenities, RV sites, and outdoor venues), can bring tourism dollars to the City as well as create
a location for community wide events of regional appeal.
The report suggests that Brazoria has many strengths that are helpful in creating a successful
water park. The proposed location is within a 90 minute drive of 5 million residents, is located
near many tourist attractions (as featured in the ‘Escape Down 288’ tourism campaign), and
there is a lack of competing tourist-generating water parks in the surrounding vicinity. Eco-
tourism opportunities are plentiful in the region and present Brazoria with unique amenities
that do not exist in other cities across the state of Texas.
The RV market also appears to be strong in the region. RV owners tend to frequent places that
offer a wide-variety of natural amenities. The region offers RVers the Gulf of Mexico, the
Brazoria National Wildlife Refuge, the Justin Hurst Wildlife Management Area, and the Sam
Bernard National Wildlife Refuge. These natural reserves offer nature enthusiasts ample
opportunities for fishing, hunting, bird-watching, and many other outdoor leisure activities.
Further, these attractions offer year-round appeal, presenting the opportunity for Brazoria to
attract visitors beyond the summer months.
The combination of water parks and RV parks are becoming more commonplace across the
nation as facilities attempt to cater to a wider demographic. Jellystone in Burleson, Texas,
Point Mallard in Decatur, Alabama, and Splash Way in Sheridan, Texas are examples of a
successful RV and water park combination.
The RV park market and the water park markets are different; yet intersect. RV Parks tend to
appeal to older populations and those who desired to invest large sums of money into personal
RVs. By appealing to an aging baby boomer generation that is becoming interested in RVing and
also participate in the kinds of outdoor and natural tourism opportunities that Brazoria County
provides, Brazoria can also provide recreation to baby boomers’ children and grandchildren.
The benefits to a community that adds a water park are many: seasonal jobs for the city’s
youth, larger sales tax revenues at local businesses like gas stations and restaurants, and the
potential for complementary recreational activities. The water park can also create a
community meeting place to hold festivals and events to celebrate the community and bring in
more visitors.

CONCLUSION 57
6.1 RECOMMENDATIONS
Throughout the development of the feasibility report, members of the IUS developed many
recommendations that the City should consider if they choose to develop a municipal water
park.
1. Research and the case studies presented in this report identify key attributes of successful
waterparks to follow:
Carefully chose the mix of wet and dry amenities
Different amenities appeal to different age groups and demographics— for example,
young patrons tend to prefer fast slides and flow riders and older patrons tend to prefer
lazy rivers. Consider in–park dry amenities such as playgrounds and shaded pavilions.
Build a solid core of amenities first, then expand the water park over time.
This will encourage more visitors and ensure a fresh experience over time for repeat
visitors, while minimizing initial construction costs.
Seek to maximize in-park revenue
Special events, “dive-in” movies, swim lessons, party rentals and other programs offer
opportunities to sell more food, beverages, and merchandize in addition to admissions.
2. Careful site consideration is important
Site visibility should be maximized on State Highway 36.
Amenity placement and signage encourage drive-by visitation and wayfinding
Be aware of and respectful to interaction with neighboring uses such as the Austin
Colony subdivision
Determine infrastructure needs for the park at build out
Ensuring adequate provision of water, sewer, electric, and other utilities for the largest
desired facility up front minimizes expansion cost.
Consider the addition of pedestrian pathways to the site.
Walkways assure pedestrian accessibility to and from different uses within the site and
offer provision for later connection to nearby complementary commercial and
recreational uses.
Strategically place the water park on the site to make additional land uses on the
larger parcel accessible.
Design and place the parking lot with enough space for future expansion while not
hampering the site visibility from Highway 36.

FEASIBILITY STUDY 58
3. Complementary activities (sports fields, entertainment, etc) should be considered for future
expansion around the water park and RV park.
Recreational amenities such as laser tag, paintball, sports fields (tennis, baseball, and
soccer) should be considered nearby the water park.
The addition of these forms of recreational activities expands the overall recreational
appeal of the waterpark, and can help make the water park/RV park a regional
recreational attraction.
Consider including handicapped accessible attractions in the waterpark.
Handicapped-accessible water parks are uncommon and considering the needs of this
population would help distinguish Brazoria’s waterpark while appealing to a broader
demographic market.
Develop the water park/RV park as a community focal point.
Adding a welcome center, amphitheater, or meeting facility would offer opportunities to
host events year round, such as summer musicals, Christmas Pageants, and Halloween
events, as well as serve local community groups.
Develop on-site services to cater to the unique demands of RVers.
On-site laundry and grocery facilities, for instance, can be franchised to private firms.
Consider future placement of complementary business activities near the park.
Restaurants, gas stations, and bait-and-tackle shops may be complementary to the
region’s eco-tourism demands. Local zoning ordinances should be referenced to address
any zoning conflicts.
The City should work to attract hotels to the City if the goal is to attract multi-day
visits from tourists.
The City of Brazoria currently lacks a hotels and motels for potential visitors. Offering
additional opportunities for overnight stays in proximity to the water park can expand
the market range and provide the potential for multi-day visitation.
4. Marketing is crucial to waterpark success
Develop a branding strategy to identify the park with the unique amenities in the
Brazoria region.
The water park and RV park should take advantage of the natural amenities in the area
and the related tourist potential that these amenities provide. This involves creating a
branding image that will appeal to visitors who frequent the area’s state parks and
wildlife refuges.

CONCLUSION 59
The water park and RV park facility should participate in the ‘Escape Down 288’
campaign.
This campaign works to attract visitors from Houston and can be a boon to the potential
tourist visitors that the water park can receive.
Place billboard signage along major routes like Interstate 10 and Highway 288.
Travelers along these routes in the Houston area would have easy access to the water
park via Highway 36 and Highway 288.
Utilize social media.
Social media is an inexpensive way to create buzz about the facility and to make
connections to potential visitors. Websites like Groupon and popularize.com are also
effective ways to encourage new and repeat visitors to the facility.
5. We recommend that coordination between the water park and RV park be established.
Discounts and “stay and play” packages should be offered as incentives to encourage
RVers to choose the Brazoria facility.
Concession stands should be conveniently placed in the facility so that both water
park patrons and RV park patrons can access them.
Third, the addition of cabins at the RV park facility should be considered.
Cabins may help encourage more people to stay at the RV park and frequent the water
park.
The RV park should be open-year round to be available during winter months.
Market to “snowbird” or “winter-Texans” as well as hunters and “eco-tourists” taking
advantage of high winter bird counts in the nearby wildlife refuges.
In general, we recommend that the City of Brazoria think “big” when planning for the future of
the acres of developable land. Long term possibilities could include the development of a golf
course, resort, and conference center serving the entire Brazoria area. The possibilities for both
water parks and RV parks are seemingly endless and the future positive effects on the City of
Brazoria are equally as endless.
FEASIBILITY STUDY 60
APPENDIX A
2011 Methodology Statement: ESRI Data – Tapestry Segmentation
For the past 30 years, companies, agencies, and organizations have used segmentation to
divide and group their markets to more precisely target their best customers, prospects,
citizens, residents, members, and donors. Segmentation systems operate on the theory that
people with similar tastes, lifestyles, and behaviors seek others with the same tastes—"like
seeks like." These behaviors can be measured, predicted, and targeted. Segmentation explains
customer diversity, describes lifestyle and life stages, and incorporates a wide range of data.
Tapestry™ Segmentation represents the fourth generation of geodemographic market
segmentation systems that began with the first mass release of machine-readable, small-area
data from the 1970 Census. The availability of hundreds of variables for thousands of
neighborhoods was both irresistible and daunting for marketers. What they needed was a
structure—a way to create information from an overwhelming database. Market segments
provide that structure, a system for classifying consumers using all the variables that can
distinguish consumer behavior, from household characteristics like income and family type to
personal traits such as age, education, or employment and even to housing choices.
Tapestry Segmentation classifies US neighborhoods into 65 distinct market segments.
Neighborhoods with the most similar characteristics are grouped together, while
neighborhoods showing divergent characteristics are separated. Tapestry Segmentation
combines the "who" of lifestyle demography with the "where" of local neighborhood
geography to create a model of various lifestyle classifications or segments of actual
neighborhoods with addresses—distinct behavioral market segments.
Statistical Methods
Cluster analysis is the generic approach used to create a market segmentation system. There
are a number of different techniques or clustering methods that can be applied to identify and
classify market types. Each technique has its strengths and weaknesses. Previous generations
of Tapestry Segmentation have been built using a combination of techniques, such as iterative
partition K-means algorithm, to create the initial clusters or market segments, followed by
application of Ward’s hierarchical minimum-variance method to group the clusters. The
combination has provided a complementary match of the strengths of each technique. Tapestry
Segmentation combines the traditional with the latest data mining techniques to provide a
robust and compelling segmentation of US neighborhoods. ESRI developed and incorporated
APPENDIX 61
these data mining techniques to complement and strengthen traditional methods to work with
large geodemographic databases. Robust methods are less susceptible to extreme values, or
outliers, and therefore, crucial to small-area analysis. The traditional methodology of cluster
analysis has a long track record in developing market segmentation systems. Complementary
use of data mining techniques and implementation of robust methods enhance the
effectiveness of traditional statistical methodology in developing Tapestry Segmentation.
For a broader view of consumer markets, cluster analysis was again used to develop the
Tapestry Segmentation summary groups. Summary groups are ideal when users want to work
with fewer than 65 segments. The 65 segments are combined into 12 LifeMode groups based
on lifestyle and lifestage. The 11 Urbanization groups present an alternative way of combining
the 65 segments based on the segments' geographic and physical features such as population
density, size of city, location relative to a metropolitan area, and whether they are part of the
economic and social center of a metropolitan area.
Data Used to Build Tapestry Segmentation
Cluster analysis techniques are essentially heuristic methods that rely on exploratory
procedures to arrive at stable and optimal solutions. The key to developing a powerful market
segmentation lies in the selection of the variable used to classify consumers. US consumer
markets are multidimensional and diverse. Using a large, well-selected array of attributes
captures this diversity with the most powerful data available. Data sources include Census
2000 data; ESRI;s Updated Demographics; and consumer surveys, such as the Survey of the
American Consumer from GfK MRI, to capture the subtlety and vibrancy of the US marketplace.
Selection of the variables used to identify consumer markets begins with data from Census
2000, the most accurate source of data on the American consumer. Census data is collected
directly from the population, self-reported, then edited by the Census Bureau for consistency.
Data includes household characteristics such as type single person or family, income,
relationships (single or multigenerational), and owner/renter status; personal traits such as age,
sex, education, employment, and marital status; and housing characteristics like home value or
rent, type of housing (single family, apartment, or townhouse), seasonal status, and owner
costs relative to income. In essence, any characteristic that is likely to differentiate consumer
spending and preferences is assessed for use in identifying consumer markets.
The selection process draws on Esri's experience in working with the 1980 and 1990 censuses
and includes a range of multivariate statistical methods, in addition to factor analysis, principal
components analysis, correlation matrices, and graphic methods. Selecting the most relevant
variables is critical to defining homogeneous market segments; however, determining the most
FEASIBILITY STUDY 62
effective measure of each variable is equally important. Is income best represented by a
median, an average, or an interval? Would household or disposable income best measure
actual buying power? In the end, selection was narrowed to more than 60 attributes to identify
and cluster US neighborhoods by market type.
From the neighborhood or block group level, Tapestry Segmentation profiles enable the
comparison of consumer markets across the country by state, metropolitan area, county, place,
census tract, ZIP Code™, and even congressional districts.
Verification Procedures
Verification procedures follow the creation of the segments to ensure their stability and
validity. Replicating the segments with independent samples checks stability. Validity is checked
through characteristics that are not used to generate the segments. Linking Tapestry
Segmentation to the latest consumer survey data is the critical test. A market segmentation
system must be able to distinguish consumer behavior—spending patterns and lifestyle
choices—as expected. ESRI verifies the efficacy of its Tapestry Segmentation markets against
the consumer surveys from GfK MRI, which include nearly 6,000 product and service brands in
550 categories, along with readership of hundreds of magazines and newspapers, Internet
usage, TV viewership by channel and program, radio listening, and use of Yellow Pages. The
validity check provides the answer to the most important question: Does it work? It works.
2011 Database Update
Each decade, decennial census data provides users with a new snapshot of the demographic
landscape of the United States. A decade's worth of population change requires concomitant
changes in geography and consumer markets to reflect a neighborhood's growth or decline.
As areas are transformed through demographic change, the Census Bureau and its local
partners redefine the geographic boundaries. Block groups are re-delineated, revised, or
dropped. To provide Tapestry in 2010 geography, the first step was to establish a geographic
correspondence to the latest geographic inventory.
The next step was to update the Tapestry profiles with current data. To preserve the predictive
power of Tapestry, market segments were updated to ensure that they capture the new
composition of the population. Typically, block group assignments are refreshed during the
decade using ESRI's current year data. However, the 2011 update was optimized by the
incorporation of data from the 2010 Census, the American Community Survey, and Experian's
INSOURCESM consumer database.
APPENDIX 63
For more information about Tapestry Segmentation, visit esri.com/tapestry or call 1-800-447-
9778.
ESRI’s Data Development Team
Led by chief demographer Lynn Wombold, ESRI's data development team has a 30-year history
of excellence in market intelligence. The combined expertise of the team's economists,
statisticians, demographers, geographers, and analysts totals nearly a century of data and
segmentation development experience. In addition to Tapestry Segmentation, the team also
develops Updated Demographics, Consumer Spending, Market Potential, and Retail
MarketPlace datasets, which are now industry benchmarks.
For more information about ESRI® data, visit esri.com/data.
FEASIBILITY STUDY 64
APPENDIX B
Midland Crowd: The Midland crowd tapestry segment has the following demographic
characteristics: median age 37.9 years; median household income: $47,544; 16% have earned
at least a bachelor’s degree; many live in housing developments built after the year 1969;
politically active and conservative voters; rural landscape; homeownership rate is 80%; large
fast-food restaurant patronage.
Rustbelt Traditions: The Rustbelt Traditions tapestry segment has the following demographic
characteristics: median age is 35.9 years old; median household income is $42,337; most
worked in manufacturing industries but not work in service industries; more than 84% have a
high school diploma while 15% have a bachelor’s or graduate degree; live in modest single-
family homes built before 1960; these residents tend to stay close to home for entertainment
and recreation; these residents are also frugal; enjoy fishing, hunting, and racing.
Sophisticated Squires: The Sophisticated Squires tapestry segment has the following
demographic characteristics: tend to live in more rural areas; median age is 39.7 years; median
household income is $83,079; most work in white-collar jobs; 90% live in single-family homes.
Industrious Urban Fringe: The Industrious Urban Fringe tapestry segment has the following
demographic characteristics: median household income is $40,400; high level of Hispanic origin;
most have children; home ownership rate is 62%; balance budgets carefully and are
apprehensive to spend money.
Aspiring Young Families: the Aspiring Young Families tapestry segment has the following
demographic characteristics: typically live in southern and western U.S. metropolitan areas;
young married couples planning to have children or new parents; median age is 31.1 years old;
median household income is $46,275; 87% have graduated from high school while 24% hold a
bachelor’s or graduate degree; 47% own their homes; most spend discretionary income on
baby and children’s products; most likely to go to a theme park as a vacation destination.
Crossroads: The Crossroads tapestry segment has the following demographic characteristics:
median age of 33.6 years; one in five members are of Hispanic origin; median household
income is $37,185; 39% have attended college; most work in manufacturing, retail,
construction, or service industries; home ownership is 69%; children are major focus of the
Crossroads resident’s life; very frugal and careful with their money.
Milk and Cookies: The Milk and Cookies tapestry segment has the following demographic
characteristics: young and affluent couples who are just starting families; median age is 34.1
years; median household income is $57,170; 20% hold a bachelor’s or graduate degree; prefer

APPENDIX 65
single-family homes in the southern United States; very likely to visit theme parks on vacation
like Six Flags or Sea World.
Inner City Tenants: The Inner City Tenants tapestry segment has the following demographic
characteristics: three in ten residents are Hispanic; median age is 28.8 years old; median
household income is $30,873; 7 percent receive public assistance; approximately 50% work in
white-collar occupations; 17% do not own a vehicle; many do not have internet in their homes;
most attend professional football and basketball games as entertainment.
Southwestern Families: The Southwestern families tapestry segment has the following
demographic characteristics: median age is 29.2 years old; median household income is
$26,058; educational attainment is low; most of these residents live in Texas; most buy used
cars.
20 MINUTE DRIVE TIME Midland Crowd 10.7%
Rustbelt Traditions 8.3%
Sophisticated Squires 7.6%
Industrious Urban Fringe 7.4%
Aspiring Young Families 7.1% (SOURCE: 2012 ESRI BUSINESS ANALYST)
20 MINUTE DRIVE TIME TAPESTRY OUTPUTS 90 MINUTE DRIVE TIME TAPESTRY OUTPUTS
40 MINUTE DRIVE TIME MIDLAND CROWD 15.1%
RUSTBELT TRADITIONS 10.0%
CROSSROADS 6.9%
MILK AND COOKIES 6.5%
INNER CITY TENANTS 5.4%
40 MINUTE DRIVE TIME TAPESTRY OUTPUTS
60 MINUTE DRIVE TIME UP AND COMING FAMILIES 13.3%
BOOMBURBS 8.4%
MILK AND COOKIES 7.9%
MIDLAND CROWD 6.0%
ASPIRING YOUNG FAMILIES 5.6%
60 MINUTE DRIVE TIME TAPESTRY OUTPUTS
90 MINUTE DRIVE TIME Milk and Cookies 10.9%
Industrious Urban Fringe 8.6%
Up and Coming Families 8.0%
Boomburbs 7.0%
Southwestern Families 5.7%
FEASIBILITY STUDY 66
APPENDIX C
A waterpark will require funding to construct and operate. In general, a waterpark facility may
be directly funded by the city, funded through the capital markets, or some combination of
both methods. This section explores various funding options and presents the general funding
scenario utilized in the financial pro-forma analysis.
The City of Brazoria may elect to directly fund the development, construction and operation of
the waterpark. Direct funding options include city monies spent directly on the project, private
donations, and joint use agreements. Private contributions can be solicited from private and
corporate citizens via a wide range of programs. Joint use agreements may be formed with
other area municipalities, health facilities, and private businesses. In general, however, these
contributions or joint use agreements will account for a relatively small portion of overall
funding needs.
Capital market funding includes numerous options. Three options presented below are: general
obligation bonds, certificates of obligation, and revenue bonds. Each has different issuance
requirements and costs.
General obligation bonds are debt instruments issued by municipalities that are backed by the
full faith and credit of those municipalities. Because municipalities pledge to dedicate sufficient
funds to cover these bonds, interest rates for general obligation bonds tend to be lower than
other capital market financing methods. Most often, general obligation bonds are used to fund
projects that do not generate revenue.
In order to issue general obligation bonds, a city must first undertake internal approval of the
bond issue, including approval by the City Council. Bond issuance amount must be in
compliance with city indebtedness limits based on aggregate property value on the tax rolls. In
addition, because they carry the full faith and credit of the municipality, general obligation
bonds require voter approval.
Revenue bonds offer an option for a project like a waterpark, since the waterpark will generate
revenue that can be pledged to service and repay the bonds. In general, the revenue stream
from the financed project is dedicated to a revenue fund. Operating expenses are paid first, and
then the remaining revenue is dedicated to servicing the bonds. Revenue bonds would be most
appropriate in this instance if the city or another entity were to underwrite operating expenses
so that the operating revenue could be dedicated to bond service and principal repayment.
Since revenue bonds are not backed by a municipalities taxing authority, they normally carry
higher interest rates than general obligation bonds. The lack of full faith and credit guarantee

APPENDIX 67
also means that issuance of revenue bonds does not need public approval. However, internal
reviews and approval and compliance with indebtedness limits still apply. Interest to investors
from revenue bonds, like interest from general obligation bonds is exempt from federal tax.
A final possible financing method is the issuance of certificates of obligation. A certificate of
obligation pledges the full faith and credit of the municipality to guarantee the certificate, but
does not require voter approval. According to the Texas Legislative Code, a certificate of
obligation may be issued for:
(1) construction of any public work;
(2) purchase of materials, supplies, equipment, machinery, buildings, land, and rights-of-way for authorized needs and purposes; or
(3) payment of contractual obligations for professional services, including services provided by tax appraisers, engineers, architects, attorneys, map makers, auditors, financial advisors, and fiscal agents.1
As with the other forms of debt financing, certificates of obligation must pass through the city’s
internal approval process and be approved by the City Council. In addition, certificates of
obligation must be in compliance with a city’s overall limit on indebtedness.
Should the city decide to issue bonds to finance the waterpark, the city must be evaluated by
an independent bond rating agency. Three major bond rating agencies are Moody's Investors
Service, Standard & Poor's, and Fitch Ratings. The independent rating determines the bond
pricing and interest rate.
For purposes of establishing an opinion of financial performance, a general funding scenario is
presented. This scenario assumes bond financing at 6% with a 20 year maturity.
Option Funding Amount
Interest Rate Term
Annual Debt
Service
Neighborhood Pool $ 3,914,665 6.0% 20 yrs $ 336,661
Tourist Attracting Waterpark $ 9,403,836 6.0% 20 yrs $ 775,816
FUNDING OPTION ASSUMPTIONS
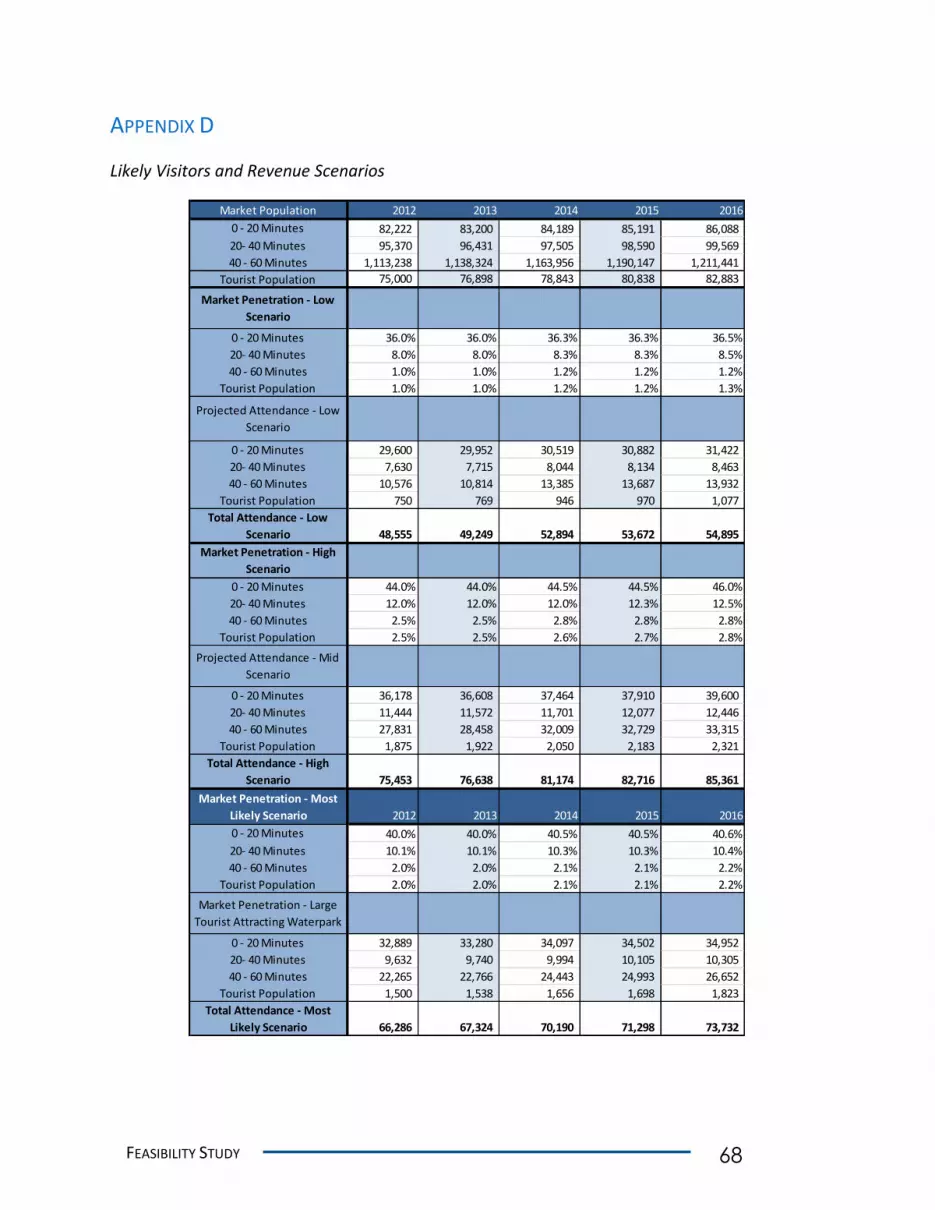
FEASIBILITY STUDY 68
APPENDIX D
Likely Visitors and Revenue Scenarios
Market Population 2012 2013 2014 2015 2016
0 - 20 Minutes 82,222 83,200 84,189 85,191 86,088
20- 40 Minutes 95,370 96,431 97,505 98,590 99,569
40 - 60 Minutes 1,113,238 1,138,324 1,163,956 1,190,147 1,211,441
Tourist Population 75,000 76,898 78,843 80,838 82,883
Market Penetration - Low
Scenario
0 - 20 Minutes 36.0% 36.0% 36.3% 36.3% 36.5%
20- 40 Minutes 8.0% 8.0% 8.3% 8.3% 8.5%
40 - 60 Minutes 1.0% 1.0% 1.2% 1.2% 1.2%
Tourist Population 1.0% 1.0% 1.2% 1.2% 1.3%
Projected Attendance - Low
Scenario
0 - 20 Minutes 29,600 29,952 30,519 30,882 31,422
20- 40 Minutes 7,630 7,715 8,044 8,134 8,463
40 - 60 Minutes 10,576 10,814 13,385 13,687 13,932
Tourist Population 750 769 946 970 1,077
Total Attendance - Low
Scenario 48,555 49,249 52,894 53,672 54,895
Market Penetration - High
Scenario
0 - 20 Minutes 44.0% 44.0% 44.5% 44.5% 46.0%
20- 40 Minutes 12.0% 12.0% 12.0% 12.3% 12.5%
40 - 60 Minutes 2.5% 2.5% 2.8% 2.8% 2.8%
Tourist Population 2.5% 2.5% 2.6% 2.7% 2.8%
Projected Attendance - Mid
Scenario
0 - 20 Minutes 36,178 36,608 37,464 37,910 39,600
20- 40 Minutes 11,444 11,572 11,701 12,077 12,446
40 - 60 Minutes 27,831 28,458 32,009 32,729 33,315
Tourist Population 1,875 1,922 2,050 2,183 2,321
Total Attendance - High
Scenario 75,453 76,638 81,174 82,716 85,361
Market Penetration - Most
Likely Scenario 2012 2013 2014 2015 2016
0 - 20 Minutes 40.0% 40.0% 40.5% 40.5% 40.6%
20- 40 Minutes 10.1% 10.1% 10.3% 10.3% 10.4%
40 - 60 Minutes 2.0% 2.0% 2.1% 2.1% 2.2%
Tourist Population 2.0% 2.0% 2.1% 2.1% 2.2%
Market Penetration - Large
Tourist Attracting Waterpark
0 - 20 Minutes 32,889 33,280 34,097 34,502 34,952
20- 40 Minutes 9,632 9,740 9,994 10,105 10,305
40 - 60 Minutes 22,265 22,766 24,443 24,993 26,652
Tourist Population 1,500 1,538 1,656 1,698 1,823
Total Attendance - Most
Likely Scenario 66,286 67,324 70,190 71,298 73,732
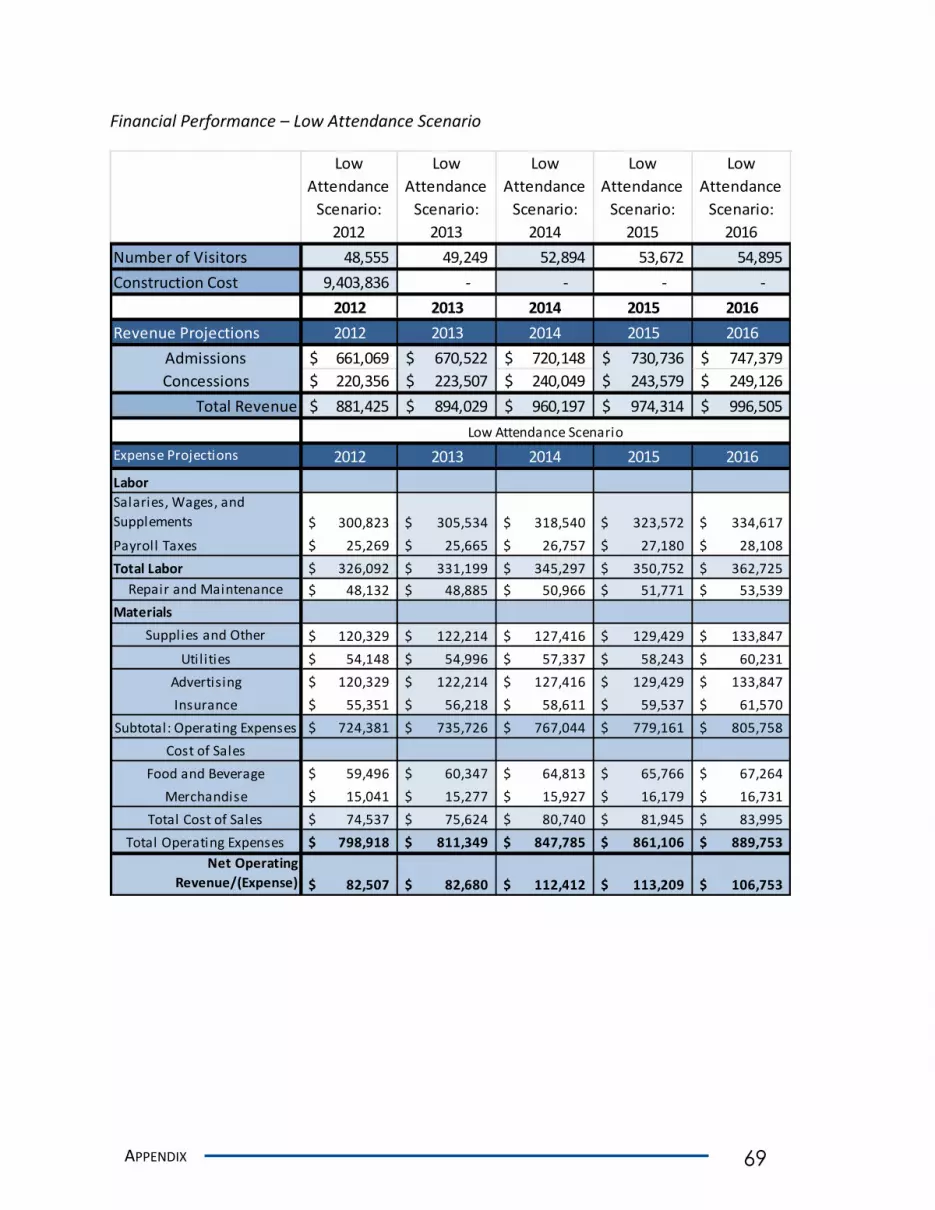
APPENDIX 69
Financial Performance – Low Attendance Scenario
Low
Attendance
Scenario:
2012
Low
Attendance
Scenario:
2013
Low
Attendance
Scenario:
2014
Low
Attendance
Scenario:
2015
Low
Attendance
Scenario:
2016
Number of Visitors 48,555 49,249 52,894 53,672 54,895
Construction Cost 9,403,836 - - - -
2012 2013 2014 2015 2016
Revenue Projections 2012 2013 2014 2015 2016
Admissions 661,069$ 670,522$ 720,148$ 730,736$ 747,379$
Concessions 220,356$ 223,507$ 240,049$ 243,579$ 249,126$
Total Revenue 881,425$ 894,029$ 960,197$ 974,314$ 996,505$
Expense Projections 2012 2013 2014 2015 2016
Labor
Salaries, Wages, and
Supplements 300,823$ 305,534$ 318,540$ 323,572$ 334,617$
Payroll Taxes 25,269$ 25,665$ 26,757$ 27,180$ 28,108$
Total Labor 326,092$ 331,199$ 345,297$ 350,752$ 362,725$
Repair and Maintenance 48,132$ 48,885$ 50,966$ 51,771$ 53,539$
Materials
Supplies and Other 120,329$ 122,214$ 127,416$ 129,429$ 133,847$
Util ities 54,148$ 54,996$ 57,337$ 58,243$ 60,231$
Advertising 120,329$ 122,214$ 127,416$ 129,429$ 133,847$
Insurance 55,351$ 56,218$ 58,611$ 59,537$ 61,570$
Subtotal: Operating Expenses 724,381$ 735,726$ 767,044$ 779,161$ 805,758$
Cost of Sales
Food and Beverage 59,496$ 60,347$ 64,813$ 65,766$ 67,264$
Merchandise 15,041$ 15,277$ 15,927$ 16,179$ 16,731$
Total Cost of Sales 74,537$ 75,624$ 80,740$ 81,945$ 83,995$
Total Operating Expenses 798,918$ 811,349$ 847,785$ 861,106$ 889,753$
Net Operating
Revenue/(Expense) 82,507$ 82,680$ 112,412$ 113,209$ 106,753$
Low Attendance Scenario
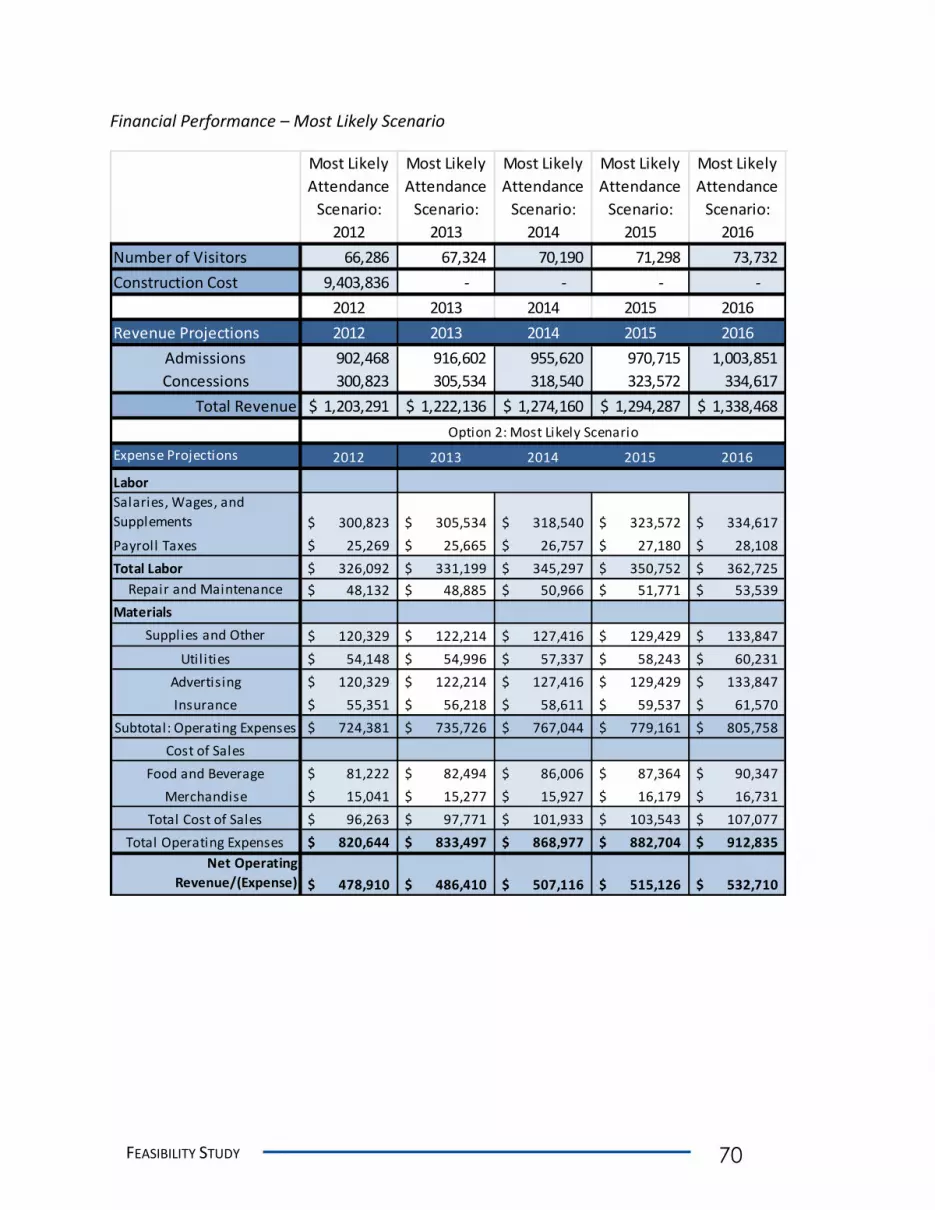
FEASIBILITY STUDY 70
Financial Performance – Most Likely Scenario
Most Likely
Attendance
Scenario:
2012
Most Likely
Attendance
Scenario:
2013
Most Likely
Attendance
Scenario:
2014
Most Likely
Attendance
Scenario:
2015
Most Likely
Attendance
Scenario:
2016
Number of Visitors 66,286 67,324 70,190 71,298 73,732
Construction Cost 9,403,836 - - - -
2012 2013 2014 2015 2016
Revenue Projections 2012 2013 2014 2015 2016
Admissions 902,468 916,602 955,620 970,715 1,003,851
Concessions 300,823 305,534 318,540 323,572 334,617
Total Revenue 1,203,291$ 1,222,136$ 1,274,160$ 1,294,287$ 1,338,468$
Expense Projections 2012 2013 2014 2015 2016
Labor
Salaries, Wages, and
Supplements 300,823$ 305,534$ 318,540$ 323,572$ 334,617$
Payroll Taxes 25,269$ 25,665$ 26,757$ 27,180$ 28,108$
Total Labor 326,092$ 331,199$ 345,297$ 350,752$ 362,725$
Repair and Maintenance 48,132$ 48,885$ 50,966$ 51,771$ 53,539$
Materials
Supplies and Other 120,329$ 122,214$ 127,416$ 129,429$ 133,847$
Util ities 54,148$ 54,996$ 57,337$ 58,243$ 60,231$
Advertising 120,329$ 122,214$ 127,416$ 129,429$ 133,847$
Insurance 55,351$ 56,218$ 58,611$ 59,537$ 61,570$
Subtotal: Operating Expenses 724,381$ 735,726$ 767,044$ 779,161$ 805,758$
Cost of Sales
Food and Beverage 81,222$ 82,494$ 86,006$ 87,364$ 90,347$
Merchandise 15,041$ 15,277$ 15,927$ 16,179$ 16,731$
Total Cost of Sales 96,263$ 97,771$ 101,933$ 103,543$ 107,077$
Total Operating Expenses 820,644$ 833,497$ 868,977$ 882,704$ 912,835$
Net Operating
Revenue/(Expense) 478,910$ 486,410$ 507,116$ 515,126$ 532,710$
Option 2: Most Likely Scenario

APPENDIX 71
Financial Performance – High Attendance Scenario
High
Attendance
Scenario:
2012
High
Attendance
Scenario:
2013
High
Attendance
Scenario:
2014
High
Attendance
Scenario:
2015
High
Attendance
Scenario:
2016
Number of Visitors 75,453 76,638 81,174 82,716 85,361
Construction Cost 9,403,836 - - - -
2012 2013 2014 2015 2016
Revenue Projections
Admissions 1,027,276 1,043,408 1,105,164 1,126,166 1,162,177
Concessions 342,425 347,803 368,388 375,389 387,392
Total Revenue 1,369,702$ 1,391,211$ 1,473,552$ 1,501,555$ 1,549,570$
Expense Projections
Labor
Salaries, Wages, and
Supplements 300,823$ 305,534$ 318,540$ 323,572$ 334,617$
Payroll Taxes 25,269$ 25,665$ 26,757$ 27,180$ 28,108$
Total Labor 326,092$ 331,199$ 345,297$ 350,752$ 362,725$ Repair and Maintenance 48,132$ 48,885$ 50,966$ 51,771$ 53,539$
Materials
Supplies and Other 120,329$ 122,214$ 127,416$ 129,429$ 133,847$
Utilities 54,148$ 54,996$ 57,337$ 58,243$ 60,231$
Advertising 120,329$ 122,214$ 127,416$ 129,429$ 133,847$
Insurance 55,351$ 56,218$ 58,611$ 59,537$ 61,570$
Subtotal: Operating Expenses 724,381$ 735,726$ 767,044$ 779,161$ 805,758$
Cost of Sales
Food and Beverage 92,455$ 93,907$ 99,465$ 101,355$ 104,596$
Merchandise 15,041$ 15,277$ 15,927$ 16,179$ 16,731$
Total Cost of Sales 107,496$ 109,183$ 115,392$ 117,534$ 121,327$
Total Operating Expenses 831,877$ 844,909$ 882,436$ 896,694$ 927,084$ Net Operating
Revenue/(Expense) 537,825$ 546,302$ 591,116$ 604,861$ 622,485$
High Attendance Scenario
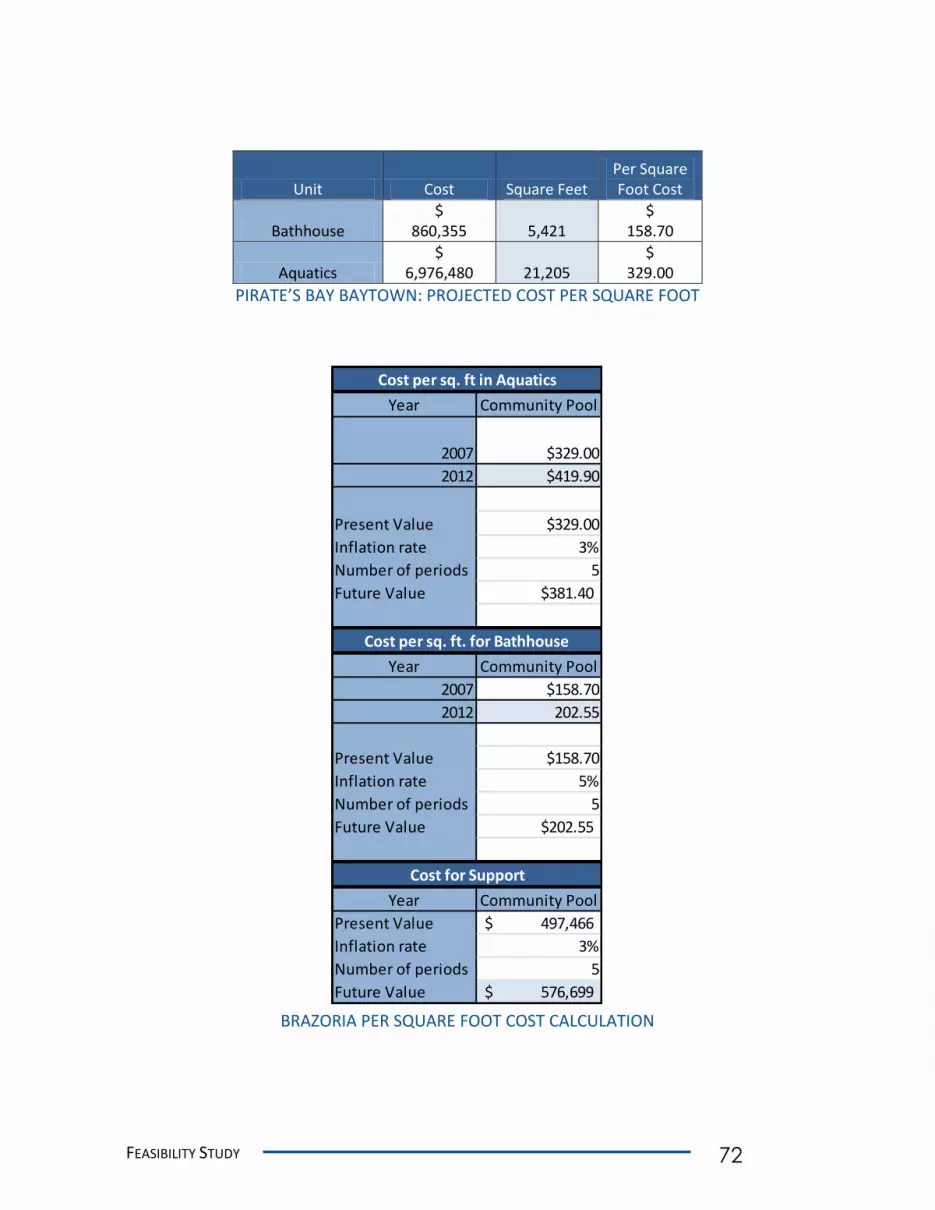
FEASIBILITY STUDY 72
Unit Cost Square Feet Per Square Foot Cost
Bathhouse $
860,355 5,421 $
158.70
Aquatics $
6,976,480 21,205 $
329.00
PIRATE’S BAY BAYTOWN: PROJECTED COST PER SQUARE FOOT
BRAZORIA PER SQUARE FOOT COST CALCULATION
Year Community Pool
2007 $329.00
2012 $419.90
Present Value $329.00
Inflation rate 3%
Number of periods 5
Future Value $381.40
Year Community Pool
2007 $158.70
2012 202.55
Present Value $158.70
Inflation rate 5%
Number of periods 5
Future Value $202.55
Year Community Pool
Present Value 497,466$
Inflation rate 3%
Number of periods 5
Future Value 576,699$
Cost per sq. ft in Aquatics
Cost per sq. ft. for Bathhouse
Cost for Support

APPENDIX 73
REFERENCES 1 www.waterparks.org 2 http://www.hladvisors.com/newsletter-july09-1.htm 3 http://www.jurispro.com/files/documents/doc-1066205982-article-1817.pdf 4 William L. Haralson & Associates. http://www.wlha-inc.com/uploadedDocs/THE%20FEASIBILITY%20STUDY.doc 5 http://www.brownwoodnews.com/index.php?option=com_content&view=article&id=5854:brownwoods-
aquatic-center-season-winding-down&catid=36:life&Itemid=59 6 http://www.jurispro.com/files/documents/doc-1066205982-article-1817.pdf 7 http://www.waterparks.org/otherArticles/Waterpark%20Industry%20General%20Facts%202011.pdf 8 http://www.counsilmanhunsaker.com/portfolio/parks-recreation/ 9 http://www.herrva.com/PDF10-29-08/THE%20WATER%20PARK%20INDUSTRY.pdf 10 http://www.pointmallardpark.com/waterpark.php 11 http://www.splashwaywaterpark.com/ 12 http://www.rv-ranch.com/ 13 http://www.baytown.org/piratesbay/index.htm 14 http://www.waterparks.org/pdf%5CTriple_Play.pdf 15 Interview with Paradise Entertainment manager 16 http://www.pwoftexas.com/ 17 http://www.chesapeakebeachwaterpark.com/ 18 http://www.splashintheboro.com/ 19 http://www.connectstatesboro.com/news/archive/2643/ 20
William L. Haralson & Associates. http://www.wlha-inc.com/uploadedDocs/THE%20FEASIBILITY%20STUDY.doc 7
Ibid 22 Texas Department of Transportation 23 Ibid 24 William L. Haralson & Associates. . http://www.wlha-inc.com/uploadedDocs/THE%20FEASIBILITY%20STUDY.doc 25 Ibid 26 http://www.noaa.gov/ 27 http://www.bakerlawson.com/ 28 http://blog.arborday.org/using-trees-and-shrubs-to-reduce-noise/ 29 http://www.fhwa.dot.gov/environment/noise/noise_barriers/design_construction/keepdown.cfm 30 http://law.onecle.com/texas/local-government/42.021.00.html 31 http://www.oas.org/DSD/publications/Unit/oea66e/ch08.htm 32 Ibid 33 U.S. Census 34 http://www.houstontx.gov/abouthouston/houstonfacts.html 35
U.S. Census. http://factfinder2.census.gov 36
Ibid 37 ESRI Business Analyst, 2012 38 William L. Haralson & Associates. http://www.wlha-inc.com/uploadedDocs/THE%20FEASIBILITY%20STUDY.doc 39 Ibid 40 U.S. Census 41 ESRI Business Analyst, 2012 42 Interview with North Richland Hills’ NRH20 water park complex 43
http://www.escapedown288.com/ 44
http://www.tpwd.state.tx.us/spdest/visitorcenters/seacenter/ 45
http://www.lakejacksonmuseum.org/ 46
http://www.bcfas.org/ 47
http://msrhouston.com/ 48
http://www.surfsidetx.org/default.aspx?name=city.things_todo

FEASIBILITY STUDY 74
49 Marsh, William M. (2010). Landscape Planning, Environmental Applications, 5
th Edition. University of Michigan:
John Wiley and Sons, Inc. 50 http://visitbrazosport.com/docs/brazosport_BCVC.pdf 51 http://www.tpwd.state.tx.us/publications/pwdpubs/media/pwd_bk_p4000_0038.pdf 52 U.S. Fish & Wildlife Service. http://library.fws.gov/pubs/birding_natsurvey06.pdf 53 http://library.fws.gov/pubs/birding_natsurvey06.pdf 54 http://www.pacificedc.org/Library%20Docs/RV%20Park%20Industry%20Snapshot.pdf 55 Ibid 56 http://www.brazoria-county.com/parks/index.html 57 http://www.sugar-grove.il.us/Dept_CD/SDD5.pdf 58 U.S. Census 59 2012 ESRI Business Analyst 60 William L. Haralson & Associates. http://www.wlha-inc.com/uploadedDocs/THE%20FEASIBILITY%20STUDY.doc 61
Ibid 62 William L. Haralson & Associates. http://www.wlha-inc.com/uploadedDocs/THE%20FEASIBILITY%20STUDY.doc 63
RV Parks Industry Snapshot. Center for Economic Vitality. http://www.pacificedc.org/Library%20Docs/ RV%20Park %20Industry%20Snapshot.pdf
64 Recreation Vehicle Industry Association. http://www.rvia.org/?ESID=trend
65 Ibid
66 http://www.census.gov/econ/industry/def/d7212.htm
67 RV Parks Industry Snapshot. Center for Economic Vitality. http://www.pacificedc.org/Library%20Docs/
RV%20Park%20Industry%20Snapshot.pdf 68
The National Association of RV Parks and Campgrounds 69
https://www.frontiertown.com/frontier-town/ 70
https://www.frontiertown.com/frontier-town/the-legend.cfm 71
https://www.frontiertown.com/waterpark-and-golf/ 72
http://visitbrazosport.com/docs/brazosport_BCVC.pdf
Related Documents