(Altar Wash - Brawley Wash Watershed) Brawley Wash - Los Robles Wash Watershed - Arizona

Welcome message from author
This document is posted to help you gain knowledge. Please leave a comment to let me know what you think about it! Share it to your friends and learn new things together.
Transcript

(Altar Wash - Brawley Wash Watershed)Brawley Wash - Los Robles Wash Watershed - Arizona
Released by
Sharon MedgalDirector
University of ArizonaWater Resources Research Center
Principle Investigators
Dino DeSimone - Natural Resources Conservation Service Phoenix ArizonaKeith Larson - Natural Resources Conservation Service Phoenix ArizonaKristine Uhlman - Water Resources Research Center University of ArizonaD Phil Guertin - School of Natural Resources University of Arizona
The United States Department of Agriculture (USDA) prohibits discrimination in all its programs and activities on the basis of race color national origin gender religion age disability political beliefs sexual orientation and marital or family status (Not all prohibited bases apply to all programs) Persons with disabilities who require alternative means for communication of program information (Braille large print audiotape etc) should contact USDArsquos TARGET Center at 202-720-2600 (voice and TDD)
To file a complaint of discrimination write USDA Director Office of Civil Rights Room 326W Whitten Building 14th and Independence Avenue SW Washington DC 20250-9410 or call (202) 720-5964 (voice or TDD)USDA is an equal employment opportunity provider and employer
David McKayState Conservationist
US Department of AgricultureNatural Resources Conservation Service
Cite asUSDA Natural Resource Conservations Serivce Arizona and University of Arisona Water Resources Research Center 2008 Little Colorado River Headwaters Arizona Rapid Watershed Assessment
Cite asUSDA Natural Resource Conservation Service Arizona and University of Arizona Water Resources Research Center 2008 Brawley Wash - Los Robles Wash Watershed (Altar Wash - Brawley Wash Watershed) Arizona Rapid Watershed Assessment
Brawley Wash-Los Robles Wash Watershed 15050304
(Altar Wash-Brawley Wash Watershed)
8-Digit Hydrologic Unit Rapid Watershed Assessment
Section 1 Introduction Overview of Rapid Watershed Assessments
A Rapid Watershed Assessment (RWA) is a concise report containing information on natural resource conditions and concerns within a designated watershed The rapid part refers to a relatively short time period to develop the report as compared to a more comprehensive watershed planning effort The ldquoassessmentrdquo part refers to a report containing maps tables and other information sufficient to give an overview of the watershed including physical characteristics and socioeconomic trends
The assessments involve the collection of readily available quantitative and qualitative information to develop a watershed profile and sufficient analysis of that information to generate an appraisal of the conservation needs of the watershed These assessments are conducted by conservation planners using Geographic Information System (GIS) technology Conservation Districts and other local leaders along with public land management agencies are involved in the assessment process
An RWA serves as a communication tool between the Natural Resources Conservation Service (NRCS) and partners for prioritizing conservation
work in selected watersheds RWAs serve as a platform for conservation program delivery provide useful information for development of NRCS and Conservation District business plans and lay a foundation for future cooperative watershed planning
General Description of the Brawley Wash-Los Robles Wash Watershed
The Brawley Wash-Los Robles Wash Watershed (also locally referred to as the Altar Wash-Brawley Wash Watershed or Altar and Avra Valleys) is located in the south-central portion of the state of Arizona The Watershed lies west of I-19 and east of the Baboquivari Mountains north of the US-Mexico border and south of Pinal County except for a small section located in Pinal County (Figure 1-1) The watershed can be defined as the area drained by the Altar Wash Brawley Washes and Los Robles Wash to the confluence with the Santa Cruz River The watershed comprises 900480 acres (1407 square miles) and is located approximately 97 in Pima County and about 2 in Santa Cruz County and 1 in Pinal County Forty-one percent of the land is state owned 24 is privately owned 11 is wildlife preserve 10 is managed by the Bureau of Land Management 8 is Tohono Orsquoodham Indian Reservation 3 is National Forest 2 is national parks and 1 is state parks There are about 10000 acres of irrigated cropland in the watershed however much of this cropland is being rapidly converted to urban uses and this trend is expected to continue in the
Brawley Wash-Los Robles Wash Watershed Rapid Watershed Assessment Section 1 ndash Introduction page 1- 1
future Important crops include alfalfa and cotton The remaining area is primarily rangeland and urban land Livestock use is dominated by ephemeral steer operations at the lower elevations and cow calf operations at the higher elevations Major towns and cities include Arivaca and a portion of the Town of Marana The metropolitan area of Tucson is east of and outside the watershed Conservation assistance is provided through two Natural Resource Conservation Districts Pima and Tohono Orsquoodham There are two US Department of Agriculture (USDA) Service Centers in the area located in Tucson and Sells Resource concerns in the watershed include soil erosion rangeland site stability rangeland hydrologic cycle excessive runoff (causing flooding or ponding) aquifer overdraft effect of air quality on visibility and plant health threatened or endangered plant and animal species noxious and invasive plants wildfire hazard inadequate water for fish and wildlife habitat fragmentation and inadequate distribution of water for domestic animals (NRCS Factsheet)
Brawley Wash-Los Robles Wash Watershed Rapid Watershed Assessment Section 1 ndash Introduction page 1- 2
Section 2 Physical Description Watershed Size The Brawley Wash-Los Robles Wash Watershed covers approximately 1407 square miles (900480 acres) representing about 12 of the State of Arizona The watershed has a maximum width of about 25 miles east to west and a maximum length of about 65 miles north to south The high point in the watershed is the Baboquivari Mountains near Baboquivari Peak at 7257 feet and the low point is the confluence of Brawley Wash and the Santa Cruz River at 1847 feet The Brawley Wash-Los Robles Wash Watershed was delineated by the US Geological Survey and has been subdivided by the NRCS into smaller watersheds or drainage areas Each drainage area has a unique hydrologic unit code number (HUC) and a name based on the primary surface water feature within the HUC These drainage areas can be further subdivided into even smaller watersheds as needed The Brawley Wash-Los Robles Wash Watershed is an 8-digit HUC of 15050304 and contains the following 10-digit HUCs (Figure 2-1)
bull 1505030401 Arivaca Creek bull 1505030402 Puertocito Wash bull 1505030403 Altar Wash bull 1505030404 Upper Brawley
Wash bull 1505030405 Lower Brawley
Wash bull 1505030406 Los Robles Wash
Geology The Brawley Wash-Los Robles Wash Watershed is located within Arizonarsquos Basin and Range Province The Basin and Range Province of southern and western Arizona is an area where the Earthrsquos crust has been stretched and broken by numerous faults so that mountain ranges and basins (broad valleys) have formed by the vertical motion of large crustal blocks The Basin and Range Province was formed from 28 to 12 million years ago as the Baja California portion of the Earthrsquos tectonic Pacific Oceanic plate began diverging from the continental plate stretching the continental plate and forming the equivalent of stretch marks in the earthrsquos crust nearly parallel to the strike (direction) of the plate boundary As the earthrsquos crust is stretched blocks of crust break and drop in a pattern of valley basins and high peak ranges and is known as the Basin and Range Province within Arizona and other regions of Mexico and the western United States The watershed is bounded on the west by the Baboquivari Mountains a range of block-faulted mountains that are crosscut by northwest-striking faults and shear zones that are part of a regional structural pattern The Baboquivaris and the closely related Quinlan Mountains to the north are composed of Jurassic Cretaceous and Tertiary granite interspersed with small amounts of schist and sedimentary rocks (Goodwin 1985) Volcanic remnants of a large caldera the Tucson Sierrita and Tumacacori Mountains delineate the eastern limit of the watershed and to the south the
Brawley Wash ndash Los Robles Wash Watershed Rapid Watershed Assessment Section 2 ndash Physical Description page 2- 1
Atascosa Highlands and Pajarita Mountains form a barrier that acts as the watershedrsquos southeastern limit The Sierritas which combine Paleozoic and Mesozoic sedimentary rocks with Cretaceous-aged volcanic rocks are a valuable source of copper in the region several open-pit mines on the east side of the range mine the large deposits of poyphory copper found there (Chronic 1983) (Figure 2-2) Soils Soils within the Brawley Wash ndash Los Robles Wash Watershed are diverse and formed as the result of differences in climate vegetation geology and physiography Detailed soils information for the watershed is available from the Natural Resources Conservation Service (NRCS) within the following Soil Surveys ldquoSoil Survey of Pima County AZ Eastern Partrdquo and ldquoSoil Survey of the Tucson ndash Avra Valley Area Pima County AZrdquo Soils data and maps from these Soil Surveys can be accessed through the NRCS Web Soil Survey website httpwebsoilsurveynrcsusdagov Common Resource Areas The USDA Natural Resources Conservation Service (NRCS) defines a Common Resource Area (CRA) as a geographical area where resource concerns problems or treatment needs are similar (NRCS 2006) It is considered a subdivision of an existing Major Land Resource Area (MLRA) Landscape conditions soil climate human considerations and other natural resource information are used to determine the geographic boundaries of a Common Resource Area
The Brawley Wash-Los Robles Wash Watershed is comprised of four Common Resource Areas (Figure 2-3 and Table 2-2) Table 2-1 Brawley Wash ndash Los Robles Wash Watershed Common Resource Areas Common Resource Area Type
Area (sq mi)
Percent of Watershed
401 Upper Sonoran Desert 694 49 402 Middle Sonoran Desert 49 3 411 Chihuahuan ndash Sonoran Desert Shrubs 69 5 413 Chihuahuan ndash Sonoran Semidesert Grasslands 596 42 Data Sources GIS map layer ldquocrardquo Arizona Land Information System (ALRIS 2004) Natural Resource Conservation Service (NRCS 2006) Beginning at the lower end of the watershed CRA 402 ldquoMiddle Sonoran Desertrdquo occurs at elevations ranging from 1200 to 2000 feet Precipitation averages 7 to 10 inches per year Vegetation includes saguaro palo verde creosote bush triangle bursage brittlebush prickly pear cholla desert saltbush wolfberry bush muhly threeawns and big galleta The soils in the area have a hyperthermic soil temperature regime and a typic aridic soil moisture regime The dominant soil orders are Aridisols and Entisols Deep stratified coarse to fine-textured soils occur on floodplains and alluvial fans Deep moderately fine and fine-textured and gravelly moderately fine-textured soils occur on fan terraces CRA 401 ldquoUpper Sonoran Desertrdquo occurs at elevations ranging from 2000
Brawley Wash ndash Los Robles Wash Watershed Rapid Watershed Assessment Section 2 ndash Physical Description page 2- 2
to 3200 feet with precipitation averaging 10 to 13 inches per year Vegetation includes saguaro ironwood palo verde mesquite range ratany creosotebush triangle bursage prickly pear cholla wolfberry bush muhly threeawns ocotillo and globe mallow The soils in the area have a thermic soil temperature regime and a typic aridic soil moisture regime The dominant soil orders are Aridisols and Entisols Deep moderately coarse-textured to fine textured soils occur on alluvial fans and drainageways Deep gravelly limy moderately coarse to moderately fine-textured soils occur on fan terraces Shallow cobbly and gravelly soils and rock outcrop occur on hills and mountains Moving up the watershed CRA 413 ldquoChihuahuan ndash Sonoran Semidesert Grasslandsrdquo occurs at elevations ranging from 3200 to 5000 feet with precipitation averaging 12 to 16 inches per year Vegetation includes mesquite catclaw acacia palo verde range ratany fourwing saltbush tarbush littleleaf sumac sideoats grama black grama plains lovegrass cane beardgrass tobosa threeawns Arizona cottontop and bush muhly The soils in the area have a thermic temperature regime and an ustic aridic soil moisture regime The dominant soil orders are Entisols Aridisols and Mollisols Deep fine-textured and gravelly moderately coarse to moderately fine-textured soils occur on fan terraces Shallow cobbly and gravelly soils and rock outcrop occur on hills and mountains In the upper portions of the watershed occurs CRA 411 ldquoMexican Oak-Pine Forest and Oak Savannahrdquo with
elevations ranging from 4500 to 7500 feet Precipitation averages 16 to 30 inches Vegetation includes Emory oak Arizona white oak one-seed juniper alligator juniper California bricklebush skunkbush sumac Arizona rosewood wait-a-bit mimosa sideoats grama blue grama wooly bunchgrass plains lovegrass squirreltail and pinyon ricegrass The soils in the area have a thermic to mesic temperature regime and an aridic ustic to typic ustic soil moisture regime The dominant soil orders are Entisols and Mollisols Shallow cobbly and gravelly soils and rock outcrop occur on hills and mountains These four Common Resource Areas (402 401 413 411) occur within the Basin and Range Physiographic Province which is characterized by numerous mountain ranges rising abruptly from broad plain-like valleys and basins Igneous and metamorphic rock classes dominate the mountain ranges and sediments filling the basins represent combinations of fluvial lacustrine colluvial and alluvial deposits Slope Classifications Slope as well as soil characteristics and topography are important when assessing the vulnerability of a watershed to erosion Approximately 78 of the Brawley Wash ndash Los Robles Wash Watershed has a slope less than 15 while 10 of the watershed has a slope greater than 15 (Table 2-2 and Figure 2-4) The Lower Brawley Wash Watershed is relatively flat with only 4 of its area over 15 slope and 87 less than 5 slope The Arivaca Creek Watershed is relatively steeper with
Table 2-2 Brawley Wash ndash Los Robles
Brawley Wash ndash Los Robles Wash Watershed Rapid Watershed Assessment Section 2 ndash Physical Description page 2- 3
Wash Watershed Slope Classifications Percent Slope Watershed Name Area
(sq mi) lt 5 5-15 gt15 Los Robles Wash 1505030406 210 83 11 6
Lower Brawley Wash 1505030405 410 87 9 4
Upper Brawley Wash 1505030404 149 70 13 17
Altar Wash 1505030403 350 74 11 15
Puertocito Wash 1505030402 149 83 9 7
Arivaca Creek 1505030401 139 55 29 16
Brawley Watershed 1407 78 12 10 Data Sources Derived from DEM obtained from US Geological Survey April 8 2003 httpedcusgsgovgeodata 16 of the area greater than 15 slope and 55 less than 5 slope Streams Lakes and Gaging Stations The locations of active and inactive gaging stations and their respective annual mean stream flow are found in Table 2-31 Nearly all streams and washes in this watershed are intermittent and therefore flows only occur during runoff periods Altar Wash near Three Points has the largest active stream flow with 535 cfs Arivaca Creek at Arivaca has the lowest active stream flow with 016cfs Table 232 lists major lakes and reservoirs in the Brawley Wash ndash Los Robles Wash as well as their watershed position surface area elevation and dam name Arivaca Lake is the largest surface water in the
watershed with an area of about 118 acres Figure 2-5 lists the major streams and washes and their lengths Stream and wash lengths range from 36 miles for Brawley Wash to 20 miles for Bailey Wash The purpose of the Central Arizona Project (CAP) Canal is to transfer Colorado River water to cities and farms in central and southern Arizona Thirty-six miles of the total 349 mile long CAP canal are in the watershed In addition to the CAP there are 31 miles of irrigation canals managed by water providers for agricultural water use
Brawley Wash ndash Los Robles Wash Watershed Rapid Watershed Assessment Section 2 ndash Physical Description page 2- 4
Table 2-31 USGS Brawley Wash ndash Los Robles Wash Watershed Stream Gages and Annual Mean Stream Flow
USGS
Gage ID Site Name Begin Date End Date
Annual Mean
Stream Flow (cfs)
Active Gages 09486590 Arivaca Creek at Arivaca 05-01-2002 09-30-2006 016 09486800 Altar Wash near Three Points 01-11-1966 09-30-2006 535 09487000 Brawley Wash near Three
Points 12-14-1990 09-30-2006 506
Inactive Gages 09486580 Arivaca Circle at Arivaca 10-01-1995 04-30-2002 087 09486600 Arivaca Wash Near Arivaca 03-17-1967 09-30-1972 346 Discontinuous years of data Data Sources GIS dataset ldquousgs_gages_utmrdquo USGS 2007 USGS website National Water Information System httpwaterdatausgsgovnwis Table 2-32 Brawley Wash ndash Los Robles Wash Watershed Major Lakes and Reservoirs
Lake Name (if known) Watershed
Surface Area (acres)
Elevation (feet above mean sea
level) Dam Name (if known)
Aguirre Lake Puertocito Wash 51 3455
Arivaca Lake Arivaca Creek 118 3773 Arivaca Dam
BK Tank Los Robles Wash 34 1995 Data Sources GIS data layer ldquoLakesrdquo Arizona State Land Department Arizona Land Resource Information System (ALRIS) February 7 2003 httpwwwlandstateazusalrisindexhtml
Brawley Wash ndash Los Robles Wash Watershed Rapid Watershed Assessment Section 2 ndash Physical Description page 2- 5
Table 2-33 Brawley Wash ndash Los Robles Wash Watershed Major Streams and Canals Lengths
Stream Name Watershed Stream Length
(miles) Alambre Wash Upper Brawley
Wash Altar Wash 15 Altar Wash Altar Wash 23 Arivaca Creek Arivaca Creek 15 Arroyo del Compartidero Puertocito Wash 7 Bailey Wash Puertocito Wash 2 Blanco Wash Los Robles Wash 19 Brawley Wash Lower Brawley
Wash Upper Brawley Wash 35
Los Robles Wash Los Robles Wash Lower Brawley Wash 19
Penitas Wash Altar Wash 13 Puertocito Wash Puertocito Wash 10 Central Arizona Project (CAP) Canal Lower Brawley Wash 36 Irrigation Canals Altar Wash Los
Robles Wash Lower Brawley Wash 31
Data Sources GIS data layer ldquoStreamsrdquo Arizona State Land Department Arizona Land Resource Information System (ALRIS) October 10 2002 httpwwwlandstateazusalrisindexhtml Riparian Vegetation The Arizona Game amp Fish Department has identified and mapped riparian vegetation associated with perennial waters in response to the requirements of the state Riparian Protection Program (July 1994) This map was used to identify riparian areas in the Brawley Wash ndash Los Robles Wash Watershed (Figure 2-6) Four of the ten types of riparian areas occur within the Brawley Wash ndash Los Robles Wash Watershed Riparian areas encompass approximately 17000 acres (27 sq mi) or less than 02 of the entire watershed North American
Warm Desert Riparian Mesquite Bosque comprises about 15397 acres or 90 of the riparian areas North American Warm Desert Riparian Woodland and Shrubland and North American Warm Desert Lower Montaine Riparian Woodland and Shrubland comprise the remaining 1281 acres and 459 acres of the watershed respectively (Table 2-4) Altar Wash has the greatest amount of riparian vegetation with 7664 acres (12 square miles) The Tanque Verde CreekRillito River Watershed has about 2243 acres (4 sq mi) and the Los Robles Wash Watershed has only 1923 acres (3 sq mi)
Brawley Wash ndash Los Robles Wash Watershed Rapid Watershed Assessment Section 2 ndash Physical Description page 2- 6
Table 2-4 Brawley Wash ndash Los Robles Wash Watershed Riparian Vegetation (acres) by 10 Digit Watershed (Part 1 of 2) Riparian Vegetation Community
Los Robles Wash
1505030406
Lower Brawley Wash
1505030405
Upper Brawley Wash
1505030404
Altar Wash 1505030403
Puertocito Wash
1505030402 North American Warm Desert Lower Montaine Riparian Woodland and Shrubland
- 1 51 332 45
North American Warm Desert Riparian Woodland and Shrubland
896 97 64 185 -
North American Warm Desert Riparian Mesquite Bosque
1027 1747 1806 7147 1493
Total Area (acres) 1923 1845 1921 7664 1538 Data Sources GIS data layer ldquonewgapvegrdquo Southwest Regional GAP Program October 13 2005 httpfws-nmcfwrunmsueduswregap Table 2-4 Brawley Wash ndash Los Robles Wash Watershed Riparian Vegetation (acres) by 10 Digit Watershed (Part 2 of 2) Riparian Vegetation Community
Arivaca Creek 1505030401
Brawley Wash ndash Los Robles Wash Watershed
North American Warm Desert Lower Montaine Riparian Woodland and Shrubland
29 459
North American Warm Desert Riparian Woodland and Shrubland
38 1281
North American Warm Desert Riparian Mesquite Bosque
2176 15397
Total Area (acres) 2243 17137 Data Sources GIS data layer ldquonewgapvegrdquo Southwest Regional GAP Program October 13 2005 httpfws-nmcfwrunmsueduswregap
Brawley Wash ndash Los Robles Wash Watershed Rapid Watershed Assessment Section 2 ndash Physical Description page 2- 7
Land Cover The Riparian Vegetation map (Figure 2-6) and Land Cover map (Figure 2-7) were created from the Southwest Regional GAP (GAP Analysis Project) land cover map (Lowry et al 2005) Within the Brawley Wash ndash Los Robles Wash Watershed Table 2-5 identifies the ScrubShrub as the most common land cover type over the entire watershed encompassing about 76 of the watershed The next most common types are GrasslandHerbaceous (8) and Evergreen Forest (6)
Note There are a total of 26 GAP vegetation categories present within the Brawley Wash-Los Robles Watershed boundary Some of these categories occur only in small concentrations and are not visible at the small scale in which the maps are displayed Some of the vegetation categories were re-grouped in order to increase the legibility of the map In collaboration with NRCS staff were able to create a total of 14 grouped GAP vegetation categories as shown on Table 2-5
Table 2-5 Brawley Watershed Southwest Regional GAP Analysis Project Land Cover Percent of 10-digit Watershed (Part 1 of 2)
Watershed
Land
C
over
Los Robles Wash
1505030406
Lower Brawley Wash
1505030405
Upper Brawley Wash
1505030404Altar Wash
1505030403
Puertocito Wash
1505030402Agriculture (Irrigated Cropland) 4 6 02 - - Altered or Disturbed 1 03 - - 3 Developed High Intensity 1 06 - - - Developed Low Intensity 4 10 1 - - Emergent Herbaceous Wetland - - - 03 02 Evergreen Forest - 04 13 11 6 Grassland Herbaceous - 02 6 11 25 Open Water - 01 - - - ScrubShrub 89 79 77 74 63 Sparsely VegetatedBarren 09 4 1 1 1 Woody Wetland 1 1 2 4 2 Area (Sq mi) 210 410 149 350 149
Brawley Wash ndash Los Robles Wash Watershed Rapid Watershed Assessment Section 2 ndash Physical Description page 2- 8
Table 2-5 Brawley Watershed Southwest Regional GAP Analysis Project Land Cover Percent of 10-digit Watershed (Part 2 of 2)
Watershed La
nd
Cov
er
Arivaca Creek 1505030401
Percent of Total
Agriculture - 2 Altered or Disturbed - 05 Developed High Intensity - 03 Developed Low Intensity - 3 Emergent Herbaceous Wetland 1 01 Evergreen Forest 13 6 Grassland Herbaceous 16 8 Open Water 01 - ScrubShrub 66 76 Sparsely VegetatedBarren 2 2 Woody Wetland 3 2 Area (Sq mi) 140 1408 Not necessarily irrigated land Data Sources GIS data layer ldquonewgapvegrdquo Southwest Regional GAP project 2005 Originated by Southwest Regional GAP project httpfws-nmcfwrunmsueduswregap Meteorological Stations Precipitation and Temperature For the years 1961-1990 the average annual precipitation for the Brawley Wash ndash Los Robles Wash Watershed was about 15 inches (WRCC 2004) (Table 2-6) Puertocito Wash and Arivaca Creek Watersheds receives the most rainfall with about 19 inches of annual rain on average while Los Robles Watershed receives the least rainfall with an average of 11
inches annually Average Temperature for the Brawley Wash ndash Los Robles Wash Watershed range from 633oF to 703oF Active meteorological stations in the watershed are located in Figure 2-8 The Western Regional Climate Center calculates the average minimum and maximum temperatures for each month for the period of record and then takes an annual average
Brawley Wash ndash Los Robles Wash Watershed Rapid Watershed Assessment Section 2 ndash Physical Description page 2- 9
Table 2-6 Brawley Watershed Meteorological Stations Temperature (oF) and Precipitation (inyr) with Recent Long-term Records
Temperature (oF) Precipitation (inyr) 10-digit Watershed Name
Meteorological Stations and
Map ID AvgMin
Avg Max Avg
Avg Min
Avg Max
Weighted Average
Los Robles Wash 1505030406
Red Rock 528 851 689 9 13 11
Lower Brawley Wash 1505030405
Tucson 17NW
565
841
703 9 23 13 Upper Brawley Wash 1505030404
Anvil Ranch 489 835 662 13 29 17
Altar Wash 1505030403 - 13 31 17 Puertocito Wash 1505030402 Sasabe 493 791 642 15 23 19 Arivaca Creek 1505030401 Ruby 499 766 633 15 21 19 Brawley Watershed - - - - 9 31 15 Data Sources GIS data layer ldquoprecip_a_azrdquo Water and Climate Center of the NRCS (1998) GIS data layer ldquoNWS_Stationsrdquo Western Regional Climate Center (WRCC) Temperature data July 15 2004 httpwwwwrccdriedusummaryclimsmazhtm Land OwnershipManagement There are 11 different land ownershipmanagement entities in the Brawley Wash ndash Los Robles Wash Watershed (Figure 2-9 and Table 2-7) State Land is the largest category representing about 41 of the watershed followed by the Private Land
with about 24 and Wildlife Preserve with about 11 Saguaro National Park the Bureau of Land Management Game amp Fish Coronado National Forest Tohono Orsquoodham Indian Reservations and the Military hold smaller amounts of land in the watershed
Brawley Wash ndash Los Robles Wash Watershed Rapid Watershed Assessment Section 2 ndash Physical Description page 2- 10
Table 2-7 Brawley Wash ndash Los Robles Wash Watershed Land OwnershipManagement (Percent of each 10-digit Watershed) (part 1 of 2)
Land Owner
Los Robles Wash
1505030406
Lower Brawley Wash
1505030405
Upper Brawley Wash
1505030404Altar Wash
1505030503
Puertocito Wash
1505030402BLM 38 4 5 5 1 Bureau of Reclamation - 1 - - -
Game and Fish -- lt1 lt1
National Forest - - - - 2
Indian Reservation 11 16 19 025 lt1
State Parks - 4 - - - Military - - - - - National Parks - 6 - - -
Private Land 26 40 27 13 8 State Land 25 29 49 66 44 Wildlife Preserve - - - 16 45
Area (square miles) 210 410 149 350 149
Table 2-7 Brawley Watershed Land OwnershipManagement (Percent of each 10-digit Watershed) (part 2 of 2)
Land Owner Arivaca Creek 1505030401
Brawley Watershed
BLM 6 10 Bureau of Reclamation - lt1
Game and Fish lt1 lt1 National Forest 30 3 Indian Reservation - 8
State Parks - 1 Military - - National Parks - 2 Private Land 20 24 State Land 22 41 Wildlife Preserve 21 11 Area (square miles) 139 1408
Data Sources GIS data layer ldquoownershiprdquo Arizona State Land Department Arizona Land Resource Information System (ALRIS) February 7 2007
Brawley Wash ndash Los Robles Wash Watershed Rapid Watershed Assessment Section 2 ndash Physical Description page 2- 11
Land Use The Land Use map (Figure 2-10) was created from the Southwest Regional GAP Analysis Project land cover map (Lowry et al 2005) The land use condition during the early 1990rsquos was determined using the National Land Cover Dataset (NLCD) The NLCD classification contains 21 different land cover and use categories (USGS NLCD Land Cover Class Definitions) however these categories have been consolidated into five land cover types (Figure 2-10 and Table 2-8) The five groupings for the land cover categories are
bull Crop which includes confined feeding operations cropland and pasture orchards groves vineyards nurseries and ornamental horticulture other agricultural land
bull Forest includes areas
characterized by tree cover (natural or semi-natural woody vegetation generally greater than
6 meters tall) tree canopy accounts for 25-100 percent of the cover
bull Water identifies all areas of
surface water generally with less than 25 cover of vegetationland cover
bull Range which includes
herbaceous rangeland mixed range shrub and brush rangeland
bull Urban (high density amp low
density) includes residential areas commercial and services industrial and commercial complexes mixed urban or built-up land other urban or built-up land strip mines quarries and gravel pits transportation communication and utilities
The most common land cover type is Range which makes up about 94 of the watershed Urban Low Intensity is the next most common type with about 3 of the total area
Brawley Wash ndash Los Robles Wash Watershed Rapid Watershed Assessment Section 2 ndash Physical Description page 2- 12
2-8 Brawley Wash ndash Los Robles Wash Watershed Land Use Percent of 10-digit Watershed
Land CoverLocation Crop Forest
Urban High
Intensity
Urban Low
Intensity Range Water Area
(sqmi) Los Robles
Wash 1505030406 40 - 10 40 92 lt10 210
Lower Brawley Wash
1505030405 60 - 10 10 84 lt10 410 Upper Brawley
Wash 1505030404
lt10 lt10
- 10 99 - 149 Altar Wash
1505030403 - lt10 - - gt99 lt10 350 Puertocito
Wash 1505030402 - lt10 - - gt99 lt10 149
Arivaca Creek 1505030401 - - - - gt99 lt10 139 Percent of
Brawley Wash ndash Los Robles
Wash Watershed
20
lt10
lt10 30 94 lt10 1407
Data Sources GIS data layer ldquoSouthwest Regional GAP Programrdquo originated by Southwest Regional GAP program 2005 httpftpnrusueduswgap Mines - Primary Ores Table 2-9 and Figure 2-11 show the types of ores being mined in the Brawley Wash ndash Los Robles Wash
Watershed The most common type of ore is gold with 94 mines (Ward JS and Associates 1973) Other common known ore types are copper silver lead tungsten manganese and uranium
Brawley Wash ndash Los Robles Wash Watershed Rapid Watershed Assessment Section 2 ndash Physical Description page 2- 13
Table 2-9 Brawley Wash ndash Los Robles Wash Watershed Mines ndash Primary Ores
Ore Type Total Number of Mines Asbestos 2 Barium 1 Beryllium 3 Copper 48 Fluorine 6 Geothermal 11 Gold 94 Iron 1 Lead 33 Lithium 1 Manganese 11 Perlite 1 Quartz Crystal 1 Rare Earth 2 Silicon 1 Silver 69 Stone 4 Tungsten 12 Uranium 11 Zeolites 1 Zinc 1 Note If a mine contains more than one ore only the major ore is noted Data Source ldquominesrdquo Arizona Land Information Service 2006
Brawley Wash ndash Los Robles Wash Watershed Rapid Watershed Assessment Section 2 ndash Physical Description page 2- 14
Section 3 Resource Concerns Introduction Conservation Districts and other local leaders along with NRCS and other resource management agencies have identified priority natural resource concerns for this watershed These
concerns can be grouped under the broad resource categories of Soil Water Air Plants or Animals (SWAPA) Refer to Table 3-1 for a listing of priority resource concerns by land use within the Brawley Wash - Los Robles Wash Watershed
Table 3-1 Brawley Wash - Los Robles Wash Watershed Priority Resource Concerns by Land Use
(NRCS 2008) Soil Erosion Soil erosion is defined as the movement of soil from water (sheet and rill or gully) or wind forces requiring treatment when soil loss tolerance levels are exceeded Sheet and rill erosion is a concern
particularly on rangeland in areas of shallow soils and poor vegetative cover Soil loss results in reduced water holding capacity and plant productivity Gully erosion can be a significant problem in areas of steep slopes and deep soils Loss of vegetative cover and down-cutting of streams contribute to gully formation Wind erosion is
Resource Category
Cropland Concerns Rangeland Concerns
Forest Concerns
Urban Concerns
Soil Erosion Sheet amp Rill Erosion
Roads amp Construction Sites
Water Quality Water Quantity
Aquifer Depletion Aquifer Depletion
Aquifer Depletion
Air Quality
Roads amp Construction Sites
Plant Condition
Plant Productivity Health amp Vigor
Noxious amp Invasive Plants Noxious amp Invasive Plants
Noxious amp Invasive Plants
Domestic Animals
Inadequate Quantities amp Quality of Feed amp Forage amp Distribution of Water
Species of Concern
TampE Species amp Declining Species amp Species of Concern
Brawley Wash ndash Los Robles Wash Watershed Rapid Watershed Assessment Section 3 ndash Resource Concerns page 3- 1
locally significant where adequate vegetative cover is not maintained Headcutting of the Santa Cruz River in the far northern portion of the watershed will become a major concern when it reaches Los Robles Wash and causes loss of archaeological sites in the northern Los Robles Archaeological District Conservation practices applied to address this resource concern are generally those that help improve vegetative cover stabilize sites and control water flows Practices may include critical area planting deferred grazing grade stabilization structures herbaceous wind barriers prescribed grazing range planting stream channel stabilization tree and shrub establishment water and sediment control basins water spreading windbreak establishment and wildlife upland habitat management Water Quality The Arizona Department of Environmental Quality (ADEQ) assesses surface water quality to identify which surface waters are impaired or attaining designed uses and to prioritize future monitoring Strategies must be implemented on impaired waters to reduce pollutant loadings so that surface water quality standards will be met unless impairment is solely due to natural conditions Once a surface water has been identified as impaired activities in the watershed that might contribute further loadings of the pollutant are not allowed Agencies and individuals planning future projects in the watershed must be sure
that activities will not further degrade these impaired waters and are encouraged through grants to implement strategies to reduce loading One of the first steps is the development of a Total Maximum Daily Load (TMDL) analysis to empirically determine the load reduction needed to meet standards The draft 2006 Status of Ambient Surface Water Quality in Arizona indicates that very little monitoring has been completed in Brawley Wash Watershed This is due to very little perennial or even intermittent flows in this watershed However one lake is this watershed has been listed as impaired
Arivaca Lake a 118 acre reservoir in the Arivaca Creek Sub-watershed (HUC 150530401) is listed as impaired due to mercury in fish tissue A TMDL was completed in 1999 The primary sources of mercury appear to be atmospheric deposition and natural deposition from local substrates Atmospheric deposition is thought to be coming from other countries and is therefore not readily controllable A fish consumption advisory is in place to warn the public concern risks associated with eating these contaminated fish (Figure 3-1)
Although some data was collected at a few other sites in this watershed there was insufficient data to assess any other lake or stream in the draft 2006 assessment report
Brawley Wash ndash Los Robles Wash Watershed Rapid Watershed Assessment Section 3 ndash Resource Concerns page 3- 2
Water Quantity In the Brawley Wash-Los Robles Wash Watershed (also known as the Avra Valley Subbasin) Altar Wash originates in the southern portion and flows northward to become Brawley Wash Brawley Wash flows to the north and northwest through Avra Valley to its confluence with the Santa Cruz River A portion of Arivaca Wash in the southwest portion of the watershed is perennial (ADWR 1999) Water quantity is a resource concern whenever water supplies are inadequate to meet the needs for agricultural or domestic uses Conservation practices applied to address this resource concern on irrigated cropland are generally those that improve the quantity and efficient distribution of water Practices may include irrigation land leveling irrigation system irrigation water conveyance (ditch or pipeline) irrigation water management and structure for water control Air Quality The Rillito Area in the northern part of the Brawley Wash-Los Robles Watershed is classified by the Arizona Department of Environmental Quality as a PM-10 nonattainment area (ADEQ 2008) (Figure 3-2) Emission sources include the Arizona Portland Cement Company construction unstabilized river banks agriculture unpaved roads and unstabilized road shoulders
Air quality is a resource concern whenever human activities contribute significantly to airborne sediment and smoke resulting in property damage and health problems Conservation
practices applied to address this resource concern are generally those that reduce wind erosion and smoke Practices may include atmospheric resource quality management critical area planting heavy use area protection road closures and treatments and windbreak establishment
Environmental Sites There are no environmental Superfund or Water Quality Assurance Revolving Fund (WQARF) cleanup sites located within the watershed (Figure 3-3) However in the Tucson area about five miles east of the watershed there are three WQARF sites and one EPA Superfund site
Plant Condition
Plant condition is a resource concern whenever plants do not manufacture sufficient food to continue the growth cycle or to reproduce Plant condition is frequently a concern where proper grazing management is not being applied Conservation practices applied to address this resource concern are generally those that maintain or improve the health photosynthetic capability rooting and reproductive capability of vegetation Practices may include brush management critical area planting deferred grazing fencing herbaceous wind barriers nutrient management pest management prescribed grazing prescribed burning range planting recreation area improvement wildlife upland habitat management and windbreak establishment
Brawley Wash ndash Los Robles Wash Watershed Rapid Watershed Assessment Section 3 ndash Resource Concerns page 3- 3
Noxious and Invasive Plants Noxious and invasive plants are a resource concern whenever these species cause unsuitable grazing conditions for livestock or wildlife and due to their potential to out-compete native species which are generally preferred for wildlife habitat value Increases in noxious and invasive plants can result from poor grazing management drought motorized off-road travel road paving and other causes Conservation practices applied to address this resource concern are generally those that control the establishment or reduce the population of noxious and invasive plant species Practices may include brush management deferred grazing fencing forest stand improvement pest management prescribed burning prescribed grazing and wildlife upland habitat management Bark Beetle Drought and Wildfire Arizona has been in an extended drought since 1996 Most areas of the state continue to experience record low winter precipitation and snowpack above-average temperatures and low soil moisture These conditions have led to high vegetation stress high fire potential below-normal streamflow decreasing water supplies and deteriorating range and pasture conditions Although in more forested regions of the state these conditions have led to Bark Beetle infestation this has not been observed in the Brawley Wash ndash Los Robles Wash Watershed (adapted from Arizona Drought Preparedness Annual Report 2006)
The Climate Assessment for the Southwest (CLIMAS) website (wwwispearizonaeduclimas) and ADWR Statewide Drought Program website (wwwazwatergovdwrdrought) provide information on Arizonas drought status The area of Arizona that encompasses the Brawley Wash - Los Robles Wash Watershed has received less than 50 of average annual precipitation placing it in moderate drought status The long-term drought status is severe Domestic Animal Concerns Domestic animal concerns occur whenever the quantity and quality of food are not adequate to meet the nutritional requirements of animals or adequate quantity or distribution of water is not provided This is frequently a concern on rangeland when changes in species composition resulting from poor grazing management and drought can reduce the availability of suitable forage This is also a concern where stock water is not evenly distributed resulting in poor grazing management Conservation practices applied to address this resource concern are generally those that maintain or improve the quantity quality and diversity of forage available for animals reduce the concentration of animals at existing water sources and insure adequate quantity and reliability of water for the management of domestic animals Practices may include brush management deferred grazing fencing pest management prescribed burning prescribed grazing pipelines ponds range planting water spreading wells
Brawley Wash ndash Los Robles Wash Watershed Rapid Watershed Assessment Section 3 ndash Resource Concerns page 3- 4
spring development watering facility and wildlife upland habitat management Species of Concern There are 55 threatened and endangered species listed for Arizona (U S Fish and Wildlife Service website) In 1990 Arizona voters created the Heritage Fund designating up to $10 million per year from lottery ticket sales for the conservation and protection of the statersquos wildlife and natural areas The Heritage Fund allowed for the creation of the Heritage Data Management System (HDMS)
which identifies elements of concern in Arizona and consolidates information about their status and distribution throughout the state (Arizona Game amp Fish website 2006) The Brawley Wash-Los Robles Wash Watershed contains 8 species that are either listed species of concern or candidate species under the US Endangered Species Act (Table 3-2) Of the eight species listed in the watershed six of the species are designated as being in imminent jeopardy of extinction
Table 3-2 Brawley Wash-Los Robles Wash Watershed Species of Concern and Endangered Species Classifications and Observations(1)
Common Name Species Name
USESA(2)
USFS(3)
STATE (4)
Chiricahua Leopard Frog Rana chiricahuensis LT S WSC Gila Topminnow Poeciliopsis occidentalis LE WSC Jaguar Panthera onca LE S WSC Kearneyrsquos Blue Star Amsonia kearneyana LE HS
Masked Bobwhite Colinus virginianus ridgwayi LE WSC
Nichol Turkrsquos Haed Cactus
Echinocactus horizonthalonius var LE HS
Pima Pineapple Cactus Coryphantha scheeri var LE HS Western Yellow-billed Cuckoo
Coccyzus americanus occidentalis C S WSC
Data Sources Arizona Land Information System (ALRIS) Natural Resource Conservation Service (NRCS) Note Status Definitions as Listed by Arizona Game and Fish Department November 26 2006 httpwwwgfstateazusw_ceditshdms_status_definitionsshtml (1) Proposed for Listing (USEA) Federal US Status ESA Endangered Species Act (1973 as amended) US Department of Interior Fish and Wildlife Service (2) Listed LE Listed Endangered imminent jeopardy of extinctionLT Listed Threatened imminent jeopardy of becoming Endangered Candidate (Notice of Review 1999) C Candidate Species for which USFWS has sufficient information on biological vulnerability and
threats to support proposals to list as Endangered or Threatened under ESA However proposed
Brawley Wash ndash Los Robles Wash Watershed Rapid Watershed Assessment Section 3 ndash Resource Concerns page 3- 5
rules have not yet been issued because such actions are precluded at present by other listing activity
(3) USFS US Forest Service (1999 Animals 1999 Plants) US Department of Agriculture Forest Service Region 3S Sensitive those taxa occurring on National Forests in Arizona which are considered sensitive by
the Regional Forester (4) State Status NPL Arizona Native Plant Law (1993) Arizona Department of Agriculture HS Highly Safeguarded no collection allowed WSC Wildlife of Special Concern in Arizona Species whose occurrence in Arizona is or may be in jeopardy or with known or perceived threats or population declines as described by the Arizona Game and Fish Departments listing of Wildlife of Special Concern in Arizona (WSCA in prep) Resource Concern Summary The Brawley Wash Watershed is a mosaic of federal state tribal and private lands where livestock grazing agriculture and recreation are the primary land uses The southern portion of the watershed is primarily managed by the US Forest Service and US Fish and Wildlife Service The northern portion of the watershed is a mixture of state and private lands Livestock grazing is the primary land use activity on the private and state lands The watershed is located near the cities of Tucson and Marana and the southern half of the watershed has seen significant development over the last decade Several important natural areas are located in the watershed The Saguaro National Park West and the Tucson Mountain Park are located in the lower portion of the watershed A portion of Ironwood Forest National Monument is located within the watershed The world famous Arizona-Sonora Desert Museum is located in the watershed near Saguaro National Park West Old Tucson an old movie studio and tourist
attraction is also located in this area This area is heavily used for recreation by both Tucson residents and tourists The Buenos Aires National Wildlife Refuge is located in the upper portion of the watershed The Buenos Aires NWR is one of the largest wildlife refuges in the United States and is a reintroduction location for the endangered masked bobwhite quail (Colinus virginianus ridgwayi) Arivaca Creek and Arivaca Cienega located on the refuge are valuable birding areas in southern Arizona and support a local ecotourism economy in the town of Arivaca Other species of concern found in the watershed include Chiricahua leopard frog (Rana chiricahuensis) Gila topminnow (Poeciliopsis occidentalis) jaguar (Panthera onca) western yellow-billed cuckoo (Coccyzus americanus occidentalis) Kearneyrsquos blue star (Amsonia kearneyana) Nicholrsquos Turkrsquos head cactus (Echinocactus horizonthalonius var) and Pima pineapple cactus (Corypthantha scheeri var)
Brawley Wash ndash Los Robles Wash Watershed Rapid Watershed Assessment Section 3 ndash Resource Concerns page 3- 6
Erosion and sedimentation are major problems in the watershed Brawley Wash started to incise in the early 1900rsquos and today is a large entrenched channel Tributaries to Brawley Wash are also entrenching due to increased channel gradients resulting from channel incisions Erosion control protections have been proposed in the area Arivaca Lake on the headwaters of Arivaca Creek is listed by the Arizona Department of Environmental Quality as impaired due to metals The watershed will see continued development due to population growth in Tucson and Marana Local flooding and continued channel degradation are likely without the implementation of progressive watershed management practices Local leaders have identified watershed health as a priority concern for the Brawley Wash - Los Robles Wash Watershed (Pima County 2000) This includes both the upland areas of the watershed and the riparian or stream course areas The condition of the
upland areas is integral to hydrologic function such that when precipitation falls on the land its disposition is affected by the soil and vegetation which in turn are affected by land uses both historical and current The amount of the precipitation which immediately runs off the land surface and that which infiltrates into the soil to either be used for plant growth or to recharge ground water is dependent on this critical interface The main concern in the Watershed is rapidly expanding urbanization of cropland and increased recreational use of public lands resulting in impacts to vegetation and soil surfaces which may affect hydrologic function and result in accelerated erosion The desert and semi-desert ecosystems have developed in a climatic regime of wide fluctuations of precipitation ranging from drought to flood Human uses superimposed on that climatic regime can tend to exacerbate or ameliorate their effects on soils vegetation and wildlife
Conservation ProgressStatus Conservation progress for the previous five years in the Brawley Wash-Los Robles Wash Watershed has focused on addressing the following primary resource concerns
Soil Condition ndash Organic Matter Depletion Soil Erosion ndash Sheet and Rill Erosion Water Quantity ndash Inefficient Water Use on Irrigated Land Plant Condition ndash Productivity Health and Vigor Domestic Animals ndash Inadequate Quantities and Quality of Feed and Forage
The following table presents conservation accomplishments in this watershed during fiscal years (FY) 2003 through 2007 according to the NRCS Progress Reporting System
Brawley Wash ndash Los Robles Wash Watershed Rapid Watershed Assessment Section 3 ndash Resource Concerns page 3- 7
Table 3-3 Brawley Wash-Low Robles Wash Watershed Conservation Treatment Applied
Brawley Wash-Los Robles Wash Watershed (15050304) FY03-07 Conservation Treatment Applied TOTAL
Conservation Crop Rotation (328) (acres) 1599 Fence (382) (feet) 123187 Irrigation Land Leveling (464) (acres) 176 Irrigation Water Conveyance Ditch and Canal Lining (428) (feet) 2319 Irrigation Water Conveyance Pipeline Underground Plastic (430) (feet) 3470 Irrigation Water Management (449) (acres) 1956 Nutrient Management (590) (acres) 1430 Pest Management (595) (acres) 1771 Pipeline (516) (feet) 28628 Prescribed Grazing (528) (acres) 182092 Residue Management Seasonal (344) (acres) 2016 Upland Wildlife Habitat Management (645) (acres) 25119
Brawley Wash ndash Los Robles Wash Watershed Rapid Watershed Assessment Section 3 ndash Resource Concerns page 3- 8
Section 4 Census Social and Agricultural Data
This section discusses the human component of the watershed and the pressure on natural resources caused by humans and by population change Population Density 1990 Census block statistics for 1990 were compiled from information prepared by Geo-Lytics (Geo-Lytics 1998) These data were linked with census block data and used to create a density map (Figure 4-1) through a normalization process using a grid of 7 km squares This process involves calculating density per census block and intersecting it with the grid which is then used to calculate the number of people and thus density per grid square Table 4-1 shows the tabulated minimum maximum and mean number of people per square mile in 1990 for the watershed In 1990 the mean population density for the entire watershed was about 19 people per square mile Lower Brawley Wash Watershed had the highest population mean with about 51 people per square mile and a maximum of 2470 people per square mile Altar Wash Watershed had the lowest density with a mean of only about 05 people per square mile
Population Density 2000 The Census Block 2000 statistics data were downloaded from the Environmental Systems Research Institute (ESRI) website (ESRI Data Products 2003) and are shown in Table 4-2 A population density map (Figure 4-2) was created from these data The mean population density in 2000 was about 29 people per square mile Lower Brawley Wash Watershed had the highest mean population density (78 peoplesq mi) and the highest maximum population density (2643 peoplesqmi) Population Density Change 1990-2000 The 1990 and 2000 population density maps were used to create a population density change map The resulting map and table (Figure 4-3 and Table 4-3) show population increase or decrease over the ten year time frame Overall mean population density increased by about 10 people per square mile during this ten-year time period Lower Brawley Wash Watershed had the largest increase in mean population at 27 people per square mile
Brawley Wash ndash Los Robles Wash Watershed Rapid Watershed Assessment Section 4 ndash Census Social and Ag page 4- 1
Table 4-1 Brawley Wash ndash Los Robles Wash Watershed 1990 Population Density (peoplesquare mile)
Population Density (peoplesqmi) 10-digit Watershed Name
Area (sq miles) Min Max Mean
Los Robles Wash 1505030406 210 0 651 14
Lower Brawley Wash 1505030405 410 0 2470 51
Upper Brawley Wash 1505030404 149 0 53 3
Altar Wash 1505030403 350 0 8 05 Puertocito Wash 1505030402 149 0 10 04
Arivaca Creek 1505030401 139 0 73 4 Total Brawley Wash ndash Los Robles Wash Watershed 1408 0 2470 19
Note Adjacent watersheds may share a grid square Data Sources Census block statistics for 1990 were compiled from a CD prepared by Geo-Lytics (GeoLytics Inc1998 Census 1990 Census CD + Maps Release 30) New Mexico Resource Geographic Information (RGIS 2007) Table 4-2 Brawley Wash ndash Los Robles Wash Watershed 2000 Population Density (peoplesquare mile)
Population Density (peoplesqmi) 10-digit Watershed Name
Area (sq miles) Min Max Mean
Los Robles Wash 1505030406 210 0 975 24
Lower Brawley Wash 1505030405 410 0 2643 78
Upper Brawley Wash 1505030404 149 0 204 5
Altar Wash 1505030403 350 0 11 03 Puertocito Wash 1505030402 149 0 1 02
Arivaca Creek 1505030401 139 0 96 5 Total Brawley Wash ndash Los Robles Wash Watershed 1408 0 2643 29
Note Adjacent watersheds may share a grid square Data Sources Census block statistics for 1990 were compiled from a CD prepared by Geo-Lytics (GeoLytics Inc1998 Census 1990 Census CD + Maps Release 30) New Mexico Resource Geographic Information (RGIS 2007)
Brawley Wash ndash Los Robles Wash Watershed Rapid Watershed Assessment Section 4 ndash Census Social and Ag page 4- 2
Table 4-3 Brawley Wash ndash Los Robles Wash Watershed Population Density Change 1990 ndash 2000 (peoplesquare mile)
Population Density Change (peoplesqmi) 10-digit Watershed Name
Area (sq miles) Min Max Mean
Los Robles Wash 1505030406 210 -60 646 10
Lower Brawley Wash 1505030405 410 -79 761 27
Upper Brawley Wash 1505030404 149 -46 152 3
Altar Wash 1505030403 350 -7 11 -02 Puertocito Wash 1505030402 149 -10 06 -02
Arivaca Creek 1505030401 139 -15 71 1 Total Brawley Wash ndash Los Robles Wash Watershed 1408 -79 761 10
Note Adjacent watersheds may share a grid square Data Sources Derived from data from the GIS data used for tables 4-1 and 4-2 Housing Density 2000 and 2030 The Watershed Housing Density Map for the year 2000 and projections for the year 2030 were created with data developed by David M Theobald (Theobald 2005) Theobald developed a nationwide housing density model that incorporates a thorough way to account for land-use change beyond the ldquourban fringerdquo Exurban regions are the ldquourban fringerdquo or areas outside suburban areas having population densities greater than 068 ndash 1618 ha (168 ndash 40 acres) per unit Theobald stresses that exurban areas are increasing at a much faster rate than urban sprawl are consuming much more land and are having a greater impact on ecological health habitat fragmentation and other resource concerns Theobald estimates that the exurban density class has increased at a much faster rate than the urbansuburban density classes Theobaldrsquos model
forecasts that this trend will continue and may even accelerate by 2030 This indicates that development patterns are shifting more towards exurban lower density housing units and are thereby consuming more land He suggests that exurban development has more overall effect on natural resources because of the larger footprint and disturbance zone a higher percent of impervious surfaces and higher pollution because of more vehicle miles traveled to work and shopping Figure 4-4 and Table 4-4 Brawley Wash-Robles Wash Watershed Housing Density for 2000 identifies that about 63 of housing is located in ldquoundeveloped privaterdquo areas about 27 is located in ldquoruralrdquo areas and 9 located in ldquoexurbanrdquo Figure 4-5 and Table 4-5 Brawley Wash-Robles Wash Watershed Housing Density for 2030 projects ldquoundeveloped privaterdquo areas being reduced to about 5 of the watershed ldquoruralrdquo decreasing to 7 and exurban increasing to 82
Brawley Wash ndash Los Robles Wash Watershed Rapid Watershed Assessment Section 4 ndash Census Social and Ag page 4- 3
Table 4-4 Brawley Wash ndash Los Robles Wash Watershed Housing Density 2000 (Percent of Watershed) (Part 1 of 2)
Housing Density
Los Robles Wash
1505030406
Lower Brawley Wash
1505030405
Upper Brawley Wash
1505030404 Altar Wash
1505030403
Puertocito Wash
1505030402
Undeveloped Private 70 72 72 59 54 Rural 26 10 25 41 46 Exurban 4 16 4 02 - Suburban - 11 gt000 gt000 - Urban 001 03 - - - Source Theobald D 2005 Landscape patterns of exurban growth in the USA from 1980 to 2020 Ecology and Society 10(1) 32 [online] URL httpwwwecology and societyorgvol10iss1art32 Table 4-4 Brawley Wash ndash Los Robles Wash Watershed Housing Density 2000 (Percent of Watershed) (Part 2 of 2)
Housing Density
Arivaca Creek
1505030401
Brawley Wash ndash Los
Robles Wash
Watershed
Brawley Wash ndash Los
Robles Wash
Watershed (sq miles)
Undeveloped Private 32 63 181
Rural 38 27 77 Exurban 29 9 27 Suburban 006 03 1 Urban 006 007 02 Source Theobald D 2005 Landscape patterns of exurban growth in the USA from 1980 to 2020 Ecology and Society 10(1) 32 [online] URL httpwwwecology and societyorgvol10iss1art32 Table 4-5 Brawley Wash ndash Los Robles Wash Watershed Housing Density 2030 (Percent of Watershed) (Part 1 of 2)
Housing Density
Los Robles Wash
1505030406
Lower Brawley Wash
1505030405
Upper Brawley Wash
1505030404 Altar Wash
1505030403
Puertocito Wash
1505030402
Undeveloped Private 3 4 4 9 7 Rural 15 1 1 11 19 Exurban 81 80 91 80 74 Suburban 06 4 01 002 - Urban 03 11 3 - - Source Theobald D 2005 Landscape patterns of exurban growth in the USA from 1980 to 2020 Ecology and Society 10(1) 32 [online] URL httpwwwecology and societyorgvol10iss1art32
Brawley Wash ndash Los Robles Wash Watershed Rapid Watershed Assessment Section 4 ndash Census Social and Ag page 4- 4
Table 4-5 Brawley Wash ndash Los Robles Wash Watershed Housing Density 2030 (Percent of Watershed) (Part 2 of 2)
Housing Density
Arivaca Creek
1505030401
Brawley Wash ndash Los
Robles Wash
Watershed
Brawley Wash ndash Los
Robles Wash
Watershed (sq miles)
Undeveloped Private 6 5 15 Rural 9 7 19 Exurban 76 82 236 Suburban 6 2 5 Urban 3 4 12 Source Theobald D 2005 Landscape patterns of exurban growth in the USA from 1980 to 2020 Ecology and Society 10(1) 32 [online] URL httpwwwecology and societyorgvol10iss1art32
Brawley Wash ndash Los Robles Wash Watershed Rapid Watershed Assessment Section 4 ndash Census Social and Ag page 4- 5
Brawley Wash-Robles Wash Watershed Agricultural Statistics Arizona is known as one of the most productive and efficient agricultural regions in the world with beauty that also provides the food and fiber to sustain life in the desert Arizona is also one of the most diverse agricultural producing states in the nation producing more than 160 varieties of vegetables livestock field crops and nursery stock The climate natural resources agribusiness infrastructure and farm heritage help make agriculture a $92 billion dollar industry employing more than 72000 individuals According to the United States Department of Agriculturersquos 2002 Census there are more than 7000 farms and ranches seventy-eight percent of which are owned by individuals or families The total farmland in Arizona is comprised of more than 26000000 acres with irrigated crops on 1280000 acres and pasture for animals on 23680000 Brawley Wash-Robes Wash Watershed is comprised of considerable grazing land for many livestock operations a significant number of apiary (honey bee) operations a mixed variety of crops including cotton and alfalfa several recreational equestrian facilities a few equestrian breeding and training facilities a number of dairy facilities variety of vegetable growing operations a few nursery facilities miscellaneous plantings of fruit trees including apples and peaches (Brill 2008) Most farms in the Brawley Wash-Robles Wash Watershed are fairly small
Eighty-four percent of all farms in the watershed are less than 1000 acres in size and 54 are less than 50 acres (Table 4-6 and Figure 4-6) Of the 100 farms that have pasture and rangeland 43 have 100 or more acres (Table 4-7 and Figure 4-7) Of the 413 farms that harvest crops 83 are 49 acres or less in size (Table 4-8 and Figure 4-8) The NASS (National Agricultural Statistics Service United States Department of Agriculture) has farm data by zip code We used the US Census Bureau ZIP Census Tabulation Areas (ZCTA) to generate maps A typical 5-digit ZCTA (there are 3-digit ZCTAs as well) is typically nearly identical to a 5-digit US Postal Service ZIP code but there are some distinctions Unlike ZIP codes ZCTA areas are spatially complete and they are easier to map The Bureau created special `XX ZCTAs (ZCTAs with a valid 3-digit ZIP but with ldquoXXrdquo as last two characters of the code) which represent large unpopulated areas where it made no sense to assign a census block to an actual ZIP code Similarly HH ZCTAs represent large bodies of water within a 3-digit zip area There is typically no population in either an XX or HH ZCTA Data is withheld by NASS for categories with one to four farms This is to protect the identity of individual farmers Farm counts for these zip codes are included in the State Total category Some categories only contained stars instead of numbers Each star was counted as one farm But because each star could represent as many as 4 farms each number on the tables are actually greater than or equal to the number listed In some cases this results in
Brawley Wash ndash Los Robles Wash Watershed Rapid Watershed Assessment Section 4 ndash Census Social and Ag page 4- 6
percentages that add up to more or less that 100 percent Tables Include data from zip codes both contained within the watershed and zip codes crossing watershed boundaries It is important to note that the figures in the tables include significant agricultural areas adjacent to but outside of the
watershed area along the Santa Cruz and the San Pedro Rivers and other nearby drainages NASS assumes that when no agricultural information exists for a zip code no agricultural activity takes place within that area `
Figure 4-6 Brawley Wash Watershed Farms by Size (2002)
0
10
20
30
40
50
60
1 to 49 acres 50 to 999 acres 1000 acres or more
Perc
ent F
arm
s
Table 4-6 Brawley Wash-Robles Wash Watershed Farms by Size All farms 1 to 49 acres 50 to 999 acres gt1000 acres 523 54 30 9 NASS defines A ldquofarmrdquo as an operation with at least $1000 in agricultural sales from agriculture Percents rounded Data source NASS (National Agricultural Statistics Service United States Department of Agriculture)
Brawley Wash ndash Los Robles Wash Watershed Rapid Watershed Assessment Section 4 ndash Census Social and Ag page 4- 7
Figure 4-7 Brawley Wash Watershed Pasture Farms by Size (2002)
0
50
100
150
200
Total farms Farms 100 acres or more
Num
ber
of F
arm
s
permanent pasture amp rangeland All other land
Table 4-7 Brawley Wash-Robles Wash Watershed Pasture and Rangeland (2002)
Category Total farms Farms 100 acres or more Permanent pasture and rangeland
100 43
All other land 169 11 Grazing lands are the USDA Pastureland as defined by NASS includes cropland used only for pasture or grazing woodland pastured and other pastureland and rangeland Percents rounded Data source NASS (National Agricultural Statistics Service United States Department of Agriculture)
Figure 4-8 Brawley Wash Watershed Cropland Harvested (2002)
1 to 49 acres 73
50 to 499 acres 13
500 acres or more 14
Table 4-8 Brawley Wash-Robles Wash Watershed Cropland Harvested Total farms 1 to 49 acres 50 to 999 acres gt1000 acres 80 75 13 14 According to the NASS ldquoharvested croplandrdquo includes all land from which crops were harvested including cut hay all land in orchards citrus groves and nursery and greenhouse crops Land from which two or more crops were harvested was counted only once even though there was more than one use of that land Percents rounded Data source NASS (National Agricultural Statistics Service United States Department of Agriculture)
Brawley Wash ndash Los Robles Wash Watershed Rapid Watershed Assessment Section 4 ndash Census Social and Ag page 4- 8
Section 5 Resource Assessment Tables The following Resource Assessment Tables summarize current and desired future natural resource conditions for the Brawley Wash ndash Los Robles Wash Watershed The tables present information on benchmark and future conservation systems and practices qualitative effects on primary resource concerns and estimated costs for conservation implementation Conservation District board members NRCS conservationists and other people familiar with conservation work in the watershed were consulted for estimating current and future natural resource conditions The tables show three levels of conservation treatment (Baseline Progressive Resource Management System) for each of the major land uses (range and urban) within the watershed Baseline is defined as a low level of conservation adoption with landowners who are typically not participating in conservation programs There are however a few practices that have been commonly adopted by all landowners in this watershed Progressive is defined as an intermediate level of conservation adoption with landowners who are actively participating in conservation programs and have adopted several practices but not satisfied all of the
Quality Criteria in the NRCS Field Office Technical Guide Resource Management System (RMS) is defined as a complete system of conservation practices that addresses all of the Soil Water Air Plant and Animal (SWAPA) resource concerns typically seen for this land use in this watershed For each land use the results of the assessment are presented in two parts Part 1 (Assessment Information) summarizes the conservation practices at each treatment level and the quantities of practices for current benchmark conditions and projected future conditions Part 1 also displays the four primary resource concerns along with individual practice effects and an overall Systems Rating (ranging from a low of 1 to a high of 5) indicating the effectiveness of the conservation system used at each treatment level Part 2 (Conservation Cost Table) summarizes the installation management and related costs by conservation practice and treatment level for the projected future conditions by federal and private share of the costs Part 2 also displays the benchmark and future conservation conditions status bars Credit goes to NRCS in Oregon for development of the template for these Resource Assessment Tables
Brawley Wash ndash Los Robles Wash Watershed Rapid Watershed Assessment Section 5ndash Resource Assessment page 5- 1
WAT
ERSH
ED N
AME
amp CO
DE
BRAW
LEY
WAS
H - L
OS R
OBLE
S W
ASH
- 150
5030
4 LA
NDUS
E AC
RES
100
00
LAND
USE
TYPE
CR
OP
TYPI
CAL
UNIT
SIZ
E AC
RES
500
ASSE
SSM
ENT
INFO
RMAT
ION
CALC
ULAT
ED P
ARTI
CIPA
TION
34
Be
nchm
ark
Cond
ition
s Fu
ture
Con
ditio
ns
RESO
URCE
CON
CERN
S
Cons
erva
tion
Syst
ems
by T
reat
men
t Lev
el
Tota
l Un
its
Exis
ting
Unch
ange
dUn
its
New
Tr
eatm
ent
Units
To
tal
Units
Soil
Cond
ition
ndash
Orga
nic
Mat
ter
Depl
etio
n
Wat
er
Qua
ntity
ndash
Inef
ficie
nt
Wat
er U
se o
n Irr
igat
ed L
and
Wat
er Q
ualit
y ndash
Exce
ssiv
e Nu
trien
ts a
nd
Orga
nics
in
Grou
ndw
ater
Plan
t Co
nditi
on ndash
Pr
oduc
tivity
He
alth
and
Vi
gor
Ba
selin
e Sy
stem
Rat
ing
-gt
1 5
3 1
Irrig
atio
n La
nd L
evel
ing
(ac
) 4
64
750
375
0 37
5 1
5 3
1 Irr
igat
ion
Wat
er C
onve
yanc
e D
itch
and
Cana
l Lin
ing
(ft)
428
6
000
300
0 0
300
0 1
5 3
1 Irr
igat
ion
Wat
er C
onve
yanc
e P
ipel
ine
(ft)
430
3
000
150
0 0
150
0 1
5 3
1 To
tal A
crea
ge a
t Bas
elin
e 3
000
150
0 0
150
0
Pr
ogre
ssiv
e Sy
stem
Rat
ing
-gt
3 5
4 4
Cons
erva
tion
Crop
Rot
atio
n (
ac)
328
2
500
187
5 37
5 2
250
5 1
3 5
Irrig
atio
n La
nd L
evel
ing
(ac
) 4
64
250
0 2
063
188
225
0 1
5 3
1 Irr
igat
ion
Wat
er C
onve
yanc
e D
itch
and
Cana
l Lin
ing
(ft)
428
20
000
16
500
1
500
180
00
1 5
3 1
Irrig
atio
n W
ater
Con
veya
nce
Pip
elin
e (ft
) 4
30
100
00
825
0 75
0 9
000
1 5
3 1
Irrig
atio
n W
ater
Man
agem
ent
(ac
) 44
9 2
500
187
5 37
5 2
250
1 5
5 3
Tota
l Acr
eage
at P
rogr
essi
ve L
evel
5
000
375
0 75
0 4
500
RMS
Syst
em R
atin
g -gt
4
5 5
5
Cons
erva
tion
Crop
Rot
atio
n (
ac)
328
2
000
262
5 1
375
400
0 5
1 3
5 Irr
igat
ion
Land
Lev
elin
g (
ac)
464
2
000
281
3 1
188
400
0 1
5 3
1 Irr
igat
ion
Wat
er C
onve
yanc
e D
itch
and
Cana
l Lin
ing
(ft)
428
20
000
26
500
13
500
40
000
1
5 3
1 Irr
igat
ion
Wat
er C
onve
yanc
e P
ipel
ine
(ft)
430
8
000
112
50
475
0 16
000
1
5 3
1 Irr
igat
ion
Wat
er M
anag
emen
t (a
c)
449
200
0 2
625
137
5 4
000
1 5
5 3
Nutri
ent M
anag
emen
t (a
c)
590
200
0 2
000
200
0 4
000
1 1
5 5
Pest
Man
agem
ent
(ac
) 59
5 2
000
200
0 2
000
400
0 1
1 3
3 Re
sidue
Man
agem
ent
Seas
onal
(a
c)
344
200
0 2
000
200
0 4
000
5 1
3 5
Tota
l Acr
eage
at R
MS
Leve
l 2
000
200
0 4
000
2
000
Brawley Wash ndash Los Robles Wash Watershed Rapid Watershed Assessment Section 5ndash Resource Assessment page 5- 2
Brawley Wash ndash Los Robles Wash Watershed Rapid Watershed Assessment Section 5ndash Resource Assessment page 5- 3
WAT
ERSH
ED N
AME
amp CO
DE
BRAW
LEY
WAS
H - L
OS R
OBLE
S W
ASH
- 150
5030
4 LA
NDUS
E AC
RES
100
00
LAND
USE
TYPE
CR
OP
TYPI
CAL
UNIT
SIZ
E AC
RES
500
CONS
ERVA
TION
COS
T TA
BLE
CALC
ULAT
ED P
ARTI
CIPA
TION
34
FU
TURE
FE
DERA
L PR
IVAT
E
Inst
allat
ionCo
st
Man
agem
ent
Cost
- 3
yrs
Tech
nical
Assis
tanc
e In
stalla
tion
Cost
An
nual
O amp
M+
Mgt
Cos
ts
Con
serv
atio
n Sy
stem
s by
Tre
atm
ent L
evel
Ne
w Tr
eatm
ent
Units
50
100
20
Tota
l Pre
sent
Va
lue C
ost
50
10
0
Tota
l Pre
sent
Va
lue C
ost
Pr
ogre
ssiv
e
Cons
erva
tion
Crop
Rot
ation
(a
c) 3
28
375
$0
$11
250
$22
50
$12
274
$0
$37
50
$57
73Irr
igatio
n La
nd L
eveli
ng
(ac
) 46
4 18
8 $9
375
0 $0
$1
875
0 $1
125
00
$93
750
$56
25
$117
445
Irriga
tion
Wat
er C
onve
yanc
e D
itch
and
Cana
l Lini
ng (f
t) 4
28
150
0 $6
000
$0
$1
200
$7
200
$6
000
$2
40
$70
11Irr
igatio
n W
ater
Con
veya
nce
Pipe
line
(ft)
430
75
0 $3
750
$0
$7
50
$45
00
$37
50
$150
$4
382
Irriga
tion
Wat
er M
anag
emen
t (a
c) 4
49
375
$0
$11
250
$22
50
$12
274
$0
$37
50
$57
73
Subt
otal
75
0 $1
035
00
$22
500
$25
200
$148
748
$1
035
00
$13
515
$140
383
RM
S
Cons
erva
tion
Crop
Rot
ation
(a
c) 3
28
137
5 $0
$4
125
0 $8
250
$4
500
4 $0
$1
375
0 $2
116
6Irr
igatio
n La
nd L
eveli
ng
(ac
) 46
4 1
188
$593
750
$0
$1
187
50
$712
500
$5
937
50
$35
625
$743
815
Irriga
tion
Wat
er C
onve
yanc
e D
itch
and
Cana
l Lini
ng (f
t) 4
28
135
00
$54
000
$0
$10
800
$64
800
$54
000
$21
60
$63
099
Irriga
tion
Wat
er C
onve
yanc
e P
ipelin
e (ft
) 4
30
475
0 $2
375
0 $0
$4
750
$2
850
0 $2
375
0 $9
50
$27
752
Irriga
tion
Wat
er M
anag
emen
t (a
c) 4
49
137
5 $0
$4
125
0 $8
250
$4
500
4 $0
$1
375
0 $2
116
6Nu
trien
t Man
agem
ent
(ac
) 59
0 2
000
$0
$60
000
$12
000
$65
460
$0
$20
000
$30
787
Pest
Man
agem
ent
(ac
) 59
5 2
000
$0
$60
000
$12
000
$65
460
$0
$20
000
$30
787
Resid
ue M
anag
emen
t Se
ason
al (
ac)
344
2
000
$0
$36
000
$72
00
$39
276
$0
$12
000
$18
472
Subt
otal
2
000
$671
500
$2
385
00
$182
000
$1
066
004
$6
715
00
$118
235
$9
570
44
Gran
d To
tal
275
0 $7
750
00
$261
000
$2
072
00
$12
147
52
$775
000
$1
317
50
$10
974
27
Char
t Ref
ers
To
Land
use
Type
CR
OP
Calcu
lated
Par
ticipa
tion
Rate
34
Av
erag
e PV
Cos
ts p
er A
c
Sy
stem
Fe
dera
l Pr
ivat
e
Pr
og
$198
33
$187
18
RMS
$533
00
$478
52
WAT
ERSH
ED N
AME
amp CO
DE
BRAW
LEY
WAS
H - L
OS R
OBLE
S W
ASH
- 150
5030
4 LA
NDUS
E AC
RES
838
000
LAND
USE
TYPE
RA
NGE
TYPI
CAL
UNIT
SIZ
E AC
RES
500
00
ASSE
SSM
ENT
INFO
RMAT
ION
CALC
ULAT
ED P
ARTI
CIPA
TION
29
Be
nchm
ark
Cond
ition
s Fu
ture
Con
ditio
ns
RESO
URCE
CON
CERN
S
Cons
erva
tion
Syst
ems
by T
reat
men
t Lev
el
Tota
l Un
its
Exis
ting
Unch
ange
dUn
its
New
Tr
eatm
ent
Units
To
tal
Units
So
il Er
osio
n ndash
Shee
t and
Rill
Wat
er Q
ualit
y ndash
Exce
ssiv
e Su
spen
ded
Sedi
men
t and
Tu
rbid
ity in
Su
rface
Wat
er
Plan
t Co
nditi
on ndash
Pr
oduc
tivity
He
alth
and
Vi
gor
Dom
estic
An
imal
s ndash
Inad
equa
te
Qua
ntiti
es a
ndQ
ualit
y of
Fe
ed a
nd
Fora
ge
Ba
selin
e Sy
stem
Rat
ing
-gt
2 2
2 4
Fenc
e (
ft)
382
838
0 4
190
0 4
190
3 3
3 5
Pipe
line
(ft
) 51
6 8
380
419
0 0
419
0 3
3 3
5 To
tal A
crea
ge a
t Bas
elin
e 83
800
41
900
0
419
00
Prog
ress
ive
Syst
em R
atin
g -gt
4
4 4
5
Fenc
e (
ft)
382
251
400
190
645
838
0 19
902
5 3
3 3
5 Pi
pelin
e (
ft)
516
251
400
190
645
838
0 19
902
5 3
3 3
5 Pr
escr
ibed
Gra
zing
(ac
) 5
28
251
400
188
550
104
75
199
025
5 5
5 5
Tota
l Acr
eage
at P
rogr
essi
ve L
evel
50
280
0 37
710
0 20
950
39
805
0
RM
S Sy
stem
Rat
ing
-gt
5 5
5 5
Fenc
e (
ft)
382
251
400
316
345
817
05
398
050
3 3
3 5
Pipe
line
(ft
) 51
6 25
140
0 31
634
5 81
705
39
805
0 3
3 3
5 Pr
escr
ibed
Gra
zing
(ac
) 5
28
251
400
314
250
838
00
398
050
5 5
5 5
Upla
nd W
ildlife
Hab
itat M
anag
emen
t (a
c)
645
251
40
251
40
146
65
398
05
5 5
5 3
Tota
l Acr
eage
at R
MS
Leve
l 25
140
0 25
140
0 39
805
0
146
650
Brawley Wash ndash Los Robles Wash Watershed Rapid Watershed Assessment Section 5ndash Resource Assessment page 5- 4
Brawley Wash ndash Los Robles Wash Watershed Rapid Watershed Assessment Section 5ndash Resource Assessment page 5- 5
WAT
ERSH
ED N
AME
amp CO
DE
BRAW
LEY
WAS
H - L
OS R
OBLE
S W
ASH
- 150
5030
4 LA
NDUS
E AC
RES
838
000
LAND
USE
TYPE
RA
NGE
TYPI
CAL
UNIT
SIZ
E AC
RES
500
00
CONS
ERVA
TION
COS
T TA
BLE
CALC
ULAT
ED P
ARTI
CIPA
TION
29
FU
TURE
FE
DERA
L PR
IVAT
E
Inst
alla
tion
Cost
M
anag
emen
tCo
st -
3 yr
s Te
chni
cal
Assis
tanc
e In
stal
latio
n Co
st
Annu
al O
amp M
+
Mgt
Cos
ts
Con
serv
atio
n Sy
stem
s by
Tre
atm
ent L
evel
Ne
w Tr
eatm
ent
Units
50
100
20
Tota
l Pre
sent
Va
lue
Cost
50
100
Tota
l Pre
sent
Va
lue
Cost
Pr
ogre
ssiv
e
Fenc
e (
ft)
382
838
0 $1
257
0 $0
$2
514
$1
508
4 $1
257
0 $5
03
$14
688
Pipe
line
(ft
) 51
6 8
380
$33
520
$0
$67
04
$40
224
$33
520
$13
41
$39
168
Pres
crib
ed G
razin
g (
ac)
528
10
475
$7
856
$0
$1
571
$9
428
$7
856
$0
$7
856
Subt
otal
20
950
$5
394
6 $0
$1
078
9 $6
473
6 $5
394
6 $1
844
$6
171
2
RMS
Fenc
e (
ft)
382
817
05
$122
558
$0
$2
451
2 $1
470
69
$122
558
$4
902
$1
432
08Pi
pelin
e (
ft)
516
817
05
$326
820
$0
$6
536
4 $3
921
84
$326
820
$1
307
3 $3
818
87Pr
escr
ibed
Gra
zing
(ac
) 5
28
838
00
$62
850
$0
$12
570
$75
420
$62
850
$0
$62
850
Upla
nd W
ildlife
Hab
itat M
anag
emen
t (a
c)
645
146
65
$0
$57
194
$11
439
$62
398
$0
$19
065
$29
347
Subt
otal
14
665
0 $5
122
28
$57
194
$113
884
$6
770
71
$512
228
$3
704
0 $6
172
92
Gra
nd T
otal
16
760
0 $5
661
74
$57
194
$124
673
$7
418
07
$566
174
$3
888
3 $6
790
04
Char
t Ref
ers
To
Land
use
Type
RA
NGE
Calcu
late
d Pa
rticip
atio
n Ra
te
29
Aver
age
PV C
osts
per
Ac
Syst
em
Fede
ral
Priv
ate
Prog
$3
09
$29
5
RM
S $4
62
$42
1
WAT
ERSH
ED N
AME
amp CO
DE
BRAW
LEY
WAS
H - L
OS R
OBLE
S W
ASH
- 150
5030
4 LA
NDUS
E AC
RES
330
00
LAND
USE
TYPE
UR
BAN
TYPI
CAL
UNIT
SIZ
E AC
RES
10
ASSE
SSM
ENT
INFO
RMAT
ION
CALC
ULAT
ED P
ARTI
CIPA
TION
10
Be
nchm
ark
Cond
ition
s Fu
ture
Con
ditio
ns
RESO
URCE
CON
CERN
S
Cons
erva
tion
Syst
ems
by T
reat
men
t Lev
el
Tota
l Un
its
Exis
ting
Unch
ange
dUn
its
New
Tr
eatm
ent
Units
To
tal
Units
Soil
Cond
ition
ndash
Orga
nic
Mat
ter
Depl
etio
n
Wat
er
Qua
ntity
ndash
Inef
ficie
nt
Wat
er U
se o
n Irr
igat
ed L
and
Wat
er Q
ualit
y ndash
Exce
ssiv
e Nu
trien
ts a
nd
Orga
nics
in
Grou
ndw
ater
Air Q
ualit
y ndash
Parti
cula
te
mat
ter l
ess
than
10
mic
rom
eter
s in
dia
met
er
(PM
10)
Ba
selin
e Sy
stem
Rat
ing
-gt
0 0
0 0
No C
onse
rvat
ion
Prac
tices
bei
ng a
pplie
d at
this
leve
l 0
0 0
0 0
0 0
0 To
tal A
crea
ge a
t Bas
elin
e 29
700
26
730
0
267
30
Prog
ress
ive
Syst
em R
atin
g -gt
0
4 2
0
Irrig
atio
n W
ater
Con
veya
nce
Ditc
h an
d Ca
nal L
inin
g (ft
) 4
28
825
00
742
50
742
50
148
500
1 5
3 1
Irrig
atio
n W
ater
Con
veya
nce
Pip
elin
e (ft
) 4
30
825
00
742
50
742
50
148
500
1 5
3 1
Tota
l Acr
eage
at P
rogr
essi
ve L
evel
3
300
297
0 2
970
594
0
RM
S Sy
stem
Rat
ing
-gt
1 5
5 3
Irrig
atio
n La
nd L
evel
ing
(ac
) 4
64
0 0
330
330
1 5
3 1
Irrig
atio
n W
ater
Con
veya
nce
Ditc
h an
d Ca
nal L
inin
g (ft
) 4
28
0 8
250
825
0 16
500
1
5 3
1 Irr
igat
ion
Wat
er C
onve
yanc
e P
ipel
ine
(ft)
430
0
825
0 8
250
165
00
1 5
3 1
Irrig
atio
n W
ater
Man
agem
ent
(ac
) 44
9 0
0 33
0 33
0 1
5 5
3 Nu
trien
t Man
agem
ent
(ac
) 59
0 0
0 33
0 33
0 1
1 5
3 Pe
st M
anag
emen
t (a
c)
595
0 0
330
330
1 1
3 3
Tota
l Acr
eage
at R
MS
Leve
l 0
0 33
0
330
Brawley Wash ndash Los Robles Wash Watershed Rapid Watershed Assessment Section 5ndash Resource Assessment page 5- 6
Brawley Wash ndash Los Robles Wash Watershed Rapid Watershed Assessment Section 5ndash Resource Assessment page 5- 7
WAT
ERSH
ED N
AME
amp CO
DE
BRAW
LEY
WAS
H - L
OS
ROBL
ES W
ASH
- 150
5030
4 LA
NDUS
E AC
RES
330
00
LAND
USE
TYPE
UR
BAN
TYPI
CAL
UNIT
SIZ
E AC
RES
10
CONS
ERVA
TIO
N CO
ST T
ABLE
CA
LCUL
ATED
PAR
TICI
PATI
ON
10
FU
TURE
FE
DERA
L PR
IVAT
E
Inst
alla
tion
Cost
M
anag
emen
t Co
st -
3 yr
s Te
chni
cal
Assis
tanc
e In
stal
latio
n Co
st
Annu
al O
amp M
+ M
gt C
osts
C
onse
rvat
ion
Syst
ems
by T
reat
men
t Lev
el
New
Trea
tmen
t Un
its
50
10
0
20
Tota
l Pre
sent
Va
lue
Cost
50
100
Tota
l Pre
sent
Va
lue
Cost
Pr
ogre
ssiv
e
Irrig
atio
n W
ater
Con
veya
nce
Ditc
h an
d Ca
nal L
inin
g (ft
) 4
28
742
50
$297
000
$0
$5
940
0 $3
564
00
$297
000
$1
188
0 $3
470
43Irr
igat
ion
Wat
er C
onve
yanc
e P
ipel
ine
(ft)
430
74
250
$3
712
50
$0
$74
250
$445
500
$3
712
50
$14
850
$433
804
Subt
otal
2
970
$668
250
$0
$1
336
50
$801
900
$6
682
50
$26
730
$780
846
RM
S
Irrig
atio
n La
nd L
evel
ing
(ac
) 4
64
330
$165
000
$0
$3
300
0 $1
980
00
$165
000
$9
900
$2
067
02Irr
igat
ion
Wat
er C
onve
yanc
e D
itch
and
Cana
l Lin
ing
(ft)
428
8
250
$33
000
$0
$66
00
$39
600
$33
000
$13
20
$38
560
Irrig
atio
n W
ater
Con
veya
nce
Pip
elin
e (ft
) 4
30
825
0 $4
125
0 $0
$8
250
$4
950
0 $4
125
0 $1
650
$4
820
0Irr
igat
ion
Wat
er M
anag
emen
t (a
c)
449
330
$0
$99
00
$19
80
$10
801
$0
$33
00
$50
80Nu
trien
t Man
agem
ent
(ac
) 59
0 33
0 $0
$9
900
$1
980
$1
080
1 $0
$3
300
$5
080
Pest
Man
agem
ent
(ac
) 59
5 33
0 $0
$9
900
$1
980
$1
080
1 $0
$3
300
$5
080
Subt
otal
33
0 $2
392
50
$29
700
$53
790
$319
503
$2
392
50
$22
770
$308
703
Gra
nd T
otal
3
300
$907
500
$2
970
0 $1
874
40
$11
214
03
$907
500
$4
950
0 $1
089
549
Char
t Ref
ers
To
Land
use
Type
UR
BAN
Calcu
late
d Pa
rticip
atio
n Ra
te
10
Aver
age
PV C
osts
per
Ac
Syst
em
Fede
ral
Priv
ate
Prog
$2
700
0 $2
629
1
RM
S $9
681
9 $9
354
6
Section 6 References Arizona Association of Conservation Districts (httpwwwaaocdorg) Arizona Dept of Agriculture (httpwwwazdagov) Arizona Dept of Environmental Quality Water Quality Monitoring amp Assessment (httpazdeqgovenvironwaterassessmentassesshtml) Arizona Department of Environmental Quality (ADEA) Draft 2006 Status of Ambient
Surface Water Quality in Arizona ndash Arizonarsquos Integrated 305(b) Assessment and 303(d) Listing Report Arizona Department of Environmental Quality Phoenix Arizona
Arizona Department of Environmental Quality Air Quality Division httpwwwazdeqgovenvironairplannotmeethtmlphoenix Arizona Department of Water Resources Arizona Drought Preparedness Plan
Background amp Impact Assessment Section Governorrsquos Drought Task Force Governor Janet Napolitano October 8 2004 httpwwwazwatergovdwrcontentfind_by_programGDTFconclusionBackground_Section_100804FINALpdf
Arizona Department of Water Resources (ADWR) 2007 Arizona Water Atlas
Vol 2 web published at httpwwwazwatergovdwr Arizona Department of Water Resources (ADWR) 1999 Third Management
Plan for Tucson Active Management Area 2000-2010 httpwwwazwatergovdwrcontentPublicationsfilesThirdMgmtPlanModifieddefaulthtmTucson
Arizona Game amp Fish Dept Heritage Database httpwwwazgfdgovw_ceditsspecies_concernshtml) Arizona Game amp Fish website 2006 httpwwwazgfdgovw_cheritage_programshtml Arizona State Land Department Arizona Land Resource Information System (ALRIS) GIS data layer ldquoGeologyrdquo February 7 2003 httpwwwlandstateazusalrisindexhtml Arizona State Land Department Arizona Land Resource Information System (ALRIS) GIS data layer ldquoLakesrdquo February 7 2003 httpwwwlandstateazusalrisindexhtml
Brawley Wash ndash Los Robles Wash Watershed Rapid Watershed Assessment Section 6ndash References page 6- 1
Arizona State Land Department Arizona Land Resource Information System (ALRIS) GIS data layer ldquominesrdquo February 7 2002
httpwwwlandstateazusalrisindexhtml Arizona State Land Department Arizona Land Resource Information System (ALRIS) GIS data layer ldquonatvegrdquo June 12 2003
httpwwwlandstateazusalrisindexhtml Arizona State Land Department Arizona Land Resource Information System (ALRIS) GIS data layer ldquoownershiprdquo February 7 2002
httpwwwlandstateazusalrisindexhtml Arizona State Land Department Arizona Land Resource Information System (ALRIS) GIS data layer ldquoStreamsrdquo Arizona October 10 2002 httpwwwlandstateazusalrisindexhtml Brill Karol 2008 Arizona Department of Agriculture personal communication May 7 Brown David E and Charles H Lowe Biotic Communities of the Southwest
11000000 scale August 1980 Bureau of Land Management Arizona Website (httpwwwblmgovazstenhtml) Chronic Halka 1983 Roadside Geology of Arizona Mountain Press Publishing
Company Montana Climate Assessment for the Southwest (CLIMAS) website
wwwispearizonaeduclimas) information on Arizonas drought status Environmental Protection Agency (EPA) website httpepagovairairtrendsaqtrnd95pm10html ESRI Data Products httparcdataesricomdatatiger2000tiger_downloadcfm
Census 2000 October 17 2003 Feth JH and ND White JD Hem 1954 Preliminary Report of Investigations of
Springs in the Mogollon Rim Region Arizona US Geological Survey Open-File Report Tucson Arizona
GeoLytics Inc 1998 Census 1990 Census CD + Maps Release 30 Goodwin LB 1985 Geologic history of the southern Baboquivari Mountains south- central Arizona Geol Soc Am Abstr Programs VolIssue 17 98 Gordon ND TA McMahon and BL Finlayson 1992 Stream Hydrology
Brawley Wash ndash Los Robles Wash Watershed Rapid Watershed Assessment Section 6ndash References page 6- 2
Chapter 4- Getting to know your stream John Wiley amp Sons New York New York Lowry J H Jr R D Ramsey K Boykin D Bradford P Comer S Falzarano W
Kepner J Kirby L Langs J Prior-Magee G Manis L OrsquoBrien T Sajwaj K A Thomas W Rieth S Schrader D Schrupp K Schulz B Thompson C Velasquez C Wallace E Waller and B Wolk 2005 Southwest Regional Gap Analysis Project Final Report on Land Cover Mapping Methods RSGIS Laboratory Utah State University Logan Utah
National Agricultural Statistics Service (httpwwwnassusdagov) National Parks Service (NPS) 2007 Saguaro National Park Information Page httpwwwsaguaronational-parkcominfohtm Natural Resources Conservation Service (NRCS) 2007 Table generated by NRCS Phoenix Office Natural Resources Conservation Service (NRCS) Fact Sheet Brawley Wash-Los
Robles Wash Natural Resources Conservation Service (NRCS) Website 2006 Technical Guide ndash
New Mexico httpwwwnmnrcsusdagovtechnicalfotgtransmittalsfotg-1doc Natural Resources Conservation Service Arizona Website (httpwwwaznrcsusdagov) Natural Resources Conservation Service Arizona GIS Webpage (httpwwwaznrcsusdagovtechnicalgisindexhtml) Natural Resources Conservation Service Web Soil Survey (httpwebsoilsurveynrcsusdagovapp) Natural Resources Conservation Service Water amp Climate Center (httpwwwwccnrcsusdagov) Parker John TC and M E Flynn 2000 Investigation of the Geology and Hydrology
of the Mogollon Highlands of Central Arizona A Project of the Arizona rural Watershed Initiative In cooperation with the Arizona Department of Water Resources USGS Fact Sheet 159-00
Pima County 2000 Biological Stress Assessment An Overview Discussion of Issues and Concerns Sonoran Desert Conservation Plan httpwwwpimagovcmosdcpreportshtml
Brawley Wash ndash Los Robles Wash Watershed Rapid Watershed Assessment Section 6ndash References page 6- 3
Pima County 2006 Chapter 2 Planning Area Characteristics in Pima County Metropolitan Area Facility Plan Pima County Wastewater Management Department httpwwwpimagovwwmreportspdfFacPlan06_chapChap_2pdf
Southern Arizona Data Services Program GIS data layer ldquoArizona Gap Analysis
Project Vegetation Maprdquo University of Arizona 2004 httpsdrsnetsrnrarizonaeduindexphp originated by Arizona Game amp Fish Department Habitat Branch 1993 this dataset was digitized from the August 1980 David E Brown amp Charles H Lowe 11000000 scale Biotic Communities of the Southwest
Southwest Regional GAP Project (httpfws-nmcfwrunmsueduswregap Theobald D 2005 Landscape patterns of exurban growth in the USA from 1980 to
2020 Ecology and Society 10(1) 32 [online] URL httpwwwecology and societyorgvol10iss1art32
United States Department of Agriculture 2004 Arizona Bark Beetle Epidemics Fact Sheet and Information Bulletin Southwestern Region USDA Forest Service httpwwwfsfedusr3prescottforest-healthindexshtml United States Department of Agriculture GIS Data Analysis obtained from US Forest
Service Southwestern Region Forest Health office Feb 26 2007 United States Environmental Protection Agency Surf Your Watershed (httpwwwepagovsurf) United States Environmental Protection Agency Air Quality Trends
httpepagovairaritrendsaqtrnd95pm10html United States Fish amp Wildlife Service Threatened and Endangered Species Listed for
Arizona httpecosfwsgov United States Fish amp Wildlife Service Arizona Ecological Services (httpwwwfwsgovsouthwestesarizona) United States Forest Service Forest Service Fact Sheet ldquoArizona Bark Beetle
Epidemicsrdquo produced by Forest Health Staff Southwestern Region USDA Forest Service January 2004 httpwwwfsfedusr3prescottforest-healthindexshtml
United States Forest Service (USFS) Terrestrial Ecosystem Surveys Surveys are
available for National Forest Lands within the watershed United States Forest Service Southwestern Region (httpwwwfsfedusr3)
Brawley Wash ndash Los Robles Wash Watershed Rapid Watershed Assessment Section 6ndash References page 6- 4
United States Geological Survey NLCD Land Cover Class Definitions httplandcoverusgsgovclassesphp United States Geological Survey April 8 2003 derived from DEM
httpedcusgsgovgeodata United States Geological Survey website National Water Information System
httpwaterdatausgsgovnwis Western Regional Climate Center (WRCC) Temperature data July 15 2004
httpwwwwrccdriedusummaryclimsmazhtml
Brawley Wash ndash Los Robles Wash Watershed Rapid Watershed Assessment Section 6ndash References page 6- 5
GLOSSARY Drainage Basin A region or area bounded by a topographic divide and occupied by a
drainage system also known as a watershed Drought There is no universally accepted quantitative definition of drought
Generally the term is applied to periods of less than average precipitation over a certain period of time natures failure to fulfill the water wants and needs of man
Flood A flood is an overflow or inundation that comes from a river or other body of water and causes or threatens damage It can be any relatively high streamflow overtopping the natural or artificial banks in any reach of a stream It is also a relatively high flow as measured by either gage height or discharge quantity
Ground Water The supply of fresh and saline water found beneath the Earths surface which is often used for supplying wells and springs Because ground water is a major source of drinking water there is a growing concern over areas where leaching agricultural or industrial pollutants are contaminating ground water
Soil Moisture Regimes
Aridic is a soil moisture regime that has no water available for plants for more than half the cumulative time that the soil temperature at 50 cm (20 in) below the surface is gt5degC (41deg F) and has no period as long as 90 consecutive days when there is water for plants while the soil temperature at 50 cm (20 in) is continuously gt8degC (46degF) Udic is a soil moisture regime that is neither dry for as long as 90 cumulative days nor for as long as 60 consecutive days in the 90 days following the summer solstice at periods when the soil temperature at 50 cm (20 in) below the surface is above 5degC (41deg F) Ustic is a soil moisture regime that is intermediate between the aridic and udic regimes and common in temperate subhumid or semiarid regions or in tropical and subtropical regions with a monsoon climate A limited amount of water is available for plants but occurs at times when the soil temperature is optimum for plant growth
Soil Orders
A soil order is a group of soils in the broadest category In the current USDA classification scheme there are 12 orders differentiated by the presence or absence of diagnostic horizons
Soil Temperature
Regimes
Hyperthermic is a soil temperature regime that has mean annual soil temperatures of 22degC (72degF) or more and gt5degC (41deg F) difference between mean summer and mean winter soil temperatures at 50 cm (20 in) below the surface Thermic is a soil temperature regime that has mean annual soil temperatures of 15degC (59degF) or more but lt22degC (72degF) and gt5degC (41deg F) difference between mean summer and mean winter soil temperatures at 50 cm (20 in) below the surface
Brawley Wash ndash Los Robles Wash Watershed Rapid Watershed Assessment Section 7 ndash Glossary page 7- 1
Mesic A soil temperature regime that has mean annual soil temperatures of 8degC (46degF) or more but lt15degC (59degF) and gt5degC (41deg F) difference between mean summer and mean winter soil temperatures at 50 cm (20 in) below the surface
Surface Water Water on the earths surface Lakes bays ponds impounding reservoirs springs rivers streams creeks estuaries wetlands marshes inlets canals and all other bodies of surface water natural or artificial inland or coastal fresh or salt navigable or non-navigable and including the beds and banks of all watercourses and bodies of surface water that are wholly or partially inside or bordering the state or subject to the jurisdiction of the state except that waters in treatment systems which are authorized by state or federal law regulation or permit and which are created for the purpose of waste treatment
Watershed The area of land that contributes surface run-off to a given point in a drainage system and delineated by topographic divides
Brawley Wash ndash Los Robles Wash Watershed Rapid Watershed Assessment Section 7 ndash Glossary page 7- 2
Acknowledgements The following University of Arizona staff and students contributed to the production of this report Terry Sprouse Erin Westfall Lainie Levick Cassie Holmgren Ariel Fisher Melisa Kennedy NRCS Field Office Area Office and State Office staff contributed to the development of this assessment
Brawley Wash ndash Los Robles Wash Watershed Rapid Watershed Assessment Section 7 ndash Glossary page 7- 3
- Table 3-1 Brawley Wash - Los Robles
- Wash Watershed Priority Resource Concerns by Land Use
- Table 3-2 Brawley Wash-Los Robles Wash Watershed Species of Concern
- and Endangered Species Classifications and Observations(1)
- United States Department of Agriculture 2004 Arizona Bark Beetle Epidemics
- Fact Sheet and Information Bulletin Southwestern Region USDA Forest
- Service httpwwwfsfedusr3prescottforest-healthindexshtml
-
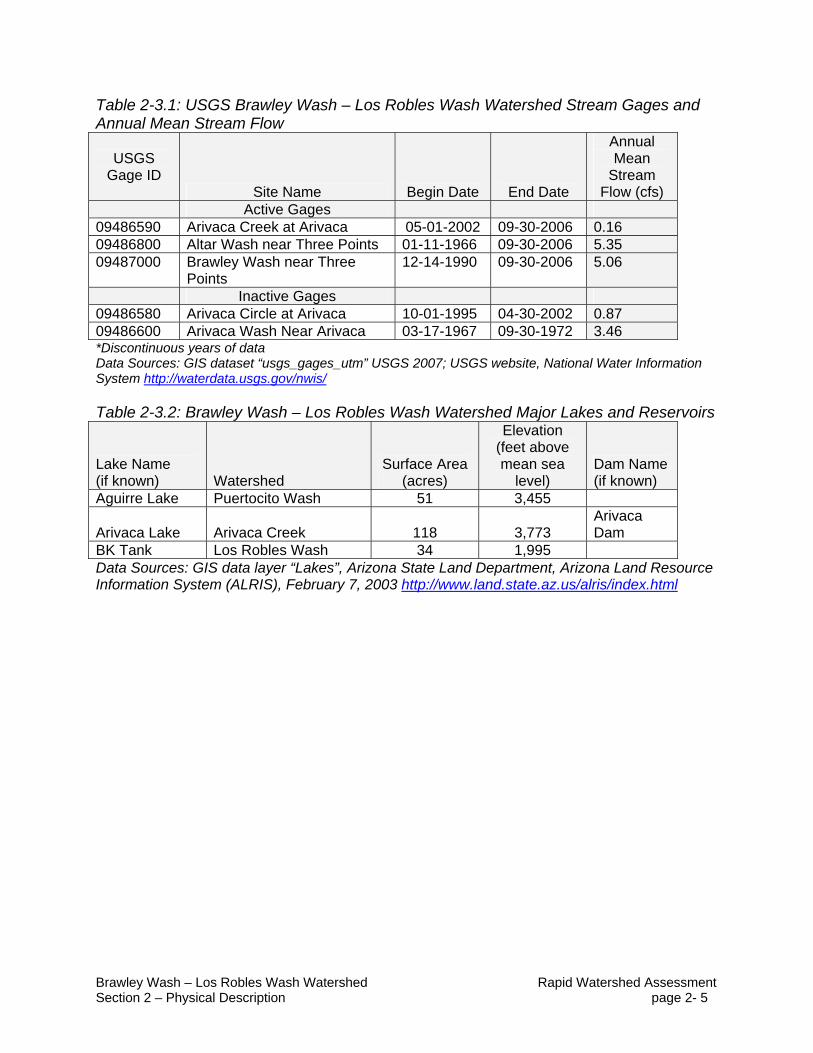
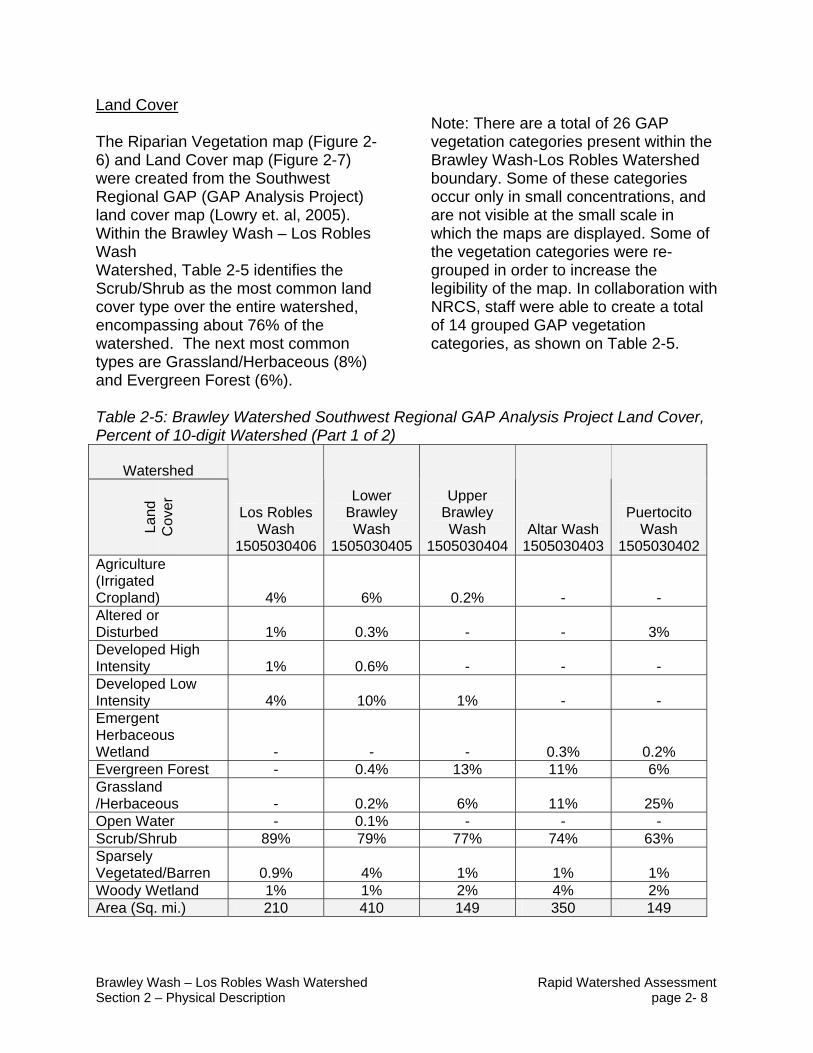
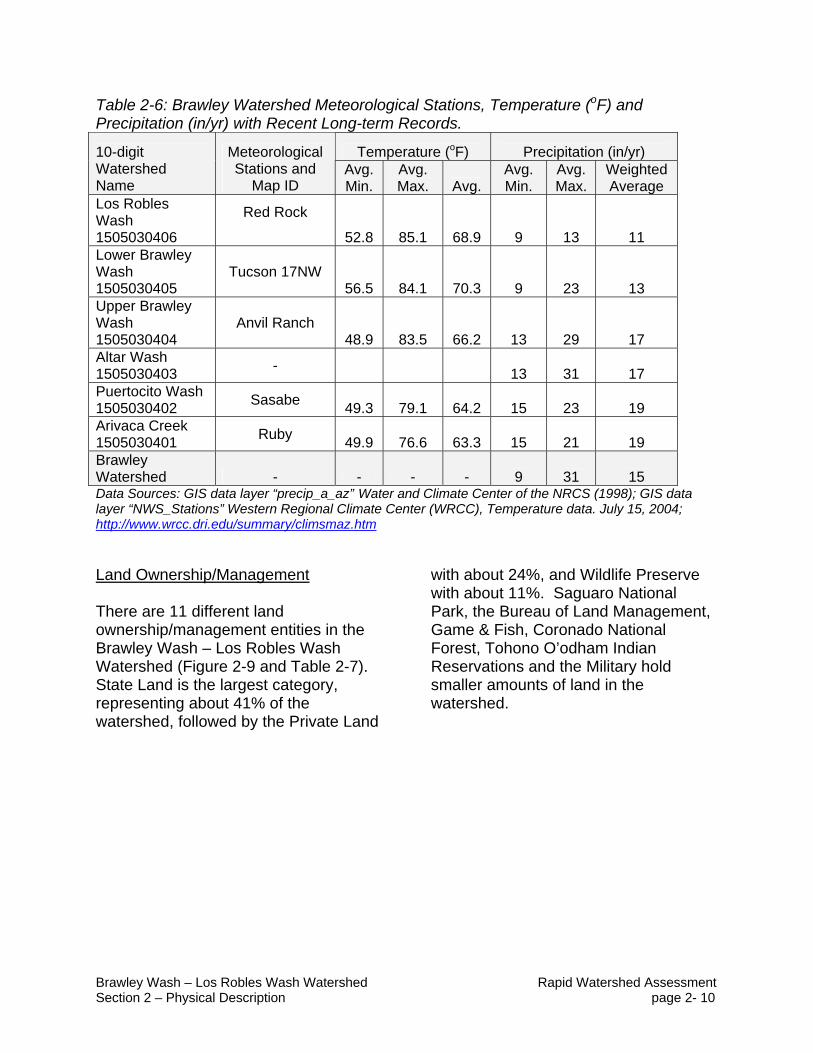
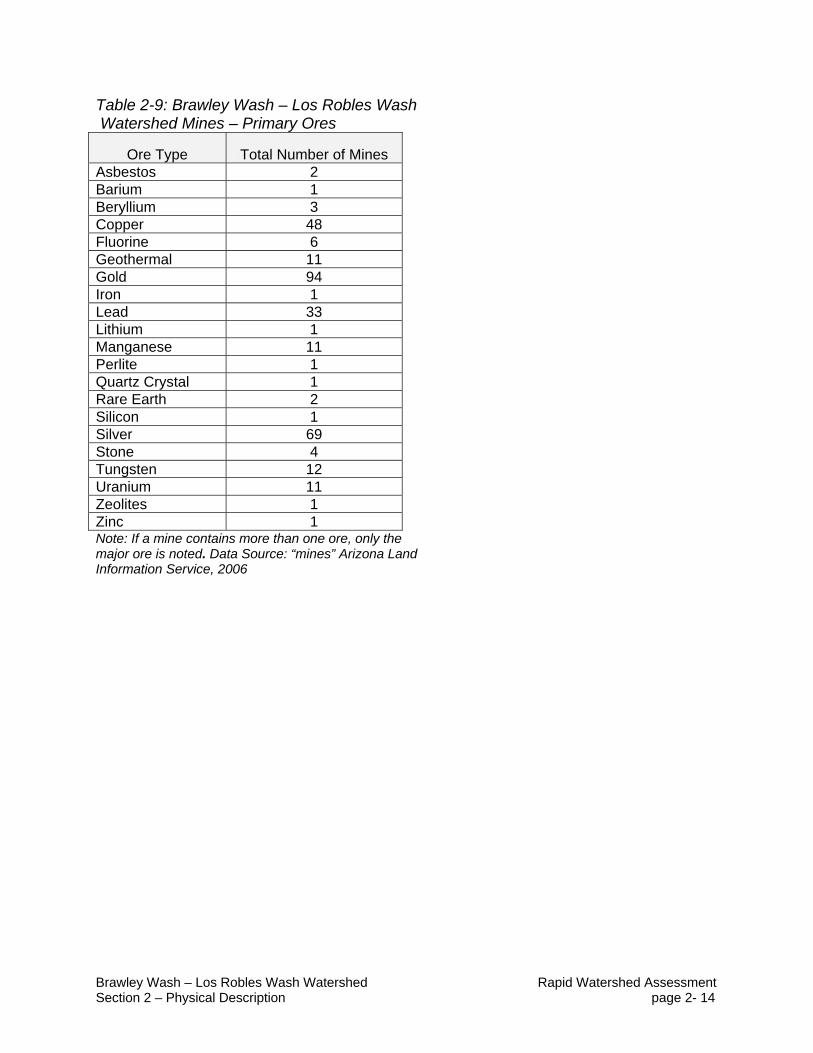
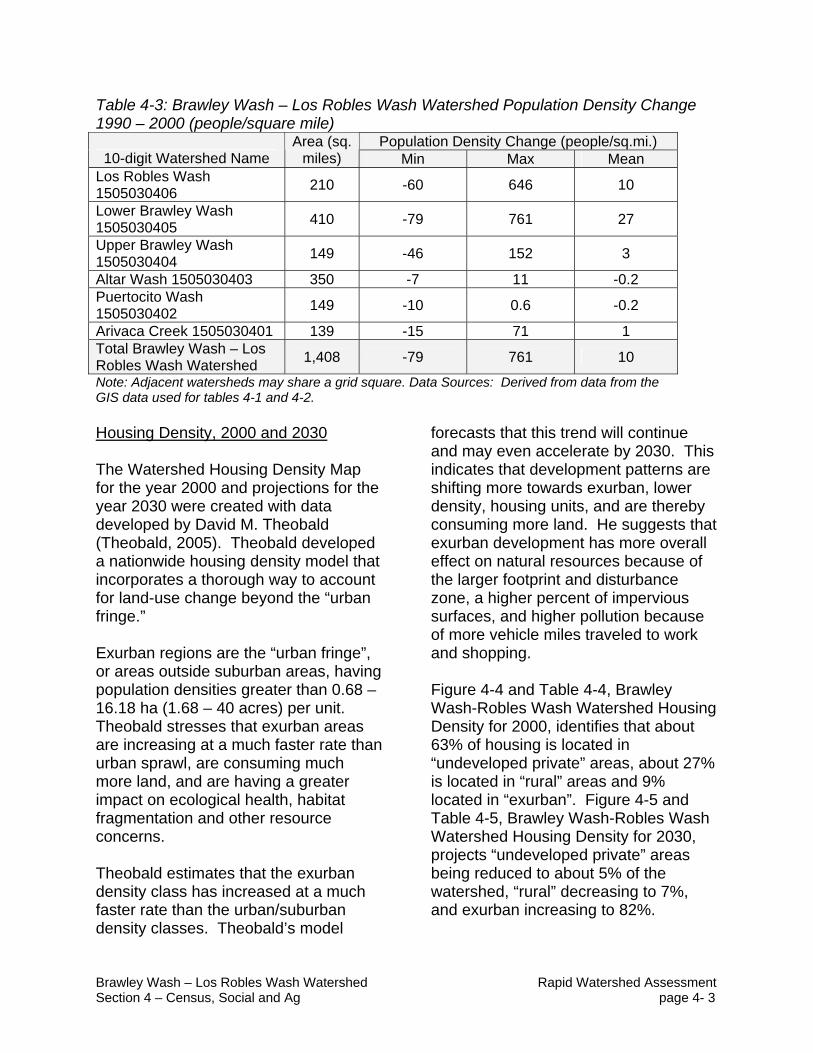

WAT
ERSH
ED N
AME
amp CO
DE
BRAW
LEY
WAS
H - L
OS R
OBLE
S W
ASH
- 150
5030
4 LA
NDUS
E AC
RES
100
00
LAND
USE
TYPE
CR
OP
TYPI
CAL
UNIT
SIZ
E AC
RES
500
ASSE
SSM
ENT
INFO
RMAT
ION
CALC
ULAT
ED P
ARTI
CIPA
TION
34
Be
nchm
ark
Cond
ition
s Fu
ture
Con
ditio
ns
RESO
URCE
CON
CERN
S
Cons
erva
tion
Syst
ems
by T
reat
men
t Lev
el
Tota
l Un
its
Exis
ting
Unch
ange
dUn
its
New
Tr
eatm
ent
Units
To
tal
Units
Soil
Cond
ition
ndash
Orga
nic
Mat
ter
Depl
etio
n
Wat
er
Qua
ntity
ndash
Inef
ficie
nt
Wat
er U
se o
n Irr
igat
ed L
and
Wat
er Q
ualit
y ndash
Exce
ssiv
e Nu
trien
ts a
nd
Orga
nics
in
Grou
ndw
ater
Plan
t Co
nditi
on ndash
Pr
oduc
tivity
He
alth
and
Vi
gor
Ba
selin
e Sy
stem
Rat
ing
-gt
1 5
3 1
Irrig
atio
n La
nd L
evel
ing
(ac
) 4
64
750
375
0 37
5 1
5 3
1 Irr
igat
ion
Wat
er C
onve
yanc
e D
itch
and
Cana
l Lin
ing
(ft)
428
6
000
300
0 0
300
0 1
5 3
1 Irr
igat
ion
Wat
er C
onve
yanc
e P
ipel
ine
(ft)
430
3
000
150
0 0
150
0 1
5 3
1 To
tal A
crea
ge a
t Bas
elin
e 3
000
150
0 0
150
0
Pr
ogre
ssiv
e Sy
stem
Rat
ing
-gt
3 5
4 4
Cons
erva
tion
Crop
Rot
atio
n (
ac)
328
2
500
187
5 37
5 2
250
5 1
3 5
Irrig
atio
n La
nd L
evel
ing
(ac
) 4
64
250
0 2
063
188
225
0 1
5 3
1 Irr
igat
ion
Wat
er C
onve
yanc
e D
itch
and
Cana
l Lin
ing
(ft)
428
20
000
16
500
1
500
180
00
1 5
3 1
Irrig
atio
n W
ater
Con
veya
nce
Pip
elin
e (ft
) 4
30
100
00
825
0 75
0 9
000
1 5
3 1
Irrig
atio
n W
ater
Man
agem
ent
(ac
) 44
9 2
500
187
5 37
5 2
250
1 5
5 3
Tota
l Acr
eage
at P
rogr
essi
ve L
evel
5
000
375
0 75
0 4
500
RMS
Syst
em R
atin
g -gt
4
5 5
5
Cons
erva
tion
Crop
Rot
atio
n (
ac)
328
2
000
262
5 1
375
400
0 5
1 3
5 Irr
igat
ion
Land
Lev
elin
g (
ac)
464
2
000
281
3 1
188
400
0 1
5 3
1 Irr
igat
ion
Wat
er C
onve
yanc
e D
itch
and
Cana
l Lin
ing
(ft)
428
20
000
26
500
13
500
40
000
1
5 3
1 Irr
igat
ion
Wat
er C
onve
yanc
e P
ipel
ine
(ft)
430
8
000
112
50
475
0 16
000
1
5 3
1 Irr
igat
ion
Wat
er M
anag
emen
t (a
c)
449
200
0 2
625
137
5 4
000
1 5
5 3
Nutri
ent M
anag
emen
t (a
c)
590
200
0 2
000
200
0 4
000
1 1
5 5
Pest
Man
agem
ent
(ac
) 59
5 2
000
200
0 2
000
400
0 1
1 3
3 Re
sidue
Man
agem
ent
Seas
onal
(a
c)
344
200
0 2
000
200
0 4
000
5 1
3 5
Tota
l Acr
eage
at R
MS
Leve
l 2
000
200
0 4
000
2
000
Brawley Wash ndash Los Robles Wash Watershed Rapid Watershed Assessment Section 5ndash Resource Assessment page 5- 2
Brawley Wash ndash Los Robles Wash Watershed Rapid Watershed Assessment Section 5ndash Resource Assessment page 5- 3
WAT
ERSH
ED N
AME
amp CO
DE
BRAW
LEY
WAS
H - L
OS R
OBLE
S W
ASH
- 150
5030
4 LA
NDUS
E AC
RES
100
00
LAND
USE
TYPE
CR
OP
TYPI
CAL
UNIT
SIZ
E AC
RES
500
CONS
ERVA
TION
COS
T TA
BLE
CALC
ULAT
ED P
ARTI
CIPA
TION
34
FU
TURE
FE
DERA
L PR
IVAT
E
Inst
allat
ionCo
st
Man
agem
ent
Cost
- 3
yrs
Tech
nical
Assis
tanc
e In
stalla
tion
Cost
An
nual
O amp
M+
Mgt
Cos
ts
Con
serv
atio
n Sy
stem
s by
Tre
atm
ent L
evel
Ne
w Tr
eatm
ent
Units
50
100
20
Tota
l Pre
sent
Va
lue C
ost
50
10
0
Tota
l Pre
sent
Va
lue C
ost
Pr
ogre
ssiv
e
Cons
erva
tion
Crop
Rot
ation
(a
c) 3
28
375
$0
$11
250
$22
50
$12
274
$0
$37
50
$57
73Irr
igatio
n La
nd L
eveli
ng
(ac
) 46
4 18
8 $9
375
0 $0
$1
875
0 $1
125
00
$93
750
$56
25
$117
445
Irriga
tion
Wat
er C
onve
yanc
e D
itch
and
Cana
l Lini
ng (f
t) 4
28
150
0 $6
000
$0
$1
200
$7
200
$6
000
$2
40
$70
11Irr
igatio
n W
ater
Con
veya
nce
Pipe
line
(ft)
430
75
0 $3
750
$0
$7
50
$45
00
$37
50
$150
$4
382
Irriga
tion
Wat
er M
anag
emen
t (a
c) 4
49
375
$0
$11
250
$22
50
$12
274
$0
$37
50
$57
73
Subt
otal
75
0 $1
035
00
$22
500
$25
200
$148
748
$1
035
00
$13
515
$140
383
RM
S
Cons
erva
tion
Crop
Rot
ation
(a
c) 3
28
137
5 $0
$4
125
0 $8
250
$4
500
4 $0
$1
375
0 $2
116
6Irr
igatio
n La
nd L
eveli
ng
(ac
) 46
4 1
188
$593
750
$0
$1
187
50
$712
500
$5
937
50
$35
625
$743
815
Irriga
tion
Wat
er C
onve
yanc
e D
itch
and
Cana
l Lini
ng (f
t) 4
28
135
00
$54
000
$0
$10
800
$64
800
$54
000
$21
60
$63
099
Irriga
tion
Wat
er C
onve
yanc
e P
ipelin
e (ft
) 4
30
475
0 $2
375
0 $0
$4
750
$2
850
0 $2
375
0 $9
50
$27
752
Irriga
tion
Wat
er M
anag
emen
t (a
c) 4
49
137
5 $0
$4
125
0 $8
250
$4
500
4 $0
$1
375
0 $2
116
6Nu
trien
t Man
agem
ent
(ac
) 59
0 2
000
$0
$60
000
$12
000
$65
460
$0
$20
000
$30
787
Pest
Man
agem
ent
(ac
) 59
5 2
000
$0
$60
000
$12
000
$65
460
$0
$20
000
$30
787
Resid
ue M
anag
emen
t Se
ason
al (
ac)
344
2
000
$0
$36
000
$72
00
$39
276
$0
$12
000
$18
472
Subt
otal
2
000
$671
500
$2
385
00
$182
000
$1
066
004
$6
715
00
$118
235
$9
570
44
Gran
d To
tal
275
0 $7
750
00
$261
000
$2
072
00
$12
147
52
$775
000
$1
317
50
$10
974
27
Char
t Ref
ers
To
Land
use
Type
CR
OP
Calcu
lated
Par
ticipa
tion
Rate
34
Av
erag
e PV
Cos
ts p
er A
c
Sy
stem
Fe
dera
l Pr
ivat
e
Pr
og
$198
33
$187
18
RMS
$533
00
$478
52
WAT
ERSH
ED N
AME
amp CO
DE
BRAW
LEY
WAS
H - L
OS R
OBLE
S W
ASH
- 150
5030
4 LA
NDUS
E AC
RES
838
000
LAND
USE
TYPE
RA
NGE
TYPI
CAL
UNIT
SIZ
E AC
RES
500
00
ASSE
SSM
ENT
INFO
RMAT
ION
CALC
ULAT
ED P
ARTI
CIPA
TION
29
Be
nchm
ark
Cond
ition
s Fu
ture
Con
ditio
ns
RESO
URCE
CON
CERN
S
Cons
erva
tion
Syst
ems
by T
reat
men
t Lev
el
Tota
l Un
its
Exis
ting
Unch
ange
dUn
its
New
Tr
eatm
ent
Units
To
tal
Units
So
il Er
osio
n ndash
Shee
t and
Rill
Wat
er Q
ualit
y ndash
Exce
ssiv
e Su
spen
ded
Sedi
men
t and
Tu
rbid
ity in
Su
rface
Wat
er
Plan
t Co
nditi
on ndash
Pr
oduc
tivity
He
alth
and
Vi
gor
Dom
estic
An
imal
s ndash
Inad
equa
te
Qua
ntiti
es a
ndQ
ualit
y of
Fe
ed a
nd
Fora
ge
Ba
selin
e Sy
stem
Rat
ing
-gt
2 2
2 4
Fenc
e (
ft)
382
838
0 4
190
0 4
190
3 3
3 5
Pipe
line
(ft
) 51
6 8
380
419
0 0
419
0 3
3 3
5 To
tal A
crea
ge a
t Bas
elin
e 83
800
41
900
0
419
00
Prog
ress
ive
Syst
em R
atin
g -gt
4
4 4
5
Fenc
e (
ft)
382
251
400
190
645
838
0 19
902
5 3
3 3
5 Pi
pelin
e (
ft)
516
251
400
190
645
838
0 19
902
5 3
3 3
5 Pr
escr
ibed
Gra
zing
(ac
) 5
28
251
400
188
550
104
75
199
025
5 5
5 5
Tota
l Acr
eage
at P
rogr
essi
ve L
evel
50
280
0 37
710
0 20
950
39
805
0
RM
S Sy
stem
Rat
ing
-gt
5 5
5 5
Fenc
e (
ft)
382
251
400
316
345
817
05
398
050
3 3
3 5
Pipe
line
(ft
) 51
6 25
140
0 31
634
5 81
705
39
805
0 3
3 3
5 Pr
escr
ibed
Gra
zing
(ac
) 5
28
251
400
314
250
838
00
398
050
5 5
5 5
Upla
nd W
ildlife
Hab
itat M
anag
emen
t (a
c)
645
251
40
251
40
146
65
398
05
5 5
5 3
Tota
l Acr
eage
at R
MS
Leve
l 25
140
0 25
140
0 39
805
0
146
650
Brawley Wash ndash Los Robles Wash Watershed Rapid Watershed Assessment Section 5ndash Resource Assessment page 5- 4
Brawley Wash ndash Los Robles Wash Watershed Rapid Watershed Assessment Section 5ndash Resource Assessment page 5- 5
WAT
ERSH
ED N
AME
amp CO
DE
BRAW
LEY
WAS
H - L
OS R
OBLE
S W
ASH
- 150
5030
4 LA
NDUS
E AC
RES
838
000
LAND
USE
TYPE
RA
NGE
TYPI
CAL
UNIT
SIZ
E AC
RES
500
00
CONS
ERVA
TION
COS
T TA
BLE
CALC
ULAT
ED P
ARTI
CIPA
TION
29
FU
TURE
FE
DERA
L PR
IVAT
E
Inst
alla
tion
Cost
M
anag
emen
tCo
st -
3 yr
s Te
chni
cal
Assis
tanc
e In
stal
latio
n Co
st
Annu
al O
amp M
+
Mgt
Cos
ts
Con
serv
atio
n Sy
stem
s by
Tre
atm
ent L
evel
Ne
w Tr
eatm
ent
Units
50
100
20
Tota
l Pre
sent
Va
lue
Cost
50
100
Tota
l Pre
sent
Va
lue
Cost
Pr
ogre
ssiv
e
Fenc
e (
ft)
382
838
0 $1
257
0 $0
$2
514
$1
508
4 $1
257
0 $5
03
$14
688
Pipe
line
(ft
) 51
6 8
380
$33
520
$0
$67
04
$40
224
$33
520
$13
41
$39
168
Pres
crib
ed G
razin
g (
ac)
528
10
475
$7
856
$0
$1
571
$9
428
$7
856
$0
$7
856
Subt
otal
20
950
$5
394
6 $0
$1
078
9 $6
473
6 $5
394
6 $1
844
$6
171
2
RMS
Fenc
e (
ft)
382
817
05
$122
558
$0
$2
451
2 $1
470
69
$122
558
$4
902
$1
432
08Pi
pelin
e (
ft)
516
817
05
$326
820
$0
$6
536
4 $3
921
84
$326
820
$1
307
3 $3
818
87Pr
escr
ibed
Gra
zing
(ac
) 5
28
838
00
$62
850
$0
$12
570
$75
420
$62
850
$0
$62
850
Upla
nd W
ildlife
Hab
itat M
anag
emen
t (a
c)
645
146
65
$0
$57
194
$11
439
$62
398
$0
$19
065
$29
347
Subt
otal
14
665
0 $5
122
28
$57
194
$113
884
$6
770
71
$512
228
$3
704
0 $6
172
92
Gra
nd T
otal
16
760
0 $5
661
74
$57
194
$124
673
$7
418
07
$566
174
$3
888
3 $6
790
04
Char
t Ref
ers
To
Land
use
Type
RA
NGE
Calcu
late
d Pa
rticip
atio
n Ra
te
29
Aver
age
PV C
osts
per
Ac
Syst
em
Fede
ral
Priv
ate
Prog
$3
09
$29
5
RM
S $4
62
$42
1
WAT
ERSH
ED N
AME
amp CO
DE
BRAW
LEY
WAS
H - L
OS R
OBLE
S W
ASH
- 150
5030
4 LA
NDUS
E AC
RES
330
00
LAND
USE
TYPE
UR
BAN
TYPI
CAL
UNIT
SIZ
E AC
RES
10
ASSE
SSM
ENT
INFO
RMAT
ION
CALC
ULAT
ED P
ARTI
CIPA
TION
10
Be
nchm
ark
Cond
ition
s Fu
ture
Con
ditio
ns
RESO
URCE
CON
CERN
S
Cons
erva
tion
Syst
ems
by T
reat
men
t Lev
el
Tota
l Un
its
Exis
ting
Unch
ange
dUn
its
New
Tr
eatm
ent
Units
To
tal
Units
Soil
Cond
ition
ndash
Orga
nic
Mat
ter
Depl
etio
n
Wat
er
Qua
ntity
ndash
Inef
ficie
nt
Wat
er U
se o
n Irr
igat
ed L
and
Wat
er Q
ualit
y ndash
Exce
ssiv
e Nu
trien
ts a
nd
Orga
nics
in
Grou
ndw
ater
Air Q
ualit
y ndash
Parti
cula
te
mat
ter l
ess
than
10
mic
rom
eter
s in
dia
met
er
(PM
10)
Ba
selin
e Sy
stem
Rat
ing
-gt
0 0
0 0
No C
onse
rvat
ion
Prac
tices
bei
ng a
pplie
d at
this
leve
l 0
0 0
0 0
0 0
0 To
tal A
crea
ge a
t Bas
elin
e 29
700
26
730
0
267
30
Prog
ress
ive
Syst
em R
atin
g -gt
0
4 2
0
Irrig
atio
n W
ater
Con
veya
nce
Ditc
h an
d Ca
nal L
inin
g (ft
) 4
28
825
00
742
50
742
50
148
500
1 5
3 1
Irrig
atio
n W
ater
Con
veya
nce
Pip
elin
e (ft
) 4
30
825
00
742
50
742
50
148
500
1 5
3 1
Tota
l Acr
eage
at P
rogr
essi
ve L
evel
3
300
297
0 2
970
594
0
RM
S Sy
stem
Rat
ing
-gt
1 5
5 3
Irrig
atio
n La
nd L
evel
ing
(ac
) 4
64
0 0
330
330
1 5
3 1
Irrig
atio
n W
ater
Con
veya
nce
Ditc
h an
d Ca
nal L
inin
g (ft
) 4
28
0 8
250
825
0 16
500
1
5 3
1 Irr
igat
ion
Wat
er C
onve
yanc
e P
ipel
ine
(ft)
430
0
825
0 8
250
165
00
1 5
3 1
Irrig
atio
n W
ater
Man
agem
ent
(ac
) 44
9 0
0 33
0 33
0 1
5 5
3 Nu
trien
t Man
agem
ent
(ac
) 59
0 0
0 33
0 33
0 1
1 5
3 Pe
st M
anag
emen
t (a
c)
595
0 0
330
330
1 1
3 3
Tota
l Acr
eage
at R
MS
Leve
l 0
0 33
0
330
Brawley Wash ndash Los Robles Wash Watershed Rapid Watershed Assessment Section 5ndash Resource Assessment page 5- 6
Brawley Wash ndash Los Robles Wash Watershed Rapid Watershed Assessment Section 5ndash Resource Assessment page 5- 7
WAT
ERSH
ED N
AME
amp CO
DE
BRAW
LEY
WAS
H - L
OS
ROBL
ES W
ASH
- 150
5030
4 LA
NDUS
E AC
RES
330
00
LAND
USE
TYPE
UR
BAN
TYPI
CAL
UNIT
SIZ
E AC
RES
10
CONS
ERVA
TIO
N CO
ST T
ABLE
CA
LCUL
ATED
PAR
TICI
PATI
ON
10
FU
TURE
FE
DERA
L PR
IVAT
E
Inst
alla
tion
Cost
M
anag
emen
t Co
st -
3 yr
s Te
chni
cal
Assis
tanc
e In
stal
latio
n Co
st
Annu
al O
amp M
+ M
gt C
osts
C
onse
rvat
ion
Syst
ems
by T
reat
men
t Lev
el
New
Trea
tmen
t Un
its
50
10
0
20
Tota
l Pre
sent
Va
lue
Cost
50
100
Tota
l Pre
sent
Va
lue
Cost
Pr
ogre
ssiv
e
Irrig
atio
n W
ater
Con
veya
nce
Ditc
h an
d Ca
nal L
inin
g (ft
) 4
28
742
50
$297
000
$0
$5
940
0 $3
564
00
$297
000
$1
188
0 $3
470
43Irr
igat
ion
Wat
er C
onve
yanc
e P
ipel
ine
(ft)
430
74
250
$3
712
50
$0
$74
250
$445
500
$3
712
50
$14
850
$433
804
Subt
otal
2
970
$668
250
$0
$1
336
50
$801
900
$6
682
50
$26
730
$780
846
RM
S
Irrig
atio
n La
nd L
evel
ing
(ac
) 4
64
330
$165
000
$0
$3
300
0 $1
980
00
$165
000
$9
900
$2
067
02Irr
igat
ion
Wat
er C
onve
yanc
e D
itch
and
Cana
l Lin
ing
(ft)
428
8
250
$33
000
$0
$66
00
$39
600
$33
000
$13
20
$38
560
Irrig
atio
n W
ater
Con
veya
nce
Pip
elin
e (ft
) 4
30
825
0 $4
125
0 $0
$8
250
$4
950
0 $4
125
0 $1
650
$4
820
0Irr
igat
ion
Wat
er M
anag
emen
t (a
c)
449
330
$0
$99
00
$19
80
$10
801
$0
$33
00
$50
80Nu
trien
t Man
agem
ent
(ac
) 59
0 33
0 $0
$9
900
$1
980
$1
080
1 $0
$3
300
$5
080
Pest
Man
agem
ent
(ac
) 59
5 33
0 $0
$9
900
$1
980
$1
080
1 $0
$3
300
$5
080
Subt
otal
33
0 $2
392
50
$29
700
$53
790
$319
503
$2
392
50
$22
770
$308
703
Gra
nd T
otal
3
300
$907
500
$2
970
0 $1
874
40
$11
214
03
$907
500
$4
950
0 $1
089
549
Char
t Ref
ers
To
Land
use
Type
UR
BAN
Calcu
late
d Pa
rticip
atio
n Ra
te
10
Aver
age
PV C
osts
per
Ac
Syst
em
Fede
ral
Priv
ate
Prog
$2
700
0 $2
629
1
RM
S $9
681
9 $9
354
6
Section 6 References Arizona Association of Conservation Districts (httpwwwaaocdorg) Arizona Dept of Agriculture (httpwwwazdagov) Arizona Dept of Environmental Quality Water Quality Monitoring amp Assessment (httpazdeqgovenvironwaterassessmentassesshtml) Arizona Department of Environmental Quality (ADEA) Draft 2006 Status of Ambient
Surface Water Quality in Arizona ndash Arizonarsquos Integrated 305(b) Assessment and 303(d) Listing Report Arizona Department of Environmental Quality Phoenix Arizona
Arizona Department of Environmental Quality Air Quality Division httpwwwazdeqgovenvironairplannotmeethtmlphoenix Arizona Department of Water Resources Arizona Drought Preparedness Plan
Background amp Impact Assessment Section Governorrsquos Drought Task Force Governor Janet Napolitano October 8 2004 httpwwwazwatergovdwrcontentfind_by_programGDTFconclusionBackground_Section_100804FINALpdf
Arizona Department of Water Resources (ADWR) 2007 Arizona Water Atlas
Vol 2 web published at httpwwwazwatergovdwr Arizona Department of Water Resources (ADWR) 1999 Third Management
Plan for Tucson Active Management Area 2000-2010 httpwwwazwatergovdwrcontentPublicationsfilesThirdMgmtPlanModifieddefaulthtmTucson
Arizona Game amp Fish Dept Heritage Database httpwwwazgfdgovw_ceditsspecies_concernshtml) Arizona Game amp Fish website 2006 httpwwwazgfdgovw_cheritage_programshtml Arizona State Land Department Arizona Land Resource Information System (ALRIS) GIS data layer ldquoGeologyrdquo February 7 2003 httpwwwlandstateazusalrisindexhtml Arizona State Land Department Arizona Land Resource Information System (ALRIS) GIS data layer ldquoLakesrdquo February 7 2003 httpwwwlandstateazusalrisindexhtml
Brawley Wash ndash Los Robles Wash Watershed Rapid Watershed Assessment Section 6ndash References page 6- 1
Arizona State Land Department Arizona Land Resource Information System (ALRIS) GIS data layer ldquominesrdquo February 7 2002
httpwwwlandstateazusalrisindexhtml Arizona State Land Department Arizona Land Resource Information System (ALRIS) GIS data layer ldquonatvegrdquo June 12 2003
httpwwwlandstateazusalrisindexhtml Arizona State Land Department Arizona Land Resource Information System (ALRIS) GIS data layer ldquoownershiprdquo February 7 2002
httpwwwlandstateazusalrisindexhtml Arizona State Land Department Arizona Land Resource Information System (ALRIS) GIS data layer ldquoStreamsrdquo Arizona October 10 2002 httpwwwlandstateazusalrisindexhtml Brill Karol 2008 Arizona Department of Agriculture personal communication May 7 Brown David E and Charles H Lowe Biotic Communities of the Southwest
11000000 scale August 1980 Bureau of Land Management Arizona Website (httpwwwblmgovazstenhtml) Chronic Halka 1983 Roadside Geology of Arizona Mountain Press Publishing
Company Montana Climate Assessment for the Southwest (CLIMAS) website
wwwispearizonaeduclimas) information on Arizonas drought status Environmental Protection Agency (EPA) website httpepagovairairtrendsaqtrnd95pm10html ESRI Data Products httparcdataesricomdatatiger2000tiger_downloadcfm
Census 2000 October 17 2003 Feth JH and ND White JD Hem 1954 Preliminary Report of Investigations of
Springs in the Mogollon Rim Region Arizona US Geological Survey Open-File Report Tucson Arizona
GeoLytics Inc 1998 Census 1990 Census CD + Maps Release 30 Goodwin LB 1985 Geologic history of the southern Baboquivari Mountains south- central Arizona Geol Soc Am Abstr Programs VolIssue 17 98 Gordon ND TA McMahon and BL Finlayson 1992 Stream Hydrology
Brawley Wash ndash Los Robles Wash Watershed Rapid Watershed Assessment Section 6ndash References page 6- 2
Chapter 4- Getting to know your stream John Wiley amp Sons New York New York Lowry J H Jr R D Ramsey K Boykin D Bradford P Comer S Falzarano W
Kepner J Kirby L Langs J Prior-Magee G Manis L OrsquoBrien T Sajwaj K A Thomas W Rieth S Schrader D Schrupp K Schulz B Thompson C Velasquez C Wallace E Waller and B Wolk 2005 Southwest Regional Gap Analysis Project Final Report on Land Cover Mapping Methods RSGIS Laboratory Utah State University Logan Utah
National Agricultural Statistics Service (httpwwwnassusdagov) National Parks Service (NPS) 2007 Saguaro National Park Information Page httpwwwsaguaronational-parkcominfohtm Natural Resources Conservation Service (NRCS) 2007 Table generated by NRCS Phoenix Office Natural Resources Conservation Service (NRCS) Fact Sheet Brawley Wash-Los
Robles Wash Natural Resources Conservation Service (NRCS) Website 2006 Technical Guide ndash
New Mexico httpwwwnmnrcsusdagovtechnicalfotgtransmittalsfotg-1doc Natural Resources Conservation Service Arizona Website (httpwwwaznrcsusdagov) Natural Resources Conservation Service Arizona GIS Webpage (httpwwwaznrcsusdagovtechnicalgisindexhtml) Natural Resources Conservation Service Web Soil Survey (httpwebsoilsurveynrcsusdagovapp) Natural Resources Conservation Service Water amp Climate Center (httpwwwwccnrcsusdagov) Parker John TC and M E Flynn 2000 Investigation of the Geology and Hydrology
of the Mogollon Highlands of Central Arizona A Project of the Arizona rural Watershed Initiative In cooperation with the Arizona Department of Water Resources USGS Fact Sheet 159-00
Pima County 2000 Biological Stress Assessment An Overview Discussion of Issues and Concerns Sonoran Desert Conservation Plan httpwwwpimagovcmosdcpreportshtml
Brawley Wash ndash Los Robles Wash Watershed Rapid Watershed Assessment Section 6ndash References page 6- 3
Pima County 2006 Chapter 2 Planning Area Characteristics in Pima County Metropolitan Area Facility Plan Pima County Wastewater Management Department httpwwwpimagovwwmreportspdfFacPlan06_chapChap_2pdf
Southern Arizona Data Services Program GIS data layer ldquoArizona Gap Analysis
Project Vegetation Maprdquo University of Arizona 2004 httpsdrsnetsrnrarizonaeduindexphp originated by Arizona Game amp Fish Department Habitat Branch 1993 this dataset was digitized from the August 1980 David E Brown amp Charles H Lowe 11000000 scale Biotic Communities of the Southwest
Southwest Regional GAP Project (httpfws-nmcfwrunmsueduswregap Theobald D 2005 Landscape patterns of exurban growth in the USA from 1980 to
2020 Ecology and Society 10(1) 32 [online] URL httpwwwecology and societyorgvol10iss1art32
United States Department of Agriculture 2004 Arizona Bark Beetle Epidemics Fact Sheet and Information Bulletin Southwestern Region USDA Forest Service httpwwwfsfedusr3prescottforest-healthindexshtml United States Department of Agriculture GIS Data Analysis obtained from US Forest
Service Southwestern Region Forest Health office Feb 26 2007 United States Environmental Protection Agency Surf Your Watershed (httpwwwepagovsurf) United States Environmental Protection Agency Air Quality Trends
httpepagovairaritrendsaqtrnd95pm10html United States Fish amp Wildlife Service Threatened and Endangered Species Listed for
Arizona httpecosfwsgov United States Fish amp Wildlife Service Arizona Ecological Services (httpwwwfwsgovsouthwestesarizona) United States Forest Service Forest Service Fact Sheet ldquoArizona Bark Beetle
Epidemicsrdquo produced by Forest Health Staff Southwestern Region USDA Forest Service January 2004 httpwwwfsfedusr3prescottforest-healthindexshtml
United States Forest Service (USFS) Terrestrial Ecosystem Surveys Surveys are
available for National Forest Lands within the watershed United States Forest Service Southwestern Region (httpwwwfsfedusr3)
Brawley Wash ndash Los Robles Wash Watershed Rapid Watershed Assessment Section 6ndash References page 6- 4
United States Geological Survey NLCD Land Cover Class Definitions httplandcoverusgsgovclassesphp United States Geological Survey April 8 2003 derived from DEM
httpedcusgsgovgeodata United States Geological Survey website National Water Information System
httpwaterdatausgsgovnwis Western Regional Climate Center (WRCC) Temperature data July 15 2004
httpwwwwrccdriedusummaryclimsmazhtml
Brawley Wash ndash Los Robles Wash Watershed Rapid Watershed Assessment Section 6ndash References page 6- 5
GLOSSARY Drainage Basin A region or area bounded by a topographic divide and occupied by a
drainage system also known as a watershed Drought There is no universally accepted quantitative definition of drought
Generally the term is applied to periods of less than average precipitation over a certain period of time natures failure to fulfill the water wants and needs of man
Flood A flood is an overflow or inundation that comes from a river or other body of water and causes or threatens damage It can be any relatively high streamflow overtopping the natural or artificial banks in any reach of a stream It is also a relatively high flow as measured by either gage height or discharge quantity
Ground Water The supply of fresh and saline water found beneath the Earths surface which is often used for supplying wells and springs Because ground water is a major source of drinking water there is a growing concern over areas where leaching agricultural or industrial pollutants are contaminating ground water
Soil Moisture Regimes
Aridic is a soil moisture regime that has no water available for plants for more than half the cumulative time that the soil temperature at 50 cm (20 in) below the surface is gt5degC (41deg F) and has no period as long as 90 consecutive days when there is water for plants while the soil temperature at 50 cm (20 in) is continuously gt8degC (46degF) Udic is a soil moisture regime that is neither dry for as long as 90 cumulative days nor for as long as 60 consecutive days in the 90 days following the summer solstice at periods when the soil temperature at 50 cm (20 in) below the surface is above 5degC (41deg F) Ustic is a soil moisture regime that is intermediate between the aridic and udic regimes and common in temperate subhumid or semiarid regions or in tropical and subtropical regions with a monsoon climate A limited amount of water is available for plants but occurs at times when the soil temperature is optimum for plant growth
Soil Orders
A soil order is a group of soils in the broadest category In the current USDA classification scheme there are 12 orders differentiated by the presence or absence of diagnostic horizons
Soil Temperature
Regimes
Hyperthermic is a soil temperature regime that has mean annual soil temperatures of 22degC (72degF) or more and gt5degC (41deg F) difference between mean summer and mean winter soil temperatures at 50 cm (20 in) below the surface Thermic is a soil temperature regime that has mean annual soil temperatures of 15degC (59degF) or more but lt22degC (72degF) and gt5degC (41deg F) difference between mean summer and mean winter soil temperatures at 50 cm (20 in) below the surface
Brawley Wash ndash Los Robles Wash Watershed Rapid Watershed Assessment Section 7 ndash Glossary page 7- 1
Mesic A soil temperature regime that has mean annual soil temperatures of 8degC (46degF) or more but lt15degC (59degF) and gt5degC (41deg F) difference between mean summer and mean winter soil temperatures at 50 cm (20 in) below the surface
Surface Water Water on the earths surface Lakes bays ponds impounding reservoirs springs rivers streams creeks estuaries wetlands marshes inlets canals and all other bodies of surface water natural or artificial inland or coastal fresh or salt navigable or non-navigable and including the beds and banks of all watercourses and bodies of surface water that are wholly or partially inside or bordering the state or subject to the jurisdiction of the state except that waters in treatment systems which are authorized by state or federal law regulation or permit and which are created for the purpose of waste treatment
Watershed The area of land that contributes surface run-off to a given point in a drainage system and delineated by topographic divides
Brawley Wash ndash Los Robles Wash Watershed Rapid Watershed Assessment Section 7 ndash Glossary page 7- 2
Acknowledgements The following University of Arizona staff and students contributed to the production of this report Terry Sprouse Erin Westfall Lainie Levick Cassie Holmgren Ariel Fisher Melisa Kennedy NRCS Field Office Area Office and State Office staff contributed to the development of this assessment
Brawley Wash ndash Los Robles Wash Watershed Rapid Watershed Assessment Section 7 ndash Glossary page 7- 3
- Table 3-1 Brawley Wash - Los Robles
- Wash Watershed Priority Resource Concerns by Land Use
- Table 3-2 Brawley Wash-Los Robles Wash Watershed Species of Concern
- and Endangered Species Classifications and Observations(1)
- United States Department of Agriculture 2004 Arizona Bark Beetle Epidemics
- Fact Sheet and Information Bulletin Southwestern Region USDA Forest
- Service httpwwwfsfedusr3prescottforest-healthindexshtml
-

WAT
ERSH
ED N
AME
amp CO
DE
BRAW
LEY
WAS
H - L
OS R
OBLE
S W
ASH
- 150
5030
4 LA
NDUS
E AC
RES
838
000
LAND
USE
TYPE
RA
NGE
TYPI
CAL
UNIT
SIZ
E AC
RES
500
00
ASSE
SSM
ENT
INFO
RMAT
ION
CALC
ULAT
ED P
ARTI
CIPA
TION
29
Be
nchm
ark
Cond
ition
s Fu
ture
Con
ditio
ns
RESO
URCE
CON
CERN
S
Cons
erva
tion
Syst
ems
by T
reat
men
t Lev
el
Tota
l Un
its
Exis
ting
Unch
ange
dUn
its
New
Tr
eatm
ent
Units
To
tal
Units
So
il Er
osio
n ndash
Shee
t and
Rill
Wat
er Q
ualit
y ndash
Exce
ssiv
e Su
spen
ded
Sedi
men
t and
Tu
rbid
ity in
Su
rface
Wat
er
Plan
t Co
nditi
on ndash
Pr
oduc
tivity
He
alth
and
Vi
gor
Dom
estic
An
imal
s ndash
Inad
equa
te
Qua
ntiti
es a
ndQ
ualit
y of
Fe
ed a
nd
Fora
ge
Ba
selin
e Sy
stem
Rat
ing
-gt
2 2
2 4
Fenc
e (
ft)
382
838
0 4
190
0 4
190
3 3
3 5
Pipe
line
(ft
) 51
6 8
380
419
0 0
419
0 3
3 3
5 To
tal A
crea
ge a
t Bas
elin
e 83
800
41
900
0
419
00
Prog
ress
ive
Syst
em R
atin
g -gt
4
4 4
5
Fenc
e (
ft)
382
251
400
190
645
838
0 19
902
5 3
3 3
5 Pi
pelin
e (
ft)
516
251
400
190
645
838
0 19
902
5 3
3 3
5 Pr
escr
ibed
Gra
zing
(ac
) 5
28
251
400
188
550
104
75
199
025
5 5
5 5
Tota
l Acr
eage
at P
rogr
essi
ve L
evel
50
280
0 37
710
0 20
950
39
805
0
RM
S Sy
stem
Rat
ing
-gt
5 5
5 5
Fenc
e (
ft)
382
251
400
316
345
817
05
398
050
3 3
3 5
Pipe
line
(ft
) 51
6 25
140
0 31
634
5 81
705
39
805
0 3
3 3
5 Pr
escr
ibed
Gra
zing
(ac
) 5
28
251
400
314
250
838
00
398
050
5 5
5 5
Upla
nd W
ildlife
Hab
itat M
anag
emen
t (a
c)
645
251
40
251
40
146
65
398
05
5 5
5 3
Tota
l Acr
eage
at R
MS
Leve
l 25
140
0 25
140
0 39
805
0
146
650
Brawley Wash ndash Los Robles Wash Watershed Rapid Watershed Assessment Section 5ndash Resource Assessment page 5- 4
Brawley Wash ndash Los Robles Wash Watershed Rapid Watershed Assessment Section 5ndash Resource Assessment page 5- 5
WAT
ERSH
ED N
AME
amp CO
DE
BRAW
LEY
WAS
H - L
OS R
OBLE
S W
ASH
- 150
5030
4 LA
NDUS
E AC
RES
838
000
LAND
USE
TYPE
RA
NGE
TYPI
CAL
UNIT
SIZ
E AC
RES
500
00
CONS
ERVA
TION
COS
T TA
BLE
CALC
ULAT
ED P
ARTI
CIPA
TION
29
FU
TURE
FE
DERA
L PR
IVAT
E
Inst
alla
tion
Cost
M
anag
emen
tCo
st -
3 yr
s Te
chni
cal
Assis
tanc
e In
stal
latio
n Co
st
Annu
al O
amp M
+
Mgt
Cos
ts
Con
serv
atio
n Sy
stem
s by
Tre
atm
ent L
evel
Ne
w Tr
eatm
ent
Units
50
100
20
Tota
l Pre
sent
Va
lue
Cost
50
100
Tota
l Pre
sent
Va
lue
Cost
Pr
ogre
ssiv
e
Fenc
e (
ft)
382
838
0 $1
257
0 $0
$2
514
$1
508
4 $1
257
0 $5
03
$14
688
Pipe
line
(ft
) 51
6 8
380
$33
520
$0
$67
04
$40
224
$33
520
$13
41
$39
168
Pres
crib
ed G
razin
g (
ac)
528
10
475
$7
856
$0
$1
571
$9
428
$7
856
$0
$7
856
Subt
otal
20
950
$5
394
6 $0
$1
078
9 $6
473
6 $5
394
6 $1
844
$6
171
2
RMS
Fenc
e (
ft)
382
817
05
$122
558
$0
$2
451
2 $1
470
69
$122
558
$4
902
$1
432
08Pi
pelin
e (
ft)
516
817
05
$326
820
$0
$6
536
4 $3
921
84
$326
820
$1
307
3 $3
818
87Pr
escr
ibed
Gra
zing
(ac
) 5
28
838
00
$62
850
$0
$12
570
$75
420
$62
850
$0
$62
850
Upla
nd W
ildlife
Hab
itat M
anag
emen
t (a
c)
645
146
65
$0
$57
194
$11
439
$62
398
$0
$19
065
$29
347
Subt
otal
14
665
0 $5
122
28
$57
194
$113
884
$6
770
71
$512
228
$3
704
0 $6
172
92
Gra
nd T
otal
16
760
0 $5
661
74
$57
194
$124
673
$7
418
07
$566
174
$3
888
3 $6
790
04
Char
t Ref
ers
To
Land
use
Type
RA
NGE
Calcu
late
d Pa
rticip
atio
n Ra
te
29
Aver
age
PV C
osts
per
Ac
Syst
em
Fede
ral
Priv
ate
Prog
$3
09
$29
5
RM
S $4
62
$42
1
WAT
ERSH
ED N
AME
amp CO
DE
BRAW
LEY
WAS
H - L
OS R
OBLE
S W
ASH
- 150
5030
4 LA
NDUS
E AC
RES
330
00
LAND
USE
TYPE
UR
BAN
TYPI
CAL
UNIT
SIZ
E AC
RES
10
ASSE
SSM
ENT
INFO
RMAT
ION
CALC
ULAT
ED P
ARTI
CIPA
TION
10
Be
nchm
ark
Cond
ition
s Fu
ture
Con
ditio
ns
RESO
URCE
CON
CERN
S
Cons
erva
tion
Syst
ems
by T
reat
men
t Lev
el
Tota
l Un
its
Exis
ting
Unch
ange
dUn
its
New
Tr
eatm
ent
Units
To
tal
Units
Soil
Cond
ition
ndash
Orga
nic
Mat
ter
Depl
etio
n
Wat
er
Qua
ntity
ndash
Inef
ficie
nt
Wat
er U
se o
n Irr
igat
ed L
and
Wat
er Q
ualit
y ndash
Exce
ssiv
e Nu
trien
ts a
nd
Orga
nics
in
Grou
ndw
ater
Air Q
ualit
y ndash
Parti
cula
te
mat
ter l
ess
than
10
mic
rom
eter
s in
dia
met
er
(PM
10)
Ba
selin
e Sy
stem
Rat
ing
-gt
0 0
0 0
No C
onse
rvat
ion
Prac
tices
bei
ng a
pplie
d at
this
leve
l 0
0 0
0 0
0 0
0 To
tal A
crea
ge a
t Bas
elin
e 29
700
26
730
0
267
30
Prog
ress
ive
Syst
em R
atin
g -gt
0
4 2
0
Irrig
atio
n W
ater
Con
veya
nce
Ditc
h an
d Ca
nal L
inin
g (ft
) 4
28
825
00
742
50
742
50
148
500
1 5
3 1
Irrig
atio
n W
ater
Con
veya
nce
Pip
elin
e (ft
) 4
30
825
00
742
50
742
50
148
500
1 5
3 1
Tota
l Acr
eage
at P
rogr
essi
ve L
evel
3
300
297
0 2
970
594
0
RM
S Sy
stem
Rat
ing
-gt
1 5
5 3
Irrig
atio
n La
nd L
evel
ing
(ac
) 4
64
0 0
330
330
1 5
3 1
Irrig
atio
n W
ater
Con
veya
nce
Ditc
h an
d Ca
nal L
inin
g (ft
) 4
28
0 8
250
825
0 16
500
1
5 3
1 Irr
igat
ion
Wat
er C
onve
yanc
e P
ipel
ine
(ft)
430
0
825
0 8
250
165
00
1 5
3 1
Irrig
atio
n W
ater
Man
agem
ent
(ac
) 44
9 0
0 33
0 33
0 1
5 5
3 Nu
trien
t Man
agem
ent
(ac
) 59
0 0
0 33
0 33
0 1
1 5
3 Pe
st M
anag
emen
t (a
c)
595
0 0
330
330
1 1
3 3
Tota
l Acr
eage
at R
MS
Leve
l 0
0 33
0
330
Brawley Wash ndash Los Robles Wash Watershed Rapid Watershed Assessment Section 5ndash Resource Assessment page 5- 6
Brawley Wash ndash Los Robles Wash Watershed Rapid Watershed Assessment Section 5ndash Resource Assessment page 5- 7
WAT
ERSH
ED N
AME
amp CO
DE
BRAW
LEY
WAS
H - L
OS
ROBL
ES W
ASH
- 150
5030
4 LA
NDUS
E AC
RES
330
00
LAND
USE
TYPE
UR
BAN
TYPI
CAL
UNIT
SIZ
E AC
RES
10
CONS
ERVA
TIO
N CO
ST T
ABLE
CA
LCUL
ATED
PAR
TICI
PATI
ON
10
FU
TURE
FE
DERA
L PR
IVAT
E
Inst
alla
tion
Cost
M
anag
emen
t Co
st -
3 yr
s Te
chni
cal
Assis
tanc
e In
stal
latio
n Co
st
Annu
al O
amp M
+ M
gt C
osts
C
onse
rvat
ion
Syst
ems
by T
reat
men
t Lev
el
New
Trea
tmen
t Un
its
50
10
0
20
Tota
l Pre
sent
Va
lue
Cost
50
100
Tota
l Pre
sent
Va
lue
Cost
Pr
ogre
ssiv
e
Irrig
atio
n W
ater
Con
veya
nce
Ditc
h an
d Ca
nal L
inin
g (ft
) 4
28
742
50
$297
000
$0
$5
940
0 $3
564
00
$297
000
$1
188
0 $3
470
43Irr
igat
ion
Wat
er C
onve
yanc
e P
ipel
ine
(ft)
430
74
250
$3
712
50
$0
$74
250
$445
500
$3
712
50
$14
850
$433
804
Subt
otal
2
970
$668
250
$0
$1
336
50
$801
900
$6
682
50
$26
730
$780
846
RM
S
Irrig
atio
n La
nd L
evel
ing
(ac
) 4
64
330
$165
000
$0
$3
300
0 $1
980
00
$165
000
$9
900
$2
067
02Irr
igat
ion
Wat
er C
onve
yanc
e D
itch
and
Cana
l Lin
ing
(ft)
428
8
250
$33
000
$0
$66
00
$39
600
$33
000
$13
20
$38
560
Irrig
atio
n W
ater
Con
veya
nce
Pip
elin
e (ft
) 4
30
825
0 $4
125
0 $0
$8
250
$4
950
0 $4
125
0 $1
650
$4
820
0Irr
igat
ion
Wat
er M
anag
emen
t (a
c)
449
330
$0
$99
00
$19
80
$10
801
$0
$33
00
$50
80Nu
trien
t Man
agem
ent
(ac
) 59
0 33
0 $0
$9
900
$1
980
$1
080
1 $0
$3
300
$5
080
Pest
Man
agem
ent
(ac
) 59
5 33
0 $0
$9
900
$1
980
$1
080
1 $0
$3
300
$5
080
Subt
otal
33
0 $2
392
50
$29
700
$53
790
$319
503
$2
392
50
$22
770
$308
703
Gra
nd T
otal
3
300
$907
500
$2
970
0 $1
874
40
$11
214
03
$907
500
$4
950
0 $1
089
549
Char
t Ref
ers
To
Land
use
Type
UR
BAN
Calcu
late
d Pa
rticip
atio
n Ra
te
10
Aver
age
PV C
osts
per
Ac
Syst
em
Fede
ral
Priv
ate
Prog
$2
700
0 $2
629
1
RM
S $9
681
9 $9
354
6
Section 6 References Arizona Association of Conservation Districts (httpwwwaaocdorg) Arizona Dept of Agriculture (httpwwwazdagov) Arizona Dept of Environmental Quality Water Quality Monitoring amp Assessment (httpazdeqgovenvironwaterassessmentassesshtml) Arizona Department of Environmental Quality (ADEA) Draft 2006 Status of Ambient
Surface Water Quality in Arizona ndash Arizonarsquos Integrated 305(b) Assessment and 303(d) Listing Report Arizona Department of Environmental Quality Phoenix Arizona
Arizona Department of Environmental Quality Air Quality Division httpwwwazdeqgovenvironairplannotmeethtmlphoenix Arizona Department of Water Resources Arizona Drought Preparedness Plan
Background amp Impact Assessment Section Governorrsquos Drought Task Force Governor Janet Napolitano October 8 2004 httpwwwazwatergovdwrcontentfind_by_programGDTFconclusionBackground_Section_100804FINALpdf
Arizona Department of Water Resources (ADWR) 2007 Arizona Water Atlas
Vol 2 web published at httpwwwazwatergovdwr Arizona Department of Water Resources (ADWR) 1999 Third Management
Plan for Tucson Active Management Area 2000-2010 httpwwwazwatergovdwrcontentPublicationsfilesThirdMgmtPlanModifieddefaulthtmTucson
Arizona Game amp Fish Dept Heritage Database httpwwwazgfdgovw_ceditsspecies_concernshtml) Arizona Game amp Fish website 2006 httpwwwazgfdgovw_cheritage_programshtml Arizona State Land Department Arizona Land Resource Information System (ALRIS) GIS data layer ldquoGeologyrdquo February 7 2003 httpwwwlandstateazusalrisindexhtml Arizona State Land Department Arizona Land Resource Information System (ALRIS) GIS data layer ldquoLakesrdquo February 7 2003 httpwwwlandstateazusalrisindexhtml
Brawley Wash ndash Los Robles Wash Watershed Rapid Watershed Assessment Section 6ndash References page 6- 1
Arizona State Land Department Arizona Land Resource Information System (ALRIS) GIS data layer ldquominesrdquo February 7 2002
httpwwwlandstateazusalrisindexhtml Arizona State Land Department Arizona Land Resource Information System (ALRIS) GIS data layer ldquonatvegrdquo June 12 2003
httpwwwlandstateazusalrisindexhtml Arizona State Land Department Arizona Land Resource Information System (ALRIS) GIS data layer ldquoownershiprdquo February 7 2002
httpwwwlandstateazusalrisindexhtml Arizona State Land Department Arizona Land Resource Information System (ALRIS) GIS data layer ldquoStreamsrdquo Arizona October 10 2002 httpwwwlandstateazusalrisindexhtml Brill Karol 2008 Arizona Department of Agriculture personal communication May 7 Brown David E and Charles H Lowe Biotic Communities of the Southwest
11000000 scale August 1980 Bureau of Land Management Arizona Website (httpwwwblmgovazstenhtml) Chronic Halka 1983 Roadside Geology of Arizona Mountain Press Publishing
Company Montana Climate Assessment for the Southwest (CLIMAS) website
wwwispearizonaeduclimas) information on Arizonas drought status Environmental Protection Agency (EPA) website httpepagovairairtrendsaqtrnd95pm10html ESRI Data Products httparcdataesricomdatatiger2000tiger_downloadcfm
Census 2000 October 17 2003 Feth JH and ND White JD Hem 1954 Preliminary Report of Investigations of
Springs in the Mogollon Rim Region Arizona US Geological Survey Open-File Report Tucson Arizona
GeoLytics Inc 1998 Census 1990 Census CD + Maps Release 30 Goodwin LB 1985 Geologic history of the southern Baboquivari Mountains south- central Arizona Geol Soc Am Abstr Programs VolIssue 17 98 Gordon ND TA McMahon and BL Finlayson 1992 Stream Hydrology
Brawley Wash ndash Los Robles Wash Watershed Rapid Watershed Assessment Section 6ndash References page 6- 2
Chapter 4- Getting to know your stream John Wiley amp Sons New York New York Lowry J H Jr R D Ramsey K Boykin D Bradford P Comer S Falzarano W
Kepner J Kirby L Langs J Prior-Magee G Manis L OrsquoBrien T Sajwaj K A Thomas W Rieth S Schrader D Schrupp K Schulz B Thompson C Velasquez C Wallace E Waller and B Wolk 2005 Southwest Regional Gap Analysis Project Final Report on Land Cover Mapping Methods RSGIS Laboratory Utah State University Logan Utah
National Agricultural Statistics Service (httpwwwnassusdagov) National Parks Service (NPS) 2007 Saguaro National Park Information Page httpwwwsaguaronational-parkcominfohtm Natural Resources Conservation Service (NRCS) 2007 Table generated by NRCS Phoenix Office Natural Resources Conservation Service (NRCS) Fact Sheet Brawley Wash-Los
Robles Wash Natural Resources Conservation Service (NRCS) Website 2006 Technical Guide ndash
New Mexico httpwwwnmnrcsusdagovtechnicalfotgtransmittalsfotg-1doc Natural Resources Conservation Service Arizona Website (httpwwwaznrcsusdagov) Natural Resources Conservation Service Arizona GIS Webpage (httpwwwaznrcsusdagovtechnicalgisindexhtml) Natural Resources Conservation Service Web Soil Survey (httpwebsoilsurveynrcsusdagovapp) Natural Resources Conservation Service Water amp Climate Center (httpwwwwccnrcsusdagov) Parker John TC and M E Flynn 2000 Investigation of the Geology and Hydrology
of the Mogollon Highlands of Central Arizona A Project of the Arizona rural Watershed Initiative In cooperation with the Arizona Department of Water Resources USGS Fact Sheet 159-00
Pima County 2000 Biological Stress Assessment An Overview Discussion of Issues and Concerns Sonoran Desert Conservation Plan httpwwwpimagovcmosdcpreportshtml
Brawley Wash ndash Los Robles Wash Watershed Rapid Watershed Assessment Section 6ndash References page 6- 3
Pima County 2006 Chapter 2 Planning Area Characteristics in Pima County Metropolitan Area Facility Plan Pima County Wastewater Management Department httpwwwpimagovwwmreportspdfFacPlan06_chapChap_2pdf
Southern Arizona Data Services Program GIS data layer ldquoArizona Gap Analysis
Project Vegetation Maprdquo University of Arizona 2004 httpsdrsnetsrnrarizonaeduindexphp originated by Arizona Game amp Fish Department Habitat Branch 1993 this dataset was digitized from the August 1980 David E Brown amp Charles H Lowe 11000000 scale Biotic Communities of the Southwest
Southwest Regional GAP Project (httpfws-nmcfwrunmsueduswregap Theobald D 2005 Landscape patterns of exurban growth in the USA from 1980 to
2020 Ecology and Society 10(1) 32 [online] URL httpwwwecology and societyorgvol10iss1art32
United States Department of Agriculture 2004 Arizona Bark Beetle Epidemics Fact Sheet and Information Bulletin Southwestern Region USDA Forest Service httpwwwfsfedusr3prescottforest-healthindexshtml United States Department of Agriculture GIS Data Analysis obtained from US Forest
Service Southwestern Region Forest Health office Feb 26 2007 United States Environmental Protection Agency Surf Your Watershed (httpwwwepagovsurf) United States Environmental Protection Agency Air Quality Trends
httpepagovairaritrendsaqtrnd95pm10html United States Fish amp Wildlife Service Threatened and Endangered Species Listed for
Arizona httpecosfwsgov United States Fish amp Wildlife Service Arizona Ecological Services (httpwwwfwsgovsouthwestesarizona) United States Forest Service Forest Service Fact Sheet ldquoArizona Bark Beetle
Epidemicsrdquo produced by Forest Health Staff Southwestern Region USDA Forest Service January 2004 httpwwwfsfedusr3prescottforest-healthindexshtml
United States Forest Service (USFS) Terrestrial Ecosystem Surveys Surveys are
available for National Forest Lands within the watershed United States Forest Service Southwestern Region (httpwwwfsfedusr3)
Brawley Wash ndash Los Robles Wash Watershed Rapid Watershed Assessment Section 6ndash References page 6- 4
United States Geological Survey NLCD Land Cover Class Definitions httplandcoverusgsgovclassesphp United States Geological Survey April 8 2003 derived from DEM
httpedcusgsgovgeodata United States Geological Survey website National Water Information System
httpwaterdatausgsgovnwis Western Regional Climate Center (WRCC) Temperature data July 15 2004
httpwwwwrccdriedusummaryclimsmazhtml
Brawley Wash ndash Los Robles Wash Watershed Rapid Watershed Assessment Section 6ndash References page 6- 5
GLOSSARY Drainage Basin A region or area bounded by a topographic divide and occupied by a
drainage system also known as a watershed Drought There is no universally accepted quantitative definition of drought
Generally the term is applied to periods of less than average precipitation over a certain period of time natures failure to fulfill the water wants and needs of man
Flood A flood is an overflow or inundation that comes from a river or other body of water and causes or threatens damage It can be any relatively high streamflow overtopping the natural or artificial banks in any reach of a stream It is also a relatively high flow as measured by either gage height or discharge quantity
Ground Water The supply of fresh and saline water found beneath the Earths surface which is often used for supplying wells and springs Because ground water is a major source of drinking water there is a growing concern over areas where leaching agricultural or industrial pollutants are contaminating ground water
Soil Moisture Regimes
Aridic is a soil moisture regime that has no water available for plants for more than half the cumulative time that the soil temperature at 50 cm (20 in) below the surface is gt5degC (41deg F) and has no period as long as 90 consecutive days when there is water for plants while the soil temperature at 50 cm (20 in) is continuously gt8degC (46degF) Udic is a soil moisture regime that is neither dry for as long as 90 cumulative days nor for as long as 60 consecutive days in the 90 days following the summer solstice at periods when the soil temperature at 50 cm (20 in) below the surface is above 5degC (41deg F) Ustic is a soil moisture regime that is intermediate between the aridic and udic regimes and common in temperate subhumid or semiarid regions or in tropical and subtropical regions with a monsoon climate A limited amount of water is available for plants but occurs at times when the soil temperature is optimum for plant growth
Soil Orders
A soil order is a group of soils in the broadest category In the current USDA classification scheme there are 12 orders differentiated by the presence or absence of diagnostic horizons
Soil Temperature
Regimes
Hyperthermic is a soil temperature regime that has mean annual soil temperatures of 22degC (72degF) or more and gt5degC (41deg F) difference between mean summer and mean winter soil temperatures at 50 cm (20 in) below the surface Thermic is a soil temperature regime that has mean annual soil temperatures of 15degC (59degF) or more but lt22degC (72degF) and gt5degC (41deg F) difference between mean summer and mean winter soil temperatures at 50 cm (20 in) below the surface
Brawley Wash ndash Los Robles Wash Watershed Rapid Watershed Assessment Section 7 ndash Glossary page 7- 1
Mesic A soil temperature regime that has mean annual soil temperatures of 8degC (46degF) or more but lt15degC (59degF) and gt5degC (41deg F) difference between mean summer and mean winter soil temperatures at 50 cm (20 in) below the surface
Surface Water Water on the earths surface Lakes bays ponds impounding reservoirs springs rivers streams creeks estuaries wetlands marshes inlets canals and all other bodies of surface water natural or artificial inland or coastal fresh or salt navigable or non-navigable and including the beds and banks of all watercourses and bodies of surface water that are wholly or partially inside or bordering the state or subject to the jurisdiction of the state except that waters in treatment systems which are authorized by state or federal law regulation or permit and which are created for the purpose of waste treatment
Watershed The area of land that contributes surface run-off to a given point in a drainage system and delineated by topographic divides
Brawley Wash ndash Los Robles Wash Watershed Rapid Watershed Assessment Section 7 ndash Glossary page 7- 2
Acknowledgements The following University of Arizona staff and students contributed to the production of this report Terry Sprouse Erin Westfall Lainie Levick Cassie Holmgren Ariel Fisher Melisa Kennedy NRCS Field Office Area Office and State Office staff contributed to the development of this assessment
Brawley Wash ndash Los Robles Wash Watershed Rapid Watershed Assessment Section 7 ndash Glossary page 7- 3
- Table 3-1 Brawley Wash - Los Robles
- Wash Watershed Priority Resource Concerns by Land Use
- Table 3-2 Brawley Wash-Los Robles Wash Watershed Species of Concern
- and Endangered Species Classifications and Observations(1)
- United States Department of Agriculture 2004 Arizona Bark Beetle Epidemics
- Fact Sheet and Information Bulletin Southwestern Region USDA Forest
- Service httpwwwfsfedusr3prescottforest-healthindexshtml
-

WAT
ERSH
ED N
AME
amp CO
DE
BRAW
LEY
WAS
H - L
OS R
OBLE
S W
ASH
- 150
5030
4 LA
NDUS
E AC
RES
330
00
LAND
USE
TYPE
UR
BAN
TYPI
CAL
UNIT
SIZ
E AC
RES
10
ASSE
SSM
ENT
INFO
RMAT
ION
CALC
ULAT
ED P
ARTI
CIPA
TION
10
Be
nchm
ark
Cond
ition
s Fu
ture
Con
ditio
ns
RESO
URCE
CON
CERN
S
Cons
erva
tion
Syst
ems
by T
reat
men
t Lev
el
Tota
l Un
its
Exis
ting
Unch
ange
dUn
its
New
Tr
eatm
ent
Units
To
tal
Units
Soil
Cond
ition
ndash
Orga
nic
Mat
ter
Depl
etio
n
Wat
er
Qua
ntity
ndash
Inef
ficie
nt
Wat
er U
se o
n Irr
igat
ed L
and
Wat
er Q
ualit
y ndash
Exce
ssiv
e Nu
trien
ts a
nd
Orga
nics
in
Grou
ndw
ater
Air Q
ualit
y ndash
Parti
cula
te
mat
ter l
ess
than
10
mic
rom
eter
s in
dia
met
er
(PM
10)
Ba
selin
e Sy
stem
Rat
ing
-gt
0 0
0 0
No C
onse
rvat
ion
Prac
tices
bei
ng a
pplie
d at
this
leve
l 0
0 0
0 0
0 0
0 To
tal A
crea
ge a
t Bas
elin
e 29
700
26
730
0
267
30
Prog
ress
ive
Syst
em R
atin
g -gt
0
4 2
0
Irrig
atio
n W
ater
Con
veya
nce
Ditc
h an
d Ca
nal L
inin
g (ft
) 4
28
825
00
742
50
742
50
148
500
1 5
3 1
Irrig
atio
n W
ater
Con
veya
nce
Pip
elin
e (ft
) 4
30
825
00
742
50
742
50
148
500
1 5
3 1
Tota
l Acr
eage
at P
rogr
essi
ve L
evel
3
300
297
0 2
970
594
0
RM
S Sy
stem
Rat
ing
-gt
1 5
5 3
Irrig
atio
n La
nd L
evel
ing
(ac
) 4
64
0 0
330
330
1 5
3 1
Irrig
atio
n W
ater
Con
veya
nce
Ditc
h an
d Ca
nal L
inin
g (ft
) 4
28
0 8
250
825
0 16
500
1
5 3
1 Irr
igat
ion
Wat
er C
onve
yanc
e P
ipel
ine
(ft)
430
0
825
0 8
250
165
00
1 5
3 1
Irrig
atio
n W
ater
Man
agem
ent
(ac
) 44
9 0
0 33
0 33
0 1
5 5
3 Nu
trien
t Man
agem
ent
(ac
) 59
0 0
0 33
0 33
0 1
1 5
3 Pe
st M
anag
emen
t (a
c)
595
0 0
330
330
1 1
3 3
Tota
l Acr
eage
at R
MS
Leve
l 0
0 33
0
330
Brawley Wash ndash Los Robles Wash Watershed Rapid Watershed Assessment Section 5ndash Resource Assessment page 5- 6
Brawley Wash ndash Los Robles Wash Watershed Rapid Watershed Assessment Section 5ndash Resource Assessment page 5- 7
WAT
ERSH
ED N
AME
amp CO
DE
BRAW
LEY
WAS
H - L
OS
ROBL
ES W
ASH
- 150
5030
4 LA
NDUS
E AC
RES
330
00
LAND
USE
TYPE
UR
BAN
TYPI
CAL
UNIT
SIZ
E AC
RES
10
CONS
ERVA
TIO
N CO
ST T
ABLE
CA
LCUL
ATED
PAR
TICI
PATI
ON
10
FU
TURE
FE
DERA
L PR
IVAT
E
Inst
alla
tion
Cost
M
anag
emen
t Co
st -
3 yr
s Te
chni
cal
Assis
tanc
e In
stal
latio
n Co
st
Annu
al O
amp M
+ M
gt C
osts
C
onse
rvat
ion
Syst
ems
by T
reat
men
t Lev
el
New
Trea
tmen
t Un
its
50
10
0
20
Tota
l Pre
sent
Va
lue
Cost
50
100
Tota
l Pre
sent
Va
lue
Cost
Pr
ogre
ssiv
e
Irrig
atio
n W
ater
Con
veya
nce
Ditc
h an
d Ca
nal L
inin
g (ft
) 4
28
742
50
$297
000
$0
$5
940
0 $3
564
00
$297
000
$1
188
0 $3
470
43Irr
igat
ion
Wat
er C
onve
yanc
e P
ipel
ine
(ft)
430
74
250
$3
712
50
$0
$74
250
$445
500
$3
712
50
$14
850
$433
804
Subt
otal
2
970
$668
250
$0
$1
336
50
$801
900
$6
682
50
$26
730
$780
846
RM
S
Irrig
atio
n La
nd L
evel
ing
(ac
) 4
64
330
$165
000
$0
$3
300
0 $1
980
00
$165
000
$9
900
$2
067
02Irr
igat
ion
Wat
er C
onve
yanc
e D
itch
and
Cana
l Lin
ing
(ft)
428
8
250
$33
000
$0
$66
00
$39
600
$33
000
$13
20
$38
560
Irrig
atio
n W
ater
Con
veya
nce
Pip
elin
e (ft
) 4
30
825
0 $4
125
0 $0
$8
250
$4
950
0 $4
125
0 $1
650
$4
820
0Irr
igat
ion
Wat
er M
anag
emen
t (a
c)
449
330
$0
$99
00
$19
80
$10
801
$0
$33
00
$50
80Nu
trien
t Man
agem
ent
(ac
) 59
0 33
0 $0
$9
900
$1
980
$1
080
1 $0
$3
300
$5
080
Pest
Man
agem
ent
(ac
) 59
5 33
0 $0
$9
900
$1
980
$1
080
1 $0
$3
300
$5
080
Subt
otal
33
0 $2
392
50
$29
700
$53
790
$319
503
$2
392
50
$22
770
$308
703
Gra
nd T
otal
3
300
$907
500
$2
970
0 $1
874
40
$11
214
03
$907
500
$4
950
0 $1
089
549
Char
t Ref
ers
To
Land
use
Type
UR
BAN
Calcu
late
d Pa
rticip
atio
n Ra
te
10
Aver
age
PV C
osts
per
Ac
Syst
em
Fede
ral
Priv
ate
Prog
$2
700
0 $2
629
1
RM
S $9
681
9 $9
354
6
Section 6 References Arizona Association of Conservation Districts (httpwwwaaocdorg) Arizona Dept of Agriculture (httpwwwazdagov) Arizona Dept of Environmental Quality Water Quality Monitoring amp Assessment (httpazdeqgovenvironwaterassessmentassesshtml) Arizona Department of Environmental Quality (ADEA) Draft 2006 Status of Ambient
Surface Water Quality in Arizona ndash Arizonarsquos Integrated 305(b) Assessment and 303(d) Listing Report Arizona Department of Environmental Quality Phoenix Arizona
Arizona Department of Environmental Quality Air Quality Division httpwwwazdeqgovenvironairplannotmeethtmlphoenix Arizona Department of Water Resources Arizona Drought Preparedness Plan
Background amp Impact Assessment Section Governorrsquos Drought Task Force Governor Janet Napolitano October 8 2004 httpwwwazwatergovdwrcontentfind_by_programGDTFconclusionBackground_Section_100804FINALpdf
Arizona Department of Water Resources (ADWR) 2007 Arizona Water Atlas
Vol 2 web published at httpwwwazwatergovdwr Arizona Department of Water Resources (ADWR) 1999 Third Management
Plan for Tucson Active Management Area 2000-2010 httpwwwazwatergovdwrcontentPublicationsfilesThirdMgmtPlanModifieddefaulthtmTucson
Arizona Game amp Fish Dept Heritage Database httpwwwazgfdgovw_ceditsspecies_concernshtml) Arizona Game amp Fish website 2006 httpwwwazgfdgovw_cheritage_programshtml Arizona State Land Department Arizona Land Resource Information System (ALRIS) GIS data layer ldquoGeologyrdquo February 7 2003 httpwwwlandstateazusalrisindexhtml Arizona State Land Department Arizona Land Resource Information System (ALRIS) GIS data layer ldquoLakesrdquo February 7 2003 httpwwwlandstateazusalrisindexhtml
Brawley Wash ndash Los Robles Wash Watershed Rapid Watershed Assessment Section 6ndash References page 6- 1
Arizona State Land Department Arizona Land Resource Information System (ALRIS) GIS data layer ldquominesrdquo February 7 2002
httpwwwlandstateazusalrisindexhtml Arizona State Land Department Arizona Land Resource Information System (ALRIS) GIS data layer ldquonatvegrdquo June 12 2003
httpwwwlandstateazusalrisindexhtml Arizona State Land Department Arizona Land Resource Information System (ALRIS) GIS data layer ldquoownershiprdquo February 7 2002
httpwwwlandstateazusalrisindexhtml Arizona State Land Department Arizona Land Resource Information System (ALRIS) GIS data layer ldquoStreamsrdquo Arizona October 10 2002 httpwwwlandstateazusalrisindexhtml Brill Karol 2008 Arizona Department of Agriculture personal communication May 7 Brown David E and Charles H Lowe Biotic Communities of the Southwest
11000000 scale August 1980 Bureau of Land Management Arizona Website (httpwwwblmgovazstenhtml) Chronic Halka 1983 Roadside Geology of Arizona Mountain Press Publishing
Company Montana Climate Assessment for the Southwest (CLIMAS) website
wwwispearizonaeduclimas) information on Arizonas drought status Environmental Protection Agency (EPA) website httpepagovairairtrendsaqtrnd95pm10html ESRI Data Products httparcdataesricomdatatiger2000tiger_downloadcfm
Census 2000 October 17 2003 Feth JH and ND White JD Hem 1954 Preliminary Report of Investigations of
Springs in the Mogollon Rim Region Arizona US Geological Survey Open-File Report Tucson Arizona
GeoLytics Inc 1998 Census 1990 Census CD + Maps Release 30 Goodwin LB 1985 Geologic history of the southern Baboquivari Mountains south- central Arizona Geol Soc Am Abstr Programs VolIssue 17 98 Gordon ND TA McMahon and BL Finlayson 1992 Stream Hydrology
Brawley Wash ndash Los Robles Wash Watershed Rapid Watershed Assessment Section 6ndash References page 6- 2
Chapter 4- Getting to know your stream John Wiley amp Sons New York New York Lowry J H Jr R D Ramsey K Boykin D Bradford P Comer S Falzarano W
Kepner J Kirby L Langs J Prior-Magee G Manis L OrsquoBrien T Sajwaj K A Thomas W Rieth S Schrader D Schrupp K Schulz B Thompson C Velasquez C Wallace E Waller and B Wolk 2005 Southwest Regional Gap Analysis Project Final Report on Land Cover Mapping Methods RSGIS Laboratory Utah State University Logan Utah
National Agricultural Statistics Service (httpwwwnassusdagov) National Parks Service (NPS) 2007 Saguaro National Park Information Page httpwwwsaguaronational-parkcominfohtm Natural Resources Conservation Service (NRCS) 2007 Table generated by NRCS Phoenix Office Natural Resources Conservation Service (NRCS) Fact Sheet Brawley Wash-Los
Robles Wash Natural Resources Conservation Service (NRCS) Website 2006 Technical Guide ndash
New Mexico httpwwwnmnrcsusdagovtechnicalfotgtransmittalsfotg-1doc Natural Resources Conservation Service Arizona Website (httpwwwaznrcsusdagov) Natural Resources Conservation Service Arizona GIS Webpage (httpwwwaznrcsusdagovtechnicalgisindexhtml) Natural Resources Conservation Service Web Soil Survey (httpwebsoilsurveynrcsusdagovapp) Natural Resources Conservation Service Water amp Climate Center (httpwwwwccnrcsusdagov) Parker John TC and M E Flynn 2000 Investigation of the Geology and Hydrology
of the Mogollon Highlands of Central Arizona A Project of the Arizona rural Watershed Initiative In cooperation with the Arizona Department of Water Resources USGS Fact Sheet 159-00
Pima County 2000 Biological Stress Assessment An Overview Discussion of Issues and Concerns Sonoran Desert Conservation Plan httpwwwpimagovcmosdcpreportshtml
Brawley Wash ndash Los Robles Wash Watershed Rapid Watershed Assessment Section 6ndash References page 6- 3
Pima County 2006 Chapter 2 Planning Area Characteristics in Pima County Metropolitan Area Facility Plan Pima County Wastewater Management Department httpwwwpimagovwwmreportspdfFacPlan06_chapChap_2pdf
Southern Arizona Data Services Program GIS data layer ldquoArizona Gap Analysis
Project Vegetation Maprdquo University of Arizona 2004 httpsdrsnetsrnrarizonaeduindexphp originated by Arizona Game amp Fish Department Habitat Branch 1993 this dataset was digitized from the August 1980 David E Brown amp Charles H Lowe 11000000 scale Biotic Communities of the Southwest
Southwest Regional GAP Project (httpfws-nmcfwrunmsueduswregap Theobald D 2005 Landscape patterns of exurban growth in the USA from 1980 to
2020 Ecology and Society 10(1) 32 [online] URL httpwwwecology and societyorgvol10iss1art32
United States Department of Agriculture 2004 Arizona Bark Beetle Epidemics Fact Sheet and Information Bulletin Southwestern Region USDA Forest Service httpwwwfsfedusr3prescottforest-healthindexshtml United States Department of Agriculture GIS Data Analysis obtained from US Forest
Service Southwestern Region Forest Health office Feb 26 2007 United States Environmental Protection Agency Surf Your Watershed (httpwwwepagovsurf) United States Environmental Protection Agency Air Quality Trends
httpepagovairaritrendsaqtrnd95pm10html United States Fish amp Wildlife Service Threatened and Endangered Species Listed for
Arizona httpecosfwsgov United States Fish amp Wildlife Service Arizona Ecological Services (httpwwwfwsgovsouthwestesarizona) United States Forest Service Forest Service Fact Sheet ldquoArizona Bark Beetle
Epidemicsrdquo produced by Forest Health Staff Southwestern Region USDA Forest Service January 2004 httpwwwfsfedusr3prescottforest-healthindexshtml
United States Forest Service (USFS) Terrestrial Ecosystem Surveys Surveys are
available for National Forest Lands within the watershed United States Forest Service Southwestern Region (httpwwwfsfedusr3)
Brawley Wash ndash Los Robles Wash Watershed Rapid Watershed Assessment Section 6ndash References page 6- 4
United States Geological Survey NLCD Land Cover Class Definitions httplandcoverusgsgovclassesphp United States Geological Survey April 8 2003 derived from DEM
httpedcusgsgovgeodata United States Geological Survey website National Water Information System
httpwaterdatausgsgovnwis Western Regional Climate Center (WRCC) Temperature data July 15 2004
httpwwwwrccdriedusummaryclimsmazhtml
Brawley Wash ndash Los Robles Wash Watershed Rapid Watershed Assessment Section 6ndash References page 6- 5
GLOSSARY Drainage Basin A region or area bounded by a topographic divide and occupied by a
drainage system also known as a watershed Drought There is no universally accepted quantitative definition of drought
Generally the term is applied to periods of less than average precipitation over a certain period of time natures failure to fulfill the water wants and needs of man
Flood A flood is an overflow or inundation that comes from a river or other body of water and causes or threatens damage It can be any relatively high streamflow overtopping the natural or artificial banks in any reach of a stream It is also a relatively high flow as measured by either gage height or discharge quantity
Ground Water The supply of fresh and saline water found beneath the Earths surface which is often used for supplying wells and springs Because ground water is a major source of drinking water there is a growing concern over areas where leaching agricultural or industrial pollutants are contaminating ground water
Soil Moisture Regimes
Aridic is a soil moisture regime that has no water available for plants for more than half the cumulative time that the soil temperature at 50 cm (20 in) below the surface is gt5degC (41deg F) and has no period as long as 90 consecutive days when there is water for plants while the soil temperature at 50 cm (20 in) is continuously gt8degC (46degF) Udic is a soil moisture regime that is neither dry for as long as 90 cumulative days nor for as long as 60 consecutive days in the 90 days following the summer solstice at periods when the soil temperature at 50 cm (20 in) below the surface is above 5degC (41deg F) Ustic is a soil moisture regime that is intermediate between the aridic and udic regimes and common in temperate subhumid or semiarid regions or in tropical and subtropical regions with a monsoon climate A limited amount of water is available for plants but occurs at times when the soil temperature is optimum for plant growth
Soil Orders
A soil order is a group of soils in the broadest category In the current USDA classification scheme there are 12 orders differentiated by the presence or absence of diagnostic horizons
Soil Temperature
Regimes
Hyperthermic is a soil temperature regime that has mean annual soil temperatures of 22degC (72degF) or more and gt5degC (41deg F) difference between mean summer and mean winter soil temperatures at 50 cm (20 in) below the surface Thermic is a soil temperature regime that has mean annual soil temperatures of 15degC (59degF) or more but lt22degC (72degF) and gt5degC (41deg F) difference between mean summer and mean winter soil temperatures at 50 cm (20 in) below the surface
Brawley Wash ndash Los Robles Wash Watershed Rapid Watershed Assessment Section 7 ndash Glossary page 7- 1
Mesic A soil temperature regime that has mean annual soil temperatures of 8degC (46degF) or more but lt15degC (59degF) and gt5degC (41deg F) difference between mean summer and mean winter soil temperatures at 50 cm (20 in) below the surface
Surface Water Water on the earths surface Lakes bays ponds impounding reservoirs springs rivers streams creeks estuaries wetlands marshes inlets canals and all other bodies of surface water natural or artificial inland or coastal fresh or salt navigable or non-navigable and including the beds and banks of all watercourses and bodies of surface water that are wholly or partially inside or bordering the state or subject to the jurisdiction of the state except that waters in treatment systems which are authorized by state or federal law regulation or permit and which are created for the purpose of waste treatment
Watershed The area of land that contributes surface run-off to a given point in a drainage system and delineated by topographic divides
Brawley Wash ndash Los Robles Wash Watershed Rapid Watershed Assessment Section 7 ndash Glossary page 7- 2
Acknowledgements The following University of Arizona staff and students contributed to the production of this report Terry Sprouse Erin Westfall Lainie Levick Cassie Holmgren Ariel Fisher Melisa Kennedy NRCS Field Office Area Office and State Office staff contributed to the development of this assessment
Brawley Wash ndash Los Robles Wash Watershed Rapid Watershed Assessment Section 7 ndash Glossary page 7- 3
- Table 3-1 Brawley Wash - Los Robles
- Wash Watershed Priority Resource Concerns by Land Use
- Table 3-2 Brawley Wash-Los Robles Wash Watershed Species of Concern
- and Endangered Species Classifications and Observations(1)
- United States Department of Agriculture 2004 Arizona Bark Beetle Epidemics
- Fact Sheet and Information Bulletin Southwestern Region USDA Forest
- Service httpwwwfsfedusr3prescottforest-healthindexshtml
-
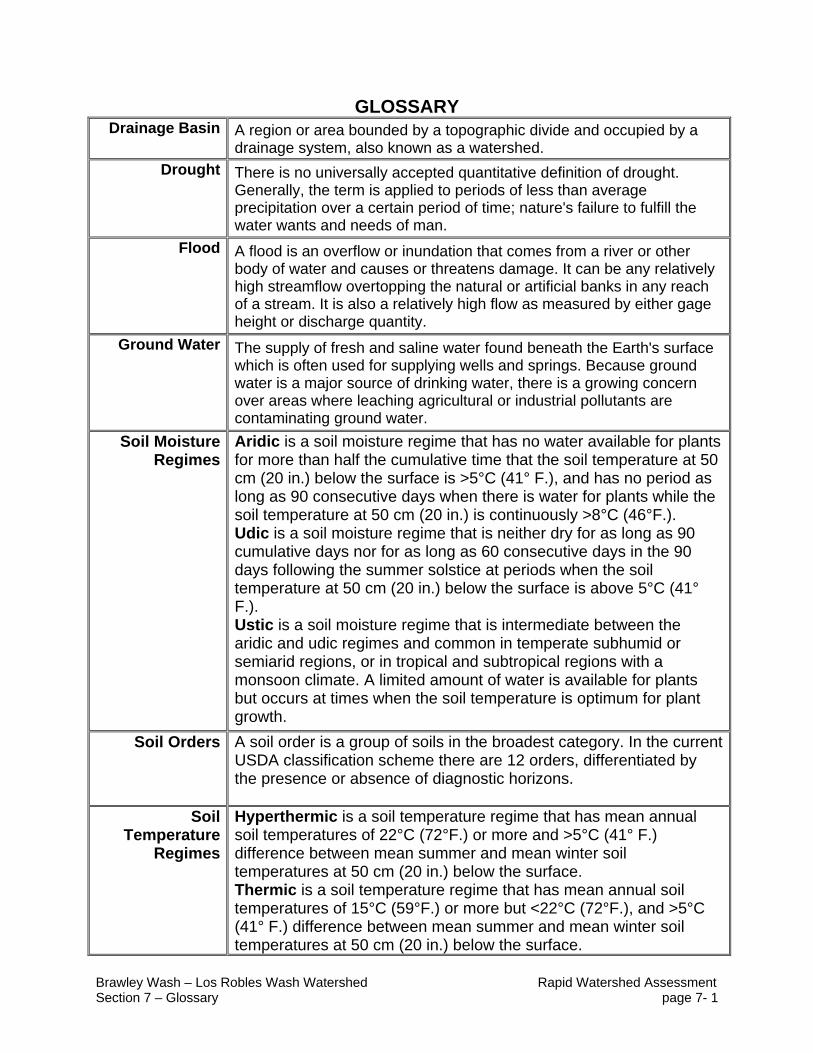
Related Documents