MINISTRY OF AGRICULTURE, FORESTRY AND FOOD SECURITY (MAFFS) AGRICULTURAL STATISTICS BULLETIN VOLUME 2 Compiled by: PLANNING, EVALUATION, MONITORING AND STATISTICS DIVISION (PEMSD) 1

Welcome message from author
This document is posted to help you gain knowledge. Please leave a comment to let me know what you think about it! Share it to your friends and learn new things together.
Transcript

MINISTRY OF AGRICULTURE, FORESTRY AND FOOD SECURITY (MAFFS)
AGRICULTURAL STATISTICS BULLETINVOLUME 2
Compiled by:
PLANNING, EVALUATION, MONITORING AND STATISTICS DIVISION (PEMSD)
JANUARY 2011
1
TABLE OF TABLES
Table 1: Percentage Contributions to Real Gross Domestic Product by Sector.............................................................................................................4
Table 2: Gross Domestic Product at Current Prices (Million Leones) by Sector...........................................................................................................5
Table 3: Gross Domestic Product at Constant 2001 Prices (Million Leones) by Sector................................................................................................6
Table 4: Real Gross Domestic Product Growth Rate by Sector.....................................................................................................................................7
Table 5: Contributions to GDP Growth by Sector (Supply Side)...................................................................................................................................8
Table 6: Gross Domestic Product at Market Prices........................................................................................................................................................9
Table 7: National Rice Production and Self-Sufficiency for Period 2001 - 2010........................................................................................................10
Table 8: Rice Balance Sheet for Sierra Leone..............................................................................................................................................................14
Table 9: Cereal Balance Sheet for Sierra Leone...........................................................................................................................................................15
Table 10: Production of Other Major Food Crops........................................................................................................................................................16
Table 11: Production of Tree / Export Crops................................................................................................................................................................17
Table 12: Domestic Livestock Figures.........................................................................................................................................................................18
Table 13: Forestry Products (Firewood, Charcoal and Timber)...................................................................................................................................19
Table 14: Yield Data for Major Food Crops for 2008..................................................................................................................................................20
Table 15: Yield Data for Major Crops for 2009...........................................................................................................................................................21
Table 16: Rainfall (mm) Data for 2009 and January to October 2010.........................................................................................................................22
Table 17: Rice Imports for 2001...................................................................................................................................................................................24
Table 18: Rice Imports for 2002...................................................................................................................................................................................25
Table 19: Rice Imports for 2003...................................................................................................................................................................................26
Table 20: Rice Imports for 2004...................................................................................................................................................................................27
Table 21: Rice Imports for 2005...................................................................................................................................................................................28
Table 22: Rice Imports for 2006...................................................................................................................................................................................29
Table 23: Rice Imports for 2007...................................................................................................................................................................................30
Table 24: Rice Imports for 2008...................................................................................................................................................................................31
2

Table 25: Rice Imports for 2009...................................................................................................................................................................................32
Table 26: Rice Imports for 2010...................................................................................................................................................................................33
Table 27: Summary of Rice Imports from 2001 to 2009 and Jan. - Sept. 2010...........................................................................................................34
Table 28: Coffee Exports Volume................................................................................................................................................................................37
Table 29: Coffee Export Value.....................................................................................................................................................................................38
Table 30: Cocoa Exports Volume.................................................................................................................................................................................39
Table 31: Cocoa Export Value......................................................................................................................................................................................40
Table 32: Fishery Data..................................................................................................................................................................................................41
Table 33: Retail Prices (Le/Kg) for Priority Commodities - January to November 2010............................................................................................42
Table 34: Wholesale Prices (Le/Kg) for Priority Commodities – Jan. to Nov. 2010...................................................................................................43
TABLE OF FIGURES
Figure 1: National Rice Self-Sufficiency for Period 2001 - 2010................................................................................................................................11
Figure 2: National Rice Self-Sufficiency for Period 2001 - 2010................................................................................................................................12
Figure 3: National Production of Rice / Rice Import (Mt Milled)................................................................................................................................13
Figure 4: Rainfall (MM) Data for 2009 and January to September 2010.....................................................................................................................23
Figure 5: Summary of Import Volume of Rice from 2001 to 2009 and January to September 2010..........................................................................35
Figure 6: Summary of Import Value of Rice from 2001 to 2009 and January to September 2010..............................................................................36
3

Table 1: Percentage Contributions to Real Gross Domestic Product by Sector
Sector 2006 2007 2008 20092010
Provisional1. Agriculture 47.33 46.33 46.25 45.92 45.55 1.1 Crops 32.05 31.46 31.75 31.89 32.05 1.2 Livestock 2.90 2.91 2.82 2.73 2.62 1.3 Forestry 3.77 3.60 2.55 3.44 3.31 1.4 Fishery 8.61 8.37 8.13 7.87 7.592. Industry 9.23 9.71 7.87 6.56 6.74 2.1 Mining and Quarrying 4.70 5.34 3.45 2.43 2.73 2.2 Manufacturing and Handicrafts 2.25 2.16 2.09 1.97 1.91 2.3 Electricity and Water Supply 0.17 0.15 0.31 0.28 0.28 2.4 Construction 2.11 2.06 2.03 1.89 1.823. Services 39.26 39.27 41.47 42.14 42.34
3.1 Trade and Tourism 10.93 11.92 11.84 11.81 11.783.1.1 WHOLESALE & RETAIL 10.49 11.49 11.17 11.5 11.413.1.2 HOTELS AND RESTAURANTS 0.45 0.44 0.41 0.4 0.38
3.2 Transport, Storage and Communication 7.55 8.41 8.41 10.8 10.45 3.3 Finance, Insurance and Real Estate 6.19 5.38 6.14 5.6 5.17 3.4 Administration of Public Services 3.97 3.37 2.66 2.5 3.11 3.5 Other Services 4.03 3.87 3.8 3.8 3.71 3.6 Education 2.85 3.34 4.95 4.4 4.12
3.7 Health 3.14 2.49 3.18 3.3 3.35 3.8 NPISH 0.51 0.44 0.46 0.5 0.65
4 FISIM 1.94 1.8
3 2.45 2.72 3.06GDP at Basic price 93.87 93.48 93.14 91.90 91.56Indirect Taxes 6.13 6.52 6.86 8.10 8.44GDP at market price 100.00 100.00 100.00 100.00 100.00
Source: National Accounts Section, SSL
4

Table 2: Gross Domestic Product at Current Prices (Million Leones) by Sector
Sector 2006 2007 2008 2009 2010(Provisiona
l)
1. Agriculture, Forestry and Fishing 2,488,5
76 3,240,4
02 3,721,7624,306,282 5,013,560
1.1 Crops 1,693,340 2,339,00
1 2,761,85
6 326,826 3,846,641
1.2 Livestock 115,919 140,29
3 149,42
6 133,273 149,709
1.3 Forestry 182,154 202,30
7 165,20
4 271,874 305,099
1.4 Fishery 488,982 547,89
4 651,47
1 633,309 712,112
2. Industry 402,43
3 456,7
00 412,096
96 360,011 437,617
2.1 Mining and Quarrying 202,281 246,96
7 183,08
8 132,382 179,903
2.2 Manufacturing and Handicrafts 107,908 114,58
6 128,08
2 122,316 1,38,486
2.3 Electricity and Water Supply 15,949 15,99
9 12,317 19,948 23,256
2.4 Construction 88,431 93,62
9 95,936 85,364 95,972
3. Services 1,774,3
39 1,903,4
12 2,1
52,0022,380,457 2,787,325
3.1 Trade and Tourism 467,015 551,22
7 577,03
8 564,236 680,114
3.1.1 Wholesale and retail 444,783 526,84
4 556,24
6 559,818 652,467
3.1.2 Hotels and Restaurants 22,23
2 24,383 20,792 24,418 2,7647
3.2 Transport, Storage and Communication 345,198
349,866
355,350
475,009 560,867
5

3.3 Finance, Insurance and Real Estate 294,670 308,75
0 359,31
8 348,224 396,293
3.4 Administration of Public Services 223,474 225,54
8 216,07
0 244,668 279,729
3.5 Other Services 170,138 175,88
7 189,13
4 205,036 234,465
3.6 Education 114,017 137,79
4 214,91
8 234,002 280,522
3.7 Health 134,731 136,36
6 147,94
6 158,734 200,862
3.8 NPISH 33,527 33,06
9 40,56
6 130,548 154,474
4. FISIM 71,06
8 78,1
57 105,21
0 126,328 166,329
5. GDP at Basic Prices (1+2+3-4) 4,594,280 5,52235
7 6,1806
49 6,920,421 8,072,174
6.Indirect Taxes (Net) 280,799 302727 357,365 420,503 511,5687. GDP at Market Prices (5+6) 4875079 5825084 6,538,014 730,925 8583742Percentage Change 13.3% 19.5% 12.2% 12.3% 16.9%Note: NPISH = Non-Profit Institutions Serving HouseholdFISIM = Financial Intermediation Services Indirectly Measured
Source: National Accounts Section, SSL
Table 3: Gross Domestic Product at Constant 2001 Prices (Million Leones) by Sector
Sector 2006 2007 2008 2009 2010(Provisiona
l)
1. Agriculture, Forestry and Fishing 1,828,2
71 1,904,5
54 1,984,374 2,059,5
67 2,148,646
1.1 Crops 1,227,575 1,280,86
6 1,404,82
8 1,436,524 1,510,846
1.2 Livestock 112,175 119,41
4 136,45
7 149,061 123,829.35
1.3 Forestry 145,460 148,07 102,01 96,237 156,154.07
6

3 8
1.4 Fishery 332,445 343,88
7 364,05
7 389,103 357,817.18
2. Industry 356493 399002 337816 294453 317,840
2.1 Mining and Quarrying 191,983 230,08
8 163,17
2 157,555 128,850
2.2 Manufacturing and Handicrafts 86,817 88,59
7 89,67
1 94,235 90,152.58
2.3 Electricity and Water Supply 6,520 6,15
8 12,64
5 14,778 13,079
2.4 Construction 81,584 84,85
5 86,90
5 93,577 85,759.04
3. Services 1,51652
4 1,614,2
89 1,779,1
97 1,890,203 1,997,253
3.1 Trade and Tourism 422,320 489,82
6 502,19
0 538,094 555,735
3.1.1 Wholesale and Retail 404,84
6 471,870 484,389 521,31
4 538,029.94
3.1.2 Hotel Restaurant 17,474 17,95
6 17,80
2 16,78
0 17,705.39
3.2 Transport, Storage and Communication 291,468
345,443
364,730 411,292
492,964
3.3 Finance, Insurance and Real Estate 239,012
221,035
266,491 288,227
244,020
3.4 Administration of Public Services 153,214
138,501
115,541 115,739
164,720.56
3.5 Other Services 155,312 158,74
6 164,70
1 169,975 174,936.04
3.6 Education 109,853 137,02
1 214,68
4 266,257 194,213.82
3.7 Health 121,237 102,32
8 137,74
6 145,816 157,966.02
3.8 NPISH 19,594 18,15
5 19,87
6 18,308 30,697.43
4. FISIM 75,01
6 75,3
65 105,2
10 121,816 144,494.22
5. GDP at Basic Prices (1+2+3-4) 3,626,2 3,842,4 3,996,177 4,122,407 4,319,245
7

71 80
6.Indirect Taxes (Net) 236,66
5 267,9
97 294,4
58 363,199 398,065.85
7. GDP at Market Prices (5+6) 3,858,2
19 4,110,4
77 4,290,6
35 4,485,606 4,717,311
Growth Rate - Year-on-Year 7.4% 6.4% 4.4% 4.5% 5.2%Note: NPISH = Non-Profit Institutions Serving HouseholdFISIM = Financial Intermediation Services Indirectly Measured
Source: National Accounts Section, SSL
Table 4: Real Gross Domestic Product Growth Rate by Sector
Sector 2006 2007 2008 2009 2010 (Provisiona
l)1. Agriculture, Forestry and Fishing 5.04 4.17 4.19 3.79 4.331.1 Crops 7.63 4.44 5.35 4.93 5.691.2 Livestock -2.55 6.45 1.18 1.27 1.201.3 Forestry 3.26 1.80 2.89 1.3 1.101.4 Fishery -0.49 3.44 1.45 1.25 1.302. Industry 0.37 11.92 -15.33 -12.84 7.942.1 Mining and Quarrying -5.15 20.83 -32.54 -26.38 18.262.2 Manufacturing and Handicrafts 12.74 2.05 1.21 -1.43 2.002.3 Electricity and Water Supply -3.10 -5.56 114.88 -5.98 5.132.4 Construction 1.95 4.01 2.42 -2.57 1.293. Services 9.43 6.45 10.22 6.24 5.663.1 Trade and Tourism 14.04 15.98 3.73 4.27 4.90
3.1.1 Wholesale and Retail 15.18 16.56 3.96 4.45 5.00
3.1.2 Hotel and Restaurants -6.66 2.76 -2.42 -0.932.00
3.2 Transport, Storage and Communication 6.98 18.52 25.95 6.51 6.373.3 Finance, Insurance and Real Estate 5.12 -7.52 8.53 -0.97 2.723.4 Administration of Public Services 20.38 -10.22 -16.05 23.35 3.003.5 Other Services 3.58 2.21 3.75 3.10 3.023.6 Education 15.59 24.73 20.60 8.82 8.00
8

3.7 Health 1.56 -15.60 21.91 11.08 14.003.8 NPISH -0.36 -7.35 16.16 10.99 6.604. FISIM 26.49 0.47 39.60 15.78 18.625. GDP at Basic Prices (1+2+3-4) 5.96 5.95 4.00 3.16 4.776.Indirect Taxes (Net) 34.92 13.24 9.89 23.34 9.607. Gross Domestic Product at Market Prices 7.37 6.41 4.38 4.54
5.17
Annual Growth rate (%) 7.37 6.41 4.38 4.45 5.17
Source: National Accounts Section, SSL
Table 5: Contributions to GDP Growth by Sector (Supply Side)
Sector 2006 2007 2008 2009 2010 (Provisiona
l)
1. Agriculture, Forestry and Fishing 2.44 1.
97 1.
94 1.751.99
1.1 Crops 2.1
0 1.3
8 3.0
2 1.751.81
1.2 Livestock (0.08
) 0.1
9 0.4
2 0.040.03
1.3 Forestry 0.1
3 0.0
7 (1.12
) 0.050.04
1.4 Fishery (0.05
) 0.3
0 0.4
9 0.100.10
2. Industry 0.44 1.
10 (1.4
9) (1.01)0.52
2.1 Mining and Quarrying 0.0
2 0.9
9 (1.63
) (0.91)0.44
2.2 Manufacturing and Handicrafts 0.2
7 0.0
5 0.0
3 (0.03)0.04
2.3 Electricity and Water Supply (0.01) (0.01
) 0.1
6 (0.02)0.1
2.4 Construction 0.0 0.0 0.0 (0.05) 0.019

4 8 5
3. Services 3.
63 2.
53 4.
01 2.592.39
3.1 Trade and Tourism 1.4
5 1.7
5 0.3
0 0.510.58
3.1.1 Wholesale and Retail 1.4
8 1.7
4 0.3
0 0.510.57
3.1.2 Hotel and Restaurants (0.03
) 0.0
1 (0.00
) (0.00)0.01
3.2 Transport, Storage and Communication
0.53
1.40
0.47 0.66
0.66
3.3 Finance, Insurance and Real Estate 0.3
2 (0.47
) 1.1
1 (0.05)0.08
3.4 Administration of Public Services 0.7
2 (0.38
) (0.56
) 0.630.10
3.5 Other Services 0.1
5 0.0
9 0.1
5 0.120.11
3.6 Education 0.4
1 0.7
0 1.8
9 0.340.32
3.7 Health 0.0
5 (0.49
) 0.8
6 0.320.43
3.8 NPISH (0.06
) (0.04
) 0.0
4 0.070.04
4. FISIM 0.
44 0.0
1 0.
73 0.390.51
5. GDP at Basic Prices (1+2+3-4) 5.67 5.60 3.74 2.94 4.396.Indirect Taxes (Net) 1.70 0.81 0.64 1.60 0.787. GDP at Market Prices (5+6) 7.37 6.41 4.38 4.54 5.17
Source: National Accounts Section, SSL
Table 6: Gross Domestic Product at Market Prices
Sector 2006 2007 2008 2009 2010(Provisiona
l)
10

1. Agriculture, Forestry and Fishing 136.1 170.1 187.6 209.1 233.3
1.1 Crops 137.4 181.7 199.2 228.6 254.61.2 Livestock 103.3 117.5 109.6 108.9 120.91.3 Forestry 125.2 136.6 165.2 176.0 195.41.4 Fishery 147.1 159.3 178.8 179.3 199.02. Industry 112.9 114.5 122.0 122.3 137.72.1 Mining and Quarrying 104.7 106.4 115.6 121.5 139.92.2 Manufacturing and Handicrafts 124.3 129.3 142.8 138.4 153.62.3 Electricity and Water Supply 244.6 259.8 127.8 160.4 177.82.4 Construction 108.4 109.2 110.4 100.8 111.93. Services 117.0 117.9 121.0 125.9 139.63.1 Trade and Tourism 110.3 111.4 114.9 110.3 122.4
3.1.1 Wholesale and Retail 109.5 110.5 114. 8 109.3 121.3
3.1.2 Hotel and restaurants 127.2 135.8 117.8 140.7 156.1
3.2 Transport, Storage and Communication 118.4 101.3 97.6
102.5 113.8
3.3 Finance, Insurance and Real Estate 116.8 131.9 132.4 146.6 162.43.4 Administration of Public Services 114.8 162.8 187.0 171.8 190.73.5 Other Services 145.9 111.6 114.8 120.7 134.03.6 Education 109.5 100.6 130.1 130.1 144.43.7 Health 105.8 133.3 118.6 114.6 127.23.8 NPISH 111.1 182.9 222.4 453.3 503.24. FISIM 173.7 103.7 100.0 103.7 115.55. GDP at Basic Prices (1+2+3-4) 94.7 143.7 154.7 167.9 186.96.Indirect Taxes (Net) 126.7 113.0 121.4 115.8 128.57. Gross Domestic Product at Market Prices (5+6) 118.6 141.7 152.4
163.7 182.0
Average 5% price change by deflator 5.4 12.3 7.5 7.4 11.2
Source: National Accounts Section, SSL
Table 7: National Rice Production and Self-Sufficiency for Period 2001 - 2010.
Year Area Yield Productio Milled Populatio National Self-
11

(Ha)(Mt/Ha
)n (Mt)
Equivalent (Mt)
nRequireme
nt (Mt Milled)
Sufficiency (%)
2001 258,850 1.20 310,620 186,372 4,725,033 491,403 37.932002 343,142 1.23 422,065 253,239 4,814,808 500,740 50.572003 356,506 1.25 445,633 267,380 4,906,290 510,254 52.402004 426,772 1.27 542,000 325,200 4,999,509 519,949 62.542005 427,907 1.29 552,000 331,200 5,094,500 529,828 62.512006 422,556 1.33 562,000 337,200 5,216,890 542,557 62.152007 432,356 1.36 588,004 352,802 5,343,200 555,693 63.492008 475,592 1.43 680,097 408,058 5,473,530 569,247 71.682009 499,111 1.78 888,417 533,050 5,607,930 583,225 91.402010 549,022 1.87 1,026,671 616,003 5,746,800 597,667 103.07
Source: PEMSD Note: Milled recovery = 60% Population growth rate at 1.9% using 2004 population as baseline Per caput consumption = 104 kg per person per annum
Note: 2010 Figures are projections projected at 10% increase for area and 5% increase for yield
12

Figure 1: National Rice Self-Sufficiency for Period 2001 - 201013
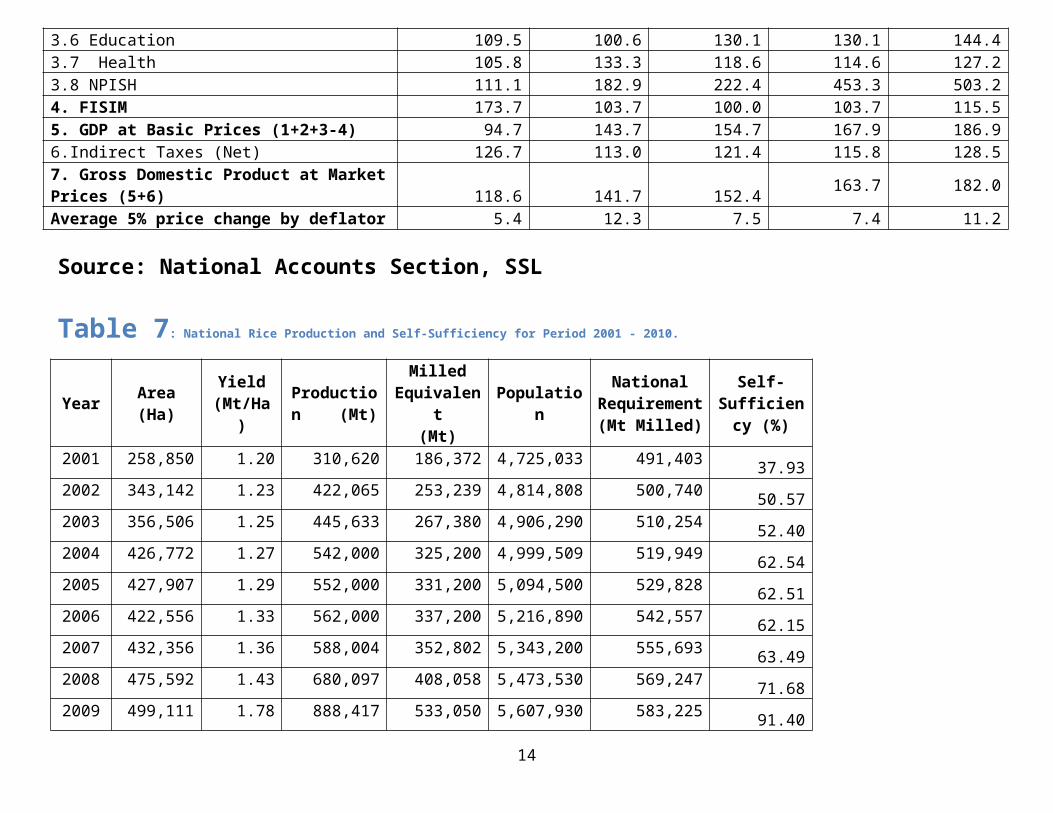
Figure 2: National Rice Self-Sufficiency for Period 2001 - 201014

Figure 3: National Production of Rice / Rice Import (Mt Milled)NOTE: Import Figures for 2010 WERE ONLY CAPTURED from January to September.Source: Customs and Excise Department
15

Table 8: Rice Balance Sheet for Sierra Leone
ITEM 2006 2007 2008 2009
Population 5,216,890
5,343,530
5,473,530
5,607,930
Domestic supply(Availability)(Mt)
Rice Production (Mt) 337,200 352,802 408,058 533,050
Open Stock - 337,200 -32,609 320,193 -65,806 342,252 -44,025 489,025
National requirement (MT)
542,557
555,693
569,247
583,225
Rice consumption per
Person(104Kg)
Domestic Surplus/ Deficit (Mt) -205,357 -235,500 -226,995 -94,200
Cereals Import/Export
Import(Mt) - Rice 147,794 156,235 182,975 235,375
cereal food Aid- Rice ***24,954 172,748 ***13,459 169,694 0 182,975 0 235,375
Actual Rice Surplus/Deficit (mt) -32,609 -65,806 -44,020 141,175
*** Figure is subject to clarification
Rice/food Aid data needs to be Collected or else we will not have a true balance sheet
16

Table 9: Cereal Balance Sheet for Sierra Leone
ITEM 2006 2007 2008 2009
Population 5,216,890 5,343,530 5,473,530 5,607,930
Domestic supply(Availability)(Mt)
357499
(570,154)
335,743
352,069
(598,202)
499,533
Cereal Production (Mt) Rice 337,200 352,802 408,058 533,050
Maize 20,299 22,848 22,533 29,641
Open Stock - -39,907 -78,522 -63,158
National requirement (MT)
555,693
583,225
consumption per Person
Rice (104kg) 542,557 569,247
Maize (5.29Kg) 27,597 28,266 (583,959) 28,955 29,666 (612,891)
Domestic Surplus/ Deficit (Mt)
-212,655
147,794
156,235
-248,216
156,235
182,975
-246,133
182,975
235,375
-113,358
235,375
Cereals Import/Export
Import(Mt) - Rice 147,794
cereal food Aid- Rice***24954 ***13459
0 0
Actual Cereals Surplus/Deficit (mt) -64,861 -91,981 -63,158 122,017
17

Table 10: Production of Other Major Food Crops
Production Year
Cassava Maize Sweet Potato GroundnutArea
Cultivated (Ha)
Yield (Mt/Ha)
Production (Mt)
Area Cultivate
d (Ha)
Yield (Mt/Ha)
Production (Mt)
Area Cultivate
d (Ha)
Yield (Mt/Ha)
Production (Mt)
Area Cultivate
d (Ha)
Yield (Mt/Ha)
Prod (Mt)
2005 175,923
6.
37
1,120,63
0 19,332 0.84 16,239 29,652
3.
37 99,927 69,820
0.
68
47,47
8
2006 228,700
6.
37
1,456,81
9 24,165 0.84 20,299 31,135
3.
37 104,925 76,802
0.
68
52,22
5
2007 297,310
6.
37
1,893,86
5 27,200 0.84 22,848 32,692
3.
37 110,172 84,482
0.
68
57,44
8
2008 312,176
6.
37
1,988,56
1 28,016 0.84 23,533 33,673
3.
37 113,478 87,017
0.
68
59,17
2
2009 359,002
7.
84
2,814,57
6 32,218 1.38 44.46 38,724
4.
57 176,969 100,070
0.
70
70,04
9
2010 394,902
8.
23
3,250,04
4 35,440 1.45 51,388 42,956
4.
80 206,189 110,077
0.
74
81,45
7
Source: PEMSD
Note: 2010 figures are projections projected at 10% increase for area and 5% increase for yield
18

Table 11: Production of Tree / Export Crops
Year Cacao Coffee Oil PalmArea
Cultivated (Ha)
Yield (Mt/Ha)
Production (Mt)
Area Cultivate
d (Ha)
Yield (Mt/Ha)
Production (Mt)
Area Cultivate
d (Ha)
Yield (Mt/Ha)
Production (Mt)
2001 30,333 0.36 10,920 14,037 1.78 24,986 218,750 4.50 984,375
2002 35,135 0.37 13,000 16,854 1.77 29,832 293,750 4.50 1,321,875
2003 42,105 0.38 16,000 21,910 1.77 38,781 306,250 4.50 1,378,125
2004 49,762 0.42 20,900 28,843 1.78 51,341 312,500 4.50 1,406,250
2005 57,226 0.42 24,035 35,208 1.79 63,022 328,125 4.50 1,476,563
2006 73,576 0.42 30,902 42,725 1.80 76,905 344,531 4.50 1,550,390
2007 84,578 0.42 35,523 49,134 1.80 88,441 361,758 4.50 1,627,911
2008 97,265 0.42 40,851 56,505 1.80 101,709 416,022 4.50 1,872,099
2009 106,992 0.87 93,083 62,156 1.88 116,852 457,624 6.40 2,928,794
2010 117,691 0.91 107,099 68,372 1.97 134,693 503,368 6.72 3,382,633
Source: PEMSD
Note: 2010 figures are projections projected at 10% increase for area and 5% increase for yield
19

Table 12: Domestic Livestock Figures
Year Livestock Type and Number of Heads
CATTLE SHEEP GOATS CHICKEN DUCKS RABBITS PIGS
2001 109,020 131,280 153,540 1,363,750 127,500 1,938 7,525
2002 130,824 157,536 184,248 1,704,688 159,375 2,422 9,406
2003 156,989 189,043 221,098 2,130,859 199,219 3,027 11,758
2004 188,387 226,852 265,317 2,663,574 249,023 3,784 14,697
2005 226,064 272,222 318,381 3,329,468 311,279 4,730 18,372
2006 271,277 326,667 382,057 4,161,835 389,099 5,913 22,964
2007 325,532 392,000 458,468 5,202,293 486,374 7,391 28,706
2008 390,638 470,400 550,162 6,502,867 607,967 9,239 35,882
2009 470,000 620,000 730,000 8,600,000 729,560 11,087 43,058
2010 517,000 682,000 803,000 9,460,000 802,516 12,196 47,364
Source: PEMSD
Note: 2010 figures are projections projected at 10% increase in number per annum
20

Table 13: Forestry Products (Firewood, Charcoal and Timber)
FORESTRY STATISTICS (2001 -2010)
Type of
Produc
t
Years
2001 2002 2003 2004 2005 2006 2007 20082009 2010
Fire
Wood (m3)
2,127,70
4
2,176,85
4
2,227,14
0
2,278,58
6
2,331,22
2
2,385,07
3
2,440,16
8
2,496,53
6
2,620,013 2,882,014
Charcoal (m3) 557,216 570,128 583,298 596,773 610,558 624,662 639,092 653,855 686,548 755,203
Timber (m3) 607,916 621,958 636,326 651,025 666,063 681,449 697,191 713,296 748,961 823,857
TOTAL
(m3)
3,292,87
6
3,368,94
0
3,446,76
4
3,526,38
4
3,607,84
3
3,691,18
4
3,776,4
57
3,863,6
87
4,056,87
1
4,461,074
Source: Forestry Division, MAFFS.
Assumption: Sierra Leone National Wood Products consumption in 1997 are the same as shown below (*Conteh, 1997)Please Note: Baseline year figures were derived from 1985 National census report published in 1995(CSO, 1995): National
Population, Vo = 3515383; Average population growth i = 0.0231 or 2.31 percent; n = 0Forestry statistics from 1997 – 2008 were obtained using the formula-
Vn = Vo(1+i)n(where n ranges from 12 to 23) x per caput consumption of each of the following(Conteh, 1997) –
Firewood – 0.42m3/cap./annum}
21

Charcoal - 0.11m3/cap./annum} Aggregate per capita consumption = 0.65m3/annumTimber - 0.12m3/cap/annum}
Note: 2010 figures are projections projected at 10% increase in production per annum
Table 14: Yield Data for Major Food Crops for 2008
Major Food Crop 2008 Crop Yield in Metric Ton Per Hectare
East Region North Region South Region Western Area II National
Upland Rice 1.37 0.65 0.77 0.31 0.70
Boliland Rice 0 0.71 1.15 0.31 0.72
Inland Valley Swamp Rice 2.14 1.63 1.33 1.21 1.58
Riverrain Rice 0 1.56 0 0 1.56
Mangrove Rice 0 3.17 0 2.04 2.61
All Rice Ecologies 1.43
Cassava (Upland Sole Crop) 6.90 6.59 6.22 5.76 6.37
Sweet Potato (Upland Sole
Crop)
- 3.80 3.76 3.74 3.77
Groundnut (Upland Second
Crop)
- 0.66 0.70 - 0.68
Maize (Upland Second Crop) - 0.84 - - 0.84
Cowpea (Upland Sole Crop) - 0.49 - - 0.49
22

Vegetable – Hot Pepper
(Chilies)
- 0.63 - 0.56 0.60
Vegetable – Garden Eggs - - - 0.90 0.90
Vegetable – Okra - - - 0.46 0.46
Source: PEMSD
Table 15: Yield Data for Major Crops for 2009
Major Food Crop 2009 Crop Yield in Metric Ton Per HectareEast Region North Region South Region Western Area II National
Upland Rice 0.999 1.266 1.024 0.953 1.061
Boliland Rice 0 1.172 1.172 0 1.172
Inland Valley Swamp Rice 2.271 2.214 2.358 2.062 2.224
Riverrain Rice 0 0 2.200 0 2.200
Mangrove Rice 0 0 2.240 0 2.240
All Rice Ecologies 1.779
Cassava (Upland Sole Crop) 6.943 7.624 7.673 9.100 7.835
Sweet Potato (Upland Sole
Crop)
0 5.352 4.772 3.600 4.574
Groundnut (Upland Second
Crop)
0.527 0.792 0.655 0.840 0.703
Maize (Upland Second Crop) 0 1.150 2.000 1.000 1.383
Cowpea (Upland Sole Crop) 0 0.402 0 0 0.402
23

Vegetable – Hot Pepper
(Chilies)
0 0.275 0 0 0.275
Cacao 0.870 0 0 0 0.870
Coffee 1.880 0 0 0 1.880
Oil Palm 6.250 0 6.1i88 6.750 6.396
Citrus 0 7.594 0 0 7.954
Source: PEMSD
Table 16: Rainfall (mm) Data for 2009 and January to October 2010
Monthly Average Rainfall For Sierra Leone ( mm)
2009 2010
Year Average Monthly Average Monthly
January 0.9 26.25
February 13.975 22.525
March 26.475 68.6
April 192.375 200.5
May 178.65 270.625
June 403.975 450.05
July 541.45 634.875
24

August 912.20 796.075
Septemb
er 568.98 411.7
October 284.65 259.6
Novemb
er 103.83
Decembe
r 28.63
Source: Sierra Leone Meteorological Department
25

Monthly Rainfall for Sierra Leone (mm)
0
200
400
600
800
1000
Months
Rai
nfal
l(mm
)
2009
2010
Figure 4: Rainfall (MM) Data for 2009 and January to September 2010
26

Table 17: Rice Imports for 2001
Dutiable Non dutiable TOTAL
Period
Volume (m/tons)
Value Value ValueLe'000 US$'000 Le'000 US$'000 Le'000 US$'000
2001
Jan 9,765.00
1,940,673.74
1,173.04
287.59
0.17
1,940,961.33
3,902,625.87
Feb - - - 28.46
0.02 28.46 56.94
Mar 13,512.00
3,746,348.07
1,963.56 - -
3,746,348.07
7,521,683.70
Apr 7,606.30
2,866,992.36
1,505.08 - -
2,866,992.36
5,750,702.40
May 16,286.80
5,767,991.85
3,037.10 - -
5,767,991.85
11,571,594.40
Jun 15,700.00
5,665,830.58
2,916.08 - -
5,665,830.58
11,365,977.24
Jul 11,000.00
4,329,562.24
2,130.33 - -
4,329,562.24
8,683,254.81
Aug 17,000.00
6,377,199.98
3,097.05 - -
6,377,199.98
12,791,497.01
Sep 21,813.00
8,706,828.31
4,206.97 - -
8,706,828.31
17,461,489.59
Oct 7,500.00
2,910,060.00
1,376.84 - -
2,910,060.00
5,836,496.84
Nov - - - - - - -
Dec 12,000.00
4,899,797.35
2,214.63 - -
4,899,797.35
9,825,809.33
132,183.10
47,211,284.48
23,620.68
316.05
0.19
47,211,600.53
94,711,188.13
Source: Customs and Excise Department* Volume represents dutiable rice only
27

Table 18: Rice Imports for 2002
Perio
d
Dutiable Non dutiable TOTAL
Volume (m/tons)
Value Value ValueLe'000 US$'000 Le'000 US$'000 Le'000 US$'000
2002
Jan 6,455.96 2,424,489.01 1,165.08 - - 2,424,489.01 4,863,055.02
Feb 6,778.76 4,032,921.81 1,931.52 - - 4,032,921.81 8,081,332.66
Mar 696.61 276,946.15 128.60 - - 276,946.15 555,414.12
Apr 3,375.89 1,365,958.40 632.53 1,664.11 0.77 1,367,622.51 2,742,630.10
May 13,849.98 4,848,325.45 2,336.33 - - 4,848,325.45 9,726,687.19
Jun 11,498.45 4,435,551.70 2,197.53 - - 4,435,551.70 8,896,297.83
Jul 5,000.00 1,779,845.00 865.14 330.20 0.16 1,780,175.20 3,571,215.70
Aug 29,752.00 10,797,983.78 5,222.30 - - 10,797,983.78 21,660,693.86
Sep 28,000.00 9,996,212.80 4,805.27 1,630.50 0.78 9,997,843.30 20,056,492.65
Oct 11,449.17 4,087,439.20 1,954.03 771,800.70 368.96 4,859,239.90 9,743,701.13
Nov 23,075.62 8,238,171.00 3,861.23 810,390.70 379.83 833,466.32 9,932,420.32
Dec 6,489.93 2,316,953.60 1,062.88 772,317.90 354.29 3,089,271.50 6,192,940.03
146,422.37 54,600,797.90 26,162.432,358,134.1
1 1,104.80 48,743,836.63106,022,880.
62Source: Customs and Excise Department* Volume represents dutiable rice only
28

Table 19: Rice Imports for 2003
Dutiable Non dutiable TOTAL
Period
Volume (m/tons)*
Value Value Value
Le'000 US$'000 Le'000US$'00
0 Le'000 US$'0002003
Jan 11,150.00 4,284,624.79 1,942.34 - - 4,284,624.79 1,942.34
Feb 12,265.00 4,713,087.27 2,130.25 - - 4,713,087.27 2,130.25
Mar 15,500.00 6,420,083.63 2,850.32 - - 6,420,083.63 2,850.32
Apr 20,250.00 8,213,004.98 3,637.05 8,213,004.98 3,637.05
May 4,000.00 1,622,376.00 709.47 - - 1,622,376.00 709.47
Jun 11,000.00 4,487,242.52 1,933.89 - - 4,487,242.52 1,933.89
Jul - - - - - - -
Aug 18,811.90 8,211,580.76 3,473.16 - - 8,211,580.76 3,473.16
Sep 20,850.00 9,277,388.76 3,843.53 - - 9,277,388.76 3,843.53
Oct 20,850.00 9,462,584.37 3,834.39 - - 9,462,584.37 3,834.39
Nov 15,200.00 7,140,832.22 2,854.12 - - 15,200.00 2,854.12
Dec 6,825.00 3,494,764.80 1,378.58 3,494,764.80 1,378.58
156,701.90 67,327,570.10 28,587.10 - - 60,201,937.88 28,587.10* Volume represents dutiable rice onlySource: Customs and Excise Department
29

Table 20: Rice Imports for 2004
Dutiable Non dutiable TOTAL
Period
Volume (m/tons)*
Value Value Value
Le'000 US$'000 Le'000US$'00
0 Le'000 US$'000
2004
Jan 4,000.00 1,856,478.34 717.41 - - 1,856,478.34 717.41
Feb 2,700.00 1,548,314.03 591.06 - - 1,548,314.03 591.06
Mar - - - - - - -
Apr 25,300.00 15,160,147.20 5,715.01 15,160,147.20 5,715.01
May 43,000.00 26,213,716.65 9,854.45 - - 26,213,716.65 9,854.45
Jun 6,770.00 4,351.90 1,620.21 - - 4,351.90 1,620.21
Jul - - - - - - -
Aug 17,400.00 10,947,634.67 4,029.55 - - 10,947,634.67 4,029.55
Sep 8,154.00 5,380,281.58 1,967.63 - - 5,380,281.58 1,967.63
Oct 4,665.00 3,041,220.33 1,099.86 - - 3,041,220.33 1,099.86
Nov - - - - - - -
Dec 12,050.00 7,916,789.75 2,771.50 - - 7,916,789.75 2,771.50
124,039.00 72,068,934.45 28,366.68 - - 72,068,934.45 28,366.68
* Volume represents dutiable rice onlySource: Customs and Excise Department
30

Table 21: Rice Imports for 2005
Dutiable Non dutiable TOTAL
Period
Volume (m/tons)*
Value Value Value
Le'000 US$'000 Le'000US$'00
0 Le'000 US$'0002005
Jan - - - - - - -
Feb 17,500.00 11,675,828.10 4,062.50 - - 11,675,828.10 4,062.50
Mar 12,000.00 8,109,276.60 5,044.31 - - 8,109,276.60 5,044.31
Apr - - - - - - -
May 12,000.00 7,903,039.20 2,760.00 - - 7,903,039.20 2,760.00
Jun 11,000.00 7,736,563.45 2,695.00 - - 7,736,563.45 2,695.00
Jul 8,500.00 5,762,567.78 1,997.50 - - 5,762,567.78 1,997.50
Aug 6,500.00 4,428,604.38 1,527.50 - - 4,428,604.38 1,527.50
Sep 7,150.00 4,886,570.26 1,680.25 - - 4,886,570.26 1,680.25
Oct 4,000.00 2,729,085.60 935.28 - - 2,729,085.60 935.28
Nov 12,500.00 8,597,445.63 2,937.50 - - 8,597,445.63 2,937.50
Dec 5,295.00 3,642,748.99 1,244.33 - - 3,642,748.99 1,244.33
96,445.00 65,471,729.99 24,884.17 - - 65,471,729.99 24,884.17
* Volume represents dutiable rice onlySource: Customs and Excise Department
31

Table 22: Rice Imports for 2006
Dutiable Non dutiable TOTAL
Period
Volume (m/tons)*
Value Value Value
Le'000 US$'000 Le'000US$'00
0 Le'000 US$'0002006
Jan 13,200.00 9,091,868.94 3,102.00 - - 9,091,868.94 3,102.00
Feb 12,000.00 8,292,971.40 2,820.00 - - 8,292,971.40 2,820.00
Mar - - - - - - -
Apr - - - - - - -
May 12,000.00 10,203,858.00 3,450.00 - - 10,203,858.00 3,450.00
Jun 12,524.36 8,869,842.73 2,997.84 - - 8,869,842.73 2,997.84
Jul 16,500.00 11,511,017.93 3,877.50 - - 11,511,017.93 3,877.50
Aug 13,080.00 9,123,899.06 3,073.80 - - 9,123,899.06 3,073.80
Sep 11,080.00 7,567,779.60 2,548.40 - - 7,567,779.60 2,548.40
Oct - - - - - - -
Nov 5,000.00 3,434,486.50 1,150.00 - - 3,434,486.50 1,150.00
Dec 2,500.00 1,715,276.75 575.00 - - 1,715,276.75 575.00
97,884.36 69,811,000.91 23,594.54 - - 69,811,000.91 23,594.54
* Volume represents dutiable rice onlySource: Customs and Excise Department
32

Table 23: Rice Imports for 2007
Dutiable Non dutiable TOTAL
Period
Volume (m/tons)*
Value Value Value
Le'000 US$'000 Le'000US$'00
0 Le'000 US$'0002007
Jan 16,500.00 11,547,156.23 3,877.50 - - 11,547,156.23 3,877.50
Feb 10,700.00 7,513,225.42 2,514.50 - - 7,513,225.42 2,514.50
Mar 14,300.00 10,053,507.04 3,360.50 - - 10,053,507.04 3,360.50
Apr - - - - - - -
May 8,000.00 5,855,990.00 1,960.00 - - 5,855,990.00 1,960.00
Jun 19,500.00 14,245,453.95 4,777.50 - - 14,245,453.95 4,777.50
Jul 8,000.00 5,858,410.49 1,964.41 - - 5,858,410.49 1,964.41
Aug - - - - - - -
Sep 7,679.00 5,609,052.98 1,881.35 - - 5,609,052.98 1,881.35
Oct - - - - - - -
Nov 15,000.00 10,958,997.00 3,675.00 - - 10,958,997.00 3,675.00
Dec - - - - - - -
99,679.00 71,641,793.11 24,010.76 - - 71,641,793.11 24,010.76
* Volume represents dutiable rice onlySource: Customs and Excise Department
33

Table 24: Rice Imports for 2008
Dutiable Non dutiable TOTAL
Period
Volume (m/tons)*
Value Value ValueLe'000 US$'000 Le'000 US$'000 Le'000 US$'000
2008
Jan 5,000.00 3,697,253.15 1,242.09 - - 3,697,253.15 1,242.09
Feb - - - - - - -
Mar 9,500.00 10,729,973.97 3,611.62 - - 10,729,973.97 3,611.62
Apr 32,000.00 36,118,510.76 12,163.91 - - 36,118,510.76 12,163.91
May 42,740.00 48,254,506.99 16,245.45 - - 48,254,506.99 16,245.45
Jun 20,000.00 22,585,428.93 7,607.19 - - 22,585,428.93 7,607.19
Jul - - - - - - -
Aug 2,750.00 3,096,245.62 1,042.72 - - 3,096,245.62 1,042.72
Sep 17,952.50 20,346,766.54 6,837.32 1,133.37 0.38 20,347,899.91 6,837.70Oct - - - - -
Nov 28,000.00 31,734,268.94 10,544.49 - - 31,734,268.94 10,544.49
Dec - - - - - - -
157,942.50 176,562,954.90 59,294.79 1,133.37 0.38 176,564,088.27 59,295.17* Volume represents dutiable rice onlySource: Customs and Excise Department
34

Table 25: Rice Imports for 2009
Dutiable Non dutiable TOTAL
Period
Volume (m/tons)*
Value Value Value
Le'000 US$'000 Le'000US$'00
0 Le'000 US$'000
2009
Jan 16,000.00 18,931,840.77 - - - 18,931,840.77 -
Feb 9,000.00 10,679,488.31 - - - 10,679,488.31 -
Mar - - - - - -
Apr 31,950.00 39,047,710.52 - - - 39,047,710.52 -
May 8,000.00 9,853,036.42 - - 9,853,036.42 -
Jun 17,000.00 21,385,488.30 - - - 21,385,488.30 -
Jul 9,914.42 12,626,801.13 - - - 12,626,801.13 -
Aug - - - - - - -
Sep 7,000.00 9,665,264.44 - - 9,665,264.44 -
Oct 10,700.00 14,962,090.25 - - - 14,962,090.25 -
Nov 25,250.00 37,122,637.28 - - - 37,122,637.28 -
Dec 9,000.00 13,491,276.19 - - - 13,491,276.19 -143,814.42 187,765,633.61 - - - 187,765,633.61 -
* Volume represents dutiable rice only
Source: Customs and Excise Department
35

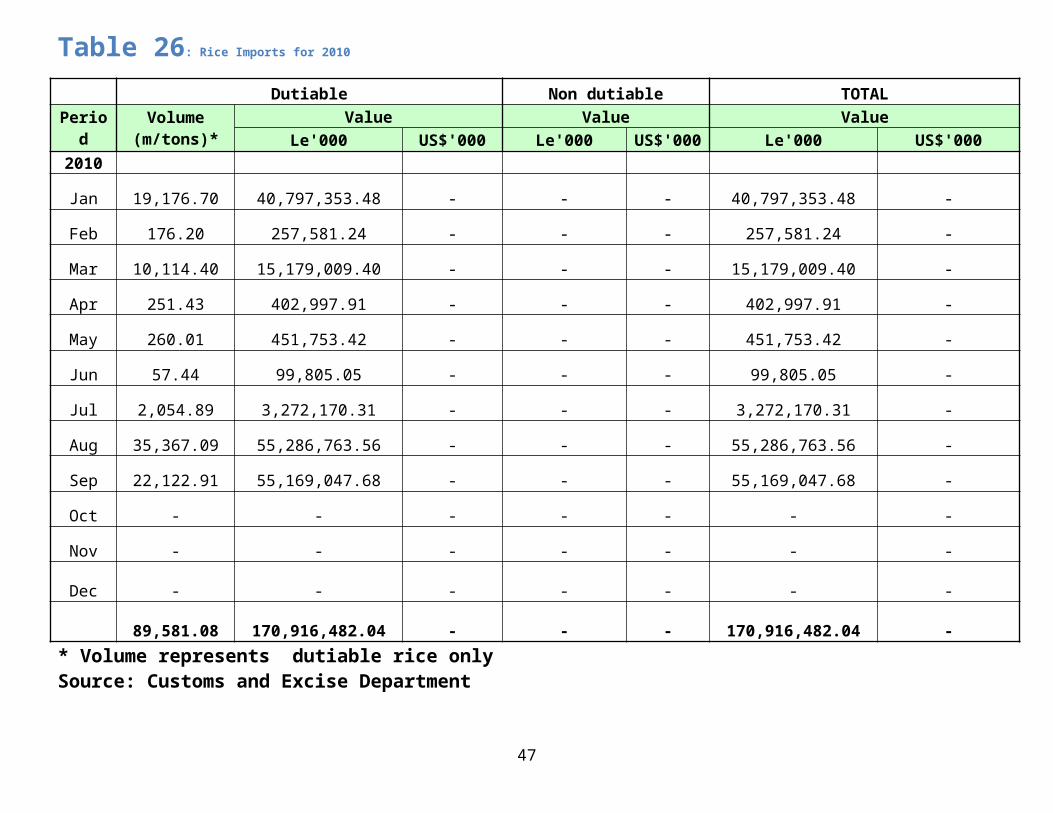
Table 26: Rice Imports for 2010
Dutiable Non dutiable TOTAL
Period
Volume (m/tons)*
Value Value Value
Le'000 US$'000 Le'000US$'00
0 Le'000 US$'0002010
Jan 19,176.70 40,797,353.48 - - - 40,797,353.48 -
Feb 176.20 257,581.24 - - - 257,581.24 -
Mar 10,114.40 15,179,009.40 - - - 15,179,009.40 -
Apr 251.43 402,997.91 - - - 402,997.91 -
May 260.01 451,753.42 - - - 451,753.42 -
Jun 57.44 99,805.05 - - - 99,805.05 -
Jul 2,054.89 3,272,170.31 - - - 3,272,170.31 -
Aug 35,367.09 55,286,763.56 - - - 55,286,763.56 -
Sep 22,122.91 55,169,047.68 - - - 55,169,047.68 -
Oct - - - - - - -
Nov - - - - - - -
Dec - - - - - - -
89,581.08 170,916,482.04 - - - 170,916,482.04 -
* Volume represents dutiable rice onlySource: Customs and Excise Department
36

Table 27: Summary of Rice Imports from 2001 to 2009 and Jan. - Sept. 2010
Period
Dutiable Non dutiable TOTAL
Volume (m/tons)*
Value Value Value
Le'000 US$'000 Le'000US$'00
0 Le'000 US$'000
2001 132,183.10 47,211,284.48 23,620.68 316.05 0.19 47,211,600.53 94,711,188.13
2002 146,422.37 54,600,797.90 26,162.43 2,358,134.111,104.8
0 48,743,836.63 106,022,880.62
2003 156,701.90 67,327,570.10 28,587.10 0 0 60,201,937.88 28,587.10
2004 124,039.00 72,068,934.45 28,366.68 0 0 72,068,934.45 28,366.68
2005 96,445.00 65,471,729.99 24,884.17 0 0 65,471,729.99 24,884.17
2006 97,884.36 69,811,000.91 23,594.54 0 0 69,811,000.91 23,594.54
2007 99,679.00 71,641,793.11 24,010.76 0 0 71,641,793.11 24,010.76
2008 157,942.50 176,562,954.90 59,294.79 1,133.37 0.38 176,564,088.27 59,295.17
2009 143,814.42 187,765,633.61 0 0 187,765,633.61 0
2010 89,581.08 170,916,482.04 0 0 170,916,482.04 0
TOT1,244,692.
73 983,378,181.49238,521.1
52,359,583.5
31,105.3
7 970,397,037.42200,922,807.
17
* Volume represents dutiable rice onlySource: Customs and Excise Department
37

Figure 5: Summary of Import Volume of Rice from 2001 to 2009 and January to September 2010.
Source: Customs and Excise Department
38

Figure 6: Summary of Import Value of Rice from 2001 to 2009 and January to September 2010.
39

Table 28: Coffee Exports Volume
Volume (Metric Tons) of Coffee Export for 2001 to August 2010Year Jan Feb Mar Apr May Jun Jul Aug Sep Oct Nov Dec Total
2001 Nil Nil Nil Nil Nil Nil Nil Nil Nil
75 Nil Nil
75
2002
160 Nil
360 Nil
115 Nil Nil Nil Nil Nil
312 Nil
947
2003 Nil Nil Nil Nil Nil
54 Nil Nil Nil Nil
59 Nil
113
2004 Nil Nil Nil Nil Nil Nil Nil Nil
100
18 Nil Nil
118
2005 Nil Nil Nil
224
184 Nil Nil
50
581 Nil Nil Nil
1,039
2006 Nil
66
17 Nil
109
40
36
21 Nil Nil
404 Nil
693
2007 Nil Nil Nil Nil Nil Nil Nil
342 Nil Nil Nil
375
717
2008
247
103
50
108
773
342
124
193
18 Nil Nil Nil
1,958
2009 341 142 69 149 1,060 472 171 266 25 Nil Nil Nil 2,695
2010(Prov) 0 14 49 99 179 3 2 3 - - - - 349
Source: Customs and Excise Department (NRA); Government Gold and Diamond Office (GGDO) and International Finance Department, BSL.
40

Table 29: Coffee Export Value
Value (000 US Dollars) of Coffee Export for 2001 to August 2010
Year Jan Feb Mar Apr May Jun Jul Aug Sep Oct Nov Dec Total
2001 Nil Nil Nil Nil Nil Nil Nil Nil Nil 22.9 Nil Nil 22.9
2002 48.6 Nil 108.9 Nil 34.6 Nil Nil Nil Nil Nil 80.0 Nil 272.1
2003 Nil Nil Nil Nil Nil 17.8 Nil Nil Nil Nil 22.3 Nil 40.1
2004 Nil Nil Nil Nil Nil Nil Nil Nil 45.6 7.2 Nil Nil 52.8
2005 Nil Nil 102.1 218.7 295.0 119.7 Nil 31.3 50.8 56.2l Nil Nil 735.5
2006 Nil Nil 406.4 207.4 296.7 78.2 43.3 18.1 27.0 9.0 7.3 Nil 1,093.4
2007 Nil Nil Nil 578.4 316.4 414.3 Nil 273.6 Nil Nil Nil 272.0 1,854.7
2008 179.2 74.7 36.3 86.4 618.4 248.1 90.0 140.1 14.4 Nil Nil Nil 1,487.5
2009 133.1 847.5
1,418.
7 1,381.0 612.0
3,743.
3
3,269.
8 839.7 416.4 462.1 Nil Nil 13,123.5
2010(Prov) Nil 14.3 47.2 96.3
1,486.4 20.0 13.3 20.7 Nil Nil Nil Nil 1,698.2
Source: Customs and Excise Department (NRA); Government Gold and Diamond Office (GGDO) and International Finance Department, BSL.
41
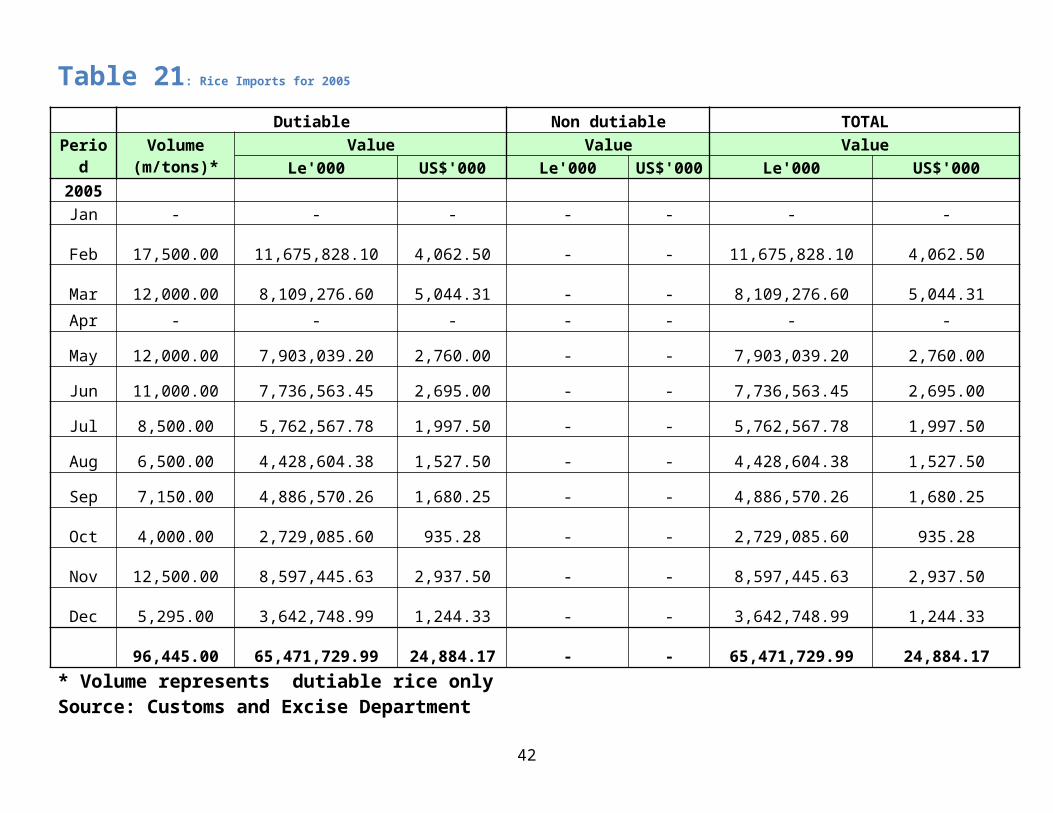
Table 30: Cocoa Exports Volume
Volume (Metric Tons) of Cocoa Export for 2001 to 2010
Year Jan Feb Mar Apr May Jun Jul Aug Sep Oct Nov Dec Total 2001 28 Nil 26 Nil Nil Nil Nil Nil Nil 390 125 72 641
2002 96 Nil 16 Nil Nil Nil Nil Nil Nil Nil 941 125 1,178
2003 1,897 Nil Nil Nil 566 Nil Nil Nil 25 Nil 50 195 2,733
2004 487 1,075 Nil 88 Nil Nil Nil Nil 338 1,587 1,863 750 6,187
2005 3,313 775 216 38 Nil 50 Nil Nil 1,450 570 570 188 7,169
2006 1,087 25 149 75 25 63 25 50 163 27 813 Nil 2,502
2007 Nil 4,050 Nil Nil Nil Nil 16 250 888 637 250 1,294 7,384
2008 3,796 1,091 169 88 466 200 Nil 576 2,346 5,301 656 3,205
17,89
3
2009 5,200 1,495 232 121 638 274 Nil 789 3,213 7,262 899 4,391
24,51
4
2010(Prov) 19,916 4,904 760 397 2,093 899 Nil 2,588 Nil Nil Nil Nil
31,557
Source: Customs and Excise Department (NRA); Government Gold and Diamond Office (GGDO) and International Finance Department, BSL.
42

Table 31: Cocoa Export ValueValue (US Dollars) of Cocoa Export for 2001 to 2010
Year Jan Feb Mar Apr May Jun Jul Aug Sep Oct Nov Dec Total
2001 3.1 Nil 8.8 Nil Nil Nil Nil Nil Nil 162.3 56.8 34.9 265.9
2002 46.0 Nil 17.9 Nil Nil Nil Nil Nil Nil Nil 1,015.9 138.9 1,218.9
2003 1,675.1 Nil Nil Nil 577.9 Nil Nil Nil 32.3 Nil 66.2 212.3 2,572.8
2004 414.4 914.0 Nil 74.4 Nil Nil Nil Nil 286.9 1,349.4 1,583.1 637.5 5,259.4
2005 2,929.1 664.9 185.4 30.9 Nil 42.7 Nil Nil 916.4 320.3 320,286 114.9 5,524.9
2006 1,012.6 184.0 407.0 22.2 72.3 69.2 131.7 167.6 1,248.1 2,849.3 2,429.1 2,977.8 11,570.8
2007 2,292.2 3,361.7 957.3 377.7 67.6 41.5 12.8 212.5 754.4 528.7 1,732.2 1,029.5 11,368.1
2008 3,256.2 880.8 136.4 74.4 397.7 171.6 Nil 493.8 1,877.1 4,452.8 551.0 2,692.2 14,981.9
2009 6,351.00 3,875.50
1,937.1
0 952.2
1,399.9
0 455.8 443.3 311.7
3,312.1
0
1,200.9
0 140.6 164.5l 20,544.6
2010
(Prov
) 12,751.6 9,056.0 1,658.5
1,687.
6 925.7 44.5 Nil 332.7 Nil Nil Nil Nil 26,456.6
43

Source: Customs and Excise Department (NRA); Government Gold and Diamond Office (GGDO) and International Finance Department, BSL.
Table 32: Fishery Data
FISHERY (PRODUCTION AND EXPORT - Mt) – 2001 TO 2010 Value of Export(000 US$)
YEAR INDUSTRIAL FISHERY ARTISANAL FISHERY
TOTAL
Shrimps
Lobster &
Crabs
Cuttlefish
Snails Shark &
Rays
Dermasal Fish
Tuna Pelagic Fish
Mix
2001 1,277 337 1,169 - 120 10,993 6,16
6
2,536 39,950 62,548 15.7
2002 1,119 194 3,562 - 126 7,315 - 1,405 55,659 69,254 22.3
2003 1,541 215 4,598 - 150 9,549 - 1,112 65,458 82,623 22.6
2004 1,445 127 1,596 1,266 175 8,011 - 1,611 106,216 120,45
3
24.1
2005 1,378 106 2,017 1,883 135 7,756 - 2,522 116,614 132,41
1
76.2
2006 1,354 159 982 1,065 143 8,526 - 1,413 120,490 134,13 97.2
44

5
2007 1,373 262 722 925 431 12,684 - 2,216 111,937 130,55
0
443.8
2008 987 - - - - 15,898 - 3,176 161,699 181,75
9
2,045.5
2009 1,036 - - - - 17,488 - 3,651 183,316 202,20
4
14,800.
9
2010(Prov
)
10 - - - - 157 - 33 1,650 1,850 146.0
Source: Fisheries and Marine Resources
Table 33: Retail Prices (Le/Kg) for Priority Commodities - January to November 2010
COMMODITY NAME
JAN FEB MAR APR MAY JUN JUL AUG SEP OCT NOV AVG.
Local Milled Rice (Parboil)
2,324
2,362
2,415
2,587
2,696
2,655
2,713
2,661
2,658
2,742
2,614
2,563
Imported Milled Rice 2,
555 2,5
86 2,5
87 2,7
37 2,7
82 2,7
79 2,
763 2,70
9 2,6
45 2,7
42 2,6
33 2,
682
Cassava Tuber
569 6
35 6
55 6
68 6
04 6
77
616 69
0 5
60 5
60 5
45
630
Sweet Potato 1,
077 1,0
98 1,0
63 9
17 8
87 8
81
917 1,13
3 1,0
74 8
10 1,1
30 1,
005
Broad Beans 2,
782 2,7
37 2,8
60 2,6
81 2,6
83 2,5
15 2,
636 3,42
6 2,5
39 2,5
67 2,7
47 2,
762 45

Pigeon Pea 3,
382 3,2
22 3,1
22 2,6
13 2,6
12 2,7
40 3,
008 3,34
3 3,3
32 3,6
62 3,1
17 3,
041
Sesame (Benin) 4,
102 4,1
89 4,0
83 4,4
32 4,5
94 4,6
57 5,
434 5,27
9 5,2
15 6,3
65 7,5
69 4,
665
Groundnut (Unshelled)
2,776
2,863
3,060
3,920
4,113
4,097
2,971
2,127
3,359
2,626
2,838
3,254
Groundnut (Shelled) 4,
318 4,2
42 4,3
10 3,8
74 3,3
96 4,6
45 4,
694 4,84
6 4,8
73 4,6
55 4,5
32 4,
355
Sweet (Big) Pepper 5,
094 6,5
10 6,1
19 3,3
62 4,8
27 4,0
40 4,
557 7,93
8 7,1
78 6,5
00 7,0
03 5,
514
Small (Hot) Pepper 12,
079 11,7
09 11,4
70 6,0
89 5,9
98 4,8
47 4,
622 5,83
3 6,5
97 6,5
79 6,4
82 7,
694
Palm Oil 4,
775 4,9
13 4,4
03 3,9
59 4,1
14 4,1
55 4,
620 4,90
0 4,9
30 4,9
92 5,4
38 4,
530
Bonga (Dried) 5,
389 4,7
74 5,4
27 6,4
74 6,3
20 6,6
09 6,
725 9,66
9 9,3
61 8,5
39 11,4
05 6,
750
Cow Meat 12,
103 10,7
19 10,0
26 11,1
54 12,2
06 12,1
98 9,
462 11,70
2 13,2
33 15,3
40 16,2
96 11,4
23
Cocoa 3,
100 3,2
75 3,2
50 3,2
95 5,0
65 4,8
15 3,
478 4,03
0 3,6
78 7,8
45 7,7
78 3,
776
Coffee 3,
250 3,5
50 3,5
00 3,7
14 5,8
52 5,8
55 1,
091 1,68
2 1,6
82 - - 3,
353
Source : PEMSD/MAFFS
Table 34: Wholesale Prices (Le/Kg) for Priority Commodities – Jan. to Nov. 2010
COMMODITY NAME
JAN FEBMAR
APR MAY JUN JUL AUG SEP OCT NOVNational Average
Local Milled Rice (Parboil)
2,005
2,101
2,175
2,353
2,494
2,334
2,232
2,154
2,439
2,031
2,289 2,254
Imported Milled Rice 2,4
14 2,4
35 2,4
33 2,2
88 2,3
84 2,3
65 2,3
51 2,3
32 2,3
78 2,4
45 2,3
53 2,376
Cassava Tuber 5
51 7
74 6
69 4
41 4
33 4
52 5
25 4
08 4
73 5
12 4
39 525
Sweet Potato 6
54 5
80 6
57 5
54 5
62 5
99 6
51 7
09 7
57 5
81 5
87 636
Broad Beans 3,3
52 3,3
52 3,3
52 3,1
33 1,4
64 1,1
98 1,8
80 1,5
75 1,5
56 3,3
13 3,5
00 2,318 Pigeon Pea 2,3 1,9 1,5 2,4 1,2 1,4 1,9 2,3 2,5 3,7 2,6 1,987
46
14 80 65 51 99 07 71 33 58 87 67
Sesame (Benin) 4,0
71 4,2
01 4,2
53 3,3
40 3,1
81 3,6
89 2,9
24 3,5
00 3,1
67 2,4
85 4,7
96 3,592 Groundnut (Unshelled)
2,887
2,446
2,529
2,992
2,871
3,007
2,620
1,471
1,863
2,373
1,965 2,521
Groundnut (Shelled) 3,3
91 3,6
03 3,1
50 3,1
03 2,7
23 3,2
48 3,5
01 3,8
30 4,1
21 4,2
50 4,3
50 3,408
Sweet (Big) Pepper 4,7
50 5,0
00 4,0
00 1,7
62 5,6
24 4,6
97 1,6
34 3,3
12 3,3
58 4,5
03 3,4
55 3,793
Small (Hot) Pepper 10,5
99 13,0
09 9,3
57 4,4
92 3,5
97 3,0
23 1,9
61 3,6
73 4,2
49 5,5
95 5,9
13 5,996
Palm Oil 3,8
47 4,1
68 3,7
11 3,2
17 3,2
90 3,3
61 3,7
62 3,9
41 3,8
77 4,2
13 4,3
68 3,686
Bonga (Dried) 5,6
67 3,9
11 4,7
92 3,7
56 4,1
70 4,2
17 6,1
14 8,5
70 5,2
61 6,2
00 2,9
01 5,162
Cow Meat
-
-
-
-
- -
-
-
-
-
- -
Cocoa 2,8
00 2,9
00 2,9
00
- 3,6
20 3,6
20
-
- 4,7
60 4,9
12
- 3,645
Coffee 3,1
00 3,1
50 3,1
50
- 3,0
79 3,0
79
-
-
-
-
- 3,112 Source: PEMSD/MAFFS
47