August 2012 Brand loyalty in Smartphone Master Thesis Author Mulugeta Z Forsido Thesis Advisor: Jukka Hohenthal

Welcome message from author
This document is posted to help you gain knowledge. Please leave a comment to let me know what you think about it! Share it to your friends and learn new things together.
Transcript
August 2012
Brand loyalty in Smartphone
Master Thesis
Author Mulugeta Z Forsido
Thesis Advisor: Jukka Hohenthal
2
Abstract
Problem statement – what factors determine brand loyalty in Smartphone?
Purpose – The purpose of this study is to examine causal antecedent factors leading to brand
loyalty in the Swedish Smartphone market
Theory – theoretical review and critical analysis of academic journals related to dependant
and independent variables and conceptual model is formulated.
Methodology - Quantitative approach is used to quantify the relationship between dependant
and independent variables based on the proposed theoretical model that delineates the
relationships between dependant variable brand loyalty and the independent variables
customer satisfaction, perceived quality, brand experience, brand image, brand switching cost
and product involvement.
Data – In total 200 responses were collected through a structured interview from Uppsala
University, Uppsala central train and bus station and two big shopping centers in Uppsala (S: t
per galleria and Forum galleria). Apple and Sony Ericsson brand users are interviewed in the
data gathering process, 100 respondents for each brand.
Findings – the analysis suggest brand image, product involvement and customer satisfaction
determined brand loyalty in Apple brand, whereas customer satisfaction was the only
determinate factor in Sony Ericsson brand.
Keywords Smartphone, Brand loyalty, Customer satisfaction, Perceived quality, Brand
image, Brand switching cost, Customer product involvement, Sweden
Paper type: Research paper
3
Table of Contents 1. Introduction ......................................................................................................................................... 4
1.2 Problem statement ........................................................................................................................ 7
1.3 Purpose .......................................................................................................................................... 7
1.4 structures of the thesis .................................................................................................................. 7
2. Literature Review ................................................................................................................................. 7
2.1 Brand loyalty .................................................................................................................................. 8
2.2 Customer Satisfaction .................................................................................................................. 10
2.3 Perceived brand quality ............................................................................................................... 13
2.4 Brand experience ......................................................................................................................... 14
2.5 Brand Image ................................................................................................................................. 15
2.6 Brand switching costs .................................................................................................................. 16
2.7 Customer product involvement ................................................................................................... 17
3. Methodology ..................................................................................................................................... 18
3.1 Data Collection and Sampling characteristics .............................................................................. 19
3.2 Measurement .............................................................................................................................. 22
3.2.1 Brand Loyalty ........................................................................................................................ 22
3.2.2 Customer Satisfaction ........................................................................................................... 23
3.2.3 Perceived Brand quality ........................................................................................................ 23
3.2.4 Brand experience .................................................................................................................. 24
3.2.5 Brand Image. ......................................................................................................................... 24
3.2.6 Brand switching costs ........................................................................................................... 25
3.2.7 Customer product involvement ............................................................................................ 25
4. Result and analysis ............................................................................................................................. 25
4.2 summary output .......................................................................................................................... 27
4.3 ANOVA output ............................................................................................................................. 28
4.4 Model Parameters ....................................................................................................................... 30
4
5. Discussion .......................................................................................................................................... 33
6. Conclusion Limitations and future research direction ....................................................................... 36
Reference ............................................................................................................................................... 37
Appendix ............................................................................................................................................... 45
1. Introduction A revolutionary and magical product that is literally five years ahead of any other mobile
phone, the guardian (2012). Smartphone is not just a simple mobile phone; rather it has an
5
extensive data storage capacity and processing power (Leyland, et al., 2010). The Smartphone
has moved the data processing power to in the hands of mobile users, who can use the mobile
device irrespective of time and space (Leyland, et al., 2010). According to Euromonitor 2010,
Smartphone contains functions such as instant messaging, downloading applications, and the
use of information services such as WiFi and global positioning system (GPS) and
entertainment. The market demand for Smartphone in worldwide is high. The percentage
shipment has been growing in the last three years remarkably, according to Euromonitor
(2012) & Canalys.com (2012). Vendors shipped 488 million Smartphone’s in 2011, compare
to 415 clients PCs Canalys.com (2012). A 62.7 % increase its sales volume 2010/2011
according to Canalys.com (2012).
The demand for Smartphone in Sweden has been driven by the availability of cheaper model
and sales volume increase by 124% in year 2010, and demand for features phone decline by
22% according to Euromonitor (2012). The forecasted sales volume of Smartphone is
expected to increase in the year 2010/2015 by 115% in total. However, mobile manufacturers
such as Nokia and Sony Ericsson have faced a new competitive environment in Sweden
market from new entrants Apple and HTC according to the report. Apple and HTC are well-
known to customers through the importance of the brand in the country and extensive
marketing campaigns according to the Euromonitor (2012).
Rapid technological development and short product life have been the characteristics of the
industry (Xun Li, et al., 2010). Mobile manufacturing and operating developing companies
are pushing Smartphone technology so hard, the new Smartphone with higher speed and more
features are coming out every year (Xun Li, et al., 2010). Short product life forced the
Smartphone owners to upgrade their phones on an average 18 months to keep with the news
generation Smartphone (Xun Li, et al., 2010). In general, most Smartphone customers are
young and middle age groups according to Nielsen (2011). Hedonism, visibility, and open-
mindedness are the main characteristics of the groups’ and they often consider Smartphone as
a means of leisure, simplicity in life, social connectives and information access Anna Wilska
(2002).
6
Both Nokia and Sony Ericsson were dominant in ordinary mobile cell phone and Smartphone
respectively, Euromonitor (2012). They have strong customers’ loyalty, especially in Finland
and Sweden due to companies’ origin countries and their products have good reputation
among the customers. Even the first-time Smartphone used for cell phone model R380 and
available in mass market by Sony Ericsson in the beginning of 2000’s according to Steve
Bridges (2001). Smartphone demand and growth prospects are high in Sweden according to
Euromonitor international, January 2012.
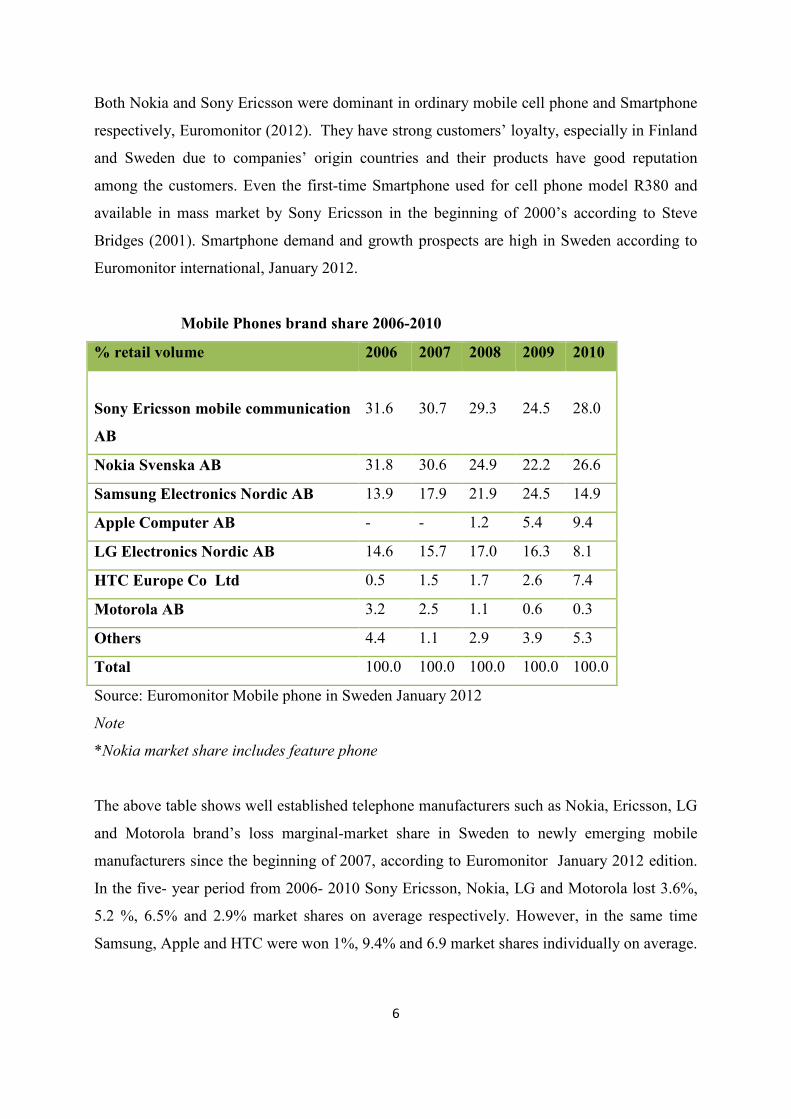
Mobile Phones brand share 2006-2010
% retail volume 2006 2007 2008 2009 2010
Sony Ericsson mobile communication
AB
31.6
30.7
29.3
24.5
28.0
Nokia Svenska AB 31.8 30.6 24.9 22.2 26.6
Samsung Electronics Nordic AB 13.9 17.9 21.9 24.5 14.9
Apple Computer AB - - 1.2 5.4 9.4
LG Electronics Nordic AB 14.6 15.7 17.0 16.3 8.1
HTC Europe Co Ltd 0.5 1.5 1.7 2.6 7.4
Motorola AB 3.2 2.5 1.1 0.6 0.3
Others 4.4 1.1 2.9 3.9 5.3
Total 100.0 100.0 100.0 100.0 100.0
Source: Euromonitor Mobile phone in Sweden January 2012
Note
*Nokia market share includes feature phone
The above table shows well established telephone manufacturers such as Nokia, Ericsson, LG
and Motorola brand’s loss marginal-market share in Sweden to newly emerging mobile
manufacturers since the beginning of 2007, according to Euromonitor January 2012 edition.
In the five- year period from 2006- 2010 Sony Ericsson, Nokia, LG and Motorola lost 3.6%,
5.2 %, 6.5% and 2.9% market shares on average respectively. However, in the same time
Samsung, Apple and HTC were won 1%, 9.4% and 6.9 market shares individually on average.
7
Why Apple and Sony Ericsson brand? The above table showed Apple and HTC market share
in Sweden has been increasing in the last 4-5 years, in contrary the leading Smartphone
manufacturers and service provider such as Ericsson and Nokia lose marginal market share in
the same period. It would be interesting to analyze four brands at the same time, but due to the
limited scope of study and time, in this research, only two brands into consideration. The
market leader was Sony Ericsson at the moment and Apple brand won a large market share as
compared other new brand on that specific period of time.
1.2 Problem statement Most previous research on customer loyalty has been carried out in static market and mature
environment (Son K, et al., 2010). That means uncommon to see a new market’s actor is
dominant. The new actors are dominate because market environment is dynamic:- 1) short
product life 2) fast technology and design change/ development 3) constant new product
introduction 4) the established market actors are struggling to maintain the competitiveness.
What factors lead to Smartphone brand loyalty in Sweden?
1.3 Purpose The purpose of this study is analyzing causal antecedent factors that lead to brand loyalty in
Smartphone market in Sweden.
.
1.4 structures of the thesis The thesis structured in the following way. On section “2 “literature review discussed and
presented, on section “3 “research methodology discussed and presented on section “4”
Sampling and data collection presented, on a Section “5 “ discussion presented , on Section
“6” recommendation and suggestion presented and at end appendix and tables.
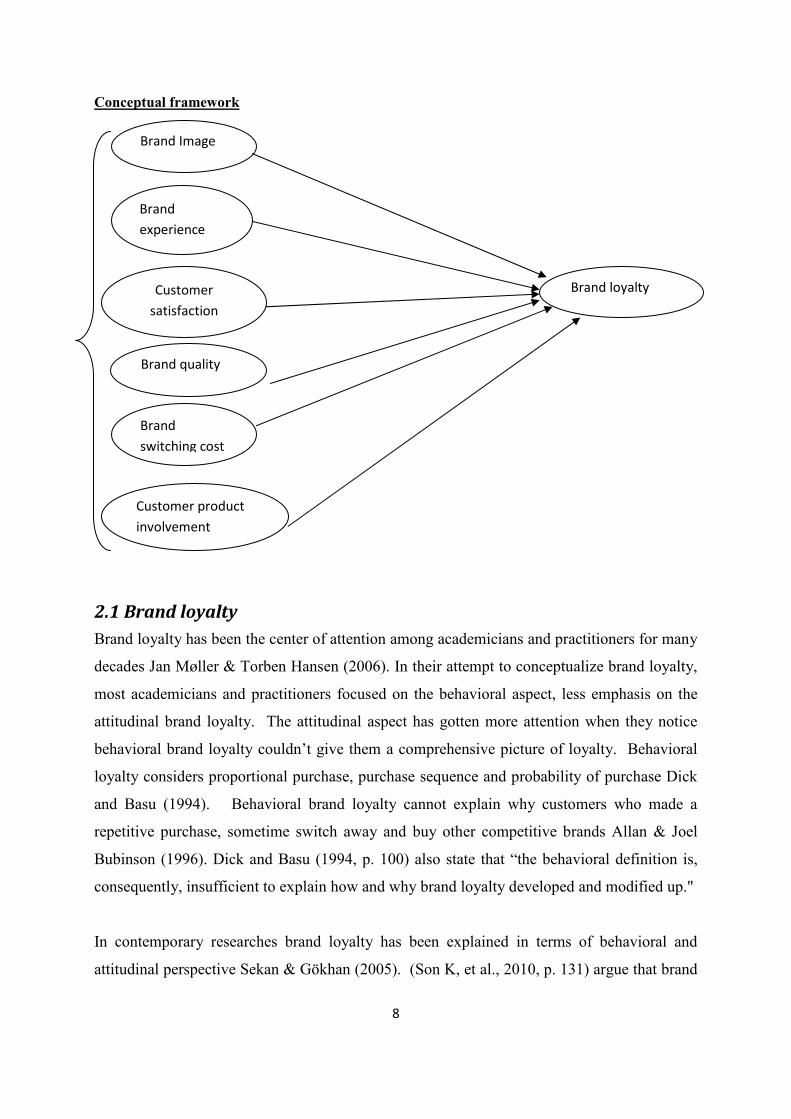
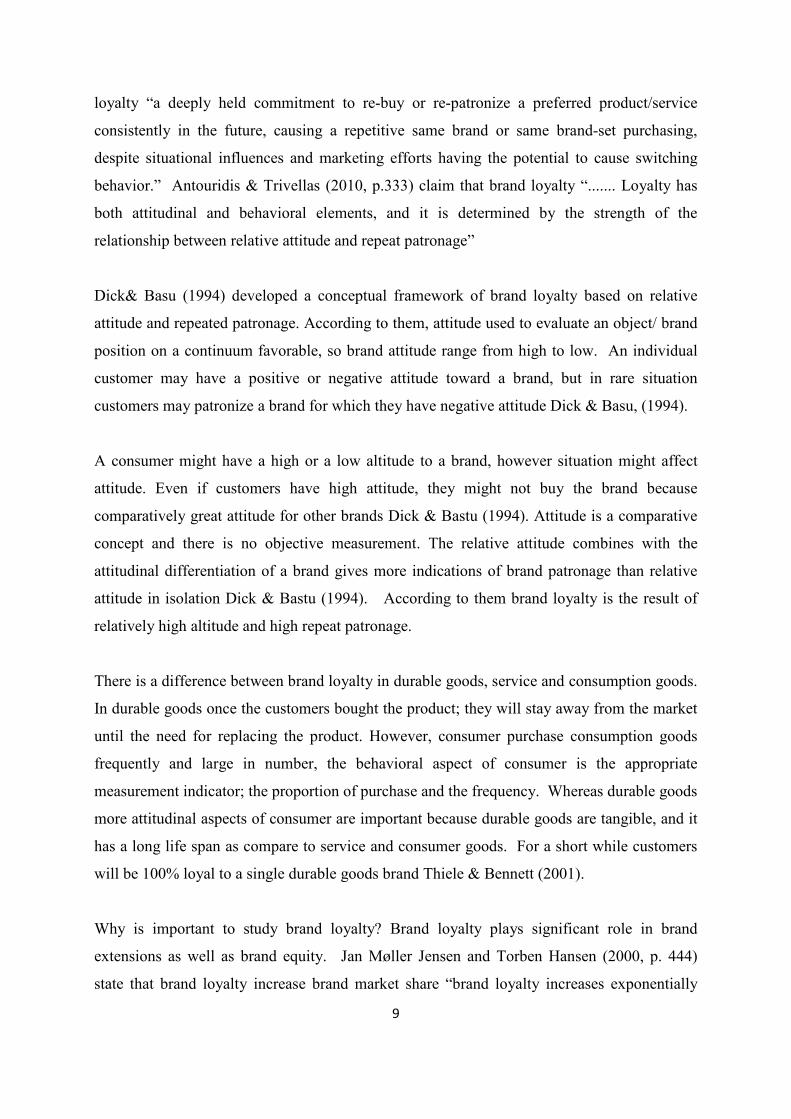
2. Literature Review The literature structured in the following way. Overall conceptual frameworks presented first,
and then in section 3.1 theoretical discussions on the dependant variable “brand loyalty”. On
section 3.2 customer satisfaction, on section 3.3 perceived brand quality, on section 3.4
customer brand experience, on section 3.5 brand image, on section 3.6 switching cost and on
section 3.7 customer product involvement discussed in detail.
8
Conceptual framework
2.1 Brand loyalty Brand loyalty has been the center of attention among academicians and practitioners for many
decades Jan Møller & Torben Hansen (2006). In their attempt to conceptualize brand loyalty,
most academicians and practitioners focused on the behavioral aspect, less emphasis on the
attitudinal brand loyalty. The attitudinal aspect has gotten more attention when they notice
behavioral brand loyalty couldn’t give them a comprehensive picture of loyalty. Behavioral
loyalty considers proportional purchase, purchase sequence and probability of purchase Dick
and Basu (1994). Behavioral brand loyalty cannot explain why customers who made a
repetitive purchase, sometime switch away and buy other competitive brands Allan & Joel
Bubinson (1996). Dick and Basu (1994, p. 100) also state that “the behavioral definition is,
consequently, insufficient to explain how and why brand loyalty developed and modified up."
In contemporary researches brand loyalty has been explained in terms of behavioral and
attitudinal perspective Sekan & Gökhan (2005). (Son K, et al., 2010, p. 131) argue that brand
Brand loyalty Customer satisfaction
Brand quality
Brand experience
Brand Image
Customer product involvement
Brand switching cost
9
loyalty “a deeply held commitment to re-buy or re-patronize a preferred product/service
consistently in the future, causing a repetitive same brand or same brand-set purchasing,
despite situational influences and marketing efforts having the potential to cause switching
behavior.” Antouridis & Trivellas (2010, p.333) claim that brand loyalty “....... Loyalty has
both attitudinal and behavioral elements, and it is determined by the strength of the
relationship between relative attitude and repeat patronage”
Dick& Basu (1994) developed a conceptual framework of brand loyalty based on relative
attitude and repeated patronage. According to them, attitude used to evaluate an object/ brand
position on a continuum favorable, so brand attitude range from high to low. An individual
customer may have a positive or negative attitude toward a brand, but in rare situation
customers may patronize a brand for which they have negative attitude Dick & Basu, (1994).
A consumer might have a high or a low altitude to a brand, however situation might affect
attitude. Even if customers have high attitude, they might not buy the brand because
comparatively great attitude for other brands Dick & Bastu (1994). Attitude is a comparative
concept and there is no objective measurement. The relative attitude combines with the
attitudinal differentiation of a brand gives more indications of brand patronage than relative
attitude in isolation Dick & Bastu (1994). According to them brand loyalty is the result of
relatively high altitude and high repeat patronage.
There is a difference between brand loyalty in durable goods, service and consumption goods.
In durable goods once the customers bought the product; they will stay away from the market
until the need for replacing the product. However, consumer purchase consumption goods
frequently and large in number, the behavioral aspect of consumer is the appropriate
measurement indicator; the proportion of purchase and the frequency. Whereas durable goods
more attitudinal aspects of consumer are important because durable goods are tangible, and it
has a long life span as compare to service and consumer goods. For a short while customers
will be 100% loyal to a single durable goods brand Thiele & Bennett (2001).
Why is important to study brand loyalty? Brand loyalty plays significant role in brand
extensions as well as brand equity. Jan Møller Jensen and Torben Hansen (2000, p. 444)
state that brand loyalty increase brand market share “brand loyalty increases exponentially
10
market share, resistance to alternative competitor brands and favors positive word of mouth”.
(Mokhtar, et al., 2000, p. 827) state that brand loyalty is a crucial role in organization
profitability and future growth prospect “Loyal customers stick with their suppliers or service
providers over the long run. They also express their loyalty by giving a greater share of their
wallets to their high-value brands or service providers and by generating word-of-mouth
referrals. All of these behaviors will directly affect profitability.”
Why only six factors? Brand loyalty is a broader concept and it is influenced by various
factors. In this thesis the factors that influence brand loyalty were limited to six for
operational reasons. As the number of independent variables increases, the size of questions
would also increase in numbers. The response rate would be declining, because the questions
take a long time to respond. To encourage response rate the questions and the independent
variables were limited to reasonable numbers, even if there are others independent variables
that could affect brand loyalty.
2.2 Customer Satisfaction Customer satisfaction is the result of purchase expectation and post purchase experience
comparison with incurred cost Serkan & Gökhan (2005). The customer might have high, low
and no expectation. It is also depends on the importance of brand as well as the cost. If the
expectation for brand/product performance is high, post purchase experience will determines
customer satisfaction even if the customers are low cost conscious.
Customer satisfaction can be overall satisfaction Serkan & Gökhan (2009). Overall
satisfaction is the result of accumulative experience and encounter rather than specific
satisfaction or dissatisfaction, which has longitudinal by nature Serkan Aydin & Gökhan
(2009). Overall customer satisfaction is longitudinal, so a customer's response is cognitive.
Paurav Shukla (2004, p. 85) states that customer satisfaction is “customer’s psychological
response to his/her or her positive evaluation of the consumption outcome in relation to
his/her expectation". Satisfaction is a subjective evaluation of the consumption experience.
The argument is based on disconfirmation satisfaction theory. The theory state that customer
evaluation of product/brand is based on comparison between expected performances with
11
actual performance. Disconfirmation theory of satisfaction has conceptualized as expectation,
performance, disconfirmation and satisfaction Gilbert & Carol Surprenant (1982).
Expectation indicates the customers anticipated performance. There are various expectation
indicators that customers might expect from brand performance. Customers might expect
brand provide functional or other expectation, but that depends on customer's interest.
Although all customers might not be able to list out the entire possible brand benefits due to
the fact that customers might have little awareness or motivation to do so Joss & Hans (1995).
Their brand performance rating is based on the attributes' that they are familiar with or the
attributes that customers want to have from the brand.
Performance is how the product or brand carries out the intended purpose or operating
character Gilbert & Carol Surprenant (1982). It is highly influenced by customer expectation.
Brand performance is a baseline for comparison with the customer expectation. Brand
performance might exceed, meet or below expectation. The performance criteria are highly
based on tangible and intangible's brand attributes. Brand specific performance attributes
include hardware, software, stylishness or other attributes.
Hardware refers physical components of the technology. That can be anything physically
handled i.e. Keyboard, camera, screen etc. Software refers operating systems that run on the
system, i.e iTune, GPS etc. Stylishness refers the outlook of the object. I.e weight, size, shape,
design, color etc., Encyclopedia Britannica Online.
Disconfirmation is the variance between prior expectation and actual performance Gilbert &
Carol Surprenant (1982). Customers might have positive or negative disconfirmation of their
experience. Positive disconfirmation indicate performance exceed expectation, while negative
disconfirmation indicate performance less than anticipated expectation. If the consumers have
no previous experience with alternative brands, they might be less motivated to compare the
difference between expectation and performance; it is hard for them making any meaningful
comparison Joss & Hans (1995). However, individual consumption experiences determine the
outcome of satisfaction or dissatisfaction Rodoula Tsiotsou (2005). Customer consumption
experience rated based on individual attitude on continuum range, very dissatisfied to very
satisfied.
12
Why is important to study customer satisfaction? Satisfied customer will be more inclined to
stay with service provider or using the same brand in the future, however, dissatisfied
customers are willing to search alternative brand information. H. Lin &Y. Wang (2006 p.
273) stated that ‘‘a dissatisfied customer is more probable to search for information on
alternatives and more likely to yield to competitor overtures than is a satisfied customer.
According to Hill & Alexander (2006, p. 1) “It is far less costly to keep the existing customers
than it is to win new ones up”. In supporting previous argument Hill & Alexander (2006, p.
2) state that customer satisfaction one way of measuring organization and product
performance in a competitive marketplace “customer satisfaction is a measure of how your
organization totals product performance in relation as a set of customer requirements."
Satisfied customers have high probability remain to use the existing company product or
brand as compare to dissatisfied customers, who are willing to search information about
alternative product or brand Santouridis & Trivellas (2010).
Numerous empirical studies on goods and service markets support customer satisfaction
influence loyalty positively Youl & John (2010). However, satisfaction is a necessary
condition to customer loyalty, but not it is sufficient condition. Even if customers are satisfied
with the brand, sometime they switch to other brands. Brand loyalty is a deeply held positive
attitude combine with repeat purchasing behavior Youl & John (2010). Only those satisfied
customers will have a positive attitude and repeat purchasing behavior. It is hard to
conceptualize dissatisfied customers might have a high positive attitude, and even if they
show repeats purchasing behavior in situations where there is no alternative brand to
substitute or high switching cost Youl & John (2010).
Brand satisfaction is one factor that influences brand loyalty (Youl & John 2010, Bennett &
Bove 2001; Bennett, Härtel, &McColl-Kennedy 2005 and Jones & Suh 2000). The more the
customer satisfied with the brand the more they are willing to use the same brand in the
future. Feick, L., Lee, J. and Lee, J. (2001) stated that high level satisfaction strongly
correlated with increase brand loyalty.
13
2.3 Perceived brand quality Perception of brand quality is determined by individual customers (Cole, Robert and Flynn
2009). Individual customer is the ultimate determinate of quality. However, there is a
parameter than can be used to establish brand quality as a reference. Bruks & Naylar (2000)
and (Pappu, Quester,& Cooksey, 2006) state that the common method to assess the quality of
product/service is establishing quality dimension. The following are quality parameters to
assess the quality of durable goods; easy to use, serviceability, durability, performance and
excellent feature (prestige).
Easy to use refers a customer's ability to start and operate the product with the help of
instruction available with a product. The instructions to start and operate the product are clear
and understandable to meet quality criteria. Serviceability refers to the customer’s access to
obtain services from manufacturers. The services include repairing and upgrading the brand,
services also available with reasonable time, place and price to customers. Durability refers
how long the product last, the length of time product function properly without the need of
repair. Performance refers how well the product performs the intended purpose, for example,
how well micro-wave cook food. Prestige refers to how well the products communicate
superiority and relevance to a social group Bruks & Naylar G (2000).
Lee. H, Lee. C &Wu .C (2009) argue that brand quality is a cumulative evaluation of brand
excellence. It includes tangible and intangible brand attributes. Customers might not
understand brand quality the way manufacturers do Bruks & Naylar (2000). According to
them, it is common method customers use intangible brand attributes when their asses brand
quality for durable goods. (Cole, Robert, Flynn, 2009, p. 68) state that “Perceived quality can
affect a willingness to buy, and the price that customers will pay. “
Brand loyalty expected to occur when perceived quality has been judged favorably
Gurbuz (2008). According to him when the customer perceived the brand has high
quality, they will develop brand loyalty. He also states that perceived quality is the
main driver of brand loyalty and a positive quality evaluation as a construct that maintains
behavioral intentions. Boulding et al. (1993) states that the positive relationship between
perceived quality and repurchase intention and willing to recommend.
14
2.4 Brand experience Brand experience is a subjective and internal response as well as a behavioral response when
an individual customer's encounter with the product, shopping and consumption Brakus &
Zarantonello (2009). Product experience is the result of the customers physically contact with
the product or virtual presentation on advertising Brakus & Zarantonello (2009). Some
experience might have a short impact, where some experience stays for long. Brand
experience span from brand consumption to the environment where brand displayed (Kerin, et
al., 1992).
However, Brakus & Zarantonello (2009, p. 53) argue that brand experience is not a general
evaluation of customers overall experience “brand experience is specific sensations, feelings,
cognitions, and behavioral responses triggered by specific brand-related stimuli.”For example,
the customers might have specific experience; this iPod puts me in a good mood. However,
experience through a time results general evaluation and attitude toward the brand.
Other researchers rather argue brand experience as the total pleasantness and unpleasantness
encounters that affect attitudinal and behavioral response of the customers and influences
patronage (Kerin, et al., 1992). Sahin, Zehir and Kitap (2002, p. 1289) argue that brand
experience as a combination of behavioral, affective and cognitive response “Brand
experience is conceptualized as sensations, feelings, cognition, and behavioral responses
evoked by brand-related stimuli that is part of a brand’s design and identity, packaging,
communications, and environments.” The positive outcome of brand experience will
influence brand loyalty.
Brand experience has a direct relationship with brand loyalty and it plays a crucial role in
brand building process, Iglesias, Singh, & Batista- Fouget (2010). According to them if the
customers have positive and pleasant experience, they would likely purchase the same brand
repeatedly and they become loyal to the brand. Iglesias, Singh,& Batista- Fouget (2010 p.
572) also state that “ brands which are capable of delivering a superior brand experience can
achieve preference over and differentiation from other brands and build brand loyalty and
foster evangelism”.
15
2.5 Brand Image (Lee. H, Lee. C & Wu.C, 2009, p. 1093) state brand image as “perceptions about a brand as
reflected by the brand association held in consumer memory.” Consumers associate the brand
with tangible and intangible attributes, often it is represented by the feelings and thoughts the
consumers have in their minds. The brand association easily helps customer’s process
information and retrieves when they made the purchasing decision because it recalls positive
feelings and attitudes toward that brand (Lee. H, Lee. C&Wu. C, 2009).
The brand image is also brand uniqueness when it comes to competing brands (Lee. H, Lee.
C&Wu. C, 2009). Almost all competitive brands have unique dimensions to differentiate
themselves from the competitor’s brand. The brand might be differentiated by the color, the
texture, sound, packaging, design, weight, while other more abstract dimensions can be brand
uniqueness.
Brand image also includes the customer’s knowledge, belief and information about the
specific brand (Lee. H , Lee. C & Wu.C, 2009). The source of information and knowledge
might come from advertising, promotion, friends, internet, word of mouth or company reports
and bulletins. Customers’ knowledge might include the range of products within the brand,
the philosophy the company and the brand’s quality. When consumers grow a positive image
for a brand, they might develop a strong connection. Customers may also develop beliefs
about the brand. If the customers have a strong belief about a brand, the more deeply rooted
the brand image in their mind. As an outcome, consumers easily identify brands and they are
not easily persuaded by a competitor’s offering as they would otherwise. Hyun & Kim (2011,
p. 430) stated that “[...] A favorable brand image would have a positive influence on
consumer behavior towards the brand in terms of increasing loyalty, commanding a price
premium and generating positive word-of-mouth.” Chen and Myagmarsuren (2011, p. 960)
argue that” Brand image is a subjective perception, a mental representation of functional and
non-functional information regarding the product or service. One important part of subjective
perception of brand image is the symbolic concepts brand personality.”
Brand image is the perceived functions and symbolic association in the mind of customers
and the strength and favor of brand image depends on the consumer’s value (Salciuviene,
Ghauri, Mockaitis and De Mattos, 2009). According to them a product functional attribute is
16
tangible excellence of a brand on performing certain technical functionality in high standard
and symbolical brand attribute refers intangible benefits offered by brand such as self-image
and status.
Brand image plays an important role when consumer evaluates service and product and it is a
driving force for customer brand loyalty Chen and Myagmarsuren (2001). According to them
brand image influence attitudinal and behavioral response of customers toward brand,
company and services. Kwon and Lennon (2009) also state that brand image crate strong
company patronage intention among customers, and they are willing to pay premium prices
and strong feeling and affiliation.
2.6 Brand switching costs Switching cost is cost incur by a customer when they decide to switch to another brand. The
cost might be one time, which includes financial and non financial Burnham & Mahajan
(2003). According to them, the cost includes" searching cost, transaction cost, learning cost,
customer habit, emotional cost, cognitive effort, coupled with financial, social and
physiological risk of part of the buyer."
Searching cost might include time and an effort made in searching information and comparing
alternative brand quality, price, serviceability, product warranty and other brand offering from
competitive brand Burnham & Mahajan (2003).
The economic cost is sunk cost and progressive cost. Sunk cost is the one-time purchase cost
incurred by customers, which is paid at the beginning of brand purchase and onetime sum
payment. Progressive cost is an additional cost incurred by customers when they update
functional system and repair. The sunk costs and progressive costs increase switching costs
because it increases customers’ investment on a brand Burnham & Mahajan (2003).
Learning cost usually stated as the effort and energy put by customers to learn new setting and
feature. Learning progress depends on customer skill and the complexity of brand Burnham &
Mahajan (2003). The more complex to learn a brand is the more time-consuming to get used
to a new setting and procedure. Long procedural learning might frustrate customers and they
hesitate to change brands.
17
Social and physiological risk also factor to switching cost. Customers’ perception about brand
switching might affect social status Burnham & Mahajan (2003). If a brand glorify/undermine
social states, the high / low probability the customer will show switching tendency.
Customers might fear they might not end up using the new brand which is considered as less
worthy among friends and family members Burnham & Mahajan (2003).
Physiological risk is uncertainty associated brand when customers were not sure about brand
quality and performance in advance Burnham & Mahajan (2003).
Switching cost has some advantage to a firm, because it has a direct effect on brand loyalty
Serkan & Gökhan (2005). They stated that higher the switching cost reduces customer
sensitivity to price and satisfaction level. Switching cost makes customers less likely to
switch to another brand Feick, L., Lee, J. and Lee, J. (2001). They state that even if the
customers are dissatisfied, they will keep using the brand due to high switching cost. The
higher switching cost reduces information searching for alternative brands as Jones .H ,
Mothersbaugh .D, and Beatty .S ( 2000).
2.7 Customer product involvement Customer product involvement is conceptualized as individual customer’s connection with the
brand. Customers might think a specific product or brand is personally important and
necessary. The customer perceptions determine a product involvement level rather than a
product Pascale & AI Lin Lim (2003). The brand might have different importance in different
situations and it influences customers’ product involvement. For example, a person who is
going to prepare a dinner for the guest who has diabetes/allergic problem might highly
involve in the selection of grocers than other time. Customers are highly involved in product
selection when product is considered very important, essential and give meaningful pleasure
& desire according to Pascale & AI Lin Lim (2003). The essence of a brand for a customer’s
might influence information searching, processing and decision making, Von Riesen &
Herndon (2011). According to (Malär, et al. 2011, p. 36) “a consumer’s level of involvement
with an object, situation, or action is determined by the degree to which she/he perceives that
concept to be personally relevant." Personal relevance of brand emerged usually from
individual self-concept, self-esteem and public self-consciousness according to them.
18
Customers’ involvement with a brand has different reasons. Miital.B & Lee. M (1989, p. 366)
state that the followings are the reasons that drive customer involvement “ (a) utilitarian, i.e,
economic, rational, functional goals - these concerns the physical performance of a product
(b) sign-value, i.e., A social, self-concept related, or impression management goals and (c)
hedonic, i.e., Sensory pleasure or experiential goals." From the statement utilitarian, sign
value and hedonic are the antecedent factor for customer involvement. Mittal & Lee (1989)
stated brand risk is another valuable source to customer product involvement. According to
them, the brand risk is the probability that customers happen to buy inferior products.
Customers’ consumption of brand is not based on only satisfying a basic need; it is also used
as a way of expressing self as an individual and social status. Petruzzellis (2010, p. 612) argue
that “It is a way of self expression, individual identity formation, creativity, or even art.”
Brand loyalty interacts with customer product involvement (Pascale & Ai Lin Lim 2003,
LeClerc and Little 1997). They stated that the repetitive purchase of the high involvement
product indicates brand loyalty. Park (1996) stated that product involvement and attitudinal
loyalty are highly correlated. Olson (2007, p. 320) stated that product involvement is a strong
indication of brand loyalty “brand loyalty has typically explained the origins of brand
commitment as attitudinal loyalty or as an outcome of product involvement, and suggested a
positive relationship between product involvement and brand loyalty”.
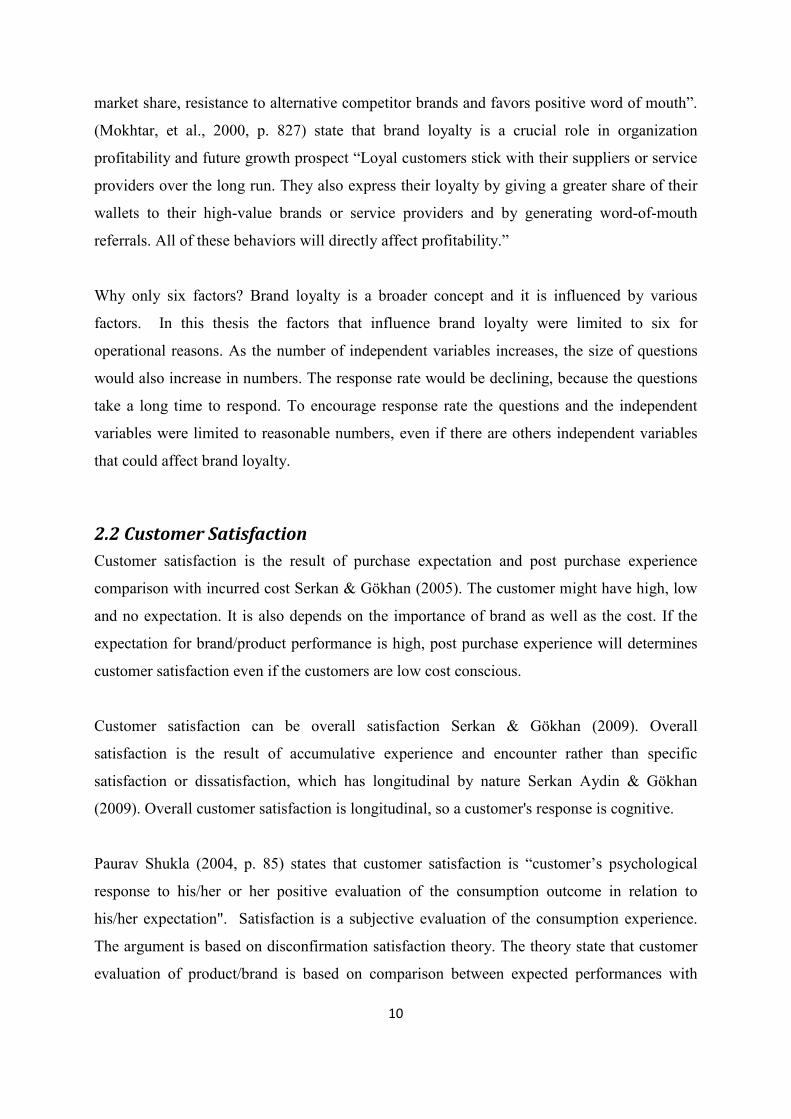
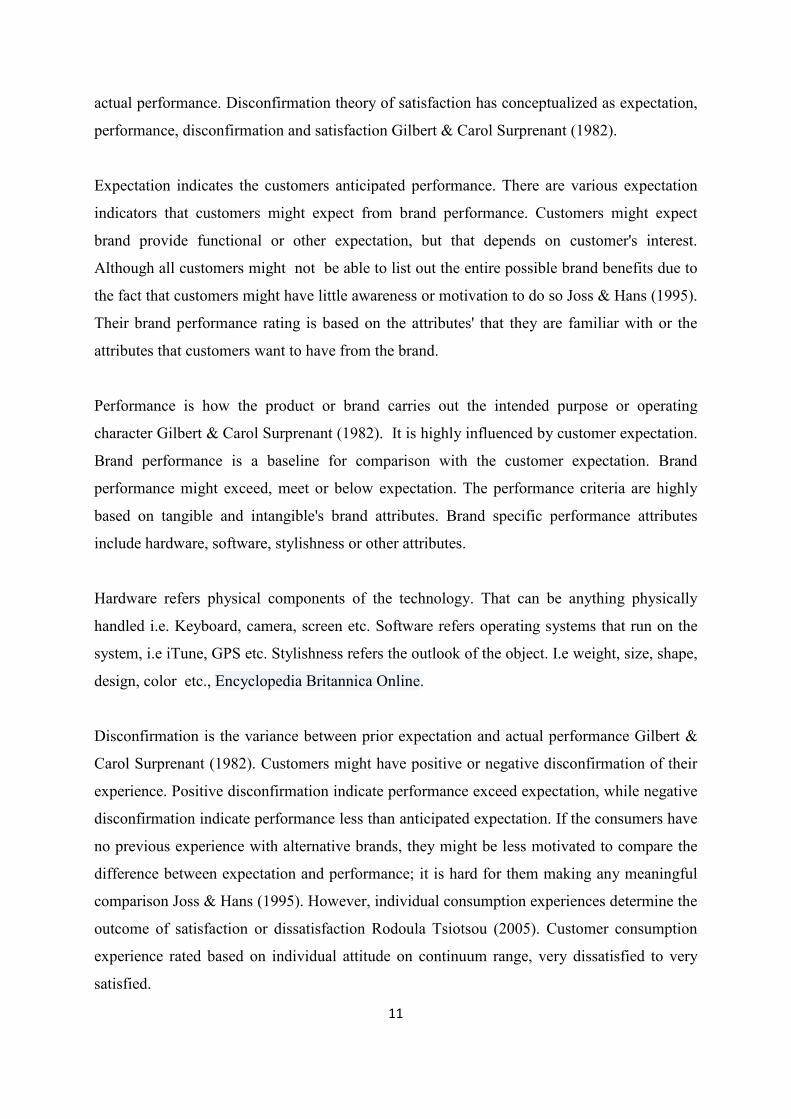
3. Methodology Quantitative method is used to meet the purpose of this study, estimate the quantitative effect
of the causal variables upon the variable that they influence. Brand loyalty is the dependant
variable, which is influenced by the independent variables. The independent variables are
customer satisfaction, brand quality, brand experience, brand image, switching costs and
customer product involvement. Dependent and independent variables have a linear
relationship. By definition linear relationship is the proportional increase/decrease in
independent variability will proportional increase /decrease dependent variables.
19
Dependant variable
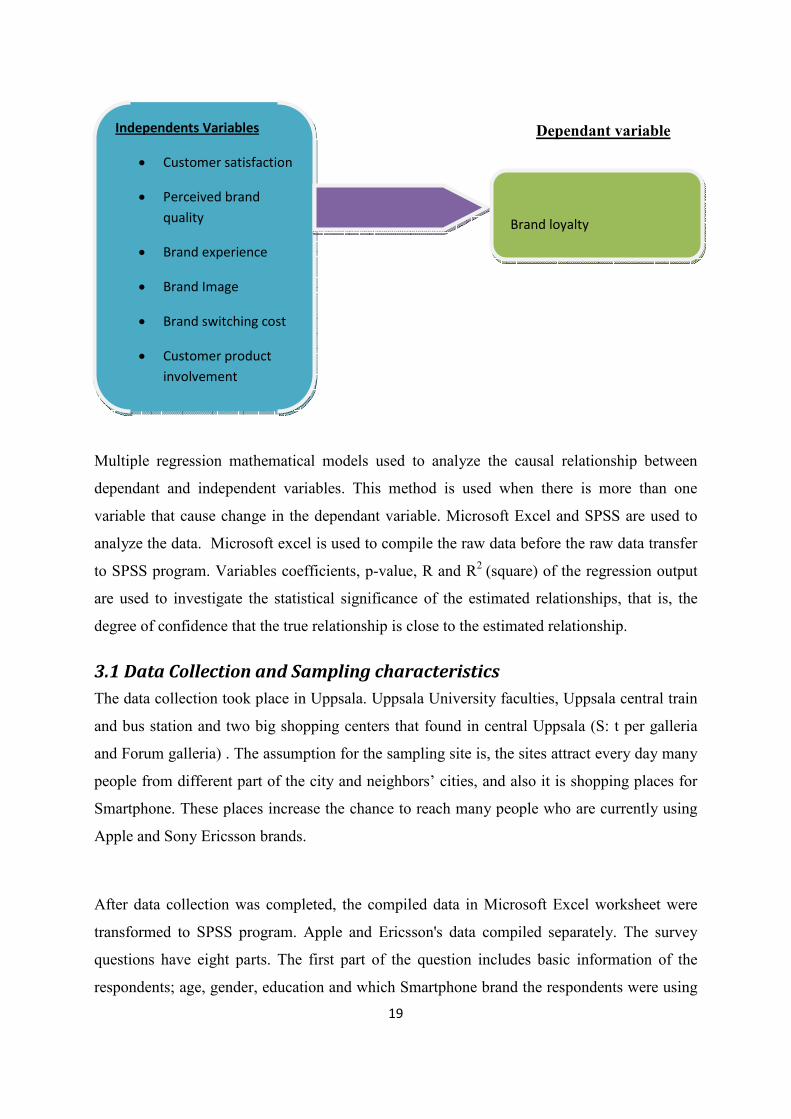
Multiple regression mathematical models used to analyze the causal relationship between
dependant and independent variables. This method is used when there is more than one
variable that cause change in the dependant variable. Microsoft Excel and SPSS are used to
analyze the data. Microsoft excel is used to compile the raw data before the raw data transfer
to SPSS program. Variables coefficients, p-value, R and R2 (square) of the regression output
are used to investigate the statistical significance of the estimated relationships, that is, the
degree of confidence that the true relationship is close to the estimated relationship.
3.1 Data Collection and Sampling characteristics The data collection took place in Uppsala. Uppsala University faculties, Uppsala central train
and bus station and two big shopping centers that found in central Uppsala (S: t per galleria
and Forum galleria) . The assumption for the sampling site is, the sites attract every day many
people from different part of the city and neighbors’ cities, and also it is shopping places for
Smartphone. These places increase the chance to reach many people who are currently using
Apple and Sony Ericsson brands.
After data collection was completed, the compiled data in Microsoft Excel worksheet were
transformed to SPSS program. Apple and Ericsson's data compiled separately. The survey
questions have eight parts. The first part of the question includes basic information of the
respondents; age, gender, education and which Smartphone brand the respondents were using
Independents Variables
• Customer satisfaction
• Perceived brand quality
• Brand experience
• Brand Image
• Brand switching cost
• Customer product involvement
Brand loyalty
20
at the moment. The second part of the question includes customer satisfaction; the third part
of the question includes perceived quality; the fourth part of the question includes brand
experience, the fifth part of the question includes brand image; the sixth part of the question
includes switching costs; the seventh part of the question includes customer product
involvement, and the eighth's part includes brand loyalty. The questions organized from the
independent variable to the dependant variables. There were 100 respondents for each brand;
in total 200 respondents of which 35% of respondent were men and 65% respondent was
Female. 72% of respondent were university graduates (first -degree), 17.4% of respondent
was high school graduates, 9.7% of respondent was a master’s degree graduate and 0.7% of
respondent was above the master’s degree level. The average age of the respondents was 24
years old. Sixty years was the oldest respondent and eighteen years were the youngest
respondents.
A group of people who are currently using the brand (Apple, Sony Eriksson) are the
population of this study. The age limits between 18 -60 years old. The age limits consider the
users’ income level and the inclination to new technology adoption. The users’ income refers
the amount of money that can be used for consumption and saving. In general eighteen and
above years old is most adult start work and get sustainable income. Adoption of
technological product refers consumer’s attraction to the product. When people get old, they
are not usually attracted to products that have complex setting. Mary & Zeithaml (1985) state
that the older the consumers, the more negative view of technology. According to them sixty
five and above years old consumers are less inclined to adopt new technology. However, Ali
Quazi (2011) states that older people above fifty years use their innovation skills significantly
less than those ages under fifty. Ali Quazi (2011, p. 36) states that “Older people are less
interested in adopting a technological innovation as they experience higher levels of anxiety
in using a new technology.” Sixty years age considered the upper limit for this thesis.
The questions for thesis were reached to respondent on their presence and asked with
alternative choices. Each question has a seven-point Likert scale (one being ‘highly disagreed’
and seven being ‘highly agrees ’). The questions were tested on a small number of
respondents before administer into large scale. The respondents were five Uppsala University
students and three sales women working in a cosmetics shop in Central Uppsala. The sales
women involvement in preliminary survey was a random choice. They were willing to
21
participate in the survey questions. They were between 24 -28 years old. Some questions
were further modified to accommodate the respondents' understanding. Couples of questions
were removed from final research questions after respondents’ suggestion. Respondents said
questioners not capture the real importance of Smartphone description. The following
questions were removed after preliminary survey:
*I think that this brand gives me an image of someone important
*This brand changes my image in other people’s eyes
*This brand reflects my success in life
*I think this brand can relate to the pleasant experience
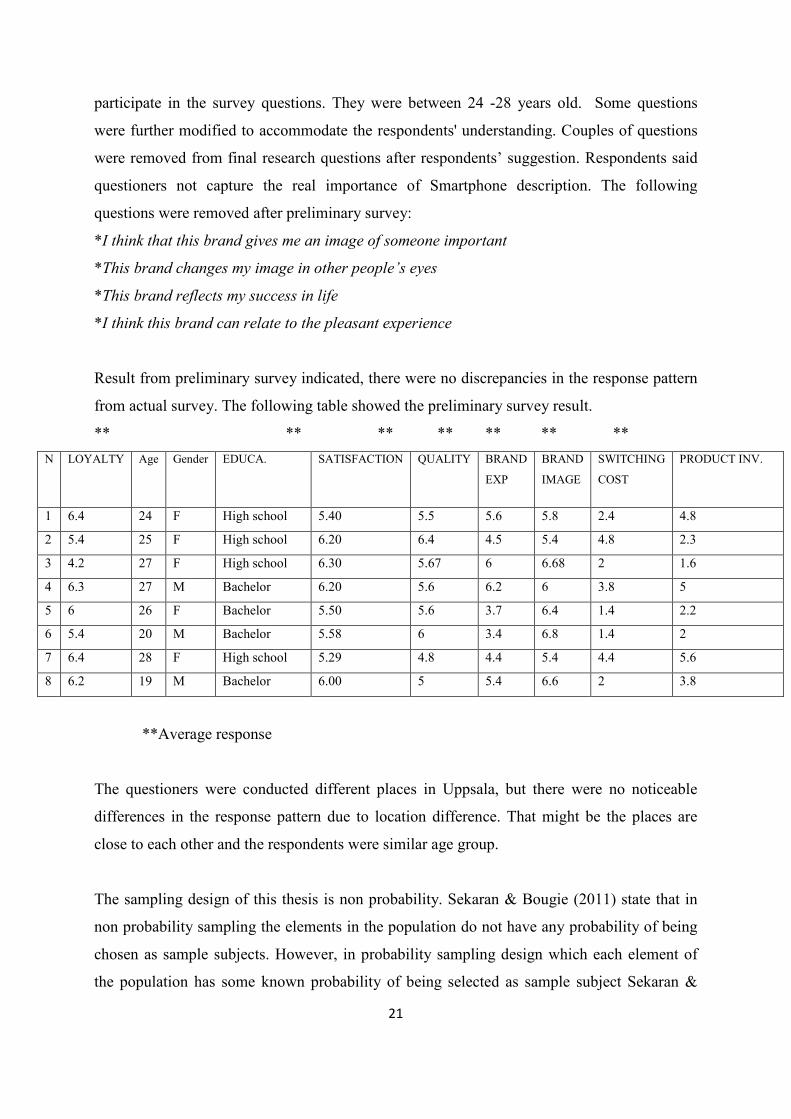
Result from preliminary survey indicated, there were no discrepancies in the response pattern
from actual survey. The following table showed the preliminary survey result.
** ** ** ** ** ** **
N LOYALTY Age Gender EDUCA. SATISFACTION QUALITY BRAND
EXP
BRAND
IMAGE
SWITCHING
COST
PRODUCT INV.
1 6.4 24 F High school 5.40 5.5 5.6 5.8 2.4 4.8
2 5.4 25 F High school 6.20 6.4 4.5 5.4 4.8 2.3
3 4.2 27 F High school 6.30 5.67 6 6.68 2 1.6
4 6.3 27 M Bachelor 6.20 5.6 6.2 6 3.8 5
5 6 26 F Bachelor 5.50 5.6 3.7 6.4 1.4 2.2
6 5.4 20 M Bachelor 5.58 6 3.4 6.8 1.4 2
7 6.4 28 F High school 5.29 4.8 4.4 5.4 4.4 5.6
8 6.2 19 M Bachelor 6.00 5 5.4 6.6 2 3.8
**Average response
The questioners were conducted different places in Uppsala, but there were no noticeable
differences in the response pattern due to location difference. That might be the places are
close to each other and the respondents were similar age group.
The sampling design of this thesis is non probability. Sekaran & Bougie (2011) state that in
non probability sampling the elements in the population do not have any probability of being
chosen as sample subjects. However, in probability sampling design which each element of
the population has some known probability of being selected as sample subject Sekaran &
22
Bougie (2011). Convenience sampling is one of non probability sampling designs.
Convenience sampling refers to the procedure of collection of information from members of
the population, who are most conveniently available to provide Willam Zikmund (2000). Why
this method? Because it was hard to convince Smartphone sellers in Uppsala city to access
their customer database to carry out probability sampling. The possibilities of their database
access were restricted due to confidentiality.
Advantage of convenience sampling;
• Convenient and economical
• Large number of questioners collected quickly and economically
• It would be ground for future exploratory research based on probability sampling
Disadvantage of convenience sampling
• It is inappropriate generalizing the result beyond the specific sample group
3.2 Measurement In measuring the given independent variables some dimension measurements and scales were
adopted from previous research work that already passed requirements for validity and
reliability.
Validity: - It refers a characteristic of measurement. Do a test measures what the researcher
intended to measure and how well a measure is an indicator of specific traits Cooper &
Schindloer (2011).
Reliability: - It refers the measurement stability over time, the measurement instrument will
produce the same result each time with the assumption that the measured item under
consideration is not changed Willam Zikmund (2000).
3.2.1 Brand Loyalty To measure brand loyalty seven scales measurement is adopted from Serkan & Gökhan
(2005). Dimensional measurements adopt from Dick & Bastu (1994). The questions which
included in this part is adopted from previous research with slight modification aimed at
capturing the core essence of loyalty from this thesis perspective; attitudinal and future
purchasing tendency of customers, which are also the main theme of Dick & Bastu (1994)
research work. The questions included under this part:
23
• I will buy an X brand in the future even if competitive brands offer cheaper prices
• I recommend brand X to my friends and family
• I consider myself loyal to brand X
• Brand X is my first choice among Smartphone brand
• I have a favorable attitude towards brand X
3.2.2 Customer Satisfaction For measuring customer satisfaction, seven scale measurements strongly dissatisfied (one)
and strongly satisfied (seven) is adapted from Gilbert & Carol Surprenant (1982) & Rodoula
Tsiotsou (2005). Various researchers have used different dimension to measurement customer
satisfaction. Rodoula Tsiotsou (2005) used three dimensional measurements for sport shoes,
Gilbert & Carol Surprenant (1982) used seven dimensional measurements for video disc
players, but in this thesis seven dimensional measurements were used. The questions that
included under satisfaction are adopted from previous research and some modification with
the aim of capturing the essence of satisfaction from this thesis perspective. Customer
expectation, brand performance, disconfirmation and overall satisfaction are the core area of
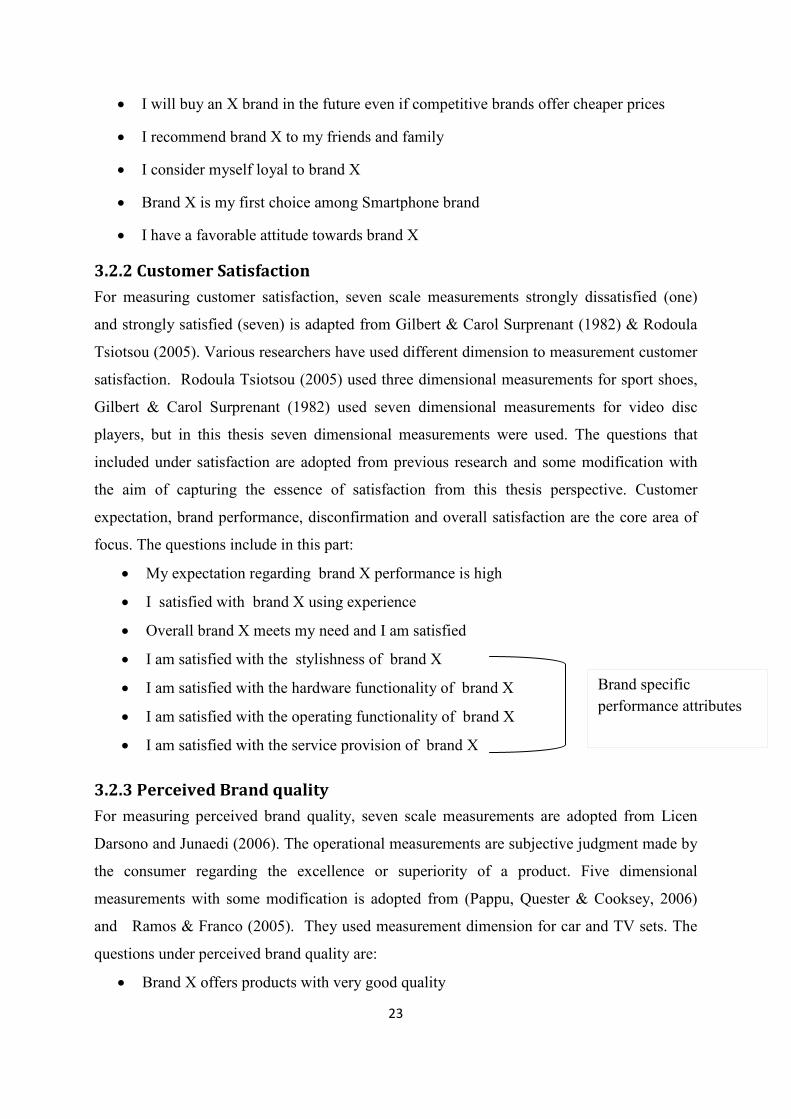
focus. The questions include in this part:
• My expectation regarding brand X performance is high
• I satisfied with brand X using experience
• Overall brand X meets my need and I am satisfied
• I am satisfied with the stylishness of brand X
• I am satisfied with the hardware functionality of brand X
• I am satisfied with the operating functionality of brand X
• I am satisfied with the service provision of brand X
3.2.3 Perceived Brand quality For measuring perceived brand quality, seven scale measurements are adopted from Licen
Darsono and Junaedi (2006). The operational measurements are subjective judgment made by
the consumer regarding the excellence or superiority of a product. Five dimensional
measurements with some modification is adopted from (Pappu, Quester & Cooksey, 2006)
and Ramos & Franco (2005). They used measurement dimension for car and TV sets. The
questions under perceived brand quality are:
• Brand X offers products with very good quality
Brand specific performance attributes
24
• Brand X offers products with consistent quality
• Brand X offers very durable products
• Brand X offers very reliable products
• Brand X offer products with excellent features
3.2.4 Brand experience For measuring brand experience five-point Likert scales with anchors strongly disagree (one)
and strongly agree (five), is adopted from (Azize, Cemal and Hakan Kitapc, 2011) and
(Brakus, Schmitt & Zarantonello, 2009). The former authors used to measure automobile
experience and the later authors used to measure Apple/iPod experience. The operational
measurements are sensations, feelings, cognition, and behavioral responses of customers to
the brand. It is reasonable enough to get a consistent scale measurement across the variable.
The scale is adjusted to 7. The questions under brand experience included are adopted from
previous research with slight modifications. It’s aimed at capturing the essence of customer's
brand experience from this thesis perspective.
• Using brand X crate positive feelings and sentiments
• I find brand X interesting in a sensory way
• Brand X increase desire to learn new thing and problem solving
• I feel brand X products go with my way of life
• Because of brand X, I feel I am part of a smart community
3.2.5 Brand Image. For measuring brand image a five-Likert scales ranging from one (completely
disagree/completely unimportant) to five (completely agree/very important) is adopted from
(Salciuviene, Mockaitis and De Mattos, 2009). They used to measure cell phone brand image
from different cultural perspectives. The operational measurements are perceptions’ attribute
benefits and symbolic attributes benefits’. The measurement scale adjusts to 7. The questions
under brand image include:
• I think brand X is well- known and prestigious
• I think brand X has a reputation for high quality
• I think brand X is fashionable and elegant
• I think brand X is number one among Smartphone brands
• The organization manufacturing brand X is trustworthy
25
3.2.6 Brand switching costs For measuring perceived switching cost, a seven (7) scale measurement is adapted from
(Aydin Özer and Arsil, 2005). The operational measures are perceived economic costs,
learning costs, searching costs, social and physiological risk was adopted from Paurav Shukla
(2004). He used dimensional measurement for brand switching cost on Vehicles, TV, Soap,
Hair oil and Ice cream. The questioners under brand switching costs include:
• I think it is not worth spending money on brand X
• I am afraid that my choice of brand X may reduce the esteem that I have among my
families and friends
• I am afraid that if I change brand X to another brand I will lose important files that I
have on it
• I am afraid that if I want to change brand X to another brand in the future I cannot
afford the time to get the information and fully evaluate alternative brand
• I am afraid that it needs effort and time to learn new features and setting of brand X
3.2.7 Customer product involvement For measuring customer product involvement five points like scale response format (fully
agree- fully disagree) and five dimensions measurements are adopted from Laurent and
Kapferer (1985). Measurement dimension is adopted from Pascale and AI Lin Lim (2003).
They used to measure sport shoes & ballpoint pens. The operational measurements are
product importance, risk importance, risk probability, pleasure and sign. The measurement
scale adjusts to 7. The questioners under product involvement include:
• Brand X personally very important to me
• Brand X says a lot about who I am
• I should be annoyed with myself, if it turned out I had made the wrong choice when
buy brand X
• When I buy brand X I can never be quite sure it was the right choice or not
• Whenever I buy brand X it is like giving myself a present
4. Result and analysis Before proceeding to regression analysis, data clearing and statistical test were done. SPSS
used in data clearing. The collected data passed through the following test; normality,
multicollinearity, reliability and validity.
26
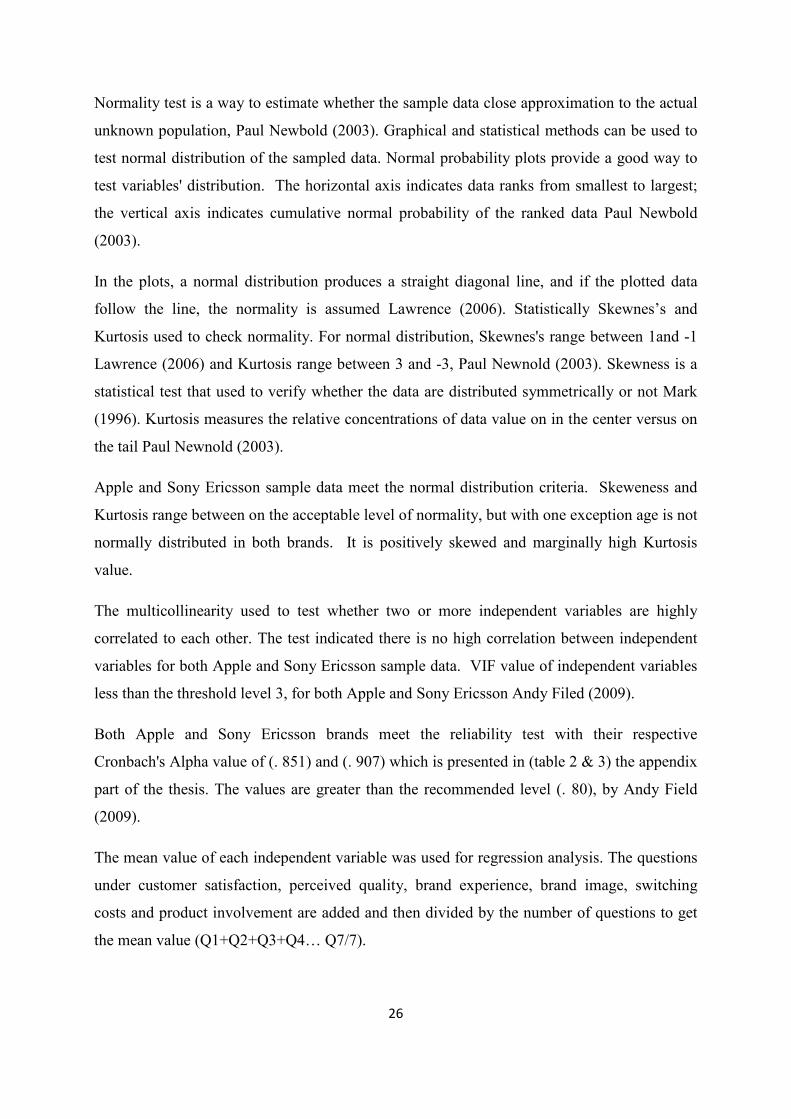
Normality test is a way to estimate whether the sample data close approximation to the actual
unknown population, Paul Newbold (2003). Graphical and statistical methods can be used to
test normal distribution of the sampled data. Normal probability plots provide a good way to
test variables' distribution. The horizontal axis indicates data ranks from smallest to largest;
the vertical axis indicates cumulative normal probability of the ranked data Paul Newbold
(2003).
In the plots, a normal distribution produces a straight diagonal line, and if the plotted data
follow the line, the normality is assumed Lawrence (2006). Statistically Skewnes’s and
Kurtosis used to check normality. For normal distribution, Skewnes's range between 1and -1
Lawrence (2006) and Kurtosis range between 3 and -3, Paul Newnold (2003). Skewness is a
statistical test that used to verify whether the data are distributed symmetrically or not Mark
(1996). Kurtosis measures the relative concentrations of data value on in the center versus on
the tail Paul Newnold (2003).
Apple and Sony Ericsson sample data meet the normal distribution criteria. Skeweness and
Kurtosis range between on the acceptable level of normality, but with one exception age is not
normally distributed in both brands. It is positively skewed and marginally high Kurtosis
value.
The multicollinearity used to test whether two or more independent variables are highly
correlated to each other. The test indicated there is no high correlation between independent
variables for both Apple and Sony Ericsson sample data. VIF value of independent variables
less than the threshold level 3, for both Apple and Sony Ericsson Andy Filed (2009).
Both Apple and Sony Ericsson brands meet the reliability test with their respective
Cronbach's Alpha value of (. 851) and (. 907) which is presented in (table 2 & 3) the appendix
part of the thesis. The values are greater than the recommended level (. 80), by Andy Field
(2009).
The mean value of each independent variable was used for regression analysis. The questions
under customer satisfaction, perceived quality, brand experience, brand image, switching
costs and product involvement are added and then divided by the number of questions to get
the mean value (Q1+Q2+Q3+Q4… Q7/7).
27
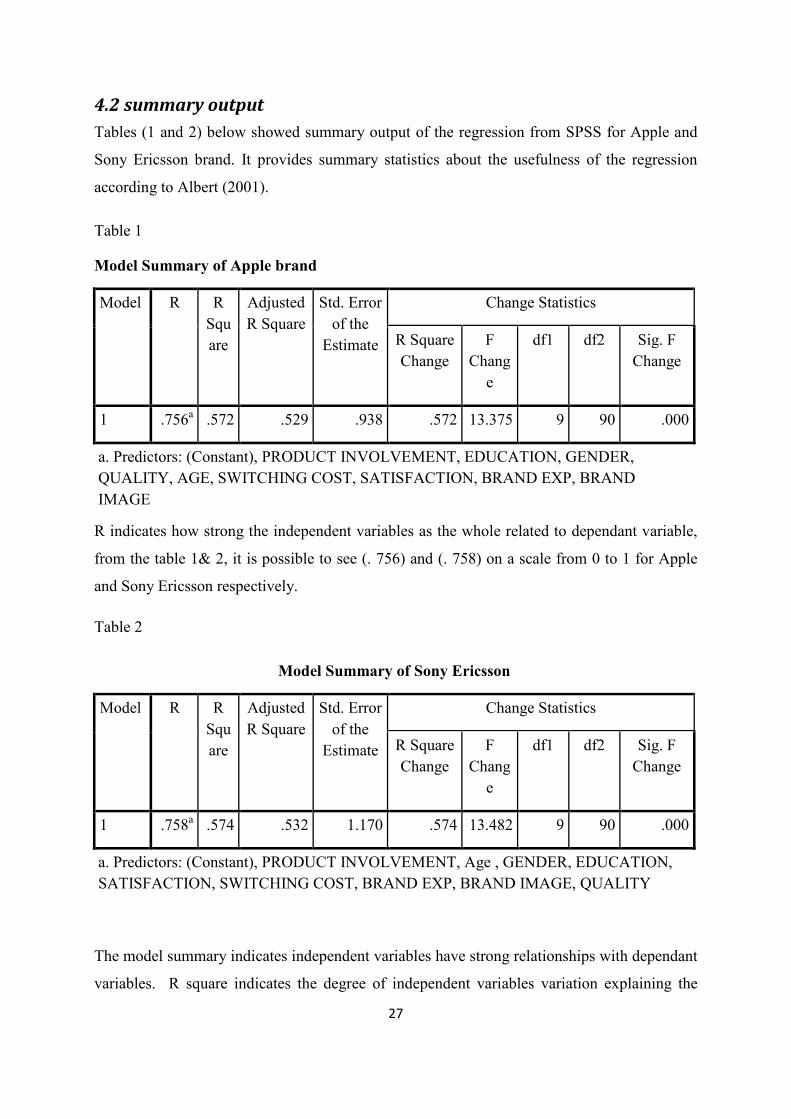
4.2 summary output Tables (1 and 2) below showed summary output of the regression from SPSS for Apple and
Sony Ericsson brand. It provides summary statistics about the usefulness of the regression
according to Albert (2001).
Table 1
Model Summary of Apple brand
Model R R Square
Adjusted R Square
Std. Error of the Estimate
Change Statistics
R Square Change
F Change
df1 df2 Sig. F Change
1 .756a .572 .529 .938 .572 13.375 9 90 .000
a. Predictors: (Constant), PRODUCT INVOLVEMENT, EDUCATION, GENDER, QUALITY, AGE, SWITCHING COST, SATISFACTION, BRAND EXP, BRAND IMAGE
R indicates how strong the independent variables as the whole related to dependant variable,
from the table 1& 2, it is possible to see (. 756) and (. 758) on a scale from 0 to 1 for Apple
and Sony Ericsson respectively.
Table 2
Model Summary of Sony Ericsson
Model R R Square
Adjusted R Square
Std. Error of the Estimate
Change Statistics
R Square Change
F Change
df1 df2 Sig. F Change
1 .758a .574 .532 1.170 .574 13.482 9 90 .000
a. Predictors: (Constant), PRODUCT INVOLVEMENT, Age , GENDER, EDUCATION, SATISFACTION, SWITCHING COST, BRAND EXP, BRAND IMAGE, QUALITY
The model summary indicates independent variables have strong relationships with dependant
variables. R square indicates the degree of independent variables variation explaining the
28
dependant variable Albert (2001). A 57.2 % change of the dependant variables (brand loyalty)
on Apple brand explained by independent variables all taken together. A 42.8 % change in the
dependant variable on Apple brand explained by other variables, which have not been
included in this regression model. A 57.4 % change in the dependant variable (brand loyalty)
on Sony Ericsson explained by independent variables all taken together. A 42.6 % change of
dependant variables on Sony Ericsson's explained by other variables, which have not been
included in this regression model.
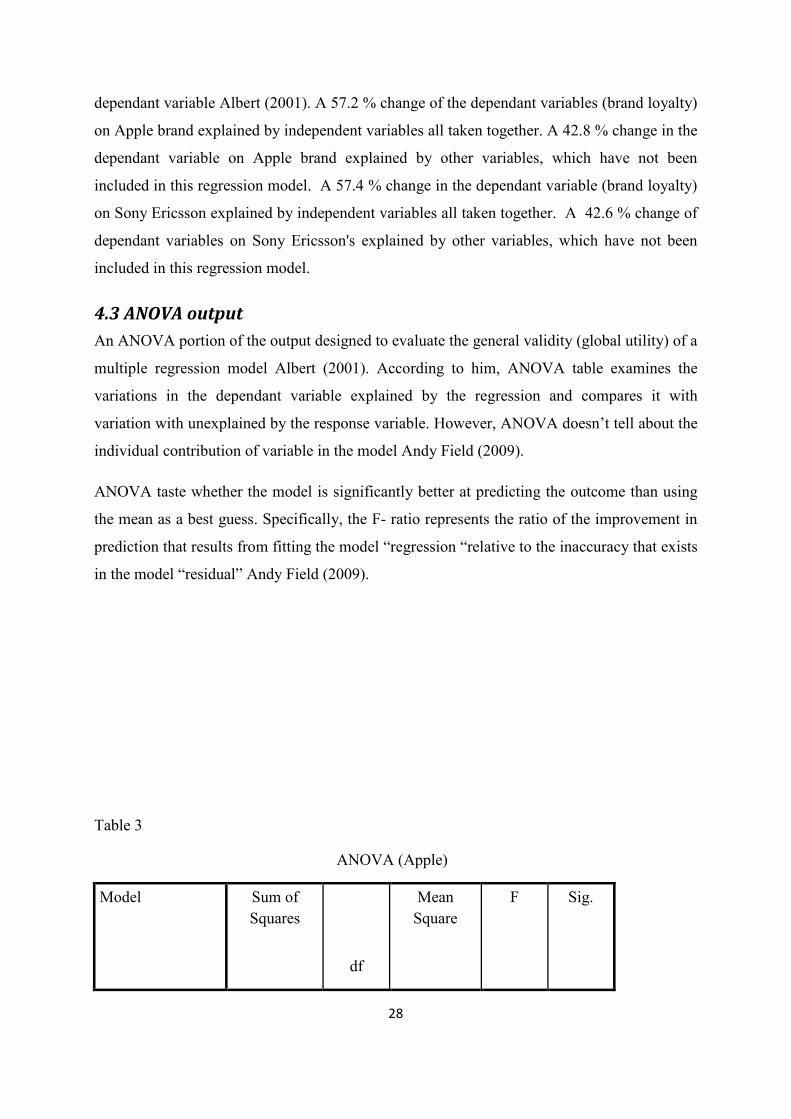
4.3 ANOVA output An ANOVA portion of the output designed to evaluate the general validity (global utility) of a
multiple regression model Albert (2001). According to him, ANOVA table examines the
variations in the dependant variable explained by the regression and compares it with
variation with unexplained by the response variable. However, ANOVA doesn’t tell about the
individual contribution of variable in the model Andy Field (2009).
ANOVA taste whether the model is significantly better at predicting the outcome than using
the mean as a best guess. Specifically, the F- ratio represents the ratio of the improvement in
prediction that results from fitting the model “regression “relative to the inaccuracy that exists
in the model “residual” Andy Field (2009).
Table 3
ANOVA (Apple)
Model Sum of Squares
df
Mean Square
F Sig.
29
1
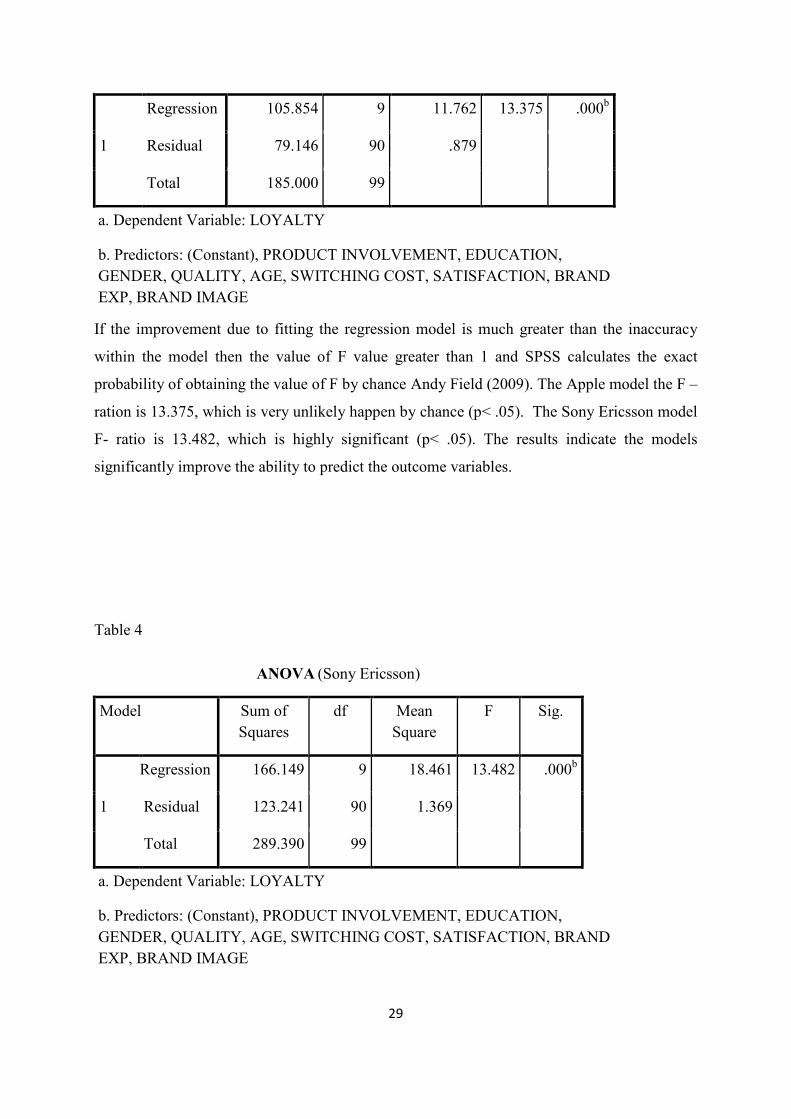
Regression 105.854 9 11.762 13.375 .000b
Residual 79.146 90 .879
Total 185.000 99
a. Dependent Variable: LOYALTY
b. Predictors: (Constant), PRODUCT INVOLVEMENT, EDUCATION, GENDER, QUALITY, AGE, SWITCHING COST, SATISFACTION, BRAND EXP, BRAND IMAGE
If the improvement due to fitting the regression model is much greater than the inaccuracy
within the model then the value of F value greater than 1 and SPSS calculates the exact
probability of obtaining the value of F by chance Andy Field (2009). The Apple model the F –
ration is 13.375, which is very unlikely happen by chance (p< .05). The Sony Ericsson model
F- ratio is 13.482, which is highly significant (p< .05). The results indicate the models
significantly improve the ability to predict the outcome variables.
Table 4
ANOVA (Sony Ericsson)
Model Sum of Squares
df Mean Square
F Sig.
1
Regression 166.149 9 18.461 13.482 .000b
Residual 123.241 90 1.369
Total 289.390 99
a. Dependent Variable: LOYALTY
b. Predictors: (Constant), PRODUCT INVOLVEMENT, EDUCATION, GENDER, QUALITY, AGE, SWITCHING COST, SATISFACTION, BRAND EXP, BRAND IMAGE
30
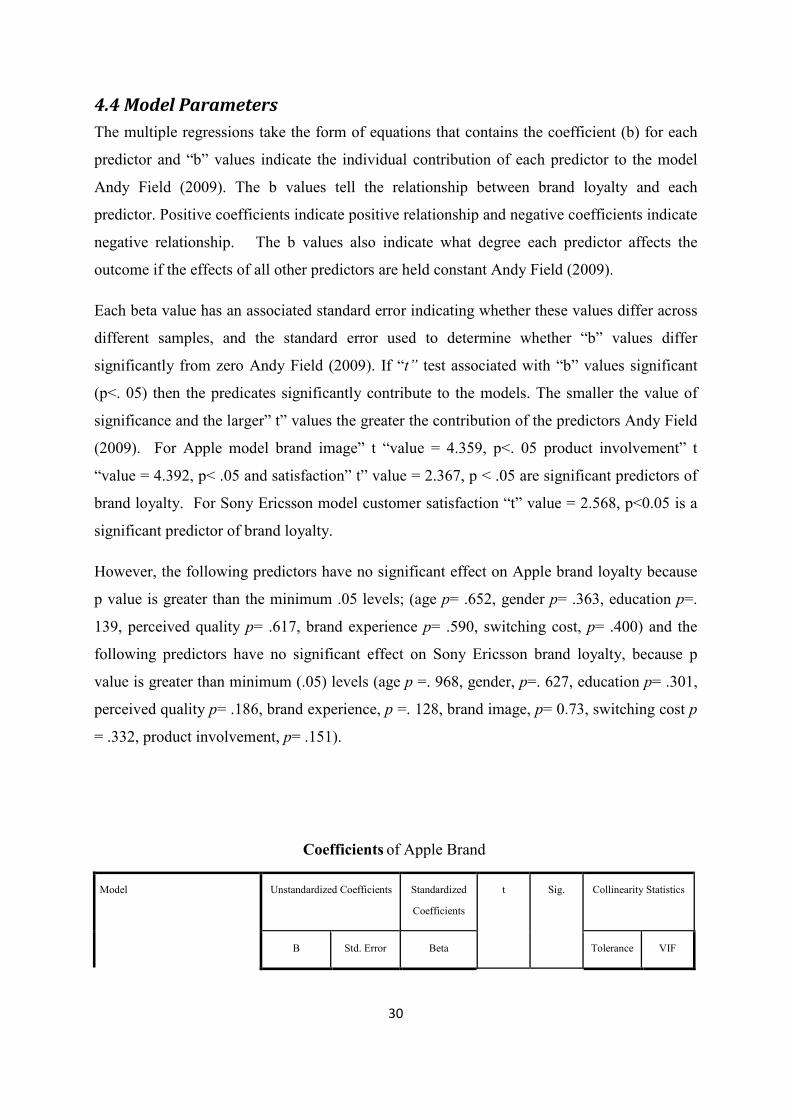
4.4 Model Parameters The multiple regressions take the form of equations that contains the coefficient (b) for each
predictor and “b” values indicate the individual contribution of each predictor to the model
Andy Field (2009). The b values tell the relationship between brand loyalty and each
predictor. Positive coefficients indicate positive relationship and negative coefficients indicate
negative relationship. The b values also indicate what degree each predictor affects the
outcome if the effects of all other predictors are held constant Andy Field (2009).
Each beta value has an associated standard error indicating whether these values differ across
different samples, and the standard error used to determine whether “b” values differ
significantly from zero Andy Field (2009). If “t” test associated with “b” values significant
(p<. 05) then the predicates significantly contribute to the models. The smaller the value of
significance and the larger” t” values the greater the contribution of the predictors Andy Field
(2009). For Apple model brand image” t “value = 4.359, p<. 05 product involvement” t
“value = 4.392, p< .05 and satisfaction” t” value = 2.367, p < .05 are significant predictors of
brand loyalty. For Sony Ericsson model customer satisfaction “t” value = 2.568, p<0.05 is a
significant predictor of brand loyalty.
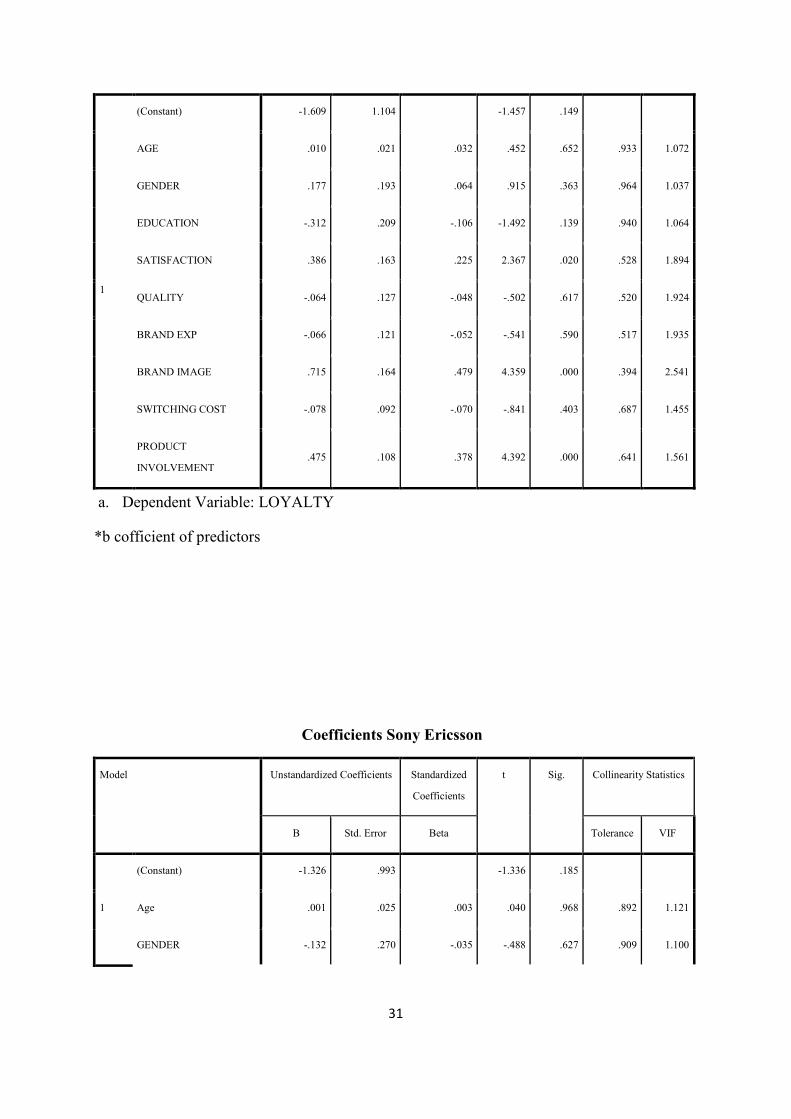
However, the following predictors have no significant effect on Apple brand loyalty because
p value is greater than the minimum .05 levels; (age p= .652, gender p= .363, education p=.
139, perceived quality p= .617, brand experience p= .590, switching cost, p= .400) and the
following predictors have no significant effect on Sony Ericsson brand loyalty, because p
value is greater than minimum (.05) levels (age p =. 968, gender, p=. 627, education p= .301,
perceived quality p= .186, brand experience, p =. 128, brand image, p= 0.73, switching cost p
= .332, product involvement, p= .151).
Coefficients of Apple Brand
Model Unstandardized Coefficients Standardized
Coefficients
t Sig. Collinearity Statistics
B Std. Error Beta Tolerance VIF
31
1
(Constant) -1.609 1.104
-1.457 .149
AGE .010 .021 .032 .452 .652 .933 1.072
GENDER .177 .193 .064 .915 .363 .964 1.037
EDUCATION -.312 .209 -.106 -1.492 .139 .940 1.064
SATISFACTION .386 .163 .225 2.367 .020 .528 1.894
QUALITY -.064 .127 -.048 -.502 .617 .520 1.924
BRAND EXP -.066 .121 -.052 -.541 .590 .517 1.935
BRAND IMAGE .715 .164 .479 4.359 .000 .394 2.541
SWITCHING COST -.078 .092 -.070 -.841 .403 .687 1.455
PRODUCT
INVOLVEMENT .475 .108 .378 4.392 .000 .641 1.561
a. Dependent Variable: LOYALTY
*b cofficient of predictors
Coefficients Sony Ericsson
Model Unstandardized Coefficients Standardized
Coefficients
t Sig. Collinearity Statistics
B Std. Error Beta Tolerance VIF
1
(Constant) -1.326 .993
-1.336 .185
Age .001 .025 .003 .040 .968 .892 1.121
GENDER -.132 .270 -.035 -.488 .627 .909 1.100
32
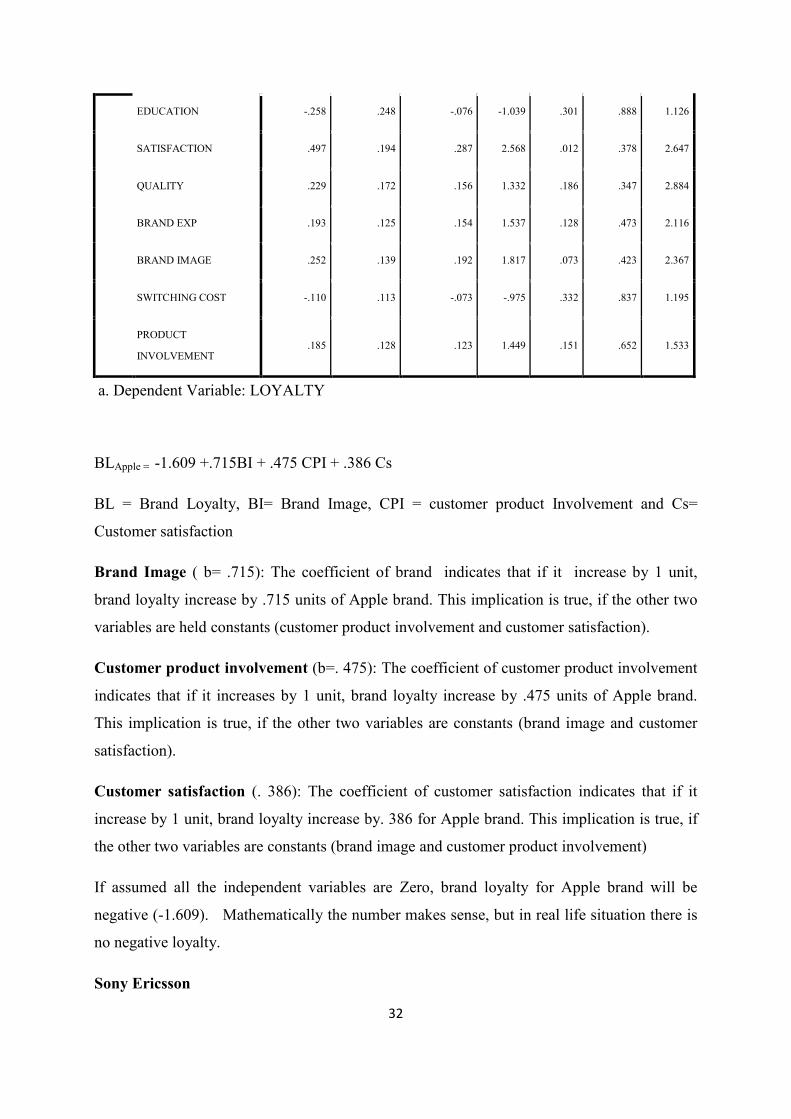
EDUCATION -.258 .248 -.076 -1.039 .301 .888 1.126
SATISFACTION .497 .194 .287 2.568 .012 .378 2.647
QUALITY .229 .172 .156 1.332 .186 .347 2.884
BRAND EXP .193 .125 .154 1.537 .128 .473 2.116
BRAND IMAGE .252 .139 .192 1.817 .073 .423 2.367
SWITCHING COST -.110 .113 -.073 -.975 .332 .837 1.195
PRODUCT
INVOLVEMENT .185 .128 .123 1.449 .151 .652 1.533
a. Dependent Variable: LOYALTY
BLApple = -1.609 +.715BI + .475 CPI + .386 Cs
BL = Brand Loyalty, BI= Brand Image, CPI = customer product Involvement and Cs=
Customer satisfaction
Brand Image ( b= .715): The coefficient of brand indicates that if it increase by 1 unit,
brand loyalty increase by .715 units of Apple brand. This implication is true, if the other two
variables are held constants (customer product involvement and customer satisfaction).
Customer product involvement (b=. 475): The coefficient of customer product involvement
indicates that if it increases by 1 unit, brand loyalty increase by .475 units of Apple brand.
This implication is true, if the other two variables are constants (brand image and customer
satisfaction).
Customer satisfaction (. 386): The coefficient of customer satisfaction indicates that if it
increase by 1 unit, brand loyalty increase by. 386 for Apple brand. This implication is true, if
the other two variables are constants (brand image and customer product involvement)
If assumed all the independent variables are Zero, brand loyalty for Apple brand will be
negative (-1.609). Mathematically the number makes sense, but in real life situation there is
no negative loyalty.
Sony Ericsson
33
BL Sony Ericsson = - 1.326 + .497 Cs
Customer satisfaction (. 497): The coefficient of customer satisfaction indicates that if it
increases by one unit, brand loyalty increase by. 497 for Sony Ericsson brand. The negative
constant number does not add up any practical meaning, because there is no negative loyalty.
5. Discussion The regression analysis confirms the following independent variables are significant and
influencing brand loyalty in Apple brand; customer satisfaction, brand image and customer
product involvement. Customer satisfaction is the only independent variable that influence
brand loyalty for the Sony Ericsson brand. However, perceived product quality, brand
experience, age, gender and education have no significant effect and influencing brand loyalty
on both brands.
Regression analysis provided sufficient evidence that customer satisfaction is among the
factor that determines Apple brand and Sony Ericsson brand loyalty, which is in line with the
argument of Youl & John (2010). The satisfied customer will buy the same brand in the future
and patronized the brand. In addition, they will develop a positive attitude and feeling because
it is hard to conceptualize dissatisfied customers will have a positive attitude towards the
brands. Satisfaction is the combination of cognitive response to consumption (using)
experience that is stated by Gilbert & Carol Surprenant (1982). A customer using experience
is the important element of customer satisfaction. It is the result of a brand specific attribute
that customers easily identify. Brand specific attributes include hardware functionality,
operating system and network connectivity. That is a basic criteria customer’s compare brand
performance with their expectation. The following branch mark used by most customers to
evaluate brand performance, how well the touch screen of Smartphone works? How well the
Smartphone brand good at taking nice pictures? How well the Smartphone brand video
recording quality? How well the operating system is friendly? How many free download apps
available? How well the network function and processing speed? A brand that has a good
performance rating on brand attribute can ignite customer satisfactions.
Customers’ satisfaction based on physical attributes and aesthetic has got some critics from
researchers. Joss & Hans (1995) state that most customers might not be able to list out the
possible brand attributes and they might not be familiar enough with all the potential benefits
brand could offer. Their satisfaction assessment based on limited attribute that customer
34
familiar with. There are possibilities for customers can express their satisfaction and
dissatisfaction perception of limited brand attribute rather than compressive brand attribute.
That is because all customers might not give equal value to all brand attributes, it might
happen to be satisfied /dissatisfied on limited brand attribute that can dictate the whole
satisfaction evaluation.
Satisfaction is based on individual customer assessment rather than some objective
benchmark, so there would be no objective brand performance rating between Apple and
Sony Ericsson brand users; rather it is a subjective individual customer’s psychological
response to consumption experience, which goes to the previous argument stated by Paurav
Shukla (2004).
Apple and Sony Ericsson brand users have positive disconfirmation with their brands.
Positive disconformities are discrepancies between prior expectation and actual performance.
If the customers got higher service's benefits as compare to the expectation, they will develop
a positive attitude toward a brand the argument the previous study of Gilbert & Carol
Surprenant (1982).
Apple and Sony Ericsson brand users are satisfied with their brand hardware, operating
system, service provisions and stylishness. However, it is hard to compare which brand users
are more satisfied on their brand because it needed further factor loading analysis on
satisfaction construct. Customer satisfaction is among the factors that affect brand loyalty in a
Smartphone. Customers who are satisfied with their brand might have high probability remain
to use the brand in the future compare to customers who are dissatisfied; they are willing to
search alternative brand information.
Brand image is the most determinate factor on brand loyalty. Apple brand has a higher brand
image in the consumer mind. Apple brand users associate their brands with prestigious, high
quality, fashionable, elegant, trustworthy and number-one among Smartphone brands.
Intangible brand attributes are main constitutes of brand image and Apple brand users feel
they are using brands that have high acceptance in Smartphone brand users. They connect the
brand with higher symbolic associations, which goes with previous research argument
(Salciuviene, Ghauri and De Mattos, 2009). Intangible's brand attributes offered higher self-
image and status benefits. Symbolic association of Apple brand increases individual self
image and status. That might be the case, Apple brand users in some extent think they have a
35
marginally higher status than customers who are using other brands. In addition they think
Apple brand has higher technical functionality with respect to other brands.
Apple brand users think the brand is unique in comparison to competitive brand. The
uniqueness of a brand has its impact on brand image, and the argument goes with (Lee. H,
Lee. C & Wu.C, 2009). Due to that fact, the customers willing to pay the premium price for
the brand. The brand users have deeply rooted positive brand image in their mind and as an
outcome they easily identify the brand, the argument goes with previous study Hyun & Kim
(2011).
A favorable Apple brand image has a positive influence on consumers’ behavior and increase
loyalty and generates positive word of mouth.
Customers are highly involved with the Apple brand. Customers think Apple brand personally
important and necessary because the brand gives them meaningful pleasure and desire, the
argument goes with Pascale and Ali Lin Lim, (2003). The essence of the Apple brand for the
users would influence the information searching, processing and decision making. Apple
brand users used the brand as a means of expressing individual and social status, which goes
with Petruzzellis (2010) argument. Apple brand is just not only providing functionality
benefits to users. It is also a means to express social status and enjoyment benefits, which
close the brand as luxuries.
Apple brand users’ conscious of the risk associated buying products with less quality that
might lead to disappointment, so they take longer time to evaluate all the available
information before they make buying decision the statement goes with Mittal and Lee (1989).
In general brand image, customer satisfaction and product involvement are the main
determinant factors on brand loyalty in Smartphone in Sweden market.
The main contribution of this thesis is using the existing knowledge on brand loyalty and
applied to Smartphone context. Most previous studies on brand loyalty have done in stable
and mature market situation. In addition, many studies have not been done on causal
antecedent factors that lead to brand loyalty in a Smartphone. Analyzing brand performance
on dynamic market condition might be one way of understanding consumers’ behaviors.
It would also make room for comparative analysis on factors that are determinate on the stable
market situation and dynamic market environment specifically on brand loyalty. In this thesis
36
it is the author argued that the market conditions for Smartphone are not stable and mature
rather dynamic. It is characterized as fast technological development, short product life and
new market actors are dominant. Conceptual understanding of the market situation can help
managers and marketing practitioners to undertake various administrative action and
marketing campaign with the main aim on increasing brand loyalty to avoid the loss of their
customers to competitive brands.
6. Conclusion Limitations and future research direction
As a concluding remark, Smartphone is not just an ordinary phone. It provides most services
previously done by computers. It is now part and parcel of consumers’ daily life. It is not a
matter of fashion rather, it is necessary. Consumers’ developed an especial connection with
the brand. Most Smartphone brand users are young and middle age group. These groups of
consumers are always looking the best quality brand, social connectivity and cheap price.
The market environment of Smartphone is dynamic and unstable due to the product short
lifecycle, fast technological development and unstable consumer behavior.
Due to the following reasons any generalization of the result would be compromised; Data in
this thesis lack normal distribution (age) (2) the sampling design is not probability, so it is not
possible to make any generalization beyond the sample group.
It is assumed that the following variables are predictors of brand loyalty; customer
satisfaction, perceived quality, brand experience, brand image, switching costs and customer
product involvement, but the following variables can also affect brand loyalty; attractiveness
of alternative brand, price and affective commitment.
In the future research, it would be good to use more sample size and even distribution across
different age groups.
37
Reference
Andy, F. 2009. Discovering Statistics using SPSS, Sage publications Ltd, 3rd edition
Allan, L., Baldinger & Joel, B., 1996. The link between attitude and behavior. Journal of
Advertising research, Volume36, Issue 6, pp. 22-34
Alain.S. 2006. Understanding the buzz that matters: negative vs positive word of mouth ,
International Journal of Market Research Volume 48, Issue 6
Albert, C., 2001. Business statistics in brief, south western college publishing
Apple Inc. 2012. Encyclopædia Britannica Online. Retrieved 12 August, 2012,
from http://www.britannica.com/EBchecked/topic/30632/Apple-Inc
38
Azize, S., Cemal, Z. and Hakan, K., 2011. The Effects of Brand Experiences, Trust and
Satisfaction on Building Brand Loyalty; an Empirical Research on Global Brands. Precede
Social and Behavioral Sciences, Volume 24, pp.1288–1301
Bennett, R., & Bove, L. 2001. Identifying the key issues for measuring loyalty. Australasian
Journal of Market Research, 9(2), pp.27–44.
Bennett, R., Härtel,C. & McColl-Kennedy,J.,2005. Experience as a moderator of involvement
and satisfaction on brand loyalty in a business-to-business setting. Industrial Marketing
Management, 34(1), pp.97–107.
Biel,A. , (1992). How brand image drives brand equity. Journal of Advertising Research,
Volume 32, No.6, pp.RC-6-RC-12
Boulding, W., Kalra, A., Staelin, R. and Zeithaml, V. (1993), “A dynamic process model of
service quality: form expectations to behavioral intentions”, Journal of Marketing Research,
Vol. 30, pp. 7-27
Bruks, M. , Zeithmal,V.& Naylar, 2000. Price and brand name as indicators of quality
Dimensions for Consumer Durable. Journal of the Academy of Marketing Science ,Volume
28, No. 3, pp.359-374
Brakus,J., Schmitt, H and Zarantonello, L. , 2009 . Brand Experience: What Is It? How is It
Measured? Does It Affect Loyalty? Journal of Marketing Volume 73, pp.52–68
Burnham, T. and Mahajan, V., 2003. Consumer switching costs: typology, antecedents, and
consequences; Journal the academy of science, Volume 32, No.2 pp.109- 126
C.-F. Chen and O. Myagmarsuren (2011). Brand equity, relationship quality, relationship
value, and customer loyalty: Evidence from the telecommunications services. Total Quality
Management Vol. 22, No. 9, September 2011, 957–974
39
Ching, Chen. and Myagmarsuren, 2011. Brand equity, relationship quality, relationship
value, and customer loyalty: Evidence from the telecommunications services. Total Quality
Management, Volume 22, No. 9, pp. 957–974
Cole, Robert, E. and Flynn, Michael , O., 2009. Automotive Quality Reputation: Hard to
achieve, Hard to lose, still harder to win back. California Management Review, Volume 52,
Issue 1, pp.67-93
Cooper, D. and Schindler,P. 2011. Business research methods, McGraw- Hill Education, 3rd
European edition
Craik, F. and Lockhart. R,1972. Levels of processing: a framework for memory research,
Journal of Verbal Learning and Verbal Behavior, Voume11, pp.671-84
Darsono, L. & Marliana, J., 2006. An examination of perceived quality, satisfaction, and
loyalty relationship applicability of comparative and non comparative evaluation.
International Journal of Business. Volume 8, No. 3, pp. 323–342
Dick,S. & Basu,C.1994. Customer loyalty: Toward an integrated conceptual framework.
Journal of the academic of marketing Science, Volume 22, No.2, pp.99-113
Ding Hooi, T. et al., 2011. Dependency on Smartphone and the impact on purchase behavior,
Young consumers. Volume 12 no. 3, pp.193-203
Feick, L., Lee, J. and Lee, J. (2001), “The impact of switching costs on the customer
satisfaction-loyalty link: mobile phone service in France”, Journal of Services Marketing,
Vol. 15 No. 1, pp. 35-48.
Gilbert , C. and Carol Surprenant, 1982. An Investigation into the determinants of customer
satisfaction. Journal of Marketing Research Volume XIX, pp.491-504
40
Gill and Dawra, 2010 . Evaluating Aaker ’ s sources of brand equity and the mediating role of brand image. Journal of Targeting, Measurement and Analysis for Marketing Volume 18, 3/4, pp.189–198 Gürbüz. E, 2008. Retail store branding in Turkey: its effect on perceived quality,
satisfaction and loyalty. Journal of Business Vol. 3 No. 3, 2008 pp. 286-304
Hill,N. and Alexander J., 2006. Handbook of customer satisfaction and loyalty measurement,
3rd edition Gower publishing limited, England
Hyun, S., Kim, S. and Wansoo, 2011. Dimensions of brand equity in the chain restaurant
industry. Cornell Hospitality Quarterly; Volume 52, Issue 4, p. 429-437
Jensen, M., and Hansen, T., 2006. An empirical examination of brand loyalty, Journal of
Product & Brand Management 15/7, pp.442–449
Jones, M.. & Suh, J. 2000. Transaction-specific satisfaction and overall satisfaction: An
empirical analysis. Journal of Service Marketing, 14(2), pp.147–159
Jones .M , Mothersbaugh .D, and Beatty .S ( 2000). Switching barriers and repurchase
intention in Services. Journal of retailing , volume 76(2) pp. 259-274
Kerin, R. et al., 1992. Store Shopping Experience and Consumer Price–Quality–Value
Perceptions. Journal of Retailing, 68 (4), pp.376–97.
Kotler, P., 1988. Marketing Management: Analysis, Planning and Control, Englewood Cliffs,
New Jersey: Practice Hall.
Krishnamurthi, L. and Rajan, S., 1991. Empirical analysis of the relationship ‘between brand
loyalty and consumer price elasticity. Marketing science, volume 10, no. 2,
Kwon, W.-S., & Lennon, S.J. (2009). What induces online loyalty? Online versus offline
brand images. Journal of Business Research, 62, 557–564.
41
Laurent, G., & Kapferer, J. N 1985. Measuring consumer involvement profiles. Journal of Marketing Research, Volume 22, pp.41-53
Lawernce, M., Glenn, G. & Guarino, A., 2006. Applied multivariate research; design and
interpretation, Sage publication, Inc
LeClerc , F and Little , J.D.C (1997), “ can advertising copy makes FSI coupons more
effective ? “ Journal marketing research, Volume 34, pp 473- 84
Lee, M.,Lee, C. and Wu, C., 2009. Brand image strategy affects brand equity after
M&A. European Journal of Marketing , Volume 45 issue ⅞
Leyland, et al., 2010. Integrating the Smartphone into a sound environmental information
systems strategy: Principles, practices and a research agenda. Journal of Strategic Information
Systems, Volume 20, pp.27–37
Luca Petruzzellis, 2010. Mobile phone choice: technology versus marketing, the brand effect
in the Italian market. European Journal of Marketing, Volume 44, No. 5,
Michael, J., David, L. and Mothersbaugh & Betty, S., 2000. Switching barriers and
repurchase intention in Service. Journal of Retailing, Volume 76, pp 259-274
Miital.B & Lee.M, 1989. A causal model of consumer involvement. Journal of Economic
Psychology Volume 10, pp.363-389
Mobile phone in Sweden, 2012.
http://www.portal.euromonitor.com.ezproxy.its.uu.se/Portal/Pages/Magazine/IndustryPage.as
px access January 18, 2012
Mokhtar, A., Amjad, D. and Al-Nasser & Husain, N. , 2000. Evaluating functional
relationship between image, customer satisfaction and customer loyalty using general
maximum entropy. Total quality management, Volume11, No. 4/5&6, pp.S826- S829
42
Olsen, S . , 2002.Comparative evaluation and the relationship between, quality satisfaction
and repurchase loyalty. Journal of marketing science, Volume 30, No 3, pp.240- 249,
Park , S.H (1996) “ Relationship between involvement and attitudinal loyalty construct in
adult fitness programs” Journal of Leisure research Volume 28, No 4 pp. 230-250
Pappu, R., Quester, P. & Cooksey, R., 2006. Consumer-based brand equity and country-of-
origin relationships. European Journal of Marketing Volume, 40 No. 5/6
Pascale, Q. and Ai Lin Lim, 2003. Product involvement/brand loyalty: is there a link?.
Journal of Product & Brand Management, Volume12, Issue: 1
Paul, N., Carlson, W, & Betty, M., 2003. Statistics for business and economics, Pearson
education
Paurav, S. , 2005. Effect of Product Usage, Satisfaction and Involvement on Brand Switching
Behavior. Asia Pacific Journal of Marketing and Logistics, Volume 16, No. 4
Ramos, A. & Franco, M., 2005. The impact of marketing communication and price promotion on brand equity, brand management, Volume 12, no. 6, pp.431–444
Riesen, R & Herndon, N. , 2011. Consumer Involvement with the Product and the Nature of
Brand Loyalty. Journal of Marketing Channels, Volume 18: pp.327–352
Rodoula Tsiotsou, 2005. Perceived Quality Levels and their Relation to Involvement, Satisfaction, and Purchase Intentions. Marketing Bulletin 16, Research Note 4
Salciuviene .L , Ghauri .P, Mockaitis.A, and De Mattos, 2009. Brand image perceptions
across cultures: a study of symbolic and functional associations Advances in International
Marketing, Volume 20, pp.177–191
Serkan,A., and Gökhan, Ö. ,2005. Customer loyalty and the effect of switching costs as a
moderator variable: A case in the Turkish mobile phone market Marketing .Intelligence &
Planning Volume 23, No. 1, pp. 89-103
43
Son, K. et al. , 2010. Resistance to Brand Switching When a Radically New Brand Is
Introduced: A Social Identity Theory Perspective .Journal of Marketing Volume 74, pp.128–
146
Santouridis, I. & Trivellas, 2010. Investigating the impact of service quality and customer
satisfaction on customer loyalty in mobile telephony in Greece. TQM Journal, Volume 22, no.
3, pp.330-343
Smart phones overtake client PCs in 2011. Online avilable
http://www.canalys.com/newsroom/smart-phones-overtake-client-pcs-2011, accessed, 14-05-
2012
Srivastava, M, & Kamdar, 2009. Brand Image Formation as a Function of Involvement and
Familiarity' and Paradigm. Institute Of Management Technology, Volume13, No.1, pp. 84-90
Steven, B. 2001. The R380s—The first smartphone from the Ericsson–Symbian partnership.
Online available
http://www.ericsson.com/ericsson/corpinfo/publications/review/2001_01/files/2001015.pdf,
January 26, 2012
The history of mobile phone: time line. The Guardian,
http://www.guardian.co.uk/technology/2012/jan/24/smartphones-timeline?INTCMP=SRCH, January
2012.
The mobile media report: state of the media Q3, 2011. Online available
http://nielsen.com/content/dam/corporate/us/en/reports-downloads/2011-Reports/state-of-
mobile-Q3-2011.pdf accessed 10/05/2012
Thiele, S., & Bennett, R., 2001. A brand for all seasons? A discussion of brand loyalty
approaches and their applicability for different markets. Journal of Product and Brand
Management, Volume 10, Issue no. 1, pp. 25-37
44
Tyler, W., 1957. The image, the brand, and the consumer. Journal of Marketing Volume 22,
pp. 162-165
Youl, H. and Joby, J. 2010. Role of customer orientation in an integrative model of brand
loyalty in services The Service Industries Journal Volume 30, No. 7, pp.1025–1046
William, G., 2000. Business research methods, Dryden press, pp. 279-283
Xun Li, et al., 2010. Smartphone Evolution and Reuse: Establishing a more Sustainable
Model. 39th International Conference on Parallel Processing Workshops
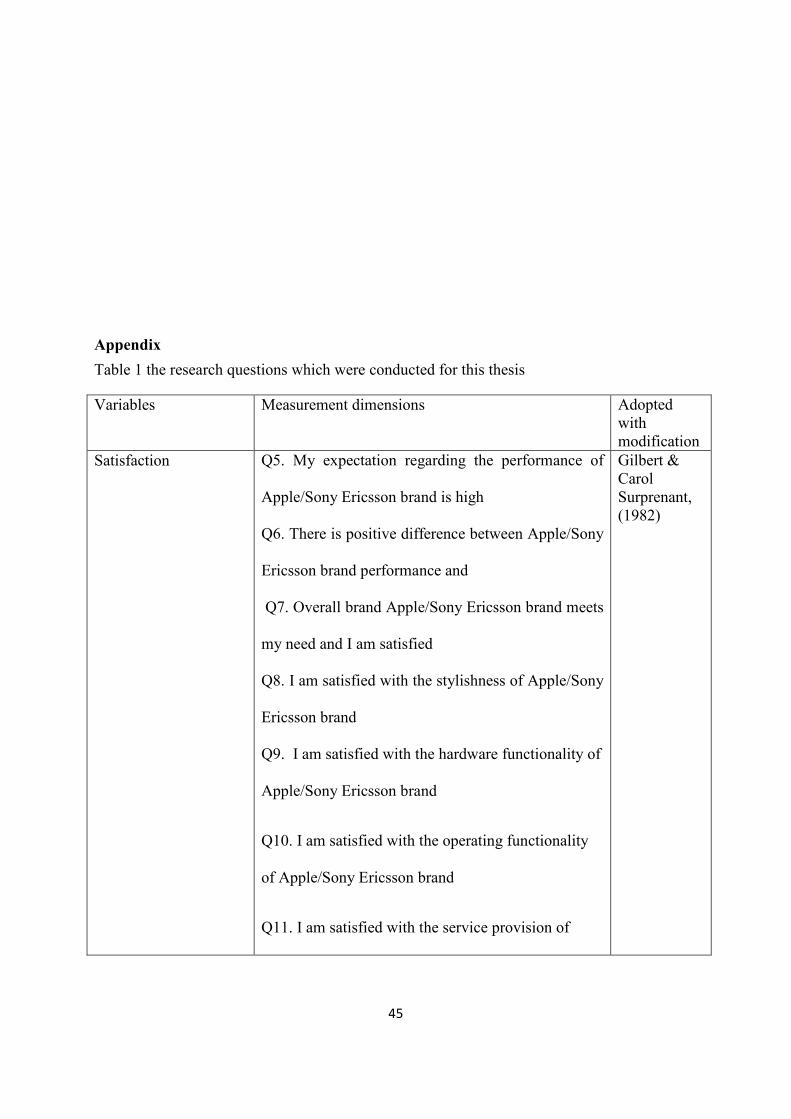
45
Appendix
Table 1 the research questions which were conducted for this thesis
Variables
Measurement dimensions Adopted with modification
Satisfaction
Q5. My expectation regarding the performance of
Apple/Sony Ericsson brand is high
Q6. There is positive difference between Apple/Sony
Ericsson brand performance and
Q7. Overall brand Apple/Sony Ericsson brand meets
my need and I am satisfied
Q8. I am satisfied with the stylishness of Apple/Sony
Ericsson brand
Q9. I am satisfied with the hardware functionality of
Apple/Sony Ericsson brand
Q10. I am satisfied with the operating functionality
of Apple/Sony Ericsson brand
Q11. I am satisfied with the service provision of
Gilbert & Carol Surprenant, (1982)
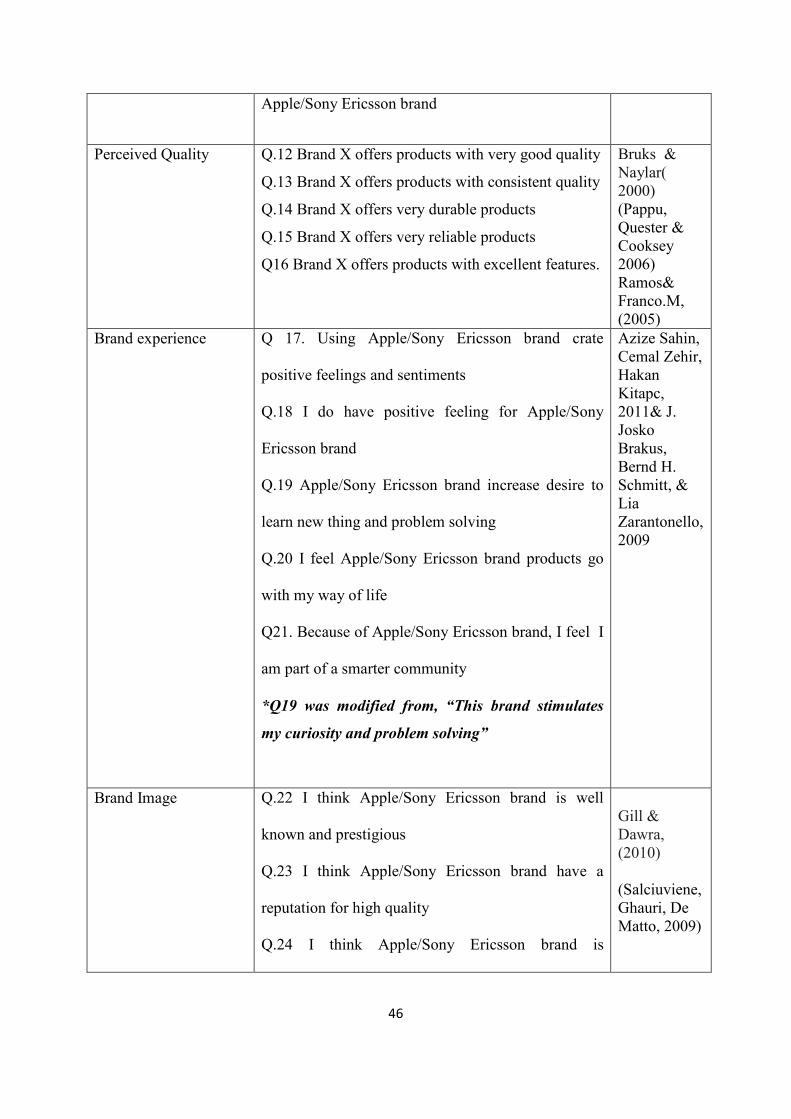
46
Apple/Sony Ericsson brand
Perceived Quality
Q.12 Brand X offers products with very good quality
Q.13 Brand X offers products with consistent quality
Q.14 Brand X offers very durable products
Q.15 Brand X offers very reliable products
Q16 Brand X offers products with excellent features.
Bruks & Naylar( 2000) (Pappu, Quester & Cooksey 2006) Ramos& Franco.M, (2005)
Brand experience
Q 17. Using Apple/Sony Ericsson brand crate
positive feelings and sentiments
Q.18 I do have positive feeling for Apple/Sony
Ericsson brand
Q.19 Apple/Sony Ericsson brand increase desire to
learn new thing and problem solving
Q.20 I feel Apple/Sony Ericsson brand products go
with my way of life
Q21. Because of Apple/Sony Ericsson brand, I feel I
am part of a smarter community
*Q19 was modified from, “This brand stimulates
my curiosity and problem solving”
Azize Sahin, Cemal Zehir, Hakan Kitapc, 2011& J. Josko Brakus, Bernd H. Schmitt, & Lia Zarantonello, 2009
Brand Image
Q.22 I think Apple/Sony Ericsson brand is well
known and prestigious
Q.23 I think Apple/Sony Ericsson brand have a
reputation for high quality
Q.24 I think Apple/Sony Ericsson brand is
Gill & Dawra, (2010) (Salciuviene, Ghauri, De Matto, 2009)
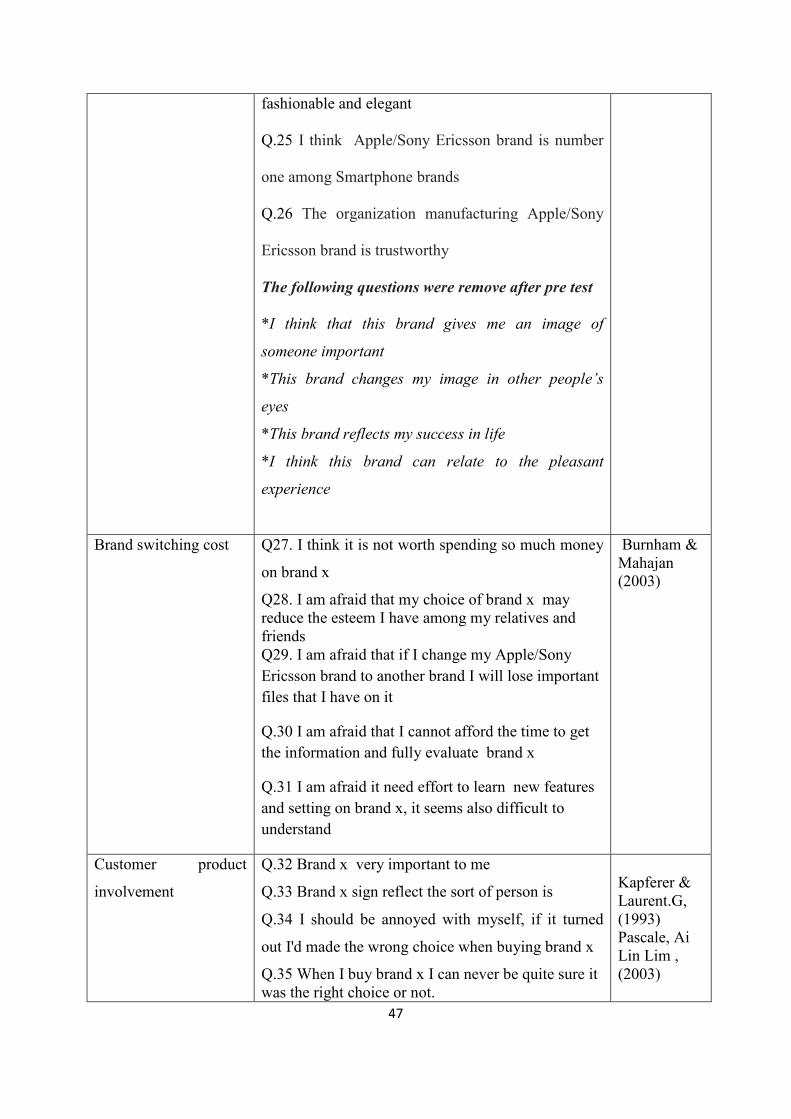
47
fashionable and elegant
Q.25 I think Apple/Sony Ericsson brand is number
one among Smartphone brands
Q.26 The organization manufacturing Apple/Sony
Ericsson brand is trustworthy
The following questions were remove after pre test
*I think that this brand gives me an image of
someone important
*This brand changes my image in other people’s
eyes
*This brand reflects my success in life
*I think this brand can relate to the pleasant
experience
Brand switching cost
Q27. I think it is not worth spending so much money
on brand x
Q28. I am afraid that my choice of brand x may reduce the esteem I have among my relatives and friends Q29. I am afraid that if I change my Apple/Sony Ericsson brand to another brand I will lose important files that I have on it
Q.30 I am afraid that I cannot afford the time to get the information and fully evaluate brand x
Q.31 I am afraid it need effort to learn new features and setting on brand x, it seems also difficult to understand
Burnham & Mahajan (2003)
Customer product
involvement
Q.32 Brand x very important to me
Q.33 Brand x sign reflect the sort of person is
Q.34 I should be annoyed with myself, if it turned
out I'd made the wrong choice when buying brand x
Q.35 When I buy brand x I can never be quite sure it was the right choice or not.
Kapferer & Laurent.G, (1993) Pascale, Ai Lin Lim , (2003)
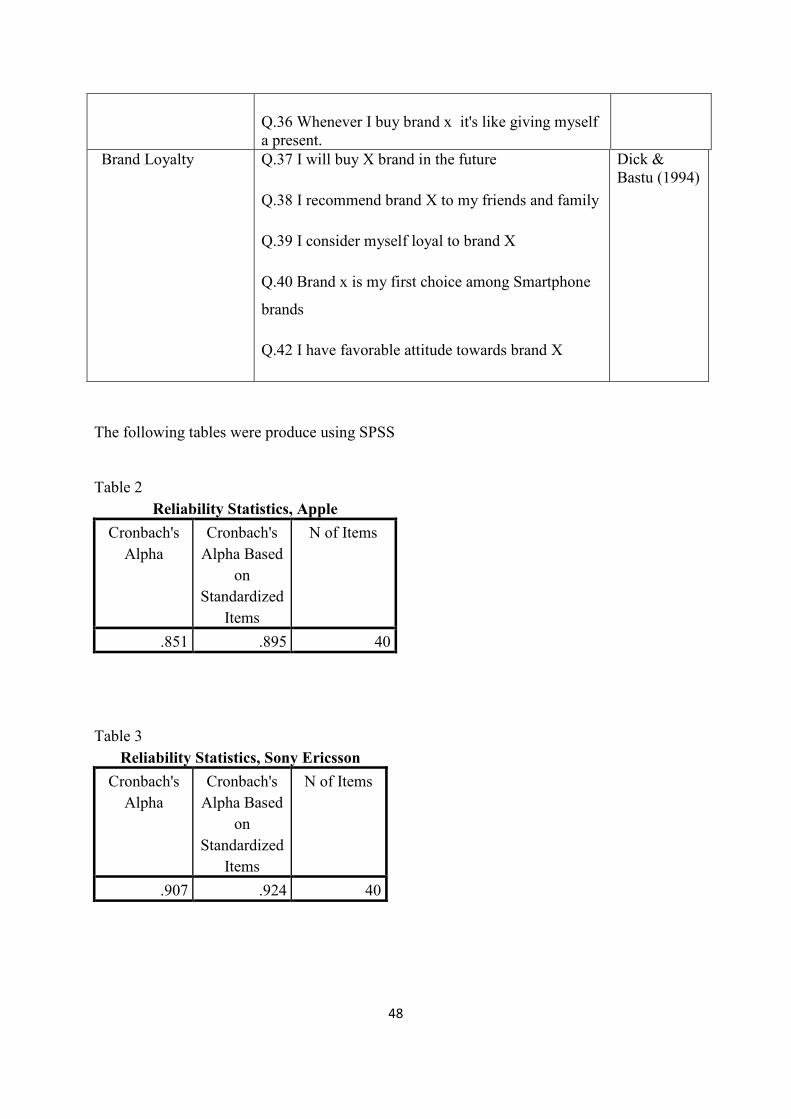
48
Q.36 Whenever I buy brand x it's like giving myself a present.
Brand Loyalty
Q.37 I will buy X brand in the future
Q.38 I recommend brand X to my friends and family
Q.39 I consider myself loyal to brand X
Q.40 Brand x is my first choice among Smartphone
brands
Q.42 I have favorable attitude towards brand X
Dick & Bastu (1994)
The following tables were produce using SPSS Table 2
Reliability Statistics, Apple Cronbach's Alpha
Cronbach's Alpha Based
on Standardized
Items
N of Items
.851 .895 40 Table 3
Reliability Statistics, Sony Ericsson Cronbach's Alpha
Cronbach's Alpha Based
on Standardized
Items
N of Items
.907 .924 40
Related Documents