Brain–behaviour relationships in people at high genetic risk of schizophrenia G. Katherine S. Lymer, ⁎ Dominic E. Job, T. William J. Moorhead, Andrew M. McIntosh, David G.C. Owens, Eve C. Johnstone, and Stephen M. Lawrie Division of Psychiatry, School of Molecular and Clinical Medicine, The University of Edinburgh, Kennedy Tower, Royal Edinburgh Hospital, Morningside Park, Edinburgh EH10 5HF, UK Received 31 March 2006; revised 5 June 2006; accepted 7 June 2006 Available online 22 August 2006 The brain is known to be structurally abnormal in schizophrenia, with replicated findings between anatomical deficits and some dysfunctions. These structure–function associations have, however, only very rarely been studied in relatives at risk of schizophrenia. We studied the relationships between structure and schizotypal features (assessed using RISC and SIS) and verbal learning and memory (measured using RAVLT) in relatives at high risk of developing schizophrenia and normal controls. Since these behavioural test scores are strong predictors of schizophrenia in the Edinburgh High Risk Study, we hypothesised that these relationships would differ between those high- risk subjects who will develop schizophrenia from those who will not. We performed multiple regressions of the grey matter segments of the subjects and controls, produced using grey matter optimised, voxel- based morphometry, with their RAVLT, SIS and RISC scores in SPM. Where significant relationships were found, we used SPSS to test for subject group by behavioural score interactions. In those high-risk subjects who became ill, grey matter density (GMD) was significantly correlated with RISC in the left superior temporal gyrus. In subjects who remained well, SIS was significantly correlated with GMD in the right pulvinar. Across the whole HR group, GMD in the right medial dorsal thalamic nucleus was significantly correlated with RAVLT. In those subjects who developed symptoms, RAVLT significantly corre- lated with GMD in right parahippocampal gyrus whereas in those who became ill, significant correlations existed bilaterally in the pulvinar. These results suggest complex and changing patterns of structural– functional relationships in those subjects at high-risk of schizophrenia. © 2006 Elsevier Inc. All rights reserved. Keywords: Schizophrenia; Magnetic resonance imaging; Voxel-based morphometry; Statistical parametric mapping; Working and verbal memory; Schizotypy Introduction Anatomical abnormalities of the brain in schizophrenia, first identified post-mortem, have been confirmed using structural imaging (Lawrie and Abukmeil, 1998; Shenton et al., 2001; Johnstone and Owens, 2004) and functional deficits have been investigated using many cognitive assessment and functional imaging techniques (Kremen et al., 1994; Antonova et al., 2004). The concept that these functional abnormalities are caused by underlying pathological changes in the brain was first proposed in the early 20th century (Hoenig and Turner, 1995) and cognitive impairment is one of the few clear associations of postmortem abnormalities (Harrison, 1999). With the application of in vivo imaging to schizophrenia, a seminal region of interest (ROI) study demonstrated that ventricular enlargement, as shown on computed tomography (CT), was associated with cognitive impairment (Johnstone et al., 1976) and this association was consistently replicated (Lewis, 1990). MRI, with its superior soft tissue contrast allowing the differentiation of brain regions, has allowed further investigation of the structural–functional relationships in schizo- phrenia (Barta et al., 1990; Shenton et al., 1992; Flaum et al., 1994; Sullivan et al., 1996; Sanfilipo et al., 2002; Antonova et al., 2004; Choi et al., 2005; Mitelman et al., 2005b). Automated image analysis techniques such as voxel-based morphometry (VBM) have permitted more extensive interrogation of the relationships between structural deficits across the whole of the brain and functional abnormalities in subjects with schizophrenia as compared to healthy controls (Dazzan et al., 2004; Antonova et al., 2005; Whitford et al., 2005). We employ MRI and automated post-processing methods in relatives at high risk of schizophrenia to further develop this search. We examine potential differences in structural–functional relationships before the onset of schizophrenia, across groups that will and will not become ill, both with or without psychotic symptoms, unconfounded by possible medication effects. This is achieved by studying individuals at high risk of developing schizophrenia, from the Edinburgh High Risk Study (EHRS). Details of this study have been published elsewhere (Byrne et al., 1999; Hodges et al., 1999; Johnstone et al., 2000), as have the www.elsevier.com/locate/ynimg NeuroImage 33 (2006) 275 – 285 ⁎ Corresponding author. Fax: +44 131 537 6531. E-mail address: [email protected] (G.K.S. Lymer). Available online on ScienceDirect (www.sciencedirect.com). 1053-8119/$ - see front matter © 2006 Elsevier Inc. All rights reserved. doi:10.1016/j.neuroimage.2006.06.031

Welcome message from author
This document is posted to help you gain knowledge. Please leave a comment to let me know what you think about it! Share it to your friends and learn new things together.
Transcript
www.elsevier.com/locate/ynimg
NeuroImage 33 (2006) 275–285Brain–behaviour relationships in people at highgenetic risk of schizophrenia
G. Katherine S. Lymer,⁎ Dominic E. Job, T. William J. Moorhead, Andrew M. McIntosh,David G.C. Owens, Eve C. Johnstone, and Stephen M. Lawrie
Division of Psychiatry, School of Molecular and Clinical Medicine, The University of Edinburgh, Kennedy Tower,Royal Edinburgh Hospital, Morningside Park, Edinburgh EH10 5HF, UK
Received 31 March 2006; revised 5 June 2006; accepted 7 June 2006Available online 22 August 2006
The brain is known to be structurally abnormal in schizophrenia, withreplicated findings between anatomical deficits and some dysfunctions.These structure–function associations have, however, only very rarelybeen studied in relatives at risk of schizophrenia. We studied therelationships between structure and schizotypal features (assessedusing RISC and SIS) and verbal learning and memory (measuredusing RAVLT) in relatives at high risk of developing schizophrenia andnormal controls. Since these behavioural test scores are strongpredictors of schizophrenia in the Edinburgh High Risk Study, wehypothesised that these relationships would differ between those high-risk subjects who will develop schizophrenia from those who will not.We performed multiple regressions of the grey matter segments of thesubjects and controls, produced using grey matter optimised, voxel-based morphometry, with their RAVLT, SIS and RISC scores in SPM.Where significant relationships were found, we used SPSS to test forsubject group by behavioural score interactions. In those high-risksubjects who became ill, grey matter density (GMD) was significantlycorrelated with RISC in the left superior temporal gyrus. In subjectswho remained well, SIS was significantly correlated with GMD in theright pulvinar. Across the whole HR group, GMD in the right medialdorsal thalamic nucleus was significantly correlated with RAVLT. Inthose subjects who developed symptoms, RAVLT significantly corre-lated with GMD in right parahippocampal gyrus whereas in those whobecame ill, significant correlations existed bilaterally in the pulvinar.These results suggest complex and changing patterns of structural–functional relationships in those subjects at high-risk of schizophrenia.© 2006 Elsevier Inc. All rights reserved.
Keywords: Schizophrenia; Magnetic resonance imaging; Voxel-basedmorphometry; Statistical parametric mapping; Working and verbal memory;Schizotypy
⁎ Corresponding author. Fax: +44 131 537 6531.E-mail address: [email protected] (G.K.S. Lymer).Available online on ScienceDirect (www.sciencedirect.com).
1053-8119/$ - see front matter © 2006 Elsevier Inc. All rights reserved.doi:10.1016/j.neuroimage.2006.06.031
Introduction
Anatomical abnormalities of the brain in schizophrenia, firstidentified post-mortem, have been confirmed using structuralimaging (Lawrie and Abukmeil, 1998; Shenton et al., 2001;Johnstone and Owens, 2004) and functional deficits have beeninvestigated using many cognitive assessment and functionalimaging techniques (Kremen et al., 1994; Antonova et al., 2004).The concept that these functional abnormalities are caused byunderlying pathological changes in the brain was first proposed inthe early 20th century (Hoenig and Turner, 1995) and cognitiveimpairment is one of the few clear associations of postmortemabnormalities (Harrison, 1999). With the application of in vivoimaging to schizophrenia, a seminal region of interest (ROI) studydemonstrated that ventricular enlargement, as shown on computedtomography (CT), was associated with cognitive impairment(Johnstone et al., 1976) and this association was consistentlyreplicated (Lewis, 1990). MRI, with its superior soft tissue contrastallowing the differentiation of brain regions, has allowed furtherinvestigation of the structural–functional relationships in schizo-phrenia (Barta et al., 1990; Shenton et al., 1992; Flaum et al., 1994;Sullivan et al., 1996; Sanfilipo et al., 2002; Antonova et al., 2004;Choi et al., 2005; Mitelman et al., 2005b). Automated imageanalysis techniques such as voxel-based morphometry (VBM) havepermitted more extensive interrogation of the relationships betweenstructural deficits across the whole of the brain and functionalabnormalities in subjects with schizophrenia as compared to healthycontrols (Dazzan et al., 2004; Antonova et al., 2005; Whitford et al.,2005). We employ MRI and automated post-processing methods inrelatives at high risk of schizophrenia to further develop this search.
We examine potential differences in structural–functionalrelationships before the onset of schizophrenia, across groups thatwill and will not become ill, both with or without psychoticsymptoms, unconfounded by possible medication effects. This isachieved by studying individuals at high risk of developingschizophrenia, from the Edinburgh High Risk Study (EHRS).Details of this study have been published elsewhere (Byrne et al.,1999; Hodges et al., 1999; Johnstone et al., 2000), as have the
276 G.K.S. Lymer et al. / NeuroImage 33 (2006) 275–285
clinical, neuropsychological and imaging findings at baseline(Lawrie et al., 1999, 2001; Miller et al., 2002a,b; Job et al., 2003;Harris et al., 2004). From this work, significant predictors ofschizophrenia have been identified within the cohort from thebattery of behavioural tests completed by the subjects at baseline,2.5 years on average before the onset of the disorder (Johnstone etal., 2005). Baseline memory and learning, as tested using the ReyAuditory Verbal Learning Test (Rey, 1964) (RAVLT), wassignificantly worse in the high-risk subjects than the control group(Byrne et al., 1999, 2003) and particularly poor in those who wenton to develop schizophrenia, with no point of rarity (Whyte et al.,2006). Previous work has established that the Rust Inventory ofSchizotypal Cognitions (RISC) is able to differentiate schizo-phrenic subjects from controls (Rust, 1988) and the StructuredInventory for Schizotypy (SIS) allows discrimination of relativesof healthy controls from the relatives of schizophrenic patients(Kendler et al., 1989). In the EHRS, differences in the baselinescores from the SIS and RISC were also able to distinguish thosehigh-risk individuals who would go onto develop schizophreniafrom those who did not. Each of the RAVLT, SIS and RISC wasalso able to identify those, within the clinically indistinguishablesubjects with psychotic symptoms, who did and did not become ill(Miller et al., 2002b; Johnstone et al., 2005). Identifying whetherthese trait markers represent separate, overlapping or closelyrelated intermediate phenotypes would facilitate the search for theiraetiological underpinnings and probably assist in the earliestpossible identification of those who are most likely to become ill.
Available information regarding structural–functional relation-ships in high-risk populations is very limited. In the EHRS,differences in whole brain volume ROI measures between psychoticand non-psychotic subjects have been reported, with those subjectsreporting symptoms having smaller brains (Lawrie et al., 2001). Inanother setting, Toulopoulou et al. reported positive correlationsbetween visual memory and size of left hippocampus andcerebellum in 90 relatives of schizophrenic subjects using ROIanalysis (Toulopoulou et al., 2004). Further positive correlationswere found across the whole group (including patients, relatives andhealthy controls) between verbal memory in the cerebellum, inaddition to inverse correlations of verbal memory in the lefthippocampus. However, this is in contrast to earlier work where apositive correlation was found between delayed verbal memory andanterior-amygdala hippocampal (AHC) volume in a group ofcontrols and 20 first-degree relatives of patients with schizophrenia(O'Driscoll et al., 2001). This apparently conflicting result may bedue to differences in the exact site of the volumetric measurementsand the populations studied. Indeed, the relatives in the Toulopouloustudy comprised obligate carriers (mean age 50.2±15.5 years) whowere, by definition, out with the age period of risk, while the firstdegree relatives in the O'Driscoll study were younger (meanage=35.4±8.8 years). Further investigation into the nature of thestructure–function relationship in those at high risk of developingschizophrenia is clearly required.
The primary aim of this study was to address this issue byexamining the structural associations of the three strongestbehavioural predictors in theEHRS (Johnstone et al., 2005). Previousstudies in patients with schizophrenia have shown correlationsbetween hallucinations and thought disorder with temporal lobevolumes (Barta et al., 1990; Shenton et al., 1992; Menon et al., 1995;Holinger et al., 1999; Rajarethinam et al., 2000; Matsumoto et al.,2001). In addition, relationships between associational and percep-tual disturbances and abnormalities in the thalamic nuclei have been
reported in subjects with schizophrenia and schizotypal personalitydisorder (Byne et al., 2001). In terms of the RAVLT, impairments ofverbal memory in schizophrenia have been associated with temporallobe abnormalities in general (Kolb and Whishaw, 1983; Saykin etal., 1991; Nestor et al., 1993, 1995, 2002) and reduced hippocampalvolume (Gur et al., 2000). Studies of auditory–verbal learning alsoimplicate the thalamus in such processing in both health (e.g., Grasbyet al., 1993, 1994) and schizophrenia (Crespo-Facorro et al., 1999;Ragland et al., 2001, 2005). Therefore, on the basis of these knownstructure–function relationships in schizophrenia, we hypothesisedthat within the high-risk subjects, relationships will exist betweendeficits in the temporal lobes and thalamus and schizotypy, asassessed using RISC and SIS, and that reductions in the temporallobes, AHC and thalamus will be related to poorer verbal memoryperformance as measured using the RAVLT.
Our second aim was to identify any variations in theseassociations within the subgroups of HR subjects with differentoutcomes. This is potentially important as if the structure–functionrelationships functionally differ in those at risk, with or withoutsymptoms, who will or will not develop psychosis, it could thereforebe useful in distinguishing between these populations. Although nostructural differences were reported at baseline between the HRsubgroups in VBM (Job et al., 2003, 2005), we reasoned that theinclusion of the strongest behavioural predictors (Johnstone et al.,2005) into the analysis would provide additional information to helpidentify those high-risk subjects who will develop schizophreniafrom those who will not. To test these hypotheses, we applyautomated analysis techniques to correlate grey matter density(GMD), as obtained using VBM, with the behavioural test scores.
Methods
Subjects
All subjects were recruited as part of the EHRS. The selectionand assessment criteria have been described elsewhere (e.g., Byrneet al., 1999; Hodges et al., 1999; Johnstone et al., 2000). In brief, 150young adults initially aged 16–24 years, at high risk (HR) ofdeveloping schizophrenia as having at least two close relatives withschizophrenia (1° or 2°) and 36 healthy controls underwent a seriesof detailed clinical, behavioural and neuropsychological measuresand structural MRI scanning. Verbal learning and memory wereassessed using the RAVLT (Lezak, 1995). Behavioural measuresincluded the SIS (Kendler et al., 1989) and RISC (Rust, 1988) toobtain scores for schizotypy. The Present State Examination (PSE)was used to elicit psychopathology and allowed classification of thesubjects into five categories: no psychotic or fully rated neuroticsymptoms; fully rated non-psychotic symptoms; partial psychoticsymptoms; definite but isolated and/or transient psychotic symp-toms; diagnosis of schizophrenia (Johnstone et al., 2000). Thispresent study considers baseline data and their inter-relationshipsaccording to these clinical groupings.
Three of the HR subjects were excluded from sMRI analysisdue to abnormal scans (two had grossly dilated ventricular systemsand thin cortical rims and the third had a large temporal cyst). Afourth scan was omitted from the VBM analysis as the phantomimage required for image intensity correction was lost due to acomputer malfunction. A further 14 MRI scans from the HRsubjects and three scans from the control group were excludedfrom the analysis as the subjects had incomplete behavioural testscores, resulting in n=132 HR and n=33 controls with full
277G.K.S. Lymer et al. / NeuroImage 33 (2006) 275–285
behavioural evaluation and sMRI at baseline. Details of the subjectgroups are presented in Table 1.
Scanning protocol
All baseline imaging was performed on a 1.0 T SiemensMagnetom scanner (Erlangen, Germany). After localisation and adouble spin-echo sequence to identify any gross brain abnormalities,the volumetric data required for VBM were acquired usingMPRAGE (TR=10 ms, TE=4 ms, TI=200 ms, relaxation delaytime=500 ms, flip angle=12°, FOV=250 mm×250 mm) resultingin 128 contiguous, 1.88-mm-thick “slices”. To correct for inhomo-geneity of the RF coil and any scanner changes over time, an oilphantomwas scanned immediately after each subject, using the samecoil and in the same orientation as the subject’s head (Job et al., 2002).
Image processing
VBM was performed using the SPM99 toolbox [http://www.fil.ion.ucl.ac.uk/spm/software/spm99/] running in Matlab version 6.1(The MathWorks, Natick, MA) and was based on the methodsdescribed by Ashburner and Friston (2000) and Good et al. (2001),Moorhead et al. (2004).
A study-specific template was constructed from all 146 HR and36 control structurally normal MRI scans. Since this groupcontained scans from subjects of mixed outcome (i.e., thosewithout psychotic symptoms (HR well), those with isolated orpartial psychotic symptoms (HR+) and those who were laterdiagnosed with schizophrenia (HR ill)), it was believed to representthe entire study population and therefore minimised bias for spatialnormalisation. The scans were normalised to the generic SPM T1template using 12-point linear affine transformation to minimisethe residual sum of squares differences between the images and thetemplate. A study-specific T1 template was created from the meanimage calculated from all the normalised T1 images and smoothedat 8-mm full-width at half maximum (FWHM).
To generate study-specific brain tissue a priori maps, thenormalised images were segmented into grey matter (GM), whitematter (WM) and cerebrospinal fluid (CSF) using SPM clusteranalysis with a modified mixture model and the SPM GM, WMand CSF a priori probability maps. A brain tissue mask wasproduced using the “Xtract brain” function. This removes theextracerebral voxels from both the GM and WM segmented images
Table 1Details of the subject groups
Control HR
HR wellsubjectswith non-psychoticsymptoms
HR+psychoticallysymptomatic(fully orpartially)at baseline
HR illsubsequentlydevelopedschizophrenia
n 33 89 26 17Age (mean±SD)
(years)21.3±2.4 21.3±2.9 21.3±2.9 20.0±2.5
Male:Female 16:17 49:40 9:17 11:6RISC (mean±SD) 28.1±11.4 27.2±10.1 30.0±9.9 39.9±10.6SIS (mean±SD) 20.1±10.1 21.0±8.8 26.3±10.9 38.7±13.6RAVLT, trials 1–5
(mean±SD)55.1±8.7 52.0±8.8 51.7±7.8 47.6±7.5
using a series of dilation functions and adds together the segmentsforming a binary image of extracted brain tissue. Multiplication ofthis image with the original segmented images removes theextracerebral voxels. Mean images were calculated from the CSFand extracted GM and WM segments and smoothed at 8-mmFWHM to produce study-specific a priori maps.
To process the images using the study-specific template, GMsegmented images, extracted from the original T1 images asdescribed above, were normalised to the study-specific GM a prioritemplate using a combination of 12-linear affine transformationsand a linear combination of smooth spatial basis functions toaccount for the non-linear global shape differences. The original T1images were then normalised into stereotactic space by applicationof the same GM-optimised combination of linear and non-lineartransformation parameters.
The GM optimally normalised images were then segmentedinto GM, WM and CSF using the study-specific templates and thesame modified cluster analysis function, and the extracerebralvoxels removed as previously described. Each of the GM optimallynormalised and segmented images were smoothed with a 12-mmFWHM kernel.
Statistical analysis
Initial statistical analyses were performed on a voxel by voxelbasis in SPM99, based on the general linear model. The overallrelationships of verbal learning and memory and schizotypy withbrain structure in the complete subject cohort were investigated byrunning multiple regressions of the GMD in the controls and eachsubgroup of HR subjects with their RAVLT (trials 1–5), SIS andRISC scores. Age, sex and the number of grey matter voxels ascalculated from the native space images (nVoxGM) were includedas nuisance variables to remove any global differences between theimages. Premorbid IQ, as assessed using the National AdultReading Test (NART), was also included as a covariate whenanalysing the RAVLT (total score 1–5) since previous work hasshown associations between intellectual decline and deficits inmemory in some patients with schizophrenia (Wieckert et al.,2000). Two contrasts were constructed to examine correlationswith both increasing and decreasing GMD with RAVLT (totalscore 1–5), RISC and SIS test scores, and statistical parametricmaps were produced for p=0.001 (uncorrected).
To allow the relationships between RAVLT, SIS and RISC andGMD to be determined in the specific brain regions stated in thehypothesis, small volume corrections (SVCs) were applied to thetemporal lobes, AHC and thalamus (Barta et al., 1990; Shenton etal., 1992; Nestor et al., 1993; Becker et al., 1996; Gur et al., 2000;Byne et al., 2001). Maximum voxel results with p<0.05(corrected) were considered significant. The correspondingcoordinates from the significant voxels were converted fromMontreal Neurological Institute (MNI) space to Talairach andTournoux coordinates (Talairach and Tournoux, 1998) using thematlab script mni2tal.m (Brett, 1999). Where significant correla-tions were found, the GMD values were extracted for each ofthese voxel locations into SPSS and one-sample Kolmogorov–Smirnov tests were applied to ensure the normality of the data.Since the GM segments were smoothed with a 12-mm FWHMfilter, each extracted voxel then represented a radially based mean,weighted by the point-spread function (PSF) of the FWHM. Theapplication of an isotropic filter ensured that there was nodirectional bias in the convolution. SPSS was used to test for
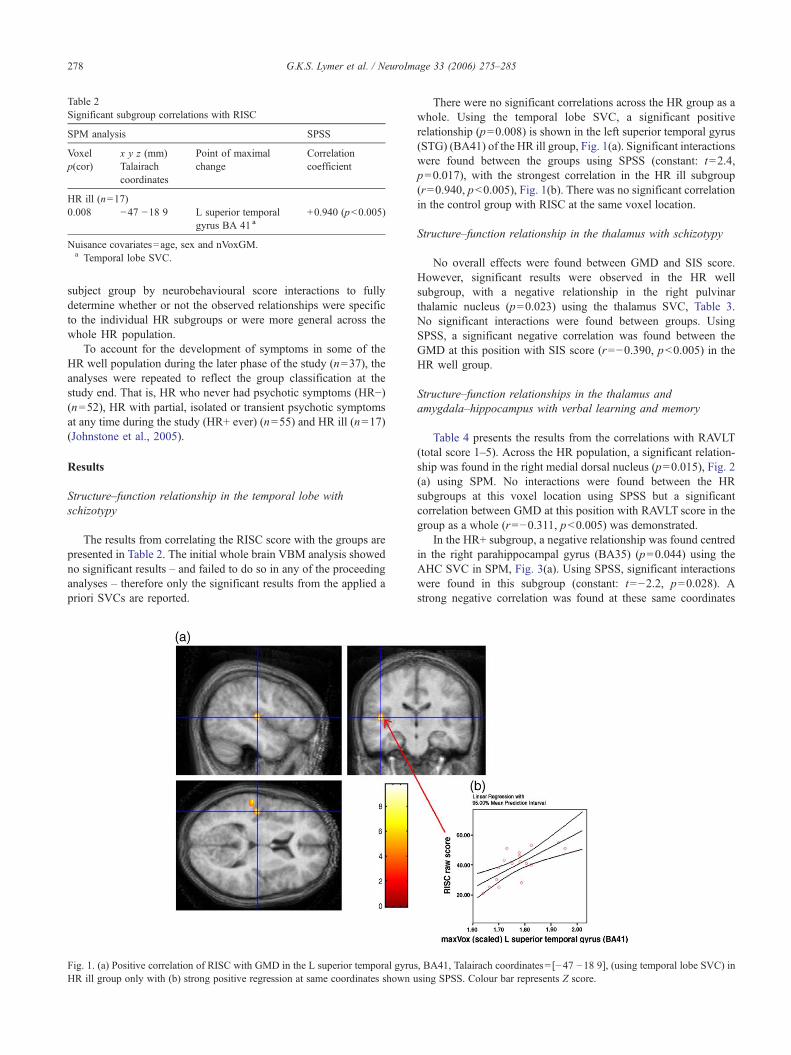
Table 2Significant subgroup correlations with RISC
SPM analysis SPSS
Voxelp(cor)
x y z (mm)Talairachcoordinates
Point of maximalchange
Correlationcoefficient
HR ill (n=17)0.008 −47 −18 9 L superior temporal
gyrus BA 41 a+0.940 (p<0.005)
Nuisance covariates=age, sex and nVoxGM.a Temporal lobe SVC.
278 G.K.S. Lymer et al. / NeuroImage 33 (2006) 275–285
subject group by neurobehavioural score interactions to fullydetermine whether or not the observed relationships were specificto the individual HR subgroups or were more general across thewhole HR population.
To account for the development of symptoms in some of theHR well population during the later phase of the study (n=37), theanalyses were repeated to reflect the group classification at thestudy end. That is, HR who never had psychotic symptoms (HR−)(n=52), HR with partial, isolated or transient psychotic symptomsat any time during the study (HR+ ever) (n=55) and HR ill (n=17)(Johnstone et al., 2005).
Results
Structure–function relationship in the temporal lobe withschizotypy
The results from correlating the RISC score with the groups arepresented in Table 2. The initial whole brain VBM analysis showedno significant results – and failed to do so in any of the proceedinganalyses – therefore only the significant results from the applied apriori SVCs are reported.
Fig. 1. (a) Positive correlation of RISC with GMD in the L superior temporal gyruHR ill group only with (b) strong positive regression at same coordinates shown u
There were no significant correlations across the HR group as awhole. Using the temporal lobe SVC, a significant positiverelationship (p=0.008) is shown in the left superior temporal gyrus(STG) (BA41) of the HR ill group, Fig. 1(a). Significant interactionswere found between the groups using SPSS (constant: t=2.4,p=0.017), with the strongest correlation in the HR ill subgroup(r=0.940, p<0.005), Fig. 1(b). There was no significant correlationin the control group with RISC at the same voxel location.
Structure–function relationship in the thalamus with schizotypy
No overall effects were found between GMD and SIS score.However, significant results were observed in the HR wellsubgroup, with a negative relationship in the right pulvinarthalamic nucleus (p=0.023) using the thalamus SVC, Table 3.No significant interactions were found between groups. UsingSPSS, a significant negative correlation was found between theGMD at this position with SIS score (r=−0.390, p<0.005) in theHR well group.
Structure–function relationships in the thalamus andamygdala–hippocampus with verbal learning and memory
Table 4 presents the results from the correlations with RAVLT(total score 1–5). Across the HR population, a significant relation-ship was found in the right medial dorsal nucleus (p=0.015), Fig. 2(a) using SPM. No interactions were found between the HRsubgroups at this voxel location using SPSS but a significantcorrelation between GMD at this position with RAVLT score in thegroup as a whole (r=−0.311, p<0.005) was demonstrated.
In the HR+ subgroup, a negative relationship was found centredin the right parahippocampal gyrus (BA35) (p=0.044) using theAHC SVC in SPM, Fig. 3(a). Using SPSS, significant interactionswere found in this subgroup (constant: t=−2.2, p=0.028). Astrong negative correlation was found at these same coordinates
s, BA41, Talairach coordinates= [−47 −18 9], (using temporal lobe SVC) insing SPSS. Colour bar represents Z score.
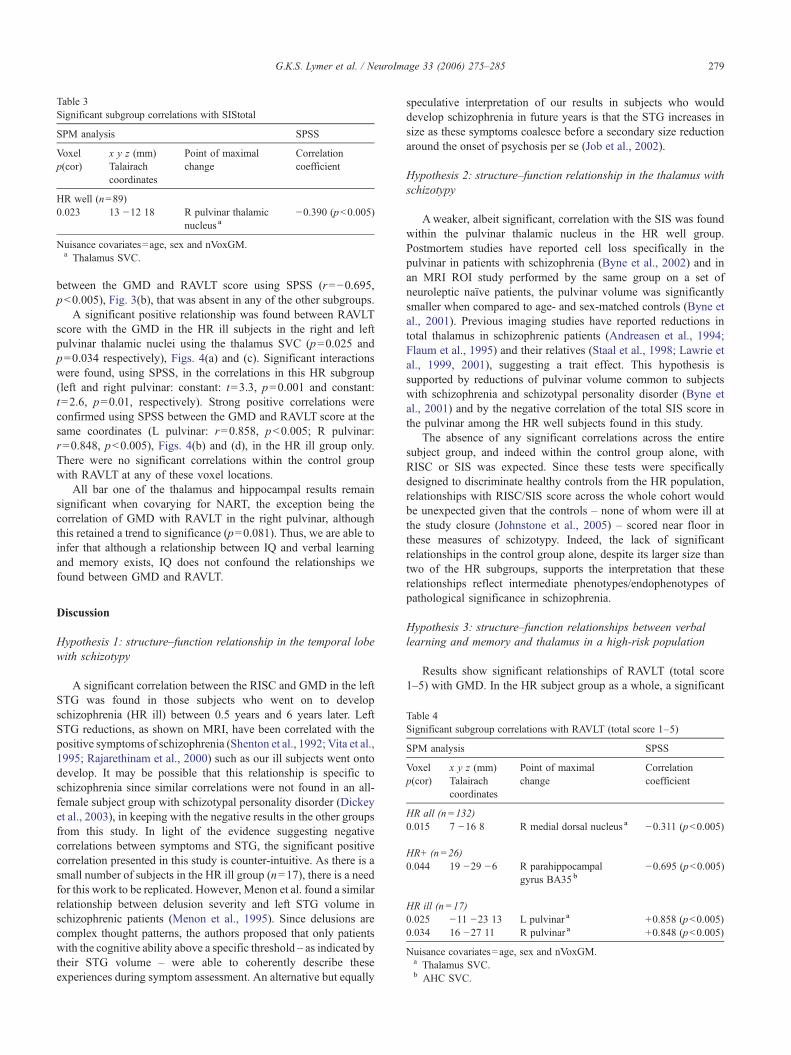
Table 3Significant subgroup correlations with SIStotal
SPM analysis SPSS
Voxelp(cor)
x y z (mm)Talairachcoordinates
Point of maximalchange
Correlationcoefficient
HR well (n=89)0.023 13 −12 18 R pulvinar thalamic
nucleus a−0.390 (p<0.005)
Nuisance covariates=age, sex and nVoxGM.a Thalamus SVC.
Table 4Significant subgroup correlations with RAVLT (total score 1–5)
SPM analysis SPSS
Voxelp(cor)
x y z (mm)Talairachcoordinates
Point of maximalchange
Correlationcoefficient
HR all (n=132)0.015 7 −16 8 R medial dorsal nucleus a −0.311 (p<0.005)
HR+ (n=26)0.044 19 −29 −6 R parahippocampal
gyrus BA35 b−0.695 (p<0.005)
HR ill (n=17)0.025 −11 −23 13 L pulvinar a +0.858 (p<0.005)0.034 16 −27 11 R pulvinar a +0.848 (p<0.005)
Nuisance covariates=age, sex and nVoxGM.a Thalamus SVC.b AHC SVC.
279G.K.S. Lymer et al. / NeuroImage 33 (2006) 275–285
between the GMD and RAVLT score using SPSS (r=−0.695,p<0.005), Fig. 3(b), that was absent in any of the other subgroups.
A significant positive relationship was found between RAVLTscore with the GMD in the HR ill subjects in the right and leftpulvinar thalamic nuclei using the thalamus SVC (p=0.025 andp=0.034 respectively), Figs. 4(a) and (c). Significant interactionswere found, using SPSS, in the correlations in this HR subgroup(left and right pulvinar: constant: t=3.3, p=0.001 and constant:t=2.6, p=0.01, respectively). Strong positive correlations wereconfirmed using SPSS between the GMD and RAVLT score at thesame coordinates (L pulvinar: r=0.858, p<0.005; R pulvinar:r=0.848, p<0.005), Figs. 4(b) and (d), in the HR ill group only.There were no significant correlations within the control groupwith RAVLT at any of these voxel locations.
All bar one of the thalamus and hippocampal results remainsignificant when covarying for NART, the exception being thecorrelation of GMD with RAVLT in the right pulvinar, althoughthis retained a trend to significance (p=0.081). Thus, we are able toinfer that although a relationship between IQ and verbal learningand memory exists, IQ does not confound the relationships wefound between GMD and RAVLT.
Discussion
Hypothesis 1: structure–function relationship in the temporal lobewith schizotypy
A significant correlation between the RISC and GMD in the leftSTG was found in those subjects who went on to developschizophrenia (HR ill) between 0.5 years and 6 years later. LeftSTG reductions, as shown on MRI, have been correlated with thepositive symptoms of schizophrenia (Shenton et al., 1992; Vita et al.,1995; Rajarethinam et al., 2000) such as our ill subjects went ontodevelop. It may be possible that this relationship is specific toschizophrenia since similar correlations were not found in an all-female subject group with schizotypal personality disorder (Dickeyet al., 2003), in keeping with the negative results in the other groupsfrom this study. In light of the evidence suggesting negativecorrelations between symptoms and STG, the significant positivecorrelation presented in this study is counter-intuitive. As there is asmall number of subjects in the HR ill group (n=17), there is a needfor this work to be replicated. However, Menon et al. found a similarrelationship between delusion severity and left STG volume inschizophrenic patients (Menon et al., 1995). Since delusions arecomplex thought patterns, the authors proposed that only patientswith the cognitive ability above a specific threshold – as indicated bytheir STG volume – were able to coherently describe theseexperiences during symptom assessment. An alternative but equally
speculative interpretation of our results in subjects who woulddevelop schizophrenia in future years is that the STG increases insize as these symptoms coalesce before a secondary size reductionaround the onset of psychosis per se (Job et al., 2002).
Hypothesis 2: structure–function relationship in the thalamus withschizotypy
Aweaker, albeit significant, correlation with the SIS was foundwithin the pulvinar thalamic nucleus in the HR well group.Postmortem studies have reported cell loss specifically in thepulvinar in patients with schizophrenia (Byne et al., 2002) and inan MRI ROI study performed by the same group on a set ofneuroleptic naïve patients, the pulvinar volume was significantlysmaller when compared to age- and sex-matched controls (Byne etal., 2001). Previous imaging studies have reported reductions intotal thalamus in schizophrenic patients (Andreasen et al., 1994;Flaum et al., 1995) and their relatives (Staal et al., 1998; Lawrie etal., 1999, 2001), suggesting a trait effect. This hypothesis issupported by reductions of pulvinar volume common to subjectswith schizophrenia and schizotypal personality disorder (Byne etal., 2001) and by the negative correlation of the total SIS score inthe pulvinar among the HR well subjects found in this study.
The absence of any significant correlations across the entiresubject group, and indeed within the control group alone, withRISC or SIS was expected. Since these tests were specificallydesigned to discriminate healthy controls from the HR population,relationships with RISC/SIS score across the whole cohort wouldbe unexpected given that the controls – none of whom were ill atthe study closure (Johnstone et al., 2005) – scored near floor inthese measures of schizotypy. Indeed, the lack of significantrelationships in the control group alone, despite its larger size thantwo of the HR subgroups, supports the interpretation that theserelationships reflect intermediate phenotypes/endophenotypes ofpathological significance in schizophrenia.
Hypothesis 3: structure–function relationships between verballearning and memory and thalamus in a high-risk population
Results show significant relationships of RAVLT (total score1–5) with GMD. In the HR subject group as a whole, a significant
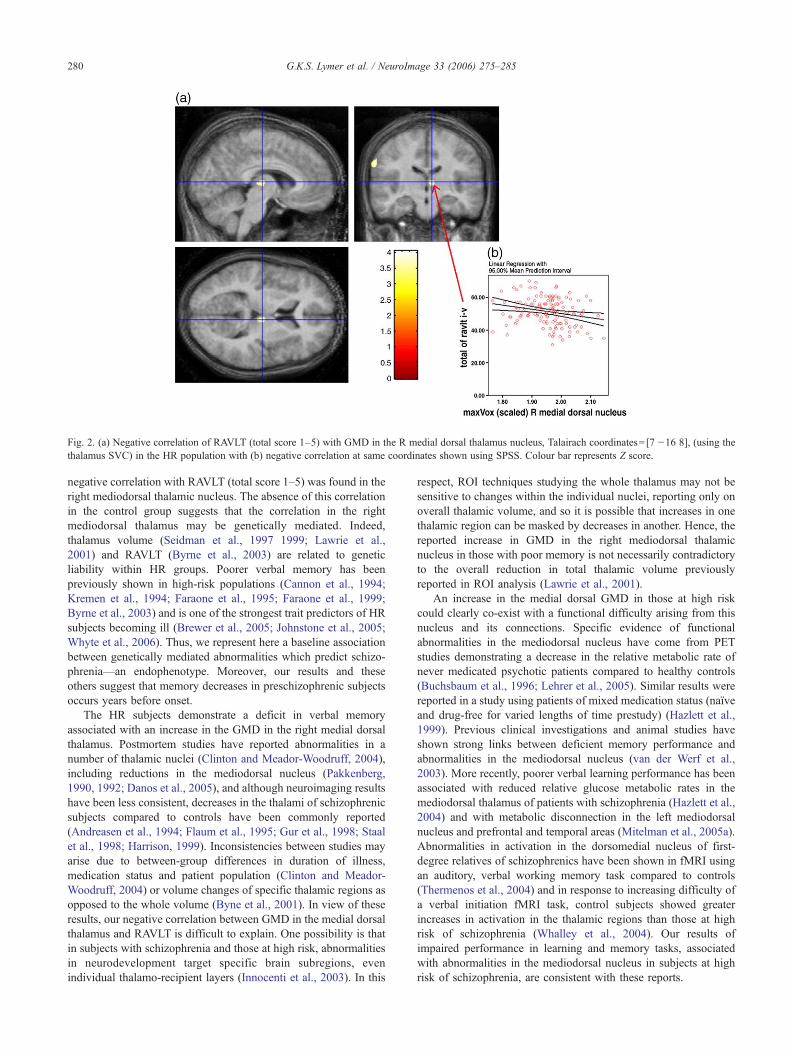
Fig. 2. (a) Negative correlation of RAVLT (total score 1–5) with GMD in the R medial dorsal thalamus nucleus, Talairach coordinates=[7 −16 8], (using thethalamus SVC) in the HR population with (b) negative correlation at same coordinates shown using SPSS. Colour bar represents Z score.
280 G.K.S. Lymer et al. / NeuroImage 33 (2006) 275–285
negative correlation with RAVLT (total score 1–5) was found in theright mediodorsal thalamic nucleus. The absence of this correlationin the control group suggests that the correlation in the rightmediodorsal thalamus may be genetically mediated. Indeed,thalamus volume (Seidman et al., 1997 1999; Lawrie et al.,2001) and RAVLT (Byrne et al., 2003) are related to geneticliability within HR groups. Poorer verbal memory has beenpreviously shown in high-risk populations (Cannon et al., 1994;Kremen et al., 1994; Faraone et al., 1995; Faraone et al., 1999;Byrne et al., 2003) and is one of the strongest trait predictors of HRsubjects becoming ill (Brewer et al., 2005; Johnstone et al., 2005;Whyte et al., 2006). Thus, we represent here a baseline associationbetween genetically mediated abnormalities which predict schizo-phrenia—an endophenotype. Moreover, our results and theseothers suggest that memory decreases in preschizophrenic subjectsoccurs years before onset.
The HR subjects demonstrate a deficit in verbal memoryassociated with an increase in the GMD in the right medial dorsalthalamus. Postmortem studies have reported abnormalities in anumber of thalamic nuclei (Clinton and Meador-Woodruff, 2004),including reductions in the mediodorsal nucleus (Pakkenberg,1990, 1992; Danos et al., 2005), and although neuroimaging resultshave been less consistent, decreases in the thalami of schizophrenicsubjects compared to controls have been commonly reported(Andreasen et al., 1994; Flaum et al., 1995; Gur et al., 1998; Staalet al., 1998; Harrison, 1999). Inconsistencies between studies mayarise due to between-group differences in duration of illness,medication status and patient population (Clinton and Meador-Woodruff, 2004) or volume changes of specific thalamic regions asopposed to the whole volume (Byne et al., 2001). In view of theseresults, our negative correlation between GMD in the medial dorsalthalamus and RAVLT is difficult to explain. One possibility is thatin subjects with schizophrenia and those at high risk, abnormalitiesin neurodevelopment target specific brain subregions, evenindividual thalamo-recipient layers (Innocenti et al., 2003). In this
respect, ROI techniques studying the whole thalamus may not besensitive to changes within the individual nuclei, reporting only onoverall thalamic volume, and so it is possible that increases in onethalamic region can be masked by decreases in another. Hence, thereported increase in GMD in the right mediodorsal thalamicnucleus in those with poor memory is not necessarily contradictoryto the overall reduction in total thalamic volume previouslyreported in ROI analysis (Lawrie et al., 2001).
An increase in the medial dorsal GMD in those at high riskcould clearly co-exist with a functional difficulty arising from thisnucleus and its connections. Specific evidence of functionalabnormalities in the mediodorsal nucleus have come from PETstudies demonstrating a decrease in the relative metabolic rate ofnever medicated psychotic patients compared to healthy controls(Buchsbaum et al., 1996; Lehrer et al., 2005). Similar results werereported in a study using patients of mixed medication status (naïveand drug-free for varied lengths of time prestudy) (Hazlett et al.,1999). Previous clinical investigations and animal studies haveshown strong links between deficient memory performance andabnormalities in the mediodorsal nucleus (van der Werf et al.,2003). More recently, poorer verbal learning performance has beenassociated with reduced relative glucose metabolic rates in themediodorsal thalamus of patients with schizophrenia (Hazlett et al.,2004) and with metabolic disconnection in the left mediodorsalnucleus and prefrontal and temporal areas (Mitelman et al., 2005a).Abnormalities in activation in the dorsomedial nucleus of first-degree relatives of schizophrenics have been shown in fMRI usingan auditory, verbal working memory task compared to controls(Thermenos et al., 2004) and in response to increasing difficulty ofa verbal initiation fMRI task, control subjects showed greaterincreases in activation in the thalamic regions than those at highrisk of schizophrenia (Whalley et al., 2004). Our results ofimpaired performance in learning and memory tasks, associatedwith abnormalities in the mediodorsal nucleus in subjects at highrisk of schizophrenia, are consistent with these reports.
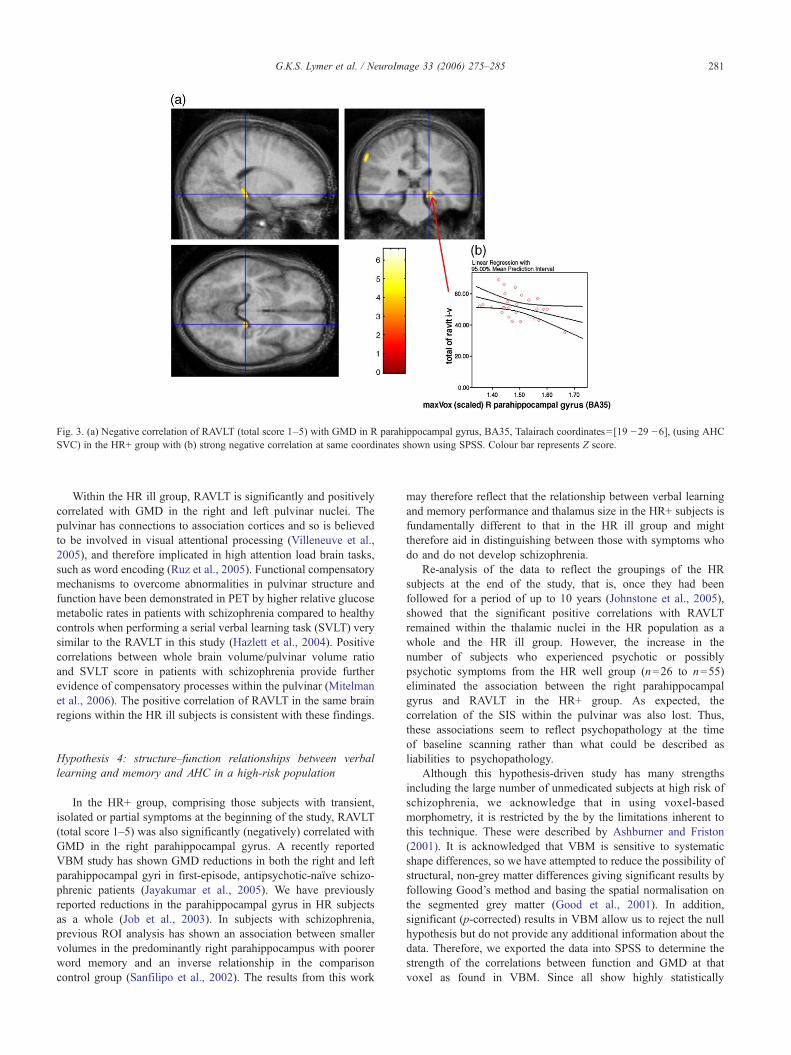
Fig. 3. (a) Negative correlation of RAVLT (total score 1–5) with GMD in R parahippocampal gyrus, BA35, Talairach coordinates= [19 −29 −6], (using AHCSVC) in the HR+ group with (b) strong negative correlation at same coordinates shown using SPSS. Colour bar represents Z score.
281G.K.S. Lymer et al. / NeuroImage 33 (2006) 275–285
Within the HR ill group, RAVLT is significantly and positivelycorrelated with GMD in the right and left pulvinar nuclei. Thepulvinar has connections to association cortices and so is believedto be involved in visual attentional processing (Villeneuve et al.,2005), and therefore implicated in high attention load brain tasks,such as word encoding (Ruz et al., 2005). Functional compensatorymechanisms to overcome abnormalities in pulvinar structure andfunction have been demonstrated in PET by higher relative glucosemetabolic rates in patients with schizophrenia compared to healthycontrols when performing a serial verbal learning task (SVLT) verysimilar to the RAVLT in this study (Hazlett et al., 2004). Positivecorrelations between whole brain volume/pulvinar volume ratioand SVLT score in patients with schizophrenia provide furtherevidence of compensatory processes within the pulvinar (Mitelmanet al., 2006). The positive correlation of RAVLT in the same brainregions within the HR ill subjects is consistent with these findings.
Hypothesis 4: structure–function relationships between verballearning and memory and AHC in a high-risk population
In the HR+ group, comprising those subjects with transient,isolated or partial symptoms at the beginning of the study, RAVLT(total score 1–5) was also significantly (negatively) correlated withGMD in the right parahippocampal gyrus. A recently reportedVBM study has shown GMD reductions in both the right and leftparahippocampal gyri in first-episode, antipsychotic-naïve schizo-phrenic patients (Jayakumar et al., 2005). We have previouslyreported reductions in the parahippocampal gyrus in HR subjectsas a whole (Job et al., 2003). In subjects with schizophrenia,previous ROI analysis has shown an association between smallervolumes in the predominantly right parahippocampus with poorerword memory and an inverse relationship in the comparisoncontrol group (Sanfilipo et al., 2002). The results from this work
may therefore reflect that the relationship between verbal learningand memory performance and thalamus size in the HR+ subjects isfundamentally different to that in the HR ill group and mighttherefore aid in distinguishing between those with symptoms whodo and do not develop schizophrenia.
Re-analysis of the data to reflect the groupings of the HRsubjects at the end of the study, that is, once they had beenfollowed for a period of up to 10 years (Johnstone et al., 2005),showed that the significant positive correlations with RAVLTremained within the thalamic nuclei in the HR population as awhole and the HR ill group. However, the increase in thenumber of subjects who experienced psychotic or possiblypsychotic symptoms from the HR well group (n=26 to n=55)eliminated the association between the right parahippocampalgyrus and RAVLT in the HR+ group. As expected, thecorrelation of the SIS within the pulvinar was also lost. Thus,these associations seem to reflect psychopathology at the timeof baseline scanning rather than what could be described asliabilities to psychopathology.
Although this hypothesis-driven study has many strengthsincluding the large number of unmedicated subjects at high risk ofschizophrenia, we acknowledge that in using voxel-basedmorphometry, it is restricted by the by the limitations inherent tothis technique. These were described by Ashburner and Friston(2001). It is acknowledged that VBM is sensitive to systematicshape differences, so we have attempted to reduce the possibility ofstructural, non-grey matter differences giving significant results byfollowing Good’s method and basing the spatial normalisation onthe segmented grey matter (Good et al., 2001). In addition,significant (p-corrected) results in VBM allow us to reject the nullhypothesis but do not provide any additional information about thedata. Therefore, we exported the data into SPSS to determine thestrength of the correlations between function and GMD at thatvoxel as found in VBM. Since all show highly statistically
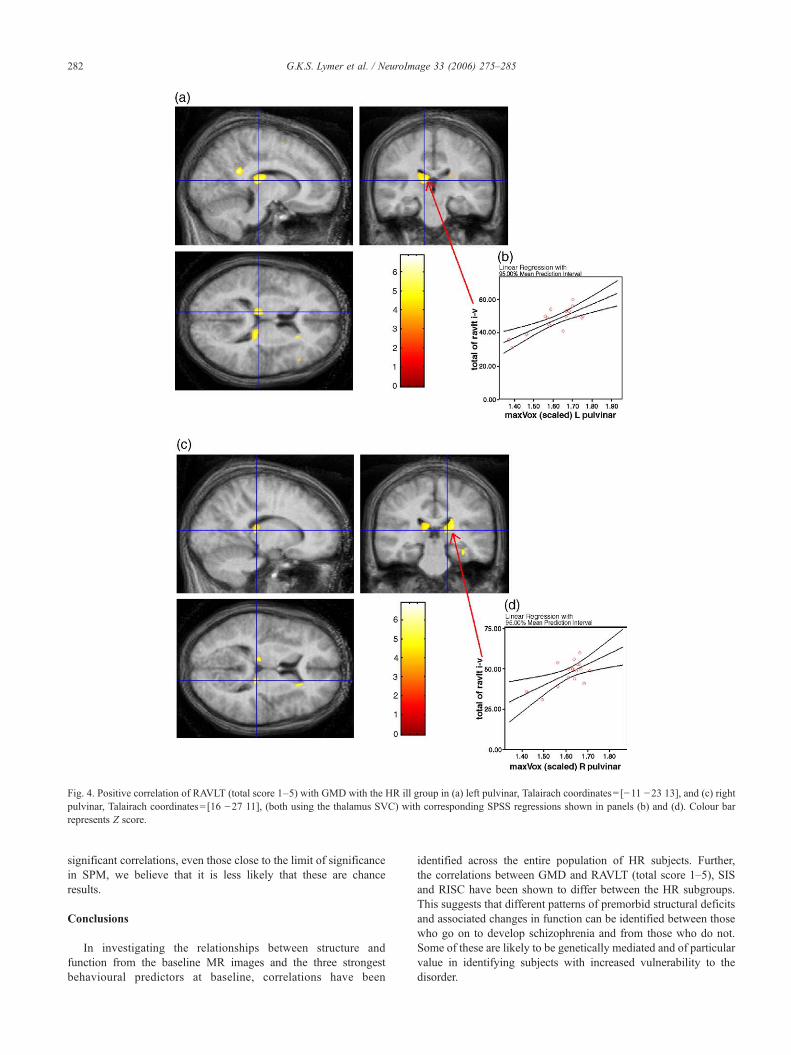
Fig. 4. Positive correlation of RAVLT (total score 1–5) with GMD with the HR ill group in (a) left pulvinar, Talairach coordinates= [−11 −23 13], and (c) rightpulvinar, Talairach coordinates= [16 −27 11], (both using the thalamus SVC) with corresponding SPSS regressions shown in panels (b) and (d). Colour barrepresents Z score.
282 G.K.S. Lymer et al. / NeuroImage 33 (2006) 275–285
significant correlations, even those close to the limit of significancein SPM, we believe that it is less likely that these are chanceresults.
Conclusions
In investigating the relationships between structure andfunction from the baseline MR images and the three strongestbehavioural predictors at baseline, correlations have been
identified across the entire population of HR subjects. Further,the correlations between GMD and RAVLT (total score 1–5), SISand RISC have been shown to differ between the HR subgroups.This suggests that different patterns of premorbid structural deficitsand associated changes in function can be identified between thosewho go on to develop schizophrenia and from those who do not.Some of these are likely to be genetically mediated and of particularvalue in identifying subjects with increased vulnerability to thedisorder.
283G.K.S. Lymer et al. / NeuroImage 33 (2006) 275–285
Examination of the structure–function relationships in the HR+and HR ill groups is able to provide further insight into the genesisof schizophrenia. This appears to be particularly true of theevolution of the structural correlations with RAVLTacross the high-risk groups, as a proxy for changing relationships as the illnessdevelops. Across the cohort as a whole, we found correlations in themedial dorsal nucleus, consistent with previously reported associa-tions between verbal learning and memory in the thalamic nucleusresponsible for memory performance (van der Werf et al., 2003;Hazlett et al., 2004; Thermenos et al., 2004). In those withpsychotic symptoms (HR+), the association is found in the rightparrahippocampal gyrus and is again negatively correlated withRAVLT score. These relationships are not however of pathologicalsignificance. The predictive loss ofmemory performance in the HR+population did not have the same association in those who went ontodevelop schizophrenia, who had expected positive correlationsfound bilaterally within the pulvinar some 2–3 years on averagebefore illness onset. These, and similarly complex patterns of brainrelationships with schizotypy, suggest there are dynamic andchanging structural–functional relationships in those at risk ofschizophrenia and in those who will get it.
Acknowledgments
We would like to thank all the subjects and family members fortheir participation in this study. This work was funded by the UKMedical Research Council. G.K.S.L., D.E.J., A.M.M. and S.M.L.are all supported by the Sackler Foundation.
References
Andreasen, N.C., Arndt, S., Swayze II, V., Cizaldo, T., Flaum, M., O'Leary,D., Ehrhardt, J.C., Yuh, W.T.C., 1994. Thalamic abnormalities inschizophrenia visualized through magnetic resonance image averaging.Science 266, 294–298.
Antonova, E., Sharma, T., Morris, R., Kumari, V., 2004. The relationshipbetween brain structure and neurocognition in schizophrenia: a selectivereview. Schizophr. Res. 70, 117–145.
Antonova, E., Kumari, V., Morris, R., Halari, R., Anilkumar, A., Mehrotra,R., Sharma, T., 2005. The relationship of structural alterations tocognitive deficits in schizophrenia: a voxel-based morphometry study.Biol. Psychiatry 58, 457–467.
Ashburner, J., Friston, K.J., 2000. Voxel-based morphometry—Themethods. NeuroImage 11, 805–821.
Ashburner, J., Friston, K.J., 2001. Why voxel-based morphometry should beused. NeuroImage 14, 1238–1243.
Barta, P.E., Pearlson, G.D., Powers, R.E., Richards, S.S., Tune, L.E., 1990.Auditory hallucinations and smaller superior temporal gyral volume inschizophrenia. Am. J. Psychiatry 147, 1457–1462.
Becker, T., Elmer, K., Schneider, M., Grodd, W., Bartels, M., Heckers, S.,Beckman, H., 1996. Confirmation of reduced temporal limbic structurevolume on magnetic resonance imaging in male patients withschizophrenia. Psychiatry Res. 67, 135–143.
Brett, M., 1999. The MNI brain and the Talairach atlas. MRC Cognition andBrain Sciences Unit. http://www.mrc-cbu.cam.ac.uk/Imaging/Common/mnispace.shtml.
Brewer, W.J., Francey, S.M., Wood, S.J., Jackson, H.J., Pantelis, C.,Phillips, L.J., Yung, A.R., Anderson, V.A., McGorry, P.D., 2005.Memory impairments identified in people at ultra-high risk forpsychosis who later develop first-episode psychosis. Am. J. Psychiatry162, 71–78.
Buchsbaum, M.S., Someya, T., Ying Teng, C., Abel, L., Chin, S., Najafi, A.,
Haier, R.J., Wu, J., Bunney, W.E., 1996. PETandMRI of the thalamus innever-medicated patients with schizophrenia. Am. J. Psychiatry 153,191–199.
Byne, W., Buchsbaum, M.S., Kemether, E., Hazlett, E.A., Shinwari, A.,Mitropoulou, V., 2001. Magnetic resonance imaging of the thalamicmediodorsal nucleus and pulvinar in schizophrenia and schizotypalpersonality disorder. Arch. Gen. Psychiatry 58, 133–140.
Byne, W., Buchsbaum, M.S., Mattiace, L.A., Hazlett, E.A., Kemether, E.,Elhakem, S.L., Purohit, D.P., Haroutunian, V., Jones, L., 2002.Postmortem assessment of thalamic nuclear volumes in subjects withschizophrenia. Am. J. Psychiatry 159, 59–65.
Byrne, M., Hodges, A., Grant, E., Owens, D.G.C., Johnstone, E.C., 1999.Neuropsychological assessment of young people at high genetic risk fordeveloping schizophrenia compared with controls: preliminary findingsof the Edinburgh High Risk Study (EHRS). Psychol. Med. 29,1161–1173.
Byrne, M., Clafferty, B.A., Cosway, R., Grant, E., Hodges, A., Whalley,H.C., Lawrie, S.M., Owens, D.G.C., Johnstone, E.C., 2003. Neuro-pychology, genetic liability, and psychotic symptoms in those at highrisk of schizophrenia. J. Abnorm. Psychol. 112, 38–48.
Cannon, T.D., Eyler Zorrilla, L., Shtasel, D., Gur, R.E., Gur, R.C., Marco,E.J., Moberg, P., Price, A., 1994. Neuropsychological functioning insiblings discordant for schizophrenia and healthy volunteers. Arch.Gen. Psychiatry 51, 651–661.
Choi, J.-S., Kang, D.-H., Kim, J.-J., Ha, T.-H., Roh, K.S., Youn, T., Kwon,J.S., 2005. Decreased caudal anterior cingulate gyrus volume andpositive symptoms in schizophrenia. Psychiatry Res.: Neuroimaging139, 239–247.
Clinton, S.M., Meador-Woodruff, J.H., 2004. Thalamic dysfunction inschizophrenia: neurochemical, neuropathological, and in vivo imagingabnormalities. Schizophr. Res. 69, 237–253.
Crespo-Facorro, B., Paradiso, S., Andreasen, N.C., O'Leary, D.S., Watkins,L., Boles Ponto, L.L., Hichwa, R.D., 1999. Recalling word lists reveals“cognitive dysmetria” in schizophrenia: a positron emission tomographystudy. Am. J. Psychiatry 156, 386–392.
Danos, P., Schmidt, A., Baumann, B., Bernstein, H.-G., Nothoff, G., Stauch,R., Krell, D., Bogerts, B., 2005. Volume and neuron number of themediodorsal thalamic nuclei in schizophrenia: a replication study.Psychiatry Res. 140, 281–289.
Dazzan, P., Morgan, K.D., Orr, K.G., Hutchinson, G., Chitnis, X., Suckling,J., Fearon, P., Salvo, J., McGuire, P.K., Mallett, R.M., Jones, P.B., Leff,J., Murray, R.M., 2004. The structural brain correlates of neurologicalsoft signs in AESOP first-episode psychoses study. Brain 127, 143–153.
Dickey, C.C., McCarley, R.W., Voglmaier, M.M., Niznikiewicz, M.A.,Siedman, L.J., Demeo, S., Frumin, M., Shenton, M.E., 2003. An MRIstudy of superior temporal gyrus volume in women with schizotypalpersonality disorder. Am. J. Psychiatry 160, 2198–2201.
Faraone, S.V., Seidman, L.J., Kremen, W.S., Pepple, J.R., Lyons, M.J.,Tsuang, M.T., 1995. Neuropsychological functioning among thenonpyschotic relatives of schizophrenic patients: a diagnosticefficiency analysis. J. Abnorm. Psychol. 104, 286–304.
Faraone, S.V., Seidman, L.J., Kremen, W.S., Toomey, R., Pepple, J.R.,Tsuang, M.T., 1999. Interest functioning among the non psychoticrelatives of schizophrenic patients: a 4-year follow-up study. J. Abnorm.Psychol. 108, 176–181.
Flaum, M., Andreasen, N.C., Swayze II, V.W., O'Leary, D.S., Alliger, R.J.,1994. IQ and brain size in schizophrenia. Psychiatry Res. 53, 243–257.
Flaum, M., Swayze II, V.W., O'Leary, D.S., Yuh, W.T.C., Ehrhardt, J.C.,Arndt, S.V., Andreasen, N.C., 1995. Effects of diagnosis, laterality, andgender on brain morphology in schizophrenia. Am. J. Psychiatry 152,704–714.
Good, C.D., Johnstrude, I.S., Ashburner, J., Henson, R.N.A., Friston, K.J.,Frackowiak, R.S.J., 2001. A voxel-based morphometric study of ageingin 465 normal adult human brains. NeuroImage 14, 21–36.
Grasby, P.M., Frith, C.D., Friston, K.J., Bench, C., Frackowiak, R.S., Dolan,R.J., 1993. Functional mapping of brain areas implicated in auditory–verbal memory function. Brain 116, 1–20.
284 G.K.S. Lymer et al. / NeuroImage 33 (2006) 275–285
Grasby, P.M., Frith, C.D., Friston, K.J., Simpson, J., Fletcher, P.C.,Frackowiak, R.S., Dolan, R.J., 1994. A graded task approach to thefunctional mapping of areas implication in auditory–verbal memory.Brain 117, 1271–1282.
Gur, R.E., Maany, V., Mozley, D., Swanson, C., Bilker, W., Gur, R.C., 1998.Subcortical MRI volumes in neuroleptic-naive and treated patients withschizophrenia. Am. J. Psychiatry 155, 1711–1717.
Gur, R.E., Turetsky, B.I., Cowell, P.E., Finkelman, C., Maany, V., Grossman,R.I., Arnold, S.E., Bilker, W.B., Gur, R.C., 2000. Temporolimbic volumereductions in schizophrenia. Arch. Gen. Psychiatry 57, 769–775.
Harris, J.M., Whalley, H.C., Yates, S., Miller, P., Johnstone, E.C., Lawrie, S.M., 2004. Abnormal cortical folding in high-risk individuals: a predictorof the development of schizophrenia? Biol. Psychiatry 56, 182–189.
Harrison, P.J., 1999. The neuropathology of schizophrenia. A critical reviewof the data and their interpretation. Brain 122, 593–624.
Hazlett, E.A., Buchsbaum, B.R., Byne, W., Wei, T.-C., Speigel-Cohen, J.,Geneve, C., Kinderlehrer, R., Haznedar, M.M., Shihabuddin, L., Siever,L.J., 1999. Three-dimensional analysis with MRI and PET of the size,shape, and function of the thalamus in the schizophrenic spectrum. Am.J. Psychiatry 156, 1190–1199.
Hazlett, E.A., Buchsbaum, M.S., Kemether, E., Bloom, R., Platholi, J.,Brickman, A.M., Shihabuddin, L., Tang, C., Byne, W., 2004. Abnormalglucose metabolism in the mediodorsal nucleus of the thalamus inschizophrenia. Am. J. Psychiatry 161, 305–314.
Hodges, A., Byrne, M., Grant, E., Johnstone, E.C., 1999. People at risk ofschizophrenia sample characteristics of the first 100 cases in theEdinburgh High-risk Study. Br. J. Psychiatry 174, 547–553.
Hoenig, J., Turner, T., 1995. Schizophrenia. In: Berrios, G.E., Porter, R.(Eds.), A History of Clinical Psychiatry. Athlone, London.
Holinger, D.P., Shenton, M.E., Wible, C.G., Donnino, R., Kikinis, R.,Jolesz, F.A., McCarley, R.W., 1999. Superior temporal gyrus volumeabnormalities and thought disorder in left-handed schizophrenic men.Am. J. Psychiatry 156, 1730–1735.
Innocenti, G.M., Ansermet, F., Parnas, J., 2003. Schizophrenia,neurodevelopment and corpus callosum. Mol. Psychiatry 8, 261–274.
Jayakumar, P.N., Venkatasubramanian, G., Gangadhar, B.N., Janakiramaiah,N., Keshavan, M.S., 2005. Optimized voxel-based mophometry of graymatter volume in first-episode, antipsychotic-naive schizophrenia. Prog.Neuro-Psychopharmacol. Biol. Psychiatry 29, 587–591.
Job, D.E., Whalley, H.C., McConnell, S., Glabus, M., Johnstone, E.C.,Lawrie, S.M., 2002. Structural gray matter differences between first-episode schizophrenics and normal controls using voxel-basedmorphometry. NeuroImage 17, 880–889.
Job, D.E., Whalley, H.C., McConnell, S., Glabus, M., Johnstone, E.C.,Lawrie, S.M., 2003. Voxel-based morphometry of grey matter densitiesin subjects at high risk of schizophrenia. Schizophr. Res. 64, 1–13.
Job, D.E., Whalley, H.C., Johnstone, E.C., Lawrie, S.M., 2005. Grey matterchanges over time in high risk subjects developing schizophrenia.NeuroImage 25, 544–552.
Johnstone, E.C., Owens, D.G.C., 2004. Early studies of brain anatomy inschizophrenia. In: Lawrie, S.M., et al. (Ed.), Schizophrenia: fromNeuroimaging to Neuroscience. Oxford Univ. Press, Oxford, pp. 1–19.
Johnstone, E.C., Frith, C.D., Crow, T.J., Husband, J., Kreel, L., 1976.Cerebral ventricular size and cognitive impairment in chronicschizophrenia. Lancet 2, 924–926.
Johnstone, E.C., Abukmeil, S.S., Byrne, M., Clafferty, R., Grant, E.,Hodges, A., Lawrie, S.M., Owens, D.G.C., 2000. Edinburgh high riskstudy—Findings after four years: demographic, attainment andpsychopathological issues. Schizophr. Res. 46, 1–15.
Johnstone, E.C., Ebmeir, K.P., Miller, P., Owens, D.G.C., Lawrie, S.M.,2005. Predicting schizoprenia: findings from the Edinburgh High-riskStudy. Br. J. Psychiatry 186, 18–25.
Kendler, K.S., Lieberman, J.A., Walsh, D., 1989. The Structured Interviewfor Schizotypy (SIS): a preliminary report. Schizophr. Bull. 15, 559–571.
Kolb, B., Whishaw, I.Q., 1983. Performance of schizophrenic patients ontest sensitive to left or right frontal, temporal, or parietal function inneurological patients. J. Nerv. Ment. Dis. 171, 435–443.
Kremen, W.S., Seidman, L.J., Pepple, J.R., Lyons, M.J., Tsuang, M.T.,Faraone, S.V., 1994. Neuropsychological risk indicators forschizophrenia: a review of family studies. Schizophr. Bull. 20, 119–130.
Lawrie, S.M., Abukmeil, S.S., 1998. Brain abnormality in schizophrenia.Br. J. Psychiatry 172, 110–120.
Lawrie, S.M., Whalley, H.C., Kestelman, J.N., Abukmeil, S.S., Byrne, M.,Hodges, A., Rimmington, J.E., Best, J.J.K., Owens, D.G.C., Johnstone,E.C., 1999. Magnetic resonance imaging of brain in people at high riskof developing schizophrenia. Lancet 353, 30–33.
Lawrie, S.M., Whalley, H.C., Abukmeil, S.S., Kestelman, J.N., Donnelly,L., Miller, P., Best, J.J.K., Owens, D.G.C., Johnstone, E.C., 2001. Brainstructure, genetic liability, and psychotic symptoms in subjects at highrisk of developing schizophrenia. Biol. Psychiatry 49, 811–823.
Lehrer, D.S., Christian, B.T., Mantil, J., Murray, A.C., Buchsbaum, B.R.,Oakes, T.R., Byne, W., Kemether, E.M., Buchsbaum, M.S., 2005.Thalamic and prefrontal FDG uptake in never medicated patients withschizophrenia. Am. J. Psychiatry 162, 931–938.
Lewis, S.W., 1990. Computerised tomography in schizophrenia 15 years on.Br. J. Psychiatry 157, 16–24.
Lezak, M.D., 1995. Neuropsychological Assessment. Oxford Univ. Press.Matsumoto, H., Simmons, A., Williams, S., Hadjulis, M., Pipe, R., Murray,
R., Frangou, S., 2001. Superior temporal gyrus abnormalities in early-onset schizophrenia: similarities and differences with adult-onsetschizophrenia. Am. J. Psychiatry 158, 1299–1304.
Menon, R.R., Barta, P.E., Aylward, E.H., Richards, S.S., Vaughn, D.D., Tien,A.Y., Harris, G.J., Pearlson, G.D., 1995. Posterior superior temporalgyrus in schizophrenia: grey matter changes and clinical correlates.Schizophr. Res. 16, 127–135.
Miller, P., Byrne, M., Hodges, A., Lawrie, S.M., Owens, D.G.C., Johnstone,E.C., 2002a. Schizotypal components in people at high risk ofdeveloping schizophrenia: early findings from the Edinburgh High-risk Study. Br. J. Psychiatry 180, 179–184.
Miller, P.M., Lawrie, S.M., Byrne, M., Cosway, R., Johnstone, E.C., 2002b.Self-rated schizotypal cognitions, psychotic symptoms and the onset ofschizophrenia in young people at high risk of schizophrenia. ActaPsychiatr. Scand. 105, 341–345.
Mitelman, S.A., Byne, W., Kemether, E.M., Hazlett, E.A., Buchsbaum,M.S., 2005a. Metabolic disconnection between the mediodorsalnucleus of the thalamus and cortical Brodmann's areas of the lefthemisphere in schizophrenia. Am. J. Psychiatry 162, 1733–1735.
Mitelman, S.A., Shihabuddin, L., Brickman, A.M., Buchsbaum, M.S.,2005b. Cortical intercorrelations of temporal area volumes in schizo-phrenia. Schizophr. Res. 76, 207–229.
Mitelman, S.A., Byne,W., Kemether, E.M., Hazlett, E.A., Buchsbaum,M.S.,2006. Correlations between volumes of the pulvinar, centromedian, andmediodorsal nuclei and cortical Brodmann's areas in schizophrenia.Neurosci. Lett. 392, 16–21.
Moorhead, T.W.J., Job, D.E., Whalley, H.C., Sanderson, T.L., Johnstone, E.C., Lawrie, S.M., 2004. Voxel-based morphometry of comorbidschizophrenia and learning disability: analyses in normalised and nativespaces using parametric and nonparametric statistical methods.NeuroImage 22, 188–202.
Nestor, P.G., Shenton, M.E., McCarley, R.W., Haimson, J., Smith, R.S.,O'Donnell, B., Kimble, M., Kikinis, R., Jolesz, F.A., 1993. Neuropsy-chological correlates of MRI temporal lobe abnormalities in schizo-phrenia. Am. J. Psychiatry 150, 1849–1855.
Nestor, P.G., Shenton, M.E., O'Donnell, B., McCarley, R.W., Wible, C.G.,1995. Letter to the Editor. Am. J. Psychiatry 152, 475–476.
Nestor, P.G., O'Donnell, B.F., McCarley, R.W., Niznikiewicz, M.A.,Barnard, J., Jen Shen, Z., Bookstein, F.L., Shenton, M.E., 2002. A newstatistical method for testing hypotheses of neuropsychological/MRIrelationships in schizophrenia: partial least squares analysis. Schizophr.Res. 53, 57–66.
O'Driscoll, G.A., Florencio, P.S., Gagnon, D., Wolff, A.-L.V., Benkelfat, C.,Mikula, L., Lal, S., Evans, A.C., 2001. Amygdala–hippocampal volumeand verbal memory in first-degree relatives of schizophrenic patients.Psychiatry Res. 107, 75–85.
285G.K.S. Lymer et al. / NeuroImage 33 (2006) 275–285
Pakkenberg, B., 1990. Pronounced reduction of total neuron number inmediodorsal thalamic nucleus and nucleus accumbens in schizophrenics.Arch. Gen. Psychiatry 47, 1023–1028.
Pakkenberg, B., 1992. The volume of the mediodorsal thalamic nucleus intreated and untreated schizophrenics. Schizophr. Res. 7, 95–100.
Ragland, J.D., Gur, R.C., Raz, J., Schroeder, L., Kohler, C.G., Smith, R.J.,Alavi, A., Gur, R.E., 2001. Effect of schizophrenia on frontotemporalactivity during word encoding and recognition: a PET cerebral bloodflow study. Am. J. Psychiatry 158, 1114–1125.
Ragland, J.D., Gur, R.C., Valdez, J.N., Loughead, J., Elliot, M., Kohler, C.,Kanes, S., Siegle, S.J., Moelter, S.T., Gur, R.E., 2005. Levels-of-processing effect on frontotemporal function in schizophrenia duringword encoding and recognition. Am. J. Psychiatry 162, 1840–1848.
Rajarethinam, R.P., DeQuardo, J.R., Nalepa, R., Tandon, R., 2000. Superiortemporal gyrus in schizophrenia: a volumetic magnetic resonanceimaging study. Schizophr. Res. 41, 303–312.
Rey, A., 1964. L'examen clinique en psychologie. Presses Universitaires deFrance, Paris.
Rust, J., 1988. The Rust Inventory of Schizoptypal Cognitions (RISC).Schizophr. Bull. 14, 317–322.
Ruz, M., Wolmetz, M.E., Tudela, O., McCandliss, B.D., 2005. Two brainpathways for attended and ignored words. NeuroImage 27, 852–861.
Sanfilipo, M., Lafargue, T., Rusinek, H., Arena, L., Loneragan, C., Lautin,A., Rotrosen, J., Wolkin, A., 2002. Cognitive performance inschizophrenia: relationship to regional brain volumes and psychiatricsymptoms. Psychiatry Res.: Neuroimaging 116, 1–23.
Saykin, A.J., Gur, R.C., Gur, R.E., Mozley, P.D., Mozley, L.H., Resnick,S.M., Kester, B., Stafiniak, P., 1991. Neuropsychological function inschizophrenia: selective impairment in memory and learning. Arch.Gen. Psychiatry 48, 618–624.
Seidman, L.J., Faraone, S.V., Goldstein, J.M., Goodman, J.M., Kremen,W.S., Matsuda, G., Hoge, E.A., Kennedy, D., Makris, N., Caviness,V.S., Tsuang, M.T., 1997. Reduced subcortical brain volumes in non-psychotic siblings of schizophrenic patients: a pilot magnetic resonanceimaging study. Am. J. Med. Genet., Neuropsychiatr. Genet. 74,507–514.
Seidman, L.J., Faraone, S.V., Goldstein, J.M., Goodman, J.M., Kremen,W.S., Toomey, R., Tourville, J., Kennedy, D., Makris, N., Caviness, V.S.,Tsuang, M.T., 1999. Thalamic and amygdala–hippocampal volumereductions in first-degree relatives of patients with schizophrenia: anMRI-based morphometric analysis. Biol. Psychiatry 46, 941–954.
Shenton, M.E., Kikinis, R., Jolesz, F.A., Pollak, S.D., LeMay, M., Wible,C.G., Hokama, H., Martin, J., Metcalf, D., Coleman, M., McCarley,R.W., 1992. Abnormalities of the left temporal lobe and thoughtdisorder in schizophrenia. N. Engl. J. Med. 327, 604–612.
Shenton, M.E., Dickey, C.C., Frumin, M., McCarley, R.W., 2001. A reviewof MRI findings in schizophrenia. Schizophr. Res. 49, 1–52.
Staal, W.G., Hulshoff Pol, H.E., Schnack, H., van der Schot, A.C., Kahn,R.S., 1998. Partial volume decrease of the thalamus in relatives ofpatients with schizophrenia. Am. J. Psychiatry 155, 1784–1786.
Sullivan, E.V., Shear, P.K., Lim, K.O., Zipursky, R.B., Pfefferbaum, A.,1996. Cognitive and motor impairments are related to gray mattervolume deficits in schizophrenia. Biol. Psychiatry 39, 234–240.
Talairach, J., Tournoux, P., 1998. Co-Planar Stereotaxic Atlas of the HumanBrain. Thieme, Stuttgart.
Thermenos, H.W., Seidman, L.J., Breiter, H., Goldstein, J.M., Goodman,J.M., Poldrack, R., Faraone, S.V., Tsuang, M.T., 2004. Functionalmagnetic resonance imaging during auditory verbal working memoryin nonpsychotic relatives of persons with schizophrenia: a pilot study.Biol. Psychiatry 55, 490–500.
Toulopoulou, T., Grech, A., Morris, R.G., Schulze, K., McDonald, C.,Chapple, B., Rabe-Hesketh, S., Murray, R.M., 2004. The relationshipbetween volumetric brain changes and cognitive function: a family studyon schizophrenia. Biol. Psychiatry 56, 447–453.
vanderWerf,Y.D.,Jolles,J.,Witter,M.P.,Uylings,H.B.M.,2003.Contributionsof thalamic nuclei to declarative memory functioning. Cortex 39,1047–1062.
Villeneuve, M.Y., Kupers, R., Gjedde, A., Ptito, M., Casanova, C., 2005.Pattern-motion selectivity in the human pulvinar. NeuroImage 28,474–480.
Vita, A., Massimiliano, D., Marco Giobbio, G., Caputo, A., Ghiringhelli, L.,Comazzi, M., Garbarini, M., Paolo Mednini, A., Morganti, C., Tenconi,F., Cesana, B., Inverinizzi, G., 1995. Language and thought disorderin schizophrenia: brain morphological correlates. Schizophr. Res. 15,243–251.
Whalley, H.C., Simonotto, E., Flett, S., Marshall, I., Ebmeir, K.P., Owens,D.G.C., Goddard, N.H., Lawrie, S.M., 2004. fMRI correlates of stateand trait effects in subjects at genetically enhanced risk of schizophrenia.Brain 127, 478–490.
Whitford, T.J., Farrow, T.F.D., Gomes, L., Brennan, J., Harris, A.W.F.,Williams, L.M., 2005. Grey matter deficits and symptom profile in firstepisode schizophrenia. Psychiatry Res.: Neuroimaging 139, 229–238.
Whyte, M.-C., Brett, C., Harrison, L.K., Byrne, M., Miller, P., Lawrie,S.M., Johnstone, E.C., 2006. Neuropsychological performance overtime in people at high risk of developing schizophrenia andcontrols. Biol. Psychiatry 59, 730–739.
Wieckert, T.W., Goldberg, T.E., Gold, J.M., Bigelow, L.B., Egan, M.F.,Weinberger, D.R., 2000. Cognitive impairments in patients withschizophrenia displaying persevered and compromised intellect. Arch.Gen. Psychiatry 57, 907–913.
Related Documents