and number of visual cortical neurons are reduced in am blyopia (7). COrtical cells receiving input from affected cell layersof thelateralgemculateis knownto showabnormal orabsentsensitivityto retinallightstimulationof theam blyopic eye (8, 9). PET studies in amblyopic humans, using }I2'@Oasanindicator of cerebral bloodflow and‘8F- fluorodeoxyglucose as an indicator of glucose metabolism, havedisclosedthattheneuronalactivityis reducedinthe part of the visual cortex connected to the amblyopic eye (10). Other studies using PET have demonstrated in creased metabolism of the visual cortex during ictal visual hallucinations and decreased perfusion in cases of visual cortex ischemia (11—14). Recently, Woods et al. showed that SPECF can detect regional cerebral blood flow (rCBF) increase in the visual cortex with visual stimulation (15). The clinical utility of brain SPECF has also been documented in patients with cortical visual loss, even in those patients who had normal ornondiagnosticMRI(16,17). This study evaluates visual cortex response to visual stimulation with brain SPECT in amblyopic patients and its usefulness in the diagnosis of amblyopia. MATERIALS AND METHODS Patients Tenpatients(4 men, 6 women;age range,8—14 yr) with uni lateralamblyopia strabismusecondary torefractiveerrorswere studied.Thevisualacuityoftheamblyopiceyerangedfrom3m counting fingers (met) to 20/100 as measured with the Snellen acuity testing (18) and did not improvewith treatment. StimulatIon All patientshadtwo separatestudies.Beforeeachstudy,pa tientswere placedin a dark, silentroomfor 10mmto adjustto the darkness.Afterclosingone eye,visualstimulationwas performed in five patients for 2 mm using a black-and-white checkerboard pattern reversal with a frequency of 2 Hz. The other five patients were stimulatedwith a 2-Hzstrobe lightflash. For stimulation,a 2-Hz frequency was used because it was the routine rate for the visual-evokedpotential(VEP)recordingsof the pediatricpatients in our ophthalmology department. The strobe light and pattern reversal screen were placed 50 cm from the patients who were asked to look directlyat the stimulusand stay motionless.While the patients were under visual stimulation, 500—550 MBq @Tc HMPAO (Ceretec Amersham, Inc., Amersham, UK, prepared Inamblyopia, thenumberofvisualcortical neuronsare reduced andabnormalorabsentsensitivity to retinallightstimulationof the amblyopiceye is demonstrated. Ten amblyopicpatients werestudiedto evaluatethe responseof the visualcortexto visualstimulation. Methods:Allpatientswithunilateral amblyo piarecehied500-550MBq @rc-HMPAO duringvieualstimu lation.Strobelightflashingwas usedas the stimulusfor five patients and a checkerboard pattern reversal was used in the otherfive patients,closingone eye. For bothgroupsa 2-Hz frequency was used. One week later, the same procedurewas repeatedwiththe oppositeeyeclosed.SPECTImageswere reconstructedwithpreMeringtechniquesandslicedalongthe orbitomeatal line.Results:Forall patients,the amblyopiceye demonstrated lessradioactivity in the visualcortexthan in the normaleye.Themeancerebral-to-cerebellar ratioswere0.95± 0.05 and I.09 ±0.07 for amblyopicand normaleyes, respec tively (p < 0.0001). ConclusIon: Visual cortex response of the amt$yor@c eyeto lightstimulationwasseverelyreducedwhen compared to the normaleye. KeyWords:visualcortex;ambEyopia; brainsingle-phOton emis sion computed tomography visual neuroactlvatlon; visual evokedpotentials J NucIMed1995;36:1170—1174 mblyopia is classically defined as a unilateral or bi lateral decrease of visual acuity in the absence of ophthal mologically visible abnormalities (1,2). Amblyopia occurs in 2% of the general population. The most common types of amblyopia are those secondary to strabismus and un equal refractive errors. Early diagnosis and onset of treat ment are essential to a favorable outcome and management of amblyopia and other associated serious conditions (1,2). Diagnostic techniques for amblyopia vary according to pa tient age. A satisfactory method, however, for reliably measuring monocular visual acuities in infants and young children is still lacking (1—6). Experimental studies have demonstrated that the size Received Jun.15,1994; revision acce@ed Nov.1,1994. For correspondenceor reprintscor@ LeventK@as@caI, MD,Cerrahpesa •flp FsiUteSI,NUkIeerflpMsi@EimDali,AJsaay,Istanbul,Turkey. I 170 TheJournal ofNudearMedicine • Vol.36 • No.7 • July1995 Brain SPECT Evaluation of the Visual Cortex in Amblyopia Levent Kabasakal, Kazim Dewano@lu,Osman Arslan, Tanju Yusuf Erdil, Kenm Söumezo@,lu, Ihami Uslu, Hayati Tolun, Ali T. Isitman, Kutlan Ozker and @etin Onsel DepartmenL@ofNuclear Medicine and Ophthalmology, Cerrahpa@a Medical Facuhy oflstanbu! University, Istanbu4 Turkey by on June 24, 2015. For personal use only. jnm.snmjournals.org Downloaded from

Welcome message from author
This document is posted to help you gain knowledge. Please leave a comment to let me know what you think about it! Share it to your friends and learn new things together.
Transcript
and number of visual cortical neurons are reduced in amblyopia (7). COrtical cells receiving input from affected celllayersof thelateralgemculateis knownto showabnormalor absentsensitivityto retinallightstimulationof the amblyopic eye (8,9). PET studies in amblyopic humans, using}I2'@Oas an indicatorof cerebralbloodflowand‘8F-fluorodeoxyglucose as an indicator of glucose metabolism,havedisclosedthatthe neuronalactivityis reducedin thepart of the visual cortex connected to the amblyopic eye(10). Other studies using PET have demonstrated increased metabolism of the visual cortex during ictal visualhallucinations and decreased perfusion in cases of visualcortex ischemia (11—14).
Recently, Woods et al. showed that SPECF can detectregional cerebral blood flow (rCBF) increase in the visualcortex with visual stimulation (15). The clinical utility ofbrain SPECF has also been documentedin patients withcortical visual loss, even in those patients who had normalor nondiagnosticMRI(16,17).
This study evaluates visual cortex response to visualstimulation with brain SPECT in amblyopic patients and itsusefulness in the diagnosis of amblyopia.
MATERIALS AND METHODS
PatientsTenpatients(4 men,6 women;agerange,8—14yr)withuni
lateralamblyopiastrabismussecondaryto refractiveerrorswerestudied.Thevisualacuityof theamblyopiceye rangedfrom3 mcounting fingers (met) to 20/100 as measured with the Snellenacuity testing(18)and did not improvewith treatment.
StimulatIonAll patientshadtwo separatestudies.Beforeeachstudy,pa
tientswereplacedin a dark, silentroomfor 10mmto adjustto thedarkness.Afterclosingoneeye,visualstimulationwas performedin five patients for 2 mm using a black-and-white checkerboardpattern reversal with a frequency of 2 Hz. The other five patientswere stimulatedwith a 2-Hzstrobe lightflash.For stimulation,a2-Hz frequency was used because it was the routine rate for thevisual-evokedpotential(VEP)recordingsof the pediatricpatientsin our ophthalmology department. The strobe light and patternreversal screen were placed 50 cm from the patients who wereasked to lookdirectlyat the stimulusand stay motionless.Whilethe patients were undervisual stimulation, 500—550MBq @TcHMPAO (Ceretec Amersham, Inc., Amersham, UK, prepared
Inamblyopia,the numberofvisualcorticalneuronsare reducedandabnormalor absentsensitivityto retinallightstimulationofthe amblyopiceye is demonstrated.Ten amblyopicpatientswere studiedto evaluatethe responseof the visualcortextovisualstimulation.Methods:All patientswithunilateralamblyopiarecehied500-550MBq @rc-HMPAOduringvieualstimulation.Strobelightflashingwas usedas the stimulusfor fivepatients and a checkerboard pattern reversal was used in theotherfive patients,closingone eye. For both groupsa 2-Hzfrequencywas used. One week later, the same procedurewasrepeatedwith the oppositeeye closed.SPECTImageswerereconstructedwithpreMeringtechniquesand slicedalongtheorbitomeatalline.Results: Forall patients,the amblyopiceyedemonstratedlessradioactivityin the visualcortexthan in thenormaleye.Themeancerebral-to-cerebellarratioswere0.95±0.05 and I .09 ±0.07 for amblyopicand normal eyes, respectively (p < 0.0001).ConclusIon: Visual cortex responseof theamt$yor@ceyeto lightstimulationwas severelyreducedwhencomparedto the normaleye.
KeyWords:visualcortex;ambEyopia;brainsingle-phOtonemission computed tomography visual neuroactlvatlon; visualevokedpotentials
J NucIMed1995;36:1170—1174
mblyopia is classically defined as a unilateral or bilateraldecrease of visual acuity in the absence of ophthalmologically visible abnormalities (1,2). Amblyopia occursin 2% of the general population. The most common typesof amblyopia are those secondary to strabismus and unequal refractive errors. Early diagnosis and onset of treatment are essential to a favorableoutcome andmanagementof amblyopiaandother associated serious conditions (1,2).Diagnostic techniques for amblyopia vary according to patient age. A satisfactory method, however, for reliablymeasuring monocularvisual acuities in infants and youngchildren is still lacking (1—6).
Experimental studies have demonstrated that the size
ReceivedJun.15,1994;[email protected],1994.Forcorrespondenceor reprintscor@ LeventK@as@caI,MD,Cerrahpesa
•flpFsiUteSI,NUkIeerflpMsi@EimDali,AJsaay, Istanbul,Turkey.
I 170 TheJournalofNudearMedicine•Vol.36•No.7 •July1995
Brain SPECT Evaluation of the Visual Cortexin AmblyopiaLevent Kabasakal, Kazim Dewano@lu,Osman Arslan, Tanju Yusuf Erdil, Kenm Söumezo@,lu,Ihami Uslu,Hayati Tolun, Ali T. Isitman, Kutlan Ozker and @etinOnsel
DepartmenL@ofNuclear Medicine and Ophthalmology, Cerrahpa@aMedical Facuhy oflstanbu! University,Istanbu4 Turkey
by on June 24, 2015. For personal use only. jnm.snmjournals.org Downloaded from
accordingto the manufacturer's instructions)was injectedvia atwo-way venous catheterinsertedpreviouslyand stimulationcontinuedforan additional2 mmafterthe injection.Thesameprocedure was repeated 1 wk later with the opposite eye closed.
AcquIsItionSPECTscanswereacquired20—30rainafterinjectionusinga
single-head, rotatinggamma camera (Siemens, Orbiter75 ZLC,HoffmanEstates, IL) fittedwith a low-energy,high-resolutioncollimator. Images were obtained in a circular step-and-shootmode, at 3600for 12815-secviews in a 64 x 64 frame matrix.ImagereconstructionwasperformedwithButterworthfilter(0.45Nyquist frequency, 10thorder).Changattenuationcorrectionandreorientationof the slices parallelto the orbitomeatalline wereperformed. Each study consisted of 16 transaxial slices with a6.2-mmpixel size.Two separatestudiesof eachpatientweredisplayed together and corresponding images were aligned according to the vertex and temporal poles to obtain consistencybetweenthestudies.Amongthem,fiveoccipitofrontalslicesdisplayingthe visual cortex were selected. The correspondingimages oftwo separate studies ofeach patient were composed in onefile, enablingdisplay of two studies in a normalized,standardwindow adjustment for visual evaluation. The slices displayingthevisualcortexwereselectedbyusinganatomicalstntcturesaslandmarksand an anatomicalCT atlas (19).
Imageswerealsointerpretedquantitativelybydrawingregionsof interest (ROIs) over the left and rightoccipital cortex of eachstudy. Whole visual cortex activation of the amblyopic eye andnormal eye stimulation studies were compared; the ipsilateral andcontralateral cerebral cortices of each study were compared aswell. For quantitation,the slicesweredisplayedon 128x 128matricesto minimizedrawingerrors and the ROIsweremanuallypositionedover the right and left occipitallobes by usingvisualinspection and isocount pixels around the cortex. Region selection was based on anatomical structuresand activation and theywere defined to approximatecerebral structuresdemonstratedinthe anatomicalCT atlas.Averagecountsof ROIscontainingatleast 100pixels were obtainedfromboththe rightandleftoccipitalcortexandcerebellumof eachstudy.
Theprimaryvisualcortexandassociativevisualcortexcouldnot be delineated separately due to the lower resolution of ourtomographic images (18 mm FWHM). Cerebellar counts wereobtainedby drawingROIsover the wholecerebellumin a slicedisplaying both cerebellar hemispheres. The cerebral-to-cerebellar ratios were calculated for each of the five slices of both thenormalandamblyopiceye stimulationstudiesandtheaverageofthe five slices was obtainedto minimizevariancesoccurringfrom position changes. The normaleye and amblyopic eye ratio(C/Cr@0@—C/Cr,@,blYO@,)differences,whereC/Cris cerebral-tocerebellar,for bothhemisphereswerecalculated.Themeanratiosofthe ipsilateralandcontralateraloccipitalcortexwereexpressedas a percentageof increaseaccordingto theformula(15):
(C/Cr@ - C/Cr@yc,)/(C/Cr@mNy&X 100%.
Thecalculatedratioswerecorrectedforflow-dependentbackdiffusionas describedby Lassenet al. (a = 1.5).Thehighestvalueof hemisphereswereacceptedas themaximumincrease(20,21):
corrected C/Cr = C/Cr/(l + a - C/Cr).
Theinterpreterandtheoperatorwereblindedtothepositionofstimulatedand abnormaleyes. Statisticalanalysis was performed
I I 71SPECTEvaluationoftheVisualCortex•Kabasakaletal.
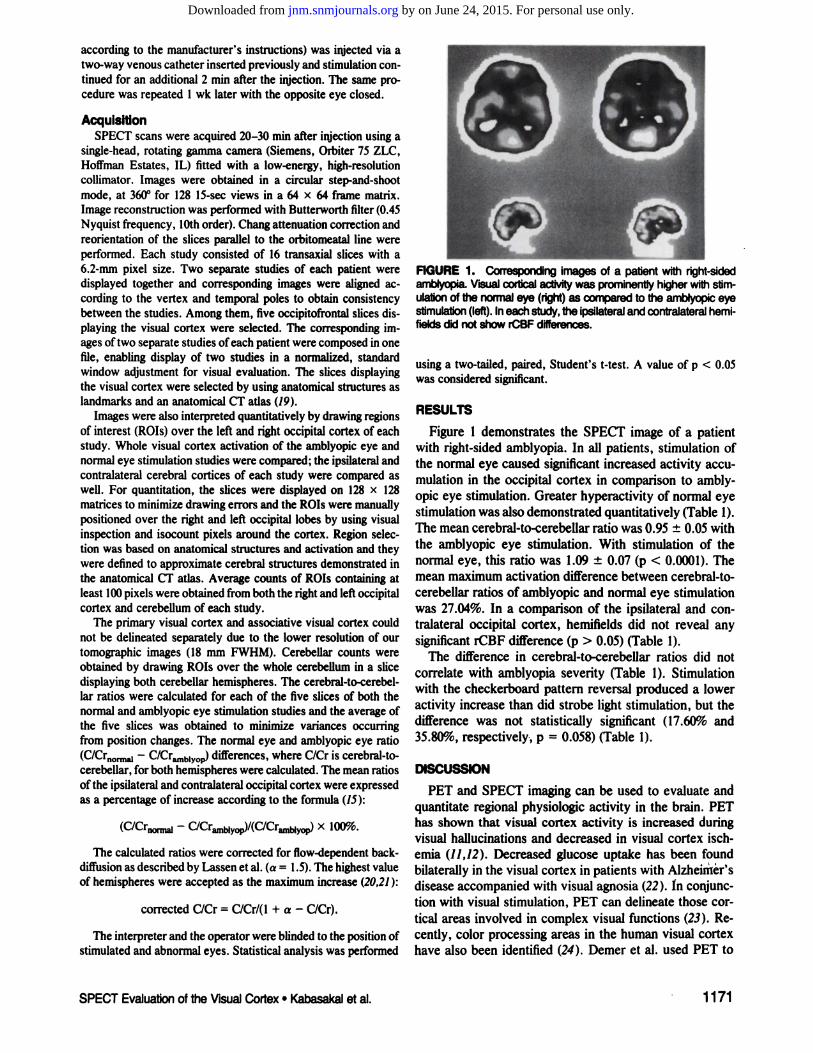
FIGURE I. Correspondingimagesof a patientwffli nght-sidedamblyopiaVieuaIcorticalactMtywas prominentlyhigherwfthstimulationof the normaleye (right)as comparedto the amblyopiceyestlmulatlon(Ieft).Ineachstudy,theIpsilateralandcontralateralhemifieldsdid notshowrCBFdifferences.
usinga two-tailed,paired, Student's t-test. A value of p < 0.05was consideredsignificant.
RESULTS
Figure 1 demonstrates the SPECT image of a patientwith right-sidedamblyopia. In all patients, stimulation ofthe normaleye caused significant increased activity accumulation in the occipital cortex in comparison to amblyopic eye stimulation. Greater hyperactivity of normal eyestimulationwas also demonstratedquantitatively(Table 1).The mean cerebral-to-cerebellarratiowas 0.95 ±0.05 withthe amblyopic eye stimulation. With stimulation of thenormal eye, this ratio was 1.09 ±0.07 (p < 0.0001). Themean maximumactivation difference between cerebral-tocerebellar ratios of amblyopic and normal eye stimulationwas 27.04%. In a comparison of the ipsilateral and contralateral occipital cortex, hemifields did not reveal anysignificant rCBF difference (p > 0.05) (Table 1).
The difference in cerebral-to-cerebellar ratios did notcorrelate with amblyopia severity (Table 1). Stimulationwith the checkerboard pattern reversal produced a loweractivity increase than did strobe light stimulation, but thedifference was not statistically significant (17.60% and35.80%, respectively, p = 0.058) (Table 1).
DISCUSSION
PETandSPECTimagingcan be used to evaluateandquantitate regional physiologic activity in the brain. PEThas shown that visual cortex activity is increased duringvisual hallucinations and decreased in visual cortex ischemia (11,12). Decreased glucose uptake has been foundbilaterallyin the visual cortex in patients with Alzheimér'sdisease accompanied with visual agnosia (22). In conjunction with visual stimulation, PET can delineate those cortical areas involved in complex visual functions (23). Recently, color processing areas in the human visual cortexhave also been identified (24). Demer et al. used PET to
by on June 24, 2015. For personal use only. jnm.snmjournals.org Downloaded from

@pioPatientno. eye AcuityNormaStimulus IpsilateralCerebellum-to-Cerebella,ratioseye—eyeContralateralIpsilateralContralateral
CerebeUwm@CerebeUwra@os
Increase(%) Increase(%)
Patientno. Ipsilateral Contraiateral IpallateralMaxIn@ease
(%)(Lassen
corr.)Contralateral
Ipsilateral= ipsilateralhemifleldofthev@uaIcortexwiththestimulatedeye;contralaterai= contralateralhemlfiddofthevisualcortexwfththestimulatedeye.
TABLE 1AVisualAcuftyof the ib@opk@Eye,Typeof StimulationandCerebral-tO-CerebellarRatios
IR20/200Pattern1 .061.060.991.002A20/200Strobe1.181.200.930.933A20/100Pattern1
.061.080.971.004A3metPattern1 .011.030.900.915R20/100Strobe1.051.040.910.916A20/200Strobe1.311.341.081.097L20/200Strobe1.031.010.900.898A20/100Strobe0.960.990.870.869L20/200Pattern1.091.081.000.9610A20/200Pattern1
.041.030.950.97Mean±s.e.m.1 .08 ±0.071 .09 ±0.070.95 ±0.050.95 ±0.05
Ipsilateral= ipsilateralhemifieldof thevisualcortexwiththeStimUlatedeye;contr@ateral= contralateralhemifleldof thevisualcortexwiththeStimulatedeye.
image amblyopicpatients and found a significantreductionin visual cortical blood flow and glucose metabolism duringvisual stimulation of the amblyopic eye in comparison toperiods of normal eye stimulation (10). Deprivation, anisometric and strabismic amblyopia were some of the notedconditions.In normalsubjectsvisualcortex is activatedtothe same extent by visual stimulation of either eye. Because of its much better spatial resolution, PET has definiteadvantages over other imagingtests of the visual system.
Althoughthe spatial resolutionof SPEC!' is lower thanthat of PET, it is less expensive, more widely availableandoffers a more practical approach in routine clinical studies.Inaddition,thespatialresolutionof dedicatedmultidetector neuro-SPECFcameras are comparableto PET systems(25).Moreover,split-dose,same-daySPEC!'testingmay
provide additionalpractical advantages in the clinical useof neuroactivationstudies(26).
The clinical usefulness of brain SPECF in defining thelocation,extent and nature of disease in patientswith cortical visual loss has been previously documented (1417).Inourstudy,SPECTimagesdemonstrateda loweractivityrate in the visual cortex of the stimulated amblyopic eyewith respect to normal eye stimulation in every patient.This finding is consistent with PET results of Demer et al.(10). Woods et al. usedSPECF to demonstratethat visualstimulation causes a significant increase (36.7%) in rCBF ofthe visual cortex as compared to visual deprivationin normal-sighted subjects (15). Crosson et al. recently reporteda rCBF increase of 44.39% during visual stimulation innormal controls (27). In our study, stimulationof the am
TABLE lBPercent Increases in Cerebral-tO-CerebellarRatios of the VisualCortex
I7.076.0012.2810.4212.28226.8829.0350.9155.8355.8339.288.0016.1114.0816.11412.2213.1920.5122.4322.43515.3814.2926.5324.4626.53621
.3022.9444.7449.4349.43714.4413.4824.5722.6224.57810.3415.1216.7925.0325.0399.0012.5015.9622.0122.01109.476.1916.2210.5216.22Mean
±s.e.m.13.54 ±4.7714.07 ±5.0224.46 ±9.7825.68 ±10.7827.04 ±10.23
1172 TheJoumalofNudear Medicsne•Vol.36•No. 7'July 1995
by on June 24, 2015. For personal use only. jnm.snmjournals.org Downloaded from
blyopic eye demonstrateda depressed response in the visual cortex, with 27.04% less activity than normal eyestimulation. This finding agrees with the results from animalstudies(6@,9). Forexample,it is knownthatthevisualcortex of monkeys with one eyelid sutured in infancy contalus neurons that respond only to the eye remaining open.Physiologicrecordingsof cells in lateralgemculateshowedcompletely normalresponses in amblyopia, althoughthesecells are reduced in number and size. This indicates thatthe firstcells to show abnormalfunctionalresponsearesituated in the visual cortex.
No difference in rCBF between the ipsilateraland contralateralhemiflelds of the visual cortex were found in thisstudy. This finding is not surprising since the optic chiasmin humans is symmetrical. This finding also agrees withpreviously published PET studies (11,12). Phelps et al.demonstratedthat the left and rightvisual cortex showsymmetrical uptake with one or two eye stimulations aswell as withthe unstimulatedbasalstates.
The checkerboardpatternreversalwe used as a complexvisual stimulation has a lower magnitude of visual cortexactivity when compared to strobe-light flashing in thisstudy, which contradicts previous reports. Neurophysiologically, cells in the visual cortex respond to more cornplex stimulithan those excitingcells in the subcorticalstructures (28). In subjects with normal sight, Phelps et al.found visual cortex metabolism to be progressively activatedwith increasinglycomplicatedvisualstimulus(10).The increasein metabolicresponseof the associativevisual cortexwas higherthanthe prirnaryvisualcortex as thevisual scene became more complex. We cannot explainthis discrepancy. Studies in larger series and in normalsubjects are needed to determine appropriate calculationsof this protocol's sensitivity and specificity. In patientswithamblyopia,however,spatialresolution,contrastsensitivity and spatial frequency discrimination ability are alteredandthe healthyeye of thesepatientscannotbe considered as completely normal (18). Furthermore,childrenstimulatedwith strobe lightandpatternreversalhave varyingelectrophysiologicalresponsesto eachtypeof stimulationincomparisonto adults;thesameparameteris trueforamblyopic patients in comparison to normals (29,30).
Amblyopia can be acquired and treated only during earlychildhood when there is still plasticity of the visual cortex(1,2). The visual system loses its ability to improve withtreatment after age 8—9yr. The early diagnosis of amblyopiaandtreatmentat a youngagearethemostimportantdeterminants of a favorable outcome. This study foundpromising results in SPECF documentation of amblyopia,an approachthatmaybe used in the earlyassessmentofthe disease.
CONCLUSION
SPECTbrain perfusionimaginghas potentialuse in theevaluationof thevisualcortexof amblyopicpatientswithamblyopia. SPECT may also be used as an objective
method of documenting visual function in the cortex and,perhaps, in predicting whether effective binocular visioncan be restored.
ACKNOWLEDGMENT
TheauthorsthankDr.NielsA. Lassenforhisconthl,utionsinthepreparationofthis manuscript.
REFERENCES1. Friendly, DS. Amblyopia: definition, classilication, consideration for pedi
atricians,familyphysiciansand generalpractitioners.PediatñcClinNArn1987;34:1389-1401.
2. RubinSE, Nelson LB. Aml$yopia:diagnosisand management.PediabicChit NAm 1993;40f727—735.
3. OwiazdaJ,Bauer3,HeldR.Fromvisualacuitytohyperacuity:a ten-yearupdate. CanJP@sycd1989;43:109-120.
4. MayerLD, Gross RD. ModifledAllenpicturestoassessamblyopia inyoungchildren.Ophthalmology199@,97:8V—832.
5. KeechRV, KutschkePJ.The gradientfiltertestto assessamblyopia.AmJOphthabnol 1990;110-.57—61.
6. Holmes JM, Archer SM. Vernier acuity cards: a practical method formeasuringVernieracuityin InIantLJP&JatTOp&haImOI1993;30:312-314.
7. WisedTN,HubelDH.Effectsof visualdepr@,atioson morphologyandphysiologyofthecat'slateral genimlatebOdy.JNeUTOPhYSIOI1963;26:978-993.
8. WieselTN, HubelDH. Single cell responses in kittens deprived ofvision inone eye. JNeWT.çhysiol196326:1003-1017.
9. VonNoordenOK,crawfordMLMorphologicalandphysiologicalchangesin the monkeyvisualsystemafter short-termlidsuture. Jnwst OphthalmolVu Sd 1978;17:762.
10.DemeriL,VonNoordenOK,VolkowND,GouldKL Imagingofcerebralbloodflowand metabolismin amb@yopiaby positronemissiontomography.Am I Ophthabnol 1988;105:337-.347.
11. PhelpSME, KuhiDE, MathottaJC. Metabolicmappingof the brain'sresponsetovisualstimulation:studiesinhumans.Science1981;211:1445-1448.
12.PhelpsME,MaZ2IOtIaJC,KuhIDE,etal.Tomographicmappingofhumancerebral metabolism:visual StimalatiOnand deprivation.Neurology 1981;31:517—529.
13.GreenbergJH,AlaviA, HandP,etaLMetabolicmappingoffunctiOnalactivity in human subjects with the F-18-fluorodeoxyglucosetechnique.Science 1981;212678-680.
14. BosieyTM, RosenquitA@ KushnerM, et al. Ischemiclesionsof theoccipitalcortex and optic radiations:positronemissiontomography.Neu@vIogp198535:470—484.
15.WoodsSW,HegemanIM, Zubal10,etaLVisualstimulationincreasestechnetium-99m-HMPAOdistributionin humanvisualcortex.JNucI Med199132:210—215.
16. SilvermanIE, Galetta SL, Grossman M. SPECF and MRI in posteriorcerebralartery infarctionand relatedvisualfielddefects.INuciMed 1993;34:1009—1012.
17.SilvermanIE,GalettaSL,GrayLO,etaLSPECTinpatientswithconicalvisual loss.JNuclMed 1993;34:1447-1451.
18.StagerDR,BirchEE, WeakleyDR.Amblyopiaandthepediatrician.PediatrAnn 199019:301—305,309—315.
19. AquiloniusSM,EckernasSA, eds.A colorathisofhwnan brain.Adaptedtocomputedtomography.EsselteStudium,1988.
20.LassenNA,AndersenAR,NeirinckxRD,EliPJ,CostaDC.ValidationofCeretec. In: El PJ, Costa D@ Qillum ID, Jarrit PH, Lui D, eds. rCBFatlas: the clinicalapplication OfiCBFInIGgIngby SPET. Amersham: BrierPress Ltd.; 1987;14—18.
21. Yonekura Y, Nishizawa 5, Mukai T, et al. SPECI' with @Fc-d,1-hexamethyl-propyleneamineoxime (HMPAO)comparedwith regionalcerebralbloodflowmeasuredby PET: effectsof lineariZatiOn.I CerebBloodFlowMetab 1988;8:S82—S89.
22.KiyosawaM, BosleyTM, ChawlukJ, et al. Alzheimer'sdiseasewithprominentvisualsymptoms:clinicalandmetabolicevaluation.Ophthabnology 1989;96:1077-1086.
23. KushnerMi, RosenquistA, Alavi A, et aLCerebralstimulationandpattamed visual stimulation:a positron emissiontomographicstudy of thehumanvisualcortex. Neurology1988;38:89-95.
1173SPECTEvaluationofthe VisualCortex•Kabasakalat al.
by on June 24, 2015. For personal use only. jnm.snmjournals.org Downloaded from

24. Zeki S, Watson JDG, Lueck CJ, et al. A direct demonstrationof functionalspecializationin humanvisualcortex.JNeWVSci1991;11:641-649.
25. Bailey DL, Zito F, Gilardi MC, Savi AR, Fazzio F, JonesT. Performencecomparisonof a state-of-the-artneuro-SPETscanneranda dedicatedneuroPETscanner.EuriNudMed 1994;21:381-387.
26. Yeni SN, Onsel @,Kabasakal L, et aL Split-dose @Tc-HMPAOin theevaluationofthe propagationofseizuredischargesinpatientswithpetit-mal(PM)epilepsy[Abstract].EurJNuclMed1993;20:963.
27. CrossonB, WilliamsonDiG, ShuklaSS,HoneymanJC,NadeauSE.Atechnique to localizeactivationin the humanbrain with technetium-99m-
HMPAOSPECF: a validationstudy usingvisual stimulation.I Nuci Med199435:755—763.
28. Maso C, Kandel ER. Central visual pathways. In: Kandel ER, SchwartzJH, Jessel TM, eds. Fthsc4plesOfPIeWUIScIence,third edition.New York:ElsevierSciencePub. Co, Inc.; 1991:420—439.
29. HardingGFA.Histoiyofvisualevokedconicaltesting.In:HeCkenIiVCIyJR, Arden GB, eds.Pthzc@,Iesandpnzctice ofcliaicalelecbvph@trkAogyof
@cion.St. Lois, MO: Mosby-YearBook, Inc.; 1991:17-22.30. Odom JV. Amblyopia and clinical electrophysiology. In: Heckenlivejy JR,
Aiden GB, eds. Pthsc4,Iesand p,uctice of clinical elecbrç[email protected]. Louis, MO: Mosby-Year Book, Inc.; 1991:589-593.
I 174 The Journalof NuclearMed@ane•Vol.36 •No. 7 •July1995
by on June 24, 2015. For personal use only. jnm.snmjournals.org Downloaded from

1995;36:1170-1174.J Nucl Med. T. Isitman, Kutlan Ozker and Çetin ÖnselLevent Kabasakal, Kazim Devranoglu, Osman Arslan, Tanju Yusuf Erdil, Kerim Sönmezoglu, Ihami Uslu, Hayati Tolun, Ali Brain SPECT Evaluation of the Visual Cortex in Amblyopia
http://jnm.snmjournals.org/content/36/7/1170This article and updated information are available at:
http://jnm.snmjournals.org/site/subscriptions/online.xhtml
Information about subscriptions to JNM can be found at:
http://jnm.snmjournals.org/site/misc/permission.xhtmlInformation about reproducing figures, tables, or other portions of this article can be found online at:
(Print ISSN: 0161-5505, Online ISSN: 2159-662X)1850 Samuel Morse Drive, Reston, VA 20190.SNMMI | Society of Nuclear Medicine and Molecular Imaging
is published monthly.The Journal of Nuclear Medicine
© Copyright 1995 SNMMI; all rights reserved.
by on June 24, 2015. For personal use only. jnm.snmjournals.org Downloaded from
Related Documents