Brain region-specific perfluoroalkylated sulfonate (PFSA) and car- boxylic acid (PFCA) accumulation and neurochemical biomarker Re- sponses in east Greenland polar Bears (Ursus maritimus) Kathrine Eggers Pedersen a,n , Niladri Basu b , Robert Letcher c , Alana K. Greaves c , Christian Sonne d , Rune Dietz d , Bjarne Styrishave a a Toxicology Laboratory, Section of Advanced Drug Analysis, Department of Pharmacy, Faculty of Health and Medical Sciences, University of Copenhagen, Copenhagen, Denmark b Faculty of Agricultural and Environmental Sciences, McGill University, Montreal, Quebec, Canada c Wildlife and Landscape Science Directorate, Science and Technology Branch, Environment Canada, National Wildlife Research Centre, Carleton University, Ottawa, ON, Canada d Aarhus University, Faculty of Science and Technology, Department of Bioscience, Arctic Research Centre, Roskilde, Denmark article info Article history: Received 25 November 2014 Received in revised form 16 January 2015 Accepted 20 January 2015 Keywords: Brain Neurotoxicology Perfluorinated substances Polar bear (Ursus maritimus) abstract Perfluoroalkyl substances (PFASs) is a growing class of contaminants in the Arctic environment, and include the established perfluorinated sulfonates (PFSAs; especially perfluorooctane sulfonate (PFOS)) and carboxylic acids (PFCAs). PFSAs and PFCAs of varying chain length have been reported to bioaccu- mulate in lipid rich tissues of the brain among other tissues such as liver, and can reach high con- centrations in top predators including the polar bear. PFCA and PFSA bioaccummulation in the brain has the potential to pose neurotoxic effects and therefore we conducted a study to investigate if variations in neurochemical transmitter systems i.e. the cholinergic, glutaminergic, dopaminergic and GABAergic, could be related to brain-specific bioaccumulation of PFASs in East Greenland polar bears. Nine brain regions from nine polar bears were analyzed for enzyme activity (monoamine oxidase (MAO), acet- ylcholinesterase (AChE) and glutamine synthetase (GS)) and receptor density (dopamine-2 (D2), mus- carinic cholinergic (mAChR) and gamma-butyric acid type A (GABA-A)) along with PFSA and PFCA concentrations. Average brain ∑PFSA concentration was 25 ng/g ww where PFOS accounted for 91%. Average ∑PFCA concentration was 88 ng/g ww where PFUnDA, PFDoDA and PFTrDA combined accounted for 79%. The highest concentrations of PFASs were measured in brain stem, cerebellum and hippocampus. Correlative analyses were performed both across and within brain regions. Significant positive correla- tions were found between PFASs and MAO activity in occipital lobe (e.g. ∑PFCA; r p ¼0.83, p ¼0.041, n ¼6) and across brain regions (e.g. ∑PFCA; r p ¼0.47, p ¼0.001, ∑PFSA; r p ¼0.44, p 40.001; n ¼50). GABA-A receptor density was positively correlated with two PFASs across brain regions (PFOS; r p ¼0.33, p ¼0.02 and PFDoDA; r p ¼0.34, p ¼0.014; n ¼52). Significant negative correlations were found between mAChR density and PFASs in cerebellum (e.g. ∑PFCA; r p ¼0.95, p ¼0.013, n ¼5) and across brain regions (e.g. ∑PFCA; r p ¼0.40, p ¼0.003, ∑PFSA; r p ¼0.37, p ¼0.007; n ¼52). AChE activity and D2 density were negatively correlated with single PFCAs in several brain regions, whereas GS activity was positively correlated with PFASs primarily in occipital lobe. Results from the present study support the hypothesis that PFAS concentrations in polar bears from East Greenland have exceeded the threshold limits for neurochemical alterations. It is not known whether the observed alterations in neurochemical signaling are currently having negative effects on neurochemistry in East Greenland polar bears. However given the importance of these systems in cognitive processes and motor function, the present results indicate an urgent need for a better understanding of neurochemical effects of PFAS exposure to wildlife. & 2015 Elsevier Inc. All rights reserved. 1. Introduction The polar bear (Ursus maritimus) is an apex predator in the Arctic. Due to its trophic position, long life span and preference for a lipid-rich diet, the polar bear accumulates high levels of Contents lists available at ScienceDirect journal homepage: www.elsevier.com/locate/envres Environmental Research http://dx.doi.org/10.1016/j.envres.2015.01.015 0013-9351/& 2015 Elsevier Inc. All rights reserved. n Corresponding author. E-mail address: [email protected] (K. Eggers Pedersen). Environmental Research 138 (2015) 22–31

Welcome message from author
This document is posted to help you gain knowledge. Please leave a comment to let me know what you think about it! Share it to your friends and learn new things together.
Transcript
Environmental Research 138 (2015) 22–31
Contents lists available at ScienceDirect
Environmental Research
http://d0013-93
n CorrE-m
journal homepage: www.elsevier.com/locate/envres
Brain region-specific perfluoroalkylated sulfonate (PFSA) and car-boxylic acid (PFCA) accumulation and neurochemical biomarker Re-sponses in east Greenland polar Bears (Ursus maritimus)
Kathrine Eggers Pedersen a,n, Niladri Basu b, Robert Letcher c, Alana K. Greaves c,Christian Sonne d, Rune Dietz d, Bjarne Styrishave a
a Toxicology Laboratory, Section of Advanced Drug Analysis, Department of Pharmacy, Faculty of Health and Medical Sciences, University of Copenhagen,Copenhagen, Denmarkb Faculty of Agricultural and Environmental Sciences, McGill University, Montreal, Quebec, Canadac Wildlife and Landscape Science Directorate, Science and Technology Branch, Environment Canada, National Wildlife Research Centre, Carleton University,Ottawa, ON, Canadad Aarhus University, Faculty of Science and Technology, Department of Bioscience, Arctic Research Centre, Roskilde, Denmark
a r t i c l e i n f o
Article history:Received 25 November 2014Received in revised form16 January 2015Accepted 20 January 2015
Keywords:BrainNeurotoxicologyPerfluorinated substancesPolar bear (Ursus maritimus)
x.doi.org/10.1016/j.envres.2015.01.01551/& 2015 Elsevier Inc. All rights reserved.
esponding author.ail address: [email protected] (K. Eggers P
a b s t r a c t
Perfluoroalkyl substances (PFASs) is a growing class of contaminants in the Arctic environment, andinclude the established perfluorinated sulfonates (PFSAs; especially perfluorooctane sulfonate (PFOS))and carboxylic acids (PFCAs). PFSAs and PFCAs of varying chain length have been reported to bioaccu-mulate in lipid rich tissues of the brain among other tissues such as liver, and can reach high con-centrations in top predators including the polar bear. PFCA and PFSA bioaccummulation in the brain hasthe potential to pose neurotoxic effects and therefore we conducted a study to investigate if variations inneurochemical transmitter systems i.e. the cholinergic, glutaminergic, dopaminergic and GABAergic,could be related to brain-specific bioaccumulation of PFASs in East Greenland polar bears. Nine brainregions from nine polar bears were analyzed for enzyme activity (monoamine oxidase (MAO), acet-ylcholinesterase (AChE) and glutamine synthetase (GS)) and receptor density (dopamine-2 (D2), mus-carinic cholinergic (mAChR) and gamma-butyric acid type A (GABA-A)) along with PFSA and PFCAconcentrations. Average brain ∑PFSA concentration was 25 ng/g ww where PFOS accounted for 91%.Average∑PFCA concentrationwas 88 ng/g ww where PFUnDA, PFDoDA and PFTrDA combined accountedfor 79%. The highest concentrations of PFASs were measured in brain stem, cerebellum and hippocampus.Correlative analyses were performed both across and within brain regions. Significant positive correla-tions were found between PFASs and MAO activity in occipital lobe (e.g. ∑PFCA; rp¼0.83, p¼0.041, n¼6)and across brain regions (e.g. ∑PFCA; rp¼0.47, p¼0.001, ∑PFSA; rp¼0.44, p40.001; n¼50). GABA-Areceptor density was positively correlated with two PFASs across brain regions (PFOS; rp¼0.33, p¼0.02and PFDoDA; rp¼0.34, p¼0.014; n¼52). Significant negative correlations were found between mAChRdensity and PFASs in cerebellum (e.g. ∑PFCA; rp¼�0.95, p¼0.013, n¼5) and across brain regions (e.g.∑PFCA; rp¼�0.40, p¼0.003, ∑PFSA; rp¼�0.37, p¼0.007; n¼52). AChE activity and D2 density werenegatively correlated with single PFCAs in several brain regions, whereas GS activity was positivelycorrelated with PFASs primarily in occipital lobe. Results from the present study support the hypothesisthat PFAS concentrations in polar bears from East Greenland have exceeded the threshold limits forneurochemical alterations. It is not known whether the observed alterations in neurochemical signalingare currently having negative effects on neurochemistry in East Greenland polar bears. However giventhe importance of these systems in cognitive processes and motor function, the present results indicatean urgent need for a better understanding of neurochemical effects of PFAS exposure to wildlife.
& 2015 Elsevier Inc. All rights reserved.
edersen).
1. Introduction
The polar bear (Ursus maritimus) is an apex predator in theArctic. Due to its trophic position, long life span and preference fora lipid-rich diet, the polar bear accumulates high levels of
K. Eggers Pedersen et al. / Environmental Research 138 (2015) 22–31 23
persistent organic pollutants (POPs) (Letcher et al., 2010, 2009,Ramsay and Stirling, 1988). The legacy POP polychlorinated bi-phenyls (PCBs) have long been the dominant contaminant groupin polar bears (AMAP, 2004). However, studies have shown thatduring the early 2000s perfluoroalkyl substances (PFASs), includ-ing perfluorinated carboxylates (PFCAs) and perfluorinated sulfo-nates (PFSAs), especially the highly bioaccummulative per-flurooctane sulfonate (PFOS), reached comparable liver levels(∑PCB51¼3125 ng/g ww,∑PFAS11¼2636 ng/g ww) (Gebbink et al.2008, Smithwick et al., 2005). Among circumpolar populations ofpolar bears, those from East Greenland accumulate the highestlevels of PFASs (Butt et al., 2010; Dietz et al., 2008; Greaves et al.,2012; Houde et al., 2011; Rigét et al., 2013).
PFASs and their precursors contain carbon chains where allhydrogen atoms are substituted with fluorine. Due to their oil- andwater repellent nature, PFASs are incorporated into products suchas Teflon and Gore-Tex (Lindstrom et al., 2011). PFASs end up in theArctic environment though direct release of PFAS (Paul et al.,2009) as well as through release and subsequent degradation ofPFAS precursors such as perfluorooctane sulfonamide metabolismof PFOS (Z. Wang et al., 2013.).
PFSAs and PFCAs have been shown to affect a number of phy-siological systems, including the nervous system. For example,there are limited studies from laboratory experiments showingalterations in behavior, motor function, memory and learning inrodents after exposure to PFOS or PFOA. Effects were most pro-nounced for individuals exposed during development (Johanssonet al., 2009, 2008). At the molecular level, correlations have beenfound between exposure to PFOS or PFOA and changes in thecholinergic system in rodents (Johansson et al., 2008) and proteinkinase C (involved in neurotransmission by G protein-coupledreceptors) in hatchlings (Pinkas et al., 2010). Taken together, thesefindings suggest that PFASs may disrupt the function of the ner-vous system.
It is not known if PFSAs and PFCAs exposure is causing neu-rological stress in polar bears (or other arctic marine mammals),although previous studies of polar bears demonstrated that PFASs,especially the long chained PFASs (C10–C15), cross the blood brainbarrier (BBB) and reach the brain at concentrations up to 116 ng/gww (∑PFAS17) (Greaves et al., 2013). PFASs are mainly bound toblood-proteins (Greaves et al., 2012) and the crossing of the BBBresembles the transport of free fatty acids (Greaves et al., 2013,2012). Due to the importance of the nervous system in mediatingcritical aspects of animal health, behavior, reproduction, and sur-vival (Gore, 2008), resolving whether contaminants such as PFASsmay cause neurotoxicity is of pressing concern. Prior to affectingthe structure and/or function of the nervous system, neurotoxiccontaminants will first cause a range of sub-clinical effects (Basu,2014, Basu and Head, 2010), and one of the earliest indicators ofneurotoxic disease is disruption of brain neurochemistry. Neuro-chemical biomarkers have been used previously in wildlife, in-cluding polar bears, to assess the risk of mercury exposure (Basuet al., 2009,, 2007a,, 2005).
Although PFASs have been increasing in the Arctic, and inparticular in East Greenland polar bears, over the past three dec-ades, several of the most dominant PFASs have started to declinearound 2007 (Dietz et al., 2008; Rigét et al., 2013). However re-latively high levels have recently been found in polar bear brains(Greaves et al., 2013, 2012), and it is not known whether theseexposures are related to any neurological effects. In the presentstudy activities of neurochemical enzymes (monoamine oxidase,MAO; acetylcholinesterase, AChE and glutamine synthetase, GS)and densities of central neuro-receptors (γ-aminobutyric acid typeA receptor, GABA-A; dopamine-2 receptor, D2 and muscarinicacetylcholine receptor, mAChR) were determined in nine brainregions from nine East Greenland polar bears. Furthermore
concentrations of several PFSAs and PFCAs were measured in eachof the brain regions. Correlative association between neurochem-ical biomarkers and brain region-specific levels of PFSA and PFCAwere investigated to test the hypothesis that PFSA and PFCA ex-posure is correlated with neurochemical changes.
2. Materials and methods
2.1. Sampling of animals
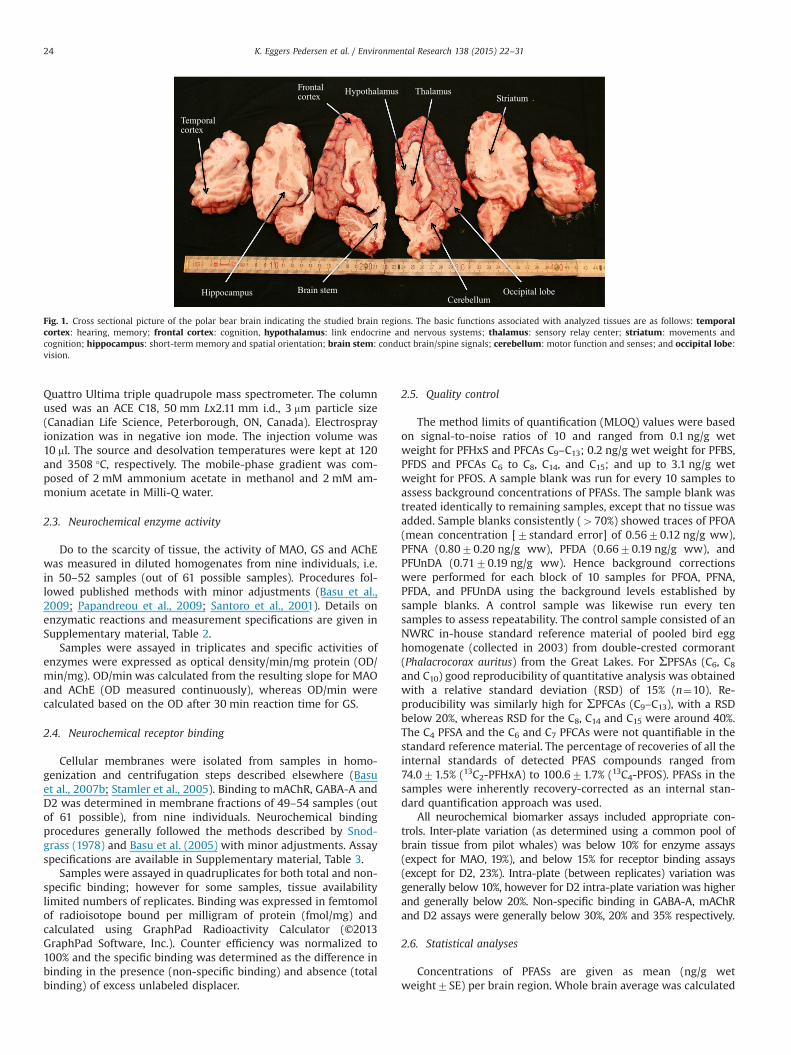
Brain samples were obtained from nine polar bears legallyhunted within the established Greenlandic quota system for sub-sistence hunting in the Scoresby Sound area, East Greenland(69°00'N to 74°00ʹN) during February and March 2011 and 2012.For further information, including biological data see Supple-mentary material, Table 1. Briefly, the entire brain was rapidlyremoved, dissected into nine regions (brain stem (n¼6), cere-bellum (n¼6), frontal cortex (n¼6), occipital lobe (n¼7), temporalcortex (n¼9), striatum (n¼7), thalamus (n¼7), hypothalamus(n¼7) and hippocampus (n¼5)) as illustrated in Fig. 1, and storedfrozen in liquid nitrogen at �196 °C (contaminant analysis) or�80 °C (neurochemical marker analysis) until analyses.
2.2. PFAS analyses
PFASs were analyzed in brain regions from 10 individuals.Chemical standards (all 498% purity) of the four C4, C6, C8 and C10PFSAs (perfluorobutane sulfonate (PFBS), perfluorohexane sulfo-nate (PFHxS), perfluorooctane sulfonate (PFOS), perfluorodecanesulfonate (PFDS)) and ten C6–C15 PFCAs (perfluorohexanoic acid(PFHxA), perfluoroheptanoic acid (PFHpA), perfluorooctanoic acid(PFOA), perfluorononanoic acid (PFNA), perfluorodecanoic acid(PFDA), perfluoroundecanoic acid (PFUnDA), perfluorododecanoicacid (PFDoDA), perfluorotridecanoic acid (PFTrDA), per-fluorotetradecanoic acid (PFTeDA), perfluoropentadecanoic acid(PFPeDA)) were purchased from Wellington Laboratories (Guelph,ON, Canada). Internal standards (all498% purity) consisted of18O-PFHxS, 13C-PFOS and 13C-PFCAs (C6, C8–C12) (Wellington La-boratories, Guelph, ON, Canada). Based on retention times13C-PFHxA was chosen as the surrogate for PFBS and PFHpA,13C-PFUnDA for PFDS, and 13C-PFDoDA for PFTrDA, PFTeDA, andPFPeDA. Chemicals used for extraction of PFASs included formicacid (98-100%, Sigma-Aldrich, Oakville, ON, Canada), ammoniumhydroxide (28–30% w/v, EMD Chemicals Canada), ammoniumacetate (Fisher Scientific, Ottawa, ON. Canada), acetonitrile (Cale-don Laboratories, Georgetown, ON, Canada) and diatomaceousearth (VWR International). All were of analytical grade or higher.All solvents used were high-performance liquid chromatography(HPLC)-grade, including methanol (Caledon Laboratories, George-town, ON, Canada), and Milli-Q water (treated on-site).
All PFCA and PFSA sample analyses were performed at NWRC(Carleton University, Ottawa, Canada) in the Letcher/ OrganicContaminants Research Laboratory (OCRL). The sample extractionand cleanup steps followed a previously used method for analysisof PFASs from brain tissue (Greaves et al., 2013). In brief, 1 g oftissue was spiked with 10 ng of each isotopically labeled internalstandard, followed by homogenization with a 10 mM potassiumhydroxide acetonitrile:water (80:20, v/v) solution to extract thePFASs. Samples were subjected to cleanup by solid-phase extrac-tion (Waters Oasis WAX cartridges). PFSAs and PFCAs were elutedby 2 ml of 1% ammonium hydroxide in methanol, evaporated todryness, reconstituted in methanol, filtrated, and transferred to aLC–MS vial for analysis.
The analysis of the final clean-up fractions for PFCAs and PFSAswas performed using a Waters 2695 HPLC coupled with a Waters
Frontal cortex
Temporal cortex
Occipital lobe Brain stem
ThalamusStriatum
Cerebellum
Hypothalamus
Hippocampus
Fig. 1. Cross sectional picture of the polar bear brain indicating the studied brain regions. The basic functions associated with analyzed tissues are as follows: temporalcortex: hearing, memory; frontal cortex: cognition, hypothalamus: link endocrine and nervous systems; thalamus: sensory relay center; striatum: movements andcognition; hippocampus: short-term memory and spatial orientation; brain stem: conduct brain/spine signals; cerebellum: motor function and senses; and occipital lobe:vision.
K. Eggers Pedersen et al. / Environmental Research 138 (2015) 22–3124
Quattro Ultima triple quadrupole mass spectrometer. The columnused was an ACE C18, 50 mm Lx2.11 mm i.d., 3 mm particle size(Canadian Life Science, Peterborough, ON, Canada). Electrosprayionization was in negative ion mode. The injection volume was10 ml. The source and desolvation temperatures were kept at 120and 3508 °C, respectively. The mobile-phase gradient was com-posed of 2 mM ammonium acetate in methanol and 2 mM am-monium acetate in Milli-Q water.
2.3. Neurochemical enzyme activity
Do to the scarcity of tissue, the activity of MAO, GS and AChEwas measured in diluted homogenates from nine individuals, i.e.in 50–52 samples (out of 61 possible samples). Procedures fol-lowed published methods with minor adjustments (Basu et al.,2009; Papandreou et al., 2009; Santoro et al., 2001). Details onenzymatic reactions and measurement specifications are given inSupplementary material, Table 2.
Samples were assayed in triplicates and specific activities ofenzymes were expressed as optical density/min/mg protein (OD/min/mg). OD/min was calculated from the resulting slope for MAOand AChE (OD measured continuously), whereas OD/min werecalculated based on the OD after 30 min reaction time for GS.
2.4. Neurochemical receptor binding
Cellular membranes were isolated from samples in homo-genization and centrifugation steps described elsewhere (Basuet al., 2007b; Stamler et al., 2005). Binding to mAChR, GABA-A andD2 was determined in membrane fractions of 49–54 samples (outof 61 possible), from nine individuals. Neurochemical bindingprocedures generally followed the methods described by Snod-grass (1978) and Basu et al. (2005) with minor adjustments. Assayspecifications are available in Supplementary material, Table 3.
Samples were assayed in quadruplicates for both total and non-specific binding; however for some samples, tissue availabilitylimited numbers of replicates. Binding was expressed in femtomolof radioisotope bound per milligram of protein (fmol/mg) andcalculated using GraphPad Radioactivity Calculator (©2013GraphPad Software, Inc.). Counter efficiency was normalized to100% and the specific binding was determined as the difference inbinding in the presence (non-specific binding) and absence (totalbinding) of excess unlabeled displacer.
2.5. Quality control
The method limits of quantification (MLOQ) values were basedon signal-to-noise ratios of 10 and ranged from 0.1 ng/g wetweight for PFHxS and PFCAs C9–C13; 0.2 ng/g wet weight for PFBS,PFDS and PFCAs C6 to C8, C14, and C15; and up to 3.1 ng/g wetweight for PFOS. A sample blank was run for every 10 samples toassess background concentrations of PFASs. The sample blank wastreated identically to remaining samples, except that no tissue wasadded. Sample blanks consistently (470%) showed traces of PFOA(mean concentration [7standard error] of 0.5670.12 ng/g ww),PFNA (0.8070.20 ng/g ww), PFDA (0.6670.19 ng/g ww), andPFUnDA (0.7170.19 ng/g ww). Hence background correctionswere performed for each block of 10 samples for PFOA, PFNA,PFDA, and PFUnDA using the background levels established bysample blanks. A control sample was likewise run every tensamples to assess repeatability. The control sample consisted of anNWRC in-house standard reference material of pooled bird egghomogenate (collected in 2003) from double-crested cormorant(Phalacrocorax auritus) from the Great Lakes. For ΣPFSAs (C6, C8
and C10) good reproducibility of quantitative analysis was obtainedwith a relative standard deviation (RSD) of 15% (n¼10). Re-producibility was similarly high for ΣPFCAs (C9–C13), with a RSDbelow 20%, whereas RSD for the C8, C14 and C15 were around 40%.The C4 PFSA and the C6 and C7 PFCAs were not quantifiable in thestandard reference material. The percentage of recoveries of all theinternal standards of detected PFAS compounds ranged from74.071.5% (13C2-PFHxA) to 100.671.7% (13C4-PFOS). PFASs in thesamples were inherently recovery-corrected as an internal stan-dard quantification approach was used.
All neurochemical biomarker assays included appropriate con-trols. Inter-plate variation (as determined using a common pool ofbrain tissue from pilot whales) was below 10% for enzyme assays(expect for MAO, 19%), and below 15% for receptor binding assays(except for D2, 23%). Intra-plate (between replicates) variation wasgenerally below 10%, however for D2 intra-plate variation was higherand generally below 20%. Non-specific binding in GABA-A, mAChRand D2 assays were generally below 30%, 20% and 35% respectively.
2.6. Statistical analyses
Concentrations of PFASs are given as mean (ng/g wetweight7SE) per brain region. Whole brain average was calculated
K. Eggers Pedersen et al. / Environmental Research 138 (2015) 22–31 25
as arithmetic mean PFAS concentrations in analyzed tissues. Datawas checked for normality using D'Agostino-Pearson omnibusnormality test. The majority of datasets fitted a normal distribu-tion and log transformation was considered unnecessary. Differ-ence in brain region concentrations of PFASs was assessed by one-way ANOVA (Turkey's post-hoc). Same approach was used to assessbrain region differences in enzyme activity and receptor density.
Correlations between selected PFASs (PFOS, PFUnDA, PFDoDA,PFTrDA, ∑PFSAs and ∑PFCAs) and neurochemical endpoints wereassessed using correlative matrices, with pr0.05 indicating sta-tistical significance and a Pearson coefficient rpZ0.5 indicating astrong correlation. Correlations were performed both across andwithin brain regions. The critical level was set at p¼0.05. All sta-tistical operations were performed with Prisms (Version 6.0eGraphPad Software, Inc.).
3. Results
3.1. PFAS concentrations
Results from chemical analyses of PFSA (PFBS, PFHxS, PFOS andPFDS) and PFCA (PFHxA, PFHpA, PFOA, PFNA, PFDA, PFUnDA,PFDoDA, PFTrDA, PFTeDA and PFPeDA) are shown in Tables 1 and2, respectively. Whole brain average of ∑PFSAs was28.8271.19 ng/g ww. The most abundant PFSA was PFOS ac-counting for approximately 91% of ∑PFSAs. PFOS was observed inall analyzed samples. Average whole brain concentration of∑PFCAs was 99.4075.95 ng/g ww with PFUnDA, PFDoDA andPFTrDA found in all samples expect for PFDoDA found in 87 out of89 samples, which all together accounted for 79%. The remainingPFCAs accounted for less than 8% each.
Brain stem was the brain region having the highest mean PFSAand PFCA concentrations (41 ng/g ww and 164 ng/g ww) followedby cerebellum (31 ng/g ww and 111 ng/g ww) and hypothalamus(28 ng/g ww and 101 ng/g ww). Mean PFSA and PFCA concentra-tions in remaining brain regions were ∼25 ng/g ww and ∼85 re-spectively and significantly lower than in brain stem (po0.05).
3.2. Correlations between neurochemical markers and PFAS
Statistical analyses of variance in neurochemical markersshowed that brain region was a significant factor for response ofMAO, GS, GABA-A and mAChR. Hence correlation analyses wereperformed for each brain region individually but also on the fulldata set (as a secondary/exploratory analyses recognizing withinindividual confounding; explored to increase sample size).
When assessing correlations in individual brain regions sig-nificant correlations were observed between MAO activity andPFTrDA (rp¼0.83, p¼0.04, n¼6) and ∑PFCAs (rp¼0.83, p¼0.04,n¼6) in occipital lobe. Further a borderline relation was present inoccipital lobe between MAO activity and PFDoDA (rp¼0.225,p¼0.077, n¼6) (Table 3). Across brain regions correlative analysesdemonstrated significant positive linear associations betweenMAO activity and all investigated single/or groups of PFASs, i.e. 6/6investigated correlations. Correlations are illustrated in Fig. 2.Specifically MAO activity was positively correlated with PFOS(rp¼0.50, po0.0001, n¼50), ∑PFSAs, (rp¼0.44, p¼0.001, n¼50),PFUnDA (rp¼0.50, po0.001, n¼50), PFDoDA (rp¼0.41, p¼0.003,n¼50), PFTrDA (rp¼0.46, p¼0.001, n¼50) and ∑PFCAs (rp¼0.47,p¼0.001, n¼50). In summary MAO activity were significantlycorrelated with PFASs in 6/6 tested correlation across brain regionsand in 2/54 correlations in individual brain regions, both in theoccipital lobe.
When assessing association between mAChR density and PFASsin individual brain regions negative correlations were observed in
cerebellum for PFUnDA (rp¼�0.94, p¼0.02, n¼5), PFTrDA(rp¼�0.91, p¼0.03, n¼5) and ∑PFCAs (rp¼�0.95, p¼0.01, n¼5).In addition both PFOS and ∑PFSA along with PFDoDA showednegative borderline correlations with mAChR density in cere-bellum (Table 4). Across brain regions significant negative linearcorrelations were found between mAChR density and all in-vestigated single/or groups of PFASs across brain regions, i.e. 6/6investigated correlations (Fig. 3). Density of mAChR was negativelycorrelated with PFOS (rp¼�0.36, p¼0.01, n¼52), ∑PFSAs,(rp¼�0.37, p¼0.01, n¼52), PFUnDA (rp¼�0.37, p¼0.01, n¼52),PFDoDA (rp¼�0.46, p¼0.001, n¼52), PFTrDA (rp¼�0.38,p¼0.006, n¼52) and ∑PFCAs (rp¼�0.40, p¼0.003, n¼52). Insummary mAChR density was significantly correlated with PFASsin 6/6 tested correlations across brain regions and in 3/54 corre-lations in individual brain regions, all of the latter were observedin cerebellum in addition to 3 correlations of borderline sig-nificance. It should be noted that two significant positive corre-lations between mAChR density and PFASs, namely PFOS (rp¼0.94,p¼0.006, n¼6) and ∑PFSA (rp¼0.98, p¼0.0008, n¼6), were ob-served in frontal cortex (Table 4).
Within single brain regions GABA-A density showed a singlesignificant negative correlation with PFDoDA (rp¼�0.843,p¼0.035, n¼6) (Table 4). Across brain regions significant positivelinear correlations were observed for GABA-A density and PFOS(rp¼0.33, p¼0.02, n¼52) and PFDoDA (rp¼0.34, p¼0.01, n¼52)across brain regions, i.e. in 2/6 correlations. Correlations are illu-strated in Fig. 4. Further correlations between GABA-A density and∑PFSAs, PFUnDA and ∑PFCAs showed borderline positive asso-ciations (rp¼0.27, p¼0.055; rp¼0.27, p¼0.053 and rp¼0.26,p¼0.066 respectively, Table 4). In summary positive correlationswere observed in 3/6 cases across brain regions, in addition to 3 ofborderline significance.
When investigating associations within individual brain re-gions significant negative correlations were found for AChE ac-tivity, PFDoDA and PFUnDA (rp¼�0.92, p¼0.03; n¼5; rp¼�0.90,p¼0.04, n¼5) in cerebellum. Also in thalamus AChE activity wasnegatively correlated with PFDoDA (rp¼�0.89, p¼0.04, n¼6). Infrontal cortex significant negative correlations with AChE activitywere found for PFTrDA (rp¼�0.90, p¼0.02, n¼6) and ∑PFCAs (rp¼�0.95, p¼0.003, n¼6). In summary AChE activity was nega-tively correlated with PFASs in 5 out of 54 cases (Table 3). Corre-lative analyses did not reveal any significant associations betweenPFASs and activity of AChE across brain regions. However negativelinear borderline correlations were observed for AChE activity vs.PFOS and ∑PFCAs (rp¼�0.27, p¼0.06; rp¼�0.12, p¼0.07 re-spectively, Table 3).
GS activity was significantly positively correlated to PFOS,∑PFSAs and PFUnDA in occipital lobe (rp¼0.84, p¼0.037, n¼6;rp¼0.82, p¼0.046, n¼6; rp¼0.88, p¼0.02; n¼6, Table 3). In ad-dition borderline correlations were observed between GS activityand remaining PFSAs, i.e. between GS activity and PFDoDA, PFTrDAand ∑PFCAs (rp¼0.781, p¼0.067, n¼6; rp¼0.769, p¼0.074, n¼6;rp¼0.80, p¼0.056; n¼6) in occipital lobe. Further, significantpositive correlations were observed between GS activity, PFOS and∑PFSAs in frontal cortex (rp¼0.89, p¼0.02, n¼6; rp¼0.86,p¼0.03, n¼6), whereas a negative correlation was present be-tween GS activity and ∑PFSAs in hypothalamus (rp¼�0.99,p¼0.02, n¼4). In summary GS activity was positively correlatedwith the PFASs in 8/54 cases (3 of borderline significance), ofwhich six correlations were observed in the occipital lobe. Onecase showed a negative correlation (Table 3).
D2 density showed significant negative linear relationshipswith the investigated PFCAs in temporal cortex; PFUnDA (rp¼�0.86, p¼0.0007, n¼8), PFDoDA (rp¼�0.84, p¼0.009, n¼8),PFTrDA (rp¼�0.90, p¼0.003, n¼8), and ∑PFCAs (rp¼�0.91,p¼0.002, n¼8). In cerebellum negative borderline correlations
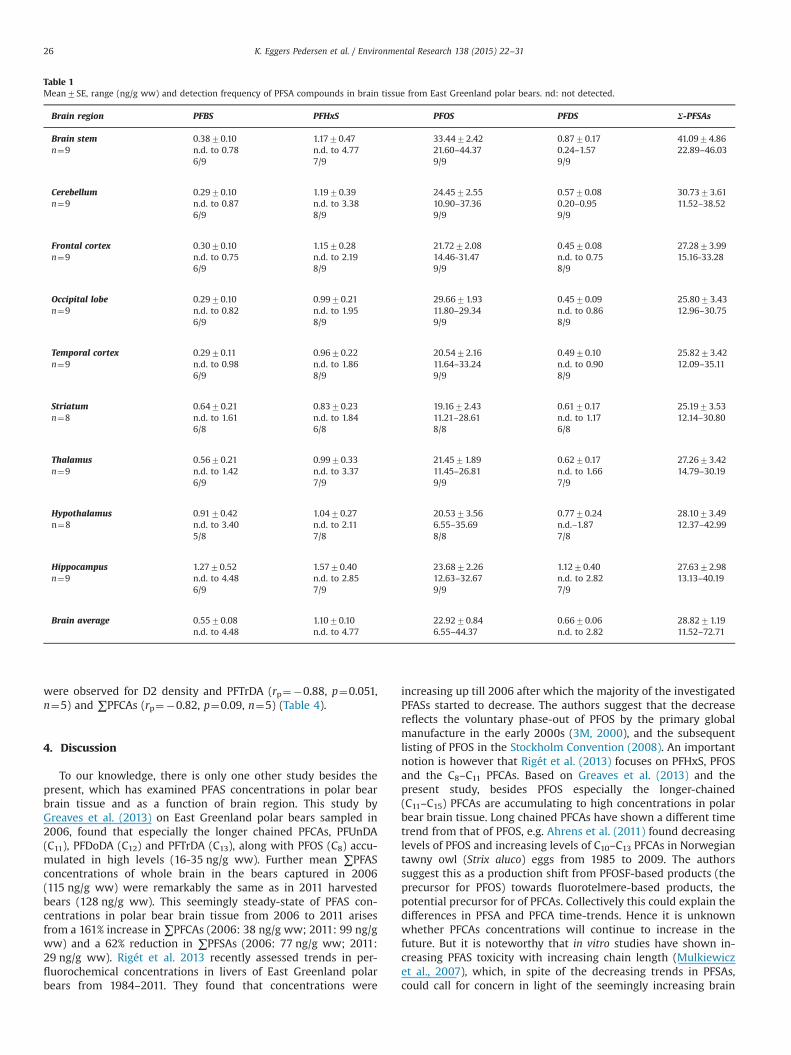
Table 1Mean7SE, range (ng/g ww) and detection frequency of PFSA compounds in brain tissue from East Greenland polar bears. nd: not detected.
Brain region PFBS PFHxS PFOS PFDS Σ-PFSAs
Brain stem 0.3870.10 1.1770.47 33.4472.42 0.8770.17 41.0974.86n¼9 n.d. to 0.78 n.d. to 4.77 21.60–44.37 0.24–1.57 22.89–46.03
6/9 7/9 9/9 9/9
Cerebellum 0.2970.10 1.1970.39 24.4572.55 0.5770.08 30.7373.61n¼9 n.d. to 0.87 n.d. to 3.38 10.90–37.36 0.20–0.95 11.52–38.52
6/9 8/9 9/9 9/9
Frontal cortex 0.3070.10 1.1570.28 21.7272.08 0.4570.08 27.2873.99n¼9 n.d. to 0.75 n.d. to 2.19 14.46-31.47 n.d. to 0.75 15.16-33.28
6/9 8/9 9/9 8/9
Occipital lobe 0.2970.10 0.9970.21 29.6671.93 0.4570.09 25.8073.43n¼9 n.d. to 0.82 n.d. to 1.95 11.80–29.34 n.d. to 0.86 12.96–30.75
6/9 8/9 9/9 8/9
Temporal cortex 0.2970.11 0.9670.22 20.5472.16 0.4970.10 25.8273.42n¼9 n.d. to 0.98 n.d. to 1.86 11.64–33.24 n.d. to 0.90 12.09–35.11
6/9 8/9 9/9 8/9
Striatum 0.6470.21 0.8370.23 19.1672.43 0.6170.17 25.1973.53n¼8 n.d. to 1.61 n.d. to 1.84 11.21–28.61 n.d. to 1.17 12.14–30.80
6/8 6/8 8/8 6/8
Thalamus 0.5670.21 0.9970.33 21.4571.89 0.6270.17 27.2673.42n¼9 n.d. to 1.42 n.d. to 3.37 11.45–26.81 n.d. to 1.66 14.79–30.19
6/9 7/9 9/9 7/9
Hypothalamus 0.9170.42 1.0470.27 20.5373.56 0.7770.24 28.1073.49n¼8 n.d. to 3.40 n.d. to 2.11 6.55–35.69 n.d.–1.87 12.37–42.99
5/8 7/8 8/8 7/8
Hippocampus 1.2770.52 1.5770.40 23.6872.26 1.1270.40 27.6372.98n¼9 n.d. to 4.48 n.d. to 2.85 12.63–32.67 n.d. to 2.82 13.13–40.19
6/9 7/9 9/9 7/9
Brain average 0.5570.08 1.1070.10 22.9270.84 0.6670.06 28.8271.19n.d. to 4.48 n.d. to 4.77 6.55–44.37 n.d. to 2.82 11.52–72.71
K. Eggers Pedersen et al. / Environmental Research 138 (2015) 22–3126
were observed for D2 density and PFTrDA (rp¼�0.88, p¼0.051,n¼5) and ∑PFCAs (rp¼�0.82, p¼0.09, n¼5) (Table 4).
4. Discussion
To our knowledge, there is only one other study besides thepresent, which has examined PFAS concentrations in polar bearbrain tissue and as a function of brain region. This study byGreaves et al. (2013) on East Greenland polar bears sampled in2006, found that especially the longer chained PFCAs, PFUnDA(C11), PFDoDA (C12) and PFTrDA (C13), along with PFOS (C8) accu-mulated in high levels (16-35 ng/g ww). Further mean ∑PFASconcentrations of whole brain in the bears captured in 2006(115 ng/g ww) were remarkably the same as in 2011 harvestedbears (128 ng/g ww). This seemingly steady-state of PFAS con-centrations in polar bear brain tissue from 2006 to 2011 arisesfrom a 161% increase in ∑PFCAs (2006: 38 ng/g ww; 2011: 99 ng/gww) and a 62% reduction in ∑PFSAs (2006: 77 ng/g ww; 2011:29 ng/g ww). Rigét et al. 2013 recently assessed trends in per-fluorochemical concentrations in livers of East Greenland polarbears from 1984–2011. They found that concentrations were
increasing up till 2006 after which the majority of the investigatedPFASs started to decrease. The authors suggest that the decreasereflects the voluntary phase-out of PFOS by the primary globalmanufacture in the early 2000s (3M, 2000), and the subsequentlisting of PFOS in the Stockholm Convention (2008). An importantnotion is however that Rigét et al. (2013) focuses on PFHxS, PFOSand the C8–C11 PFCAs. Based on Greaves et al. (2013) and thepresent study, besides PFOS especially the longer-chained(C11–C15) PFCAs are accumulating to high concentrations in polarbear brain tissue. Long chained PFCAs have shown a different timetrend from that of PFOS, e.g. Ahrens et al. (2011) found decreasinglevels of PFOS and increasing levels of C10–C13 PFCAs in Norwegiantawny owl (Strix aluco) eggs from 1985 to 2009. The authorssuggest this as a production shift from PFOSF-based products (theprecursor for PFOS) towards fluorotelmere-based products, thepotential precursor for of PFCAs. Collectively this could explain thedifferences in PFSA and PFCA time-trends. Hence it is unknownwhether PFCAs concentrations will continue to increase in thefuture. But it is noteworthy that in vitro studies have shown in-creasing PFAS toxicity with increasing chain length (Mulkiewiczet al., 2007), which, in spite of the decreasing trends in PFSAs,could call for concern in light of the seemingly increasing brain
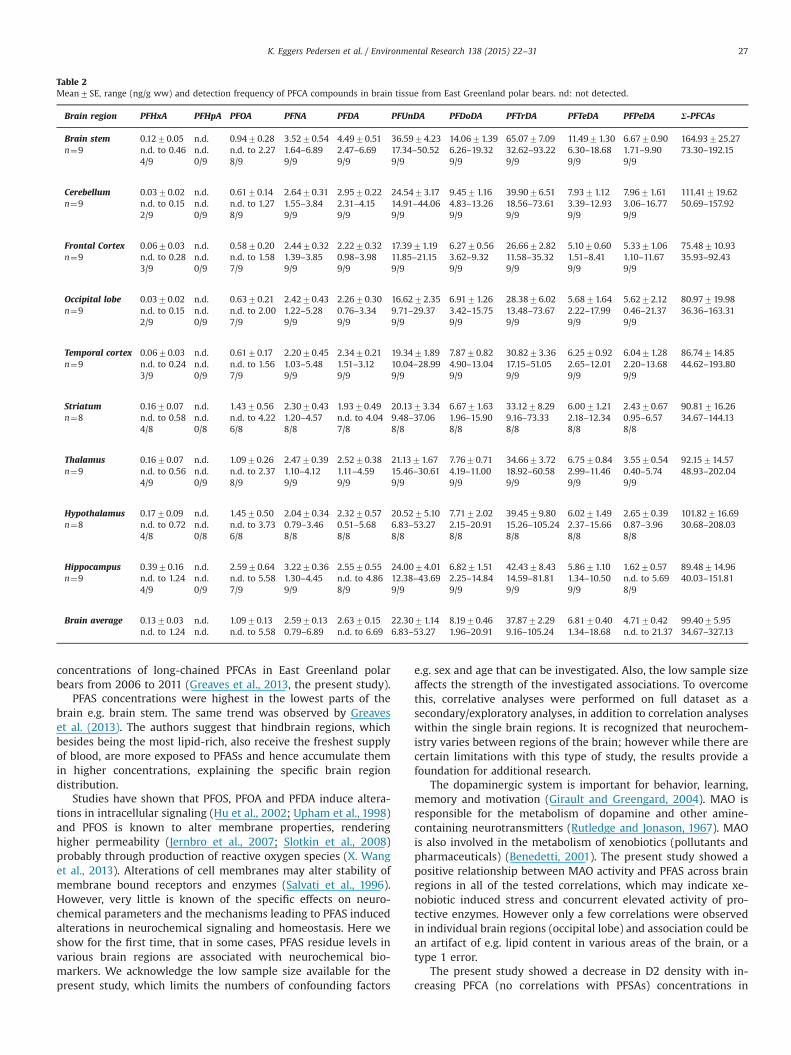
Table 2Mean7SE, range (ng/g ww) and detection frequency of PFCA compounds in brain tissue from East Greenland polar bears. nd: not detected.
Brain region PFHxA PFHpA PFOA PFNA PFDA PFUnDA PFDoDA PFTrDA PFTeDA PFPeDA Σ-PFCAs
Brain stem 0.1270.05 n.d. 0.9470.28 3.5270.54 4.4970.51 36.5974.23 14.0671.39 65.0777.09 11.4971.30 6.6770.90 164.93725.27n¼9 n.d. to 0.46 n.d. n.d. to 2.27 1.64–6.89 2.47–6.69 17.34–50.52 6.26–19.32 32.62–93.22 6.30–18.68 1.71–9.90 73.30–192.15
4/9 0/9 8/9 9/9 9/9 9/9 9/9 9/9 9/9 9/9
Cerebellum 0.0370.02 n.d. 0.6170.14 2.6470.31 2.9570.22 24.5473.17 9.4571.16 39.9076.51 7.9371.12 7.9671.61 111.41719.62n¼9 n.d. to 0.15 n.d. n.d. to 1.27 1.55–3.84 2.31–4.15 14.91–44.06 4.83–13.26 18.56–73.61 3.39–12.93 3.06–16.77 50.69–157.92
2/9 0/9 8/9 9/9 9/9 9/9 9/9 9/9 9/9 9/9
Frontal Cortex 0.0670.03 n.d. 0.5870.20 2.4470.32 2.2270.32 17.3971.19 6.2770.56 26.6672.82 5.1070.60 5.3371.06 75.48710.93n¼9 n.d. to 0.28 n.d. n.d. to 1.58 1.39–3.85 0.98–3.98 11.85–21.15 3.62–9.32 11.58–35.32 1.51–8.41 1.10–11.67 35.93–92.43
3/9 0/9 7/9 9/9 9/9 9/9 9/9 9/9 9/9 9/9
Occipital lobe 0.0370.02 n.d. 0.6370.21 2.4270.43 2.2670.30 16.6272.35 6.9171.26 28.3876.02 5.6871.64 5.6272.12 80.97719.98n¼9 n.d. to 0.15 n.d. n.d. to 2.00 1.22–5.28 0.76–3.34 9.71–29.37 3.42–15.75 13.48–73.67 2.22–17.99 0.46–21.37 36.36–163.31
2/9 0/9 7/9 9/9 9/9 9/9 9/9 9/9 9/9 9/9
Temporal cortex 0.0670.03 n.d. 0.6170.17 2.2070.45 2.3470.21 19.3471.89 7.8770.82 30.8273.36 6.2570.92 6.0471.28 86.74714.85n¼9 n.d. to 0.24 n.d. n.d. to 1.56 1.03–5.48 1.51–3.12 10.04–28.99 4.90–13.04 17.15–51.05 2.65–12.01 2.20–13.68 44.62–193.80
3/9 0/9 7/9 9/9 9/9 9/9 9/9 9/9 9/9 9/9
Striatum 0.1670.07 n.d. 1.4370.56 2.3070.43 1.9370.49 20.1373.34 6.6771.63 33.1278.29 6.0071.21 2.4370.67 90.81716.26n¼8 n.d. to 0.58 n.d. n.d. to 4.22 1.20–4.57 n.d. to 4.04 9.48–37.06 1.96–15.90 9.16–73.33 2.18–12.34 0.95–6.57 34.67–144.13
4/8 0/8 6/8 8/8 7/8 8/8 8/8 8/8 8/8 8/8
Thalamus 0.1670.07 n.d. 1.0970.26 2.4770.39 2.5270.38 21.1371.67 7.7670.71 34.6673.72 6.7570.84 3.5570.54 92.15714.57n¼9 n.d. to 0.56 n.d. n.d. to 2.37 1.10–4.12 1.11–4.59 15.46–30.61 4.19–11.00 18.92–60.58 2.99–11.46 0.40–5.74 48.93–202.04
4/9 0/9 8/9 9/9 9/9 9/9 9/9 9/9 9/9 9/9
Hypothalamus 0.1770.09 n.d. 1.4570.50 2.0470.34 2.3270.57 20.5275.10 7.7172.02 39.4579.80 6.0271.49 2.6570.39 101.82716.69n¼8 n.d. to 0.72 n.d. n.d. to 3.73 0.79–3.46 0.51–5.68 6.83–53.27 2.15–20.91 15.26–105.24 2.37–15.66 0.87–3.96 30.68–208.03
4/8 0/8 6/8 8/8 8/8 8/8 8/8 8/8 8/8 8/8
Hippocampus 0.3970.16 n.d. 2.5970.64 3.2270.36 2.5570.55 24.0074.01 6.8271.51 42.4378.43 5.8671.10 1.6270.57 89.48714.96n¼9 n.d. to 1.24 n.d. n.d. to 5.58 1.30–4.45 n.d. to 4.86 12.38–43.69 2.25–14.84 14.59–81.81 1.34–10.50 n.d. to 5.69 40.03–151.81
4/9 0/9 7/9 9/9 8/9 9/9 9/9 9/9 9/9 8/9
Brain average 0.1370.03 n.d. 1.0970.13 2.5970.13 2.6370.15 22.3071.14 8.1970.46 37.8772.29 6.8170.40 4.7170.42 99.4075.95n.d. to 1.24 n.d. n.d. to 5.58 0.79–6.89 n.d. to 6.69 6.83–53.27 1.96–20.91 9.16–105.24 1.34–18.68 n.d. to 21.37 34.67–327.13
K. Eggers Pedersen et al. / Environmental Research 138 (2015) 22–31 27
concentrations of long-chained PFCAs in East Greenland polarbears from 2006 to 2011 (Greaves et al., 2013, the present study).
PFAS concentrations were highest in the lowest parts of thebrain e.g. brain stem. The same trend was observed by Greaveset al. (2013). The authors suggest that hindbrain regions, whichbesides being the most lipid-rich, also receive the freshest supplyof blood, are more exposed to PFASs and hence accumulate themin higher concentrations, explaining the specific brain regiondistribution.
Studies have shown that PFOS, PFOA and PFDA induce altera-tions in intracellular signaling (Hu et al., 2002; Upham et al., 1998)and PFOS is known to alter membrane properties, renderinghigher permeability (Jernbro et al., 2007; Slotkin et al., 2008)probably through production of reactive oxygen species (X. Wanget al., 2013). Alterations of cell membranes may alter stability ofmembrane bound receptors and enzymes (Salvati et al., 1996).However, very little is known of the specific effects on neuro-chemical parameters and the mechanisms leading to PFAS inducedalterations in neurochemical signaling and homeostasis. Here weshow for the first time, that in some cases, PFAS residue levels invarious brain regions are associated with neurochemical bio-markers. We acknowledge the low sample size available for thepresent study, which limits the numbers of confounding factors
e.g. sex and age that can be investigated. Also, the low sample sizeaffects the strength of the investigated associations. To overcomethis, correlative analyses were performed on full dataset as asecondary/exploratory analyses, in addition to correlation analyseswithin the single brain regions. It is recognized that neurochem-istry varies between regions of the brain; however while there arecertain limitations with this type of study, the results provide afoundation for additional research.
The dopaminergic system is important for behavior, learning,memory and motivation (Girault and Greengard, 2004). MAO isresponsible for the metabolism of dopamine and other amine-containing neurotransmitters (Rutledge and Jonason, 1967). MAOis also involved in the metabolism of xenobiotics (pollutants andpharmaceuticals) (Benedetti, 2001). The present study showed apositive relationship between MAO activity and PFAS across brainregions in all of the tested correlations, which may indicate xe-nobiotic induced stress and concurrent elevated activity of pro-tective enzymes. However only a few correlations were observedin individual brain regions (occipital lobe) and association could bean artifact of e.g. lipid content in various areas of the brain, or atype 1 error.
The present study showed a decrease in D2 density with in-creasing PFCA (no correlations with PFSAs) concentrations in
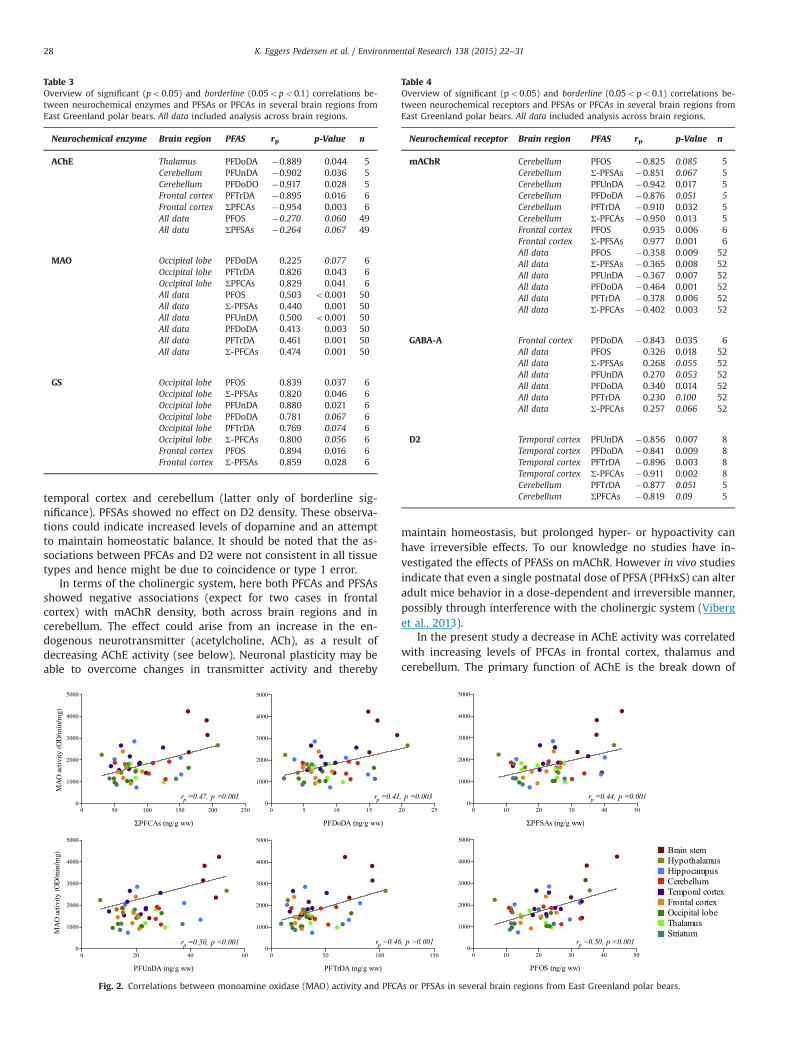
Table 3Overview of significant (po0.05) and borderline (0.05opo0.1) correlations be-tween neurochemical enzymes and PFSAs or PFCAs in several brain regions fromEast Greenland polar bears. All data included analysis across brain regions.
Neurochemical enzyme Brain region PFAS rp p-Value n
AChE Thalamus PFDoDA �0.889 0.044 5Cerebellum PFUnDA �0.902 0.036 5Cerebellum PFDoDO �0.917 0.028 5Frontal cortex PFTrDA �0.895 0.016 6Frontal cortex ΣPFCAs �0.954 0.003 6All data PFOS �0.270 0.060 49All data ΣPFSAs �0.264 0.067 49
MAO Occipital lobe PFDoDA 0.225 0.077 6Occipital lobe PFTrDA 0.826 0.043 6Occipital lobe ΣPFCAs 0.829 0.041 6All data PFOS 0.503 o0.001 50All data Σ-PFSAs 0.440 0.001 50All data PFUnDA 0.500 o0.001 50All data PFDoDA 0.413 0.003 50All data PFTrDA 0.461 0.001 50All data Σ-PFCAs 0.474 0.001 50
GS Occipital lobe PFOS 0.839 0.037 6Occipital lobe Σ-PFSAs 0.820 0.046 6Occipital lobe PFUnDA 0.880 0.021 6Occipital lobe PFDoDA 0.781 0.067 6Occipital lobe PFTrDA 0.769 0.074 6Occipital lobe Σ-PFCAs 0.800 0.056 6Frontal cortex PFOS 0.894 0.016 6Frontal cortex Σ-PFSAs 0.859 0.028 6
Table 4Overview of significant (po0.05) and borderline (0.05opo0.1) correlations be-tween neurochemical receptors and PFSAs or PFCAs in several brain regions fromEast Greenland polar bears. All data included analysis across brain regions.
Neurochemical receptor Brain region PFAS rp p-Value n
mAChR Cerebellum PFOS �0.825 0.085 5Cerebellum Σ-PFSAs �0.851 0.067 5Cerebellum PFUnDA �0.942 0.017 5Cerebellum PFDoDA �0.876 0.051 5Cerebellum PFTrDA �0.910 0.032 5Cerebellum Σ-PFCAs �0.950 0.013 5Frontal cortex PFOS 0.935 0.006 6Frontal cortex Σ-PFSAs 0.977 0.001 6All data PFOS �0.358 0.009 52All data Σ-PFSAs �0.365 0.008 52All data PFUnDA �0.367 0.007 52All data PFDoDA �0.464 0.001 52All data PFTrDA �0.378 0.006 52All data Σ-PFCAs �0.402 0.003 52
GABA-A Frontal cortex PFDoDA �0.843 0.035 6All data PFOS 0.326 0.018 52All data Σ-PFSAs 0.268 0.055 52All data PFUnDA 0.270 0.053 52All data PFDoDA 0.340 0.014 52All data PFTrDA 0.230 0.100 52All data Σ-PFCAs 0.257 0.066 52
D2 Temporal cortex PFUnDA �0.856 0.007 8Temporal cortex PFDoDA �0.841 0.009 8Temporal cortex PFTrDA �0.896 0.003 8Temporal cortex Σ-PFCAs �0.911 0.002 8Cerebellum PFTrDA �0.877 0.051 5Cerebellum ΣPFCAs �0.819 0.09 5
K. Eggers Pedersen et al. / Environmental Research 138 (2015) 22–3128
temporal cortex and cerebellum (latter only of borderline sig-nificance). PFSAs showed no effect on D2 density. These observa-tions could indicate increased levels of dopamine and an attemptto maintain homeostatic balance. It should be noted that the as-sociations between PFCAs and D2 were not consistent in all tissuetypes and hence might be due to coincidence or type 1 error.
In terms of the cholinergic system, here both PFCAs and PFSAsshowed negative associations (expect for two cases in frontalcortex) with mAChR density, both across brain regions and incerebellum. The effect could arise from an increase in the en-dogenous neurotransmitter (acetylcholine, ACh), as a result ofdecreasing AChE activity (see below). Neuronal plasticity may beable to overcome changes in transmitter activity and thereby
Fig. 2. Correlations between monoamine oxidase (MAO) activity and PFCA
maintain homeostasis, but prolonged hyper- or hypoactivity canhave irreversible effects. To our knowledge no studies have in-vestigated the effects of PFASs on mAChR. However in vivo studiesindicate that even a single postnatal dose of PFSA (PFHxS) can alteradult mice behavior in a dose-dependent and irreversible manner,possibly through interference with the cholinergic system (Viberget al., 2013).
In the present study a decrease in AChE activity was correlatedwith increasing levels of PFCAs in frontal cortex, thalamus andcerebellum. The primary function of AChE is the break down of
s or PFSAs in several brain regions from East Greenland polar bears.
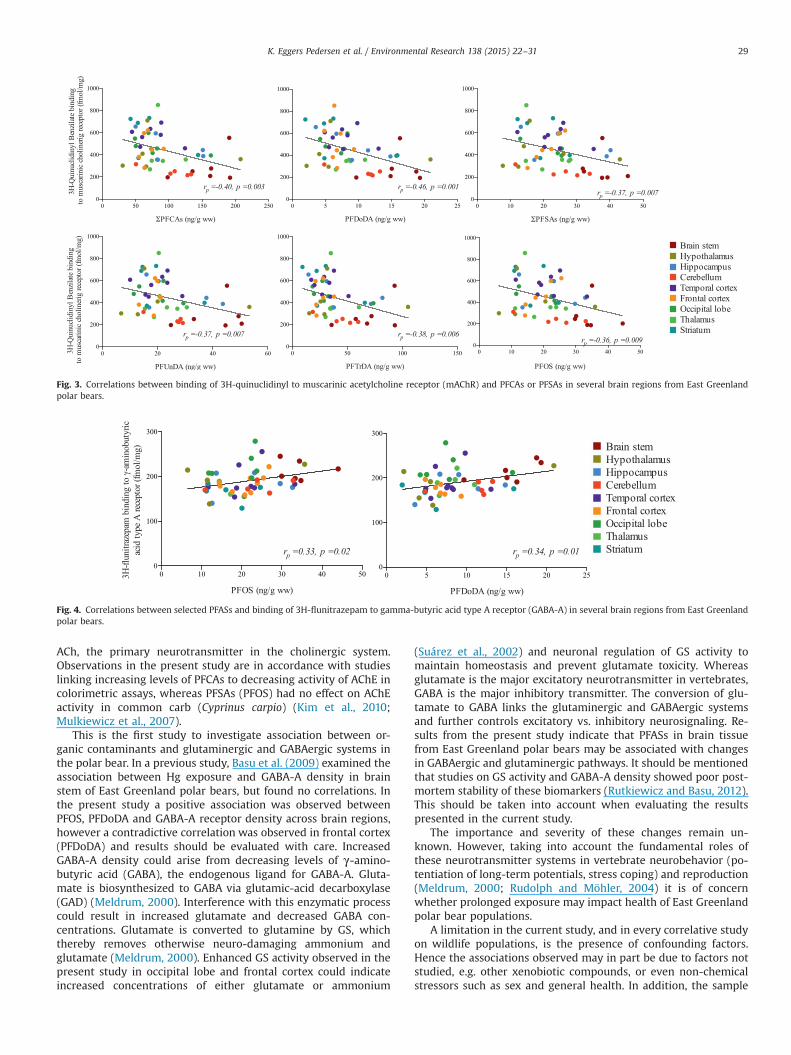
Fig. 3. Correlations between binding of 3H-quinuclidinyl to muscarinic acetylcholine receptor (mAChR) and PFCAs or PFSAs in several brain regions from East Greenlandpolar bears.
Fig. 4. Correlations between selected PFASs and binding of 3H-flunitrazepam to gamma-butyric acid type A receptor (GABA-A) in several brain regions from East Greenlandpolar bears.
K. Eggers Pedersen et al. / Environmental Research 138 (2015) 22–31 29
ACh, the primary neurotransmitter in the cholinergic system.Observations in the present study are in accordance with studieslinking increasing levels of PFCAs to decreasing activity of AChE incolorimetric assays, whereas PFSAs (PFOS) had no effect on AChEactivity in common carb (Cyprinus carpio) (Kim et al., 2010;Mulkiewicz et al., 2007).
This is the first study to investigate association between or-ganic contaminants and glutaminergic and GABAergic systems inthe polar bear. In a previous study, Basu et al. (2009) examined theassociation between Hg exposure and GABA-A density in brainstem of East Greenland polar bears, but found no correlations. Inthe present study a positive association was observed betweenPFOS, PFDoDA and GABA-A receptor density across brain regions,however a contradictive correlation was observed in frontal cortex(PFDoDA) and results should be evaluated with care. IncreasedGABA-A density could arise from decreasing levels of γ-amino-butyric acid (GABA), the endogenous ligand for GABA-A. Gluta-mate is biosynthesized to GABA via glutamic-acid decarboxylase(GAD) (Meldrum, 2000). Interference with this enzymatic processcould result in increased glutamate and decreased GABA con-centrations. Glutamate is converted to glutamine by GS, whichthereby removes otherwise neuro-damaging ammonium andglutamate (Meldrum, 2000). Enhanced GS activity observed in thepresent study in occipital lobe and frontal cortex could indicateincreased concentrations of either glutamate or ammonium
(Suárez et al., 2002) and neuronal regulation of GS activity tomaintain homeostasis and prevent glutamate toxicity. Whereasglutamate is the major excitatory neurotransmitter in vertebrates,GABA is the major inhibitory transmitter. The conversion of glu-tamate to GABA links the glutaminergic and GABAergic systemsand further controls excitatory vs. inhibitory neurosignaling. Re-sults from the present study indicate that PFASs in brain tissuefrom East Greenland polar bears may be associated with changesin GABAergic and glutaminergic pathways. It should be mentionedthat studies on GS activity and GABA-A density showed poor post-mortem stability of these biomarkers (Rutkiewicz and Basu, 2012).This should be taken into account when evaluating the resultspresented in the current study.
The importance and severity of these changes remain un-known. However, taking into account the fundamental roles ofthese neurotransmitter systems in vertebrate neurobehavior (po-tentiation of long-term potentials, stress coping) and reproduction(Meldrum, 2000; Rudolph and Möhler, 2004) it is of concernwhether prolonged exposure may impact health of East Greenlandpolar bear populations.
A limitation in the current study, and in every correlative studyon wildlife populations, is the presence of confounding factors.Hence the associations observed may in part be due to factors notstudied, e.g. other xenobiotic compounds, or even non-chemicalstressors such as sex and general health. In addition, the sample
K. Eggers Pedersen et al. / Environmental Research 138 (2015) 22–3130
size is rather limited, which limits the statistical power of thecorrelative associations. However, unlike many wildlife studies, amajor strength of the study is that the tissues were obtained aspart of a field campaign in which freshly harvested tissues wereimmediately stored frozen in liquid nitrogen thus lessening theinfluence of post-mortem stability factors that may affect bio-marker values (Rutkiewicz and Basu, 2012).
It is not known whether the observed alterations in neuro-chemical signaling are currently having negative effects on neu-rological functions in East Greenland polar bears. However, resultsfrom the present study, when coupled with limited laboratoryanimal studies (Hu et al., 2002, Johansson et al., 2009, 2008, Kimet al., 2010, Viberg et al., 2013), indicate that neurochemical sys-tems important in animal behavior may be affected by exposure toPFASs. The present study indicates an urgent need for a betterunderstanding of the neurochemical effects of PFAS exposure towildlife.
5. Concluding remarks
The present study is the first to show significant correlationsbetween brain region-specific PFSA and PFCA exposure (con-centrations and congener patterns) and several neurochemicalmarkers in a wildlife species, notably the East Greenland polarbear. These correlative results support the hypothesis that PFSA/PFCA concentrations in polar bears from East Greenland may beeliciting effects on the cholinergic, glutaminergic, GABAergic anddopaminergic systems. Given the importance of these systems incognitive processes and motor function, this may be an indicationof early adverse changes in neuro-behavior and animal health. It ishighly recommended that further studies be performed to in-vestigate the neurotoxic effects of PFASs, especially PFCAs, onarctic mammals, including the polar bear. Furthermore additionalend-points e.g. the sex steroid receptors and the peroxisomeproliferator-activated receptors should be included.
Appendix A. Supplementary material
Supplementary data associated with this article can be found inthe online version at http://dx.doi.org/10.1016/j.envres.2015.01.015.
References
3M, 2000. Phase-out Plan for POSF-based Products. 3M , Specialty Materials Mar-kets Group. United States Environmental Protection Agency (U.S. EPA) DocketOPPT-2002-0043. St. Paul, MN .
Ahrens, L., Herzke, D., Huber, S., Bustnes, J.O., Bangjord, G., Ebinghaus, R., 2011.Temporal trends and pattern of polyfluoroalkyl compounds in Tawny Owl (Strixaluco) eggs from Norway, 1986–2009. Environ. Sci. Technol. 45, 8090–8097.http://dx.doi.org/10.1021/es103473v.
AMAP, 2004. Assessment 2002: Persistent Organic Pollutants in the Arctic. ArcticMonitoring and Assessment Programme. Oslo, Norway.
Basu, N., 2014. Applications and implications of neurochemical biomarkers in en-vironmental toxicology. Environ. Toxicol. Chem. 34, 22–29. http://dx.doi.org/10.1002/etc.2783.
Basu, N., Klenavic, K., Gamberg, M., O'Brien, M., Evans, D., Scheuhammer, A.M.,et al., 2005. Effects of mercury on neurochemical receptor-binding character-istics in wild mink. Environ. Toxicol. Chem. 24, 1444–1450. http://dx.doi.org/10.1897/04-048R.1.
Basu, N., Scheuhammer, M., Evans, R.D., O'Brien, M., Chan, H.M., 2007b. Cholines-terase and monoamine oxidase activity in relation to mercury levels in thecerebral cortex of wild river otters. Hum. Exp. Toxicol. 26, 213–220. http://dx.doi.org/10.1177/0960327107070570.
Basu, N., Scheuhammer, M., Rouvinen-Watt, K., Grochowina, N., Evans, R.D., O'Brien,M., et al., 2007a. Decreased N-methyl-D-aspartic acid (NMDA) receptor levelsare associated with mercury exposure in wild and captive mink. Neurotox-icology 28, 587–593. http://dx.doi.org/10.1016/j.neuro.2006.12.007.
Basu, N., Scheuhammer, A.M., Sonne, C., Letcher, R.J., Born, E.W., Dietz, R., 2009. Isdietary mercury of neurotoxicological concern to wild polar bears (Ursusmaritimus)? Environ. Toxicol. Chem. 28, 133–140. http://dx.doi.org/10.1897/08-251.1.
Basu, N., Head, J., 2010. Mammalian wildlife as complementary models in en-vironmental neurotoxicology. Neurotoxicol. Teratol. 32, 114–119.
Benedetti, M.S., 2001. Biotransformation of xenobiotics by amine oxidases. Fundam.Clin. Pharmacol. 15, 75–84. http://dx.doi.org/10.1046/j.1472-8206.2001.00011.x.
Butt, C.M., Berger, U., Bossi, R., Tomy, G.T., 2010. Levels and trends of poly- andperfluorinated compounds in the Arctic environment. Sci. Total. Environ. 408,2936–2965.
Dietz, R., Bossi, R., Rigét, F.F., Sonne, C., Born, E.W., 2008. Increasing perfluoroalkylcontaminants in East Greenland polar bears (Ursus maritimus): a new toxicthreat to the Arctic bears. Environ. Sci. Technol. 42, 2701–2707.
Gebbink, W., Sonne, C., Dietz, R., Kirkegaard, M., Riget, F.F., Born, E.W., et al., 2008.Tissue-specific congener composition of organohalogen and metabolite con-taminants in East Greenland polar bears (Ursus maritimus). Environ. Pollut. 152,621–629. http://dx.doi.org/10.1016/j.envpol.2007.07.001.
Girault, J.A., Greengard, P., 2004. The neurobiology of dopamine signaling. Arch.Neurol. 61, 641–644. http://dx.doi.org/10.1001/archneur.61.5.641.
Gore, A.C., 2008. Developmental programming and endocrine disruptor effects onreproductive neuroendocrine systems. Front. Neuroendocrinol. 29, 358–374.http://dx.doi.org/10.1016/j.yfrne.2008.02.002.
Greaves, A.K., Letcher, R.J., Sonne, C., Dietz, R., Born, E.W., 2012. Tissue-specificconcentrations and patterns of perfluoroalkyl carboxylates and sulfonates inEast Greenland polar bears. Environ. Sci. Technol. 46, 11575–11583. http://dx.doi.org/10.1021/es303400f.
Greaves, A.K., Letcher, R.J., Sonne, C., Dietz, R., 2013. Brain region distribution andpatterns of bioaccumulative perfluoroalkyl carboxylates and sulfonates in EastGreenland polar bears (Ursus maritimus). Environ. Toxicol. Chem. 32, 713–722.http://dx.doi.org/10.1002/etc.2107.
Houde, M., De Silva, A.O., Muir, D.C.G., Letcher, R.J., 2011. An updated review ofmonitoring and accumulation of perfluorinated compounds in aquatic biota.Environ. Sci. Technol. 45, 7962–7973.
Hu, W., Jones, P.D., Upham, B.L., Trosko, J.E., Lau, C., Giesy, J.P., 2002. Inhibition ofgap junctional intercellular communication by perfluorinated compounds in ratliver and dolphin kidney epithelial cell lines in vitro and Sprague-Dawley ratsin vivo. Toxicol. Sci. 68, 429–436.
Jernbro, S., Rocha, P.S., Keiter, S., Skutlarek, D., Färber, H., Jones, P.D., et al., 2007.Short Original Communications. Perfluorooctane Sulfonate Increases the Gen-otoxicity of Cyclophosphamide in the Micronucleus Assay with V79 Cells Fur-ther Proof of Alterations in Cell Membrane Properties Caused by PFOS. vol. 14,pp. 85–87.
Johansson, N., Fredriksson, A., Eriksson, P., 2008. Neonatal exposure to per-fluorooctane sulfonate (PFOS) and perfluorooctanoic acid (PFOA) causes neu-robehavioural defects in adult mice. Neurotoxicology 29, 160–169. http://dx.doi.org/10.1016/j.neuro.2007.10.008.
Johansson, N., Eriksson, P., Viberg, H., 2009. Neonatal exposure to PFOS and PFOA inmice results in changes in proteins which are important for neuronal growthand synaptogenesis in the developing brain. Toxicol. Sci. 108, 412–418. http://dx.doi.org/10.1093/toxsci/kfp029.
Kim, W.K., Lee, S.K., Jung, J., 2010. Integrated assessment of biomarker responses incommon carp (Cyprinus carpio) exposed to perfluorinated organic compounds.J. Hazard. Mater. 180, 395–400. http://dx.doi.org/10.1016/j.jhazmat.2010.04.044.
Letcher, R.J., Gebbink, W., Sonne, C., Born, E.W., McKinney, M., Dietz, R., 2009.Bioaccumulation and biotransformation of brominated and chlorinated con-taminants and their metabolites in ringed seals (Pusa hispida) and polar bears(Ursus maritimus) from East Greenland. Environ. Int. 35, 1118–1124. http://dx.doi.org/10.1016/j.envint.2009.07.006.
Letcher, R.J., Bustnes, J.O., Dietz, R., Jenssen, B.M., Jørgensen, E.H., Sonne, C., et al.,2010. Exposure and effects assessment of persistent organohalogen con-taminants in Arctic wildlife and fish. Sci. Total Environ. 408, 2995–3043. http://dx.doi.org/10.1016/j.scitotenv.2009.10.038.
Lindstrom, A.B., Strynar, M.J., Libelo, E.L., 2011. Polyfluorinated compounds: past,present, and future. Environ. Sci. Technol. 45, 7954–7961.
Meldrum, B., 2000. Glutamate as a Neurotransmitter in the brain : review of phy-siology and pPathology. J. Nutr. 8, 1007–1015.
Mulkiewicz, E., Jastorff, B., Składanowski, C., Kleszczyński, K., Stepnowski, P., 2007.Evaluation of the acute toxicity of perfluorinated carboxylic acids using eu-karyotic cell lines, bacteria and enzymatic assays. Environ. Toxicol. Pharmacol.23, 279–285. http://dx.doi.org/10.1016/j.etap.2006.11.002.
Papandreou, M., Dimakopoulou, A., Linardaki, Z.I., Cordopatis, P., Klimis-Zacas, D.,Margarity, M., et al., 2009. Effect of a polyphenol-rich wild blueberry extract oncognitive performance of mice, brain antioxidant markers and acet-ylcholinesterase activity. Behav. Brain Res. 198, 352–358. http://dx.doi.org/10.1016/j.bbr.2008.11.013.
Paul, A.G., Jones, K.C., Sweetman, A.J., 2009. A first global production, emission, andenvironmental inventory for perfluorooctane sulfonate. Environ. Sci. Technol.43, 386–392.
Pinkas, A., Slotkin, T., Brick-Turin, Y., Van der Zee, E., Yanai, J., 2010. Neurobehavioralteratogenicity of perfluorinated alkyls in an avian model. Neurotoxicol. Teratol.32, 182–186. http://dx.doi.org/10.1016/j.ntt.2009.11.004.
Ramsay, M.A., Stirling, I., 1988. Reproductive biology and ecology of the femalepolar bears (Ursus maritimus). J. Zool. 214, 601–634.
Rigét, F., Bossi, R., Sonne, C., Vorkamp, K., Dietz, R., 2013. Trends of
K. Eggers Pedersen et al. / Environmental Research 138 (2015) 22–31 31
perfluorochemicals in Greenland ringed seals and polar bears: indications ofshifts to decreasing trends. Chemosphere 93, 1607–1614.
Rudolph, U., Möhler, H., 2004. Analysis of GABA-A receptor function and dissectionof the pharmacology of benzodiazepines and general anesthetics throughmouse genetics. Annu. Rev. Pharmacol. Toxicol. 44, 475–498. http://dx.doi.org/10.1146/annurev.pharmtox.44.101802.121429.
Rutkiewicz, J., Basu, N., 2012. Postmortem stability of brain GABAergic and gluta-minergic receptors and enzymes under ecological conditions. Ecotoxicol. En-viron. Saf. 84, 133–138.
Rutledge, C., Jonason, J., 1967. Metabolic pathways of dopamine and nor-epinephrine in rabbit brain in vitro. J. Pharmacol. Exp. Ther. 157, 493–502.
Salvati, S., Attorri, L., Felice, M., Di., Campeggi, L., Pintor, A., Tiburzi, F., et al., 1996.Effect of dietary oils on brain enzymatic activities (2ʹ-3ʹ-cyclic nucleotide 3ʹ-phosphodiesterase and acetylcholinesterase) and muscarinic receptor site ingrowing rats. Natl. Biochem. 7, 113–117.
Santoro, J.C., Harris, G., Sitlani, A., 2001. Colorimetric detection of glutamine syn-thetase-catalyzed transferase activity in glucocorticoid-treated skeletal musclecells. Anal. Biochem. 289, 18–25. http://dx.doi.org/10.1006/abio.2000.4911.
Slotkin, T., MacKillop, E., Melnick, R.L., Thayer, K., Seidler, F.J., 2008. Developmentalneurotoxicity of perfluorinated chemicals modeled in vitro. Environ. HealthPerspect. 116, 716–722. http://dx.doi.org/10.1289/ehp.11253.
Smithwick, M., Mabury, S., Solomon, K.R., Sonne, C., Martin, J.W., Born, E.W., et al.,2005. Circumpolar study of perfluoroalkyl contaminants in polar bears (Ursusmaritimus). Environ. Sci. Technol. 39, 5517–5523.
Snodgrass, S., 1978. Use of 3H-muscimol for GABA receptor studies. Nature 273,392–394.
Stamler, C.J., Basu, N., Man Chan, H., 2005. Biochemical markers of neurotoxicity inwildlife and human populations: considerations for method development. J.Toxicol. Environ. Health A 68, 1413–1429. http://dx.doi.org/10.1080/15287390590956560.
Stockholm Convention, 2008. ⟨http://chm.pops.int/Convention/The POPs/ListingofPOPs/tabid/2509/Default.aspx⟩ (accessed 12.06.14).
Suárez, I., Bodega, G., Fernández, B., 2002. Glutamine synthetase in brain: effect ofammonia. Neurochem. Int. 41, 123–142.
Upham, B.L., Decampo, N.D., Wurl, B., Trosko, J.E., 1998. Inhibition of gap junctionalintercellular communication by perfluorinated fatty acids is dependent on thechain length of the fluorinated tail. Int. J. Cancer 78, 491–495.
Viberg, H., Lee, I., Eriksson, P., 2013. Adult dose-dependent behavioral and cognitivedisturbances after single oral neonatal PFHxS dose. Toxicology 304, 185–191.
Wang, X., Zhao, G., Liang, J., Jiang, J., Chen, N., Yu, J., et al., 2013a. PFOS-inducedapoptosis through mitochondrion-dependent pathway in human-hamster hy-brid cells. Mutat. Res. 754, 51–57. http://dx.doi.org/10.1016/j.mrgentox.2013.04.004.
Wang, Z., Cousins, I.T., Scheringer, M., Hungerbühler, K., 2013b. Fluorinated alter-natives to long-chain perfluoroalkyl carboxylic acids (PFCAs), perfluoroalkanesulfonic acids (PFSAs) and their potential precursors. Environ. Int. 60, 242–248.
Related Documents