Brain Phenotypes in Two FGFR2 Mouse Models for Apert Syndrome Kristina Aldridge 1,* , Cheryl A. Hill 1 , Jordan R. Austin 1 , Christopher Percival 2 , Neus Martinez- Abadias 2 , Thomas Neuberger 3 , Yingli Wang 4 , Ethylin Wang Jabs 4 , and Joan T. Richtsmeier 2 1 Department of Pathology and Anatomical Sciences, University of Missouri-School of Medicine, Columbia, Missouri 2 Department of Anthropology, Pennsylvania State University, University Park, Pennsylvania 3 Huck Institutes of the Life Sciences, Pennsylvania State University, Hershey, Pennsylvania 4 Department of Genetics and Genomic Sciences, Mount Sinai School of Medicine, New York, New York Abstract Apert syndrome (AS) is one of at least nine disorders considered members of the fibroblast growth factor receptor (FGFR) -1, -2, and -3–related craniosynostosis syndromes. Nearly 100% of individuals diagnosed with AS carry one of two neighboring mutations on Fgfr2. The cranial phenotype associated with these two mutations includes coronal suture synostosis, either unilateral (unicoronal synostosis) or bilateral (bicoronal synostosis). Brain dysmorphology associated with AS is thought to be secondary to cranial vault or base alterations, but the variation in brain phenotypes within Apert syndrome is unexplained. Here, we present novel three-dimensional data on brain phenotypes of inbred mice at postnatal day 0 each carrying one of the two Fgfr2 mutations associated with AS. Our data suggest that the brain is primarily affected, rather than secondarily responding to skull dysmorphogenesis. Our hypothesis is that the skull and brain are both primarily affected in craniosynostosis and that shared phenogenetic developmental processes affect both tissues in craniosynostosis of Apert syndrome. Keywords Apert syndrome; craniosynostosis; suture; mouse; skull; brain; development INTRODUCTION Apert syndrome (AS) is one of several genetic syndromes associated with craniosynostosis, occurring in 1 in 12.4–15.5/million live births (Cohen et al., 1992; Tolarova et al., 1997), with 99% of cases associated with one of two missense mutations in adjacent amino acids, Ser252Trp and Pro253Arg, of fibroblast growth factor receptor 2 (FGFR2). Individuals with AS display what has been described as a stereotypical constellation of dysmorphologies, most often including craniofacial dysmorphology and central nervous system (CNS) anomalies. However, the relative severity of brain dysmorphology and cognitive effects varies widely among individuals with AS (Blank, 1960; Lefebvre et al., 1986; Renier et al., 1996; Yacubian- *Correspondence to: Kristina Aldridge, Department of Pathology and Anatomical Sciences, University of Missouri-School of Medicine, One Hospital Drive, M309 Medical Sciences Building, Columbia, MO 65212. [email protected]. NIH Public Access Author Manuscript Dev Dyn. Author manuscript; available in PMC 2010 March 1. Published in final edited form as: Dev Dyn. 2010 March ; 239(3): 987–997. doi:10.1002/dvdy.22218. NIH-PA Author Manuscript NIH-PA Author Manuscript NIH-PA Author Manuscript

Welcome message from author
This document is posted to help you gain knowledge. Please leave a comment to let me know what you think about it! Share it to your friends and learn new things together.
Transcript

Brain Phenotypes in Two FGFR2 Mouse Models for ApertSyndrome
Kristina Aldridge1,*, Cheryl A. Hill1, Jordan R. Austin1, Christopher Percival2, Neus Martinez-Abadias2, Thomas Neuberger3, Yingli Wang4, Ethylin Wang Jabs4, and Joan T.Richtsmeier21 Department of Pathology and Anatomical Sciences, University of Missouri-School of Medicine,Columbia, Missouri2 Department of Anthropology, Pennsylvania State University, University Park, Pennsylvania3 Huck Institutes of the Life Sciences, Pennsylvania State University, Hershey, Pennsylvania4 Department of Genetics and Genomic Sciences, Mount Sinai School of Medicine, New York, NewYork
AbstractApert syndrome (AS) is one of at least nine disorders considered members of the fibroblast growthfactor receptor (FGFR) -1, -2, and -3–related craniosynostosis syndromes. Nearly 100% ofindividuals diagnosed with AS carry one of two neighboring mutations on Fgfr2. The cranialphenotype associated with these two mutations includes coronal suture synostosis, either unilateral(unicoronal synostosis) or bilateral (bicoronal synostosis). Brain dysmorphology associated with ASis thought to be secondary to cranial vault or base alterations, but the variation in brain phenotypeswithin Apert syndrome is unexplained. Here, we present novel three-dimensional data on brainphenotypes of inbred mice at postnatal day 0 each carrying one of the two Fgfr2 mutations associatedwith AS. Our data suggest that the brain is primarily affected, rather than secondarily responding toskull dysmorphogenesis. Our hypothesis is that the skull and brain are both primarily affected incraniosynostosis and that shared phenogenetic developmental processes affect both tissues incraniosynostosis of Apert syndrome.
KeywordsApert syndrome; craniosynostosis; suture; mouse; skull; brain; development
INTRODUCTIONApert syndrome (AS) is one of several genetic syndromes associated with craniosynostosis,occurring in 1 in 12.4–15.5/million live births (Cohen et al., 1992; Tolarova et al., 1997), with99% of cases associated with one of two missense mutations in adjacent amino acids,Ser252Trp and Pro253Arg, of fibroblast growth factor receptor 2 (FGFR2). Individuals withAS display what has been described as a stereotypical constellation of dysmorphologies, mostoften including craniofacial dysmorphology and central nervous system (CNS) anomalies.However, the relative severity of brain dysmorphology and cognitive effects varies widelyamong individuals with AS (Blank, 1960; Lefebvre et al., 1986; Renier et al., 1996; Yacubian-
*Correspondence to: Kristina Aldridge, Department of Pathology and Anatomical Sciences, University of Missouri-School of Medicine,One Hospital Drive, M309 Medical Sciences Building, Columbia, MO 65212. [email protected].
NIH Public AccessAuthor ManuscriptDev Dyn. Author manuscript; available in PMC 2010 March 1.
Published in final edited form as:Dev Dyn. 2010 March ; 239(3): 987–997. doi:10.1002/dvdy.22218.
NIH
-PA Author Manuscript
NIH
-PA Author Manuscript
NIH
-PA Author Manuscript

Fernandes et al., 2004, 2005). Although an absence of alterations of brain morphology has beenreported for some individuals diagnosed with AS (Yacubian-Fernandes et al., 2004, 2005), alarge proportion of individuals display a range of neuroanatomical anomalies. These includeincreased intracranial volume (Gosain et al., 1995; Anderson et al., 2004), megalencephaly(Cohen and Kreiborg, 1990, 1991, 1994; Gosain et al., 1995; Posnick et al., 1995; Cohen,2000), and ventriculomegaly (Tokumaru et al., 1996; Pooh et al., 1999; Cohen and MacLean,2000; Renier et al., 2000; Yacubian-Fernandes et al., 2004; Quintero-Rivera et al., 2006). Otherstudies have observed dysmorphology of the corpus callosum (de Leon et al., 1987; Cohen andKreiborg, 1990, 1991, 1994; Posnick et al., 1995), anomalies in limbic structure (de Leon etal., 1987; Cohen and Kreiborg, 1990, 1991; Renier et al., 2000; Quintero-Rivera et al., 2006),and in gyral patterning (Cohen and Kreiborg, 1990, 1991). Many individuals with AS displaycognitive deficits, including mental retardation (Patton et al., 1988; Cohen and Kreiborg,1990; Cohen, 2000); however, a large proportion of individuals with AS have an IQ well withinthe normal range (Patton et al., 1988; Yacubian-Fernandes et al., 2005), although other learningdeficits may be present (Lefebvre et al., 1986). The nature of the association betweenphenotypic abnormalities and cognitive deficits is not known, but it has been shown that earlysurgical treatment of cranial dysmorphologies does not prevent mental deficiencies (Cohenand Kreiborg, 1990).
The wide diversity of brain phenotypes among individuals with AS has been attributed tovarious causes, including: secondary effects of the pattern of suture fusion (Cohen andKreiborg, 1990; Yacubian-Fernandes et al., 2004), differing actions of the two FGFR2mutations responsible for AS (Lajeunie et al., 1999), variation in penetrance and expressivityof the FGFR2 mutations (Passos-Bueno et al., 2008), and the potential differences in the actionof the mutations on varying genetic backgrounds and environments (Slaney et al., 1996;Yacubian-Fernandes et al., 2005; Passos-Bueno et al., 2008). Theories about the variation inbrain phenotypes in AS cannot be tested in humans, as the number of cases carrying each ofthe two mutations is not large enough to enable true genotype-phenotype correlations (Passos-Bueno et al., 2008), nor can environmental factors be easily accounted for in the study ofhumans. Thus, we turn to two inbred mouse models for AS on the same genetic background,the Apert syndrome Fgfr2+/S252W mouse (Wang et al., 2005) and the Apert syndromeFgfr2+/P253R mouse (Wang et al., in press) to compare the effects of the two AS geneticmutations on brain phenotypes.
Mice with the Fgfr2 S252W mutation have been shown to display reduced body size andcraniofacial dysmorphology that mirrors that described in individuals with AS, includingcoronal suture fusion and metopic defect of the skull (Chen et al., 2003; Wang et al., 2005).Adult Fgfr2+/P253R mice have also been shown to display AS-like phenotypes, includingcraniofacial dysmorphology, coronal suture fusion, limb abnormalities, and abnormalities ofskull osteogenesis and chondrogenesis (Yin et al., 2008; Wang et al., in press).
Fibroblast growth factors induce diverse cellular responses in multiple biological systems bybinding to high-affinity cell-surface receptors suggesting their function as morphogens duringdevelopment (Hughes, 1997). FGFR2 signaling is known to regulate stem cell proliferation,affecting different cell lineages. The affected lineages include those important to the controlof endochondral and intra-membranous bone formation in cranial and postcranial structures(Iseki et al., 1999; Eswarakumar et al., 2002a), and those critical to the developing CNS, asindicated by expression local to the neural tube during neural crest cell migration, and inbranchial arches following neural crest cell migration (Wilke et al., 1997). Given the exquisiteregulation of Fgfr activity (Hughes, 1997; Ornitz and Marie, 2002), subtle variations in tissue-specific patterns of FGFR expression may be responsible for the complex patterning of normalmorphogenetic processes like angiogenesis and bone formation, as well as thedysmorphogenetic mechanisms underlying conditions like Apert syndrome. An appreciation
Aldridge et al. Page 2
Dev Dyn. Author manuscript; available in PMC 2010 March 1.
NIH
-PA Author Manuscript
NIH
-PA Author Manuscript
NIH
-PA Author Manuscript

for the complexity of FGF–FGFR interactions shows that the two known mutations that causeApert syndrome could produce varying patterns and magnitudes of phenotypic effects on manydeveloping systems, including the CNS.
To date, there has been no comparison of the effects of either of the two mutations on brainmorphology. This study is the first investigation of brain morphology in mouse models for ASand the first to compare the phenotypic effects of each mutation on the brain. In this study, wecompare brain phenotypes among inbred Fgfr2+/S252W, Fgfr2+/P253R, and their wild-typelittermates with the C57BL/6J strain at postnatal day (P) 0 using data from three-dimensional(3D) magnetic resonance microscopy (MRM) and morphometric methods. By studying miceon the day of birth we reduce the effect of external environmental factors that influence patternsof postnatal growth.
RESULTSBrain Size in Fgfr2+/S252W and Fgfr2+/P253R Mice
MRM images were acquired of all mice at the High Field Magnetic Resonance Facility of theHuck Institutes of the Life Sciences at the Pennsylvania State University(http://www.huck.psu.edu/facilities/hf-magnetic-resonance-up). The 3D coordinate locationsof neuroanatomical landmarks were recorded for 45 mice (ten Fgfr2+/S252W and 11 of theirwild-type littermates, and 14 Fgfr2+/P253R and ten of their wild-type littermates) from MRMimages using Analyze 9.0 (Robb et al., 1989). Fifteen landmarks (five bilateral, five midline)were defined for internal and surface cerebral, midbrain, cerebellar, and brainstem structures(Table 1; Fig. 1). Overall brain size, estimated as the geometric mean of all possible lineardistances between these landmarks (Darroch and Mosimann, 1985; Falsetti et al., 1993) wasstatistically compared among mutant and wild-type groups using Mann-Whitney U tests (Mannand Whitney, 1947). Of the four groups compared, average brain size is largest inFgfr2+/S252W mice (Table 2; Fig. 2). Average brain size of Fgfr2+/S252W mice exceeds that ofwild-type mice and of Fgfr2+/P253R mice in this sample. Average brain size is similar inFgfr2+/P253R mice and wild-type mice.
Coronal Suture Fusion in Apert Syndrome Fgfr2+/S252W and Fgfr2+/P253R Miceμ-Computed tomography (μ-CT) images were acquired at the Center for Quantitative Imagingat the Pennsylvania State University (www.cqi.psu.edu) and reconstructed in three dimensionsto visualize and assess cranial suture patency in Fgfr2+/S252W mice and their wild-typelittermates, and Fgfr2+/P253R mice and their wild-type littermates. None of the wild-type micedisplay fusion of any cranial vault suture at P0. On the other hand, results show clear variationin both pattern and degree of coronal suture closure in the mutant mice of both models at P0(Martinez-Abadias et al., in preparation). Fgfr2+/S252W and Fgfr2+/P253R mice are observedwith fusion of the right coronal suture, the left coronal suture, and of both coronal sutures(Table 3). Importantly, these varying patterns of suture closure are observed within litters ofmice.
Of the 10 Fgfr2+/S252W mice, 7 display complete fusion of both coronal sutures, and 3 displaycomplete unilateral coronal fusion. Of the three mice with unilateral suture fusion, two of themdisplay partial fusion of the contralateral coronal suture, with the remaining mouse having onepatent coronal suture. Of the 14 Fgfr2+/P253R mice, 6 display complete fusion of the left andright coronal sutures, 2 display partial fusion of both coronal sutures, and 6 display completeunilateral fusion of the coronal suture. Of the six mice with unilateral fusion, three displaypartial fusion of the contralateral coronal suture and three display patency of the contralateralcoronal suture.
Aldridge et al. Page 3
Dev Dyn. Author manuscript; available in PMC 2010 March 1.
NIH
-PA Author Manuscript
NIH
-PA Author Manuscript
NIH
-PA Author Manuscript

Brain Morphology Phenotype in Fgfr2+/S252W and Fgfr2+/P253R MiceMRM images were reconstructed in 3D to visualize and assess the gross morphology of thebrain. All non-neural tissues (e.g., skull, dura, blood vessels), as well as the olfactory bulbswere removed from the MRM images using Analyze 9.0 (Robb et al., 1989) to reconstruct thebrain surface. From these reconstructions, we qualitatively assessed overall brain morphology,brain symmetry, gross defects of the corpus callosum, and ventriculomegaly of the lateralventricles and fourth ventricle. Results of these observations are presented in Table 3 andexample phenotypes are illustrated in Figure 3.
Brain morphology in Fgfr2+/S252W mice is highly variable. Although all Fgfr2+/S252W miceshow reduced brain length (rostrocaudal) and increased cerebral height (dorsoventral), themagnitude of these effects varies considerably among the mutant mice. Additionally, theseverity of cerebral asymmetry in each individual is variable. Of the 10 Fgfr2+/S252W mice, 4mice display severe asymmetry and 1 mouse is mildly asymmetric, with the remaining 5 miceshowing no obvious asymmetry. Size of the lateral ventricles does not appear to differ betweenmutant and wild-type mice (i.e., there is no obvious ventriculomegaly of lateral ventricles),although two mice displayed enlarged fourth ventricles. Two of the ten Fgfr2+/S252W micedisplay a distinctly arched corpus callosum. These patterns of observable brain morphologyare not obviously associated with particular patterns of coronal suture fusion. For example, amouse with both coronal sutures fused may appear as asymmetric as a mouse with unilateralfusion.
As observed in the Fgfr2+/S252W mice, many of the Fgfr2+/P253R mice display relativelyreduced rostrocaudal length and increased dorsoventral height of the cerebrum, but the severityof these differences are variable. Furthermore, there is severe cerebral asymmetry in 1 of themutant mice and mild asymmetry in another, with the remaining 12 mice displaying overallsymmetry of the cerebral hemispheres. Of the 14 Fgfr2+/P253R mice, 3 display a markedlyarched corpus callosum in the midline, although the relative severity of the angle is variable,as is the relative superoinferior thickness of the midline aspect of this structure. Of the 14 mice,2 also appear to have an enlarged fourth ventricle, and one mouse displays enlarged lateralventricles. As seen in Fgfr2+/S252W mice, the patterns of observable brain morphology inFgfr2+/P253R are not obviously associated with a particular pattern of coronal suture fusion.
Quantitative Comparisons of Brain PhenotypesWe quantitatively assessed brain morphology using a principal coordinates application ofEuclidean distance matrix analysis, or PCOORD (Lele and Richtsmeier, 2001). Principalcoordinates analysis (PCOORD) allows determination of the specific combination ofmorphological variables that successfully separate individuals into groups of knownmembership by measuring dissimilarity among individuals within a multidimensional “formspace” (Richtsmeier et al., 1998). A series of orthogonal axes are fitted into the form spaceaccounting for the majority of the variation among cases. The ordination of individuals alongthese axes indicates morphological groupings among the mice based on commonalities ofcombinations of metric variables. Examination of variables that are strongly correlated withthe principal axes reveals those variables that account for the most variation between groups.Results of PCOORD analyses of the landmark data representing brain morphology of all mice(Fig. 4) show that the first and third principal axes (accounting for 23.42% and 10.59% ofvariance, respectively) do not reveal distinct subgroups based on model or genotype. Incontrast, the second principal axis (14.35% of variance) shows both groups of wild-type miceclustering primarily on the negative end of the axis while the mice carrying the FGFR2mutations are located on the positive end. Linear distances that are strongly correlated withposition along this 2nd principal axis describe an increased superoinferior height of thecerebrum and increased breadth of the rostral cerebrum in both groups of mutant mice relative
Aldridge et al. Page 4
Dev Dyn. Author manuscript; available in PMC 2010 March 1.
NIH
-PA Author Manuscript
NIH
-PA Author Manuscript
NIH
-PA Author Manuscript

to wild-type. When PCOORD analysis is conducted using only Fgfr2+/S252W andFgfr2+/P253R (Fig. 5) no distinct clusters of individuals are revealed along any of the first threeprincipal axes (55.03% of variance, collectively) based on genotype, nor do individuals formclusters based on pattern of cranial suture fusion. These results suggest that despite smalldifferences in overall brain size, brain morphology does not distinguish Fgfr2+/S252W fromFgfr2+/P253R mice, or distinguish mice with varying patterns of suture fusion.
DISCUSSIONBrain Size Is Not Increased in Either Model at P0
One of the most often noted characteristics of individuals with AS is increased intracranialvolume (ICV; Gosain et al., 1995; Posnick et al., 1995; Anderson et al., 2004). However, ithas also been noted that ICV is in the normal range at birth with rapid post-natal increase(Gosain et al., 1995). A study comparing the two AS mutations in humans determined thatthere is no difference in ICV (Anderson et al., 2004). The P0 mice carrying the FGFR2mutations in this study show slightly larger brain size relative to their normal littermates.Additionally, as observed in AS, there was no significant difference in brain size between thegroups carrying the different Fgfr2 mutations. Analyses of these mouse models of AS at laterdevelopmental stages are required to determine whether brain size or ICV is increasedpostnatally as is observed in AS.
Patterns of Gross Brain Morphology Are Highly Variable in Fgfr2+/S252W and Fgfr2+/P253R MiceSeverity of CNS abnormalities varies considerably among individuals with AS (Blank,1960). CNS anomalies have been observed in 55.6% of individuals with AS in a study byYacubian-Fernandes and colleagues (2005). However, CNS anomalies were not observed in25% of AS individuals studied by Renier et al (2000), 28% studied by Renier et al. (1996), and44.4% studied by Yacubian-Fernandes et al (2004). Only one anomaly was observed in 16.7%of the individuals with AS in the latter study. Of the 10 Fgfr2+/S252W mice, 3 did not show anyCNS abnormalities (30%), and 5 showed only one abnormality (50%). Of the 14Fgfr2+/P253R mice, 8 showed no CNS abnormalities (57%), and 4 mice displayed a singleanomaly (29%). No brain anomalies were observed in the wild-type mice.
In Fgfr2+/S252W mice, the most frequently observed anomaly is asymmetry of cerebralhemispheres, while only two of the Fgfr2+/P253R mice showed asymmetry. However, thepresence and the severity of cerebral asymmetry do not correlate with the pattern of coronalsuture fusion. Overall brain morphology in AS has been described as often asymmetric (Fig.6), although the degree of asymmetry varies (Lefebvre et al., 1986). The relationship betweencerebral asymmetry and coronal suture fusion has not been systematically investigated inhumans.
Ventriculomegaly is often observed in humans with AS (Noetzel et al., 1985; Cohen andKreiborg, 1990, 1994) and increased size of the lateral ventricles has been observed in variousfrequencies in individuals with AS. For example, Yacubian-Fernandes et al. (2004) observedventriculomegaly in 27.8% of individuals with AS in their study, Renier et al. (1996) observedit in 43% of AS individuals studied, and Quintero-Rivera et al. (2006) observed 89% of ASindividuals with ventriculomegaly. Noetzel et al. (1985) provide a developmentalconsideration of ventriculomegaly and state that when it is present at birth in individuals withAS, it does not progress with postnatal development or change postoperatively. They suggestthat the ventriculomegaly results from a primary disturbance of embryologic development,rather than occurring secondary to abnormal skull development. Only one of the mice in ourstudy displayed enlarged lateral ventricles (Fgfr2+/P253R), although four mice were observedto have enlarged fourth ventricles (two Fgfr2+/S252W and two Fgfr2+/P253R). The difference in
Aldridge et al. Page 5
Dev Dyn. Author manuscript; available in PMC 2010 March 1.
NIH
-PA Author Manuscript
NIH
-PA Author Manuscript
NIH
-PA Author Manuscript

this trait between mice and humans with AS may be due to species-specific differences in braincomposition. Further study of this trait is necessary to determine the cause for the divergentfindings.
Many individuals with AS show dysmorphology of the corpus callosum (Cohen and Kreiborg,1990, 1993), but it has been observed as normal in up to 70% of AS individuals considered inother studies (Renier et al., 1996; Yacubian-Fernandes et al., 2004). Dysmorphology of thecorpus callosum in individuals with AS is observed on the midsagittal plane as arched orrounded as compared to a more anteroposteriorly elongated and flat structure in typicallydeveloping individuals (Fig. 6). Two of the Fgfr2+/S252W and three Fgfr2+/P253R mice in thisstudy show the rounded corpus callosum (Fig. 3). This indicates a similar proportion of micewith the two FGFR2 mutations that show a rounded corpus callosum shape, which is similarto the proportion observed in individuals with AS.
3D Quantitative Brain Phenotypes Mirror Those Observed in ASMarsh et al. (1991) described the shape of the head in AS as having a flat and elongatedforehead, broader bitemporal width, broad and flattened occipital regions, andanteroposteriorly shortened cranial lengths. Cohen and Kreiborg (1994) describe dramaticincreases in head height and decreased head length present at birth. Additionally, they describethe decrease in head length as more pronounced than the observed increase in head breadth.Although our gross observations showed a distinction between both mutant models and theirrespective littermates in the rostrocaudal length of the cerebrum and the overall brain asdescribed for humans with AS, the quantitative traits that most strongly distinguish mutantfrom wild-type mice were the mediolateral breadth of the rostral cerebrum and overalldorsoventral cerebral height. Many studies of brain morphology in individuals with AS includechildren of older ages, suggesting this trait may become exacerbated later in postnataldevelopment. Study of later development in these mice will shed light on this possibility.Indeed, Yin et al. (2008) and Wang et al. (2005, in press) described decreased cranial length,increased cranial height and increased cranial width between paired frontal bones in the skullsof adult Fgfr2+/P253R mice, suggesting this may be the case. Because, to our knowledge, therehave not been quantitative analyses of 3D brain morphology of children with AS, it is difficultto directly compare our results with the human condition.
Brain Phenotypes Are Similar in Fgfr2+/S252W and Fgfr2+/P253R MiceAlthough clear differences exist in the phenotypic effects of the two Fgfr2 mutations on brainphenotypes at P0, our results do not support a hypothesis of one mutation showing relativelymore severe effects. Brain size is significantly increased in Fgfr2+/S252W mice by slightly lessthan 2%. In comparison, mean Fgfr2+/P253R brain size is increased by more than 1% relativeto wild-type littermates, although this difference is not statistically significant. Additionally,a greater proportion of Fgfr2+/S252W mice display cerebral asymmetry than observed inFgfr2+/P253R. Significantly, overall brain morphology distinguishes each AS mouse modelfrom their respective wild-type littermates, but does not distinguish the two Apert mousemodels from one another.
Brain Anomalies at P0 Are Not Correlated With Patterns of Suture FusionIt has been suggested that CNS anomalies in AS are the result of cranial suture fusion (Cohenand Kreiborg, 1990; Yacubian-Fernandes et al., 2004). The results of our study do not supportthis hypothesis. We find no evidence of correspondence between the pattern of suture fusion/patency and both qualitative and quantitative brain phenotypes, including cerebral asymmetry,corpus callosum dysmorphology, and overall brain morphology. These findings suggest adegree of independence in the processes underlying phenotypic alterations of calvarial vaultsutures and brain dysmorphogenesis.
Aldridge et al. Page 6
Dev Dyn. Author manuscript; available in PMC 2010 March 1.
NIH
-PA Author Manuscript
NIH
-PA Author Manuscript
NIH
-PA Author Manuscript

There are several potential explanations for our findings. Remembering that we are lookingonly at P0 mice, one possibility is that the mutations in FGFR2 have independent effects onformative tissues (neurogenic vs. chondrogenic vs. osteogenic), and that these effects produceearly alterations in morphogenesis of each tissue which in turn can ultimately affect theformation of alternate tissues. FGFR2 is expressed in the developing neural tube in proliferatingneuronal precursor cells (Maric et al., 2007; Frinchi et al., 2008). It is also expressed throughoutthe neural tube during neural crest cell migration (Wilke et al., 1997). Expression of FGFR2increases with age in certain regions of the brain, including white matter of the cerebrum andcerebellum (Bansal et al., 2003). Alternatively, the mutations in FGFR2 may have an effect ona third tissue that then affects both neural and osteogenic tissues. For example, a thin layer ofneural crest cell-derived cells travels with developing cerebral hemispheres, ultimatelydeveloping into the mature meningeal tissues (Gagan et al., 2007), a tissue that has beenproposed to be involved in the production of craniosynostosis phenotypes (Moss and Young,1960; Moss, 1979, 1997a–d; Opperman et al., 1993, 1995, 1998).
A second possibility is that suture fusion patterns may show a recognizable relationship withbrain morphology at later developmental stages that is not observed at P0. The continuedintegration of various tissues during postnatal growth may produce increased correlationsbetween suture fusion, skull dysmorphology, and brain phenotypes. Previous work on brainmorphology in human infants with isolated, single-suture craniosynostosis has shown patternsof brain morphology in infancy that correlate with skull dysmorphology (Gault et al., 1992;Aldridge et al., 2002, 2005, 2006; Richtsmeier et al., 2006). Study of infants with isolated,single-suture sagittal synostosis 1 year following surgical alteration of the calvarial vault alsoshowed postoperative changes in brain morphology (Aldridge et al., 2005). However, studieshave also shown patterns of brain dysmorphology, both pre- and postoperatively, that cannotbe explained by the shape of the skull (Aldridge et al., 2002, 2005, 2006). These studies haveincluded infants several months postnatal, not at birth as in the present study of P0 mice. Futureinvestigation of brain shape, skull shape, and suture biology in mouse models of Apertsyndrome at postnatal time points will determine whether brain morphology can be predictedby calvarial vault suture fusion patterns at later ontogenetic stages despite the lack of correlationat birth.
CONCLUSIONSEnormous progress has been made in identifying various mutations associated with theproduction of craniosynostosis. Still, even for those cases in which a causal gene has beendefined, the precise role of this mutation in producing craniofacial dysmorphology isunidentified. The gap between molecular events and phenotype obscures our understanding ofdisease process, prevents an accurate prediction of individual phenotypes, and precludes thedesign of individualized therapeutic strategies.
FGFR1, FGFR2, and FGFR3 tyrosine kinases and their ligands are known to play a crucialrole in the control of cell migration, proliferation, differentiation, and survival by activatingtwo primary pathways (Ornitz and Itoh, 2001; Wang et al., 2006). Signaling through FGFR2is known to regulate stem cell proliferation, affecting multiple cell lineages including thoseimportant to brain and bone formation (Iseki et al., 1999; Eswarakumar et al., 2002b).Simultaneous expression of Fgf ligands at sites in brain and skull primordia in an organismwith an Fgfr mutation will result in abnormal cellular function local to those sites. The abnormalcellular processes experienced by these separate tissues will initiate a series of events that resultin local sites of dysmorphogenesis that are ultimately observed as a composite phenotypicoutcome.
Aldridge et al. Page 7
Dev Dyn. Author manuscript; available in PMC 2010 March 1.
NIH
-PA Author Manuscript
NIH
-PA Author Manuscript
NIH
-PA Author Manuscript

We have demonstrated anomalies of the developing brain in two Fgfr2 models for Apertsyndrome, and our data suggest little or no relationship between patterns of premature sutureclosure and brain dysmorphology at P0. Further dissection of the co-development of skull andbrain morphology will define change in local developmental processes that underliecraniosynostosis phenotypes and their variation. The developmental relationships betweenthese two important tissues are key to the elucidation of the genotype-phenotype continuumin craniosynostosis.
EXPERIMENTAL PROCEDURESGeneration of Targeting Construct and Mutant Mice
The Apert Fgfr2+/S252W and Fgfr2+/P253R mice were generated in the laboratory of Dr. EthylinWang Jabs (Wang et al., 2005, in press). They were consistently inbred to a C57BL/6Jbackground to minimize phenotypic variation due to genetic differences. Genotyping of tailDNA to distinguish mutant from wild-type progeny was carried out by polymerase chainreaction analysis. The primers for Fgfr2 were as described (Wang et al., 2005). Care and useof mice for this study were in compliance with the relevant animal welfare guidelines approvedby the Johns Hopkins University Animal Care and Use Committee and the Mount Sinai Schoolof Medicine Animal Care and Use Committee. Mice were killed on P0 by inhalation anestheticsand weighed. The carcasses were fixed and heads were perfused in 4% paraformaldehyde. Oursample consists of Fgfr2+/S252W (N = 10) and their wild-type littermates (N = 11), andFgfr2+/P253R (N = 14) and their wild-type littermates (N = 10).
MRM and μ-CT Imaging ProtocolsThe fixed animals were immersed in a 2% Magnevist (Bayer Health Care, Wayne, NJ)phosphor-buffered solution for 10 days to reduce the T1 and T2 relaxation times. The achievedshort T1 (32 ms) and T2 (8 ms) times allowed for fast imaging with a high contrast-to-noiseratio. To prevent the animals from drying out and to minimize magnetic susceptibility artifactsduring scanning the specimens were surrounded by a flourinert liquid FD-43 (3M, St. Paul,MN). All experiments were conducted on a vertical 14.1 Tesla Varian (Varian Inc., Palo Alto,CA) imaging system with direct drive technology. A home-built loop gap resonator with adiameter of 2.0 cm was used to acquire standard three-dimensional spin echo images of thehead of the animal. Images up to an isotropic resolution of 40 μm were acquired. A standardimaging experiment with an isotropic resolution of 80 μm comprised a field of view of 15.4 ×14 × 11 mm3 and a matrix size of 192 × 132 (75% partial Fourier: 176) × 137. With eightaverages and a repetition time of 75 ms (echo time 25 ms) the total scan time was three hours.Matlab (The MathWorks, Inc., Natick, MA) was used for postprocessing. By zero-filling eachdirection by a factor of two the pixel resolution of the standard imaging experiment was 40μm3.
μ-CT images were acquired at the Center for Quantitative Imaging at the Pennsylvania StateUniversity (www.cqi.psu.edu) using the HD-600 OMNI-X high-resolution X-ray computedtomography system (Bio-Imaging Research Inc, Lincolnshire, IL) following alreadyestablished protocols (Parsons et al., 2007; Hill et al., 2007) with pixel size of 0.15–0.02 mmand 0.15–0.025 mm slice thickness.
Landmark Data Collection and AnalysisAnatomical landmarks represent biologically meaningful points that can be repeatedly locatedwith a high degree of accuracy and precision (Richtsmeier et al., 1995). Landmarks areillustrated in Figure 1 and defined in Table 1. Precision of landmark data collection wasevaluated following previously described methods (Aldridge et al., 2007). After checking for
Aldridge et al. Page 8
Dev Dyn. Author manuscript; available in PMC 2010 March 1.
NIH
-PA Author Manuscript
NIH
-PA Author Manuscript
NIH
-PA Author Manuscript

gross errors of landmark placement, data from the two trials were averaged to minimize intra-observer error.
AcknowledgmentsThe authors thank Dr. Tim Ryan at the Center for Quantitative Imaging for his work in obtaining μ-CT images of themice. This manuscript benefited from the thoughtful comments of two anonymous reviewers. Work was supported inpart by funds from the Department of Pathology and Anatomical Sciences at the University of Missouri.
Grant sponsor: NIH: NIDCR; Grant number: R01 DE018500.
ReferencesAldridge K, Marsh J, Govier D, Richtsmeier J. Central nervous system phenotypes in craniosynostosis.
J Anat 2002;201:31–39. [PubMed: 12171474]Aldridge K, Kane A, Marsh J, Panchal J, Boyadijiev S, Yan P, Govier D, Ahmad W, Richtsmeier J. Brain
morphology in nonsyndromic unicoronal craniosynostosis. Anat Rec 2005;285:690–698.Aldridge K, Kane A, Marsh J, Yan P, Govier D, Richtsmeier J. Relationship of brain and skull in pre-
and postoperative sagittal synostosis. J Anat 2006;206:373–385. [PubMed: 15817105]Aldridge K, Reeves R, Olson L, Richtsmeier J. Differential effects of trisomy on brain shape and volume
in related aneuploid mouse models. Am J Med Genet Part A 2007;143A:1060–1070. [PubMed:17431903]
Anderson P, Netherway D, Abbott A, Cox T, Roscioli T, David D. Analysis of intracranial volume inApert syndrome genotypes. Pediatr Neurosurg 2004;40:161–164. [PubMed: 15608488]
Bansal R, Lakhina V, Remedios R, Tole S. Expression of FGF receptors 1, 2, 3 in the embryonic andpostnatal mouse brain compared with Pdgfra, Olig2 and Plp/dm20: implications for oligodendrocytedevelopment. Dev Neurosci 2003;25:83–95. [PubMed: 12966207]
Blank C. Apert’s syndrome (a type of acrocephalosyndactyly)--observations on a British series of thirty-nine cases. Ann Hum Genet Lond 1960;24:151–164.
Chen L, Li D, Li C, Engel A, Deng C. A Ser250Trp substitution in mouse fibroblast growth factor receptor2(Fgfr2) results in craniosynostosis. Bone 2003;33:169–178. [PubMed: 14499350]
Cohen, M. Apert syndrome. In: Cohen, M.; MacLean, R., editors. Craniosynostosis: diagnosis,evaluation, and management. New York: Oxford University Press; 2000. p. 316-353.
Cohen M, Kreiborg S. The central nervous system in the Apert syndrome. Am J Med Genet 1990;35:36–45. [PubMed: 2405668]
Cohen M, Kreiborg S. Agenesis of the corpus callosum. Its associated anomalies and syndromes withspecial reference to the Apert syndrome. Neurosurg Clin N Am 1991;2:565–568. [PubMed: 1821304]
Cohen M, Kreiborg S. An updated pediatric perspective on the Apert syndrome. Am J Dis Child1993;147:989–993. [PubMed: 8362820]
Cohen M, Kreiborg S. Cranial size and configuration in the Apert syndrome. J Craniofac Genet Dev Biol1994;14:153–162. [PubMed: 7852544]
Cohen, M.; MacLean, R., editors. Craniosynostosis: diagnosis, evaluation, and management. New York:Oxford University Press; 2000. p. 454
Cohen M, Kreiborg S, Lammer E, Cordero J, Mastroiacovo P, Erickson J, Roeper P, Martinez-Frias M.Birth prevalence study of the Apert syndrome. Am J Med Genet 1992;42:655–659. [PubMed:1303629]
Darroch J, Mosimann J. Canonical and principal components of shape. Biometrika 1985;72:241–252.de Leon G, de Leon G, Grover W, Zaeri N, Alburger P. Agenesis of the corpus callosum and limbic
malformation in Apert syndrome (type I acrocephalosyndactyly). Arch Neurol 1987;44:979–982.[PubMed: 3619717]
Eswarakumar V, Monsonego-Ornan E, Pines M, Antonopoulou I, Morriss-Kay G, Lonai P. The IIIcalternative of Fgfr2 is a positive regulator of bone formation. Development 2002a;129:3783–3793.[PubMed: 12135917]
Aldridge et al. Page 9
Dev Dyn. Author manuscript; available in PMC 2010 March 1.
NIH
-PA Author Manuscript
NIH
-PA Author Manuscript
NIH
-PA Author Manuscript

Eswarakumar VP, Monsonego-Ornan E, Pines M, Antonopoulou I, Morriss-Kay GM, Lonai P. The IIIcalternative of Fgfr2 is a positive regulator of bone formation. Development 2002b;129:3783–3793.[PubMed: 12135917]
Falsetti A, Jungers W, Cole TR. Morphometrics of the callitrichid fore-limb: a case study in size andshape. Int J Primatol 1993;14:551–572.
Frinchi M, Bonomo A, Trovato-Salinaro A, Condorelli D, Fuxe K, Spampinato M, Mudò G. Fibroblastgrowth factor-2 and its receptor expression in proliferating precursor cells of the sub-ventricular zonein the adult rat brain. Neurosci Lett 2008;447:20–25. [PubMed: 18835325]
Gagan J, Tholpady S, Ogle R. Cellular dynamics and tissue interactions of the dura mater during headdevelopment. Birth Defects Res C Embryo Today 2007;81:297–304. [PubMed: 18228258]
Gault D, Renier D, Marchac D, Jones B. Intracranial pressure and intracranial volume in children withcraniosynostosis. Plast Reconstr Surg 1992;90:377–381. [PubMed: 1513883]
Gosain A, McCarthy J, Glatt P, Staffenberg D, Hoffmann R. A study of intracranial volume in Apertsyndrome. Plast Reconstr Surg 1995;95:284–295. [PubMed: 7824608]
Hill CA, Reeves RH, Richtsmeier JT. Effects of aneuploidy on skull growth in a mouse model of Downsyndrome. J Anat 2007;210:394–405. [PubMed: 17428201]
Hughes S. Differential expression of the fibroblast growth factor receptor (FGFR) multigene family innormal human adult tissues. J Histochem Cytochem 1997;45:1005–1019. [PubMed: 9212826]
Iseki S, Wilkie AO, Morriss-Kay GM. Fgfr1 and Fgfr2 have distinct differentiation- and proliferation-related roles in the developing mouse skull vault. Development 1999;126:5611–5620. [PubMed:10572038]
Lajeunie E, Cameron R, El Ghouzzi V, De Parseval N, Journeau P, Gonzales M, Delezoide A-L,Bonaventure J, LeMerrer M, Renier D. Clinical variability in patients with Apert’s syndrome. JNeurosurg 1999;90:443–447. [PubMed: 10067911]
Lefebvre A, Travis F, Arndt E, Munro I. A psychiatric profile before and after reconstructive surgery inchildren with Apert’s syndrome. Br J Plast Surg 1986;39:510–513. [PubMed: 3779198]
Lele, S.; Richtsmeier, J. An invariant approach to the statistical analysis of shapes. London: Chapmanand Hall/CRC Press; 2001.
Mann H, Whitney D. On a test of whether one of two random variables is stochastically larger than theother. Ann Math Stat 1947;18:50–60.
Maric D, Pla A, Chang Y, Barker J. Self-renewing and differentiating properties of cortical neural stemcells are selectively regulated by basic fibroblast growth factor (FGF) signaling via specific FGFreceptors. J Neurosci 2007;27:1836–1852. [PubMed: 17314281]
Marsh J, Galic M, Vannier M. Surgical correction of the craniofacial dysmorphology of Apert syndrome.Clin Plast Surg 1991;18:251–275. [PubMed: 2065488]
Moss M. Functional cranial analysis and the functional matrix. Int J Orthod 1979;17:21–31. [PubMed:285927]
Moss M. The functional matrix hypothesis revisited. 1. The role of mechanotransduction. Am J OrthodDentofacial Orthop 1997a;12:8–11.
Moss M. The functional matrix hypothesis revisited. 2. The role of an osseous connected cellular network.Am J Orthod Dentofacial Orthop 1997b;112:221–226. [PubMed: 9267235]
Moss M. The functional matrix hypothesis revisited. 3. The genomic thesis. Am J Orthod DentofacialOrthop 1997c;112:338–342. [PubMed: 9294365]
Moss M. The functional matrix hypothesis revisited. 4. The epigenetic antithesis and the resolvingsynthesis. Am J Orthod Dentofacial Orthop 1997d;112:410–417. [PubMed: 9345153]
Moss M, Young R. A functional approach to craniology. Am J Phys Anthropol 1960;18:281–202.[PubMed: 13773136]
Noetzel M, Marsh J, Palkes H, Gado M. Hydrocephalus and mental retardation in craniosynostosis. JPediatr 1985;107:885–892. [PubMed: 4067746]
Opperman L, Sweeney T, Redmon J, Persing J, Ogle R. Tissue interactions with underlying dura materinhibit osseous obliteration of developing cranial sutures. Dev Dyn 1993;198:312–322. [PubMed:8130378]
Aldridge et al. Page 10
Dev Dyn. Author manuscript; available in PMC 2010 March 1.
NIH
-PA Author Manuscript
NIH
-PA Author Manuscript
NIH
-PA Author Manuscript

Opperman L, Passarelli R, Morgan E, Reintjes M, Ogle R. Cranial sutures require tissue interactions withdura mater to resist osseous obliteration in vitro. J Bone Miner Res 1995;10:1978–1987. [PubMed:8619379]
Opperman L, Chhabra A, Nolen A, Bao Y, Ogle R. Dura mater maintains rat cranial sutures in vitro byregulating suture cell proliferation and collagen production. J Craniofac Genet Dev Biol1998;18:150–158. [PubMed: 9785219]
Ornitz DM, Itoh N. Fibroblast growth factors. Genome Biol 2001;2:1–12.Ornitz D, Marie P. FGF signaling pathways in endochondral and intramembranous bone development
and human genetic disease. Genes Dev 2002;16:1445–1465.Parsons T, Ryan T, Reeves R, Richtsmeier J. Microstructure of trabecular bone in a mouse model for
Down syndrome. Anat Rec 2007;290:414–421.Passos-Bueno, M.; Sertie, A.; Jehee, F.; Fanganiello, R.; Yeh, E. Genetics of craniosynostosis: genes,
syndromes, mutations and genotype-phenotype correlations. In: Rice, D., editor. Craniofacial sutures.Development, disease and treatment. Basel: Karger; 2008. p. 107-143.
Patton M, Goodship J, Hayward R, Lansdown R. Intellectual development in Apert’s syndrome: a longterm follow up of 29 patients. J Med Genet 1988;25:164–167. [PubMed: 3351902]
Pooh R, Nakagawa Y, Pooh K, Nakagawa Y, Nagamachi N. Fetal craniofacial structure and intracranialmorphology in a case of Apert syndrome. Ultrasound Obstet Gynecol 1999;13:274–280. [PubMed:10341409]
Posnick J, Armstrong D, Bite U. Crouzon and Apert syndromes: intracranial volume measurements beforeand after cranio-orbital reshaping in childhood. Plast Reconstr Surg 1995;96:539–548. [PubMed:7638278]
Quintero-Rivera F, Robson C, Reiss R, Levine D, Benson C, et al. Intracranial anomalies detected byimaging studies in 30 patients with Apert syndrome. Am J Med Genet 2006;140A:1337–1338.[PubMed: 16691624]
Renier D, Arnaud E, Cinalli G, Sebag G, Zerah M, Marchac D. Prognosis for mental function in Apert’ssyndrome. J Neurosurg 1996;85:66–72. [PubMed: 8683284]
Renier D, Lajeunie E, Arnaud E, Marchac D. Management of craniosynostoses. Childs Nerv Syst2000;16:645–658. [PubMed: 11151714]
Richtsmeier JT, Paik C, Elfert P, Cole T, Dahlman HR. Precision, repeatability and validation of thelocalization of cranial landmarks using computed tomogrphay scans. Cleft Palate Craniofac J1995;32:217–227. [PubMed: 7605789]
Richtsmeier J, Cole Tr, Krovitz G, Valeri C, Lele S. Preoperative morphology and development in sagittalsynostosis. J Craniofac Genet Dev Biol 1998;18:64–78. [PubMed: 9672839]
Richtsmeier J, Aldridge K, DeLeon V, Panchal J, Kane A, Marsh J, Yan P, Cole Tr. Phenotypic integrationof neurocranium and brain. J Exp Zool B Mol Dev Evol 2006;306:360–378. [PubMed: 16526048]
Robb R, Hanson D, Karwoski R, Larson A, Workman E, Stacy M. ANALYZE: a comprehensive,operator-interactive software package for multidimensional medical image display and analysis.Comput Med Imaging Graph 1989;13:433–454. [PubMed: 2688869]
Slaney S, Oldridge M, Hurst J, Morriss-Kay G, Hall C, Poole M, Wilkie A. Differential effects of FGFR2mutations on syndactyly and cleft palate in Apert syndrome. Am J Hum Genet 1996;58:923–932.[PubMed: 8651276]
Tokumaru A, Barkovich A, Ciricillo S, Edwards M. Skull base and calvarial deformities: associationwith intracranial changes in craniofacial syndromes. AJNR Am J Neuroradiol 1996;17:619–630.[PubMed: 8730180]
Tolarova M, Harris J, Ordway D, Vargervik K. Birth prevalence, mutation rate, sex ratio, parents’ age,and ethnicity in Apert syndrome. Am J Med Genet 1997;72:394–398. [PubMed: 9375719]
Wang Y, Xiao R, Yang F, Karim B, Iocovelli A, Cai J, Lerner C, Richtsmeier J, Leszl J, Hill C, Yu K,Ornitz D, Elisseeff J, Huso D, Jabs E. Abnormalities in cartilage and bone development in the Apertsyndrome FGFR2(+/S252W) mouse. Development 2005;132:3537–3548. [PubMed: 15975938]
Wang Y, Sun M, Uhlhorn V, Peter I, Hill C, Percival C, Richtsmeier J, Huso D, Jabs E. Activation ofp38 MAPK pathway in the skull abnormalities of Apert syndrome Fgfr2+/P253R mice. BMC DevBiol. in press.
Aldridge et al. Page 11
Dev Dyn. Author manuscript; available in PMC 2010 March 1.
NIH
-PA Author Manuscript
NIH
-PA Author Manuscript
NIH
-PA Author Manuscript

Wang H, Owens JD, Shih JH, Li MC, Bonner RF, Mushinski JF. Histological staining methodspreparatory to laser capture microdissection significantly affect the integrity of the cellular RNA.BMC Genomics 2006;7:97. [PubMed: 16643667]
Wilke T, Gubbels S, Schwartz J, Richman J. Expression of fibroblast growth factor receptors (FGFR1,FGFR2, FGFR3) in the developing head and face. Dev Dyn 1997;210:41–52. [PubMed: 9286594]
Yacubian-Fernandes A, Palhares A, Giglio A, Gabarra R, Zanini S, et al. Apert syndrome: analysis ofassociated brain malformations and conformational changes determined by surgical treatment. AJNRJ Neuroradiol 2004;31:116–122.
Yacubian-Fernandes A, Palhares A, Giglio A, Gabarra R, Zanini S, et al. Apert syndrome: factorsinvolved in the cognitive development. Arq Neuropsiquiatr 2005;63:963–968. [PubMed: 16400413]
Yin L, Du X, Li C, Xu X, Chen Z, Su N, Zhao L, Qi H, Li F, Xue J, Yang J, Jin M, Deng C, Chen L. APro253Arg mutation in fibroblast growth factor receptor 2 (Fgfr2) causes skeleton malformationmimicking human Apert syndrome by affecting both chondrogenesis and osteogenesis. Bone2008;42:631–643. [PubMed: 18242159]
Aldridge et al. Page 12
Dev Dyn. Author manuscript; available in PMC 2010 March 1.
NIH
-PA Author Manuscript
NIH
-PA Author Manuscript
NIH
-PA Author Manuscript

Fig. 1.Landmarks collected from magnetic resonance microscopy (MRM) images of postnatal day(P) 0 mouse brains illustrated on three-dimensional (3D) reconstructions of the MRM images.A: Dorsal view. B: Lateral view of right side. C: Midsagittal view. D: Axial slice. Landmarkdefinitions are in Table 1.
Aldridge et al. Page 13
Dev Dyn. Author manuscript; available in PMC 2010 March 1.
NIH
-PA Author Manuscript
NIH
-PA Author Manuscript
NIH
-PA Author Manuscript

Fig. 2.Comparisons of brain size as measured by the geometric mean of all possible linear distancesamong Fgfr2+/S252W, Fgfr2+/P253R, and wild-type littermates. Closed triangles,Fgfr2+/S252W; open triangles, Fgfr2+/P253R; circles, wild-type (wt) littermates. Bars = medianvalues.
Aldridge et al. Page 14
Dev Dyn. Author manuscript; available in PMC 2010 March 1.
NIH
-PA Author Manuscript
NIH
-PA Author Manuscript
NIH
-PA Author Manuscript

Fig. 3.Three-dimensional reconstructions of superior surfaces (first column), midsagittal planes(second column), and axial slice images (last column) of magnetic resonance microscopy(MRM) data, illustrating examples of variation in brain phenotypes. Row 1: Wild-type mouse.Row 2: Fgfr2+/S252W mice with slight cerebral asymmetry (above) and severe cerebralasymmetry (below), enlarged fourth ventricle (above, white arrow) and arched corpus callosum(below, white arrow), and unremarkable lateral ventricles. Row 3: Fgfr2+/P253R mice withslight cerebral asymmetry (above) and severe cerebral asymmetry (below), enlarged fourthventricle and arched corpus callosum (white arrows) and enlarged lateral ventricles (whitearrows).
Aldridge et al. Page 15
Dev Dyn. Author manuscript; available in PMC 2010 March 1.
NIH
-PA Author Manuscript
NIH
-PA Author Manuscript
NIH
-PA Author Manuscript

Fig. 4.Results of PCOORD analyses of landmark coordinate data collected from brain structures,including Fgfr2+/S252W, Fgfr2+/P253R, and wild-type littermate mice. A: Eigenscores plottedfor the first three principal axes and the percent of variation accounted for by each axis. Closedtriangles, Fgfr2+/S252W mice; open triangles, Fgfr2+/P253R mice; circles, respective wild-typelittermates. B: Linear distances strongly positively correlated with Axis 1. C: Linear distancesstrongly correlated with Axis 2. Black lines, strong positive correlations; white lines, strongnegative correlations. Black dots, landmarks located in plane of view; white dots, landmarksdeep to the plane of view.
Aldridge et al. Page 16
Dev Dyn. Author manuscript; available in PMC 2010 March 1.
NIH
-PA Author Manuscript
NIH
-PA Author Manuscript
NIH
-PA Author Manuscript
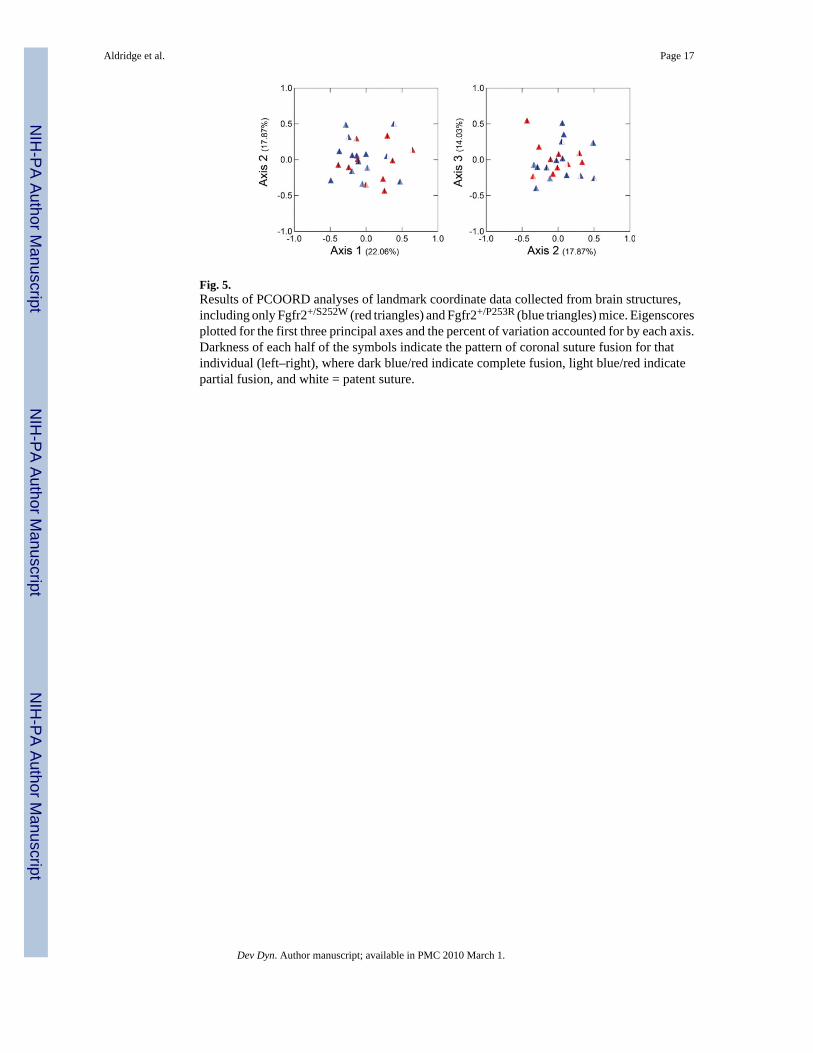
Fig. 5.Results of PCOORD analyses of landmark coordinate data collected from brain structures,including only Fgfr2+/S252W (red triangles) and Fgfr2+/P253R (blue triangles) mice. Eigenscoresplotted for the first three principal axes and the percent of variation accounted for by each axis.Darkness of each half of the symbols indicate the pattern of coronal suture fusion for thatindividual (left–right), where dark blue/red indicate complete fusion, light blue/red indicatepartial fusion, and white = patent suture.
Aldridge et al. Page 17
Dev Dyn. Author manuscript; available in PMC 2010 March 1.
NIH
-PA Author Manuscript
NIH
-PA Author Manuscript
NIH
-PA Author Manuscript

Fig. 6.A,B: Example MRIs of a child with AS (A) and a typically developing child (B). Cerebralasymmetry is observed in the axial plane of A (left image) as compared to B. The frequentlyobserved arched corpus callosum is observed in the sagittal plan of A (right image). Comparewith arched corpus callosum in Fgfr2+/S252W and Fgfr2+/P253R mice illustrated in Figure 3.
Aldridge et al. Page 18
Dev Dyn. Author manuscript; available in PMC 2010 March 1.
NIH
-PA Author Manuscript
NIH
-PA Author Manuscript
NIH
-PA Author Manuscript

NIH
-PA Author Manuscript
NIH
-PA Author Manuscript
NIH
-PA Author Manuscript
Aldridge et al. Page 19
TABLE 1
Anatomical Definitions of 15 Three-Dimensional Brain Landmarks Collected From MRM Images of Mice atP0a
Cerebrum (C)
Midline (M) Cerebellum (Cb)
Landmark (left, right) Anatomical definition Bilateral (B) Brainstem (Br)
1,2 Most superolateral point of intersection ofolfactory bulb with anterior frontal lobe surface
B C
3,4 Most caudolateral point on occipital lobe surface B C
5 Most caudal point on cerebellar surface M Cb
6,7 Most lateral point on cerebellar surface B Cb
8,9 Centroid of head of caudate nucleus B C
10,11 Origin of middle cerebral artery from Circle ofWillis on ventral cerebral surface
B C
12 Genu of corpus callosum M C
13 Anterior commissure M C
14 Splenium of corpus callosum M C
15 Intersection of pons with most caudal aspect of theventral cerebral surface
M Br
aLandmarks are illustrated in Figure 1.
Dev Dyn. Author manuscript; available in PMC 2010 March 1.

NIH
-PA Author Manuscript
NIH
-PA Author Manuscript
NIH
-PA Author Manuscript
Aldridge et al. Page 20
TABLE 2
Sample Sizes and Results of Mann-Whitney U Tests Comparing Brain Size Among Fgfr2+/S252W,Fgfr2+/P253R, and Wild-Type Littermates
Brain size (Mean % difference, P value)
Fgfr2+/S252W (N=8) vs. WT (N=11) 101.8% P = 0.041
Fgfr2+/P253R (N=14) vs. WT (N=8) 100.00% P = 0.953
Fgfr2+/S252W vs. Fgfr2+/P253R 101.1% P = 0.160
Dev Dyn. Author manuscript; available in PMC 2010 March 1.

NIH
-PA Author Manuscript
NIH
-PA Author Manuscript
NIH
-PA Author Manuscript
Aldridge et al. Page 21
TAB
LE 3
Cor
onal
Sut
ure
Pate
ncy
and
Bra
in P
heno
type
s in
Ape
rt Sy
ndro
me
Fgfr
2+/S2
52W
and
Fgf
r2+/
P253
R M
ice,
and
Wild
-Typ
e Li
tterm
ate
Mic
e at
P0a
Mou
se ID
Rig
ht c
oron
al su
ture
Lef
t cor
onal
sutu
reD
egre
e of
ove
rall
asym
met
ryC
orpu
s cal
losu
m sh
ape
Lat
eral
ven
tric
le e
nlar
gem
ent
Four
th v
entr
icle
enl
arge
men
t
Fgfr
2+/S2
52W
N=1
0
AF
FM
ildN
orm
alN
orm
alL
arge
BF
PN
one
Nor
mal
Nor
mal
Nor
mal
CF
FSe
vere
Nor
mal
Nor
mal
Nor
mal
DF
FSe
vere
Arc
hed
Nor
mal
Nor
mal
EF
OSe
vere
Nor
mal
Nor
mal
Nor
mal
FF
FSe
vere
Nor
mal
Nor
mal
Nor
mal
GP
FN
one
Nor
mal
Nor
mal
Nor
mal
HF
FN
one
Arc
hed
Nor
mal
Nor
mal
IF
FN
one
Nor
mal
Nor
mal
Nor
mal
JF
FN
one
Nor
mal
Nor
mal
Lar
ge
Fgfr
2+/P2
53R N
=14
aP
FSe
vere
Nor
mal
Lar
geN
orm
al
bP
PM
ildN
orm
alN
orm
alN
orm
al
cF
PN
one
Nor
mal
Nor
mal
Nor
mal
dO
FN
one
Nor
mal
Nor
mal
Nor
mal
eF
ON
one
Nor
mal
Nor
mal
Lar
ge
fF
FN
one
Arc
hed
Nor
mal
Nor
mal
gF
FN
one
Arc
hed
Nor
mal
Lar
ge
hP
FN
one
Nor
mal
Nor
mal
Nor
mal
iF
FN
one
Nor
mal
Nor
mal
Nor
mal
jF
FN
one
Arc
hed
Nor
mal
Nor
mal
kF
FN
one
Nor
mal
Nor
mal
Nor
mal
lF
FN
one
Nor
mal
Nor
mal
Nor
mal
mP
PN
one
Nor
mal
Nor
mal
Nor
mal
nO
FN
one
Nor
mal
Nor
mal
Nor
mal
a O in
dica
tes l
ess t
han
25%
of t
he le
ngth
of t
he su
ture
is fu
sed;
P, g
reat
er th
an 2
5% b
ut le
ss th
an 7
5% o
f the
leng
th o
f the
sutu
re is
fuse
d;
Dev Dyn. Author manuscript; available in PMC 2010 March 1.

NIH
-PA Author Manuscript
NIH
-PA Author Manuscript
NIH
-PA Author Manuscript
Aldridge et al. Page 22F,
mor
e th
an 7
5% o
f the
leng
th o
f the
sutu
re is
fuse
d. E
xam
ple
phen
otyp
es a
re il
lust
rate
d in
Fig
ure
3.
Dev Dyn. Author manuscript; available in PMC 2010 March 1.
Related Documents