BRAIN INJURY REHABILITATION DIRECTORATE NSW BRAIN INJURY REHABILITATION PROGRAM 2011 and 2012 Annual Reports ACI Brain Injury Rehabilitation Directorate Level 2 Ingham Institute, 1 Campbell Street, Liverpool NSW 2170 Phone (02) 8738 9263 • Fax (02) 9602 7187

Welcome message from author
This document is posted to help you gain knowledge. Please leave a comment to let me know what you think about it! Share it to your friends and learn new things together.
Transcript
BRAIN INJURY REHABILITATION DIRECTORATE
NSW BRAIN INJURY REHABILITATION PROGRAM
2011 and 2012 Annual Reports
ACI Brain Injury Rehabilitation Directorate Level 2 Ingham Institute, 1 Campbell Street, Liverpool NSW 2170
Phone (02) 8738 9263 • Fax (02) 9602 7187
B I R D – A N N U A L R E P O R T 2 0 1 1 A N D 2 0 1 2
Background
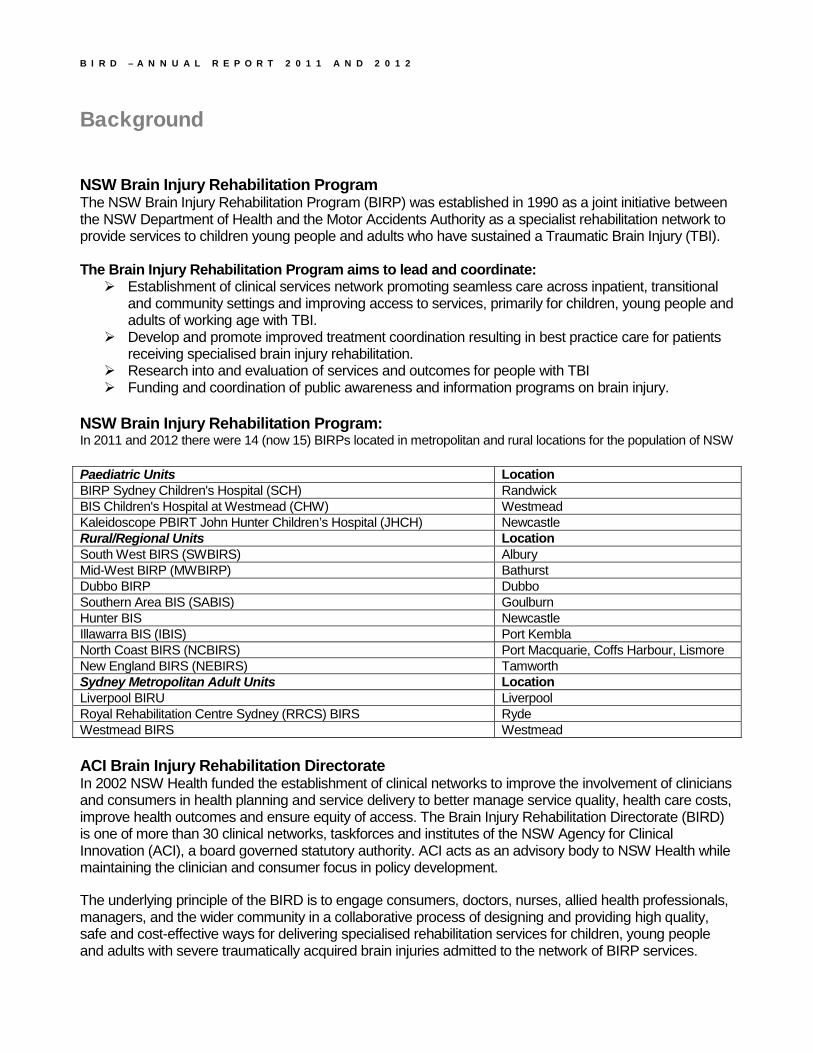
NSW Brain Injury Rehabilitation Program The NSW Brain Injury Rehabilitation Program (BIRP) was established in 1990 as a joint initiative between the NSW Department of Health and the Motor Accidents Authority as a specialist rehabilitation network to provide services to children young people and adults who have sustained a Traumatic Brain Injury (TBI). The Brain Injury Rehabilitation Program aims to lead and coordinate: Establishment of clinical services network promoting seamless care across inpatient, transitional
and community settings and improving access to services, primarily for children, young people and adults of working age with TBI.
Develop and promote improved treatment coordination resulting in best practice care for patients receiving specialised brain injury rehabilitation.
Research into and evaluation of services and outcomes for people with TBI Funding and coordination of public awareness and information programs on brain injury.
NSW Brain Injury Rehabilitation Program: In 2011 and 2012 there were 14 (now 15) BIRPs located in metropolitan and rural locations for the population of NSW Paediatric Units Location BIRP Sydney Children's Hospital (SCH) Randwick BIS Children's Hospital at Westmead (CHW) Westmead Kaleidoscope PBIRT John Hunter Children’s Hospital (JHCH) Newcastle Rural/Regional Units Location South West BIRS (SWBIRS) Albury Mid-West BIRP (MWBIRP) Bathurst Dubbo BIRP Dubbo Southern Area BIS (SABIS) Goulburn Hunter BIS Newcastle Illawarra BIS (IBIS) Port Kembla North Coast BIRS (NCBIRS) Port Macquarie, Coffs Harbour, Lismore New England BIRS (NEBIRS) Tamworth Sydney Metropolitan Adult Units Location Liverpool BIRU Liverpool Royal Rehabilitation Centre Sydney (RRCS) BIRS Ryde Westmead BIRS Westmead ACI Brain Injury Rehabilitation Directorate In 2002 NSW Health funded the establishment of clinical networks to improve the involvement of clinicians and consumers in health planning and service delivery to better manage service quality, health care costs, improve health outcomes and ensure equity of access. The Brain Injury Rehabilitation Directorate (BIRD) is one of more than 30 clinical networks, taskforces and institutes of the NSW Agency for Clinical Innovation (ACI), a board governed statutory authority. ACI acts as an advisory body to NSW Health while maintaining the clinician and consumer focus in policy development.
The underlying principle of the BIRD is to engage consumers, doctors, nurses, allied health professionals, managers, and the wider community in a collaborative process of designing and providing high quality, safe and cost-effective ways for delivering specialised rehabilitation services for children, young people and adults with severe traumatically acquired brain injuries admitted to the network of BIRP services.
B I R D – A N N U A L R E P O R T 2 0 1 1 A N D 2 0 1 2
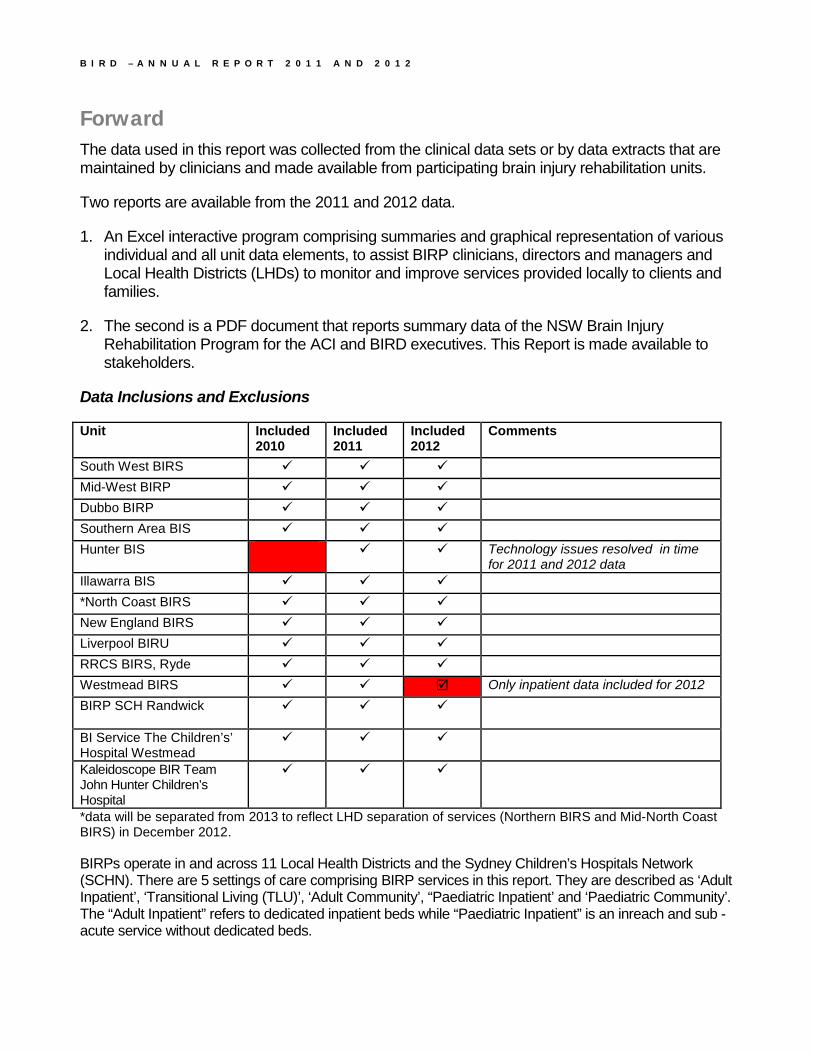
Forward The data used in this report was collected from the clinical data sets or by data extracts that are maintained by clinicians and made available from participating brain injury rehabilitation units.
Two reports are available from the 2011 and 2012 data.
1. An Excel interactive program comprising summaries and graphical representation of various individual and all unit data elements, to assist BIRP clinicians, directors and managers and Local Health Districts (LHDs) to monitor and improve services provided locally to clients and families.
2. The second is a PDF document that reports summary data of the NSW Brain Injury Rehabilitation Program for the ACI and BIRD executives. This Report is made available to stakeholders.
Data Inclusions and Exclusions
Unit Included 2010
Included 2011
Included 2012
Comments
South West BIRS Mid-West BIRP Dubbo BIRP Southern Area BIS Hunter BIS Technology issues resolved in time
for 2011 and 2012 data Illawarra BIS *North Coast BIRS New England BIRS Liverpool BIRU RRCS BIRS, Ryde Westmead BIRS Only inpatient data included for 2012 BIRP SCH Randwick
BI Service The Children’s’ Hospital Westmead
Kaleidoscope BIR Team John Hunter Children’s Hospital
*data will be separated from 2013 to reflect LHD separation of services (Northern BIRS and Mid-North Coast BIRS) in December 2012. BIRPs operate in and across 11 Local Health Districts and the Sydney Children’s Hospitals Network (SCHN). There are 5 settings of care comprising BIRP services in this report. They are described as ‘Adult Inpatient’, ‘Transitional Living (TLU)’, ‘Adult Community’, “Paediatric Inpatient’ and ‘Paediatric Community’. The “Adult Inpatient” refers to dedicated inpatient beds while “Paediatric Inpatient” is an inreach and sub -acute service without dedicated beds.

B I R D – A N N U A L R E P O R T 2 0 1 1 A N D 2 0 1 2
Table of ContentsBACKGROUND ..................................................................................................................................................................................... 2
FORWARD .............................................................................................................................................................................................. 3
TABLE OF CONTENTS ....................................................................................................................................................................... 4 EXECUTIVE SUMMARY ................................................................................................................................................................... 6
Section 1: Client Demographics ............................................................................................................................................... 6 Section 2: Injury ........................................................................................................................................................................ 6 Section 3: Referrals ................................................................................................................................................................... 6 Section 4: Financial Status ....................................................................................................................................................... 7 Section 5: Admissions ............................................................................................................................................................... 7 Section 6: Episode of Care (EOC) - Length............................................................................................................................. 7 Section 7: Discharges ............................................................................................................................................................... 8 Section 8: NSW Brain Injury Rehabilitation Program (BIRP) Total Clients ......................................................................... 8 Section 9: Inpatient Outcomes .................................................................................................................................................. 8
SECTION 1 - CLIENT DEMOGRAPHICS ...................................................................................................................................... 9 Chart 1.1 - Individual Clients Intake Trend .................................................................................................................................... 9 Chart 1.2 - Individual Client Intake by Sex & Indigenous Status ................................................................................................ 10 Chart 1.3 – Individual Client Intake by Age at Date of Injury .................................................................................................... 11
SECTION 2 – INJURY ........................................................................................................................................................................ 12 Chart 2.1.A – Individual Client Intake by Injury Year ................................................................................................................. 12 Chart 2.1.B – Individual Client Intake by Injury Type ................................................................................................................. 13 Chart 2.2 – Individual Client Intake by Injury Cause .................................................................................................................. 14 Chart 2.3 – Individual Client Intake by Injury Cause and Age ................................................................................................... 15 Chart 2.4 – Injury Cause for Children < = 16 Years .................................................................................................................. 16 Chart 2.5 – Individual Client Intake by Length of PTA ............................................................................................................... 17 Chart 2.6 – Individual Client Intake by TBI Injury Cause and Severity by PTA ........................................................................ 18
SECTION 3 - REFERRALS ............................................................................................................................................................... 19 Chart 3.1 – Individual Client Intake by Source of Referral ......................................................................................................... 19 Chart 3.2 – Referrals (Other Sources) .......................................................................................................................................... 20 Chart 3.3.A – Referrals from NSW Adult Major Trauma Hospitals ........................................................................................... 21 Chart 3.3.B – Referrals from NSW Paediatric Major Trauma Hospitals ................................................................................... 22 Chart 3.4.A – Referrals by First Setting of Care: Adult Inpatient ............................................................................................... 23 Chart 3.4.B – Referrals by First Setting of Care: TLU ................................................................................................................ 24 Chart 3.4.C – Referrals by First Setting of Care: Adult Community ......................................................................................... 25 Chart 3.4.D – Referrals by First Setting of Care: Paediatric Inpatient ...................................................................................... 26 Chart 3.4.E – Referrals by First Setting of Care: Paediatric Community .................................................................................. 27
SECTION 4 - FINANCIAL STATUS................................................................................................................................................ 28 Chart 4.1.A – Individual Client Intake by Financial Status ......................................................................................................... 28 Chart 4.1.B – Individual Client Intake by Injury Severity and Financial Status (I) ................................................................... 29 Chart 4.2.A – Individual Client Intake by Injury Cause and Financial Status ........................................................................... 30 Chart 4.2.B – Individual Client Intake by Injury Severity and Financial Status (II) .................................................................. 31 Chart 4.2.C –Financial Status by Injury Severity for MVA- Related Injuries ............................................................................ 32 Chart 4.2.D –Financial Status by Injury Severity for Non- MVA- Related Injuries ................................................................... 33
SECTION 5 - ADMISSIONS .............................................................................................................................................................. 34 Chart 5.1 – Admissions by Admission Type.................................................................................................................................. 34 Chart 5.2 – Admissions by Type and Setting of Care ................................................................................................................... 35 Chart 5.3.A – Time Elapsed between Injury and EOC Start for Adult Inpatient (New Admissions only) ................................ 36 Chart 5.3.B – Time Elapsed between Injury and EOC Start for TLU (New Admissions only).................................................. 37 Chart 5.3.C – Time Elapsed since Injury to EOC Start - Adult Community (New Admissions only) ....................................... 38 Chart 5.3.D – Time Elapsed between Injury and EOC Start for Paediatric Inpatient (New Admissions only) ....................... 39
B I R D – A N N U A L R E P O R T 2 0 1 1 A N D 2 0 1 2
Chart 5.3.E – Time Elapsed between Injury and EOC Start for Paediatric Community (New Admissions only) .................... 40
SECTION 6 EPISODE OF CARE - LENGTH ............................................................................................................................... 41 Chart 6.1.A – EOC Length: Adult Inpatient ................................................................................................................................ 41 Chart 6.1.B – EOC Length: TLU ................................................................................................................................................. 42 Chart 6.1.C - EOC Length: Adult Community ............................................................................................................................ 43 Chart 6.1.D - EOC Length: Paediatric inpatient ........................................................................................................................ 44 Chart 6.1.E - EOC Length: Paediatric community ..................................................................................................................... 45
SECTION 7 - DISCHARGES ............................................................................................................................................................. 46 Chart 7.1 – Discharges – All Settings of Care ............................................................................................................................. 46 Chart 7.2 – Discharges by Setting of Care ................................................................................................................................... 47 Chart 7.3.A – Discharge Accommodation: Inpatient (2011)...................................................................................................... 48 Chart 7.3.B – Discharge Accommodation: TLU (2011) .............................................................................................................. 49 Chart 7.3.C – Discharge Accommodation: Community (2011) .................................................................................................. 49 Chart 7.4.A – Discharge Accommodation: Adult Inpatient (2012) ............................................................................................. 50 Chart 7.4.B – Discharge Accommodation: TLU (2012) .............................................................................................................. 51 Chart 7.4.C – Discharge Accommodation: Community (2012) .................................................................................................. 52
SECTION 8 – NSW BIRP TOTAL CLIENTS ................................................................................................................................ 53 Chart 8 – Total Clients of BIRP Services ..................................................................................................................................... 53
SECTION 9 – INPATIENT OUTCOMES ....................................................................................................................................... 54 Chart 9.1.A – Summary of FIM Scores ......................................................................................................................................... 54 Chart 9.1.B – Mean FIM Scores ................................................................................................................................................... 54 Chart 9.2.A – Scatter Plot of Total FIM Scores (2011) ............................................................................................................... 55 Chart 9.2.B – Scatter Plot of Total FIM Scores (2012) ............................................................................................................... 56 Chart 9.3.A – Improvement of Cognitive Skills (2011) ................................................................................................................ 57 Chart 9.3.B – Improvement of Motor Skills (2011) ...................................................................................................................... 58 Chart 9.4.A – Improvement of Cognitive Skills (2012) ................................................................................................................ 59 Chart 9.4.B – Improvement of Motor Skills (2012) ...................................................................................................................... 60 Chart 9.5.A – Achieved Maximum FIM Scores ............................................................................................................................ 61 Chart 9.5.B – Inpatient Rehab Efficiency ..................................................................................................................................... 61
ABBREVIATIONS ............................................................................................................................................................................... 62
NSW TRAUMA HOSPITALS ........................................................................................................................................................... 62
B I R D – A N N U A L R E P O R T 2 0 1 1 A N D 2 0 1 2
Page 6
Executive Summary This report presents NSW Brain Injury Rehabilitation Program (BIRP) minimum data aggregated for 2011 and 2012 calendar years. Where possible, trend analysis with 2006-2010 years is provided and data inconsistencies are highlighted in the relevant sections of the report. The report is provided in 9 sections and the key findings are highlighted below. Section 1: Client Demographics 1,057 people were admitted to 14 BIRP units in 2011 and 1,109 people to 13 BIRP units in 2012. Over the years (2006-2012), the ratio of male to female admissions (around 70% to 30%) and the pattern for age based admissions remain consistent. Section 2: Injury The 2011 and 2012 client intake data finds that about 65% of the intake sustained an injury in the same year as the admission. The data also confirms the following trends of BIRP clients, which have been consistent since 2006.
• Trend for injury cause – motor vehicle related injuries, falls and assaults account for over 60% of the total client intake.
• Trend for injury age – almost 70% of the total intake are under 34years of age at the time of injury • Trend for injury cause for different age groups - motor vehicle accidents remain as the number one
injury cause for the 17-54 group. • The ratio of TBI to Non-TBI clients is about 80% to 20%.
For the first time this report presents injury cause distribution for children under 5 years old. Falls are the most common injury cause for children under 5 (over 30%). This is in contrast to children aged 5-16, where the most common causes of injury are motor vehicle and sport related.
Consistent with the previous years, the 2011 and 2012 data analysis also supports the findings of existing literature that the most severe injuries (severity = more than 28 days post traumatic amnesia (PTA)) tends to be associated with motor vehicle related trauma rather than other causes. Section 3: Referrals Among the referral sources listed below, the two largest referral sources for client intake to BIRP services remain the same, ‘NSW Trauma Hospitals’ and ‘Other Sources’ (over 50% and around 30%, respectively). Over the years, the ratio of NSW major to regional trauma hospital referrals also appears consistent. The referrals from NSW adult and paediatric major hospitals make up about 80% of all referrals from NSW trauma hospitals. Within ‘Other Sources’, the two largest referral sources are an external specialist/ practitioner (GP) and family/self (over 40% and about 30%, respectively for both 2011 and 2012). The breakdown of inpatient referral sources of client intake by setting of care (the first setting of care of individual clients) shows that over 90% of paediatric inpatient and over 80% of adult inpatient referral derives from NSW trauma hospitals.

B I R D – A N N U A L R E P O R T 2 0 1 1 A N D 2 0 1 2
Page 7
Section 4: Financial Status Financial status (‘compensable’, ‘non-compensable’ and ‘unknown’) is not directly related to claim type in the data collection system. Over the last 3 years, the proportion of ‘Unknown’ financial status has been consistent (about 20% of the intake) and includes those whose claim status has not yet been determined. With available compensation status information, the analysis shows that the majority (more than 80%) of compensable injuries were motor vehicle related (MVA). In addition, the data finds that for the motor vehicle related severe traumatic injuries (PTA duration > 7 days), the majority (around 60%) were compensable, contrary to the severe traumatic injuries from other causes (PTA duration > 7 days), with only around 15% of which were compensable. This trend has been consistent over the three years. Section 5: Admissions The admission data provided in this report is described for each setting of care – ‘Adult Inpatient’, ‘Transitional living (TLU)’, ‘Adult Community’, “Paediatric Inpatient’ and ‘Paediatric Community’. Therefore, some clients are counted more than once as clients typically move through different settings of care during their rehabilitation program (length of service). “Adult Inpatient” is dedicated inpatient beds while “Paediatric Inpatient” is an inreach service to acute beds. In 2011, 14 BIRP units admitted a total of 1,126 clients to 1,410 episodes of care. In 2012, 13 BIRP units admitted a total of 1,168 clients to 1,438 episodes of care. For the admission type, the overall ratio of 80 to 20 for new admissions to readmissions has been consistent over the three years. The trend for injury time to admission has been also consistent over the years. Nearly 90% of new clients admitted to the adult inpatient setting were seen within 3 months of injury and more than 60% of new clients admitted to the adult community setting within 6 months of injury. The 2011 and 2012 paediatric data shows that nearly 90% of children admitted to the paediatric inpatient setting were seen within one month of injury and more than 60% of children admitted to the paediatric community setting within 3 months of injury. There is still some degree of inconsistency across the 14 BIRP units in the definition for admission type (‘new admission’ versus ‘readmission’) but BIRD aims to improve consistency for future reports. Section 6: Episode of Care (EOC) - Length The individual EOC data analysis for three years (2010-2012) finds shorter episodes of care for the adult inpatient and TLU admissions, typically <3 months, with more varied length of episodes of care in the adult community setting. The 2011 and 2012 paediatric data analysis finds even shorter episodes of care for the paediatric inpatient admission, typically < 1 month and longer episodes of care for the paediatric community admissions, typically > 12 months. In the current data collection system for BIRD reporting, it is very hard or extremely difficult to capture clinical pathways of individual clients. The system is good for reporting activities in terms of activity within each setting of care during a particular period of time, but not how clients progress through the range of BIRP services.
B I R D – A N N U A L R E P O R T 2 0 1 1 A N D 2 0 1 2
Page 8
In order to reflect the client journey through BIRP services, the future database revision and data collection system/methodology will aim to make data more client than setting of care focused. Section 7: Discharges The discharge data provided here is for discharges from each setting of care. As is the case with admission data by setting of care, some clients are counted more than once as clients typically move through different settings of care within the same rehabilitation program (length of service). In 2011, 14 BIRP units discharged a total of 1,130 clients from 1,251 episodes of care. In 2012, a total of 1,085 clients from 1,193 episodes of care were discharged from all settings of care for 13 BIRP units and from only the adult inpatient program of the other unit. Data concerning pre-admission and post-discharge accommodation type was analysed for the first time for clients discharged in 2011 and 2012. However, the findings are affected by a large proportion of missing data. However, available data shows that private residence is the predominate type of discharge accommodation and differences exist between pre and post accommodation types. BIRD will seek to reduce the rate of missing data for future reports. Section 8: NSW Brain Injury Rehabilitation Program (BIRP) Total Clients This report presents for the first time the total count of NSW BIRP clients including clients who were neither admitted to nor discharged from an episode of care in the respective calendar year. In 2011, 14 BIRP units had a total of 3,266 clients including 1,657 clients who were neither admitted to nor discharged from an episode of care in 2011. In 2012, 13 BIRP units had a total of 3,322 clients including 1,759 clients who were neither admitted to nor discharged from an episode of care in 2012. For future reports BIRD will seek to identify available data that can provide useful information about the broader BIRP caseload. Section 9: Inpatient Outcomes This report presents for the first time adult inpatient outcomes for 2011 and 2012 in terms of admission and discharge scores using the standardised Functional Independence Measure (FIM) and providing 126 episodes of care for 2011 and 153 episodes of care for 2012. The FIM assesses and scores function in areas (domains) of physical (motor) and cognitive function. The pattern of admission and discharge FIMs across the 2 years is similar. Adult clients admitted to the BIRP inpatient setting of care generally improve in their cognitive and motor domain scores during their rehabilitation between admission and discharge. People with the longest length of stay (LOS) generally arrive with the lowest total FIM scores. People arriving with mid-range or higher total FIM scores tend to have shorter LOS. Some people who arrive with the lowest possible total FIM scores achieve a substantial change during their rehabilitation although they tend to stay the longest. Overall, a large proportion of people makes very significant motor improvements and often approach or achieve the maximum FIM motor score of 91 at discharge. However, only a small number of patients achieve maximum cognitive scores at discharge, reflecting the greater impact that TBI often has on cognitive function. There is also a trend of improved outcomes for patients with shorter lengths of stay, which likely reflects less severe injury.
Page 9
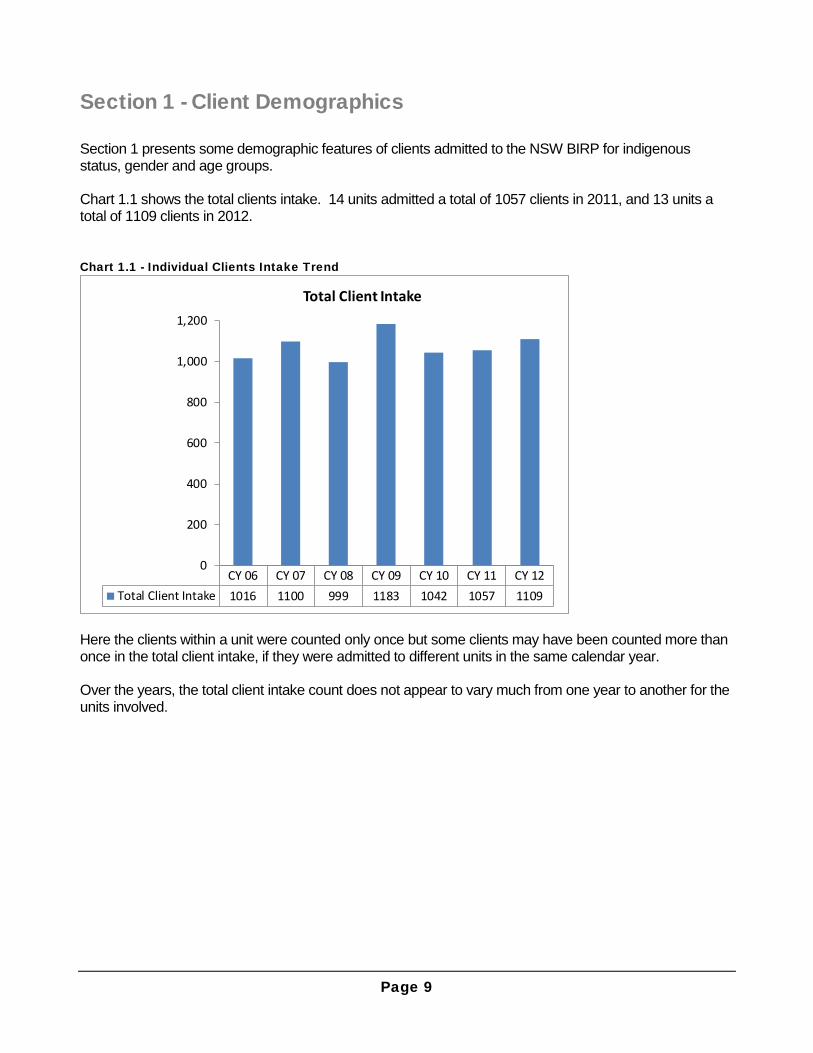
Section 1 - Client Demographics Section 1 presents some demographic features of clients admitted to the NSW BIRP for indigenous status, gender and age groups. Chart 1.1 shows the total clients intake. 14 units admitted a total of 1057 clients in 2011, and 13 units a total of 1109 clients in 2012. Chart 1.1 - Individual Clients Intake Trend
Here the clients within a unit were counted only once but some clients may have been counted more than once in the total client intake, if they were admitted to different units in the same calendar year. Over the years, the total client intake count does not appear to vary much from one year to another for the units involved.
CY 06 CY 07 CY 08 CY 09 CY 10 CY 11 CY 12Total Client Intake 1016 1100 999 1183 1042 1057 1109
0
200
400
600
800
1,000
1,200
Total Client Intake
C L I E N T D E M O G R A P H I C S
Page 10
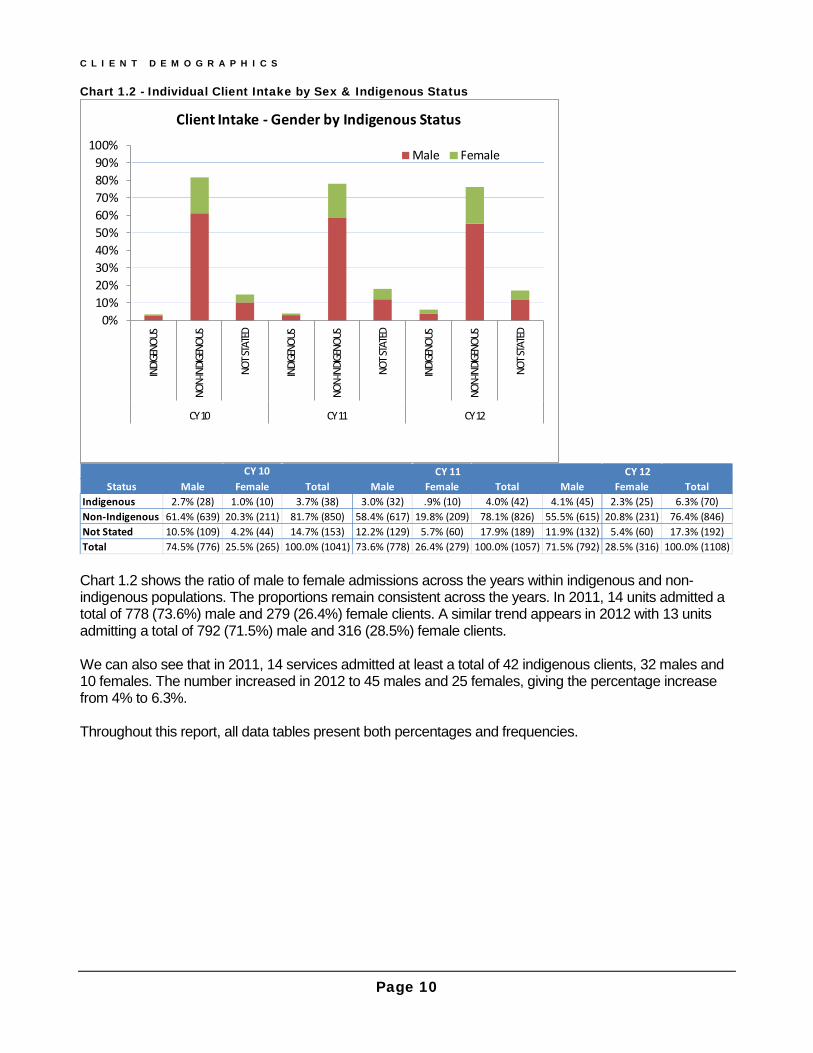
Chart 1.2 - Individual Client Intake by Sex & Indigenous Status
Chart 1.2 shows the ratio of male to female admissions across the years within indigenous and non-indigenous populations. The proportions remain consistent across the years. In 2011, 14 units admitted a total of 778 (73.6%) male and 279 (26.4%) female clients. A similar trend appears in 2012 with 13 units admitting a total of 792 (71.5%) male and 316 (28.5%) female clients. We can also see that in 2011, 14 services admitted at least a total of 42 indigenous clients, 32 males and 10 females. The number increased in 2012 to 45 males and 25 females, giving the percentage increase from 4% to 6.3%. Throughout this report, all data tables present both percentages and frequencies.
0%10%20%30%40%50%60%70%80%90%
100%IN
DIGEN
OUS
NON-
INDIG
ENOU
S
NOT S
TATE
D
INDIG
ENOU
S
NON-
INDIG
ENOU
S
NOT S
TATE
D
INDIG
ENOU
S
NON-
INDIG
ENOU
S
NOT S
TATE
D
CY 10 CY 11 CY 12
Client Intake - Gender by Indigenous Status
Male Female
Status Male Female Total Male Female Total Male Female TotalIndigenous 2.7% (28) 1.0% (10) 3.7% (38) 3.0% (32) .9% (10) 4.0% (42) 4.1% (45) 2.3% (25) 6.3% (70)Non-Indigenous 61.4% (639) 20.3% (211) 81.7% (850) 58.4% (617) 19.8% (209) 78.1% (826) 55.5% (615) 20.8% (231) 76.4% (846)Not Stated 10.5% (109) 4.2% (44) 14.7% (153) 12.2% (129) 5.7% (60) 17.9% (189) 11.9% (132) 5.4% (60) 17.3% (192)Total 74.5% (776) 25.5% (265) 100.0% (1041) 73.6% (778) 26.4% (279) 100.0% (1057) 71.5% (792) 28.5% (316) 100.0% (1108)
CY 10 CY 11 CY 12

C L I E N T D E M O G R A P H I C S
Page 11
Chart 1.3 – Individual Client Intake by Age at Date of Injury
For the clients admitted to the BIRP services, the two particular age groups remain consistently dominant over the years.
• In 2011, over 43% (463) of clients admitted to 14 units sustained the brain injury when aged between 5 and 24 years of age.
• A similar pattern continued in 2012 with 13 units admitting 486 (43.8%) clients who were injured
when aged between 5 and 24 years of age. A very small number of clients over 65 (12 in 2011 and 11 in 2012) reflects the general admission criterion for people under 65 years old.
0.00%
5.00%
10.00%
15.00%
20.00%
25.00%
30.00%
CY 10 CY 11 CY 12
Client Intake - Injury Age
<5 5-14 15-24 25-34 35-44 45-54 55-64 65+ NOT STATED
Age Group CY 10 CY 11 CY 12<5 10.9% (114) 12.1% (128) 11.7% (130)5-14 17.3% (180) 20.4% (216) 21.1% (234)15-24 24.3% (253) 23.4% (247) 22.7% (252)25-34 12.5% (130) 12.7% (134) 13.0% (144)35-44 14.3% (149) 11.7% (124) 10.8% (120)45-54 11.2% (117) 11.4% (121) 11.8% (131)55-64 7.4% (77) 6.8% (72) 6.9% (76)65+ .7% (7) 1.1% (12) 1.0% (11)Not Stated 1.4% (15) .3% (3) 1.0% (11)Total 100% (1042) 100% (1057) 100% (1109)

Page 12
Section 2 – Injury Section 2 presents injury characteristics of clients admitted to the units involved – injury year, injury type, injury cause, traumatic injury severity measured in duration of post traumatic amnesia (PTA) and correlation between injury age and injury cause.
It also attempts to discover any correlation between injury severity and motor vehicle related injuries. Chart 2.1.A – Individual Client Intake by Injury Year
Chart 2.1.A shows that the majority clients had their injury in the same year as their admission to the NSW BIRP (64% in 2011 and 66% in 2012).
About 21% (222) of client intake in 2011 had the injury prior to 2010 and a similar proportion of client intake in 2012 (19.7 %) sustained the injury prior to 2011. This is noteworthy in relation to the analysis of injury cause trend presented in this section.
0%10%20%30%40%50%60%70%80%90%
100%
CY 11 CY 12
Client Intake - Injury Year
Up to 1990 1991 - 2000 2001-8 CY 09
CY 10 CY 11 CY 12 Not Stated
Injury Year CY 11 CY 12Up to 1990 1.3% (14) 2.1% (23)1991 - 2000 5.1% (54) 3.3% (37)2001-2008 10.2% (108) 8.7% (97)CY 09 4.4% (46) 2.1% (23)CY 10 14.6% (154) 3.5% (39)CY 11 64.1% (678) 13.5% (150)CY 12 .0% (0) 65.7% (729)Not Stated .3% (3) 1.0% (11)Total 100% (1057) 100% (1109)

I N J U R Y
Page 13
Chart 2.1.B – Individual Client Intake by Injury Type
Chart 2.1.B shows that in 2011, 14 BIRP units admitted to the service a total of 889 (84%) clients who sustained a traumatic brain injury (TBI). In 2012, 13 BIRP units admitted a similar proportion of TBI clients (81.4%). The ratio of TBI to Non-TBI clients is consistent over the years, with non-TBI admissions not exceeding 20% of the total admissions to the service. The analysis results are not presented in this report but the analysis of the data also indicated that there is little difference between NSW metro and rural services in the ratio of traumatic to non-traumatic injuries.
0.00%
10.00%
20.00%
30.00%
40.00%
50.00%
60.00%
70.00%
80.00%
90.00%
100.00%
CY 10 CY 11 CY 12
Client Intake - TBI versus Non-TBI
TBI NON-TBI NOT STATED
Injury Type CY 10 CY 11 CY 12TBI 81.8% (852) 84.1% (889) 81.4% (903)Non-TBI 17.5% (182) 15.5% (164) 17.7% (196)Not Stated .8% (8) .4% (4) .9% (10)Total 100.0% (1042) 100.0% (1057) 100.0% (1109)

I N J U R Y
Page 14
Chart 2.2 – Individual Client Intake by Injury Cause
Chart 2.2 includes both TBI and non-TBI clients. Over the years, the trend of major injury cause concerning BIRP clients remains consistent. Motor vehicle related injuries (driver, passenger paedestrian, cyclist), falls and assaults account for over 60% of the total client intake. In 2011, 14 BIRP units admitted 411clients who sustained injuries in motor vehicle accidents, 201 in falls and 127 in assaults and these groups together account for 83% of the total TBI clients. Motor vehicle related injuries alone account for 46% of the total TBI clients. Similarly, in 2012, 13 units admitted 371 clients with motor vehicle related, 271 fall-related and 112 assault-related injuries, which accounts for 79% of the TBI clients. Motor vehicle related injuries alone account for 41% of the total TBI clients.
0.0%5.0%
10.0%15.0%20.0%25.0%30.0%35.0%40.0%45.0%50.0%
CY 10 CY 11 CY 12
Client Intake - Injury Cause
MVA Related Fall Assault
Gunshot Pedal Cyclist / Pushbike Sport /Leisure
Other TBI Hypoxia /CVA/Cerebral Bleed Other Non-TBI
Not Stated
Injury Cause CY 10 CY 11 CY 12MVA Related 36.4% (379) 38.9% (411) 33.5% (371)Fall 17.8% (185) 19.0% (201) 20.4% (226)Assault 11.7% (122) 12.0% (127) 10.1% (112)Gunshot .4% (4) .3% (3) .4% (4)Pedal Cyclist / Pushbike 3.8% (40) 2.7% (29) 5.3% (59)Sport /Leisure 6.8% (71) 7.9% (84) 8.5% (94)Other TBI 4.9% (51) 3.2% (34) 3.3% (37)Hypoxia /CVA/Cerebral Bleed 9.9% (103) 9.3% (98) 9.6% (106)Other Non-TBI 7.6% (79) 6.2% (66) 8.1% (90)Not Stated .8% (8) .4% (4) .9% (10)Total 100% (1042) 100% (1057) 100% (1109)
I N J U R Y
Page 15
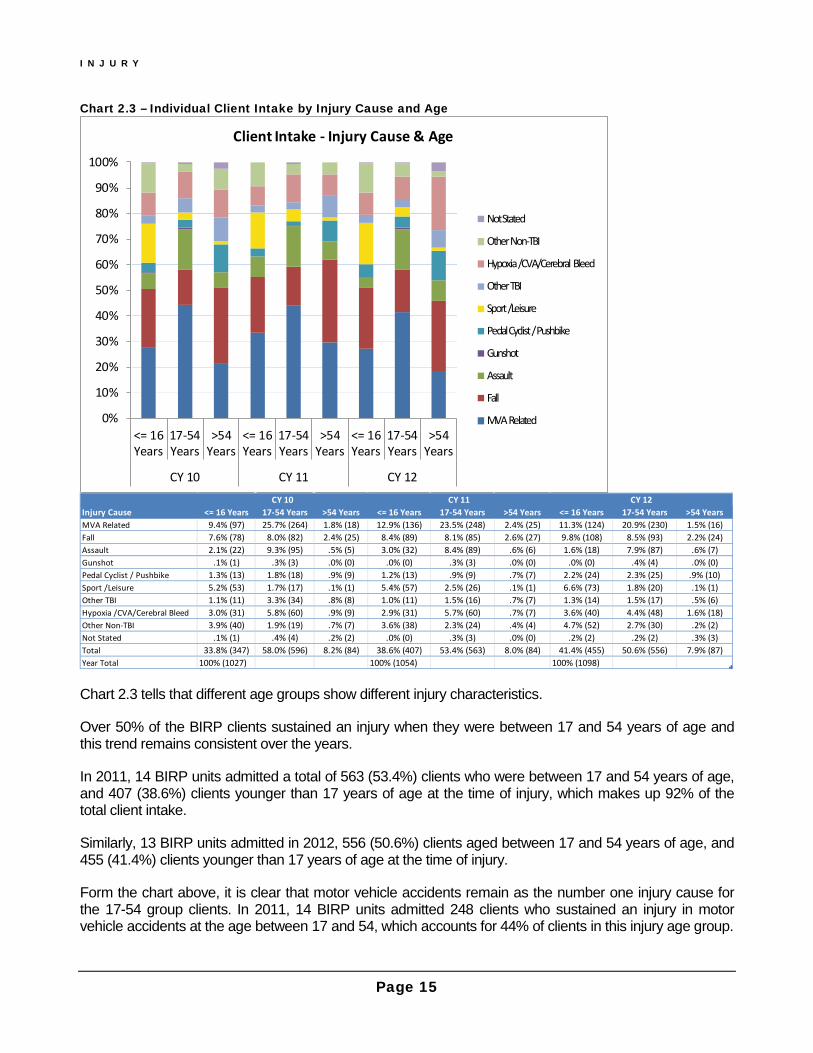
Chart 2.3 – Individual Client Intake by Injury Cause and Age
Chart 2.3 tells that different age groups show different injury characteristics.
Over 50% of the BIRP clients sustained an injury when they were between 17 and 54 years of age and this trend remains consistent over the years.
In 2011, 14 BIRP units admitted a total of 563 (53.4%) clients who were between 17 and 54 years of age, and 407 (38.6%) clients younger than 17 years of age at the time of injury, which makes up 92% of the total client intake.
Similarly, 13 BIRP units admitted in 2012, 556 (50.6%) clients aged between 17 and 54 years of age, and 455 (41.4%) clients younger than 17 years of age at the time of injury.
Form the chart above, it is clear that motor vehicle accidents remain as the number one injury cause for the 17-54 group clients. In 2011, 14 BIRP units admitted 248 clients who sustained an injury in motor vehicle accidents at the age between 17 and 54, which accounts for 44% of clients in this injury age group.
0%
10%
20%
30%
40%
50%
60%
70%
80%
90%
100%
<= 16Years
17-54Years
>54Years
<= 16Years
17-54Years
>54Years
<= 16Years
17-54Years
>54Years
CY 10 CY 11 CY 12
Client Intake - Injury Cause & Age
Not Stated
Other Non-TBI
Hypoxia /CVA/Cerebral Bleed
Other TBI
Sport /Leisure
Pedal Cyclist / Pushbike
Gunshot
Assault
Fall
MVA Related
Injury Cause <= 16 Years 17-54 Years >54 Years <= 16 Years 17-54 Years >54 Years <= 16 Years 17-54 Years >54 YearsMVA Related 9.4% (97) 25.7% (264) 1.8% (18) 12.9% (136) 23.5% (248) 2.4% (25) 11.3% (124) 20.9% (230) 1.5% (16)Fall 7.6% (78) 8.0% (82) 2.4% (25) 8.4% (89) 8.1% (85) 2.6% (27) 9.8% (108) 8.5% (93) 2.2% (24)Assault 2.1% (22) 9.3% (95) .5% (5) 3.0% (32) 8.4% (89) .6% (6) 1.6% (18) 7.9% (87) .6% (7)Gunshot .1% (1) .3% (3) .0% (0) .0% (0) .3% (3) .0% (0) .0% (0) .4% (4) .0% (0)Pedal Cyclist / Pushbike 1.3% (13) 1.8% (18) .9% (9) 1.2% (13) .9% (9) .7% (7) 2.2% (24) 2.3% (25) .9% (10)Sport /Leisure 5.2% (53) 1.7% (17) .1% (1) 5.4% (57) 2.5% (26) .1% (1) 6.6% (73) 1.8% (20) .1% (1)Other TBI 1.1% (11) 3.3% (34) .8% (8) 1.0% (11) 1.5% (16) .7% (7) 1.3% (14) 1.5% (17) .5% (6)Hypoxia /CVA/Cerebral Bleed 3.0% (31) 5.8% (60) .9% (9) 2.9% (31) 5.7% (60) .7% (7) 3.6% (40) 4.4% (48) 1.6% (18)Other Non-TBI 3.9% (40) 1.9% (19) .7% (7) 3.6% (38) 2.3% (24) .4% (4) 4.7% (52) 2.7% (30) .2% (2)Not Stated .1% (1) .4% (4) .2% (2) .0% (0) .3% (3) .0% (0) .2% (2) .2% (2) .3% (3)Total 33.8% (347) 58.0% (596) 8.2% (84) 38.6% (407) 53.4% (563) 8.0% (84) 41.4% (455) 50.6% (556) 7.9% (87)Year Total 100% (1027) 100% (1054) 100% (1098)
CY 10 CY 11 CY 12
I N J U R Y
Page 16
Likewise, in 2012, 13 BIRP units admitted 230 clients who sustained motor vehicle related injuries in this age group which accounts for 41% of the age group.
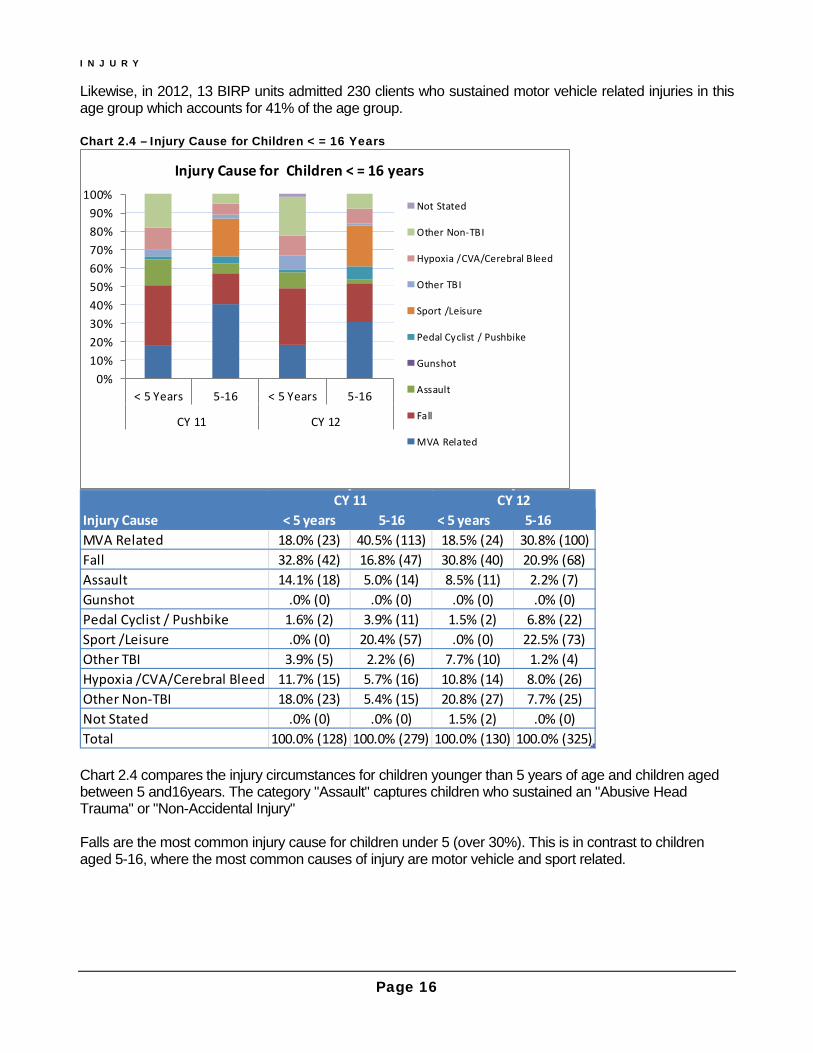
Chart 2.4 – Injury Cause for Children < = 16 Years
Chart 2.4 compares the injury circumstances for children younger than 5 years of age and children aged between 5 and16years. The category "Assault" captures children who sustained an "Abusive Head Trauma" or "Non-Accidental Injury" Falls are the most common injury cause for children under 5 (over 30%). This is in contrast to children aged 5-16, where the most common causes of injury are motor vehicle and sport related.
0%10%20%30%40%50%60%70%80%90%
100%
< 5 Years 5-16 < 5 Years 5-16
CY 11 CY 12
Injury Cause for Children < = 16 years
Not Stated
Other Non-TBI
Hypoxia /CVA/Cerebral Bleed
Other TBI
Sport /Leisure
Pedal Cyclist / Pushbike
Gunshot
Assault
Fall
MVA Related
Injury Cause < 5 years 5-16 < 5 years 5-16MVA Related 18.0% (23) 40.5% (113) 18.5% (24) 30.8% (100)Fall 32.8% (42) 16.8% (47) 30.8% (40) 20.9% (68)Assault 14.1% (18) 5.0% (14) 8.5% (11) 2.2% (7)Gunshot .0% (0) .0% (0) .0% (0) .0% (0)Pedal Cyclist / Pushbike 1.6% (2) 3.9% (11) 1.5% (2) 6.8% (22)Sport /Leisure .0% (0) 20.4% (57) .0% (0) 22.5% (73)Other TBI 3.9% (5) 2.2% (6) 7.7% (10) 1.2% (4)Hypoxia /CVA/Cerebral Bleed 11.7% (15) 5.7% (16) 10.8% (14) 8.0% (26)Other Non-TBI 18.0% (23) 5.4% (15) 20.8% (27) 7.7% (25)Not Stated .0% (0) .0% (0) 1.5% (2) .0% (0)Total 100.0% (128) 100.0% (279) 100.0% (130) 100.0% (325)
CY 11 CY 12
I N J U R Y
Page 17
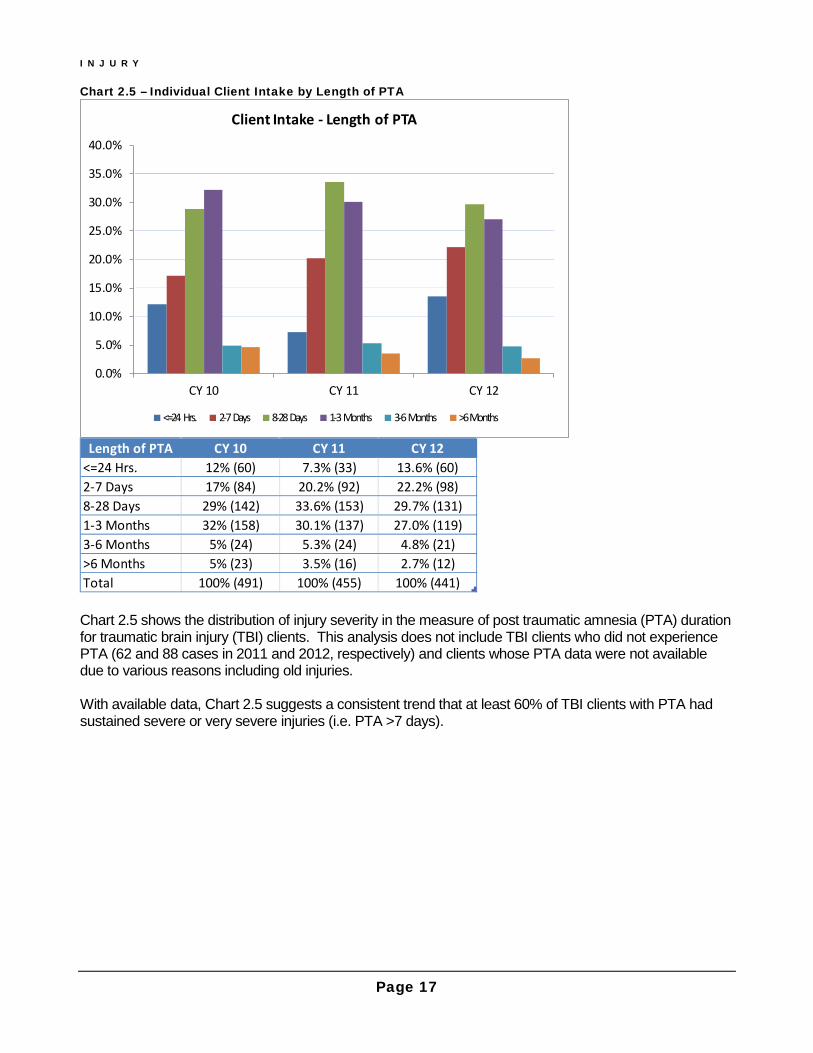
Chart 2.5 – Individual Client Intake by Length of PTA
Chart 2.5 shows the distribution of injury severity in the measure of post traumatic amnesia (PTA) duration for traumatic brain injury (TBI) clients. This analysis does not include TBI clients who did not experience PTA (62 and 88 cases in 2011 and 2012, respectively) and clients whose PTA data were not available due to various reasons including old injuries. With available data, Chart 2.5 suggests a consistent trend that at least 60% of TBI clients with PTA had sustained severe or very severe injuries (i.e. PTA >7 days).
0.0%
5.0%
10.0%
15.0%
20.0%
25.0%
30.0%
35.0%
40.0%
CY 10 CY 11 CY 12
Client Intake - Length of PTA
<=24 Hrs. 2-7 Days 8-28 Days 1-3 Months 3-6 Months >6 Months
Length of PTA CY 10 CY 11 CY 12<=24 Hrs. 12% (60) 7.3% (33) 13.6% (60)2-7 Days 17% (84) 20.2% (92) 22.2% (98)8-28 Days 29% (142) 33.6% (153) 29.7% (131)1-3 Months 32% (158) 30.1% (137) 27.0% (119)3-6 Months 5% (24) 5.3% (24) 4.8% (21)>6 Months 5% (23) 3.5% (16) 2.7% (12)Total 100% (491) 100% (455) 100% (441)

I N J U R Y
Page 18
Chart 2.6 – Individual Client Intake by TBI Injury Cause and Severity by PTA
Chart 2.6 is based on available post traumatic amnesia (PTA) data and injury cause of traumatic brain injury (TBI) clients. The data summary appears to reflect what has been reported in existing literature. That is, motor vehicle related injuries tend to be more severe than all other causes of TBI. Over the years, at least more than 40% of motor vehicle related injuries resulted in PTA longer than 28 days whereas around 30% of all other TBI led to this level of severity.
0%10%20%30%40%50%60%70%80%90%
100%
CY 10 CY 11 CY 12
MVA Related TBIs & PTA Duration
<=28 Days > 28 Days
0%10%20%30%40%50%60%70%80%90%
100%
CY 10 CY 11 CY 12
Non - MVA Related TBIs & PTA Duration
<=28 Days > 28 Days
MVA RelatedPTA Duration CY 10 CY 11 CY 12<=28 Days 48.8% (126) 53.1% (138) 58.8% (134)> 28 Days 51.2% (132) 46.9% (122) 41.2% (94)
Total 100% (258) 100% (260) 100% (228)Non - MVA Related
PTA Duration CY 10 CY 11 CY 12<=28 Days 68.7% (160) 71.8% (140) 72.8% (155)> 28 Days 31.3% (73) 28.2% (55) 27.2% (58)
Total 100% (233) 100% (195) 100% (213)
Page 19
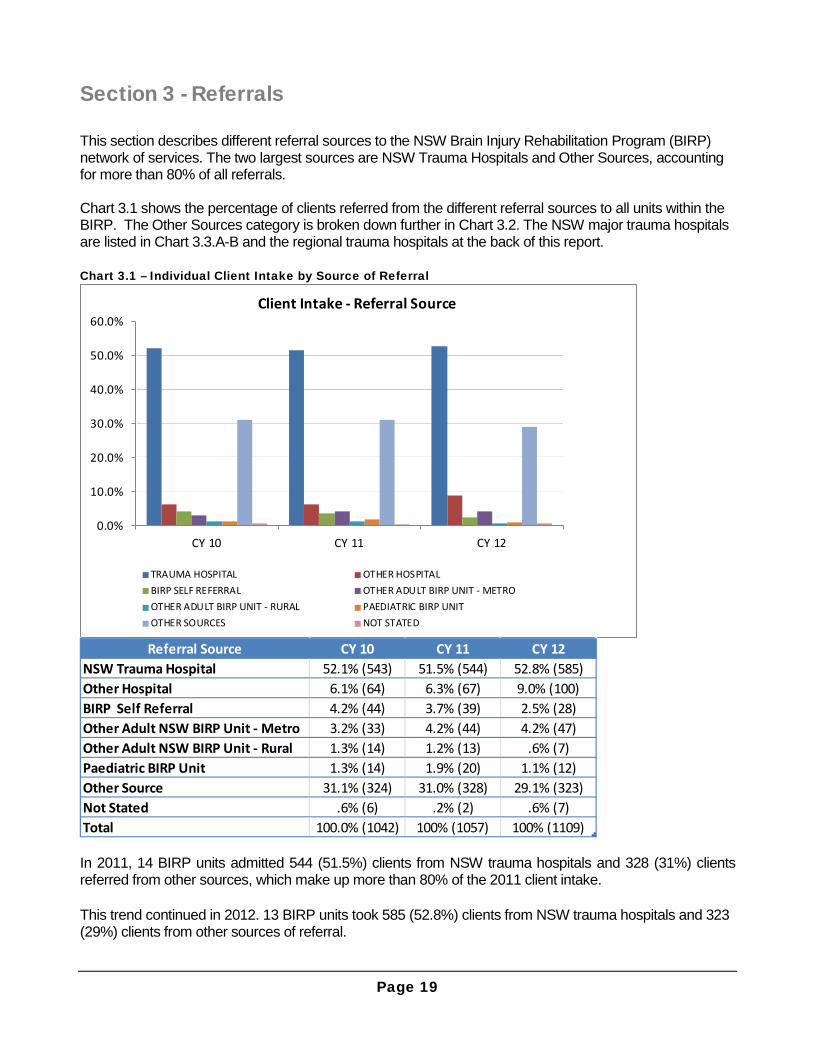
Section 3 - Referrals This section describes different referral sources to the NSW Brain Injury Rehabilitation Program (BIRP) network of services. The two largest sources are NSW Trauma Hospitals and Other Sources, accounting for more than 80% of all referrals. Chart 3.1 shows the percentage of clients referred from the different referral sources to all units within the BIRP. The Other Sources category is broken down further in Chart 3.2. The NSW major trauma hospitals are listed in Chart 3.3.A-B and the regional trauma hospitals at the back of this report. Chart 3.1 – Individual Client Intake by Source of Referral
In 2011, 14 BIRP units admitted 544 (51.5%) clients from NSW trauma hospitals and 328 (31%) clients referred from other sources, which make up more than 80% of the 2011 client intake. This trend continued in 2012. 13 BIRP units took 585 (52.8%) clients from NSW trauma hospitals and 323 (29%) clients from other sources of referral.
0.0%
10.0%
20.0%
30.0%
40.0%
50.0%
60.0%
CY 10 CY 11 CY 12
Client Intake - Referral Source
TRAUMA HOSPITAL OTHER HOSPITALBIRP SELF REFERRAL OTHER ADULT BIRP UNIT - METROOTHER ADULT BIRP UNIT - RURAL PAEDIATRIC BIRP UNITOTHER SOURCES NOT STATED
Referral Source CY 10 CY 11 CY 12NSW Trauma Hospital 52.1% (543) 51.5% (544) 52.8% (585)Other Hospital 6.1% (64) 6.3% (67) 9.0% (100)BIRP Self Referral 4.2% (44) 3.7% (39) 2.5% (28)Other Adult NSW BIRP Unit - Metro 3.2% (33) 4.2% (44) 4.2% (47)Other Adult NSW BIRP Unit - Rural 1.3% (14) 1.2% (13) .6% (7)Paediatric BIRP Unit 1.3% (14) 1.9% (20) 1.1% (12)Other Source 31.1% (324) 31.0% (328) 29.1% (323)Not Stated .6% (6) .2% (2) .6% (7)Total 100.0% (1042) 100% (1057) 100% (1109)

R E F E R R A L S
Page 20
Chart 3.2 – Referrals (Other Sources)
Chart 3.2 shows various referral sources within the Other Source category. Over the years, more than 60% of clients within this category were referred by an external specialist or practitioner (GP), or were initiated via a family or self-referral. ‘Family/Self-Referral’ in Chart 3.2 is different from ‘BIRP Self-Referral’ as listed in Chart 3.1 above. The former is a patient/client self-referral to a rehab service whereas the latter is a referral of a client to a different program (setting of care) within the same BIRP service unit. In 2011, the number of clients either self-referred or referred by an external medical specialist or practitioner to 14 BIRP units was 233, accounting for 71% of this Other Source category. Similarly, in 2012, 13 BIRP units accepted 227 clients either self-referred or referred by an external medical specialist or practitioner (70% of other sources).
0.0%5.0%
10.0%15.0%20.0%25.0%30.0%35.0%40.0%45.0%
CY 10 CY 11 CY 12
Referrals - Other Sources
BRAIN INJURY CLINIC COMMUNITY AGENCY
CRS/OTHER REHAB FACILITY FAMILY/SELF REFERRAL
MEDICAL PRACTITIONER/SPECIALIST SCHOOL /WORKPLACE
INTERSTATE OTHER
Referral Source CY 10 CY 11 CY 12BRAIN INJURY CLINIC 6.5% (21) 7.9% (26) 5.0% (16)COMMUNITY AGENCY 7.4% (24) 4.6% (15) 9.0% (29)CRS/OTHER REHAB FACILITY 6.5% (21) 2.7% (9) 1.5% (5)FAMILY/SELF REFERRAL 26.9% (87) 28.4% (93) 28.8% (93)MEDICAL PRACTITIONER/SPECIALIST 35.2% (114) 42.7% (140) 41.5% (134)SCHOOL /WORKPLACE 1.5% (5) .6% (2) 1.9% (6)INTERSTATE 1.5% (5) .0% (0) .9% (3)OTHER 14.5% (47) 13.1% (43) 11.5% (37)Total 100% (324) 100% (328) 100% (323)

R E F E R R A L S
Page 21
Chart 3.3.A – Referrals from NSW Adult Major Trauma Hospitals
The majority of NSW trauma hospital referrals are from NSW major trauma hospitals, showing consistency over the years in the ratio of major to regional trauma hospital referrals – around 80% to 20%. Chart 3.3.A shows referrals of individual adult major trauma hospitals to the NSW adult BIRP services and Chart 3.3.B referrals of paediatric major trauma hospitals. Because the referral pathway to paediatric service is not compatible to that of adult services, they are presented separately. The 2012 Westmead BIRS activity data was not included in the analysis. This should explain the drop in referrals from Westmead Hospital in 2012.
0.0%
5.0%
10.0%
15.0%
20.0%
25.0%
CY 10 CY 11 CY 12
Referrals - NSW Adult Major Trauma Hospital
CANBERRA
JOHN HUNTER
LIVERPOOL
ROYAL NORTH SHORE
ROYAL PRINCE ALFRED
ST GEORGE
ST VINCENT'S
WESTMEAD
Major Trauma Hospital Adult CY 10 CY 11 CY 12CANBERRA 8.8% (19) 5.9% (11) 7.6% (13)JOHN HUNTER 5.1% (11) 22.9% (43) 15.2% (26)LIVERPOOL 21.8% (47) 20.2% (38) 24.0% (41)ROYAL NORTH SHORE 18.1% (39) 10.1% (19) 12.3% (21)ROYAL PRINCE ALFRED 7.9% (17) 8.5% (16) 7.6% (13)ST GEORGE 16.2% (35) 12.8% (24) 24.6% (42)ST VINCENT'S 5.1% (11) 5.3% (10) 4.1% (7)WESTMEAD 17.1% (37) 14.4% (27) 4.7% (8)Total 100.0% (216) 100.0% (188) 100.0% (171)
R E F E R R A L S
Page 22
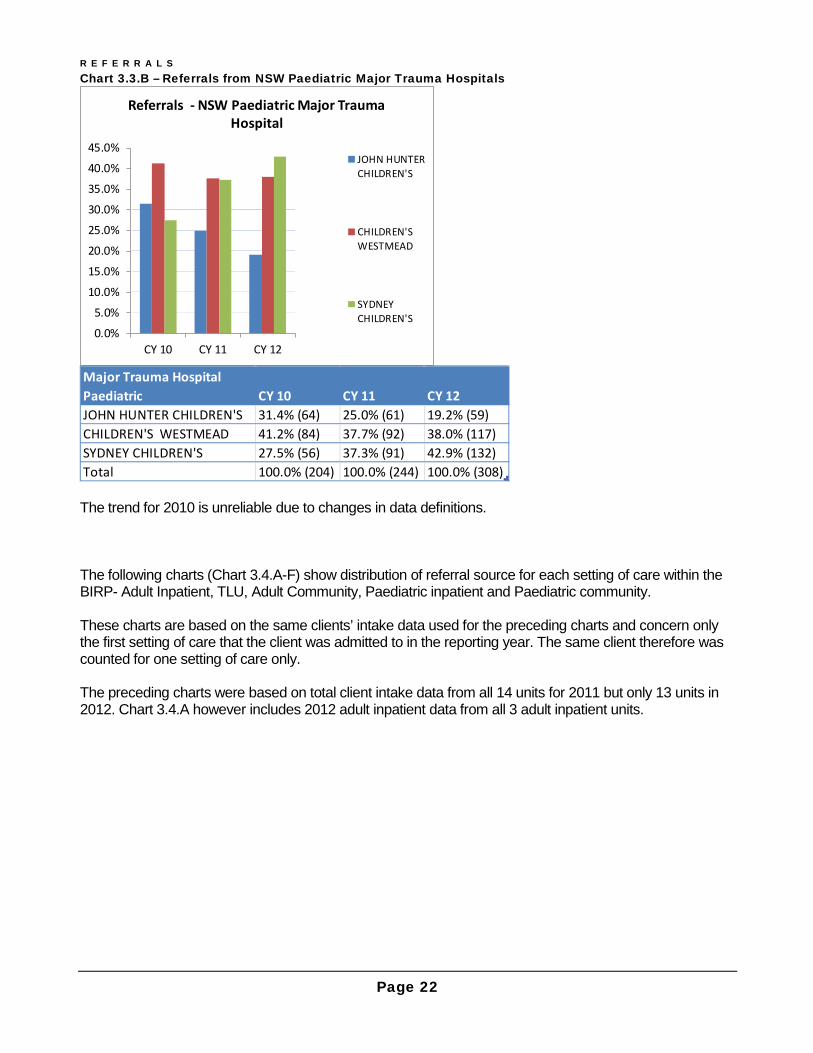
Chart 3.3.B – Referrals from NSW Paediatric Major Trauma Hospitals
The trend for 2010 is unreliable due to changes in data definitions. The following charts (Chart 3.4.A-F) show distribution of referral source for each setting of care within the BIRP- Adult Inpatient, TLU, Adult Community, Paediatric inpatient and Paediatric community. These charts are based on the same clients’ intake data used for the preceding charts and concern only the first setting of care that the client was admitted to in the reporting year. The same client therefore was counted for one setting of care only. The preceding charts were based on total client intake data from all 14 units for 2011 but only 13 units in 2012. Chart 3.4.A however includes 2012 adult inpatient data from all 3 adult inpatient units.
0.0%
5.0%
10.0%
15.0%
20.0%
25.0%
30.0%
35.0%
40.0%
45.0%
CY 10 CY 11 CY 12
Referrals - NSW Paediatric Major Trauma Hospital
JOHN HUNTERCHILDREN'S
CHILDREN'SWESTMEAD
SYDNEYCHILDREN'S
Major Trauma Hospital Paediatric CY 10 CY 11 CY 12JOHN HUNTER CHILDREN'S 31.4% (64) 25.0% (61) 19.2% (59)CHILDREN'S WESTMEAD 41.2% (84) 37.7% (92) 38.0% (117)SYDNEY CHILDREN'S 27.5% (56) 37.3% (91) 42.9% (132)Total 100.0% (204) 100.0% (244) 100.0% (308)

R E F E R R A L S
Page 23
Chart 3.4.A – Referrals by First Setting of Care: Adult Inpatient
Chart 3.4.A shows that most of the referrals to the 3 adult inpatient units derive from NSW trauma hospitals. In the 2011 client intake, 110 adult inpatients (88.7% of total inpatients admitted to the 3 adult inpatient units in the calendar year) were referred from NSW trauma hospitals. In 2012, 3 BIRP adult inpatient units accepted 120 inpatients (80% of total inpatients admitted to the 3 units in the calendar year) from NSW trauma hospitals. The chart shows an increase in referrals from other sources in the 2012 inpatients intake. The 9 inpatient referrals from other sources include 4 referrals from a medical practitioner/specialist and 1 referral from CRS/Other rehab facility.
0%10%20%30%40%50%60%70%80%90%
100%
CY 10 CY 11 CY 12
Referral Source - Adult Inpatient
NSW Trauma Hospital Other Hospital BIRP SELFOther Adult BIRP Metro Other Adult BIRP Rural Other SourcesNot Stated
Adult Inpatient Referral Source CY 10 CY 11 CY 12NSW Trauma Hospital 91.6% (141) 88.7% (110) 80.0% (120)Other Hospital 4.5% (7) 9.7% (12) 11.3% (17)BIRP SELF .6% (1) .0% (0) .7% (1)Other Adult BIRP Metro .0% (0) .8% (1) 1.3% (2)Other Adult BIRP Rural .0% (0) .0% (0) .0% (0)Other Sources 3.2% (5) .0% (0) 6.0% (9)Not Stated .0% (0) .8% (1) .7% (1)Total 100% (154) 100% (124) 100% (150)

R E F E R R A L S
Page 24
Chart 3.4.B – Referrals by First Setting of Care: TLU
Chart 3.4.B shows that over the years, the Transitional Living Units consistently received the majority of referrals from two sources: directly from NSW trauma hospitals or from external medical practitioners. This chart does not include TLU clients who were already counted in the preceding chart. In the 2011 client intake, more than 50% of TLU referrals (as the first setting of care in the reporting year) came from NSW trauma or other hospitals and this increased even more with the 2012 intake (56.4%), which was accompanied by a sharp decrease in referrals within the same BIRP unit. The yearly trend in percent, however, can vary greatly in response to a small change in the clients count for each referral source, due to the small number of clients who are admitted to TLU as the first setting of care in the reporting year. The chart also shows the movement of clients across the NSW BIRP units, 11 clients in 2011 and 9 clients in 2012.
0%10%20%30%40%50%60%70%80%90%
100%
CY 10 CY 11 CY 12
Referral Source - TLU
NSW Trauma Hospital Other Hospital BIRP SELFOther Adult BIRP Metro Other Adult BIRP Rural Other SourcesNot Stated
TLU Referral Source CY 10 CY 11 CY 12NSW Trauma Hospital 28.1% (9) 40.7% (22) 38.2% (21)Other Hospital 6.3% (2) 11.1% (6) 18.2% (10)BIRP SELF 25.0% (8) 3.7% (2) 1.8% (1)Other Adult BIRP Metro 9.4% (3) 20.4% (11) 16.4% (9)Other Adult BIRP Rural 9.4% (3) .0% (0) .0% (0)Other Sources 21.9% (7) 24.1% (13) 25.5% (14)Not Stated .0% (0) .0% (0) .0% (0)Total 100% (32) 100% (54) 100% (55)
R E F E R R A L S
Page 25
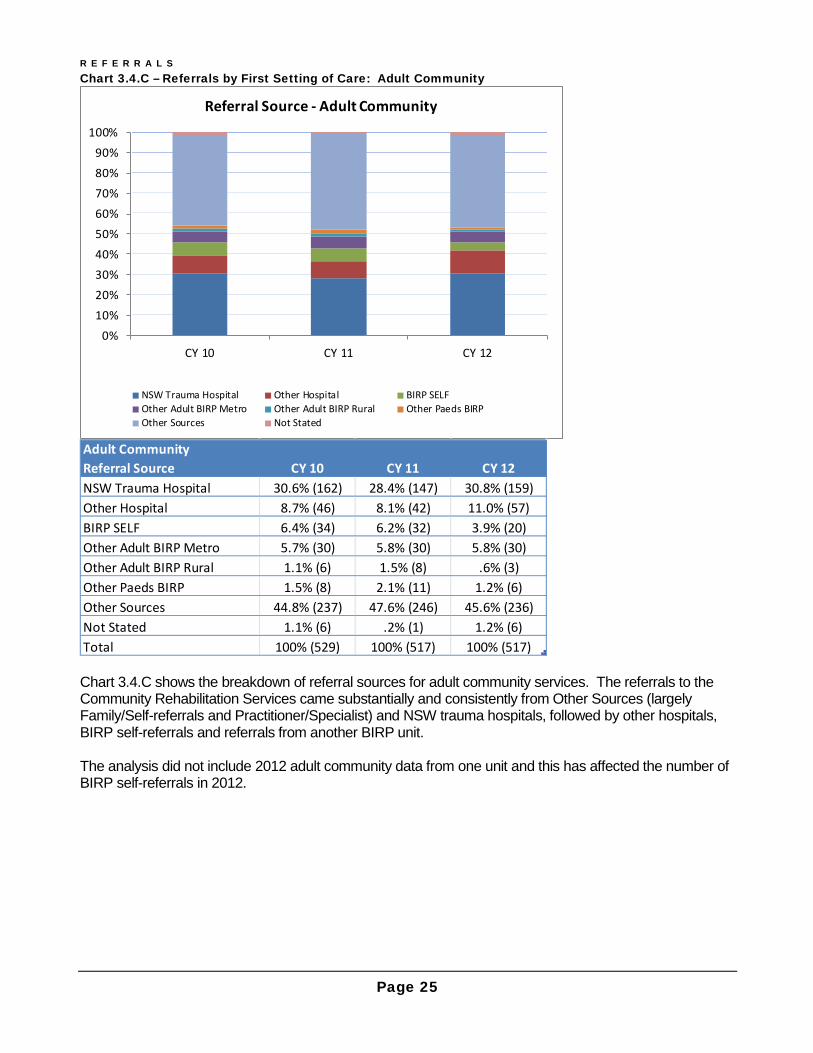
Chart 3.4.C – Referrals by First Setting of Care: Adult Community
Chart 3.4.C shows the breakdown of referral sources for adult community services. The referrals to the Community Rehabilitation Services came substantially and consistently from Other Sources (largely Family/Self-referrals and Practitioner/Specialist) and NSW trauma hospitals, followed by other hospitals, BIRP self-referrals and referrals from another BIRP unit. The analysis did not include 2012 adult community data from one unit and this has affected the number of BIRP self-referrals in 2012.
0%10%20%30%40%50%60%70%80%90%
100%
CY 10 CY 11 CY 12
Referral Source - Adult Community
NSW Trauma Hospital Other Hospital BIRP SELFOther Adult BIRP Metro Other Adult BIRP Rural Other Paeds BIRPOther Sources Not Stated
Adult Community Referral Source CY 10 CY 11 CY 12NSW Trauma Hospital 30.6% (162) 28.4% (147) 30.8% (159)Other Hospital 8.7% (46) 8.1% (42) 11.0% (57)BIRP SELF 6.4% (34) 6.2% (32) 3.9% (20)Other Adult BIRP Metro 5.7% (30) 5.8% (30) 5.8% (30)Other Adult BIRP Rural 1.1% (6) 1.5% (8) .6% (3)Other Paeds BIRP 1.5% (8) 2.1% (11) 1.2% (6)Other Sources 44.8% (237) 47.6% (246) 45.6% (236)Not Stated 1.1% (6) .2% (1) 1.2% (6)Total 100% (529) 100% (517) 100% (517)

R E F E R R A L S
Page 26
Chart 3.4.D – Referrals by First Setting of Care: Paediatric Inpatient
Chart 3.4.D shows different sources of referrals to the paediatric inpatient setting of care. The chart includes aggregated data for the 2010 report but it is not comparable to the data for the subsequent years. It represents a combined single paediatric setting of care without distinguishing between paediatric inpatient and community settings. The trend is also unreliable due to changes in data definitions. For 2011 and 2012, the chart shows that more than 90% of referrals to paediatric inpatient services came from NSW trauma hospitals. In 2011, the BIRP admitted to the paediatric inpatient service a total of 226 children from NSW trauma hospitals. In 2012, the number of NSW trauma hospital referrals increased both in percentage and count (276 referrals, 94.8%). Chart 3.4.E shows different sources of referrals to paediatric community services. In contrast with paediatric inpatient, a larger proportion of referrals derive from sources other than the trauma hospitals.
0%10%20%30%40%50%60%70%80%90%
100%
CY 10
Combined Paediatric - CY 10
NSW Trauma Hospital Other HospitalBIRP SELF Other Adult BIRP MetroOther Adult BIRP Rural Other Paeds BIRPOther Sources Not Stated
84%
86%
88%
90%
92%
94%
96%
98%
100%
CY 11 CY 12
Referral Source - Paediatric Inpatient
NSW Trauma Hospital Other HospitalBIRP SELF Other Adult BIRP MetroOther Adult BIRP Rural Other Paeds BIRPOther Sources Not Stated
Referral Sources CY 10 CY 11 CY 12NSW Trauma Hospital 70.6% (231) 90.4% (226) 94.8% (276)Other Hospital 2.8% (9) .8% (2) .0% (0)BIRP SELF .3% (1) .8% (2) 1.4% (4)Other Adult BIRP Metro .0% (0) .4% (1) 1.0% (3)Other Adult BIRP Rural 1.5% (5) .0% (0) .0% (0)Other Paeds BIRP 1.8% (6) .0% (0) .0% (0)Other Sources 22.9% (75) 7.6% (19) 2.7% (8)Not Stated .0% (0) .0% (0) .0% (0)Total 100.0% (327) 100% (250) 100% (291)

R E F E R R A L S
Page 27
Chart 3.4.E – Referrals by First Setting of Care: Paediatric Community
A small number of young people were referred from adult BIRP services (6 in 2011 and 7 in 2012). It is a pathway to rehabilitation that some young people are admitted to adult services and then later transferred to paediatric services to better meet the needs of the younger person. The client intake to the paediatric inpatient service outnumbers the client intake to the paediatric community service. The 2011 paediatric intake consists of 250 children admitted to the paediatric inpatient service and an additional 112 children admitted to the paediatric community service (as the first episode of care for the year). Similarly, the 2012 paediatric intake includes 291 children to the paediatric inpatient service and an additional 124 children to the paediatric community service.
0%
20%
40%
60%
80%
100%
CY 11 CY 12
Referral Source - Paediatric Community
NSW Trauma Hospital Other HospitalBIRP SELF Other Adult BIRP MetroOther Adult BIRP Rural Other Paeds BIRPOther Sources Not Stated
Paediatric Community Referral Source CY 11 CY 12
NSW Trauma Hospital 34.8% (39) 34.8% (49)Other Hospital 4.5% (5) 12.8% (18)BIRP SELF 2.7% (3) 2.1% (3)Other Adult BIRP Metro .9% (1) 2.1% (3)Other Adult BIRP Rural 4.5% (5) 2.8% (4)Other Paeds BIRP 8.0% (9) 4.3% (6)Other Sources 44.6% (50) 41.1% (58)Not Stated .0% (0) .0% (0)Total 100.0% (112) 100.0% (141)

Page 28
Section 4 - Financial Status This section describes the breakdown of client intake by financial status. Financial status refers to access to injury compensation (compensable) so financial status here concerns the outcome of claims, rather than claim type itself. In the data collection system, claim type is not directly related to financial status. In some charts the missing and unknown category appears high however, this is includes those whose claim status is still being determined (pending). Chart 4.1.A – Individual Client Intake by Financial Status
Charts 4.1.A shows that the proportion of “compensable” financial status for the yearly client intake is fairly consistent (around 20%) over the years. The analysis did not include 2012 activity data for one unit that provides adult inpatient service, which may explain the small decrease in the proportion of compensable status in 2012.
0.0%
10.0%
20.0%
30.0%
40.0%
50.0%
60.0%
70.0%
80.0%
90.0%
100.0%
CY 10 CY 11 CY 12
Client Intake - Financial Status
Compensable Non-compensable Pending/Not Stated
Financial Status CY 10 CY 11 CY 12Compensable 20.9% (218) 21.6% (228) 18.3% (203)Non-compensable 59.7% (622) 58.0% (613) 60.0% (665)Pending/Not Stated 19.4% (202) 20.4% (216) 21.7% (241)Total 100% (1042) 100% (1057) 100% (1109)
F I N A N C I A L S T A T U S
Page 29
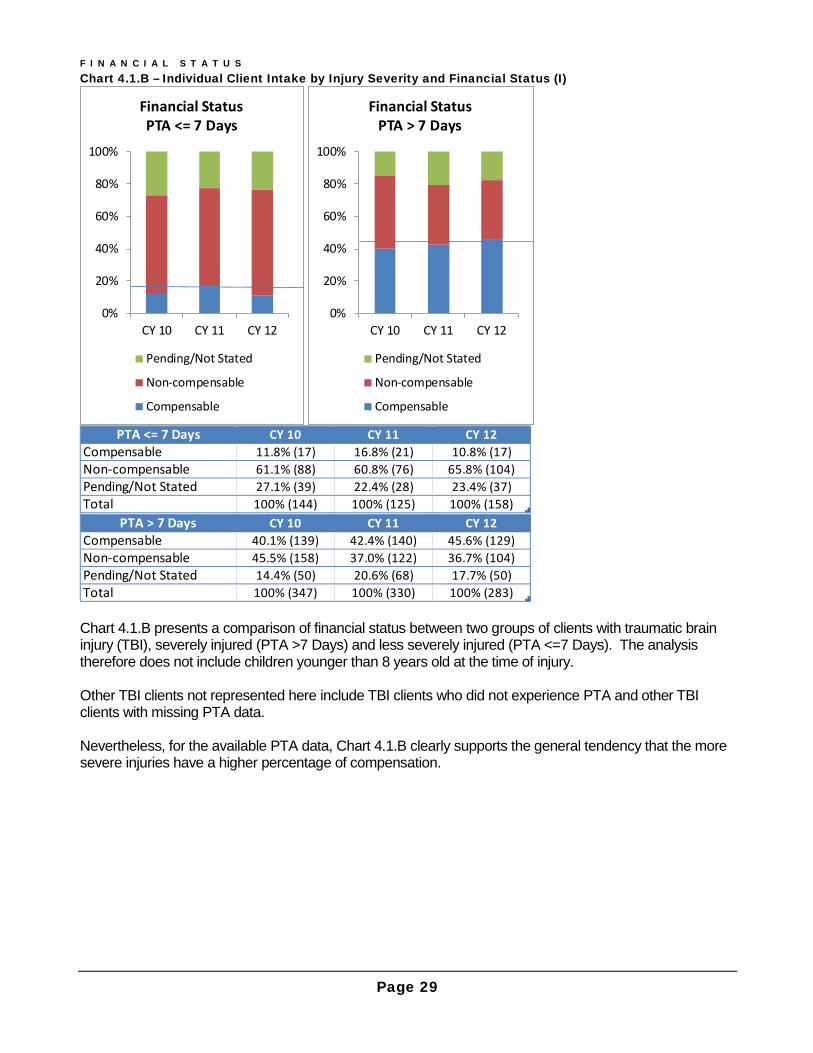
Chart 4.1.B – Individual Client Intake by Injury Severity and Financial Status (I)
Chart 4.1.B presents a comparison of financial status between two groups of clients with traumatic brain injury (TBI), severely injured (PTA >7 Days) and less severely injured (PTA <=7 Days). The analysis therefore does not include children younger than 8 years old at the time of injury. Other TBI clients not represented here include TBI clients who did not experience PTA and other TBI clients with missing PTA data. Nevertheless, for the available PTA data, Chart 4.1.B clearly supports the general tendency that the more severe injuries have a higher percentage of compensation.
0%
20%
40%
60%
80%
100%
CY 10 CY 11 CY 12
Financial Status PTA <= 7 Days
Pending/Not Stated
Non-compensable
Compensable
0%
20%
40%
60%
80%
100%
CY 10 CY 11 CY 12
Financial Status PTA > 7 Days
Pending/Not Stated
Non-compensable
Compensable
PTA <= 7 Days CY 10 CY 11 CY 12Compensable 11.8% (17) 16.8% (21) 10.8% (17)Non-compensable 61.1% (88) 60.8% (76) 65.8% (104)Pending/Not Stated 27.1% (39) 22.4% (28) 23.4% (37)Total 100% (144) 100% (125) 100% (158)
PTA > 7 Days CY 10 CY 11 CY 12Compensable 40.1% (139) 42.4% (140) 45.6% (129)Non-compensable 45.5% (158) 37.0% (122) 36.7% (104)Pending/Not Stated 14.4% (50) 20.6% (68) 17.7% (50)Total 100% (347) 100% (330) 100% (283)
F I N A N C I A L S T A T U S
Page 30
Chart 4.2.A – Individual Client Intake by Injury Cause and Financial Status
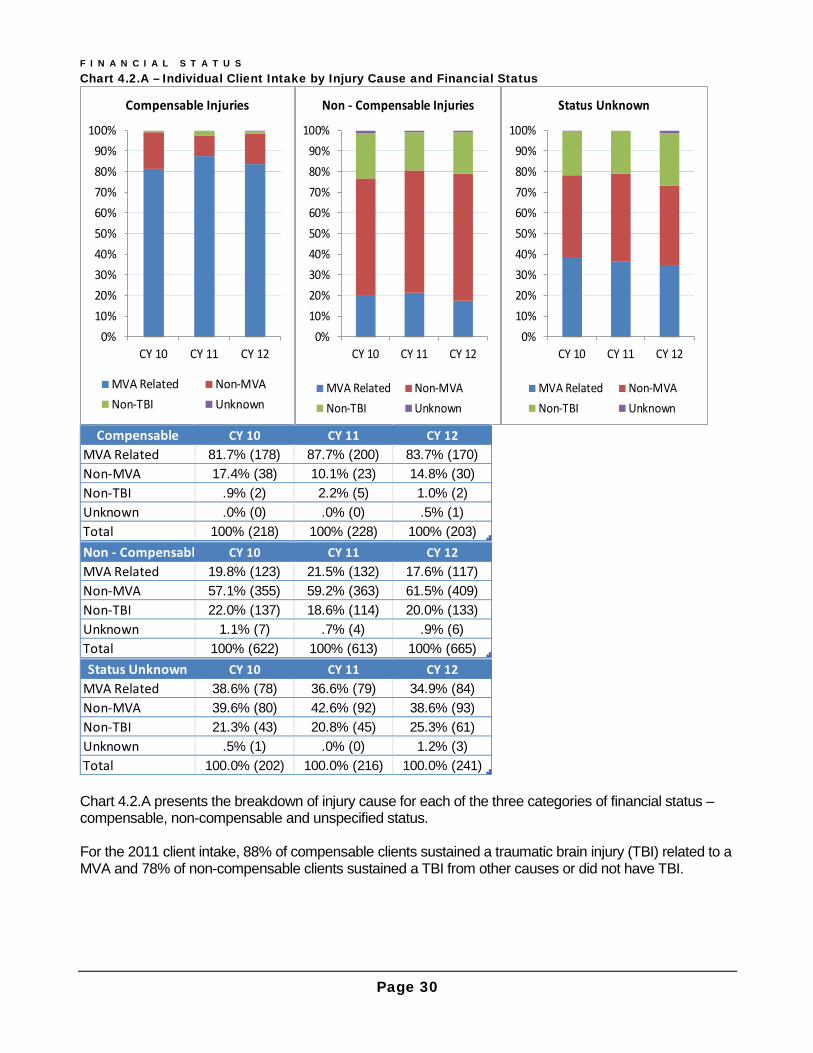
Chart 4.2.A presents the breakdown of injury cause for each of the three categories of financial status – compensable, non-compensable and unspecified status. For the 2011 client intake, 88% of compensable clients sustained a traumatic brain injury (TBI) related to a MVA and 78% of non-compensable clients sustained a TBI from other causes or did not have TBI.
0%10%20%30%40%50%60%70%80%90%
100%
CY 10 CY 11 CY 12
Compensable Injuries
MVA Related Non-MVANon-TBI Unknown
0%10%20%30%40%50%60%70%80%90%
100%
CY 10 CY 11 CY 12
Non - Compensable Injuries
MVA Related Non-MVANon-TBI Unknown
0%10%20%30%40%50%60%70%80%90%
100%
CY 10 CY 11 CY 12
Status Unknown
MVA Related Non-MVANon-TBI Unknown
Compensable CY 10 CY 11 CY 12MVA Related 81.7% (178) 87.7% (200) 83.7% (170)Non-MVA 17.4% (38) 10.1% (23) 14.8% (30)Non-TBI .9% (2) 2.2% (5) 1.0% (2)Unknown .0% (0) .0% (0) .5% (1)Total 100% (218) 100% (228) 100% (203)Non - Compensable CY 10 CY 11 CY 12MVA Related 19.8% (123) 21.5% (132) 17.6% (117)Non-MVA 57.1% (355) 59.2% (363) 61.5% (409)Non-TBI 22.0% (137) 18.6% (114) 20.0% (133)Unknown 1.1% (7) .7% (4) .9% (6)Total 100% (622) 100% (613) 100% (665)Status Unknown CY 10 CY 11 CY 12
MVA Related 38.6% (78) 36.6% (79) 34.9% (84)Non-MVA 39.6% (80) 42.6% (92) 38.6% (93)Non-TBI 21.3% (43) 20.8% (45) 25.3% (61)Unknown .5% (1) .0% (0) 1.2% (3)Total 100.0% (202) 100.0% (216) 100.0% (241)
F I N A N C I A L S T A T U S
Page 31
A similar pattern emerged in the 2012 client intake. Motor vehicle related injuries comprise 84% of compensable injuries and TBI from other causes or non-traumatic injuries account for 82% of non-compensable injuries. This yearly trend is reasonably consistent with the 2010 client intake. Chart 4.2.B – Individual Client Intake by Injury Severity and Financial Status (II)
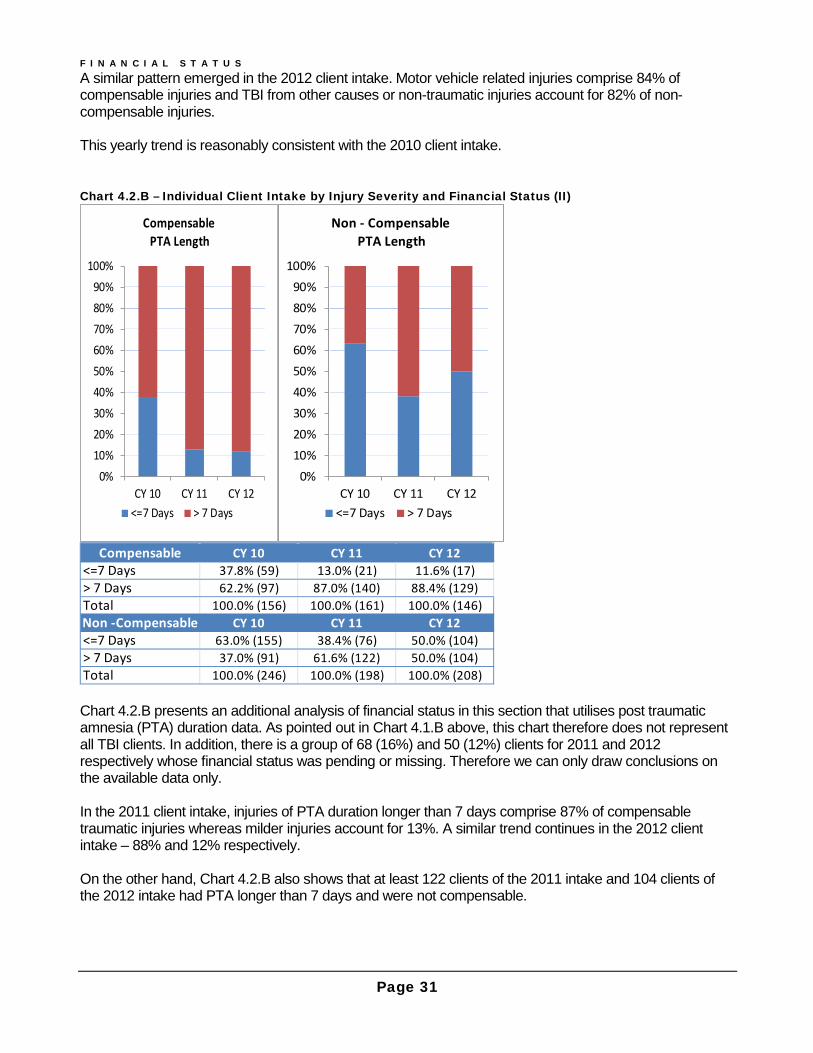
Chart 4.2.B presents an additional analysis of financial status in this section that utilises post traumatic amnesia (PTA) duration data. As pointed out in Chart 4.1.B above, this chart therefore does not represent all TBI clients. In addition, there is a group of 68 (16%) and 50 (12%) clients for 2011 and 2012 respectively whose financial status was pending or missing. Therefore we can only draw conclusions on the available data only. In the 2011 client intake, injuries of PTA duration longer than 7 days comprise 87% of compensable traumatic injuries whereas milder injuries account for 13%. A similar trend continues in the 2012 client intake – 88% and 12% respectively. On the other hand, Chart 4.2.B also shows that at least 122 clients of the 2011 intake and 104 clients of the 2012 intake had PTA longer than 7 days and were not compensable.
0%10%20%30%40%50%60%70%80%90%
100%
CY 10 CY 11 CY 12
CompensablePTA Length
<=7 Days > 7 Days
0%10%20%30%40%50%60%70%80%90%
100%
CY 10 CY 11 CY 12
Non - CompensablePTA Length
<=7 Days > 7 Days
Compensable CY 10 CY 11 CY 12<=7 Days 37.8% (59) 13.0% (21) 11.6% (17)> 7 Days 62.2% (97) 87.0% (140) 88.4% (129)Total 100.0% (156) 100.0% (161) 100.0% (146)Non -Compensable CY 10 CY 11 CY 12<=7 Days 63.0% (155) 38.4% (76) 50.0% (104)> 7 Days 37.0% (91) 61.6% (122) 50.0% (104)Total 100.0% (246) 100.0% (198) 100.0% (208)
F I N A N C I A L S T A T U S
Page 32
Chart 4.2.C –Financial Status by Injury Severity for MVA- Related Injuries
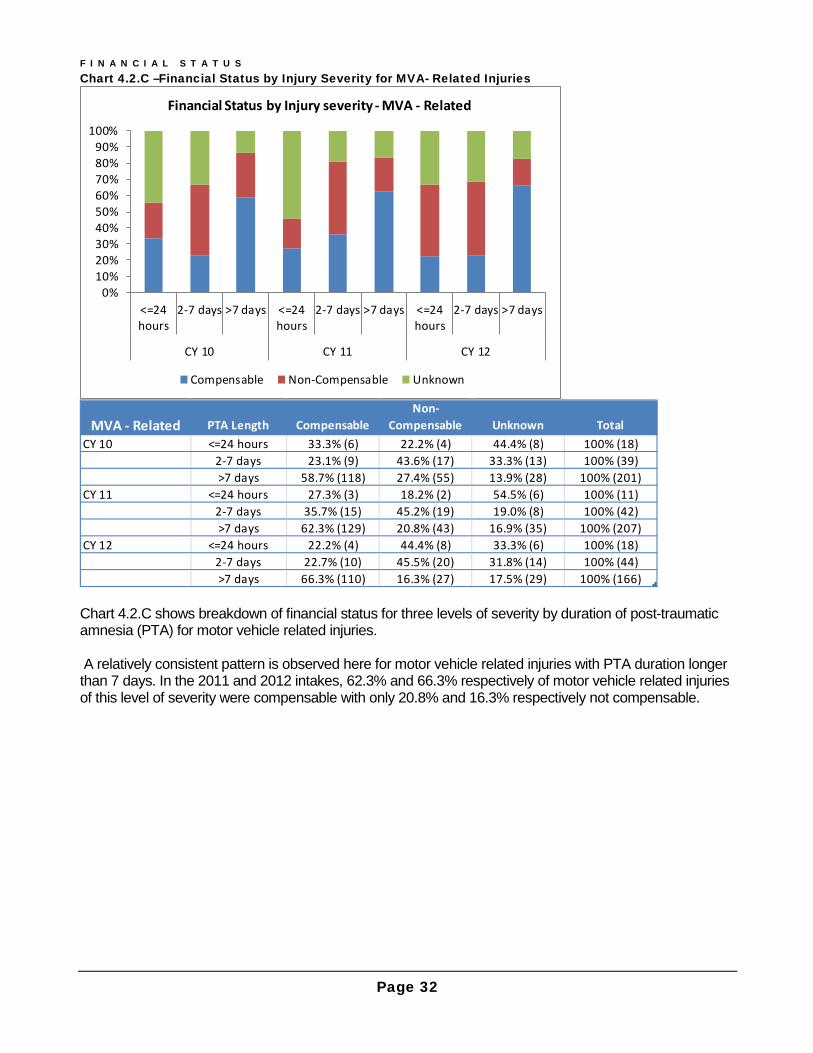
Chart 4.2.C shows breakdown of financial status for three levels of severity by duration of post-traumatic amnesia (PTA) for motor vehicle related injuries. A relatively consistent pattern is observed here for motor vehicle related injuries with PTA duration longer than 7 days. In the 2011 and 2012 intakes, 62.3% and 66.3% respectively of motor vehicle related injuries of this level of severity were compensable with only 20.8% and 16.3% respectively not compensable.
0%10%20%30%40%50%60%70%80%90%
100%
<=24hours
2-7 days >7 days <=24hours
2-7 days >7 days <=24hours
2-7 days >7 days
CY 10 CY 11 CY 12
Financial Status by Injury severity - MVA - Related
Compensable Non-Compensable Unknown
MVA - Related PTA Length CompensableNon-
Compensable Unknown TotalCY 10 <=24 hours 33.3% (6) 22.2% (4) 44.4% (8) 100% (18)
2-7 days 23.1% (9) 43.6% (17) 33.3% (13) 100% (39)>7 days 58.7% (118) 27.4% (55) 13.9% (28) 100% (201)
CY 11 <=24 hours 27.3% (3) 18.2% (2) 54.5% (6) 100% (11)2-7 days 35.7% (15) 45.2% (19) 19.0% (8) 100% (42)>7 days 62.3% (129) 20.8% (43) 16.9% (35) 100% (207)
CY 12 <=24 hours 22.2% (4) 44.4% (8) 33.3% (6) 100% (18)2-7 days 22.7% (10) 45.5% (20) 31.8% (14) 100% (44)>7 days 66.3% (110) 16.3% (27) 17.5% (29) 100% (166)

F I N A N C I A L S T A T U S
Page 33
Chart 4.2.D –Financial Status by Injury Severity for Non- MVA- Related Injuries
Chart 4.2.D shows the distribution of financial status for TBI from causes other than motor vehicles related injuries for three different levels of severity in duration of post-traumatic amnesia (PTA) – ‘PTA of 24 hours or shorter’, ‘PTA between 2 and 7 days’, and ‘PTA longer than 7 days’. In contrast to motor vehicle related injuries, a relatively small proportion of severe injuries (PTA >7 days) was compensable – 8.9% and 16.2% in the 2011 and 2012 intakes, respectively. In summary, over the last three years consistently, the majority of motor vehicle related severe injuries (PTA >7 days) were compensable whereas a large proportion of severe injuries with TBI from causes other than motor vehicle accidents were not compensable.
0%10%20%30%40%50%60%70%80%90%
100%
<=24hours
2-7 days >7 days <=24hours
2-7 days >7 days <=24hours
2-7 days >7 days
CY 10 CY 11 CY 12
Financial Status by Injury severity - Non MVA - Related
Compensable Non-Compensable Unknown
Non-MVA Related PTA Length Compensable
Non-Compensable Unknown Total
CY 10 <=24 hours 2.4% (1) 83.3% (35) 14.3% (6) 100% (42)2-7 days 2.2% (1) 71.1% (32) 26.7% (12) 100% (45)>7 days 14.4% (21) 70.5% (103) 15.1% (22) 100% (146)
CY 11 <=24 hours 9.1% (2) 54.5% (12) 36.4% (8) 100% (22)2-7 days 2.0% (1) 86.0% (43) 12.0% (6) 100% (50)>7 days 8.9% (11) 64.2% (79) 26.8% (33) 100% (123)
CY 12 <=24 hours 2.4% (1) 66.7% (28) 31.0% (13) 100% (42)2-7 days 3.7% (2) 88.9% (48) 7.4% (4) 100% (54)>7 days 16.2% (19) 65.8% (77) 17.9% (21) 100% (117)
Page 34
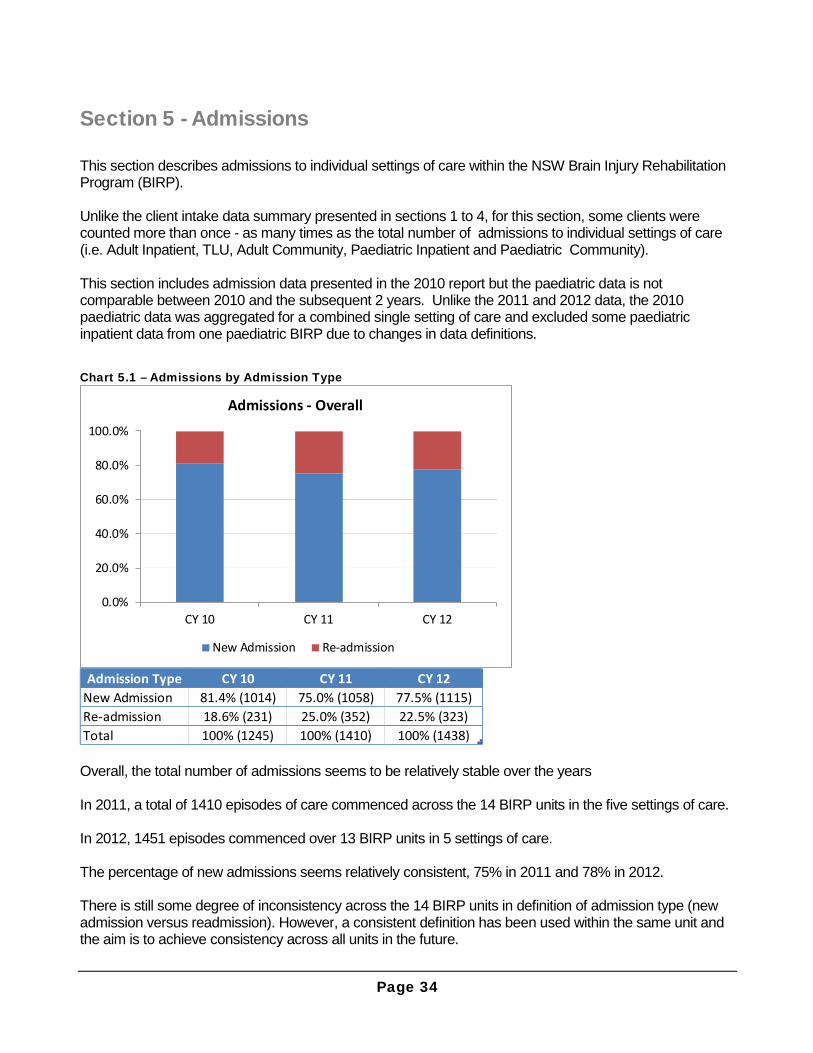
Section 5 - Admissions This section describes admissions to individual settings of care within the NSW Brain Injury Rehabilitation Program (BIRP). Unlike the client intake data summary presented in sections 1 to 4, for this section, some clients were counted more than once - as many times as the total number of admissions to individual settings of care (i.e. Adult Inpatient, TLU, Adult Community, Paediatric Inpatient and Paediatric Community). This section includes admission data presented in the 2010 report but the paediatric data is not comparable between 2010 and the subsequent 2 years. Unlike the 2011 and 2012 data, the 2010 paediatric data was aggregated for a combined single setting of care and excluded some paediatric inpatient data from one paediatric BIRP due to changes in data definitions.
Chart 5.1 – Admissions by Admission Type
Overall, the total number of admissions seems to be relatively stable over the years In 2011, a total of 1410 episodes of care commenced across the 14 BIRP units in the five settings of care. In 2012, 1451 episodes commenced over 13 BIRP units in 5 settings of care. The percentage of new admissions seems relatively consistent, 75% in 2011 and 78% in 2012. There is still some degree of inconsistency across the 14 BIRP units in definition of admission type (new admission versus readmission). However, a consistent definition has been used within the same unit and the aim is to achieve consistency across all units in the future.
0.0%
20.0%
40.0%
60.0%
80.0%
100.0%
CY 10 CY 11 CY 12
Admissions - Overall
New Admission Re-admission
Admission Type CY 10 CY 11 CY 12New Admission 81.4% (1014) 75.0% (1058) 77.5% (1115)Re-admission 18.6% (231) 25.0% (352) 22.5% (323)Total 100% (1245) 100% (1410) 100% (1438)
A D M I S S I O N S
Page 35
Chart 5.2 – Admissions by Type and Setting of Care
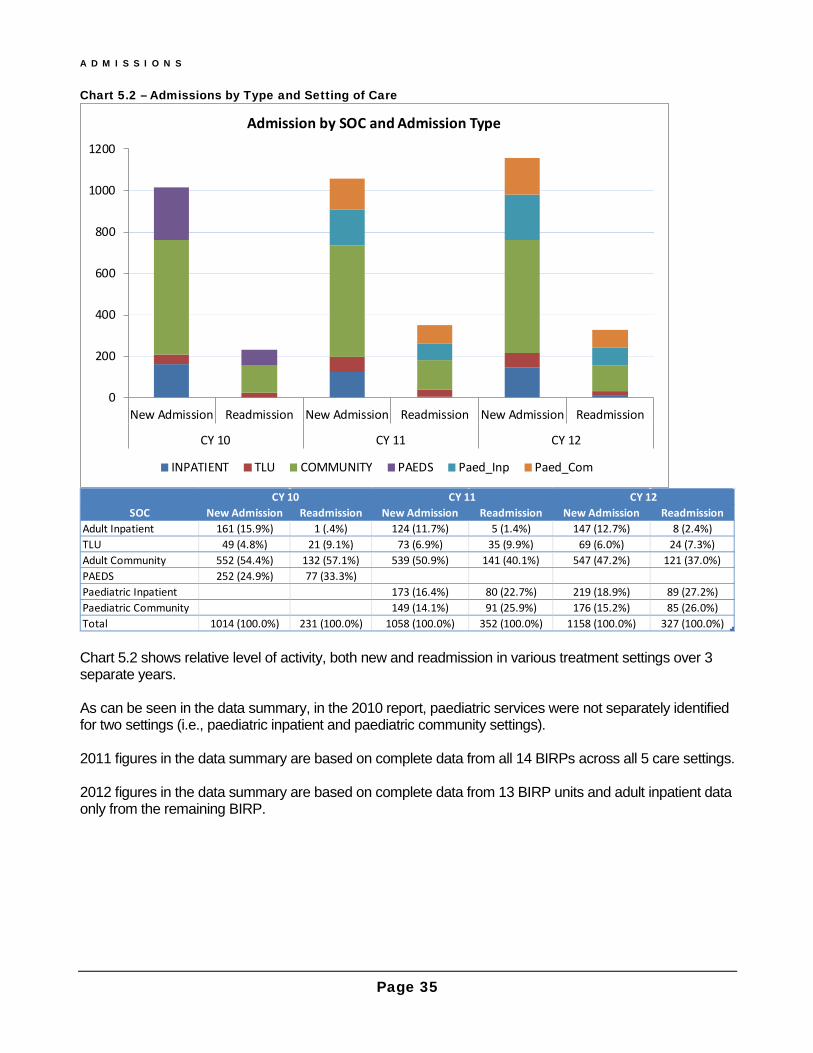
Chart 5.2 shows relative level of activity, both new and readmission in various treatment settings over 3 separate years. As can be seen in the data summary, in the 2010 report, paediatric services were not separately identified for two settings (i.e., paediatric inpatient and paediatric community settings). 2011 figures in the data summary are based on complete data from all 14 BIRPs across all 5 care settings. 2012 figures in the data summary are based on complete data from 13 BIRP units and adult inpatient data only from the remaining BIRP.
0
200
400
600
800
1000
1200
New Admission Readmission New Admission Readmission New Admission Readmission
CY 10 CY 11 CY 12
Admission by SOC and Admission Type
INPATIENT TLU COMMUNITY PAEDS Paed_Inp Paed_Com
SOC New Admission Readmission New Admission Readmission New Admission ReadmissionAdult Inpatient 161 (15.9%) 1 (.4%) 124 (11.7%) 5 (1.4%) 147 (12.7%) 8 (2.4%)TLU 49 (4.8%) 21 (9.1%) 73 (6.9%) 35 (9.9%) 69 (6.0%) 24 (7.3%)Adult Community 552 (54.4%) 132 (57.1%) 539 (50.9%) 141 (40.1%) 547 (47.2%) 121 (37.0%)PAEDS 252 (24.9%) 77 (33.3%)Paediatric Inpatient 173 (16.4%) 80 (22.7%) 219 (18.9%) 89 (27.2%)Paediatric Community 149 (14.1%) 91 (25.9%) 176 (15.2%) 85 (26.0%)Total 1014 (100.0%) 231 (100.0%) 1058 (100.0%) 352 (100.0%) 1158 (100.0%) 327 (100.0%)
CY 10 CY 11 CY 12

A D M I S S I O N S
Page 36
The following charts present the time elapsed since injury to admission for each setting of care. Only new admissions are included.
Chart 5.3.A – Time Elapsed between Injury and EOC Start for Adult Inpatient (New Admissions only)
Chart 5.3.A shows that the time elapsed between injury and start of an episode of care in the BIRP adult inpatient setting. Over the years, a high percentage of clients were admitted within a 3 month period – 87% in 2010, 94.3% in 2011 and 90.5% in 2012. This reflects the practice of early referrals to adult inpatient BIRPs.
0.0%
10.0%
20.0%
30.0%
40.0%
50.0%
60.0%
70.0%
80.0%
90.0%
100.0%
CY 10 CY 11 CY 12
Injury to Admission - Adult Inpatient
<1 Month 1-3 Months 3-6 Months >6 Months DOI Unknown
Time Elapsed CY 10 CY 11 CY 12<1 Month 34.8% (56) 25.8% (32) 27.2% (40)1-3 Months 52.2% (84) 68.5% (85) 63.3% (93)3-6 Months 5.6% (9) 4.0% (5) 4.8% (7)>6 Months 6.2% (10) 1.6% (2) 2.7% (4)DOI Unknown 1.2% (2) .0% (0) 2.0% (3)Total 100% (161) 100% (124) 100% (147)
A D M I S S I O N S
Page 37
Chart 5.3.B – Time Elapsed between Injury and EOC Start for TLU (New Admissions only)
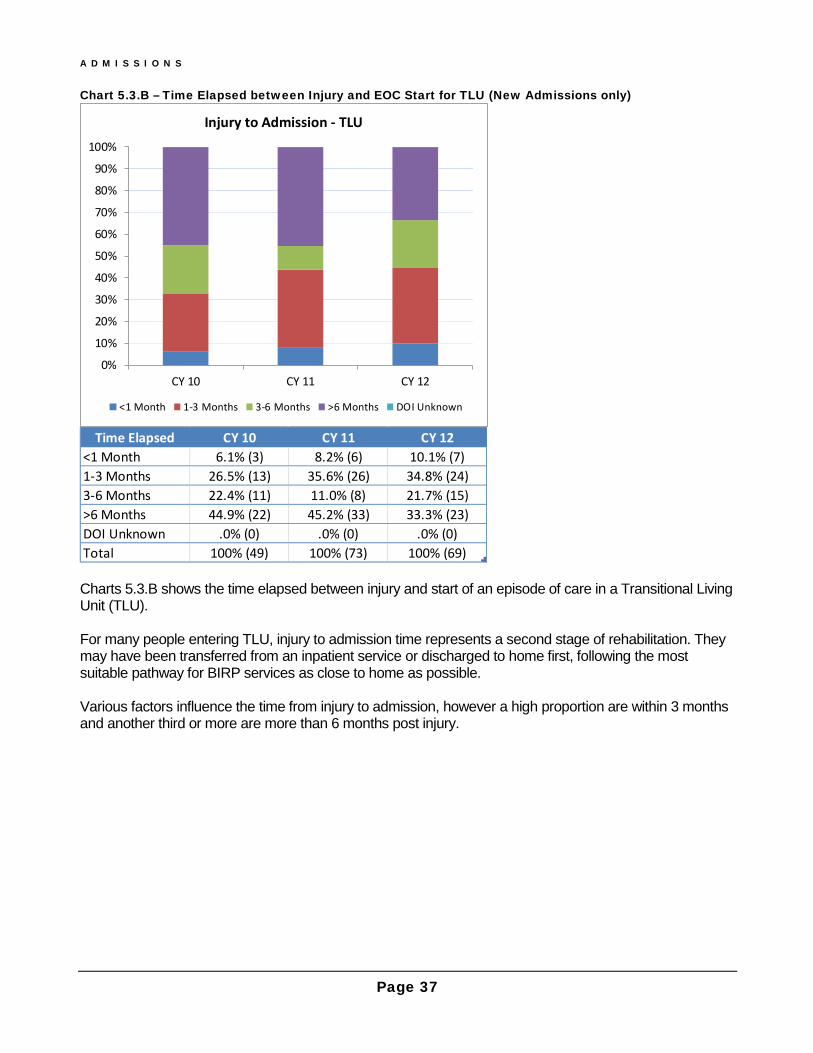
Charts 5.3.B shows the time elapsed between injury and start of an episode of care in a Transitional Living Unit (TLU). For many people entering TLU, injury to admission time represents a second stage of rehabilitation. They may have been transferred from an inpatient service or discharged to home first, following the most suitable pathway for BIRP services as close to home as possible. Various factors influence the time from injury to admission, however a high proportion are within 3 months and another third or more are more than 6 months post injury.
0%
10%
20%
30%
40%
50%
60%
70%
80%
90%
100%
CY 10 CY 11 CY 12
Injury to Admission - TLU
<1 Month 1-3 Months 3-6 Months >6 Months DOI Unknown
Time Elapsed CY 10 CY 11 CY 12<1 Month 6.1% (3) 8.2% (6) 10.1% (7)1-3 Months 26.5% (13) 35.6% (26) 34.8% (24)3-6 Months 22.4% (11) 11.0% (8) 21.7% (15)>6 Months 44.9% (22) 45.2% (33) 33.3% (23)DOI Unknown .0% (0) .0% (0) .0% (0)Total 100% (49) 100% (73) 100% (69)
A D M I S S I O N S
Page 38
Chart 5.3.C – Time Elapsed since Injury to EOC Start - Adult Community (New Admissions only)
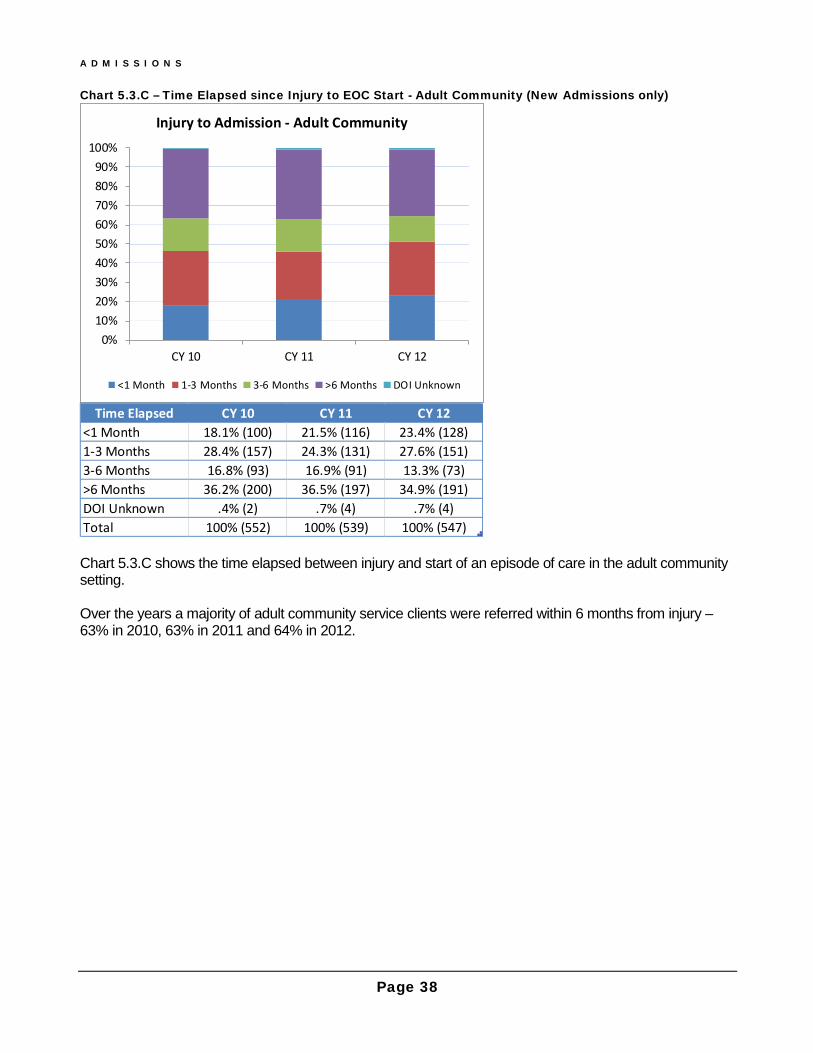
Chart 5.3.C shows the time elapsed between injury and start of an episode of care in the adult community setting. Over the years a majority of adult community service clients were referred within 6 months from injury – 63% in 2010, 63% in 2011 and 64% in 2012.
0%10%20%30%40%50%60%70%80%90%
100%
CY 10 CY 11 CY 12
Injury to Admission - Adult Community
<1 Month 1-3 Months 3-6 Months >6 Months DOI Unknown
Time Elapsed CY 10 CY 11 CY 12<1 Month 18.1% (100) 21.5% (116) 23.4% (128)1-3 Months 28.4% (157) 24.3% (131) 27.6% (151)3-6 Months 16.8% (93) 16.9% (91) 13.3% (73)>6 Months 36.2% (200) 36.5% (197) 34.9% (191)DOI Unknown .4% (2) .7% (4) .7% (4)Total 100% (552) 100% (539) 100% (547)

A D M I S S I O N S
Page 39
Chart 5.3.D – Time Elapsed between Injury and EOC Start for Paediatric Inpatient (New Admissions only)
Chart 5.3.D shows the time elapsed between injury and start of a paediatric inpatient episode of care. It does not present the 2010 data as it is incomparable to the other years for the reason stated at the beginning of this section. A very high percentage of children were admitted within a month of injury in 2011 and 2012 – 93% and 89%, respectively.
0%10%20%30%40%50%60%70%80%90%
100%
CY 11 CY 12
Injury to Admission - Paeds Inpatient
<1 Month 1-3 Months 3-6 Months
>6 Months DOI Unknown
Time Elapsed CY 11 CY 12<1 Month 93.1% (161) 88.6% (194)1-3 Months 2.9% (5) 2.7% (6)3-6 Months 1.2% (2) .9% (2)>6 Months .6% (1) 1.4% (3)DOI Unknown 2.3% (4) 6.4% (14)Total 100% (173) 100% (219)
A D M I S S I O N S
Page 40
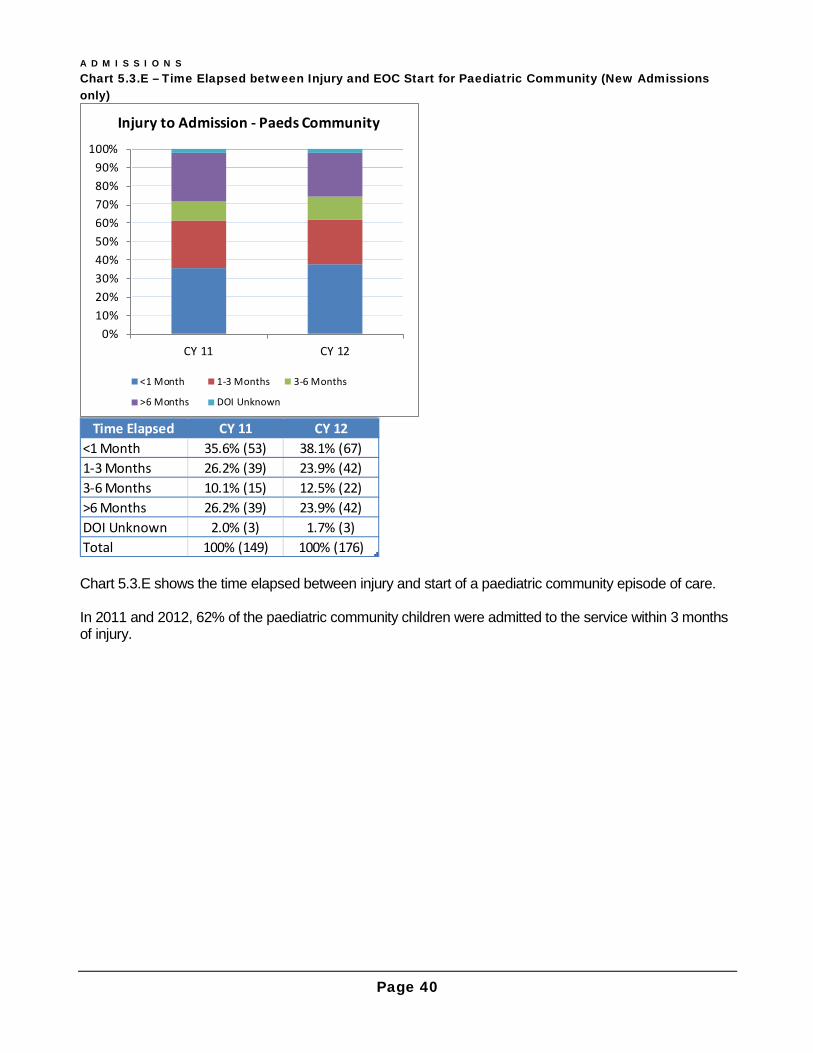
Chart 5.3.E – Time Elapsed between Injury and EOC Start for Paediatric Community (New Admissions only)
Chart 5.3.E shows the time elapsed between injury and start of a paediatric community episode of care. In 2011 and 2012, 62% of the paediatric community children were admitted to the service within 3 months of injury.
0%10%20%30%40%50%60%70%80%90%
100%
CY 11 CY 12
Injury to Admission - Paeds Community
<1 Month 1-3 Months 3-6 Months
>6 Months DOI Unknown
Time Elapsed CY 11 CY 12<1 Month 35.6% (53) 38.1% (67)1-3 Months 26.2% (39) 23.9% (42)3-6 Months 10.1% (15) 12.5% (22)>6 Months 26.2% (39) 23.9% (42)DOI Unknown 2.0% (3) 1.7% (3)Total 100% (149) 100% (176)

Page 41
Section 6 Episode of Care - Length This section presents distribution of Episode of care (EOC) length (duration) by setting of care – Adult Inpatient, Transitional Living (TLU), Adult Community, Paediatric Inpatient and Paediatric Community. It is not unexpected to find more of shorter episodes of care, <3 months in the inpatient and TLU settings and more varied length of episodes of care in the Community. This report does not include paediatric EOC length data reported in the previous 2010 BIRD Report. The 2010 paediatric EOC length data was aggregated for a combined single setting of care and therefore not comparable to the data aggregated for 2011 and 2012 reports for two separate paediatric settings of care (i.e. “Paediatric Inpatient’ and ‘Paediatric Community’). Chart 6.1.A – EOC Length: Adult Inpatient
Chart 6.1.A shows that the majority of adult inpatients were discharged within 3 months of their admission but a very small number of people stayed longer than 12 months.
0%
10%
20%
30%
40%
50%
60%
70%
80%
90%
100%
CY 10 CY 11 CY 12
EOC Length - Adult Inpatient
<29 Days 29-90 Days 91-183 Days 184-365 Days >365 Days
EOC Length CY 10 CY 11 CY 12<29 Days 37.3% (57) 31.3% (40) 26.0% (40)29-90 Days 39.2% (60) 36.7% (47) 41.6% (64)91-183 Days 15.7% (24) 14.1% (18) 22.7% (35)184-365 Days 7.2% (11) 11.7% (15) 3.9% (6)>365 Days .7% (1) 6.3% (8) 5.8% (9)Total 100.0% (153) 100.0% (128) 100.0% (154)
E O C L E N G T H
Page 42
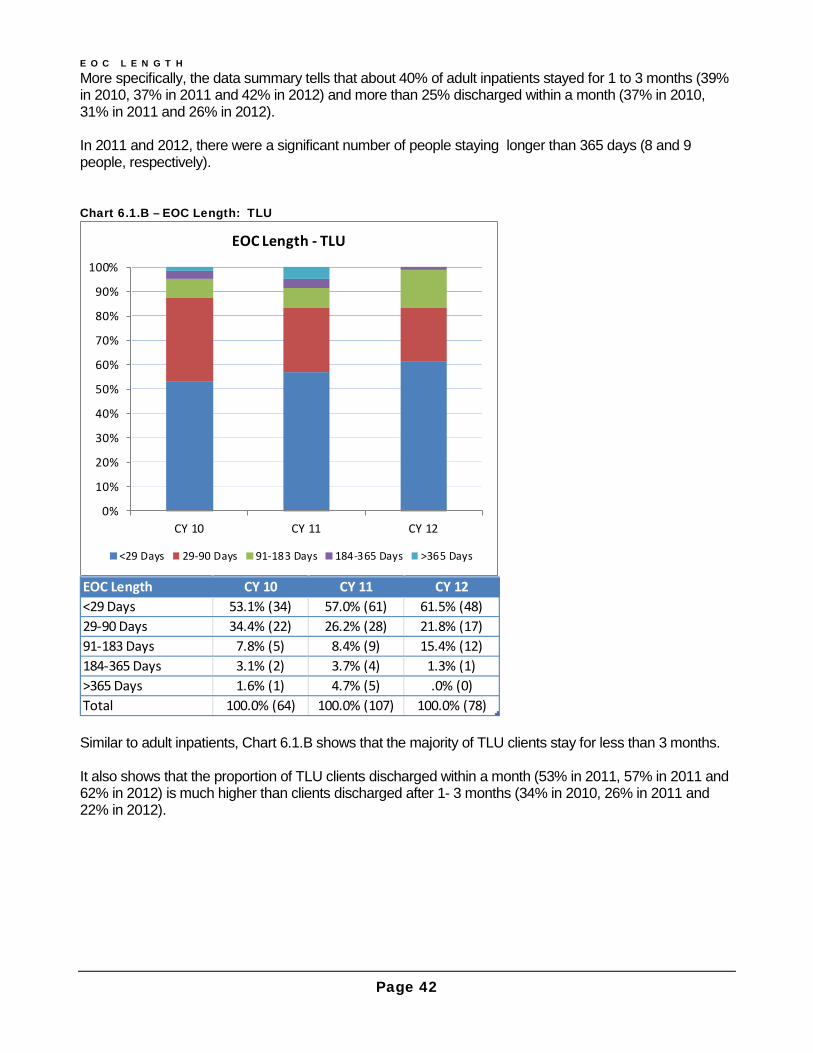
More specifically, the data summary tells that about 40% of adult inpatients stayed for 1 to 3 months (39% in 2010, 37% in 2011 and 42% in 2012) and more than 25% discharged within a month (37% in 2010, 31% in 2011 and 26% in 2012). In 2011 and 2012, there were a significant number of people staying longer than 365 days (8 and 9 people, respectively). Chart 6.1.B – EOC Length: TLU
Similar to adult inpatients, Chart 6.1.B shows that the majority of TLU clients stay for less than 3 months. It also shows that the proportion of TLU clients discharged within a month (53% in 2011, 57% in 2011 and 62% in 2012) is much higher than clients discharged after 1- 3 months (34% in 2010, 26% in 2011 and 22% in 2012).
0%
10%
20%
30%
40%
50%
60%
70%
80%
90%
100%
CY 10 CY 11 CY 12
EOC Length - TLU
<29 Days 29-90 Days 91-183 Days 184-365 Days >365 Days
EOC Length CY 10 CY 11 CY 12<29 Days 53.1% (34) 57.0% (61) 61.5% (48)29-90 Days 34.4% (22) 26.2% (28) 21.8% (17)91-183 Days 7.8% (5) 8.4% (9) 15.4% (12)184-365 Days 3.1% (2) 3.7% (4) 1.3% (1)>365 Days 1.6% (1) 4.7% (5) .0% (0)Total 100.0% (64) 100.0% (107) 100.0% (78)
E O C L E N G T H
Page 43
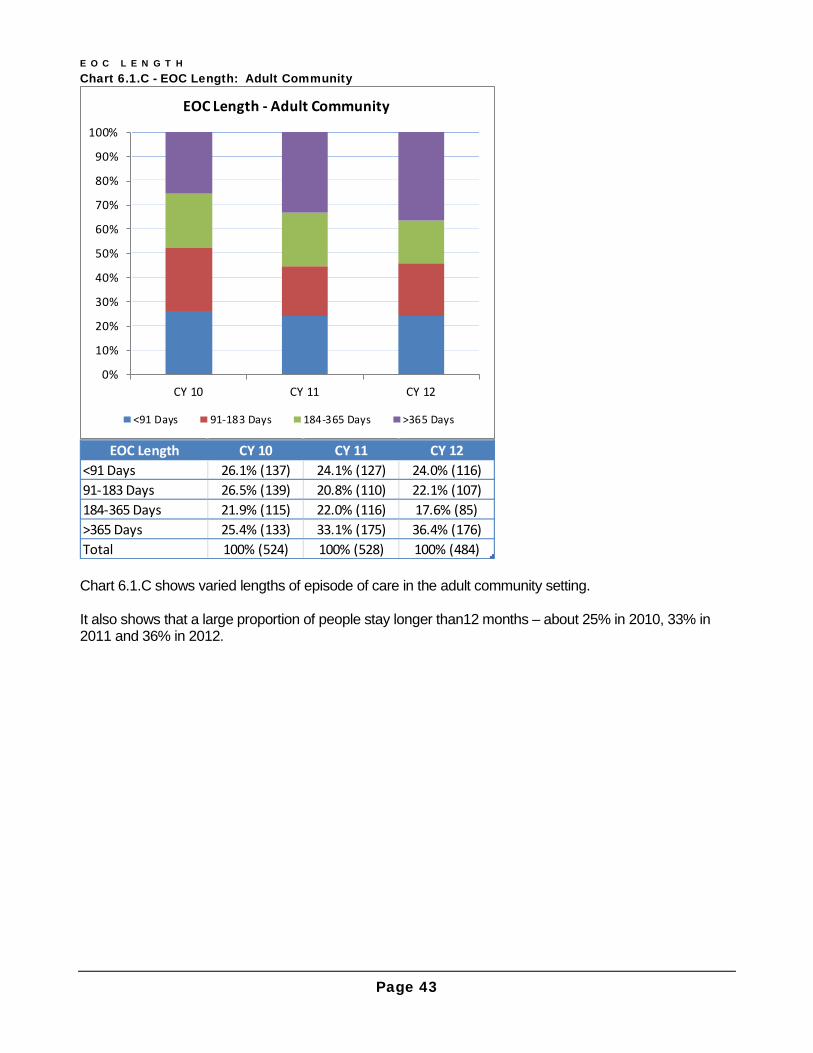
Chart 6.1.C - EOC Length: Adult Community
Chart 6.1.C shows varied lengths of episode of care in the adult community setting. It also shows that a large proportion of people stay longer than12 months – about 25% in 2010, 33% in 2011 and 36% in 2012.
0%
10%
20%
30%
40%
50%
60%
70%
80%
90%
100%
CY 10 CY 11 CY 12
EOC Length - Adult Community
<91 Days 91-183 Days 184-365 Days >365 Days
EOC Length CY 10 CY 11 CY 12<91 Days 26.1% (137) 24.1% (127) 24.0% (116)91-183 Days 26.5% (139) 20.8% (110) 22.1% (107)184-365 Days 21.9% (115) 22.0% (116) 17.6% (85)>365 Days 25.4% (133) 33.1% (175) 36.4% (176)Total 100% (524) 100% (528) 100% (484)

E O C L E N G T H
Page 44
Chart 6.1.D - EOC Length: Paediatric inpatient
Chart 6.1D shows that almost 90% of paediatric inpatients stayed in hospital less than 30 days and 60% remained in hospital for less than one week. This data accurately reflects the shorter length of stay for the paediatric population as they receive in reach services during acute care and are typically discharged to the care of parents.
0%
10%
20%
30%
40%
50%
60%
70%
80%
90%
100%
CY 11 CY 12
EOC Length - Paeds Inpatient
<7 Days 7-29 Days 30-90 Days91-183 Days 184-365 Days >365 Days
EOC Length CY 11 CY 12<7 Days 61.4% (153) 59.6% (174)7-29 Days 27.3% (68) 29.1% (85)30-90 Days 7.6% (19) 8.9% (26)91-183 Days 2.4% (6) 1.4% (4)184-365 Days 1.2% (3) .0% (0)>365 Days .0% (0) 1.0% (3)Total 100.0% (249) 100.0% (292)
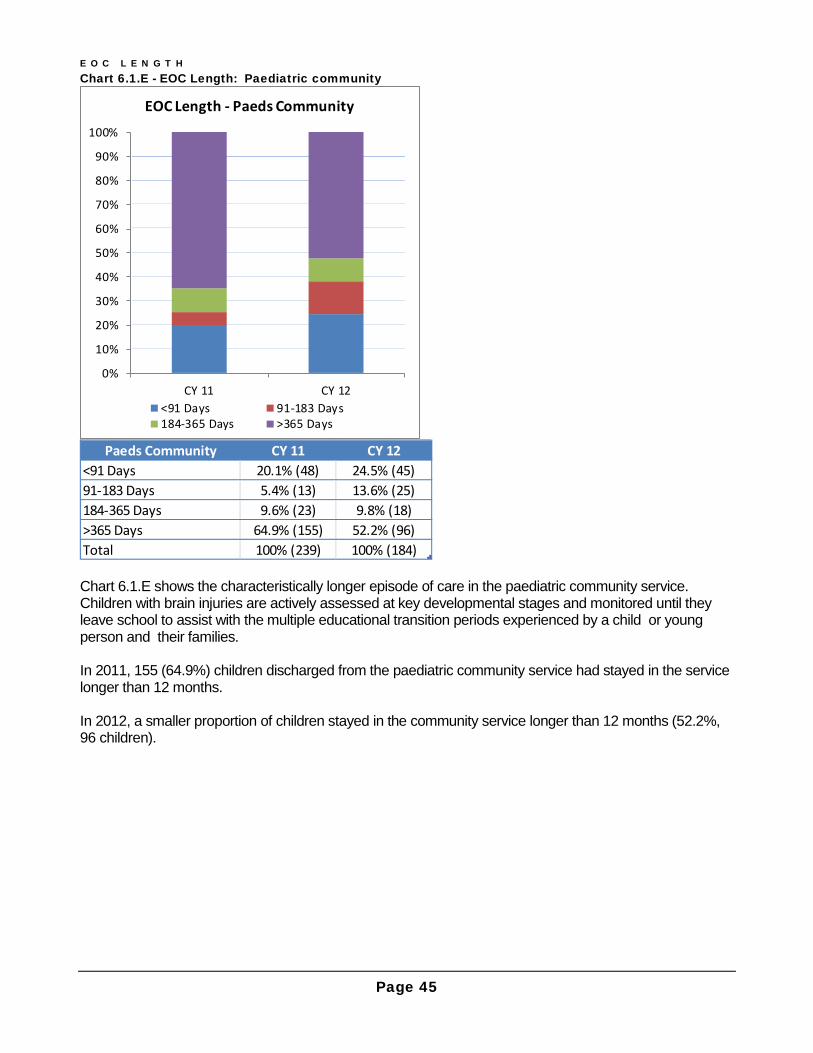
E O C L E N G T H
Page 45
Chart 6.1.E - EOC Length: Paediatric community
Chart 6.1.E shows the characteristically longer episode of care in the paediatric community service. Children with brain injuries are actively assessed at key developmental stages and monitored until they leave school to assist with the multiple educational transition periods experienced by a child or young person and their families. In 2011, 155 (64.9%) children discharged from the paediatric community service had stayed in the service longer than 12 months. In 2012, a smaller proportion of children stayed in the community service longer than 12 months (52.2%, 96 children).
0%
10%
20%
30%
40%
50%
60%
70%
80%
90%
100%
CY 11 CY 12
EOC Length - Paeds Community
<91 Days 91-183 Days184-365 Days >365 Days
Paeds Community CY 11 CY 12<91 Days 20.1% (48) 24.5% (45)91-183 Days 5.4% (13) 13.6% (25)184-365 Days 9.6% (23) 9.8% (18)>365 Days 64.9% (155) 52.2% (96)Total 100% (239) 100% (184)
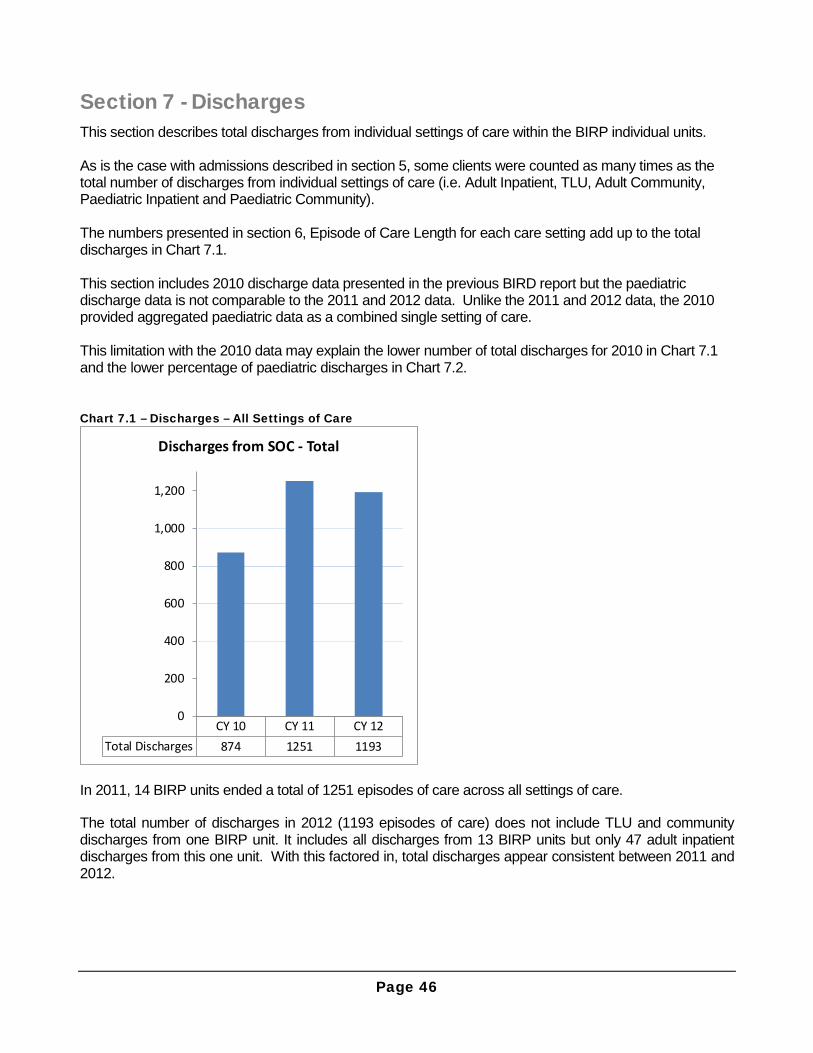
Page 46
Section 7 - Discharges This section describes total discharges from individual settings of care within the BIRP individual units. As is the case with admissions described in section 5, some clients were counted as many times as the total number of discharges from individual settings of care (i.e. Adult Inpatient, TLU, Adult Community, Paediatric Inpatient and Paediatric Community). The numbers presented in section 6, Episode of Care Length for each care setting add up to the total discharges in Chart 7.1. This section includes 2010 discharge data presented in the previous BIRD report but the paediatric discharge data is not comparable to the 2011 and 2012 data. Unlike the 2011 and 2012 data, the 2010 provided aggregated paediatric data as a combined single setting of care. This limitation with the 2010 data may explain the lower number of total discharges for 2010 in Chart 7.1 and the lower percentage of paediatric discharges in Chart 7.2. Chart 7.1 – Discharges – All Settings of Care
In 2011, 14 BIRP units ended a total of 1251 episodes of care across all settings of care.
The total number of discharges in 2012 (1193 episodes of care) does not include TLU and community discharges from one BIRP unit. It includes all discharges from 13 BIRP units but only 47 adult inpatient discharges from this one unit. With this factored in, total discharges appear consistent between 2011 and 2012.
CY 10 CY 11 CY 12Total Discharges 874 1251 1193
0
200
400
600
800
1,000
1,200
Discharges from SOC - Total

D I S C H A R G E S
Page 47
Chart 7.2 presents the number of discharges from each setting of care and its percentage over the total number of discharges for all settings of care. Chart 7.2 – Discharges by Setting of Care
Please note that for the adult inpatient discharges in 2011 and 2012, a rule was consistently applied across the three inpatient units that needed a gap of 14 days before the current episode of care ended and the next one started. If the gap out of the unit did not exceed 14 days, then it was considered to be recommencement of the same rehabilitation episode following suspension and not the end of that episode of care.
0%10%20%30%40%50%60%70%80%90%
100%
CY 10 CY 11 CY 12
Discharges by SOC
Adult Inpatient TLU Adult Community
PAEDS Paeds Inpatient Paeds Community
Setting of Care CY 10 CY 11 CY 12Adult Inpatient 17.5% (153) 10.2% (128) 12.9% (154)TLU 7.3% (64) 8.6% (107) 6.5% (78)Adult Community 60.0% (524) 42.2% (528) 40.7% (485)PAEDS 15.2% (133)Paeds Inpatient 19.9% (249) 24.5% (292)Paeds Community 19.1% (239) 15.4% (184)Total 100% (874) 100% (1251) 100% (1193)

D I S C H A R G E S
Page 48
The following charts 7.3.A to 7.4.C compare type of accommodation at pre-admission and post-discharge for each of the three adult settings of care: Adult Inpatient, TLU and Adult Community. This is a new item being reported for the first time and analysis is limited due to a high proportion of missing data. The aim is reduce the rate of missing data in future reports for accommodation type at admission and discharge across all settings of care. Improvements in missing data have already been achieved with about 30% missing in 2011and under 20% missing in 2012). Due to space restriction, 2011 and 2012 data are presented in separate charts.
Chart 7.3.A – Discharge Accommodation: Inpatient (2011)
Chart 7.3.A shows various types of pre-admission and post-discharge accommodation of adult inpatients discharged in 2011. The green bars denote pre-admission accommodation type and red bars post-discharge accommodation type. The data summary tells that 66.4% of adult inpatients discharged in 2011 were in a private residence prior to the accident and only 43.8% were able to return to a private residence. These numbers were based on 2011 adult inpatient discharge data with more than 30% of missing data (“Not Stated”) for accommodation type.
7.0% 3.1% 1.6% 50.8% 2.3% 35.2%
Accommodation at Discharge - Adult Inpatient
At End of EOC
At Start of EOC
EOC End
Start BIRP TLUAged Care
Facility
Boarding House/Community
HomePrivate
Residence Other Not StatedTotal at EOC
StartBIRP TLU .8% (1) - - - - - .8% (1)Boarding House/Community Home - - .8% (1) .8% (1) - .8% (1) 2.3% (3)Private Residence 5.5% (7) 2.3% (3) .8% (1) 43.8% (56) 1.6% (2) 12.5% (16) 66.4% (85)Other - - - - .8% (1) - .8% (1)Not Stated .8% (1) .8% (1) - 6.3% (8) - 21.9% (28) 29.7% (38)Total at Discharge 7.0% (9) 3.1% (4) 1.6% (2) 50.8% (65) 2.3% (3) 35.2% (45) 100.0% (128)
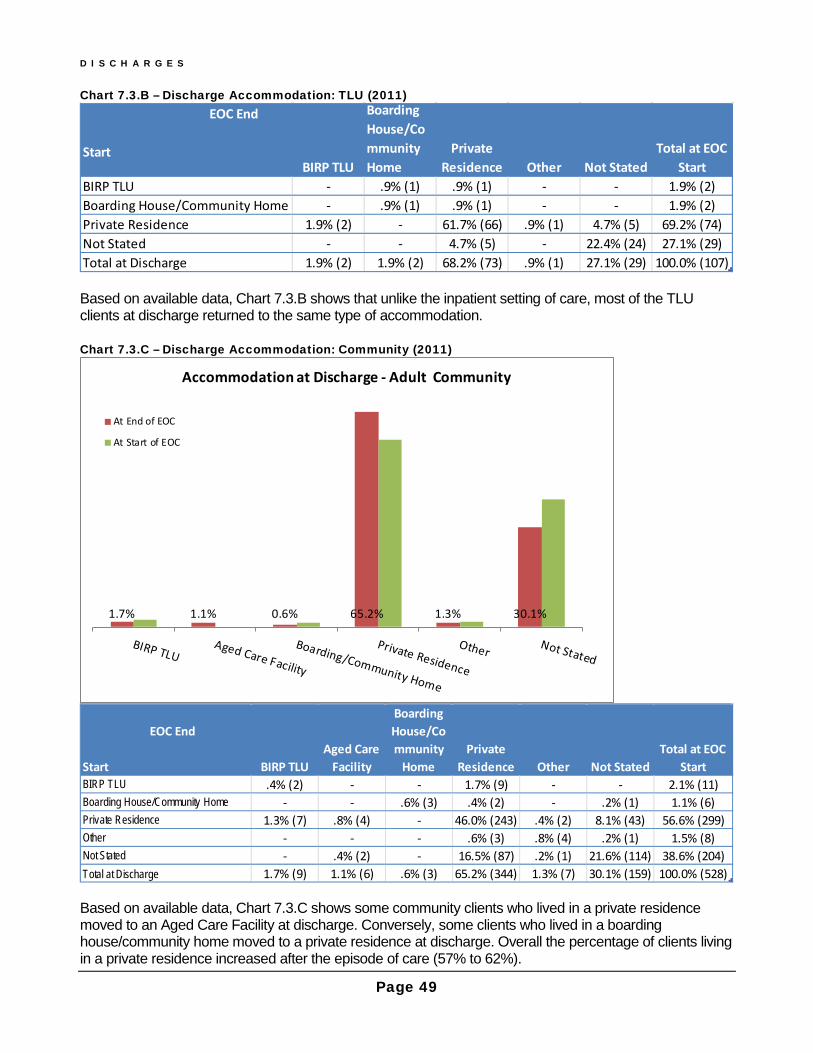
D I S C H A R G E S
Page 49
Chart 7.3.B – Discharge Accommodation: TLU (2011)
Based on available data, Chart 7.3.B shows that unlike the inpatient setting of care, most of the TLU clients at discharge returned to the same type of accommodation. Chart 7.3.C – Discharge Accommodation: Community (2011)
Based on available data, Chart 7.3.C shows some community clients who lived in a private residence moved to an Aged Care Facility at discharge. Conversely, some clients who lived in a boarding house/community home moved to a private residence at discharge. Overall the percentage of clients living in a private residence increased after the episode of care (57% to 62%).
EOC End
StartBIRP TLU
Boarding House/Community Home
Private Residence Other Not Stated
Total at EOC Start
BIRP TLU - .9% (1) .9% (1) - - 1.9% (2)Boarding House/Community Home - .9% (1) .9% (1) - - 1.9% (2)Private Residence 1.9% (2) - 61.7% (66) .9% (1) 4.7% (5) 69.2% (74)Not Stated - - 4.7% (5) - 22.4% (24) 27.1% (29)Total at Discharge 1.9% (2) 1.9% (2) 68.2% (73) .9% (1) 27.1% (29) 100.0% (107)
1.7% 1.1% 0.6% 65.2% 1.3% 30.1%
Accommodation at Discharge - Adult Community
At End of EOC
At Start of EOC
EOC End
Start BIRP TLUAged Care
Facility
Boarding House/Community
HomePrivate
Residence Other Not StatedTotal at EOC
StartBIRP TLU .4% (2) - - 1.7% (9) - - 2.1% (11)Boarding House/Community Home - - .6% (3) .4% (2) - .2% (1) 1.1% (6)Private Residence 1.3% (7) .8% (4) - 46.0% (243) .4% (2) 8.1% (43) 56.6% (299)Other - - - .6% (3) .8% (4) .2% (1) 1.5% (8)Not Stated - .4% (2) - 16.5% (87) .2% (1) 21.6% (114) 38.6% (204)Total at Discharge 1.7% (9) 1.1% (6) .6% (3) 65.2% (344) 1.3% (7) 30.1% (159) 100.0% (528)

D I S C H A R G E S
Page 50
Chart 7.4.A – Discharge Accommodation: Adult Inpatient (2012)
Similar to adult inpatients discharged in 2011, the data summary tells that 66.9% of adult inpatients discharged in 2012 were in a private residence prior to the accident and only 43.5% were able to return to a private residence. With 29% of pre-admission and 13% of post-discharge accommodation data still unavailable for 2012 inpatient discharges, Chart 7.4.A shows that in 2012, at least 60% of inpatients were discharged into a private residence, 9% into a TLU, 5% into an Aged Care Facility, 3% into a boarding house/community group home and 10% into other types of accommodation. To improve the accuracy of information we will seek to reduce the rate of missing data in the future reports.
9.1% 4.5% 3.9% 59.7% 9.7% 13.0%
Accommodation at Discharge - Adult Inpatient
At End of EOC
At Start of EOC
EOC End
Start BIRP TLUAged Care
Facility
Boarding House/Community
HomePrivate
Residence Other Not StatedTotal at EOC
StartBoarding House/Community Home .6% (1) - 1.3% (2) .6% (1) - - 2.6% (4)Private Residence 7.8% (12) 4.5% (7) .6% (1) 43.5% (67) 8.4% (13) 1.9% (3) 66.9% (103)Aged Care Facility - - 1.3% (2) - - - 1.3% (2)Other - - - - .6% (1) - .6% (1)Not Stated .6% (1) - .6% (1) 15.6% (24) .6% (1) 11.0% (17) 28.6% (44)Total at Discharge 9.1% (14) 4.5% (7) 3.9% (6) 59.7% (92) 9.7% (15) 13.0% (20) 100.0% (154)

D I S C H A R G E S
Page 51
Chart 7.4.B – Discharge Accommodation: TLU (2012)
For TLU clients discharged in 2012, the trend seems consistent with 2011 except for the reduced portion of missing data (27% to 19% for both pre-admission and post-discharge data). The trend was that unlike the inpatient setting of care, most of the TLU clients at discharge returned to the same type of pre injury accommodation.
1.3% 1.3%
73.1%
5.1%
19.2%
Accommodation at Discharge - TLU
At End of EOC At Start of EOC
EOC End
Start BIRP TLU
Boarding House/Community
HomePrivate
Residence Other Not StatedTotal at EOC
StartBIRP TLU - - 1.3% (1) - - 1.3% (1)Boarding House/Community Home - 1.3% (1) - - - 1.3% (1)Private Residence 1.3% (1) - 69.2% (54) 3.8% (3) 1.3% (1) 75.6% (59)Other - - 2.6% (2) 1.3% (1) - 3.8% (3)Not Stated - - - - 17.9% (14) 17.9% (14)Total at Discharge 1.3% (1) 1.3% (1) 73.1% (57) 5.1% (4) 19.2% (15) 100.0% (78)

D I S C H A R G E S
Page 52
Chart 7.4.C – Discharge Accommodation: Community (2012)
The proportion of available data increased for 2012 discharges for the community setting of care with 17% and 18% missing data for pre-admission and post-discharge, respectively. As expected of community clients, there hardly shows any difference between pre-admission and post-discharge in the proportion of clients living in a private residence. However, as shown in the data summary table, a small proportion of clients move from a private residence to other types of accommodation at discharge (76.7% clients living in a private residence at start of EOC and 63.7% clients staying in the same type of accommodation).
3.1% 0.4% 0.8% 75.1% 2.5% 18.1%
Accommodation at Discharge - Adult Community
At End of EOC
At Start of EOC
EOC End
Start BIRP TLUAged Care
Facility
Boarding House/Community
HomePrivate
Residence Other Not StatedTotal at EOC
StartBIRP TLU .4% (2) - - 2.9% (14) .2% (1) - 3.5% (17)Boarding House/Community Home - - .4% (2) .6% (3) .2% (1) - 1.2% (6)Private Residence 2.5% (12) .2% (1) - 63.7% (309) 1.9% (9) 8.5% (41) 76.7% (372)Aged Care Facility - .2% (1) - - .2% (1) .2% (1) .6% (3)Other .2% (1) - - .4% (2) - .2% (1) .8% (4)Not Stated - - .4% (2) 7.4% (36) - 9.3% (45) 17.1% (83)Total at Discharge 3.1% (15) .4% (2) .8% (4) 75.1% (364) 2.5% (12) 18.1% (88) 100.0% (485)

Page 53
Section 8 – NSW BIRP Total Clients For the first time the BIRD Report includes the total caseload of BIRP services by counting both the clients admitted and discharged in the same year and clients who were neither admitted nor discharged in the reporting year. For the purpose of these reports, the latter are called ‘continuing or registered clients’. Continuing clients will have a range of injury dates, be involved in different settings of care and receive differing levels of rehabilitation program intensity. The combination of clients admitted or discharged in the calendar year with the continuing clients provides the total client numbers for all included BIRP services for that calendar year. Chart 8 – Total Clients of BIRP Services
Chart 8 provides the number of total distinct clients either admitted or discharged in the calendar year and the number of ‘continuing clients’ in the respective calendar year. In the 2011 calendar year, there were a total of 3,266 BIRP clients in the 14 BIRPs consisting of 1,609 distinct clients that were either admitted to or discharged from an episode of care and an additional 1657 continuing clients. In the same way in 2012 there were a total of 3,322 clients in the 13 BIRPs. 1563 clients were either admitted or discharged, with an additional 1759 continuing clients for the year. BIRD will seek to better understand ‘continuing’ clients by exploring available data and including this information in future reports.
CY11 (14 units) CY12 (13 units)Registered 1657 1759Admitted orDischarged 1609 1563
3266 3322
0
500
1000
1500
2000
2500
3000
3500
Total Clients of BIRP Services

Page 54
Section 9 – Inpatient Outcomes This section presents adult inpatient outcomes for 2011 and 2012 in terms of admission and discharge FIM scores from the three adult Inpatient BIRP units for 126 episodes of care that ended in 2011 and 153 episodes of care that ended in 2012. Chart 9.1.A – Summary of FIM Scores
Chart 9.1.A shows average and median scores of cognitive, motor and the total FIM scores. Chart 9.1.B graphically shows the mean increase of cognitive and motor scores at discharge. Chart 9.1.B – Mean FIM Scores
The score of cognitive skills improved on average by more than 5 points (29%) in 2011 and by 6.5 points (41%) in 2012. For motor skills, the score increased on average by more than 22 points (43%) in 2011 and by 25 points in (51%) 2012. Overall, the pattern of Admission and Discharge FIMs across the 2 years is similar. Clients admitted to the BIRP Adult Inpatient setting of care improve in the motor and cognitive domains during their rehabilitation between admission and discharge.
Scores Stats Admission Discharge Admission DischargeCognitive Mean 17.0 23.2 15.8 22.3
Median 19 25 16 24Motor Mean 50.6 73.2 48.6 73.8
Median 56.5 85.5 53 85Total FIM Mean 67.6 96.5 64.5 96.1
Median 75.5 111 68 107
CY 11 CY 12
Admission Discharge Admission DischargeUnits Total Units Total
2011 2012Cognitive 17.0 23.2 15.8 22.3Motor 50.6 73.2 48.6 73.8FIM Total 67.6 96.5 64.5 96.1
0.0
20.0
40.0
60.0
80.0
100.0
120.0
Mean FIM Scores
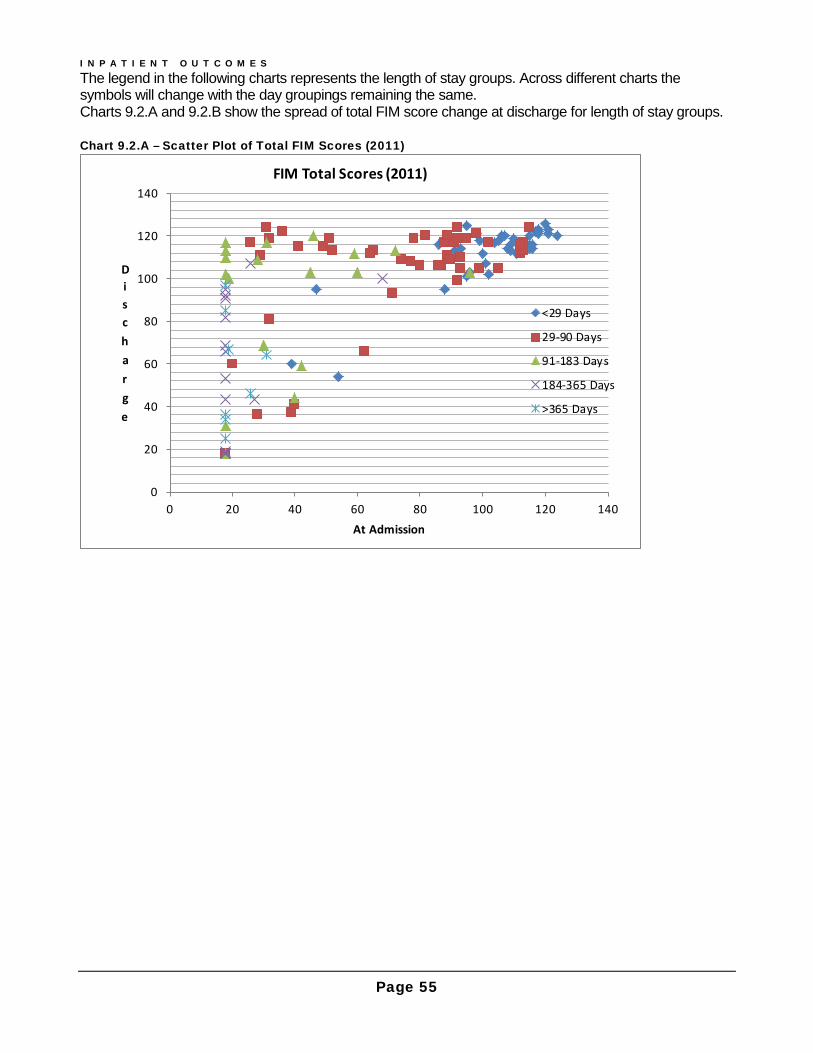
I N P A T I E N T O U T C O M E S
Page 55
The legend in the following charts represents the length of stay groups. Across different charts the symbols will change with the day groupings remaining the same. Charts 9.2.A and 9.2.B show the spread of total FIM score change at discharge for length of stay groups. Chart 9.2.A – Scatter Plot of Total FIM Scores (2011)
0
20
40
60
80
100
120
140
0 20 40 60 80 100 120 140
Discharge
At Admission
FIM Total Scores (2011)
<29 Days
29-90 Days
91-183 Days
184-365 Days
>365 Days

I N P A T I E N T O U T C O M E S
Page 56
Chart 9.2.B – Scatter Plot of Total FIM Scores (2012)
Charts 9.2.A &B show that people with the longest length of stay (LOS) generally arrive with the lowest total FIM scores. People arriving with mid-range or higher total FIM scores tend to have shorter LOS. Some people who arrive with the lowest possible total FIM scores achieve a substantial change during their rehabilitation although they tend to stay the longest. The following 9.3.charts show the spread of FIM score changes at discharge for length of stay groups for the cognitive and motor domains, respectively.
0
20
40
60
80
100
120
140
0 20 40 60 80 100 120 140
Discharge
At Admission
FIM Total Scores (2012)
< 29 Days
29-90 Days
91-183 Days
184-365 Days
>365 Days
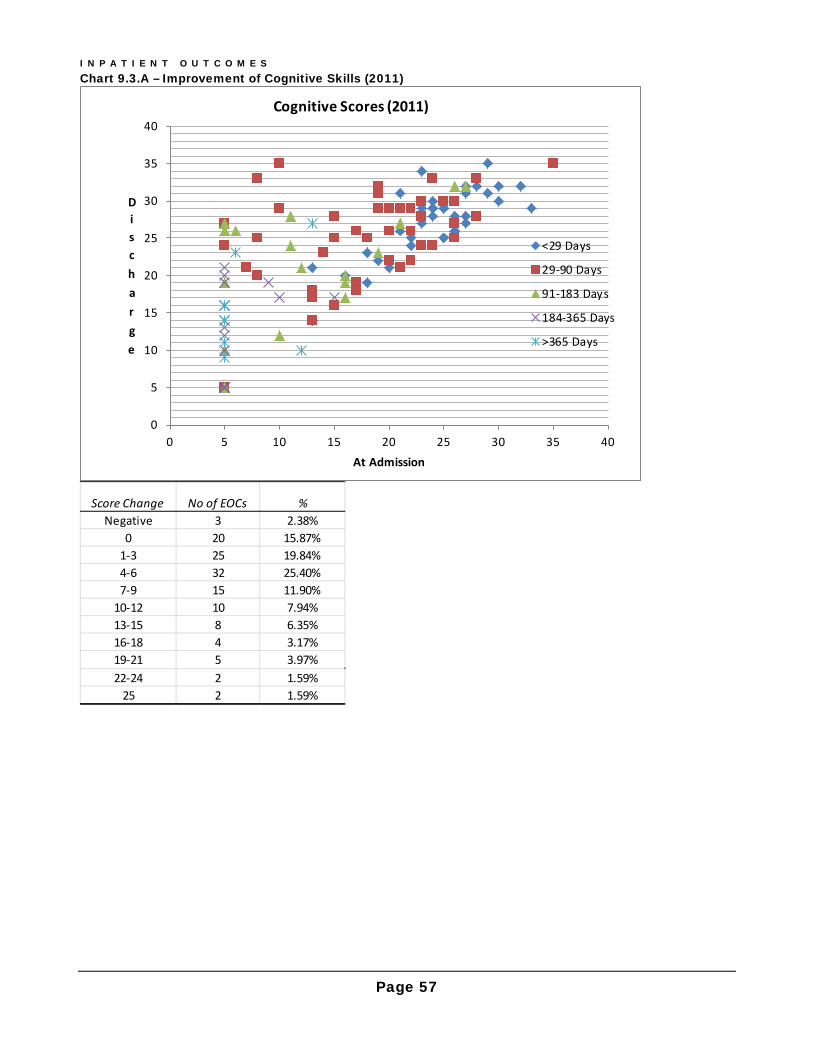
I N P A T I E N T O U T C O M E S
Page 57
Chart 9.3.A – Improvement of Cognitive Skills (2011)
0
5
10
15
20
25
30
35
40
0 5 10 15 20 25 30 35 40
Discharge
At Admission
Cognitive Scores (2011)
<29 Days
29-90 Days
91-183 Days
184-365 Days
>365 Days
Score Change No of EOCs %Negative 3 2.38%
0 20 15.87%1-3 25 19.84%4-6 32 25.40%7-9 15 11.90%
10-12 10 7.94%13-15 8 6.35%16-18 4 3.17%19-21 5 3.97%22-24 2 1.59%
25 2 1.59%
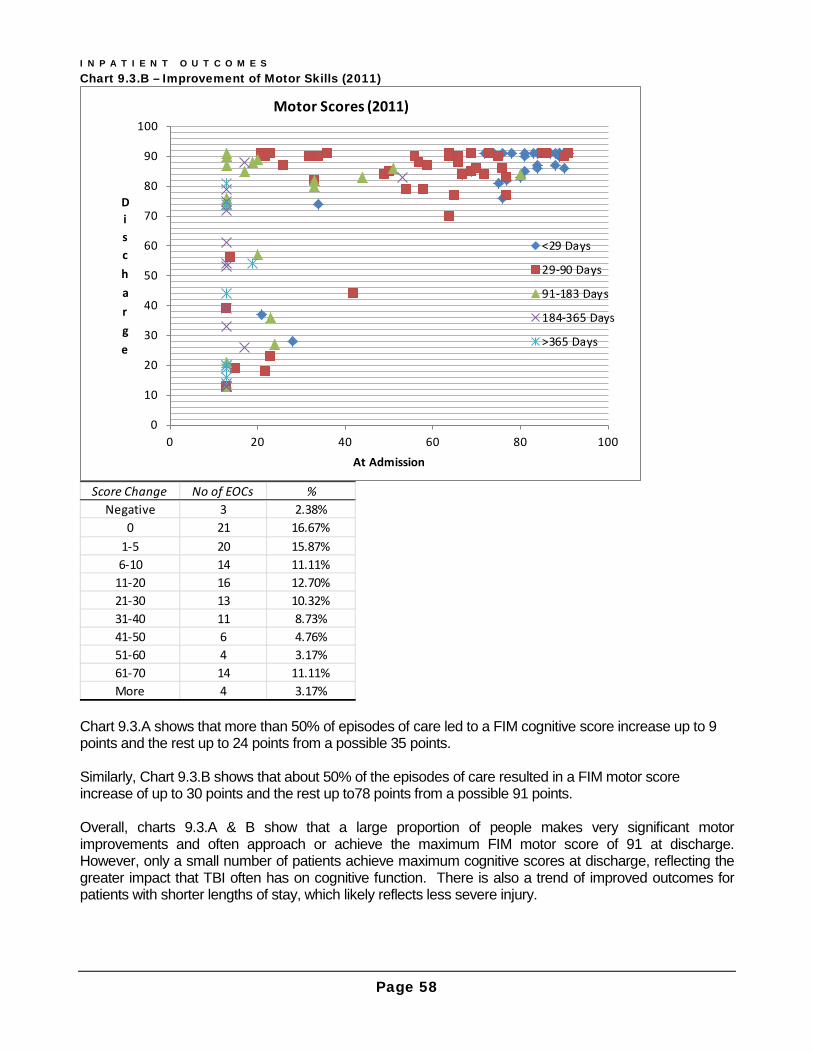
I N P A T I E N T O U T C O M E S
Page 58
Chart 9.3.B – Improvement of Motor Skills (2011)
Chart 9.3.A shows that more than 50% of episodes of care led to a FIM cognitive score increase up to 9 points and the rest up to 24 points from a possible 35 points. Similarly, Chart 9.3.B shows that about 50% of the episodes of care resulted in a FIM motor score increase of up to 30 points and the rest up to78 points from a possible 91 points. Overall, charts 9.3.A & B show that a large proportion of people makes very significant motor improvements and often approach or achieve the maximum FIM motor score of 91 at discharge. However, only a small number of patients achieve maximum cognitive scores at discharge, reflecting the greater impact that TBI often has on cognitive function. There is also a trend of improved outcomes for patients with shorter lengths of stay, which likely reflects less severe injury.
0
10
20
30
40
50
60
70
80
90
100
0 20 40 60 80 100
Discharge
At Admission
Motor Scores (2011)
<29 Days
29-90 Days
91-183 Days
184-365 Days
>365 Days
Score Change No of EOCs %Negative 3 2.38%
0 21 16.67%1-5 20 15.87%6-10 14 11.11%
11-20 16 12.70%21-30 13 10.32%31-40 11 8.73%41-50 6 4.76%51-60 4 3.17%61-70 14 11.11%More 4 3.17%

I N P A T I E N T O U T C O M E S
Page 59
The following charts 9.4.A & B shows that a similar pattern to 2011 appears to emerge for inpatient episodes of care that ended in 2012. Chart 9.4.A – Improvement of Cognitive Skills (2012)
0
5
10
15
20
25
30
35
40
0 5 10 15 20 25 30 35 40
Discharge
At Admission
Cognitive Scores (2012)
< 29 Days
29-90 Days
91-183 Days
184-365 Days
>365 Days
Score Change No of EOCs %Negative 3 2.0%
0 21 13.7%1-3 37 24.2%4-6 31 20.3%7-9 19 12.4%
10-12 19 12.4%13-15 9 5.9%16-18 7 4.6%19-21 4 2.6%22-24 3 2.0%
25 0 0.0%

I N P A T I E N T O U T C O M E S
Page 60
Chart 9.4.B – Improvement of Motor Skills (2012)
0
10
20
30
40
50
60
70
80
90
100
0 20 40 60 80 100
Discharge
At Admission
Motor Scores (2012)
< 29 Days
29-90 Days
91-183 Days
184-365 Days
>365 Days
Score Change No of EOCs %Negative 4 2.61%
0 21 13.73%1-5 17 11.11%
6-10 11 7.19%11-20 29 18.95%21-30 20 13.07%31-40 10 6.54%41-50 11 7.19%51-60 9 5.88%61-70 12 7.84%More 9 5.88%

I N P A T I E N T O U T C O M E S
Page 61
Chart 9.5.A – Achieved Maximum FIM Scores
In 2011, 3 out of 126 episodes of care achieved the maximum cognitive score, but 33 achieved the maximum motor score. The percentages of patients achieving maximum cognitive and motor scores were similar in 2012. These results demonstrate that cognitive recovery is not as complete as motor recovery following TBI. Chart 9.5.B – Inpatient Rehab Efficiency
The rehabilitation efficiency in Chart 9.5.B, ‘Rehab Efficiency’ was calculated by dividing the average difference in total FIM scores between admission and discharge by average LOS (days) - 0.28 for 2011 and 0.34 for 2012. Rehab Efficiency2 was calculated by dividing the median difference in total FIM scores between admission and discharge by median LOS (days) - 0.71 for 2011 and 0.80 for 2012. These numbers seem low compared with the efficiency the corresponding years of Australian Rehabilitation Outcome Centre (AROC) annual reports present. The reports give for all brain dysfunction, stroke and neurological conditions, the overall efficiency of 0.8, 0.8 and 0.7, respectively. There are a number of reasons why the efficiency scores are different to AROC data so direct comparisons cannot be made. AROC presents mixed diagnostic groups, there are differences with how length of stay (LOS) is determined for the rehabilitation episode and the specialised brain injury units are weighted towards accepting the most complex and severe.
Year Total No of EOC
Cognitive =35 Motor=91 FIM Total =126
2011 126 3 33 12012 153 2 26 0
Year No of EOC Rehab Efficiency
Average FIM Score Difference
Avergae LOS (days)
Rehab Efficiency2
Median FIM Score Difference
Median LOS (days)
2011 126 0.28 28.9 104 0.71 35.5 50.02012 153 0.34 31.6 94 0.80 39.0 49.0

Page 62
Abbreviations 1. MDS/CDS Minimum dataset/clinical data set 2. BIRD Brain Injury Rehabilitation Directorate (ACI network) 3. BIRP NSW Brain Injury Rehabilitation Program 4. EOC: Episode of Care 5. SOC: Setting of Care 6. TLU: A Transitional Living Unit or Program in an adult BIRP 7. TBI: Traumatic Brain Injury 8. Non-TBI: Non- Traumatic Brain Injury 9. PTA: Post Traumatic Amnesia 10. MVA: Motor Vehicle Accident usually involving car/motor bike/truck 11. MVA Related: Includes driver/passenger/paedestrian/cyclist 12. Non-MVA: Traumatic Brain Injury not related to motor vehicle accidents 13. DOI: Date of Injury 14. FIM: Functional Independence Measure
NSW Trauma Hospitals This report refers to the following hospitals as NSW major and regional trauma hospitals, respectively.
Major Trauma HospitalsCANBERRA JOHN HUNTER LIVERPOOL ROYAL NORTH SHORE ROYAL PRINCE ALFRED ST GEORGE ST VINCENT'S WESTMEAD JOHN HUNTER CHILDREN'S CHILDREN'S WESTMEADSYDNEY CHILDREN'S
Regional TraumaGOSFORD HOSPITAL
WOLLONGONG HOSPITALALBURY HOSPITAL
BROKEN HILL HOSPITALCOFFS HARBOUR HOSPITAL
DUBBO HOSPITALGOULBURN HOSPITAL
LISMORE HOSPITALORANGE HOSPITAL
PORT MACQUARIE HOSPITALTAMWORTH HOSPITAL
WAGGA WAGGA HOSPITAL
Related Documents