Cerebral Cortex January 2011;21:56--67 doi:10.1093/cercor/bhq058 Advance Access publication April 9, 2010 Brain Hemispheric Structural Efficiency and Interconnectivity Rightward Asymmetry in Human and Nonhuman Primates Yasser Iturria-Medina 1 , Alejandro Pe´rez Ferna´ndez 2,3 , David M. Morris 4,5 , Erick J. Canales-Rodrı´guez 6,7 , Hamied A. Haroon 4,5 , Lorna Garcı´a Pento´n 2 , Mark Augath 8 , Lı´dice Gala´ n Garcı´a 1 , Nikos Logothetis 4,8 , Geoffrey J. M. Parker 4,5 and Lester Melie-Garcı´a 1 1 Neuroimaging Department, Cuban Neuroscience Center, CP 10 600, La Habana, Cuba, 2 Laboratory of Cognitive Neuroscience, Universidad Diego Portales, 8370076 Santiago, Chile, 3 Centro de Investigacio´n y Desarrollo del Comercio Interior, CID-CI, CP 10 400, La Habana, Cuba, 4 Imaging Science and Biomedical Engineering Research Group, School of Cancer and Imaging Sciences and, 5 Imaging Science and Biomedical Engineering, Biomedical Imaging Institute, University of Manchester, Manchester, M13 9PT, UK, 6 Centro de Investigacio´ n Biome´ dica en Red de Salud Mental (CIBERSam), 28007, Madrid, Spain, 7 Benito Menni Complex Assistencial en Salut Mental, Barcelona 08830, Spain and 8 Physiology of Cognitive Processes Department, Max Planck Institute for Biological Cybernetics, 72076 Tu¨bingen, Germany Address correspondence to Yasser Iturria-Medina, Neuroimaging Department, Cuban Neuroscience Center, Avenida 25, Esquina 158, #15202, Apartado Postal 6648, Cubanaca´n, Playa, Habana 6 CP 10600, Cuba. Email: [email protected]. Evidence for interregional structural asymmetries has been pre- viously reported for brain anatomic regions supporting well- described functional lateralization. Here, we aimed to investigate whether the two brain hemispheres demonstrate dissimilar general structural attributes implying different principles on information flow management. Common left hemisphere/right hemisphere structural network properties are estimated and compared for right-handed healthy human subjects and a nonhuman primate, by means of 3 different diffusion-weighted magnetic resonance imaging fiber tractography algorithms and a graph theory framework. In both the human and the nonhuman primate, the data support the conclusion that, in terms of the graph framework, the right hemisphere is significantly more efficient and interconnected than the left hemisphere, whereas the left hemisphere presents more central or indispensable regions for the whole-brain structural network than the right hemisphere. From our point of view, in terms of functional principles, this pattern could be related with the fact that the left hemisphere has a leading role for highly demanding specific process, such as language and motor actions, which may require dedicated specialized networks, whereas the right hemisphere has a leading role for more general process, such as integration tasks, which may require a more general level of interconnection. Keywords: brain structural network, diffusion-weighted MRI, efficiency, fiber tractography, hemispheric asymmetries, interconnectivity Introduction The interregional structural connectivity asymmetry for left-- right brain hemispheres is an important topic in the study of the neural basis of brain functional asymmetries, contributing to our understanding of the factors that modulate cognitive specialization in the brain. The recent development of diffusion--weighted magnetic resonance imaging (DW-MRI), a noninvasive technique that quantifies water diffusion process, has allowed the acquisition of structural information about the intravoxel axon arrangement, making possible the noninvasive study of the brain anatomical circuitry (Mori et al. 1999; Koch et al. 2002; Parker et al. 2002; Behrens, Johansen-Berg, et al. 2003; Tuch et al. 2003; Hagmann, Kurant, et al. 2006; Iturria- Medina et al. 2007). In that context, structural asymmetries have been explored analyzing mainly the fractional anisotropy (FA), a measure of local fiber coherence (Kubicki et al. 2002; Gong et al. 2005; Powell et al. 2006; Clark et al. 2007; Rodrigo et al. 2007) and the number of, or existence of, connecting paths between specific regions (Parker et al. 2005; Hagmann, Cammoun, et al. 2006; Powell et al. 2006; Glasser and Rilling 2008), contributing to our understanding of cognitive lateral- ized process like language and motor control. These previous interregional studies were focused on identifying which white matter regions and/or connections, corresponding to reported functional lateralization, are more coherent or stronger in one hemisphere than in the other. In other words, to match well-described functional lateralization with the specific white matter structural asymmetries support- ing the function. However, in order to characterize brain structural asymmetry through white matter connections, it is necessary to recognize not only the specific interregional asymmetries in a pairwise manner, which could represent a considerable challenge due to the high number of possible connections, but also the broader structural network asymme- tries between the hemispheres, in order to assess differences in how their anatomical substrates may be configured to facilitate the management and integration of information flow in a more general sense. In this study, we aimed to investigate if, besides the specific regional asymmetries, both hemispheres demonstrate dissimi- lar general structural attributes implying different principles on the management of the information flow. Our analysis is based on a mathematical network framework (Watts and Strogatz 1998; Latora and Marchiori 2001; Onnela et al. 2005; Boccaletti et al. 2006; Costa et al. 2007), allowing us to explore hemispheric differences in terms of quantitative parameters that can be structurally and, by inference, functionally interpreted. Previous brain structural network analyses have used connectivity information obtained from nonhuman post- mortem studies (Sporns and Zwi 2004; Costa and Sporns 2005; Sporns 2006), statistical concurrent change analysis between brain areas in one or more morphological variables (He et al. 2007; Bassett et al. 2008; Chen et al. 2008; He et al. 2008), or DW-MRI techniques (Hagmann, Kurant, et al. 2006; Hagmann et al. 2008; Iturria-Medina et al. 2008; Gong et al. 2009) to investigate large-scale connection patterns of the brain, such as small-world attributes, efficiency, degree distribution, motif composition, and structural core properties. Here, using 3 different tractography algorithms and a graph theory framework, we attempt to estimate white matter interregional Ó The Author 2010. Published by Oxford University Press. All rights reserved. For permissions, please e-mail: [email protected] at University of Manchester on January 27, 2014 http://cercor.oxfordjournals.org/ Downloaded from

Welcome message from author
This document is posted to help you gain knowledge. Please leave a comment to let me know what you think about it! Share it to your friends and learn new things together.
Transcript
Cerebral Cortex January 2011;21:56--67
doi:10.1093/cercor/bhq058
Advance Access publication April 9, 2010
Brain Hemispheric Structural Efficiency and Interconnectivity Rightward Asymmetryin Human and Nonhuman Primates
Yasser Iturria-Medina1, Alejandro Perez Fernandez2,3, David M. Morris4,5, Erick J. Canales-Rodrıguez6,7, Hamied A. Haroon4,5,
Lorna Garcıa Penton2, Mark Augath8, Lıdice Galan Garcıa1, Nikos Logothetis4,8, Geoffrey J. M. Parker4,5 and Lester Melie-Garcıa1
1Neuroimaging Department, Cuban Neuroscience Center, CP 10 600, La Habana, Cuba, 2Laboratory of Cognitive Neuroscience,
Universidad Diego Portales, 8370076 Santiago, Chile, 3Centro de Investigacion y Desarrollo del Comercio Interior, CID-CI, CP 10
400, La Habana, Cuba, 4Imaging Science and Biomedical Engineering Research Group, School of Cancer and Imaging Sciences and,5Imaging Science and Biomedical Engineering, Biomedical Imaging Institute, University of Manchester, Manchester, M13 9PT, UK,6Centro de Investigacion Biomedica en Red de Salud Mental (CIBERSam), 28007, Madrid, Spain, 7Benito Menni Complex Assistencial
en Salut Mental, Barcelona 08830, Spain and 8Physiology of Cognitive Processes Department, Max Planck Institute for Biological
Cybernetics, 72076 Tubingen, Germany
Address correspondence to Yasser Iturria-Medina, Neuroimaging Department, Cuban Neuroscience Center, Avenida 25, Esquina 158, #15202,
Apartado Postal 6648, Cubanacan, Playa, Habana 6 CP 10600, Cuba. Email: [email protected].
Evidence for interregional structural asymmetries has been pre-viously reported for brain anatomic regions supporting well-described functional lateralization. Here, we aimed to investigatewhether the two brain hemispheres demonstrate dissimilar generalstructural attributes implying different principles on information flowmanagement. Common left hemisphere/right hemisphere structuralnetwork properties are estimated and compared for right-handedhealthy human subjects and a nonhuman primate, by means of3 different diffusion-weighted magnetic resonance imaging fibertractography algorithms and a graph theory framework. In both thehuman and the nonhuman primate, the data support the conclusionthat, in terms of the graph framework, the right hemisphere issignificantly more efficient and interconnected than the lefthemisphere, whereas the left hemisphere presents more centralor indispensable regions for the whole-brain structural network thanthe right hemisphere. From our point of view, in terms of functionalprinciples, this pattern could be related with the fact that the lefthemisphere has a leading role for highly demanding specificprocess, such as language and motor actions, which may requirededicated specialized networks, whereas the right hemisphere hasa leading role for more general process, such as integration tasks,which may require a more general level of interconnection.
Keywords: brain structural network, diffusion-weighted MRI, efficiency,fiber tractography, hemispheric asymmetries, interconnectivity
Introduction
The interregional structural connectivity asymmetry for left--
right brain hemispheres is an important topic in the study of
the neural basis of brain functional asymmetries, contributing
to our understanding of the factors that modulate cognitive
specialization in the brain. The recent development of
diffusion--weighted magnetic resonance imaging (DW-MRI),
a noninvasive technique that quantifies water diffusion process,
has allowed the acquisition of structural information about the
intravoxel axon arrangement, making possible the noninvasive
study of the brain anatomical circuitry (Mori et al. 1999; Koch
et al. 2002; Parker et al. 2002; Behrens, Johansen-Berg, et al.
2003; Tuch et al. 2003; Hagmann, Kurant, et al. 2006; Iturria-
Medina et al. 2007). In that context, structural asymmetries
have been explored analyzing mainly the fractional anisotropy
(FA), a measure of local fiber coherence (Kubicki et al. 2002;
Gong et al. 2005; Powell et al. 2006; Clark et al. 2007; Rodrigo
et al. 2007) and the number of, or existence of, connecting
paths between specific regions (Parker et al. 2005; Hagmann,
Cammoun, et al. 2006; Powell et al. 2006; Glasser and Rilling
2008), contributing to our understanding of cognitive lateral-
ized process like language and motor control.
These previous interregional studies were focused on
identifying which white matter regions and/or connections,
corresponding to reported functional lateralization, are more
coherent or stronger in one hemisphere than in the other. In
other words, to match well-described functional lateralization
with the specific white matter structural asymmetries support-
ing the function. However, in order to characterize brain
structural asymmetry through white matter connections, it is
necessary to recognize not only the specific interregional
asymmetries in a pairwise manner, which could represent
a considerable challenge due to the high number of possible
connections, but also the broader structural network asymme-
tries between the hemispheres, in order to assess differences in
how their anatomical substrates may be configured to facilitate
the management and integration of information flow in a more
general sense.
In this study, we aimed to investigate if, besides the specific
regional asymmetries, both hemispheres demonstrate dissimi-
lar general structural attributes implying different principles on
the management of the information flow. Our analysis is based
on a mathematical network framework (Watts and Strogatz
1998; Latora and Marchiori 2001; Onnela et al. 2005; Boccaletti
et al. 2006; Costa et al. 2007), allowing us to explore
hemispheric differences in terms of quantitative parameters
that can be structurally and, by inference, functionally
interpreted. Previous brain structural network analyses have
used connectivity information obtained from nonhuman post-
mortem studies (Sporns and Zwi 2004; Costa and Sporns 2005;
Sporns 2006), statistical concurrent change analysis between
brain areas in one or more morphological variables (He et al.
2007; Bassett et al. 2008; Chen et al. 2008; He et al. 2008), or
DW-MRI techniques (Hagmann, Kurant, et al. 2006; Hagmann
et al. 2008; Iturria-Medina et al. 2008; Gong et al. 2009) to
investigate large-scale connection patterns of the brain, such as
small-world attributes, efficiency, degree distribution, motif
composition, and structural core properties. Here, using
3 different tractography algorithms and a graph theory
framework, we attempt to estimate white matter interregional
� The Author 2010. Published by Oxford University Press. All rights reserved.
For permissions, please e-mail: [email protected]
at University of M
anchester on January 27, 2014http://cercor.oxfordjournals.org/
Dow
nloaded from

axonal pathways and to infer left and right common anatomical
network properties, obtaining global and local measures that
allow us to evaluate for the first time structural network
(dis)similarities between hemispheres. In particular, we focus
on graph measures of efficiency and interconnectivity, for
11 right-handed healthy human subjects and a single macaque
monkey. Additional analyses include the identification of those
anatomic regions that are significantly more central or in-
dispensable (in terms of their connections) for the whole-brain
structural network than their homolog regions in the opposite
hemisphere. Finally, some comments are made concerning the
relationship between the obtained anatomical findings and
some previously reported functional asymmetries, such as
visual attention neglect.
Materials and Methods
Data Acquisition and Preprocessing
Dataset 1
High--angular resolution DW-MRI datasets were acquired in 11 right-
handed healthy subjects (age range: 23--38 years). All subjects provided
informed consent, and the procedures were approved by the Local
Research Ethics Committee. Handedness was determined by docu-
menting the dominant hand of the participants.
Data were acquired on a 3-T Philips Achieva scanner (Philips Medical
Systems) in Manchester, UK, using an 8-element SENSE head coil.
Diffusion-weighted imaging was performed using a dual phase encoded
pulsed gradient spin echo protocol designed to allow correction of
susceptibility-induced and eddy current--induced distortions (Embleton
et al. 2006). Acquisition parameters used were time echo (TE) = 54 ms,
time repetition (TR) = 11884 ms, G = 62 mT/m, half-scan
factor = 0.679, 112 3 112 image matrix reconstructed to 128 3 128
using zero padding, reconstructed resolution = 1.875 3 1.875 mm2,
slice thickness = 2.1 mm, 60 contiguous slices, 61 noncollinear
diffusion sensitization directions at b = 1200 s/mm2 (D = 29.8 ms and
d = 13.1 ms), 1 at b = 0, and SENSE acceleration factor = 2.5. For each
diffusion gradient direction, 2 separate volumes were obtained with
opposite polarity k space traversal in order to enable the distortion
correction method.
T2-weighted images were also acquired and automatically parcellated
into 90 gray matter structures (parcellation scheme 1) (Mazziotta et al.
1995) using the IBASPM toolbox (available at http://www.fil.ion.ucl
.ac.uk/spm/ext/#IBASPM) (Aleman-Gomez et al. 2006). Additionally, in
order to evaluate possible parcellation scheme effects on lateralization
of global/local efficiency and interconnectivity network measures, the
registered T2-weighted images were also parcellated into 71 gray
matter structures (parcellation scheme 2) corresponding to the Jacob
Atlas developed by the Montreal Neurological Institute (http://
www.mni.mcgill.ca/). In order to consider the same left and right gray
matter regions, the brain stem region was rejected from this
parcellation scheme (for details please see Supplementary Table 4).
Dataset 2
A high--angular resolution DW-MRI dataset was acquired in a formalin-
fixed postmortem macaque (Macaca mulatta) brain using a Bruker
BIOSPEC 4.7-T vertical bore scanner. The macaque brain was perfused,
removed from the skull, and kept in 4% paraformaldehyde for 5 years
prior scanning. A 2D spin echo MRI sequence was implemented with
TE = 78 ms, TR = 9 s, G = 47 mT/m, 104 3 94 imaging matrix,
58 contiguous slices, isotropic voxel resolution = 0.8 mm, 61 non-
collinear diffusion sensitization directions at b = 4000 s/mm2 (D = 39
ms and d = 31 ms), 7 at b = 0, and 4 averages. The total imaging time
was ca. 64 h. To improve the signal-to-noise ratio in the diffusion-
sensitized images, for the purposes of tractography, we applied
5 iterations of 2D anisotropic diffusion smoothing (rsb.info.nih.gov/ij/
plugins/anisotropic-diffusion-2d.html) using ImageJ (rsb.info.nih.gov
/ij/index.html).
Following the procedure described in Haroon et al. (2008), we took
the cortical parcellation scheme LVE00a (Lewis and Van Essen 2000)
available as part of the Caret 5.5 software (available at http://
www.brainmap.wustl.edu/caret) for the F99UA1 rhesus macaque brain
atlas. Then, using the Normalize tool in SPM5 (available at http://
www.fil.ion.ucl.ac.uk/spm/software/spm5/), a nonlinear warping was
applied to the F99UA1 MRI brain volume to spatially match the brain
volume of our dataset. Finally, the nonlinear warping transformation
parameters obtained were applied to the LVE00a parcellation scheme
(for a list of region labels see Supplementary Table 5). In addition,
macaque cortex structural connections information derived by
invasive tracer studies was extracted from Cocomac LVE00a database
(cocomac.org/home.asp) (for details please see Fig. 3a).
Voxel-Region Axonal Connectivity Estimation
For each subject of datasets 1 and 2, 3 axonal connectivity values
between each brain voxel and the surface of each considered gray
matter region (voxel-region connectivity) were estimated using 3 fully
automated fiber tractography algorithms as follows:
1. Probabilistic tractography from the seed regions was carried out
according to Behrens, Woolrich, et al. (2003) using the FSL software
package (available at http://www.fmrib.ox.ac.uk/fsl/). For each brain
voxel, an index of connectivity, representing the number of
generated paths that passed through it from the seed region, was
assigned. Tracking parameters used were 5000 as number of
generated paths from each seed point (suggested in the FSL
software package as optimum to reach the convergence of the
algorithm), 0.5 mm as step size, 500 mm maximum trace length, and
a curvature threshold of ±80�. In the text we refer to this algorithm
as ‘‘FSL.’’
2. Second, probabilistic tractography was performed using the PICo
algorithm (Parker et al. 2003; Parker and Alexander 2005). Similarly
to the FSL method, a connection probability value with each seed
region was assigned to the brain voxels. Tracking parameters used
were 5000 as number of generated paths from each seed point,
0.5 mm as step size, 500 mm as maximum trace length, and
a curvature threshold over voxel of ±90�. Intravoxel probability
density functions of fiber orientation were generated using a model-
based residual bootstrap Q-ball approach (Haroon et al. 2009). In the
text we refer to this algorithm as ‘‘PICo.’’
3. Finally, a graph-based tractography algorithm (Iturria-Medina et al.
2007) was used, assigning to each brain voxel a probability of
connection with each considered seed region. A maximum of
500 mm trace length and a curvature threshold of ±90� were
imposed as tracking parameters. The intravoxel white matter
orientational distribution function maps were estimated using the
Q-ball approach (Tuch 2004). In the text we refer to this algorithm
as ‘‘GM.’’
Additionally, in order to evaluate the performance of the previous
fiber tractography algorithms (FSL, PICo, and GM) in comparison with
the more often used deterministic streamline tractography (SLT)
algorithm (Mori et al. 1999), we used also the SLT approach to estimate
axonal connectivity values between brain voxels and the surface of
each considered gray matter region for the macaque monkey subject
(dataset 2). Tracking parameters used for SLT algorithm were 0.5 mm as
step size, 500 mm as maximum trace length, a curvature threshold over
voxel of ±60�, and a FA threshold of 0.2. Seed points were selected as all
brain voxels with an FA value greater than 0.2 (the so-called brute-force
approach). Following the procedure described in Li et al. (2009), 2 gray
matter regions were considered to be connected if the reconstructed
fiber trajectories with 2 end points located in these 2 regions,
respectively, were present, and a final connection measurement
between these regions was defined as the number of connecting fiber
trajectories relative to the number of voxels over the surface of both
regions (equivalent to arc weight definition in eq. 1).
Network Construction
For each subject, whole-brain undirected weighted networks were
created for each tracking algorithm used as follows: 1) A node was
defined to represent each considered anatomic region, 2) An
Cerebral Cortex January 2011, V 21 N 1 57
at University of M
anchester on January 27, 2014http://cercor.oxfordjournals.org/
Dow
nloaded from
undirected arc aij between nodes i and j was established if a nonzero
connectivity value was found to exist between the boundary voxels of
regions i and j, and 3) Arc weight w(aij) was defined as the connection
measurement (the output of the tractography algorithm) between
regions i and j (Iturria-Medina et al. 2007), estimated by counting the
‘‘effective’’ number of voxels over the surface of both regions and
weighting each voxel by its voxel-region connectivity value with the
opposite zone, relative to the total number of considered superficial
voxels. Mathematically:
wðaij Þ[wðaji Þ=+"~rn 2N s
i
f~rn ++"~rm 2N sj
f~rm��N s
i
�� +���N s
j
���; ð1Þ
where the term f~rn denotes the axonal connectivity value of each node
~rn 2 N si (N s
i being the set of superficial nodes of region i) with the
superficial nodes of region j
�N sj
�. Similarly, f~rm denotes the
connectivity value of any node ~rm 2 N sj with superficial nodes of
region i.��N s
i
�� and���N s
j
��� are the number of elements (superficial nodes)
of regions i and j, respectively. Note that the first term of the numerator
quantifies connections of the region i with j, and the second term
quantifies connections of the region j with i.
Eliminating interhemispheric connections, each whole-brain net-
work was segmented into left and right hemispheric networks, each
one containing the same number of homolog regions. Graphically, each
created undirected weighted network is a discrete set of points
(nodes) representing anatomic regions and a set of nondirectional lines
(arcs) representing connections between them, which the width of
each line reflecting the corresponding arc weight.
Graph Analysis
Efficiency
In terms of the information flow, the global efficiency (Eglob) of
a network G reflects how efficiently information can be exchanged
over G, considering a parallel system in which each node sends
information concurrently along the network. It is defined as (Latora and
Marchiori 2001):
Eglob=1
nðn – 1Þ +i; j 2 G
i 6¼ j
1
dij
; ð2Þ
where n is the number of nodes, and dij is the geodesic length over
all pairs of nodes. In the unweighted network context, the shortest
path length dij is defined as the number of arcs along the shortest path
connecting nodes i and j. In the case of weighted networks, the path
with the minimum number of nodes is not necessarily the optimal dij
and is necessary to define a physical length associated to each arc (this
should be a function of the characteristics of the hypothetical link
among any nodes i and j). In this work, we assumed that the physical
length of an arc connecting nodes i and j is inversely proportional to
the strength of the analyzed connection (Iturria-Medina et al. 2008),
i.e., lij=1wij. Thus, the shortest path length dij is finally computed as the
smallest sum of the arc lengths throughout all the possible paths
from node i to node j. Note that for the particular case of unweighted
graphs, lij=1 for all arcs and the geodesic lengths dij reduces to the
minimum number of arcs traversed to get from i to j.
The local efficiency (Eloc) of G is defined as the average efficiency of
the local subgraphs (Latora and Marchiori 2001):
Eloc=1
n+i2G
Eglob�Gi
�; ð3Þ
where Gi is the subgraph of the first neighbors of node i. This measure
has been used to reveal how much a system is fault tolerant, showing
how efficient the communication is among the first neighbors of
i when i is removed.
In a physiological sense, the global efficiency of a structural brain/
hemispheric network reflects the potential parallel exchange of neural
information between the involved anatomic regions (a high global
efficiency value, i.e., Eglob � 1, may indicate highly parallel information
transfer in the brain/hemispheric system, in which each element node
could efficiently send information concurrently along the network).
The local efficiency of a structural brain/hemispheric network reflects
its potential tendency to present communities or clusters of
anatomically and physiologically different regions that deal with
common neural information (where regions connected to a same
region tend also to link to each other). In addition, concurrent higher
values of global and local efficiencies indicate a system with a high
balance between local necessities (fault tolerance) and wide-scope
interactions.
Interconnectivity
In order to obtain a measure of the total amount of connectivity in
a weighted network G, here we define the interconnectivity (Iconn) of
G as the sum of its arc weights. It reflects the amount of connectivity
between all the considered anatomic regions.
Betweenness Centrality
Betweenness centrality is a widely used measure to identify the most
central nodes in a graph, which are associated to those nodes that act as
bridges between the others nodes (Freeman 1977; Bassett et al. 2006;
Dall’Asta et al. 2006; Honey et al. 2007). It is defined as the fraction of
shortest paths between pairs of nodes that passes through a given node.
Mathematically, for weighted networks, if rwkj is the number of paths
from node k to node j, and rwkj ðiÞ is the number of these paths passing
through node i, the weighted betweenness centrality of i is (Dall’Asta
et al. 2006)
bwi = +
k; j 2 G
k 6¼ j 6¼ i
rwkj ðiÞrwkj
: ð4Þ
Lateralization IndexIn order to characterize asymmetry for a given network measure
X (global/local efficiency, interconnectivity, or betweenness central-
ity), a lateralization index (LI) was computed as:
LIðX Þ = 1003X ðRightÞ –X ðLeftÞX ðRightÞ +X ðLeftÞ: ð5Þ
This procedure allows us to look at differences between the right
and left hemispheres, incorporating the relative network value of X
over both hemispheres in one value. The index, ranging between 100
and –100, is positive when X is more prominent over the right
hemisphere and lower over the left hemisphere ðX ðRightÞ >X ðLeftÞÞand negative when the opposite is the case ðX ðRightÞ <X ðLeftÞÞ.
Receiver Operating Characteristic Analysis
Receiver operating characteristic (ROC) curves are useful for
visualizing, organizing, and selecting classifiers based on their perfor-
mance (Fawcett 2006). Here, in order to evaluate the performance of
the FSL, PICo, and GM fiber tractography algorithms in comparison
with the traditional SLT algorithm, ROC curves for each of these
algorithms were constructed, based on the comparison of their
connection results for the macaque monkey subject (dataset 2) and
the reference connection pattern defined by macaque cortex structural
connections information derived by invasive tracer studies (Fig. 3a).
First, because in this analysis we are not differencing between left
and right hemispheres due to connection information from invasive
tracing studies not being hemisphere specific, connectivity matrix
representing each fiber tractography algorithm was created assuming,
as final connection value between any 2 regions i and j, the mean of the
connection values obtained by this algorithm on both hemispheres
(eq. 1). Next, the ROC curve corresponding to a specific tractography
algorithm was represented as the fraction of ‘‘true positives’’ (TPR)
versus the fraction of ‘‘false positives’’ (FPR) of its connectivity matrix
with regard the reference connection pattern (Fig. 3a) as a discrimi-
nation threshold is varied, that is, a set of threshold values, varying from
minimum to maximum value, were applied to the analyzed connectivity
matrix and resulting binarized matrix versions were compared with
58 Brain Hemispheric Structural Efficiency and Interconnectivity Rightward Asymmetry d Iturria-Medina et al.
at University of M
anchester on January 27, 2014http://cercor.oxfordjournals.org/
Dow
nloaded from

the reference connection pattern (Fig. 3a), allowing to calculate
corresponding TPR and FPR values as:
TPR = TPTP + FN
;
FPR = FPFP + TN
;ð6Þ
where TP, FN, FP, and TN are the number of true positives, false
negatives, false positives, and true negatives, respectively. For a valid
comparison, only those matrix cells where a direct (dis)connection by
invasive tracer studies (values 0 and 1 on Fig. 3a, i.e., a total of
462 values) have been reported were considered. One point in ROC
space is considered better than another (each point belonging to
a different tracking algorithm) if it is to the northwest (TPR is higher,
FPR is lower, or both).
Results
Anatomical connections between cortical and subcortical
regions for 11 right-handed healthy human subjects (dataset 1)
and a single macaque monkey (dataset 2) were estimated using
3 different fiber tractography algorithms (see Materials and
Methods). From the obtained voxel-region connectivity maps
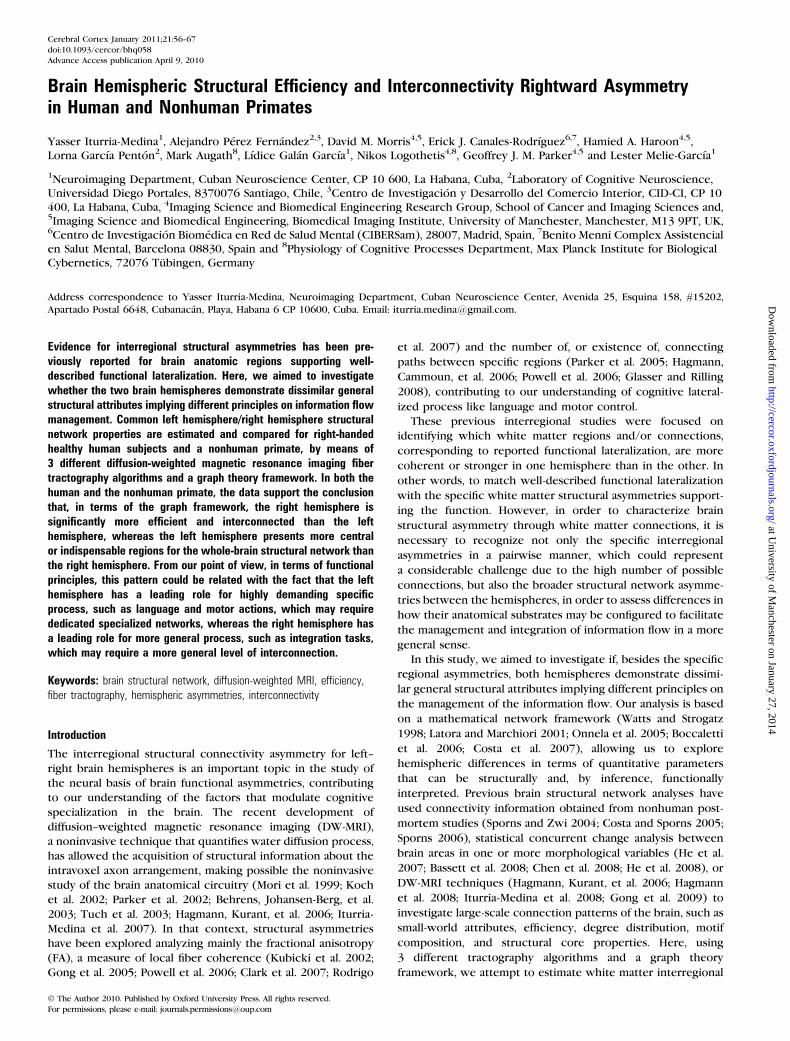
(Fig. 1b), weighted networks were created for the whole brain
(Fig. 1c), in which each node represents an anatomic brain
region (90 for humans or 176 for macaque monkey), arcs
connecting nodes correspond to white matter links, and arc
weights correspond to the degree of evidence supporting the
Figure 1. Schematic representation of the connectivity estimation and network construction procedure; for an example, human subject and the first tractography algorithm. (a)Axial map representing intravoxel mean fiber orientation (dyadic vectors), overlaid on the FA image; the inset figure provides detail of the high fiber orientation coherence withinthe splenium of the corpus callosum. (b) Axial voxel-region connectivity maps corresponding to region 1 (precentral gyrus) and region 90 (inferior temporal gyrus), overlaid on theregistered T2-weighted image; voxels are color-coded according to whether the connectivity of each voxel is high (white) or low (black). (c) Whole-brain structural networkderived as described in Materials and Methods. (d) Right and left hemispheric networks (RH and LH, respectively), obtained by rejection of callosal connections on the whole-brainstructural network (viewed from below). In (c) and (d), points (nodes) represent anatomic regions, lines without arrow (arcs) correspond to connections between them, and linewidths reflect the corresponding arc weights. Lines colors were assigned according to the spatial position of the nodes.
Cerebral Cortex January 2011, V 21 N 1 59
at University of M
anchester on January 27, 2014http://cercor.oxfordjournals.org/
Dow
nloaded from
existence of a white matter connection between regions.
Eliminating callosal connections, each whole-brain network
was segmented into left and right hemispheric networks, each
one containing the same number of homolog regions (i.e.,
45 regions for humans and 88 regions for macaque monkey;
Fig. 1d).
In summary, for each subject we obtained a whole-brain
network, and corresponding left/right hemispheric networks,
each one replicated for each of 3 different fiber tracking
algorithms.
Efficiency and Interconnectivity Asymmetries
We evaluated structural asymmetries between left hemisphere
and right hemisphere networks according to 3 network
properties: global efficiency (Eglob, a measure of how efficiently
information can be exchanged over a network), local efficiency
(Eloc, the average global efficiency of the local subnetworks),
and interconnectivity (Iconn, a measure of the total amount of
interconnectivity). These measures were separately computed
for each individual’s left and right hemispheric networks (see
Materials and Methods).
In order to characterize the hemispheric asymmetry for
global/local efficiency and interconnectivity, a LI was calcu-
lated for each of these 3 network measures, with a positive
value meaning a lateralization to the right while negative value
indicates a lateralization to the left (see Materials and Methods).
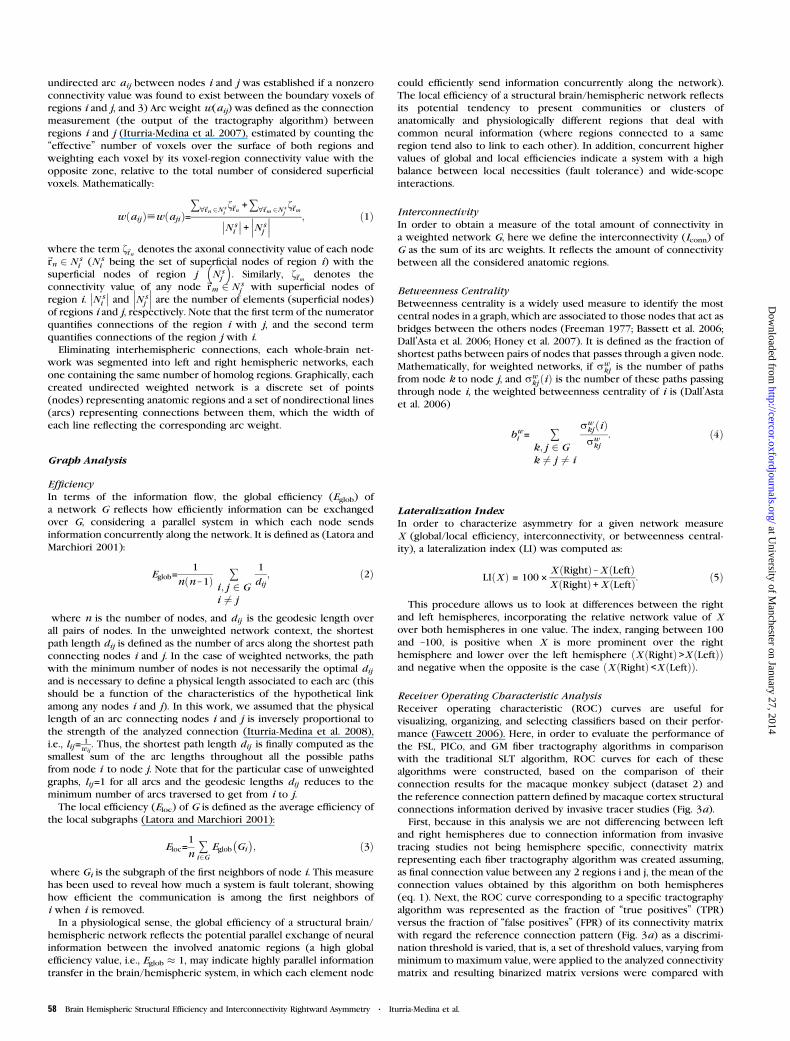
Interestingly, the obtained LI results showed a consistent
lateralization trend toward the right hemisphere for the 3
efficiency and interconnectivity network measures (Fig. 2).
Before testing for a statistically significant lateralization for
human subjects, we compared tracking algorithm effects on
the obtained LI values using a Kruskal--Wallis test, testing the
null hypothesis that all values for a same network measure
(Eglob, Eloc, or Iconn) were drawn from the same distribution
independently of the fiber tracking algorithm used. The
nonsignificant P values obtained (P > 0.05; Table 1) supported
that LI values obtained were not statistically dependent on the
tracking method used. Right lateralization was then tested
using a sign test with the hypothesis that all obtained LI values
for a same network measure come from a distribution whose
median is zero. The small P values obtained (all P < 7 3 10–5;
Table 1) supported the hypothesis of a significant positive
lateralization for the 3 measures, indicating that human right
hemisphere networks are anatomically more efficient and
interconnected than left hemisphere networks for right-
handed subjects. The LI values obtained for Eglob, Eloc, and
Iconn in the macaque monkey were also positive for the 3
tractography algorithms (Table 1).
Regional Betweenness Centrality Asymmetries
We computed the betweenness centrality associated with each
brain region considered in humans (dataset 1) and macaque
monkey (dataset 2) with respect to the whole-brain anatomical
network. This measure reflects the relative centrality or
indispensability of each gray matter region within the entire
brain anatomical network in terms of its connections, in which
higher betweenness centrality values imply greater importance
(see Materials and Methods). Then, in order to characterize
centrality asymmetries between left and right homolog regions,
a betweenness centrality LI was calculated (a positive value
meaning a lateralization to the right while a negative value
indicates a lateralization to the left).
Results in Dataset 1
Before testing for a statistically significant lateralization of the
betweenness centrality parameter between human homolog
regions, we compared tracking algorithm effects on the
measured betweenness centrality LI values using a Kruskal--
Wallis test (Table 2). We observed that 9 region pairs had
betweenness centrality values that were dependent on method
but that the remaining 36 region pairs did not (P > 0.05). In
a first lateralization analysis, we considered only those 36 pairs
Figure 2. Efficiency and interconnectivity LIs obtained using 3 different fibertractography algorithms (FSL, PICo, and GM; see Materials and Methods) for 11 right-handed healthy human subjects (dataset 1; denoted by superscript ‘‘y’’) anda nonhuman primate (dataset 2; denoted by superscript ‘‘J’’). Each compared leftand right hemispheric networks contained the same number of anatomic homologregions (i.e., 45 for humans or 88 for the nonhuman primate). Note a prevalence ofpositive bar values, indicating a consistent lateralization to the right hemisphere.
60 Brain Hemispheric Structural Efficiency and Interconnectivity Rightward Asymmetry d Iturria-Medina et al.
at University of M
anchester on January 27, 2014http://cercor.oxfordjournals.org/
Dow
nloaded from

of regions whose LI values can be statistically assumed to be
drawn from the same distribution for the 3 tracking algorithms.
Lateralization was then tested using a sign test, with the
hypothesis that all measured LI values of each identified pair of
regions came from a distribution whose median is zero.
Significant lateralization of betweenness centrality was found
for 15 pairs of homolog regions (P < 0.05; Table 2). Leftward
asymmetries (negative LI) were observed in 10 pairs of regions:
precentral gyrus (P = 0.0350), middle orbital frontal
(P = 0.0214), supplementary motor area (P = 0.0427), olfactory
bulb (P = 0.0045), superior medial frontal gyrus (P = 0.0059),
anterior cingulate gyrus (P = 1.30 3 10–7), middle cingulate
gyrus (P = 0.0045), inferior occipital (P = 0.0266), paracentral
lobule (P = 0.0002), and caudate (P = 0.0013). Significant
rightward asymmetries (positive LI) were observed in 5 pairs
of regions: hippocampus (P = 0.0350), cuneus (P = 0.0013),
superior occipital (P = 0.0350), supramarginal (P = 0.0013),
and angular (P = 6.61 3 10–5).
In order to account to a degree for the demonstrated
differences in output from different tracking processes, we also
assessed thosepairs of regionswhose LI values can be statistically
assumed to be drawn from the same distribution for 2 of the
3 tracking algorithms. Eight additional pairs of homolog regions
were included in the lateralization analysis when using this
criterion. By means of a sign test, 6 of the additional region pairs
were found to demonstrate significant lateralization (P < 0.05;
Table 2). Leftward (negative LI) asymmetries were observed in
posterior cingulate gyrus (P = 0.0043), inferior parietal
(P = 0.0071), superior temporal (P = 0.0015), superior temporal
pole (P = 1.09 3 10–5), and middle temporal pole (P = 0.0008),
Table 2Human considered brain regions (dataset 1, parcellation scheme 1) and corresponding statistical results for obtained betweenness centrality LI values
Region Kruskal--Wallis (P) Sign test (P) Region Kruskal--Wallis (P) Sign test (P)
No. Name No. Name
1 Precentral 0.3753 20.0350 24 Lingual 0.3974 þ12 Frontal_Sup 0.3281 þ1 25 Occipital_Sup 0.1061 10.03503 Frontal_Sup_Orb 0.7893 þ0.4582 26 Occipital_Mid 0.0031 10.00464 Frontal_Mid 0.7311 �0.0614 27 Occipital_Inf 0.4269 20.02665 Frontal_Mid_Orb 0.1131 20.0214 28 Fusiform 0.1493 �0.48686 Frontal_Inf_Oper 0.4402 þ1 29 Postcentral 0.5276 �0.37707 Frontal_Inf_Tri 0.2545 �0.8600 30 Parietal_Sup 0.6837 �0.14968 Frontal_Inf_Orb 0.3326 þ0.1686 31 Parietal_Inf 5.34 3 1025 20.00719 Rolandic_Oper 0.3974 þ1 32 SupraMarginal 0.8089 10.001310 Supp_Motor_Area 0.5851 20.0427 33 Angular 0.2948 16.61 3 1025
11 Olfactory 0.2917 20.0045 34 Precuneus 0.4045 þ0.080112 Frontal_Sup_Medial 0.0851 20.0059 35 Paracentral_Lobule 0.3069 20.000213 Frontal_Mid_Orb 0.0958 þ0.2153 36 Caudate 0.2482 20.001314 Rectus 0.0923 þ0.4868 37 Putamen 0.0059 þ0.286215 Insula 0.6338 þ0.4868 38 Pallidum 0.2943 þ0.507816 Cingulate_Ant 0.2344 21.30 3 1027 39 Thalamus 0.2421 þ0.596617 Cingulate_Mid 0.4021 20.0045 40 Heschl 8.52 3 1026 �118 Cingulate_Post 0.0479 20.0043 41 Temporal_Sup 0.0069 21.09 3 1025
19 Hippocampus 0.5706 10.0350 42 Temporal_Pole_Sup 0.0238 20.000820 ParaHippocampal 0.4523 þ0.2004 43 Temporal_Mid 0.2129 þ0.860021 Amygdala 0.0030 þ0.1338 44 Temporal_Pole_Mid 0.0035 �0.006322 Calcarine 0.1609 �1 45 Temporal_Inf 0.0724 �0.860023 Cuneus 0.4084 10.0013
Note: The Kruskal--Wallis P value corresponds to the null hypothesis that all betweenness centrality LI values for a given region were drawn from the same distribution independently of the used fiber
tracking algorithms (a P value near to zero, i.e., P\ 0.05, suggests that at least one sample median is significantly different from the others). The sign test P value (preceded by � or þ symbols, which
indicates a leftward or rightward lateralization, respectively) corresponds to the null hypothesis that the betweenness centrality LI values come from a distribution whose median is zero (a P value near to
zero, i.e., P\ 0.05, indicates a significant lateralization). For obtained betweenness centrality LI values corresponding to each region and fiber tracking method, including the complete statistic results of
tracking algorithm effects, please see Supplementary Table 2. For an equivalent lateralization statistical analysis, in which the obtained betweenness centrality left/right values were directly compared
without the use of a LI, please see Supplementary Table 3. Significant values are depicted in bold type.
Table 1Global efficiency, local efficiency, and interconnectivity LIs obtained for the brain anatomical networks of a single macaque monkey (dataset 2) and 11 right-handed healthy subjects (dataset 1)
Brain networks Measure Lateralization (mean ± standard error of the mean) Kruskal--Wallis (P) Sign test (P)
FSL PICo GM
Macaque Eglob 12.67 5.36 1.48 — —Eloc 10.97 5.43 1.48 — —Iconn 12.35 4.10 1.18 — —
Human Eglob 3.39 ± 0.90 1.80 ± 0.37 2.35 ± 0.76 0.4903 1.09 3 1025
Eloc 3.71 ± 0.77 2.39 ± 0.50 2.37 ± 0.76 0.4140 1.30 3 1027
Iconn 2.98 ± 0.94 2.60 ± 0.56 3.39 ± 1.16 0.9990 6.61 3 1025
Note: A positive value means a lateralization to the right hemisphere while a negative value indicates a lateralization to the left hemisphere. For human cases, mean values are reported with their
corresponding standard errors (i.e., the uncertainty of how the sample mean represents the underlying population mean). The Kruskal--Wallis P values corresponds to the null hypothesis that all human LI
values for a given measure (Eglob, Eloc, or Iconn) were drawn from the same distribution independently of the used fiber tracking algorithms. The nonsignificant P values obtained (all P[ 0.4) demonstrates
that each tracking method yields statistically indistinguishable results. The sign test P value corresponds to the null hypothesis that all the human LI values come from a distribution whose median is zero.
The small P values obtained (all P\ 7 3 10�5) supported the hypothesis of a significant positive lateralization for the 3 measures. For an equivalent statistical analysis, in which the same network
measures were directly compared without the use of a LI, please see Supplementary Table 1. Significant values are depicted in bold type.
Cerebral Cortex January 2011, V 21 N 1 61
at University of M
anchester on January 27, 2014http://cercor.oxfordjournals.org/
Dow
nloaded from

whereas only the middle occipital (P = 0.0046) was found to
demonstrate rightward asymmetry.
In summary, a total of 21 pairs of human homolog regions
were found lateralized in terms of their centrality or in-
dispensability to the whole-brain structural network. In line
with a previous cortical thickness study (Luders et al. 2006),
we found a more pronounced leftward than rightward
asymmetry (15 vs. 6 lateralized regions, respectively).
Results in Dataset 2
Tracking algorithm effects for the macaque monkey data were
compared using a Kruskal--Wallis test across all considered
region pairs. The high P value obtained (P = 0.8393) supported
the conclusion that LI values obtained were not statistically
dependent on the tracking method used. Lateralization was
then tested via a nonparametric permutation test (see
Appendix).
Significant lateralization of betweenness centrality was found
for 19 pairs of homolog regions (P < 0.05). Leftward asymme-
try (negative LI) was observed in 11 regions: temporoparietal
area (P = 0.0156), somatosensory area 2 (P = 0.0156), middle
temporal area (P = 0.0313), ventral sudivisions of the anterior
inferotemporal cortex area TE (P = 0.0156), dorsal prelunate
area (P = 0.0313), subdivisions of area 8 (P = 0.0156), dorsal
cingulate area 24 (P = 0.0156), subdivisions of cingulate area
24 (P = 0.0156), area 31 (P = 0.0156), area 14r (P = 0.0156),
and medial area 10 (P = 0.0313). Significant rightward asym-
metry (positive LI) was observed in 8 regions: visual area
3 (P = 0.0156), visual area V3A (P = 0.0156), area 13m
(P = 0.0156), ventral visual area (P = 0.0156), 11m
(P = 0.0156), medial intraparietal area (P = 0.0313), area
6M (P = 0.0156), and area 32 (P = 0.0156).
Fiber Tracking Algorithms Performance Evaluation
In order to evaluate the validity of the fiber tractography
algorithms used in this paper (FSL, PICo, and GM) in
comparison with the more often used deterministic SLT
algorithm (Mori et al. 1999), we compared structural networks
results obtained for the macaque monkey (dataset 2) with
macaque cortex structural connections information derived by
invasive tracer studies. Figure 3a presents cortical--cortical
connection information extracted from Cocomac LVE00a
database, corresponding to 63 brain cortical regions (see
Materials and Methods, Data Acquisition and Preprocessing),
whereas Figure 3b presents resultant ROC curves from
comparison between previous cortical--cortical connection
information and connectivity matrices estimated with FSL,
PICo, GM, and SLT algorithms (see Materials and Methods,
Receiver Operating Characteristic Analysis).
Although it is not possible to make a statistical comparison
between the obtained ROC curves (due to the fact that they
correspond to a single dataset), a clear prevalence of the 3 fiber
tracking algorithms used in this study (FSL, PICo, and GM) can
be seen over the performance of the traditional deterministic
SLT algorithm, which is also numerically supported by the
corresponding areas under the ROC curves: FSL (AUC = 0.78),
PICo (AUC = 0.72), GM (AUC = 0.77), and SLT (AUC = 0.62).
Discussion
We performed a structural network analysis based on DW-MRI
techniques and graph theory to identify brain hemispheric
anatomical asymmetries. In contrast with previous structural
network studies (Hagmann, Kurant, et al. 2006; Hagmann et al.
2008; Iturria-Medina et al. 2008; Gong et al. 2009), here we
Figure 3. Macaque cortex structural connections derived by invasive tracer studies and ROC curves resulting from a comparison with connections derived by DW-MRItractography techniques. (a) Cortical--cortical connection information extracted from Cocomac LVE00a database (cocomac.org/home.asp). Similarly to methods in Haroon et al.(2008), the source and target cortical regions, numbered 1 to 63 on the matrices, correspond to the subset of cortical areas labeled as follows in the LVE00a scheme: 1, 2, 4, 23,45, 24d, 3a, 46p, 46v, 4C, 5D, 5V, 6Ds, 6Val, 6Vam, 7a, 7b, 7op, 7t, 8Ac, 8Am, 8As, A1, AIP, DP, FST, G, IPa, LIPd, LIPv, LOP, MDP, MIP, MSTda, MSTdp, MSTm, MT, Pi, PIP, PO,PrCO, Ri, S2, TAa, TE1--3, TEa/m, TF, TPOc, TPOi, TPOr, Tpt, V1, V2, V2v, V3, V3A, V4, V4ta, V4tp, VIPl, VIPm, VOT, and VP, respectively. Values of 1 (or 0) have used to fill in cellswhere there is (or not) a direct connection, while a value of �1 has been used for connections for which no information is available. (b) Resultant ROC curves from comparisonbetween previous cortical--cortical connection information and connectivity matrices estimated with FSL, PICo, GM, and traditional SLT (Mori et al. 1999) algorithms, for a singlemacaque monkey (dataset 2). For a valid comparison, we considered only those matrix cells where have been reported a direct (dis)connection by invasive tracer studies (values0 and 1 on panel a). Although it is not possible to make a statistical comparison between the obtained ROC curves (due to the fact that they correspond to a single dataset), a clearprevalence of the 3 probabilistic fiber tracking algorithms used in the study (FSL, PICo, and GM) can be seen over the performance of the traditional deterministic SLT algorithm,which is also numerically supported by the corresponding areas under the ROC curves: FSL (AUC 5 0.78), PICo (AUC 5 0.72), GM (AUC 5 0.77), and SLT (AUC 5 0.62).
62 Brain Hemispheric Structural Efficiency and Interconnectivity Rightward Asymmetry d Iturria-Medina et al.
at University of M
anchester on January 27, 2014http://cercor.oxfordjournals.org/
Dow
nloaded from

emphasize the use of 3 tractography algorithms, making the
results robust to choice of tracking algorithm, which is
potentially a significant source of bias, and thus providing
a valuable assessment of the relative detail of network
information across these methods and, more importantly,
providing a robust set of results with which to assess
lateralization. We found significant differences between right
and left hemispheric networks at a hemispheric level using the
metrics Eglob, Eloc, and Iconn, indicating that the right hemi-
sphere is, at the whole-hemisphere level, more efficient and
interconnected. However, the subhemisphere regional asym-
metries observed using the betweenness centrality measure
indicate that the left hemisphere presents more central or
indispensable regions for the whole-brain structural network
than the right hemisphere. These findings were found to hold
true across the human dataset and in the single macaque
dataset, indicating that general organizational strategies are
broadly similar between these species.
Efficiency and Interconnectivity HemisphericAsymmetries
We explored general structural differences between both
hemispheres via 3 network measures: global efficiency, local
efficiency, and interconnectivity (Eglob, Eloc, and Iconn, re-
spectively). A significant rightward asymmetry on both
efficiencies and interconnectivity was found (Table 1 and
Fig. 2). To our knowledge, this is the first report of brain
structural asymmetry of these measures. This whole-hemi-
sphere right-greater-than-left interconnectivity and efficiency
are consistent with the reported significant rightward asym-
metry in the white matter volume for right-handed healthy
subjects (Barrick et al. 2005). Furthermore, the greater
efficiency and stronger interconnectivity in the right hemi-
sphere obtained for the macaque monkey suggest that these
asymmetry characteristics could be shared among primates,
even when caution is applied when considering that a single
nonhuman primate case was tested.
Our results raise a number of intriguing questions. For
example, what are the functional requirements underlying the
fact that one hemisphere is more efficient and interconnected
than the other? Interestingly, our leftward regional asymmetry
findings, as expressed using the betweenness centralitymeasure,
indicate that left hemisphere presentsmore central or indispens-
able regions for the whole-brain structural network than the
right hemisphere, which is in line with previous studies (Luders
et al. 2006). Since the connectivity of a given region, and thus the
measurement of betweenness centrality, is related to its cellular
characteristics such as cell packing density, cell size, and number
of cortical neurons (Costa 2005; Lerch et al. 2006), connectivity
asymmetries of the cortex might be related to hemisphere-
specific functional specializations, which based on the high
correspondence between our structural results and well-known
functional regional asymmetries seems to support the fact that
the left hemisphere is ‘‘regionally’’ more specialized than the
right hemisphere. When considered in combination with the
whole-hemisphere efficiency and interconnectivity results, this
induces us to think that a greater left hemisphere functional
specialization could lead to its apparently ‘‘worse’’ general
structural organization (less efficiency and interconnectivity at
the whole-hemisphere scale) in comparison with the right
hemisphere. In terms of functional principles, these patterns
appear to support the fact that the left hemisphere has a leading
role for highly demanding specific process, such as language and
motor actions, which may require dedicated specialized net-
works, whereas the right hemisphere has a leading role for more
general process, such as integration tasks, which may require
a more general level of interconnection.
Regional Betweenness Centrality Asymmetries,Correspondence with Previous Findings
Previous studies reporting structural differences between
homologs areas have been mainly based on specific cytoarch-
itectonic and morphologic features while our regional asym-
metry analysis is based on the fiber connectivity pattern of each
region in terms of its relative importance to the whole-brain
structural network. Despite the interpretative differences
between the measures and procedures employed in different
studies, we found a considerable regional correspondence
between previous reports, old observations of asymmetric
regional specialization (based on the effects of brain lesions),
and our asymmetry findings, supporting the hypothesis of
a determinant relation between cytoarchitectonic/morpho-
logic characteristics and interregional connectivity (Costa
2005; Lerch et al. 2006; Van Essen 1997).
Dataset 1
In correspondence with previous human studies, leftward
asymmetries for the precentral gyrus and supplementary motor
area, regions associated with motor control actions as hand
preferences, have been well recognized for right-handed
subjects (Amunts et al. 1996; Rogers et al. 2004; Dadda et al.
2006; Luders et al. 2006). The paracentral gyrus and cingulate
gyrus leftward asymmetries found here are in line with similar
cortical thickness results (Luders et al. 2006), although this
cingulate gyrus asymmetry is in contrast to rightward
asymmetries previously reported using volumetric and voxel-
based measures (Paus et al. 1996; Watkins et al. 2001).
However, significant left-greater-than-right FA values have
previously been reported for the cingulum bundle (i.e., white
matter fibers projecting from the cingulate gyrus to the
entorhinal cortex), suggesting a more coherent fiber organiza-
tion in the left hemisphere that is consistent with our findings
(Gong et al. 2005; Clark et al. 2007). In addition, our observed
leftward asymmetries for superior temporal, superior temporal
pole, and middle temporal pole regions agree with many
structural reports (Niznikiewicz et al. 2000; Good et al. 2001a;
Watkins et al. 2001; Luders et al. 2006) and the documented
left hemispheric dominance for language (Price 2000).
Nevertheless, we did not find significant localized asymmetries
related to the inferior frontal regions, thought to contain
Broca’s region, which is also associated with dominant language
process. Interestingly, a recent study (Keller et al. 2009)
concluded that contrary to what has frequently been reported
in literature, structural asymmetry of Broca’s area has not been
reproducibly demonstrated. According to this previous study, if
a structural asymmetry of Broca’s area does exist, it is variable
and may differ from that of the functional asymmetry of
language, which is more consistent. Additionally, it is known
that the gyral location and extent of Broca’s area vary
considerably between subjects (Amunts et al. 1999, 2004;
Mazziotta et al. 2001; Juch et al. 2005; Lindenberg et al. 2007).
Such variation has been demonstrated using cytoarchitectonic
and functional imaging methods but cannot be determined
Cerebral Cortex January 2011, V 21 N 1 63
at University of M
anchester on January 27, 2014http://cercor.oxfordjournals.org/
Dow
nloaded from

from the purely anatomical parcellation of the cortex used in
our study. We must therefore conclude that there is a possibility
that a true underlying localized lateralization associated with
Broca’s area has not been detected using our methodology.
Asymmetries of the caudate nucleus, a region found here
with a leftward betweenness centrality asymmetry and thought
to be involved in higher order motor control (Graybiel 2005)
and learning and memory process (Packard and Knowlton
2002), have been reported for normal children (Filipek et al.
1997; Pueyo et al. 2000; Castellanos et al. 2001) and for children
with attention-deficit hyperactivity disorder (Aylward et al.
1996; Sugama et al. 2000; Castellanos et al. 2001; Schrimsher
et al. 2002). However, reports on caudate asymmetry have been
inconsistent (e.g., in normal subjects a common finding is left-
greater-than-right caudate volume although there are also
reports of no asymmetry and even of rightward asymmetry; see
Schrimsher et al. 2002). Recently, Tremols et al. (2008) argued
that these inconsistencies can be explained according to
different asymmetric properties of the head and body parts of
the caudate, which connect into different fiber pathways.
Unfortunately, our study was limited to the whole caudate
region without making distinction between its head and body
parts due to the nonspecificity of our gray matter parcellation
scheme. Further caudate network analysis should focus on
more precise parcellations in order to explore how caudate
connectivity could be related to head and body volume
asymmetries.
In the case of those homotopic regions found with a
betweenness centrality rightward asymmetry, the finding of the
hippocampus is consistent with the widely reported right-
sided asymmetries for this region (Free et al. 1995; Bigler et al.
1997; Bilir et al. 1998; Good et al. 2001b; Pegues et al. 2003). It
is striking that all the other right-lateralized regions (i.e.,
cuneus, superior occipital, supramarginal, angular, and middle
occipital) are related to visual processes, and there is evidence
that right hemispheric areas play a dominant role in the
implementation of visuo-spatial attention (Fink et al. 2000,
2001; Corbetta and Shulman 2002; Halligan et al. 2003). The
specific case of a betweenness centrality rightward lateraliza-
tion for angular and supramarginal gyrus (Brodmann areas 39
and 40, respectively) is an additionally interesting result
because evidence exists suggesting that lesions to these
regions on the right hemisphere cause visuo-spatial attentional
neglect (Vallar 1998; Halligan et al. 2003; Husain and Rorden
2003), a neuropsychological syndrome characterized by an
attentional bias. To our knowledge, this is the first structural
indication of why the widely investigated phenomenon of
visuo-attentional neglect is more commonly a consequence of
right hemisphere damage.
Dataset 2
Literature about macaque monkey interhemispheric brain
asymmetries is scarce. However, in correspondence with our
results, consistent evidence concerning leftward volumetric
asymmetry at the cytoarchitectural level of the temporoparietal
area (Tpt) has been reported (Gannon et al. 2008). This region,
a homologous area of the human planum temporale, is thought
to be linked to the participation of the left temporal lobe in
auditory and vocalization process, cognitive tasks that have
being reported to present a leftward lateralization in the
macaque monkey (Heffner HE and Heffner RS 1984; Poremba
et al. 2004). In addition, we found a leftward asymmetry to the
middle temporal and the ventral subdivisions of the anterior
inferotemporal cortex area TE. These results reinforce the view
that the macaque could provide a model system for studying
the evolutionary development of concepts and language in
humans (Gil-Da-Costa et al. 2004).
Interestingly, we also find corresponding interspecies
structural asymmetries in the visual system (rightward asym-
metry) and cingulate gyrus (leftward asymmetry), which to our
knowledge have not been reported before. However, as the
parcellation schemes that we used for human and nonhuman
primate differed considerably, further analyses are necessary to
identify with confidence other possible asymmetry equivalen-
ces and differences between species.
Methodological Issues and Future Work
Previous structural and functional studies have provided
evidence on how the apparent topological organization of
brain networks can be modified by the different parcellation
strategies applied (Hagmann, Kurant, et al. 2006; Li et al. 2009;
Wang et al. 2009). In principle, our results could be biased by
the chosen gray matter parcellation scheme, a key element of
the creation of brain anatomical networks due to its influence
on the node definition process. Thus, in order to explore
possible parcellation effects on our efficiency and intercon-
nectivity findings, we repeated the human structural brain
graph asymmetry analysis for another parcellation scheme with
a different set of 70 regions, using 1 of the 3 tractography
algorithms (GM), and the results indicated a consistent hemi-
spheric rightward asymmetry on these measures (see Supple-
mentary Figure 1 and Supplementary Table 4). However, it is
important to consider that although the atlases that we used
were carefully created taking into account relevant anatomical
and functional details, in the future it might be more
meaningful to use advanced integrative atlases based on finer
cytoarchitecture, myeloarchitecture, and MRI procedures
(Toga et al. 2006).
In contrast to the more often used deterministic tractog-
raphy approach (Conturo et al. 1999; Mori et al. 1999; Basser
et al. 2000), which typically can only progress when there is
high certainty of fiber direction limiting their usefulness in
defining pathways near gray matter, the 3 different tractog-
raphy algorithms used in this study include in the tracking
procedure the uncertainty of each fiber orientation (based in
the high information contained in the acquired high--angular
resolution DW-MRI datasets) and attempt to establish the
spatially distributed degree of connection confidence across
the whole brain to a given start point. However, in spite its
advantages over the conventional deterministic tractography
(Fig. 3b), these methods still present important limitations, like
a decrease in probability of connection with distance and the
difficulty to separate real from false connections. Thus, in the
future it might be more meaningful to use statistical
methodologies such as that recently introduced by Morris
et al. (2008), which proposed to address the mentioned
limitations of current probabilistic tractography algorithms
using an objective method for determining significant con-
nections based on statistical comparison with a null pattern of
connection, which also has the desirable effect of reducing the
effect of distance on extracted patterns of connection.
Another consideration for our study is the relatively small
size of the used subject sample, especially with respect to the
64 Brain Hemispheric Structural Efficiency and Interconnectivity Rightward Asymmetry d Iturria-Medina et al.
at University of M
anchester on January 27, 2014http://cercor.oxfordjournals.org/
Dow
nloaded from

macaque brain. Despite this, as previously mentioned, the use
of 3 different tractography algorithms allowed us to replicate
network measures, making the statistical analysis nonspecific
to only one tracking algorithm’s results and thus improving the
robustness of the study. However, future work should be
addressed to analyzing a bigger number of subjects, taking into
account also handedness and sex effects, not considered here
in spite their evidenced influence on structural and functional
asymmetries.
Supplementary Material
Supplementary material can be found at: http://www.cercor
.oxfordjournals.org/
Funding
Biotechnology and Biological Sciences Research Council of the
United Kingdom (BB/E002226/1).
Notes
We are also grateful to the anonymous reviewers for their useful
comments and suggestions. Author contributions: Y.I.-M. and A.P.F.
conceived and designed the experiment. G.J.M.P., D.M.M., H.A.H., M.A.,
and N.L. acquired and preprocessed the MRI datasets. D.M.M., H.A.H.,
and G.J.M.P. implemented the PICo tractography algorithm used. Y.I.-M.
implemented the graph-based tractography algorithm and network
analysis tools used. Y.I.-M. and A.P.F. analyzed the data and wrote the
paper with input from all other authors. All authors contributed to
constructive discussions regarding the interpretation of the results.
Conflict of Interest : None declared.
Appendix
Permutation Test Used for the Betweenness CentralityLateralization Analysis of Dataset 2
The analysis consisted of the following steps (Blair and Karniski 1993;
Galan et al. 1997):
1. The null hypothesis (H0) of 0 mean for all the measured LI values is
decomposed into the marginal hypotheses H0r : mr = 0, where mr is
the mean of the LI values for a given brain region r.
2. Each marginal hypothesis H0r is tested by:
a) Computing the t-statistic for the original LI values of the region
r (i.e., to compute the t value corresponding to the hypothesis
that the data in the vector LI come from a distribution with mean
zero).
b) Obtaining a larger number of permutation resample from the data
(without replacement) and constructing the permutation distri-
bution of the t-statistic (in each permutation the sign of at least
one of the elements of the original LI vector was changed, being
the complete permutation space 2n, where n is the number of
fiber tracking algorithms used).
c) Finding the P value of H0r by comparing the original t-statistic
(obtained in step a) with the t-statistic permutation distribution
(obtained in step b), specifically, to perform a 2-sided test (sign
test) with the hypothesis that the data in the t-statistic
permutation distribution come from a distribution whose median
is the original t-statistic.
References
Aleman-Gomez Y, Melie-Garcıa L, Valdes-Hernandez P. 2006. IBASPM:
toolbox for automatic parcellation of brain structures. Neuroimage.
31(1):29--185.
Amunts K, Schlaug G, Schleicher A, Steinmetz H, Dabringhaus A,
Roland PE, Zilles K. 1996. Asymmetry in the human motor cortex
and handedness. Neuroimage. 4:216--222.
Amunts K, Schleicher A, Burgel U, Mohlberg H, Uylings HBM, Zilles K.
1999. Broca’s region revisited: cytoarchitecture and intersubject
variability. J Comp Neurol. 412:319--341.
Amunts K, Weiss PH, Mohlberg H, Pieperhoff P, Eickhoff S, Gurd JM,
Marshall JC, Shah NJ, Fink GR, Zilles K. 2004. Analysis of neural
mechanisms underlying verbal fluency in cytoarchitectonically
defined stereotaxic space—the roles of Brodmann areas 44 and
45. Neuroimage. 22:42--56.
Aylward EH, Reiss AL, Reader MJ, Singer HS, Brown JE, Denckla MB.
1996. Basal ganglia volumes in children with attention-deficit
hyperactivity disorder. J Child Neurol. 11:112--115.
Barrick TR, Mackay CE, Prima S, Maes F, Vandermeulen D, Crow TJ,
Roberts N. 2005. Automatic analysis of cerebral asymmetry: an
exploratory study of the relationship between brain torque and
planum temporale asymmetry. Neuroimage. 24:678--691.
Basser PJ, Pajevic S, Pierpaoli C, Duda J, Aldroubi A. 2000. In vivo fiber
tractography using DT-MRI data. Magn Reson Med. 44:625--632.
Bassett DS, Bullmore E, Verchinski BA, Mattay VS, Weinberger DR,
Meyer-Lindenberg A. 2008. Hierarchical organization of human
cortical networks in health and schizophrenia. J Neurosci.
28:9239--9248.
Bassett DS, Meyer-Lindenberg A, Achard S, Duke T, Bullmore E. 2006.
Adaptive reconfiguration of fractal small-world human brain
functional networks. Proc Natl Acad Sci U S A. 103:19518--19523.
Behrens TE, Johansen-Berg H, Woolrich MW, Smith SM,
Wheeler-Kingshott CA, Boulby PA, Barker GJ, Sillery EL, Sheehan K,
Ciccarelli O, et al. 2003. Non-invasive mapping of connections
between human thalamus and cortex using diffusion imaging. Nat
Neurosci. 6:750--757.
Behrens TE, Woolrich MW, Jenkinson M, Johansen-Berg H, Nunes RG,
Clare S, Matthews PM, Brady JM, Smith SM. 2003. Characterization
and propagation of uncertainty in diffusion-weighted MR imaging.
Magn Reson Med. 50:1077--1088.
Bigler ED, Blatter DD, Anderson CV, Johnson SC, Gale SD, Hopkins RO,
Burnett B. 1997. Hippocampal volume in normal aging and
traumatic brain injury. Am J Neuroradiol. 18:11--23.
Bilir E, Craven W, Hugg J, Gilliam F, Martin R, Faught E, Kuzniecky R.
1998. Volumetric MRI of the limbic system: anatomic determinants.
Neuroradiology. 40:138--144.
Blair RC, Karniski W. 1993. An alternative method for significance
testing of wave-form difference potentials. Psychophysiology.
30:518--524.
Boccaletti S, Latora V, Moreno Y, Chavez M, Hwang D-U. 2006. Complex
networks: structure and dynamics. Phys Rep. 424:175--308.
Castellanos FX, Giedd JN, Berquin PC, Walter JM, Sharp W, Tran T,
Vaituzis AC, Blumenthal JD, Nelson J, Bastain TM, et al. 2001.
Quantitative brain magnetic resonance imaging in girls with
attention-deficit/hyperactivity disorder. Arch Gen Psychiatry.
58:289--295.
Chen ZJ, He Y, Rosa P, Germann J, Evans AC. 2008. Revealing modular
architecture of human brain structural networks by using cortical
thickness from MRI. Cereb Cortex. 18:2374--2381.
Clark C, Ulmer J, Gaggle W, Mark L. 2007. Structural asymmetries of
the normal human cingulum. Available at http://www
.marquette.edu/engineering/pages/AllYouNeed/Biomedical/Programs
/documents/codi_final.pdf. Accessed 1 April 2010.
Conturo TE, Lori NF, Cull TS, Akbudak E, Snyder AZ, Shimony JS,
McKinstry RC, Burton H, Raichle ME. 1999. Tracking neuronal fiber
pathways in the living human brain. Proc Natl Acad Sci U S A.
96:10422--10427.
Corbetta M, Shulman GL. 2002. Control of goal-directed and stimulus-
driven attention in the brain. Nat Rev Neurosci. 3:201--215.
Costa Lda F. 2005. Morphological complex networks: can individual
morphology determine the general connectivity and dynamics of
networks? Presented at the COSIN final meeting, Salou, Spain,
March. arXiv:q-bio/0503041v1 [q-bio.MN]. Available at http://
arxiv.org/abs/q-bio/0503041. Accessed 1 April 2010.
Cerebral Cortex January 2011, V 21 N 1 65
at University of M
anchester on January 27, 2014http://cercor.oxfordjournals.org/
Dow
nloaded from
Costa Lda F, Rodrigues FA, Travieso G, Villas PR. 2007. Characterization
of complex networks: A survey of measurements. Adv. Phys.
56(1):167--242.
Costa Lda F, Sporns O. 2005. Hierarchical features of large-scale cortical
connectivity. Eur Phys J B. 48:567--573.
Dadda M, Cantalupo C, Hopkins WD. 2006. Further evidence of an
association between handedness and neuroanatomical asymmetries
in the primary motor cortex of chimpanzees (Pan troglodytes).
Neuropsychologia. 44:2582--2586.
Dall’Asta L, Barrat A, Barthelemy M, Vespignani A. 2006. Vulnerability of
weighted networks. J Stat Mech. Published online April 27, doi:
10.1088/1742-5468/2006/04/P04006.
Embleton KV, Lambon Ralph MA, Parker GJ. 2006. A combined
distortion corrected protocol for diffusion weighted tractography
and fMRI. ISMRM 14th Scientific Meeting & Exhibition; 2006 May 6--
12; Seattle, WA. Vol. 14, 1070 p.
Fawcett T. 2006. An introduction to ROC analysis. Pattern Recog Lett.
27:861--874.
Filipek PA, Semrud-Clikeman M, Steingard RJ, Renshaw PF,
Kennedy DN, Biederman J. 1997. Volumetric MRI analysis compar-
ing subjects having attention-deficit hyperactivity disorder with
normal controls. Neurology. 48:589--601.
Fink GR, Marshall JC, Shah NJ, Weiss PH, Halligan PW, Grosse-Ruyken M,
Ziemons K, Zilles K, Freund HJ. 2000. Line bisection judgments
implicate right parietal cortex and cerebellum as assessed by fMRI.
Neurology. 54:1324--1331.
Fink GR, Marshall JC, Weiss PH, Zilles K. 2001. The neural basis of
vertical and horizontal line bisection judgments: an fMRI study of
normal volunteers. Neuroimage. 14:S59--S67.
Free SL, Bergin PS, Fish DR, Cook MJ, Shorvon SD, Stevens JM. 1995.
Methods for normalization of hippocampal volumes measured with
MR. Am J Neuroradiol. 16:637--643.
Freeman L. 1977. A set of measures of centrality based upon
betweenness. Sociometry. 40:35--41.
Galan L, Biscay R, Rodriguez JL, PerezAbalo MC, Rodriguez R. 1997.
Testing topographic differences between event related brain
potentials by using non-parametric combinations of permutation
tests. Electroencephalogr Clin Neurophysiol. 102:240--247.
Gannon PJ, Kheck N, Hof PR. 2008. Leftward interhemispheric
asymmetry of macaque monkey temporal lobe language area
homolog is evident at the cytoarchitectural, but not gross anatomic
level. Brain Res. 1199:62--73.
Gil-Da-Costa R, Braun A, Lopes M, Hauser MD, Carson RE,
Herscovitch P, Martin A. 2004. Toward an evolutionary perspective
on conceptual representation: species-specific calls activate visual
and affective processing systems in the macaque. Proc Natl Acad Sci
U S A. 101:17516--17521.
Glasser MF, Rilling JK. 2008. DTI tractography of the human brain’s
language pathways. Cereb Cortex. 18:2471--2482.
Gong GL, He Y, Concha L, Lebel C, Gross DW, Evans AC, Beaulieu C.
2009. Mapping anatomical connectivity patterns of human cerebral
cortex using in vivo diffusion tensor imaging tractography. Cereb
Cortex. 19:524--536.
Gong GL, Jiang TZ, Zhu CZ, Zang YF, Wang F, Xie S, Xiao JX, Gu XM. 2005.
Asymmetry analysis of cingulum based on scale-invariant parameter-
ization by diffusion tensor imaging. Hum Brain Mapp. 24:92--98.
Good CD, Johnsrude I, Ashburner J, Henson RNA, Friston KJ,
Frackowiak RSJ. 2001a. Cerebral asymmetry and the effects of sex
and handedness on brain structure: a voxel-based morphometric
analysis of 465 normal adult human brains. Neuroimage. 14:685--700.
Good CD, Johnsrude IS, Ashburner J, Henson RNA, Friston KJ,
Frackowiak RSJ. 2001b. A voxel-based morphometric study of
ageing in 465 normal adult human brains. Neuroimage. 14:21--36.
Graybiel AM. 2005. The basal ganglia: learning new tricks and loving it.
Curr Opin Neurobiol. 15:638--644.
Hagmann P, Cammoun L, Gigandet X, Meuli R, Honey CJ, Wedeen V,
Sporns O. 2008. Mapping the structural core of human cerebral
cortex. PLoS Biol. 6:1479--1493.
Hagmann P, Cammoun L, Martuzzi R, Maeder P, Clarke S, Thiran JP,
Meuli R. 2006. Hand preference and sex shape the architecture of
language networks. Hum Brain Mapp. 27:828--835.
Hagmann P, Kurant M, Gigandet X, Thiran P, Wedeen VJ, Meuli R,
Thiran JP. 2006. Imaging the brain neuronal network with diffusion
MRI: a way to understand its global architecture. ISMRM 14th
Scientific Meeting & Exhibition; 2006 May 6--12; Seattle, WA. Vol. 14,
436 p.
Halligan PW, Fink GR, Marshall JC, Vallar G. 2003. Spatial cognition:
evidence from visual neglect. Trends Cogn Sci. 7:125--133.
Haroon HA, Morris DM, Embleton KV, Alexander DC, Parker GJM. 2009.
Using the model-based residual bootstrap to quantify uncertainty in
fiber orientations from Q-ball analysis. IEEE Trans Med Imaging.
28:535--550.
Haroon HA, Morris DM, Kaiser A, Augath M, Logothetis NK, Parker GJ.
2008. Comparing corticocortical interconnection information from
tracer studies and probabilistic tractography in the postmortem
macaque brain. ISMRM 16th Scientific Meeting & Exhibition; 2008
May 3--9; Toronto, Ontario, Canada, p. 3369.
He Y, Chen ZJ, Evans AC. 2007. Small-world anatomical networks in the
human brain revealed by cortical thickness from MRI. Cereb Cortex.
17:2407--2419.
He Y, Chen Z, Evans AC. 2008. Structural insights into aberrant
topological patterns of large-scale cortical networks in Alzheimer’s
disease. J Neurosci. 28:4756--4766.
Heffner HE, Heffner RS. 1984. Temporal lobe lesions and perception
of species-specific vocalizations by macaques. Science. 226:
75--76.
Honey CJ, Kotter R, Breakspear M, Sporns O. 2007. Network structure
of cerebral cortex shapes functional connectivity on multiple time
scales. Proc Natl Acad Sci U S A. 104:10240--10245.
Husain M, Rorden C. 2003. Non-spatially lateralized mechanisms in
hemispatial neglect. Nat Rev Neurosci. 4:26--36.
Iturria-Medina Y, Canales-Rodrıguez EJ, Melie-Garcıa L, Valdes-
Hernandez PA, Martınez-Montes E, Aleman-Gomez Y, Sanchez-
Bornot JM. 2007. Characterizing brain anatomical connections
using diffusion weighted MRI and graph theory. Neuroimage.
36:645--660.
Iturria-Medina Y, Sotero RC, Canales-Rodriguez EJ, Aleman-Gomez Y,
Melie-Garcia L. 2008. Studying the human brain anatomical network
via diffusion-weighted MRI and Graph Theory. Neuroimage.
40:1064--1076.
Juch H, Zimine I, Seghier ML, Lazeyras F, Fasel JHD. 2005. Anatomical
variability of the lateral frontal lobe surface: implication for
intersubject variability in language neuroimaging. Neuroimage.
24:504--514.
Keller SS, Crow T, Foundas A, Amunts K, Roberts N. 2009. Broca’s area:
nomenclature, anatomy, typology and asymmetry. Brain Lang.
109:29--48.
Koch MA, Norris DG, Hund-Georgiadis M. 2002. An investigation of
functional and anatomical connectivity using magnetic resonance
imaging. Neuroimage. 16:241--250.
Kubicki M, Westin CF, Maier SE, Frumin M, Nestor PG,
Salisbury DF, Kikinis R, Jolesz FA, McCarley RW, Shenton ME.
2002. Uncinate fasciculus findings in schizophrenia: a magnetic
resonance diffusion tensor imaging study. Am J Psychiatry. 159:
813--820.
Latora V, Marchiori M. 2001. Efficient behavior of small-world networks.
Phys Rev Lett. 87:198701.
Lerch JP, Worsley K, Shaw WP, Greenstein DK, Lenroot RK, Giedd J,
Evans AC. 2006. Mapping anatomical correlations across cerebral
cortex (MACACC) using cortical thickness from MRI. Neuroimage.
31:993--1003.
Lewis JW, Van Essen DC. 2000. Mapping of architectonic subdivisions in
the macaque monkey, with emphasis on parieto-occipital cortex.
J Comp Neurol. 428:79--111.
Li YH, Liu Y, Li J, Qin W, Li KC, Yu CS, Jiang TZ. 2009. Brain anatomical
network and intelligence. PLoS Comput Biol. 5:e1000395.
Lindenberg R, Fangerau H, Seitz RJ. 2007. ‘‘Broca’s area’’ as a collective
term? Brain Lang. 102:22--29.
Luders E, Narr KL, Thompson PM, Rex DE, Jancke L, Toga AW. 2006.
Hemispheric asymmetries in cortical thickness. Cereb Cortex.
16:1232--1238.
66 Brain Hemispheric Structural Efficiency and Interconnectivity Rightward Asymmetry d Iturria-Medina et al.
at University of M
anchester on January 27, 2014http://cercor.oxfordjournals.org/
Dow
nloaded from

Mazziotta J, Toga A, Evans A, Fox P, Lancaster J, Zilles K, Woods R,
Paus T, Simpson G, Pike B, et al. 2001. A four-dimensional
probabilistic atlas of the human brain. J Am Med Inform Assoc.
8:401--430.
Mazziotta JC, Toga AW, Evans A, Fox P, Lancaster J. 1995. A probabilistic
atlas of the human brain: theory and rationale for its development.
The International Consortium for Brain Mapping (ICBM). Neuro-
image. 2:89--101.
Mori S, Crain BJ, Chacko VP, van Zijl PC. 1999. Three-dimensional
tracking of axonal projections in the brain by magnetic resonance
imaging. Ann Neurol. 45:265--269.
Morris DM, Embleton KV, Parker GJM. 2008. Probabilistic fibre tracking:
differentiation of connections from chance events. Neuroimage.
42:1329--1339.
Niznikiewicz M, Donnino R, McCarley RW, Nestor PG,
Iosifescu DV, O’Donnell B, Levitt J, Shenton ME. 2000. Abnormal
angular gyrus asymmetry in schizophrenia. Am J Psychiatry. 157:
428--437.
Onnela JP, Saramaki J, Kertesz J, Kaski K. 2005. Intensity and coherence
of motifs in weighted complex networks. Phys Rev E. 71:065103.
Packard MG, Knowlton BJ. 2002. Learning and memory functions of the
basal ganglia. Annu Rev Neurosci. 25:563--593.
Parker GJM, Alexander DC. 2005. A mechanism for probabilistic fibre
tracking using multi-fibre orientation functions. ISMRM Workshop
on Methods for Quantitative Diffusion MRI of the brain; 2005 March
13--16; Lake Louise, Alberta, Canada. 74 p.
Parker GJM, Haroon HA, Wheeler-Kingshott CA. 2003. A framework for
a streamline-based probabilistic index of connectivity (PICo) using
a structural interpretation of MRI diffusion measurements. J Magn
Reson Imaging. 18:242--254.
Parker GJM, Wheeler-Kingshott CA, Barker GJ. 2002. Estimating
distributed anatomical connectivity using fast marching methods
and diffusion tensor imaging. IEEE Trans Med Imaging. 21:505--512.
Parker GJM, Luzzi S, Alexander DC, Wheeler-Kingshott CAM,
Clecarelli O, Ralph MAL. 2005. Lateralization of ventral and dorsal
auditory-language pathways in the human brain. Neuroimage. 24:
656--666.
Paus T, Otaky N, Caramanos Z, MacDonald D, Zijdenbos A, DAvirro D,
Gutmans D, Holmes C, Tomaiuolo F, Evans AC. 1996. In vivo
morphometry of the intrasulcal gray matter in the human cingulate,
paracingulate, and superior-rostral sulci: hemispheric asymmetries,
gender differences and probability maps. J Comp Neurol.
376:664--673.
Pegues MP, Rogers LJ, Amend D, Vinogradov S, Deicken RF. 2003.
Anterior hippocampal volume reduction in male patients with
schizophrenia. Schizophr Res. 60:105--115.
Poremba A, Malloy M, Saunders RC, Carson RE, Herscovitch P,
Mishkin M. 2004. Species-specific calls evoke asymmetric activity
in the monkey’s temporal poles. Nature. 427:448--451.
Powell HWR, Parker GJM, Alexander DC, Symms MR, Boulby PA,
Wheeler-Kingshott CAM, Barker GJ, Noppeney U, Koepp MJ,
Duncan JS. 2006. Hemispheric asymmetries in language-related
pathways: a combined functional MPI and tractography study.
Neuroimage. 32:388--399.
Price CJ. 2000. The anatomy of language: contributions from functional
neuroimaging. J Anat. 197:335--359.
Pueyo R, Maneru C, Vendrell P, Mataro N, Estevez-Gonzalez A, Garcia-
Sanchez C, Junque C. 2000. Attention deficit hyperactivity disorder.
Cerebral asymmetry observed on magnetic resonance. Rev Neurol.
30:920--925.
Rodrigo S, Naggara O, Oppenheirn C, Golestani N, Poupon C,
Cointepas Y, Mangin JF, Le Bihan D, Meder JF. 2007. Human
subinsular asymmetry studied by diffusion tensor Imaging and fiber
tracking. Am J Neuroradiol. 28:1526--1531.
Rogers BP, Carew JD, Meyerand ME. 2004. Hemispheric asymmetry in
supplementary motor area connectivity during unilateral finger
movements. Neuroimage. 22:855--859.
Schrimsher GW, Billingsley RL, Jackson EF, Moore BD. 2002. Caudate
nucleus volume asymmetry predicts attention-deficit hyperactivity
disorder (ADHD) symptomatology in children. J Child Neurol.
17:877--884.
Sporns O. 2006. Small-world connectivity, motif composition, and
complexity of fractal neuronal connections. Biosystems. 85:55--64.
Sporns O, Zwi JD. 2004. The small world of the cerebral cortex.
Neuroinformatics. 2:145--162.
Sugama S, Bingham PM, Wang PP, Moss EM, Kobayashi H, Eto Y. 2000.
Morphometry of the head of the caudate nucleus in patients with
velocardiofacial syndrome (del 22q11.2). Acta Paediatr. 89:546--549.
Toga A, Thompson P, Susumu M, Amunts K, Zilles K. 2006. Towards
multimodal atlases of the human brain. Nat Rev Neurosci.
7(12):952--966.
Tremols V, Bielsa A, Soliva JC, Raheb C, Carmona S, Tomas J, Gispert JD,
Rovira M, Fauquet J, Tobena A, et al. 2008. Differential abnormalities
of the head and body of the caudate nucleus in attention deficit-
hyperactivity disorder. Psychiat Res Neuroimaging. 163:270--278.
Tuch DS. 2004. Q-ball imaging. Magn Reson Med. 52:1358--1372.
Tuch DS, Reese TG, Wiegell MR, Wedeen VJ. 2003. Diffusion MRI of
complex neural architecture. Neuron. 40:885--895.
Vallar G. 1998. Spatial hemineglect in humans. Trends Cogn Sci.
2:87--97.
Van Essen DC. 1997. A tension-based theory of morphogenesis and
compact wiring in the central nervous system. Nature. 385:313--318.
Wang JH, Wang L, Zang YF, Yang H, Tang HH, Gong QY, Chen Z,
Zhu CZ, He Y. 2009. Parcellation-dependent small-world brain
functional networks: a resting-state fMRI study. Hum Brain Mapp.
30:1511--1523.
Watkins KE, Paus T, Lerch JP, Zijdenbos A, Collins DL, Neelin P, Taylor J,
Worsley KJ, Evans AC. 2001. Structural asymmetries in the human
brain: a voxel-based statistical analysis of 142 MRI scans. Cereb
Cortex. 11:868--877.
Watts DJ, Strogatz SH. 1998. Collective dynamics of small-world
networks. Nature. 393(6684):440--442.
Cerebral Cortex January 2011, V 21 N 1 67
at University of M
anchester on January 27, 2014http://cercor.oxfordjournals.org/
Dow
nloaded from
Related Documents