Article Brain and Body Associations Between EEG-Vigilance and the Autonomous Nervous System Activity During Rest Sebastian Olbrich, 1,2,4 Christian Sander, 1,4 Herbert Matschinger, 3 Roland Mergl, 1 Maja Trenner, 1 Peter Schönknecht, 1,4 and Ulrich Hegerl 1,2,4 1 Department of Psychiatry and Psychotherapy, University Hospital Leipzig, Germany, 2 Leipzig University Medical Centre, IFB Adiposity Diseases, Leipzig, Germany, 3 Institute for Social Medicine, Occupational Medicine and Public Health, University Leipzig, Germany, 4 LIFE – Leipzig Research Centre for Civilization Diseases, University Leipzig, Germany Abstract. The temporal dynamics of electroencephalogram (EEG)-vigilance as a measure of tonic cortical arousal are discussed as pathogenetic factors in neuropsychiatric disorders. Although there is broad knowledge about the interaction of cortical arousal and activity of the autonomous nervous system (ANS) during different sleep stages, the association and temporal interaction between fine-graded EEG-vigilance stages and markers of sympathetic and parasympathetic activity during the transition from wakefulness to sleep onset warrants more detailed exploration and was focus of the presented study. A 15-min resting-EEG, electrocardiogram (ECG), and skin conductance level (SCL) were recorded from 54 healthy subjects. Using an EEG-algorithm (VIGALL), 1-s segments were classified into seven different vigilance stages. Associations and temporal interactions between EEG-vigilance stages and heart rate variability (HRV), heart rate (HR), and SCL were computed using correlation analysis, regression analysis, and cross-correlations of EEG-vigilance and ANS time series. EEG-vigilance stages and ANS activity showed a significant association between increased HRV parameters including total and (normalized) very low frequency power and low vigilance stages. Regression analysis revealed significantly increased values of SCL and HR for high vigilance stages in comparison to lower ones. In these relationships, for SCL but not HR most of the covariance was explained by the effect of time. Phasic increases in EEG-vigilance were paralleled by significant increases of HR but not of SCL. Cross-correlations between EEG-vigilance and ANS time series yielded highest correlations when there was no or only a minimal temporal lag. ANS activity during the transition from wakefulness to sleep onset gradually changes along with different fine-graded EEG-vigilance stages. Associations between cortical and autonomic activity are better reflected by HR than by SCL. Keywords: EEG-vigilance, arousal, autonomic nervous system, autonomic space, heart rate variability, skin conductance level Different states of global cortical arousal can be separated not only during sleep but also during wakefulness. The elec- troencephalogram (EEG) is the best tool to separate different levels of brain activation, termed EEG-vigilance stages, and to study their dynamics under defined conditions. Recently, interest in the analysis of EEG-vigilance regulation has increased because the temporal dynamics of EEG-vigilance are discussed as pathogenetic factors in patients with affec- tive disorders (Hegerl, Olbrich, Scho ¨nknecht, & Sander, 2008; Hegerl, Sander, Olbrich, & Schoenknecht, 2009), attention-deficit/hyperactivity disorder (Hegerl, Himmerich, Engmann, & Hensch, 2010; Sander, Arns, Olbrich, & Hegerl, 2010), or cancer-related fatigue (Olbrich, Sander, Jahn, Eplinius, Claus, Mergl, ... Hegerl, 2011). Besides changes of cortical vigilance stages, the autono- mous nervous system (ANS) also adapts its activity to altered needs of the organism with decreases of parasympa- thetic activity and increases of sympathetic activity during mental, physical, or emotional activation (Barry, Clarke, Johnstone, Brown, Bruggemann, & Van Rijbroek, 2009; Kreibig, Wilhelm, Roth, & Gross, 2007; Pattyn, Neyt, Henderickx, & Soetens, 2008; VaezMousavi, Barry, & Clarke, 2009; Vico, Guerra, Robles, Vila, & Anllo-Vento, 2010) and increased parasympathetic activity and decreased sympathetic activity during rest (Kuo, Shaw, Lai, & Yang, 2008; Penzel, Kantelhardt, Lo, Voigt, & Vogelmeier, 2003; Silvani, 2008). Many studies focused on the association between sleep/rest and ANS function. Consistent findings suggest sleep-dependent alterations of ANS parameters such as heart rate (HR), heart rate variability (HRV), or skin con- ductance level (SCL) with decreasing HR (Burgess, Trinder, & Kim, 1999; Trinder, Kleiman, Carrington, Smith, Breen, Tan, & Kim, 2001), decreasing low frequency (LF), and increasing high frequency (HF) power of HRV (Bonnet & Arand, 1997) as well as decreasing SCL being a function of sleep stages (Doberenz, Roth, Wollburg, Breuninger, & Kim, 2010; Hori, 1982; Hori & Fujisawa, 1977; Hori, Miya- sita, & Niimi, 1970). These findings reflect a shift of sym- pathovagal balance toward parasympathetic predominance during the decline of vigilance. Other markers of ANS Journal of Psychophysiology 2011; Vol. 25(4):190–200 DOI: 10.1027/0269-8803/a000061 Hogrefe Publishing Ó 2011 Federation of European Psychophysiology Societies

Welcome message from author
This document is posted to help you gain knowledge. Please leave a comment to let me know what you think about it! Share it to your friends and learn new things together.
Transcript
Article
Brain and BodyAssociations Between EEG-Vigilance and
the Autonomous Nervous System Activity During Rest
Sebastian Olbrich,1,2,4 Christian Sander,1,4 Herbert Matschinger,3
Roland Mergl,1 Maja Trenner,1 Peter Schönknecht,1,4 and Ulrich Hegerl1,2,4
1Department of Psychiatry and Psychotherapy, University Hospital Leipzig, Germany, 2LeipzigUniversity Medical Centre, IFB Adiposity Diseases, Leipzig, Germany, 3Institute for Social Medicine,
Occupational Medicine and Public Health, University Leipzig, Germany, 4LIFE – Leipzig ResearchCentre for Civilization Diseases, University Leipzig, Germany
Abstract. The temporal dynamics of electroencephalogram (EEG)-vigilance as a measure of tonic cortical arousal are discussed as pathogeneticfactors in neuropsychiatric disorders. Although there is broad knowledge about the interaction of cortical arousal and activity of the autonomousnervous system (ANS) during different sleep stages, the association and temporal interaction between fine-graded EEG-vigilance stages andmarkers of sympathetic and parasympathetic activity during the transition from wakefulness to sleep onset warrants more detailed exploration andwas focus of the presented study. A 15-min resting-EEG, electrocardiogram (ECG), and skin conductance level (SCL) were recorded from 54healthy subjects. Using an EEG-algorithm (VIGALL), 1-s segments were classified into seven different vigilance stages. Associations andtemporal interactions between EEG-vigilance stages and heart rate variability (HRV), heart rate (HR), and SCL were computed using correlationanalysis, regression analysis, and cross-correlations of EEG-vigilance and ANS time series. EEG-vigilance stages and ANS activity showed asignificant association between increased HRV parameters including total and (normalized) very low frequency power and low vigilance stages.Regression analysis revealed significantly increased values of SCL and HR for high vigilance stages in comparison to lower ones. In theserelationships, for SCL but not HR most of the covariance was explained by the effect of time. Phasic increases in EEG-vigilance were paralleledby significant increases of HR but not of SCL. Cross-correlations between EEG-vigilance and ANS time series yielded highest correlations whenthere was no or only a minimal temporal lag. ANS activity during the transition from wakefulness to sleep onset gradually changes along withdifferent fine-graded EEG-vigilance stages. Associations between cortical and autonomic activity are better reflected by HR than by SCL.
Keywords: EEG-vigilance, arousal, autonomic nervous system, autonomic space, heart rate variability, skin conductance level
Different states of global cortical arousal can be separatednot only during sleep but also during wakefulness. The elec-troencephalogram (EEG) is the best tool to separate differentlevels of brain activation, termed EEG-vigilance stages, andto study their dynamics under defined conditions. Recently,interest in the analysis of EEG-vigilance regulation hasincreased because the temporal dynamics of EEG-vigilanceare discussed as pathogenetic factors in patients with affec-tive disorders (Hegerl, Olbrich, Schonknecht, & Sander,2008; Hegerl, Sander, Olbrich, & Schoenknecht, 2009),attention-deficit/hyperactivity disorder (Hegerl, Himmerich,Engmann, & Hensch, 2010; Sander, Arns, Olbrich, &Hegerl, 2010), or cancer-related fatigue (Olbrich, Sander,Jahn, Eplinius, Claus, Mergl, . . . Hegerl, 2011).
Besides changes of cortical vigilance stages, the autono-mous nervous system (ANS) also adapts its activity toaltered needs of the organism with decreases of parasympa-thetic activity and increases of sympathetic activity duringmental, physical, or emotional activation (Barry, Clarke,Johnstone, Brown, Bruggemann, & Van Rijbroek, 2009;
Kreibig, Wilhelm, Roth, & Gross, 2007; Pattyn, Neyt,Henderickx, & Soetens, 2008; VaezMousavi, Barry, &Clarke, 2009; Vico, Guerra, Robles, Vila, & Anllo-Vento,2010) and increased parasympathetic activity and decreasedsympathetic activity during rest (Kuo, Shaw, Lai, & Yang,2008; Penzel, Kantelhardt, Lo, Voigt, & Vogelmeier, 2003;Silvani, 2008). Many studies focused on the associationbetween sleep/rest and ANS function. Consistent findingssuggest sleep-dependent alterations of ANS parameters suchas heart rate (HR), heart rate variability (HRV), or skin con-ductance level (SCL) with decreasing HR (Burgess, Trinder,& Kim, 1999; Trinder, Kleiman, Carrington, Smith, Breen,Tan, & Kim, 2001), decreasing low frequency (LF), andincreasing high frequency (HF) power of HRV (Bonnet &Arand, 1997) as well as decreasing SCL being a functionof sleep stages (Doberenz, Roth, Wollburg, Breuninger, &Kim, 2010; Hori, 1982; Hori & Fujisawa, 1977; Hori, Miya-sita, & Niimi, 1970). These findings reflect a shift of sym-pathovagal balance toward parasympathetic predominanceduring the decline of vigilance. Other markers of ANS
Journal of Psychophysiology 2011; Vol. 25(4):190–200DOI: 10.1027/0269-8803/a000061
Hogrefe Publishing
� 2011 Federation of European Psychophysiology Societies
activity like the standard deviation of R-R intervals (SDNN),the total spectral power of HRV (total power, TP), or the(normalized) very low frequency component (nVLF) havealso been reported to change in parallel with differentsleep stages (Busek, Vankova, Opavsky, Salinger, &Nevsımalova, 2005; Kesek, Franklin, Sahlin, & Lindberg,2009), but the interpretation of these findings remains diffi-cult since SDNN and TP are dependent on the length of therecording and VLF is influenced by several mechanisms thatare not directly related to the activity of the ANS, for exam-ple, the activity of the renin-angiotensin system (Taylor,Carr, Myers, & Eckberg, 1998).
Although the basic principles of ANS function and itsassociation with different sleep stages are known, there is stilla lack of knowledge about the interaction of ANS parametersand cortical arousal during rest. Most studies confined them-selves to measuring cortical arousal by means of only sleepstaging according to Rechtschaffen and Kales (1968), whichis moreover a method with a relatively low temporal resolu-tion of 30 s (for a critique see Himanen & Hasan, 2000).Additionally, ANS parameters are often averaged over longtime segments or even the whole recording period. However,for a detailed analysis of the interaction between corticalarousal and ANS activity during rest, a less coarse classifica-tion and a higher temporal resolution of cortical arousal areneeded. Therefore a computer-based algorithm has beendeveloped (VIGALL, Vigilance Algorithm Leipzig) thatallows the classification of 1-s EEG-segments into seven dif-ferent EEG-vigilance stages associated with different statesof wakefulness ranging from high alertness after closingthe eyes to drowsiness and sleep onset (Guenther et al.,2011; Olbrich et al., 2009). An advantage of VIGALL incomparison to simple frequency-power measures is that vig-ilance stages can be classified for each segment withoutknowledge of preceding or following segments because thecriteria used are not relative but absolute.
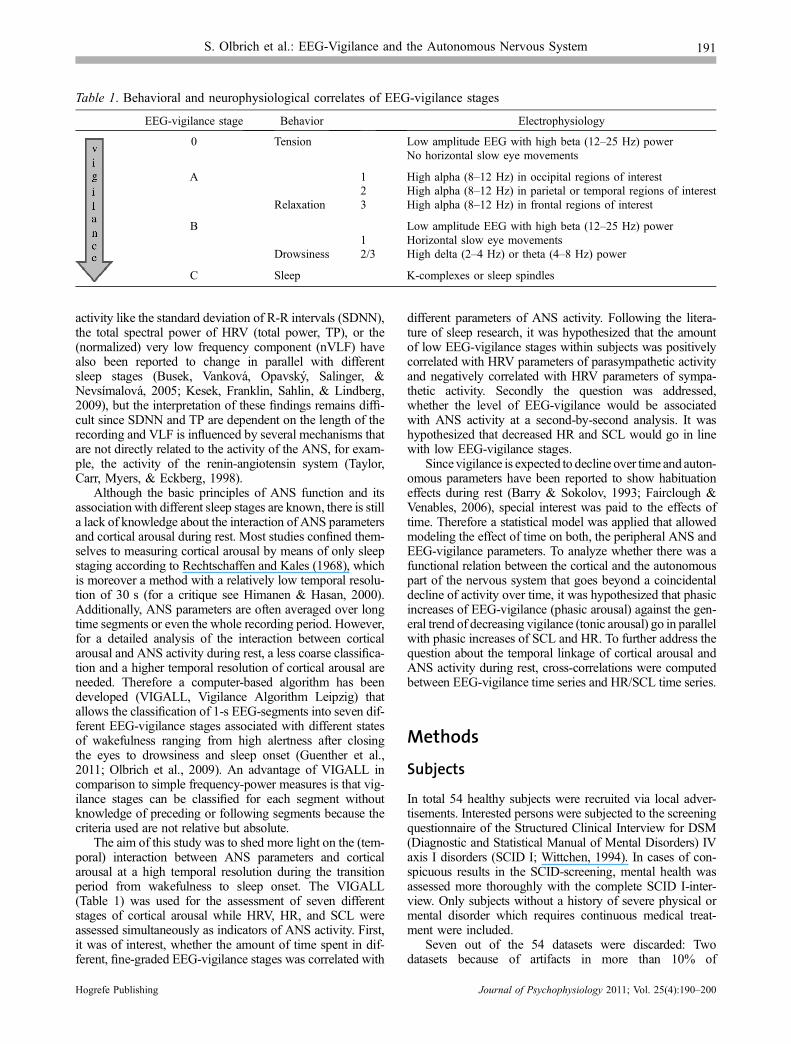
The aim of this study was to shed more light on the (tem-poral) interaction between ANS parameters and corticalarousal at a high temporal resolution during the transitionperiod from wakefulness to sleep onset. The VIGALL(Table 1) was used for the assessment of seven differentstages of cortical arousal while HRV, HR, and SCL wereassessed simultaneously as indicators of ANS activity. First,it was of interest, whether the amount of time spent in dif-ferent, fine-graded EEG-vigilance stages was correlated with
different parameters of ANS activity. Following the litera-ture of sleep research, it was hypothesized that the amountof low EEG-vigilance stages within subjects was positivelycorrelated with HRV parameters of parasympathetic activityand negatively correlated with HRV parameters of sympa-thetic activity. Secondly the question was addressed,whether the level of EEG-vigilance would be associatedwith ANS activity at a second-by-second analysis. It washypothesized that decreased HR and SCL would go in linewith low EEG-vigilance stages.
Since vigilance is expected to decline over time and auton-omous parameters have been reported to show habituationeffects during rest (Barry & Sokolov, 1993; Fairclough &Venables, 2006), special interest was paid to the effects oftime. Therefore a statistical model was applied that allowedmodeling the effect of time on both, the peripheral ANS andEEG-vigilance parameters. To analyze whether there was afunctional relation between the cortical and the autonomouspart of the nervous system that goes beyond a coincidentaldecline of activity over time, it was hypothesized that phasicincreases of EEG-vigilance (phasic arousal) against the gen-eral trend of decreasing vigilance (tonic arousal) go in parallelwith phasic increases of SCL and HR. To further address thequestion about the temporal linkage of cortical arousal andANS activity during rest, cross-correlations were computedbetween EEG-vigilance time series and HR/SCL time series.
Methods
Subjects
In total 54 healthy subjects were recruited via local adver-tisements. Interested persons were subjected to the screeningquestionnaire of the Structured Clinical Interview for DSM(Diagnostic and Statistical Manual of Mental Disorders) IVaxis I disorders (SCID I; Wittchen, 1994). In cases of con-spicuous results in the SCID-screening, mental health wasassessed more thoroughly with the complete SCID I-inter-view. Only subjects without a history of severe physical ormental disorder which requires continuous medical treat-ment were included.
Seven out of the 54 datasets were discarded: Twodatasets because of artifacts in more than 10% of
Table 1. Behavioral and neurophysiological correlates of EEG-vigilance stages
EEG-vigilance stage Behavior Electrophysiology
0 Tension Low amplitude EEG with high beta (12–25 Hz) powerNo horizontal slow eye movements
A 1 High alpha (8–12 Hz) in occipital regions of interest2 High alpha (8–12 Hz) in parietal or temporal regions of interest
Relaxation 3 High alpha (8–12 Hz) in frontal regions of interest
B Low amplitude EEG with high beta (12–25 Hz) power1 Horizontal slow eye movements
Drowsiness 2/3 High delta (2–4 Hz) or theta (4–8 Hz) power
C Sleep K-complexes or sleep spindles
S. Olbrich et al.: EEG-Vigilance and the Autonomous Nervous System 191
Hogrefe Publishing Journal of Psychophysiology 2011; Vol. 25(4):190–200

EEG-segments, three because of technical problems withSCL and ECG channels, and two because subjects hadnot followed the instruction to keep eyes closed throughoutthe resting period as revealed by visual inspection of theEEG and EOG channels (see EEG-Recording and Process-ing section). The remaining datasets of 47 subjects with 900consecutive 1 s segments of resting period were included inthe final analysis (average age 23.96 years; 32 females).
The study was approved by the local Ethics Committee.Written and informed consent was obtained from each par-ticipant prior to investigation according to the Declaration ofHelsinki. All subjects received a small honorarium of €7 perhour for their participation (2–3 hrs in total).
EEG-Recording and Processing
Recording began at about 3 p.m. The participants were com-fortably seated in a reclining chair in half lying position(approximately 45� inclination) in a dimly lit (light approxi-mately 40 lx) and sound attenuated room. The average roomtemperature in the EEG-cabin was maintained at 20–23 �C.Fifteen minutes of resting-EEG were recorded with closedeyes. Participants were instructed to relax and not to fight apossibly occurring urge to fall asleep. The EEGwas recordedwith a 40 channel QuickAmp amplifier (Brain ProductsGmbH,Gilching,Germany) from31electrode sites accordingto the extended international 10-20 system at a sampling rateof 1 kHz, referenced against common average. Impedanceswere kept below 10 kX. EOG was recorded with a bipolarchannel of the QuickAmp device. Electrodes were placedabove the upper left eye and under the lower right eye. Stan-dardized auditory instructions were given using Presentationsoftware (Neurobehavioral Systems, Albany, NY). EEG datawere preprocessed using BrainVision Analyzer 2.0 software(Brain Products GmbH, Gilching, Germany). EEG raw datawere filtered at 70 Hz (low-pass), 0.5 Hz (high-pass), and50 Hz (notch-filter, range 5 Hz). EOG channels werescreened for periods of open eyes. Eye movement artifactswere removedbyextracting1–3 independent components thatclearly representedvertical andhorizontal eyemovements andhadbeen identifiedby visual topographic inspection and com-parison with the EOG channel (Delorme, Sejnowski, &Makeig, 2007) before EEG-time series were segmented intoconsecutive 1-s intervals. Segments were again screened forremaining muscle, movement, eye, and sweating artifacts.Artifacts were marked for exclusion from further analysis.
EEG-Vigilance Staging
Segments were classified into seven different EEG-vigilancestages (Table 1) using the VIGALL. This vigilanceclassification is based on the work of Loomis, Harvey, andHobart (1937), which was further refined by Bente (1964)and Roth (1961). The resulting EEG-patterns have been con-firmed by other research groups to yield information aboutvigilance stages (Benca, Obermeyer, Larson, Yun, Dolski,Kleist, Weber, . . . Davidson, 1999; Corsi-Cabrera, Guevara,Del Rıo-Portilla, Arce, & Villanueva-Hernandez, 2000; DeGennaro & Ferrara, 2003; De Gennaro, Ferrara, & Bertini,
2001; De Gennaro, Ferrara, Curcio, & Cristiani, 2001; DeGennaro et al., 2004; Santamaria & Chiappa, 1987; Tanaka,Hayashi, & Hori, 1997, 2000; Tsuno, Shigeta, Hyoki, Faber,& Lehmann, 2004; Tsuno et al., 2002). Different EEG-vigi-lance stages have been associated with different cortical andsubcortical blood oxygen level dependent (BOLD) signalsin a simultaneous EEG/fMRI study (Olbrich et al., 2009).More recently, the discriminative power ofVIGALLhas beendemonstrated by revealing decreased EEG-vigilance inpatients suffering from cancer-related fatigue in comparisonto healthy controls (Olbrich et al., 2011).
Complex demodulation of the EEG-frequency bandsdelta, theta, alpha, and theta was computed for all EEG-channels to obtain the frequency band envelope magnitudein lV2 to approximate the power of the underlying signal(Schroeder & Barr, 2000).
Using the LORETA module of the Vision Analyzer soft-ware the intracortical averaged squared current densities offrequency band power in lA2
mm4 in four predefined regions ofinterest (ROIs) were calculated. The occipital ROI consistedof the occipital lobe and the cuneus, the parietal ROI con-sisted of the superior and inferior parietal lobe, the temporalROI consisted of the inferior temporal lobe, and the frontalROI consisted of the anterior cingulate gyrus and the medialfrontal gyrus.
In a next step, segmentswere classified based on theEEG-power information of the four ROIs and additional informa-tion of the EOG channel amplitude (Table 1). To avoidmisclassification of low amplitude EEG-segments (definedas sum of total power <= 20 lA2
mm4 per data point in at leastone ROI) that reflect desynchronization during states of highalertness, the previous version of the algorithm (Olbrich et al.,2009) has been extended with an additional high vigilancestage 0 that is characterized by desynchronized EEGwithout slow eye movements (SEMs). Stage A1 is markedbydominant (alpha power > 2/3 of total power) alpha activityin the occipital ROI (occipital ROI alpha power > = 3x pari-etal and frontal ROI alpha power), stage A2 by increasedalpha activity in temporal and parietal ROIs (occipital ROIalpha power < 3x parietal and frontal ROI alpha power;temporal and parietal ROI alpha power > = 1.5x frontalROI alpha power), and stage A3 by increased alpha activityin the frontal ROI (temporal and parietal ROI alpha power-< 1.5x frontal ROI alpha power). Stage B1 is marked bylow amplitude non-alpha EEG with SEMs (ampli-tude > 200 lV) and stage B2/3 by increasing theta and deltapower (delta power + theta power > = 1/3 of total power).Sleep onset corresponds to stage C, characterized by sleepspindles and/or K-complexes that have been marked manu-ally by experienced EEG-raters (for a more detailed descrip-tion of used parameters please see Olbrich et al., 2011).
ANS Parameters
Electrocardiogram (ECG) was recorded using a bipolar chan-nel of the QuickAmp amplifier. Electrodes were placed at thewrists of both arms. All data were sampled at a rate of 1 kHz.R-peaks were detected using an algorithm integrated inthe BrainVision Analyzer Software. Results were visually
192 S. Olbrich et al.: EEG-Vigilance and the Autonomous Nervous System
Journal of Psychophysiology 2011; Vol. 25(4):190–200 Hogrefe Publishing
checked and corrected if necessary. HR was calculated foreach segment (60,000/RR-interval in ms) and exportedfor further analysis. Time series were visually inspected forartifacts, all segments marked as artifacts in the EEG wereautomatically marked as artifacts in the ECG time course.HRV was computed for each HR time series with 900 sduration using Kubios HRV software Version 2.0 (http://kubios.uku.fi/KubiosHRV/). The following parameters wereextracted (Task Force of the European Society of Cardiologyand the North American Society of Pacing and Electrophys-iology, 1996): the spectral power in the high frequency(0.15–0.4 Hz; HF) and normalized high frequency (nHF)band, the TP (0–0.4 Hz), and the standard deviation ofpeak-to-peak intervals (standard deviation of normal tonorma, SDNN) as parameters for parasympathetic activity;the spectral power in the LF (0.04–0.15 Hz) and the normal-ized low frequency (nLF) band as parameters for sympatheticactivity and the spectral power in the VLF (0–0.04 Hz) andnVLF band, although the influences of sympathetic and para-sympathetic activity on VLF are still a matter of debate.
For assessing the SCL, the tonic component of electro-dermal activity, a bipolar channel of the QuickAmp ampli-fier was used applying a constant voltage (DC capabilityof the QuickAmp device) of 0.5 V (GSR-module, BrainProducts GmbH, Gilching, Germany). Two electrodes(diameter of 13 mm) were placed at the thenar and hypothe-nar of the nondominant hand. Twenty-five millivoltsaccounted for 1 lSiemens. To assess SCL, a low-pass filterwas applied (1 Hz) to exclude phasic components of theelectrodermal activity and the average SCL of all data pointsof each segment were exported for further analysis. SCL isgenerally known to predominantly reflect sympathetic activ-ity (Venables & Christie 1980).
Statistical Analysis
STATA software Version 10.1 (StataCorp LP, TX) andMATLAB software Version 7.0 (http://www.math-works.com) were used for statistical analysis. In order toanalyze the global association between high/low vigilancestages and activity of the ANS, HRV parameters, including(n)HF, (n)LF, (n)VLF, SDNN, and TP, were correlatedwith percentages of different EEG-vigilance stage segments.Spearman’s rho has been used for correlation analysis(p < .05) because EEG-vigilance stages have been foundnot to be normally distributed (Guenther et al., 2011).
To analyze the association between cortical arousal andANS activity, separate fixed-effects within-regressionmodels (Baltagi, 2008; Blackwell, 2005; Greene, 2003)were employed for HR and SCL with EEG-vigilance stagesas the predictor variable. No regression analysis was com-puted for HRV measures because the multiple changesbetween vigilance stages resulted in too short continuoussegments for the different vigilance stages to calculate reli-able corresponding HRV values.
A fixed-effects 2-level model was preferred to a randomeffects model since no assumption could be made a prioriabout the correlation between the error term, that is, unex-plained variance, and the predictor, that is, the EEG-vigilance
stage (Wooldridge, 2002). In case of such correlations, a ran-dom effects model would have led to false results.
To control the results for the effect of time on ANS val-ues and EEG-vigilance stages, the fixed model was extendedto include all possible three-way interactions with time. Thismeans that for each vigilance stage, HR and SCL time serieswere estimated with different Y-interceptions, slopes, andflexions to model the effects of time on HR and SCL andto control for a moderating effect of time on the independentvariable vigilance stage. This was done because vigilancestages might not be associated with invariant values ofANS parameters over time. In order to get reasonable esti-mates of both the main and interaction effects, effect coding(Rencher, 2000) was used by transforming the predictorvariables into a matrix with values �1, 0, and 1 to conveyall information about group membership.
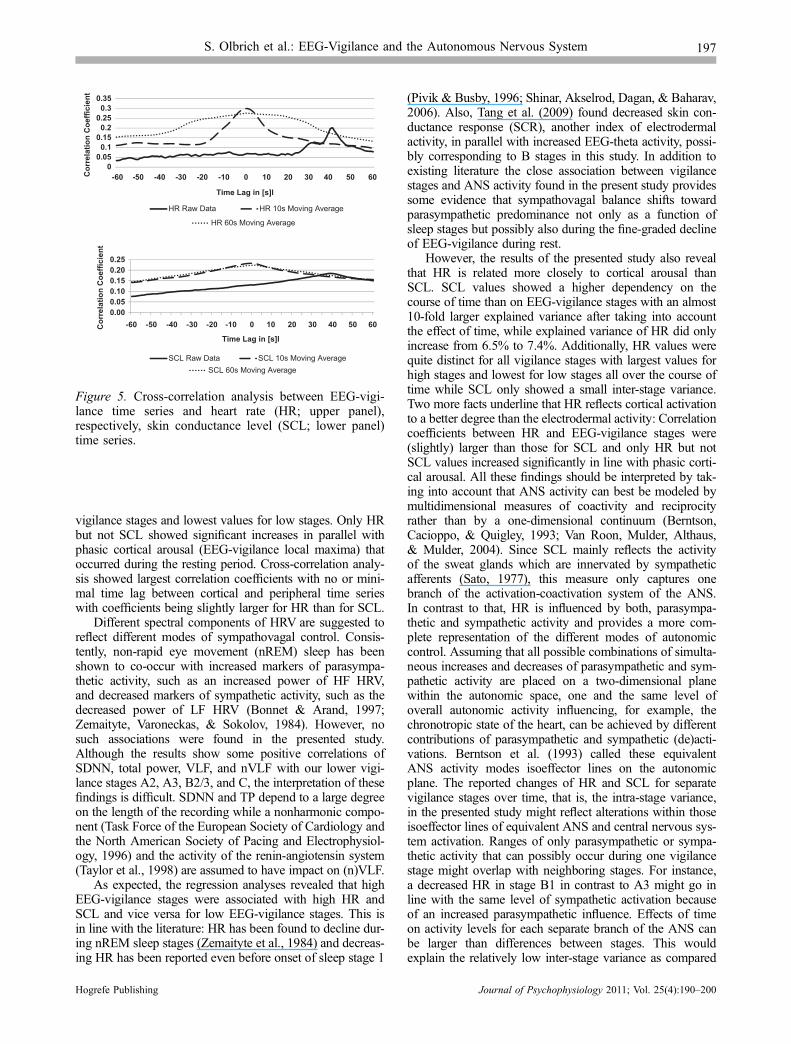
To further test whether declines of tonic cortical arousaland ANS parameters were coincidental without any func-tional connection, it was analyzed if ANS values duringphasic increases of EEG-vigilance were associated withincreased SCL and HR values in comparison to ANS valuesof preceding lower EEG-vigilance stages. Therefore a vigi-lance measure ranging from 7 (highest vigilance stage 0) to1 (lowest vigilance stage C) was assigned to each segment,assuming a continuous decline of vigilance from stage 0 toC. Local minima and maxima of EEG-vigilance time serieswere detected using a public domain Matlab algorithm(http://www.billauer.co.il/peakdet.html). A maximum/mini-mum was defined as a local peak or trough in the temporalsmoothed (10 s) vigilance time series with d = 0.2 of thevigilance measure. EEG-vigilance maxima/minima of allsubjects were pooled together. For further analysis, the timeseries of HR and SCL for each subject were normalized dueto high inter-subject variability. Corresponding ANS param-eters (moving average of 10 s) of local EEG-vigilanceminima were then tested against ANS parameters of consec-utive, intermediate local maxima of EEG-vigilance, that is,phasic cortical arousal, using two-tailed t-test.
To evaluate the temporal association between changes ofEEG-vigilance and ANS parameters, cross-correlation anal-yses between the cortical arousal and ANS time series werecarried out. The vigilance time series was cross-correlatedwith the ANS time series (no moving average filter, movingaverage filter of 10 and 60 s) with a maximal lag of ±60 s in1-s intervals.
Results
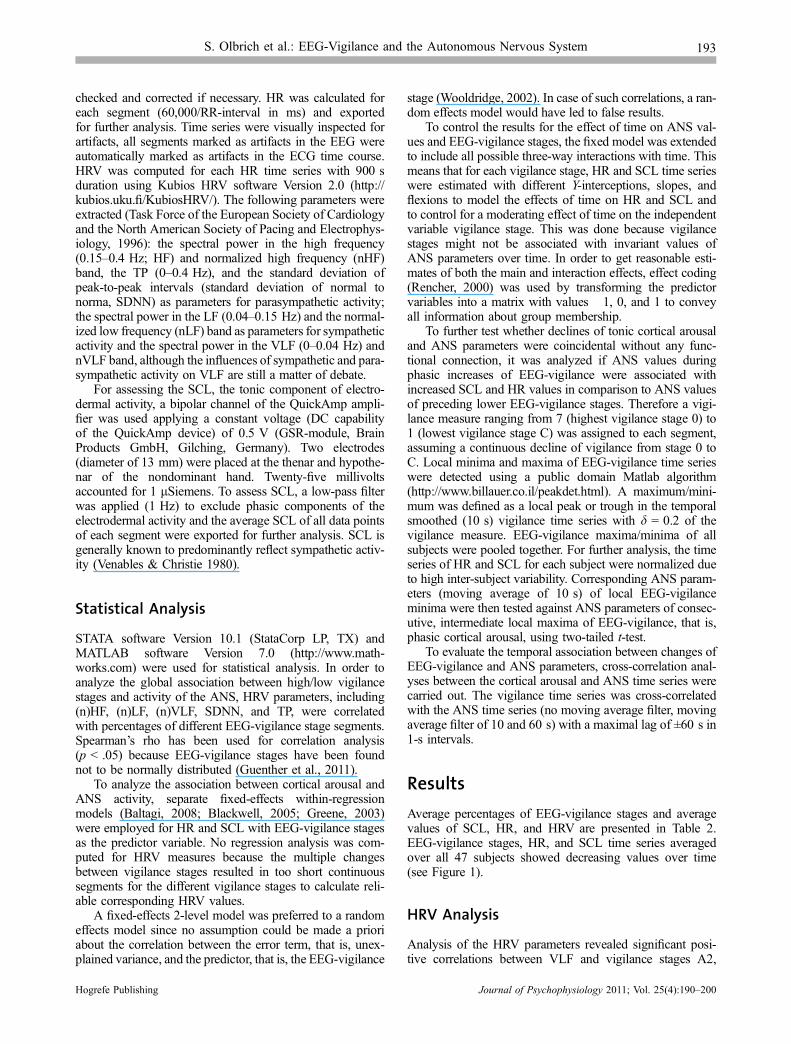
Average percentages of EEG-vigilance stages and averagevalues of SCL, HR, and HRV are presented in Table 2.EEG-vigilance stages, HR, and SCL time series averagedover all 47 subjects showed decreasing values over time(see Figure 1).
HRV Analysis
Analysis of the HRV parameters revealed significant posi-tive correlations between VLF and vigilance stages A2,
S. Olbrich et al.: EEG-Vigilance and the Autonomous Nervous System 193
Hogrefe Publishing Journal of Psychophysiology 2011; Vol. 25(4):190–200
A3, B2/3, and C; between nVLF and B2/3 and C; betweenTP and stages A2 and A3; and between SDNN and stagesA2 and A3 (see Table 3). No significant correlations werefound for LF or HF HRV, these components being assumedto reflect sympathetic and parasympathetic ANS activity,respectively (see Table 3).
Regression Analysis
The fixed-effects regression analysis revealed that all meanvalues of HR and SCL for the seven vigilance stages weresignificantly different in comparison to the grand mean ofall stages with F(7, 42246) = 269.91; p < .001 for SCLand with F(7, 42246) = 421.42; p < .001 for HR. The val-ues of SCL showed a continuous decline from high to low
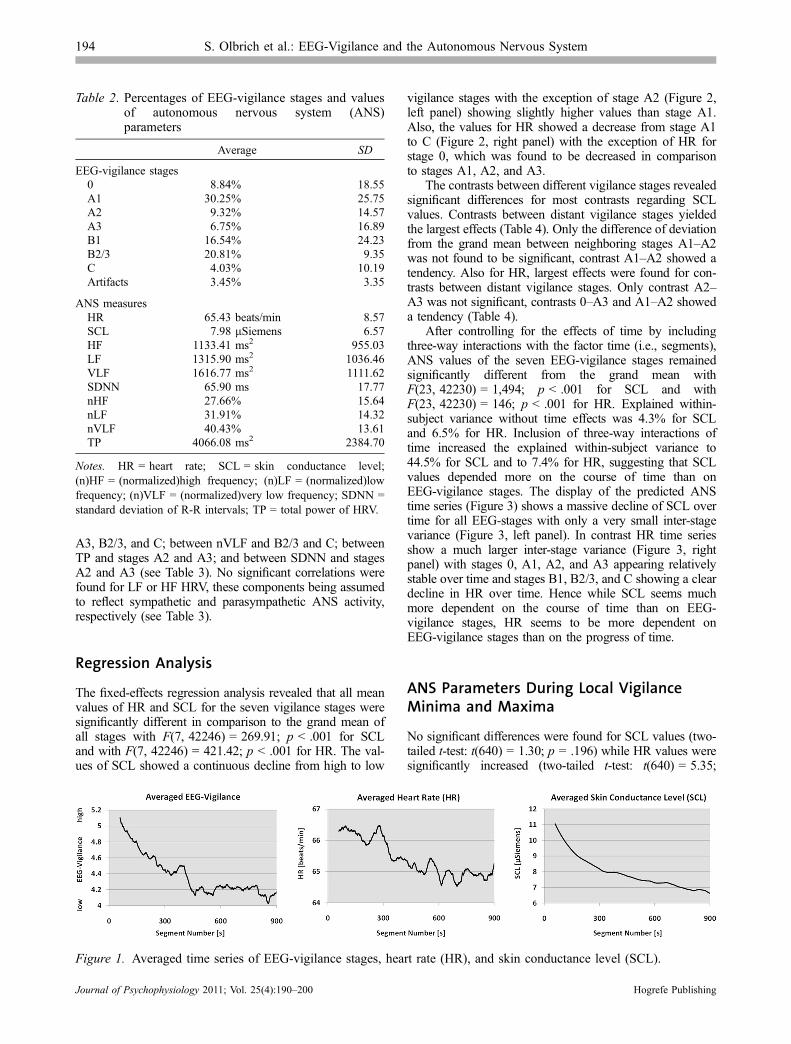
vigilance stages with the exception of stage A2 (Figure 2,left panel) showing slightly higher values than stage A1.Also, the values for HR showed a decrease from stage A1to C (Figure 2, right panel) with the exception of HR forstage 0, which was found to be decreased in comparisonto stages A1, A2, and A3.
The contrasts between different vigilance stages revealedsignificant differences for most contrasts regarding SCLvalues. Contrasts between distant vigilance stages yieldedthe largest effects (Table 4). Only the difference of deviationfrom the grand mean between neighboring stages A1–A2was not found to be significant, contrast A1–A2 showed atendency. Also for HR, largest effects were found for con-trasts between distant vigilance stages. Only contrast A2–A3 was not significant, contrasts 0–A3 and A1–A2 showeda tendency (Table 4).
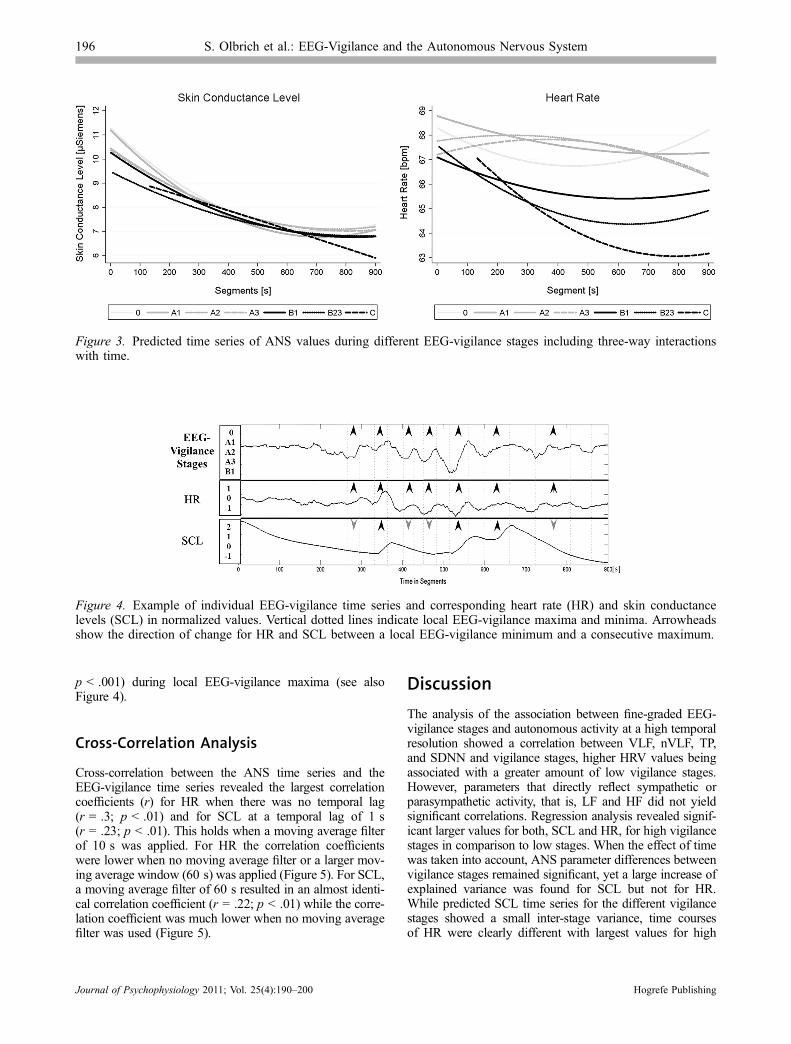
After controlling for the effects of time by includingthree-way interactions with the factor time (i.e., segments),ANS values of the seven EEG-vigilance stages remainedsignificantly different from the grand mean withF(23, 42230) = 1,494; p < .001 for SCL and withF(23, 42230) = 146; p < .001 for HR. Explained within-subject variance without time effects was 4.3% for SCLand 6.5% for HR. Inclusion of three-way interactions oftime increased the explained within-subject variance to44.5% for SCL and to 7.4% for HR, suggesting that SCLvalues depended more on the course of time than onEEG-vigilance stages. The display of the predicted ANStime series (Figure 3) shows a massive decline of SCL overtime for all EEG-stages with only a very small inter-stagevariance (Figure 3, left panel). In contrast HR time seriesshow a much larger inter-stage variance (Figure 3, rightpanel) with stages 0, A1, A2, and A3 appearing relativelystable over time and stages B1, B2/3, and C showing a cleardecline in HR over time. Hence while SCL seems muchmore dependent on the course of time than on EEG-vigilance stages, HR seems to be more dependent onEEG-vigilance stages than on the progress of time.
ANS Parameters During Local VigilanceMinima and Maxima
No significant differences were found for SCL values (two-tailed t-test: t(640) = 1.30; p = .196) while HR values weresignificantly increased (two-tailed t-test: t(640) = 5.35;
Table 2. Percentages of EEG-vigilance stages and valuesof autonomous nervous system (ANS)parameters
Average SD
EEG-vigilance stages0 8.84% 18.55A1 30.25% 25.75A2 9.32% 14.57A3 6.75% 16.89B1 16.54% 24.23B2/3 20.81% 9.35C 4.03% 10.19Artifacts 3.45% 3.35
ANS measuresHR 65.43 beats/min 8.57SCL 7.98 lSiemens 6.57HF 1133.41 ms2 955.03LF 1315.90 ms2 1036.46VLF 1616.77 ms2 1111.62SDNN 65.90 ms 17.77nHF 27.66% 15.64nLF 31.91% 14.32nVLF 40.43% 13.61TP 4066.08 ms2 2384.70
Notes. HR = heart rate; SCL = skin conductance level;(n)HF = (normalized)high frequency; (n)LF = (normalized)lowfrequency; (n)VLF = (normalized)very low frequency; SDNN =standard deviation of R-R intervals; TP = total power of HRV.
Figure 1. Averaged time series of EEG-vigilance stages, heart rate (HR), and skin conductance level (SCL).
194 S. Olbrich et al.: EEG-Vigilance and the Autonomous Nervous System
Journal of Psychophysiology 2011; Vol. 25(4):190–200 Hogrefe Publishing
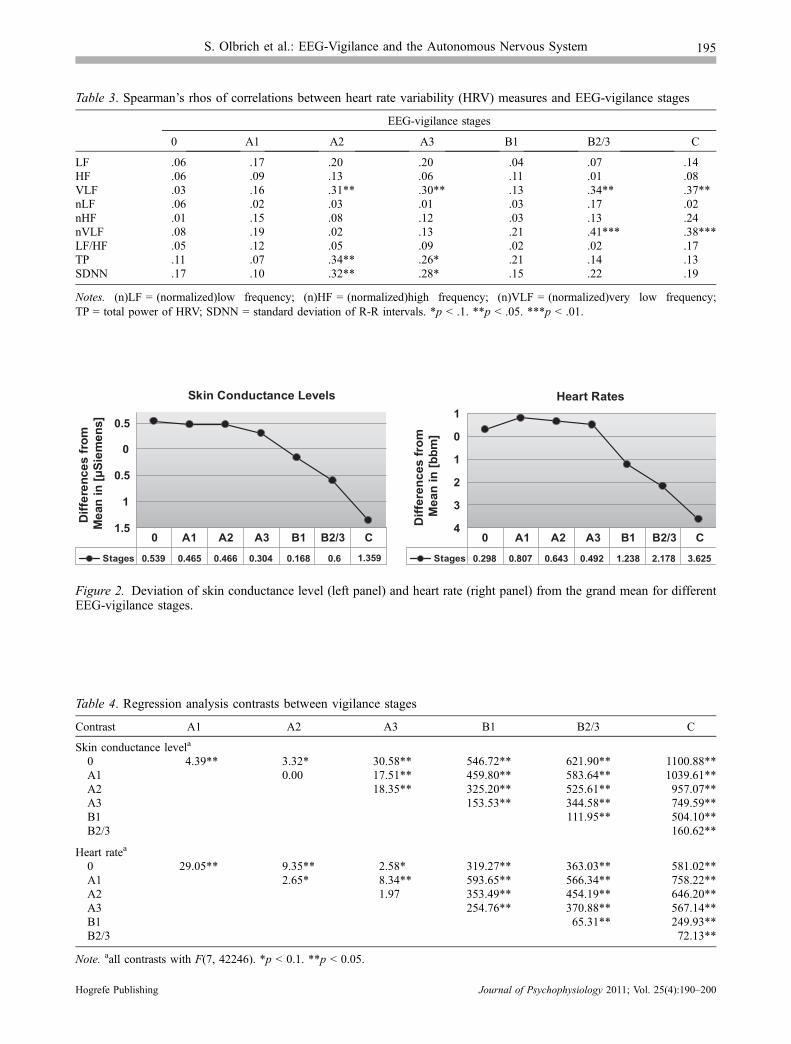
Table 3. Spearman’s rhos of correlations between heart rate variability (HRV) measures and EEG-vigilance stages
EEG-vigilance stages
0 A1 A2 A3 B1 B2/3 C
LF �.06 �.17 .20 .20 �.04 .07 .14HF �.06 .09 .13 .06 �.11 .01 �.08VLF �.03 �.16 .31** .30** �.13 .34** .37**nLF �.06 �.02 �.03 �.01 �.03 �.17 �.02nHF .01 .15 �.08 �.12 �.03 �.13 �.24nVLF .08 �.19 .02 .13 .21 .41*** .38***LF/HF �.05 �.12 .05 .09 .02 .02 .17TP �.11 �.07 .34** .26* �.21 .14 .13SDNN �.17 �.10 .32** .28* �.15 .22 .19
Notes. (n)LF = (normalized)low frequency; (n)HF = (normalized)high frequency; (n)VLF = (normalized)very low frequency;TP = total power of HRV; SDNN = standard deviation of R-R intervals. *p < .1. **p < .05. ***p < .01.
Skin Conductance Levels
1.5
1
0.5
0
0.5
Diffe
renc
es fr
om
Mea
n in
[µSi
emen
s]
Stages 0.539 0.465 0.466 0.304 0.168 0.6 1.359
0 A1 A2 A3 B1 B2/3 C
Heart Rates
4
3
2
1
0
1D
iffer
ence
s fr
om
Mea
n in
[bbm
]
Stages 0.298 0.807 0.643 0.492 1.238 2.178 3.625
0 A1 A2 A3 B1 B2/3 C
Figure 2. Deviation of skin conductance level (left panel) and heart rate (right panel) from the grand mean for differentEEG-vigilance stages.
Table 4. Regression analysis contrasts between vigilance stages
Contrast A1 A2 A3 B1 B2/3 C
Skin conductance levela
0 �4.39** 3.32* 30.58** 546.72** 621.90** 1100.88**A1 0.00 17.51** 459.80** 583.64** 1039.61**A2 18.35** 325.20** 525.61** 957.07**A3 153.53** 344.58** 749.59**B1 111.95** 504.10**B2/3 160.62**
Heart ratea
0 �29.05** �9.35** �2.58* 319.27** 363.03** 581.02**A1 2.65* 8.34** 593.65** 566.34** 758.22**A2 1.97 353.49** 454.19** 646.20**A3 254.76** 370.88** 567.14**B1 65.31** 249.93**B2/3 72.13**
Note. aall contrasts with F(7, 42246). *p < 0.1. **p < 0.05.
S. Olbrich et al.: EEG-Vigilance and the Autonomous Nervous System 195
Hogrefe Publishing Journal of Psychophysiology 2011; Vol. 25(4):190–200
p < .001) during local EEG-vigilance maxima (see alsoFigure 4).
Cross-Correlation Analysis
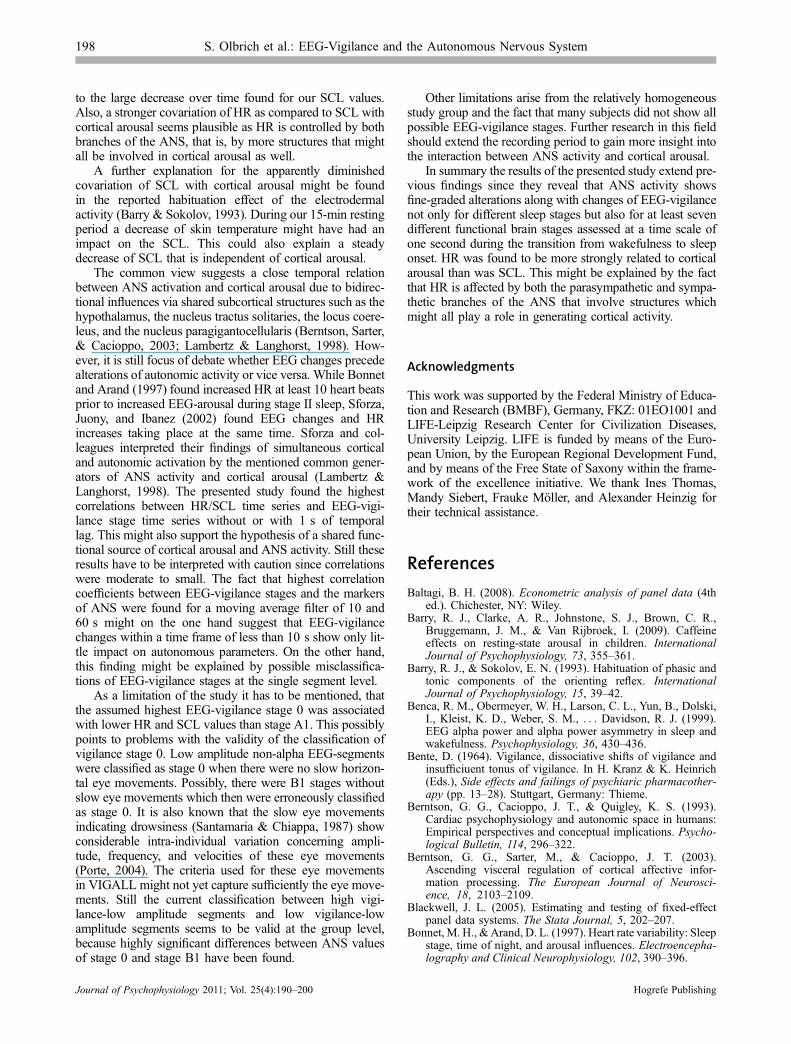
Cross-correlation between the ANS time series and theEEG-vigilance time series revealed the largest correlationcoefficients (r) for HR when there was no temporal lag(r = .3; p < .01) and for SCL at a temporal lag of 1 s(r = .23; p < .01). This holds when a moving average filterof 10 s was applied. For HR the correlation coefficientswere lower when no moving average filter or a larger mov-ing average window (60 s) was applied (Figure 5). For SCL,a moving average filter of 60 s resulted in an almost identi-cal correlation coefficient (r = .22; p < .01) while the corre-lation coefficient was much lower when no moving averagefilter was used (Figure 5).
Discussion
The analysis of the association between fine-graded EEG-vigilance stages and autonomous activity at a high temporalresolution showed a correlation between VLF, nVLF, TP,and SDNN and vigilance stages, higher HRV values beingassociated with a greater amount of low vigilance stages.However, parameters that directly reflect sympathetic orparasympathetic activity, that is, LF and HF did not yieldsignificant correlations. Regression analysis revealed signif-icant larger values for both, SCL and HR, for high vigilancestages in comparison to low stages. When the effect of timewas taken into account, ANS parameter differences betweenvigilance stages remained significant, yet a large increase ofexplained variance was found for SCL but not for HR.While predicted SCL time series for the different vigilancestages showed a small inter-stage variance, time coursesof HR were clearly different with largest values for high
Figure 4. Example of individual EEG-vigilance time series and corresponding heart rate (HR) and skin conductancelevels (SCL) in normalized values. Vertical dotted lines indicate local EEG-vigilance maxima and minima. Arrowheadsshow the direction of change for HR and SCL between a local EEG-vigilance minimum and a consecutive maximum.
Figure 3. Predicted time series of ANS values during different EEG-vigilance stages including three-way interactionswith time.
196 S. Olbrich et al.: EEG-Vigilance and the Autonomous Nervous System
Journal of Psychophysiology 2011; Vol. 25(4):190–200 Hogrefe Publishing
vigilance stages and lowest values for low stages. Only HRbut not SCL showed significant increases in parallel withphasic cortical arousal (EEG-vigilance local maxima) thatoccurred during the resting period. Cross-correlation analy-sis showed largest correlation coefficients with no or mini-mal time lag between cortical and peripheral time serieswith coefficients being slightly larger for HR than for SCL.
Different spectral components of HRV are suggested toreflect different modes of sympathovagal control. Consis-tently, non-rapid eye movement (nREM) sleep has beenshown to co-occur with increased markers of parasympa-thetic activity, such as an increased power of HF HRV,and decreased markers of sympathetic activity, such as thedecreased power of LF HRV (Bonnet & Arand, 1997;Zemaityte, Varoneckas, & Sokolov, 1984). However, nosuch associations were found in the presented study.Although the results show some positive correlations ofSDNN, total power, VLF, and nVLF with our lower vigi-lance stages A2, A3, B2/3, and C, the interpretation of thesefindings is difficult. SDNN and TP depend to a large degreeon the length of the recording while a nonharmonic compo-nent (Task Force of the European Society of Cardiology andthe North American Society of Pacing and Electrophysiol-ogy, 1996) and the activity of the renin-angiotensin system(Taylor et al., 1998) are assumed to have impact on (n)VLF.
As expected, the regression analyses revealed that highEEG-vigilance stages were associated with high HR andSCL and vice versa for low EEG-vigilance stages. This isin line with the literature: HR has been found to decline dur-ing nREM sleep stages (Zemaityte et al., 1984) and decreas-ing HR has been reported even before onset of sleep stage 1
(Pivik & Busby, 1996; Shinar, Akselrod, Dagan, & Baharav,2006). Also, Tang et al. (2009) found decreased skin con-ductance response (SCR), another index of electrodermalactivity, in parallel with increased EEG-theta activity, possi-bly corresponding to B stages in this study. In addition toexisting literature the close association between vigilancestages and ANS activity found in the present study providessome evidence that sympathovagal balance shifts towardparasympathetic predominance not only as a function ofsleep stages but possibly also during the fine-graded declineof EEG-vigilance during rest.
However, the results of the presented study also revealthat HR is related more closely to cortical arousal thanSCL. SCL values showed a higher dependency on thecourse of time than on EEG-vigilance stages with an almost10-fold larger explained variance after taking into accountthe effect of time, while explained variance of HR did onlyincrease from 6.5% to 7.4%. Additionally, HR values werequite distinct for all vigilance stages with largest values forhigh stages and lowest for low stages all over the course oftime while SCL only showed a small inter-stage variance.Two more facts underline that HR reflects cortical activationto a better degree than the electrodermal activity: Correlationcoefficients between HR and EEG-vigilance stages were(slightly) larger than those for SCL and only HR but notSCL values increased significantly in line with phasic corti-cal arousal. All these findings should be interpreted by tak-ing into account that ANS activity can best be modeled bymultidimensional measures of coactivity and reciprocityrather than by a one-dimensional continuum (Berntson,Cacioppo, & Quigley, 1993; Van Roon, Mulder, Althaus,& Mulder, 2004). Since SCL mainly reflects the activityof the sweat glands which are innervated by sympatheticafferents (Sato, 1977), this measure only captures onebranch of the activation-coactivation system of the ANS.In contrast to that, HR is influenced by both, parasympa-thetic and sympathetic activity and provides a more com-plete representation of the different modes of autonomiccontrol. Assuming that all possible combinations of simulta-neous increases and decreases of parasympathetic and sym-pathetic activity are placed on a two-dimensional planewithin the autonomic space, one and the same level ofoverall autonomic activity influencing, for example, thechronotropic state of the heart, can be achieved by differentcontributions of parasympathetic and sympathetic (de)acti-vations. Berntson et al. (1993) called these equivalentANS activity modes isoeffector lines on the autonomicplane. The reported changes of HR and SCL for separatevigilance stages over time, that is, the intra-stage variance,in the presented study might reflect alterations within thoseisoeffector lines of equivalent ANS and central nervous sys-tem activation. Ranges of only parasympathetic or sympa-thetic activity that can possibly occur during one vigilancestage might overlap with neighboring stages. For instance,a decreased HR in stage B1 in contrast to A3 might go inline with the same level of sympathetic activation becauseof an increased parasympathetic influence. Effects of timeon activity levels for each separate branch of the ANS canbe larger than differences between stages. This wouldexplain the relatively low inter-stage variance as compared
00.050.1
0.150.2
0.250.3
0.35
-60 -50 -40 -30 -20 -10 0 10 20 30 40 50 60
HR Raw Data HR 10s Moving Average
HR 60s Moving Average
0.000.050.100.150.200.25
-60 -50 -40 -30 -20 -10 0 10 20 30 40 50 60Cor
rela
tion
Coe
ffici
ent
Cor
rela
tion
Coe
ffici
ent
Time Lag in [s]l
Time Lag in [s]l
SCL Raw Data SCL 10s Moving AverageSCL 60s Moving Average
Figure 5. Cross-correlation analysis between EEG-vigi-lance time series and heart rate (HR; upper panel),respectively, skin conductance level (SCL; lower panel)time series.
S. Olbrich et al.: EEG-Vigilance and the Autonomous Nervous System 197
Hogrefe Publishing Journal of Psychophysiology 2011; Vol. 25(4):190–200
to the large decrease over time found for our SCL values.Also, a stronger covariation of HR as compared to SCL withcortical arousal seems plausible as HR is controlled by bothbranches of the ANS, that is, by more structures that mightall be involved in cortical arousal as well.
A further explanation for the apparently diminishedcovariation of SCL with cortical arousal might be foundin the reported habituation effect of the electrodermalactivity (Barry & Sokolov, 1993). During our 15-min restingperiod a decrease of skin temperature might have had animpact on the SCL. This could also explain a steadydecrease of SCL that is independent of cortical arousal.
The common view suggests a close temporal relationbetween ANS activation and cortical arousal due to bidirec-tional influences via shared subcortical structures such as thehypothalamus, the nucleus tractus solitaries, the locus coere-leus, and the nucleus paragigantocellularis (Berntson, Sarter,& Cacioppo, 2003; Lambertz & Langhorst, 1998). How-ever, it is still focus of debate whether EEG changes precedealterations of autonomic activity or vice versa. While Bonnetand Arand (1997) found increased HR at least 10 heart beatsprior to increased EEG-arousal during stage II sleep, Sforza,Juony, and Ibanez (2002) found EEG changes and HRincreases taking place at the same time. Sforza and col-leagues interpreted their findings of simultaneous corticaland autonomic activation by the mentioned common gener-ators of ANS activity and cortical arousal (Lambertz &Langhorst, 1998). The presented study found the highestcorrelations between HR/SCL time series and EEG-vigi-lance stage time series without or with 1 s of temporallag. This might also support the hypothesis of a shared func-tional source of cortical arousal and ANS activity. Still theseresults have to be interpreted with caution since correlationswere moderate to small. The fact that highest correlationcoefficients between EEG-vigilance stages and the markersof ANS were found for a moving average filter of 10 and60 s might on the one hand suggest that EEG-vigilancechanges within a time frame of less than 10 s show only lit-tle impact on autonomous parameters. On the other hand,this finding might be explained by possible misclassifica-tions of EEG-vigilance stages at the single segment level.
As a limitation of the study it has to be mentioned, thatthe assumed highest EEG-vigilance stage 0 was associatedwith lower HR and SCL values than stage A1. This possiblypoints to problems with the validity of the classification ofvigilance stage 0. Low amplitude non-alpha EEG-segmentswere classified as stage 0 when there were no slow horizon-tal eye movements. Possibly, there were B1 stages withoutslow eye movements which then were erroneously classifiedas stage 0. It is also known that the slow eye movementsindicating drowsiness (Santamaria & Chiappa, 1987) showconsiderable intra-individual variation concerning ampli-tude, frequency, and velocities of these eye movements(Porte, 2004). The criteria used for these eye movementsin VIGALL might not yet capture sufficiently the eye move-ments. Still the current classification between high vigi-lance-low amplitude segments and low vigilance-lowamplitude segments seems to be valid at the group level,because highly significant differences between ANS valuesof stage 0 and stage B1 have been found.
Other limitations arise from the relatively homogeneousstudy group and the fact that many subjects did not show allpossible EEG-vigilance stages. Further research in this fieldshould extend the recording period to gain more insight intothe interaction between ANS activity and cortical arousal.
In summary the results of the presented study extend pre-vious findings since they reveal that ANS activity showsfine-graded alterations along with changes of EEG-vigilancenot only for different sleep stages but also for at least sevendifferent functional brain stages assessed at a time scale ofone second during the transition from wakefulness to sleeponset. HR was found to be more strongly related to corticalarousal than was SCL. This might be explained by the factthat HR is affected by both the parasympathetic and sympa-thetic branches of the ANS that involve structures whichmight all play a role in generating cortical activity.
Acknowledgments
This work was supported by the Federal Ministry of Educa-tion and Research (BMBF), Germany, FKZ: 01EO1001 andLIFE-Leipzig Research Center for Civilization Diseases,University Leipzig. LIFE is funded by means of the Euro-pean Union, by the European Regional Development Fund,and by means of the Free State of Saxony within the frame-work of the excellence initiative. We thank Ines Thomas,Mandy Siebert, Frauke Moller, and Alexander Heinzig fortheir technical assistance.
References
Baltagi, B. H. (2008). Econometric analysis of panel data (4thed.). Chichester, NY: Wiley.
Barry, R. J., Clarke, A. R., Johnstone, S. J., Brown, C. R.,Bruggemann, J. M., & Van Rijbroek, I. (2009). Caffeineeffects on resting-state arousal in children. InternationalJournal of Psychophysiology, 73, 355–361.
Barry, R. J., & Sokolov, E. N. (1993). Habituation of phasic andtonic components of the orienting reflex. InternationalJournal of Psychophysiology, 15, 39–42.
Benca, R. M., Obermeyer, W. H., Larson, C. L., Yun, B., Dolski,I., Kleist, K. D., Weber, S. M., . . . Davidson, R. J. (1999).EEG alpha power and alpha power asymmetry in sleep andwakefulness. Psychophysiology, 36, 430–436.
Bente, D. (1964). Vigilance, dissociative shifts of vigilance andinsufficiuent tonus of vigilance. In H. Kranz & K. Heinrich(Eds.), Side effects and failings of psychiaric pharmacother-apy (pp. 13–28). Stuttgart, Germany: Thieme.
Berntson, G. G., Cacioppo, J. T., & Quigley, K. S. (1993).Cardiac psychophysiology and autonomic space in humans:Empirical perspectives and conceptual implications. Psycho-logical Bulletin, 114, 296–322.
Berntson, G. G., Sarter, M., & Cacioppo, J. T. (2003).Ascending visceral regulation of cortical affective infor-mation processing. The European Journal of Neurosci-ence, 18, 2103–2109.
Blackwell, J. L. (2005). Estimating and testing of fixed-effectpanel data systems. The Stata Journal, 5, 202–207.
Bonnet, M. H., &Arand, D. L. (1997). Heart rate variability: Sleepstage, time of night, and arousal influences. Electroencepha-lography and Clinical Neurophysiology, 102, 390–396.
198 S. Olbrich et al.: EEG-Vigilance and the Autonomous Nervous System
Journal of Psychophysiology 2011; Vol. 25(4):190–200 Hogrefe Publishing
Burgess, H. J., Trinder, J., & Kim, Y. (1999). Cardiac autonomicnervous system activity during presleep wakefulness andstage 2 NREM sleep. Journal of Sleep Research, 8, 113–122.
Busek, P., Vankova, J., Opavsky, J., Salinger, J., & Nevsımalova,S. (2005). Spectral analysis of the heart rate variability in sleep.Physiological Research / Academia Scientiarum Bohemoslo-vaca, 54, 369–376.
Corsi-Cabrera, M., Guevara, M. A., Del Rıo-Portilla, Y., Arce,C., & Villanueva-Hernandez, Y. (2000). EEG bands duringwakefulness, slow-wave and paradoxical sleep as a result ofprincipal component analysis in man. Sleep, 23, 738–744.
De Gennaro, L., & Ferrara, M. (2003). Sleep spindles: Anoverview. Sleep Medicine Reviews, 7, 423–440.
De Gennaro, L., Ferrara, M., & Bertini, M. (2001). The boundarybetween wakefulness and sleep: Quantitative electroenceph-alographic changes during the sleep onset period. Neurosci-ence, 107, 1–11.
De Gennaro, L., Ferrara, M., Curcio, G., & Cristiani, R. (2001).Antero-posterior EEG changes during the wakefulness-sleeptransition. Clinical Neurophysiology, 112, 1901–1911.
De Gennaro, L., Vecchio, F., Ferrara, M., Curcio, G., Rossini, P.M., & Babiloni, C. (2004). Changes in fronto-posteriorfunctional coupling at sleep onset in humans. Journal ofSleep Research, 13, 209–217.
Delorme, A., Sejnowski, T., & Makeig, S. (2007). Enhanceddetection of artifacts in EEG data using higher-order statisticsand independent component analysis. NeuroImage, 34,1443–1449.
Doberenz, S., Roth, W. T., Wollburg, E., Breuninger, C., & Kim,S. (2010). Twenty-four hour skin conductance in panicdisorder. Journal of Psychiatric Research, 44, 1137–1147.
Fairclough, S. H., & Venables, L. (2006). Prediction of subjectivestates from psychophysiology: A multivariate approach.Biological Psychology, 71, 100–110.
Greene, W. H. (2003). Econometric analysis. InternationalEdition (5th ed.). Upper Saddle River, NJ: Prentice Hall.
Guenther, T., Schonknecht, P., Becker, G., Olbrich, S., Sander,C., Hesse, S., . . . Sabri, O. (2011). Impact of EEG-vigilanceon brain glucose uptake measured with [(18)F]FDG and PETin patients with depressive episode or mild cognitiveimpairment. NeuroImage, 56, 93–101.
Hegerl, U., Himmerich, H., Engmann, B., & Hensch, T. (2010).Mania and attention-deficit/hyperactivity disorder: Commonsymptomatology, common pathophysiology and commontreatment? Current Opinion in Psychiatry, 23, 1–7.
Hegerl, U., Olbrich, S., Schonknecht, P., & Sander, C. (2008).Manic behavior as an autoregulatory attempt to stabilizevigilance. Der Nervenarzt, 79, 1283–1284, 1286–1290.
Hegerl, U., Sander, C., Olbrich, S., & Schoenknecht, P. (2009).Are psychostimulants a treatment option in mania? Phar-macopsychiatry, 42, 169–174.
Himanen, S., & Hasan, J. (2000). Limitations of Rechtschaffenand Kales. Sleep Medicine Reviews, 4, 149–167.
Hori, T. (1982). Electrodermal and electro-oculographic activityin a hypnagogic state. Psychophysiology, 19, 668–672.
Hori, T., & Fujisawa, K. (1977). Autonomic activities inhypnagogic state. Bulletin of Educational Science, 27, 81–98.
Hori, T., Miyasita, A., & Niimi, Y. (1970). Skin potentialactivities and their regional differences during normal sleepin humans. Japanese Journal of Physiology, 20, 657–671.
Kesek, M., Franklin, K. A., Sahlin, C., & Lindberg, E. (2009).Heart rate variability during sleep and sleep apnoea in apopulation based study of 387 women. Clinical Physiologyand Functional Imaging, 29, 309–315.
Kreibig, S. D., Wilhelm, F. H., Roth, W. T., & Gross, J. J. (2007).Cardiovascular, electrodermal, and respiratory response pat-terns to fear- and sadness-inducing films. Psychophysiology,44, 787–806.
Kuo, T. B. J., Shaw, F. Z., Lai, C. J., & Yang, C. C. H. (2008).Asymmetry in sympathetic and vagal activities during sleep-wake transitions. Sleep, 31, 311–320.
Lambertz, M., & Langhorst, P. (1998). Simultaneous changes ofrhythmic organization in brainstem neurons, respiration,cardiovascular system and EEG between 0.05 Hz and0.5 Hz. Journal of the Autonomic Nervous System, 68, 58–77.
Loomis, A. L., Harvey, E. N., & Hobart, G. A. (1937). Cerebralstates during sleep, as studied by human brain potentials.Journal of Experimental Psychology, 21, 127–144.
Olbrich, S., Mulert, C., Karch, S., Trenner, M., Leicht, G.,Pogarell, O., & Hegerl, U. (2009). EEG-vigilance and BOLDeffect during simultaneous EEG/fMRI measurement. Neuro-Image, 45, 319–332.
Olbrich, S., Sander, C., Jahn, I., Eplinius, F., Claus, S., Mergl, R.,. . . Hegerl, U. (2011). Unstable EEG-vigilance in patientswith cancer-related fatigue (CRF) in comparison to healthycontrols. World Journal of Biological Psychiatry. doi:10.3109/15622975.2010.545434
Pattyn, N., Neyt, X., Henderickx, D., & Soetens, E. (2008).Psychophysiological investigation of vigilance decrement:Boredom or cognitive fatigue? Physiology & Behavior, 93,369–378.
Penzel, T., Kantelhardt, J. W., Lo, C. C., Voigt, K., & Vogelmeier,C. (2003). Dynamics of heart rate and sleep stages in normalsand patients with sleep apnea. In Neuropsychopharmacology:Official Publication of the American College of Neuropsycho-pharmacology, 28 (Suppl. 1), 48–53.
Pivik, R. T., & Busby, K. (1996). Heart rate associated with sleeponset in preadolescents. Journal of Sleep Research, 5, 33–36.
Porte, H. S. (2004). Slow horizontal eye movement at humansleep onset. Journal of Sleep Research, 13, 239–249.
Rechtschaffen, A., & Kales, A. (1968). A manual of standardizedterminology, techniques and scoring system for sleep stagesof human subjects. Bethesda, MD: US National Institute ofNeurological Diseases and Blindness, Neurological Informa-tion Network.
Rencher, A. C. (2000). Linear models in statistics. New York,NY: Wiley.
Roth, B. (1961). The clinical and theoretical importance of EEGrhythms corresponding to states of lowered vigilance.Electroencephalography and Clinical Neurophysiology, 13,395–399.
Sander, C., Arns, M., Olbrich, S., & Hegerl, U. (2010). EEG-vigilance and response to stimulants in paediatric patientswith attention deficit/hyperactivity disorder. Clinical Neuro-physiology, 121, 1511–1518.
Santamaria, J., & Chiappa, K. H. (1987). The EEG of drowsinessin normal adults. Journal of Clinical Neurophysiology, 4,327–382.
Sato, K. (1977). The physiology, pharmacology, and biochem-istry of the eccrine sweat gland. Reviews of Physiology,Biochemistry and Pharmacology, 79, 51–131.
Schroeder, M. J., & Barr, R. E. (2000). An alpha modulationindex for electroencephalographic studies using complexdemodulation. Medical & Biological Engineering & Com-puting, 38, 306–310.
Sforza, E., Juony, C., & Ibanez, V. (2002). Time-dependentvariation in cerebral and autonomic activity during periodicleg movements in sleep: Implications for arousal mecha-nisms. Clinical Neurophysiology, 113, 883–891.
Shinar, Z., Akselrod, S., Dagan, Y., & Baharav, A. (2006).Autonomic changes during wake-sleep transition: A heartrate variability based approach. Autonomic Neuroscience:Basic & Clinical, 130, 17–27.
Silvani, A. (2008). Physiological sleep-dependent changes inarterial blood pressure: Central autonomic commands and
S. Olbrich et al.: EEG-Vigilance and the Autonomous Nervous System 199
Hogrefe Publishing Journal of Psychophysiology 2011; Vol. 25(4):190–200
baroreflex control. Clinical and Experimental Pharmacology& Physiology, 35, 987–994.
Tanaka, H., Hayashi, M., & Hori, T. (1997). Topographicalcharacteristics and principal component structure of thehypnagogic EEG. Sleep, 20, 523–534.
Tanaka, H., Hayashi, M., & Hori, T. (2000). Topographicalcharacteristics of slow wave activities during the transitionfrom wakefulness to sleep. Clinical Neurophysiology, 111,417–427.
Tang, Y. Y., Ma, Y., Fan, Y., Feng, H., Wang, J., Feng, S., . . .Fan, M. (2009). Central and autonomic nervous systeminteraction is altered by short-term meditation. Proceedingsof the National Academy of Sciences, 106, 8865–8870.
Task Force of the European Society of Cardiology and theNorth American Society of Pacing and Electrophysiology.(1996). Heart rate variability. Standards of measurementphysiological interpretation, and clinical use. EuropeanHeart Journal, 17, 354–381.
Taylor, J. A., Carr, D. L., Myers, C. W., & Eckberg, D. L. (1998).Mechanisms underlying very-low-frequency RR-intervaloscillations in humans. Circulation, 98, 547–555.
Trinder, J., Kleiman, J., Carrington, M., Smith, S., Breen, S., Tan,N., & Kim, Y. (2001). Autonomic activity during humansleep as a function of time and sleep stage. Journal of SleepResearch, 10, 253–264.
Tsuno, N., Shigeta, M., Hyoki, K., Faber, P. L., & Lehmann, D.(2004). Fluctuations of source locations of EEG activityduring transition from alertness to sleep in Alzheimer’sdisease and vascular dementia. Neuropsychobiology, 50,267–272.
Tsuno, N., Shigeta, M., Hyoki, K., Kinoshita, T., Ushijima, S.,Faber, P. L., & Lehmann, D. (2002). Spatial organization ofEEG activity from alertness to sleep stage 2 in old andyounger subjects. Journal of Sleep Research, 11, 43–51.
VaezMousavi, S. M., Barry, R. J., & Clarke, A. R. (2009).Individual differences in task-related activation and perfor-mance. Physiology & Behavior, 98, 326–330.
Van Roon, A. M., Mulder, L. J. M., Althaus, M., & Mulder, G.(2004). Introducing a baroreflex model for studying cardio-vascular effects of mental workload. Psychophysiology, 41,961–981.
Venables, P. H., & Christie, M. J. (1980). Affective processing ofloved faces: Contributions from peripheral and centralelectrophysiology. In I. Martin & P. H. Venables (Eds.),Electrodermal activity. In techniques in psychophysiology(pp. 3–67). New York, NY: Wiley.
Vico, C., Guerra, P., Robles, H., Vila, J., & Anllo-Vento, L.(2010). Affective processing of loved faces: Contributionsfrom peripheral and central electrophysiology. Neuropsych-ologia, 48, 2894–2902.
Wittchen, H. U. (1994). Reliability and validity studies of theWHO –Composite International Diagnostic Interview (CIDI):A critical review. Journal of Psychiatric Research, 28, 57–84.
Wooldridge, J. M. (2002). Econometric analysis of cross sectionand panel data. Cambridge, MA: The MIT Press.
Zemaityte, D., Varoneckas, G., & Sokolov, E. (1984). Heartrhythm control during sleep. Psychophysiology, 21, 279–289.
Accepted for publication: September 2, 2011
Sebastian Olbrich
Department of PsychiatryUniversity of LeipzigSemmelweisstr. 1004103 LeipzigGermanyTel. +49 341 972-5041Fax +49 341 972-4539E-mail [email protected]
200 S. Olbrich et al.: EEG-Vigilance and the Autonomous Nervous System
Journal of Psychophysiology 2011; Vol. 25(4):190–200 Hogrefe Publishing
Related Documents