Bradley, Nasira (2020) Economics of innovation, productivity and growth. PhD thesis. https://theses.gla.ac.uk/79042/ Copyright and moral rights for this work are retained by the author A copy can be downloaded for personal non-commercial research or study, without prior permission or charge This work cannot be reproduced or quoted extensively from without first obtaining permission in writing from the author The content must not be changed in any way or sold commercially in any format or medium without the formal permission of the author When referring to this work, full bibliographic details including the author, title, awarding institution and date of the thesis must be given Enlighten: Theses https://theses.gla.ac.uk/ [email protected]

Welcome message from author
This document is posted to help you gain knowledge. Please leave a comment to let me know what you think about it! Share it to your friends and learn new things together.
Transcript

Bradley, Nasira (2020) Economics of innovation, productivity and growth. PhD thesis.
https://theses.gla.ac.uk/79042/
Copyright and moral rights for this work are retained by the author
A copy can be downloaded for personal non-commercial research or study, without prior permission or charge
This work cannot be reproduced or quoted extensively from without first obtaining permission in writing from the author
The content must not be changed in any way or sold commercially in any format or medium without the formal permission of the author
When referring to this work, full bibliographic details including the author, title, awarding institution and date of the thesis must be given
Enlighten: Theses https://theses.gla.ac.uk/

Economics of Innovation, Productivity
and Growth
NasiraBradley
SubmittedinfulfilmentoftherequirementsfortheDegreeofDoctorofPhilosophyAdamSmithBusinessSchoolUniversityofGlasgowFebruary2020

ii
Abstract
This doctoral research studies the deeper drivers of innovation, productivity and
growth as well as the interlinkages between these three aspects. The thesis is
organized as follows:
Chapter 1 places the motivation of this research within the context of the wider
body of research in the fields of economics of innovation, productivity and
growth. It sets out the main aspirations of this research, followed by a brief
outline of the research.
Chapter 2 explores a wider set of innovation drivers driving firm growth,
combining analysis of formal R&D processes promoted by growth theories
alongside informal R&D linkages emphasized by national systems of innovation
(NSI). The main goal is to distinguish primary drivers from secondary drivers, by
examining the differences in key forces driving firm revenue levels versus those
driving firm revenue growth. This hypothesis is tested through a dataset of 27
European economies over the period of 1996-2010, controlling also for
globalization and industrial organizational drivers. Findings reveal that informal
R&D linkages appear to be the primary drivers needed to establish firm revenue
levels, while formal R&D investment is needed as a secondary driver to spur firm
revenue growth.
Chapter 3 delves into the structural drivers of productivity. Using an adaptation
of the economic development framework, the Lewis model, this study proposes
that country level labour productivity may be driven structurally by the
movement of resources from smaller firm to larger firm-size structures. To
enable this analysis, a new database is built up at sector level for the 32
European economies between 2000-2012. The contribution of firm-sizes to
country productivity is measured through isolating classifications of small,
medium and large firms, alongside control variables capturing growth theory
drivers, globalization, credit conditions and monetary lending policies. Large
firms are indeed found to be the most significant firm structure shaping country
labour productivity.

iii
Chapter 4 examines whether firm independence, previously not considered
critical for firm growth, may indeed be an important criterion to enable scale up
of innovative firms into successful frontier large firms. To shed light on the role
of independence, the study examines the drivers of firm growth and the policy
tools used to support firm growth – with innovative independent firms separately
assessed from overall innovative firms. Using firm level dataset for all UK sectors
between 2006-2016, policy tax and financing tools supporting start-up, growth
and merger activity are examined alongside growth theory drivers, globalization
and monetary lending policy. The empirical analysis reveals that independent
firms reap much higher growth, with age of independence delivering a bonus
growth dividend.
Finally, Chapter 5 summarizes the findings of this thesis, listing the limitations
of the analysis alongside future potential areas of research.

iv
Table of Contents
Abstract ......................................................................................... ii List of Tables ................................................................................. vi
List of Figures................................................................................. vii
Acknowledgement .......................................................................... viii Author’s Declaration ........................................................................ ix
Chapter 1 Introduction ................................................................... 1 Chapter 2 Where NSI meets Growth Theory .......................................... 8
2.1 Abstract ............................................................................. 8
2.2 Introduction ......................................................................... 9 2.3 Brief Overview of theories and Innovation studies ......................... 14
2.4 Model and data .................................................................... 24
2.5 Empirical Analysis ................................................................. 36 2.6 Germany, as a case in point, for the workings of these drivers .......... 59
2.7 Conclusion .......................................................................... 63 Chapter 3 Are firm-size structures important for Productivity? ................. 70
3.1 Abstract ............................................................................ 70 3.2 Introduction ........................................................................ 71 3.3 Theoretical Framework .......................................................... 76
3.4 Existing Literature. ............................................................... 79 3.5 Data and Methodology ........................................................... 82 3.6 Empirical Results .................................................................. 95 3.7 Conclusion ........................................................................ 117
Chapter 4 Why does the UK not have its own Google, let alone a new ARM - does firm independence matter?’ ....................................................... 120
4.1 Abstract .......................................................................... 120 4.2 Introduction ...................................................................... 121
4.3 The selection of tax and financing policy incentives for this study for their impact on firm growth .......................................................... 129
4.4 Methodology and Data ......................................................... 137
4.5 Empirical Analysis ............................................................... 146 4.6 Conclusion ........................................................................ 174
Chapter 5 Conclusion .................................................................. 181
5.1 Summary and key insights drawn from research .......................... 181 5.2 Future Areas of Research ...................................................... 185
Appendix..................................................................................... 188
Chapter 1 appendix ..................................................................... 188 Chapter 4 Appendix ..................................................................... 199

v
Bibliography ................................................................................. 201

vi
List of Tables
Table 2.1 Summary oversight of literature review , source (author) ............... 23 Table 2.2 : List of drivers used in model, associated with main strands of theories influencing innovation, source (author) ...................................... 27 Table 2.3:Regression results for initially step-wise theories and their drivers, lastly with combined drivers in accordance with proposed model, with dependent variable – annual innovative turnover of firms in quadrillion Euros .. 38 Table 2.4:Regression results for combined drivers in accordance with proposed model in column 1, with additional regressions column 2-4 for further checks on model specification and column (5) listing regression on innovation growth, with time dummies. ............................................................................... 42 Table 2.5:Regression of combined drivers on innovation growth - not innovation level, to determine how secondary drivers may differ from primary drivers ..... 50 Table 2.6:Robustness checks for Fixed Effects regression results with reduced set of drivers to avoid collinearity ............................................................ 53 Table 2.7:Regression results with reduced correlation terms and time dummies, for differing firm-sizes ...................................................................... 56 Table 2.8:Top 20 EU economies ranked in order for mean innovative turnover in absolute value (in billions of Euros) for all firm-sizes, covering the period 1996-2010 ............................................................................................ 60 Table 2.9:Summary table of overall key findings ...................................... 64 Table 3.1 GVA per employee (K Euros per Empl) of the 32 economies in this study at 2000 and 2012, derived from WDI indicators sourced from World DataBank .. 87 Table 3.2 Summary Statistics .............................................................. 94 Table 3.3 Correlation Matrix values ...................................................... 95 Table 3.4 FEM of Firm-size Turnover and Firm-size productivity impact on Country Productivity ........................................................................ 98 Table 3.5 FEM of Firm-size Turnover-share impact on Country Productivity ... 102 Table 3.6 FEM of Sector turnover and Sector turnover/Employee on Country Productivity ................................................................................. 105 Table 3.7 FEM of Sector turnover and Sector GVA/emp on Country Productivity ................................................................................................ 109 Table 3.8 FEM of Sector turnover and Sector turnover/Employee on Country Productivity ................................................................................. 113 Table 4.1:Summary statistics of variables used in regressions .................... 144 Table 4.2:Correlation Matrix values (observations 56,191 – if R&D excluded) .. 145 Table 4.3 Correlation Matrix – for R&D growth (observations 5,736 – if R&D included) .................................................................................... 146 Table 4.4: Variables used in Model, source (author) ................................ 147 Table 4.5:FEM of tax and financing incentives regressed on Firm growth (measured by growth in operating revenue from year before, as a percentage of current operating revenue) separately for aggregated general firms and separately for aggregated innovative firms ........................................... 151 Table 4.6 FEM of tax and financing incentives regressed on (Innovative firms) Firm growth, differentiated for firm class sizes ...................................... 155 Table 4.7 FEM of tax and financing incentives regressed on (General firms) Firm growth, differentiated for firm class sizes ............................................ 158 Table 1A

vii
List of Figures
Figure 2.1: The different innovation drivers associated with Growth theory, NSI, Cluster theory and Globalization, source (author) ..................................... 18 Figure 3.1 Adapted Lewis Model for Productivity, source (author) ................. 77 Figure 4.1 Model depicting Basic growth drivers and policy tools influencing firm growth leading to country productivity and Growth, source (author)............ 149

viii
Acknowledgement
Iwouldliketodedicatemythesistomyeversupportivebutlong-sufferinghusband,Daveandouramazingchildren,Saara,Aaliya,andSayeed.All,whohaveunfailinglysupportedmethroughallmydoubtsanddifficultiesandbelievedinme–especiallythroughperiodswhenthisresearchfelttobeabridgetoofar.
Mygratitudealsotobothmyparents,whohavebroughtmeuptobelieveinmyself,encouragingustopushbarriersandcontinuouslyseekwaystocontributetothisworld.Myfather’sencouragementtometopursuethisPhDinhislastfewmonthsoflife,hassomehowmadehimverymuchapartofthisendeavour.
Mysinceregratitudetomysupervisors,ProfRayStokesandDrCelineAzemarfortheircontinuoussupportandguidance.Icannotthankthembothenoughfortheirflexibilitytoallowmetoconductthisresearchacrossbothdepartments-EconomicHistoryandEconomics.MyheartfeltthankstoRay,whoinparticularguidedmetosomekeyeconomichistoryinsightsthatsetmeonthepathtowardsmergingseveralschoolsofthought.Thankstohisguidance,IbelieveImanagedtodrawgreaterinsightsfrommyfindingsandputthemincontextacrossvariedschoolsofthought.MythanksalsotoCeline,whoensuredmyeconomicanalysisremainedsoundthroughout.Noteasy,givenmybackgroundinmathsandengineering,noteconomics!
Iwouldespeciallyalsoliketothankmysupervisors,duringaninterimperiodinthisPhDofillhealthforme.Wereitnotfortheirunderstandingandbeliefinme,IamnotsureIcouldhavemanagedthatperiod.Mygratitudeisdeepfelt.
IamalsothankfultomymanyfriendsinEdinburgh,whohavehelpedmeoutwithkidsandemergencies,whileIwasengagedonthischallengingpath-andthemanyencouragingdogwalkstogether!Ihavebeenveryblessedindeed.

ix
Author’s Declaration
Ideclarethat,exceptwhereexplicitreferenceismadetothecontributionofothers,thatthisdissertationistheresultofmyownworkandhasnotbeensubmittedforanyotherdegreeattheUniversityofGlasgoworanyotherinstitution.
Printedname:NasiraBradley
Signature:

1
Chapter 1 Introduction
‘Stay Hungry, stay foolish’ Steve Jobs (Commencement speech, Stanford, 2005)
A reminder to me to stay true to my outside-the-box training, learned while
working in research in frontier edge technology - and now my attempt to apply
it also within academic research.
All economies, be they advanced or developing, seek long term sustainable
growth to deliver an improving quality of life. The key to sustainable growth has
long since been acknowledged as innovation. Yet, innovation does not deliver
growth directly, it acts upon growth through raising productivity. The oncoming
era of automation and artificial intelligence pose challenges and opportunities
for both the advanced and developing economies, with the race on to see which
economies will be ahead of this curve in the transition – and how smoothly. Once
again innovation has been brought to the fore as a deliverer of growth in this
race, raising the importance of understanding the intricacies of the interwound
fields of innovation, productivity and growth.
The importance of innovation and its role in economic growth is not new. It can
be traced back as early as Adam Smith (1776), who recognized that
improvements in technology played an important part in raising worker
productivity. After Smith, however there was a period of silence on the role of
innovation in economic analysis, till the arrival of the Austrian economist,
Joseph Schumpeter, with his influential book “The Theory of Economic
Development’ published in German (1911) and later in English (1934). However,
Soete et al. (2010) give List the credit of being the first economist who
advocated the role of the state in creating long-term policies to support
industries, emphasizing the importance of interconnectedness of institutional
science with technology in industries (List, 1841). Following List, Schumpeter,
often acknowledged as the ‘father of the field of innovation’ (Hall & Rosenberg,
2010), expanded on Lists’ importance to the role innovation by focussing on two
main themes in his book (1911). Firstly, that innovation lay at the heart of
economic development and growth. Secondly, innovation did not just happen,
they were created through heroic efforts by entrepreneurs (Schumpeter, 1934).
More so, Schumpeter homed in on the importance of understanding and
analysing role of firm-structures in developing innovation (Schumpeter J. ,

Chapter 1 2
1942). By placing innovation at the heart of the growth process, Schumpeter in
essence began a long road of study into innovation and its central connection
with growth.
The seminal paper linking the role of innovation as the long-term driver for
sustainable growth is attributed to Robert Solow (1957), who attributed
innovation or technological change as the only driver to overcome diminishing
returns of factors of production. This paper was ‘a shot heard around the world
that transformed the study of technological change into something more than an
obscure sideshow’ (Scherer, 1999). Solow’s paper sparked a flurry of research
into growth, specially the role of human capital in overcoming diminishing
returns (Schultz, 1961; Lucas, 1986). However, innovation – which had been
promoted as a specific point of focus by Schumpeter- remained still an
exogeneous variable, delivered as if it were by manna of heaven. It was not until
Romer’s seminal paper (1986) that innovation or technology was made
endogenous to growth. Romer proposed that innovation in industry required
profit-orientated activity to deliver two distinct components: products that
could be patented excluding rival firms and knowledge, which is essentially a
public good. Alongside this period of growth theories sparked by Solows’ seminal
paper (1957) leading to Romer’s insights into the role of innovation within
growth, the field of evolutionary economics – studies of innovation systems- had
also experienced a spurt of interest and developed in tandem.
In contrast to growth theories, which concentrate on explaining an output based
on inputs, National Innovation Systems (NSI) focus on the process connecting the
inputs and outputs. According to Soete et al (2010), the historical foundations of
evolutionary economic stream of thought can essentially be traced back to List
(1841), who advocated the support to develop systems of innovation, focussed at
institutional and country level. These innovation systems, which were alluded to
over the early 20th century (Schumpeter, 1939; Rostow, 1952; Kuznets, 1965),
were developed further in seminal papers by evolutionary economists
highlighting the informal role of R&D linkages or tacit knowledge in National
innovation systems (Nelson & Winter, 1982; Freeman, 1987). These papers
emphasized linkages between institutions and industry alongside importance of
diffusion and skill development and led to a spate of studies on innovation
systems (Dosi & Nelson, 1994; Lundvall, 1992; Nelson & Rosenberg, 1993;

Chapter 1 3
Freeman & Soete, 1997), sometimes known as the field of economics of
innovation (Verspagen & Werker, 2003). Not only does NSI theory probe into the
networks and alignments between the public and private sector, it also includes
the emphasis on importance of basic sciences, diffusion of knowledge and skilled
workers. In particular, NSI systems differentiated themselves from growth
theories by allowing introductions of innovation to be accompanied by initially
diverging directions of productivity (Broadberry & Jong, 2000). This somewhat
broader approach to the innovation process was complementary to growth
theory, adding important understanding to the process of development of
innovation. The link of innovation to growth via productivity is however not
rooted in NSI, instead it can best be found through linking development
economics understanding with growth theory.
A seminal paper in development economics was Lewis’s economic development
model, which proposed country growth could be linked to accumulation of
capital (Lewis, 1954). Adding to this was the influential work of Amsden (2001),
analysing newly industrializing economies explaining mechanisms of moving
knowledge-based assets from lower skilled sectors towards higher skilled or
higher productive sectors. However, it was Gollin (2014) reviewing the Lewis
model, who adapted the interpretation of the Lewis model to relate productivity
to growth. Building upon the insights in development economics, Gollin (ibid)
proposed that productivity caused by the reallocation of resources from lower
productive sectors towards higher productive sectors was the key to growth, not
capital accumulation as suggested by Lewis. While Gollins’ revised interpretation
of Lewis model provides a model linking growth to productivity, the model does
not make any connection with innovation or firm structures. Despite the oft-
repeated insight that innovation is the key to higher productivity, overcoming
diminishing returns as proposed originally by Solow (1957). Indeed, while these
three disciplines of national innovation systems rooted in evolutionary
economics, growth theory rooted in neoclassical economics and development
economics offer very fundamental insights – yet, they remain quite apart.
It is this very gap that the thesis aims to bridge. Drawing together insights from
these three close yet disparate fields, to find a way to interconnect fundamental
concepts on growth: innovation, productivity and growth. In order to do this, a
fundamental thread runs through all three papers in this thesis – the importance

Chapter 1 4
of the firm in all these three areas. The principle ‘vehicle’ of innovation as
proposed by Schumpeter, who was preoccupied with the role of the firm size in
the field of innovation (Schumpeter, 1934; Schumpeter, 1942). To enable this
interconnection of innovation, productivity and growth, the thesis breaks up the
research into three areas.
Firstly, to enable this, the thesis starts by broadening the analysis of innovation
by including growth theory alongside national innovation systems. Following in
the footsteps of scholars working on economics of innovation in the ‘invisible
college’ (Verpsagen & Werker, 2003), with an ‘evolutionary’ paradigm working
alongside the more traditional paradigm analysts (Hall & Rosenberg, 2010). This
thesis however proposes combining the two paradigms, rather than working
alongside the traditional paradigm. Following the seminal work by Lundvall et
al. (Jensen et al.,2007) who indeed combine these two paradigms, this thesis
examines not only the combined effect of these two paradigms – it seeks to find
an order to these influences. Differentiating primary drivers, those needed to
initially build innovation, and secondary drivers, those used to spur innovation
growth. To avoid using TFP, labelled ‘a measure of our ignorance’ (Abramovitz,
1956), as growth accounting has pitfalls associated with the increasing difficulty
to untangle capital from intangible investments (Hulten et al, 2006), the
research used direct innovation survey data. Maintaining Schumpeter’s focus on
firms, the analysis differentiates these drivers for firm-size classes: small,
medium and large. Thus, identifying the innovation drivers most needed per size
class. In essence, this is the foundational research setting an understanding of
drivers of innovation combining two paradigms, while also laying the groundwork
for understanding the importance of structures in the arena of innovation.
Secondly, drawing on development economics’ Lewis model, the thesis aims to
connect innovation’s importance of firm structures with country labour
productivity. Influenced strongly by economic development thinking of Lewis
(1954), Gollin (2014) and Amsden (2001), all of whom in slightly differing ways
explain the mechanisms of moving knowledge-based assets from lower skilled
sectors towards higher skilled or higher productive sectors. These higher skilled
sectors are associated with higher innovation, which in the long-term generate
the higher productivity and growth for economies. Deviating from the norm of
considering hindrances to factors of production rooted in neoclassical

Chapter 1 5
perspective, as cause of lower productivity – this research explores how firm-
structures which channel resources, influences productivity through proposing an
adaptation of the Lewis model. This thesis examines through the proposed
adapted Leis model whether movement across firm structures, not sectors, could
offer important insights to explain country labour productivity. Thereby drawing
concepts of innovation into the area of growth and productivity, as productivity
is recognized as the sustainable long-term driver of country growth Gollin
(2014).
Lastly, proceeding further on Schumpeter’s focus of the firm as ‘the vehicle’ of
innovation, this research assesses what drives growth of the firm itself. Tackling
one of the very concrete problems hindering growth in the UK economy – scale
up of firms. Drawing from evolutionary thought on the influencing role of state
policies on innovation, this research aspires to draw as many as possible of the
firm-growth policies together, ranging from tax, financing, merger & acquisition
supporting policies through to monetary policy. Assimilating an overall view of
their realistic influence on the ground through using actual firm data.
Combining this analysis with factors of production rooted in neoclassical
analysis, alongside variables capturing aspects rooted in systems of innovation.
However, this amalgamation goes further. It draws on understanding rooted in
business history of economics and research in finance, management and
enterprise literature. These offer valuable insights, which essentially allow the
final leap. The leap involving a factor, not rooted in either stream of thought,
but debated in economic history – a very prevalent issue on the ground in firms.
That of firm independence. Firm independence as measured in this study, is
understood to indicate that the firm is not owned by another business or
financial firm, as such it has not been acquired or merged by another firm with
controlling shares above 25%. The reason firm independence is of interest is the
debate between some economic business historians claim that firms appear to
grow sustainably through organic growth, which appears to contradict
management literature, which consider acquisition as a path of sustainable
growth for firms. While this may not be hard and fast rule, it is interesting to
examine whether this characteristic does have any impact on firm growth ,as
suggested by business historians. The research revelations are surprising.
Independence appears to enable firms to reap more from factors of production,

Chapter 1 6
while also delivering an age-related independence bonus-dividend. Firm
independence appears to have a strong influence on growth, not yet captured in
neoclassical thought nor in evolutionary systems. Leaving the possibility open for
new models to be perhaps developed, offering deeper insights into firm growth.
This thesis has thus tried to connect the analyses of innovation, productivity and
growth, through merging insights across disciplines ranging from evolutionary
economics, growth theory, development economics and business history. That
path seems to have delivered new insights on the interconnectedness, as well as
offering deeper understanding of structural determinants. Yet, it seems only to
be a beginning. It offers insights of what can be gained from merging the field of
‘economics of innovation’ towards a field of ‘economics of innovation,
productivity and growth’. It would appear that far more can be interlaced,
which could help this paradigm of thought to grow and evolve further.
Despite the new insights yielded in this thesis on innovation, productivity and
growth, there are quite a few research topics addressed in this thesis that leave
avenues for future research. At its core, the foundational research chapter while
shedding light upon the broader set of innovation drivers, only throws indicative
light upon the possible mechanism through which these innovation drivers
influence firms’ primary and secondary drivers. Detailed research into the
various threads would reveal the deeper mechanisms, allowing policy analysis to
be tuned accordingly. Similarly, the research on the adapted Lewis model which
draws firm structures into productivity analysis, enables examination of
importance of firm structures influence on productivity of an economy.
However, in terms of sectoral composition it was only indicative of which sectors
contribute to growth through employment or through higher productivity. Future
research to explore the manner of contribution of sectors to economies, would
help device policies to tailor policy to the problem – distinguishing between
employment versus productivity. The last research piece of this thesis on scale
up of firms, while shedding light on the value of firm independence, leaves
questions on the role of the innovator unanswered. Future research, perhaps in
close collaboration between historical analysis and economics of innovation, may
help unveil the critical role of culture or innovator mind-set to find answers to
those queries.

Chapter 1 7
In essence, this thesis has tried to address some of the gaps that exist both in
evolutionary stream on empirical analysis on concrete problems (Soete et al.,
2010), as well as limitations in neoclassical analysis of analysing innovation at
country, sector and firm level ( (Dosi & Nelson, 2010). According to Soete et
al.(2010) , empirical analysis of concrete problems offering concrete policy
advice is a much needed next step for evolutionary economic steam of thought.
Soete et al. (2010) observe that the challenges of globalisation and the spread of
innovation across services and industry sectors causing shifts in the role of R&D
and interconnections with institutions, requires evolutionary economic thought
to move towards empirical approach to retain relevance. More specifically, it
should move towards policy analysis of concrete problem. This thesis hopes to
add towards filling the void as mentioned by Soete et al. (2010), as well as
making steps towards overcoming some of the neoclassical limitations raised by
Dosi & Nelson (2010). I hope this thesis is indeed one small step in that
direction.
Last but not least, my own experiences in innovation on the ground, have left
me convinced and strongly supportive of Soete et al.’s (2010) stance – that
innovation policy analysis has to tackle concrete problems. Allowing not only this
field to remain relevant– but principally also in order to grow.

8
Chapter 2 Where NSI meets Growth Theory - ‘Where do informal R&D processes fit alongside formal R&D investment?’
2.1 Abstract
This chapter explores a wider set of innovation drivers driving firm growth,
combining analysis of formal R&D processes promoted by growth theories
alongside informal R&D linkages emphasized by national innovation systems
(NSI). Although both R&D aspects are well researched for their importance
towards innovation, this study proposes that there is an order to this
contribution. The informal R&D process of linkages works on building the
foundational levels of innovation, while R&D investment appears to spur
additional growth of these innovation levels. Thus, informal R&D processes such
as linkages and tacit knowledge constitute the primary driver, while formal R&D
processes such as R&D investment acts as a secondary driver.
The main goal of this study is to distinguish primary drivers from secondary
drivers, by examining the differences in key forces driving firm revenue levels
versus those driving firm revenue growth. This hypothesis is tested through a
dataset of 27 European economies over the period of 1996-2010, controlling also
for globalization and industrial organizational drivers. Findings reveal that
informal R&D linkages appear to be the primary drivers needed to establish firm
revenue levels, while formal R&D investment is needed as a secondary driver to
spur firm revenue growth.
Furthermore, the findings reveal that drivers for small and medium (SMEs) firms
including both skilled human capital and linkages with academia, are significant.
Additionally, linkages with government institutions were found relevant for
medium size firms, reflecting the contribution of organisations like the
Fraunhofer institutes in Germany on innovation.

Chapter 2 9
2.2 Introduction
Economies across the world seek policies to stimulate sustainable growth and
improve productivities. Ever since Solow demonstrated that technology
contributed more than capital towards long-term growth (Solow, 1956), the
countries have focused on innovation as a basis for growth. Since then, the
responsive policy focus has predominantly been driven by an emphasis on R&D
investment. While policy response has been dominated by a focus on R&D
investment, historical analysis of innovation across the two industrial revolutions
draws emphasis towards another aspect – the role of collaboration (Mokyr,
2010). According to Mokyr, the key to economic growth in the west such as UK’s
innovative reign as the first Industrial nation and Germany’s dominance in
chemicals in the second Industrial revolution, can be found in the “international
cooperative agenda for useful knowledge” (ibid). Perhaps, policy focus may not
only have missed capturing the wider drivers of innovation; more importantly it
may have overlooked the most critical of drivers.
Understanding the drivers of innovation not only helps tailor policy to support
innovation delivering long-term growth in an economy; moreover, economies in
the vanguard of innovation appear to dominate globally, outpacing others in
growth. The US, the world’s dominant economy, can be considered as the
‘cutting-edge global technology leader’ in the global arena (Wessner, 2011).
Among European economies, the European Union Innovation scoreboard (EIS)
ranks Germany alongside Sweden, Denmark and Finland as the Innovation leaders
above other European economies (European Commission, 2013). Indeed,
Germany’s strength in technical machinery allows it to be portrayed as the
‘world supplier and equipper’ of systems and production technology (Wessner,
2011). Obtaining a better understanding of the drivers of innovation may help
explain why some economies outpace others in innovation and how, as Mokyr
observed, it may have shaped dominance of historical economic powers.
What are then the wider set of innovation drivers and importantly which are
primary drivers acting on innovation levels versus secondary drivers acting on
innovation growth? Moreover, do current R&D policy targets represent a
sufficient response for driving innovation? Mokyr’s historical analysis of
innovation (Mokyr, 2010) seems to suggest that the drivers of innovation are

Chapter 2 10
complex, requiring more than just a focus on R&D investment. This view has also
long been promoted by evolutionary economists (Nelson & Winter, 1982;
Freeman,1987; Lundvall, 1992), who emphasise the informal role of R&D
linkages or tacit knowledge in national innovation systems (NSI). This paper
aspires to answer the first part of the query through using a wider context of
analysis, which incorporates drivers of innovation found in growth theories,
evolutionary economic theories and industrial organization theories. Through
bridging the search for innovation across theories, this paper hopes to deliver a
wider set of drivers, but critically also providing comparison, enabling in turn
the order of selection of the most crucial drivers. The second part of the query
is taken up in the conclusion, based on the findings of the analysis.
Building upon significant body of work assessing the diverse roles of informal and
formal R&D processes on innovation, this paper adds to this debate through two
dimensions. Firstly, it aims to differentiate between the contribution of a
primary and secondary driver role, between informal R&D linkages and formal
R&D process, as captured by R&D investment, R&D linkages exemplifying an NSI
approach and R&D investment rooted in growth theories. This expands on the
work of Jensen et al. (2007), who investigate the isolated and combined effect
of R&D linkages and R&D investment on innovation, through differentiating the
order of the contribution of informal R&D linkages and R&D investment on
innovation. The second dimension is that the paper expands the combination
beyond national systems of innovation (NSI) and growth theories to including
drivers from industrial organization and globalisation which influence the
innovation process.
Apart from the significant work on assessing the formal and informal role of R&D
on innovation, there is an abundance of studies analysing the determinants of
innovation rooted in assessing Schumpeterian concepts or drivers from growth
theories. Growth theories, with technology considered either exogenous to
systems as in neoclassical growth theories1 or technology endogenous to growth2.
1 Growth theory models such as (Solow, 1956), (Mankiew, Romer and Wiel , 1992), (Lewis, 1954),
alongside growth determinnat studies (Bosworth and Collins, 2003), (Easterly and Levine 2001) (Klenow and Rodrigues, 1997).
2 Endogenous growth models as developed by (Arrow, 1962), (Romer 1990), (Romer 1993), (Matsumaya, 1992), recently added by (Aghion & Howitt, 2006)

Chapter 2 11
In fact, Mairesse and Mohnen reviewing innovation determinant studies,
observed that studies have tended to concentrate on the analysis of
contributions of market concentration, firm size, impact of technology push and
pull on demand, foreign ownership and impact of R&D effort on Innovation
(Mairesse & Mohnen, 2010). In contrast, Cohen reviewing innovation studies over
the last fifty years, found the focus of industrial organization studies moved
away over 50 years ago from market concentration and firm size, towards a
focus on more fundamental determinants3 such as firm-level or industry
characteristics, explaining industry differences and problems of appropriability
(Cohen W. , 2010). Nonetheless, Mairesse and Mohnen observe that despite
these numerous determinants studies, the process of innovation is far from
clear, with a great portion of innovation remaining unexplained (Mairesse &
Mohnen, 2010). Supporting that aspect, Hall et al. (2010) observe that R&D may
explain as little as 20-30 percent of the innovation process. Thus, by bridging the
analysis in this study across theories, this study aims to not only bring in a wider
set of innovation drivers – it aspires to shed a little more light on the actual
innovation process.
Previous studies have not only left a large portion of the innovation process
unexplained; according to Cohen (2010), they have also suffered from the
drawback of lack of direct innovation data and perhaps most seriously, from the
absence of an innovation measure itself. Total factor of productivity (TFP) an oft
used measure of innovation obtained through growth accounting, was very early
on characterised by Abramovitz as a ‘measure of our Ignorance’ (Abramovitz,
1956). While growth accounting techniques have developed a lot since then, the
fact that capital has become more inter-twined with productivity has essentially
made the separation of influence of innovation from capital through growth
accounting even more difficult (Hulten C. , 2010), making the capture of as
technology in TFP through growth accounting more problematic. More so, growth
accounting is essentially based on a production function approach rooted in
growth theories, whereas this study aims to take a wider approach incorporating
growth theories as well as the informal role of R&D linkages or tacit knowledge
3 Pioneered by Schmookler (Schmookler 1962) , Arrow (Arrow 1962), Nelson (Nelson, 1959), Griliches
(Griliches, 1979), Rosenberg (Rosenberg, 1974), Mansfield (Mansfield 1968) and Scherer (Scherer, 1980).

Chapter 2 12
in national innovation systems (NSI). This suggests seeking an alternative
measure to TFP for capturing innovation.
This leads to the choice by many scholars of another measure of innovation,
patents. The weaknesses, however, associated with the use of patents as a
measure of innovation have also been highlighted earlier on by Griliches and
Pakes (Pakes & Griliches, 1980)), supported by findings of Achs and Audretsch
(Achs & Audretsch, 1988). Given these challenges, the innovation manual
(Eurostat, 1997) advocated the choice of measuring outputs of innovation, where
invention has been commercialized into an output, a concept used in Community
Innovation Surveys (CIS). Mairesse and Mohnen (2010) find that Community
Innovation Surveys provide studies with access to both direct innovation data
and a reliable innovation measure, enabling cross comparisons (Mairesse &
Mohnen, 2010). Through choosing to use both innovation data and innovation
measure from CIS for this analysis, this study hopes to avoid some of the earlier
drawbacks associated with use of indirect data or the absence of a specific
innovation measure.
Additional to calling for an avoidance of these pitfalls, Cohen pointed out ‘a
major lacuna in the understanding of drivers of innovation’, is the lack of
awareness of the contribution of innovation from the service sector (Cohen,
2010). This study goes a step further and looks at all innovative sectors, be they
service or industry, as defined by the Organization for Economic Co-operation
and development in their move to help standardize innovation terminology
(OECD, Innovation Manual, 2005). Such a wider incorporation of sectors,
essentially also assessing the contributions of innovation importantly taking
place in design and engineering, is again one more step in the direction towards
improving our understanding of innovation through a wider approach
Thus, with the aspiration of shedding greater light on the innovation process
through finding a wider set of drivers and adding robustness through use of
direct innovation data as a direct innovation measure, this study focuses on 27
OECD countries using EU CIS survey data to perform a country level panel data
innovation driver analysis covering a period from 1996-2010. For this analysis,
the unit of analysis is at aggregated innovative core sector level for each of the
27 EU economies - with the aggregation capturing innovation across both

Chapter 2 13
industry and services, avoiding the pitfall of restricting innovation to industry
only sectors.
Following on from the empirical section, this study offers insights into the
mechanisms through which these drivers could exert influence on the innovation
process illustrated through German context, given Germany’s strong standing
across drivers and innovation.
Although the drivers in this study are sourced from across a slightly wider set of
theories than previous cross-theory studies, the results support earlier findings
of those theories: significance was found for industry linkages with academic
institutions and importance of public funding for industry, along with supplier
linkages and skilled human capital. The linkages were measured through CIS
innovation surveys, based on firms rating the working relationship with the
respective body as the most valuable cooperation influencing their innovations.
Interpreted through the workings in Germany, these drivers influence innovation
through mechanisms enhancing commercialization of research, reduction of
funding gaps and promotion of longer-term decision-making. Though surprisingly,
R&D investment is not found to be significant as a primary driver for innovation,
it is found significant as a secondary driver working on innovation growth. This
seems to signify that it requires the foundations of innovation to be laid by the
wider set of primary drivers and uses them to thereupon build innovation
growth. This differentiation may be an important insight for policymaking, by
calling into question the current focus on R&D investment, which seems to be a
secondary driver, and asking whether innovation may not be better served if
greater focus is brought to bear also upon the use of a wider set of primary
drivers to lay the foundations of innovation in the first place.
The analysis concludes with a reversal of Schumpeter’s Hypothesis: instead of
using firm-size as a driver, it differentiates the drivers for varied firm sizes. The
results indicate that skilled human capital and linkages to academia remain key
in driving innovation for SMEs, with the added significance of linkages with
government institutions for medium sized firms. The loss of significance of
public funding or supplier collaborations as drivers for small and medium size
firms invites further research. A last, but perhaps not insignificant aspect, is
that large firms appear to dictate a substantial portion of innovation measure.

Chapter 2 14
While SMEs may be called the hidden growth champions of Germany, their share
of innovation turnover is by virtue of their size limited. Hence in the long run,
economies or indeed sectors may be inhibited in innovation as a consequence of
a reduced share of presence of large firms.
The rest of this article is structured as follows. Section 2 gives a short
background covering an overview of the Innovation studies and their findings on
determinants, accompanied with a brief outline of the theories governing the
various studies and their respective drivers. Section 3 describes the model and
data. Section 4 interprets the mechanisms of influence of these drivers using
insights gained from the Germany economy, with Section 5 listing the empirical
results. The concluding section 6 offers insights from the empirical results into
the innovation process, along with listing of some possible implications for policy
makers.
2.3 Brief Overview of theories and Innovation studies
The dominant theories influencing growth and innovation and their consequent specific innovation drivers
Before we proceed to the overview of innovation determinant studies, it may be
helpful to briefly outline the prevalent dominant theories and their
accompanying influence on innovation. As this study’s main contribution centres
on the importance of selecting drivers sourced across a wider range of theories
rather than proving the theories themselves, this section provides only a very
preliminary sketch of these theories. The reader wishing to pursue these
theories in greater detail may access the listed references to obtain a more in-
depth understanding of these theories.
It is perhaps also important to clarify that these theories are not innovation
specific theories; instead they are the prevalent theories regarding growth,
trade and industrial organization. Indeed, these are areas in an economy that,
in some way or another, are critically dependent upon the path of innovation.
Hence, they tend to include some determinants or influences pertaining
specifically to innovation. Aspects of these theories that influence innovation
are incorporated in this study as a set of innovation drivers originating from that
theory, with each set of drivers thus representative of a particular theory, as

Chapter 2 15
illustrated in Figure 2.1. Thus, keeping in mind that the theories itself have a
wider composition pertaining to other areas of influence, the following theories
will be considered for their influence on innovation: Growth theory; National
innovation systems; Cluster theory; and Globalization. Though this selection can
by no means be considered to cover the entire range of theories touching upon
innovation, their selection is dictated by the prevalent dominance of these
theories in influencing various innovation studies.
Let us start with growth theory. At its very simplest, growth theory may be
understood as a set of models and theories that attempt to interpret the process
of growth in economies, accommodating various combinations of factors of
production in their models.4 Solow, in developing a growth model, with
technology exogenous to it, illustrated that the factors of production such as
physical and human capital are limited in their contribution to growth and long-
run sustainable growth may only achieved by virtue of technology (Solow, 1956).
In exogenous growth systems, technology increasing productivity through an
upward shift of the production function and endogenous growth systems
maintaining an increasing-returns to scale through knowledge capital5. Although
growth models have continued to develop, some with technology exogenous and
others with technology endogenous to them, the main assertion of Solow’s
remains relevant even today: technology or innovation still appears to drive
long-term growth.
While the development of growth models has led to varied sets of drivers,
including the distinction of tangible from intangible capital (Hulten, Corrado, &
Scihel, 2006), growth theory drivers essentially originate from the supply or
input side of the process, with varying emphasis on the degree of contribution of
human and physical capital in delivering growth and innovation. The inherent
assumption is that the introduction of innovation is accompanied by productivity
increases.
4 A good overview of growth models may be found in (Jones, 2002) , as well as (Thirlwall, 2002) 5 Some overviews of exogenous and endogenous growth theories may be found in (Broadberry & Jong,
2000), (Winter, 1994), (Jones, 2002) (Meier, Rauch, 2005)

Chapter 2 16
As the focus of this study remains on innovation, the drivers selected from
growth theory for this research have been restricted to those influencing
innovation, i.e. skilled human capital and R&D investment, including external
outsourcing of R&D. Given the restriction of data availability, this smaller subset
of drivers pertinent to innovation, is considered for the remainder of this
research as appropriately representative of growth theory drivers influencing
innovation.
In contrast to growth theories, which concentrate on explaining an output based
on inputs, National Innovation systems focus on the process connecting the
inputs and outputs. Developed by evolutionary economists, the National
Innovation Systems (NSI) approach emphasizes linkages between institutions and
industry alongside importance of diffusion and skill development (Schumpeter,
1939; Rostow, 1952; Kuznets, 1965; Nelson & Winter, 1982; Nelson &
Rosenberg,1993). Not only does NSI theory probe into the networks and
alignments between the public and private sector, it also includes the emphasis
on importance of basic sciences, diffusion of knowledge and skilled workers. It
also differentiates itself from growth theories in allowing introductions of
innovation to be accompanied by initially diverging directions of productivity,
with productivity initially reducing at introductions of innovation and only rising
after period of diffusion (Broadberry & Jong, 2000). This somewhat broader
approach to the innovation process may be viewed as defining the groundwork
through which innovation could flourish within the boundaries of a nation state6.
The selection of NSI drivers impacting the process of innovation for this research
have been restricted to those available in CIS data: linkages between industry,
public institutions and educational sector, representing alignment between
industry, academia and government institutions and commercialization of
research; as well as a measure of the influence of skilled human capital, as well
as a measure of contribution of firm access to public funding on innovation.
Whereas growth theory and NSI deal with the supply side or process aspect of
innovation, Cluster theory has a different angle of contribution to innovation,
rooted in its origins in cities and industrial organization (Marshall, 1920; Arrow,
1962). While Marshall (1920) emphasized the decrease in labour and input costs
6 Explanation of National Innovation systems have been documented by the OECD (OECD, 1997)

Chapter 2 17
to firm co-location, Hotelling (1929) emphasized co-location as a competitive
advantage for profitable business locations. Jacobs (1969) promoted the idea
that city size and diversity lead to industrial agglomeration, a concept also
recognized earlier by Marshall (1920). These concepts of co-location received
greater traction across the policy world, when Porter related the advantages of
industrial conglomeration and localization towards spurring of competitive
advantage of nations (Porter M. , 1990). Indeed there is an abundance of studies
in agglomeration, a review of which was conducted by Rosenthal & Strange
(2004), however for this study we focus on the cluster concept promoted by
Porter (1990) as it influenced industrial agglomeration.
While not without critique7, this resurgence of cluster theory has influenced
policy widely, both at international and national forum-levels. It combines
drivers from growth theory and NSI to bring emphasis on skilled human capital,
as well as infrastructure and importance of institutions. While it emphasizes
institutions, it differs from NSI that it focuses on the expertise and not the
relationships of institutions within the innovative networks. Instead, the key
emphasis of relationships for industry is directed towards supplier and clients,
based on geographic proximity and the influence of home markets. Competitive
advantage is based on inter-firm rivalry within the domestic markets. As before
due to data limitations, the drivers representative of cluster theory for this
research have been restricted to skilled human capital, supplier linkages
measured through collaborations and home market focus of enterprises.
7 Some recent critique of Porters work may be found in (Martin & Sunley, 2003) (Taylor, 2010) (Swords,
2013).

Chapter 2 18
Figure 2.1: The different innovation drivers associated with Growth theory, NSI, Cluster theory and Globalization, source (author)
In comparison to the above brief overview of dominant theories influencing
innovation, globalization may perhaps not be labeled as a theory. Rather it can
be described as an aspect of trade, which has shaped innovation through the
diffusion of knowledge and enabled transfer of technology across national
boundaries, a consequence of multinational enterprise cooperation with local

Chapter 2 19
organizations (Frankel & Romer, 1999; Feyrer, 2009). Though globalization and
trade may not always have been beneficial for growth8 or for fuelling innovation,
its impact on innovation through global competitive pressures and wider skill-
base draw focus on globalization as a driver of innovation in its own right
(Grossman & Helpman, 1994; Bailey & Gersbach, 1995; Scherer, 1992). Thus,
within the boundaries of this research and data availability, to determine
whether it is a primary driver, the importance assigned by innovative enterprises
on global markets is considered a driver representative of globalization influence
on innovation.
The above thus lists the theories influencing innovation, whose drivers pertinent
to innovation will be explored empirically further on in this study. However,
there is another theory that has considerably influenced innovation studies – that
of Schumpeter’s Hypothesis (Schumpeter, 1934; Schumpeter, 1942)9. It basically
evaluates the contribution of firm-size and market concentration as drivers on
innovation. Although has there been considerable research about these two
aspects as drivers10 of innovation, this study seeks to actually refine the
Hypothesis. Instead of viewing firm-size as a driver, it seeks to differentiate the
drivers for varied firm sizes, as there is a growing preoccupation in the policy
world that stimulation of small and medium firms (SMEs) may be important for
growth and innovation in economies (Wessner, 2011).
The above remains a very rough outline of theories, describing the main
direction of thought of dominant theories influencing innovation and a simplified
selection due to data limitation, of the related drivers influencing innovation.
Within these boundaries, the empirical analysis that follows in section 4, reviews
the contributions of these drivers, representative of these theories on
innovation. Before however exploring the empirical analysis, however, the next
section lists previous research on determinants of innovation.
8 Wacziarg and Welsch found that though average affects of trade on growth are positive, certain economies
did not benefit and local context may be important to consider, while reviewing impact of globalization and trade (Wacziarg & Welsch, 2008)
9 Schumpeter started the debate on whether large size firms and monopoly was good for innovation, as it to an extent reduced the appropriability problem versus the potential of smaller and medium firms being more innovative and nimble in research (Schumpeter, 1934) (Schumpeter, 1942).
10 See Cohen who lists the large extent of studies in this area (Cohen, 2010)

Chapter 2 20
Innovation Determinant studies
As mentioned earlier, although there has been an abundance of studies into
aspects of innovation, puzzlingly a large part of the innovation process remains
largely unexplained. Mairesse and Mohnen observe reviewing innovation
determinant studies, observe that the predominant focus in analysis has been
around some key aspects, such as market concentration, firms size, technology
push-pull effects on demand, foreign ownership and influence of R&D efforts
(Mairesse & Mohnen, 2010). In contrast, Cohen reviewing industrial organization
studies on innovation, found that there has been movement away over the last
50 years from Schumpeter’s Hypothesis on firm-size and market concentration,
towards a broader research agenda delving into the deeper impacts, such as firm
level and industry characteristics, alongside technology and appropriability
issues (Cohen W. , 2010). Cohen attributes this broader movement away from
Schumpeterian hypothesis to pioneers such as Schmookler (1962), Arrow (1962),
Nelson(1959), Griliches (1979), Rosenberg (1974) , Mansfield (1968) and Scherer
(1980). According to Cohen’s review, the evaluation of firm level characteristics
includes appraising influence of attributes such as cash flow, user needs,
marketing, various management and governance methods and product
diversification on innovation, whereas industry characteristics focus on the
innovation differences in industries covering impacts on demand through income
and price elasticity, market size, technological opportunities impacted by
collaborations with suppliers and universities, along with connections to basic
sciences and role of public scientific institutions. Notwithstanding this variation
in their viewpoints, both the studies of Mairesse and Mohnen (2010) and Cohen
(2010) acknowledge that despite the extensive studies the process of innovation
remains largely unexplained.
This lack of understanding of the innovation process is further underscored by
Hall et al. (2010), who observe that despite the concentrated focus in innovation
studies on R&D, R&D explains only 20-30 percent of the innovation process. It
appears that despite this promulgation of studies into these wider drivers and
aspects of innovation, ‘there is considerable distance to go’ in terms of
explaining innovation, as succinctly put by Cohen (Cohen, 2010. P.194). This
study seeks therefore, not to further increase the depth of study into the same
aspects, but instead it considers the option of going across various theories,

Chapter 2 21
evaluating their combined effect on innovation, aiming in the process to explain
a somewhat larger share of the innovation process.
While this is indeed not the first of innovation determinant studies going across
theories, there are not many studies that have attempted a similar approach to
innovation analysis. Achs and Audretsch combined growth theory elements
alongside Schumpeter’s Hypothesis to deliver important insights, when they
evaluated innovation determinants at firm level within US (Achs & Audretsch,
1988). Though they found a monotonic relationship between firm-size and R&D,
they found no significant effect of firm size on innovation and found importance
of market concentration (but not firm dominance) important for innovation.
Their study was however limited in comparability, as it was based on a specific
US business administration data. Romijn and Albadejo went quite a bit further
and combined aspects of cluster theory, NSI and growth theory when exploring
firm level innovation in for a particular UK region (Romijn & Albadejo, 2002).
Using experimental measures of innovation, they found support for most of their
drivers, except that intra-firm networking, customer proximity or geographic
proximity were not found to be significant. They also yielded important insights
on the significant bearing of previous inter-firm and inter-personnel relationships
and experiences on future collaborations and the process of innovation. Their
study again lacked ease of comparability, as it was based on a specific
innovation survey.
In a similar vein of innovation studies going across theories, but enabling
comparability across countries, Furman, Porter and Stern (2002) again explore
similar comparisons of theories but enhance the analysis through use of panel
data looking across 17 OECD countries and time period between 1973 and 1996.
Their results attribute the greater share of innovation to a growth theory
attribute of R&D investment and an attribute of all three theories - skilled
human capital - with certain aspects of NSI also finding significance, though with
lesser impact. Their study is however limited by the use of patents as an
innovation measure and the lack of innovation specific data. Mairesse and
Mohnen explore an experimental version of a growth accounting technique to
determine innovation, using cross-country analysis of 7 OECD countries (Mairesse
& Mohnen, 2002). Using a combination of drivers from cluster theory,
Schumpeters Hypothesis of firm size, industry characteristics and R&D effort,

Chapter 2 22
they find significance for R&D effort and industry characteristic. This analysis
provides a valuable alternative approach towards innovation analysis and also
uses direct innovation data, providing further reliability of results. They
however, critically miss out on skilled human capital contribution, a key driver
found across most theories, and so run the risk of capturing contributions of
skilled human capital in their other drivers.
Continuing to combine across theories for innovation determinants, but at firm
level analysis, Bhattacharya and Bloch use cross-theory analysis for a firm level
Australia survey-specific study (Bhattacharya & Bloch, 2004). Reviewing drivers
across theories such as Schumpeter’s hypothesis of firm size and market
concentration, growth theory attribute of R&D investment, globalization drivers
of trade, as well as firm-characteristics of profits, their findings attribute the
largest significance to R&D investment, with less but still significance for
Schumpeter’s hypothesis. This analysis adds value through adding globalization
as an additional aspect to cross-theory studies., which helps broaden the
analysis, but has limitations of cross-country comparison due to the use of
Australian-specific survey data from Australian Bureau of Statistics. However,
the larger limitation is caused due to the absence of skilled human capital, a
vital driver across theories, its absence risking an incorrect significance
attribution to other drivers. Jong and Vermeulen combine aspects of linkages,
which include management leadership, education and experience, linkages to
universities and cluster aspects of intra-firm working for a Netherlands-specific
firm-level study (Jong & Vermeulen, 2006). Their results find significance for all
except education. Their analysis offers insights into deeper aspects of type of
skills of management, employee connections and intra-firm influence. Their
study, though, again suffers from the absence of skilled human capital, a key
driver across theories, along with absence of R&D investment, a driver usually
included. Furthermore, the use of country specific survey data makes
comparison across countries of similar drivers more difficult. Valuable as the
insights are from these studies, especially as they highlight the potential
strengths of various combined approaches, as enumerated above they each
suffer from certain shortcomings.

Chapter 2 23
Table 2.1 Summary oversight of literature review , source (author) Summary of literature overview
Papers reviewing a set of studies
• Review of Innovation determinant studies (Mairesse & Mohnen, 2010)
• Review of Industrial organization studies (Cohen, 2010)
• Review of literature measuring returns on R&D (Hall et al, 2010)
Papers going across theories - that enable comparison across countries
• Combining cluster theory, growth theory
and aspects of NSI, Panel data looking across 17 OECD countries and time period between 1973 and 1996 (Furman et al, 2002) – find R&D investment, skilled human capital and certain aspects of NSI. Shortcoming - use of Patents
• Combining across cluster theory, Schumpeters Hypothesis of firm size, industry characteristics and R&D effort, cross-country analysis of 7 OECD countries (Mairesse & Mohnen, 2002). Findings - R&D effort and industry characteristics, shortcoming – miss out on skilled human capital
Papers going across theories – country specific, but at firm level analysis
• Combining aspects of growth theory and
Schumpeterian hypothesis for US (Achs & Audretsch, 1988). Found a monotonic relationship between firm-size and R&D. Shor-coming, not comparable, as specific study
• Combining aspects of cluster theory, NSI and growth theory for UK (Romijn & Albadejo, 2002). Found support for most of their drivers, except that intra-firm networking, customer proximity or geographic proximity were not found to be significant. Shortcoming – not comparable, as specific survey
• Combining theories across Schumpeter’s hypothesis of firm size and market concentration, growth theory, globalization, as well as firm-characteristics of profits - at firm level analysis Australia survey-specific study (Bhattacharya & Bloch, 2004). Find significance to R&D investment and

Chapter 2 24
Schumpeter’s hypothesis. Shortcoming – no skilled human capital
• Combining aspects of linkages of innovation systems as well as management aspects and cluster theory for a Netherlands-specific firm-level study (Jong & Vermeulen, 2006). Find significance for all except education. Shortcoming – no skilled human capital
Indeed, this brief overview summarized in Table 2.1, only reaffirms Cohen’s
observation that part of the problem with innovation studies is either the use of
indirect innovation data or an absence of a specific innovation measure or the
lack of use of historical insights to supplement explanations of empirical
research (Cohen, 2010).. Nonetheless, they have pioneered an approach that has
much merit and it is in their footsteps that this study hopes to proceed further,
aiming to add value through avoiding the weaknesses highlighted by Cohen as
well as going a bit wider across theories for drivers. Our nest section will outline
the choice of models and the drivers associated with it, before proceeding to the
empirical analysis in section 5.
2.4 Model and data
Model
Having considered both the prevalent dominant theories influencing innovation
and their relevant drivers for innovation, the model evaluating the contribution
of these drivers on innovation can now be built. As pointed out earlier, the
significance of contribution of this model is based on a few simple premises.
Firstly, it combines the drivers from a spectrum of theories spanning growth
theory, evolutionary theory, cluster theory and impacts of globalization.
Secondly, this study refines Schumpeter’s hypothesis which seeks to identify the
firm-sizes driving innovation, instead this paper reverses this thought process –
initially seeking to define innovation drivers for all firms and then differentiating
the drivers specific to firm-size: small, medium and large firms. Thirdly, it uses
direct innovation firm data and a corresponding innovation measure to increase
the relevance of drivers specific to innovation. Lastly, the unit of analysis is at

Chapter 2 25
aggregated innovative core sector level for each of the 27 EU economies - with
the aggregation capturing innovation across both industry and services, avoiding
the pitfall of restricting innovation to industry only sectors.
Based on above mentioned premises, the model is listed in equation 1 :
INNOVATIONi,t = b0 + a (innovation drivers of Growth theory) i,t + b (innovation
drivers of national innovation systems) i,t + d ( innovation drivers of Cluster
theory) i,t + h (drivers of globalization) i,t + g (country-specific effects) i,t + µi,t
(1)
Where i – identifies the aggregated innovative core sector level for each EU
economy and t – identifies year
Previous innovation studies have varied model specifications, differing between
log-log form or linear combinations, based on differing innovation measures
(Cohen W. , 2010). Based on the choice of innovation measure and to avoid
capturing any of the variables from combining across theories, this model
proposes a linear combination of drivers. Essentially, assuming the drivers’
contribution is additive on innovation, not multiplicative with each other. While
this may be a simplified and conservative estimation of the drivers’ separate
influences, it avoids overlooking contributions by possibly non-multiplicative
drivers. Hence, the above model uses a linear form to assess the various
influences of these individual drivers originating from various theories on
innovation.
Representing the theories by their driver contributions, the analysis can be
rewritten, as specified in equation (2).
INNOVATIONi,t = b0 + b1(Skilled human capital and Investment) i,t + b2(Skilled
human capital, public funding, linkages to universities and linkages to
government institutions ) i,t + b3 (Skilled human capital, linkages with suppliers
and home market focus) i,t + b4 (enterprises focused on international markets) i,t
+ g5 (country-specific effects) i,t + µi,t (2)

Chapter 2 26
Innovation measure is represented by firm turnover of innovative firms, with
classification of innovative firms based on innovation in product, process,
marketing or organizational aspects (Eurostat, 1997; EUROSTAT CIS, 2013).
As skilled human capital is common to several, its influence needs to be only
evaluated once. Hence, the final shape of the equation is shown in equation (3):
INNOVATIONi,t = b0 + b1(Skilled human capital) i,t + [b2 (R&D Investment ) i,t+ b3
(R&D external) i,t+ b4 (R&D internal) i,t ] + [b5(public funding) i,t +b6 (linkages to
universities ) i,t + b7(linkages to government institutions) i,t} + [b8(linkages with
suppliers) i,t +b9(home market focus) i,t] + [b10 (enterprises focused on
international markets) i,t] + g6 (country-specific effects) i,t + µi,t (3)
Including, time effects, the equation is listed in (4), with the square brackets
denoting the separate variables representing drivers for growth theory, NSI,
cluster theory and globalization respectively, as listed in Table 2.2:
INNOVATIONi,t = b0 + b1(Skilled human capital) i,t + [b2 (R&D Investment ) i,t+ b3
(R&D external) i,t + b4 (R&D internal) i,t] + [b5(public funding) i,t +b6 (linkages to
universities ) i,t + b7(linkages to government institutions) i,t} + [b8(linkages with
suppliers) i,t +b9(home market focus) i,t] + [b10 (enterprises focused on
international markets) i,t] + g6 (country-specific effects) i,t + b7 (time dummies) i,t
+ µi,t (4)

Chapter 2 27
Table 2.2 : List of drivers used in model, associated with main strands of theories influencing innovation, source (author) The theories specific to drivers
The drivers associated with the innovation theory
Driver common to 3 of 4 strands
• Skilled human capital
Additional drivers specific to growth theories
• R&D investment (including acquisition of external knowledge and capital)
• Enterprises engaged in Internal R&D • Enterprises sourcing external R&D
Additional driver specific to National Innovation system
• Access to public funding for enterprises with some form of state support
• Linkages between industry and academia, supporting commercialization of research
• Linkages between industry and government institutions and laboratories
Additional drivers specific to Cluster theory
• Linkages between industry and suppliers, aligning research and upstream suppliers
• Enterprises with Home market focus, home influences shaping innovation
Globalization • Enterprises focused on international markets
Sources of data and definition of key measures and terms
Having defined the model, it is important to explain the sources of data and the
definitions of some measures of variables, as that also forms an important
aspect of contribution for this research. As highlighted in the overview of
previous innovation determinant studies, amongst the various challenges facing
cross-country innovation studies, there are possibly two key issues: firstly,
access to data that actually reflects innovation; and, secondly, the choice of an
accurate and comparable measure of innovation across varied national
innovation systems. To attempt to bridge these two gaps, based upon previous
research into the reliance of innovation data (Mairesse & Mohnen, 2010;
Johansson & Loof, 2009), this research turned to Community Innovation Survey
(CIS) data in order to access direct innovation data and a direct innovation
measure.
Innovation database: CIS innovation data is specific innovation data collected
across EU economies, providing a source of direct measures for most of the

Chapter 2 28
innovation variables used in this research. This facilitates a specific measure of
innovation through turnover of classified innovative firms along with other
variables associated with innovation, as well as avoids the inaccuracies that may
accompany the use of general economic variables when applied as proxies for
specific innovation issues. The European Commission initiated the first CIS direct
innovation data for Europe in ’93 with a pilot community innovation survey (CIS)
(EUROSTAT CIS, 2013). This was further developed to form the basis of CIS
innovation data, leading to the first official CIS survey in ’96 and thereafter to
the availability of innovation data every two years, with the last available data
for 2010. This survey provides data for varied types of indicators related to
innovation: products, processes, marketing and organizational and has been
closely developed following the guidelines in the Oslo manual (Eurostat, 1997).
While not without criticism, as it mixes quantitative and qualitative measures
(Mairesse & Mohnen, 2010), with the qualitative measures being vulnerable to
certain amount of subjectivity, this research is based upon the quantitative
measures available in this data.
Innovation measure: In this study, the dependent variable is the revenue or
turnover of innovative firms. This choice of innovation measure needs some
elaboration, as Kuznets mentioned as early as in 1962 that ‘the lack of
meaningful measures of innovation input and output remain great obstacles to
understanding the role of innovation in economic progress’ (Kuznets, 1962) and
continues be a challenge (Achs & Audretch, 1988; Mairesse and Mohnen, 2010).
The characterization of TFP as ‘a measure of ignorance” (Abramovitz, 1956),
underscored by the challenge of separating capital from the increasingly inter-
twined capital with innovation (Hulten C. , 2010) highlights the weakness of use
of TFP as a measure of innovation. Similarly, the use of patents as a measure of
innovation has also been questioned by Griliches and Pakes (Pakes & Griliches,
1980)), supported by findings of Achs and Audretsch (Achs & Audretsch, 1988).
The use of R&D expenditure or R&D intensity, another used measure for
innovation, was specified by the Oslo manual, as ‘one of the range of input
activities that generate innovation’ (Eurostat, 1997; OECD, 2018, p 46). The Oslo
manual goes on to identify that ‘innovation needs to be implemented…
distinguishing it from invention’ (OECD, 2018, p 47), seeming to underscore that

Chapter 2 29
innovation should be measured based on output or successful translation of
input.
Mairesse and Mohnen (2010) following that line of thought suggest that firm
revenue of an innovative firms could be an output measure which successfully
measures innovation, capturing the translation of an invention or R&D input into
gain. As Community Innovation Surveys (CIS) classify firms as innovative or not
and measure revenue, these surveys provide studies with access to direct
innovation data and various reliable innovation measures, enabling cross
comparisons (Mairesse & Mohnen, 2010). A firm is considered innovative, if it has
incorporated innovative products or processes within the last 3 years, in
accordance with definitions of innovation as listed in the Oslo manual (Eurostat,
1997; OECD, 2005). Although, the revenue measure has similar disadvantages of
measures associated with survey errors, though it appears to reflect reasonable
accuracy based on comparisons with sales and balance sheets of firms
(Johansson & Loof, 2009; Mairesse & Mohnen, 2010).
While CIS surveys provide total revenue of innovative and non-innovative firms,
they also try to identify the percentage of turnover of firms relevant to new
innovations introduced over 3 years prior to surveys. However, in the
harmonized and anonymized datasets provided by the EU, with requisite firm
classifications and sector identification, this separation of turnover related to
innovation is not available. Given the differing focus of various innovation
studies using CIS datasets, innovation measures have varied ranging from a
dichotomous binary variable identifying a firm as innovative or not, to various
usages of quantitative data (Mairesse and Mohnen, 2010). This study chose not to
use a dichotomous variable instead choosing firm revenue, as this variable could
offer insights regarding growth and firm classification.
Albeit, this choice is accompanied by the limitation that this innovation measure
does not separately identify the exact contribution of the innovation towards
overall revenue. Nonetheless, it was felt that this variable could offer more
insights than a purely dichotomous binary variable distinguishing a firm from
being innovative or non-innovative, while reflecting as much as possible of
actual innovation within firms. Henceforth, the dependent variable in the model

Chapter 2 30
is firm revenue of innovative firms, with firms being classified innovative based
on CIS definition.
Understanding of Innovation and innovative firms itself: As innovation is a
widely used term, it is also perhaps best to define the boundaries of this term
for this research. Innovation or innovative firms, as used by this research are in
accordance with the classifications of CIS, which are aligned with definitions in
the Oslo manual (Eurostat, 1997; OECD, 2005). According to the Oslo manual,
innovation is interpreted as either a new or significantly improved set of goods
and services brought by a firm to the market. Innovative firms are thus defined
as those introducing a new process or product, be it new to the market or only
new to the firm, in line with the Oslo manual definition of innovation. This
differentiation of innovation from invention, with innovation being the activity
that actually is translated to profit in the market, echoes Schumpeter’s
interpretation of innovation. In his view, innovations took place only when
inventions were accompanied by entrepreneurship: ‘… As long as they
[inventions] are not carried into practice, inventions are economically
irrelevant’ (Schumpeter, 1961, pp 88-89). Hall and Rosenberg (2010) also define
similar concepts of innovation, encompassing technical change in both products
as well as organization.
Core-innovative sectors: Another key aspect of this research is the width of
sectors analysed for innovation, incorporating both service and industry sectors,
as innovation in current day digital economies bridges both categories. This
research seeks to overcome previous restrictions of innovation studies to
industry sectors only, which Cohen (2010) found contributed to the weaknesses
of previous innovation studies (Cohen W. , 2010). Hence, this study seeks to
include all ‘core-innovative’ sectors as defined in CIS data11, including both
11 These core-innovative sectors of an economy thus follow the classification as specified by CIS (Eurostat,
2013). According to CIS, the core innovative sectors classified within industry are mining and quarrying, manufacturing, electricity, gas, steam and air conditioning and water supply; while services include
wholesale trade, except motor vehicles, transportation and storage, publishing activities, computer
programming and related consultancies, information’s services, financial and insurance services, architectural
and engineering activities, technical testing and analysis. The actual activity classification is according to

Chapter 2 31
services and industry. CIS defines these core innovative sectors to include both
manufacturing and services ranging from B till M 71 sectors. The possible
importance of extending this innovation research to all ‘core innovative sectors’
across both services and industry is not to be underestimated. This extension is
necessary to capture analysis of technical frontier firms, classified varyingly
under R&D, computer or information services, which are delivering design
solutions but not necessarily manufacturing them. To restrict studies of
innovation to manufacturing industries risks missing innovative firms in new
emerging sectors and thus not capturing the essential drivers in the ever-
changing landscape of innovation. Hall and Rosenberg underscore the
importance of this wider concept of innovation to ‘encompass research carried
out in universities and industrial and government labs … or [even just] which
Romer (Romer P. , 1990) labelled as new ideas’ (Hall & Rosenberg, 2010).
According to Hall and Rosenberg (ibid), this wider understanding of innovation
evolved with time to reflect the importance of productivity and welfare-
enhancing technical change emanating across sectors.
Firm-sizes: As this research uses firm sizes to distinguish turnover for small and
medium firms (SMEs) from large firms and this definition differs across
continents, it is also worthwhile to define the basis for this differentiation. The
classification of firm sizes in CIS innovation data follows the recommendations of
European Commission (Commission, 2003), defining small and medium-sized
enterprises (SMEs) as having less than 250 employees and an annual turnover of
up to 50 million Euros. It is though worth noting that the differentiation in CIS
data between small, medium and large is based only on employee numbers, with
small firms having 10-49 employees, medium firms having 50-249 employees and
large firms having above 250 employees.
Skilled human capital: Data on skilled human capital was not available in CIS
and has been sourced from another data set, also provided by Eurostat, the
Human Resources in Science and Technology (HRST) database (EUROSTAT HRST,
NACE system of classification, a “statistical classification of economic activities in the European
Community” (Eurostat, 2008)

Chapter 2 32
2012). This database measures the stock and flows of human resources across
the EU and is based on European labour force surveys and
UNESCO/OECD/Eurostat questionnaires. This dataset provides a measure of the
scientists and engineers in employment in the economy across all sectors, not
only innovative sectors. However, as scientists and engineers can be assumed
work in innovative sectors, this measure may still be considered relevant. While
this is also only a partial measurement of the innovative skill force in an
economy, in the absence of further detailed skilled human capital working in
economies, this is used as a variable to proxy the skill base of innovative human
capital.
Definitions of CIS variables: Though the variables in CIS have matured and
developed in the CIS surveys in order to allow greater accuracy and
differentiation of data over the years between 1996 and 2010, this study has
attempted to choose the variables across the years closely aligned to their initial
starting point in 1996 to try to minimize discrepancies. Most of these variables
assumed the definitions in 2000, which are listed still as the definitions in 2010.
Total innovation expenditure (R&D investment): In 1996, this is defined as
total innovation expenditure. By 2010, this is explicitly defined as total
innovation expenditure, capturing R&D investment, as well as costs for
acquisition of external knowledge and capital.
Enterprises sourcing external R&D: There is no data in 1996 or 1998, 2000
onwards it is defined as innovative enterprises engaged in external R&D
activities.
Enterprises engaged in internal R&D: In 1996, this was obtained as innovative
enterprises with R&D expenditure. In 2010, this variable represents innovative
enterprises engaged in in-house R&D activities.
Access to public funding for enterprises with some form of state support: In
1996, this is defined as innovative enterprises supported by government. In 2010
this represents the innovative enterprises that receive any form of public
funding.

Chapter 2 33
Linkages between industry and academia, supporting commercialization of
research: Linkages between academia and industry are considered a critical
linkage in national innovation systems. In 1996, CIS defined this as innovative
enterprises with universities or other higher education institutes as partners. By
2010 this represents innovative enterprises co-operating with universities or
other higher education institutes.
Linkages between industry and government institutions and laboratories:
This linkage captures external R&D collaboration for firms in national innovation
systems. CIS defined this in1996 as innovative enterprises with government or
private non-profit research institutes as partners. By 2010 this represents
innovative enterprises co-operating with government or public research
institutes.
Linkages between industry and suppliers, aligning research and upstream
suppliers: Perhaps also a critical linkage, as an important linkage in national
innovation systems as well as cluster theory, CIS defined this in 1996 as
innovative enterprises with suppliers as partners in equipment, materials,
components and software. By 2010 this represents innovative enterprises co-
operating with suppliers of equipment, materials, components and software.
Linkages between industry and any form of development partners: In 1996,
this is defined as innovative enterprises with any form of innovative cooperation.
By 2010 this represents innovative enterprises engaged in any type of innovative
cooperation.
Enterprises with Home market: In 1996 this was classified as innovative
enterprises with no exports. By 2010 this had matured into a variety of classes
with the study restricting the variable to innovative enterprises that sell goods
and/or services in the national markets.
Enterprises focused on international markets: In 1996 this was classified as
innovative enterprises with exports. By 2010, the variable chosen for this class is
defined as innovative enterprises that sell goods and/or services to other EU,
EFTA and EU candidate countries. To avoid overlaps, this study chose not to add
further classes of exports to different regions, as it could be the same

Chapter 2 34
enterprises with further expansions of exports. While this may reduce the total
level of innovative firms with exports and may err on the side of conservative
estimates, it attempts to capture the first level of exports for firms – through
their expansion in the closest regions outside their national borders.
In the above listed variables (except for investment and revenue variables), the
study lists the number of firms making these choices and not the aggregate
turnover, as it is not available for such measures, unfortunately a limitation of
CIS survey data. Basically, these variables are dichotomous qualitative variables
indicating use or not of the wider aspects of National innovation systems.
This study hopes to explore the importance of these above linkages, enabling
some prioritisation of these linkages for innovation, differentiated for firm-size
classes.
Interpretation of the coefficients of drivers:
As the model is a linear model of innovation, the regression will yield
coefficients for each driver, which may need to be clarified, as they will
represent the proportional ratio of change in output per unit change of the
particular driver. These are outlined below:
Dependent variable (all firm-sizes): The dependent variable, innovation output
is measured in quadrillion (million billion) Euros to enable readable coefficients
in regression tables, is the average turnover of all innovative firms.
Dependent variable (small/medium/large): The dependent variable, innovation
output measured in quadrillion (million billion) Euros, is the average turnover of
small/medium/large firm-sizes.
Skilled human capital proportional ratio: This parameter would relate
innovation output (measured in quadrillion of Euros) per number of scientists
and engineers representing skilled human capital unit (measured in the 1000’s).
Hence unit for parameter would be billions of Euro innovation output per 1000’s
engineers/scientists.

Chapter 2 35
R&D investment proportional ratio: This parameter would relate innovation
output (measured in quadrillions of Euros) per R&D investment unit, represented
by total innovation expenditure (measured in millions of Euros). Hence unit for
parameter would be billions of Euro output per millions of Euro R&D investment.
Internal R&D proportional ratio: This parameter would relate innovation
output (measured in quadrillions of Euros) per number of firms engaged in
internal R&D unit (measured in 1000’s). Hence units would be billions of Euro
output per 1000’s of firms engaged in internal R&D.
External R&D proportional ratio: This parameter would relate innovation
output (measured in quadrillions of Euros) per number of firms sourcing R&D
externally unit (measured in 1000’s). Hence units would be billions of Euro
output per 1000’s of firms sourcing R&D externally.
Public funding proportional ratio: This parameter would relate innovation
output (measured in quadrillions of Euros) per number of firms with access to
public funding unit (measured in 1000’s). Hence unit for parameter would be
billions of Euro output per 1000’s of firms with public funding.
Linkages between industry and academia proportional ratio: This parameter
would relate innovation output (measured in quadrillions of Euros) per number
of firms with cooperation between industry and academia unit (measured in
1000’s). Hence unit for parameter would be billions of Euro output per 1000’s of
firms with linkages to academia.
Linkages between industry and government institutions proportional ratio:
This parameter would relate innovation output (measured in quadrillions of
Euros) per number of firms with cooperation between industry and government
institutions unit (measured in 1000’s). Hence unit for parameter would be
billions of Euro output per 1000’s of firms with linkages to government
institutions.
Linkages between industry and suppliers proportional ratio: This parameter
would relate innovation output (measured in quadrillions of Euros) per number
of firms with cooperation between industry and suppliers unit (measured in

Chapter 2 36
1000’s). Hence units would be billions of Euro output per 1000’s of firms with
linkages to suppliers.
Linkages between industry and any form of development partner’s
proportional ratio: This parameter would relate innovation output (measured in
quadrillions of Euros) per number of firms with any form of external
collaborations (measured in 1000’s). Hence unit for parameter would be billions
of Euro output per 1000’s of firms with any collaboration.
Home market proportional ratio: This parameter would relate innovation
output (measured in quadrillions of Euros) per number of firms with sales focus
on domestic markets (measured in 1000’s). Hence unit for parameter would be
billions of Euro output per 1000’s of firms focused on domestic markets.
International market proportional ratio: This parameter would relate
innovation output (measured in quadrillions of Euros) per number of firms with
sales focus on international markets (measured in 1000’s). Hence unit for
parameter would be billions of Euro output per1000’s of firms focused on
international markets.
Having outlined the basic definitions, sources of data and interpretation of
coefficients, the next section describes the model and lists the empirical results
for this study.
2.5 Empirical Analysis
A panel-data analysis of innovation and its drivers
The empirical analysis is based on the model described in equation 4 in section 3
and the drivers enumerated in Table 2.2, the possible mechanisms of influence
for those drivers on innovation as proposed in the above section. Proceeding
now to the empirical analysis, the regression is based initially on two Eurostat
data sets, CIS and HRST, which cover 27 countries across the EU over the period
1996-2010. Reiterating the earlier equation 4 below, which is used for the
regression:

Chapter 2 37
INNOVATIONi,t = b0 + b1(Skilled human capital) i,t + [b2 (R&D Investment ) i,t+ b3
(R&D external) i,t +b4 (R&D internal) i,t]] + [b5(public funding) i,t +b6 (linkages to
universities ) i,t + b7(linkages to government institutions) i,t} + [b8(linkages with
suppliers) i,t +b9(home market focus) i,t] + [b10 (enterprises focused on
international markets) i,t] + g6 (country-specific effects) i,t + b7 (time dummies) i,t
+ µi,t (4)
For the regressions, panel datasets covering 27 countries are used, which offer
the advantage of capturing both cross-sectional as well as time-series data,
while minimizing impact of omitted variables in regressions (Hsiao, 2005). Given
this advantage of panel data sets, nonetheless the regression estimation has to
be careful to avoid country specific and sector specific effects, as they could
distort regression results. Hence, based on the panel data sets selected for this
study, this study found Fixed effect (FEM) estimation to be the most appropriate
econometric analytical tool of choice to remove country specific effects from
across the 27 country data, as FEM removes time invariant mean effects from
the correlation of regressor with explanatory variables (ibid).
The regression results for equation 4 are listed in Table 2.3 for period ’96-2010
covering 27 European countries. Innovative firm turnover as defined earlier as
the innovation measure, is used as the dependent variable on the L.H.S. Columns
numbered (1) – (5) list the various regressions independently initially for each
theory as listed in Table 2.3 and then the combined regression of all drivers – the
model for our research. Consequently column (1) lists the regression with only
the independent drivers from growth theories on R.H.S.; column (2) lists results
for NSI drivers only on R.H.S; column (3) shows results for cluster theory drivers
only; column (4) lists globalization only drivers; with column (5) depicting results
due to the combined effect of drivers, as proposed by this theory in equation
(2). However, these initial separate regressions for each separate theory from
column 1-4 may suffer from problem of omitted variable regressions, as we
exclude combining these theories which this research considers jointly
significant. As such, the result and consequent insights of the initial regression
results from column 1-4 should be treated with caution.

Chapter 2 38
Table 2.3:Regression results for initially step-wise theories and their drivers, lastly with combined drivers in accordance with proposed model, with dependent variable – annual innovative turnover of firms in quadrillion Euros
Strands of theories:
(Period 1996-2010)
(1) Growth theories
(2) Nat. Innov. Systems
(3) Cluster Theory
(4) Globali-zation
(5) All combined – as per model
(5) Previous combined – as per model
Observations
109 100 103 107 89 90
No. of groups
30 29 28 29 27 27
Obs per group:
min = 1, avg = 3.6, max = 5
min = 1, avg = 3.4, max = 5
min = 1, avg = 3.7, max = 5
min = 1, avg = 3.7, max = 5
min = 1, avg = 3.3, max = 5
min = 1, avg = 3.3, max = 5
Common driver
No. of Scientists/Engineers (Skilled human capital)
2.04***
[0.34] 1.49***
[0.32] 3.29*** [0.40]
3.22*** [0.31]
1.82*** [0.53]
2.83*** [0.05]
Drivers specific to growth Theories
Total Innovation Expenditure (R&D investment)
.000013 [0.000012]
0.000022 [0.000015]
-0.000012 [0.000014]
Enterprises with internal R&D
-0.039 [0.027]
-0.12 *** 0.03
Enterprises with external R&D
0.11 * [0.056]
0.23 *** [0.06]
0.037 [0.049]
Drivers specific to NSI
Enterprises with public funding
0.081***
[0.019] 0.075
*** [0.02]
0.07 *** [0.022]
Enterprises with any collaboration
-0.062 * [0.032]
-0.2 *** [0.045]
-0.22 *** [0.050]
Enterprises with govt. Insti. Collaboration
0.123
[0.15] -0.32
** [0.16]
-0.068 [0.16]
Enterprises with University collaboration
0.145* [0.08]
0.44 *** [0.086]
0.25 *** [0.08]
Cluster Theory
Enterprises focused on National markets
-0.003 [0.008]
0.009 [0.017]
0.025 [0.019]
Enterprises with Supplier collaboration
-0.048 [0.038]
0.138 ** [0.06]
0.15 ** [0.069]
Globalization
Enterprises focused on International markets
-0.02 **
[0.009]
-0.014 [0.025]
-0.045 * [0.027]
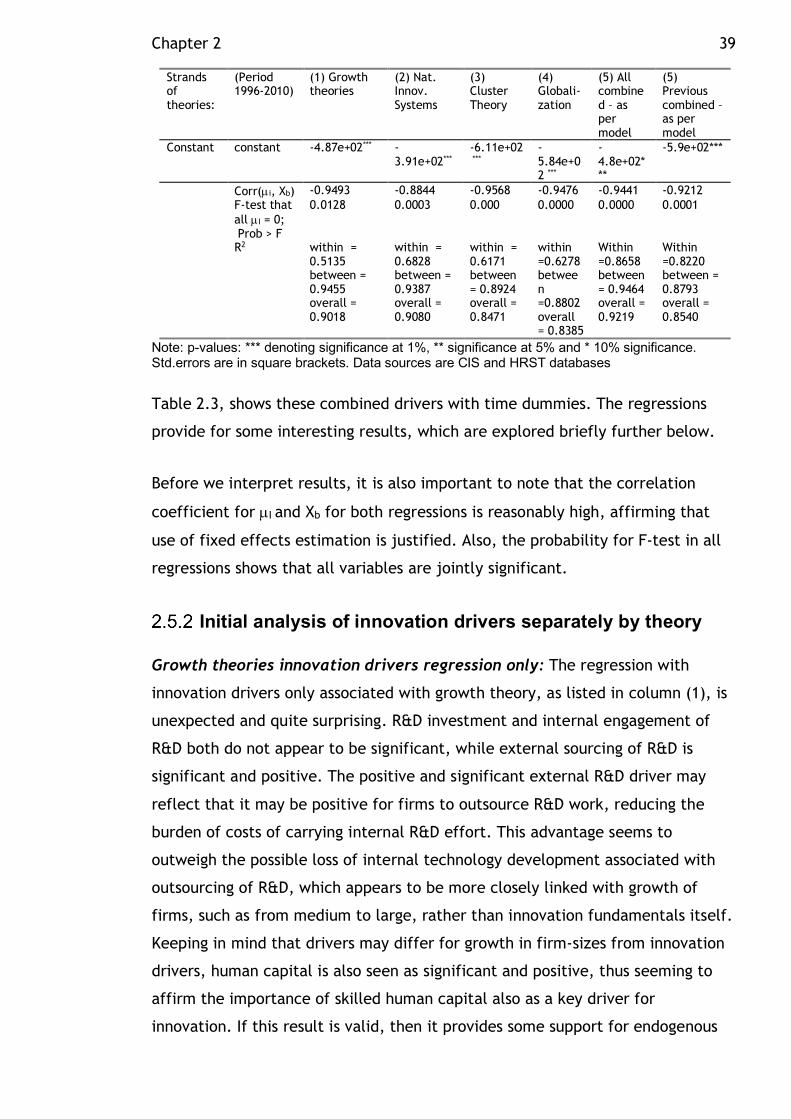
Chapter 2 39
Strands of theories:
(Period 1996-2010)
(1) Growth theories
(2) Nat. Innov. Systems
(3) Cluster Theory
(4) Globali-zation
(5) All combined – as per model
(5) Previous combined – as per model
Constant constant -4.87e+02*** -3.91e+02***
-6.11e+02 ***
-5.84e+02 ***
-4.8e+02***
-5.9e+02***
Corr(µi, Xb) -0.9493 -0.8844 -0.9568 -0.9476 -0.9441 -0.9212 F-test that
all µI = 0; Prob > F
0.0128 0.0003 0.000 0.0000 0.0000 0.0001
R2 within = 0.5135 between = 0.9455 overall = 0.9018
within = 0.6828 between = 0.9387 overall = 0.9080
within = 0.6171 between = 0.8924 overall = 0.8471
within =0.6278 between =0.8802 overall = 0.8385
Within =0.8658 between = 0.9464 overall = 0.9219
Within =0.8220 between = 0.8793 overall = 0.8540
Note: p-values: *** denoting significance at 1%, ** significance at 5% and * 10% significance. Std.errors are in square brackets. Data sources are CIS and HRST databases
Table 2.3, shows these combined drivers with time dummies. The regressions
provide for some interesting results, which are explored briefly further below.
Before we interpret results, it is also important to note that the correlation
coefficient for µI and Xb for both regressions is reasonably high, affirming that
use of fixed effects estimation is justified. Also, the probability for F-test in all
regressions shows that all variables are jointly significant.
Initial analysis of innovation drivers separately by theory
Growth theories innovation drivers regression only: The regression with
innovation drivers only associated with growth theory, as listed in column (1), is
unexpected and quite surprising. R&D investment and internal engagement of
R&D both do not appear to be significant, while external sourcing of R&D is
significant and positive. The positive and significant external R&D driver may
reflect that it may be positive for firms to outsource R&D work, reducing the
burden of costs of carrying internal R&D effort. This advantage seems to
outweigh the possible loss of internal technology development associated with
outsourcing of R&D, which appears to be more closely linked with growth of
firms, such as from medium to large, rather than innovation fundamentals itself.
Keeping in mind that drivers may differ for growth in firm-sizes from innovation
drivers, human capital is also seen as significant and positive, thus seeming to
affirm the importance of skilled human capital also as a key driver for
innovation. If this result is valid, then it provides some support for endogenous

Chapter 2 40
growth theory in terms of innovation, but negates the importance of R&D
investment, which includes capital and knowledge acquisition, as a main driver
for innovation. Removing skilled human capital from this regression immediately
assigns significance to both these R&D drivers, indicating that absence of skilled
human capital in innovation regressions may assign mistaken significance to
other drivers.
NSI innovation drivers regression only: The regression of innovation drivers
part of National Innovation Systems as listed in column (2), appears to negate
the importance of linkages with government institutions. Indeed cooperation in
general, appears to generate a negative contribution for innovation. Instead,
positive contribution towards innovation is specific to industry linkages with
universities and to firms access to public funding, thus affirming importance of
certain linkages within NSI for innovation, along with signifying importance of
public funding for firms for innovation.
Cluster theory innovation drivers regression only: Column (3) lists the
contributions from cluster theory, surprisingly also only finding significance for
skilled human capital. Home market focus and supplier cooperation do not
appear significant.
Globalization as an innovation driver regression only: The results of column
(4) show the regression results for globalization as an innovation driver along
with skilled human capital. Again, unexpectedly international market focus,
though significant is negative towards innovation, thus, seeming to indicate that
export may not be an essential driver for innovation on its own.
Before moving onto the analysis of combined drivers, the proposed model of this
research, it suffices to say that some of these results are unexpected. While
empirical errors may never be totally ruled out, it may be that the use of a
wider set of innovation drivers based on direct innovation data reduces both a
possible problem of omitted variables as well as reduces errors from usage of
indirect proxies, providing a result more accurately representative of the actual
determinants of innovation.

Chapter 2 41
Analysis of combined innovation drivers, the proposed model for this research:
Combined innovation drivers regression: The model as proposed by this
research, incorporating drivers from across the theories, as listed in column (5)
in Table 2.3 is also displayed in column (1), Table 2.4. The results reveal quite a
few intriguing differences from the previous separate regressions: while R&D
investment remains insignificant and external R&D investment stays significant,
internal R&D which was negative earlier now turns significant. The government
linkage variables turn significant, but they also become negative. Additionally,
international markets turn insignificant though remaining negative, in contrast
to supplier linkages, which turns significant and positive. The rest of the results
remain similar. To understand the results of this combined driver regression, the
next subsections offers insights and explanations for each of the drivers used in
this model, interpreting R&D investment last as it requires more detailed
investigation. Indeed, to make sense of the absence of significance of R&D
investment as a primary driver of innovation, further regressions are performed
and listed in Table 2.4. These regressions are listed in column (2-4) check for
specification error: column (2) examines an oft used model without human
capital and column (3) evaluates if R&D could have a non-linear component.
Thereafter, out of concerns of collinearity, two mirroring variables home market
and international market are interchangeably removed in column (4) and (5) and
accordingly assessed.
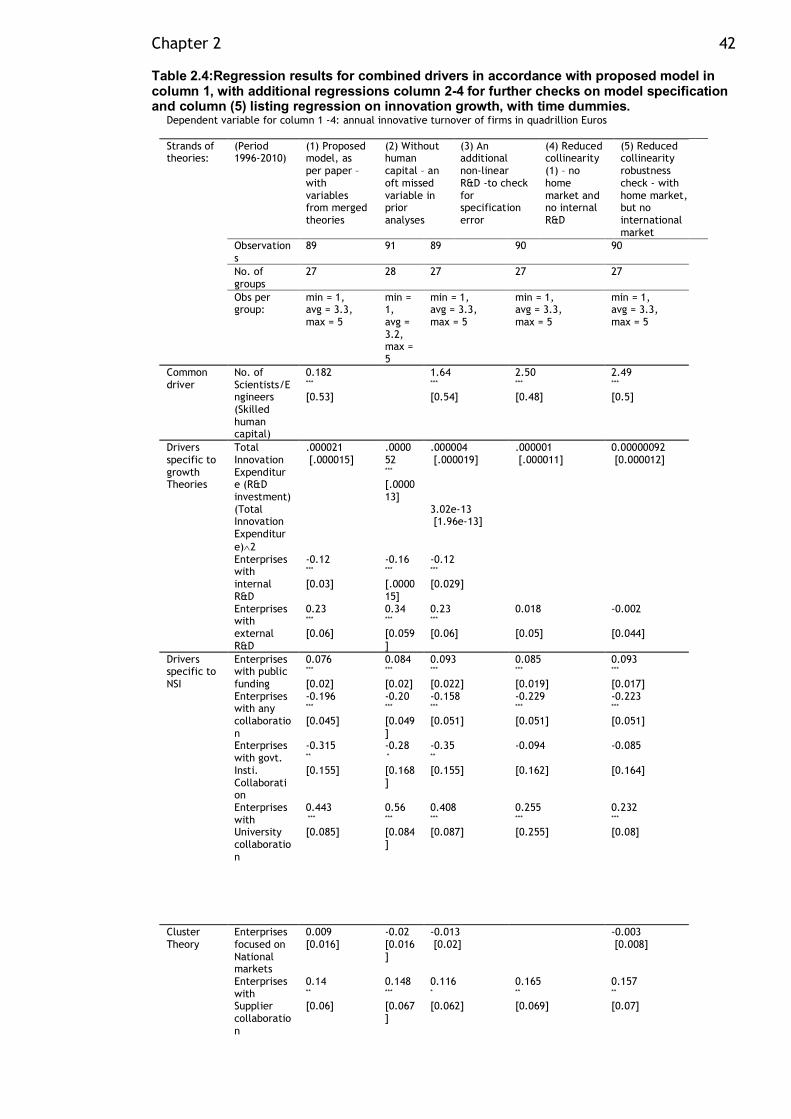
Chapter 2 42
Table 2.4:Regression results for combined drivers in accordance with proposed model in column 1, with additional regressions column 2-4 for further checks on model specification and column (5) listing regression on innovation growth, with time dummies.
Dependent variable for column 1 -4: annual innovative turnover of firms in quadrillion Euros Strands of theories:
(Period 1996-2010)
(1) Proposed model, as per paper – with variables from merged theories
(2) Without human capital – an oft missed variable in prior analyses
(3) An additional non-linear R&D -to check for specification error
(4) Reduced collinearity (1) – no home market and no internal R&D
(5) Reduced collinearity robustness check - with home market, but no international market
Observations
89 91 89 90 90
No. of groups
27 28 27 27 27
Obs per group:
min = 1, avg = 3.3, max = 5
min = 1, avg = 3.2, max = 5
min = 1, avg = 3.3, max = 5
min = 1, avg = 3.3, max = 5
min = 1, avg = 3.3, max = 5
Common driver
No. of Scientists/Engineers (Skilled human capital)
0.182 ***
[0.53]
1.64 ***
[0.54]
2.50 ***
[0.48]
2.49 ***
[0.5]
Drivers specific to growth Theories
Total Innovation Expenditure (R&D investment)
.000021 [.000015]
.000052 *** [.000013]
.000004 [.000019]
.000001 [.000011]
0.00000092 [0.000012]
(Total Innovation Expenditure)Ù2
3.02e-13 [1.96e-13]
Enterprises with internal R&D
-0.12 *** [0.03]
-0.16 *** [.000015]
-0.12 *** [0.029]
Enterprises with external R&D
0.23 ***
[0.06]
0.34 *** [0.059]
0.23 ***
[0.06]
0.018 [0.05]
-0.002 [0.044]
Drivers specific to NSI
Enterprises with public funding
0.076 ***
[0.02]
0.084 ***
[0.02]
0.093 ***
[0.022]
0.085 ***
[0.019]
0.093 ***
[0.017]
Enterprises with any collaboration
-0.196 ***
[0.045]
-0.20 ***
[0.049]
-0.158 ***
[0.051]
-0.229 ***
[0.051]
-0.223 ***
[0.051]
Enterprises with govt. Insti. Collaboration
-0.315 **
[0.155]
-0.28 *
[0.168]
-0.35 **
[0.155]
-0.094 [0.162]
-0.085 [0.164]
Enterprises with University collaboration
0.443 ***
[0.085]
0.56 ***
[0.084]
0.408 ***
[0.087]
0.255 ***
[0.255]
0.232 ***
[0.08]
Cluster Theory
Enterprises focused on National markets
0.009 [0.016]
-0.02 [0.016]
-0.013 [0.02]
-0.003 [0.008]
Enterprises with Supplier collaboration
0.14 **
[0.06]
0.148 ***
[0.067]
0.116 *
[0.062]
0.165 **
[0.069]
0.157 **
[0.07]

Chapter 2 43
Globalization
Enterprises focused on International markets
-0.014 [0.026]
0.026 [0.025]
0.007 [0.029]
-0.012 [0.012]
Constant constant -4.8e+02 ***
-2.6e+02 **
-4.6e+02 ***
-5.62e+02 ***
-5.52e+02 ***
Corr(µi, Xb) -0.9441 -0.9505 -0.9412 -0.9371 F-test that
all µI = 0; Prob > F
0.0000 0.0000 0.0000 0.0001
R2 Within =0.8658 between = 0.9464 overall = 0.9219
Within =0.8719 between = 0.9445 overall = 0.9175
Within =0.8159 between = 0.9146 overall = 0.8861
Within =0.8128 between = 0.9102 overall = 0.8816
Note: p-values: *** denoting significance at 1%, ** significance at 5% and * 10% significance. Std.errors in square brackets. Data sources are CIS and HRST databases..
Overall, these results are interesting yet surprising - the lack of significance for
R&D expenditure, the negative significance of internal R&D, the lack of
significance of domestic market focus – balanced against strong positive
significance of skilled human capital, public funding, collaboration with suppliers
and linkages with universities. These results are explained further below, but
detailed analysis to explore how these drivers vary for firm-sizes, is explored in
sub-section 2.5.7 as well as a separate sub-section 2.5.4 to understand lack of
R&D expenditure significance, as some of these surprising results are quite
significant.
Skilled human capital as driver: This is quite a strong result, emphasizing the
importance of skilled human capital as an innovation driver, as it shares
importance across theories - a driver common across growth theories, NSI and
cluster theory – is found consistently significant and positive. Indeed, it is one of
the highly robust drivers. As will be shown in section 2.6, based upon literature
on Germany explaining mechanisms of influence on innovation, skilled human
capital as a driver may be made more effective through the provision of a highly
skilled and diverse education sector incorporating vocational programmes,
closely aligned with industry. Thus, though skilled human capital significance for
innovation is found across all economies, its effectiveness in delivering
innovation may be increased through additional focus in policy on the diversity
of the skilled educational sector and its alignment with industry.

Chapter 2 44
R&D internal and external focus of firms: As in the separate growth theory,
the driver capturing the firms’ outsourcing of R&D externally appears to be
significant and positive. In contrast the choice by firms to undertake internal
R&D is shown to be negative. This is a surprising result, if internal R&D is viewed
separately. However, as suggested earlier, these two results in tandem may
represent the reduced burden of cost of internal R&D, which would impact
innovation turnover negatively. Also, as mentioned earlier, maybe this driver
would be significant for growth of firms rather than innovation fundamentals,
differentiating growth from small to medium-sized firms and medium to large-
sized firms. This variation is explored in depth in sub-section 2.5.7, where
drivers are differentiated for firm-size classes.
Public funding of firms as driver: The next listed driver, public funding of
firms, is another remarkably consistent and robust positive driver on innovation.
Its influence on innovation may well work through the mechanism highlighted in
section 2.6 on Germany, through encouraging longer-term decision-making and
stable governance structures, while reducing funding gaps for firms. Despite the
robustness of this driver, the data of economies reveals some anomalies. There
is quite a lot of variation in the use of this driver and the delivery of innovation.
A possible interpretation of the varying effectiveness of this driver on innovation
may take us back to the original proposal of this paper – the delivery of
innovation may be better achieved through a wider tool-kit, which in turn may
increase effectiveness of individual drivers.
Nonetheless, future research on ownership structures and decision –making using
demographic data of firm birth and death rates, as started by EU in 2008, may
provide further insights into understanding the workings of this driver.
Linkages with academia and government as drivers: We proceed now to the
three drivers capturing varying forms of linkages: various sorts of collaborations
of firms with other enterprises, institutions, academia, suppliers and/or clients;
collaborations of firms specifically with government institutions; collaborations
of firms specifically with academia for research. Out of these linkages, the first
driver representing any type of linkage is significant but negative, whereas the
second driver of industry linkages with governmental institutions is significant

Chapter 2 45
but negative. Only the last driver representing linkages with academia is
significant and positive.
The insignificance of the first driver may capture possible losses incurred to
innovation turnover in short-term, as it also captures effort with clients,
customers and other agencies. The second linkages driver representing
collaborations with government institutions, may specify that this association is
not necessarily fruitful for all firm sizes. Indeed, this is later affirmed, when
differentiating these drivers for different firm sizes, where it is found significant
for medium sized firms. While the underlying mechanism for this relationship
would need further research, it appears that driver differentiation for specific
firm sizes helps clarify this result. In addition to differentiation of drivers for
varied firm-sizes, this insignificance may also suggest that collaborations in
industry may only benefit innovation when focused on specific partnerships.
However, the last driver representing linkages between industry and academia is
highly robust, even later irrespective of firm sizes, staying significant and
positive. As will be explored in section 2.6 on this particular drivers’ influence in
Germany, it appears conceivable that linkages with academia exerts a positive
influence on innovation through enhancing commercialization of research for all
firm-sizes, forged through collaborations between research and entrepreneurs.
International market and home market focus drivers: Turning to also the
surprising negative and insignificant influence of international market focus on
innovation and positive but still insignificant significance for home market focus
of firms. As home market focus of firms is considered quite necessary for
innovation in the cluster theory concept as promoted by Porter, (Porter M. ,
1990), two further regressions are analysed in order to rule out correlation
mistakenly influencing results, removing higher correlation variables of internal
R&D and home market. To avoid mistaken results due to imperfect collinearity,
the significance of international market focus as a driver and home market as a
driver are assessed separately in regressions listed in Table 2.4 in column (4) and
(5) respectively. Interchanging either driver in these two regressions does not
influence the significance of other drivers, though it changes the borderline
significance of internal markets to insignificant. These additional regressions
seem to affirm the insignificance of both globalization and home markets as a
primary driver of innovation. There may however be scope for market influence

Chapter 2 46
– be it home market or globalization - to perhaps exert a secondary influence on
innovation. In other words, markets may be important after innovation has taken
place to expand future profits. On the other hand, a specific focus on markets
before knowing the suitability of markets to target, may be an added burden
detracting finances away from innovation. To differentiate and properly
understand the order of inter-workings between globalization and innovation,
further analysis with specific innovation and market data would be required.
Linkages with suppliers as driver: Supplier collaboration is found positive and
significant as expected with cluster theory, contrary to the results found earlier
in the step-wise analysis. This may be as a result of improved analysis through
inclusion of a more complete set of drivers. The importance attributed by
cluster theory on the relationship of innovators with suppliers is widely
acknowledged in policies and is apparent in policy incentives around the world.
R&D investment driver: The second listed driver, R&D investment, as pointed
out earlier is a key driver for innovation policy targets and an important
component in growth theories. Nonetheless, it was found insignificant for
innovation in the separate theory analysis and continues to be insignificant in
the combined driver regression.
Although data inaccuracies cannot be totally excluded, a few aspects of R&D
investment driver, which seem plausible given the data, may explain this
insignificance. Firstly, R&D investment is recognized in practice to be quite a
stable figure in firms (Hall, Mairesse, & Mohnen, 2010, p. 16), only changing
gradually over time. This attribute may influence the significance of this drivers’
correlation with variations in innovation turnover. Secondly, and perhaps more
significantly, it appears that economies most effectively using this driver to
deliver innovation do not turn out to be the most innovative of economies. This
anomaly is evident in the figures in table A3 in Annexe, which lists the
proportional ratios for R&D (innovation output per R&D input, measured in
billions output per millions R&D input) for the top 10 economies with the highest
R&D investments: Spain having the highest proportional ratio (2x of Germany),
yet Germany having the highest turnover (5x of Spain). This lack of correlation
between the highest proportional ratio of this driver and the highest innovation
turnover, seems to signify that other drivers may need to be present in an

Chapter 2 47
economy, which when working together deliver a total innovation much higher
than that of this individual driver. This implies that possibly other drivers drawn
from informal R&D drivers as captured in national innovation systems and not
R&D investment in particular, may explain the differentiation in innovation
levels performance of economies. This result is further investigated for model
robustness in more regressions listed in Table 2.4 above and explained in greater
detail in the next subsection.
Further regressions to investigate lack of significance of R&D investment driver:
In order to make more sense of this result, additional regressions are
undertaken, which are also listed in Table 2.4, to check for specification error or
possible collinearity. The regressions listed in column Table 2.4 columns (2-3)
explore regressions to check for specification, while column (4-5) remove closely
correlated variables to reduce collinearity errors.
To first and foremost check the robustness of model specification, the proposed
complete model as suggested by the merging of theories in this paper is listed in
column (1), this is compared it to the oft-used model without human capital as
listed in column (2) of Table 2.4. As this model without human capital is a model
quite prevalent in innovation analysis with direct innovation data, it is important
to examine if it can lead to mistaken conclusions due to specification error.
Furthermore, in order to check our own model for specification error, column (3)
adds a non-linear component of R&D investment to the proposed model of
column (1). Non-linear component of R&D is considered, in case there is a
curved non-linear relationship between R&D and innovation, possibly a tapering
impact of increasing R&D on innovation, which our model fails to incorporate.
More so, to alleviate concerns of collinearity, Column (4) and (5) remove higher
correlated variables, in order to check if that may influence significance of R&D
investment. Finally, column (6) investigates the possibility of R&D investment as
a secondary driver, working on innovation growth instead of innovation
fundamentals depicted by levels. The detailed interpretations are listed below,
but these regressions appear to show that R&D investment only becomes
significant as a primary driver when skilled human capital is excluded. On the

Chapter 2 48
other hand, it does remain significant as a secondary driver, so indeed important
for spurring growth of innovation once fundamentals of innovation in place.
Column (2) results: Regression without skilled human capital: This regression
is to allow comparison of the proposed model as in column (1) with on oft used
models in innovation analysis, omitting skilled human capital. The results are
interesting, as it seems to indicate that misleading significance may be attached
to other variables, if models omit skilled human capital. Setting aside small
changes in extent of significance, this regression shows similar results for all
drivers as in the papers proposed model - except one, R&D investment. It
becomes highly significant and positive. This appears to indicate that exclusion
of skilled human capital from this model could lead to mistaken results as a
result of omitted variable problem, an important aspect that may explain the
difference of results in this study from previous studies.
Column (3) results: Regression with additional non-linear component of R&D
investment: To ensure there is no specification error in papers proposed model
as listed in column (1), this regression adds a non-linear component of R&D
investment, as R&D investment itself was not significant. The results again show
barely any changes in significance for drivers and both R&D investment driver, as
well as the non-linear component of R&D investment remain insignificant.
Column (4) and (5) results- To reduce collinearity, two regressions with
removal of two mirroring variables: To reduce possible errors due to
imperfect collinearity, the two variables that seem to be mirrored by their
counterpart, Internal R&D and National markets, are removed. Based on the
assumption that these two variables reflect their counterparts to a large extent:
Internal R&D with External R&D and National markets with International
markets; and as they appear to be highly correlated with these counterparts, the
two variables may reliably be removed without losing fundamentals of
specification. The results do capture two differences from our initial proposed
model in column (1): significance is lost for external R&D outsourcing and
government collaboration. This appears to be a robust result, as the switch
between National markets and International markets, column (4) and (5)
respectively, shows no change in significance to other drivers. Most importantly,
it shows no change in significance for R&D investment.

Chapter 2 49
To assess whether R&D investment may be a secondary driver, instead of
primary driver, the combined drivers model is regressed on innovation growth,
which is examined in the following section.
Analysis of secondary innovation drivers – on innovation growth, rather than innovation level:
So far, the study has focussed on determining on finding a complete set of
primary innovation drivers, to understand what drives the foundation of
innovation – measured by innovation levels. In order to avoid attributing
misleading significance to variables due to omitted variable problems, it has
chosen drivers across a range of theories to provide as holistic a set of
innovation drivers as is possible within the dataset. While this has yielded
valuable insights as explained in previous section, it is important to seek to put
this in context with secondary drivers – those innovation drivers that spur
growth, after innovation foundation has been laid in the economy.
Towards this end, it would appear important to apply the same approach of
regressing a wider set of innovation drivers on innovation growth, to try to
obtain a holistic set of secondary drivers spurring innovation growth.
Thus, a regression is now performed on innovation growth (biannual growth, due
to data availability) instead of innovation level, using the same wider set of
innovation drivers combining theories, over the same time period 1996-2010.
Choosing the model of reduced correlation drivers as listed in column (4) in
Table 2.4, the regression on innovation growth for these same drivers is listed in
Table 2.5.

Chapter 2 50
Table 2.5:Regression of combined drivers on innovation growth - not innovation level, to determine how secondary drivers may differ from primary drivers
Strands of theories:
(Period 1996-2010) Dependent variable: biannual innovation growth (6) Reduced correlation regression with time dummies
Observations 86
No. of groups 26
Obs per group:
min = 1, avg = 3.3, max = 5
Common driver
No. of Scientists/Engineers (Skilled human capital)
-70***
[25] Drivers specific to growth Theories
Total Innovation Expenditure (R&D investment)
.000005 *** [.0000002]
(Total Innovation Expenditure)Ù2
Enterprises with internal R&D
Enterprises with external R&D
14.6***
[.000007] Drivers specific to NSI
Enterprises with public funding
-1.335 [0.97]
Enterprises with any collaboration
-5.97*
[3.09] Enterprises with govt. Insti.
Collaboration -19.6**
[8.1] Enterprises with University
collaboration 19.2***
[7.37] Cluster Theory
Enterprises focused on National markets
Enterprises with Supplier collaboration
7.37***
[3.82] Globalization
Enterprises focused on International markets
-3.34***
[0.709]
Constant constant 1.47e+4*** Time dummies
2004 -6.8e+03* [3.86e+03]
2006 -7.1e+03* [4.13e+03]
2008 -9.8e+03 ** [3.96e+03]
2010 -7.1e+03 * [4.01e+03]
Corr(µi, Xb) -0.1589 F-test that all µI = 0;
Prob > F 0.0000
R2 Within =0.9926 between = 0.6792 overall = 0.8797
Note: p-values: *** denoting significance at 1%, ** significance at 5% and * 10% significance. Std.errors in square brackets. Data sources are CIS and HRST databases..
This regression again provides interesting insights. Perhaps the most important
insight is that R&D investment appears to be a secondary driver influencing
innovation growth, as R&D investment is significant and positive. Thus,
underscoring the importance of understanding that the same variables exhibit
different influences as primary drivers as opposed to secondary drivers. In terms
of secondary drivers not only is R&D investment significant, but also external
R&D is positive and significant, while interestingly skilled human capital turns
negative and public funding loses significance. Exploring these results in further

Chapter 2 51
detail is currently out of the scope of this study, however there is one important
understanding highlighted by this regression - an innovation policy should
carefully distinguish the target of its policy from fostering the foundations of
innovation to spurring innovation growth, as then it can accordingly choose the
appropriate drivers to influence to achieve that goal.
Within this boundary of understanding, this regression seems to confirm that
different secondary drivers such as R&D investment are needed to grow
innovation, after primary drivers have laid the foundation to create innovation
levels. Thus, accommodating and indeed understanding this differentiation of
both primary and secondary drivers may be an important insight gained for
tailoring effective innovation policies.
Though each driver’s significance or lack of significance does provide further
opportunities for research, the possible mechanisms of influence of this wider
set of drivers are explored through exploiting the understanding gained on their
workings in Germany in Section 5.
Another perhaps equivalently important message from this analysis is that no
driver in isolation can be as effective as a wider mix of these drivers. Indeed, if
this is valid, then it may be possible for economies to boost innovation within
current capital limitations, purely through applying these wider set of innovation
drivers in tandem.
Robustness checks for innovation drivers:
To ensure robustness in empirical analysis, some further regressions are
undertaken and listed in Table 2.6: column (1) lists the regression of reduced set
of combined drivers as some drivers were excluded due to concerns of
collinearity, as listed originally in column (3) of Table 2.4. This is supplemented
in column (2) in Table 2.6, with the addition of time-dummies. Then column (3)
in Table 2.6 displays results of regression for robustness check, with substitution
of international market driver with home market driver and external outsourcing
of R&D replaced with internal R&D driver. As these two pairs of reasonably
highly correlated with each other, their substitution could highlight weakness in
regression results. Reviewing the results in column (3) indicates the regression to

Chapter 2 52
be reasonably robust, as the substitution of these drivers causes no change in
significance of other drivers, though it does add significance of time dummies.
Column (4) lists the heteroskedasticity and autocorrelation (HAC) robust
corrected standard errors. There is one change in the significant variables,
which is that significance of suppliers is reduced to 13%. This implies that the
earlier higher significance of the supplier variable at 5% may have been
influenced erroneously through heteroskedasticity and autocorrelation.
Nonetheless, though lower in significance, its effect on innovation may be still
be evaluated within this lower significance level.
Last, but not least, these regressions could not rule out endogeneity, as due to
shortages of time period data, these regressors could not be instrumented to
ensure there was no reverse causality between drivers, such as linkages between
academia or linkages between government institutions and innovation measure
as dependent variable.

Chapter 2 53
Table 2.6:Robustness checks for Fixed Effects regression results with reduced set of drivers to avoid collinearity
Dependent variable – annual innovative turnover of firms, measured in quadrillion Euros
Strands of theories:
(Period 1996-2010)
(1) Reduced regression – with no home market
(2) Reduced regression – but with added time dummies
(3) Robustness check , substituting international market with home market
(4) Further robustness check, (autocorrelation and heteroskedasticity) Reduced regression – but with added time dummies
Observations 90 90 90 90 No. of groups 27 27 27 27 Obs per group:
min = 1, avg = 3.3, max = 5
min = 1, avg = 3.3, max = 5
min = 1, avg = 3.3, max = 5
min = 1, avg = 3.3, max = 5
Common driver
No. of Scientists/Engineers (Skilled human capital)
2.5***
[0.48] 3.04***
[0.56] 3.325*** [0.45]
3.038***
[0.91]
Drivers specific to growth Theories
Total Innovation Expenditure (R&D investment)
0.000001 [0.000011]
-0.000007 [0.000012]
-0.000009 [0.000011]
-0.000007 [0.000015]
Enterprises with external R&D
0.018 [0.048]
-0.009 [0.05]
-0.009 [0.058]
Enterprises with internal R&D
-0.049 *** [0.018]
Drivers specific to NSI
Enterprises with public funding
0.0849*** [0.019]
0.085*** [0.020]
0.090*** [0.016]
0.085*** [0.03]
Enterprises with any collaboration
-0.229 *** [0.051]
-0.29*** [0.058]
-0.289*** [0.053]
-0.289*** [0.107]
Enterprises with govt. Insti. Collaboration
-0.094 [0.162]
-0.066 [0.158]
-0.183 [0.156]
-0.066 [0.28]
Enterprises with University collaboration
0.255*** [0.255]
0.247*** [0.079]
0.268*** [0.07]
0.245*** [0.085]
Cluster Theory
Enterprises focused on National markets
0.010 [0.008]
Enterprises with Supplier collaboration
0.165 ** [0.069]
0.247*** [0.083]
0.28*** [0.074]
0.247 ([0.159]
Globalization
Enterprises focused on International markets
-0.012 [0.012]
-0.002 [0.013]
Constant constant -5.62e+02*** -4.9e+02*** -3.99e+02*** -4.9e+02*** Time dummies
2004 -1.9e+02** [94.4]
-2.31e+02*** [85.8]
-1.88e+02* [109]
2006 -1.33e+02 [99.6]
-1.91e+02 ** [90.2]
-1.33e+02 [99.6]
2008 -1.34e+02 [96.4]
-1.8e+02 ** [92.6]
-1.34e+02 [95.7]

Chapter 2 54
Dependent variable – annual innovative turnover of firms, measured in quadrillion Euros
Strands of theories:
(Period 1996-2010)
(1) Reduced regression – with no home market
(2) Reduced regression – but with added time dummies
(3) Robustness check , substituting international market with home market
(4) Further robustness check, (autocorrelation and heteroskedasticity) Reduced regression – but with added time dummies
2010 -1.93e+02* [99.9]
-2.45e+02*** [92.6]
-1.93e+02* [103]
Corr(µi, Xb) -0.9412 -0.9323 -0.9412 -0.9323 F-test that all
µI = 0; Prob > F
0.0000 0.0001 0.0000 0.0000
R2 Within =0.8159 between = 0.9146 overall = 0.8861
Within =0.8388 between = 0.8769 overall = 0.8528
Within =0.8159 between = 0.9146 overall = 0.8861
Within =0.8388 between = 0.8769 overall = 0.8528
Note: p-values: *** denoting significance at 1%, ** significance at 5% and * 10% significance. Std.errors in square brackets. Data sources are CIS and HRST databases..
Differentiating innovation drivers for firm-sizes: small, medium and large firm-sizes:
Thus far, the Innovation drivers have been evaluated for firms across the board.
Now, however we refine Schumpeter’s hypothesis on impact of firm size on
innovation (Schumpeter J. , 1942), instead performing regressions to
differentiate innovation drivers for small, medium and large firm-sizes. It should
also be clarified that firm-size turnover for each firm-size class is the average
turnover of small/medium/large firms. To enable differentiation of innovation
drivers for each firm-size class, the innovation measure on the left-hand side of
the equation (4) is changed from measuring innovative turnover for all firms to
average innovative turnover for small firms initially, then medium firms and then
large firms. The regression analysis with these changes is listed in Table 2.7
below. Thus, column (1) lists the combined drivers regression for all firm-sizes,
whereas column (2) is specific to small firms , column (3) is relevant to medium
firms and column (4) for large firms.
The results indicate differing drivers for small and medium firms from the
general drivers for all firm sizes are interesting and somewhat difficult to
interpret, without further in-depth data. Noticeably, public funding and supplier

Chapter 2 55
collaboration are both found not significant for either small or medium sized
firms. The loss of significance of linkages to suppliers could indicate that small
and medium firm products may not be mature enough to benefit from supplier
collaboration. Albeit, the lack of significance for public funding for SMEs remains
puzzling and invites further research.

Chapter 2 56
Table 2.7:Regression results with reduced correlation terms and time dummies, for differing firm-sizes
Dependent variable: annual innovative turnover (measured in quadrillion Euros) of all firms for column 1; annual innovative turnover of small firms for column 2, medium sized firms in column 3 and large sized firms in column 4 Strands of theories:
(Period 1996-2010)
(1) Reduced correlation regression –with added time dummies – for all firm-sizes
(2) Reduced correlation regression –with added time dummies – for small firm-sizes
(3) Reduced correlation regression –with added time dummies – for medium firm-sizes
(4) Reduced correlation regression –with added time dummies – for large firm-sizes
Observations 90 89 89 89 No. of groups 27 27 27 27 Obs per group:
min = 1, avg = 3.3, max = 5
min = 1, avg = 3.3, max = 5
min = 1, avg = 3.3, max = 5
min = 1, avg = 3.3, max = 5
Common driver
No. of Scientists/Engineers (Skilled human capital)
3.038***
[0.56] 0.439*** [0.13]
0.27*** [0.08]
2.639 *** [0.48]
Drivers specific to growth Theories
Total Innovation Expenditure (R&D investment)
-0.000007 [0.000012]
-0.000002 [0.000002]
0.00000015 [0.000001]
-0.000009 [ 0.000009]
Enterprises with external R&D
-0.009 [0.05]
-0.01086 [0.011]
-0.015** [0.003]
-0.0009 [ 0.041]
Drivers specific to NSI
Enterprises with public funding
0.085*** [0.02]
-0.0037 [0.004]
-0.004 [0.003]
0.09*** [0.016]
Enterprises with any collaboration
-0.289*** [0.058]
-0.0029 [0.0136]
0.004 [0.008]
-0.32*** [0.049]
Enterprises with govt. Insti. Collaboration
-0.066 [0.158]
-0.08** [0.035]
0.047** [0.022]
-0.0245 [0.125]
Enterprises with University collaboration
0.247*** [0.08]
0.054*** [0.018]
0.034*** [0.011]
0.148** [0.06]
Cluster Theory Enterprises focused on National markets
Enterprises with Supplier collaboration
0.247*** [0.08]
0.0068 [0.02]
-0.005 [0.013]
0.299*** [0.07]
Globalization
Enterprises focused on International markets
-0.002 [0.01]
-0.002 [0.003]
0.002 [0.002]
0.002 [0.01]
Constant constant -4.9e+02*** -3.11e+01 -3.18e+01
-3.77e+02
Time dummies 2004 -1.9e+02** [94.4]
-1,7e+01 [26.9]
-2.47e+01 [16.7]
-2.52e+02*** [96.8]
2006 -1.33e+02 [99.6]
-3.3e+02 [28.5]
-2.13e+01 [17.7]
-2.22e+02** [10.3]
2008 -1.34e+02 [96.4]
-8.4 [28.6]
-1.24e+01 [17.1]
-2.22e+08** [99.3]
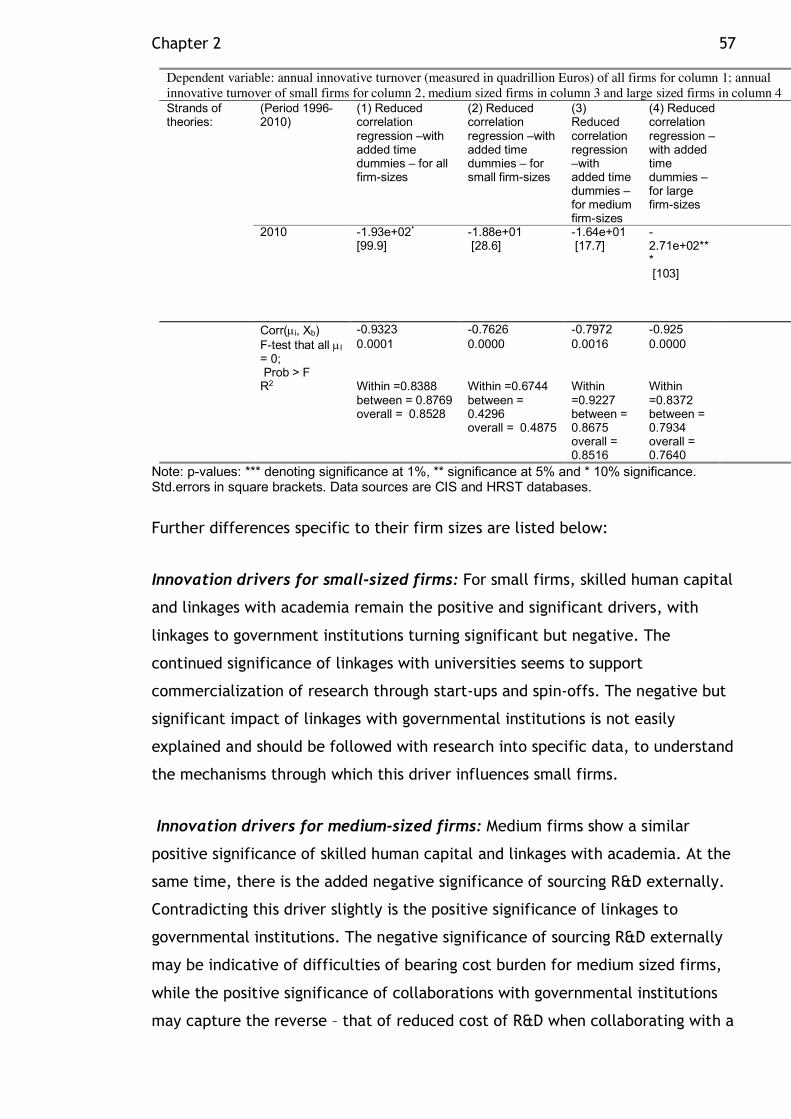
Chapter 2 57
Dependent variable: annual innovative turnover (measured in quadrillion Euros) of all firms for column 1; annual innovative turnover of small firms for column 2, medium sized firms in column 3 and large sized firms in column 4 Strands of theories:
(Period 1996-2010)
(1) Reduced correlation regression –with added time dummies – for all firm-sizes
(2) Reduced correlation regression –with added time dummies – for small firm-sizes
(3) Reduced correlation regression –with added time dummies – for medium firm-sizes
(4) Reduced correlation regression –with added time dummies – for large firm-sizes
2010 -1.93e+02* [99.9]
-1.88e+01 [28.6]
-1.64e+01 [17.7]
-2.71e+02*** [103]
Corr(µi, Xb) -0.9323 -0.7626 -0.7972 -0.925 F-test that all µI
= 0; Prob > F
0.0001 0.0000 0.0016 0.0000
R2 Within =0.8388 between = 0.8769 overall = 0.8528
Within =0.6744 between = 0.4296 overall = 0.4875
Within =0.9227 between = 0.8675 overall = 0.8516
Within =0.8372 between = 0.7934 overall = 0.7640
Note: p-values: *** denoting significance at 1%, ** significance at 5% and * 10% significance. Std.errors in square brackets. Data sources are CIS and HRST databases.
Further differences specific to their firm sizes are listed below:
Innovation drivers for small-sized firms: For small firms, skilled human capital
and linkages with academia remain the positive and significant drivers, with
linkages to government institutions turning significant but negative. The
continued significance of linkages with universities seems to support
commercialization of research through start-ups and spin-offs. The negative but
significant impact of linkages with governmental institutions is not easily
explained and should be followed with research into specific data, to understand
the mechanisms through which this driver influences small firms.
Innovation drivers for medium-sized firms: Medium firms show a similar
positive significance of skilled human capital and linkages with academia. At the
same time, there is the added negative significance of sourcing R&D externally.
Contradicting this driver slightly is the positive significance of linkages to
governmental institutions. The negative significance of sourcing R&D externally
may be indicative of difficulties of bearing cost burden for medium sized firms,
while the positive significance of collaborations with governmental institutions
may capture the reverse – that of reduced cost of R&D when collaborating with a

Chapter 2 58
government institution, as reflected in German economy with the use of
Fraunhofer institutes or in the US through use of extension services by SMEs.
Further exploration with specific data would yield clearer insights into the
mechanism of this drivers influence on innovation.
Innovation drivers for large-sized firms: Large firms are similar to small and
medium sized firms in the positive significance of skilled human capital and
linkages to academia. However, they show additional positive significance for
public funding, as well as suppliers and negative significance for linkages to
government institutions. The positive significance of public funding and supplier
relationships appears to reflect that large firms use access to public funding and
relationships of co-development with suppliers to aid their growth, while the
negative association with government institutions reflects their lack of need to
subcontract research externally, as large firms usually have significant R&D
teams internally.
Innovation turnover size of SMEs: A last but perhaps not insignificant aspect is
that SMEs innovative turnover is reasonably small compared to large firms, which
appear to dictate a substantial portion of innovation measure. Looking at
descriptive stats listed in table A1 in appendix, small-size firms mean innovative
turnover is 11 % of total firm-sizes mean turnover and medium-size firms mean
innovative turnover also only reaches 19%. Thus, while SMEs may be called the
hidden growth champions of Germany, their share of innovation turnover is by
virtue of their size limited. Hence in the long run, economies or indeed sectors
may be inhibited in innovation as a consequence of a reduced share of presence
of large firms.
In brief, some results for these SME drivers remain puzzling and do invite further
research. It may reflect a step-wise process to building innovation, and that
order and type of drivers may be important to build differing type of innovative
economies. If this is indeed the case, then policy makers may need to account
for these variations when designing specific policy incentives for SMEs. Following
Cohen’s line of thinking that historical and case-study literature can provide rich
insights to supplement interpretation of empirical analysis (Cohen W. , 2010),
the following section explores the experiences in Germany to illustrate possible
mechanisms through which drivers may influence innovation.

Chapter 2 59
2.6 Germany, as a case in point, for the workings of these drivers
Possible mechanisms through which drivers may influence innovation
The choice of an apt case study to provide hypotheses for the workings of these
drivers appears best suited to fall upon Germany. Not only is it the highest
performing economy according to our innovation measure as listed in Table 2.8
below, it is also an acknowledged successful innovative economy according to
other measures. As mentioned earlier, Germany ranks alongside Sweden,
Denmark and Finland as an Innovation leader above other European economies
according to the European Innovation Union scoreboard (EIS) (European
Commission, 2013). Though Germany’s particular type of innovation as a ‘world
supplier and equipper’ of systems and production technology, integrating newer
technologies in traditional industries, may not equate it to a globally innovative
leader as US, which is considered a ‘cutting edge technology leader’ (Wessner,
2011), the economy could highlight workings relevant to other economies. Thus,
acknowledging that varying economies may evolve diverse patters of innovation,
nonetheless some useful insights may perhaps be gained by understanding the
mechanisms through which these drivers exert influence on German innovation.
Further cementing Germany’s high performance in this study’s innovation
measure is also the remarkably consistent and high performance of Germany
across the wider set of drivers12: skilled human capital, R&D investment, external
sourcing of R&D, public funding for enterprises, firm linkages with academia,
firm linkages with governmental organizations, firm linkages with suppliers,
national market focus for enterprises and Enterprises focused on International
markets. Drawing on previous research, the next few subsections offer a brief
summary of the mechanisms through which these drivers may have worked to
enhance innovation in Germany.
12 The tables listing the top 10 economies for each driver are in Appendix section 1.3, tables A4 and A5

Chapter 2 60
Table 2.8:Top 20 EU economies ranked in order for mean innovative turnover in absolute value (in billions of Euros) for all firm-sizes, covering the period 1996-2010 Countries Mean Innovative turnover
(all firms) – main innovation measure
Mean innovative turnover (for only small firms)
Mean innovative turnover (for only medium firms)
Germany 2.99 0.23 0.48 France 1.33 0.11 0.19 UK 1.00 0.13 0.23 Italy 0.92 0.16 0.21 Spain 0.63 0.08 0.12 Turkey 0.62 0.27 0.14 Netherlands 0.38 0.05 0.092 Belgium 0.29 0.048 0.067 Sweden 0.26 0.04 0.048 Poland 0.24 0.019 0.046 Austria 0.23 0.029 0.057 Ireland 0.18 0.02 0.055 Finland 0.16 0.015 0.025 Czech Repiblic
0.15 0.015 0.032
Norway 0.14 0.019 0.03 Denmark 0.13 0.023 0.031 Portugal 0.12 0.023 0.032 Hungary 0.08 0.006 0.013 Romania 0.062 0.006 0.011 Luxembourg 0.057 0.008 0.013
CIS database, Eurostat
Commercialization of research through: aligned skilled human capital and
linkages to research Germany’s ability to commercialize its research, a
mechanism quite vital for innovation, appears to be facilitated by the presence
of two drivers in particular. According to Soskice, the highly skilled and diverse
German work force, a distinguishing feature of German economy, delivered by
the strength of its diversified education sector, combined with the strong
linkages between research and industry, appear to enhance Germany’s ability to
commercialize its research (Soskice, 1997). The linkages not only align
government policy with industry interests and research institutions through
industry-wide associations, they also help tailor skills and research to industry
needs (Burton & Hansen, 1993). The heavy investment of industry in both the
educational sector and the funding of specialized vocational programmes ensures
continued alignment and channelling of the workforce in accordance with
demands in industry (Soskice, 1997). From this very brief synopsis, it appears

Chapter 2 61
that these drivers work in tandem to stimulate innovation through encouraging
the commercialization of research.
Longer-term decision-making and reduced funding gaps through: public
funding: The long-term governance and public financing of firms, another quite
distinct feature of German firms (Soskice, 1997), appears to be supported
through one driver in particular – public funding. It seems that public funding
influences this characteristic of the German industry, through encouraging
longer-term decision-making, with the provision of long-term finance for firms
over longer periods relative to commercial loans, (Buiguis & Sekkat, 2009). The
provision of long-term loans for firms in Germany may be as long as 20 years,
though typically 10 through the German state investment bank Kreditanstalt fur
Wiederafbau (KfW) and regional Sparkassen banks (Buiguis & Sekkat, 2009).
These longer periods of loans seem to allow firms greater time periods for
recovery of profits, reducing short-term pressures and encouraging innovation of
products which may have longer lead times. The availability of public finance
not only influences innovation through encouraging these longer-term
governance and decision-making structures, but may also impact the funding gap
in R&D investment (Buiguis & Sekkat, 2009; Soskice, 1997). The presence of
funding gaps in R&D, or rather the difficulties associated in financing R&D are
well recognized and were raised early on by Schumpeter (1942), Nelson (1959)
and Arrow (1962). R&D investment may be inadequate because of in ability of
firms to appropriate knowledge or avoid leakages (Schumpeter, 1942; Nelson,
1959; Griliches, 1992). However, R&D investments could suffer due to the gap
between private rate of return and external cost of capital (Schumpeter, 1942;
Arrow, 1962; Hall & Rosenberg, 2010). In competitive markets, Hall and Lerner
recognize that either of these aspects could combine to create a funding gap for
R&D investments in firms (Hall & Rosenberg, 2010). A study in Finland was shown
to demonstrate that public funding helped bridge funding-gaps for firms,
avoiding constraints on growth and innovation investments (Hyytinen &
Toivanen, 2005). Through having a provision of public financing for firms,
minimizing some of these funding gaps and encouraging longer-term governance
structures, public funding appears to provide a strong support for innovation in
Germany.

Chapter 2 62
Concentrated ownership and governance structures enhanced through public
funding: Public funding appears to encourage another aspect in German
industry, that of a more concentrated form of ownership structures. It appears
that the long-term governance and financial planning in firms enhanced through
public funding, seems also to be associated with a smaller group of stable
shareholders in contrast to the Anglo-Saxon dispersed shareholder value model
(Soskice, 1997). Buigues and Sekkat also associate the provision of long-term
loans for firms in Germany, with longer-term planning and governance structures
(Buiguis & Sekkat, 2009). Such ownership structures appear to forge relationships
with banks, allowing easier monitoring by banks, enhancing longer-term financial
agreements. Perhaps this concentrated form of ownership structures allied to
longer-term financial agreements, augmented through public funding, is another
mechanism through which public funding has worked to influence innovation in
Germany.
Diffusion of knowledge and technology through inter-industry linkages: Not
only do linkages enhance commercialization of research, they also appear to
enhance diffusion of technology within industries. According to Burton and
Hansen, Germany’s industry-wide linkages are important to innovation, as they
encourage the dissemination of new technologies by pooling of resources and
allow industry as a whole to remain competitive (Burton & Hansen, 1993).
Soskice suggests that these linkages between industry and research embed links,
which encourages investment by firms and in turn enhances technology diffusion
(Soskice, 97). This diffusion of knowledge allowing industry as a whole to remain
competitive may be another mechanism through which these industry-wide
linkages shape innovation in Germany.
Reduction of costs for firms through linkages with research: It appears that
industry-wide linkages with external contract centres such as Germany’s
Fraunhofer institutes and research units, which in turn link up with university
research, may additionally work on enhancing innovation in the economy
through reducing the burden of funding for R&D for firms (Burton & Hansen,
1993; Martin & Scott, 2000). This may be similar to the provision in the US,
where extension services have helped reduce R&D burden on small firms (Nelson
& Rosenberg, 1993). This may be another aspect through which linkages with
research may enhance innovation in Germany.

Chapter 2 63
SMEs - growth champions for Germany: Though not considered a driver for this
study, it appears that SMEs are an important aspect of growth and innovation in
the German economy. According to Schutte, Germany’s State Secretary for
Education and Research, Germany’s hidden growth champions are its SMEs,
(Wessner, 2011). This focus on SMEs appears to be re-iterated in Germany’s
Federal government white paper on innovation policy, the High-tech Strategy
2020, where financing of innovation for SMEs receives high prominence
(Rammer, 2011). The earlier analysis distinguishing the drivers for small and
medium firm sizes throws some light on the varying drivers needed in an
economy to stimulate wide-spectrum of firms.
Although this is a very brief synopsis of the conceivable mechanisms through
which drivers may influence innovation in Germany, it does appear to offer
insights on the possible workings of these drivers. Brief as it is, it does seem to
validate Cohen’s suggestions that historical and case study literature can be a
source of hypotheses aiding the interpretation of empirical research. With these
interpretations in mind, the next section summarizes the key findings of this
study.
2.7 Conclusion
Let us return to the main queries of this research: What is the wider set of
innovation drivers that may address the innovation process more completely and
importantly, what is the order of these drivers, differentiating primary drivers
from secondary? More so, how do these drives differ for different firm-sizes. This
wider set of drivers is sourced from combining analysis of formal R&D process
promoted by growth theories, alongside informal R&D linkages emphasized by
national innovation systems. This study also sought to query whether current
R&D policy targets, based on formal R&D process, are a sufficient response for
driving innovation?
There were varied regressions undertaken, in order to seek answers to the above
queries. A short summary of the key findings of the regressions are listed in
Table 2.9 and thereafter, the outcomes are described in greater length.

Chapter 2 64
Table 2.9:Summary table of overall key findings Focus of analysis The key drivers found significant
Primary innovation drivers – driving innovation levels – all firm sizes
• Skilled human capital • Access to public funding for enterprises
with some form of state support • Linkages between industry and
academia, supporting commercialization of research
• Linkages between industry and suppliers, aligning research and upstream suppliers
Primary innovation drivers – driving innovation levels – small firm-size
• Skilled human capital • Linkages between industry and
government institutions and laboratories (negative)
• Linkages between industry and academia, supporting commercialization of research
Primary innovation drivers – driving innovation levels – medium firm-size
• Skilled human capital • Enterprises sourcing external R&D
(negative) • Linkages between industry and
government institutions and laboratories • Linkages between industry and
academia, supporting commercialization of research
Primary innovation drivers – driving innovation levels – large firm-size
• Skilled human capital • Access to public funding for enterprises
with some form of state support • Linkages between industry and
academia, supporting commercialization of research
• Linkages between industry and suppliers, aligning research and upstream suppliers
Secondary innovation drivers – driving innovation growth
• Skilled human capital (negative) • R&D investment (including acquisition of
external knowledge and capital) • Enterprises sourcing external R&D • Linkages between industry and
government institutions and laboratories (negative)
• Linkages between industry and academia, supporting commercialization of research
• Linkages between industry and suppliers, aligning research and upstream suppliers

Chapter 2 65
Primary drivers versus secondary drivers:
The results from this empirical analysis covering 27 EU economies over the
period 1996-2010 appear to negate the latter part of the query. Importantly,
R&D investment is not found significant as a primary driver working on
innovation levels. Instead the primary drivers found significant and positive for
innovation are based on the informal R&D linkages emphasized in national
innovation systems: industry linkages with academia, public funding of firms,
industry collaborations with suppliers and importantly skilled human capital.
These findings seem to provide partial support for Mokyr’s historical analysis for
building up innovation in an economy – importance of collaborations or rather
linkages - though in this case not only restricted to academia, but instead
extending to other institutions, firms and bodies, as is well acknowledged in
national innovation systems. The mechanisms through which these drivers may
influence innovation are drawn from a brief analysis on Germany and are
touched upon briefly below.
Linkages with academia as a primary innovation driver: Basing our
interpretation on previous research on Germany, it appears that the driver
representing linkages with academia could exert influence on innovation through
two facets: aligning education sector with industry to deliver skilled human
capital in accordance with demands of industry; and facilitating
commercialization of research through forging collaborations between
entrepreneurs and educational sector, working beyond geographic proximity and
helping spawns the creation of spin-offs and start-ups.
Public funding as a primary innovation driver: Public funding as a driver of
innovation, as understood from the workings in German economy, may shape
innovation through encouraging longer-term decision-making and reduction of
funding gaps for firms, along with supporting more stable ownership structures.
This driver would benefit from future research using firms birth demographic and
ownership data, as started in Eurostat for CIS since 2008, as it would yield
clearer insights into ownership patterns and governance structures.
Industry collaborations with suppliers as a primary innovation driver: The
impact of linkages with suppliers on innovation as stressed by cluster theory,

Chapter 2 66
appears to work through enhancing incremental innovation through joint
collaborations with suppliers.
Skilled human capital as a primary innovation driver: Skilled human capital,
along with linkages to academia are probably the two most robust drivers for
innovation, affirming the central role of skilled human capital in innovation,
working in tandem with alignments of industry with academia. The importance
of a diversified education sector, including the offering of vocational
programmes to help deliver the skilled work force is highlighted through German
analysis. This delivery of skilled human capital in line with the needs of industry
seems too encourage investment from industry into educational sector. in
Germany. Mayhap this alignment in educational sector across economies, could
thus not only fine-tune the training of the skilled human capital, but perhaps
even provide an alternative source of funding for institutions.
Lack of significance of R&D investment as a primary innovation driver: The
absence of significance for R&D investment as a primary driver on innovation
levels was surprising and unexpected. While this result invites further research
specially into drivers of innovation growth, there are certain aspects evident in
the data, which may explain this insignificance. Firstly, R&D investment is
recognized in practice to be quite a stable figure in firms (Hall, Mairesse, &
Mohnen, 2010, p. 16), only changing gradually over time periods. Secondly, it
appears that economies most effectively using this driver to deliver innovation
do not turn out to be the most innovative of economies. This is evident in the
lack of correlation of highest proportional ratios of R&D investment to highest
innovation turnovers. Seeming to signify that presence of other drivers in an
economy, working in tandem may deliver a total innovation level higher than
that of this individual driver. Thirdly, and perhaps more significantly, R&D
investment appears significant as a secondary driver when regressed on
innovation growth, thus validating the difference between secondary drivers
from primary drivers for a process. This innovation growth regression seems to
confirm that secondary drivers, such as R&D investment, are needed to grow
innovation after primary drivers have laid the foundation to create innovation
levels. This result also invites further research into the wider set of innovation
growth drivers itself.

Chapter 2 67
Accommodating and indeed understanding this differentiation of both primary
and secondary drivers may be an important insight gained for tailoring effective
innovation.
This also appears to support previous findings that innovation growth may
initially diverge from productivity growth (Tunzelmann G. V., 2000), thus growth
drivers may differ somewhat from innovation drivers in initial stages of
technology generation. Further reiterating the need for policymakers to
acknowledge this differentiation and ensure that policies target both innovation
drivers as well as growth drivers in the long run.
Lack of significance for globalization as an Innovation driver: Globalization
is also not found significant as a driver, nor is the driver representing home
markets focus found significant. The absence of both these market drivers on
innovation may reflect that the focus on markets may follow innovation, when
the product may determine the choice of markets and not the other way around.
This would again imply that time periods necessary for technology maturing and
diffusion, as also referred to by Tunzelmann (Tunzelmann G. V., 2000), may
explain these differences between drivers of growth from drivers of innovation.
Differences in innovation drivers for firm-sizes:
Innovation drivers for small-sized firms: For small firms, skilled human capital
and linkages with academia were found positive and significant drivers, with
linkages to government institutions surprisingly significant but negative.
However, linkages with universities continues to be found significant and
positive, seeming to support commercialization of research through start-ups
and spin-offs. The negative but significant impact of linkages with governmental
institutions is not easily explained and should be followed with research into
specific data, to understand the mechanisms through which this driver
influences small firms.
Innovation drivers for medium-sized firms: Medium firms similarly found
skilled human capital and linkages with academia positive and significant.
However, external sourcing of R&D was found negative. Contradicting this driver
slightly is the positive significance of linkages to governmental institutions. The

Chapter 2 68
negative significance of sourcing R&D externally may be indicative of difficulties
of bearing cost burden for medium sized firms, while the positive significance of
collaborations with governmental institutions may capture the reverse – that of
reduced cost of R&D when collaborating with a government institution, as
reflected in German economy with the use of Fraunhofer institutes or in the US
through use of extension services by SMEs. Further exploration with specific data
would yield clearer insights into the mechanism of this drivers influence on
innovation.
Innovation drivers for large-sized firms: Similar to small and medium sized
firms, large firm analysis found skilled human capital and linkages to academia
positive and significant. However, they show additional positive significance for
public funding as well as linkages to suppliers and negative significance for
linkages to government institutions. The positive significance of public funding
and supplier relationships appears to reflect that large firms use access to public
funding and relationships of co-development with suppliers to aid their growth,
while the negative association with government institutions could reflect their
lack of need to subcontract research externally, as large firms usually have
significant R&D teams internally.
Firm eco-sphere for innovation:
Importance of large firm presence for innovation: A last but perhaps not
insignificant aspect is that large firms appear to dictate a substantial portion of
innovation measure. While SMEs may be called the hidden growth champions of
Germany, their share of innovation turnover is by virtue of their size limited.
Hence in the long run, economies or indeed sectors may be inhibited in
innovation as a consequence of a reduced share of presence of large firms.
German insights:
The brief analysis of Germany helped offer insights into the mechanisms through
which these wider sets of drivers may influence innovation: commercialization of
research; alignment of industry, academia and government policy; and
encouragement of longer-term decision-making, along with the reduction of
funding gaps. Apart from offering insights into the mechanisms through which

Chapter 2 69
these drivers exert influence on innovation, Germany also shows that the use of
a wider tool kit of innovation drivers may allow different drivers to drive
different segments. It that is indeed the case, then policy makers in other
economies may enhance the delivery of innovation across a range of firms sizes,
through setting up structures and regulations that encourage the creation of this
wider mix of drivers in economies.
Thus, by no means complete and with some results remaining puzzling and
inviting further research, this wider analysis of drivers highlights the importance
of increasing the toolkit to analyse influences on innovation and paves the way
for further research into understanding the mechanisms through which these
drivers shape innovation. Germany’s consistent high usage of these other
innovation drivers provides some affirmation of this wider tool kit of innovation
drivers. Perhaps, the most important message is that no driver in isolation may
be as effective compared to using a mix of drivers, while distinguishing primary
drivers from secondary drivers enables policy tools to effectively target required
outcome. If the results of this analysis are indeed valid, then it appears that
innovation may be increased in economies without expanding capital investment
– through just widening the toolkit to incorporate the primary drivers.

Chapter 3 70
Chapter 3 Are firm-size structures important for Productivity? - An adapted Lewis model to draw firm-sizes into the arena of productivity analysis
3.1 Abstract
UK labour productivity levels have lagged well below US, Germany and France
since the 70’s, something often cited as a productivity conundrum for the
economy (FT, 2016). This study explores whether deeper determinants may
explain productivity levels. In particular, this chapter explores the structural
compositions of the economy, which may influence productivity. Using an
adaptation of the economic development framework, the Lewis model, this
study proposes that country level labour productivity may be driven structurally
by the movement of resources from smaller firm sizes to larger firm-size
structures. To enable this analysis, a new database is built up at sector level for
the 32 European economies between 2000-2012. The contribution of firm-size to
country productivity is measured through isolating classifications of small,
medium and large firms, alongside control variables capturing growth theory
drivers, globalization, credit conditions and monetary lending policies. Large
firm sizes are indeed found to be the most significant structure for country
labour productivity. These findings underscore the fact that focus on factors of
production alone, be it firm investment or skills shortage, may not be sufficient
to enable productivity improvements – understanding the firm-landscape
composition may be as essential.
Additionally, this chapter examines whether sectoral composition of an economy
can shape country labour productivity levels. The findings from sector
composition analysis are less clear. Some sector productivities were found
significant for country productivity, while revenue-size was found significant for
some sectors. These results suggest that firm structures may not be an equally
sensitive issue over all sectors.

Chapter 3 71
3.2 Introduction
Office of National Statistics (ONS) analysis showed UK labour productivity to
have grown by 0.9% for the second quarter in 2015 (ONS, 2015), though this
decreased in 2016 to 0.4% (Harari, Briefing paper, n0 06492, 2017). While these
figures indicate some recovery of productivity growth, productivity levels remain
below the pre-financial 2008 crisis trend. According to ONS figures, productivity
growth was indeed flat between Q3 2013 and Q2 2014. Bank of England (BoE),
undertaking an analysis in 2014 into UK labour productivity, concluded that
alongside cyclical factors, two persistent non-cyclical factors could perhaps
better explain UK’s lower labour productivity growth: reduced investment and
impaired resource allocation (Barnett et al., 2014). While these figures are
specific to UK productivity growth and productivity levels related to 2008 crisis,
an equivalently if not more worrying aspect is that UK’s productivity levels have
lagged well below Germany, France and US since the ‘70’s (Harari, Number
06492, 2016). Indeed, productivity levels and not only productivity growth,
remains and has been a key focus of concern for advanced economies, but
specially for UK.
The roots of the BoE productivity analysis lie in the long-advocated Lewis
development model (Lewis, 1954), which emphasizes resource allocation as key
to growth. This line of thought provides the theoretical grounding for the BoE
analysis, which focuses on explaining constraints on factors of production
influencing resource reallocation. These theories on factor constraints could be
broadly grouped in two camps. The first one centres on distortions, which hinder
capital investment flows and the consequent impact on skills shortage
(Bannerjee & Duflo, 2005; Hsieh & Klenow, 2009). The second related camp
targets the time lag or slow diffusion of technology as an explanation for slower
resource reallocation (Tunzelmann, 2000; Klenow & RodriguezClare, 2005;
Caselli & Feyrer, 2007). The core focus of both these camps, as reflected in the
BoE analysis, remains on identifying constraints or distortions in credit and
labour market - the removal or reduction of which could encourage resource
reallocation. Notwithstanding, an analysis of constraints on resources without
assessing the underlying structures that channel these resources, appears
incomplete. Understanding the role structures play in determining productivity
could perhaps be as significant in identifying the hindrances on productivity.

Chapter 3 72
Gollin’s review of the Lewis model (Gollin, 2014), proposes that productivity and
not capital, as assumed by Lewis, may be the long run driver for growth (Gollin,
2014). Importantly, he attributes growth through productivity to be driven
structurally, through the movement of resources to higher productive sectors.
While Gollin focuses on the movement of resources between sectors as the
means to raising productivity, there could perhaps be another equivalently
important structural aspect governing higher productivity from resources – that
of movement of resources across firm structures.
Why firm structures, instead of sectors? This draws on the linkage of productivity
to innovation, where innovation is recognized as the long run driver of growth,
through increasing productivity (Solow, 1956; Romer, 1990). The emphasis on
firm structures in innovation is rooted in the theories promoted by one of the
earliest innovation economists, Joseph Schumpeter, who drew attention to the
structures prevalent in economy through which innovation is channelled.
Schumpeter questioned which size of firm could best function as the principal
engine of innovation, initially emphasizing the role of small firms (Schumpeter,
1934), later singling out the presence of large firms as critical to long run
technological progress (Schumpeter, 1942). It would appear that firm structures
play an important role in driving innovation. Given the intricate linkage of
innovation with productivity and building upon Gollin’s review, the question
arises: Could lack of country level labour productivity be driven through
hindrances of moving resources, not only across sectors as implied by Gollin’s
review of Lewis model – but also across firm structures? That is the key question
this thesis aims to address.
This thesis develops this insight through offering a structural model for country
level labour productivity, building upon Gollin’s review of Lewis’s model of
growth, remodelling the resource movement across firm structures – not sectors,
as in Gollin’s work (Gollin, 2014). In other words, could a country’s lack of
productivity levels be hindered by constraints on moving resources to larger firm
structures? A focus on importance of firm-size structures on country
productivity, irrespective of firm productivity or sectors. To this end, the study
assesses whether firm structures are significant for a country’s labour
productivity economy, and if so, which firm-size structures. Identifying the firm-
size structures most significant for labour productivity, enables an assessment of

Chapter 3 73
the influence of expansion or reduction of that firm-size structure on
productivity levels of an economy. In particular, it may offer clues to the
productivity puzzle in the UK, whose productivity levels remain towards the
bottom of the G7 league table (Financial Times, 2018). In essence, this study
aims to show the linkage between firm structures and country productivity,
offering a theoretical framework through the further adaptation of the Lewis
model.
To demonstrate this linkage, this study focuses on how differing firm-sizes may
influence country labour productivity. Firms are classified into firm-size
groupings based on size of average revenue (turnover) to enable initial
assessment of importance of firm size on an economy – irrespective of the firm
productivities. Later, firm sizes are also assessed through average firm
productivity’s influence on country productivity. This differentiation is to enable
insights on whether just sheer presence of particular firm sizes is important or
not for an economy, irrespective of whether those firm-sizes are productive or
not. Reason for this focus on firm size, irrespective of firm productivity, is to
recognize that certain firm sizes may be lifting country productivity through
other channels such as best practices, R&D spill-overs, skills training – and as
such may be valuable for an economy in their own right, irrespective of their
productivity.
Nonetheless, firm productivity is of importance, which though assessed also in
this study, has already been documented at varied aggregate levels previously by
a valuable body of research. The seminal paper linking firm productivity to
aggregated sector productivity in this field was by Bailey et al. (1992), who
examined the empirical linkage of plant productivity to sector level aggregate
productivity. Examining 23 manufacturing sectors, they found an econometric
positive correlation between productivity of plants and sector productivity, thus,
establishing an empirical base line linking productivity of plants with an
aggregated sector productivity. Developing this theme further, further research
has shown that reallocation of resources from lower to higher productive firms
largely influenced sector-level labour productivity growth (Olley & Pakes, 1996;
Griliches & Regev, 1995). Following a slightly different theme, using cross-
country data Bartelsman et al. (2013) examine entry/exits of firms impact on
country labour productivity and find that country-level labour productivity can

Chapter 3 74
to a large extent be explained by within-firm productivities. These studies
provide significant evidence underscoring the relationship between firm
productivity and either sector-level productivity or country-level productivity,
yet there appears to be far less research on the link between firm size and
country level labour productivity. The only previous study on this topic is by
Leung et al. (2008), who find that the reallocation of labour towards larger firm
structures appears to have a positive correlation on country level productivity
Building upon this theme using econometric analysis, this thesis seeks to
examine the influence of the varied firm-size structures on country-level labour
productivity for 32 European economies between 2000-2012. More so, it aims to
offer an explanation for the mechanisms by which firm sizes may impact on
country labour productivity, through an adapted form of the Lewis model.
The adapted Lewis model, introducing Schumpeterian innovation concepts of
firm structures, essentially explains the impact of varied firm size landscapes on
the labour productivity of an economy. By necessity, models are simplifications
in order to clarify a mechanism. Thus, to enable this study to focus on a model
to highlight the relationship between firm-size and country labour productivity,
it is not possible to include all other heterogenous firm aspects well-
acknowledged in industrial organizational literature. Hence, within these
limitations and keeping view of the insights sought by this study, the question
arises - does the data corroborate this adaptation of the Lewis model and do
firm-size structures indeed dictate productivity for an economy?
The findings from this study support the proposed adaptation of the Lewis
model, with some caveats. It would appear, based on average firm turnover
shares, that only large firms’ structures were found to impact country level
productivity significantly and positively, with small and medium sized firm
structures seeming to have a negative influence. More so, only large firm
productivity was found robust and significant for country level productivity. This
overlaps with recent research by ECB, which found that though small and
medium sized firms (SMEs) employed nearly 70 percent of the workforce in the
EU business economy in 2012; they generated only 60 percent of the value added
(ECB, 2013). Further, if measured by number of firms, though SMEs accounted
for 99.8 percent of the firms in the business economy, large firms comprising
only 0.2 percent of the total, generated 40 percent of the value added

Chapter 3 75
(Eurostat, 2012). That roughly translates to a factor 330 times higher value
added per large firm compared to SMEs, indicating larger firms appear to have
much higher productivity. However, it should be kept in context with the fact
that despite lower productivity, SMEs are found to be an important source of
employment and country growth (Beck et al., 2005). Similarly, both small and
large firms were found critical for innovation (Bradley, 2014), bearing in mind
that innovation is a critical element for long-term productivity. Keeping sight of
the varied value of the different firm-size structures, it would appear that
moving resources from SMEs over to larger firm structures for purposes of raising
country level labour productivity, could be beneficial. That is essentially the
main insight for the model.
In particular, interpreted in UK’s case, this could be a problem, as on average
the UK appears to have a declining large firm density trend since the 70’s
(Bradley, 2018). This would require policy makers to look beyond constraints on
factors of production, looking to devise policies to increase or support large firm
presence in the economy.
This study also examined sector influence on country productivity, aspiring to
shed some insights on Gollin’s view that moving resources to higher productivity
sectors could help lift the country level productivity of an economy. However,
findings in this area were more mixed. It appears that some sectors influence
country level productivity through their productivity and others through sector
size. Where sectors influence through size, it would appear that such sectors
would benefit from presence of all three firm-sizes in those sectors. In contrast,
those sectors influencing through productivity may benefit from a larger firm-
size presence in those sectors. These findings add some detail to Gollin’s
interpretation of Lewis model, lending some clarification of the type of
structures towards which to move resources in varied sectors. However, these
implications would need further detailed corroboration through detailed
research, to verify the validity of these implications.
The remainder of this chapter is as follows: the next section 3.3 addresses the
theoretical framework and thereafter section 3.4 covers the relevant literature
around the questions addressed by this study. Section 3.5 explains the data and

Chapter 3 76
methodology. Section 3.6 highlights the main results, concluding in section 3.7
with possible policy implications.
3.3 Theoretical Framework
This study offers insights into the structural drivers of productivity, based on
adaptation of Lewis’s development model for growth, as interpreted by Gollin
(Gollin, 2014). Gollin suggested productivity was the long run driver of growth
instead of capital, as proposed originally in Lewis’s model (Lewis, 1954). Gollin
based this interpretation on Lewis’s original dual-sector model, attributing
growth through productivity to be driven structurally through the movement of
resources to higher productive sectors. This study builds further upon Lewis’s
model, but with two differences. Firstly, it aims to explain country level labour
productivity, not country level growth. Secondly, it proposes that this
productivity could be driven structurally, through the movement of resources
across firm-structures, irrespective of sectors. The focus is on firm structures,
small versus large, deriving from Schumpeterian concepts of innovation
(Schumpeter, 1942; Schumpeter, 1934). It simplifies the firm structures into
dual-structure concept of small and large, in order to explain the mechanism of
shift of resources. Thus, this study not only proposes that country level labour
productivity is driven structurally by the movement of resources across firm
structures, it proposes a particular direction – movement from smaller firm sizes
to larger firm-size structures.
This direction of movement from smaller firm-size structures to larger firm-size
structures to enhance labour productivity is based to an extent on simplification
of previous research on firm structures and related firm productivities. While
research has widely found large firm-size structures to have higher firm
productivity (Lucas, 1978; Snodgrass & Biggs, 1996; Van Biesebroeck, 2005; Van
Ark & Monnikhof, 1996), there is caution that this could be sector dependent or
indeed dictated by various other aspects, including management practices
(Bartelsman et al., 2013). Thus, keeping this caveat in mind, the model proposes
a direction of resources towards larger firm-size structures for enhancing
productivity, based on the assumption that larger firm-size structures are on
average associated with higher productivities.

Chapter 3 77
In turn, this movement of resources to larger firms, in effect more highly
productive firms, is proposed to deliver higher country level labour productivity.
In essence, this proposal is based on the key insights by earlier research that
moving resources to higher productivity structures raises sector level labour
productivity (Olley & Pakes, 1996; Griliches & Regev, 1996; Bailey et al., 1992).
In this study, this same mechanism is proposed to translate to country level
labour productivity as depicted in Figure 3.1. In effect, this study builds upon
these various insights in literature and pulls them together, to offer an adapted-
Lewis model for country level labour productivity.
Figure 3.1 Adapted Lewis Model for Productivity, source (author) This adapted Lewis model, based on simplification of the interrelationship
between innovation and productivity, highlights the impact of firm structures on
country level labour productivity. Combining various insights from above
mentioned previous research, this model proposes that shift from smaller firm
structures towards larger firms raises country level productivity – both through
channels of firm productivity and firm revenue. The model is explained basically
through representations of marginal product of labour (MPL) curves for small and
large firms, with shifts in these MPL curves observed for their impact on country
level labour productivity.
The proposed mechanism of shifting MPL of large firm rightward or leftward,
whilst not shifting left hand corner of MPL curve, in essence represents a firm’s
capital expansion without productivity shift. On a country level, however, this
MPL can be seen as representative of expansion or reduction in the share of

Chapter 3 78
large firm presence in an economy. This is however different from a firm
productivity shift (due to introduction of a new technology/innovation or
efficiency), in which case the entire MPL shifts outwards due to a firm
productivity increase. Smaller firms are depicted on the right-hand side of the
diagram with on average a much lower MPL than large firms. This follows a
similar mechanism as explained for large firms, with a leftward shift of the MPL
capturing expansion of the smaller firm-size presence in an economy, but a full
outward-shift of the smaller-firm MPL only caused by a productivity increase.
However, should the small firms struggle to scale up, as evidenced in UK
(Bradley, 2018), then the smaller MPL may not scale up outwards as firms do not
appear to last the distance to grow.
The study assesses the data to verify the validity of this adapted Lewis model for
productivity, thus assessing the questions of whether firm structures are indeed
significant for a country’s labour productivity economy, and if so, which firm-
size structures? To assess if large or small firm-size structures are indeed
relevant for country level productivity irrespective of their firm productivities,
firm-size structures are assessed for their influence both through their average
turnover share and firm productivity, essentially, allowing a dual-check of
relevance of firm-size structures. It uses evidence to identify the firm-size
structures most significant for country labour productivity and thereby,
examines the validity of the proposed adapted Lewis model. Importantly, if this
model is found valid –the expansion or reduction of particular firm-size
structures in an economy could be then found to offer clues to the longer-term
productivity levels of an economy. This itself could offer vital clues for longer
term productivity challenges, for example in the UK economy.
The study examines the evidence through a panel database on firm-sizes and
country productivity at sector level for 32 EU economies between 2000-2012. It
includes firm size classification (OECD, 2005) of small, medium and large firms
at sector level for core innovative sectors spanning manufacturing and services,
using both average firm turnover and average firm productivity to assess
importance of firm structures (EUROSTAT CIS, 2013).
The findings of this study appear to validate the proposed adapted Lewis model.
Large firm structures are indeed found to be an essential positive force on the

Chapter 3 79
country level labour productivity. In fact, only large firm turnover share and
large firm productivity were found significant and positive. In contrast, firm
turnover shares of small and medium sized firms were found to influence country
level labour productivity negatively, thus, underscoring the importance of large
firm presence in an economy for country level productivity and affirming that a
shift of resources towards larger firm structures, which essentially could shift
the MPL-curve of large firms rightwards (expansion of firms) or fully outwards
(productivity increase for new frontier technology firms), would raise country
level productivity. Vice versa, a reduction in large firm presence in an economy
would entail a shift of resources away from large firms towards smaller firms,
resulting in a lowering of country level labour productivity. Thus, the research
emphasizes the importance of including an understanding of firm-structures,
alongside constraints on factors of production, into the arena of productivity
analysis of an economy.
3.4 Existing Literature.
As noted earlier, excepting that of Leung et al. (2008), previous research is
mainly silent on the examination of firm sizes and their influence on country
labour productivity. Leung et al. (2008) examine the influence of reallocation of
resources towards large firms on country labour productivity, offering insights of
the mechanism that increasing employment in large firms appears to raise
country level productivity. This study takes this a step further and investigates
initially how the varied firm size structures influence country level labour
productivity, irrespective of firm productivities, thereafter, also assessing
influence of firm productivities on country productivity, for which there is a
valuable body of prior research.
There are nonetheless valuable insights in previous literature on the importance
of firm-structures, even if they don’t specifically relate it to country
productivity. This section reviews the existing literature on the relationship of
firm-structures, firm productivity, country productivity and growth.
There is a relatively wide range of studies that have investigated the link
between firm sizes and firm productivities. Partially inspired by Schumpeter’s
differing claims of firm-sizes for innovation, Lucas researched movements in firm

Chapter 3 80
productivity due to employment shifts of highly skilled managers as a
consequence of rising wages and found an association in the US between large
firms and higher firm productivity (Lucas R. J., 1978). Lucas, though, indicated
this could possibly vary in accordance with the level of advancement of
economies, with perhaps smaller and medium sized firms having greater
importance for developing economies. On the other hand, Snodgras and Biggs,
assessing a wide range of parameters on the role of SMEs in India and newly
industrializing economies of the far east, research revealed that on aggregate,
firm labour productivity appeared to be positively correlated with firm-size
(Snodgrass & Biggs, 1996). They cautioned that this could be sector dependent,
as a few sectors showed that SMEs had comparable or higher productivity.
Supporting Lucas’s earlier findings while examining advanced economies, Van
Ark and Monnikhof having constructed data sets based on three manufacturing
sets in advanced economies between the 60’s and late 80’s, reported that higher
firm productivity appeared correlated with larger firm sizes (Van Ark &
Monnikhof, 1996). Assessing developing economies, Van Biesebroek relating firm-
size to firm productivity for manufacturing sectors across some African
economies, showed that firm-size was positively correlated with both firm
growth and firm productivity (Van Biesebroeck, 2005). This supports earlier
findings by Biggs et al.(1996) examining manufacturing sectors in African
economies, where large firms were found to have higher labour productivities.
With some variation for developing economies, this set of research overall seems
to support views that higher firm productivity is closely associated with larger
firm sizes in advanced economies and some developing economies.
As mentioned earlier, there are valuable studies linking firm productivity with
aggregate productivity. The seminal paper linking firm productivity to
aggregated sector productivity in this field was by Bailey et al. (1992), who
examined the empirical linkage of plant productivity to sector level aggregate
productivity. Examining 23 manufacturing sectors, they found a positive
econometric correlation between productivity of plants and sector productivity,
thus, establishing an empirical base line linking productivity of plants with an
aggregated sector productivity. Developing this theme further, further research
has shown that reallocation of resources from lower to higher productive firms
largely influenced sector-level labour productivity growth (Olley & Pakes, 1996;

Chapter 3 81
Griliches & Regev, 1995). With a slightly different focus, Bartelsman et al.
(2013), use firm productivity gaps to capture resource misallocation that explain
cross country productivity differences across five advanced and three eastern
European economies. These studies provide valuable insights linking firm
productivities to aggregate productivity, finding shifts towards higher productive
firms reflected in raised aggregate productivity measures.
Furthermore, there is also research assessing total factor productivity (TFP) and
its impact on country level productivity. Using TFP to capture some resource
misallocation caused by constraints to physical and human capital, a positive
association was found between lower TFP and lower country productivity
(Klenow & Rodriguez-Clare, 1997). This association of TFP with country labour
productivity is supported by findings from Hall & Jones, using growth accounting
on extended human capital Solow models to compute TFP (Hall & Jones, 1999).
Caselli evaluating country income and TFP through development accounting finds
cross-country incomes are not sufficiently explained by factors of production and
questions if departure from Cobb-Douglas function may aid future research
(Caselli, 2005). As this study does not use growth accounting or TFP to capture
impact of technology, instead using firm structures to capture innovative
activity, this association is of less direct relevance here.
On another related strand, there is some research assessing firm-size, classified
by employment share, and its effect on aggregate country growth. . Historically,
there is evidence for the vital role of SMEs on country growth for some
developing economies. Indeed SMEs played a critical role in Japan’s
industrialization after the Meiji revolution and experience of emerging
economies like Taiwan seemed to further strengthen these convictions
(Snodgrass & Biggs, 1996). However Snodgrass and Biggs(1996) also emphasized
that was not the experience of most second tier industrializing European
economies, nor of Korea as an emerging economy, showing that variable firm
sizes seemed to have suited differing economies to deliver growth. Albeit, the
role of SMEs in delivering growth in emerging economies is also supported by the
World Bank (World Bank, 2002; World Bank 2004). While recent research by Beck
et al. (2005) further supports the correlation of SMEs with growth, they find no
empirical support for a causal relationship. Beck et al. (ibid) use national
characteristics as instrumental variables to assess this causal relationship,

Chapter 3 82
cautioning that this is only indicative of the lack of empirical support for the
significance of this relationship, not evidence to support the absence of a causal
relationship; which leaves the issue of firm sizes open for further evaluation.
Excluding causality, it appears there is quite a significant body of evidence
supporting the association of smaller and medium sized firms with country
growth. While country growth differs from country productivity, the focus for
this current study, nonetheless this strand of research underlines the importance
of evaluating all three firm sizes carefully for their impact on country level
labour productivity.
This study thus hopes to complement this body of research on firm-structures,
through assessing how presence of varied firm-size structures influences labour
productivity at country level. Using these insights, it assesses the proposed
adapted Lewis model offering a mechanism through which firm-sizes could
impact country level productivity. This is followed by an examination of sector
sizes and sector productivities, which may shed insights on the differing types of
firm-structures needed in sectors for country productivity. The description of
the data and methodology follows in the next section.
3.5 Data and Methodology
Measures of Firm-size structures and productivity, as well as Sector share and Sector productivity
To ensure the collection of a comprehensive set of firm size measures, the study
uses a newly built database comprising of two types of sector level survey data
and one set of country level data. The sector level firm data is sourced from bi-
annual community innovation survey data (CIS) for 32 European economies
between 2000-2012 (EUROSTAT CIS, 2013) and Structural Business survey data
(SBS) between 2008-2012 (EUROSTAT SBS, 2015). Although CIS data covers the
period of 2000-2012, as there is often missing sector data for 2002, that year is
dropped from the regression analysis. The corresponding country specific control
variables between 2000-2012 are drawn from World Bank Development Indicators
(WDI) accessed from the World DataBank (World Bank, n.d.).
Using these datasets, a panel database is built, incorporating all firm-sizes,
including SMEs and large firms, for 32 European economies over the period of

Chapter 3 83
2000-2012. Moving away from an analysis into either just manufacturing or
services sectors, it instead incorporates core innovative sectors within countries,
as defined by Eurostat (2013). This includes both manufacturing and service
sectors, permitting the study to engage with all sectors contributing to
innovation, the key to long run growth and productivity. This panel database has
essentially 5 layers of classifications: year, country, sector, type of firm
(innovative, non-innovative) and firm size (small, medium and large). The data
for sectors is available at aggregated core innovative sector level, sub-
aggregated level and detailed sector level.
3.5.1.1 Firm classification and Firm turnover:
To classify firm-size structures influence on the productivity of an economy, this
study separates firm turnover and firm productivity at sector level into three
OECD-defined groups: small, medium and large firm size class structures
(EUROSTAT CIS, 2013; OECD, 2005), with small featuring 0-49 employees,
medium between 50-249 employees and large with 250+ employees. Firm
turnover is the average turnover of small/medium/large firms, measured by
aggregated turnover at sector level for each size class. The firm-size measure is
in fact a dynamic measure, as it captures the net firm data bi-annually,
including entries and exits of firms at sector level. Though the survey data
provides access to invaluable aspects of firm data, it has the associated
shortcoming of survey data and thus limited in its coverage of the entire
economy. Eurostat attempts to ensure that the population cover is
representative of the economy and by measuring both innovative and non-
innovative firms, tries to ensure a balanced snapshot of the economy at sector
level (EUROSTAT CIS, 2013; EUROSTAT SBS, 2015). Its unique strength lies in its
provision of international comparability, an aspect that has seriously hindered
previous cross-country studies, opening up the possibility of panel data studies.
3.5.1.2 Firm productivity, Sector productivity and Sector share:
Firm size structures are captured by the associated turnover related to firm-size
classes: small, medium and large for the period of 2000-2012. Lacking gross
value added per employee data in CIS, the productivity of firm sizes is captured
by turnover per employee for the time period 2000-2012, critically with CIS data

Chapter 3 84
providing related firm-size information. The study also uses SBS data, which
provides accurate productivity measures of gross value added per employee data
at sector level, however as it for shorter time period of 2008-2012 and lacks
firm-size information, and opportunities for corroboration are limited.
Furthermore, as varying sectors will have missing data across the 32 economies
for different year groups, the number of actual panel years per sector employed
in the analysis is reduced accordingly, with the year 2002 often dropped due to
missing sector data. Another limitation of firm size structure data is that it is
only available at approximately 10 aggregated sector levels, restricting firm size
structures analysis to that level. However detailed sector level turnover and
turnover per employee is available, albeit without firm-size classification,
allowing detailed sector share and sector productivity analysis. Sector share is
defined as the aggregated turnover for firms in that sector, while sector
productivity is measured as turnover per employee aggregated at sector level.
3.5.1.3 Level of aggregation of sectors:
As this study focuses on firm-size structures, it is restricted to varying depths of
sector level for the regression due to restrictions imposed by availability of data.
CIS survey data is the only source of firm-size structures classification data,
providing firm-size information either at a fully aggregated sector level defined
as ‘Innovation Core activities’, encompassing all innovative sectors or at sub-
aggregated levels of sector aggregation. The 9 sub-aggregated innovative sectors
providing firm-size structure classification are as follows: Industry (except
construction); Information and communication; Financial and insurance
activities; Architectural and engineering activities; technical testing and
analysis; scientific research and development; advertising and market research;
Electricity, gas, steam and air conditioning supply; manufacturing; Water supply;
sewerage, waste management and remediation activities; Transport, storage and
communication; Wholesale trade, except of motor vehicles and motorcycles. The
firm-size structures and firm-size productivity regressions are of necessity
performed at this sub-aggregated level. In contrast, as no firm-size classification
is required, the detailed sectors comprising about 60 innovative sectors are used
during the examination of sector share and sector productivity influence on
country productivity.

Chapter 3 85
The width of sectors chosen for this analysis also deserves some clarification. As
innovation over the last few decades has moved away from pure manufacturing
and is increasingly wrapped up in the software and design in the services sector,
the study uses OECD’s grouping of sectors, defined as core innovative sectors
(OECD, Innovation Manual, 2005). Though this grouping or classification has thus
far not been used widely in studies, the author of this study previously used this
grouping in a study on innovation drivers (Bradley, What are the drivers of
Innovation and does policy target them?, 2014), and again uses this grouping for
this study as it enables to focus the examination on sectors most relevant to
innovation across manufacturing and service sectors.
Measures of Country productivity, alongside country specific control variables
As the study examines the relationship of firm-size structures on country level
productivity, the dependent variable is country level labour productivity
measured by Gross Value Added per employee, sourced from WDI. Following this
regression, the study assesses the impact of sector level turnover and sector
productivity on country productivity, the dependent variable for country level
labour productivity again being measured by Gross Value Added per employee.
When assessing impact of sector productivity on country productivity, the sector
productivity variable of interest is initially measured by turnover per employee if
using CIS data, over the period 2000-2012. However, this is later followed up by
an alternative and more accurate measure of sector productivity as measured by
Gross value added per employee from SBS data, albeit with a shortened time
period of analysis from 2008-2012 due to data availability restrictions. On the
other hand, sector turnover is measured only by the size of turnover of
corresponding sector each second year over the period 2000-2012.
The level of analysis for firm-size structures is restricted by the availability of
firm-size data only at particular sub-aggregated sector level. The sub-aggregated
sectors are detailed in the regression. However, regressions analysing sector
turnover and sector productivity impact on country productivity are independent
of firm-size structures, and thus are implemented at detailed sector level.

Chapter 3 86
To ensure that the regression only captures the firm structure effects, we
separately control for country specific growth drivers which influence
productivity as per Solow model (Solow,1956): capital formation and labour
force participation rates; as well as globalisation growth impact captured by
export trade; last but not least, also controlling for differing monetary policy
growth impacts through country specific deposit rates alongside lending rates
influencing variable credit conditions. Though sourced from World DataBank,
they are a mixture of National statistics data, as well as IMF, IFC and ILO
collected data statistics (World Bank, n.d.). As the CIS data is only available
biannually, the country specific measures are accordingly drawn for a similar
period and frequency from World databank. The choice of these control
variables is defined in greater length in the sub-section 3.5.3.1
To provide a snapshot of the movement of economies between 2000-2012, Table
3.1 provides a listing of the country labour productivities (derived from WDI,
World DataBank) analyzed in this study, initially in 2000 and then 2012.

Chapter 3 87
Table 3.1 GVA per employee (K Euros per Empl) of the 32 economies in this study at 2000 and 2012, derived from WDI indicators sourced from World DataBank
Country GVA per employee (2000) (K Euros per Employee)
GVA per employee (2012) (K Euros per Employee)
Austria 43.9 82.7 Belgium 47.9 92.3 Bulgaria 3.8 15.04 Croatia - 33.3 Cyprus 19.3 40.9 Czech republic 11.2 36.8 Denmark 47.9 96.2 Estonia 8.1 30.6 Finland 39.8 75.4 France 45.6 81.2 Germany 45.5 78.6 Greece 26.97 55.97 Hungary 8.97 24 Ireland 46.75 98.77 Italy 47.4 80.5 Latvia 8.7 27.3 Lithuania 29.3 Luxembourg 94.97 193.4 Malta 22.04 - Netherlands 42.6 81.3 Norway 53.7 148.8 Poland 9.5 26.04 Portugal 19.5 40.1 Romania 2.8 16.4 Serbia - 15.1 Slovakia 11.2 34.9 Slovenia 18.9 42.1 Spain 32.7 66.4 Sweden 43.8 87.1 Turkey 9.1 23.7 United Kingdom 44.7 71.2 United States (Reference only, not analyzed in regressions)
56.9 92.8
Note: Whist care has to be taken interpreting these nominal values, Luxembourg had the highest labour productivity in 2000 and yet again in 2012. In contrast Romania had the lowest GVA/employee in 2000, yet in 2012 Bulgaria appears to have even lower labour productivity than Romania. Excluding Canada and Japan, the G7 economies listed here vary in their labour productivities with UK with the lowest productivity level, France and Germany virtually equivalent, then Italy and US the highest in 2000. This remains similar in 2012 for UK being lowest and US highest. Inbetween it changes somewhat with France increasing its productivity above Germany, as well as Italy. Though US continues to remain slightly less than half of Luxembourg. Norway stands out in increasing its productivity nearly three-fold from 2000 to 2012.

Chapter 3 88
Methodology
3.5.3.1 Country level Productivity and Firm-size Regressions
Measurement of productivity is inherently derived from growth models. Either
neoclassical growth models that estimate income of an economy based on a
functional form relating human and physical capital with technology exogenous
to model (Solow, 1956; Mankiew, Romer, & Weil, 1992). Or endogenous growth
models can be used to measure income of an economy, with yet another
functional form relating capital, both human and physical, to some measure of
technology endogenous to model (Arrow, 1962; Romer, 1990). While labour
productvity has many definitions, the most commonly used measure of labour
productvity is income of an economy per employee or more specifically income
per hour worked (OECD, 2001). This study, due to data restrictions, uses income
per employee, as measured by gross value added (GVA) per employee to
estimate country labour productvity.
Purpose of regression: As explained earlier, this study assesses the data, to
verify the validity of this adapted Lewis model for this measure of country
labour productivity, in other words, assessing whether firm structures are indeed
significant for a country’s labour productivity economy, and if so, which firm-
size structures? To initially examine whether large or small firm-size structures
are indeed relevant for country level productivity irrespective of their firm
productivities, firm-size structures are assessed for their influence both through
average turnover share impact on country labour productivity. Thereafter,
average firm productivity of the varied firm size structures is assessed for its
impact on country labour productivity, essentially, allowing a dual-check of
relevance of firm-size structures. The findings are then used to identify the
firm-size structures most significant for country labour productivity and thereby,
to assess the validity of the proposed adapted Lewis model.
Choice of control variables: Assesment of the validity of the proposed adapted
Lewis model, requires examining the impact of the varied firm-sizes on country
labour productvity. To ensure the regression captures the correct impact of firm
size structures on country productivity, the regression controls for basic drivers
of growth, globalization and monetary policy. Growth drivers are represented by

Chapter 3 89
human and physical capital, where human capital is captured by employment
labour force particpation rate, in order to also assess Becker and Gordon’s
findings that productvity and employment may move in opposite directions
(Gordon & Becker, 2008). Physical capital is proxied by the gross capital
formation at country level. Along with these basic elements of productvity
analysis, the empirical analysis controls for country specific moneatry policy and
financial lending rates, which could influence credit constraints impacting labour
productvity. Furthermore, it controls for export, as that aspect of country-
specific trade policy may also influence labour productivity. Lastly, time
dummies are included to capture any anuual shocks across the panel.
Regression equation: The regression equation used to evaluate the relationship
between country productivity and firm-size structures, using panel data over the
period 2000-2012 for the 32 European economies, can be defined as follows:
yij= a1GCFit + a2EMPit + a3EXPit+ a4LENDit+ a5DEPit + b1SmallFirmijt + b2MedFirmijt
+ b3LgeFirmijt + hyear dummies + e (1)
where y is the country-level labour productivity measured by GVA per employee,
GCF is the gross capital formation at country level, EMP is the country’s labour
force participation rate measured as Employment to population % ratios, EXP is
the country specific export as a % ratio to GDP as proxy for government policy,
LEND is the lending interest rate capturing credit constraint conditions, DEP is
the deposit interest rate to proxy monetary policy. Year dummies are included
to capture any time shocks and e represents error term. The subscripts in
regression following standard notation of ‘i’ representing country variation,
subscript ‘j’ sector variation and subscript ‘t’ denoting year variation. GCF and
EMP chiefly represent country specific productivity factors influencing physical
and human capital accumulation. This regression evaluates at the aggregated
and sub-aggregated innovative sector levels, as firm-size information is not
available at detailed sector level. At these two levels of aggregation, initially
the regression examines influence of average turnover of the firm size
structures: small, medium and large size class. Thereafter, the regression
evaluates these three firm-size structures through average firm-turnover share
(firm intensities), with average turnover of each firm-size class as a proportion

Chapter 3 90
of total turnover. Lacking data on actual firm numbers, the share in revenue or
turnover was proxied to represent firm-intensities. Both regressions offer
differing, but equally important insights. Essentially, firm turnover reveals how
the average revenue of the small, medium and large firms impacts on country
productivity, while average turnover-share examines how the proportions of
particular firm-size classes present in an economy can influence country
productivity.
As described in the adapted Lewis model, firm structures influence country level
productivity either through channels of expanding turnover or through increasing
firm productivity. To examine the validity of the proposed adapted Lewis model,
firm-size structures are assessed thus additionally through channels of firm
productivity as well as turnover. The equation for the regression adding the
influence of firm-size productivities on country labour productivity can be listed
as follows:
yij= a1GCFit + a2EMPit + a3EXPit+ a4LENDit+ a5DEPit + b1SmallFirmijt + b2MedFirmijt
+ b3LgeFirmijt + g1SmallFirmProdijt + g2MedFirmProdijt + g3LgeFirmProdijt + hyear
dummies + e (2)
where SmallFirmProd, MedFirmProd and LgeFirmProd are represented by
turnover per employee.
In both these regressions, the coefficient b indicates the ratio of country
productivity to firm-size turnover, according to classification of small, medium
and large size class. As the b coefficient is the slope response of a unit change of
a particular class of firm-size turnover, a higher value of b implies a higher
impact on country productivity for a unit change of the associated firm-size
turnover.
Similarly, the coefficient g represents the ratio of country productivity to firm-
size productivity, classified again into small, medium and large size grouping.
This coefficient g is the slope response on country productivity for a unit change
in firm-size productivity. Again, a higher g value is suggestive of a greater
productivity of that firm-size class, with the sign and significance of the

Chapter 3 91
coefficient indicating whether there is any relationship between firm-size
productivity of that class and country productivity. A positive sign implies a
favourable influence, while a negative sign an adverse effect.
3.5.3.2 Country level Productivity and Sector Regressions
This study also examines the relationship of sector size and sector productivity
on country level productivity. As firm-size turnovers determine sector size and
firm-size productivities in turn shape sector productivities, this examination in
effect allows an alternative cross-check of firm-size influence on country
productivity. It offers the added advantage of a lower level of evaluation at
detailed sector level, as no firm-size classification is required, increasing the
robustness of the regression.
Each sector size is measured by turnover of the corresponding sector for each
biannual year, over the period 2000-2012. On the other hand, sector productivity
is measured by turnover per employee using CIS data over a panel data period of
2000-2012 biannually. When measuring sector productivity by GVA per employee
using SBS data, the period of observation is restricted to 2008-2012. Using this
more accurate measure of sector productivity, albeit restricted to a shorter time
period, offers a robustness check to the regression.
It is to be noted that as there is lack of firm-size classification, sectors can only
be assessed for their relationship of sector size or productivity on country
productivity. Not for the makeup of firm-size classes within those sectors on
country productivity. The following regression is used:
yij= a1GCFij + a2EMPij + a3EXPij+ a4LENDij+ a5DEPij + b1SectorShareij + … +
b60Sector Shareij + g1SectorProdij + … + g60SectorProdij + hyear dummies + e (3)
In this case, coefficient b indicates the ratio of country productivity to sector
turnover. As b is effectively the slope response of a unit change of sector
turnover on country productivity, a higher b value suggests a larger impact on
country productivity for a unit sector turnover. A positive and significant b
suggests a beneficial impact of sector size on country productivity, whilst a
negative sign would indicate an adverse effect.

Chapter 3 92
In this instance, coefficient g represents the ratio of country productivity to
sector productivity. Thus the coefficient g is the slope response on country
productivity for a unit change on sector productivity. As earlier, a higher g
implies a greater influence on the country productivity, with a positive
(negative) sign implying country productivity benefits (adverse effect) from that
particular sector’s productivity.
In essence, sector size (measured by turnover) could expand without improving
sector productivity (turnover per employee) through increasing employment, yet
benefitting country productivity by shifting resources from lower productive
sectors to employment in higher productive sectors, as proposed in original
Lewis model (1954). On the other hand, sector productivity could increase
through efficiency in the short term or innovation in the long term shifting the
firm technology composition, as per adapted Lewis model – yet again benefitting
country productivity.
As both sector sizes and sector productivity are examined, this process is
examined comparatively - whether sector sizes or sector productivity have a
similar significance of influence. If there is disparity in significance, the
predominance of one aspect, either sizes or productivity, is suggestive of a more
(less) than proportional influence of that aspect on country productivity.
This initial analysis of sector size as captured by turnover is followed by a set of
regressions where sector size is instead represented by sector share, measured
with sector turnover as a proportion of total core innovative sectors’ turnover.
In essence, sector share = sector size (turnover) / total turnover of all innovative
sectors, enabling each sectors weight in the whole economy to be determined.
Whereas sector size examines sector revenue as an alternative channel of
influence on country productivity, sector share assesses whether the proportion
of sectors relative to total core innovative sectors is important for country
productivity.
3.5.3.3 Descriptive Statistics and Correlations
Table 3.2 lists summary statistics of the variables for . Looking at labour
productivity variations of GVA per employee overall, the mean labour

Chapter 3 93
productivity across the 32 economies for the period 2000-2012 is measured as
49KEuros per employee. However, looking overall at the 32 countries over the
period 2000-2012, there is also substantial variation with the lowest labour
productivity of a country recording absolute value of 2.8 K Euros GVA per
employee, possibly Romania and the highest labour productivity measuring 215 K
Euros GVA per employee, possibly Luxembourg. Sector turnover has a mean of
63 billion Euros, with a maximum turnover of sector reaching 3.2 trillion Euros.
Sector productivity, as proxied for this study and defined by turnover per
employee has a mean of 300 K Euros per employee, varying between sectors
from 103 K Euros per employee to 1, 822 K Euros per employee. These contrasts
with Sector productivity figures of gross value added per employee with a mean
of 75 K Euros per employee, varying between 27 K Euros per employee to 2197 K
Euros per employee. It appears that sector productivity as defined by turnover
per employee is approximately factor five higher than sector productivity for the
mean as measured by gross value added. The turnover per standard deviation is
somewhat higher than standard deviation of gross value added per employee,
possibly indicating it is a less sensitive measure of sector productivity.

Chapter 3 94
Table 3.2 Summary Statistics
Mean Std dev Min Max Observations Country GVA/Empl (K Euros per Employee) overall between within
49.3
35.93 0 35.9
2.81 49.3 2.81
215.3 49.3 215.3
N= 65520 n = 312 T = 210
Gross cap form GCF/Empl (K Euros per Employee) overall between within
6.88
5.27 0 5.27
.104 6.9 .104
30.5 6.9 30.5
N = 66768 n = 312 T-bar = 214
Employment ratio (Empl) (Labour %age of Pop) overall between within
53.25
7.13 7.1e-15 7.1
35.5 53.25 35.5
72 53.25 72
N= 66456 n = 312 T = 213
Export (Export as %age of GDP) - overall - between - within
51.9
29.5 0 29.5
9.8 51.9 9.8
193.3 51.9 193.4
N = 66768 n = 312 T-bar = 214
Lending interest rate - overall - between - within
8.6
6.01 0 6.01
.5 8.6 .5
53.85 8.6 53.85
N= 43056 n = 312 T = 138
Deposit interest rate - overall - between - within
4.8
7.8 0 7.86
.01 4.89 .01
78.7 4.89 78.7
N= 37440 n = 312 T = 120
Turnover Billion Euros (of sectors) (CIS) - overall - between - within
63
184 68 170
0 0.9 -273
3,290 340 3,040
N = 4360 n = 60 T-bar = 72.7
Turnover/Empl (K Euros per Employee) (CIS) - overall - between - within
300.8
581.15 272.06 524.9
1.8 103.8 -1512.2
22505.7 1822.3 20984.3
N = 4125 n = 60 T-bar = 68.75
Sector GVA/Empl (K Euros per Employee) (Sbs) - overall - between - within
75.9
349.2 283.5 307.8
-323.7 27.9 -2001.1
18451.6 2197.665 16329.9
N = 13788 n = 171 T-bar = 80.6
Table 3.3 shows the correlation matrix values between country productivity,
GVA per employee, and the independent variables. Country productivity has the
highest correlation percentage with gross capital formation, as well as labour
force participation rates, with negative correlations for the lending and interest
rates. Export, the trade variable is also positive, while sector turnover and
sector productivity showing also positive correlation. Interestingly sector

Chapter 3 95
productivity, as measured by turnover per employee, or sector productivity as
measured by GVA per employee, show a similar level of correlation.
Table 3.3 Correlation Matrix values
Country GVA/Empl
GCF/Empl
Empl (%age to Pop)
Export (%age to GDP)
Lending rate
Deposit rate
Sector Turnover
Sector Turnover per Empl
Sector GVA/Empl
Country GVA/Empl
1
GCF/Empl
.96 1
Empl (%age to Pop)
.765 .831 1
Export (%age to GDP)
.187 .109 .305 1
Lending rate
-.507 -.39 -.44 -.705 1
Deposit rate
-.036 .06 .17 -.377 .60 1
Sector Turnover
.217 .17 .18 .097 -.19 -.25 1
Sector Turnover per Empl
.399 .367 .30 .15 -.25 -.05 .23 1
11Sector GVA/Empl
.390 .378 .305 .06 -.18 -.0006 .12 .58
3.6 Empirical Results
Country level Productivity and Firm-size Regressions
3.6.1.1 Firm turnover and Firm productivity:
Using Fixed Effects Estimation (FEM) to minimize country specific effects, as
well as controlling for country specific variables influencing productivity, the
results for the regression for the 32 European economies between 2000-2012 are
listed in Table 3.4. The first two columns report regression results for equation
(1). The first column lists the impact of firm-size turnover on country
productivity at an aggregated level encompassing all core innovative sectors,
with the second column listing results for firm-size turnover at the detailed sub-
sector aggregated level. The next two columns list the results of the regression
for equation (2). The third column, showing the impact of firm-size turnover and
firm-size productivity on country productivity at again the aggregated level
encompasses all core innovative sectors, while the fourth column lists results for

Chapter 3 96
regression conducted at a sub-aggregated sector level. Due to insufficient data
for many sectors in 2002, it appears to drop out of the regressions, with year
dummies reflecting shocks relative to reference dummy of year 2000.
Besides the firm-size turnover and firm-size productivity indicators, the
regression includes gross capital formation, employment as a percentage of
population, export as a percentage of GDP, lending interest rate and deposit
interest rates. All control variables are significant in column (1), with
employment and lending rate showing a negative coefficient. A negative
coefficient on employment seems to support findings of Gordon & Becker (2008)
that employment may move in opposite directions to labour productivity. For
the rest of the three columns, export is insignificant while employment and
lending rate continue to show a negative coefficient.
As this study assesses the importance of firm-size structures on country
productivity through the channels of both firm revenue and firm productivity,
initially regressions listed in Table 3.4 are only on firm turnover impact on
country productivity followed by regressions of both firm-size turnover and firm-
size productivity on country productivity. The initial regression examining firm-
size turnover in columns 1 and 2 of Table 3.4 is mainly to build an understanding
of how firms impacts country productivity through channels of revenue, followed
by regressions in column 3 and 4 in Table 3.4 of both channels of revenue and
firm productivity influence on country productivity.
Firm-size turnover is significant for all three firm-sizes in all columns 1, 3 & 4 at
the one percent significance level. Firm-size productivity is however only
significant for the large and small firm-size classification at the aggregated level
in column 3, whereas at sub-aggregated level although small and large firm-size
productivity is mostly found significant in column 4 , this varies across
subsectors.
The firm-size structures in column 1 of Table 3.4 are found to be all significant,
while in column 2 all three firm-sizes are also found significant for most sub-
sectors, when assessed through impact of firm turnovers on country productivity.
As explained earlier, the higher the value of the firm-size coefficient, the
greater the impact of turnover of that size class on unit country productivity. At

Chapter 3 97
first glance, the findings indicate that large firms appear to have a slope
response roughly half to one-third the impact on country productivity compared
to small or medium firms for a unit change in large firm turnover. Furthermore,
as large firm share of value added was found to be 40 percent on average
between 2008-2013 in the EU economy (ECB, 2013), it would appear that the net
impact on the economy of large firms is indeed less than that of small or
medium sized firms. However, this needs to be assessed in context with the fact
that only 0.2 percent of total firms were found to be large firms and they alone
made up the 40 percent of value added share. Hence to perceive the actual
impact of the creation or loss of a large firm in the economy, this slope response
needs to be evaluated in context of the net impact of a firm. Given that this
translates to a magnitude of value added per large firm in the EU economy as
approximately 330 times higher than an SME firm, then the net impact per
creation or loss of a large firm presence could in essence have a much larger
significance on the economy at country level than is implied at first glance from
the slope response. Based on this wider context of ECB survey that on average
the large firms are about 0.2% of total firms, as the data itself does not yield the
number of firms making up large firm turnover, it would appear turnover
influence per large firm can be estimated by dividing slope by 0.2% - making the
actual impact per large firm much larger indeed. Similarly, the effect per firm
for smaller and medium sized (SME) firms requires the slope to be divided by
their total percentage of 99.8%, which would make the slope of SME firms’
influence on country productivity much smaller, thus, establishing an
understanding of the much larger scale of influence of large firm-size revenue on
country productivity relative to both small and medium sized firms’ revenue.
Furthermore, it is notable that R-square is reasonably high in the regression
results, yet it is not necessarily a problem as similar high R2 are found in an
OECD study of use of firm structures impact on country level job creation using
country panel data (Criscuolo et al, 2014), indicating it is not unusual to find
such R2 values in similar types of studies. Indeed, Goldberger attributes only a
modest role to R-square in regressions indicating that ‘… a high R2 is not
evidence in favour of a model and a low R2 is not evidence against it’
(Goldberger, 1978). In fact, Gujarati (2003) puts the emphasis on ensuring model
is correctly specified, which has been attempted in this study.

Chapter 3 98
Table 3.4 FEM of Firm-size Turnover and Firm-size productivity impact on Country Productivity
(1) – Eq (1) (2) – Eq (1) (3) – Eq (2) (4) – Eq (2)
Aggregation Level of Turnover:
Aggregated all core innovative sectors
Sub- aggregated innovative sectors
Aggregated all core innovative sectors
Sub- aggregated innovative sectors
Firm-size Turnover
Firm-size Turnover Firm-size Turnover Firm-size Turnover
Small Firms 6.98 e-8*** (9.66e-9)
5.38e-8*** (1.18e-8) 5.4e-8*** (4.97e-9)
Medium Firms 6.13e-8*** (8.79e-9)
6.87e-8***(9.95e-9) 5.13e-8*** (4.62e-9)
Large Firms 2.41e-8*** (3.68e-9)
2.07e-8*** (4.02e-9) 1.27e-8*** (1.45e-9)
Firm-size Turnover (sub-sectors)
Firm-size Productivity (Turnover per Emply)
Firm-size Productivity (Turnover per Emply) (sub-sectors)
Small Firms .025** (.01)
Medium Firms .0009 (.004))
Large Firms .015**(.006)
Inf & com Inf & com
Small Firms
1.14e-6***(4.3e-7) .057 ***(.019)
Medium Firms
1.95e-6***(7.5e-7) .09*** (.035)
Large Firms
1.37e-6**(5.8e-7) .07*** (.025)
Fin & ins Fin & ins
Small Firms
8.2e-8*(4,5e-8) .001 (.002)
Medium Firms
8.3e-8**(4.05e-8) .002(.003)
Large Firms
2.4e-8***(8.6e-9) .006 (.003)
Arch & Engg Arch & Engg
Small Firms 1.4e-6(2.8e-6) .05 (.06)
Medium Firms 1.3e-6***(5.2e-7) .053*** (.02)
Large Firms 2.6e-6**(1.07e-6) .017 (.03)
Elec & Gas Elec & Gas
Small Firms -1.2e-6**(5.9e-7) -.001 (.002)
Medium Firms -1.1e-7(3.2e-7) -0.001(0.002)
Large Firms -2.5e-8(1,7e-7) -.00007 (.003)
Manufacturing Manufacturing
Small Firms 8.3e-8***(2.1e-8) .03 ***(.009)
Medium Firms
6.2e-8***(1.6e-8) .008(.006)
Large Firms
1.5e-8***(4.4e-9) .01**(.004)

Chapter 3 99
(1) – Eq (1) (2) – Eq (1) (3) – Eq (2) (4) – Eq (2)
Aggregation Level of Turnover:
Aggregated all core innovative sectors
Sub- aggregated innovative sectors
Aggregated all core innovative sectors
Sub- aggregated innovative sectors
Mining & Quarrying
Mining & Quarrying
Small Firms 3.9e-7(9.6e-7) .001(.002)
Medium Firms -9.7e-7***(3.5e-7) -.00009(.001)
Large Firms -1.4e-7***(4.97e-8)
.0003(.002)
Water,Sew & Waste
Water,Sew & Waste
Small Firms 3.7e-6**(1.9e-6) .03***(.01)
Medium Firms 3.1e-6***(1.06e-6) .02**(.01)
Large Firms 2.5e-6**(1.03e-6) .03**(.013)
Tranpt, Stor & com
Tranpt, Stor & com
Small Firms 3.2e-7***(9.3e-8) .03***(.009)
Medium Firms 3.4e-7***(1.1e-7) .0003(.002)
Large Firms 1.1e-7***(2.98e-8) .04***(.01)
Wholesale Trade Wholesale Trade
Small Firms 1.53e-7***(6.07e-8)
.01(.008)
Medium Firms 1.3e-7**(5.3e-8) .01(.007)
Large Firms 2.2e-7**(9.4e-8) .017***(.006)
Observations 192 33,455 186 2,046
No. of groups 3 312 3 57
Obs per group min = 64 min = 7 min = 62 min = 6 avg= 64 avg= 107.2 avg= 62.0 avg = 35.9 max= 64 max= 114 max= 62 max= 80
R-sq within= 0.97 within= 0.9419 within= 0.9738 within = 0.9605 between between = .7147 between between = 0.6047 overall = 0.972 overall = 0.9418 overall = 0.972 overall= 0.9571
Corr (u_i,Xb) -0.0084 -0.0196 -0.0353 -0.0232
Note: The regression equation for column (1) and (2) is country productivity measured by GVA/Emplij= a1GCFij + a2EMPij + a3EXPij+ a4LENDij+ a5DEPij + b1SmallFirmij + b2MedFirmij + b3LgeFirmij + hyear dummies + e (1). While for column (3) and (4) , the equation is country productivity as measured by GVA/Emplij= a1GCFij + a2EMPij + a3EXPij+ a4LENDij+ a5DEPij + b1SmallFirmij + b2MedFirmij + b3LgeFirmij + g1SmallFirmProdij + g2MedFirmProdij + g3LgeFirmProdij + hyear dummies + e (2) Country Productivity is represented by gross value added at factor cost GVA/empl, derived from World Bank national accounts data. To control for country specific productivity influencing aspects, a range of variables are used: GCF is country level gross capital formation sourced from World bank national accounts; EMP is employment to population ratios, sourced from ILO; EXP is export as a %age to GDP sourced from World bank National Accounts;

Chapter 3 100
and credit conditions is captured by lending rate sourced from IMF, while monetary policy is proxied by deposit rate derived from interest rate spread sourced from IMF. Small firms refer to firms with less than 49 employees, medium is less than 249 employees and large is 250+ employees – all as defined by OECD.
*** indicates significance at 1% p-value, ** indicates significance at 5% p-value and * indicates significance at 10% p-value. Standard errors are listed in parenthesis.
To complete the analysis, regressions in column 3 and 4 assess influence of firm-
size structures on country productivity through both channels: firm turnover and
firm productivity, column 3 is aggregated level and column 4 is at sub-
aggregated level. In column 3, all three firm-size turnovers are indeed still
found significant for their influence on country productivity, whereas only large
and small firm-size productivity is found significant. This is to an extent also
reflected at sub-aggregated level in column 4, where small and large firm-size
productivity are predominantly found significant in sub-sectors, though this is
not true for all subsectors. In some subsectors, all three firm-size productivities
are significant, in one sub-aggregated sector only medium class is found
significant, with more often the small and large firm size class productivity
found significant for rest of sub-sectors. These slight variations suggest that
different sectors have differences in how firm productivity impacts country
productivity, although in general even at sub-aggregated level, it appears that
enabling firms to grow to become medium and large firms would be beneficial
for country productivity. As noted earlier, these results hold when controlling for
country specific aspects influencing productivity including trade policy, credit
conditions and monetary policy.
The finding that predominantly small and large firm-size productivity have a
significant influence on country productivity at both aggregated and sub-
aggregated level, is quite important. This echoes the findings of ECB, which
analysed firm-size labour productivity in EU business economy between 2008-
2013 and assessed large firms to have 130% productivity compared to SMEs at
87% (ECB, 2013, p. 42). It thus further corroborates the importance of large firm
presence for building productivity levels in economies. The fact that both small
and large firm productivity is significant underscores Schumpeters’ focus initially
on small (Schumpeter, 1934) and then large firms (Schumpeter, 1942) as drivers
of innovation. Indeed, it appears that the influence of structures on country
productivity is quite intricate, with large and small firms seeming to exert their

Chapter 3 101
influence in a dual capacity, through both turnover and productivity. However
given the ECB (2013) analysis of large firm value-added on average 330 times
SME’s and large firm productivity 130% relative to SME 87%, it appears important
to ensure large firms continue to keep their share in the economic landscape for
maintaining high country productivity.
3.6.1.2 Firm turnover-share:
To properly assess how the size (and hence the expansion or reduction) of
particular firm-size structures impacts country productivity, firm-size classes’
turnover needs to be assessed as a proportion of total turnover. To assess how
the size of small, medium and large firm-size presence in an economy impacts
country productivity, equation (1) is used to regress firm turnover shares on
country productivity. As earlier, these are initially examined separately and then
alongside firm-size productivity. The results are listed in Table 3.5.

Chapter 3 102
Table 3.5 FEM of Firm-size Turnover-share impact on Country Productivity
Aggregation Level of Turnover:
(1) – Eq (1) Aggregated all core innovative sectors
Firm-size Turnover Small Firms Medium Firms Large Firms
-15.8 (10.72) -34.07*** (12.1) 18.07*** (6.995)
Observations 192 No. of groups 3 Obs per group min = 64
avg= 64 max= 64
R-sq within= 0.957 between overall = 0.878
Corr (u_i,Xb) -0.2877
Note: The regression equation for column (1) is country productivity measured by GVA/Emplij= a1GCFij + a2EMPij + a3EXPij+ a4LENDij+ a5DEPij + b1SmallFirmij + b2MedFirmij + b3LgeFirmij + hyear dummies + e . Country Productivity is represented by gross value added at factor cost GVA/empl, derived from World Bank national accounts data. To control for country specific productivity influencing aspects, a range of variables are used: GCF is country level gross capital formation sourced from World bank national accounts; EMP is employment to population ratios, sourced from ILO; EXP is export as a %age to GDP sourced from World bank National Accounts; and credit conditions is captured by lending rate sourced from IMF, while monetary policy is proxied by deposit rate derived from interest rate spread sourced from IMF. Small firms refer to firms with less than 49 employees, medium is less than 249 employees and large is 250+ employees – all as defined by OECD.
*** indicates significance at 1% p-value, ** indicates significance at 5% p-value and * indicates significance at 10% p-value. Standard errors are listed in parenthesis
The findings are quite suggestive. At aggregated sector level as listed in column
1, only large-sized firm intensity is found to be positive for country productivity,
with both small and medium firm-intensities showing a negative contribution
towards country productivity. This latter result is intriguing, as in terms of
actual revenue, small and medium sized firms appear to have about 3 times
larger impact per unit turnover compared to large firms, as listed in Table 3.4.
Yet, perhaps as a consequence that net revenue generated by SMEs is so much
lower on average than large firms (ECB, 2013), their expanded share in the total
economy may not be that positive for country productivity. Perhaps that could
serve to explain the negative impact on country productivity of SMEs, though it
is to be noted that small sized firm intensity is found to be statistically
insignificant. Essentially at aggregated levels, these findings reveal that the size
of large firm presence in an economy, captured through its turnover share, is the
most significant influence on country productivity.

Chapter 3 103
In contrast, the size of the smaller and medium sized firms’ presence in an
economy appears to have a negative influence on country productivity. This
finding, nonetheless has to kept in perspective, as SMEs are well recognized for
their importance on the economy through channels of growth or employment.
Indeed, Beck et al. (2005) found that SMEs play a positive role in delivering
country growth.
These two insights - positive impact of size of large firm presence in an economy
on country productivity versus negative impact of size of smaller and medium
sized firms on country productivity – seem to validate the proposed adapted
Lewis model. This model essentially demonstrates that the size of the large firm
presence in an economy is critical for its influence on country productivity and
that reduction (or expansion) would lead to consequent fall (or rise) of country
productivity. The findings from these regressions appears to support this
proposed mechanism of working of the adapted Lewis model.
In the same vein, further to firm-size structures, the question arises whether
specific sectors or industries could be more relevant for country productivity.
Furthermore, is it the size of sectors or rather sector turnover as determined by
firm structures important, or is sector productivity of greater import for country
productivity? To seek answers to this query, the next section examines the
impact of specific sectors both for their turnover and productivity on country
productivity. This not only could shed some light through isolating industries and
their channel more pertinent to country productivity, it may also provide an
alternative examination at sector level of the influence of firm-sizes structures
on country productivity.
Country level Productivity and Sector Regressions
3.6.2.1 Sector Size and Sector productivity:
The FEM results of analysing specific sector sizes and sector productivities on
country level productivity are listed Table 3.6. Column (1) lists the sectors
turnover coefficients and column (2) lists the coefficient for sector
productivities, measured by turnover per employee. As these variables use CIS
data, the analysis is conducted over the time period of 2000-2012 for the 32

Chapter 3 104
European economies. Sectors found significant for both aspects are highlighted
in column 3.

Chapter 3 105
Table 3.6 FEM of Sector turnover and Sector turnover/Employee on Country Productivity
Sectors
-1 -2 Sectors found significant for both aspects
Sector turnover coefficients
Sector Productivity (turnover/Empl) coefficients
Activities auxiliary to financial services and insurance 8.9e-7*** (2.07 e -07) .0132* (.006) Ö
Advertising and market research 1.41e-6* (8e-07) .0089 (,0197)
Air transport 3.9e-6*** (6.86e-07) (6th highest) -.0022 (.003)
Architectural, engineering and technical activities 1.06e-6*** (1.55e-07) .004 (.014)
Collection, purification and distribution of water 1.12e-6** (5.04e-07) .038*** (.0117) Ö
Computer programming, consultancy and related activities 6.89e-7*** (9.47e-08) .015 (.0104) Ö
Electric power generation, transmission and distribution -6.6e-8(2.93e-07) .001 (.004)
Electricity, gas, steam and air conditioning supply 1.51e-7(1.65e-07) .0002 (.005)
Extraction of crude petroleum and natural gas -7.16e-8 (5.82e-08) .0032*** (.0013)
Financial service activities, except insurance and pensions 1.81e-7*** (3.83e-08) .006(.0045)
Insurance, reinsurance and pension funding 1.10e-7*** (2.69e-08) .005** (.002)
Land transport and transport via pipelines 6.83e-8 (5.66e-08) .078*** (.016) (2nd highest)
Manufacture of basic metals 4.74e-7*** (1.41e-07) .018*** (.004)
Manufacture of basic pharmaceutical products 1.96e-6** (8.91e-07) (10th highest) .017 (.014) Ö
Manufacture of beverages 1.34e-6 (1.15e-06) .024*** (.008)
Manufacture of chemicals and chemical products 1.43e-7*** (3.74e-08) .019*** (.005) Ö
Manufacture of coke and refined petroleum products 2.53e-7*** (8.72e-08) .00003 (.001)
Manufacture of computer, electronic and optical products -6.15e-7** (2.21e-07) (negative) .053*** (.011) (8th highest) Ö
Manufacture of electrical equipment 5.48e-7 (3.52e-07) .03** (.013) Ö
Manufacture of fabricated metal products, except machinery
2.88e-7*** (8.9e-08) (7th highest) .06*** (.011) (4th highest) Ö
Manufacture of food products 2.71e-7*** (6.55e-08) .003 (.011)
Manufacture of furniture 4.01e-6*** (1.62e-06) (5th highest) .03 (.023)
Manufacture of gas; distribution of gaseous fuels 3.7e-7 (5.37e-07) -.001 (.002)
Manufacture of leather and related products 2.98e-6*** (9.4e-07) (8th highest) .064*** (.008) (3rd highest) Ö
Manufacture of machinery and equipment n.e.c. 3.54e-7*** (7.66e-08) .028*** (.009) Ö
Manufacture of motor vehicles, trailers and semi-trailers 2.08e-8 (4.26e-08) .037*** (.007)
Manufacture of other non-metallic mineral products 5.42e-7*** (1.75e-07)
.050*** (.009) (10th highest) Ö
Manufacture of other transport equipment 3.91e-7*** (1.56e-07) .037*** (.007) Ö
Manufacture of paper and paper products 5.49e-7*** (1.84e-07) .035*** (.007) Ö
Manufacture of rubber and plastic products 2.7e-7 (1.13e-07) .059*** (.01) (6th highest)

Chapter 3 106
Sectors
-1 -2 Sectors found significant for both aspects
Sector turnover coefficients
Sector Productivity (turnover/Empl) coefficients
Manufacture of textiles 8.41e-7** (3.78e-07) .081*** (.01)
Manufacture of tobacco products 5.4e-7 (1.12e-
06) .006*** (.002) Ö
Manufacture of transport equipment 5.22e-8 (1.96e-07) .018 (.021)
Manufacture of wearing apparel 9.59e-7*** (3.72e-07) .053*** (.006)
Manufacture of wood and products of wood and cork 7.21e-7* (4.12e-07) .055*** (.011) Ö
Mining of coal and lignite 2.56e-7 (5.34e-07) .024*** (.006) Ö
Mining of metal ores 1.76e-6 (3.58e-06) .009 (.019)
Mining support services -1.38e-6***
(4.41e-07) .023*** (.005)
Motion picture, video and television .000018*** (3.9e-06) -.023 (.015)
Other manufacturing 5.05e-6*** (8.82e-07) (4th highest) -.019 (.024) Ö
Other mining and quarrying 2.97e-6*** (9.49e-07) (9th highest) .032*** (.005) Ö
Other professional, scientific and technical activities 2.36e-6 (2.01e-06) .003 (.027)
Postal and courier services 3.8e-6** (1.73e-06) (7th highest) -.005 (.011)) Ö
Printing and reproduction of recorded media 3.62e-7** (1.72e-07) .082*** (.013) (Highest)
Professional, scientific and technical activities 6.27e-7*** (1.02e-07) -.025** (.011) Ö
Programming and broadcasting activities .000012** (4.93e-06) (3rd highest) -.0003 (.03) Ö
Publishing activities 2.06e-6* (1.25e-06) .022 (.032)
Remediation activities and waste management .000052***
(.000018) (Highest)
-.018 (.02)
Scientific Research and development 3.16e-6*** (6.76e-07) .05*** (.013) (9th highest)
Sewerage .000024*** (6.4e-06) (2nd highest) .003 (.022) Ö
Telecommunications 1.01e-6** (4.91e-07) -.002(.007)
Transportation and Storage 3.12e-7*** (8.31e-08) .0007 (.024)
Warehousing and support activities for transportation 9.61e-7*** (2.17e-07) -.01 (.013)
Waste collection, treatment and disposal activities 2.07e-6*** (4.15e-07) .022*** (.005)
Water collection, treatment and supply 1.82e-6(2.08e-06) .033*** (.009) Ö
Water transport 1.94e-6*** (3.86e-07) .003 (.0058)
Wholesale and retail trade, repair of motor vehicles 1.62e-8***
(4.48e-09) .023*** (.004)
Wholesale trade, except of motor vehicles and motorcycle 7.85e-8***
(1.40e-08) -.0004 (.005) Ö
No. of Obs 2,313
No of groups 59
Obs per group Min = 8

Chapter 3 107
Sectors
-1 -2 Sectors found significant for both aspects
Sector turnover coefficients
Sector Productivity (turnover/Empl) coefficients
Avg = 39.2
Max = 61
R-sq
Within = 0.9743
Between 0.8581
Overall = 0.9711 Corr (u_i, Xb) -0.0442
Note: The regression equation for this regression is yij= a1GCFij + a2EMPij + a3EXPij+ a4LENDij+ a5DEPij + b1SectorShareij + … + b60Sector Shareij + g1SectorProdij + … + g60SectorProdij + hyear dummies + e (3) , with similar control variables as explained in previous regression
*** indicates significance at 1% p-value, ** indicates significance at 5% p-value and * indicates significance at 10% p-value.
The coefficient or slope-response of sector turnover measures the ratio of
country productivity to sector turnover or size of revenue, whilst the sector
productivity coefficient or slope-response measures the ratio of country
productivity to sector productivity. For both coefficients, the higher the
coefficient value, the greater is the impact on country productivity for a unit
change of sector turnover (or sector productivity).
As in the earlier regressions, alongside sector turnover and sector productivity
indicators, the regression includes controlling variables of gross capital
formation, employment as a percentage of population, export as a percentage of
GDP, lending interest rate and deposit interest rates. All controlling variables
are found significant in the regression, again with employment and lending rate
having a negative coefficient for their impact on country productivity. A
negative coefficient on employment yet again appears to supports propositions
by Gordon & Becker (2008) that employment for advanced economies may move
in opposite direction to labour productivity.
The overview reveals that sectors differ in their contributions to country
productivity. The sectors found significant for turnover listed in column (1) are
not necessarily accompanied by significance of that sector’s turnover per
employee listed in column (2). The sectors with both overlapping sector
turnovers contribution, as well as sector productivity as measured by turnover
per employee, are indicated in column (3). Observing the higher impact sectors,
as suggested by the coefficient size, the difference in sector results suggests

Chapter 3 108
that the channels through which sectors influence the economy may be
different. The coefficient size can suggest the relative influence level of sectors
in terms of either size of revenue or productivity on country productivity.
Furthermore, it is to be noted, that no comparisons may be drawn from these
results differentiating the impact of these two channels on country productivity.
To evaluate net responses of sectors on country productivity, a similar caution
has to be exercised by placing coefficients in context alongside the actual size of
sectors. Sectors with smaller coefficients or slope responses may exert a larger
influence on country productivity based on the net impact incorporating size and
slope response. While the listing of the net impact of sizes of sectors for the 32
EU economies for the time period 2000-2012 is outside the current scope of this
study, it implies there should be caution in drawing conclusion based on
coefficients alone. However, it is somewhat surprising that sectors, such as
financial services, basic pharma, transport and storage and telecommunication
sectors are not found significant for their productivities. In contrast, their sector
turnovers are found significant. This implies they do not seem to exert influence
on country productivity through firm productivities, rather only through their
turnover. Given that all three firm-sizes are important for turnover, in particular
with large firms found to contribute disproportionately higher magnitude of
turnovers, this invites further research on the role of structures in these
particular sectors.
These sector results may be contrasted with slightly different FEM sector
turnover and productivity results displayed in Table 3.7. Although this regression
covers the 32 European economies again, it is regressed over a shorter time
period, i.e. 2008-2012. Further, this regression measures sector productivity
more accurately through the measure GVA/employee through use of SBS data.
However, as SBS data is restricted to 2008-2012, the period of analysis is shorter
and certain sectors are dropped as data not available in SBS data, the
comparison should be viewed with caution. Column (1) lists the sector turnover
coefficients and column (2) the coefficients of sector productivity as measured
more accurately by GVA per employee. Column (3) again indicates sectors found
to be significant in both sector turnover and sector productivity to country
productivity.
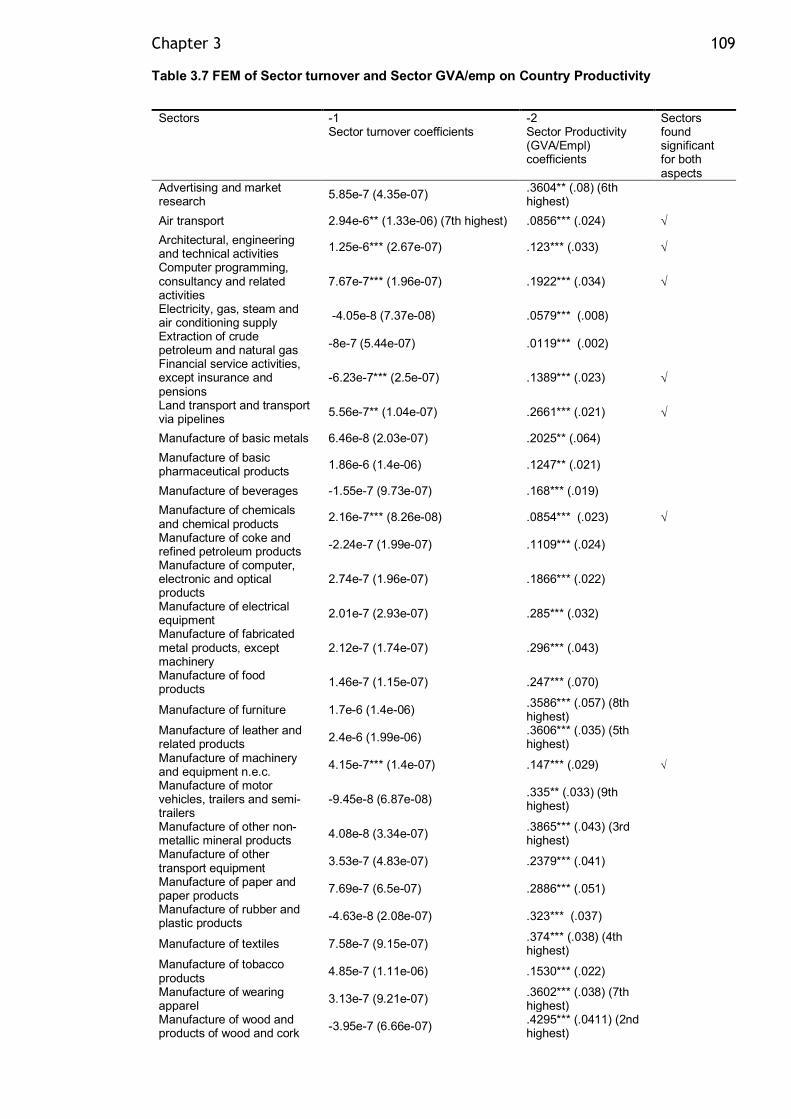
Chapter 3 109
Table 3.7 FEM of Sector turnover and Sector GVA/emp on Country Productivity
Sectors -1 Sector turnover coefficients
-2 Sector Productivity (GVA/Empl) coefficients
Sectors found significant for both aspects
Advertising and market research 5.85e-7 (4.35e-07) .3604** (.08) (6th
highest)
Air transport 2.94e-6** (1.33e-06) (7th highest) .0856*** (.024) Ö Architectural, engineering and technical activities 1.25e-6*** (2.67e-07) .123*** (.033) Ö Computer programming, consultancy and related activities
7.67e-7*** (1.96e-07) .1922*** (.034) Ö
Electricity, gas, steam and air conditioning supply -4.05e-8 (7.37e-08) .0579*** (.008)
Extraction of crude petroleum and natural gas -8e-7 (5.44e-07) .0119*** (.002)
Financial service activities, except insurance and pensions
-6.23e-7*** (2.5e-07) .1389*** (.023) Ö
Land transport and transport via pipelines 5.56e-7** (1.04e-07) .2661*** (.021) Ö
Manufacture of basic metals 6.46e-8 (2.03e-07) .2025** (.064)
Manufacture of basic pharmaceutical products 1.86e-6 (1.4e-06) .1247** (.021)
Manufacture of beverages -1.55e-7 (9.73e-07) .168*** (.019)
Manufacture of chemicals and chemical products 2.16e-7*** (8.26e-08) .0854*** (.023) Ö Manufacture of coke and refined petroleum products -2.24e-7 (1.99e-07) .1109*** (.024)
Manufacture of computer, electronic and optical products
2.74e-7 (1.96e-07) .1866*** (.022)
Manufacture of electrical equipment 2.01e-7 (2.93e-07) .285*** (.032)
Manufacture of fabricated metal products, except machinery
2.12e-7 (1.74e-07) .296*** (.043)
Manufacture of food products 1.46e-7 (1.15e-07) .247*** (.070)
Manufacture of furniture 1.7e-6 (1.4e-06) .3586*** (.057) (8th highest)
Manufacture of leather and related products 2.4e-6 (1.99e-06) .3606*** (.035) (5th
highest)
Manufacture of machinery and equipment n.e.c. 4.15e-7*** (1.4e-07) .147*** (.029) Ö Manufacture of motor vehicles, trailers and semi-trailers
-9.45e-8 (6.87e-08) .335** (.033) (9th highest)
Manufacture of other non-metallic mineral products 4.08e-8 (3.34e-07) .3865*** (.043) (3rd
highest)
Manufacture of other transport equipment 3.53e-7 (4.83e-07) .2379*** (.041)
Manufacture of paper and paper products 7.69e-7 (6.5e-07) .2886*** (.051)
Manufacture of rubber and plastic products -4.63e-8 (2.08e-07) .323*** (.037)
Manufacture of textiles 7.58e-7 (9.15e-07) .374*** (.038) (4th highest)
Manufacture of tobacco products 4.85e-7 (1.11e-06) .1530*** (.022)
Manufacture of wearing apparel 3.13e-7 (9.21e-07) .3602*** (.038) (7th
highest)
Manufacture of wood and products of wood and cork -3.95e-7 (6.66e-07) .4295*** (.0411) (2nd
highest)

Chapter 3 110
Sectors -1 Sector turnover coefficients
-2 Sector Productivity (GVA/Empl) coefficients
Sectors found significant for both aspects
Mining of coal and lignite 8.05e-8 (8.41e-07) .134 (.083)
Mining of metal ores -.0002 (.000017) -113 (.19)
Mining support services 8.37e-7*** (2.55e-07) .0462***(.004) (4th highest) Ö
Motion picture, video and television
.000022*** (3.64e-06) (2nd highest) -.036 (.04)
Other manufacturing 1.87e-6* (1.14e-06) (9th highest) .3198*** (.054) Ö
Other mining and quarrying 2,41e-7 (2.97e-06) .194*** (.043)
Other professional, scientific and technical activities 1.32e-6** (6.04e-07) .1947*** (.083) Ö
Postal and courier services 1.86e-6** (5.49e-07) .509*** (.047) (highest)
Printing and reproduction of recorded media
1.66e-6** (6.01e-07) (10th highest)
.333*** (.087) (10th highest)
Professional, scientific and technical activities 6.40e-7*** (1.57e-07) .0498 (.043)
Programming and broadcasting activities
.000019*** (3.63e-06) (3rd highest) -.008 (.073)
Publishing activities 1.4e-6 (1.21e-06) .187*** (.079)
Remediation activities and waste management .000029** (.000015) (highest) .131* (.066) Ö
Scientific Research and development 3.95e-6* (1.08e-06) (6th highest) .314*** (.044) Ö
Sewerage .000015*** (4.87e-06) (4th highest) .219*** (.052) Ö
Telecommunications 1.96e-7 (3.07e-07) .109** (.012)
Transportation and Storage 2.7e-7*** (5.49e-08) .1695*** (.045) Ö Warehousing and support activities for transportation 6.64e-7*** (1.67e-07) .128*** (.038) Ö
Waste collection, treatment and disposal activities 1.22e-6** (5.05e-07) .253*** (.043) Ö Water collection, treatment and supply 3.55e-7 (1.7e-06) .146*** (.019)
Water transport 3.43e-6** (1.46e-06) (5th highest) .0383*** (.036) Ö Wholesale trade, except of motor vehicles and motorcycle
4.65e-8** (1.78e-08) ..183*** (.051) Ö
No. of Obs 1224
No of groups 52
Obs per group Min = 5
Avg = 23.5
Max = 38
R-sq Within = 0.9874
Between 0.9152
Overall = 0.9832
Corr (u_i, Xb) -0.0589

Chapter 3 111
Given this caution in comparison, nonetheless the difference in the lists of
sectors significant for turnover and productivity on country productivity is quite
remarkable. Firstly, there is a substantial decrease in the listing of sectors
significant for turnover, with previously significant sectors with high slope
responses such as basic pharma, furniture, leather and other mining and
quarrying found to be insignificant. Secondly, only five of the sectors within
the10 highest slope responses for turnover overlap with the previous list.
Thirdly, while sectors significant for productivity are not substantially reduced,
again the listing of the sectors with the 10 highest slope responses is different.
In this case,six of the sectors with the highest slope response for productivity
overlap with the previous list. As the time period of analysis is shorter and
certain observations may lose their weight, it is not a straightforward
comparison. Notwithstanding this caution, it is to be noted that the list of
sectors found significant for both their turnover and productivity on country
productivity is diminished.
These results have two pertinent implications. Critically, they suggest that
turnover per employee, despite its similar correlation to country productivity, is
limited in its role as proxy for sector productivity as measured by GVA per
employee. Secondly, the results further substantiate the earlier conclusion that
sectors differ in their channels of influence on country productivity. Size of
revenue appears to remain a valid and separate channel of influence from sector
productivity on country productivity.
Essentially, both these detailed sector regressions deliver two findings. Firstly,
these results indicate that not all core innovative sectors contribute equally to
country productivity. Certain industries or sectors appear to have a greater
influence on country productivity. Specifically, sectors appear to differ in the
manner in which they exert an influence, either through productivity or size of
revenue. There, however, appears to be a set of sectors that contributes both
through aspects of sector turnover and productivity. To discern whether that
makes those sectors of greater import for country productivity is beyond the
current scope of this study. Further research would be required to ascertain the
actual size of turnovers of those sectors in economies and assess net impact
through evaluating the slope responses in context with the size of sectors.
Nonetheless, the key finding that sectors exert influence through dual channels

Chapter 3 112
of size and productivity has critical implications, as it brings firm structures
alongside factors of production into the core of the debate surrounding
productivity.
3.6.2.2 Sector Share and Sector productivity:
Before concluding this section on sector analysis, we perform one more set of
regressions: sector share and sector productivities on country level productivity.
Sector share is defined by sector turnover as proportional to total core
innovative sector turnover. Sector shares essentially neutralize the size of the
sector or its weight in the economy, enable measuring the impact of a unit
percentage change of the sector on country productivity, irrespective of size of
the sector. This basically enables capturing which unit shifts of sectors, be they
smaller or larger dominant sectors, influence country productivity. Identifying
those unit shifts with the most significant impact on country productivity could
enable policymakers to support those shifts, irrespective of its current size or
firm structures. To recap, sector size assesses the original Lewis model
proposition that shifting resources across sectors influences country productivity
positively by expanding sector sizes of those sectors. In comparison, sector share
examines which unit change of a sector, irrespective of its size, influences
country productivity most significantly, in effect refining the Lewis model to
examine whether changing weightage of sectors in an economy influences
country prouctivity. Thus, using sector shares in the regression allows this study
to examine whether a unit shift in the relative proportional size of sectors, as
opposed to size itself as examined earlier, is of consequence to the labour
productivity of an economy.
The FEM results analyzing sector shares and sector productivities on country
level productivity using equation (3), with similar controls as in previous
regression are listed Table 3.8. Column (1) lists the sector share coefficients and
column (2) lists the coefficient for sector productivities, measured by turnover
per employee. As these variables again use CIS data, the analysis is conducted
over the time period of 2000-2012 for the 32 European economies. Sectors found
significant for both aspects are highlighted in column 3.

Chapter 3 113
Table 3.8 FEM of Sector turnover and Sector turnover/Employee on Country Productivity
Sectors -1 Sector turnover coefficients
-2 Sector Productivity (turnover/Empl) coefficients
Sectors found significant for both aspects
Activities auxiliary to financial services and insurance 535.41** (213.76) .011 (.009)
Advertising and market research 336.9 (727.9) .034** (.017)
Air transport -134.95* (84.3) (negative) .0047 (.0035)
Architectural, engineering and technical activities 197.69 (148.65) .05** (.011)
Collection, purification and distribution of water -64.20 (262.3) .051***
Computer programming, consultancy and related activities 437.1*** (165.8) -.0019 (.0207)
Electric power generation, transmission and distribution -65.3 (55.82) .001 (.002)
Electricity, gas, steam and air conditioning supply
-97.41*** (33.03) (negative) .005** (.003) Ö
Extraction of crude petroleum and natural gas -1.92 (14.09) .002* (.001)
Financial service activities, except insurance and pensions -29.65** (12.12) (negative) .019*** (.005) Ö
Insurance, reinsurance and pension funding 97.27*** (35.9) .004 (.003)
Land transport and transport via pipelines -75.16** (31.7) (negative) .098*** (.013) Ö
Manufacture of basic metals -91.05*** (35.49) (negative) .024*** (.0045) Ö
Manufacture of basic pharmaceutical products 122.37 (209.6) .039*** (.01)
Manufacture of beverages 139.7 (283.07) .031*** (.009)
Manufacture of chemicals and chemical products 79.28* (41.95) .023*** (.005) Ö
Manufacture of coke and refined petroleum products -57.8*** (22.35) (negative) .0023** (.0009) Ö
Manufacture of computer, electronic and optical products
-107.03*** (34.37) (negative) .044*** (.009) Ö
Manufacture of electrical equipment -189.89** (94.52) (negative) .035*** (.01) Ö
Manufacture of fabricated metal products, except machinery -126.02** (53.5) (negative) .08*** (.01)
Ö
Manufacture of food products 94.4** (40.7) .035*** (.008) Ö Manufacture of furniture -41.57 (173.72) .073*** (.02)
Manufacture of gas; distribution of gaseous fuels 34.8 (68.76) -.003 (.001)
Manufacture of leather and related products 339.18 (239.85) .07*** (.01)
Manufacture of machinery and equipment n.e.c. 14.32 (45.27) .051*** (.008)
Manufacture of motor vehicles, trailers and semi-trailers
-63.34*** (19.17) (negative) .047*** (.007) Ö
Manufacture of other non-metallic mineral products
-401.76*** (111.5) (negative) .047*** (.009) Ö
Manufacture of other transport equipment 91.61 (96.25) .044*** (.007)
Manufacture of paper and paper products -53.67 (61.75) .048*** (.007)
Manufacture of rubber and plastic products -114.79 (71.27) .067*** (.01)

Chapter 3 114
Sectors -1 Sector turnover coefficients
-2 Sector Productivity (turnover/Empl) coefficients
Sectors found significant for both aspects
Manufacture of textiles -212.63 (148.3) .083*** (.011)
Manufacture of tobacco products -592.78*** (204.83) (negative) .005* (.002)
Ö
Manufacture of transport equipment -40.62 (73.57) .039 (.034)
Manufacture of wearing apparel -27.11 (89.31) .053*** (.007)
Manufacture of wood and products of wood and cork
-102.96*** (36.09) (negative) .064*** (.01)
Ö
Mining of coal and lignite -80.50 (182.39) .023*** (.007)
Mining of metal ores -558.92** (260.34) (negative) .021 (.015)
Mining support services -388.67*** (145.76) (negative) .02*** (.004)
Ö Motion picture, video and television -672.69 (2329.04) .022 (.02)
Other manufacturing 753.48 (566.7) -.012 (.026)
Other mining and quarrying -558.82 (469.05) .035*** (.005)
Other professional, scientific and technical activities 959.61 (1421.79) .015 (.028)
Postal and courier services -675.002 (905.88) .02*** (.005)
Printing and reproduction of recorded media -1.42 (120.59) .096*** (.013)
Professional, scientific and technical activities 246.17*** (81.57) -.011 (.013)
Programming and broadcasting activities -609.9 (991.88) .06 (.019)
Publishing activities -294.87 (335.63) .077*** (.0165)
Remediation activities and waste management 3691.59 (3385.2) .029*** (.018)
Scientific Research and development 242.89 (446.82) .063*** (.015)
Sewerage 2642 (2389.3) .054*** (.019)
Telecommunications -313.26*** (89.4) (negative) .006 (.005)
Transportation and Storage 3-15.25 (25.02) .077*** (.016)
Warehousing and support activities for transportation -44.42 (47.96) .039*** (.009)
Waste collection, treatment and disposal activities 192.1 (131.05) .028*** (.006)
Water collection, treatment and supply 709.6 (692.7) .043*** (.0105)
Water transport -113.86 (100.1) .023*** (.006)
Wholesale and retail trade, repair of motor vehicles 15.3 (11.69) .029*** (.006)
Wholesale trade, except of motor vehicles and motorcycle 1.79 (11.99) .018*** (.0042)
No. of Obs 2,297 No of groups 59
Obs per group Min = 8
Avg = 38.9 Max = 61
R-sq Within = 0.9695
Between 0.6259 Overall = 0.9573
Corr (u_i, Xb) -0.1136 *** indicates significance at 1% p-value, ** indicates significance at 5% p-value and * indicates significance at 10% p-value. Values in parenthesis are standard errors.

Chapter 3 115
The coefficient or slope-response of sector share measures the unit change of
each sector’s weight in the economy on country productivity. On the other hand,
sector productivity coefficient is same as in earlier regressions and measures the
slope-response of country productivity to sector productivity. For both
coefficients, the higher the coefficient value, the greater is the impact on
country productivity for a unit change of sector turnover (or sector
productivity).
As stated earlier, in essence the sector share examines which unit change of a
sector, irrespective of its size, influences country productivity most
significantly, in effect refining the Lewis model to examine whether changing
weightage of sectors in an economy influences country productivity. Comparing
these results of sector share as listed in table 8 to sector turnover in table 6,
certain differences are immediately apparent. Firstly, there are far fewer
significant sectors impacting country productivity through the unit change in the
size of their relative share, in contrast to a higher number of sectors that
impacted country productivity directly through their turnover. Secondly, a large
number of the significant sectors for their relative size appear to influence
country productivity negatively. A few conclusions can perhaps be drawn from
these results. Primarily, it appears that the relative unit change of sectors may
be less important than actual size of turnover when examining influence on
country productivity. This seems to draw attention to the makeup of sectors and
the aspects driving the turnover of size of sectors, rather than an indiscriminate
focus on relative size of sector in an economy. Factors such the type of
innovation determining turnover in those sectors, firm-structures and
consequent productivity may be of greater consequence than its relative size
when examining influence of that sector on country productivity. Secondly, and
more puzzling, is the negative impact of quite a large number of unit change of
relative sector shares on country productivity. The causes for this result would
appear to be outside the current realms of this study, but could indicate that
either dominance or the opposite, too small a relative size of sectors could
detract from country productivity. Both of these results are intriguing and would
benefit from more detailed examination, specifically a study to isolate why and
how relative size of sectors, be it dominance or smallness, can appear to have a
negative impact on country productivity. In essence though the conclusion

Chapter 3 116
remains that sectors appear to influence country productivity both through
sector productivity and sector turnover, in this case through their relative share
in sector turnover.
Overall, these findings provide not only an alternative assessment of the impact
of firm-size structures on productivity; they shed a light on the firm-size
structures relevant to sectors, depending upon the channel through which they
influence country productivity. Sectors with only productivity contributions
would appear to benefit from small and large firm structures. On the other
hand, sector with turnover contributions would appear to require all three firm-
size structures, specifically large-firm structures. Sectors contributions through
relative share in turnover appear to be more complex and would require
assessment beyond the scope of this study, specifically examination of relative
sector dominance or weakness in an economy. As this study is restricted by data
availability and unable to regress firm-size structures at detailed sector level,
further analysis would be required to assess these potential implications.
These results need to be qualified in their findings on a few aspects. Firstly,
although it uses panel data, the time period is essentially short. It is biannual
data over a period of 12 years (2000-2012) and thus limited in its depth of study.
Secondly, although the study controls for country-specific aspects that influence
productivity, it does not provide the depth of an individual country analysis
conducted over a longer period of time. Thirdly, by using Eurostat firm data on
turnover measured on a bi-annual basis, it captures the entries and exits of firms
providing a dynamic picture of the firm presence in sectors. Fourthly, though the
study uses some hard data from World Bank Database (WDI), the study draws
heavily from processing raw data obtained from innovation and business surveys
collected by Eurostat. This has its limitations in the extent and uniformity of
coverage of all sectors, specifically internationally across all 32 economies and
thus the results may suffer from similar limitations. Shortage of data availability
meant that not all variables could be weighted to altogether avoid this disparity.
Lastly, without an endogenity regression to check reverse causality, these results
only confirm that firm-structures are a characteristic of economies with high
productivity levels, not necessarily a determinant of it.

Chapter 3 117
3.7 Conclusion
This study proposed an adapted Lewis model to relate how particular firm-size
classes presence in an economy may influence country labour productivity. In
particular, it proposed that size of large firm-size presence in an economy, is
critical to country productivity and the consequent reduction (expansion) could
lead to a fall(rise) of country productivity.
To assess this relationship, the study examined the influence of firm-size
structures on country labour productivities through two channels: firm turnover
share and firm productivities. Using FEM panel data was examined for 32
European economies over a time period of 2000-2012, across core innovative
structures encompassing both manufacturing and service sectors. Whereas Fixed
Effects Methods (FEM) was used to minimize sector or country specific effects,
an additional array of country-level variables was also used to control for
country-specific aspects that could influence country labour productivity.
The regressions assessed whether firm structures are indeed significant for a
country’s labour productivity economy as proposed in the Lewis adapted model,
and if so, which firm-size structures? It also examined whether large or small
firm-size structures are relevant for country level productivity, irrespective of
their firm productivities. These firm-size structures were assessed for their
influence both through turnover share impact on country labour productivity.
The findings reveal that the size of large firm presence in an economy, captured
through its turnover share and firm productivity, is the most significant influence
on country productivity. In contrast, the turnover share of the smaller and
medium sized firms’ presence in an economy appears to have a negative
influence on country productivity, although small firm productivity is found
significant and positive for country productivity. Thus although SMEs are well
recognized in previous research for their importance on the economy through
channels of growth or employment, in terms of country productivity it appears
overall that large firms are of most importance in an economic landscape.
The findings are very suggestive. Substantially they offer these two insights, i.e.
that positive impact of size of large firm presence in an economy on country
productivity versus negative impact of size of smaller and medium sized firms on

Chapter 3 118
country productivity seem to validate the proposed adapted Lewis model. This
model centrally proposes that the size of the large firm presence in an economy
is critical for its influence on country productivity and that reduction (or
expansion) would lead to consequent fall (or rise) of country productivity. The
findings from these regressions appear to support the mechanism of influence of
firms structures on country labour productivity, as proposed in the adapted
Lewis Model.
Although these insights highlight the importance of large firms’ influence on
country productivity, however, the means through which large firms may exert
their influence on productivity is outside the scope of this study. Previous
theoretical insights underscore their financial ability to undertake fixed R&D
costs over a longer period of time, extensive skill training feeding into sector as
a whole, ability to withstand longer product development times and access to
funds for capital investment (Pack &Westphal, 1986; Achs & Audretsch, 1988;
Brown et al., 1990).
This mechanism of the adapted Lewis model on the role of size of large firm
presence in an economy on country productivity, may deliver some insights on
the productivity conundrum currently present in the UK. Specifically, it draws
the spotlight to the UK’s reducing intensity of large firm presence. According to
Van Ark and Monnikhof, the UK had a comparable large firm intensity to
Germany in the 60’s, but this had reached a lower intensity comparable to
France in the late 80’s (Van Ark & Monnikhof, 1996). Though this study’s data
does not contain direct intensity data, using firm turnover share to capture firm
intensity, the UK in 2012 appears to have roughly a third the level of large to
small firm intensity compared to Germany and about 60 percent of that in
France. These figures are only approximations and not accurate enough to lead
to firm conclusions. Nonetheless, they invite future UK firm-level research to
examine carefully how changes in the varied firm size structures in UK over the
decades may have impacted country labour productivity. Specifically, detailed
research examining the means through which this relationship exerts an
influence on country labour productivity.
Furthermore, this study assessed whether sector size and not only sector
productivity was of relevance in determining country labour productivity. The

Chapter 3 119
analysis revealed size indeed to be important for some sectors, whilst sector
productivity appeared significant for other, with a few sectors retaining both
channels of influence. This was also an interesting result, from two perspectives.
Firstly, if sector size is of import, as indicated, as well as sector productivity,
then future policy making on productivity could best be served by looking at
both these aspects. Secondly, this finding has possible implications for firm-
structures most suited to sectors depending upon their mode of influence.
Though needing further corroborations, the implication is that sectors
influencing through size would benefit most from presence of turnover
contributions of all three firm-size structures. In contrast, sectors contributing
through sector productivity may benefit from a higher intensity of large firms in
that sector. These implications were outside the scope of the current study, due
to limitations of firm-structure classification at detailed sector level data.
Should that data become available in the future, these implications could be
corroborated allowing future policy support of firm-structures to be shaped in
accordance to mode of influence of sectors.
Lastly, this study also examined whether sector share, the proportion of a
sectors turnover share to total core innovative sectors turnover, as distinguished
from sheer size of sector also exerts an influence on country productivity. In
essence, sector share examines which unit change of a sector, irrespective of its
size, influences country productivity most significantly, in effect refining the
Lewis model to examine whether changing weightage of sectors in an economy
influences country productivity. The results indicate that unit change of some
sectors is significant for country productivity, although comparatively fewer
sectors than those found significant for size of turnover. It would appear that
focussing on size of sectors, as proposed in Lewis model is relatively of greater
importance than consideration of the change of relative weight of a sector in the
economy. Nonetheless, what is puzzling is that of those sectors found significant
in terms of share, quite a large number appeared to have a negative influence
on country productivity. Although isolating the cause for this result is outside the
scope of the study, this could be indicative of a negative impact through either
dominance or conversely weakness of sectors proportional to the total
innovative sectors. Further in-depth research would be needed to assess whether
this is or is not an issue for country productivity.

120
Chapter 4 Why does the UK not have its own Google, let alone a new ARM - does firm independence matter?’ An assessment of how firm independence and tax, financing and regulatory policy incentives are impacting firm growth in UK
4.1 Abstract
The UK is considered globally successful at generating innovative start-ups. Yet,
despite this abundance of innovative start-ups, why has not even a single one of
them scaled up and gone on to become at least one of the new future Googles of
UK or a new ARM? That is the key question.
This chapter examines whether firm independence, previously not considered
critical for firm growth, may indeed be an important criterion to enable scale up
of innovative firms into successful frontier large firms. To shed light on the role
of independence, the study examines the drivers of firm growth and the policy
tools used to support tax & financing incentives along with M&A activity drive
firm growth – with innovative independent firms separately assessed from overall
innovative firms. Using firm level dataset for all UK sectors between 2006-2016,
policy tax and financing tools supporting start-up, growth and merger activity
are examined alongside growth theory drivers, globalization and monetary
lending policy. The empirical analysis reveals that independent firms reap much
higher growth, with age of independence delivering a bonus growth-dividend.
Firm independence appears to be one of the most vital aspects for growth – an
aspect neither enhanced nor specifically protected in current policy.
Other findings reveal that lower corporate tax rates promote innovative firms,
though general firms can grow despite increased rates. Access to seed and
venture capital was found positive both general and innovative firm growth,
specially SMEs. The verdict on mergers and acquisitions (M&A) was slightly
mixed, with M&As positive for general and innovative firms, though they do no
drive innovative SMEs – only large innovative firms and general SMEs.

Chapter 4 121
4.2 Introduction
Why has Europe not given birth to a significant tech company in the past 30
years, except ARM?, to paraphrase Michael Moritz’s query (Moritz, 2016).
Scrutinizing the 40 most valuable tech companies in Europe formed over the last
25 years, Moritz observed that ARM Holdings, a UK firm, was the sole European
entrant. Although Moritz’s observations were perhaps directed towards a
defence of American tech companies, the question remains valid. Ironically,
however, a few months after Moritz’s question, the UK high tech firm ARM was
taken over by a Japanese firm (BBC News, 2016). Even though ARM may have
been the only British tech company in the top 40 by valuation created over the
last few decades, it was not the only tech company sold to foreign ownership. In
fact, there have been other potentially significant UK frontier technology
companies created across that same period that were sold before they appeared
to reach full potential - DeepMind, CSR, Swiftkey or Skyscanner, to name but a
few.
It was however the sale of ARM holdings that provoked some outcries directed at
the incoming prime minister, Theresa May, to reassess this potential takeover
(Guardian, 2106), which also led to talks on revival of industrial policy with
specific new national interest tests to vet foreign takeovers of UK firms
(Financial Times, 2016). National interest tests to vet takeovers would not be
unique to UK. Countries such as US have their own foreign takeover vetting
system in the form of the Committee on Foreign Investment CFIUS (Jackson,
2016), as does Australia with its Foreign Investment review board (Ghori, 2015),
amongst some other advanced nation states. As a point of fact, public interest
tests were part of UK law earlier, until they were removed by the Enterprise Act
2002 (Elks, 2014). Indeed, this issue of public interest tests was also raised
earlier in the UK during a potential foreign takeover bid by Pfizer for UK’s
second largest pharmaceutical firm AstraZeneca (Miliband, 2014). This issue was
raised yet again by Unilever in its fight to stay independent against a hostile bid
from Kraft-Heinz (FT, 2017). Unilever’s urgings to reshape the UK takeover code,
which in contrast to that of the Netherlands leaves firms far more exposed, were
met by the government “with official shrugs” (FT, 2107). It appears that
Unilever’s recent decision to rebase its headquarters to Netherlands could be
partly rooted in the greater protection afforded to firms in Netherlands from

Chapter 4 122
hostile takeovers (FT, 2018), bringing the issue of firm independence and
mergers and takeovers to the fore. As GKN, another well-established aerospace
UK firm, currently strives to defend itself against a hostile takeover (FT, 2018),
it appears that the issue of independence cannot be ignored. Is independence
then indeed critical to the growth of the firm and could it be one element in a
complex puzzle to explain why UK has only managed to create one significant
tech firm by market valuation over the last few decades. What has prevented UK
from creating the global giants of today – and does independence matter?
It is this very question that this study aims to shed light upon. Answering it
requires understanding firm growth at both ends of the spectrum. At one end,
understanding the key growth drivers for small and medium sized firms (SMEs)
and at the other end, understanding the key drivers for continued growth or
rejuvenation of large UK firms. To put the importance of addressing both ends of
this spectrum into perspective, it is perhaps best to understand the current
position of both SMEs and large firms in the UK economy.
UK has quite an impressive position for generating innovative start-ups in the
world. While the UK ranks 9th in the world on Global entrepreneurship index
(GEI) for quality innovative start-ups in 2016, it was placed 4th in 2015 (GEDI ,
2016). On the other hand, it ranks quite a bit lower, in fact 26th, on the GEI’s
finer scale of scale-up quality of start-ups. This scale, which measures quality of
growth for start-ups/SMEs over 5 years, appears to capture a weakness in UK’s
scaling up ability of SMEs (ibid). This compares to US position as 1st in this
measure, with France and Germany in 12th and 15th position respectively. An
OECD analysis assessing start-up survival rates across 18 OECD countries, also
found that only 5% of UK’s micro firms still grew after 3 years (Criscuolo, Gal, &
Menon, 2014). This scaling up weakness of UK start-ups is coupled with large
firms diminishing on the UK economy landscape. Appraising large firm share in
the UK’s economy, OECD analysis revealed a decreasing trend in large firm share
starting from the 1970’s, which proceeded into the 1990’s (Van Ark & Monnikhof,
1996). This trend was observed to continue by UK’s business, innovation and
skills (BIS) department reporting that large firm share in UK economy was 8
percent lower in 2013 compared to 2000 levels (BIS, 2013). However, the latest
BIS figures appear to show a reversal of this trend, with current large firm share
in economy in 2016 having risen back to 2000 levels of 0.13% share of large firm

Chapter 4 123
in economy (BEIS, 2016). Albeit positive that it has recovered to 2000 levels, it is
perhaps important to realize that UK ‘s current large firm share of 0.13%
compares to US large firm share of 0.81% in 2011 (SBA , 2016). That comparison
reveals UK to have quite a gap, possibly as large as a factor 6-7 lower than the
US. Given that current OECD analysis suggests US large firm share has continued
to grow in 2016 (OECD, 2016), this gap could conceivably grow larger. To
understand why this may matter – either a weakness in scaling up SMEs or a
diminishing large firm share, it is perhaps best to understand how the landscape
of firm-sizes in an economy relates to the two central pillars of UK’s growth:
productivity and innovation.
One of the challenges facing UK economy since the 1970’s has been its lower
productivity levels amongst the G-7, which have lagged behind those of France,
Germany and US (Harari, Number 06492, 2016). This could be viewed as
detrimental in the long run, as economic development models appear to stress
that not capital, but rather productivity is the long run driver of growth (Lewis
A. , 1954) (Gollin, 2014). Gollin indeed emphasizes the central role of resource
allocation in generating productivity (Gollin, 2014). Around a similar period as
Lewis, analysing growth models, Solow concluded that innovation was the most
important factor by far in explaining long term economic growth (Solow, 1956).
As productivity and innovation are viewed as complementary to each other,
though often accompanied by a lag (Tunzelmann G. V., 2000), these theories and
understanding of growth drivers are not contradictory. Previous research has
shown that firm-sizes can play a critical role in shaping both innovation and
productivity, the two driving pillars of growth in the long run.
The earliest research on firm size impact on innovation can be traced to an
Austrian economist Joseph Schumpeter, who viewed firm size as one of the key
elements influencing both these aspects (Schumpeter, 1934; Schumpeter, 1942).
Schumpeter questioned which firm size was critical in driving innovation,
initially emphasizing small firms (1934) and later advocating the critical role of
large firms (1942). Subsequent research has shown that firm sizes play a complex
role in innovation (Bhattacharya & Bloch, 2004; Achs & Audretsch, 1988).
Although in terms of productivity, large firms were generally found to have
higher productivity (Van Ark & Monnikhof, 1996; Van Biesebroeck, 2005; ECB,
2013), small firms have been found to be more productive in certain sectors

Chapter 4 124
(Snodgrass & Biggs, 1996). A recent study examining firm-size share impact on an
economy also found that large firm presence was significant in shaping country
level labour productivity (Bradley, 2016). Although not conclusive, evidence does
appear to support the importance of large firm share in an economy to drive
productivity, with the presence of both small and medium sized firms important
for employment and growth (Beck et al., 2005; World Bank, 2004; World Bank,
2002). Given this importance of firm-sizes to both innovation and productivity,
but specifically large firm size impact on productivity - the query as to why UK
has not been able to grow global innovative titans in frontier technology sectors,
be it creative, science or digital sectors acquires even greater significance.
Thus, this study seeks to understand why UK has not produced the new
innovative giants of tomorrow through analysing whether firm independence
matters - and how this fits in alongside tax & financing incentives and M&A
activity: policy tools which drive firm growth. The aim here is to determine how
independence or policy tools influence firm growth and to distinguish
insufficiencies in incentives or regulation currently, which may partially explain
UK’s lack of frontier firm giants. Specifically, the idea is to distinguish factors
having an impact on innovative firms, although overall firms are analysed as a
starting point. The question, put in other words, is whether these various policy
initiatives over the last few decades in UK could have inadvertently shaped the
current UK economy – perhaps boosting the creation of innovative start-ups like
DeepMind (Shead, 2016), but not sufficient to support firms to last the distance
to scale up to create the Googles itself? Furthermore, as the sale of potential
successful innovative UK firms before reaching their potential, which is a part of
M&A activity, appeared to be of relevance to this issue - it became important to
identify the impact of this firm characteristic – independence on firm growth. To
identify the influence of independence, the growth reaped from basic growth
drivers was examined relative to overall firms. As research is currently largely
absent on the influence of firm independence on firm growth, this appeared to
be an important void for this study to fill. Hence, the main contribution of this
study is to understand the influence of independence on firm growth – which
allows the value of the various growth policy tools to be put in context and thus
to enable re-assessment of insufficiencies or shortcomings in the current policy

Chapter 4 125
toolkit, something which is important as independence is currently neither
protected nor specifically supported in growth policy.
In order to understand this influence of policies and independence on firm
growth, this study measures firm growth through revenue growth, one of the
OECD defined measures of firm growth (OECD,2005). Previous studies have
scrutinized some of the tax and financing policy tools impact on other firm
aspects (Devereux & Maffini, 2006; Gemmel et al., 2010; Achleitner et al., 2012;
Wright et al.,2009), but not revenue growth. However, as this study seeks to
understand what enables the growth of firms to become the innovative giants of
tomorrow, the various policy tools are examined for their impact on firm
revenue growth.
To enable putting the value of independence on firm growth in context with
other growth policy tools, it is first required to measure the influence of these
policy tools on firm growth. The first tax policy tool or incentive considered for
its influence on firm growth is corporate tax. Analysing its influence on firm
growth seems particularly relevant, as UK has viewed it as one of the key policy
measures to promote firm growth. So much so, that UK has been near the
forefront in lowering corporate tax in G7 countries over the last decade,
although it is not the only OECD country vying to lower this tax (Devereux &
Vella, 2014). As a point of fact, UK’s corporate tax at 29% in 2009 was the
second lowest statutory rate amongst the G7 (Griffeth & Miller, 2010), and the
UK rate became the lowest in G7 when it was lowered to 26% by 2012 (Bilicka &
Devereux, 2012). As corporate tax has been considered an important policy tool,
it has drawn valuable previous research, yet this previous research seems not to
have focussed on firm revenue growth. Conducting an extensive review,
Devereux & Maffini classify the focus of various corporate tax studies on
assessing the impact on location of capital, firm production and firm profits
(Devereux & Maffini, 2006). Furthermore, corporate tax has been examined for
its influence on investment, productivity and innovation as measured by total
factor productivity (TFP) (Vartia, 2008; Grubert & Mutti, 2000; Gemmel et al.,
2010; Devereux et al., 2016). This study, in contrast, seeks to understand if this
policy measure of lowering corporate tax, actually influences the growth of
firms. In particular, it will explore whether lowering of corporate tax will

Chapter 4 126
promote growth of the innovative firms, which could become the frontier giants
of tomorrow.
Another area of tax, also missing previous examination for its impact on firm
growth, are UK’s competitive tax relief incentives around venture capital
investment and capital gains tax. In fact, UK has maintained the lowest capital
gains tax rate amongst G7 economies since 2000, as an incentive to promote
venture capital investment (Achleitner et al., 2012). This low capital gains tax
exists alongside financing incentives to support innovative start-ups, such as the
enterprise investment scheme (EIS) which UK has operated since 1994 (OECD,
2015) or the Venture Capital Trust Scheme (VCT) offering relief to indirect
investments into smaller businesses operational since 1995 (ibid), These have
been further enhanced through the introduction in 2012 of a Seed Enterprise
Investment Scheme (SEIS) (OECD, 2015). Nonetheless, despite all these
initiatives UK venture capital ratio relative to GDP is still about a factor 7~8
lower than US (OECD, 2016). Wright et al, reviewing extensive studies on private
equity, show that these venture capital studies cover a wide area of impact
extending from profitability, productivity, employment and wage growth to
investment strategies (Wright et al., 2009). Surprisingly, these previous studies
have not assessed venture capital’s impact on firm revenue growth, despite the
fact that these policy initiatives appear to be aimed at firm growth, involving
both the scaling up of start-up firms, as well as rejuvenation or growth of
medium and large firms. Yet, the assessment of venture capital on firm revenue
growth seems essential, in order to judge the importance of these venture
capital-enhancing policies in shaping the innovative firm landscape of the
economy. Thus, this study aims to fill this gap by examining how venture capital
shapes firm growth, as well as enable placing these policy tools in context with
other policy tools and firm characteristics for their importance in creating the
innovative giants of tomorrow.
The analysis of mergers and acquisitions (M&A) influenced both by policy
regulation and policy incentives, on firm growth appears also essential. The
impact of private equity is not only through venture capital for start-ups, but it
appears to have a potential impact on medium and large firm growth through
mergers and acquisitions as a means of accessing new knowledge (Purunam &
Kannan, 2005). In fact, business historians assign an important role to mergers

Chapter 4 127
and acquisitions in creating British conglomerates post-Second World War period
(Toms & Wright, 2002). In contrast, Chandler, another business historian, views
mergers and acquisitions as having only a subsidiary role in large firm growth,
emphasizing instead the role of organic growth (Chandler A. , Scale and Scope,
1990). Not denying acquisitions could serve as a possible means for accessing
new technologies, Chandler cautions that historically they also appear to have
destroyed value across a range of industries (Chandler A. , 1994). As Wright et
al. (2009) pointed out in their review, private equity in the form of mergers and
acquisitions has been empirically analysed for its impact on employment, wages,
profitability and innovation. This debate raging within business history upon the
role of mergers and acquisitions impact on medium and large firm growth
underscores the importance of assessing the impact of this activity on firm
revenue growth in econometric analysis. More importantly, as mergers and
acquisition form the channel through which firms not only grow but also lose
independence, its impact on firm growth needs to be evaluated. If the impact of
mergers and acquisitions activity on firm growth outweighs the gains of growth
from firm independence, then firm independence should not be an issue of
consideration for policy regulation. If, however, firm independence surpasses
impact of other policy tools in influence, then some form of policy regulation to
support independence may become advisable.
Analysis of these policy regulations and tools on firm growth appears essential,
as successive UK governments have launched a multitude of policy incentives
over the last few decades, aimed at increasing firm growth. Peculiarly, analysis
of these incentives on firm revenue growth itself has been absent. Notably,
despite these globally competitive tax and financing incentives, firms have not
grown to become the frontier UK giants of tomorrow. More so, regulation
hindering mergers and acquisitions was reduced since the removal of public
interest tests in Enterprise act 2002, also aimed at boosting firm growth. Yet
despite these myriads of initiatives, its puzzling that UK has not created even
one of the frontier global giants of tomorrow. This study seeks to shed light on
this puzzle by assessing the impact of these policy initiatives on firm growth.
Have these policy tools been perchance been insufficient, or could policy
regulation have missed protecting/enhancing firm independence, if that is an
important firm characteristic for growth itself? This analysis undertakes to put

Chapter 4 128
all these policy tools in perspective, alongside the firm characteristic of
independence – to try to determine, whether or which aspect is most critical for
firm growth.
The outcome was quite unexpected. Contrary to expectations, the impact of
independence on growth seems to outweigh other influences, though policy tools
still provided valuable aid to growth. Independence, not only allows innovative
firms to reap much greater response from basic growth drivers, there also
appears to be a bonus independence growth dividend based solely on the years
that a firm can manage to stay independent. This independence growth dividend
appears to deliver a quite astonishing 15% growth for each year of
independence, albeit at 15% significance. It appears that independence has a
large impact on firm growth and the fact that currently there is no policy tool in
place either to support or protect it, may be one of the reasons that UK’s
innovative firms struggle to scale up into the future frontier UK giants of
tomorrow.
Notwithstanding the importance of firm independence as a vital influence on
growth, policy tools remain a critical component to aid growth. However, even
the analysis of policy tools led to some surprising outcomes. It appears, that
general (innovative and non-innovative) firms can grow despite increases in
corporate tax rates, contrary to expectations. However, the policy of lowering
corporate tax rates does appear to benefit innovative firms, where lowered
corporate tax rates are positive for firm growth. Albeit, the magnitude of impact
on firm growth is relatively small and as such, this context should be kept in
mind when weighing the cost of such a policy tool. Thus, it would appear that a
blanket policy on corporate tax rate reduction may not be the best choice,
rather a tailored policy approach adapted to type, and size of firms seems
advisable, weighing the benefits of this policy carefully against the costs. In
contrast, access to seed and venture capital does appear to be an important
source of finance to support long-term growth for both general and innovative
small and medium (SME) sized firms, albeit yet again the magnitude is relatively
small. It would seem that policy tools enhancing seed and venture capital
promote across the board, both general and innovative SME firm growth. Indeed,
it seems these policy tools need further enhancing, as UK has approximately a
factor 7~8 lower availability of venture capital ratio to GDP relative to US

Chapter 4 129
(OECD, 2016). The verdict on mergers and acquisitions was slightly mixed.
Mergers and acquisitions (M&A) were analysed through both management buy-
outs (MBO’s) and buy-ins (MBIs) impact on firm growth. The findings suggest that
M&As are positive and significant, with a similar impact for both general and
innovative firms. Yet again to put the impact in context, it is not large
relatively, as MBO’s which include external hostile/consensual takeovers as well
as management buyouts, have about half the impact of venture capital. In
contrast MBIs seems to have a much higher impact than venture capital, though
MBI’s make up a very small fraction of M&A activity (Wright & Wilson, 2013).
More so, detailed analysis revealed that M&As do not drive firm growth for
innovative SME’s, only large innovative firms and general SME’s. It would appear
that M&A play a differing role in promoting growth for different firms and thus
remain an important tool of choice for creating a diverse economy– it appears
not to be the option for delivering growth for innovative SME firms.
These results show the importance of maintaining a diverse policy tool kit for
growth, yet at the same time underscore the importance of bringing in some
policy tools to either support or protect firm independence, given its reasonably
large impact on firm growth. Especially, as policy is currently absent in this
area.
The rest of this study is organised as follows. The next section reviews the
previous studies conducted on the tax and financing incentives taken into
consideration for this research, selected for their influence on reducing finance
constraints for firm growth. These include impact of seed and venture capital on
firm growth, impact of mergers and acquisitions on large firm growth and studies
on corporate tax impact. This is followed by the empirical section, describing
methodology, analysis and results. The conclusion summarizes the findings and
possible policy considerations.
4.3 The selection of tax and financing policy incentives for this study for their impact on firm growth
As mentioned in the introduction, this study aims to understand the drivers of
firm growth and place the various tax and financing policy tools currently
targeted at firm growth in context of these drivers, lastly distinguishing whether

Chapter 4 130
the characteristic of firm independence influences either growth itself or these
drivers. The tax and financing policy tools impacting firm growth considered for
this study are those that have been a key focus of British government over the
last few decades, which include: corporate tax; seed and venture capital
financing incentives; and impact of mergers and acquisitions on firm growth.
To enable this objective, the next sub-sections firstly explain why these tax and
financing tools have been selected and thereafter explores the previous studies
conducted on these tax and financing objectives and examines how they have
been researched for their impact on firm growth.
Why tax and financing incentives that shape finance for firms matters for firm-growth
The selection of tax or financing incentives for their impact on firm growth is
rooted in the basics of growth theory. Although basic growth theory would hold
that both physical and human capital, alongside innovation, are critical to
growth (Solow, 1956), this study focuses on policy incentives aimed at enhancing
physical capital for firms, in particular those reducing financial constraints on
firms. Using the lens of finance as a growth constraint on firms, the tax and
financing incentives are identified for those that may have impacted the current
firm landscape of UK.
Although Lucas may have disregarded the importance of finance in growth as an
“over-stressed” driver of economic growth (Lucas R. , 1988), Schumpeter long
advocated the importance of finance in driving economic growth (Schumpeter J.
, 1912). Previous studies would appear to endorse Schumpeter’s view, as their
findings generally appear to support availability of finance as one of the
pertinent enablers of both economic and firm growth. Levine, reviewing a wide
array of theoretical and empirical studies on the inter-connectedness of finance
and economic growth, concludes that overwhelming evidence suggests that
availability of finance, through financial intermediaries or markets, appears to
matter for economic growth (Levine, 2005). Focusing specifically on impact of
finance and firm growth using cross-country research, Beck and Demirguc-Kent
found that constrained access to finance can have significant diminishing impact
on small and medium sized (SME) firm growth (Beck & Demirguc-Kent, 2006).

Chapter 4 131
Their research suggests that small firms particularly face larger constraints on
access to formal sources of external finance, thus hampering growth. Aghion et
al. (2007), evaluating both entry and expansion of small firms in industrialized
and emerging economies, observe that access to finance has again a significant
impact on the entry of firms, but also particularly in influencing their expansion
growth. Assessing different sources of finance impact on firm growth, Segarra
and Teruel (2009) associate the availability of long-term debt with high growth
firms, with short-term debt being correlated to lower growth firms.
Furthermore, assessing finance’s impact on innovation, Savignac (2008), using a
specifically designed innovation survey for French firms, observes that financial
constraints are also seen to hamper innovative activity. Even when Fernando and
Ruggieri (2015) examine the impact of restrained financial access on firm labour
productivity, they observe that financial constraints impact it negatively. Thus,
financial constraints appear to have a significant impact on firm growth, be it
through direct influence on growth or through hampering innovation and
productivity in firms.
Over the last few decades UK has competitively engaged in certain tax and
financing incentives, which could have influenced finance constraints of firms. In
particular, these would include venture capital, mergers and acquisitions and
corporate tax, which are investigated in this study.
What have previous studies on Venture capital deduced for firm growth
Venture capital is a critical source of finance for firms, alongside traditional
bank lending, especially for high-risk but also high-growth innovative firms. An
OECD project on SMEs and Entrepreneurship (WPSMEE) undertook an extensive
review of financing options for SMEs, as part of its objective to understand the
challenges facing both start-ups and small and medium sized firms (OECD, 2015).
While acknowledging that bank lending remains an integral part of finance for
many SMEs, they recognize the challenges in accessing traditional finance for
both innovative higher risk start-ups, as well as SMEs seeking to change
ownership structures or to de-leverage and improve their capital structures
(ibid). Reviewing options of external financing alternative to straight debt, they

Chapter 4 132
observe that equity financing targets the start-ups or innovative high-risk SME’s
with the potential of high growth. According to their classifications of
alternative financing, equity finance incorporating venture and seed capital, as
well as private equity, can provide significant access to finance to overcome the
capital gap often faced by such firms.
Specifically, analysing the impact of venture capital on young and high growth
firms in Germany, Engel finds that surviving venture capital backed firms appear
to have higher employment growth compared to non-venture capital funded
comparable firms (Engel, Discussion paper 02-02, 2002). Moreover, his findings
appear to indicate that venture capitalists are able to push firms towards higher
growth compared to other investors. However, when using German firm data to
distinguish the impact of venture capital on growth as well as innovation, Engel
and Keilbach found that while venture capital has indeed a positive impact on
firm employment growth, it appears not to have a significant impact on
innovation (Engel & Keilbach, 2007). This finding was further corroborated by
Peneder, using Austrian firm-level data to examine impact of venture capital on
firm growth, observes that while venture capital impact is positive on firm
growth, it appears to have no impact on innovation output of firms (Peneder,
2010). It would appear that these findings suggest that while venture capital has
a positive impact on growth, it is less so on innovation. In fact, Engel and
Keilbach imply that venture capitalists pre-select innovative firms and focus on
enhancing commercialization of the innovative product, rather than adding to
innovation itself (2007).
Using Swedish survey data, Smlarski and Kut use their study to qualify the impact
of incremental versus lump-sum venture capital finance, combined with number
of external investor involvement on firm growth (Smolarski & Kut, 2011).
According to their analysis, firm growth is positive with either incremental
financing or a syndicate of two or more investors. However, when these two
aspects are combined, this appears to have a negative impact on firm growth.
Thus, the type of investor involvement combined with method of financing
appears to alter the impact of venture capital on firm growth.
Lastly, the research by Bottazi and Da Rin using European data, caution that
financing policy incentives to encourage venture capital may not be sufficient in

Chapter 4 133
themselves to deliver firm growth, unless the policies and regulations to support
maturing of capital markets are in place to support it (Bottazi & Da Rin, 2002).
While they do find venture capital provides critical access to finance for
otherwise constrained highly innovative firms, they do not find venture capital-
backed firms grow any quicker than non-venture capital backed firms.
Intriguingly, they imply that this could to some extent be attributed possibly to
immature European capital markets. Their supposition is based on the lengthy
time period taken to develop venture capital industry in the US. Describing the
historical path taken by US venture capital, they trace the establishment of the
first venture capital fund American Research and Development (ARD) in 1946.
However, the maturation of the venture capital was not straightforward, with
the 1980’s still finding venture capital heavily reliant on publicly funded Small
Business Investment Companies (SBIC). According to Botaazi and da Rin, the
industry only really managed to take off in the late 1980’s, after the 1979
Employment Retirement Income Stabilization Act had enabled pension funds to
invest in venture capital. The resulting overwhelming increase in funds allowed
SBIC’s to be gradually replaced by limited partnerships as the dominant form of
venture capital firms, resulting in the successful venture capital industry of
today. These studies caution that venture capital financing incentives in
themselves may not be sufficient to increase the impact of venture capital on
growth – that polices and regulations to support maturing of venture capital
markets may be as necessary a part of this process. Aspects which cannot be
evaluated with the current data unfortunately and thus a possible limitation to
this studies analysis.
These various studies provide us with valuable insights into the impact of
venture capital and how that process was built up over time. Nonetheless, there
are opportunities to build upon this research and take the analysis somewhat
deeper, specifically through using firm level data. These studies, limited often
by shortage of data, were often confined to evaluating venture capital’s impact
on firm growth through comparing growth between similar subset of venture
capital backed or non-venture capital backed firms. Notwithstanding their
pertinent conclusions, they were unable to distinguish between seed and
venture capital effect on firm growth mainly due to data limitations, nor could
they capture a direct correlation measure between venture capital investment

Chapter 4 134
and firm growth. These are some of the gaps that this study hopes to provide
further insights on.
What is known about the impact of mergers and acquisition impact on firm growth
Following up further with policy tools that influence firm growth alongside
access to finance, mergers and acquisitions (M&A) is another route for firm
growth. Indeed, it is a tool of firm growth, which was employed by British firms
in the 20th century, the benefits of which have been debated by business
historians and management literature. In particular, this tool is of interest, as
there has been a debate across the field of business history and management
literature, whether M&A still remain a pertinent route of firm growth, with the
debate on the merits of organic growth versus growth through acquisitions.
According to business historians, mergers and acquisitions (M&A) have played an
important role in large firm growth in the first half of the twentieth century,
allowing British firms to create their own conglomerates to catch up with US
firms (Hannah, 1983; Lamoreaux, 1988). Yet, this appears to have changed in
the second half of the twentieth century, with Chandler viewing mergers as
subsidiary to large firm growth and instead emphasizing the role of organic
growth (Chandler, 1990; Chandler, 2005). However, Miskell & Jones following
resource-based management literature (Harrison et al, 1991), find that
complementary rather than related acquisitions can provide valuable source of
growth for large firms (Miskell & Jones, 2007). These historical studies, though
not conclusive, appear to assign at least a subsidiary if not slightly more
significant role to acquisitions and mergers in large firm growth. In fact, it would
appear that acquisitions could be important in rejuvenating large firm growth,
depending on the type of acquisitions.
The significance of type of acquisition in determining the impact on large firm
growth appears to be borne out also in management studies. Recent
management studies examining acquisitions have found technology sourcing to
be one of the motivations driving mergers and acquisitions (Desyllas & Hughes,
2008; Ruckman, 2004). These technology-driven acquisitions have led to some
financial studies evaluating the consequent market valuations of acquired firms

Chapter 4 135
(Feys & Manigart, 2010) , as well some management studies examining the
impact of acquisitions on consequent innovation of the combined firms (Cefis,
2010).
Despite this varied historical and management analyses on mergers and
acquisitions, econometric analyses examining the impact of mergers and
acquisitions (M&A) on the growth of the consequent combined firm seems to be
largely absent. Previous empirical studies appear to have mainly focussed
examining impact of M&A activity on employment or wage growth, not firm
growth. Burghardt and Helm use Swiss firm data for newly acquired firms to
assess employment growth (Burghardt & Helm, 2015). They find that the size of
the acquiring firm is correlated positively to the labour growth of the newly
acquired firm. Contrastingly, the combined size of the net establishment is
negatively related to its net workforce growth. Conyon et al. (2002), examining
the impact of mergers on employment in UK firms, suggest that the combined
merged firms tend to reduce labour after mergers, while Gugler and Yutoglu
(2004) find similar negative effects for mergers amongst European firm, though
not amongst US firms. Another management study, using Swedish data, assesses
firm growth in order to distinguish whether firm growth drives acquisition or the
reverse (Xiao, 2013). These studies mainly yield insights into the impact of
mergers and acquisitions on employment growth and its impact on labour growth
within the merged units of the firm.
On the whole, it would appear that mergers and acquisitions seem to exert a
significant impact on large firms, though this could be a positive or negative
impact based on a complex set of criteria. This is perhaps a positive impact
when it leads to rejuvenation of technology or absorption of new capabilities,
with a possibly more negative influence if merger focus detracts from organic
growth.
Given the importance of this influence of mergers and acquisitions on firm
growth, it is perhaps also pertinent to understand the limitations of the
influence of tax policy on this process. Although private equity buyouts have
been critiqued as a possible tax shield (Treasury Select Committee, 2007),
Auerbach & Reishaus previously researching US firms found no strong evidence to
support taxation as a driving factor in merger activity (Auerbach & Reishus, The

Chapter 4 136
Effects of Taxation on the Merger Decision, 1988). Indeed, Auerbach and
Reihaus, evaluating American firms, did not find tax benefits to play an
important role in shaping the activity of mergers and acquisitions (ibid).
However, Klodt and Kleinert reviewing merger waves over the last century,
attribute increased merger activity to sectoral shocks, with deregulation and
globalization possibly influencing the last wave of mergers (Kleinert & Klodt,
2002). Thus, though tax policy itself may not have a direct influence on mergers
and acquisition, it appears the regulations governing the wider financial sector
have had a significant impact on the process.
These historical and empirical studies yield insights, which may help explain the
complex interaction shaping the outcomes of mergers. Nonetheless, it is
noteworthy that there is an absence of empirical analysis examining the impact
of acquisitions on firm growth. Yet, it is precisely this insight on the impact of
mergers and acquisitions on firm growth, which could perhaps some shed some
light on explaining the decline of larger firm share. Did UK large firms not have
the option of technology acquisition, or was there some other obstacle
hampering their innovation? An empirical study may not be able to answer
conclusively, but it may provide some clues to deepen our understanding of this
process.
Impact of Corporate tax on firm growth
Essentially, this research to assess finance constraints, along with mergers and
acquisition impact on firm growth, is motivated by the expectation of clarifying
or at least placing some order of significance on policy incentives, specifically
the policy incentives that could influence this firm growth. Within that
framework, there is the multitude of tax relief schemes associated with EIS, SEIS
and VCT. Furthermore, there is capital gains tax and lastly, corporate tax.
Corporate tax perhaps deserves a particular mention, as it has been long
considered a means to attract inward investment by foreign MNC Britain, as well
as make British medium and large firms competitive (Devereux & Vella, 2014;
Devereux et al., 2002).
To understand its impact on inward investment and firm competitiveness,
Devereux and Maffini (2006), conducting an extensive review of studies,

Chapter 4 137
conclude that tax does appear to play a role in location and capital allocation
choices of multinational firms (MNC). Using American MNC firm data, Grubert
and Mutti (2000) find that average effective tax rate appears significantly to
influence the location of capital invested in a host country. Using industry level
data for 16 OECD economies, corporate tax is found by Vartia (2008) to reduce
investment as well as productivity. Using Firm level data in OECD countries,
corporate tax is also found to have a negative impact on innovation, along with
investment (Gemmell et al., 2010). Devereux et al. (2016) examining the
influence of capital allowances, a sub component of effective marginal
corporate tax rate, conclude that it has a significant impact on investment.
These numerous studies provide substantial evidence that corporate tax can
have significant impact on MNC choices of investment and location and profit
diversion. Yet, an empirical analysis directly between firm growth and corporate
tax appears absent. This study aims to fill this gap, which could provide a direct
insight into the supportive impact of corporate tax on making domestic firms
competitive.
4.4 Methodology and Data
As stated earlier, this study’s main contribution is to fill the void of research on
impact of independence on firm growth. Furthermore, using this understanding
of the impact of independence to place the value of the current policy tools in
context, clarifying which policy tools are supportive or perhaps even detrimental
to growth. To this end, it was imperative to keep firm growth as a point of focus
– assessing initially general (innovative and non-innovative) firms, thereafter
both overall (independent and non-independent) innovative firms and
independent innovative firms, measuring firm growth by revenue growth, one of
the OECD defined measures of firm growth (OECD, 2005) and specifically,
distinguishing the impact of independence on innovative firm growth, identifying
in the process the type of firms which can potentially grow into frontier giants.
Data Sources
This research uses firm level data sourced from Amadeus database from Bureau
Van Dijk, extracted from Wharton Research Data Services (WRDS) database.

Chapter 4 138
Relevant variables are downloaded both from profit/loss account and balance
sheets of firms.
UK Firm-level Panel data is analysed for time period 2006-2016 for all sectors -
89 in total. The firms are analysed initially incorporating all firm sizes. This is
followed by separate analysis per firm-size class: large, medium and small firm
size-classes, as defined by OECD.
Data separating investments on early stage seed funding, later stage venture
capital funding (2nd and 3rd round), as well as differentiating management buy-
out & management buy-in funding from replacement capital is only available at
country level on an annual basis from industry reports by the British Venture
Capital Association (BVCA).
Interest rate data for UK is collected from World data bank from IMF database.
Methodology
Using Fixed effects estimation, this analysis seeks to shed light on corporate tax
and financing incentives and its influence on firm growth. Firm growth, as
measured by annual turnover growth as a share of operating revenue, is
regressed upon by a set of varied variables. The variables of interest are sourced
from either firm-accounts data or BVCA sector level data, in order to throw light
of the tax and financing incentives on actual firm growth, which has been
empirically absent in current literature. It also aims to shed light on the
differential impact of mergers and impact on firm growth, where differences
exist either in the qualitative business history literature or there is absence of
actual firm growth measurement, as in management literature.
A) Dependent variable:
As Firm growth, the dependent variable, is measured as annual firm growth. This
is deduced from the profit/loss account sheet of firms as annual growth in
Operating revenue/turnover as % age of operating revenue.
Firm growth (Firm Grth ) = [Operating Revenue – Lagged Operating
revenue]/Lagged Operating Revenue

Chapter 4 139
B) Variables of interest: tax and financing incentives and firm independence
As referred to earlier, although corporate tax has drawn substantial valuable
research, yet it is lacking specific analysis on how it may have shaped firm
growth. Using firm level data drawn from Amadeus database, based on similar
measures used in studies reviewed by Devereux et al. (2006), this study
considers measuring corporate tax either through using EBIT (earnings before
income tax) or Profits (P/L) before and after tax, from the profit/loss account of
firms:
Corporate tax measure (CorpTax) = [P/L before tax – P/L after tax]/Gross profits
To examine impact of tax relief incentives such as capital gains tax reduction
through schemes such as enterprise investment schemes (EIS), Seed Enterprise
Investment Scheme (SEIS) and a mixture of corporation tax and capital gains
reduction through Venture Capital Trust Scheme (VCT) on firm growth, this study
assesses them through their impact on venture and seed capital investment. As
detailed firm data for these aspects is not available, this study uses venture
capital investment and seed/angel investment data aggregated at country-level
compiled by British Private Equity & Venture Capital association (BVCA).
Capital gains and venture capital tax schemes are differentiated for their
impact on early stage funding (seed and early stage venture capital aimed at
initial stage of start-up), from that of later stage funding (2nd and 3rd round of
funding, usually for expansion of firm) and any other form of later stage funding.
These are thus measured as:
• To capture Seed and Enterprise investment schemes:
(SeedInv) = Investment Amount (measured in unit of million pounds) in early
stages Seed funding and early (1st round ) Venture capital (sector specific)
• To capture venture capital investment schemes and impact of capital
gains tax:

Chapter 4 140
(Ven Cap) = Investment Amount (measured in unit of million pounds) in
later stage (2nd and 3rd round of funding) Venture capital (sector specific)
• To capture other forms of later funding rounds:
( Lat Ven Cap) = Investment Amount (venture capital) (measured in unit of
million pounds) in further later stages of firms(sector specific)
Given the debate around different impacts of mergers and acquisitions based on
type of merger, an attempt is made to differentiate these activities. As private
equity tax relief measures not only influence seed/venture capital investment,
but also mergers and acquisitions, this differentiation will be quite crude. Yet it
may give an indication. While some management theories suggest acquisitions
can be positive for firm growth if used to acquire new technologies, some
business historians suggest that these could be negative when distracting from
organic growth. Furthermore, the debate on reinstatement of national interest
tests, based on the earlier removal of public interest tests in Enterprise act
2002, makes this issue a separate concern.
This study thus tries to separate private equity activity from venture capital and
aims to measure merger and acquisition activity, using BVCA sector level data.
Although the measures are only approximate due to lack of detailed data,
private equity buyouts termed as secondary buyouts are captured in the
replacement capital term, which is a combined term of secondary buyouts,
replacement capital (capital repair and depreciation) and bank refinancing.
• Hence secondary buyouts reflective of private equity are measured by:
Replacement Capital (Rep Cap) = Capital invested for Secondary buyout +
Replacement capital + bank refinancing.

Chapter 4 141
Furthermore, data allows differentiation between types of management
buyouts:
• Firstly, Management Buyouts, while these normally refer to management
team of the firm buy their own firm, in this data this term has a wider
classification in the industry reports by BVCA. This is understood as
follows:
Management Buyout (MBO) = It includes capital invested by management
teams to buy own firms (MBOs), but also Institutional Buyouts (IBOs):
capital used by private equity, venture capital or commercial financial
institution to acquire a firm, could be in cooperation of target firm or
hostile takeover, which may include leveraged buyouts (LBOs), which
incorporates use of highly leveraged or borrowed funds to acquire target
firm.
• Secondly, if an external management team buys a controlling stake in the
firm, replacing the existing management team – usually if a firm is
undervalued, poorly managed or needing succession:
Management Buy-in (MBI) = Capital invested (unit millions of pounds) by
external management team to replace existing team.
A related measure to mergers and acquisition available in Amadeus database, is
the independence indicator113based on ownership data:
• Indep (Firm Ind) = Independence of a firm is indicated by A or A- or A+
status. Else it has another ultimate owner
This defines whether the firm is independent or owned by another ultimate
ownership, indicative of a buy-out or acquisition of firm by an external firm. It is
to be noted that firm independence in this aspect primarily checks that the firm
has no controlling shareholder. This independence indicator mainly assesses
whether any shareholder (excluding public shareholders for quoted firms), be it
13 Definition in appendix

Chapter 4 142
an owner, financial firm or industrial firm has controlling shares, with equity
over 25%. This indicator would capture loss of independence of firms which have
been acquired by another firm, but would mistakenly also classify some of the
big Silicon Valley independent firms as dependent. These are exceptions and
only few, which follow the trend set in Silicon Valley after Steve Jobs experience
of being ousted from Apple, where founders have sought to retain controlling
shares, if possible. This is evident in Facebook (Financial Times , 2017) or Tesla
(Los Angeles Times, 2018) to name a few, but not so in Amazon or Alphabet.
Thus, although this measure may mistakenly miss some successful UK
independent firms, which similar to these Silicon Valley icons may have retained
controlling shares by founders, this indicator in the main may be understood to
represent independent firms, not acquired by another firm or private investor.
Another possibly relevant measure, to assess maturity of firm:
• Firm Age (Firmage) = The time span between year of analysis and firm’s
year of incorporation
C) Control Variables
To examine impact of these tax and relief incentives on firm growth, it is
necessary to ensure other control variables are in place to capture elements
from growth theory, globalization and monetary policy.
The control variables rooted in growth theories, firm-level measures such as
capital expenditure and human capital can be extracted from the profit/loss
account and measured for their growth:
• Gross capital Growth measure (Gross Cap Grth) = [Fixed assets (Tangible) –
Lagged Fixed assets (Tangible)] / Lagged Fixed assets (Tangible).
• Human Resource (employees) (Cost Emply Grth ) = [Cost of staff Employees –
Lagged Cost of staff Employees] / Lagged Cost of staff Employees
A possible variable to capture both the innovativeness of the firm, as well as an
aspect of technology considered critical for national innovation systems, is R&D

Chapter 4 143
expenses. R&D expenses, as defined in firm data, captures both internal R&D or
firm costs for R&D alliances, which implies the firm could itself be developing
that innovation or buying in that research. Yet, in the absence of other
measures, it is a reasonable measure to serve as a proxy for the innovative level
of the firm. This is also available through profit/loss accounts:
• Hence, technology (R&D Grth) = [Research and Development expenses –
Lagged Research and Development expenses] / Lagged Research and
Development expenses
To capture aspects of globalization of firms, firm level data on export revenues
are also extracted from profit loss account:
• Export (Exp Rev Grth) = [Export Revenue – Lagged Export Revenue] / Lagged
Export Revenue
• To capture impact of monetary policy:
Interest rates (Int Rates) = Bank of England interest rates set nationally
D) Summary statistics and correlation matrix of Variables
Summary statistics of the variables used in this regression are listed in Table 4.1
below. It is to be noted that not all firms provide data on the variables used in
our regressions. In particular R&D expenditure is available for a much smaller
subset of firms, which is used by this study to indicate innovativeness of firm as
mentioned above. Similarly export data and skilled human resource costs data is
also less prevalently available in firms, though more so than R&D expenditure.

Chapter 4 144
Table 4.1:Summary statistics of variables used in regressions
Observations Mean Standard Deviation Min Max
Firm growth 1,479,257 2587.4 689377.6 -8.7e+07 5.58e+08E+08
Year 2,073,538 2010.72 2.85 2006 2017
Gross capital growth 1,127,045 1570.12 380611.9 -1754000 3.17e+08
Skilled Human Resource growth
583,164 100.04 27969.2 -548.5 2.11e+07
R&D expenditure growth
14,077 337.5 16016.7 -906.73 1291225
Export Growth 120,665 537.6 52750.2 -11766.1 1.06e+07
Corporate tax growth 572,789 67.34 50249.6 -1.78E+07 3.05e+07
Firm age 2,072,102 14.5 16.32 0 159
Later stage funding 1,463,763 1346.33 345.03 841 1772
Replacement Capital (includes secondary buyouts)
2,020,054 1160.57 651.7 254 2669
Management Buy-out (MBO) capital
2,020,054 3365.73 1864.665 1051 7373
Management Buy-in (MBI) capital
2,020,054 120.25 92.95 16 348
Other late funding 1,666,580 538.85 533.67 143 1886
Lending interest rate 1,843,457 1.86 2.05 0.5 5.5
Dummy independence 2,073,538 0.08 0.26 0 1
In addition to the summary statistics listed above, the correlation of variables is
listed below in Table 4.2 and Table 4.3. As the variable Early stage funding with
Later stage funding shows a high correlation, the variable Early stage funding is
dropped from the final equation used in the regressions in order to reduce
potential errors arising from multicollinearity.
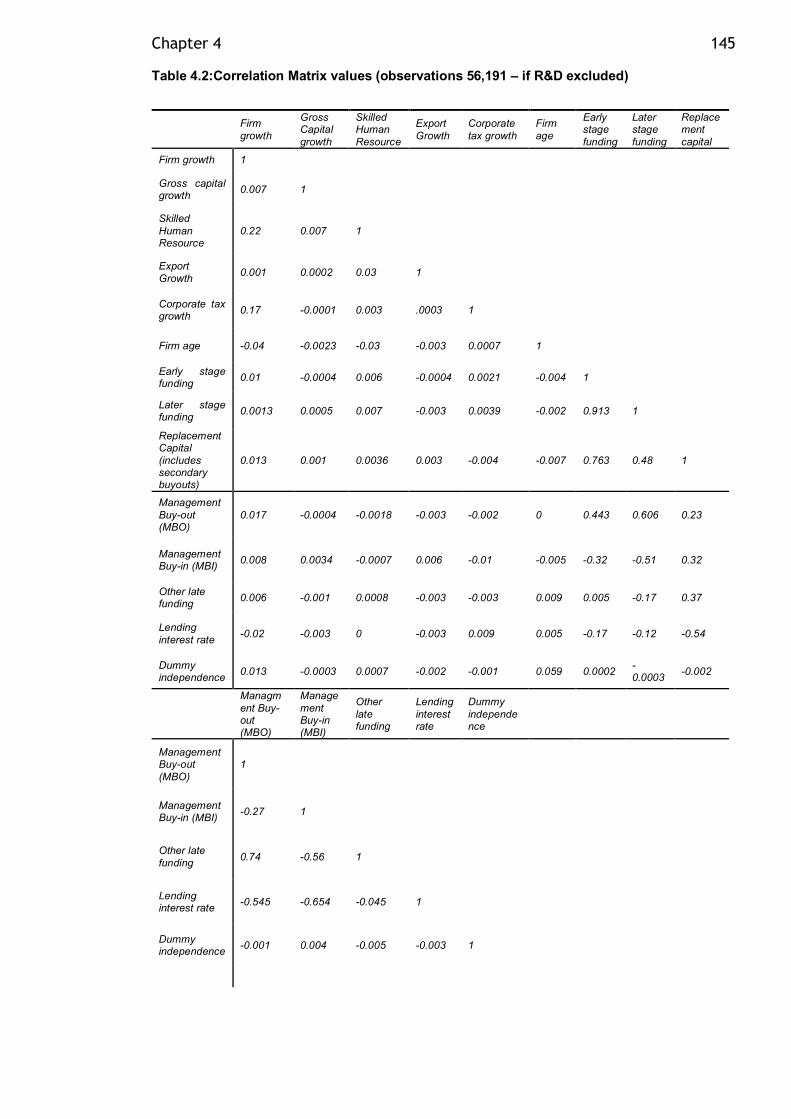
Chapter 4 145
Table 4.2:Correlation Matrix values (observations 56,191 – if R&D excluded)
Firm growth
Gross Capital growth
Skilled Human Resource
Export Growth
Corporate tax growth
Firm age
Early stage funding
Later stage funding
Replacement capital
Firm growth 1
Gross capital growth 0.007 1
Skilled Human Resource
0.22 0.007 1
Export Growth 0.001 0.0002 0.03 1
Corporate tax growth 0.17 -0.0001 0.003 .0003 1
Firm age -0.04 -0.0023 -0.03 -0.003 0.0007 1
Early stage funding 0.01 -0.0004 0.006 -0.0004 0.0021 -0.004 1
Later stage funding 0.0013 0.0005 0.007 -0.003 0.0039 -0.002 0.913 1
Replacement Capital (includes secondary buyouts)
0.013 0.001 0.0036 0.003 -0.004 -0.007 0.763 0.48 1
Management Buy-out (MBO)
0.017 -0.0004 -0.0018 -0.003 -0.002 0 0.443 0.606 0.23
Management Buy-in (MBI) 0.008 0.0034 -0.0007 0.006 -0.01 -0.005 -0.32 -0.51 0.32
Other late funding 0.006 -0.001 0.0008 -0.003 -0.003 0.009 0.005 -0.17 0.37
Lending interest rate -0.02 -0.003 0 -0.003 0.009 0.005 -0.17 -0.12 -0.54
Dummy independence 0.013 -0.0003 0.0007 -0.002 -0.001 0.059 0.0002 -
0.0003 -0.002
Managment Buy-out (MBO)
Management Buy-in (MBI)
Other late funding
Lending interest rate
Dummy independence
Management Buy-out (MBO)
1
Management Buy-in (MBI) -0.27 1
Other late funding 0.74 -0.56 1
Lending interest rate -0.545 -0.654 -0.045 1
Dummy independence -0.001 0.004 -0.005 -0.003 1

Chapter 4 146
Table 4.3 Correlation Matrix – for R&D growth (observations 5,736 – if R&D included)
Firm growth Gross Capital growth
Skilled Human Resource
Export Growth
Corporate tax growth
Firm age
Early stage funding
Later stage funding
Replacement capital
R&D growth 0.027 -0.0006 0.017 -0.0007 0.0005 0.028 -0.004 -0.006 0.003
Managment Buy-out (MBO)
Management Buy-in (MBI)
Other late funding
Lending interest rate
Dummy independence
R&D growth
R&D growth -0.006 0.009 0.003 -0.003 -0.007 1
4.5 Empirical Analysis
Going back to the aims, this study seeks to understand why UK has not produced
the new innovative giants of tomorrow through analysing whether firm
independence matters and how this may fit in alongside current policy tools
which drive firm growth: tax & financing incentives and M&A activity.
As such the first regression assesses what drives frim growth - examining growth
drivers alongside the tax and financing incentive policy tools as well as M&A
activity, as these are considered to be policy tools targeting support of firm
growth. These drivers and policy tools are overall examined for their impact on
firm growth for overall general (on-innovative and innovative) firms and then
compared for their impact on innovative firms. Upon shortlisting the drivers that
matter most for driving innovative firms (the object of this study), then a
regression is performed examining how these short-listed drivers may differ for
independent firms, trying to answer whether independence matters for firm
growth.
Before listing regressions, the model is explained briefly in next sub-section.
Model
For all the regressions, an initial set of drivers based on the rudiments of growth
theory and globalization as defined in above section are used as control
variables, alongside the policy variables of interest to evaluate impact of tax
and financing incentives on firm growth. The variables used in model are listed
in Table 4.4.

Chapter 4 147
Table 4.4: Variables used in Model, source (author) Dependent variable Firm growth measured annually
Control variables • Gross capital growth; • Skilled Human resource, either capturing
expansion of employees or increasing skills level of firms;
• R&D expenditure growth, capturing changing technology level or innovativeness of firm – possibly more relevant for growing small and medium firms, whereas for large firms R&D budgets may not increase significantly for new innovations and instead may be conducted through a shift of resources;
• Export growth – capturing changing global market exposure of firm.
Policy variables of interest to evaluate tax and financing incentives:
• Corporate tax growth (annual firm level); • Venture capital (annual country level) - -
the funding available for firms is differentiated by seed funding/early stage venture capital to later stage funding.
o Seed funding/early stage funding (annual country level) - – this to an extent captures initiatives impact of capital gains tax entrepreneur relief and financing schemes EIS and SEIS.
o Later stage venture capital funding (2nd and 3rd round) (annual country level) - – this would to an extent capture impact again of capital gains tax relief, as well as financing schemes such as VCT
o Other late stage funding – for further capital investment in further rounds
• Acquisitions are differentiated for Management Buyouts (MBO) activity from management Buy-ins (MBI), although the data only allows for a limited differentiation:
o MBI - External management takeover replacing existing management
o MB) - all types of either external hostile/cooperative or internal management takeovers.

Chapter 4 148
A point to clarify in above Table 4.4, is a limitation in the data while examining
acquisitions, attempt is made to differentiate Management Buyouts (MBO)
activity from management Buy-ins (MBI). The motivation behind this
differentiation is rooted in the debate in business history, which differs from
management studies – where complementary acquisitions are considered positive
for firm growth, whilst others could be seen as harming growth. However, as
available data MBO – merges the cooperative takeovers alongside the hostile
takeovers in the same figure, this differentiation was not fully possible with this
data. This data only allows for a limited differentiation - distinguishing between
an external management takeover replacing existing management (MBI), versus
all types of either external hostile/cooperative or internal management
takeovers (MBO). This limitation is important to point out, as the interpretation
of results is done accordingly.
Further to above listed variables, in model, a variable to assess whether a firm
grows at varying rate based on age of age of firm, the analysis also includes:
• Firm age (annual firm level) – age of firm based on year of incorporation
Furthermore:
• Time dummies are removed, as venture capital variables appear to have
constant time effect and could not otherwise be analysed.
• Also, early stage funding appears to be closely correlated with later stage
funding. Hence, two separate regressions are used to assess them.
This model with variables listed in Table 4.4 is depicted in Diagram 4.1 to enable
easier oversight of the different drivers and policy tools influencing firm growth.

Chapter 4 149
Figure 4.1 Model depicting Basic growth drivers and policy tools influencing firm growth leading to country productivity and Growth, source (author)
Using Fixed effects method to remove sector specific effects, the equation for
the model used for this analysis, is thus defined as:
Firm growth (Firm Grth ) = a + + b1(Gross Cap Grth) + b2(Cost Emply Grth ) + b3(R&D Grth)
+ b4(Exp Rev Grth ) + b5(Int Rates ) + b6(Firmage ) + b7(CorpTaxGrth) )+ b8(SeedInv) +
b9(Ven Cap) + b10(Lat Ven Cap) + b11 (Rep Cap) + b12 (MBO) + b13 (MBI) + b14 (Firm Ind)
Equation (1)
As mentioned earlier, analysing the correlation matrix for firms in Table 4.2
indicates that early stage and later stage (2nd & 3rd round) funding are highly
correlated, indicating they could cause near perfect multicollinearity in
regressions. Hence, the regressions use only late stage funding, dropping early
stage (SeedInv), as shown in Equations 2:
Firm growth (Firm Grth ) = a + b1(Gross Cap Grth) + b2(Cost Emply Grth ) + b3(R&D Grth) +
b4(Exp Rev Grth ) + b5(Int Rates ) + b6(Firmage ) + b7(CorpTaxGrth) ) + b9(Ven Cap) +
b10(Lat Ven Cap) + b11 (Rep Cap) + b12 (MBO) + b13 (MBI) + b14 (Firm Ind)
Equation (2)
The following regressions are performed using the equation above.

Chapter 4 150
Regression results
Using Fixed effects method (FEM) to remove sector and firm specific effects, the
regressions are conducted on panel data over time period 2006-2016, for UK 89
sectors at firm-level, to examine firm growth.
Initially the regressions analyse overall general firm growth and then the same
analysis is conducted only for innovating firms – based on firms which report R&D
expenses. As mentioned above, early and late stage funding appear to be highly
correlated, thus only late stage (2nd and 3rd round venture capital) funding is
used in regressions, using equation (2) for all regressions. Given the UK’s bigger
challenge lies in upscaling firms, rather than the birth of innovative firms, a
focus on venture capital funding of 2nd and 3rd round is more pertinent to this
study than the initial seed funding.
Furthermore, as lending interest rates as well as late stage funding are omitted
because of collinearity, these two variables are not listed in the results. Lastly,
throughout these regressions time dummies are removed, as they caused the
annual country level data of venture capital and financing incentives to be
omitted – which are our variables of interest. These results are listed in Table
4.5 below for aggregate level analysis of overall general (innovative and non-
innovative) in column 1 and innovative firms in column 2.
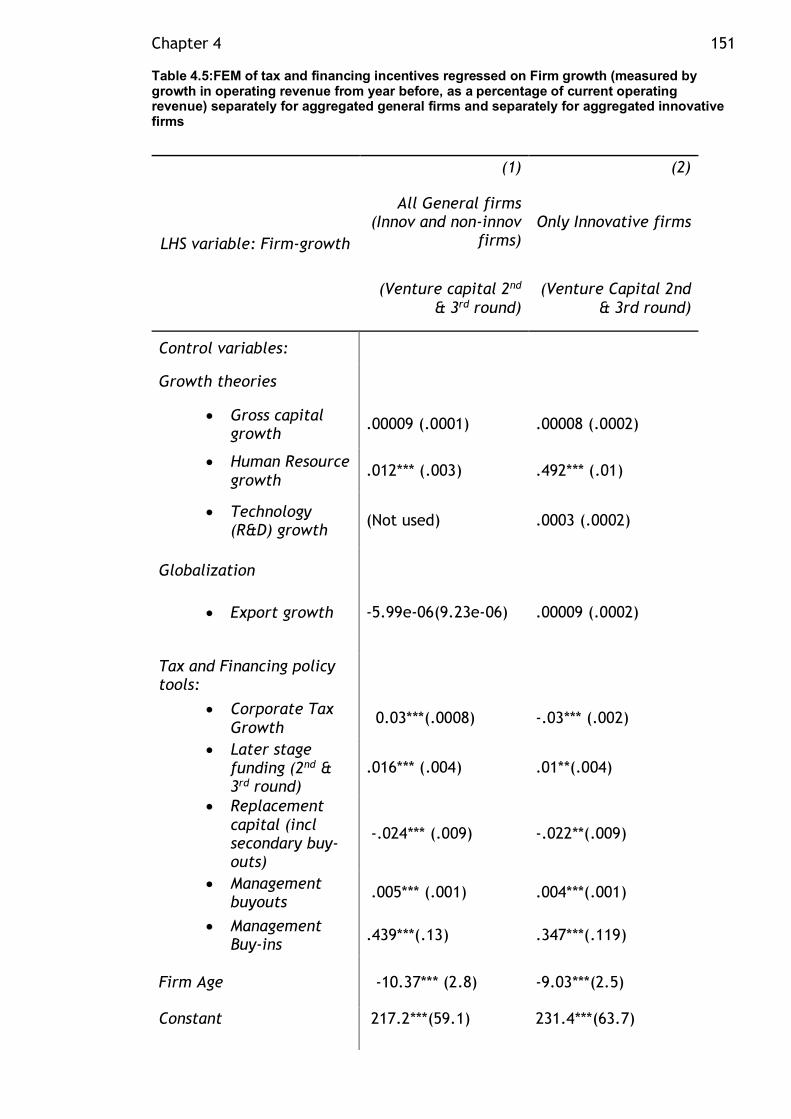
Chapter 4 151
Table 4.5:FEM of tax and financing incentives regressed on Firm growth (measured by growth in operating revenue from year before, as a percentage of current operating revenue) separately for aggregated general firms and separately for aggregated innovative firms
LHS variable: Firm-growth
(1) (2)
All General firms (Innov and non-innov
firms) Only Innovative firms
(Venture capital 2nd & 3rd round)
(Venture Capital 2nd & 3rd round)
Control variables:
Growth theories
• Gross capital growth
.00009 (.0001) .00008 (.0002)
• Human Resource growth
.012*** (.003) .492*** (.01)
• Technology (R&D) growth
(Not used) .0003 (.0002)
Globalization
• Export growth -5.99e-06(9.23e-06) .00009 (.0002)
Tax and Financing policy tools:
• Corporate Tax Growth
0.03***(.0008) -.03*** (.002)
• Later stage funding (2nd & 3rd round)
.016*** (.004) .01**(.004)
• Replacement capital (incl secondary buy-outs)
-.024*** (.009) -.022**(.009)
• Management buyouts
.005*** (.001) .004***(.001)
• Management Buy-ins .439***(.13) .347***(.119)
Firm Age -10.37*** (2.8) -9.03***(2.5)
Constant 217.2***(59.1) 231.4***(63.7)

Chapter 4 152
Observations 56, 191 5,736
No. of groups 16,184 2,127
Obs per group min = 1 min = 1 avg= 3.5 avg= 2.7 max= 6 max= 6
R-sq
within= 0.08
within= 0.4182
between = .0069 between = .0212 overall = 0.0057 overall = 0.0174
Corr (u_i,Xb)
-0.8897
-0.9862
Note: The regression equation uses Eq (2) for Firm growth (Firm Grth ) = a + + b1(Gross Cap Grth) +
b2(Cost Emply Grth ) + b3(R&D Grth) + b4(Exp Rev Grth ) + b5(Int Rates ) + b6(Firmage ) + b7(CorpTaxGrth) )+
b8(SeedInv) + b9(Ven Cap) + b10(Lat Ven Cap) + b11 (Rep Cap) + b12 (MBO) + b13 (MBI) + b14 (Firm Ind) –
R&D variable excluded in column (1) to allow observation of general overall firm types, as only innovative firms seem to list R&D.
*** indicates significance at 1% p-value, ** indicates significance at 5% p-value and * indicates
significance at 10% p-value. Standard errors are listed in parenthesis.
These main results for these regressions can be summarised as:
• Surprisingly, Gross Capital is not a significant driver. At first sight, this
is surprising, however it could be indicative of the fact that capital
investments are not reflected in immediate growth but may rather
have a delayed effect on firm growth. This should be explored in
future research to understand if indeed this is the case.
• Human Resource – is significant, and this coefficient x2 for innovative
firms. Yet there is no significant policy in place to boost increasing
skilled human resource available to firms.

Chapter 4 153
• The impact of Corporate tax growth is very small and surprisingly
positive for overall (innovative and non-innovative firms) ie. Overall
firms grow despite increased corporate tax. However, this figure is
negative for innovative firms, albeit smaller in impact relative to
Human resource – despite it being considered as one of the key
attractions for driving growth in UK policy making. As such although
the current policy focus to reduce corporate tax would appear to help
innovative firms, its impact is relatively much smaller and brings into
question as to whether this policy tool should be centre stage for
attracting or supporting innovative firm growth. More so, the question
arises whether this policy should be a blanket policy for all types of
firms, as these findings indicate that overall firms (includes non-
innovative firms) can grow despite increased corporate tax.
• Later stage funding (2nd & 3rd venture capital round) although
significant, it appears a relatively smaller impact. Bearing in mind that
these are not percentage growth figures, rather it measures the
change in percentage growth for firms for every million pounds
invested, its interpretation differs from above variables.
This is a level – not a growth figure of venture capital - and cannot be
directly compared with earlier growth coefficients. It can only be
used to relatively compare other level of invested capital. As such, it
appears that every million pounds invested in venture capital would
have 2.5x higher impact on firm growth than MBOs, which include
capital of either cooperative or hostile takeovers of IBOs and LBOs.
• Replacement capital including secondary buyouts, appears negative -
which could be just the cost of replacement capital, but could also
indicate that secondary buyouts may not be positive for firm growth.
As these two figures are inter-bound, it is not possible to isolate the
two impacts.
• Both Management buyouts (MBO) and Management buy-ins (MBI) are
positive for firm growth, with Management buy-ins showing higher
figures. As mentioned earlier, each million invested in MBOs (capturing

Chapter 4 154
both management buyouts, but also hostile/cooperative IBO takeovers)
seem to have 2.5x lower impact than each million invested in venture
capital. On the other hand, MBI, which captures external management
using capital to replace existing teams usually for undervalued firms,
seems to deliver 100x higher firm growth than MBOs. However, MBI’s
are much less prevalent as much riskier to fund and appear to be less
than 1% relative to MBO’s in UK (BVCA, 2016).
Thus, perhaps the main takeaway of these figures is a comparison of
venture capital with MBO figures - that direct venture capital invested
into the organic growth of a firm delivers more growth than an
acquisition/takeover. Thus, while M&A’s seem to be positive on firm
growth, venture capital investing in organic firm growth seems
relatively a larger impact, supporting economic historians evaluation
of importance of organic firm growth over growth through acquisitions.
As such, greater focus in policy making to support access to finance to
encourage organic firm growth above M&A’s, seems important for firm
growth.
• Firm age is surprisingly negative – i.e. the older or more established a
firm, then that age works negatively on growth. This would appear to
indicate that the longer the firms last the distance, then each year of
incorporation has a negative impact on firm growth. This appears
contrary to Business historians and is investigated in further detail in
follow-up regressions to enable understanding of this result.
• Three variables: lending interest rates; other further later stage of
lending and independence dummies are omitted due to collinearity
These results are also further checked for how these drivers may impact firm
size classes differently, again using equation 2 to assess firm growth.
The firm growth is differentiated for firm-size classes: micro (employees < 10),
small (employees < 50), medium (employees < 250) and large (employees 250+).
In all, a set of further eight regressions are performed. These regressions are
listed in Table 4.6 for innovative firms and Table 4.7 for general overall firms.

Chapter 4 155
Table 4.6 FEM of tax and financing incentives regressed on (Innovative firms) Firm growth, differentiated for firm class sizes
LHS variable: Firm-growth
(1) (2) (3) (4) Innovative firms (micro)
Innovative firms (small)
Innovative firms (medium)
Innovative firms (large)
Control variables: Growth theories
• Gross capital growth
-.067 (.203) .005(.005) .0002(.002) .004(.003)
• Human
Resource growth
-2.45 (2.01) .537***(.08) .48*** (.009) .747*** (.026)
• Technology (R&D) growth
.101 (.105) .0004 (.004) .0003(.0008)
.0004** (.0001)
Globalization
• Export growth
.076 (.062) .049***(.012) .00003(.0001)
.0001
(.0003) Tax and Financing policy tools:
• Corporate Tax Growth
-1.87 (1.32) -.028*** (.004) .03**(.01) .003 (.004)
• Later
stage funding (2nd & 3rd round)
.598(.39) .013(.023) .009*(.005) .004 (.005)
• Replacem
ent capital (incl secondary buy-outs)
.502 (.441) -.023 (.043) -.022**(.009)
-.019**
(.009)
• Managem
ent buyouts
Omitted .006(.007) .003(.002) .005**
(.001)

Chapter 4 156
• Management Buy-ins
Omitted .47(.63) .266** (.133) .33* (.127)
• Firm Age 353.6 (270.97) -9.3(13.7) -7.8*** (2.8) -8.9***
(2.7)
• Constant -6905.
(5223.6) 163.6(262,6)) 189.9***
(63.7) 294.07***
(86.9)
Observations 51 805 2,873 1,984
No. of groups 36 368 1,167 691
Obs per group min=1 min =1 min =1 min =1 avg=1.4 avg =2.2 avg =2.5 avg =2.9 max=4 max =6 max =6 max =6
R-sq within= 0.5175 within= 0.2192 within=
0.6483 within= 0.4102
between = .04888
between = .0162
between = .0288
between = .0346
overall = 0.0245
overall = 0.0125
overall = 0.0376
overall = 0.0132
Corr (u_i,Xb) -0.9999 -0.9688 -0.9685 -0.9964
Note: The regression equation uses Eq (2) for (Firm Grth ) = a + b1(Gross Cap Grth) + b2(Cost Emply Grth )
+ b3(R&D Grth) + b4(Exp Rev Grth ) + b5(Int Rates ) + b6(Firmage ) + b7(CorpTaxGrth) ) + b9(Ven Cap) + b10(Lat
Ven Cap) + b11 (Rep Cap) + b12 (MBO) + b13 (MBI) + b14 (Firm Ind) – with lending interest rates, early stage
lending, other late stage lending and independence dummy not listed as they are omitted due to
collinearity
*** indicates significance at 1% p-value, ** indicates significance at 5% p-value and * indicates
significance at 10% p-value. Standard errors are listed in parenthesis.
Main findings of these regressions on innovative firm sizes:
• Micro firm-class: no significant drivers below 10% p-values, although
late stage (2nd and 3rd round) venture capital is significant at 17% p-
value, which is valid enough and indicates access to finance is key for
these small firms
• Small firm-class: Skilled human resource is the most influential driver
on firm growth, with export also significant driver and reduction in

Chapter 4 157
corporate tax reductions also significant for small firm growth, though
half the magnitude of impact of export growth and factor 20x less than
skilled human resource.
• Medium firm-class: Skilled human resource yet again the most
significant, with increase in corporate tax positive on growth and later
stage venture capital (2nd and 3rd round) also significant for firm
growth. Though the impact of venture capital on medium firms is
relatively far smaller on firm growth than for micro firms. MBOs
(includes external hostile/consensual takeovers as well as internal
management buyouts) have 11% p-value significance, which indicates
that M&A are a positive impact for medium firms – though we cannot
distinguish whether that is driven by management buyouts by internal
management team or external takeovers. MBI’s are separate and they
show a significant and positive impact.
• Large firm class: Yet again, skilled human resource is key – in fact this
driver is the largest in magnitude when compared across all firm-sizes.
Export and corporate tax are surprisingly not significant, instead
replacement capital (including secondary buyouts) is a drag on growth,
with MBOs (external takeovers, as well as internal management
buyouts) a positive on frim growth, as well as MBIs. Yet again ,
indicating that M&A’s play a significant role in firm growth of large
firms, however data not distinguishing whether this is due to external
acquisitions or internal management buyouts.

Chapter 4 158
Table 4.7 FEM of tax and financing incentives regressed on (General firms) Firm growth, differentiated for firm class sizes
LHS variable: Firm-growth (1) (2) (3) (4)
General firms (micro)
General firms (small)
General firms (medium)
General firms (large)
Control variables: Growth theories
• Gross capital growth
.002(.002) .001(.002) .00009 (.00006)
.0001 (.0004)
• Human
Resource growth
.05*** (.02)
1.01*** (.018)
.085*** (.002)
.16*** (.004)
• Technology (R&D) growth
Not used Not used Not used Not used
Globalization
• Export growth
.002*** (.0007)
-.0002*** (.00002)
6.5e-7(7.3e-6)
.00002 (.00005)
Tax and Financing policy tools:
• Corporate Tax Growth
.06***(.0009)
-.0008(.02)
-.07*** (.006)
.062*** (.007)
• Later stage funding (2nd & 3rd round)
.019(.019) .017 (.012) .014***
(.003) .012** (.006)
• Replacem
ent capital (incl secondary buy-outs)
-.03 (.038) -0.036(.025)
-.02***
(.007) -0.014(.013)

Chapter 4 159
• Management buyouts
.008(.006) .007*
(.004) .005***
(.001) .003(.002)
• Management Buy-ins
.588(.563) .568*
(.367) .382***
(.101) .304(.19)
• Firm Age -11.8
(12.2)
-13.01*(7.96)
-8.6***(2.2)
-8.3** (4.1
Constant 157.6(173.9)
226.2(142.7)
180.5(46.5)
218.512**
(104.4)
Observations 2,925 13,731 27,386 11,831
No. of groups 1,327 5,007 8,507 3,452
Obs per group min=1 min =1 min =1 min =1 avg=2.2 avg =2.7 avg =3.2 avg =3.4
max=6 max =6 max =6 max =6
R-sq within= 0.6757
within= 0.2848
within= 0.0919
within= 0.1657
between = .1195
between = .0129
between = .0066
between = .0085
overall = 0.2058
overall = 0.0229
overall = 0.0058
overall = 0.0059
Corr (u_i,Xb) -0.7302 -0.9546 -0.9450 -0.7130
Note: The regression equation uses Eq (2) for (Firm Grth ) = a + b1(Gross Cap Grth) + b2(Cost Emply Grth )
+ b3(R&D Grth) + b4(Exp Rev Grth ) + b5(Int Rates ) + b6(Firmage ) + b7(CorpTaxGrth) ) + b9(Ven Cap) + b10(Lat
Ven Cap) + b11 (Rep Cap) + b12 (MBO) + b13 (MBI) + b14 (Firm Ind) – with lending interest rates, early stage
lending, other late stage lending and independence dummy not listed as they are omitted due to
collinearity
*** indicates significance at 1% p-value, ** indicates significance at 5% p-value and * indicates
significance at 10% p-value. Standard errors are listed in parenthesis.

Chapter 4 160
Main findings from these regressions for general firm sizes:
• Micro firm class: Skilled human resource, export, as well as increased
corporate tax are significant drivers for micro firms. Interestingly
venture capital does not seem to play a part in driving micro firm
growth of general firms, which underscores literature that venture
capital is involved mostly in innovative firms.
• Small firm class: Skilled human resource with a significantly larger
coefficient relative to micro firms is a key driver, as well as MBIs and
MBOs, indicating M&A play a part in driving even small firm growth of
general firms. Yet again, unfortunately the data does not enable
distinguishing between internal management buyout or external
takeovers as to which is the key component of MBOs. Exports are
surprisingly a negative driver. Venture capital is significant , although
only at 17%. Furthermore, firm age is also a negative driver with a
quite large coefficient value, indicating the age of a firm seems to
impose a significant drag on the growth of a general small firm.
• Medium firm class: Skilled human resource is once again evident as a
strong driver, with capital growth a very small influence though p-
value of 15%. Surprisingly late venture capital (2nd and 3rd round) is
positive driver for firm growth, alongside MBOs and MBI indicating M&A
(be it internal management buyout or external takeover) play a
positive role in driving firm growth. Increased corporate tax growth
has a negative impact on medium firm growth, while firm age has yet
again a large value and imposes a negative drag on frim growth.
• Large firm class: Yet again, Skilled human resource is highly
significant, with increased corporate tax as a positive indicating large
general firms can grow despite increased corporate taxes. Late
venture capital (2nd and 3rd round) is surprisingly positive, indicating
venture capital does seem to impact large firm growth. Future
research should identify how this is -whether this is spin-offs of large
firms or financing of specific M&As perhaps. MBOs and MBIs are both

Chapter 4 161
found positive, though at 14 % p-value and 11% p-value respectively.
Firm age is yet again a negative significant impact.
Overall conclusions (both innovative firm-classes and general firm-classes) on
variables of interest:
Firstly, corporate tax increase – this is found broadly to be positive for general
(innovative and non-innovative) firms indicating they can grow despite tax
increase, while its negative for innovative firms implying that corporate tax
increase is a drag on innovative firm growth. Exploring this in detail at the
differing firm-size levels, it appears only micro and large general firms can grow
despite increased corporate tax, while increased corporate tax would impose a
drag on small innovative firm growth, yet medium innovative firms appear to be
able to grow despite increased corporate tax. These are quite important
variations which sheds doubt on the suitability of the current blanket policy of
corporate tax reductions, indicating policy could be tailored differently for
innovative firms, more so also differently for firm size-classes.
Secondly, Venture capital 2nd and 3rd round funding – this was broadly found
positive and significant for both general (innovative and non-innovative), as well
as innovative firms. Upon detailed analysis at firm size levels, venture capital
(2nd and 3rd rounds) was found significant and positive for growth of only micro
and medium innovative firms, not small – possibly investment at that stage
feeding into expansion of firm resources and not growth. In contrast, venture
capital 2nd and 3rd round funding is significant at 17% p-value for small general
firms, while fully significant for medium general firms as well as significant for
large general firms, unlike large innovative firms. While the coefficient values
cannot be directly compared to growth coefficients given data limitations, these
findings indicate roughly .01% firm growth for every million pound invested for
general and innovative firms. While this growth is not large, it is still growth and
seems to support growth of SMEs (small and medium sized) for both innovative
and general firms. As UK appears to have a scale-up problem of its smaller
firms, as mentioned in the introduction where UK scores 26th in GEI index in
scaling up despite scoring 4th in the creation of innovative start-ups, and this is
further combined with reduced venture capital availability relative to US - this
seems to be an insightful result shedding some light on this problem. It would

Chapter 4 162
appear that policy support to further enhance access to venture capital would
help boost scaling up of firms, though yet again it is not the largest driver of
firm growth and should be kept in that context.
Furthermore, venture capitals lack of significance for large innovative firms
seems to indicate they may be able to utilize other sources for investment, also
in line with previous literature (OECD, 2015). On the other hand, detailed
analysis of general (innovative and non-innovative) firm size classes, reveals that
venture capital is significant for large size-class of general firms. In this case,
indicating venture capital supports growth of large size-class of general firms.
This would appear to be in line with previous literature on use of private equity
in complementary business acquisitions to fund large firm growth (Miskell &
Jones, 2007). In essence, it appears that venture capital is a relevant and
positive source of finance which supports growth, particularly for growth of
micro, small and medium innovative firms – albeit it is not that large an impact
and as such should be kept in that context
Thirdly, M&A activity captured by MBOs and MBIs – broadly, both of these were
found positive and with a similar impact on both general (innovative and non-
innovative) or innovative firms. Interestingly, MBO impact was roughly half the
impact of venture capital on firm growth, whereas MBI had 20x the impact of
venture capital on firm growth. Yet, MBI makeup a very small part of M&A
activity as they are seen as a riskier venture (Wright & Wilson, 2013). Further
analysis at detailed firm size level indicates that both MBO and MBI are
significant drivers for small and medium general firms, with MBI nearly 100x
higher impact on firm growth. While for innovative firms, they are both
significant for medium and large firms. This would appear to support the
literature that mergers which are related to either technology acquisition or
complementary growth could be beneficial. However, this data does appear to
show that while M&As promote growth, their impact is much lower relative to
venture capital which promotes organic growth. This to an extent seems to
support business historians’ claims that organic growth is a greater driver of firm
growth relative to acquisitions. If these conclusions are correct, then policies to
support organic growth should be given a higher precedence over M&A activity –
which would involve retaining firm independence.

Chapter 4 163
Unfortunately, firm independence cannot be evaluated from these regressions,
listed as a collinearity problem in the regression. As this indicator shows low
variation of status over the period of analysis, it is also possible that firm
independence could also be removed as a consequence of using fixed effects
method (FEM). Given the importance of this debate and the possible conclusions
on policies to support firm growth, the next sub-section tries to explore an
alternative regression to evaluate impact of firm independence on firm growth.
Independence of firms
As mentioned above, business historians’ claims that acquisitions can be a
distraction and negatively impact longer term organic growth is an important
concern and if true, has considerable policy implications – specifically as it
would appear to require policies if not to protect, at least to support firm
independence. More so, the data analysis above indicated that venture capital
which supports organic firm growth has at least 2x the impact on form growth
relative to MBO’s, which includes both external acquisitions and internal
management buyouts, appearing to support importance of organic growth.
However, firm independence itself could not be evaluated in above regressions.
Given the importance of this characteristic, as it encapsulates organic firm
growth, an alternative set of regressions are performed in this section to try to
examine this effect on firm growth.
To find a way to analyse independence and whether this matters for firm
growth, a regression is undertaken which compares the growth response of
overall innovative firms (independent and dependent firms) relative to
independent innovative firm growth. Equation (2) is used for FEM analysis for
both these regressions, with independent firm growth being examined by
restricting database to independent firms only, using the firm independence
indicator as provided by Amadeus data and described in data section.
These results of impact of drivers on firm growth for overall (independent and
dependent) innovative firms is listed in column 1, versus growth for independent
innovative firms in column 2, Table 4.7.

Chapter 4 164
Table 4.7 FEM of Innovative independent firm’s growth, compared with FEM for Innovative overall firms (dependent and independent) growth
(1) (2) LHS variable: Firm-growth Dep & Indep firms Independent firms
only All sizes Innovative
firms (Venture Capital 2nd & 3rd round)
All sizes Innovative firms (Venture Capital 2nd & 3rd round)
Control variables: Growth theories
• Gross capital growth
.00008(.0002) -.022(.021)
• Human Resource growth
.493*** (.01) .913***(.1)
• Technology (R&D) growth .0003(.0002) -.0007(.003)
Globalization
• Export growth .00009(.0002) .239***(.024) Tax and Financing policy tools:
• Corporate Tax Growth
-.026 ***(.002) -.119*** (.02)
• Later stage funding (2nd & 3rd round)
.01**(.004) -0.019(.016)
• Replacement
capital (incl secondary buy-outs)
-.022*** (.008) .047(.033)
• Management buyouts
.004*** (.001) -.005(.005)
• Management Buy-ins
.347***(.12) -.722(.49)

Chapter 4 165
• Firm Age -9.03***(2.5) 15.05(10.45)
Constant 231.43***(63.7) -463.89***(322.22)
Observations 5,736 703
No. of groups 2,127 210
Obs per group min = 1 min = 1 avg= 2.7 avg= 3.3 max= 6 max= 6 R-sq within= 0.4182 within= 0.4625 between = .0212 between = .0004 overall = 0.0174 overall = 0.0004 Corr (u_i,Xb) -0.9862 -0.9897
Note: The regression equation uses Eq (2) for (Firm Grth ) = a + b1(Gross Cap Grth) + b2(Cost Emply Grth )
+ b3(R&D Grth) + b4(Exp Rev Grth ) + b5(Int Rates ) + b6(Firmage ) + b7(CorpTaxGrth) ) + b9(Ven Cap) + b10(Lat
Ven Cap) + b11 (Rep Cap) + b12 (MBO) + b13 (MBI) + b14 (Firm Ind) – with lending interest rates and other
late stage lending not listed as they are omitted due to collinearity
*** indicates significance at 1% p-value, ** indicates significance at 5% p-value and * indicates
significance at 10% p-value. Standard errors are listed in parenthesis.
The findings can be summarised as follows:
• Skilled human resource is significant, but approximately 2x higher
impact for independent firms
• The fact that capital and R&D growth coefficient are negative and not
significant, could be consequent of these drivers exerting a delayed
impact on firm growth. This appears to be in line with previous
studies, which have found that there is a lagged impact of R&D
investment on firm profits (Coad & Rao, 2010; Chan et al., 2001)

Chapter 4 166
• Export growth is significant for independent innovative firms, which is
insignificant and very small influence for overall innovative firms.
• Corporate tax growth remains a negative for both types of innovative
firms – overall and independent
• Surprisingly, venture capital (2nd and 3rd round) is negative and is less
significant, as that driver has a p-value of 25%. This finding opposes
the premise from earlier regressions that as venture capital supports
organic growth, it should also thus support firm independence. These
findings appear to show that while venture capital supports organic
growth for overall innovative firm, it does not essentially support
growth of independent firms. Whether this is due to independent firms
seeking debt-finance rather than equity for growth, this regression
cannot answer that. It only indicates that equity financing through
venture capital is a negative impact on growth. Alternatively, this
negative impact of venture capital on independent firm growth could
also reflect the de facto lack of access to internal corporate capital
for independent firms. Given that these further rounds of venture
capital financing could be accompanied by debt or interest paybacks,
which could dilute short-term growth as independent firms lack the
larger corporate financial structure to buffer against debt repayments.
Nonetheless, for independent firms venture capital is not a growth
driver – at least in the short term.
• Similarly, as opposed to overall firms, M&A are not significant as driver
for independent innovative firms, as both MBOs and MBIs are negative
and not significant.
This is an interesting result as it seems to signify that M&A is not the
path of growth for independent firms - supportive of business
historians’ suggestions that those firms which rely on organic growth,
rather than M&A which can be a distraction, have higher long term
growth. This long-term growth for independent firms at least seems
indeed not to come from M&As – but surprisingly another characteristic
which captures the years of independence itself – firm age.

Chapter 4 167
• The biggest surprise is firm age – for independent innovative firms,
firm age has a large positive impact at 15% significance, which is valid
enough to be considered, opposed to negative impact of firm age for
overall innovative firms. Firm age appears to be the largest effect on
growth for firms, with each year since incorporation yielding a 15%
impact on firm growth.
Key findings and policy consequences from regressions on innovative
independent firms are listed below:
• Corporate Tax growth is a negative and thus appears to be a drag on
growth for independent innovative firms – supporting earlier conclusion
that corporate tax should not be a blanket policy, rather tailored
differently for innovative firms and differing firm-sizes.
• Neither venture capital, nor M&A activity appear to drive growth of
independent firms – instead seeming to rely on organic growth, as
suggested by business historians. Providing a much-needed perspective for
the role of venture capital and M&A activity in the policy tool-kit. These
two drivers, venture capital and M&A, while helping overall and
innovative firm growth are not key for innovative independent firms.
Exactly the type of firms - the independent innovative firms that could
become the next UK Googles or ARM, whose absence in UK is the
motivation for this study. So what policy is needed for them? That appears
to get answered in the next observation.
• In terms of firm growth, the largest influence on growth appears to be
interconnected – the age of a firm, when the firm stays independent. Firm
age, which is the years the firm has survived since incorporation, appears
to have a high impact on firm growth – but only for independent firms.
More so, firm independence seems to have a significant multiplier effect
on key growth drivers: skilled human resource and export. It would appear
given the significantly large effect of these three combined aspects, that
independent innovative firms would be expected to grow at a much higher
rate relative to overall innovative firms.

Chapter 4 168
As such, policies to either protect or at least support firm independence,
currently absent in policies – appears to be of critical importance for
boosting firm growth in the UK.
In essence, it would appear that ensuring firms stay independent and age while
retaining independence – could be the single most important contributor to firm
growth, given the multiplier effect of independence. If this is indeed correct,
then the sale of UK’s successful innovative firms before they reach full potential
appears to explain why the UK cannot produce the new frontier giants of the
future – the loss of independence seems to lead to significantly reduced growth
and moreover, these innovative firms do not grow into giants in their own right
as they have become part of another firm.
Overall key findings from Regressions
A) Variables of interest:
Corporate tax:
A surprising finding of this study was the revelation of how corporate tax can
have differing impacts on growth. Corporate tax growth was positive for general
(innovative and non-innovative) firms, indicating firms could seemingly grow
despite increase in corporate taxes – opposite to current emphasis in UK policy
with lowered corporate tax rates as one of the headline policies for firm growth.
However, upon isolating innovative firms, corporate tax was found to be
negative, indicating that a blanket policy for all types of firms may not be
advisable. Indeed, when isolating impact of corporate tax for differing firm size
classes, it appears that micro and large general firms as well as medium
innovative can grow despite increased corporate tax, while medium general and
small innovative firms need reduced corporate taxes to grow.
Furthermore, corporate tax growth has an even larger negative influence on
independent innovative firms, indicating that corporate tax growth is not an
advisable route if UK is wanting its innovative small firms to stay independent
and grow into the next UK ARM or Google. However, it seems that general large
firms could grow despite increased corporate tax, indicting a tailored approach

Chapter 4 169
on this policy may be more advisable relative to current blanket policy
approach.
Perhaps the main takeaway on this is that the magnitude of the impact of this
driver is low relative to other drivers and as such may explain why despite
reduction in UK corporate tax rates over the last decade -UK has not succeeded
in getting UK innovative small firms to upscale. It appears not to deserve the
headline policy status it has been given over the last decade.
Later stage -Venture capital 2nd and 3rd round:
The findings appear to corroborate the importance of venture capital on firm
growth – albeit, its impact on growth is not huge. It appears to be positive and
significant driver for both overall and innovative firms, delivering roughly .01%
firm growth for every million pound invested for overall (innovative and non-
innovative) and innovative firms. Detailed analysis at firm size levels for overall
firms reveals that it’s a significant and positive driver for medium and large
overall firms. In contrast innovative firm size class analysis reveals that this
driver is only significant for micro and medium innovative firms.
In contrast, it appears that venture capital is not significant (indeed negative)
for independent innovative firm growth. If the policy objective would be to
create the future UK Google/ARM, then policy support for venture capital
appears not to be the appropriate choice.
Nonetheless, overall these results would affirm venture capitals position as a
positive driver for SME growth and given that UK’s venture capital is
approximately factor 7~8 lower availability of venture capital ratio to GDP
relative to US (OECD, 2016) – policy effort to enhance venture capital access
seems the correct policy stance. However, the relatively low impact on firm
growth and non-significance for independent innovative firms explains why it
could not in itself be the central policy to scale up innovative firms to become
the future UK googles/ARM of UK. For that yet again, it appears we have to look
if possible for a driver with greater impact.

Chapter 4 170
Mergers and acquisitions (M&A):
The findings suggest that M&As, based on MBO and MBI, seem to be positive and
significant, with a similar impact for both general (innovative and non-
innovative) and innovative firms. Although MBO’s, which include external
hostile/consensual takeovers as well as management buyouts, have a lower
impact than venture capital, approximately half. In contrast MBIs seems to have
a much higher impact than venture capital, yet MBI’s make up a very small
fraction of M&A activity (Wright & Wilson, 2013). Given the lower composition of
MBI in M&A activity, it would appear that overall M&A impact on firm growth is
lower than venture capital and its role as a central tool of firm growth does not
seem to be justified.
Based on MBOs, which appear to be the predominant component of M&A
activity, detailed firm size analysis suggests that M&As drive growth of small and
medium size class for general firms and only large size class for innovative firms.
So, it appears not to be the key driver for scaling up innovative small firms to
become the UK Google/ARM.
In term of independent innovative firms, M&As have absolutely no significance.
Yet again, if the policy objective is to create the next UK Google/ARM, this
would not appear to be a driver at all.
Thus, it would appear that although mergers and acquisitions are much lauded
as a tool of growth, the data in contrast supports the claim by business
historians that M&A activity appears to distract firms from organic growth, which
is the longer-term growth. Specifically, it is not the driver for scaling up
innovative small firms nor specially for independent innovative small firms to
scale up to become the next UK Google/ARM.

Chapter 4 171
B) Control variables, which are basic growth drivers:
Gross capital growth
This was a surprising result when assessing general (innovative and non-
innovative) firms and innovative firms – both regressions found gross capital
growth to be an insignificant driver for firm growth, contrary to expectation.
This also held true for all firm size classes in the detailed analysis. More so, it
continued to be insignificant, although negative, also for independent innovative
firms. It is possible that this is consequent of the fact that capital investment
growth has a lagged effect on growth, which should be explored in future
research. Notwithstanding, at least for the short term capital growth appears to
be insignificant on firm growth.
Human resource growth
This is the most consistently significant and positive driver for all types of firms –
significant for general (innovative and non-innovative) firms and innovative
firms. However, interestingly this driver is 40x higher for innovative firms.
Detailed analysis shows it is a significant and positive driver for all firm size
classes, except intriguingly for micro innovative firm sizes. It appears that
skilled human resource impact on firm growth is positive and immediate, also
comparatively the largest influence for all growth variables.
Reviewing independent innovative firms, independence seems to deliver a
further higher response – in this case, human resource growth delivers x2 higher
than overall innovative firms. It appears that independence has a marked
increase in the impact of human resource on growth, a consistently key
significant basic growth driver.
Technology (R&D) growth
The effect of this driver is only analysed for innovative firms, as non-innovative
firms do not list R&D expenditures. Reviewing overall (independent and
dependent) innovative firms, technology growth is found to be insignificant
although positive driver. Detailed size-class analysis showing it to be a

Chapter 4 172
significant and positive albeit small influence only for large firms, staying
insignificant for rest of size-classes.
For independent firms, technology growth continues to be insignificant although
negative. This requires further review, as it could perhaps be related to
independent firms needing to source external funds for R&D, which are
associated with higher interest rates (Giebel & Kraft, 2015). Further research in
this would appear to be important, as it could indicate that the costs of R&D
could be one of the bottlenecks that may persuade independent firms to sell
out. However, this is only speculation and needs further research for forming a
correct understanding.
Export growth
This was yet again a surprising result – export growth was not significant for
general (innovative and non-innovative) firms nor was it significant for
innovative firms. Exploring firm size classes, it was found to be a positive and
significant driver for micro general firms as well as for small innovative firms,
albeit negative and significant for small general firms. Suggesting it has a
positive growth impact for some types of SME’s, but overall it is not significant
for either innovative or general firms. This is a puzzling result, as it implies that
these firms source their growth mainly from domestic markets, or if they export
then it does not benefit their growth immediately, which should definitely be
examined in future research.
This however totally reverses for independent innovative firms, with export
growth highly significant and a relatively large impact – 5000x that of the
insignificant though positive figure for overall innovative firms. This seems to
suggest that independent innovative firms design their product, be it
manufacturing or services within the UK and exporting that overseas seems one
of the key growth drivers. Once again, it appears that independence has a
marked influence on the ability to generate growth from a basic growth driver.

Chapter 4 173
C) Firm characteristics:
Firm age:
The findings on this firm characteristic were yet again surprising and
unexpected. Firm age is significant and a large negative impact for general
(innovative and non-innovative firms) firms, as well significant and similarly
large negative impact for innovative firms - implying the older the firm, there is
roughly a drag of 10% on growth for each year of existence. This remains true
(with variation of magnitude) for small, medium and large general firms, as well
as true for medium and large innovative firms. Its yet again puzzling, as one
would expect firms at least expanding from their early stages of micro to SME to
show a positive impact of age on firm growth.
Interestingly, this figure yet again totally reverses for independent innovative
firms. The variable albeit significant at 15% p-value, shows an even larger
positive impact on firm growth, suggesting a 15% growth boost for every year of
existence – if firm stays independent. This figure appears to dwarf impacts of
other variables. Given the extent of this impact, it would appear that the longer
firms remain independent, the greater would be the cumulative impact of age
on firm growth. On the other hand, the reverse is also true, non-independent
firms face a cumulative drag of age on growth. This finding would appear to be
in line with the new US behemoths of today. Initially Google (Entrepreneur,
2008) and Facebook (Tech Crunch, 2012) were only small successful disruptors,
but with the passage of time their growth has seemed to accelerate, in
accordance with their age of independence (BBC News, 2016; Bellis, 2017).
This result is quite significant, as it underscores the importance of firm
independence in firm growth – offering a partial explanation why UK’s innovative
firms may not scale up to become the next UK ARM/Google, if they lose
independence underway on their growth path.
Firm independence:
This was perhaps the most critical finding of the study – firm independence itself
appears to be the most vital contributor to firm growth. Independent innovative

Chapter 4 174
firms reap more from basic growth drivers and more so, there is a growth boost
for each year of independent firm existence – impact of firm age on firm growth.
Indeed, the difference in impact for basic growth drivers is quite striking, with
human resource growth x2 higher for independent innovative firms relative to
overall innovative firms and export revenue growth x5000 higher. More so, firm
age would deliver a boost of 15% a year. Such a significant difference in firm
growth for independent firms causes pause for thought.
Out of the policy tools, only reduced corporate tax is beneficial for independent
firm growth. Venture capital is not significant and negative, similarly M&A
activity is not significant and negative. There is currently no policy specifically
to support firm independence nor protect firms from takeovers in the UK, unlike
US or European economies which have varied mechanisms such as Dual shares,
staggered boards, poison pills (Mayer, 2018).
If these findings are indeed correct and it is difficult to assess the counterfactual
given data limitations, then the sale of successful UK innovative firms before
they reach potential, could significantly reduce their growth path – possibly
offering a partial answer to why UK does not have its own new frontier
behemoths.
Thus, in the main, it would appear that perhaps the most vital contributor to
firm growth is independence - more so than the other variables of interest.
However, there is currently no policy in place to either support or protect firm
independence.
4.6 Conclusion
The aim of this study was to seek to understand why UK has not produced the
new innovative giants of tomorrow and whether firm independence matters –
through examining the sufficiency and effectiveness of current policy tools
promoting firm growth put in context of the growth drivers.
The question, put in other words, is whether these various policy initiatives over
the last few decades in UK could have inadvertently shaped the current UK

Chapter 4 175
economy – perhaps boosting the creation of innovative start-ups like DeepMind
(Shead, 2016), but not sufficient to support firms to last the distance to scale up
to create the Googles itself? Furthermore, as the sale of potential successful
innovative UK firms before reaching their potential, which is a part of M&A
activity, appeared to be of relevance to this issue - it became important to
identify the impact of independence on firm growth. As firm independence is
currently absent in policy, its influence on firm growth is examined to gauge
either its relevance or importance towards this problem.
To enable this examination, initially the basic drivers of firm growth are
examined alongside the current policy tools which drive firm growth: tax &
financing incentives and M&A activity. These are examined first for general
(innovative and non-innovative) firms and then innovative firms separately,
thereafter being compared to innovative independent firms. To identify the
influence of independence, the growth reaped from basic growth drivers was
examined and compared to the influence of current policy tools promoting firm
growth.
The main contribution of this study was to understand the influence of
independence on firm growth in context of the current policy tools - as research
seems currently virtually absent on the influence of firm independence on firm
growth. Moreover, this appears to be important, as independence is currently
neither protected nor specifically supported in growth policy. Furthermore, this
study aimed to place the value of the various growth policy tools into the
context of actual firm growth and thus to reassess either insufficiencies or
shortcomings in the current policy toolkit.
The extent of impact of firm independence on growth was striking and
unexpected, with evidence in fact indicating it to be a vital factor for firm
growth. Contrary to expectation, the difference reaped in basic growth drivers
by independent firms was striking. The difference in impact for basic growth
drivers for independent innovative firms relative to overall innovative firms can
be summarised as follows: human resource growth x2 higher; and export revenue
growth x5000 higher. Moreover, each year of firm independence delivers a bonus
independence dividend - a remarkable 15% increase in firm growth per year,
though this had 15% significance. Given these quite striking differences in growth

Chapter 4 176
that independent firms reap from skilled human resource, a key growth driver,
and from globalisation, coupled with the bonus dividend for each year of
independence - raises firm independence as an important consideration for firm
growth.
Notwithstanding the importance of independence for firm growth, tax and
financing incentives, as well as merger and acquisition (M&A) activity are also
critical drivers influenced by policy impacting firm growth. While firm
independence results are persuasive in suggesting there should be some policy
space to protect or support it, nonetheless the other policy incentives are
important as they work to support different types of growth, offering firms’
choices to create a diversified firm landscape for a successful economy. So, how
did the tax and financing incentives and M&A activity stand up to evaluation?
Firstly, the much-publicized claim that corporate tax cuts are needed for firm
growth, appears not to be the case for all types of firms. It appears that general
(innovative and non-innovative) firms can seemingly grow despite increase in
corporate taxes. However, it is true that for innovative firms specifically,
corporate tax growth was found to be negative impact on firm growth, indicating
that a blanket policy for all types of firms may not be advisable. Furthermore,
corporate tax growth has an even larger negative influence on independent
innovative firms, indicating that corporate tax reduction for innovative firms
does appear to be the correct policy stance. Nonetheless, given the variation of
impact for general firms, a tailored approach on corporate tax reduction policy
may be more advisable rather than the current blanket policy approach.
Perhaps the main takeaway on corporate tax reduction is that the magnitude of
the impact of this driver on firm growth is low relative to other drivers,
appearing not to deserve the headline policy status it has been given over the
last decade.
Secondly, are the tax and financing incentives aimed at increasing seed and
venture capital, helping firm growth? The findings appear to corroborate the
importance of venture capital on firm growth – albeit its impact on growth is not
large, it is a positive and significant driver for both general and innovative firms.
In contrast, it appears that venture capital is not significant (indeed negative)

Chapter 4 177
for independent innovative firm growth. Nonetheless, incorporating detailed
analysis, the results affirm venture capitals position as a positive driver for SME
growth. Given that UK’s venture capital is approximately factor 7~8 lower
availability of venture capital ratio to GDP relative to US (OECD, 2016) and is
considered to be one of the alternatives for longer term funding for firms, then
increasing availability of this type of capital should partially address the scaling-
up difficulties of current UK innovative start-ups.
However, the relatively low impact on firm growth and non-significance for
independent innovative firms suggests it could not in itself be the central policy
to scale up innovative firms to become the future UK googles/ARM of UK. For
that yet again, it appears we have to look if possible for a driver with greater
impact.
Thirdly, how does merger and acquisition activity influence firm growth? The
findings suggest that M&As, based on MBO and MBI, seem to be positive and
significant, with a similar impact for both general (innovative and non-
innovative) and innovative firms. To be noted though that MBO’s, which include
external hostile/consensual takeovers as well as management buyouts, have a
lower impact than venture capital, approximately half. In contrast MBIs seems to
have a much higher impact than venture capital, though MBI’s make up a very
small fraction of M&A activity (Wright & Wilson, 2013). More so, detailed
analysis revealed that M&As do not drive firm growth for innovative SME’s, only
large innovative firms and general SME’s.
Furthermore, in term of independent innovative firms, M&As have absolutely no
significance. As firm independence seems to have a considerable impact in
driving firm growth, these findings place this driver in context for its impact on
firm growth. Thus, while merger & acquisition are an important option for firms,
whether as a choice of exit of firm owners or as a means of improving a failing
business or means of growth through technology acquisition – it appears not to
be the option for delivering growth for either innovative SME’s or independent
successful innovative firm.
Thus, it would appear that although mergers and acquisitions are much lauded
as a tool of growth, the data in contrast suggests it is not a driver for scaling up

Chapter 4 178
innovative SME’s nor specially for independent innovative small firms to scale up
to become the next UK Google/ARM.
In summation, it appears that the impact of these policy tools pales relative to
firm independence – for which there is currently no policy support or protection
in place. Thus, although corporate tax reduction and venture capital
enhancement are policies that do support innovative firm growth, in contrast to
M&A’s which have no impact on scaling up innovative SMEs – the most important
policy for firm growth could be support of firm independence. Currently absent
in policy.
This brings the study back to its earlier concerns – that the sale of successful
innovative firms before reaching their potential be one of the underlying reasons
that UK does not have the successful new innovative behemoths of the future.
This concern appears to be validated by data, given the quite large impact of
firm independence. What then can explain the sale of these firms before
potential?
Given the relatively large impact of firm independence on firm growth, the lack
of policies to support or protect firm independence could be crucial. Perhaps
reconsideration of the Enterprise Act (2002) would enable some protection for
firm independence through assessing whether and how firms may be protected
from hostile takeovers. This study’s findings underline that merger and
acquisitions can be an option for some firms, be it as an exit route or to bring in
best practices to improve growth – but that option, as it involves losing
independence, comes at the potential sacrifice of growth for successful firms.
Hence a firm should retain choice for this path, an option a hostile takeover
seems to remove from the firm. A possible option is the ‘poison pill’option
available to firms in the Netherlands (Harvard Law School Forum, 2015) or dual
class shares, staggered boards as in US (Mayer, 2018). The recent decision by
Unilever to relocate its HQ to the Netherlands (FT, 2018), as well as GKN’s loss
to Melrose in a hostile takeover that went to the wire (FT, 2018) , both seem to
underscore the need for re-evaluation.
Chapter 4 179
More so, lack of significant long-term financing could be another critical
problems, as venture capital provides one channel through which firms secure
longer term financing, enabling SME firm growth. Though it is not significant in
this study for innovative independent firms. Given that venture capital as a ratio
of GDP is a factor of 7~8 times lower in UK relative to US (OECD, 2016), it is
perhaps not coincidental that UK has a factor of 6-7 times lower large firm share
presence in the economy compared to US (SBA , 2016). This dearth in availability
of venture capital, could conceivably encourage firms to sell in UK, rather than
face the battles of uphill struggle to secure finance (Economist, 2017).
Increasing the size of available venture capital for firms in the UK would thus
seem a policy priority, providing one option of long-term finance for innovative
firms wishing to scale-up and last the distance. Perhaps, UK could pursue an
initiative similar to Israel’s successful venture capital investment programme as
YOZMA (OECD, 2015). Started in 1993, with 0.1 percent of its GDP in public funds
to leverage foreign financing, it was so effective at encouraging privately
financed venture capital growth that the government could begin to phase out
within 7 years. Alternatively, UK could consider introducing measures to enhance
pension fund expansion in venture capital. Maybe, in the vein of the US 1979
Employment Retirement Income Stabilization Act, which appeared to propel
venture capital expansion in Silicon Valley (Bottazi & Da Rin, 2002). It would
appear that this latter direction is supported by UK government in current white
paper on Industrial strategy (Financial Times, 2017).
In summary, it would appear that the key growth policies for UK to support its
innovative start-ups to have the chance to become a future Tesla or Google are
two-fold. Firstly, the government might bring in some policy measures to protect
or enhance firm independence – currently absent in policy. Secondly, as the
availability of venture capital in the UK is far lower than in the US, policies to
further enhance availability of venture capital are much needed, as longer-term
finance enables firms the choice of staying independent. Specially, as firm
independence appears to have such a paramount impact on firm growth and UK’s
potential giants appear to get sold before reaching potential - these two policy
shortcomings could perhaps partially explain UK’s current lack of new tech
giants. Yet, it would appear that potential UK behemoths, not short of funding,
nor targets of hostile takeovers – did indeed decide to sell (Sawyers, 2016; BBC

Chapter 4 180
News, 2016). The above policy suggestions would not have had any influence in
such a situation.
Moreover, it is puzzling that not a single UK innovative firm created in the last
30 years, except ARM, lasted the distance to become a valuable tech firm. Given
the successful start-up intensity in UK, the fact that except for ARM holdings not
a single tech frontier firm appears to have lasted the distance to become a UK
giant is truly perplexing. It is not as if there is a total absence of venture
capital, nor do all firms face hostile takeovers. Perchance, there is something
else, something deeper – embedded in the mind-set perhaps?
To find answers that delve deeper is beyond the scope of this study, but perhaps
some clues to the answer may be found in historical analysis of innovative
societies (Mokyr, 1990). While the historical discussion cannot be addressed in
this study, Mokyr offers some insights to explain how innovative societies such as
the Arab or Ottoman Empire or China were left behind by European industrial
revolutions despite their innovative lead. According to Moykr (1990), the role of
an innovator is central to grow innovative societies in the long run and the lack
of flow of financial rewards to innovators in Arab or Ottoman empire and the
lack of status of Entrepreneurs relative to Mandarins in China hindered the
innovator from acquiring that central role in those economies. Whether that
historical parallel would offer any clues to the situation in the UK is unclear,
however further combined economic and historical research into this area could
yield insights into deeper underlying issues not answered in this study. Such as
whether rewards currently flow to innovators in the UK and/or is there a need to
raise the status of innovators presently in the UK? Or do innovators prefer low-
risk and liquidate gains earlier, rather than lasting the distance to reap higher
gains, but with higher risk? Future research to assess the role of innovator in UK
society today, could perhaps yield some clues to this puzzle. As UK needs the
visionary entrepreneurs, seeking to change the world as we know it today -
looking beyond initial financial gains - to successfully create the Googles of
tomorrow.

181
Chapter 5 Conclusion
5.1 Summary and key insights drawn from research
This research aspired to widen current concepts of innovation and growth
through uniting neoclassical stream of thought with evolutionary economics,
while further sourcing understandings relevant to innovation from development
economics, economic history, industrial organization and entrepreneurial
management & finance literature. Through merging of not only these two
paradigms of thought but also these other inter-related fields, this research
seems to contribute by widening the field of economics of innovation. Not only
does this research widen some of the concepts, it goes a step further by
connecting innovation to the field of productivity and growth. Analysing
productivity through incorporating innovation structures into economic growth
development economics models. It concludes by introducing a new concept, the
characteristic of firm independence, into the study of growth.
The central theme of this research is that neoclassical factors of production do
not perhaps operate in a vacuum in an economy. Rather they are interconnected
through linkages and structures, the exposure of which emphasises the
importance of supporting these underlying connections as much as the factors of
production, when devising policies. Notably in the field of growth and
productivity, given the interaction of innovation with both these aspects of an
economy.
In particular, this research sought to broaden the current understanding of
innovation and its interlinkages with productivity and growth. To widen the
analysis of innovation combining formal innovation drivers alongside informal
drivers, whilst at the same time exploring the structural aspects governing
innovations relationship with productivity and growth. Essentially trying to
discern how both the wider set of drivers and the deeper structural
determinants of innovation, shape productivity and growth.
In line with these goals, this research assessed three problems in particular:
identifying a wider spectrum of innovation drivers explaining firm growth and
how these differ across firm structures; revealing the deeper firm and sectoral

Chapter 5 182
structures that define productivity adapting development economics models;
and, exposing the role of firm independence in shaping firm growth and how this
effect compares with current policy tools aimed at shaping firm growth.
To build the wider concepts at the outset, this research used aggregated firm
level data to form understandings across EU economies at country and sector
level. Building upon these insights, the last chapter focussed on UK, using firm-
level data to shed light upon key aspects which support firm growth .
The main empirical findings of this research support the central theme that
neoclassical factors do not operate in isolation and that linkages and structures
emphasize the intricate relationship of innovation with productivity and growth.
Using panel innovation, skills statistics and IMF data of 27 EU economies from
1996-2010, the second chapter of this research broadened the analysis of
innovation in firms by adopting a wider concept, one encompassing drivers
sourced across growth theory, evolutionary economics, industrial organization
theory and globalization. In fact, combining innovation drivers sourced from
formal R&D processes promoted by growth theories alongside informal R&D
linkages emphasized by national innovation systems (NSI). Although both R&D
aspects are well researched for their importance towards innovation, this study
researched whether there is an order to this contribution. In effect,
distinguishing influences shaping revenue levels as primary drivers and those
shaping revenue growth as secondary. The study revealed that industry linkages
with academia, public funding of industry, linkages with suppliers and skilled
human capital are found significant as primary drivers of innovative firms across
all firm sizes. Although R&D investment is not found significant as a primary
driver, it is significant as a secondary driver delivering growth of innovative
firms. Thus, informal R&D processes such as linkages and tacit knowledge were
found to constitute the primary driver, while formal R&D processes such as R&D
investment acts as a secondary driver. The key insight that a broader set of
policy tools could be used to encourage innovation, which is an important finding
for shaping future innovation policies. Significantly, there is an order to this
broader set of tools: the initial foundation of innovation driven through primary
drivers of informal R&D linkages and tacit know-how, followed by formal R&D
investment as secondary driver spurring growth.

Chapter 5 183
Building upon this groundwork of importance of firm structures in the arena of
innovation, the third chapter of research draws structures into an understanding
of productivity– based on economic development theoretical frameworks. In
particular, this chapter explores the structural compositions of the economy that
may influence productivity. Not discarding the importance of factors of
production, the chapter instead seeks to understand the structures beneath,
channelling those factors of production. Using an adaptation of the economic
development framework, the Lewis model, this study proposes that country level
labour productivity may be driven structurally by the movement of resources
across from smaller firm sizes to larger firm-size structures. To enable this
analysis, a new database is built up at sector level for the 32 European
economies between 2000-2012. The contribution of firm-sizes to country
productivity is measured through isolating classifications of small, medium and
large firms, alongside control variables capturing growth theory drivers,
globalization, credit conditions and monetary lending policies. Large firms are
indeed found to be the significant most structure for country labour
productivity. These findings underscore that focus on factors of production
alone, be it firm investment or skills shortage, may not be sufficient to improve
productivity – understanding the firm-landscape composition may be as
essential.
Additionally, this chapter examines whether sectoral composition of an economy
can shape country labour productivity levels. The chapter investigates both
aspects, sector size and sector productivity, and how they influence in shaping
country labour productivity. The findings from this sector composition analysis
seem less clear. Some sector productivities were found significant for country
productivity, while sector revenue-size was found significant for some sectors.
These results suggest that firm structures may not be an equally sensitive issue
over all sectors.
Nonetheless, these results offer two insights. Firstly, those sectors which
influence country productivity through both sector size as well as sector
productivity, require policy makers to tailor policy accordingly to both aspects.
Secondly, this finding has possible implications for firm-structures most suited to
sectors depending upon their mode of influence. Though needing further
corroborations, the implication is that sectors influencing through size would

Chapter 5 184
benefit most from presence of turnover contributions of all three firm-size
structures. In contrast, sectors contributing through sector productivity may
benefit from a higher intensity of large firms in that sector. These implications
were outside the scope of the current study due to limitations of firm-structure
classification at detailed sector level data. Should that data become available in
the future, these implications could be corroborated allowing future policy
support of firm-structures to be shaped in accordance to mode of influence of
sectors.
Lastly, chapter three also examined whether sector share, the proportion of
sector turnover to total core innovative sectors turnover, as distinguished from
sheer size of sector also exerts an influence on country productivity. The results
indicate that for some sectors, sector share of turnover is significant as a mode
of influence, although comparatively less sectors than those found significant for
size of turnover. More so, of those sectors found significant in terms of share,
quite a large number appeared to have a negative influence on country
productivity. Although isolating the cause for this result is outside the scope of
the study, this could be indicative of a negative impact through either
dominance or conversely weakness of sectors proportional to the total
innovative sectors. Further in-depth research would be needed to assess whether
this is or is not an issue for country productivity.
The fourth chapter of research, building upon the knowledge and insights gained
from foundational chapter, tackles one of the very concrete current problems in
the UK economy – the weakness of UK firms to scale up. This chapter examines
whether firm independence, not known to be driver for firm growth itself, is an
important criterion to enable scale up of innovative firms into successful frontier
large firms. To shed light on the role of independence brought to the fore in
business history and financial enterprise literature, the study examines
neoclassical drivers of firm growth alongside key policy tools used to support
firm growth – with innovative independent firms separately assessed from overall
innovative firms. Using firm level dataset for all UK sectors between 2006-2016,
policy tax and financing tools supporting start-up, growth and merger activity
are examined alongside growth theory drivers, globalization and monetary
lending policy. The empirical analysis reveals that independent firms reap much
higher growth, with age of independence delivering a bonus growth-dividend

Chapter 5 185
based solely on the years that a firm can manage to stay independent. Contrary
to expectation, the growth from the traditional policy tools, though valuable,
seems outweighed by the impact of firm independence on growth. It appears
that firm independence itself is a vital aspect for growth – an aspect neither
enhanced nor specifically protected in current UK policy. Policy tools, currently
used in US or Europe such as staggered boards, poison pills or Dual class shares
or reshaping of UK Enterprise act 2002 could perhaps be considered to form
policy support for firm independence in UK.
Notwithstanding this, current policy tools remain a critical component to aid
growth. In particular, two findings stand out. Firstly, although relatively smaller
in impact, both corporate tax reduction and access to seed and venture capital
appears important to support long-term growth for innovative firms. Though
general firms can grow despite increases in corporate tax, suggesting a tailored
policy approach is advisable. Secondly, M&A activity appears to enhance growth
of general SME’s, not innovative SME’s only large innovative firms, suggesting
M&A’s have a role for growth overall – but not for helping scale up the innovative
small firms of today to become the frontier giants of tomorrow. These findings
invite a rethink of current UK M&A regulation, balancing encouraging M&A
activity for overall firms and for large innovative firms, with some protection for
innovative SMEs desiring to scale up into possible frontier firms like ARM/UK
Googles of tomorrow.
5.2 Future Areas of Research
This research has built on a legacy of research and literature, drawing
understandings and insights not only from neoclassical and evolutionary
economics, but also from disparate fields of business history, industrial
organization and financial and management enterprise literature. The insights
were used to guide this research, but despite enormous efforts to draw the
maximum insight into this research, one of the challenges lay in the limitations
of data. While the increased availability of panel data shed light on many
insights, some of the puzzles could not be clarified within the current databases
and leave avenues open for future research. I would like to point a few, which I
think would continue to develop our understanding of innovation and its
intricate relationship with growth.

Chapter 5 186
One of the puzzles only alluded but not resolved in the second chapter on
innovation drivers lies in assessing the consequences of short-term versus long-
term ownership and governance structures on firm growth. Given current data
limitations, this could not be assessed directly, yet it is an important issue. The
focus in EU since 2008 to build demographic firm data, which would over time
gain sufficient increase in longitudinal time, could in future be linked to
financial databases with ownership data. Such an option, might not only enable
consequences of ownership structure to be explored, it may also provide further
insights on how diffusion or maturing of technology (Tunzelmann G. V., 2000)
may change innovation drivers shaping policy makers insights accordingly.
Similarly, the third chapters’ research on assessment of firm structures influence
on productivity within sectors was limited by data availability to 10 aggregated
sector levels. Should detailed firm structure of each sector be made available,
that would develop deeper understanding on the interaction of structures and
productivity at sector level. Furthermore, it could expose sectoral variations,
allowing identification of sectors differing from the norm, and even revealing
perhaps sectors where SME’s could have higher productivity relative to larger
firms, thus allowing in turn fine-tuning of policies to the needs of sectors. Lastly,
if data was made available not only on firm structures at sector level, but also of
firm-type, innovative versus non-innovative firm – that could shed light on the
intriguing puzzle how and why sector shares could negatively impact an
economy. These queries, should data be made available, could help further
develop our understanding on how structures influence productivity of
economies.
Another critical aspect for advancing insights of innovation in the future, hinted
but essentially left unanswered in chapter 4, is perhaps as much a challenge in
capturing values, as perhaps regulations or policy to support independence to
boost firm growth. This pertains to the puzzle of the role of an innovator in
lasting the distance and enabling a small firm to become a behemoth of
tomorrow. Indeed, queries seeking answers as to why potential UK behemoths
like Skyscanner or ARM, not short of funding, nor targets of hostile takeovers –
did indeed decide to sell (Sawyers, 2016; BBC, 2016), are not easily addressed.
Yet, they need to be understood. Historical analysis seems to offer some
possible clues. According to Mokyr (1990), historically innovative societies that

Chapter 5 187
failed to develop in the long run, missed allocating innovators a central role in
the innovation process: captured either by lack of status of innovators in some
societies; or a lack of flow of financial rewards to innovators in others. Should
future research perhaps combining historical business studies with demographic
data offer possible insights into the aspirations of innovators, these would be
very revealing. In fact, not only revealing, they could help shape policies dealing
with the unit at the very crux of innovation – the innovator.

Chapter 5 188
188
Appendix
Chapter 1 appendix
Apendix A: Statistics of data variables representing drivers
Table A1 provides the descriptive statistics for the drivers listed in table 2.
Table A1: Descriptive Statistics for variables used in regression analysis Mean Standard
deviation Minimum Maximum
Innovative Turnover 3.76e+08 6.92e+08 2573667 4.20e+09 Number of Scientists and Engineers (Skilled human capital)
332.1915 478.5706 4 2281
Total innovation expenditure (R&D investment)
9533784 1.99e+07 20934 1.07e+08
Enterprises using external R&D
2167.616 3060.054 4 16242
Enterprises using internal R&D
5110.252 8195. 296 61 40753
Enterprises with access to public funding _
2420.488 3926.076 14 18573.14
Enterprises with any type of cooperation
2638.093 3529.394 36 20949
Enterprises collaborating with universities
980.0557 1503.702 6 11305
Enterprises collaborating with govt. institutions
647.2313 869.0159 3 4805
Enterprises collaborating with suppliers
1599.733 1951.613 26 13886
Enterprises focusing on National markets
5642.08 8543.078 65.248 45821
Enterprises focusing on International markets
4195.015 6092.886 28 33153
Small firm Innovative turnover (less than 50 emplyees)
4.43e+07 7.26e+07 243162 4.43e+08
Medium firms Innovative turnover (less than 250 employees)
7.34e+07 1.22e+08 179474.8 8.09e+08
CIS and HRST database, Eurostat
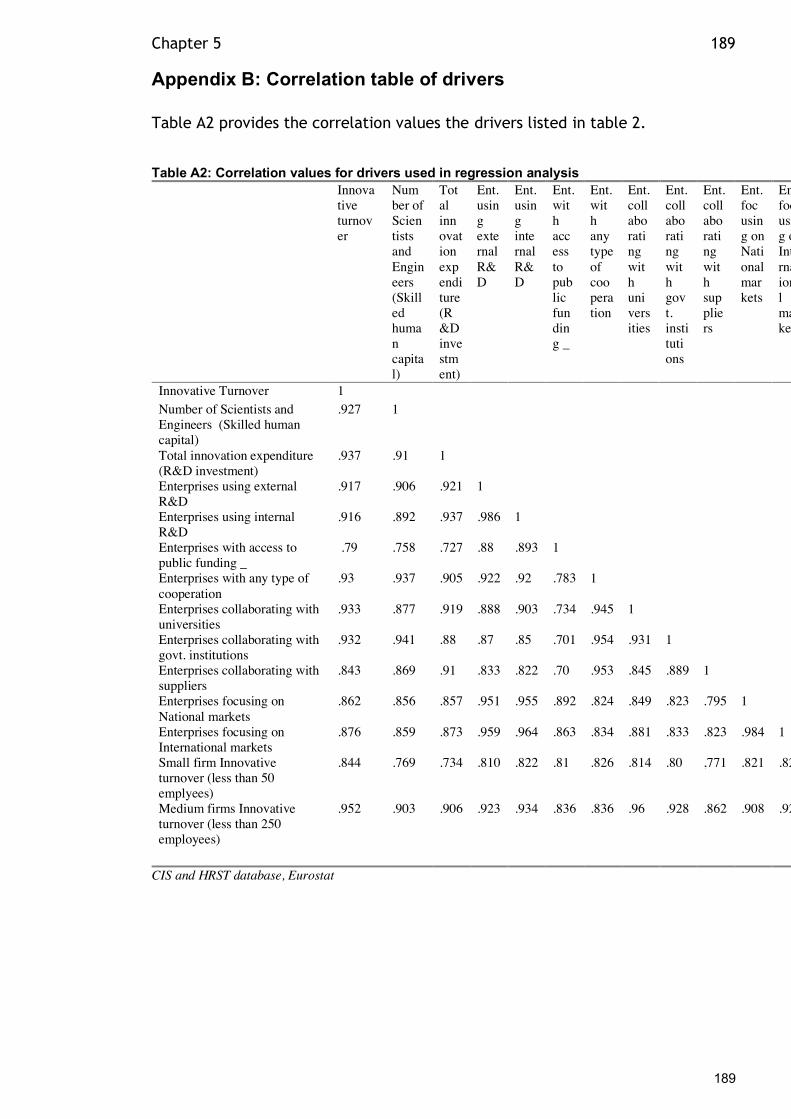
Chapter 5 189
189
Appendix B: Correlation table of drivers
Table A2 provides the correlation values the drivers listed in table 2.
Table A2: Correlation values for drivers used in regression analysis Innova
tive turnover
Number of Scientists and Engineers (Skilled human capital)
Total innovation expenditure (R&D investment)
Ent. using external R&D
Ent. using internal R&D
Ent. with access to public funding _
Ent.with any type of cooperation
Ent. collaborating with universities
Ent. collaborating with govt. institutions
Ent. collaborating with suppliers
Ent. focusing on National markets
Ent. focusing on International markets
Innovative Turnover 1 Number of Scientists and Engineers (Skilled human capital)
.927 1
Total innovation expenditure (R&D investment)
.937 .91 1
Enterprises using external R&D
.917 .906 .921 1
Enterprises using internal R&D
.916 .892 .937 .986 1
Enterprises with access to public funding _
.79 .758 .727 .88 .893 1
Enterprises with any type of cooperation
.93 .937 .905 .922 .92 .783 1
Enterprises collaborating with universities
.933 .877 .919 .888 .903 .734 .945 1
Enterprises collaborating with govt. institutions
.932 .941 .88 .87 .85 .701 .954 .931 1
Enterprises collaborating with suppliers
.843 .869 .91 .833 .822 .70 .953 .845 .889 1
Enterprises focusing on National markets
.862 .856 .857 .951 .955 .892 .824 .849 .823 .795 1
Enterprises focusing on International markets
.876 .859 .873 .959 .964 .863 .834 .881 .833 .823 .984 1
Small firm Innovative turnover (less than 50 emplyees)
.844 .769 .734 .810 .822 .81 .826 .814 .80 ,771 .821 .827
Medium firms Innovative turnover (less than 250 employees)
.952 .903 .906 .923 .934 .836 .836 .96 .928 .862 .908 .923
CIS and HRST database, Eurostat

Chapter 5 190
190
C: Overview of proportional ratios for R&D, for top 10 Economies according to R&D investments
Table A3: Top 10 EU economies ranked in order for proportional ratio of R&D driver (innovation output per R&D input, measured in billion Euros output per million Euro R&D investment), covering the period 1996-2010 Countries Proportional Ratio R&D
(innovation output per R&D input, measured in billion euros output per million euro R&D investment)
R&D investment (comprises total R&D costs, including capital and knowledge acquisition, measured in millions of Euros)
Mean Innovative turnover (all firms) – main innovation measure (measured in billions of Euros)
Spain 0.06 10.5 0.63 Poland 0.043 5.57 0.24 Netherlands 0.042 8.9 0.38 Italy 0.04 21.6 0.92 France 0.036 35.7 1.33 UK 0.036 27.8 1.00 Belgium 0.034 8.5 0.29 Germany 0.032 94.9 2.99 Finland 0.028 5.6 0.16 Sweden 0.02 13 0.26
CIS database, Eurostat
D: Overview of R&D figures for advanced economies
A brief overview of mean R&D figures14,over the period 2000-2010 of advanced
economies, as listed in table A4, contrasts with the performance mean
innovation measure over period 1996-2010 of EU economies under review in this
study in Table A5. Table A4 appears to highlight the variation in delivery of
innovation in economies based on R&D investment alone, Table A4 also including
figures on US as a benchmark for comparison. It is noteworthy to see how much
of GERD is financed by governments and how much by businesses. It seems that
quite a few of the higher performing innovative economies amongst top 20 have
a government financed GERD around 0.7%. More remarkable to note perhaps is
that the difference for the relative much higher GERD appears to be driven by
business’s financing, as evident for Sweden, Finland, Germany, Denmark and US.
Comparing figures within Table A4, it is noticeable that despite a considerable
global innovative lead by US along with Japan over EU economies (PRO INNO
Europe, 2007) (Pro Inno Europe, 2011), Sweden appears to have a higher
expenditure on R&D, both in GERD and BERD. Though Sweden in its own right is
14 As R&D expenditure is often listed both in terms of gross domestic R&D expenditure (GERD) and
business expenditure on R&D(BERD), the mean values for both are provided in table 1, covering the period of 1996-2010.

Chapter 5 191
191
ranked as one of the leading European innovative powers, it still trails behind US
(European Commission, 2013), yet its R&D expenditure is substantially higher
than US. In contrast, Germany and Denmark seem to have relatively similar
levels of GERD to US, with Finland though again higher comparatively. Thus,
underscoring the variation in R&D investment in order to deliver similar levels of
innovation performance, as measured by EIS. These R&D investments of Table A4
contrast with innovation measure performances in Table A5, illustrating the
complexities of an innovation system indicating importance of drivers beyond
R&D as a means to explain the resulting level of innovation in an economy. To
enable a comparative comparison of GERD as share of GDP with the innovative
measure, the innovative measure as a share of GDP is listed in Table A6.
Although this realigns the top 20 EU economies, Germany still outperforms the
other European G7 economies, with UK surprisingly at the bottom of the table.
It seems that the delivery of a high innovation measure may be possible with a
wide variation of R&D investment values, with Germany appearing to score the
highest innovation measure in Table A5 despite listing a lower R&D investment
than some other economies in Table A4. The next section lists the top 20
economies in the innovation measure in Table A5 and then lists the top 10
economies according to performance of the various drivers in Tables A7 and A8.
Table A4: Mean R&D and BERD expenditure between 1996-2010, as %age of GDP Countries (Gross
Domestic expenditure on R&D) 15GERD as %age of GDP
GERD financed by govt. as a %age of GDP
GERD financed by Business as %age of GDP
(Business Enterprise expenditure on R&D) 16BERD as %age of GDP
%age of BERD financed by govt.
Austria 2.14 0.78 0.97 1.60 8.07 Belgium 1.87 0.44 1.18 1.31 5.92 Czech Republic
1.15 0.49 0.58 0.68 12.85
Canada 1.87 0.59 0.91 1.07 3.07
15 Definition of Gross domestic spending on R&D (GERD) as defined by OECD: The total
expenditure (current and capital) on R&D carried out by all resident companies, research institutes, university and government laboratories, etc., in a country. It includes R&D funded from abroad, but excludes domestic funds for R&D performed outside the domestic economy
16 Definition of Business enterprise expenditure on R&D (BERD) as defined by OECD: Represents the component of GERD incurred by units belonging to the Business enterprise sector. It is the measure of intramural ( ie within the sector) R&D expenditures within the Business enterprise sector during a specific reference period.

Chapter 5 192
192
Denmark 2.40 0.70 1.42 1.62 3.40 Finland 3.22 0.85 2.22 2.26 3.45 France 2.12 0.81 1.10 1.33 10.25 Germany 2.42 0.75 1.59 1.67 6.26 Hungary 0.88 0.43 0.35 0.40 8.89 Ireland 1.24 0.35 0.73 0.85 4.33 Italy 1.07 0.51 0.48 0.54 10.65 Luxembourg 1.60 0.30 1.17 1.33 3.31 Netherlands 1.77 0.70 0.85 0.94 4.47 Poland 0.61 0.37 0.20 0.20 20.13 Portugal 0.90 0.49 0.33 0.35 5.20 Romania 0.48 0.24 0.18 0.26 35.37 Spain 1.04 0.44 0.48 0.55 11.84 Sweden 3.45 0.87 2.28 2.54 6.00 Turkey 0.54 0.25 0.23 0.19 5.76 UK 1.61 0.50 0.73 1.02 8.60 US 2.59 0.78 1.65 1.83 11.05
Mean Gross domestic expenditure on R&D (GERD) and Businesss enterprise expenditure on R&D (BERD)
for period 2000-2010 (OECD Main science and technology indicators -MSTI- database)
E: European economies performance in the Innovation measure and drivers
EU economies based on performance in Innovation measure As the innovation
measure is the key criterion for establishing level of innovation in economies for
this research, bearing in mind the definitions as outlined in the data section, the
top 20 economies are listed in table A3, based on a mean value of innovation
measure from CIS data over the period 1996-2010. It is a different ranking of
economies17,then that indicated by the level of R&D expenditure as listed in table
3. The ranking based on the main innovation measure in the second column,
shows Germany, France and UK as the top 3 innovative economies out of the 27
EU economies included in this research, based on innovative firm performance.
The spread between UK, France and Germany is quite large, with Germany
nearly a factor 3 higher than UK in the main innovation measure. Germany
maintains this lead for small firms and medium firm innovation measure, though
Italy and UK jump upwards to second place for these two variables respectively.
Again, though worth noting is the remarkably large difference between Germany
and any economy coming up in second place.
17 US is not included in this ranking, as its economy is not covered by CIS data

Chapter 5 193
193
However, the economies realign when reviewing innovative measure as share of
GDP as listed in Table A6. Despite realignment Germany still outperforms the
European G7 economies substantially, with UK surprisingly at the bottom of the
table. This seems to reaffirm the complexity of innovation systems. Not only
confirming the importance of the wider set of innovation drivers but also as
summarized in conclusion, the importance of structural aspects – such as firm
structures in an economy.
Table A5: Top 20 EU economies ranked in order for mean innovative turnover in absolute value (in billion euros) for all firm-sizes, covering the period 1996-2010 Countries Mean Innovative
turnover (all firms) –
main innovation
measure (measured in
billion euros)
Mean innovative
turnover (as share
of avg GDP for
same time period)
x 1000
Mean
innovative
turnover
(for only
small
firms)
Mean
innovative
turnover (for
only medium
firms)
Germany 2.99 1.33 0.23 0.48
France 1.33 0.81 0.11 0.19
UK 1.00 0.56 0.13 0.23
Italy 0.92 0.67 0.16 0.21
Spain 0.63 0.77 0.08 0.12
Turkey 0.62 1.7 0.27 0.14
Netherlands 0.38 0.74 0.05 0.092
Belgium 0.29 1.0 0.048 0.067
Sweden 0.26 0.88 0.04 0.048
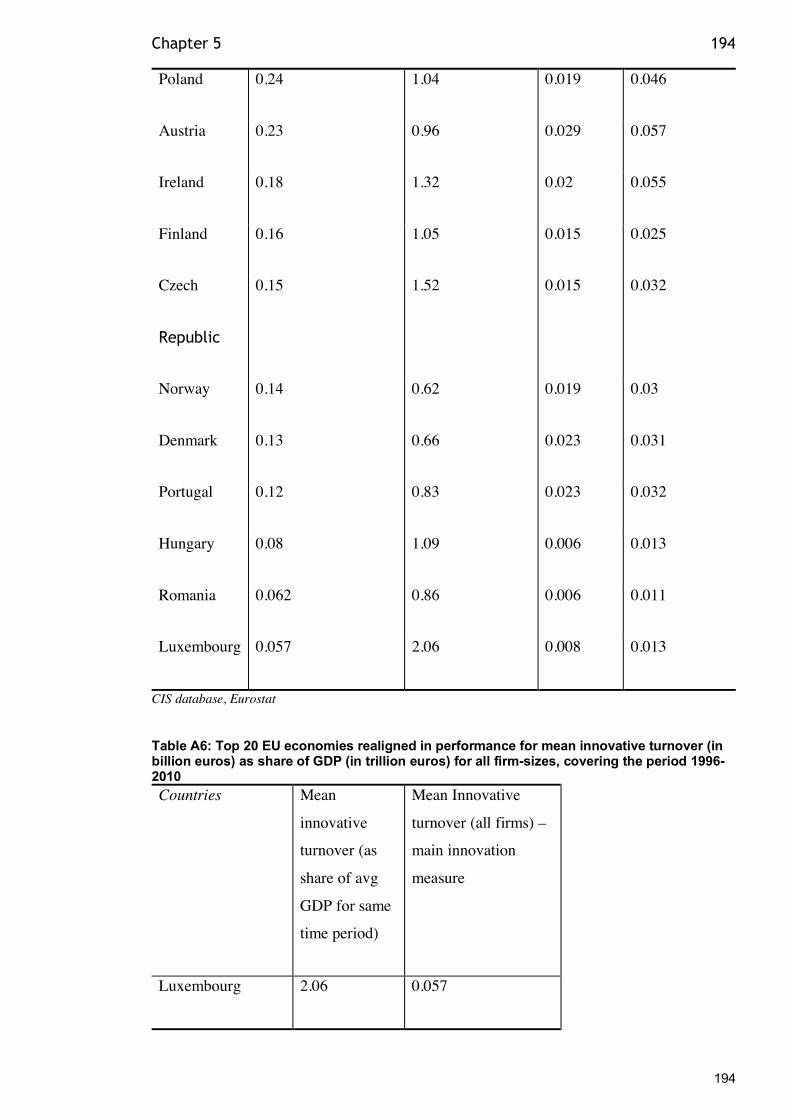
Chapter 5 194
194
Poland 0.24 1.04 0.019 0.046
Austria 0.23 0.96 0.029 0.057
Ireland 0.18 1.32 0.02 0.055
Finland 0.16 1.05 0.015 0.025
Czech
Republic
0.15 1.52 0.015 0.032
Norway 0.14 0.62 0.019 0.03
Denmark 0.13 0.66 0.023 0.031
Portugal 0.12 0.83 0.023 0.032
Hungary 0.08 1.09 0.006 0.013
Romania 0.062 0.86 0.006 0.011
Luxembourg 0.057 2.06 0.008 0.013
CIS database, Eurostat
Table A6: Top 20 EU economies realigned in performance for mean innovative turnover (in billion euros) as share of GDP (in trillion euros) for all firm-sizes, covering the period 1996-2010 Countries Mean
innovative
turnover (as
share of avg
GDP for same
time period)
Mean Innovative
turnover (all firms) –
main innovation
measure
Luxembourg 2.06 0.057

Chapter 5 195
195
Turkey 1.7 0.62
Czech Republic 1.52 0.15
Germany 1.33 2.99
Ireland 1.32 0.18
Hungary 1.09 0.08
Finland 1.05 0.16
Poland 1.04 0.24
Belgium 1.0 0.29
Austria 0.96 0.23
Sweden 0.88 0.26
Romania 0.86 0.062
Portugal 0.83 0.12
France 0.81 1.33
Spain 0.77 0.63
Netherlands 0.74 0.38
Italy 0.67 0.92
Denmark 0.66 0.13
Norway 0.62 0.14

Chapter 5 196
196
UK 0.56 1.00
National accounts, Eurostat
Innovation drivers Keeping in mind the quite large deviation between Germany
and the other G7 economies in the innovation measure, we now move to
assessing other drivers listed in table 2. They cover respectively drivers of skilled
human capital, R&D investment, external sourcing of R&D, public funding for
enterprises, firm linkages with academia, firm linkages with governmental
organizations, firm linkages with suppliers, national market focus for enterprises
and Enterprises focused on International markets. The top 10 ranked economies
for each of these drivers is displayed in table A4 and A518. Despite the
considerable variation of aspects measured by each driver, Germany’s strength
of performance across the spectrum is quite remarkable.
Table A7: Top 10 ranking of economies of five of the nine (mean value of) drivers, over the period 1996-2010 Rating of
economies per
Drivers:
(1) skilled
human
capital
(2) R&D
investment
(3) External
R&D
(4) Publicly
funded firms
(5) Firms
linked with
academia
2066 -
Germany
94.9 -
Germany
14.6 -
Germany
14.1 - Italy 7.3 -
Germany
1455 - UK 35.7 - France 7.9 - Italy 12.6 -
Germany
2.8 - UK
1265 -
France
27.8 - UK 6.1 - France 5.7 - Spain 2.3 - France
841 - Spain 21.6 - Italy 4.6 - Spain 5.5 - France 1.7 - Italy
721- Italy 13 - Sweden 3.01 -
Netherlands
4.96 - Turkey 1.4 - Turkey
18 The statistics of these drivers is provided earlier in the appendix

Chapter 5 197
197
614 -
Poland
10.5 - Spain 2.45 -
Portugal
3.4 -
Netherlands
1.3 - Spain
463 -
Netherlands
8.9 -
Netherlands
2.21 –
Czech
republic
2.89 - UK 1.08 -
Finland
392 -
Romania
8.5 - Belgium 2.18 -
Turkey
2.4 - Austria 1.07- Sweden
345-
Turkey
5.6 - Finland 2.14 -
Sweden
1.58 -
Portugal
1.01- Czech
Republic
331-
Romania
5.57 - Poland 2.12 -
Belgium
1.5 - Poland 0.97 - Austria
HRST database, Eurostat
Mean skilled human capita, scientists and engineers (expressed in 1000’s) driver Mean total innovation expenditure: Covers Internal and external R&D cost, including knowledge and capital acquisitions (expressed in millions of Euro’s) Enterprises sourcing R&D externally (expressed in 1000’s) Public funding of enterprises (expressed in 1000’s) Firm linkages with academia (expressed in 1000’s)
Table A8: Top 10 ranking of economies of the remaining four (mean value of) drivers, over the period 1996-2010 Rating of
economies per
Drivers:
(6) Firms
linkages
with govt.
Institutions
(7) Firm
linkages with
Suppliers
(8) Firms
with home
market
focus
(9) Firms
with Intl.
market focus
3.6 -
Germany
6.7 - UK 35.6 -
Germany
27.5 -
Germany
2.5 - UK 5.7 - Germany 23.2 - Italy 17.3 - Italy
1.8 - France 4.7 - France 14 - Spain 11.3 - UK

Chapter 5 198
198
1.3 - Spain 3.06 - Poland 12.9 -
France
10.3 - France
1.2- Turkey 2.9 - Italy 10.7 - UK 8.08 - Spain
0.86 -
Poland
2.6 - Turkey 10.5 -
Turkey
5.06 - Turkey
0.856 -
Finland
2.3 -
Netherlands
6 –
Netherlands
4.65 -
Netherlands
0.79 -
Netherlands
2.2 – Czech
Republic
5.5 -
Portugal
3.86 - Austria
0.68 - Italy 1.98 - Sweden 4.6 - Poland 3.8 - Portugal
0.55-
Belgium
1.79 - Spain 4.5– Czech
Republic
3.77 -
Belgium
HRST database, Eurostat
Firm linkages with governmental Institutions (expressed in 1000’s) Firm linkages with suppliers (expressed in 1000’s) Enterprises with Home market focus, firms focused in this market does not preclude them from focusing in International markets (expressed in 1000’s) Enterprises with Intl market focus (expressed in 1000’s)

Chapter 5 199
199
Chapter 4 Appendix
Corporate tax measurement at national level:
UK corporate tax, in 2009 at 28% stood was the second lowest statutory rate
amongst the G7 (Griffeth & Miller, 2010), which at 26% in 2012 reached lowest in
G7 by 2012, though it was ranked 18th when viewed amongst OECD countries
(Bilicka & Devereux, 2012). Reviewing UK’s ranking again in 2015, Devereux et
al. (2016) found UK at 20% reached the lowest statutory corporate tax rate
amongst the G20 countries. However, Devereux et al. caution at the use of
statutory corporate tax and advocate the use of either effective average tax
rate EATR or effective marginal tax rate EMTR, as it captures capital allowances.
Thus, instead using EATR and EMTR to assess corporate tax ranking, even by
those measures UK was ranked 5th and 10th respectively amongst the G20
countries by 2015 (ibid). Thus, as of late at least, UK has a policy initiative that
seems to be supportive of medium and large firms.
OECD firm-structure classification:
•Micro firms: Less than 10 employees and/or less than 2 million euro turnover
•Small firms: Between 0-49 employees and/or less than 10 million euro turnover
•Medium firms: 50-249 employees and/or less than 50 million euro turnover
•Large firms: 250+ employees and/or turnover greater than 50 million euros.
Independence Indicator as defined in Amadeus database (BvDEP, 2006):
The independence indicator, developed by Bureau Van Dijk (BvDEP) accessible in
Amadeus database, assigns firms an independence value, based on shareholder
ownership share, in line with prescriptions from International Financial
Reporting Standards (IFRS). This excludes public share-holders of quoted firms
and any unnamed or private unnamed shareholders. Accordingly, the firm is
acknowledged independent, if none of the known shareholders have more than
25% of direct or total ownership. This variable may be assigned value of A+/A/A-
, based on whether the firm has 6 or more identified shareholders/4 or 5

Chapter 5 200
200
identified shareholders/or 1to 3 identified shareholders. In all three cases, it is
considered independent. These variations do not measure higher or lower degree
of independence, only a degree of reliability of the indicator ( BvDEP, 2006,
page 13)

201
201
Bibliography Abramovitz, M. (1956, May). Resource and Output Trends in the U.S. since 1870.
American Economic Review (papers and proceedings), 46(2), 5-23.
Achlietner, A., Bock, C., & Watzinger, M. (2012, January). The capital gains Tax: A curse but also a Blessing for Venture Capital Investment. Working paper series.
Achs, Z., & Audretsch, D. (1987). Innovation, Market structures and Firm Size. Review of Economics and Statistics , 69, 567-574.
Achs, Z., & Audretsch, D. (1988). Innovation in Large and Small Firms: An Empiricial Analysis. The American Economic Review, 78(4), 678-690.
Adam Smith (1776) An Inquiry into the Nature and Causes of the Wealth of Nations p.10 Aghion, P., & Howitt, P. (2006). Joseph Schumpeter Lecture - Appropriate
growth policy - 'a unifyng framework'. Journal of European Economic Association, 4, 269-314.
Aghion, P., Besley, T., Browne, J., Caselli, F., Lambert, R., Lomax, R., . . . Van Reenan, J. (2013). Investing for porsperity: Skills, Infrastructure and Innovation. Report for LSE growth commission. Centre for Economic Performance.
Aghion, P., Fally, T., & Scarpetta, S. (2007, October). Credit constraints as a barrier to the entry and post-entry growth of firms. Economic Policy, 731-779.
Alfaro, L., Chanda, A., Kalemli-Ozcan, S., & Sayek, S. (2004). FDI and economic growth: the role of local financial markets. Journal of International Economics, 64, 89-112.
Allen, F. (1993). Stock Markets and resource allocaton. In C. Mayer, Capital markets and Financial Intermediation. Cambridge: Cambridge University Press.
Amsden, A. (2001). The Rise of The Rest - Challenges to the west From Late-Industrializaing economies. Oxford University Press.
Arrow, K. (1962). The economic implications of learning by doing. Review of Economic studies, 29(3), 155-173.
Arrow, K. (1962). The economic implications of learning by doing. Review of economic Studies, 29(3), 155-173.

202
202
Auerbach, A. J., & Reishus, D. (1988). The Effects of Taxation on the Merger Decision. In A. J. Auerbach, Corporate Takeovers: Causes and Consequences (pp. p. 157 - 190). University of Chicago Press.
Auerbach, A. J., & Reishus, D. (1988). The Impact of Taxation on Mergers and Acqusitions. In A. Auerbach, Mergers and Acquisitions (pp. 69-86). National Bureau of Economic Research.
Bailey, M., & Gersbach, H. (1995). Efficiency in manufacturing and the Need for Global Competition. Brookings Papers on economic Activity: Microeconomics, 307-47.
Bailey, M., Hulten, C., & Campbell, D. (1992). Productivity Dynamics in Manufacturing Plants. Brooking papers : microeconomics.
Bannerjee, A. V., & Duflo, E. (2005). Growth Theory through the lens of Development Economics. In P. Aghion, & S. Durlauf, Handbook of Economic Gorwth (pp. 473-52). Amsyterdam: Elsevier- Science.
Barnett, A., Batten, S., Chiu, A., Franklin, J., & Sebastia-Barriel, M. (2014, Q2). The UK productivity puzzle. Quarterly Journal .
Bartelsman, E., Haltiwanger, J., & Scarpetta, S. (2004). Microeconomic evidence of creative Destruction in Industrial and Developing Countries. Policy Research working paper series.
Bartelsman, E., Haltiwanger, J., & Scarpetta, S. (2013). Cross-country differences in Productvity: The role of allocation and Selection. American Economic Review, 103(1), 305-334.
BBC. (2016, July 18). ARM founder says Softbank deal is 'sad day' for UK tech . Retrieved from http://www.bbc.co.uk/news/business-36827769
BBC News. (2016, Feb 1). How did Google become the world's most valuable company? Retrieved from http://www.bbc.co.uk/news/business-35460398
BBC News, :. (2016, July 16). ARM chip designer to be bought by Japan's Softbank. Retrieved from http://www.bbc.co.uk/news/business-36822806
BDC. (n.d.). Management buyout: A common exit strategy when selling a business. (Business Development Bank of Canada) Retrieved 2018, from https://www.bdc.ca/en/articles-tools/change-ownership/plan-succession/pages/selling-business-management-buyout.aspx
Beck, T., & Demirguc-Kent, A. (2006). Small and medium sized enterprises: Access to finance as a growth constraint. Jounral of Banking and Finance, 30, 2931-2943.

203
203
Beck, T., Demirguc-Kunt, A., & Levine, R. (2005). SME's, growth and Poverty: cross-Country Evidence. Journal of Economic growth, 10, 199-229.
BEIS. (2016). Business Population estimates for Uk and the Regions 2016. (Department for Business, Energy & Industrial strategy) Retrieved from https://www.gov.uk/government/uploads/system/uploads/attachment_data/file/559219/bpe_2016_statistical_release.pdf
Bellis, M. (2017, June 27). The History of Facebook and How It Was Invented. Retrieved from https://www.thoughtco.com/who-invented-facebook-1991791
Bessemar Venture Partners. (n.d.). Ten Questions Every Founder Should Ask before Raising Venture Debt. Retrieved Februray 2018
Bhattacharya, M., & Bloch, H. (2004). Determinants of Innvoation. Small Business economics, 22(2), 155-162.
Biggs, T., Shah, M., & Srivastave, P. (1996). Technological Capability and Learning in African Firms.
Bilicka, K., & Devereux, M. (2012, June). CBT corporate tax ranking 2012. Oxford University Centre for Business taxation.
Bilicka, K., Devereux, M., & Fuest, C. (2011, July). G20 Corporate Tax ranking 2011. Oxford University Cnetre for Business taxation.
Birsch, D. (1979). The Job Generation Process: Final report to economic Development Administration. MIT program on Neighbourhood and Regional Change, Cambridge, MA.
BIS. (2013). Business Population estimatesfro the Uk and the Regions 2013. (Department for Business, Innovation and Skills) Retrieved from https://www.gov.uk/government/uploads/system/uploads/attachment_data/file/254552/13-92-business-population-estimates-2013-stats-release-4.pdf
Bishop, K., Mason, G., & Robinson, C. (2009). Business Growth and Innovation The wider impact of rapidly-growing rms in UK city-regions. Nesta.
Bosworth, B., & Collins, S. (2003). The Empirics of growth: An unpdate. Brookings paper on Economic Activity, 2, 113-179.
Bottazi, L., & Da Rin, M. (2002, April). Venture Capital in Europe and the Financing of Innovative Companies. Economic Policy, 34, 229-69.
Bradley, N. (2014, May). What are the drivers of Innovation and does policy target them? working paper, .

204
204
Bradley, N. (2016, July). Do firm-sizes and sectors matter for Productivity? . Working paper.
Broadberry, S., & Jong, H. (2000). Technology and productivity in historical perspective: Introduction. European Review of economic History, 4, pp. 115-119.
Brown, C., Medoff, J., & Hamilton, J. (1990). Employers: Large and Small. Cambridge, MA: Harvard University Press.
Bruining, H., & Verwaal, E. (2005). Successful management buyouts: Are they really more entrepreneurial? Erasmus rsearch Institute of management (ERIM).
Buiguis, P., & Sekkat, K. (2009). Industrial Policy in Europe, Japan and the USA: Amounts, Mechanisms and Effectiveness. Palgrave Macmillan.
Burghardt, D., & Helm, M. (2015). Firm growth in the course of mergers and acquisitions. Smal Business economy, 44889-904.
Burton, & Hansen. (1993). German Technological policy: Incentive for industrial innovation. Challenge, 36(1), 37-47.
BvDEP, B. v. (2006). Ownership Database.
Caan, J., McComb, C., Murray, G., Perman, R., Quysner, D., Rowlands, C., & Truell, D. (2009). The Provision of Growth Capital to UK Small and Medium Sized Enterprises . London: The Stationary Office (TSO).
Caselli, F. (2005). Accounting for Income Differences Across Countries. In A. Aghion, & S. Durlauf, Handbook of Economic Growth (Vol. !A, p. Chap. 9). Amsterdam: Elsevier.
Caselli, F., & Feyrer, J. (2007). The marginal Product of Capital. Quarterly Journal of Economics, 122(2), 535-568.
Cefis, E. (2010). The impact of M&A on technology sourcing strategies. Economics of Innovation and New Technology, 19(1), 27-51.
Chan, L., Lakonishok, J., & Sougiannis, T. (2001, Dec). The stock market valuation of reseach and development. Journal of Finance, 56(6), 2431-2456.
Chandler, A. (1990). Scale and Scope. Cambridge, MA: Belknap Press.
Chandler, A. (1994). The competitive performance of US Industrial Enterprises over the Second World War. Business History Review, 68(1), 1-72.

205
205
Chandler, A. (2005). Shaping the industrial Century. Cambridge, MA: Harvard University Press.
Coad, A., & Rao, R. (2010). Firm growth and R&D expenditure. Economics of Innovation and New Technology, 19(2), 127-145.
Cohen, W. (2010). fifity years of Empirical Studies of Innvoative Activity and Performance. In B. Hall, & N. Rosenberg, Handbook of Economics of Innvoation (Vol. 1). Elsevier B.V.
Cohen, W. (2010). Fifty years of Empirical studies of Innovative Activity and Performance. In B. Hall, & N. rosenberg, Handbook of Economics of Innovation. Elsevier.
Commission, E. (2003). European Commission Recommendation 2003/361/EC . OJL 124.
Conyon, M. J., Girma, S., Thompson, S., & Wright, P. W. (2002). growth. In particular, the analysis of financial data The impact of mergers and acquisitions on com- pany employment in the United Kingdom. European Economic Review, , 46(1), 31–49. .
Criscuolo, C., Gal, P., & Menon, C. (2014). The Dynamics of Employment Growth. OECD Science, Technology and Industry Policy Papers No.14.
Davis, S., Haltiwanger, J., & Schuh, S. (1993). Small Business and Job creation: Dissecting the Myth and Reassesing the Facts. Business Economics, 29, pp. 13-21.
Desyllas, P., Hughes, A., & . (2008). Sourcing technological knowledge through corporate acquisition: Evidence from an international sample of high technology firmss. The Journal of High Technology Management Research , 18(2), 157- 172. .
Devereux, M., & Maffini, G. (2006, April). The impact of Taxation on Location of Captal , Firms and Profit: A survey of Empirical Evidence.
Devereux, M., & Vella, J. (2014, October 21). Are we heading towards a corporate tax system fit for the 21st century? Working paper WP1425.
Devereux, M., Griffith, R., & Klemm, A. (2002). Corporate Income Tax Reforms and International Tax Competition. Economic Policy, 17(35), 449-495.
Devereux, M., Habu, K., Lepoev, S., & Maffini, G. (2016, March). G20 Coporateion Tax Ranking.
Devereux, M., Maffini, G., & Xing, J. (2016). The impact of investment incentives: evidence from UK corporation tax returns.

206
206
Dosi, G., & Nelson, R. (1994). An introduction to evolutionary theories in economics. Journal of Evolutionary Economics, 4(3), 153-172.
Dosi, G., & Nelson, R. (2010). Techical Change and Industrial Dynamics as Evolutionary Processes. In B. Hall, & N. Rosenerg, Handbook of The Economics of Innvoation (Vol. 2). Elsevier B.V.
Easterly, W., & Levine, R. (2001). Its not Factor Accumulation: Stylized Facts and Growth Models. The World Bank Economic Review, 15(2), 177-219.
ECB. (2013, July). ECB monthy Bulletin. Retrieved from https://www.ecb.europa.eu/pub/pdf/other/mb201307_focus06.en.pdf
Economist. (2017, April 6). British tech firms suffer from impatient investors. Retrieved from https://www.economist.com/news/britain/21720320-government-eyes-pension-funds-source-long-term-capital-british-tech-firms-suffer
Elks, L. (2014, may 15). AstraZeneca, Pfizer and the public interest test . Retrieved from https://www.ft.com/content/62af79b6-db75-11e3-94ad-00144feabdc0
Engel, D. (2002). The impact of Vneture Capital on Firm Growth: An empirical Investigation.
Engel, D., & Keilbach, M. (2007). Firm level implications of early stage venture capital investment- An empirical investigation. Journal of Empirical Finance, 14, 150-167.
Entrepreneur. (2008, Oct 16). Larry Page and Sergey Brin. Retrieved from https://www.entrepreneur.com/article/197848
European Commission, :. (2013). Innovation Union Scorboard 2013. Retrieved July 2013
Eurostat. (1997). Oslo manual, Proposed guidelines for collecting and interpreting Technological and Innovation data, 2nd edition. European Commission.
Eurostat. (2008). (E. Commission, Producer) Retrieved 2013, from Statistical classification of economic activities in the European Community NACE Rev. 2: http://epp.eurostat.ec.europa.eu/cache/ITY_OFFPUB/KS-RA-07-015/EN/KS-RA-07-015-EN.PDF
Eurostat. (2009). Eurostat CIS community innovation survey 1994-1996 - study documentation.

207
207
Eurostat. (2012). Structural Business statistics overview. Retrieved from http://ec.europa.eu/eurostat/statistics-explained/index.php/Structural_business_statistics_overview
EUROSTAT CIS. (2013, July). Community innovation Survey (cis). Retrieved from http://epp.eurostat.ec.europa.eu/portal/page/portal/statistics/search_database
EUROSTAT HRST. (n.d.). (European Commission) Retrieved 2013, from Human Resources in science and technology (hrst): http://epp.eurostat.ec.europa.eu/portal/page/portal/statistics/search_database
EUROSTAT HRST. (2012, Jan). Retrieved 2013, from Stocks of HRST at the national and regional levels; unemployment for HRST and non-HRST: http://epp.eurostat.ec.europa.eu/cache/ITY_SDDS/en/hrst_st_esms.htm
EUROSTAT SBS. (2015). Structural Business Survey Statistics. Retrieved from Eurostat Database: http://ec.europa.eu/eurostat/web/structural-business-statistics/data/database
EVCA. (2001). Survey of the Economic and Social Impact of Management Buyouts & Buyins in Europe. European Private Equity and venture capital Association.
Ferrando, A., & Ruggieri, A. (2015). Financial constraint and productvity: ebidence from euro-are companies. European Central Bank.
Feyrer, J. (2009, April). Trade and Income - exploiting time series in geography. NBER working series papers.
Feys, C., & Manigart, S. (2010). The Post Acquisition Performance of Acquired Entrepreneurial Firm. Frontiers of Entrepreneurship Research, 30(1).
Financial Times. (2018, August 13). Britain’s productivity crisis in eight charts. Retrieved from FT: https://www.ft.com/content/6ada0002-9a57-11e8-9702-5946bae86e6d Financial Times . (2017, September 23). Zuckerberg to sell up to $12bn of
Facebook shares. Retrieved from https://www.ft.com/content/842cb038-9fc9-11e7-9a86-4d5a475ba4c5
Financial Times. (2017, November 24). UK will allow pension funds to invest in start-ups, says Greg Clark. Retrieved from https://www.ft.com/content/173faa32-d10d-11e7-b781-794ce08b24dc
Financial Times, :. (2016, October 19). UK set for US-style investment regime as May calmps down on foreign deals.

208
208
Frankel, j., & Romer, D. (1999). Does Trade cause Growth? American Economic Review, 89(3), pp. 379-399.
Freeman, C., & Soete, L. (1997). The Economics of Industrial v. Cambridge, Massachusetts: MIT Press.
Frontier Economics. (2014). Rates of return to investment in science and innovation. London.
FT. (2017, February 17). Unilever rejects $143bn Kraft Heinz takeover bid. Retrieved from Financial Times: https://www.ft.com/content/e4afc504-f47e-11e6-8758-6876151821a6
FT. (2018, March 2). GKN faces fight of its life in hostile bid battle. Retrieved from Financial Times: https://www.ft.com/content/0bef79d8-1d47-11e8-aaca-4574d7dabfb6
FT. (2018, March 29). Melrose victorious in hostile bid for GKN. Retrieved from https://www.ft.com/content/c6afe24c-3356-11e8-b5bf-23cb17fd1498?segmentId=778a3b31-0eac-c57a-a529-d296f5da8125
FT. (2018, February 22). Unilever HQ move would be motivated by more than Brexit. Retrieved from Financial Times: https://www.ft.com/content/84bdb4a8-17dc-11e8-9e9c-25c814761640
FT. (2107, March 17). Unilever calls for revamp of UK Takeover Code after Kraft bid. Retrieved from Financial Times: https://www.ft.com/content/f85e6438-08b1-11e7-ac5a-903b21361b43
FT. (2016, November 21) May seeks solution to productivity conundrum Retrieved from Financial Times: https://www.ft.com/content/abe39b36-af1b-11e6-9c37-5787335499a0 Furman, J., Porter, M., & Stern, S. (2002). The determinants of National
Innvoative Capacity. Research olicy, 31(6), 899-933.
GEDI . (2016). Global Entrepreneurship Index. (Global Entreprenuership and development Institute) Retrieved from https://thegedi.org/global-entrepreneurship-and-development-index/
Gemmel, N., Kneller, R., Sanz, I., & Sanz-sanz, J. (2010, March). Corporate Taxation and the productvity and investent performance of Heterogenous Firms: Evidence from OECD firm-level data.
Ghori, U. (2015). Defining Australian national interests in regulating foreign investments. In J. Farrar, M. Hiscock, & V. Lo, Australia's trade, investment and security in the Asian centur.

209
209
Giebel, M., & Kraft, K. (2015, September). The Impact of the Financial Crisis on Investments in Innovative Firms. Retrieved from http://ftp.zew.de/pub/zew-docs/dp/dp15069.pdf
Goldberger, A.S.(1978) Topics in Regression Analysis, Macmillan, New York. Gollin, D. (2014). The Lewis Model: A 60-year Retrospective. Jounral of
Economic Perspectives, 28(3), 71-88.
Gordon, R., & Becker, I. (2008). The role of market changes int he slowdown of European productivuty growth. NBER working paper series.
Griffeth, R., & Miller, H. (2010). Productvity, innovation and the corporate tax environment. IFS Briefing note 9.
Griliches, Z., & Regev, H. (1995, January). Firm Productivity in Israeli Industry: 1979-1988. Journal of Econometrics, 65(1), 175-203. Griliches, Z. (1979). Issues in assesing the contributions of research and
development to productivity growth. Bell Journal of Economics, 10, 92-116.
Griliches, Z. (1992). The search for R&D spillovers. Scandanavian journal of economics, 94, 29-47.
Grossman, G., & Helpman, E. (1994). Endogenous Innovation in the Theory of Growth. Journal of economic perspectives, 8.
Grubert, H., & Mutti, J. (2000, December). Do taxes Influence Where US Corporations Invest. National Tax journal, 53(4).
Guardian. (2106, August 30). ARM shareholders approve SoftBank takeover. Retrieved from https://www.theguardian.com/business/2016/aug/30/arm-shareholders-softbank-takeover-tech-lord-myners
Gugler, K., & Yurtoglu, B. (2004). The effects of mergers on company employment in the USA and Europe. International Journal of Industrial Organization,, 22(4), 481–502.
Gujarati, D. (2003) Basic Econometrics, McGraw-Hill/Irwin, new York. Hall, B. (2002). The financing of research and development. Oxford Review of
Economic Policy, 18(1), 35-51.
Hall, B., & Lerner, J. (2010). The financing of R&D and Innovation. In B. Hall, & N. Rosenberg, Handbook of Economics of Innovation (Vol. 1, pp. 609-639). Elsevier-North Holland.

210
210
Hall, B., & Lerner, J. (2010). The Financing of R&D and Innovation. In B. Hall, & N. Rosenberg, The handbook of Economics of Innovation (Vol. 1).
Hall, B., & Rosenberg, N. (2010). Introduction to the Handbook. In B. Lahh, & N. Rosenberg, Handbook of The Economics of Innovation (Vol. 1). Elsevier B.V.
Hall, B., & Rosenberg, N. (2010). Introduction to the Handbook. In B. Hall, & N. Rosenberg, Handbook of The Economics of Innovation (Vol. 1). Elsevier B.V.
Hall, B., Mairesse, J., & Mohnen, P. (2010). Measuring the returns of R&D. In B. Hall, & N. Rosenberg, Handbook on Economics of Innovation (Vol. 2). Elsevier.
Hall, R., & Jones, C. (1999). Why Do Some Countries Produce So Much More Outout Per Worker Than others? Quarterly Journal of economics, 114, 83-116.
Hannah, L. (1983). The rise of the Corporate Economy. London: Methuen.
Harari, D. (2016, April 8). Productivity in the UK - Briefing Paper. Commons Library.
Harari, D. (2017). Productivity in the UK. House of Commons Library.
Harrison, J., Hitt, M., Hoskisson, R., & Ireland, R. (1991). Synergies and Post-acquistion Performance: difference versus Similarities in Resource Allocations. Journal of Management, 17(1), 173-190.
Harvard Law School Forum. (2015, December 1). The Dutch Poison Pill: How is it Different from an American Rights Plan? Retrieved from https://corpgov.law.harvard.edu/2015/12/01/the-dutch-poison-pill-how-is-it-different-from-an-american-rights-plan/
Hotelling, H. (1929) Stability in competition. Economic Journal, 41-57 Hsiao, C. (2005) Why panel data? Singapore Economic Review 50(2), 1-12 Hsieh, C., & Klenow, P. (2009). Misallocation and manufacturing TFP in China
and India. The Quarterly Jounral oF Economics, 124(4), 1403-48.
Hulten, C. (2010). Growth Accounting. In B. Hall, & N. Rosenberg, Handbook on Economics of Innovation (Vol. 2). Elsevier.
Hulten, C., Corrado, C., & Scihel, D. (2006). Intangible Capital and Economic Growth. NBER working papers.

211
211
Hyytinen, A., & Toivanen, O. (2005). Do financial constraints hold back innovation and growth? Evidence on th erole of public policy. Research policy, 34, 1385-1403.
Jackson, J. K. (2016). The Committee on Foreign Investment in the United States (CFIUS) . Congressional Research Service.
Jacobs, J. (1969). The Economy of Cities. London: Penguin.
Jensen, M.B., Johnson, B, Lorenz, E., Lundvall, B.A. (2007). Forms of knowledge and modes of innovation. Research policy ,36(5), 680-693 Johansson, B., & Loof, H. (2009, January). Innovation, R&D and productivity -
assessing alternative specifications of CDM-models. Centre for Excellence for Science and Innovation Studies (CESIS).
Jones, C. (2002). Introduction to Economci Growth (2nd edition). W.W. Norton and Company.
Jong, J., & Vermeulen, P. (2006). Determinants of Product Innvoation in small firms:A comparison across Industries. International Small Business Journal, 24(6), 587-609.
Kleinert, J., & Klodt, H. (2002, January). Causes and Consequences of merger waves.
Klenow, P., & Rodriguez-Clare, A. (1997). The Neoclassical revival in Growth Economics: has it gone too far? NBER Macroeconomics Annual, 12, 73-103.
Klenow, P., & RodriguezClare, A. (2005). Externalities and Economic growth, chapter 11. In A. Aghion, & S. Durlauf, Handbook of Economic growth (Vol. 1). Amsterdam: Elsevier.
Kuznets, S. (1962). Inventive Activity: Problemss of definition and measurement'. In R. Nelson, The Rate of Direction of Inventive Activity (pp. 19-43). Princeton: Princeton University Press.
Kuznets, S. (1965). Economic growth and Structure. In Selected Essays. New York: Norton.
La Porta, R., Lopez-de-Silanes, F., & Schleifer, A. (2002). Governement ownership of banks. Journal of Finance, 56, 265-301.
Lamoreaux, N. (1988). The Great Merger Movement in American Business 1895-1904. Cambridge: Cambridge University Press.
Lerner, J. (1999). The governement as a venture caoitalist: the long-run impact of the SBIR program. Journal of Business, 72(3), 285-318.

212
212
Leung, D., Meh, C., & Terajima, Y. (2008). Firm-size and productvity. Bank of Canada Working paper 2008-45.
Levine, R. (2005). Finance and Growth: Theory and evidence. In P. Aghion, & S. Durlauf, Handbook of Economic Growth. Elsevier.
Lewis, A. (1954). Economic Development with Unimited Supplies of Labour. Manchester School.
Lewis, A. (1954). Economic development with unlimited supplies of Labour. The Manchester School, 22(2), 139-91.
List, F. (1841). Das Nationale System der Politischen Okenomie. Basel: Kyklos.
Little, I., Mazemdar, D., & Page, J. (1987). Small Manufacturing enterprises: A Comparative Analysis of India and Other Economies. Oxford: Oxford University Press.
Los Angeles Times. (2018, January 23). Tesla unveils pay plan for Elon Musk: He could get nothing for 10 years. Retrieved from http://www.latimes.com/business/la-fi-hy-tesla-musk-pay-20180123-story.html
Lucas, R. (1988). On the Mechanics of Economic Development. Journal of Monetary Economics,, 22, 3-42.
Lucas, R. J. (1978). On the Size Distribution of Business Firms. Bell Journal of economics, 9(2), 508-23.
Lundvall, B. (1992). National Innovation systemes: Towards a theory of Innovation and Interactive learning. London: Pinter Publishers.
Mairesse, J., & Mohnen, P. (2002). Accounting for innvoation and measuring Innovativeness: An illustrative Framework and application . American Economic Review, 92(2), 226-230.
Mairesse, J., & Mohnen, P. (2010). Using Innovation surveys for Econometric Analysis. In B. Hall, & N. Rosenberg, Handbook on Economics of Innovation (Vol. 2). Elsevier.
Mairesse, J., & Mohnen, P. (2010). Using Innovation Surveys for Econometric Analysis. In B. Hall, & N. Rosenberg, Handbook oF Economics of Innvoation (Vol. 2). Elsevier B.V.
Mankiew, N., Romer, D., & Weil, D. (1992). A cotribution to the empirics of Economic Growth. Quarterly journal of economics, 107, 407-38.
Mansfield, E. (1968). Industrial research and Technological Innovation : An Econometric analysis. New York, NY: Norton.

213
213
Marshall, A. (1920). Priniciples of Economics. London: Macmillan.
Martin, R., & Sunley, P. (2003). Deconstructing clusters: Chaotic concept or policy panacea? Journal of Economic Geography , 3(1), pp. 5-35.
Martin, S., & Scott, J. (2000). The nature of innovation market failure and the design of public support for private innovation. Research Policy, 29(4-5), 437-447.
Matsumaya, K. (1992). Agricultural productivity, Comparative Advantage and Economic growth. Journal of economic Theory, 58, 317-334.
Mayer, C., & Alexander, I. (1990). banks and Securities markets: Corporate Financing in Germany and the UK.
Mayer, C. (2018). Prosperity - better business makes the greater good. Oxford University Press. Meier, G., & Rauch, J. (2005). Note I.C.2 New endogenous Growth theory. In G.
Meier, & J. Rauch, Leading issues in Economic Development (pp. 79-80). Oxford University Press.
Melitz, M. (2003). The impact of Trade on Intra-industry Reallocation and Aggregate Industry Productivty. Econometrica, 71(6), 1695-725.
Miliband, E. (2014, May 4). Ed Miliband's letter to David Cameron on proposed Pfizer/AstraZeneca deal. Guardian.
Miskell, P., & Jones, G. (2007). Acquistions and Firm Growth: creating Unilever's Ice Cream and Tea Business. Business History, 49(1), 8-28.
Mohnen, P., Mairesse, J., & Dagenais, M. (2006). Innovativity: A comparison across seven European countries. NBER working paper series.
Mokyr, J. (1990). The Lever of Riches - Technoloical creativity and economic progress. Oxford University Press.
Mokyr, J. (2010). The contribution of Economic History to the study of Innovation and Technical Change 1750-1914. In B. Hall, & N. Rosenberg, Handbook of Economics of Innovation (Vol. 1). Elsevier .
Moritz, M. (2016, January 29). "Google should be emulated, not berated". Finacial times.
Nelson, R. (1959). The simple Economics of Basic Scientific Reseacrh. Journal of political Economy, 49, 297-306.
Nelson, R. (1993). National Innovation Systems: A Comparative Analysis. New York: Oxford University Press.

214
214
Nelson, R., & Rosenberg, N. (1993). Technical innovation and national systems. In R. Nelson, National Innovation Systems. Oxford: Oxford University Press.
Nelson, R., & Winter, S. (1982). An evolutionary theory of economic change. Cambridge, MA: Harvard University Press.
Nelson, R., & Winter, S. (1982). An evolutionary theory of economic change. Cambridge , MA: Harvard University Press, .
Nesta. (2013). Unchaining investment: barriers to US venture investment in UK digitial businesses. Nesta.
OECD. (1997). National Innvoation Systems. Retrieved from http://www.oecd.org/science/inno/2101733.pdf
OECD. (2001). Measuring Productivity: Measurement of aggregate and industry level productvity and growth.
OECD. (2005). Innovation Manual. Joint publication of OECD and Eurostat.
OECD. (2005). OECD SME and Entrepreneurship Outlook. Paris.
OECD. (2015). New Approaches to SME and Entrepreneurship Financing: Broadening the Range of Instruments. OECD.
OECD. (2016). Entreprenuership at a Glance 2016. Retrieved from http://www.oecd.org/std/business-stats/entrepreneurship-at-a-glance-22266941.htm
OECD (2018) Oslo Manual 2018 Joint publication of OECD and Eurostat, 4th Edition Olley, G. S., & Pakes, A. (1996). The Dynamics of Productivity in the Telecommunications Equipment Industry. Econometrica, 64(6), 1263-97. ONS. (2015). Labour Productivity , Q2 2015. Statistical Bulletin.
Pack, H., & Westphal, L. (1986). Industrial startegy and Technological change: Theory versus Reality. Journal of Development Economics, 22, 87-128.
Pagano, P., & Schivardi, F. (2001). Firm Size Distribution and Growth. Banca d'Italia.
Pakes, A., & Griliches, Z. (1980). Patents and R&D at firm-levl: A first report. Economic Letters, 4, 377-81.
Parker, W. (1984). Europe, America and the Wider World. Cambridge University Press.

215
215
Peneder, M. (2010, April). The impact of venture capital on innovation behaviour and firm growth. Venture Capital, 12(2), 83-107.
Porter, M. (1990). The competetive advantage of Nations. New York: Free Press.
Porter, M. (1990). The competetive Advantage of Nations. New York: Free Press.
PRO INNO Europe. (2007). Retrieved 2013, from European innovation Scoreboard 2007, Comparative anaysis of innvoation performance: http://ec.europa.eu/enterprise/policies/innovation/files/proinno/eis-2007_en.pdf
Pro Inno Europe. (2011). Innovation Union Scoreboard 2011. European commission.
Purunam, P., & Kannan, S. (2005). Leveraging Knowledge or Leveraging capabilities: How Firms use Technology from Acquisitions. London Business School Working paper.
Rammer, C. (2011). Mini country report/Germany. Zentrum fur Europaische Wirtschatforschung GmbH (ZEW). PRO INNO EUROPE.
Romer, P. (1990). Endogeneous Technical Change. Journal of Policitical Economy, 98(5), S71-S102.
Romer, P. (1990, October). Endogenous Technical Change. Journal of Political Economy.
Romer, P. (1993). Idea gaps and Object gaps in Economic Development. Journal of Monetary Economics, 32, 543-573.
Romijn, H., & Albadejo, M. (2002). Determinants of innvoation capability in small electronics and southwest firms in southeast England. Research Policy, 31, 1053-1067.
Rosenberg, N. (1974). Science, Invention and economic growth. Economic Journal , 84, 90-108.
Rosenthal, S.S. & Strange, W.C. (2004), Evidence on the Nature and Sources of Agglomeration economies in J.V. Henderson & J.F. Thisse, eds., Handbook of Urban and Regional economics, Volume 4, Elsevier. Rostow, W. (1952). The process of economic growth. New York: Norton.
Ruckman, K. (2004). Technology sourcing through acquisitions: evidence from the US drug industry. Journal of International Business Studies, 36(1), 89-103.

216
216
Savignac, F. (2008, September). Impact of financial constraints on innovation: what can be learned from a direct measure? Economics of Innovation and New Technology, 17(6), 553-569.
Sawyers, P. (2016, November 24). Skyscanner CEO discusses why he just sold his company for $1.7 billion. Retrieved from https://venturebeat.com/2016/11/24/skyscanner-gareth-williams-ctrip-acquisition/
SBA . (2016, Feb). (US Small Business Administration) Retrieved from Firm size data: https://www.sba.gov/advocacy/firm-size-data
Scherer, F. (1980). Industrial market structurre and Economic Performance (second edition). Chicago, IL: Rand McNally.
Scherer, F. (1992). International High-Technology Competition. Harvard University Press.
Scherer, F. (1999). New Perspectives on Economic Growth and Technological Innovation. Washington, DC: Brookings Institution.
Schleifer, A., & Summers, L. (1988). Breach of trust in Hostile Takeover. In A. Auerbach, Mergers and acquisistions. Chicago: Chicago university Press, NBER Series.
Schmookler, J. (1962). Economic Sources of inventive activit. Journal of Economic History, 22, 1-10.
Schultz, T. (1961) Investment in Human Capital, American Economic Review, 51, 1-17. Schultz, T. (1975). The Value of the ability to Deal with Disequilibria. Journal of
Economic Literature, 13, 827-846.
Schumpeter, J. (1912). Theorie der Wirtschaftlichen Entwicklung. Leipzig: Dunker & Humblot , [The Theory of Economic Development, 1912, translated by R. Opie. Cambridge, MA: Harvard University Press, 1934.].
Schumpeter, J. (1934). The Theory of Economic Development: An inquiry into profits, Capital, Credit, Interest and the Business Cycle.
Schumpeter, J. (1937). Preface to Japenese edition . In Theorie der Wirschaftlichen Entwicklung (I. Nakayama, & S. Tobata, Trans.). Tokyo: Ishwanami Shoten.
Schumpeter, J. (1939). Business cycles: A Theorertical , Historical and Statistical Analysis of the capitalist process. New York and London: McGraw-Hill.

217
217
Schumpeter, J. (1942). Capitalism, Socialism and Democracy. New York: Harper.
Schumpeter, J. (1942). Capitalism, Socialism and Democracy. New York: Harper.
Schumpeter, J. A. (1961). The Theory of Economic Development, Trans. Redvers Opie. New York: Oxford University Press.
Segarra, A., & Teruel, M. (2009, October). Small firms, growth and financial constraints.
Shead, S. (2016, July 21). Google's £400 million acquisition of London AI startup DeepMind just got very interesting. Retrieved from http://uk.businessinsider.com/googles-400-million-acquisition-of-deepmind-is-looking-good-2016-7
Smolarski, J., & Kut, C. (2011). The impact of ventrue capital financing method on SME performance and internationalization. International Entrepreneurship and Management Journal, 7, 39-55.
Snodgrass, D., & Biggs, T. (1996). INDUSTRIALIZATION AND THE SMALL FIRM PATTERNS AND POLICIES. San Francisco,, CA: A copublication of the International Center for Economic Growth and the Harvard Institute for International Development.
Soete, L., Verspagen, B., & Weel, B. (2010). Systems of Innovation. In B. Hall, & N. Rosenberg, Handbook of The Economics of Innovation (Vol. 2). Elsevier B.V.
Solow, R. (1956). A contribution to the Theory of Economic Growth. The Quarterly Journal of Economics, 70(1), 65-94.
Solow, R. (1957, August). Technical Change and the Aggregate Production Function. Review of Economics and Statistics, 39, 312-20.
Soskice, D. (1997, June). German technological policy, Innovation and National Institutional frameworks. Industry and Innvoation, 4(1).
Swords, J. (2013). Michael Porters Cluster theory as a local and regional development tool: The rise and fall of cluster policy in UK. Local Economy, 28(4), pp. 369-383.
Taylor, M. (2010). Clusters: A mesmerizing mantra. Tijdschrift voor Economische en Sociale Geografie, 101 (3), pp. 276–286. .
Tech Crunch. (2012, Oct 20). Zuckerberg: Facebook Started Out As A ‘Hobby’ And A ‘Project,’ Not A Company. Retrieved from https://techcrunch.com/2012/10/20/zuckerberg-facebook-started-out-as-a-hobby-and-a-project-not-a-company/

218
218
Thirlwall, A. (2002). The Nature of Economic Growth. Edward Elgar.
Toms, S., & Wright, M. (2002). Corporate governance, strategy and structure in British Business History. Business Hostory, 44(3), 91-124.
Treasury Select Committee. (2007). Private Equity , Tenth report of Session 2006-2007. House of Commons.
Tunzelmann, G. V. (2000). Technology generation, technology use and economic growth. European Review of Economic History, 4(2), 121-146.
Tunzelmann, G. V. (2000). Technology generation, technology use and economic growth. . European Review of Economic History , 4(2), 121-146.
Van Ark, B., & Monnikhof, E. (1996). Size Distribution of Output and Employment: A Data Set for Manufacturing Industries in Five OECD Countries, 1960s-1990. OECD Economics Department Working Papers.
Van Biesebroeck, J. (2005, April). Firm Size matters: Growth and Productvity growth in African Manufacturing. Economic development and Cultural change, 53.
Vartia, L. (2008). How do Taxes Affect Investment and Productvity An industry level Analysis of OECD countries. OECD Economics Department Working papers.
Verpsagen, B., & Werker, C. (2003). The invisible college of the economics of innovation and technological change. Estudios De Economica, 21(3), pp. 203-220.
Wacziarg, R., & Welsch, K. (2008). Trade Liberalization and Growth: New evidence. World bank Economic Review, 22(2), pp. 187-231.
Wessner, C. (2011). Meeting Global Challenges . German-US innovation policy, summary of a Symposium. National Research Council of National Academies.
Winter, S. (1994). New Growth Theory. Journal of Economic Perspectives, 3-72.
World Bank. (2002). Review of Small Business activites. World Bank, Washington, DC.
World Bank. (2004). Review of Small Business Activities. World Bank, Washington, DC.
World Bank WDI. (n.d.). Retrieved 2013, from World Database Indicators (WDI): http://databank.worldbank.org/data/home.aspx

219
219
World Bank. (n.d.). World Development Indicators. Retrieved 2014, from World DataBank: http://databank.worldbank.org/data/reports.aspx?source=world-development-indicators
Wright, M., Gilligan, J., & Amess, K. (2009). The economic impact of private equity: What we know and what we would like to know. Venture Cpaital, 11(1), 1-21.
Wright, M., Hoskisson, R., & Busenitz, L. (2001, February). Firm rebirth: Buyouts as facilitators of strategic growth and entrepreneurship. Academy of Management Executive, 15(1), 111-125.
Wright, M. & Wilson, N. (2013) Private Equity, Buy-outs and Insolvency Risk, ERC research paper No. 8
Xiao, J. (2013). The acquisition and Firm growth: The prespective of Acquired Entrepreneurial Firms. Retrieved from Druid Society: http://druid8.sit.aau.dk/acc_papers/5dlrukqlsousbght4rfvefufu5qc.pdf
Related Documents