BPS - 3rd Ed . Chapter 13 1 Chapter 13 Confidence intervals: the basics

BPS - 3rd Ed. Chapter 131 Confidence intervals: the basics.
Dec 21, 2015
Welcome message from author
This document is posted to help you gain knowledge. Please leave a comment to let me know what you think about it! Share it to your friends and learn new things together.
Transcript

BPS - 3rd Ed. Chapter 13 1
Chapter 13
Confidence intervals: the basics

BPS - 3rd Ed. Chapter 13 2
Two general types of statistical inference– Confidence Intervals (introduced this chapter)– Tests of Significance (introduced next chapter)
Statistical Inference

BPS - 3rd Ed. Chapter 13 3
1. SRS from population
2. Normal distribution X~N(, ) in the population
3. Although the value of is unknown, the value of the population standard deviation is known
Starting Conditions

BPS - 3rd Ed. Chapter 13 4
Case Study
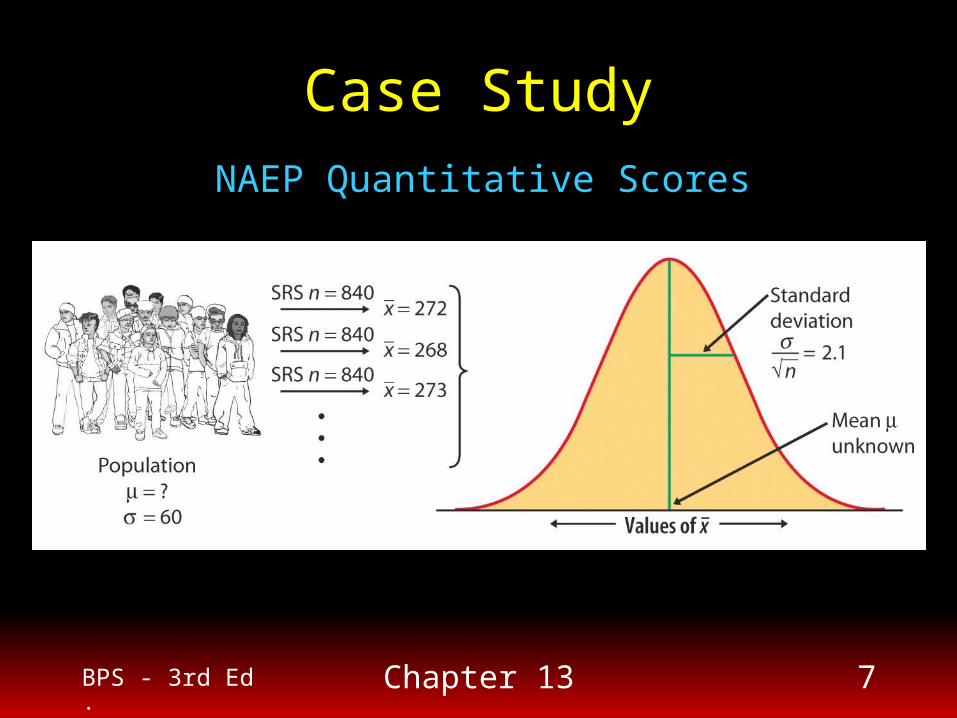
NAEP Quantitative Scores(National Assessment of Educational Progress)
Rivera-Batiz, F. L. (1992). Quantitative literacy and the likelihood of employment among young adults. Journal of
Human Resources, 27, 313-328.
The NAEP survey includes a short test of quantitative skills, covering mainly basic arithmetic and the ability to apply it to realistic problems. Young people have a better chance of good jobs and wages if they are good with numbers.

BPS - 3rd Ed. Chapter 13 5
Case Study
Given:– Scores on the test range from 0 to 500– Higher scores indicate greater numerical ability– It is known NAEP scores have standard deviation = 60.
In a recent year, 840 men 21 to 25 years of age were in the NAEP sample– Their mean quantitative score was 272 (x-bar).– On the basis of this sample, estimate the mean score µ in
the population of 9.5 million young men in this age range
NAEP Quantitative Scores

BPS - 3rd Ed. Chapter 13 6
Case StudyNAEP Quantitative Scores
1. To estimate the unknown population mean , use the sample mean = 272.
2. The law of large numbers suggests that will be close to , but there will be some error in the estimate.
3. The sampling distribution of has a Normal distribution with unknown mean and standard deviation:
x
x
x
n
60
8402.1
BPS - 3rd Ed. Chapter 13 7
Case StudyNAEP Quantitative Scores

BPS - 3rd Ed. Chapter 13 8
Case Study
NAEP Quantitative Scores4. The 68-95-99.7 rule
indicates that and are within two standard deviations (4.2) of each other in about 95% of all samples.
x

BPS - 3rd Ed. Chapter 13 9
Case StudyNAEP Quantitative Scores
So, if we estimate that lies within 4.2 of , we’ll be right about 95% of the time.
x
4.2x is a 95% confidence interval for µ

BPS - 3rd Ed. Chapter 13 10
NAEP Illustration (cont.)
The confidence interval has the formestimate ± margin of error
estimate (x-bar in this case) is our guess for unknown µ
margin of error (± 4.2 in this case) shows accuracy of estimate
4.2x is a 95% confidence interval for µ

BPS - 3rd Ed. Chapter 13 11
Level of Confidence (C)
Probability that interval will capture the true parameter in repeated samples; the “success rate” for the method
You can choose any level of confidence, but the most common levels are:– 90%– 95% – 99%
e.g., If we use 95% confidence, we are saying “we got this interval by a method that gives correct results 95% of the time” (next slide)
BPS - 3rd Ed. Chapter 13 12
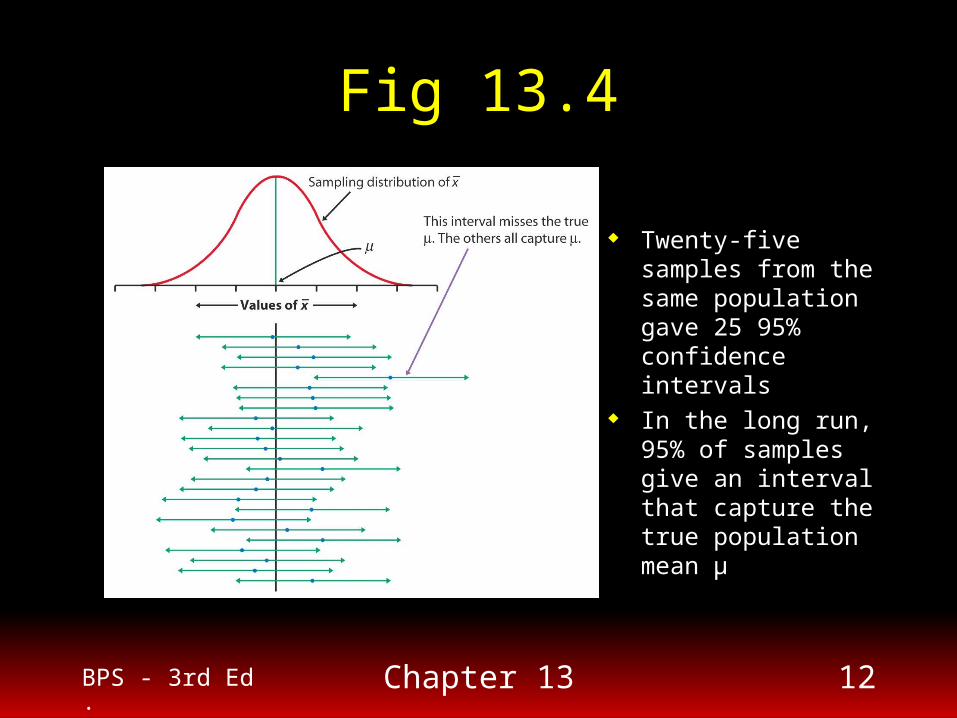
Fig 13.4
Twenty-five samples from the same population gave 25 95% confidence intervals
In the long run, 95% of samples give an interval that capture the true population mean µ

BPS - 3rd Ed. Chapter 13 13
Take an SRS of size n from a Normal population with unknown mean and known standard deviation . A “level C” confidence interval for is:
Confidence IntervalMean of a Normal Population
n
σzx
Confidence level C 90% 95% 99%
Critical value z* 1.645 1.960 2.576

BPS - 3rd Ed. Chapter 13 14
Confidence IntervalMean of a Normal Population

BPS - 3rd Ed. Chapter 13 15
Case StudyNAEP Quantitative Scores
Using the 68-95-99.7 rule gave an approximate 95% confidence interval. A more precise 95% confidence interval can be found using the appropriate value of z* (1.960) with the previous formula
267.884=4.116272=1)(1.960)(2. x276.116=4.116272=1)(1.960)(2. x
We are 95% confident that the average NAEP quantitative score for all adult males is between 267.884 and 276.116.
BPS - 3rd Ed. Chapter 13 16
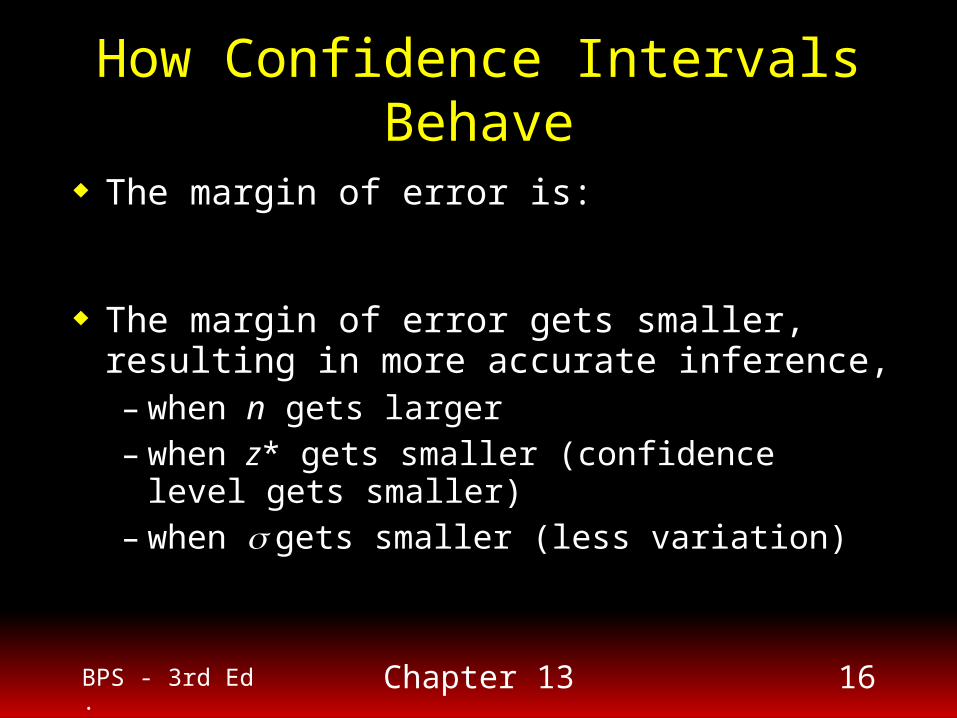
The margin of error is:
The margin of error gets smaller, resulting in more accurate inference,– when n gets larger– when z* gets smaller (confidence level gets
smaller)– when gets smaller (less variation)
How Confidence Intervals Behave
margin of error = z
n

BPS - 3rd Ed. Chapter 13 17
Case Study
NAEP Quantitative Scores
90% Confidence Interval268.5455=45453272=1)(1.645)(2. .x275.4545=45453272=1)(1.645)(2. .x
The 90% CI is narrower than the 95% CI.
95% Confidence Interval
267.884=4.116272=1)(1.960)(2. x276.116=4.116272=1)(1.960)(2. x

BPS - 3rd Ed. Chapter 13 18
Choosing the Sample Size
The confidence interval for the mean of a Normal population will have a specified margin of error m when the sample size is:
2
m
σzn

BPS - 3rd Ed. Chapter 13 19
Case Study
NAEP Quantitative ScoresSuppose that we want to estimate the population mean NAEP scores using a 90% confidence interval, and we are instructed to do so such that the margin of error does not exceed 3 points.
What sample size will be required to enable us to create such an interval?

BPS - 3rd Ed. Chapter 13 20
Case Study
NAEP Quantitative Scores
Thus, we will need to sample at least 1082.41 men aged 21 to 25 years to ensure a margin of error not to exceed 3 points. Note that since we can’t sample a fraction of an individual and using 1082 men will yield a margin of error slightly more than 3 points, our sample size should be n = 1083 men.
1082.413
)(1.645)(6022
m
σzn
Related Documents