2015 First Quarter Report

Welcome message from author
This document is posted to help you gain knowledge. Please leave a comment to let me know what you think about it! Share it to your friends and learn new things together.
Transcript
2015 First Quarter Report
2 2015 First Quarter Report
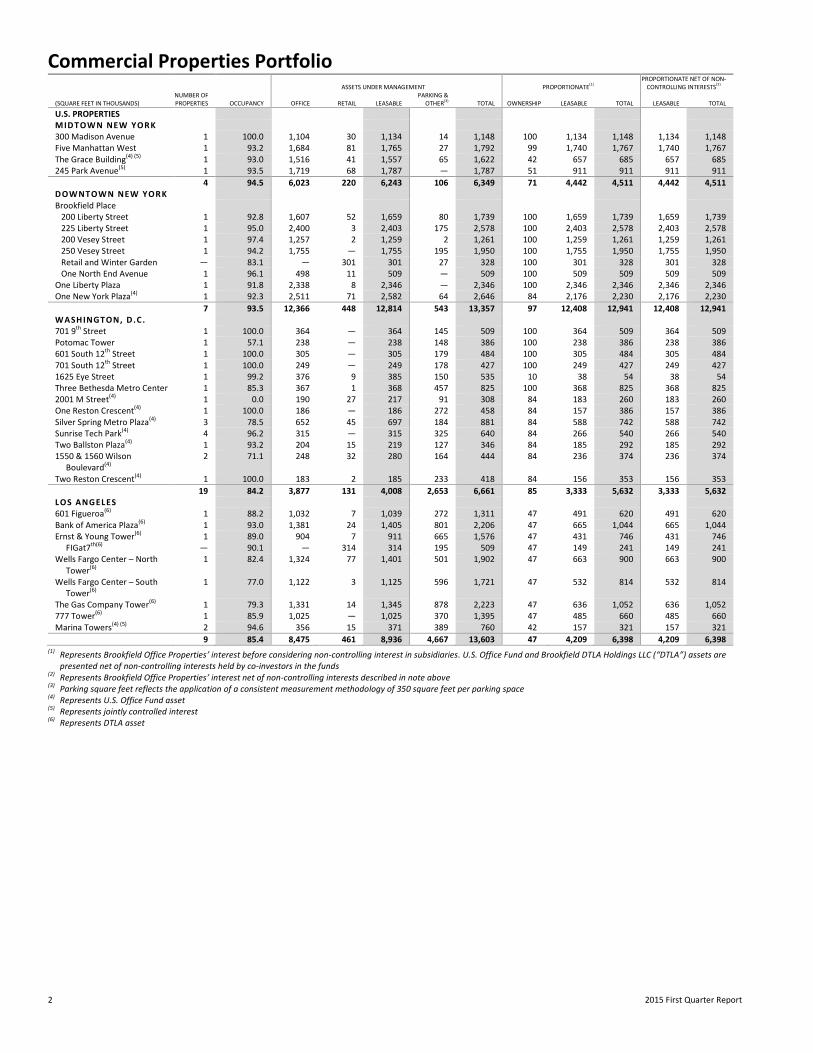
Commercial Properties Portfolio
ASSETS UNDER MANAGEMENT PROPORTIONATE(1)
PROPORTIONATE NET OF NON-
CONTROLLING INTERESTS(2)
(SQUARE FEET IN THOUSANDS) NUMBER OF PROPERTIES OCCUPANCY OFFICE RETAIL LEASABLE
PARKING & OTHER
(3) TOTAL OWNERSHIP LEASABLE TOTAL
LEASABLE
TOTAL
U.S. PROPERTIES MIDTOWN NEW YORK 300 Madison Avenue 1 100.0 1,104 30 1,134 14 1,148 100 1,134 1,148 1,134 1,148 Five Manhattan West 1 93.2 1,684 81 1,765 27 1,792 99 1,740 1,767 1,740 1,767 The Grace Building(4) (5) 1 93.0 1,516 41 1,557 65 1,622 42 657 685 657 685 245 Park Avenue(5) 1 93.5 1,719 68 1,787 — 1,787 51 911 911 911 911
4 94.5 6,023 220 6,243 106 6,349 71 4,442 4,511 4,442 4,511 DOWNTOWN NEW YORK Brookfield Place 200 Liberty Street 1 92.8 1,607 52 1,659 80 1,739 100 1,659 1,739 1,659 1,739 225 Liberty Street 1 95.0 2,400 3 2,403 175 2,578 100 2,403 2,578 2,403 2,578 200 Vesey Street 1 97.4 1,257 2 1,259 2 1,261 100 1,259 1,261 1,259 1,261 250 Vesey Street 1 94.2 1,755 — 1,755 195 1,950 100 1,755 1,950 1,755 1,950 Retail and Winter Garden — 83.1 — 301 301 27 328 100 301 328 301 328 One North End Avenue 1 96.1 498 11 509 — 509 100 509 509 509 509 One Liberty Plaza 1 91.8 2,338 8 2,346 — 2,346 100 2,346 2,346 2,346 2,346 One New York Plaza(4) 1 92.3 2,511 71 2,582 64 2,646 84 2,176 2,230 2,176 2,230
7 93.5 12,366 448 12,814 543 13,357 97 12,408 12,941 12,408 12,941 WASHINGTON, D.C . 701 9th Street 1 100.0 364 — 364 145 509 100 364 509 364 509 Potomac Tower 1 57.1 238 — 238 148 386 100 238 386 238 386 601 South 12th Street 1 100.0 305 — 305 179 484 100 305 484 305 484 701 South 12th Street 1 100.0 249 — 249 178 427 100 249 427 249 427 1625 Eye Street 1 99.2 376 9 385 150 535 10 38 54 38 54 Three Bethesda Metro Center 1 85.3 367 1 368 457 825 100 368 825 368 825 2001 M Street(4) 1 0.0 190 27 217 91 308 84 183 260 183 260 One Reston Crescent(4) 1 100.0 186 — 186 272 458 84 157 386 157 386 Silver Spring Metro Plaza(4) 3 78.5 652 45 697 184 881 84 588 742 588 742 Sunrise Tech Park(4) 4 96.2 315 — 315 325 640 84 266 540 266 540 Two Ballston Plaza(4) 1 93.2 204 15 219 127 346 84 185 292 185 292 1550 & 1560 Wilson
Boulevard(4) 2 71.1 248 32 280 164 444 84 236 374 236 374
Two Reston Crescent(4) 1 100.0 183 2 185 233 418 84 156 353 156 353
19 84.2 3,877 131 4,008 2,653 6,661 85 3,333 5,632 3,333 5,632 LOS ANGELES 601 Figueroa(6) 1 88.2 1,032 7 1,039 272 1,311 47 491 620 491 620 Bank of America Plaza(6) 1 93.0 1,381 24 1,405 801 2,206 47 665 1,044 665 1,044 Ernst & Young Tower(6) 1 89.0 904 7 911 665 1,576 47 431 746 431 746 FIGat7th(6) — 90.1 — 314 314 195 509 47 149 241 149 241 Wells Fargo Center – North
Tower(6) 1 82.4 1,324 77 1,401 501 1,902 47 663 900 663 900
Wells Fargo Center – South Tower(6)
1 77.0 1,122 3 1,125 596 1,721 47 532 814 532 814
The Gas Company Tower(6) 1 79.3 1,331 14 1,345 878 2,223 47 636 1,052 636 1,052 777 Tower(6) 1 85.9 1,025 — 1,025 370 1,395 47 485 660 485 660 Marina Towers(4) (5) 2 94.6 356 15 371 389 760 42 157 321 157 321
9 85.4 8,475 461 8,936 4,667 13,603 47 4,209 6,398 4,209 6,398 (1) Represents Brookfield Office Properties’ interest before considering non-controlling interest in subsidiaries. U.S. Office Fund and Brookfield DTLA Holdings LLC (“DTLA”) assets are
presented net of non-controlling interests held by co-investors in the funds (2) Represents Brookfield Office Properties’ interest net of non-controlling interests described in note above (3) Parking square feet reflects the application of a consistent measurement methodology of 350 square feet per parking space (4)
Represents U.S. Office Fund asset (5) Represents jointly controlled interest (6)
Represents DTLA asset
Brookfield Office Properties 3
ASSETS UNDER MANAGEMENT PROPORTIONATE(1)
PROPORTIONATE NET OF NON-
CONTROLLING INTERESTS(2)
(SQUARE FEET IN THOUSANDS) NUMBER OF PROPERTIES OCCUPANCY OFFICE RETAIL LEASABLE
PARKING & OTHER
(3) TOTAL OWNED % LEASABLE TOTAL
LEASABLE
TOTAL
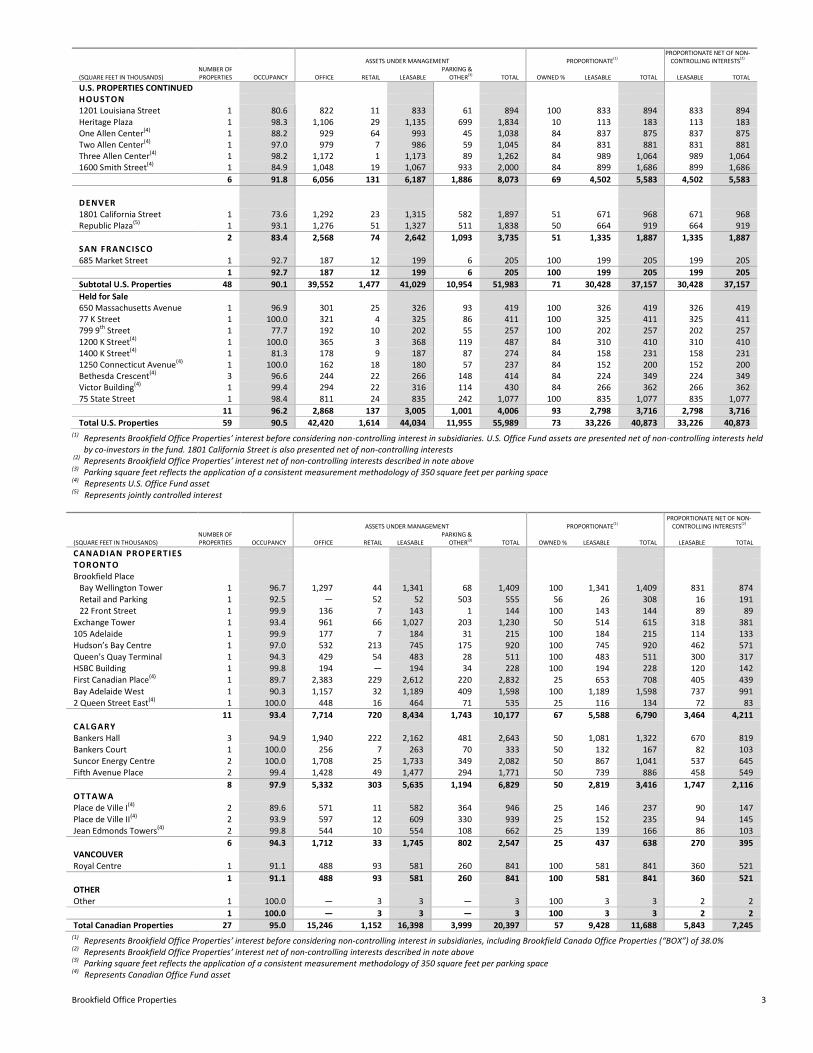
U.S. PROPERTIES CONTINUED HOUSTON 1201 Louisiana Street 1 80.6 822 11 833 61 894 100 833 894 833 894 Heritage Plaza 1 98.3 1,106 29 1,135 699 1,834 10 113 183 113 183 One Allen Center(4) 1 88.2 929 64 993 45 1,038 84 837 875 837 875 Two Allen Center(4) 1 97.0 979 7 986 59 1,045 84 831 881 831 881 Three Allen Center(4) 1 98.2 1,172 1 1,173 89 1,262 84 989 1,064 989 1,064 1600 Smith Street(4) 1 84.9 1,048 19 1,067 933 2,000 84 899 1,686 899 1,686
6 91.8 6,056 131 6,187 1,886 8,073 69 4,502 5,583 4,502 5,583
DENVER 1801 California Street 1 73.6 1,292 23 1,315 582 1,897 51 671 968 671 968 Republic Plaza(5) 1 93.1 1,276 51 1,327 511 1,838 50 664 919 664 919
2 83.4 2,568 74 2,642 1,093 3,735 51 1,335 1,887 1,335 1,887 SAN FRANCISCO 685 Market Street 1 92.7 187 12 199 6 205 100 199 205 199 205
1 92.7 187 12 199 6 205 100 199 205 199 205
Subtotal U.S. Properties 48 90.1 39,552 1,477 41,029 10,954 51,983 71 30,428 37,157 30,428 37,157
Held for Sale 650 Massachusetts Avenue 1 96.9 301 25 326 93 419 100 326 419 326 419 77 K Street 1 100.0 321 4 325 86 411 100 325 411 325 411 799 9th Street 1 77.7 192 10 202 55 257 100 202 257 202 257 1200 K Street(4) 1 100.0 365 3 368 119 487 84 310 410 310 410 1400 K Street(4) 1 81.3 178 9 187 87 274 84 158 231 158 231 1250 Connecticut Avenue(4) 1 100.0 162 18 180 57 237 84 152 200 152 200 Bethesda Crescent(4) 3 96.6 244 22 266 148 414 84 224 349 224 349 Victor Building(4) 1 99.4 294 22 316 114 430 84 266 362 266 362 75 State Street 1 98.4 811 24 835 242 1,077 100 835 1,077 835 1,077
11 96.2 2,868 137 3,005 1,001 4,006 93 2,798 3,716 2,798 3,716
Total U.S. Properties 59 90.5 42,420 1,614 44,034 11,955 55,989 73 33,226 40,873 33,226 40,873 (1) Represents Brookfield Office Properties’ interest before considering non-controlling interest in subsidiaries. U.S. Office Fund assets are presented net of non-controlling interests held
by co-investors in the fund. 1801 California Street is also presented net of non-controlling interests (2) Represents Brookfield Office Properties’ interest net of non-controlling interests described in note above (3) Parking square feet reflects the application of a consistent measurement methodology of 350 square feet per parking space (4) Represents U.S. Office Fund asset (5) Represents jointly controlled interest
ASSETS UNDER MANAGEMENT PROPORTIONATE
(1)
PROPORTIONATE NET OF NON-CONTROLLING INTERESTS
(2)
(SQUARE FEET IN THOUSANDS) NUMBER OF PROPERTIES OCCUPANCY OFFICE RETAIL LEASABLE
PARKING & OTHER
(3) TOTAL OWNED % LEASABLE TOTAL
LEASABLE
TOTAL
CANADIAN PROPERTIES TORONTO Brookfield Place Bay Wellington Tower 1 96.7 1,297 44 1,341 68 1,409 100 1,341 1,409 831 874 Retail and Parking 1 92.5 — 52 52 503 555 56 26 308 16 191 22 Front Street 1 99.9 136 7 143 1 144 100 143 144 89 89 Exchange Tower 1 93.4 961 66 1,027 203 1,230 50 514 615 318 381 105 Adelaide 1 99.9 177 7 184 31 215 100 184 215 114 133 Hudson’s Bay Centre 1 97.0 532 213 745 175 920 100 745 920 462 571 Queen’s Quay Terminal 1 94.3 429 54 483 28 511 100 483 511 300 317 HSBC Building 1 99.8 194 — 194 34 228 100 194 228 120 142 First Canadian Place(4) 1 89.7 2,383 229 2,612 220 2,832 25 653 708 405 439
Bay Adelaide West 1 90.3 1,157 32 1,189 409 1,598 100 1,189 1,598 737 991 2 Queen Street East(4) 1 100.0 448 16 464 71 535 25 116 134 72 83
11 93.4 7,714 720 8,434 1,743 10,177 67 5,588 6,790 3,464 4,211 CALGARY Bankers Hall 3 94.9 1,940 222 2,162 481 2,643 50 1,081 1,322 670 819 Bankers Court 1 100.0 256 7 263 70 333 50 132 167 82 103 Suncor Energy Centre 2 100.0 1,708 25 1,733 349 2,082 50 867 1,041 537 645 Fifth Avenue Place 2 99.4 1,428 49 1,477 294 1,771 50 739 886 458 549
8 97.9 5,332 303 5,635 1,194 6,829 50 2,819 3,416 1,747 2,116 OTTAWA Place de Ville I(4) 2 89.6 571 11 582 364 946 25 146 237 90 147 Place de Ville II(4) 2 93.9 597 12 609 330 939 25 152 235 94 145 Jean Edmonds Towers(4) 2 99.8 544 10 554 108 662 25 139 166 86 103
6 94.3 1,712 33 1,745 802 2,547 25 437 638 270 395 VANCOUVER Royal Centre 1 91.1 488 93 581 260 841 100 581 841 360 521
1 91.1 488 93 581 260 841 100 581 841 360 521 OTHER Other 1 100.0 — 3 3 — 3 100 3 3 2 2
1 100.0 — 3 3 — 3 100 3 3 2 2
Total Canadian Properties 27 95.0 15,246 1,152 16,398 3,999 20,397 57 9,428 11,688 5,843 7,245 (1) Represents Brookfield Office Properties’ interest before considering non-controlling interest in subsidiaries, including Brookfield Canada Office Properties (“BOX”) of 38.0% (2)
Represents Brookfield Office Properties’ interest net of non-controlling interests described in note above (3) Parking square feet reflects the application of a consistent measurement methodology of 350 square feet per parking space (4) Represents Canadian Office Fund asset
4 2015 First Quarter Report
ASSETS UNDER MANAGEMENT PROPORTIONATE(1)
PROPORTIONATE NET OF NON-
CONTROLLING INTERESTS(2)
(SQUARE FEET IN THOUSANDS) NUMBER OF PROPERTIES OCCUPANCY OFFICE RETAIL LEASABLE
PARKING & OTHER(3) TOTAL OWNED % LEASABLE TOTAL
LEASABLE
TOTAL
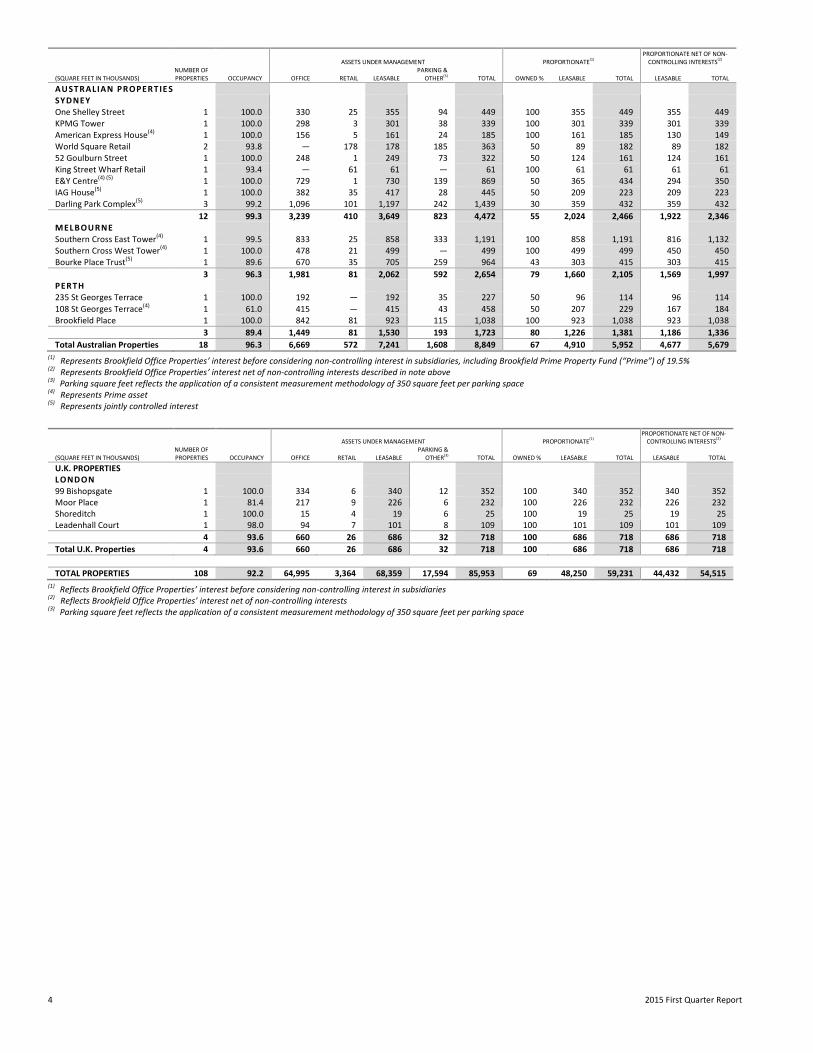
AUSTRALIAN PROPERTIE S SYDNEY One Shelley Street 1 100.0 330 25 355 94 449 100 355 449 355 449 KPMG Tower 1 100.0 298 3 301 38 339 100 301 339 301 339 American Express House(4) 1 100.0 156 5 161 24 185 100 161 185 130 149 World Square Retail 2 93.8 — 178 178 185 363 50 89 182 89 182 52 Goulburn Street 1 100.0 248 1 249 73 322 50 124 161 124 161 King Street Wharf Retail 1 93.4 — 61 61 — 61 100 61 61 61 61 E&Y Centre(4) (5) 1 100.0 729 1 730 139 869 50 365 434 294 350 IAG House(5) 1 100.0 382 35 417 28 445 50 209 223 209 223 Darling Park Complex(5) 3 99.2 1,096 101 1,197 242 1,439 30 359 432 359 432
12 99.3 3,239 410 3,649 823 4,472 55 2,024 2,466 1,922 2,346 MELBOURNE Southern Cross East Tower(4) 1 99.5 833 25 858 333 1,191 100 858 1,191 816 1,132 Southern Cross West Tower(4) 1 100.0 478 21 499 — 499 100 499 499 450 450 Bourke Place Trust(5) 1 89.6 670 35 705 259 964 43 303 415 303 415
3 96.3 1,981 81 2,062 592 2,654 79 1,660 2,105 1,569 1,997 PERTH 235 St Georges Terrace 1 100.0 192 — 192 35 227 50 96 114 96 114
108 St Georges Terrace(4) 1 61.0 415 — 415 43 458 50 207 229 167 184 Brookfield Place 1 100.0 842 81 923 115 1,038 100 923 1,038 923 1,038
3 89.4 1,449 81 1,530 193 1,723 80 1,226 1,381 1,186 1,336
Total Australian Properties 18 96.3 6,669 572 7,241 1,608 8,849 67 4,910 5,952 4,677 5,679 (1)
Represents Brookfield Office Properties’ interest before considering non-controlling interest in subsidiaries, including Brookfield Prime Property Fund (“Prime”) of 19.5% (2) Represents Brookfield Office Properties’ interest net of non-controlling interests described in note above (3) Parking square feet reflects the application of a consistent measurement methodology of 350 square feet per parking space (4) Represents Prime asset (5) Represents jointly controlled interest
ASSETS UNDER MANAGEMENT PROPORTIONATE(1)
PROPORTIONATE NET OF NON-
CONTROLLING INTERESTS(2)
(SQUARE FEET IN THOUSANDS) NUMBER OF PROPERTIES OCCUPANCY OFFICE RETAIL LEASABLE
PARKING & OTHER
(3) TOTAL OWNED % LEASABLE TOTAL
LEASABLE
TOTAL
U.K. PROPERTIES LONDON 99 Bishopsgate 1 100.0 334 6 340 12 352 100 340 352 340 352 Moor Place 1 81.4 217 9 226 6 232 100 226 232 226 232 Shoreditch 1 100.0 15 4 19 6 25 100 19 25 19 25 Leadenhall Court 1 98.0 94 7 101 8 109 100 101 109 101 109
4 93.6 660 26 686 32 718 100 686 718 686 718
Total U.K. Properties 4 93.6 660 26 686 32 718 100 686 718 686 718
TOTAL PROPERTIES 108 92.2 64,995 3,364 68,359 17,594 85,953 69 48,250 59,231 44,432 54,515 (1) Reflects Brookfield Office Properties’ interest before considering non-controlling interest in subsidiaries (2) Reflects Brookfield Office Properties’ interest net of non-controlling interests (3) Parking square feet reflects the application of a consistent measurement methodology of 350 square feet per parking space
Brookfield Office Properties 5
Contents
MANAGEMENT’S DISCUSSION AND ANALYSIS OF FINANCIAL RESULTS PART I – OBJECTIVES AND FINANCIAL HIGHLIGHTS ..................................................................................................................... 7 PART II – FINANCIAL STATEMENT ANALYSIS .............................................................................................................................. 12 PART III – RISKS AND UNCERTAINTIES ....................................................................................................................................... 36 PART IV – CRITICAL ACCOUNTING POLICIES AND ESTIMATES ................................................................................................... 44
CONDENSED CONSOLIDATED FINANCIAL STATEMENTS ................................................................................................................... 46 NOTES TO THE CONDENSED CONSOLIDATED FINANCIAL STATEMENTS .......................................................................................... 51 SHAREHOLDER INFORMATION ......................................................................................................................................................... 70 CORPORATE INFORMATION ............................................................................................................................................................. 71
6 2015 First Quarter Report
FORWARD-LOOKING STATEMENTS This interim report to shareholders, particularly the section entitled Management’s Discussion and Analysis of Financial Results, contains “forward-looking information” within the meaning of Canadian provincial securities laws and applicable regulations. Forward-looking statements include statements that are predictive in nature, depend upon or refer to future events or conditions, include statements regarding our operations, business, financial condition, expected financial results, performance, prospects, opportunities, priorities, targets, goals, ongoing objectives, strategies and outlook, as well as the outlook for North American and international economies for the current fiscal year and subsequent periods, and include words such as “expects”, “anticipates”, “plans”, “believes”, “estimates”, “seeks”, “intends”, “targets”, “projects”, “forecasts”, “likely”, or negative versions thereof and other similar expressions, or future or conditional verbs such as “may”, “will”, “should”, “would” and “could”. Although we believe that our anticipated future results, performance or achievements expressed or implied by the forward-looking statements and information are based upon reasonable assumptions and expectations, the reader should not place undue reliance on forward-looking statements and information because they involve known and unknown risks, uncertainties and other factors, many of which are beyond our control, which may cause our actual results, performance or achievements to differ materially from anticipated future results, performance or achievements expressed or implied by such forward-looking statements and information. Factors that could cause actual results to differ materially from those contemplated or implied by forward-looking statements include, but are not limited to: risks incidental to the ownership and operation of real estate properties including local real estate conditions; the impact or unanticipated impact of general economic, political and market factors in the countries in which we do business; the ability to enter into new leases or renew leases on favorable terms; business competition; dependence on tenants’ financial condition; the use of debt to finance our business; the behavior of financial markets, including fluctuations in interest and foreign exchanges rates; uncertainties of real estate development or redevelopment; global equity and capital markets and the availability of equity and debt financing and refinancing within these markets; risks relating to our insurance coverage; the possible impact of international conflicts and other developments including terrorist acts; potential environmental liabilities; changes in tax laws and other tax related risks; dependence on management personnel; illiquidity of investments; the ability to complete and effectively integrate acquisitions into existing operations and the ability to attain expected benefits therefrom; operational and reputational risks; catastrophic events, such as earthquakes and hurricanes; and other risks and factors detailed from time to time in documents filed by Brookfield Office Properties with the securities regulators in Canada as applicable. We caution that the foregoing list of important factors that may affect future results is not exhaustive. When relying on our forward-looking statements or information, investors and others should carefully consider the foregoing factors and other uncertainties and potential events. Except as required by law, we undertake no obligation to publicly update or revise any forward-looking statements or information, whether written or oral, that may be as a result of new information, future events or otherwise.
Brookfield Office Properties 7
Management’s Discussion and Analysis of Financial Results May 13, 2015
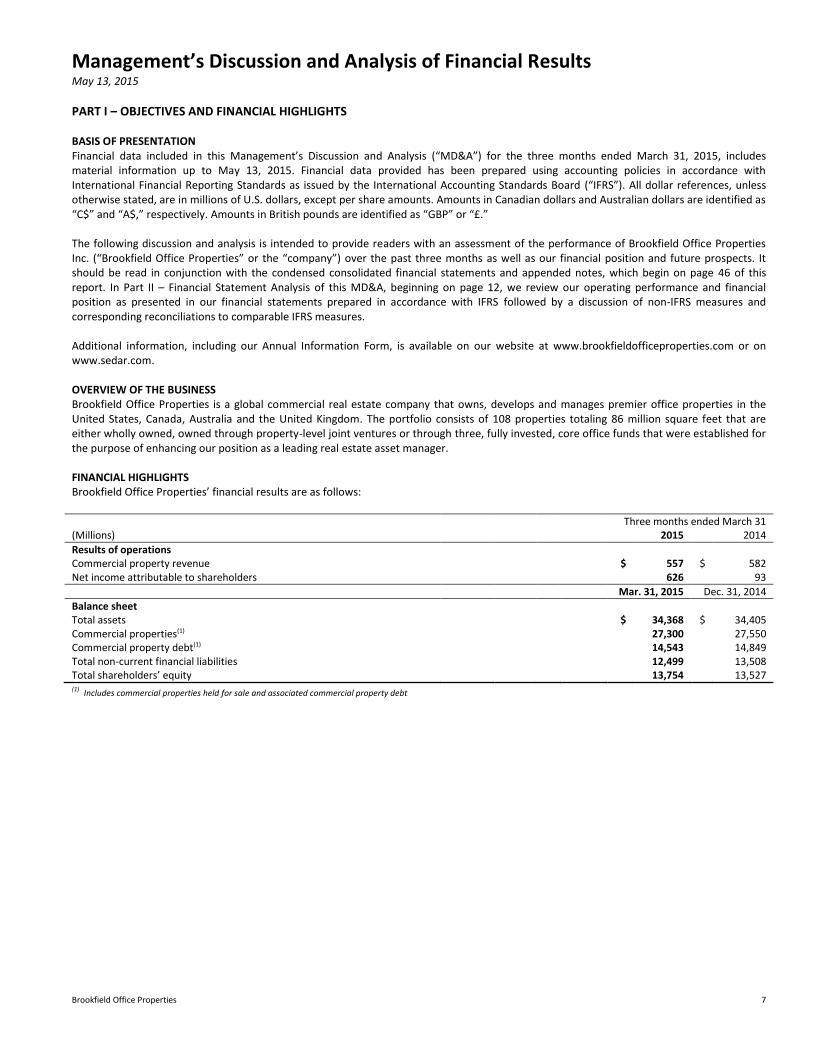
PART I – OBJECTIVES AND FINANCIAL HIGHLIGHTS BASIS OF PRESENTATION Financial data included in this Management’s Discussion and Analysis (“MD&A”) for the three months ended March 31, 2015, includes material information up to May 13, 2015. Financial data provided has been prepared using accounting policies in accordance with International Financial Reporting Standards as issued by the International Accounting Standards Board (“IFRS”). All dollar references, unless otherwise stated, are in millions of U.S. dollars, except per share amounts. Amounts in Canadian dollars and Australian dollars are identified as “C$” and “A$,” respectively. Amounts in British pounds are identified as “GBP” or “£.” The following discussion and analysis is intended to provide readers with an assessment of the performance of Brookfield Office Properties Inc. (“Brookfield Office Properties” or the “company”) over the past three months as well as our financial position and future prospects. It should be read in conjunction with the condensed consolidated financial statements and appended notes, which begin on page 46 of this report. In Part II – Financial Statement Analysis of this MD&A, beginning on page 12, we review our operating performance and financial position as presented in our financial statements prepared in accordance with IFRS followed by a discussion of non-IFRS measures and corresponding reconciliations to comparable IFRS measures. Additional information, including our Annual Information Form, is available on our website at www.brookfieldofficeproperties.com or on www.sedar.com. OVERVIEW OF THE BUSINESS Brookfield Office Properties is a global commercial real estate company that owns, develops and manages premier office properties in the United States, Canada, Australia and the United Kingdom. The portfolio consists of 108 properties totaling 86 million square feet that are either wholly owned, owned through property-level joint ventures or through three, fully invested, core office funds that were established for the purpose of enhancing our position as a leading real estate asset manager. FINANCIAL HIGHLIGHTS Brookfield Office Properties’ financial results are as follows: Three months ended March 31 (Millions) 2015 2014
Results of operations Commercial property revenue $ 557 $ 582 Net income attributable to shareholders 626 93
Mar. 31, 2015 Dec. 31, 2014
Balance sheet Total assets $ 34,368 $ 34,405 Commercial properties(1) 27,300 27,550 Commercial property debt(1) 14,543 14,849 Total non-current financial liabilities 12,499 13,508 Total shareholders’ equity 13,754 13,527 (1) Includes commercial properties held for sale and associated commercial property debt
8 2015 First Quarter Report
COMMERCIAL PROPERTY OPERATIONS Our commercial property portfolio consists of interests in 108 properties totaling 86 million square feet, including 18 million square feet of parking and other. Our development portfolio comprises interests in 20 sites totaling 19 million square feet. Our primary markets are the financial, energy and government center cities of New York, Washington, D.C., Houston, Los Angeles, Toronto, Calgary and Ottawa in North America as well as Sydney, Melbourne and Perth in Australia and London in the United Kingdom. Landmark assets include Brookfield Places in New York, Toronto and Perth, Bank of America Plaza in Los Angeles, Bankers Hall in Calgary and Darling Park Complex in Sydney. We remain focused on the following strategic priorities:
• Realizing value from our investment properties through proactive leasing and select redevelopment initiatives;
• Prudent capital management, including the refinancing of mature investment properties and disposition of select mature or non-core assets; and
• Advancing development assets as the economy rebounds and supply constraints create opportunities. Our commercial property investments are held through wholly or partially owned subsidiaries, which are fully consolidated on our balance sheet, and through entities that we jointly control with our partners, for which we recognize our interests in the net assets of such entities following the equity method of accounting or, in the case of joint operations, by recording our share of the assets and liabilities. We also recognize our investments in certain assets in Australia in the form of participating loan interests. We believe that investing our liquidity with partners through joint ventures or funds enables us to enhance returns. The funds and associated asset management fees represent an important area of growth as we expand our assets under management. Purchasing properties or portfolios of properties in a fund format allows us to earn the following categories of fees:
• Asset Management Stable base fee for providing regular, ongoing services.
• Transaction Development, redevelopment and leasing activities conducted on behalf of these funds.
• Performance Earned when certain predetermined benchmarks are exceeded. Performance fees, which can add considerably to fee revenue, typically arise later in a fund’s life cycle and are therefore not fully reflected in current results.
An important characteristic of our portfolio is the strong credit quality of our tenants. We direct special attention to credit quality, particularly in the current economic environment, in order to ensure the long-term sustainability of rental revenues through economic cycles. Major tenants with over 1,000,000 square feet of space in the portfolio include government and government agencies, CIBC World Markets, Suncor Energy Inc., Morgan Stanley, Bank of Montreal, Bank of America/Merrill Lynch and Royal Bank of Canada. A detailed list of major tenants is included in Part III – Risks and Uncertainties of this MD&A, beginning on page 36. Our strategy is to sign long-term leases in order to mitigate risk and reduce our overall re-tenanting costs. We typically commence discussions with tenants regarding their space requirements well in advance of the contractual expiration, and although each market is different, the majority of our leases, when signed, extend between 10- and 20-year terms. As a result of this strategy, only six percent of our leases, on average, mature annually up to 2019. Our Canadian Office Fund, which consists of eight properties in Toronto and Ottawa, and a 0.6 million square foot development site, is a consortium of institutional investors, led and managed by us. Affiliates of the consortium members own direct interests in property-level joint arrangements and have entered into several agreements relating to property management, fees, transfer rights and other material issues associated with the operation of the properties. We account for our interest in this fund by recognizing our share of the assets, liabilities and results of operations of the properties. Our U.S. Office Fund, which consists of 28 properties in New York, Washington, D.C., Houston and Los Angeles, and 2.9 million square feet of development sites, which we lead and manage, invests through direct and indirect investment vehicles that have also entered into several agreements relating to property management, fees, transfer rights and other material issues associated with the operation of the properties. Our 84.3% interest in the U.S. Office Fund is held through an indirect interest in TRZ Holdings LLC which is reflected as a consolidated subsidiary in our condensed consolidated financial statements. Brookfield DTLA Holdings LLC (“DTLA”), which consists of seven properties in Los Angeles, and a 0.8 million square foot development site, which we lead and manage, invests through direct and indirect investment vehicles that have also entered into several agreements relating to property management, fees, transfer rights and other material issues associated with the operation of the properties. We have a 47.3% interest in DTLA which is reflected as a consolidated subsidiary in our condensed consolidated financial statements.

Brookfield Office Properties 9
In the third quarter of 2010, we acquired an interest in a portfolio of properties in Australia (the “Australian portfolio”) through an investment of A$1.6 billion in exchange for participating loan interests that provide us with an interest in the results of operations and changes in fair values of the properties. These participating loan interests are a hybrid instrument consisting of an interest bearing note, a total return swap and an option to acquire direct or indirect legal ownership of the properties (the “property subsidiaries”). Certain of these participating loan interests provide us with control or joint control over the property subsidiaries and are consolidated or equity accounted as joint ventures, accordingly. Where the participating loan interests do not provide us with control over a property subsidiary, they are presented as participating loan interests. As a result of this arrangement, we also hold an 80.5% controlling interest in Prime, an entity that holds direct ownership interest in five properties in the Australian portfolio, and we have recognized the non-controlling interests in the net assets of Prime in equity. On June 9, 2014, Brookfield Property Partners L.P. (“BPY”) and its indirect subsidiaries, by way of a plan of arrangement, completed the acquisition of 100% of the issued and outstanding common shares of Brookfield Office Properties.
10 2015 First Quarter Report
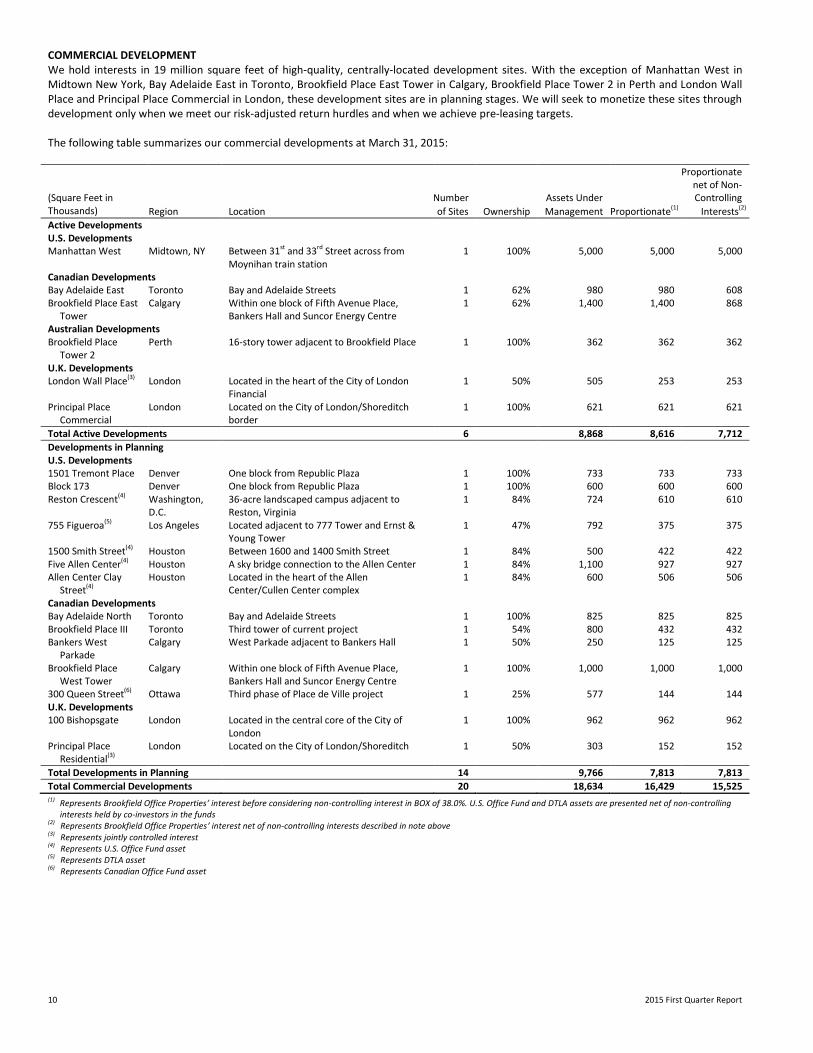
COMMERCIAL DEVELOPMENT We hold interests in 19 million square feet of high-quality, centrally-located development sites. With the exception of Manhattan West in Midtown New York, Bay Adelaide East in Toronto, Brookfield Place East Tower in Calgary, Brookfield Place Tower 2 in Perth and London Wall Place and Principal Place Commercial in London, these development sites are in planning stages. We will seek to monetize these sites through development only when we meet our risk-adjusted return hurdles and when we achieve pre-leasing targets. The following table summarizes our commercial developments at March 31, 2015: Proportionate net of Non- (Square Feet in Thousands)
Number Assets Under Controlling
Region Location of Sites Ownership Management Proportionate(1) Interests(2)
Active Developments U.S. Developments Manhattan West Midtown, NY Between 31st and 33rd Street across from
Moynihan train station 1 100% 5,000 5,000 5,000
Canadian Developments Bay Adelaide East Toronto Bay and Adelaide Streets 1 62% 980 980 608 Brookfield Place East
Tower Calgary Within one block of Fifth Avenue Place,
Bankers Hall and Suncor Energy Centre 1 62% 1,400 1,400 868
Australian Developments Brookfield Place
Tower 2 Perth 16-story tower adjacent to Brookfield Place 1 100% 362 362 362
U.K. Developments London Wall Place(3) London Located in the heart of the City of London
Financial 1 50% 505 253 253
Principal Place Commercial
London Located on the City of London/Shoreditch border
1 100% 621 621 621
Total Active Developments 6 8,868 8,616 7,712
Developments in Planning U.S. Developments 1501 Tremont Place Denver One block from Republic Plaza 1 100% 733 733 733 Block 173 Denver One block from Republic Plaza 1 100% 600 600 600 Reston Crescent(4) Washington,
D.C. 36-acre landscaped campus adjacent to Reston, Virginia
1 84% 724 610 610
755 Figueroa(5) Los Angeles Located adjacent to 777 Tower and Ernst & Young Tower
1 47% 792 375 375
1500 Smith Street(4) Houston Between 1600 and 1400 Smith Street 1 84% 500 422 422 Five Allen Center(4) Houston A sky bridge connection to the Allen Center 1 84% 1,100 927 927 Allen Center Clay
Street(4) Houston Located in the heart of the Allen
Center/Cullen Center complex 1 84% 600 506 506
Canadian Developments Bay Adelaide North Toronto Bay and Adelaide Streets 1 100% 825 825 825 Brookfield Place III Toronto Third tower of current project 1 54% 800 432 432 Bankers West
Parkade Calgary West Parkade adjacent to Bankers Hall 1 50% 250 125 125
Brookfield Place West Tower
Calgary Within one block of Fifth Avenue Place, Bankers Hall and Suncor Energy Centre
1 100% 1,000 1,000 1,000
300 Queen Street(6) Ottawa Third phase of Place de Ville project 1 25% 577 144 144 U.K. Developments 100 Bishopsgate London Located in the central core of the City of
London 1 100% 962 962 962
Principal Place Residential(3)
London Located on the City of London/Shoreditch 1 50% 303 152 152
Total Developments in Planning 14 9,766 7,813 7,813
Total Commercial Developments 20 18,634 16,429 15,525 (1)
Represents Brookfield Office Properties’ interest before considering non-controlling interest in BOX of 38.0%. U.S. Office Fund and DTLA assets are presented net of non-controlling interests held by co-investors in the funds
(2) Represents Brookfield Office Properties’ interest net of non-controlling interests described in note above (3)
Represents jointly controlled interest (4) Represents U.S. Office Fund asset (5) Represents DTLA asset (6)
Represents Canadian Office Fund asset
Brookfield Office Properties 11
PERFORMANCE MEASUREMENT The key indicators by which we measure our performance are:
• Net income attributable to shareholders;
• Funds from operations;
• Overall indebtedness level;
• Weighted average cost of debt; and
• Occupancy levels. Net Income Attributable to Shareholders Net income attributable to shareholders is calculated in accordance with IFRS. Net income attributable to shareholders is used as a key indicator in assessing the profitability of the company. KEY PERFORMANCE DRIVERS In addition to monitoring and analyzing performance in terms of net income attributable to shareholders, we consider the following items to be important drivers of our current and anticipated financial performance:
• Increases in occupancies by leasing vacant space;
• Increases in rental rates through maintaining or enhancing the quality of our assets and as market conditions permit; and
• Reduction in operating costs through achieving economies of scale and diligently managing contracts. We also believe that the key external performance drivers include the availability of:
• Debt capital at a cost and on terms conducive to our goals;
• Equity capital at a reasonable cost;
• New property acquisitions that fit into our strategic plan; and
• Investors for dispositions of peak value or non-core assets.
12 2015 First Quarter Report
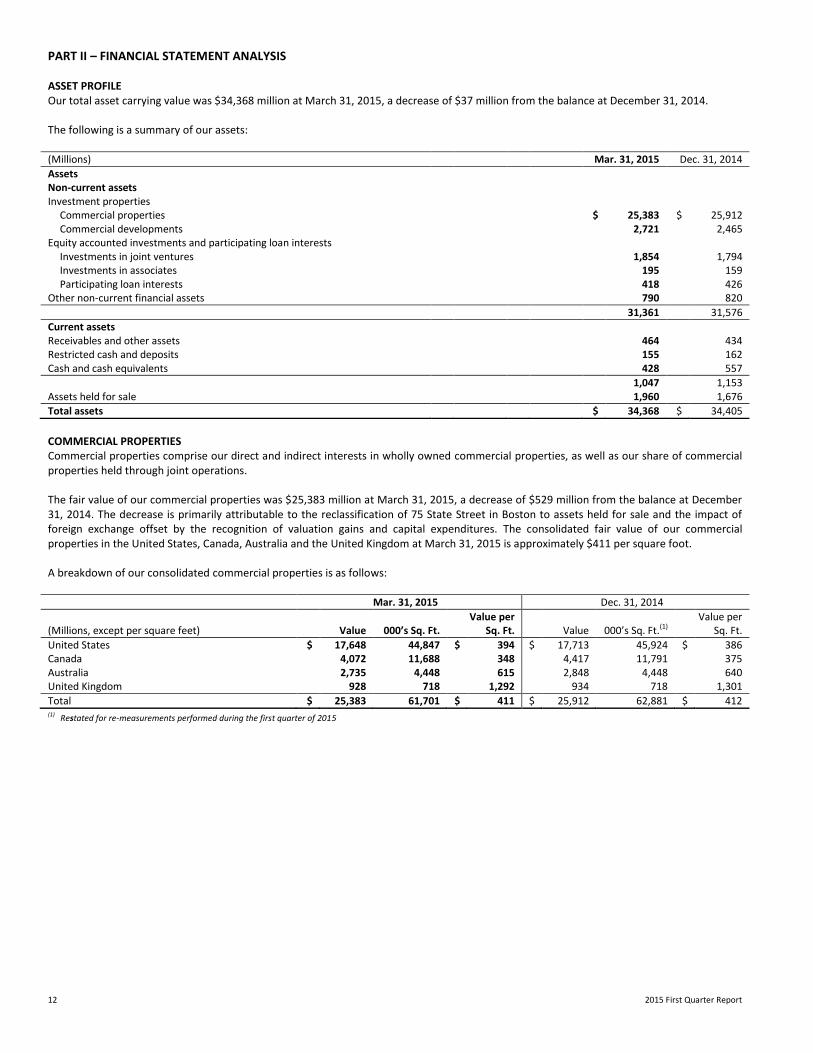
PART II – FINANCIAL STATEMENT ANALYSIS ASSET PROFILE Our total asset carrying value was $34,368 million at March 31, 2015, a decrease of $37 million from the balance at December 31, 2014. The following is a summary of our assets: (Millions) Mar. 31, 2015 Dec. 31, 2014
Assets Non-current assets Investment properties
Commercial properties $ 25,383 $ 25,912 Commercial developments 2,721 2,465
Equity accounted investments and participating loan interests Investments in joint ventures 1,854 1,794 Investments in associates 195 159 Participating loan interests 418 426
Other non-current financial assets 790 820
31,361 31,576
Current assets Receivables and other assets 464 434 Restricted cash and deposits 155 162 Cash and cash equivalents 428 557
1,047 1,153 Assets held for sale 1,960 1,676
Total assets $ 34,368 $ 34,405
COMMERCIAL PROPERTIES Commercial properties comprise our direct and indirect interests in wholly owned commercial properties, as well as our share of commercial properties held through joint operations. The fair value of our commercial properties was $25,383 million at March 31, 2015, a decrease of $529 million from the balance at December 31, 2014. The decrease is primarily attributable to the reclassification of 75 State Street in Boston to assets held for sale and the impact of foreign exchange offset by the recognition of valuation gains and capital expenditures. The consolidated fair value of our commercial properties in the United States, Canada, Australia and the United Kingdom at March 31, 2015 is approximately $411 per square foot. A breakdown of our consolidated commercial properties is as follows: Mar. 31, 2015 Dec. 31, 2014
(Millions, except per square feet) Value 000’s Sq. Ft. Value per
Sq. Ft. Value 000’s Sq. Ft.(1) Value per
Sq. Ft.
United States $ 17,648 44,847 $ 394 $ 17,713 45,924 $ 386 Canada 4,072 11,688 348 4,417 11,791 375 Australia 2,735 4,448 615 2,848 4,448 640 United Kingdom 928 718 1,292 934 718 1,301
Total $ 25,383 61,701 $ 411 $ 25,912 62,881 $ 412 (1) Restated for re-measurements performed during the first quarter of 2015
Brookfield Office Properties 13
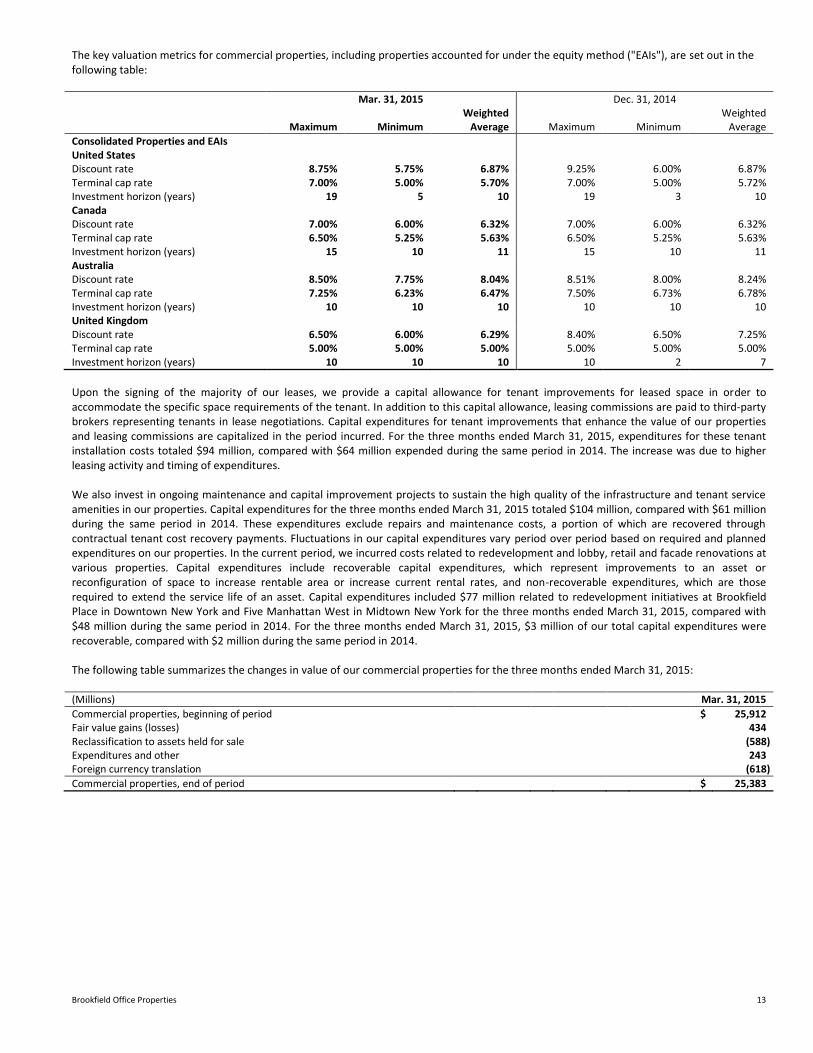
The key valuation metrics for commercial properties, including properties accounted for under the equity method ("EAIs"), are set out in the following table: Mar. 31, 2015 Dec. 31, 2014
Maximum Minimum Weighted
Average Maximum Minimum Weighted
Average
Consolidated Properties and EAIs United States Discount rate 8.75% 5.75% 6.87% 9.25% 6.00% 6.87% Terminal cap rate 7.00% 5.00% 5.70% 7.00% 5.00% 5.72% Investment horizon (years) 19 5 10 19 3 10 Canada Discount rate 7.00% 6.00% 6.32% 7.00% 6.00% 6.32% Terminal cap rate 6.50% 5.25% 5.63% 6.50% 5.25% 5.63% Investment horizon (years) 15 10 11 15 10 11 Australia Discount rate 8.50% 7.75% 8.04% 8.51% 8.00% 8.24% Terminal cap rate 7.25% 6.23% 6.47% 7.50% 6.73% 6.78% Investment horizon (years) 10 10 10 10 10 10 United Kingdom Discount rate 6.50% 6.00% 6.29% 8.40% 6.50% 7.25% Terminal cap rate 5.00% 5.00% 5.00% 5.00% 5.00% 5.00% Investment horizon (years) 10 10 10 10 2 7
Upon the signing of the majority of our leases, we provide a capital allowance for tenant improvements for leased space in order to accommodate the specific space requirements of the tenant. In addition to this capital allowance, leasing commissions are paid to third-party brokers representing tenants in lease negotiations. Capital expenditures for tenant improvements that enhance the value of our properties and leasing commissions are capitalized in the period incurred. For the three months ended March 31, 2015, expenditures for these tenant installation costs totaled $94 million, compared with $64 million expended during the same period in 2014. The increase was due to higher leasing activity and timing of expenditures. We also invest in ongoing maintenance and capital improvement projects to sustain the high quality of the infrastructure and tenant service amenities in our properties. Capital expenditures for the three months ended March 31, 2015 totaled $104 million, compared with $61 million during the same period in 2014. These expenditures exclude repairs and maintenance costs, a portion of which are recovered through contractual tenant cost recovery payments. Fluctuations in our capital expenditures vary period over period based on required and planned expenditures on our properties. In the current period, we incurred costs related to redevelopment and lobby, retail and facade renovations at various properties. Capital expenditures include recoverable capital expenditures, which represent improvements to an asset or reconfiguration of space to increase rentable area or increase current rental rates, and non-recoverable expenditures, which are those required to extend the service life of an asset. Capital expenditures included $77 million related to redevelopment initiatives at Brookfield Place in Downtown New York and Five Manhattan West in Midtown New York for the three months ended March 31, 2015, compared with $48 million during the same period in 2014. For the three months ended March 31, 2015, $3 million of our total capital expenditures were recoverable, compared with $2 million during the same period in 2014. The following table summarizes the changes in value of our commercial properties for the three months ended March 31, 2015: (Millions) Mar. 31, 2015
Commercial properties, beginning of period $ 25,912 Fair value gains (losses) 434 Reclassification to assets held for sale (588) Expenditures and other 243 Foreign currency translation (618)
Commercial properties, end of period $ 25,383

14 2015 First Quarter Report
COMMERCIAL DEVELOPMENTS Commercial developments consist of commercial property development sites, density rights and related infrastructure. The total fair value of development land and infrastructure was $2,721 million at March 31, 2015, an increase of $256 million from the balance at December 31, 2014. The increase is primarily attributable to capital expenditures and the recognition of valuation gains offset by the impact of foreign exchange. Based on 19 million square feet of commercial developments, the fair value at March 31, 2015 represents approximately $146 per square foot. Although we are generally not a speculative developer, we are a full-service real estate company with in-house development expertise. With 19 million square feet of high-quality, centrally-located development properties in New York, Denver, Washington, D.C., Los Angeles, Houston, Toronto, Calgary, Ottawa, Perth and London, we will undertake developments when we achieve our risk-adjusted returns and pre-leasing targets. Expenditures for development of commercial properties totaled $251 million for the three months ended March 31, 2015 as compared with $107 million during the same period in 2014. The increase is primarily attributable to construction costs associated with our active development sites, Manhattan West in Midtown New York, Bay Adelaide East in Toronto, Brookfield Place East Tower in Calgary, Brookfield Place Tower 2 in Perth and London Wall Place and Principal Place Commercial in London as well as increased associated borrowing costs. The details of development and redevelopment expenditures are as follows: Three months ended March 31 (Millions) 2015 2014
Construction costs $ 226 $ 87 Capitalized borrowing costs 21 18 Property taxes and other 4 2
Total development and redevelopment expenditures $ 251 $ 107
The following table summarizes the changes in value of our commercial developments for the three months ended March 31, 2015: (Millions) Mar. 31, 2015
Commercial developments, beginning of period $ 2,465 Fair value gains (losses) 103 Expenditures and other 252 Foreign currency translation (99)
Commercial developments, end of period $ 2,721
INVESTMENTS IN JOINT VENTURES We have investments in joint arrangements that are joint ventures. These joint ventures hold individual commercial properties or developments that we own together with co-owners. Details of our investments in joint ventures, which have been accounted for following the equity method, are as follows: Ownership Interest Location Mar. 31, 2015 Dec. 31, 2014
Commercial properties: The Grace Building Midtown New York 50% 50% Marina Towers Los Angeles 50% 50% 245 Park Avenue Midtown New York 51% 51% Republic Plaza Denver 50% 50% E&Y Centre Sydney 50% 50%
Commercial developments: London Wall Place London 50% 50% Principal Place – Residential London 50% 50%
Brookfield Office Properties 15
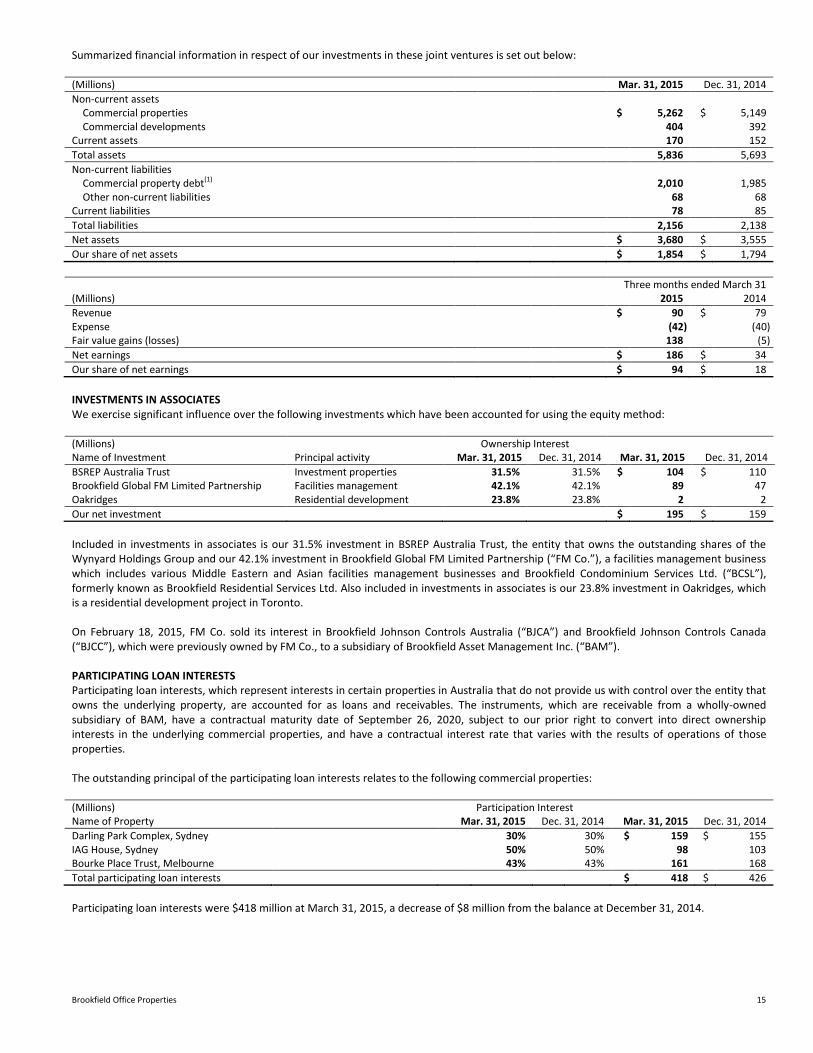
Summarized financial information in respect of our investments in these joint ventures is set out below: (Millions) Mar. 31, 2015 Dec. 31, 2014
Non-current assets Commercial properties $ 5,262 $ 5,149 Commercial developments 404 392
Current assets 170 152
Total assets 5,836 5,693
Non-current liabilities Commercial property debt(1) 2,010 1,985 Other non-current liabilities 68 68
Current liabilities 78 85
Total liabilities 2,156 2,138
Net assets $ 3,680 $ 3,555
Our share of net assets $ 1,854 $ 1,794
Three months ended March 31 (Millions) 2015 2014
Revenue $ 90 $ 79 Expense (42) (40) Fair value gains (losses) 138 (5)
Net earnings $ 186 $ 34
Our share of net earnings $ 94 $ 18
INVESTMENTS IN ASSOCIATES We exercise significant influence over the following investments which have been accounted for using the equity method: (Millions) Ownership Interest Name of Investment Principal activity Mar. 31, 2015 Dec. 31, 2014 Mar. 31, 2015 Dec. 31, 2014
BSREP Australia Trust Investment properties 31.5% 31.5% $ 104 $ 110 Brookfield Global FM Limited Partnership Facilities management 42.1% 42.1% 89 47 Oakridges Residential development 23.8% 23.8% 2 2
Our net investment $ 195 $ 159
Included in investments in associates is our 31.5% investment in BSREP Australia Trust, the entity that owns the outstanding shares of the Wynyard Holdings Group and our 42.1% investment in Brookfield Global FM Limited Partnership (“FM Co.”), a facilities management business which includes various Middle Eastern and Asian facilities management businesses and Brookfield Condominium Services Ltd. (“BCSL”), formerly known as Brookfield Residential Services Ltd. Also included in investments in associates is our 23.8% investment in Oakridges, which is a residential development project in Toronto. On February 18, 2015, FM Co. sold its interest in Brookfield Johnson Controls Australia (“BJCA”) and Brookfield Johnson Controls Canada (“BJCC”), which were previously owned by FM Co., to a subsidiary of Brookfield Asset Management Inc. (“BAM”). PARTICIPATING LOAN INTERESTS Participating loan interests, which represent interests in certain properties in Australia that do not provide us with control over the entity that owns the underlying property, are accounted for as loans and receivables. The instruments, which are receivable from a wholly-owned subsidiary of BAM, have a contractual maturity date of September 26, 2020, subject to our prior right to convert into direct ownership interests in the underlying commercial properties, and have a contractual interest rate that varies with the results of operations of those properties. The outstanding principal of the participating loan interests relates to the following commercial properties: (Millions) Participation Interest Name of Property Mar. 31, 2015 Dec. 31, 2014 Mar. 31, 2015 Dec. 31, 2014
Darling Park Complex, Sydney 30% 30% $ 159 $ 155 IAG House, Sydney 50% 50% 98 103 Bourke Place Trust, Melbourne 43% 43% 161 168
Total participating loan interests $ 418 $ 426
Participating loan interests were $418 million at March 31, 2015, a decrease of $8 million from the balance at December 31, 2014.
16 2015 First Quarter Report
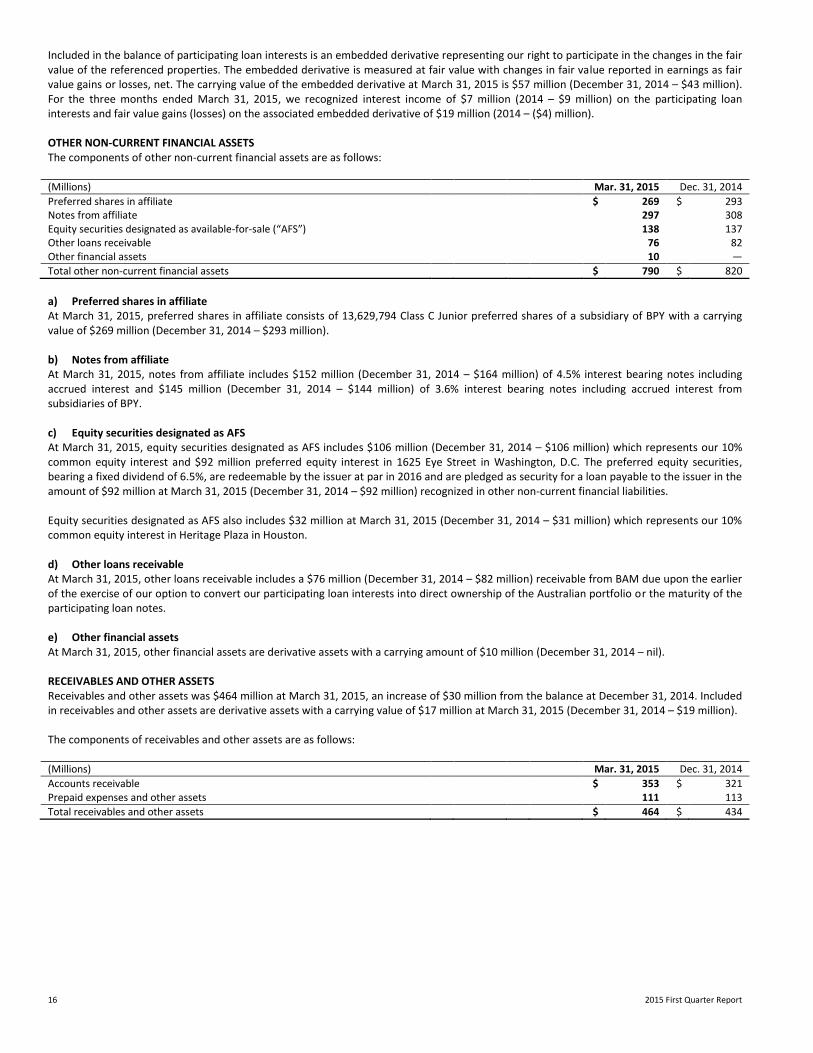
Included in the balance of participating loan interests is an embedded derivative representing our right to participate in the changes in the fair value of the referenced properties. The embedded derivative is measured at fair value with changes in fair value reported in earnings as fair value gains or losses, net. The carrying value of the embedded derivative at March 31, 2015 is $57 million (December 31, 2014 – $43 million). For the three months ended March 31, 2015, we recognized interest income of $7 million (2014 – $9 million) on the participating loan interests and fair value gains (losses) on the associated embedded derivative of $19 million (2014 – ($4) million). OTHER NON-CURRENT FINANCIAL ASSETS The components of other non-current financial assets are as follows: (Millions) Mar. 31, 2015 Dec. 31, 2014
Preferred shares in affiliate $ 269 $ 293 Notes from affiliate 297 308 Equity securities designated as available-for-sale (“AFS”) 138 137 Other loans receivable 76 82 Other financial assets 10 ―
Total other non-current financial assets $ 790 $ 820
a) Preferred shares in affiliate At March 31, 2015, preferred shares in affiliate consists of 13,629,794 Class C Junior preferred shares of a subsidiary of BPY with a carrying value of $269 million (December 31, 2014 – $293 million). b) Notes from affiliate At March 31, 2015, notes from affiliate includes $152 million (December 31, 2014 – $164 million) of 4.5% interest bearing notes including accrued interest and $145 million (December 31, 2014 – $144 million) of 3.6% interest bearing notes including accrued interest from subsidiaries of BPY. c) Equity securities designated as AFS At March 31, 2015, equity securities designated as AFS includes $106 million (December 31, 2014 – $106 million) which represents our 10% common equity interest and $92 million preferred equity interest in 1625 Eye Street in Washington, D.C. The preferred equity securities, bearing a fixed dividend of 6.5%, are redeemable by the issuer at par in 2016 and are pledged as security for a loan payable to the issuer in the amount of $92 million at March 31, 2015 (December 31, 2014 – $92 million) recognized in other non-current financial liabilities. Equity securities designated as AFS also includes $32 million at March 31, 2015 (December 31, 2014 – $31 million) which represents our 10% common equity interest in Heritage Plaza in Houston. d) Other loans receivable At March 31, 2015, other loans receivable includes a $76 million (December 31, 2014 – $82 million) receivable from BAM due upon the earlier of the exercise of our option to convert our participating loan interests into direct ownership of the Australian portfolio or the maturity of the participating loan notes. e) Other financial assets At March 31, 2015, other financial assets are derivative assets with a carrying amount of $10 million (December 31, 2014 – nil). RECEIVABLES AND OTHER ASSETS Receivables and other assets was $464 million at March 31, 2015, an increase of $30 million from the balance at December 31, 2014. Included in receivables and other assets are derivative assets with a carrying value of $17 million at March 31, 2015 (December 31, 2014 – $19 million). The components of receivables and other assets are as follows: (Millions) Mar. 31, 2015 Dec. 31, 2014
Accounts receivable $ 353 $ 321 Prepaid expenses and other assets 111 113
Total receivables and other assets $ 464 $ 434
Brookfield Office Properties 17
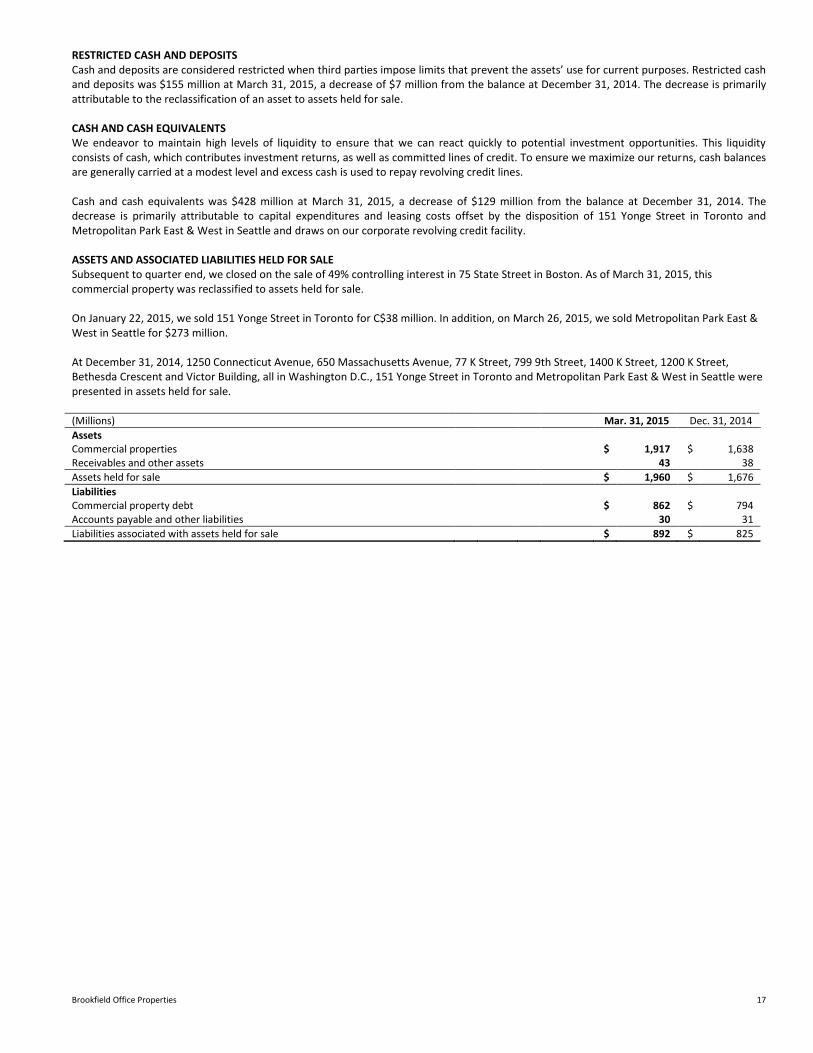
RESTRICTED CASH AND DEPOSITS Cash and deposits are considered restricted when third parties impose limits that prevent the assets’ use for current purposes. Restricted cash and deposits was $155 million at March 31, 2015, a decrease of $7 million from the balance at December 31, 2014. The decrease is primarily attributable to the reclassification of an asset to assets held for sale. CASH AND CASH EQUIVALENTS We endeavor to maintain high levels of liquidity to ensure that we can react quickly to potential investment opportunities. This liquidity consists of cash, which contributes investment returns, as well as committed lines of credit. To ensure we maximize our returns, cash balances are generally carried at a modest level and excess cash is used to repay revolving credit lines. Cash and cash equivalents was $428 million at March 31, 2015, a decrease of $129 million from the balance at December 31, 2014. The decrease is primarily attributable to capital expenditures and leasing costs offset by the disposition of 151 Yonge Street in Toronto and Metropolitan Park East & West in Seattle and draws on our corporate revolving credit facility. ASSETS AND ASSOCIATED LIABILITIES HELD FOR SALE Subsequent to quarter end, we closed on the sale of 49% controlling interest in 75 State Street in Boston. As of March 31, 2015, this commercial property was reclassified to assets held for sale. On January 22, 2015, we sold 151 Yonge Street in Toronto for C$38 million. In addition, on March 26, 2015, we sold Metropolitan Park East & West in Seattle for $273 million. At December 31, 2014, 1250 Connecticut Avenue, 650 Massachusetts Avenue, 77 K Street, 799 9th Street, 1400 K Street, 1200 K Street, Bethesda Crescent and Victor Building, all in Washington D.C., 151 Yonge Street in Toronto and Metropolitan Park East & West in Seattle were presented in assets held for sale. (Millions) Mar. 31, 2015 Dec. 31, 2014
Assets Commercial properties $ 1,917 $ 1,638 Receivables and other assets 43 38
Assets held for sale $ 1,960 $ 1,676
Liabilities Commercial property debt $ 862 $ 794 Accounts payable and other liabilities 30 31
Liabilities associated with assets held for sale $ 892 $ 825
18 2015 First Quarter Report
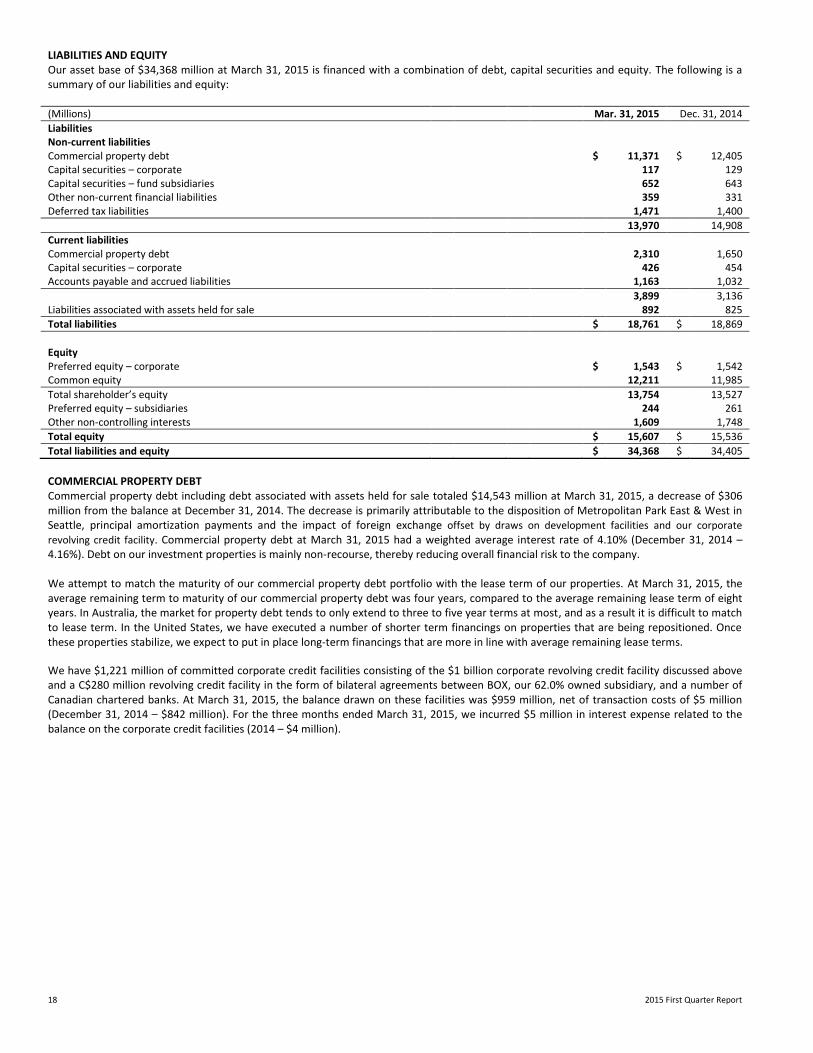
LIABILITIES AND EQUITY Our asset base of $34,368 million at March 31, 2015 is financed with a combination of debt, capital securities and equity. The following is a summary of our liabilities and equity: (Millions) Mar. 31, 2015 Dec. 31, 2014
Liabilities Non-current liabilities Commercial property debt $ 11,371 $ 12,405 Capital securities – corporate 117 129 Capital securities – fund subsidiaries 652 643 Other non-current financial liabilities 359 331 Deferred tax liabilities 1,471 1,400
13,970 14,908
Current liabilities Commercial property debt 2,310 1,650 Capital securities – corporate 426 454 Accounts payable and accrued liabilities 1,163 1,032
3,899 3,136 Liabilities associated with assets held for sale 892 825
Total liabilities $ 18,761 $ 18,869
Equity Preferred equity – corporate $ 1,543 $ 1,542 Common equity 12,211 11,985
Total shareholder’s equity 13,754 13,527 Preferred equity – subsidiaries 244 261 Other non-controlling interests 1,609 1,748
Total equity $ 15,607 $ 15,536
Total liabilities and equity $ 34,368 $ 34,405
COMMERCIAL PROPERTY DEBT Commercial property debt including debt associated with assets held for sale totaled $14,543 million at March 31, 2015, a decrease of $306 million from the balance at December 31, 2014. The decrease is primarily attributable to the disposition of Metropolitan Park East & West in Seattle, principal amortization payments and the impact of foreign exchange offset by draws on development facilities and our corporate
revolving credit facility. Commercial property debt at March 31, 2015 had a weighted average interest rate of 4.10% (December 31, 2014 – 4.16%). Debt on our investment properties is mainly non-recourse, thereby reducing overall financial risk to the company. We attempt to match the maturity of our commercial property debt portfolio with the lease term of our properties. At March 31, 2015, the average remaining term to maturity of our commercial property debt was four years, compared to the average remaining lease term of eight years. In Australia, the market for property debt tends to only extend to three to five year terms at most, and as a result it is difficult to match to lease term. In the United States, we have executed a number of shorter term financings on properties that are being repositioned. Once these properties stabilize, we expect to put in place long-term financings that are more in line with average remaining lease terms.
We have $1,221 million of committed corporate credit facilities consisting of the $1 billion corporate revolving credit facility discussed above and a C$280 million revolving credit facility in the form of bilateral agreements between BOX, our 62.0% owned subsidiary, and a number of Canadian chartered banks. At March 31, 2015, the balance drawn on these facilities was $959 million, net of transaction costs of $5 million (December 31, 2014 – $842 million). For the three months ended March 31, 2015, we incurred $5 million in interest expense related to the balance on the corporate credit facilities (2014 – $4 million).
Brookfield Office Properties 19
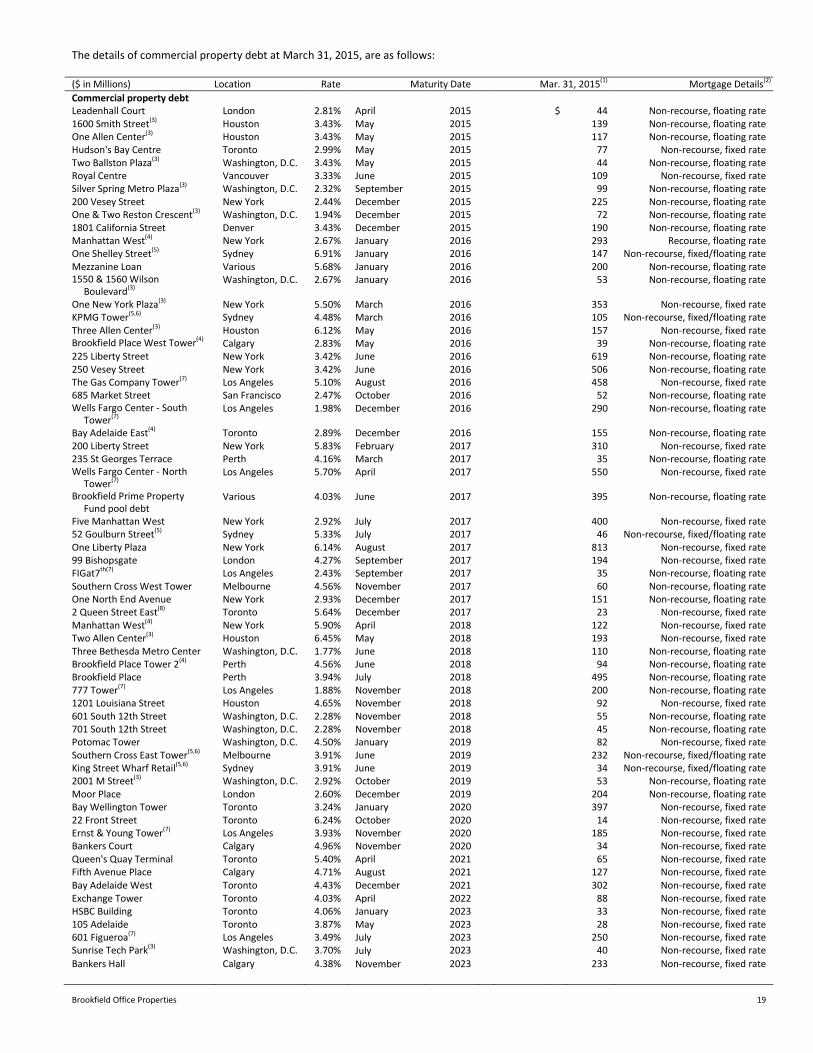
The details of commercial property debt at March 31, 2015, are as follows: ($ in Millions) Location Rate Maturity Date Mar. 31, 2015(1) Mortgage Details(2)
Commercial property debt Leadenhall Court London 2.81% April 2015 $ 44 Non-recourse, floating rate 1600 Smith Street(3) Houston 3.43% May 2015 139 Non-recourse, floating rate One Allen Center(3) Houston 3.43% May 2015 117 Non-recourse, floating rate Hudson's Bay Centre Toronto 2.99% May 2015 77 Non-recourse, fixed rate Two Ballston Plaza(3) Washington, D.C. 3.43% May 2015 44 Non-recourse, floating rate Royal Centre Vancouver 3.33% June 2015 109 Non-recourse, fixed rate Silver Spring Metro Plaza(3) Washington, D.C. 2.32% September 2015 99 Non-recourse, floating rate 200 Vesey Street New York 2.44% December 2015 225 Non-recourse, floating rate One & Two Reston Crescent(3) Washington, D.C. 1.94% December 2015 72 Non-recourse, floating rate 1801 California Street Denver 3.43% December 2015 190 Non-recourse, floating rate Manhattan West(4) New York 2.67% January 2016 293 Recourse, floating rate One Shelley Street(5) Sydney 6.91% January 2016 147 Non-recourse, fixed/floating rate Mezzanine Loan Various 5.68% January 2016 200 Non-recourse, floating rate 1550 & 1560 Wilson
Boulevard(3) Washington, D.C. 2.67% January 2016 53 Non-recourse, floating rate
One New York Plaza(3) New York 5.50% March 2016 353 Non-recourse, fixed rate KPMG Tower(5,6) Sydney 4.48% March 2016 105 Non-recourse, fixed/floating rate Three Allen Center(3) Houston 6.12% May 2016 157 Non-recourse, fixed rate Brookfield Place West Tower(4) Calgary 2.83% May 2016 39 Non-recourse, floating rate 225 Liberty Street New York 3.42% June 2016 619 Non-recourse, floating rate 250 Vesey Street New York 3.42% June 2016 506 Non-recourse, floating rate The Gas Company Tower(7) Los Angeles 5.10% August 2016 458 Non-recourse, fixed rate 685 Market Street San Francisco 2.47% October 2016 52 Non-recourse, floating rate Wells Fargo Center - South
Tower(7) Los Angeles 1.98% December 2016 290 Non-recourse, floating rate
Bay Adelaide East(4) Toronto 2.89% December 2016 155 Non-recourse, floating rate 200 Liberty Street New York 5.83% February 2017 310 Non-recourse, fixed rate 235 St Georges Terrace Perth 4.16% March 2017 35 Non-recourse, floating rate Wells Fargo Center - North
Tower(7) Los Angeles 5.70% April 2017 550 Non-recourse, fixed rate
Brookfield Prime Property Fund pool debt
Various 4.03% June 2017 395 Non-recourse, floating rate
Five Manhattan West New York 2.92% July 2017 400 Non-recourse, fixed rate 52 Goulburn Street(5) Sydney 5.33% July 2017 46 Non-recourse, fixed/floating rate One Liberty Plaza New York 6.14% August 2017 813 Non-recourse, fixed rate 99 Bishopsgate London 4.27% September 2017 194 Non-recourse, fixed rate FIGat7th(7) Los Angeles 2.43% September 2017 35 Non-recourse, floating rate Southern Cross West Tower Melbourne 4.56% November 2017 60 Non-recourse, floating rate One North End Avenue New York 2.93% December 2017 151 Non-recourse, floating rate 2 Queen Street East(8) Toronto 5.64% December 2017 23 Non-recourse, fixed rate Manhattan West(4) New York 5.90% April 2018 122 Non-recourse, fixed rate Two Allen Center(3) Houston 6.45% May 2018 193 Non-recourse, fixed rate Three Bethesda Metro Center Washington, D.C. 1.77% June 2018 110 Non-recourse, floating rate Brookfield Place Tower 2(4) Perth 4.56% June 2018 94 Non-recourse, floating rate Brookfield Place Perth 3.94% July 2018 495 Non-recourse, floating rate 777 Tower(7) Los Angeles 1.88% November 2018 200 Non-recourse, floating rate 1201 Louisiana Street Houston 4.65% November 2018 92 Non-recourse, fixed rate 601 South 12th Street Washington, D.C. 2.28% November 2018 55 Non-recourse, floating rate 701 South 12th Street Washington, D.C. 2.28% November 2018 45 Non-recourse, floating rate Potomac Tower Washington, D.C. 4.50% January 2019 82 Non-recourse, fixed rate Southern Cross East Tower(5,6) Melbourne 3.91% June 2019 232 Non-recourse, fixed/floating rate King Street Wharf Retail(5,6) Sydney 3.91% June 2019 34 Non-recourse, fixed/floating rate 2001 M Street(3) Washington, D.C. 2.92% October 2019 53 Non-recourse, floating rate Moor Place London 2.60% December 2019 204 Non-recourse, floating rate Bay Wellington Tower Toronto 3.24% January 2020 397 Non-recourse, fixed rate 22 Front Street Toronto 6.24% October 2020 14 Non-recourse, fixed rate Ernst & Young Tower(7) Los Angeles 3.93% November 2020 185 Non-recourse, fixed rate Bankers Court Calgary 4.96% November 2020 34 Non-recourse, fixed rate Queen's Quay Terminal Toronto 5.40% April 2021 65 Non-recourse, fixed rate Fifth Avenue Place Calgary 4.71% August 2021 127 Non-recourse, fixed rate Bay Adelaide West Toronto 4.43% December 2021 302 Non-recourse, fixed rate Exchange Tower Toronto 4.03% April 2022 88 Non-recourse, fixed rate HSBC Building Toronto 4.06% January 2023 33 Non-recourse, fixed rate 105 Adelaide Toronto 3.87% May 2023 28 Non-recourse, fixed rate 601 Figueroa(7) Los Angeles 3.49% July 2023 250 Non-recourse, fixed rate Sunrise Tech Park(3) Washington, D.C. 3.70% July 2023 40 Non-recourse, fixed rate
Bankers Hall Calgary 4.38% November 2023 233 Non-recourse, fixed rate
20 2015 First Quarter Report
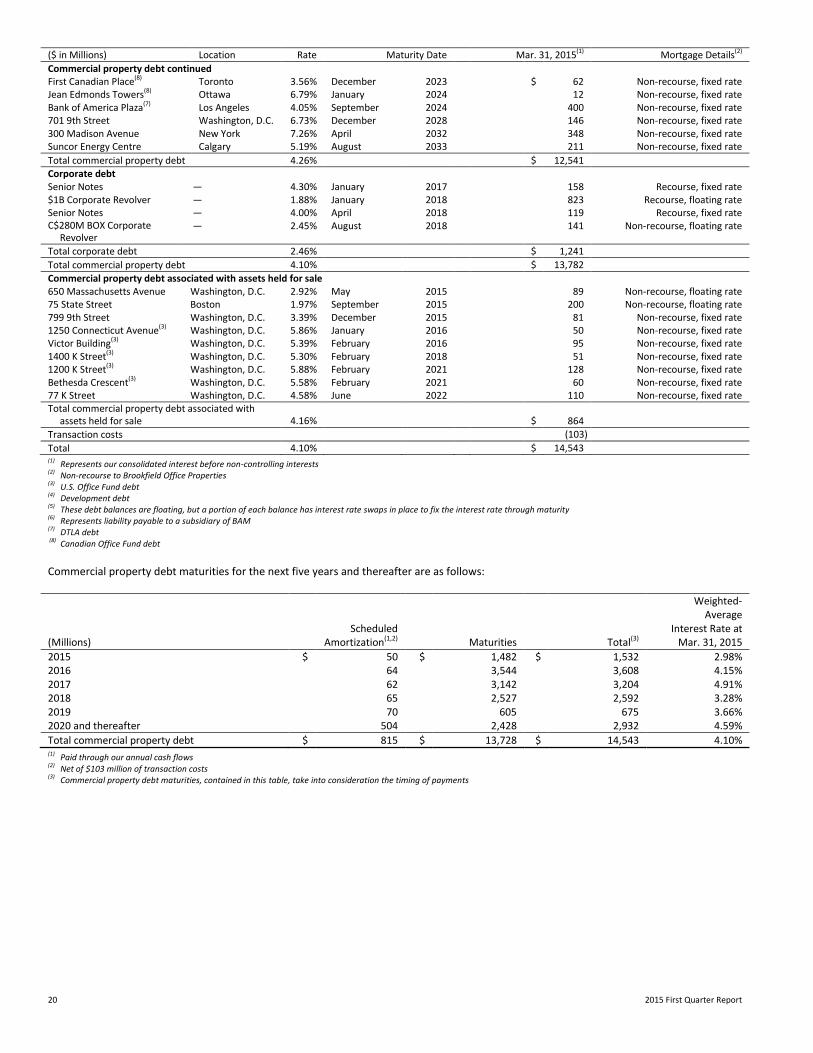
($ in Millions) Location Rate Maturity Date Mar. 31, 2015(1) Mortgage Details(2)
Commercial property debt continued First Canadian Place(8) Toronto 3.56% December 2023 $ 62 Non-recourse, fixed rate Jean Edmonds Towers(8) Ottawa 6.79% January 2024 12 Non-recourse, fixed rate Bank of America Plaza(7) Los Angeles 4.05% September 2024 400 Non-recourse, fixed rate 701 9th Street Washington, D.C. 6.73% December 2028 146 Non-recourse, fixed rate 300 Madison Avenue New York 7.26% April 2032 348 Non-recourse, fixed rate Suncor Energy Centre Calgary 5.19% August 2033 211 Non-recourse, fixed rate
Total commercial property debt 4.26% $ 12,541 Corporate debt Senior Notes — 4.30% January 2017 158 Recourse, fixed rate $1B Corporate Revolver — 1.88% January 2018 823 Recourse, floating rate Senior Notes — 4.00% April 2018 119 Recourse, fixed rate C$280M BOX Corporate
Revolver — 2.45% August 2018 141 Non-recourse, floating rate
Total corporate debt 2.46% $ 1,241
Total commercial property debt 4.10% $ 13,782
Commercial property debt associated with assets held for sale 650 Massachusetts Avenue Washington, D.C. 2.92% May 2015 89 Non-recourse, floating rate 75 State Street Boston 1.97% September 2015 200 Non-recourse, floating rate 799 9th Street Washington, D.C. 3.39% December 2015 81 Non-recourse, fixed rate 1250 Connecticut Avenue(3) Washington, D.C. 5.86% January 2016 50 Non-recourse, fixed rate Victor Building(3) Washington, D.C. 5.39% February 2016 95 Non-recourse, fixed rate 1400 K Street(3) Washington, D.C. 5.30% February 2018 51 Non-recourse, fixed rate 1200 K Street(3) Washington, D.C. 5.88% February 2021 128 Non-recourse, fixed rate Bethesda Crescent(3) Washington, D.C. 5.58% February 2021 60 Non-recourse, fixed rate 77 K Street Washington, D.C. 4.58% June 2022 110 Non-recourse, fixed rate Total commercial property debt associated with
assets held for sale 4.16% $ 864
Transaction costs (103)
Total 4.10% $ 14,543 (1) Represents our consolidated interest before non-controlling interests (2) Non-recourse to Brookfield Office Properties (3) U.S. Office Fund debt (4) Development debt (5) These debt balances are floating, but a portion of each balance has interest rate swaps in place to fix the interest rate through maturity (6) Represents liability payable to a subsidiary of BAM (7) DTLA debt (8) Canadian Office Fund debt
Commercial property debt maturities for the next five years and thereafter are as follows:
Weighted- Average Scheduled Interest Rate at (Millions) Amortization(1,2) Maturities Total(3) Mar. 31, 2015
2015 $ 50 $ 1,482 $ 1,532 2.98% 2016 64 3,544 3,608 4.15% 2017 62 3,142 3,204 4.91% 2018 65 2,527 2,592 3.28% 2019 70 605 675 3.66% 2020 and thereafter 504 2,428 2,932 4.59%
Total commercial property debt $ 815 $ 13,728 $ 14,543 4.10% (1) Paid through our annual cash flows (2) Net of $103 million of transaction costs (3)
Commercial property debt maturities, contained in this table, take into consideration the timing of payments
Brookfield Office Properties 21
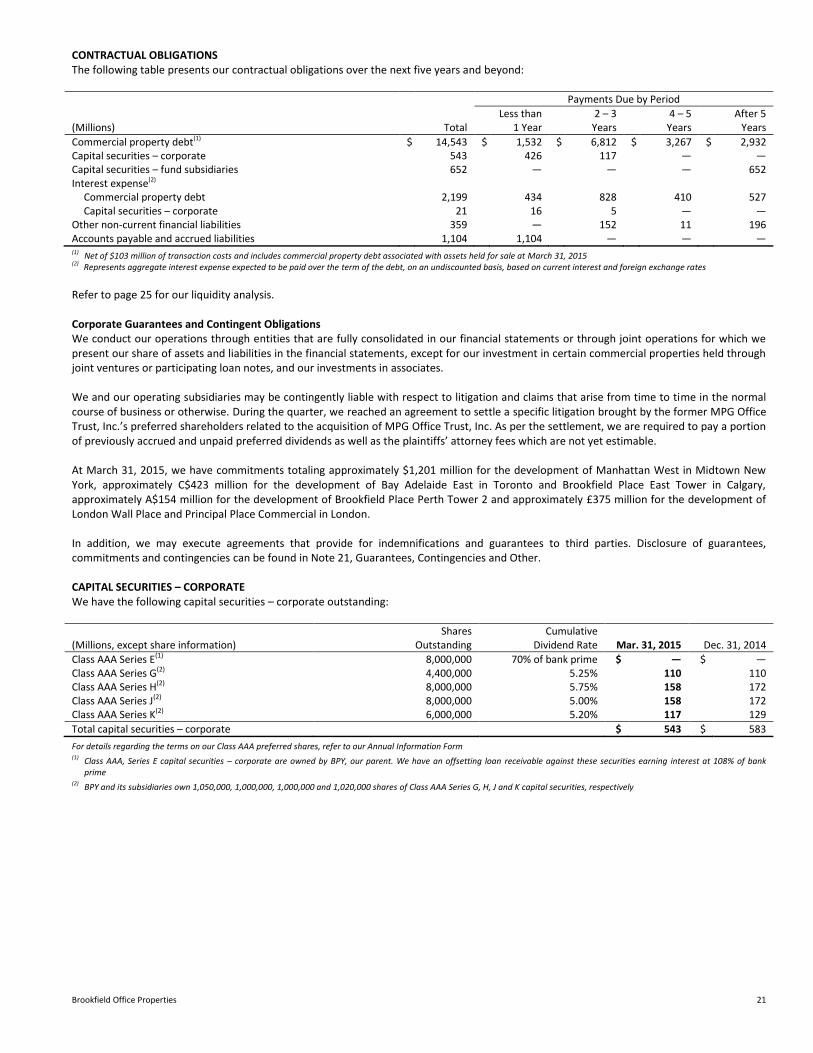
CONTRACTUAL OBLIGATIONS
The following table presents our contractual obligations over the next five years and beyond: Payments Due by Period
(Millions) Total Less than
1 Year 2 – 3
Years 4 – 5
Years After 5
Years
Commercial property debt(1) $ 14,543 $ 1,532 $ 6,812 $ 3,267 $ 2,932 Capital securities – corporate 543 426 117 ― ― Capital securities – fund subsidiaries 652 ― ― ― 652 Interest expense(2)
Commercial property debt 2,199 434 828 410 527 Capital securities – corporate 21 16 5 ― ―
Other non-current financial liabilities 359 ― 152 11 196 Accounts payable and accrued liabilities 1,104 1,104 ― ― ― (1)
Net of $103 million of transaction costs and includes commercial property debt associated with assets held for sale at March 31, 2015 (2) Represents aggregate interest expense expected to be paid over the term of the debt, on an undiscounted basis, based on current interest and foreign exchange rates
Refer to page 25 for our liquidity analysis. Corporate Guarantees and Contingent Obligations We conduct our operations through entities that are fully consolidated in our financial statements or through joint operations for which we present our share of assets and liabilities in the financial statements, except for our investment in certain commercial properties held through joint ventures or participating loan notes, and our investments in associates. We and our operating subsidiaries may be contingently liable with respect to litigation and claims that arise from time to time in the normal course of business or otherwise. During the quarter, we reached an agreement to settle a specific litigation brought by the former MPG Office Trust, Inc.’s preferred shareholders related to the acquisition of MPG Office Trust, Inc. As per the settlement, we are required to pay a portion of previously accrued and unpaid preferred dividends as well as the plaintiffs’ attorney fees which are not yet estimable. At March 31, 2015, we have commitments totaling approximately $1,201 million for the development of Manhattan West in Midtown New York, approximately C$423 million for the development of Bay Adelaide East in Toronto and Brookfield Place East Tower in Calgary, approximately A$154 million for the development of Brookfield Place Perth Tower 2 and approximately £375 million for the development of London Wall Place and Principal Place Commercial in London. In addition, we may execute agreements that provide for indemnifications and guarantees to third parties. Disclosure of guarantees, commitments and contingencies can be found in Note 21, Guarantees, Contingencies and Other. CAPITAL SECURITIES – CORPORATE We have the following capital securities – corporate outstanding: Shares Cumulative (Millions, except share information) Outstanding Dividend Rate Mar. 31, 2015 Dec. 31, 2014
Class AAA Series E(1) 8,000,000 70% of bank prime $ ― $ ― Class AAA Series G(2) 4,400,000 5.25% 110 110 Class AAA Series H(2) 8,000,000 5.75% 158 172 Class AAA Series J(2) 8,000,000 5.00% 158 172 Class AAA Series K(2) 6,000,000 5.20% 117 129
Total capital securities – corporate $ 543 $ 583
For details regarding the terms on our Class AAA preferred shares, refer to our Annual Information Form (1) Class AAA, Series E capital securities – corporate are owned by BPY, our parent. We have an offsetting loan receivable against these securities earning interest at 108% of bank
prime (2) BPY and its subsidiaries own 1,050,000, 1,000,000, 1,000,000 and 1,020,000 shares of Class AAA Series G, H, J and K capital securities, respectively
22 2015 First Quarter Report
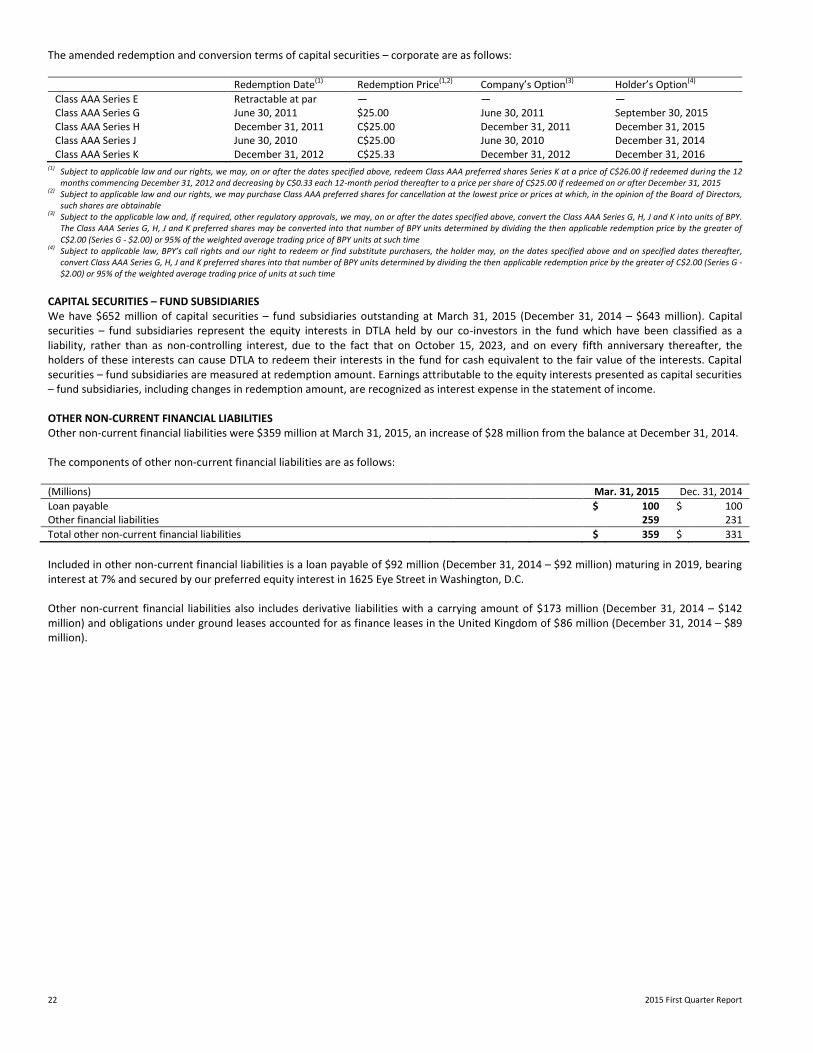
The amended redemption and conversion terms of capital securities – corporate are as follows:
Redemption Date(1) Redemption Price(1,2) Company’s Option(3) Holder’s Option(4)
Class AAA Series E Retractable at par ― — — Class AAA Series G June 30, 2011 $25.00 June 30, 2011 September 30, 2015 Class AAA Series H December 31, 2011 C$25.00 December 31, 2011 December 31, 2015 Class AAA Series J June 30, 2010 C$25.00 June 30, 2010 December 31, 2014 Class AAA Series K December 31, 2012 C$25.33 December 31, 2012 December 31, 2016
(1) Subject to applicable law and our rights, we may, on or after the dates specified above, redeem Class AAA preferred shares Series K at a price of C$26.00 if redeemed during the 12 months commencing December 31, 2012 and decreasing by C$0.33 each 12-month period thereafter to a price per share of C$25.00 if redeemed on or after December 31, 2015
(2) Subject to applicable law and our rights, we may purchase Class AAA preferred shares for cancellation at the lowest price or prices at which, in the opinion of the Board of Directors,
such shares are obtainable (3) Subject to the applicable law and, if required, other regulatory approvals, we may, on or after the dates specified above, convert the Class AAA Series G, H, J and K into units of BPY.
The Class AAA Series G, H, J and K preferred shares may be converted into that number of BPY units determined by dividing the then applicable redemption price by the greater of C$2.00 (Series G - $2.00) or 95% of the weighted average trading price of BPY units at such time
(4) Subject to applicable law, BPY’s call rights and our right to redeem or find substitute purchasers, the holder may, on the dates specified above and on specified dates thereafter, convert Class AAA Series G, H, J and K preferred shares into that number of BPY units determined by dividing the then applicable redemption price by the greater of C$2.00 (Series G - $2.00) or 95% of the weighted average trading price of units at such time
CAPITAL SECURITIES – FUND SUBSIDIARIES We have $652 million of capital securities – fund subsidiaries outstanding at March 31, 2015 (December 31, 2014 – $643 million). Capital securities – fund subsidiaries represent the equity interests in DTLA held by our co-investors in the fund which have been classified as a liability, rather than as non-controlling interest, due to the fact that on October 15, 2023, and on every fifth anniversary thereafter, the holders of these interests can cause DTLA to redeem their interests in the fund for cash equivalent to the fair value of the interests. Capital securities – fund subsidiaries are measured at redemption amount. Earnings attributable to the equity interests presented as capital securities – fund subsidiaries, including changes in redemption amount, are recognized as interest expense in the statement of income. OTHER NON-CURRENT FINANCIAL LIABILITIES Other non-current financial liabilities were $359 million at March 31, 2015, an increase of $28 million from the balance at December 31, 2014. The components of other non-current financial liabilities are as follows: (Millions) Mar. 31, 2015 Dec. 31, 2014
Loan payable $ 100 $ 100 Other financial liabilities 259 231
Total other non-current financial liabilities $ 359 $ 331
Included in other non-current financial liabilities is a loan payable of $92 million (December 31, 2014 – $92 million) maturing in 2019, bearing interest at 7% and secured by our preferred equity interest in 1625 Eye Street in Washington, D.C. Other non-current financial liabilities also includes derivative liabilities with a carrying amount of $173 million (December 31, 2014 – $142 million) and obligations under ground leases accounted for as finance leases in the United Kingdom of $86 million (December 31, 2014 – $89 million).
Brookfield Office Properties 23
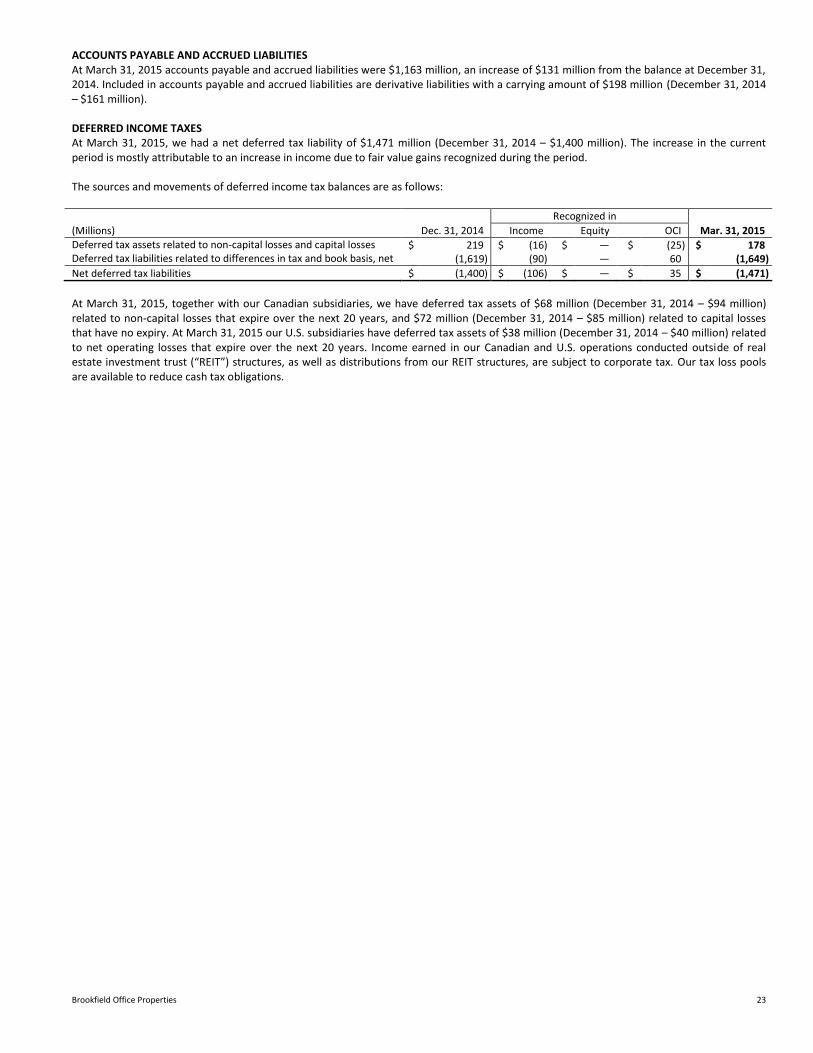
ACCOUNTS PAYABLE AND ACCRUED LIABILITIES At March 31, 2015 accounts payable and accrued liabilities were $1,163 million, an increase of $131 million from the balance at December 31, 2014. Included in accounts payable and accrued liabilities are derivative liabilities with a carrying amount of $198 million (December 31, 2014 – $161 million). DEFERRED INCOME TAXES At March 31, 2015, we had a net deferred tax liability of $1,471 million (December 31, 2014 – $1,400 million). The increase in the current period is mostly attributable to an increase in income due to fair value gains recognized during the period. The sources and movements of deferred income tax balances are as follows:
(Millions) Dec. 31, 2014
Recognized in
Mar. 31, 2015 Income Equity OCI Deferred tax assets related to non-capital losses and capital losses $ 219 $ (16) $ ― $ (25) $ 178 Deferred tax liabilities related to differences in tax and book basis, net (1,619) (90) ― 60 (1,649)
Net deferred tax liabilities $ (1,400) $ (106) $ ― $ 35 $ (1,471)
At March 31, 2015, together with our Canadian subsidiaries, we have deferred tax assets of $68 million (December 31, 2014 – $94 million) related to non-capital losses that expire over the next 20 years, and $72 million (December 31, 2014 – $85 million) related to capital losses that have no expiry. At March 31, 2015 our U.S. subsidiaries have deferred tax assets of $38 million (December 31, 2014 – $40 million) related to net operating losses that expire over the next 20 years. Income earned in our Canadian and U.S. operations conducted outside of real estate investment trust (“REIT”) structures, as well as distributions from our REIT structures, are subject to corporate tax. Our tax loss pools are available to reduce cash tax obligations.
24 2015 First Quarter Report
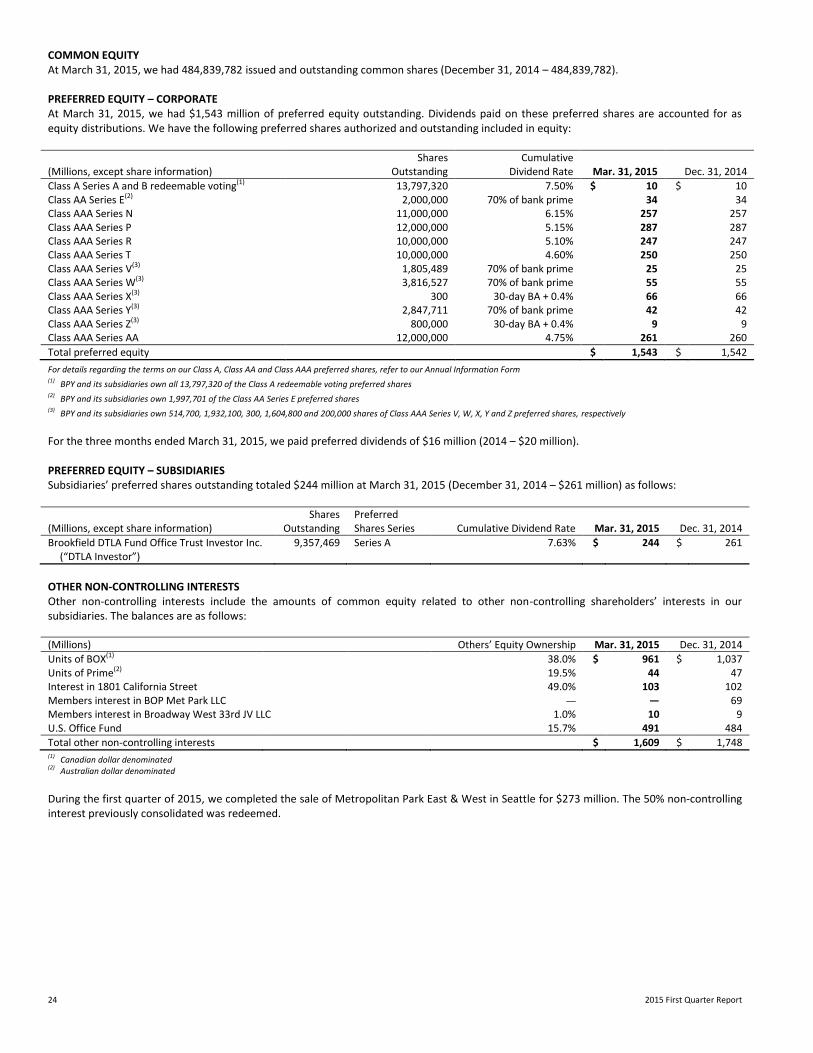
COMMON EQUITY At March 31, 2015, we had 484,839,782 issued and outstanding common shares (December 31, 2014 – 484,839,782). PREFERRED EQUITY – CORPORATE At March 31, 2015, we had $1,543 million of preferred equity outstanding. Dividends paid on these preferred shares are accounted for as equity distributions. We have the following preferred shares authorized and outstanding included in equity: Shares Cumulative (Millions, except share information) Outstanding Dividend Rate Mar. 31, 2015 Dec. 31, 2014
Class A Series A and B redeemable voting(1) 13,797,320 7.50% $ 10 $ 10 Class AA Series E(2) 2,000,000 70% of bank prime 34 34 Class AAA Series N 11,000,000 6.15% 257 257 Class AAA Series P 12,000,000 5.15% 287 287 Class AAA Series R 10,000,000 5.10% 247 247 Class AAA Series T 10,000,000 4.60% 250 250 Class AAA Series V(3) 1,805,489 70% of bank prime 25 25 Class AAA Series W(3) 3,816,527 70% of bank prime 55 55 Class AAA Series X(3) 300 30-day BA + 0.4% 66 66 Class AAA Series Y(3) 2,847,711 70% of bank prime 42 42 Class AAA Series Z(3) 800,000 30-day BA + 0.4% 9 9 Class AAA Series AA 12,000,000 4.75% 261 260
Total preferred equity $ 1,543 $ 1,542
For details regarding the terms on our Class A, Class AA and Class AAA preferred shares, refer to our Annual Information Form (1) BPY and its subsidiaries own all 13,797,320 of the Class A redeemable voting preferred shares (2) BPY and its subsidiaries own 1,997,701 of the Class AA Series E preferred shares (3) BPY and its subsidiaries own 514,700, 1,932,100, 300, 1,604,800 and 200,000 shares of Class AAA Series V, W, X, Y and Z preferred shares, respectively
For the three months ended March 31, 2015, we paid preferred dividends of $16 million (2014 – $20 million). PREFERRED EQUITY – SUBSIDIARIES Subsidiaries’ preferred shares outstanding totaled $244 million at March 31, 2015 (December 31, 2014 – $261 million) as follows:
(Millions, except share information) Shares
Outstanding Preferred Shares Series Cumulative Dividend Rate Mar. 31, 2015 Dec. 31, 2014
Brookfield DTLA Fund Office Trust Investor Inc. (“DTLA Investor”)
9,357,469 Series A 7.63% $ 244 $ 261
OTHER NON-CONTROLLING INTERESTS Other non-controlling interests include the amounts of common equity related to other non-controlling shareholders’ interests in our subsidiaries. The balances are as follows:
(Millions) Others’ Equity Ownership Mar. 31, 2015 Dec. 31, 2014
Units of BOX(1) 38.0% $ 961 $ 1,037 Units of Prime(2) 19.5% 44 47 Interest in 1801 California Street 49.0% 103 102 Members interest in BOP Met Park LLC ― ― 69 Members interest in Broadway West 33rd JV LLC 1.0% 10 9 U.S. Office Fund 15.7% 491 484
Total other non-controlling interests $ 1,609 $ 1,748 (1) Canadian dollar denominated (2) Australian dollar denominated
During the first quarter of 2015, we completed the sale of Metropolitan Park East & West in Seattle for $273 million. The 50% non-controlling interest previously consolidated was redeemed.
Brookfield Office Properties 25
CAPITAL RESOURCES AND LIQUIDITY We employ a broad range of financing strategies to facilitate growth and manage financial risk, with particular emphasis on the overall reduction of the weighted average cost of capital, in order to enhance returns. Our principal liquidity needs for the next twelve months are to:
• Fund recurring expenses;
• Meet debt service requirements;
• Make dividend payments;
• Fund those capital expenditures deemed mandatory, including tenant improvements;
• Fund current development costs not covered under construction loans; and
• Fund investing activities, which could include:
o discretionary capital expenditures;
o property acquisitions; and
o future developments.
We believe that our liquidity needs will be satisfied using cash on hand, cashflows generated from operating and financing activities, as well as proceeds from asset sales. Rental revenue, recoveries from tenants, interest and other income, available cash balances, draws on our corporate credit facilities and refinancings (including upward refinancings) of maturing indebtedness are our principal sources of capital used to pay operating expenses, dividends, debt service, capital expenditures and leasing costs in our commercial property portfolio. We seek to increase income from our existing properties by controlling operating expenses and by maintaining quality standards for our properties that promote high occupancy rates and support increases in rental rates while reducing tenant turnover. Another source of cashflow includes third-party fees generated by our asset management, leasing and development businesses. In addition, our tax status and tax loss pools allow us to retain and reinvest cash generated by our operations without incurring significant cash taxes. Consequently, we believe our revenue, along with proceeds from financing activities, will continue to provide the necessary funds for our short-term liquidity needs. However, material changes in the factors may adversely affect our net cashflows. Our principal liquidity needs for periods beyond the next year are for scheduled debt maturities, recurring and non-recurring capital expenditures, development costs and potential property acquisitions. We plan to meet these needs with one or more of the following:
• cashflows from operating activities;
• construction loans;
• proceeds from sales of assets;
• proceeds from sales of non-controlling interests in subsidiaries; and
• credit facilities and refinancing opportunities.
Our commercial property debt is primarily fixed-rate and non-recourse to the company. These investment-grade financings are typically structured on a loan-to-appraised-value basis of between 50% and 65% as market conditions permit. In addition, in certain circumstances where a building is leased almost exclusively to a high-credit-quality tenant, a higher loan-to-value financing, based on the tenant’s credit quality, is put in place at rates commensurate with the cost of funds for the tenant. This reduces our equity requirements to finance commercial property and enhances equity returns. Most of our borrowings are in the form of long-term property-specific financings with recourse only to the specific assets. Limiting recourse to specific assets ensures that poor performance within one area does not compromise our ability to finance the balance of our operations. Our maturity schedule is fairly diversified so that financing requirements in any given year are manageable. Our focus on structuring financings with investment-grade characteristics ensures that debt levels on any particular asset can typically be maintained throughout a business cycle. This enables us to limit covenants and other performance requirements, thereby reducing the risk of early payment requirements or restrictions on the distribution of cash from the assets being financed. To help ensure we are able to react to investment opportunities quickly and on a value basis, we attempt to maintain a level of liquidity. Our primary sources of liquidity consist of cash and undrawn committed credit facilities. In addition, we structure our affairs to facilitate monetization of longer-duration assets through financings, co-investor participations or refinancings. At March 31, 2015, our available liquidity consists of $428 million of cash on hand and $211 million of undrawn capacity on our corporate credit facilities. Cashflow from operating activities represents a source of liquidity to service debt, to fund capital expenditures and leasing costs and to fund distributions on shares. Cashflow from commercial operating activities depends on occupancy levels, rental rates and the timing of receivables and payables. For the three months ended March 31, 2015, no common share dividends were paid (2014 – common share dividends exceeded cashflow from operating activities by $15 million) and at March 31, 2015 and 2014, current liabilities exceed current assets. We intend to meet the obligations under our current liabilities through refinancing current debt upon maturity, cash flow from operations, as well as disposition of assets.
26 2015 First Quarter Report
OPERATING RESULTS Included on the following pages is a discussion of the various components of our operating results in accordance with IFRS followed by a discussion of non-IFRS measures and corresponding reconciliations to comparable IFRS measures. Three months ended March 31 (Millions) 2015 2014
Commercial property revenue $ 557 $ 582 Direct commercial property expense 252 252 Interest and other income 15 29 Interest expense
Commercial property debt 150 161 Capital securities – corporate 7 8 Capital securities – fund subsidiaries 20 56
Administrative expense 41 36 Fair value gains (losses), net 528 354 Share of net earnings from equity accounted investments 142 21
Income (loss) before income taxes 772 473 Income taxes 115 338
Net income (loss) 657 135 Net income (loss) attributable to non-controlling interests 31 42
Net income (loss) attributable to shareholders $ 626 $ 93
COMMERCIAL PROPERTY REVENUE Commercial property revenue includes rental revenues earned from tenant leases, straight-line rent, percentage rent and additional rent from the recovery of operating costs and property taxes, as well as recurring fee income, lease terminations, fee and other income. Commercial property revenue was $557 million for the three months ended March 31, 2015, compared with $582 million during the same period in 2014. The decrease in commercial property revenue period over period is attributable to the dispositions of Heritage Plaza in Houston in the first quarter of 2014 and Republic Plaza in Denver in the second quarter of 2014, 125 Old Broad Street in London in the third quarter of 2014, 2401 Pennsylvania Avenue in Washington D.C. and Continental Center II in Houston in the fourth quarter of 2014, 151 Yonge Street in Toronto and Metropolitan Park East & West in Seattle in the first quarter of 2015 and the impact of foreign exchange. The decrease is offset by the acquisitions of Five Manhattan West in Midtown New York in the first quarter of 2014, KPMG Tower in Sydney in the second quarter of 2014 and Moor Place in London in the fourth quarter of 2014. The components of commercial property revenue are as follows: Three months ended March 31 (Millions) 2015 2014
Rental revenue $ 523 $ 551 Straight-line rental income 24 20 Recurring fee income 9 7 Lease termination, fee and other income 1 4
Total commercial property revenue $ 557 $ 582
Straight-line rental income Our leases generally have clauses that provide for the collection of rental revenues in amounts that increase every few years, with these increases negotiated at the signing of the lease. IFRS requires that rental revenue be recorded on a straight-line basis over the life of the lease. For the three months ended March 31, 2015, we recognized $24 million of straight-line rental income compared with $20 million during the same period in 2014. Recurring fee income Recurring fee income includes property management fees, leasing fees and project management fees relating to certain co-owned properties. Fee income serves to enhance returns from co-owned assets. For the three months ended March 31, 2015, we recognized $9 million of recurring fee income compared with $7 million during the same period in 2014. The generation of fee income is not viewed as a separate business segment; however, with the establishment of our office funds, the associated fees represent a potential area of growth for us and are expected to increase as we expand our assets under management.
Brookfield Office Properties 27
DIRECT COMMERCIAL PROPERTY EXPENSE Direct commercial property expense, which includes real estate taxes, utilities, insurance, repairs and maintenance, cleaning and other property-related expenses, was $252 million for the three months ended March 31, 2015 compared with $252 million during the same period in 2014. As a result of our strategy of owning, proactively managing and developing premier properties in high-growth, and in many instances supply-constrained markets with high barriers to entry, along with our focus on executing long-term leases with strong credit rated tenants, we have been able to reduce the exposure of our commercial property revenues to the cyclical nature of the real estate business and ensure stability of cash flows associated with our properties. We have relatively strong occupancy levels across our portfolio, outperforming market occupancy levels across most of our portfolio. In addition, we continue to reduce our lease expiry profile for the upcoming years, and our average in-place net rent is lower than the market net rent which is reflective of the fact that a portion of our leases were executed at a point in time wherein market rents were lower. In a market of increasing rents, this below-market gap provides an earnings growth opportunity for us as we replace lower in-place rents with higher market rents. Accordingly, we anticipate steady growth in our commercial property revenue as the two rates converge over time. More than 95% of our leases are net leases, in which the lessee is required to pay its proportionate share of property operating expenses such as utilities, repairs, insurance and taxes. After giving consideration to amounts recovered from tenants, the company’s responsibility for operating expenses is limited to property operating expenses attributable to vacant space and operating costs specifically identified as non-recoverable under certain leases, such as ground rent. Consequently, leasing activity, which affects both occupancy and average in-place net rent, is the principal contributor to the change in same property commercial property revenue and direct commercial property expense. Our total portfolio occupancy was 92.2% at March 31, 2015 compared with 89.3% at March 31, 2014. Our total portfolio average in-place net rent was $29.51 per square foot at March 31, 2015 compared with $30.50 per square foot at March 31, 2014. Our total portfolio occupancy increased as a result of significant leasing of the former Bank of America/Merrill Lynch space at Brookfield Place in New York and new leases for space that was previously unoccupied offset by opportunistic acquisitions of certain assets at lower occupancy rates. Our average in-place net rent decreased due to the impact of foreign exchange offset by leasing at higher market rents compared to expiring net rents.
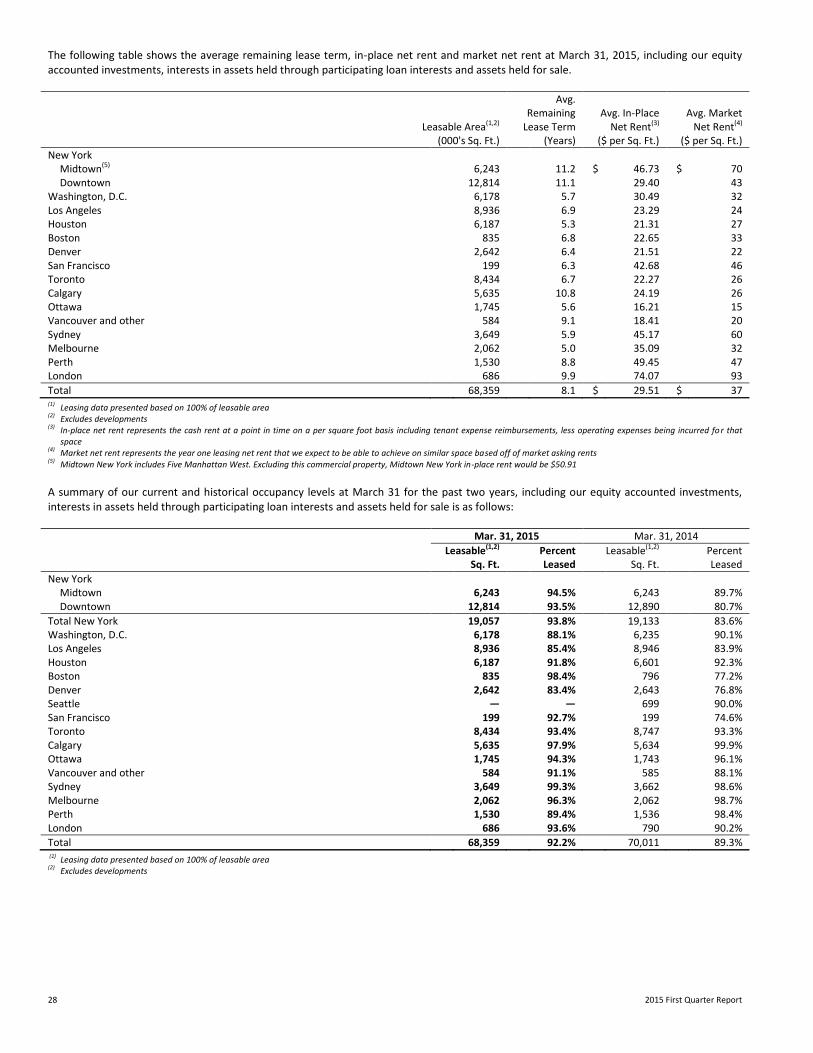
28 2015 First Quarter Report
The following table shows the average remaining lease term, in-place net rent and market net rent at March 31, 2015, including our equity accounted investments, interests in assets held through participating loan interests and assets held for sale.
Avg.
Remaining Avg. In-Place Avg. Market Leasable Area(1,2) Lease Term Net Rent(3) Net Rent(4)
(000's Sq. Ft.) (Years) ($ per Sq. Ft.) ($ per Sq. Ft.)
New York Midtown(5) 6,243 11.2 $ 46.73 $ 70 Downtown 12,814 11.1 29.40 43
Washington, D.C. 6,178 5.7 30.49 32 Los Angeles 8,936 6.9 23.29 24 Houston 6,187 5.3 21.31 27 Boston 835 6.8 22.65 33 Denver 2,642 6.4 21.51 22 San Francisco 199 6.3 42.68 46 Toronto 8,434 6.7 22.27 26 Calgary 5,635 10.8 24.19 26 Ottawa 1,745 5.6 16.21 15 Vancouver and other 584 9.1 18.41 20 Sydney 3,649 5.9 45.17 60 Melbourne 2,062 5.0 35.09 32 Perth 1,530 8.8 49.45 47 London 686 9.9 74.07 93
Total 68,359 8.1 $ 29.51 $ 37 (1) Leasing data presented based on 100% of leasable area (2) Excludes developments (3) In-place net rent represents the cash rent at a point in time on a per square foot basis including tenant expense reimbursements, less operating expenses being incurred for that
space (4) Market net rent represents the year one leasing net rent that we expect to be able to achieve on similar space based off of market asking rents (5) Midtown New York includes Five Manhattan West. Excluding this commercial property, Midtown New York in-place rent would be $50.91
A summary of our current and historical occupancy levels at March 31 for the past two years, including our equity accounted investments, interests in assets held through participating loan interests and assets held for sale is as follows: Mar. 31, 2015 Mar. 31, 2014
Leasable(1,2) Percent Leasable(1,2) Percent Sq. Ft. Leased Sq. Ft. Leased
New York Midtown 6,243 94.5% 6,243 89.7% Downtown 12,814 93.5% 12,890 80.7%
Total New York 19,057 93.8% 19,133 83.6% Washington, D.C. 6,178 88.1% 6,235 90.1% Los Angeles 8,936 85.4% 8,946 83.9% Houston 6,187 91.8% 6,601 92.3% Boston 835 98.4% 796 77.2% Denver 2,642 83.4% 2,643 76.8% Seattle ― ― 699 90.0% San Francisco 199 92.7% 199 74.6% Toronto 8,434 93.4% 8,747 93.3% Calgary 5,635 97.9% 5,634 99.9% Ottawa 1,745 94.3% 1,743 96.1% Vancouver and other 584 91.1% 585 88.1% Sydney 3,649 99.3% 3,662 98.6% Melbourne 2,062 96.3% 2,062 98.7% Perth 1,530 89.4% 1,536 98.4% London 686 93.6% 790 90.2%
Total 68,359 92.2% 70,011 89.3% (1)
Leasing data presented based on 100% of leasable area (2) Excludes developments
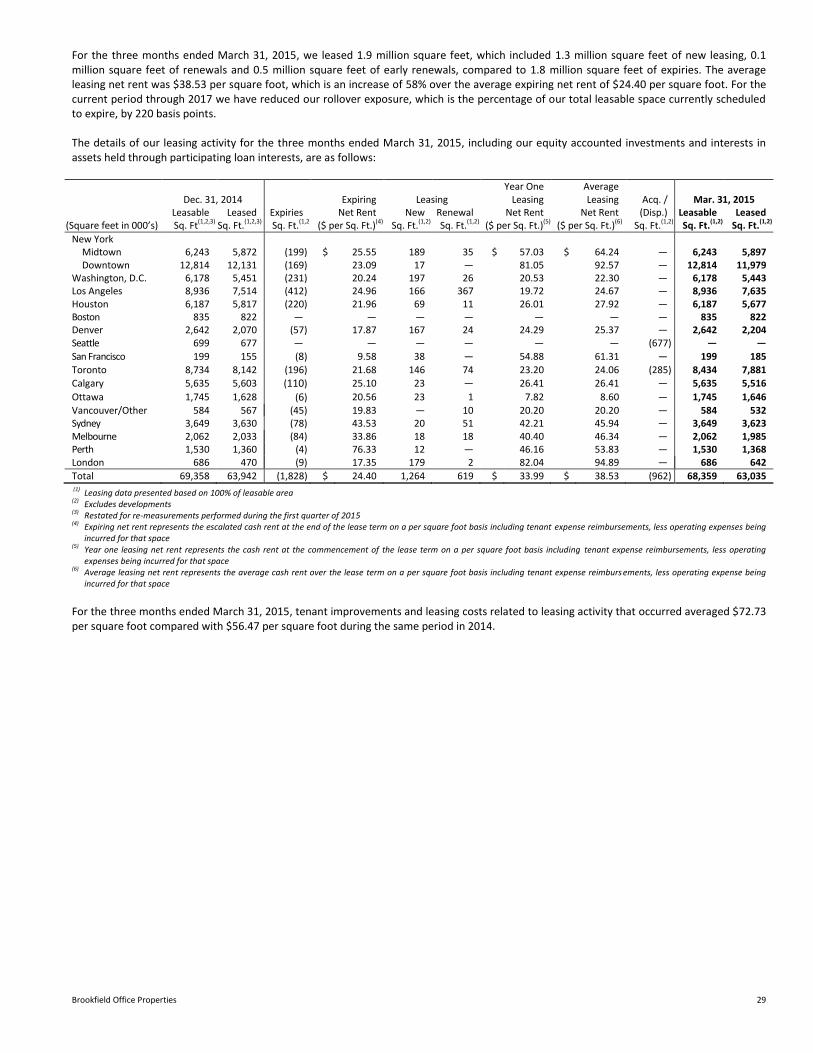
Brookfield Office Properties 29
For the three months ended March 31, 2015, we leased 1.9 million square feet, which included 1.3 million square feet of new leasing, 0.1 million square feet of renewals and 0.5 million square feet of early renewals, compared to 1.8 million square feet of expiries. The average leasing net rent was $38.53 per square foot, which is an increase of 58% over the average expiring net rent of $24.40 per square foot. For the current period through 2017 we have reduced our rollover exposure, which is the percentage of our total leasable space currently scheduled to expire, by 220 basis points. The details of our leasing activity for the three months ended March 31, 2015, including our equity accounted investments and interests in assets held through participating loan interests, are as follows: Year One Average Dec. 31, 2014 Expiring Leasing Leasing Leasing Acq. / Mar. 31, 2015 Leasable Leased Expiries Net Rent New Renewal Net Rent Net Rent (Disp.) Leasable Leased
(Square feet in 000’s) Sq. Ft(1,2,3) Sq. Ft.(1,2,3) Sq. Ft.(1,2) ($ per Sq. Ft.)(4) Sq. Ft.(1,2) Sq. Ft.(1,2) ($ per Sq. Ft.)(5) ($ per Sq. Ft.)(6) Sq. Ft.(1,2) Sq. Ft.(1,2) Sq. Ft.(1,2)
New York Midtown 6,243 5,872 (199) $ 25.55 189 35 $ 57.03 $ 64.24 ― 6,243 5,897 Downtown 12,814 12,131 (169) 23.09 17 ― 81.05 92.57 ― 12,814 11,979 Washington, D.C. 6,178 5,451 (231) 20.24 197 26 20.53 22.30 ― 6,178 5,443 Los Angeles 8,936 7,514 (412) 24.96 166 367 19.72 24.67 ― 8,936 7,635 Houston 6,187 5,817 (220) 21.96 69 11 26.01 27.92 ― 6,187 5,677 Boston 835 822 ― ― ― ― ― ― ― 835 822 Denver 2,642 2,070 (57) 17.87 167 24 24.29 25.37 ― 2,642 2,204 Seattle 699 677 ― ― ― ― ― ― (677) ― ―
San Francisco 199 155 (8) 9.58 38 ― 54.88 61.31 ― 199 185
Toronto 8,734 8,142 (196) 21.68 146 74 23.20 24.06 (285) 8,434 7,881
Calgary 5,635 5,603 (110) 25.10 23 ― 26.41 26.41 ― 5,635 5,516
Ottawa 1,745 1,628 (6) 20.56 23 1 7.82 8.60 ― 1,745 1,646
Vancouver/Other 584 567 (45) 19.83 ― 10 20.20 20.20 ― 584 532 Sydney 3,649 3,630 (78) 43.53 20 51 42.21 45.94 ― 3,649 3,623 Melbourne 2,062 2,033 (84) 33.86 18 18 40.40 46.34 ― 2,062 1,985 Perth 1,530 1,360 (4) 76.33 12 ― 46.16 53.83 ― 1,530 1,368 London 686 470 (9) 17.35 179 2 82.04 94.89 ― 686 642
Total 69,358 63,942 (1,828) $ 24.40 1,264 619 $ 33.99 $ 38.53 (962) 68,359 63,035 (1) Leasing data presented based on 100% of leasable area (2) Excludes developments (3) Restated for re-measurements performed during the first quarter of 2015 (4) Expiring net rent represents the escalated cash rent at the end of the lease term on a per square foot basis including tenant expense reimbursements, less operating expenses being
incurred for that space (5) Year one leasing net rent represents the cash rent at the commencement of the lease term on a per square foot basis including tenant expense reimbursements, less operating
expenses being incurred for that space (6)
Average leasing net rent represents the average cash rent over the lease term on a per square foot basis including tenant expense reimbursements, less operating expense being incurred for that space
For the three months ended March 31, 2015, tenant improvements and leasing costs related to leasing activity that occurred averaged $72.73 per square foot compared with $56.47 per square foot during the same period in 2014.
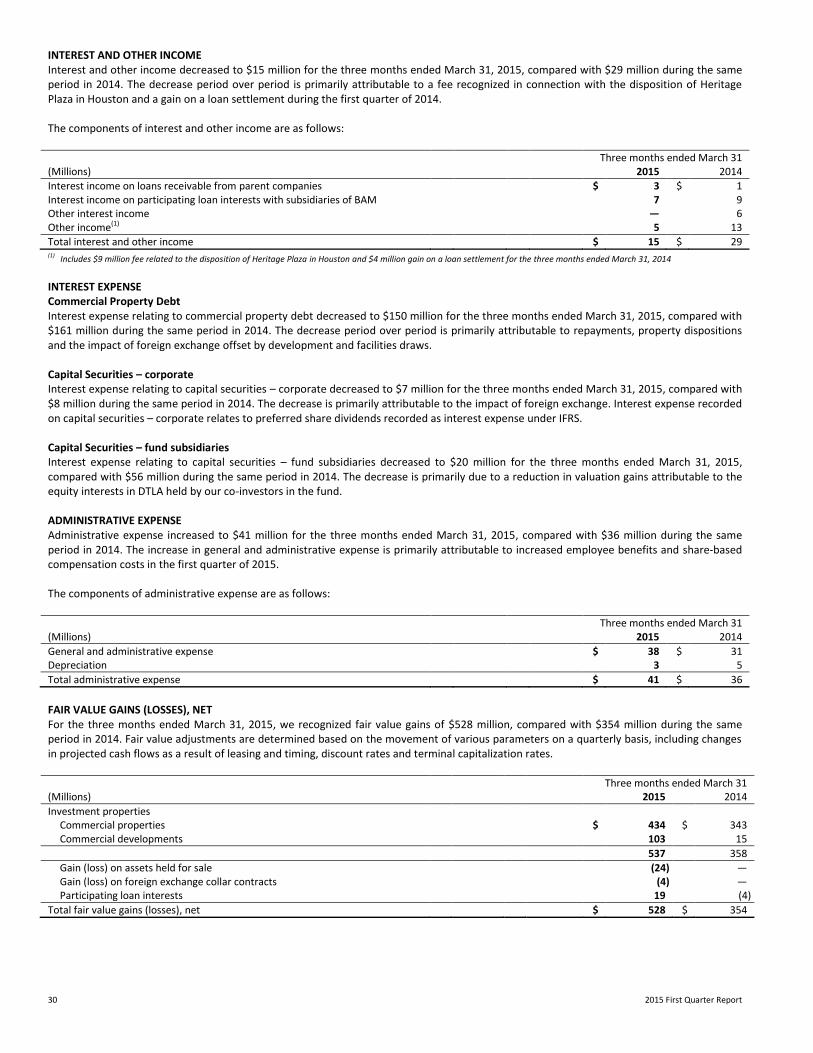
30 2015 First Quarter Report
INTEREST AND OTHER INCOME Interest and other income decreased to $15 million for the three months ended March 31, 2015, compared with $29 million during the same period in 2014. The decrease period over period is primarily attributable to a fee recognized in connection with the disposition of Heritage Plaza in Houston and a gain on a loan settlement during the first quarter of 2014. The components of interest and other income are as follows: Three months ended March 31 (Millions) 2015 2014
Interest income on loans receivable from parent companies $ 3 $ 1 Interest income on participating loan interests with subsidiaries of BAM 7 9 Other interest income ― 6 Other income(1) 5 13
Total interest and other income $ 15 $ 29 (1) Includes $9 million fee related to the disposition of Heritage Plaza in Houston and $4 million gain on a loan settlement for the three months ended March 31, 2014
INTEREST EXPENSE Commercial Property Debt Interest expense relating to commercial property debt decreased to $150 million for the three months ended March 31, 2015, compared with $161 million during the same period in 2014. The decrease period over period is primarily attributable to repayments, property dispositions and the impact of foreign exchange offset by development and facilities draws. Capital Securities – corporate Interest expense relating to capital securities – corporate decreased to $7 million for the three months ended March 31, 2015, compared with $8 million during the same period in 2014. The decrease is primarily attributable to the impact of foreign exchange. Interest expense recorded on capital securities – corporate relates to preferred share dividends recorded as interest expense under IFRS. Capital Securities – fund subsidiaries Interest expense relating to capital securities – fund subsidiaries decreased to $20 million for the three months ended March 31, 2015, compared with $56 million during the same period in 2014. The decrease is primarily due to a reduction in valuation gains attributable to the equity interests in DTLA held by our co-investors in the fund. ADMINISTRATIVE EXPENSE Administrative expense increased to $41 million for the three months ended March 31, 2015, compared with $36 million during the same period in 2014. The increase in general and administrative expense is primarily attributable to increased employee benefits and share-based compensation costs in the first quarter of 2015. The components of administrative expense are as follows: Three months ended March 31 (Millions) 2015 2014
General and administrative expense $ 38 $ 31 Depreciation 3 5
Total administrative expense $ 41 $ 36
FAIR VALUE GAINS (LOSSES), NET For the three months ended March 31, 2015, we recognized fair value gains of $528 million, compared with $354 million during the same period in 2014. Fair value adjustments are determined based on the movement of various parameters on a quarterly basis, including changes in projected cash flows as a result of leasing and timing, discount rates and terminal capitalization rates. Three months ended March 31 (Millions) 2015 2014
Investment properties Commercial properties $ 434 $ 343 Commercial developments 103 15
537 358
Gain (loss) on assets held for sale (24) ― Gain (loss) on foreign exchange collar contracts (4) ― Participating loan interests 19 (4)
Total fair value gains (losses), net $ 528 $ 354
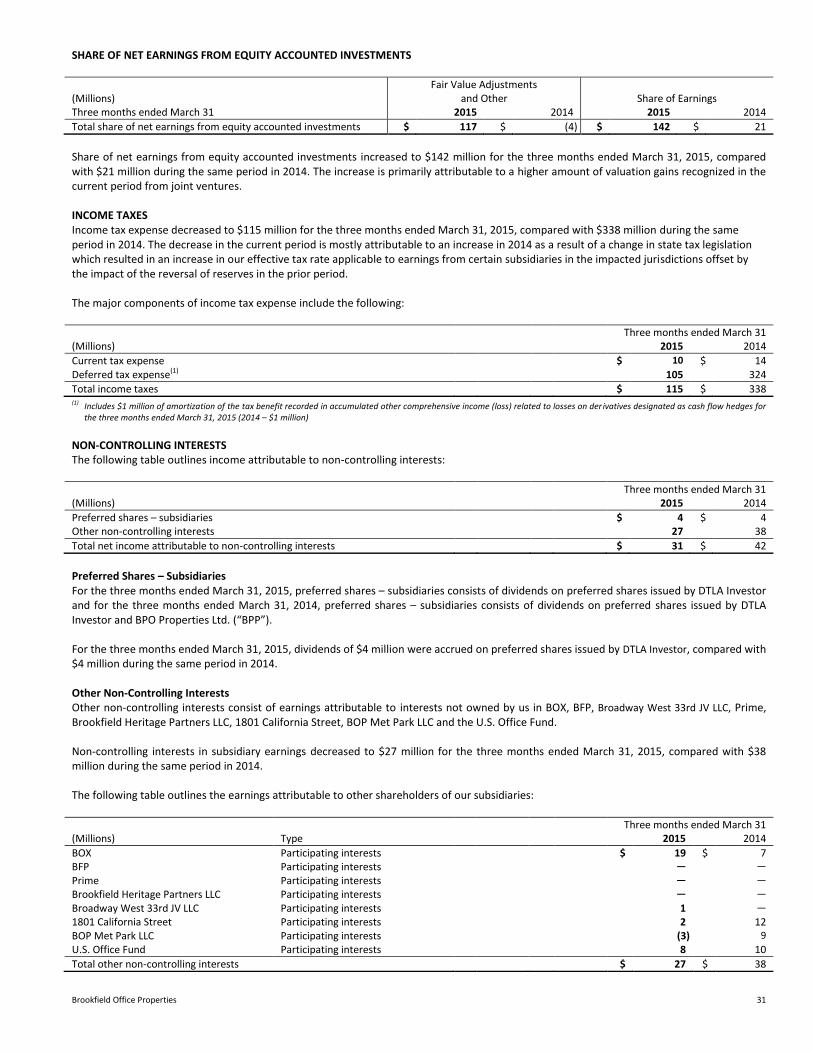
Brookfield Office Properties 31
SHARE OF NET EARNINGS FROM EQUITY ACCOUNTED INVESTMENTS
(Millions) Fair Value Adjustments
and Other Share of Earnings Three months ended March 31 2015 2014 2015 2014
Total share of net earnings from equity accounted investments $ 117 $ (4) $ 142 $ 21
Share of net earnings from equity accounted investments increased to $142 million for the three months ended March 31, 2015, compared with $21 million during the same period in 2014. The increase is primarily attributable to a higher amount of valuation gains recognized in the current period from joint ventures. INCOME TAXES Income tax expense decreased to $115 million for the three months ended March 31, 2015, compared with $338 million during the same period in 2014. The decrease in the current period is mostly attributable to an increase in 2014 as a result of a change in state tax legislation which resulted in an increase in our effective tax rate applicable to earnings from certain subsidiaries in the impacted jurisdictions offset by the impact of the reversal of reserves in the prior period. The major components of income tax expense include the following: Three months ended March 31 (Millions) 2015 2014
Current tax expense $ 10 $ 14 Deferred tax expense(1) 105 324
Total income taxes $ 115 $ 338 (1) Includes $1 million of amortization of the tax benefit recorded in accumulated other comprehensive income (loss) related to losses on der ivatives designated as cash flow hedges for
the three months ended March 31, 2015 (2014 – $1 million)
NON-CONTROLLING INTERESTS The following table outlines income attributable to non-controlling interests: Three months ended March 31 (Millions) 2015 2014
Preferred shares – subsidiaries $ 4 $ 4 Other non-controlling interests 27 38
Total net income attributable to non-controlling interests $ 31 $ 42
Preferred Shares – Subsidiaries For the three months ended March 31, 2015, preferred shares – subsidiaries consists of dividends on preferred shares issued by DTLA Investor and for the three months ended March 31, 2014, preferred shares – subsidiaries consists of dividends on preferred shares issued by DTLA Investor and BPO Properties Ltd. (“BPP”). For the three months ended March 31, 2015, dividends of $4 million were accrued on preferred shares issued by DTLA Investor, compared with $4 million during the same period in 2014. Other Non-Controlling Interests Other non-controlling interests consist of earnings attributable to interests not owned by us in BOX, BFP, Broadway West 33rd JV LLC, Prime, Brookfield Heritage Partners LLC, 1801 California Street, BOP Met Park LLC and the U.S. Office Fund. Non-controlling interests in subsidiary earnings decreased to $27 million for the three months ended March 31, 2015, compared with $38 million during the same period in 2014. The following table outlines the earnings attributable to other shareholders of our subsidiaries: Three months ended March 31 (Millions) Type 2015 2014
BOX Participating interests $ 19 $ 7 BFP Participating interests ― ―
Prime Participating interests ― ―
Brookfield Heritage Partners LLC Participating interests ― ―
Broadway West 33rd JV LLC Participating interests 1 ―
1801 California Street Participating interests 2 12 BOP Met Park LLC Participating interests (3) 9
U.S. Office Fund Participating interests 8 10
Total other non-controlling interests $ 27 $ 38
32 2015 First Quarter Report
NON-IFRS MEASURES Although we monitor and analyze our financial performance using a number of indicators, our primary business objective of generating reliable and growing cashflow is monitored and analyzed using commercial property net operating income and funds from operations in addition to net income. Commercial property net operating income and funds from operations do not have any standardized meaning prescribed by IFRS, and are therefore unlikely to be comparable to similar measures presented by other companies. Commercial Property Net Operating Income Commercial property net operating income is defined by us as revenue from commercial property operations less direct commercial property expense. Commercial property net operating income is a key indicator of performance as it represents a measure over which management of the commercial property operations has control. We evaluate the performance of management by comparing the performance of the commercial property portfolio on a same property basis. Same property commercial property net operating income is defined as properties included in our consolidated results that we own and operate throughout both the current and prior period. Accordingly, same property results exclude properties acquired, sold, or reclassified from commercial development to commercial properties during each period as well as fees earned from management and other services provided to co-investors in our funds and commercial properties. We may also exclude from our same property results any property that is undergoing a redevelopment that may impact the comparability of the results between the current and prior period. Funds from Operations Our definition of funds from operations or “FFO” includes all of the adjustments that are outlined in the National Association of Real Estate Investment Trusts (“NAREIT”) definition of FFO such as the exclusion of gains (or losses) from the sale of real estate property, the add back of any depreciation and amortization related to real estate assets and the adjustment to reflect our interest in unconsolidated partnerships and joint ventures. In addition to the adjustments prescribed by NAREIT, we also make adjustments to exclude any unrealized fair value gains (or losses) that arise as a result of reporting under IFRS and income taxes that arise as a result of our structure as a corporation as opposed to a REIT. These additional adjustments result in an FFO measure that is similar to that which would result if the company was organized as a REIT that determined net income in accordance with U.S. GAAP, which is the type of organization on which the NAREIT definition is premised. Our FFO measure will differ from other organizations applying the NAREIT definition to the extent of certain differences between the IFRS and U.S. GAAP reporting frameworks, principally related to the recognition of lease termination income, which do not have a significant impact on the FFO measure reported. Although funds from operations is a widely used measure to analyze real estate, we believe that net income, commercial property net operating income and funds from operations are all relevant measures. Funds from operations does not represent or approximate cash generated from operating activities determined in accordance with IFRS. We provide a reconciliation of funds from operations to net income attributable to shareholders as we believe net income attributable to shareholders is the most comparable measure.
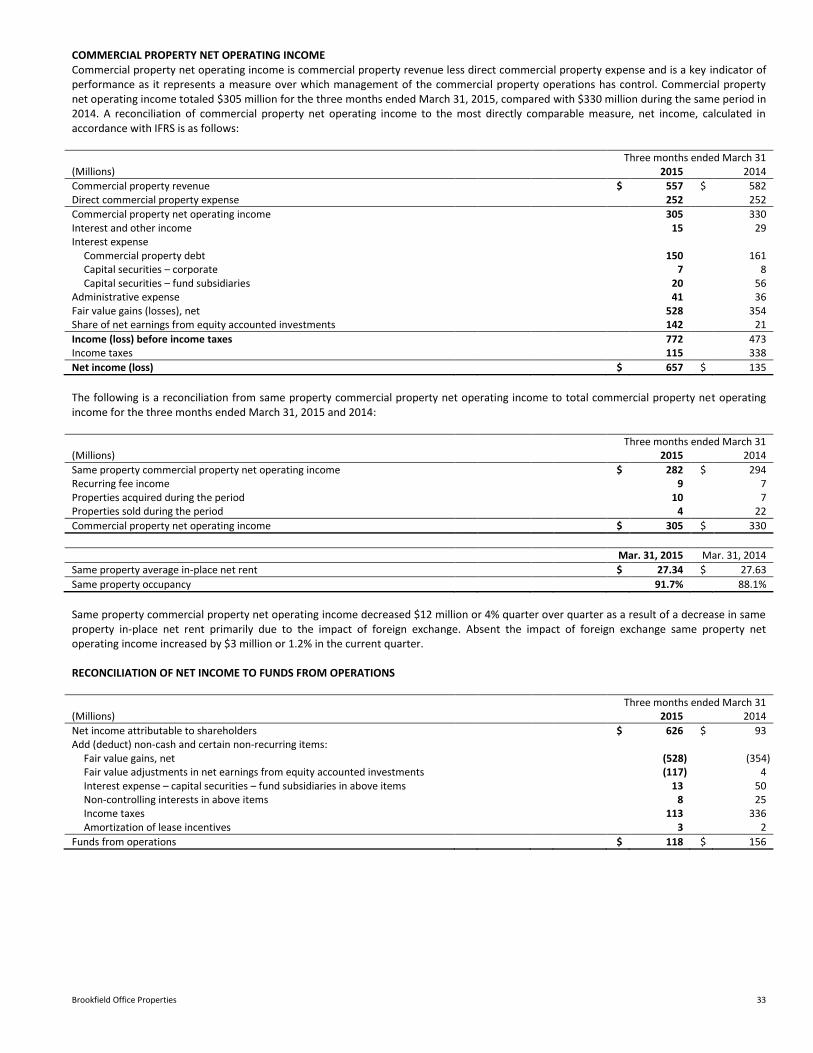
Brookfield Office Properties 33
COMMERCIAL PROPERTY NET OPERATING INCOME Commercial property net operating income is commercial property revenue less direct commercial property expense and is a key indicator of performance as it represents a measure over which management of the commercial property operations has control. Commercial property net operating income totaled $305 million for the three months ended March 31, 2015, compared with $330 million during the same period in 2014. A reconciliation of commercial property net operating income to the most directly comparable measure, net income, calculated in accordance with IFRS is as follows: Three months ended March 31 (Millions) 2015 2014
Commercial property revenue $ 557 $ 582 Direct commercial property expense 252 252
Commercial property net operating income 305 330 Interest and other income 15 29 Interest expense
Commercial property debt 150 161 Capital securities – corporate 7 8 Capital securities – fund subsidiaries 20 56
Administrative expense 41 36 Fair value gains (losses), net 528 354 Share of net earnings from equity accounted investments 142 21
Income (loss) before income taxes 772 473 Income taxes 115 338
Net income (loss) $ 657 $ 135
The following is a reconciliation from same property commercial property net operating income to total commercial property net operating income for the three months ended March 31, 2015 and 2014: Three months ended March 31 (Millions) 2015 2014
Same property commercial property net operating income $ 282 $ 294 Recurring fee income 9 7 Properties acquired during the period 10 7 Properties sold during the period 4 22
Commercial property net operating income $ 305 $ 330
Mar. 31, 2015 Mar. 31, 2014
Same property average in-place net rent $ 27.34 $ 27.63
Same property occupancy 91.7% 88.1%
Same property commercial property net operating income decreased $12 million or 4% quarter over quarter as a result of a decrease in same property in-place net rent primarily due to the impact of foreign exchange. Absent the impact of foreign exchange same property net operating income increased by $3 million or 1.2% in the current quarter. RECONCILIATION OF NET INCOME TO FUNDS FROM OPERATIONS Three months ended March 31 (Millions) 2015 2014
Net income attributable to shareholders $ 626 $ 93 Add (deduct) non-cash and certain non-recurring items:
Fair value gains, net (528) (354) Fair value adjustments in net earnings from equity accounted investments (117) 4 Interest expense – capital securities – fund subsidiaries in above items 13 50 Non-controlling interests in above items 8 25 Income taxes 113 336 Amortization of lease incentives 3 2
Funds from operations $ 118 $ 156
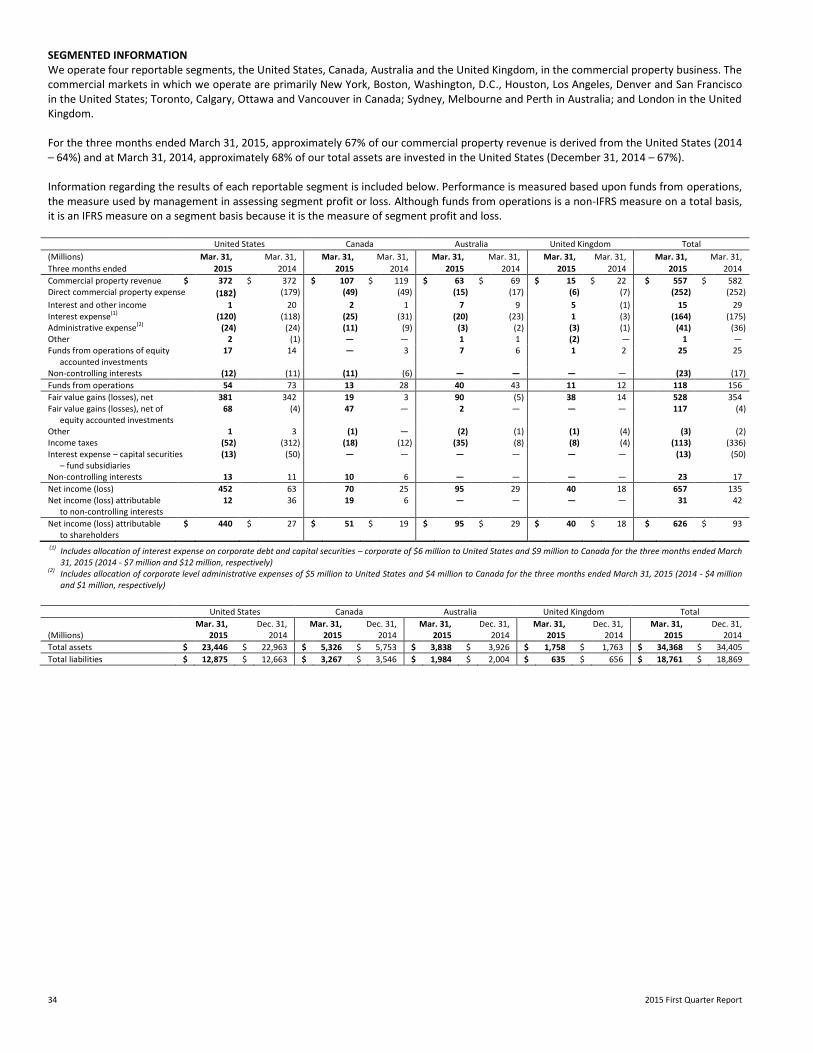
34 2015 First Quarter Report
SEGMENTED INFORMATION We operate four reportable segments, the United States, Canada, Australia and the United Kingdom, in the commercial property business. The commercial markets in which we operate are primarily New York, Boston, Washington, D.C., Houston, Los Angeles, Denver and San Francisco in the United States; Toronto, Calgary, Ottawa and Vancouver in Canada; Sydney, Melbourne and Perth in Australia; and London in the United Kingdom. For the three months ended March 31, 2015, approximately 67% of our commercial property revenue is derived from the United States (2014 – 64%) and at March 31, 2014, approximately 68% of our total assets are invested in the United States (December 31, 2014 – 67%). Information regarding the results of each reportable segment is included below. Performance is measured based upon funds from operations, the measure used by management in assessing segment profit or loss. Although funds from operations is a non-IFRS measure on a total basis, it is an IFRS measure on a segment basis because it is the measure of segment profit and loss. United States Canada Australia United Kingdom Total
(Millions) Mar. 31, Mar. 31, Mar. 31, Mar. 31, Mar. 31, Mar. 31, Mar. 31, Mar. 31, Mar. 31, Mar. 31,
Three months ended 2015 2014 2015 2014 2015 2014 2015 2014 2015 2014
Commercial property revenue $ 372 $ 372 $ 107 $ 119 $ 63 $ 69 $ 15 $ 22 $ 557 $ 582 Direct commercial property expense (182) (179) (49) (49) (15) (17) (6) (7) (252) (252)
Interest and other income 1 20 2 1 7 9 5 (1) 15 29 Interest expense(1) (120) (118) (25) (31) (20) (23) 1 (3) (164) (175) Administrative expense
(2) (24) (24) (11) (9) (3) (2) (3) (1) (41) (36)
Other 2 (1) — — 1 1 (2) — 1 — Funds from operations of equity
accounted investments 17 14 — 3 7 6 1 2 25 25
Non-controlling interests (12) (11) (11) (6) — — — — (23) (17)
Funds from operations 54 73 13 28 40 43 11 12 118 156
Fair value gains (losses), net 381 342 19 3 90 (5) 38 14 528 354 Fair value gains (losses), net of
equity accounted investments 68 (4) 47 — 2 —
— — 117 (4)
Other 1 3 (1) — (2) (1) (1) (4) (3) (2) Income taxes (52) (312) (18) (12) (35) (8) (8) (4) (113) (336) Interest expense – capital securities
– fund subsidiaries (13) (50) — — — — — — (13) (50)
Non-controlling interests 13 11 10 6 — — — — 23 17
Net income (loss) 452 63 70 25 95 29 40 18 657 135 Net income (loss) attributable
to non-controlling interests 12 36 19 6 — — — — 31 42
Net income (loss) attributable to shareholders
$ 440 $ 27 $ 51 $ 19 $ 95 $ 29 $ 40 $ 18 $ 626 $ 93
(1) Includes allocation of interest expense on corporate debt and capital securities – corporate of $6 million to United States and $9 million to Canada for the three months ended March 31, 2015 (2014 - $7 million and $12 million, respectively)
(2) Includes allocation of corporate level administrative expenses of $5 million to United States and $4 million to Canada for the three months ended March 31, 2015 (2014 - $4 million
and $1 million, respectively)
United States Canada Australia United Kingdom Total
Mar. 31, Dec. 31, Mar. 31, Dec. 31, Mar. 31, Dec. 31, Mar. 31, Dec. 31, Mar. 31, Dec. 31, (Millions) 2015 2014 2015 2014 2015 2014 2015 2014 2015 2014
Total assets $ 23,446 $ 22,963 $ 5,326 $ 5,753 $ 3,838 $ 3,926 $ 1,758 $ 1,763 $ 34,368 $ 34,405
Total liabilities $ 12,875 $ 12,663 $ 3,267 $ 3,546 $ 1,984 $ 2,004 $ 635 $ 656 $ 18,761 $ 18,869
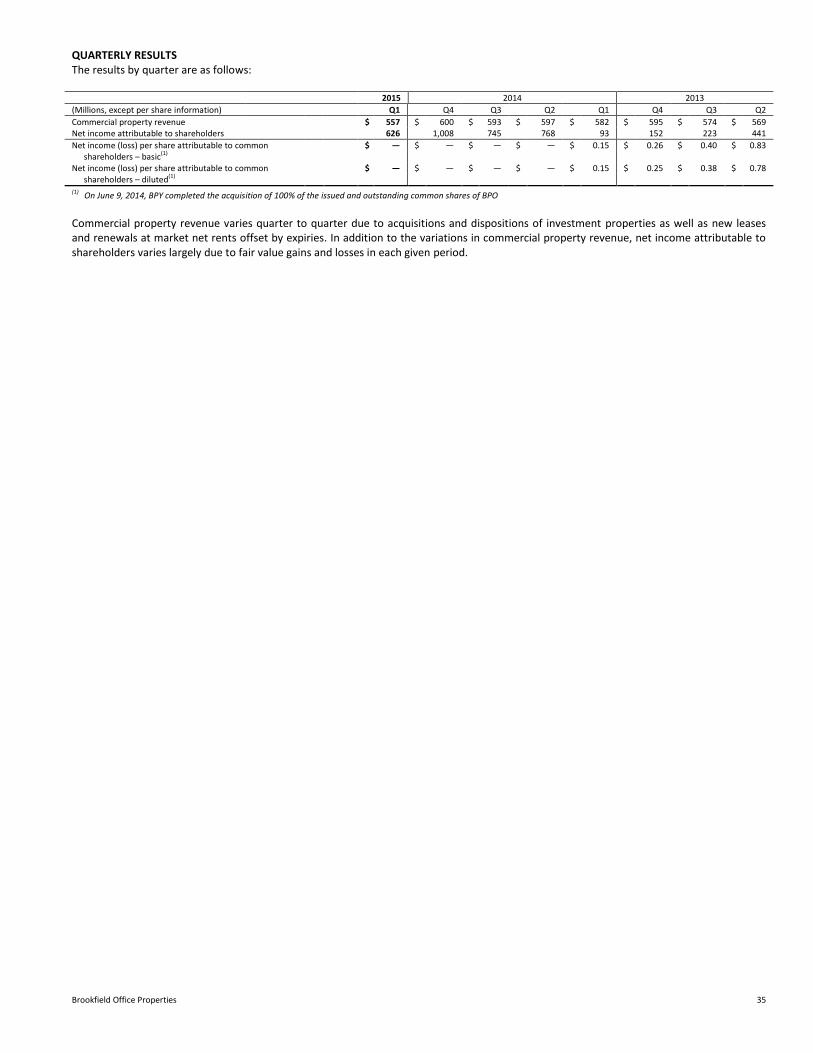
Brookfield Office Properties 35
QUARTERLY RESULTS The results by quarter are as follows: 2015 2014 2013
(Millions, except per share information) Q1 Q4 Q3 Q2 Q1 Q4 Q3 Q2
Commercial property revenue $ 557 $ 600 $ 593 $ 597 $ 582 $ 595 $ 574 $ 569 Net income attributable to shareholders 626 1,008 745 768 93 152 223 441
Net income (loss) per share attributable to common shareholders – basic(1)
Net income (loss) per share attributable to common shareholders – diluted(1)
$ — $ — $ —
$ —
$
$
0.15
0.15
$
$
0.26
0.25
$
$
0.40 0.38
$
$
0.83
0.78 $ — $ — $ — $ —
(1) On June 9, 2014, BPY completed the acquisition of 100% of the issued and outstanding common shares of BPO Commercial property revenue varies quarter to quarter due to acquisitions and dispositions of investment properties as well as new leases and renewals at market net rents offset by expiries. In addition to the variations in commercial property revenue, net income attributable to shareholders varies largely due to fair value gains and losses in each given period.
36 2015 First Quarter Report
PART III – RISKS AND UNCERTAINTIES Brookfield Office Properties’ financial results are affected by the performance of our operations and various external factors influencing the specific sectors and geographic locations in which we operate, as well as macro-economic factors such as economic growth, foreign exchange rates, inflation, interest rates; regulatory requirements and initiatives; and litigation and claims that arise in the normal course of business. Our strategy is to invest in premier assets that generate sustainable streams of cashflow. Although high-quality assets may initially generate lower returns on capital, we believe that the sustainability and future growth of their cashflows is more assured over the long-term and, as a result, warrant higher valuation levels. We also believe that the high quality of our asset base protects the company against future uncertainty and enables us to invest with confidence when opportunities arise. The following is a review of the material factors that may impact our financial results and the potential impact these factors may have on our business operations. A more detailed description of our business environment and risks is contained in our Annual Information Form, which is posted on our website at www.brookfieldofficeproperties.com and at www.sedar.com. PROPERTY RELATED RISKS Our strategy is to invest in high-quality office properties as defined by the physical characteristic of the asset and, more important, the certainty of receiving rental payments from the large corporate tenants (with investment grade credit ratings – see “Credit Risk” below) that these properties attract. Nonetheless, we remain exposed to certain risks inherent in the core office property business. Commercial property investments are generally subject to varying degrees of risk depending on the nature of the property. These risks include changes in general economic conditions (such as the availability and costs of mortgage funds), local conditions (such as an oversupply of space or a reduction in demand for real estate in the markets in which we operate), the attractiveness of the properties to tenants, competition from other landlords with competitive space and our ability to provide adequate maintenance at an economical cost. Certain significant expenditures, including property taxes, maintenance costs, mortgage payments, insurance costs and related charges, must be made regardless of whether a property is producing sufficient income to service these expenses. Our office properties are subject to mortgages that require substantial debt service payments. If we become unable or unwilling to meet mortgage payments on any property, losses could be sustained as a result of the mortgagee’s exercise of its rights of foreclosure or of sale. We believe the stability and long-term nature of our contractual revenues effectively mitigates these risks. As owners of premier office properties, lease rollovers also present a risk, as continued growth of rental income is dependent on strong leasing markets to ensure expiring leases are renewed and new tenants are found promptly to fill vacancies. Refer to “Lease Roll-over Risk” on page 39 of this MD&A for further details.

Brookfield Office Properties 37
INTEREST RATE AND FINANCING RISK We attempt to stagger the maturities of our mortgage portfolio evenly over a 10-year time horizon. We believe that this strategy will most effectively manage interest rate risk. As outlined under “Capital Resources and Liquidity,” on page 25 of this MD&A, we have an ongoing obligation to access debt markets to refinance maturing debt as it comes due. There is a risk that lenders will not refinance such maturing debt on terms and conditions acceptable to us or on any terms at all. Our strategy of staggering the maturities of our mortgage portfolio attempts to mitigate our exposure to excessive amounts of debt maturing in any one year. At March 31, 2015, we had a floating rate bank credit facility of $1 billion which matures in January 2018 with two six-month extension options. The facility also features an accordion option through which we can draw an additional $250 million with the consent of the lenders. Additionally, one of our subsidiaries has bilateral agreements with a number of Canadian chartered banks for an aggregate floating rate bank credit facility of C$280 million, the terms of which extend to August 2018. At March 31, 2015, the balances drawn on these facilities were $959 million net of transaction costs of $5 million. Approximately 48% of our outstanding commercial property and corporate debt at March 31, 2015 is floating rate debt (December 31, 2014 – 47%) and subject to fluctuations in interest rates. The effect of a 100-basis point increase in interest rates on interest expense relating to our floating rate debt, up to 5% LIBOR, is an increase in interest expense of $69 million on an annual basis. In addition, there is interest rate risk associated with the company’s fixed rate debt due to the expected requirement to refinance such debts in the year of maturity. The exposure to interest rates on fixed rate debt that is maturing in the near term, which we define as three years, totals $2,884 million based on the amount of debt at maturity. We also have exposure to interest rates within our equity accounted investments. As discussed in the Derivative Financial Instruments section beginning on page 42, we have mitigated, to some extent, the exposure to interest rate fluctuations on variable rate debt and near term maturities of fixed rate debt through interest rate derivative contracts. This analysis does not reflect the impact a changing interest rate environment could have on our overall performance and, as a result, it does not reflect the actions management may take in such an environment. We currently have a level of indebtedness of 46% of the fair market value of our commercial properties based on March 31, 2015 commercial property valuations (December 31, 2014 – 47%). This level of indebtedness is considered by the company to be conservative given the lending parameters currently existing in the real estate marketplace and the fair market value of our commercial properties. Based on this, the company believes that all debts will be financed or refinanced as they come due in the foreseeable future.
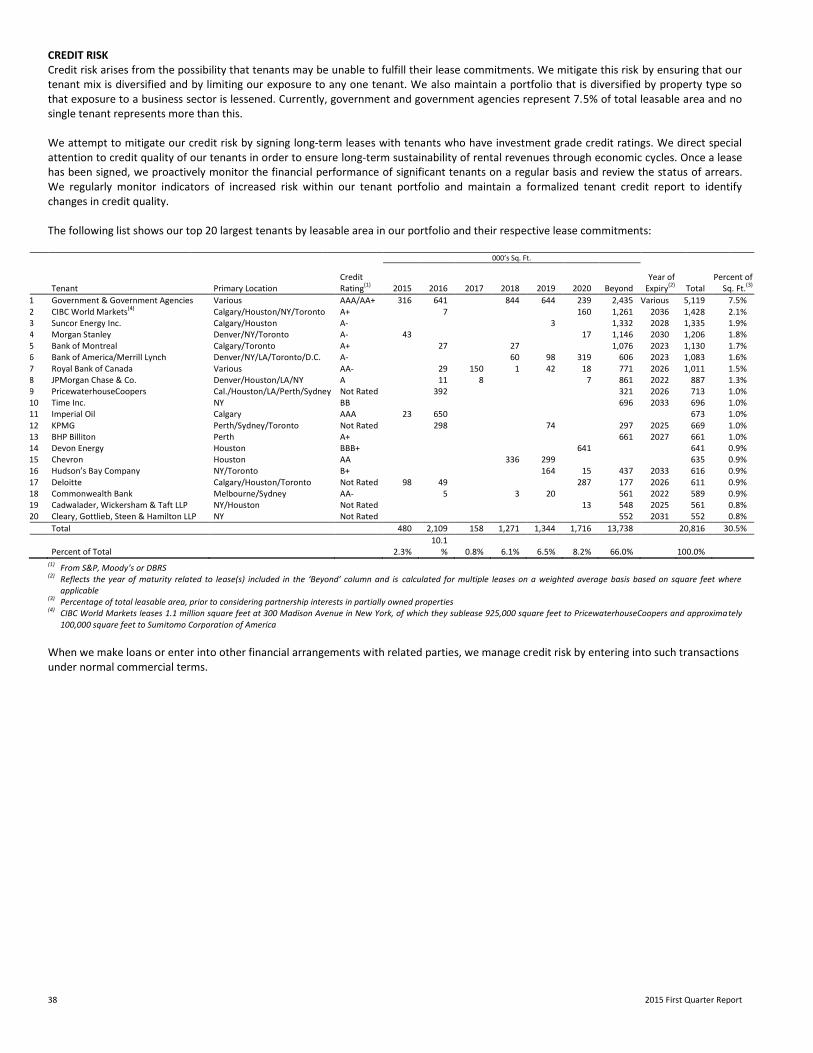
38 2015 First Quarter Report
CREDIT RISK Credit risk arises from the possibility that tenants may be unable to fulfill their lease commitments. We mitigate this risk by ensuring that our tenant mix is diversified and by limiting our exposure to any one tenant. We also maintain a portfolio that is diversified by property type so that exposure to a business sector is lessened. Currently, government and government agencies represent 7.5% of total leasable area and no single tenant represents more than this. We attempt to mitigate our credit risk by signing long-term leases with tenants who have investment grade credit ratings. We direct special attention to credit quality of our tenants in order to ensure long-term sustainability of rental revenues through economic cycles. Once a lease has been signed, we proactively monitor the financial performance of significant tenants on a regular basis and review the status of arrears. We regularly monitor indicators of increased risk within our tenant portfolio and maintain a formalized tenant credit report to identify changes in credit quality. The following list shows our top 20 largest tenants by leasable area in our portfolio and their respective lease commitments:
000’s Sq. Ft.
Tenant Primary Location Credit Rating(1) 2015 2016 2017 2018 2019 2020 Beyond
Year of Expiry(2) Total
Percent of Sq. Ft.(3)
1 Government & Government Agencies Various AAA/AA+ 316 641 844 644 239 2,435 Various 5,119 7.5% 2 CIBC World Markets
(4) Calgary/Houston/NY/Toronto A+ 7 160 1,261 2036 1,428 2.1%
3 Suncor Energy Inc. Calgary/Houston A- 3 1,332 2028 1,335 1.9% 4 Morgan Stanley Denver/NY/Toronto A- 43 17 1,146 2030 1,206 1.8% 5 Bank of Montreal Calgary/Toronto A+ 27 27 1,076 2023 1,130 1.7% 6 Bank of America/Merrill Lynch Denver/NY/LA/Toronto/D.C. A- 60 98 319 606 2023 1,083 1.6% 7 Royal Bank of Canada Various AA- 29 150 1 42 18 771 2026 1,011 1.5% 8 JPMorgan Chase & Co. Denver/Houston/LA/NY A 11 8 7 861 2022 887 1.3% 9 PricewaterhouseCoopers Cal./Houston/LA/Perth/Sydney Not Rated 392 321 2026 713 1.0% 10 Time Inc. NY BB 696 2033 696 1.0% 11 Imperial Oil Calgary AAA 23 650 673 1.0% 12 KPMG Perth/Sydney/Toronto Not Rated 298 74 297 2025 669 1.0% 13 BHP Billiton Perth A+ 661 2027 661 1.0% 14 Devon Energy Houston BBB+ 641 641 0.9% 15 Chevron Houston AA 336 299 635 0.9% 16 Hudson’s Bay Company NY/Toronto B+ 164 15 437 2033 616 0.9% 17 Deloitte Calgary/Houston/Toronto Not Rated 98 49 287 177 2026 611 0.9% 18 Commonwealth Bank Melbourne/Sydney AA- 5 3 20 561 2022 589 0.9% 19 Cadwalader, Wickersham & Taft LLP NY/Houston Not Rated 13 548 2025 561 0.8% 20 Cleary, Gottlieb, Steen & Hamilton LLP NY Not Rated 552 2031 552 0.8%
Total 480 2,109 158 1,271 1,344 1,716 13,738 20,816 30.5%
Percent of Total
2.3%
10.1% 0.8% 6.1% 6.5% 8.2% 66.0% 100.0%
(1) From S&P, Moody’s or DBRS
(2) Reflects the year of maturity related to lease(s) included in the ‘Beyond’ column and is calculated for multiple leases on a weighted average basis based on square feet where applicable
(3) Percentage of total leasable area, prior to considering partnership interests in partially owned properties (4) CIBC World Markets leases 1.1 million square feet at 300 Madison Avenue in New York, of which they sublease 925,000 square feet to PricewaterhouseCoopers and approximately
100,000 square feet to Sumitomo Corporation of America
When we make loans or enter into other financial arrangements with related parties, we manage credit risk by entering into such transactions under normal commercial terms.
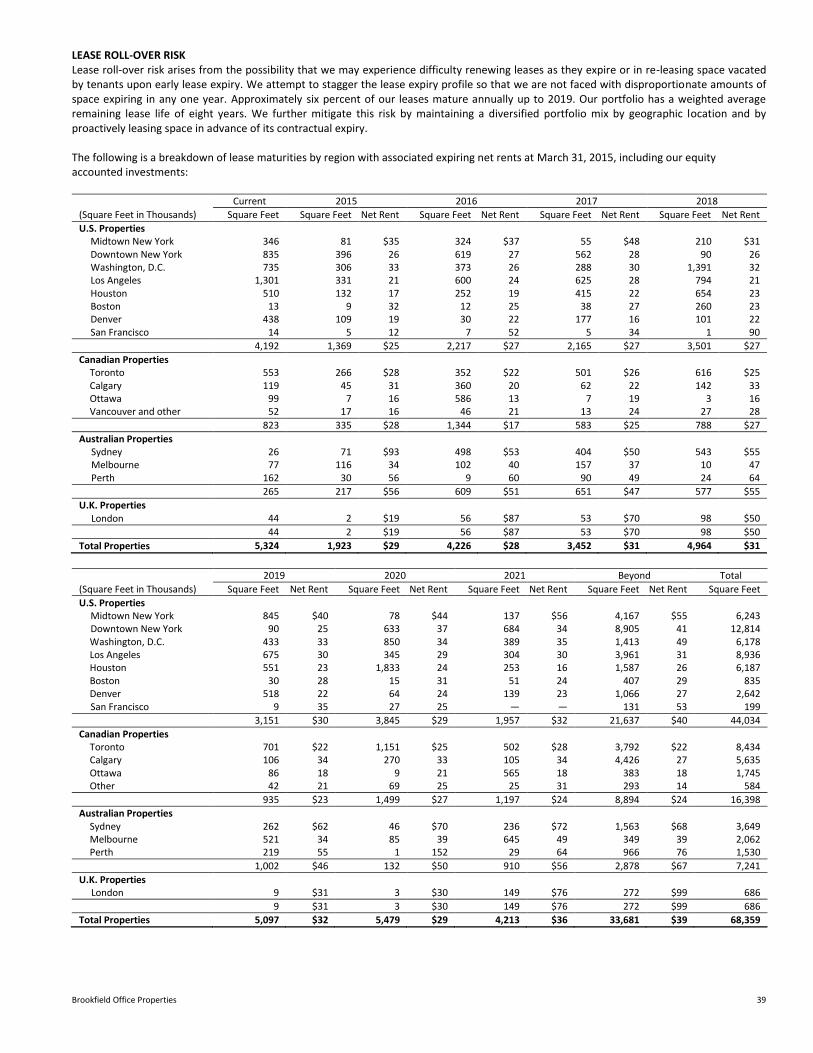
Brookfield Office Properties 39
LEASE ROLL-OVER RISK Lease roll-over risk arises from the possibility that we may experience difficulty renewing leases as they expire or in re-leasing space vacated by tenants upon early lease expiry. We attempt to stagger the lease expiry profile so that we are not faced with disproportionate amounts of space expiring in any one year. Approximately six percent of our leases mature annually up to 2019. Our portfolio has a weighted average remaining lease life of eight years. We further mitigate this risk by maintaining a diversified portfolio mix by geographic location and by proactively leasing space in advance of its contractual expiry. The following is a breakdown of lease maturities by region with associated expiring net rents at March 31, 2015, including our equity accounted investments:
Current 2015 2016 2017 2018
(Square Feet in Thousands) Square Feet Square Feet Net Rent Square Feet Net Rent Square Feet Net Rent Square Feet Net Rent
U.S. Properties Midtown New York 346 81 $35 324 $37 55 $48 210 $31 Downtown New York 835 396 26 619 27 562 28 90 26 Washington, D.C. 735 306 33 373 26 288 30 1,391 32 Los Angeles 1,301 331 21 600 24 625 28 794 21 Houston 510 132 17 252 19 415 22 654 23 Boston 13 9 32 12 25 38 27 260 23 Denver 438 109 19 30 22 177 16 101 22 San Francisco 14 5 12 7 52 5 34 1 90
4,192 1,369 $25 2,217 $27 2,165 $27 3,501 $27
Canadian Properties Toronto 553 266 $28 352 $22 501 $26 616 $25 Calgary 119 45 31 360 20 62 22 142 33 Ottawa 99 7 16 586 13 7 19 3 16 Vancouver and other 52 17 16 46 21 13 24 27 28
823 335 $28 1,344 $17 583 $25 788 $27
Australian Properties Sydney 26 71 $93 498 $53 404 $50 543 $55 Melbourne 77 116 34 102 40 157 37 10 47 Perth 162 30 56 9 60 90 49 24 64
265 217 $56 609 $51 651 $47 577 $55
U.K. Properties London 44 2 $19 56 $87 53 $70 98 $50
44 2 $19 56 $87 53 $70 98 $50
Total Properties 5,324 1,923 $29 4,226 $28 3,452 $31 4,964 $31
2019 2020 2021 Beyond Total
(Square Feet in Thousands) Square Feet Net Rent Square Feet Net Rent Square Feet Net Rent Square Feet Net Rent Square Feet
U.S. Properties Midtown New York 845 $40 78 $44 137 $56 4,167 $55 6,243 Downtown New York 90 25 633 37 684 34 8,905 41 12,814 Washington, D.C. 433 33 850 34 389 35 1,413 49 6,178 Los Angeles 675 30 345 29 304 30 3,961 31 8,936 Houston 551 23 1,833 24 253 16 1,587 26 6,187 Boston 30 28 15 31 51 24 407 29 835 Denver 518 22 64 24 139 23 1,066 27 2,642 San Francisco 9 35 27 25 ― ― 131 53 199
3,151 $30 3,845 $29 1,957 $32 21,637 $40 44,034
Canadian Properties Toronto 701 $22 1,151 $25 502 $28 3,792 $22 8,434 Calgary 106 34 270 33 105 34 4,426 27 5,635 Ottawa 86 18 9 21 565 18 383 18 1,745 Other 42 21 69 25 25 31 293 14 584
935 $23 1,499 $27 1,197 $24 8,894 $24 16,398
Australian Properties Sydney 262 $62 46 $70 236 $72 1,563 $68 3,649 Melbourne 521 34 85 39 645 49 349 39 2,062 Perth 219 55 1 152 29 64 966 76 1,530
1,002 $46 132 $50 910 $56 2,878 $67 7,241
U.K. Properties London 9 $31 3 $30 149 $76 272 $99 686
9 $31 3 $30 149 $76 272 $99 686
Total Properties 5,097 $32 5,479 $29 4,213 $36 33,681 $39 68,359
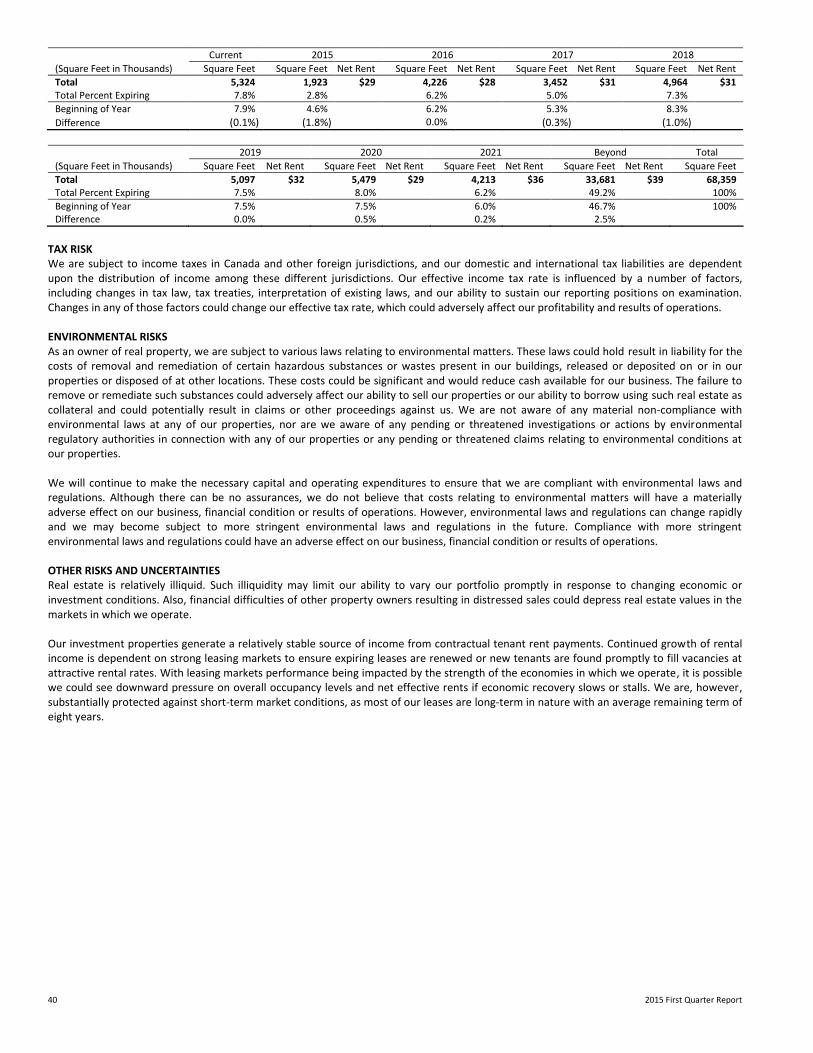
40 2015 First Quarter Report
Current 2015 2016 2017 2018
(Square Feet in Thousands) Square Feet Square Feet Net Rent Square Feet Net Rent Square Feet Net Rent Square Feet Net Rent
Total 5,324 1,923 $29 4,226 $28 3,452 $31 4,964 $31 Total Percent Expiring 7.8% 2.8% 6.2% 5.0% 7.3%
Beginning of Year 7.9% 4.6% 6.2% 5.3% 8.3%
Difference (0.1%) (1.8%) 0.0% (0.3%) (1.0%)
2019 2020 2021 Beyond Total
(Square Feet in Thousands) Square Feet Net Rent Square Feet Net Rent Square Feet Net Rent Square Feet Net Rent Square Feet
Total 5,097 $32 5,479 $29 4,213 $36 33,681 $39 68,359 Total Percent Expiring 7.5% 8.0% 6.2% 49.2% 100%
Beginning of Year 7.5% 7.5% 6.0% 46.7% 100% Difference 0.0% 0.5% 0.2% 2.5%
TAX RISK We are subject to income taxes in Canada and other foreign jurisdictions, and our domestic and international tax liabilities are dependent upon the distribution of income among these different jurisdictions. Our effective income tax rate is influenced by a number of factors, including changes in tax law, tax treaties, interpretation of existing laws, and our ability to sustain our reporting positions on examination. Changes in any of those factors could change our effective tax rate, which could adversely affect our profitability and results of operations. ENVIRONMENTAL RISKS As an owner of real property, we are subject to various laws relating to environmental matters. These laws could hold result in liability for the costs of removal and remediation of certain hazardous substances or wastes present in our buildings, released or deposited on or in our properties or disposed of at other locations. These costs could be significant and would reduce cash available for our business. The failure to remove or remediate such substances could adversely affect our ability to sell our properties or our ability to borrow using such real estate as collateral and could potentially result in claims or other proceedings against us. We are not aware of any material non-compliance with environmental laws at any of our properties, nor are we aware of any pending or threatened investigations or actions by environmental regulatory authorities in connection with any of our properties or any pending or threatened claims relating to environmental conditions at our properties. We will continue to make the necessary capital and operating expenditures to ensure that we are compliant with environmental laws and regulations. Although there can be no assurances, we do not believe that costs relating to environmental matters will have a materially adverse effect on our business, financial condition or results of operations. However, environmental laws and regulations can change rapidly and we may become subject to more stringent environmental laws and regulations in the future. Compliance with more stringent environmental laws and regulations could have an adverse effect on our business, financial condition or results of operations. OTHER RISKS AND UNCERTAINTIES Real estate is relatively illiquid. Such illiquidity may limit our ability to vary our portfolio promptly in response to changing economic or investment conditions. Also, financial difficulties of other property owners resulting in distressed sales could depress real estate values in the markets in which we operate. Our investment properties generate a relatively stable source of income from contractual tenant rent payments. Continued growth of rental income is dependent on strong leasing markets to ensure expiring leases are renewed or new tenants are found promptly to fill vacancies at attractive rental rates. With leasing markets performance being impacted by the strength of the economies in which we operate, it is possible we could see downward pressure on overall occupancy levels and net effective rents if economic recovery slows or stalls. We are, however, substantially protected against short-term market conditions, as most of our leases are long-term in nature with an average remaining term of eight years.
Brookfield Office Properties 41
INSURANCE RISKS United States We maintain insurance on our properties in amounts and with deductibles that we believe are in line with what owners of similar properties carry. We maintain all risk property insurance and rental value coverage (including coverage for the perils of flood, earthquake and weather catastrophe). Our all risk policy limit is $2.5 billion per occurrence. Our earthquake limit is $300 million per occurrence and in the annual aggregate for our California properties and a separate $300 million per occurrence and annual aggregate limit for all other U.S. properties. This coverage is subject to a deductible of 5% of the value of the affected property for California locations and $100,000 for all other locations. The weather catastrophe limit is $300 million per occurrence and subject to a deductible of 3% of the value of the affected property for U.S. locations located in traditional windstorm-exposed areas. All other locations are subject to a $50,000 deductible. The flood limit is $300 million per occurrence and in the annual aggregate subject to a deductible of $50,000 per occurrence, with the exception of five insurers that have a deductible equal to 5% of the total insured values subject to a minimum of $1,000,000 and a maximum of $5,000,000 for those locations within a Special Flood Hazard Area. Where properties are insured by our partners, all risk property insurance and rental value coverage is provided with limits that we believe are in line with what owners of similar properties carry. The Terrorism Risk Insurance Act (“TRIA”) was enacted in November 2002 in response to the uncertainty surrounding the insurance market in the aftermath of the terrorist attacks of September 11, 2001, and provides protection for “certified acts” as defined by the statute. TRIA mandates that insurance carriers offer insurance covering physical damage from terrorist incidents as certified by the U.S. Secretary of the Treasury, in consultation with the Secretary of Homeland Security and the U.S. Attorney. The Terrorism Risk Insurance Program Reauthorization Act of 2007 was signed into law on December 26, 2007 and extended the TRIA program through December 2014. The Terrorism Risk Insurance Program Reauthorization Act of 2015 was signed into law on January 12, 2015 and extended the program through December 31, 2020. With respect to our U.S. properties (including our U.S. Office Fund and DTLA), in October 2008, we formed a segregated cell captive facility, Liberty IC Casualty, LLC (“Liberty”). Liberty provides $4.0 billion of TRIA coverage for all U.S. properties. In 2009 we formed a second segregated cell captive facility, Liberty IC Casualty II, LLC (“Liberty II”). Liberty II provides protection against losses due solely to nuclear, biological, chemical or radioactive contamination arising out of a certified terrorist act. In the event of a covered loss in 2015, we expect Liberty II to recover 85% of its losses, less certain deductibles, from the United States government with the remaining 15% to be funded by us. Commencing in 2016 through 2020, Liberty and Liberty II will be required to fund for an additional 1% increase of covered losses in January of each year, due to the changes in the Terrorism Risk Insurance Program Reauthorization Act (“TRIPRA”) program requirements. Canada We maintain insurance on our properties in amounts and with deductibles that we believe are in line with what owners of similar properties carry. We maintain all risk property insurance and rental value coverage (including coverage for the perils of flood, earthquake and windstorm). Our all risk policy limit is C$1.5 billion per occurrence. Our earthquake limit is C$500 million per occurrence and in the annual aggregate. This coverage is subject to a C$100,000 deductible for all locations except for British Columbia where the deductible is 3% of the values for all locations where the physical loss, damage or destruction occurred. The flood limit is C$500 million per occurrence and in the annual aggregate, and is subject to a deductible of C$25,000 for all losses arising from the same occurrence. Windstorm is included under the all risk coverage limit of C$1.5 billion. With respect to our Canadian properties, we purchase an insurance policy that covers acts of terrorism for limits up to C$1.5 billion. Australia We maintain insurance on our properties in amounts and with deductibles that we believe are in line with what owners of similar properties carry. We maintain all risk property insurance and rental value coverage (including coverage for the perils of flood, earthquake and weather catastrophe). Our all risk policy limit (including flood and weather catastrophe) is A$1.9 billion per occurrence. Our earthquake limit is also included up to the policy limit. Earthquake coverage in Australia is subject to a deductible of 1% of the values at the location where the damage occurs. Where properties are insured by our partners, all risk property insurance and rental value coverage is provided with limits that we believe are in line with what owners of similar properties carry. Terrorism insurance is provided through the Australian Reinsurance Pool Corporation (“ARPC”). ARPC is a statutory corporation established under the Terrorism Insurance Act 2003 to offer reinsurance for terrorism risk in Australia. The Terrorism Insurance Act 2003 renders terrorism exclusion clauses in eligible insurance contracts ineffective in relation to loss or liabilities arising from a declared terrorist incident affecting eligible property located in Australia. United Kingdom We maintain insurance on our properties in amounts and with deductibles that we believe are in line with what owners of similar properties carry. We maintain all risk property insurance and rental value coverage up to the replacement cost value of the asset. Flood, earthquake, wind and terrorism coverage is included in the coverage provided all subject to a £250 deductible.
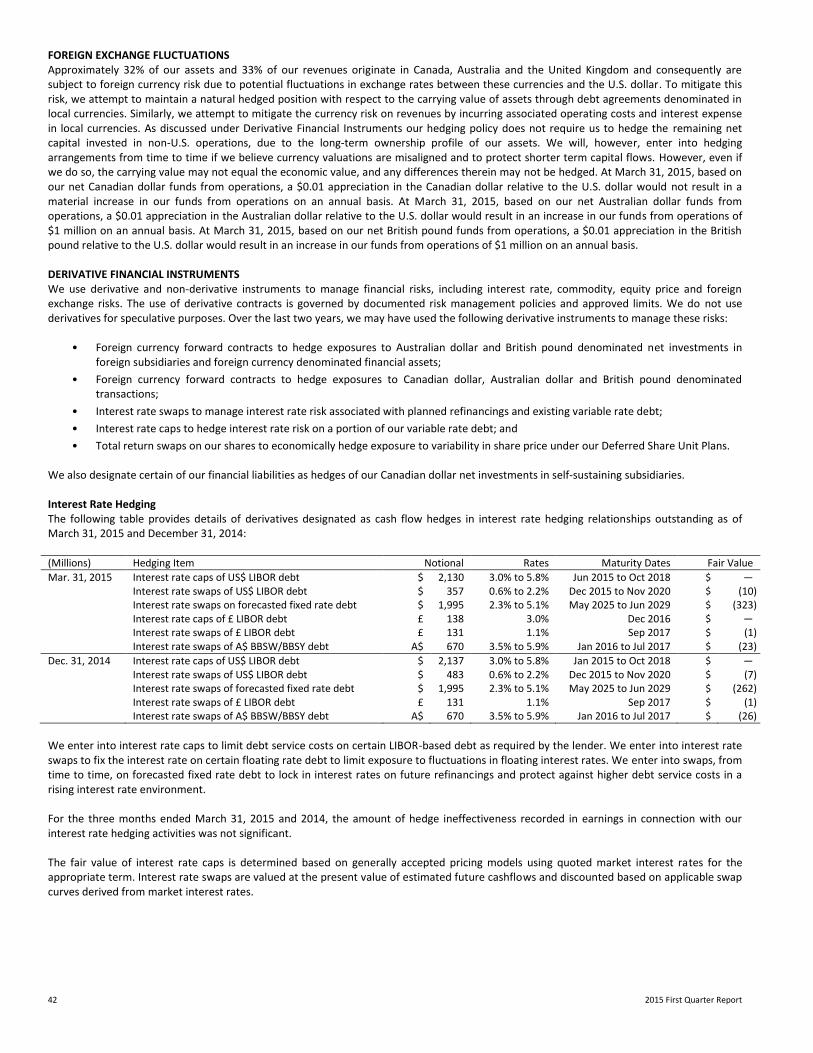
42 2015 First Quarter Report
FOREIGN EXCHANGE FLUCTUATIONS Approximately 32% of our assets and 33% of our revenues originate in Canada, Australia and the United Kingdom and consequently are subject to foreign currency risk due to potential fluctuations in exchange rates between these currencies and the U.S. dollar. To mitigate this risk, we attempt to maintain a natural hedged position with respect to the carrying value of assets through debt agreements denominated in local currencies. Similarly, we attempt to mitigate the currency risk on revenues by incurring associated operating costs and interest expense in local currencies. As discussed under Derivative Financial Instruments our hedging policy does not require us to hedge the remaining net capital invested in non-U.S. operations, due to the long-term ownership profile of our assets. We will, however, enter into hedging arrangements from time to time if we believe currency valuations are misaligned and to protect shorter term capital flows. However, even if we do so, the carrying value may not equal the economic value, and any differences therein may not be hedged. At March 31, 2015, based on our net Canadian dollar funds from operations, a $0.01 appreciation in the Canadian dollar relative to the U.S. dollar would not result in a material increase in our funds from operations on an annual basis. At March 31, 2015, based on our net Australian dollar funds from operations, a $0.01 appreciation in the Australian dollar relative to the U.S. dollar would result in an increase in our funds from operations of $1 million on an annual basis. At March 31, 2015, based on our net British pound funds from operations, a $0.01 appreciation in the British pound relative to the U.S. dollar would result in an increase in our funds from operations of $1 million on an annual basis. DERIVATIVE FINANCIAL INSTRUMENTS We use derivative and non-derivative instruments to manage financial risks, including interest rate, commodity, equity price and foreign exchange risks. The use of derivative contracts is governed by documented risk management policies and approved limits. We do not use derivatives for speculative purposes. Over the last two years, we may have used the following derivative instruments to manage these risks:
• Foreign currency forward contracts to hedge exposures to Australian dollar and British pound denominated net investments in foreign subsidiaries and foreign currency denominated financial assets;
• Foreign currency forward contracts to hedge exposures to Canadian dollar, Australian dollar and British pound denominated transactions;
• Interest rate swaps to manage interest rate risk associated with planned refinancings and existing variable rate debt;
• Interest rate caps to hedge interest rate risk on a portion of our variable rate debt; and
• Total return swaps on our shares to economically hedge exposure to variability in share price under our Deferred Share Unit Plans. We also designate certain of our financial liabilities as hedges of our Canadian dollar net investments in self-sustaining subsidiaries. Interest Rate Hedging The following table provides details of derivatives designated as cash flow hedges in interest rate hedging relationships outstanding as of March 31, 2015 and December 31, 2014: (Millions) Hedging Item Notional Rates Maturity Dates Fair Value
Mar. 31, 2015 Interest rate caps of US$ LIBOR debt $ 2,130 3.0% to 5.8% Jun 2015 to Oct 2018 $ ― Interest rate swaps of US$ LIBOR debt $ 357 0.6% to 2.2% Dec 2015 to Nov 2020 $ (10) Interest rate swaps on forecasted fixed rate debt $ 1,995 2.3% to 5.1% May 2025 to Jun 2029 $ (323) Interest rate caps of £ LIBOR debt £ 138 3.0% Dec 2016 $ ―
Interest rate swaps of £ LIBOR debt £ 131 1.1% Sep 2017 $ (1) Interest rate swaps of A$ BBSW/BBSY debt A$ 670 3.5% to 5.9% Jan 2016 to Jul 2017 $ (23)
Dec. 31, 2014 Interest rate caps of US$ LIBOR debt $ 2,137 3.0% to 5.8% Jan 2015 to Oct 2018 $ ― Interest rate swaps of US$ LIBOR debt $ 483 0.6% to 2.2% Dec 2015 to Nov 2020 $ (7) Interest rate swaps of forecasted fixed rate debt $ 1,995 2.3% to 5.1% May 2025 to Jun 2029 $ (262) Interest rate swaps of £ LIBOR debt £ 131 1.1% Sep 2017 $ (1) Interest rate swaps of A$ BBSW/BBSY debt A$ 670 3.5% to 5.9% Jan 2016 to Jul 2017 $ (26)
We enter into interest rate caps to limit debt service costs on certain LIBOR-based debt as required by the lender. We enter into interest rate swaps to fix the interest rate on certain floating rate debt to limit exposure to fluctuations in floating interest rates. We enter into swaps, from time to time, on forecasted fixed rate debt to lock in interest rates on future refinancings and protect against higher debt service costs in a rising interest rate environment. For the three months ended March 31, 2015 and 2014, the amount of hedge ineffectiveness recorded in earnings in connection with our interest rate hedging activities was not significant. The fair value of interest rate caps is determined based on generally accepted pricing models using quoted market interest rates for the appropriate term. Interest rate swaps are valued at the present value of estimated future cashflows and discounted based on applicable swap curves derived from market interest rates.

Brookfield Office Properties 43
Foreign Currency Hedging We have derivatives designated as net investment hedges of our investments in foreign subsidiaries. As of March 31, 2015, we have hedged a net notional amount of A$576 million (December 31, 2014 – $725 million) at rates between A$1.28/US$ to A$1.33/US$ using foreign currency forward contracts maturing between April 2015 and February 2016. We also have hedged a notional amount of £129 million as of March 31, 2015 (December 31, 2014 – £79 million) at rates between £0.64/US$ to £0.65/US$ using foreign currency forward contracts maturing between September and October 2015. We also have designated Australian dollar foreign currency forwards and zero cost collars as net investment hedges. The hedges fix the exchange rate on a notional of A$550 million between A$1.22/US$ to A$1.47/US$ and mature in April 2016. In connection with these hedges ($4) million relating to the time value component of their valuation has been recorded in fair value gains (losses), net for the three months ended March 31, 2015 (2014 – nil). The fair value of our outstanding derivatives designated as net investment hedges was $13 million as of March 31, 2015 (December 31, 2014 – $10 million). At March 31, 2015, we have designated C$750 million (December 31, 2014 – C$900 million) of our Canadian dollar financial liabilities as hedges of our net investment in our Canadian operations. For the three months ended March 31, 2015 and 2014, the amount of hedge ineffectiveness recorded in earnings in connection with our foreign currency hedging activities was not significant.
44 2015 First Quarter Report
PART IV – CRITICAL ACCOUNTING POLICIES AND ESTIMATES
USE OF ESTIMATES The preparation of our financial statements requires management to make judgments, estimates and assumptions that affect the reported amounts of assets and liabilities, disclosure of contingent assets and liabilities at the date of the financial statements and the reported amounts of revenues and expenses during the reporting period. Our estimates are based on historical experience and on various other assumptions that are believed to be reasonable under the circumstances. The result of our ongoing evaluation of these estimates forms the basis for making judgments about the carrying values of assets and liabilities and the reported amounts of revenues and expenses that are not readily apparent from other sources. Actual results may differ from these estimates under different assumptions. RELATED PARTY TRANSACTIONS In the normal course of operations, we enter into various transactions on market terms with related parties, which have been measured at exchange value. The following table summarizes transactions and balances with BAM and its subsidiaries: Three months ended March 31 (Millions) 2015 2014
Transactions with related parties Commercial property revenue(1) $ 5 $ 3 Interest and other income 10 10 Interest expense 5 2 Management fees paid ― 4 Administrative expense(2) 7 13 Construction costs(3) 66 35
Mar. 31, 2015 Dec. 31, 2014
Balances outstanding to (from) related parties Participating loan interests $ 418 $ 426 Other non-current financial assets 642 683 Receivables and other assets 96 73 Commercial property debt (370) (397) Capital securities – corporate (86) (91) Other liabilities (210) (51) (1) Amounts received from BAM and its subsidiaries for the rental of office premises (2) Amounts paid to BAM and its subsidiaries for administrative services (3) Amounts paid to BAM and its subsidiaries for construction costs of development property
On February 18, 2015, FM Co., an associate of the company accounted for by the equity method, sold its interest in BJCA and BJCC to a subsidiary of BAM.
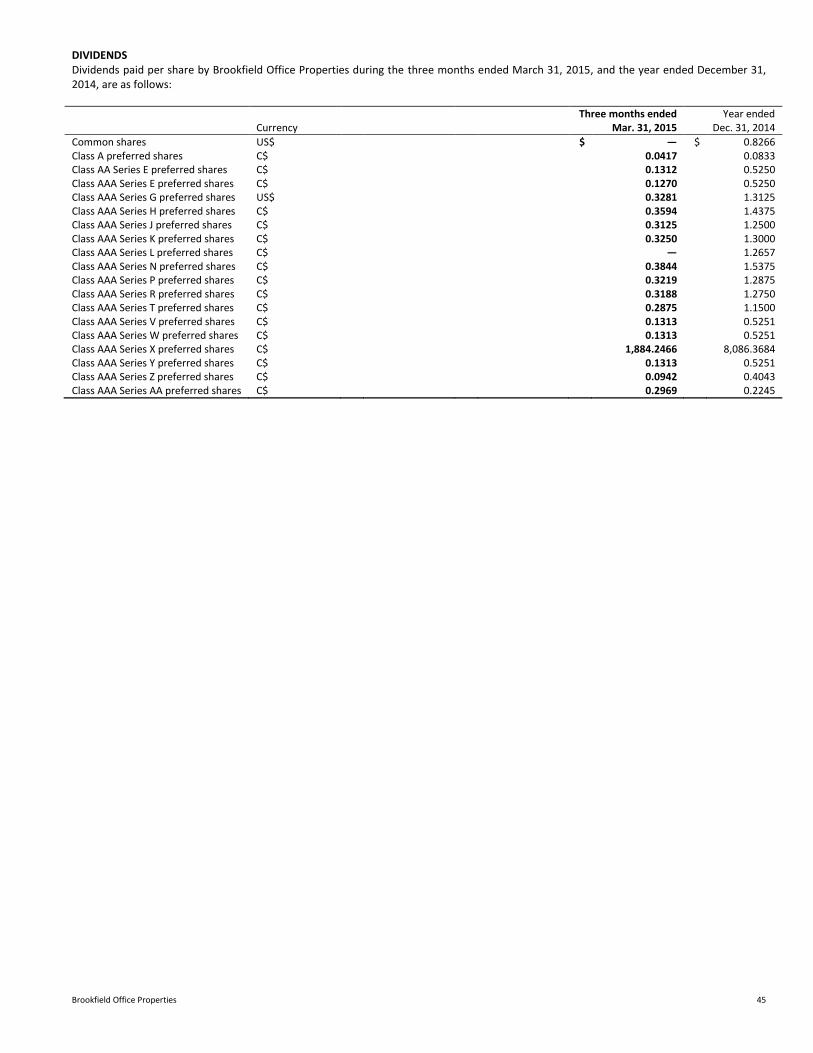
Brookfield Office Properties 45
DIVIDENDS Dividends paid per share by Brookfield Office Properties during the three months ended March 31, 2015, and the year ended December 31, 2014, are as follows: Three months ended Year ended Currency Mar. 31, 2015 Dec. 31, 2014
Common shares US$ $ ― $ 0.8266 Class A preferred shares C$ 0.0417 0.0833 Class AA Series E preferred shares C$ 0.1312 0.5250 Class AAA Series E preferred shares C$ 0.1270 0.5250 Class AAA Series G preferred shares US$ 0.3281 1.3125 Class AAA Series H preferred shares C$ 0.3594 1.4375 Class AAA Series J preferred shares C$ 0.3125 1.2500 Class AAA Series K preferred shares C$ 0.3250 1.3000 Class AAA Series L preferred shares C$ ― 1.2657 Class AAA Series N preferred shares C$ 0.3844 1.5375 Class AAA Series P preferred shares C$ 0.3219 1.2875 Class AAA Series R preferred shares C$ 0.3188 1.2750 Class AAA Series T preferred shares C$ 0.2875 1.1500 Class AAA Series V preferred shares C$ 0.1313 0.5251 Class AAA Series W preferred shares C$ 0.1313 0.5251 Class AAA Series X preferred shares C$ 1,884.2466 8,086.3684 Class AAA Series Y preferred shares C$ 0.1313 0.5251 Class AAA Series Z preferred shares C$ 0.0942 0.4043 Class AAA Series AA preferred shares C$ 0.2969 0.2245
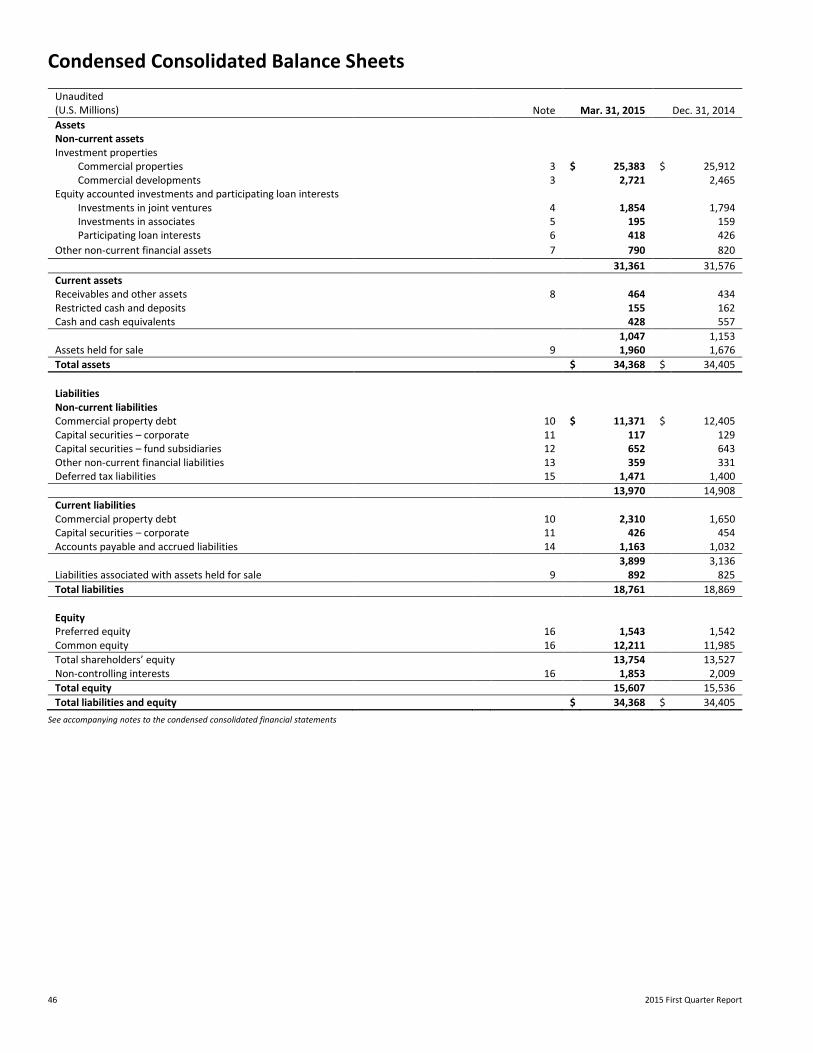
46 2015 First Quarter Report
Condensed Consolidated Balance Sheets
Unaudited (U.S. Millions) Note Mar. 31, 2015 Dec. 31, 2014
Assets Non-current assets Investment properties
Commercial properties 3 $ 25,383 $ 25,912 Commercial developments 3 2,721 2,465
Equity accounted investments and participating loan interests Investments in joint ventures 4 1,854 1,794 Investments in associates 5 195 159 Participating loan interests 6 418 426
Other non-current financial assets 7 790 820
31,361 31,576
Current assets Receivables and other assets 8 464 434 Restricted cash and deposits 155 162 Cash and cash equivalents 428 557
1,047 1,153 Assets held for sale 9 1,960 1,676
Total assets $ 34,368 $ 34,405
Liabilities Non-current liabilities Commercial property debt 10 $ 11,371 $ 12,405 Capital securities – corporate 11 117 129 Capital securities – fund subsidiaries 12 652 643 Other non-current financial liabilities 13 359 331 Deferred tax liabilities 15 1,471 1,400
13,970 14,908
Current liabilities Commercial property debt 10 2,310 1,650 Capital securities – corporate 11 426 454 Accounts payable and accrued liabilities 14 1,163 1,032
3,899 3,136 Liabilities associated with assets held for sale 9 892 825
Total liabilities 18,761 18,869
Equity Preferred equity 16 1,543 1,542 Common equity 16 12,211 11,985
Total shareholders’ equity 13,754 13,527 Non-controlling interests 16 1,853 2,009
Total equity 15,607 15,536
Total liabilities and equity $ 34,368 $ 34,405
See accompanying notes to the condensed consolidated financial statements
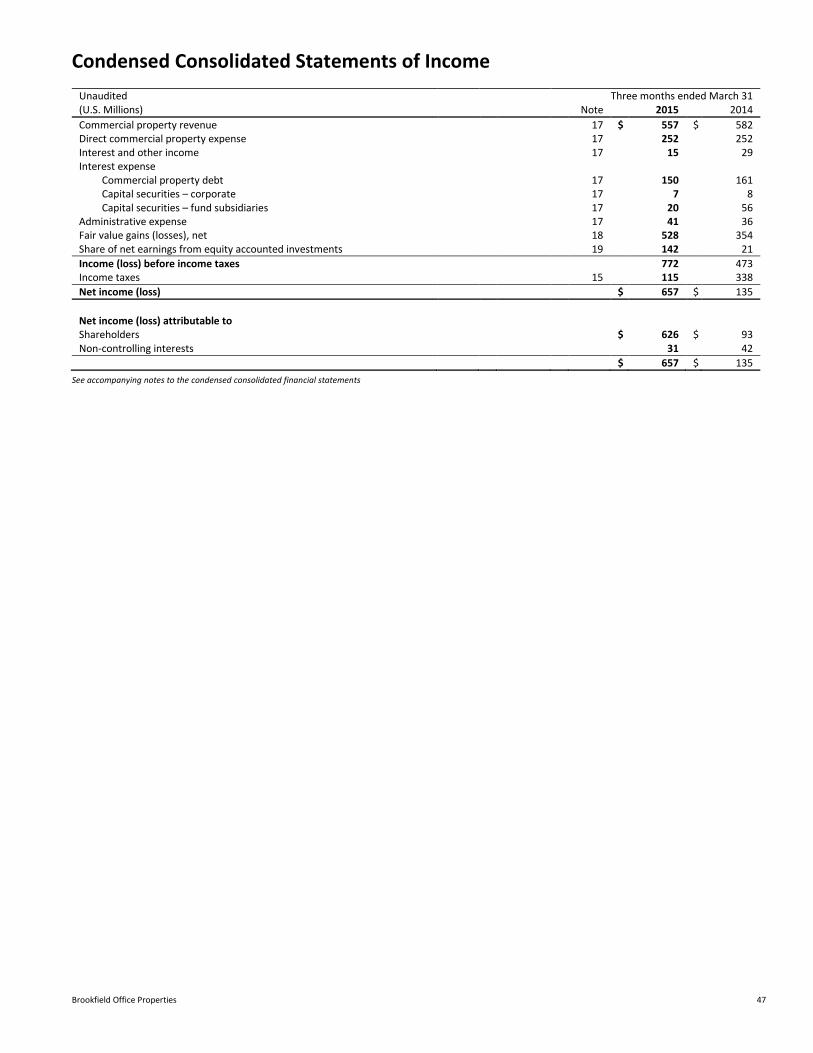
Brookfield Office Properties 47
Condensed Consolidated Statements of Income
Unaudited Three months ended March 31 (U.S. Millions) Note 2015 2014
Commercial property revenue 17 $ 557 $ 582 Direct commercial property expense 17 252 252 Interest and other income 17 15 29 Interest expense
Commercial property debt 17 150 161 Capital securities – corporate 17 7 8 Capital securities – fund subsidiaries 17 20 56
Administrative expense 17 41 36 Fair value gains (losses), net 18 528 354 Share of net earnings from equity accounted investments 19 142 21
Income (loss) before income taxes 772 473 Income taxes 15 115 338
Net income (loss) $ 657 $ 135
Net income (loss) attributable to Shareholders $ 626 $ 93 Non-controlling interests 31 42
$ 657 $ 135
See accompanying notes to the condensed consolidated financial statements
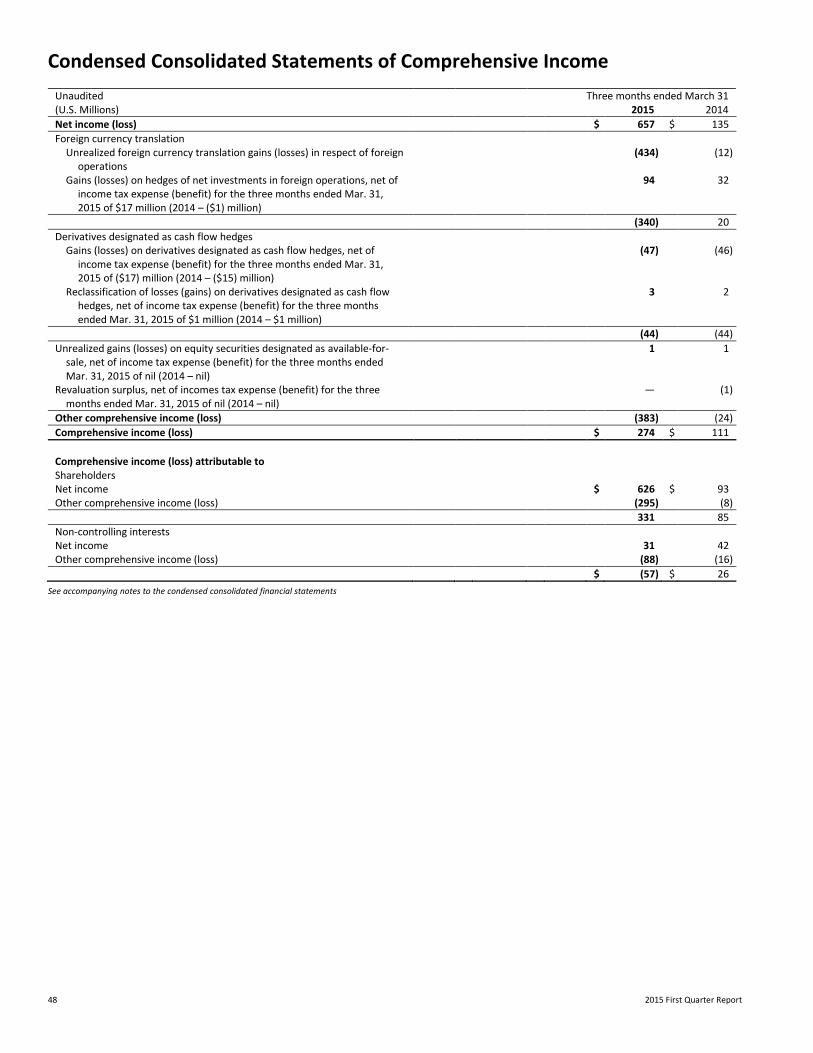
48 2015 First Quarter Report
Condensed Consolidated Statements of Comprehensive Income
Unaudited Three months ended March 31 (U.S. Millions) 2015 2014
Net income (loss) $ 657 $ 135
Foreign currency translation Unrealized foreign currency translation gains (losses) in respect of foreign
operations (434) (12)
Gains (losses) on hedges of net investments in foreign operations, net of income tax expense (benefit) for the three months ended Mar. 31, 2015 of $17 million (2014 – ($1) million)
94 32
(340) 20
Derivatives designated as cash flow hedges Gains (losses) on derivatives designated as cash flow hedges, net of
income tax expense (benefit) for the three months ended Mar. 31, 2015 of ($17) million (2014 – ($15) million)
(47) (46)
Reclassification of losses (gains) on derivatives designated as cash flow hedges, net of income tax expense (benefit) for the three months ended Mar. 31, 2015 of $1 million (2014 – $1 million)
3 2
(44) (44)
Unrealized gains (losses) on equity securities designated as available-for-sale, net of income tax expense (benefit) for the three months ended Mar. 31, 2015 of nil (2014 – nil)
1 1
Revaluation surplus, net of incomes tax expense (benefit) for the three months ended Mar. 31, 2015 of nil (2014 – nil)
― (1)
Other comprehensive income (loss) (383) (24)
Comprehensive income (loss) $ 274 $ 111
Comprehensive income (loss) attributable to Shareholders Net income $ 626 $ 93 Other comprehensive income (loss) (295) (8)
331 85
Non-controlling interests Net income 31 42 Other comprehensive income (loss) (88) (16)
$ (57) $ 26
See accompanying notes to the condensed consolidated financial statements
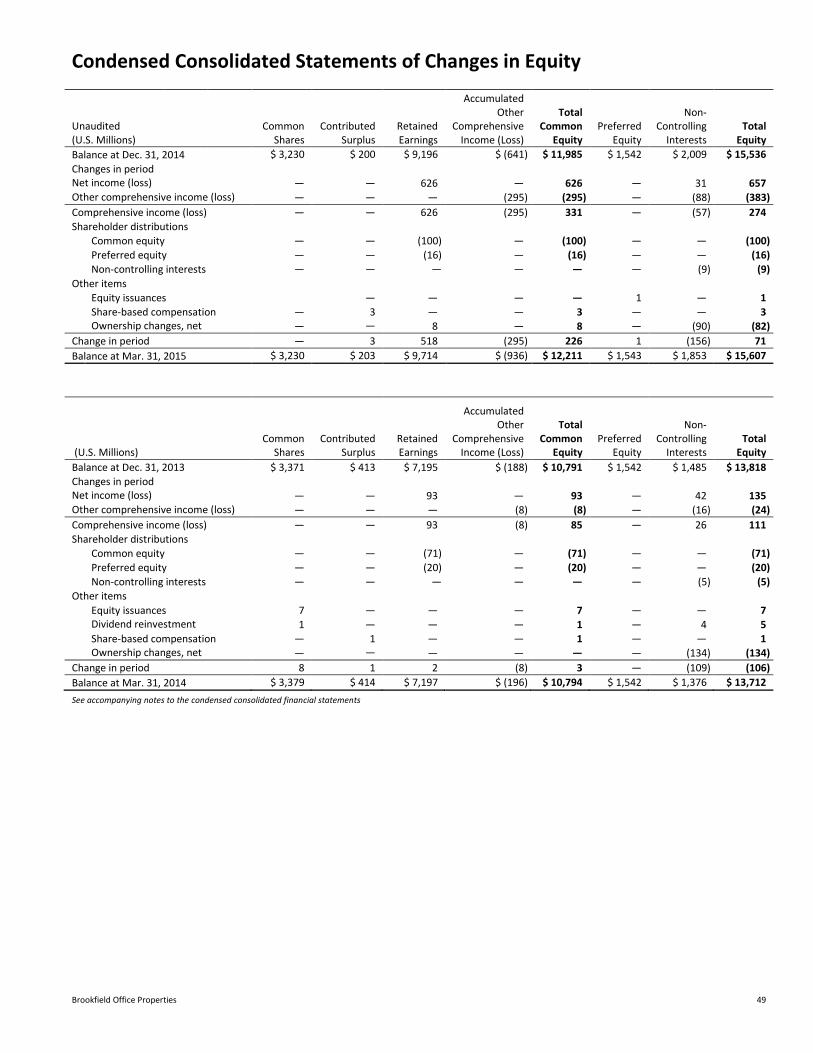
Brookfield Office Properties 49
Condensed Consolidated Statements of Changes in Equity
Unaudited (U.S. Millions)
Common Shares
Contributed Surplus
Retained Earnings
Accumulated Other
Comprehensive Income (Loss)
Total Common
Equity Preferred
Equity
Non-Controlling
Interests Total
Equity
Balance at Dec. 31, 2014 $ 3,230 $ 200 $ 9,196 $ (641) $ 11,985 $ 1,542 $ 2,009 $ 15,536
Changes in period Net income (loss) ― ― 626 ― 626 ― 31 657 Other comprehensive income (loss) ― ― ― (295) (295) ― (88) (383)
Comprehensive income (loss) ― ― 626 (295) 331 ― (57) 274
Shareholder distributions
Common equity ― ― (100) ― (100) ― ― (100)
Preferred equity ― ― (16) ― (16) ― ― (16)
Non-controlling interests ― ― ― ― ― ― (9) (9)
Other items
Equity issuances ― ― ― ― 1 ― 1
Share-based compensation ― 3 ― ― 3 ― ― 3 Ownership changes, net ― ― 8 ― 8 ― (90) (82)
Change in period ― 3 518 (295) 226 1 (156) 71
Balance at Mar. 31, 2015 $ 3,230 $ 203 $ 9,714 $ (936) $ 12,211 $ 1,543 $ 1,853 $ 15,607
(U.S. Millions) Common
Shares Contributed
Surplus Retained Earnings
Accumulated Other
Comprehensive Income (Loss)
Total Common
Equity Preferred
Equity
Non-Controlling
Interests Total
Equity
Balance at Dec. 31, 2013 $ 3,371 $ 413 $ 7,195 $ (188) $ 10,791 $ 1,542 $ 1,485 $ 13,818
Changes in period Net income (loss) ― ― 93 ― 93 ― 42 135 Other comprehensive income (loss) ― ― ― (8) (8) ― (16) (24)
Comprehensive income (loss) ― ― 93 (8) 85 ― 26 111
Shareholder distributions
Common equity ― ― (71) ― (71) ― ― (71)
Preferred equity ― ― (20) ― (20) ― ― (20)
Non-controlling interests ― ― ― ― ― ― (5) (5)
Other items
Equity issuances 7 ― ― ― 7 ― ― 7
Dividend reinvestment 1 ― ― ― 1 ― 4 5
Share-based compensation ― 1 ― ― 1 ― ― 1 Ownership changes, net ― ― ― ― ― ― (134) (134)
Change in period 8 1 2 (8) 3 ― (109) (106)
Balance at Mar. 31, 2014 $ 3,379 $ 414 $ 7,197 $ (196) $ 10,794 $ 1,542 $ 1,376 $ 13,712
See accompanying notes to the condensed consolidated financial statements
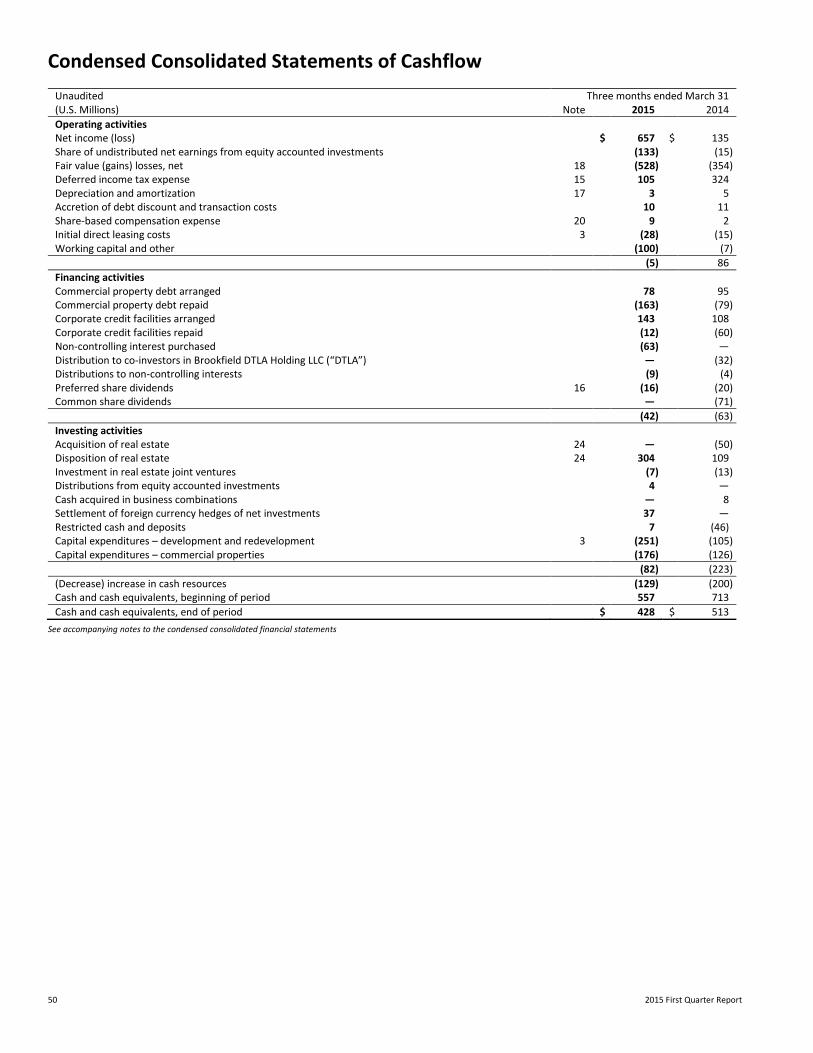
50 2015 First Quarter Report
Condensed Consolidated Statements of Cashflow
Unaudited Three months ended March 31 (U.S. Millions) Note 2015 2014
Operating activities Net income (loss) $ 657 $ 135 Share of undistributed net earnings from equity accounted investments (133) (15) Fair value (gains) losses, net 18 (528) (354) Deferred income tax expense 15 105 324 Depreciation and amortization 17 3 5 Accretion of debt discount and transaction costs 10 11 Share-based compensation expense 20 9 2 Initial direct leasing costs 3 (28) (15) Working capital and other (100) (7)
(5) 86
Financing activities Commercial property debt arranged 78 95 Commercial property debt repaid (163) (79) Corporate credit facilities arranged 143 108 Corporate credit facilities repaid (12) (60) Non-controlling interest purchased (63) ― Distribution to co-investors in Brookfield DTLA Holding LLC (“DTLA”) ― (32) Distributions to non-controlling interests (9) (4) Preferred share dividends 16 (16) (20) Common share dividends ― (71)
(42) (63)
Investing activities Acquisition of real estate 24 ― (50) Disposition of real estate 24 304 109 Investment in real estate joint ventures (7) (13) Distributions from equity accounted investments 4 ― Cash acquired in business combinations ― 8 Settlement of foreign currency hedges of net investments 37 ― Restricted cash and deposits 7 (46) Capital expenditures – development and redevelopment 3 (251) (105) Capital expenditures – commercial properties (176) (126)
(82) (223)
(Decrease) increase in cash resources (129) (200) Cash and cash equivalents, beginning of period 557 713
Cash and cash equivalents, end of period $ 428 $ 513
See accompanying notes to the condensed consolidated financial statements
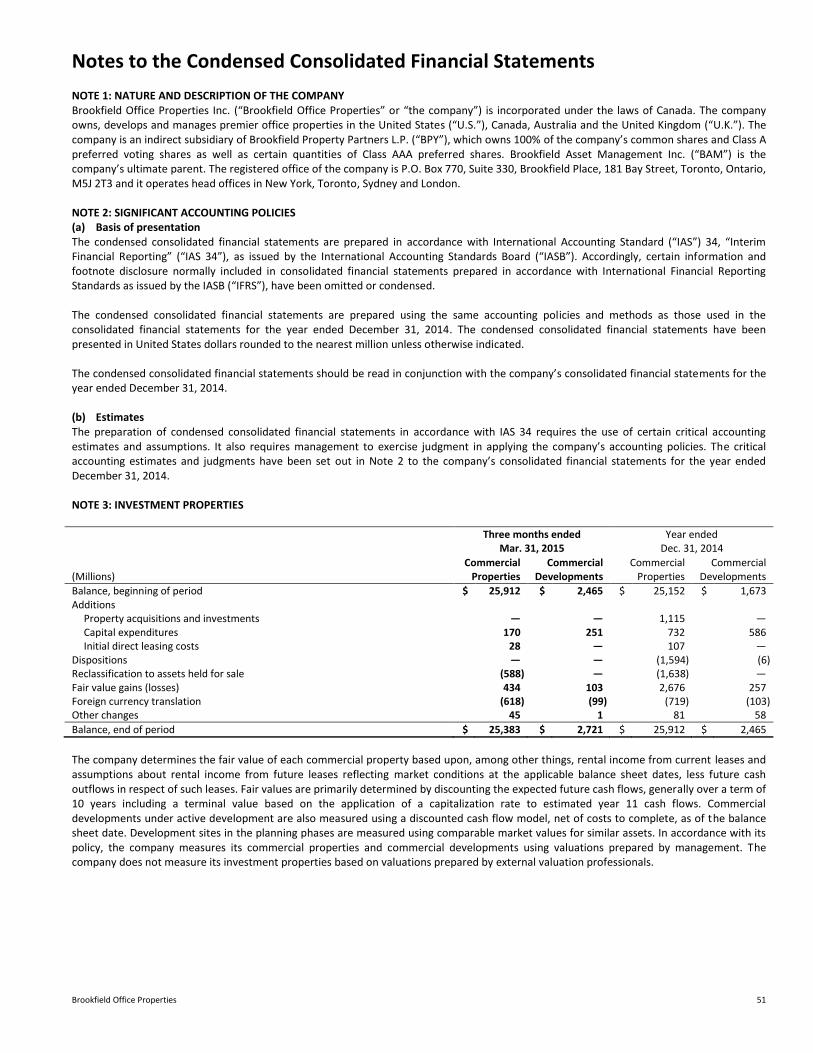
Brookfield Office Properties 51
Notes to the Condensed Consolidated Financial Statements NOTE 1: NATURE AND DESCRIPTION OF THE COMPANY Brookfield Office Properties Inc. (“Brookfield Office Properties” or “the company”) is incorporated under the laws of Canada. The company owns, develops and manages premier office properties in the United States (“U.S.”), Canada, Australia and the United Kingdom (“U.K.”). The company is an indirect subsidiary of Brookfield Property Partners L.P. (“BPY”), which owns 100% of the company’s common shares and Class A preferred voting shares as well as certain quantities of Class AAA preferred shares. Brookfield Asset Management Inc. (“BAM”) is the company’s ultimate parent. The registered office of the company is P.O. Box 770, Suite 330, Brookfield Place, 181 Bay Street, Toronto, Ontario, M5J 2T3 and it operates head offices in New York, Toronto, Sydney and London. NOTE 2: SIGNIFICANT ACCOUNTING POLICIES (a) Basis of presentation The condensed consolidated financial statements are prepared in accordance with International Accounting Standard (“IAS”) 34, “Interim Financial Reporting” (“IAS 34”), as issued by the International Accounting Standards Board (“IASB”). Accordingly, certain information and footnote disclosure normally included in consolidated financial statements prepared in accordance with International Financial Reporting Standards as issued by the IASB (“IFRS”), have been omitted or condensed. The condensed consolidated financial statements are prepared using the same accounting policies and methods as those used in the consolidated financial statements for the year ended December 31, 2014. The condensed consolidated financial statements have been presented in United States dollars rounded to the nearest million unless otherwise indicated. The condensed consolidated financial statements should be read in conjunction with the company’s consolidated financial statements for the year ended December 31, 2014. (b) Estimates The preparation of condensed consolidated financial statements in accordance with IAS 34 requires the use of certain critical accounting estimates and assumptions. It also requires management to exercise judgment in applying the company’s accounting policies. The critical accounting estimates and judgments have been set out in Note 2 to the company’s consolidated financial statements for the year ended December 31, 2014.
NOTE 3: INVESTMENT PROPERTIES
Three months ended Mar. 31, 2015
Year ended Dec. 31, 2014
Commercial Commercial Commercial Commercial (Millions) Properties Developments Properties Developments
Balance, beginning of period $ 25,912 $ 2,465 $ 25,152 $ 1,673 Additions
Property acquisitions and investments ― ― 1,115 ― Capital expenditures 170 251 732 586 Initial direct leasing costs 28 ― 107 ―
Dispositions ― ― (1,594) (6) Reclassification to assets held for sale (588) ― (1,638) ― Fair value gains (losses) 434 103 2,676 257 Foreign currency translation (618) (99) (719) (103) Other changes 45 1 81 58
Balance, end of period $ 25,383 $ 2,721 $ 25,912 $ 2,465
The company determines the fair value of each commercial property based upon, among other things, rental income from current leases and assumptions about rental income from future leases reflecting market conditions at the applicable balance sheet dates, less future cash outflows in respect of such leases. Fair values are primarily determined by discounting the expected future cash flows, generally over a term of 10 years including a terminal value based on the application of a capitalization rate to estimated year 11 cash flows. Commercial developments under active development are also measured using a discounted cash flow model, net of costs to complete, as of the balance sheet date. Development sites in the planning phases are measured using comparable market values for similar assets. In accordance with its policy, the company measures its commercial properties and commercial developments using valuations prepared by management. The company does not measure its investment properties based on valuations prepared by external valuation professionals.
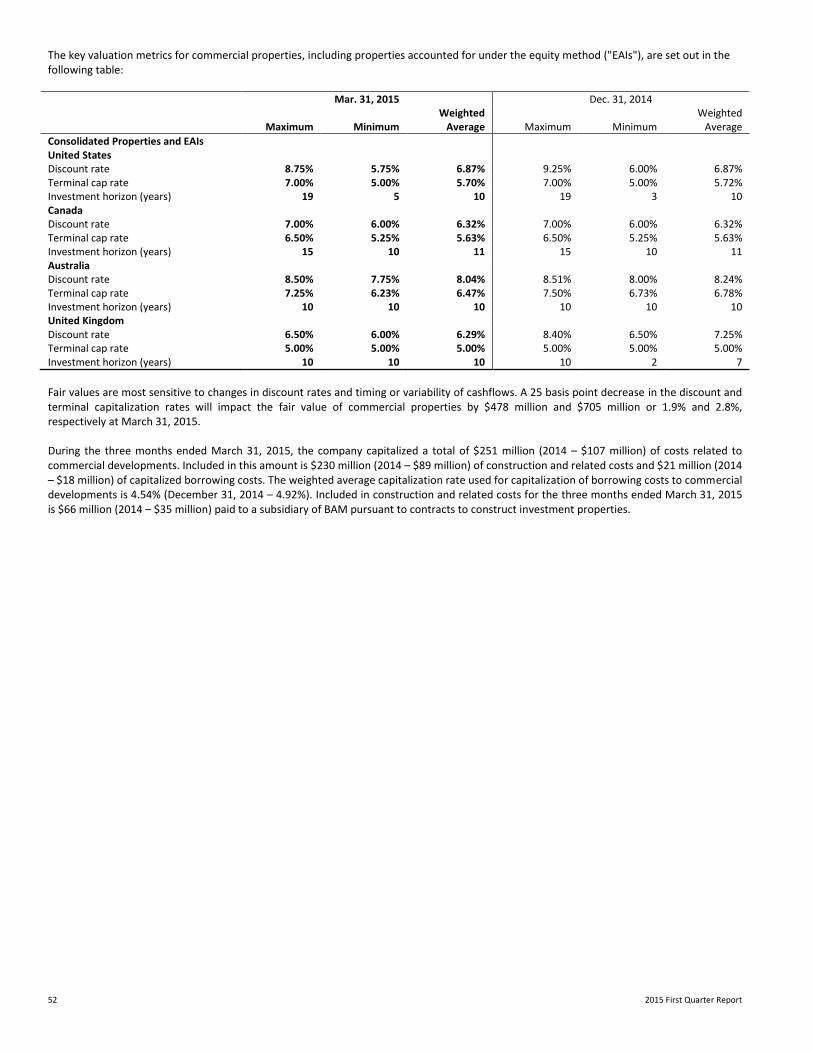
52 2015 First Quarter Report
The key valuation metrics for commercial properties, including properties accounted for under the equity method ("EAIs"), are set out in the following table: Mar. 31, 2015 Dec. 31, 2014
Maximum Minimum Weighted
Average Maximum Minimum Weighted
Average
Consolidated Properties and EAIs United States Discount rate 8.75% 5.75% 6.87% 9.25% 6.00% 6.87% Terminal cap rate 7.00% 5.00% 5.70% 7.00% 5.00% 5.72% Investment horizon (years) 19 5 10 19 3 10 Canada Discount rate 7.00% 6.00% 6.32% 7.00% 6.00% 6.32% Terminal cap rate 6.50% 5.25% 5.63% 6.50% 5.25% 5.63% Investment horizon (years) 15 10 11 15 10 11 Australia Discount rate 8.50% 7.75% 8.04% 8.51% 8.00% 8.24% Terminal cap rate 7.25% 6.23% 6.47% 7.50% 6.73% 6.78% Investment horizon (years) 10 10 10 10 10 10 United Kingdom Discount rate 6.50% 6.00% 6.29% 8.40% 6.50% 7.25% Terminal cap rate 5.00% 5.00% 5.00% 5.00% 5.00% 5.00% Investment horizon (years) 10 10 10 10 2 7
Fair values are most sensitive to changes in discount rates and timing or variability of cashflows. A 25 basis point decrease in the discount and terminal capitalization rates will impact the fair value of commercial properties by $478 million and $705 million or 1.9% and 2.8%, respectively at March 31, 2015. During the three months ended March 31, 2015, the company capitalized a total of $251 million (2014 – $107 million) of costs related to commercial developments. Included in this amount is $230 million (2014 – $89 million) of construction and related costs and $21 million (2014 – $18 million) of capitalized borrowing costs. The weighted average capitalization rate used for capitalization of borrowing costs to commercial developments is 4.54% (December 31, 2014 – 4.92%). Included in construction and related costs for the three months ended March 31, 2015 is $66 million (2014 – $35 million) paid to a subsidiary of BAM pursuant to contracts to construct investment properties.
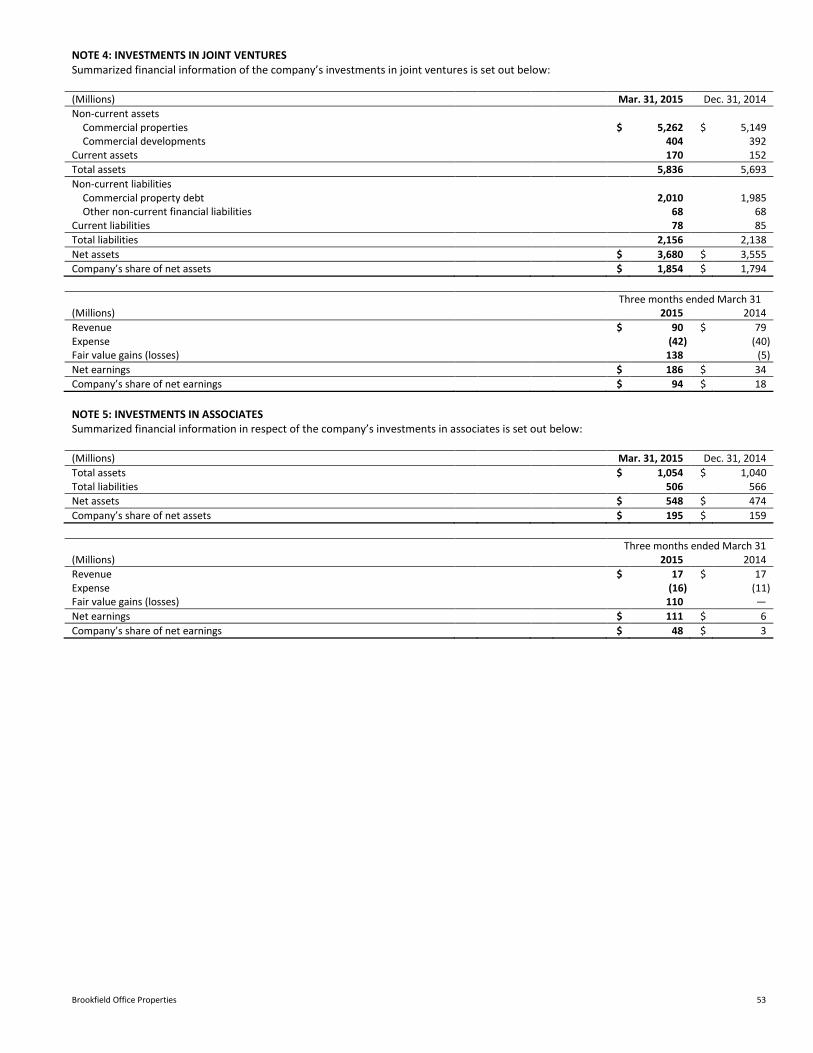
Brookfield Office Properties 53
NOTE 4: INVESTMENTS IN JOINT VENTURES Summarized financial information of the company’s investments in joint ventures is set out below: (Millions) Mar. 31, 2015 Dec. 31, 2014
Non-current assets Commercial properties $ 5,262 $ 5,149 Commercial developments 404 392
Current assets 170 152
Total assets 5,836 5,693
Non-current liabilities Commercial property debt 2,010 1,985 Other non-current financial liabilities 68 68
Current liabilities 78 85
Total liabilities 2,156 2,138
Net assets $ 3,680 $ 3,555
Company’s share of net assets $ 1,854 $ 1,794
Three months ended March 31 (Millions) 2015 2014
Revenue $ 90 $ 79 Expense (42) (40) Fair value gains (losses) 138 (5)
Net earnings $ 186 $ 34
Company’s share of net earnings $ 94 $ 18
NOTE 5: INVESTMENTS IN ASSOCIATES Summarized financial information in respect of the company’s investments in associates is set out below: (Millions) Mar. 31, 2015 Dec. 31, 2014
Total assets $ 1,054 $ 1,040 Total liabilities 506 566
Net assets $ 548 $ 474
Company’s share of net assets $ 195 $ 159
Three months ended March 31 (Millions) 2015 2014
Revenue $ 17 $ 17 Expense (16) (11) Fair value gains (losses) 110 ―
Net earnings $ 111 $ 6
Company’s share of net earnings $ 48 $ 3
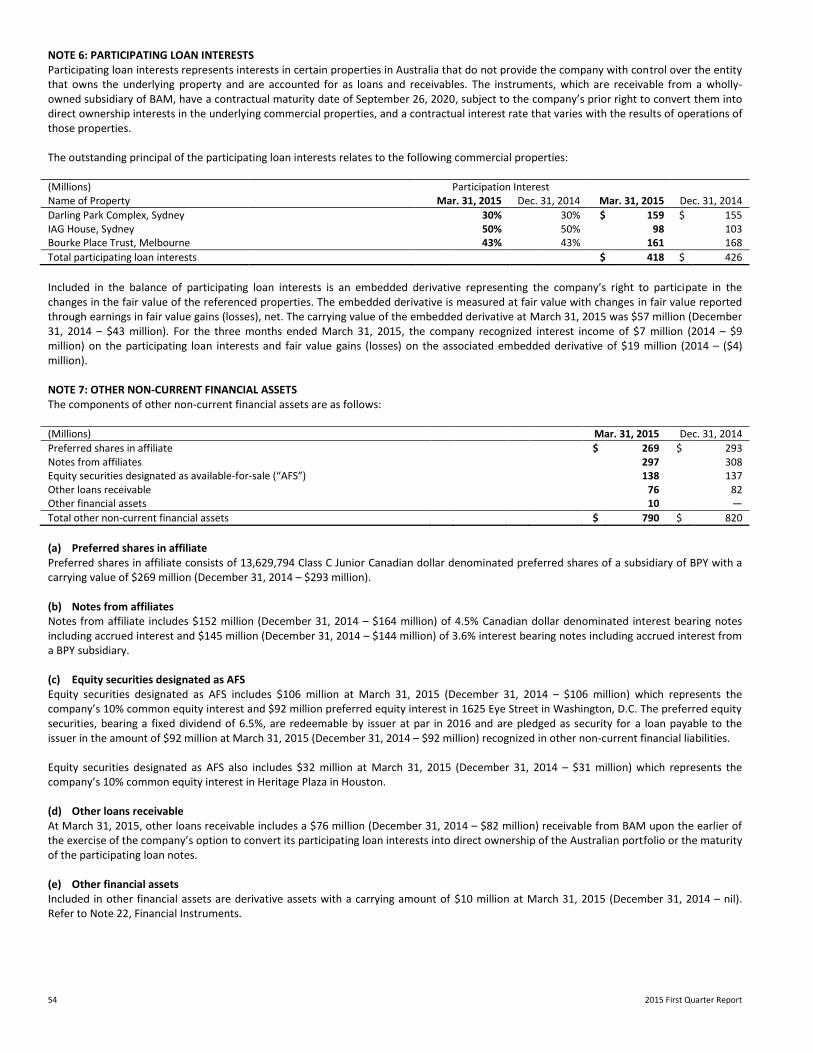
54 2015 First Quarter Report
NOTE 6: PARTICIPATING LOAN INTERESTS Participating loan interests represents interests in certain properties in Australia that do not provide the company with control over the entity that owns the underlying property and are accounted for as loans and receivables. The instruments, which are receivable from a wholly-owned subsidiary of BAM, have a contractual maturity date of September 26, 2020, subject to the company’s prior right to convert them into direct ownership interests in the underlying commercial properties, and a contractual interest rate that varies with the results of operations of those properties. The outstanding principal of the participating loan interests relates to the following commercial properties: (Millions) Participation Interest Name of Property Mar. 31, 2015 Dec. 31, 2014 Mar. 31, 2015 Dec. 31, 2014
Darling Park Complex, Sydney 30% 30% $ 159 $ 155 IAG House, Sydney 50% 50% 98 103 Bourke Place Trust, Melbourne 43% 43% 161 168
Total participating loan interests $ 418 $ 426
Included in the balance of participating loan interests is an embedded derivative representing the company’s right to participate in the changes in the fair value of the referenced properties. The embedded derivative is measured at fair value with changes in fair value reported through earnings in fair value gains (losses), net. The carrying value of the embedded derivative at March 31, 2015 was $57 million (December 31, 2014 – $43 million). For the three months ended March 31, 2015, the company recognized interest income of $7 million (2014 – $9 million) on the participating loan interests and fair value gains (losses) on the associated embedded derivative of $19 million (2014 – ($4) million). NOTE 7: OTHER NON-CURRENT FINANCIAL ASSETS The components of other non-current financial assets are as follows: (Millions) Mar. 31, 2015 Dec. 31, 2014
Preferred shares in affiliate $ 269 $ 293 Notes from affiliates 297 308 Equity securities designated as available-for-sale (“AFS”) 138 137 Other loans receivable 76 82 Other financial assets 10 ―
Total other non-current financial assets $ 790 $ 820
(a) Preferred shares in affiliate Preferred shares in affiliate consists of 13,629,794 Class C Junior Canadian dollar denominated preferred shares of a subsidiary of BPY with a carrying value of $269 million (December 31, 2014 – $293 million). (b) Notes from affiliates Notes from affiliate includes $152 million (December 31, 2014 – $164 million) of 4.5% Canadian dollar denominated interest bearing notes including accrued interest and $145 million (December 31, 2014 – $144 million) of 3.6% interest bearing notes including accrued interest from a BPY subsidiary. (c) Equity securities designated as AFS Equity securities designated as AFS includes $106 million at March 31, 2015 (December 31, 2014 – $106 million) which represents the company’s 10% common equity interest and $92 million preferred equity interest in 1625 Eye Street in Washington, D.C. The preferred equity securities, bearing a fixed dividend of 6.5%, are redeemable by issuer at par in 2016 and are pledged as security for a loan payable to the issuer in the amount of $92 million at March 31, 2015 (December 31, 2014 – $92 million) recognized in other non-current financial liabilities. Equity securities designated as AFS also includes $32 million at March 31, 2015 (December 31, 2014 – $31 million) which represents the company’s 10% common equity interest in Heritage Plaza in Houston. (d) Other loans receivable At March 31, 2015, other loans receivable includes a $76 million (December 31, 2014 – $82 million) receivable from BAM upon the earlier of the exercise of the company’s option to convert its participating loan interests into direct ownership of the Australian portfolio or the maturity of the participating loan notes. (e) Other financial assets Included in other financial assets are derivative assets with a carrying amount of $10 million at March 31, 2015 (December 31, 2014 – nil). Refer to Note 22, Financial Instruments.
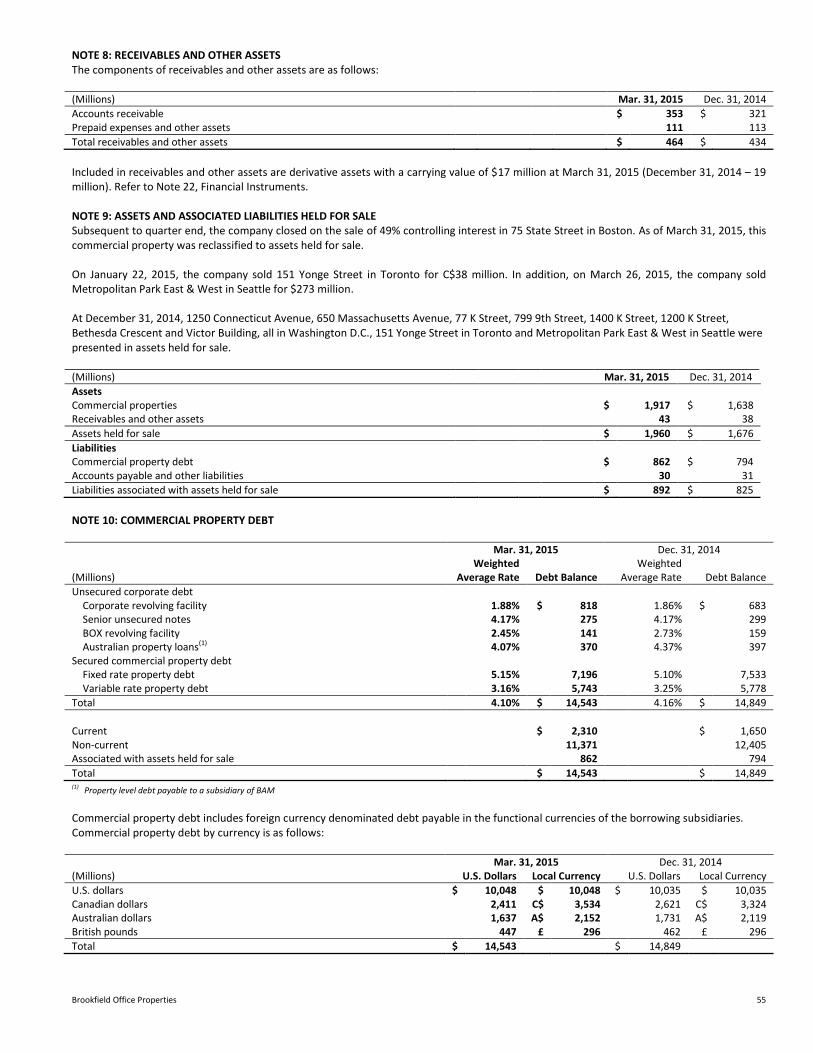
Brookfield Office Properties 55
NOTE 8: RECEIVABLES AND OTHER ASSETS The components of receivables and other assets are as follows: (Millions) Mar. 31, 2015 Dec. 31, 2014
Accounts receivable $ 353 $ 321 Prepaid expenses and other assets 111 113
Total receivables and other assets $ 464 $ 434
Included in receivables and other assets are derivative assets with a carrying value of $17 million at March 31, 2015 (December 31, 2014 – 19 million). Refer to Note 22, Financial Instruments. NOTE 9: ASSETS AND ASSOCIATED LIABILITIES HELD FOR SALE Subsequent to quarter end, the company closed on the sale of 49% controlling interest in 75 State Street in Boston. As of March 31, 2015, this commercial property was reclassified to assets held for sale. On January 22, 2015, the company sold 151 Yonge Street in Toronto for C$38 million. In addition, on March 26, 2015, the company sold Metropolitan Park East & West in Seattle for $273 million. At December 31, 2014, 1250 Connecticut Avenue, 650 Massachusetts Avenue, 77 K Street, 799 9th Street, 1400 K Street, 1200 K Street, Bethesda Crescent and Victor Building, all in Washington D.C., 151 Yonge Street in Toronto and Metropolitan Park East & West in Seattle were presented in assets held for sale. (Millions) Mar. 31, 2015 Dec. 31, 2014
Assets Commercial properties $ 1,917 $ 1,638 Receivables and other assets 43 38
Assets held for sale $ 1,960 $ 1,676
Liabilities Commercial property debt $ 862 $ 794 Accounts payable and other liabilities 30 31
Liabilities associated with assets held for sale $ 892 $ 825
NOTE 10: COMMERCIAL PROPERTY DEBT Mar. 31, 2015 Dec. 31, 2014
(Millions) Weighted
Average Rate Debt Balance Weighted
Average Rate Debt Balance
Unsecured corporate debt Corporate revolving facility 1.88% $ 818 1.86% $ 683 Senior unsecured notes 4.17% 275 4.17% 299 BOX revolving facility 2.45% 141 2.73% 159 Australian property loans(1) 4.07% 370 4.37% 397
Secured commercial property debt Fixed rate property debt 5.15% 7,196 5.10% 7,533 Variable rate property debt 3.16% 5,743 3.25% 5,778
Total 4.10% $ 14,543 4.16% $ 14,849
Current $ 2,310 $ 1,650 Non-current 11,371 12,405 Associated with assets held for sale 862 794
Total $ 14,543 $ 14,849 (1)
Property level debt payable to a subsidiary of BAM
Commercial property debt includes foreign currency denominated debt payable in the functional currencies of the borrowing subsidiaries. Commercial property debt by currency is as follows: Mar. 31, 2015 Dec. 31, 2014 (Millions) U.S. Dollars Local Currency U.S. Dollars Local Currency
U.S. dollars $ 10,048 $ 10,048 $ 10,035 $ 10,035 Canadian dollars 2,411 C$ 3,534 2,621 C$ 3,324 Australian dollars 1,637 A$ 2,152 1,731 A$ 2,119 British pounds 447 £ 296 462 £ 296
Total $ 14,543 $ 14,849
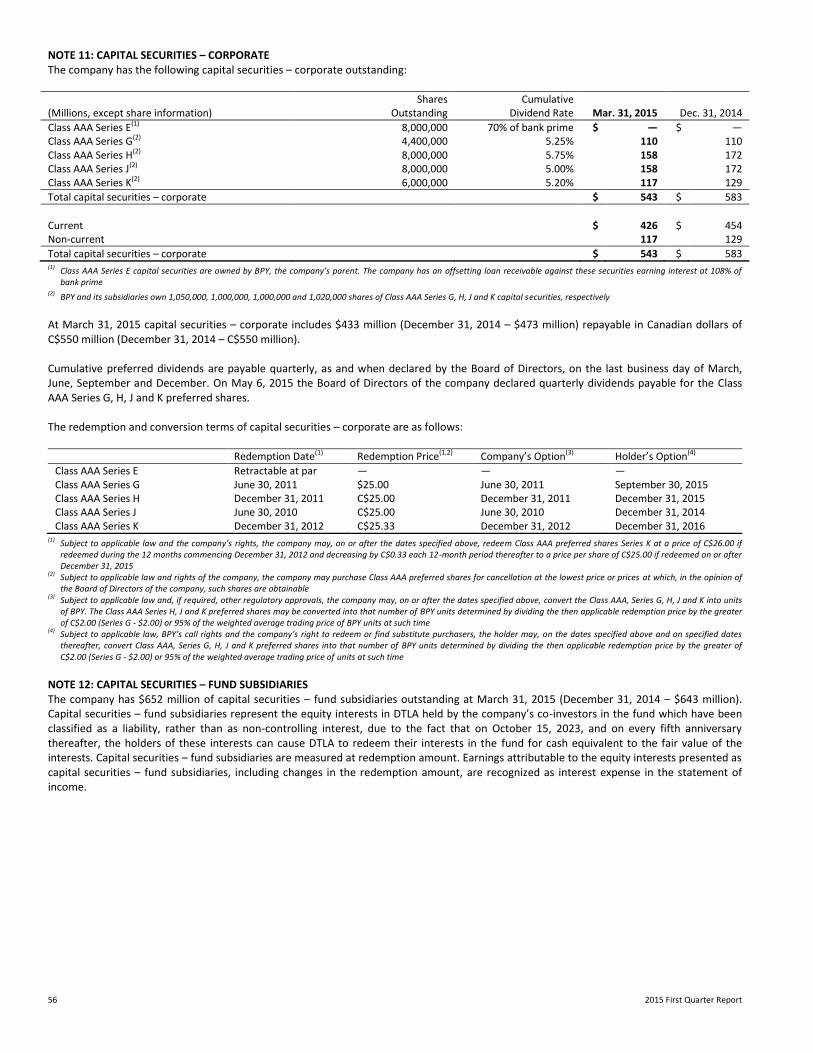
56 2015 First Quarter Report
NOTE 11: CAPITAL SECURITIES – CORPORATE The company has the following capital securities – corporate outstanding: Shares Cumulative (Millions, except share information) Outstanding Dividend Rate Mar. 31, 2015 Dec. 31, 2014
Class AAA Series E(1) 8,000,000 70% of bank prime $ ― $ ― Class AAA Series G(2) 4,400,000 5.25% 110 110 Class AAA Series H(2) 8,000,000 5.75% 158 172 Class AAA Series J(2) 8,000,000 5.00% 158 172 Class AAA Series K(2) 6,000,000 5.20% 117 129
Total capital securities – corporate $ 543 $ 583
Current $ 426 $ 454 Non-current 117 129
Total capital securities – corporate $ 543 $ 583 (1) Class AAA Series E capital securities are owned by BPY, the company’s parent. The company has an offsetting loan receivable against these securities earning interest at 108% of
bank prime (2) BPY and its subsidiaries own 1,050,000, 1,000,000, 1,000,000 and 1,020,000 shares of Class AAA Series G, H, J and K capital securities, respectively
At March 31, 2015 capital securities – corporate includes $433 million (December 31, 2014 – $473 million) repayable in Canadian dollars of C$550 million (December 31, 2014 – C$550 million). Cumulative preferred dividends are payable quarterly, as and when declared by the Board of Directors, on the last business day of March, June, September and December. On May 6, 2015 the Board of Directors of the company declared quarterly dividends payable for the Class AAA Series G, H, J and K preferred shares. The redemption and conversion terms of capital securities – corporate are as follows:
Redemption Date(1) Redemption Price(1,2) Company’s Option(3) Holder’s Option(4)
Class AAA Series E Retractable at par ― — — Class AAA Series G June 30, 2011 $25.00 June 30, 2011 September 30, 2015 Class AAA Series H December 31, 2011 C$25.00 December 31, 2011 December 31, 2015 Class AAA Series J June 30, 2010 C$25.00 June 30, 2010 December 31, 2014 Class AAA Series K December 31, 2012 C$25.33 December 31, 2012 December 31, 2016
(1) Subject to applicable law and the company’s rights, the company may, on or after the dates specified above, redeem Class AAA preferred shares Series K at a price of C$26.00 if redeemed during the 12 months commencing December 31, 2012 and decreasing by C$0.33 each 12-month period thereafter to a price per share of C$25.00 if redeemed on or after December 31, 2015
(2) Subject to applicable law and rights of the company, the company may purchase Class AAA preferred shares for cancellation at the lowest price or prices at which, in the opinion of the Board of Directors of the company, such shares are obtainable
(3) Subject to applicable law and, if required, other regulatory approvals, the company may, on or after the dates specified above, convert the Class AAA, Series G, H, J and K into units of BPY. The Class AAA Series H, J and K preferred shares may be converted into that number of BPY units determined by dividing the then applicable redemption price by the greater of C$2.00 (Series G - $2.00) or 95% of the weighted average trading price of BPY units at such time
(4) Subject to applicable law, BPY’s call rights and the company’s right to redeem or find substitute purchasers, the holder may, on the dates specified above and on specified dates thereafter, convert Class AAA, Series G, H, J and K preferred shares into that number of BPY units determined by dividing the then applicable redemption price by the greater of C$2.00 (Series G - $2.00) or 95% of the weighted average trading price of units at such time
NOTE 12: CAPITAL SECURITIES – FUND SUBSIDIARIES The company has $652 million of capital securities – fund subsidiaries outstanding at March 31, 2015 (December 31, 2014 – $643 million). Capital securities – fund subsidiaries represent the equity interests in DTLA held by the company’s co-investors in the fund which have been classified as a liability, rather than as non-controlling interest, due to the fact that on October 15, 2023, and on every fifth anniversary thereafter, the holders of these interests can cause DTLA to redeem their interests in the fund for cash equivalent to the fair value of the interests. Capital securities – fund subsidiaries are measured at redemption amount. Earnings attributable to the equity interests presented as capital securities – fund subsidiaries, including changes in the redemption amount, are recognized as interest expense in the statement of income.
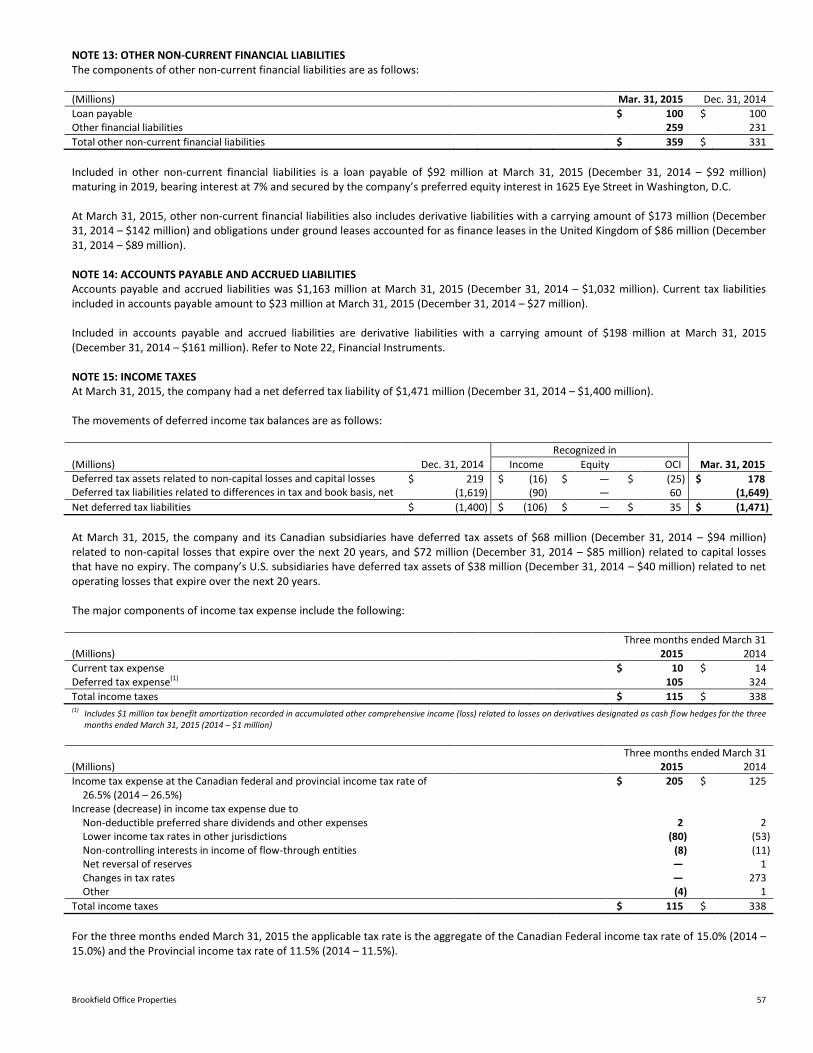
Brookfield Office Properties 57
NOTE 13: OTHER NON-CURRENT FINANCIAL LIABILITIES The components of other non-current financial liabilities are as follows: (Millions) Mar. 31, 2015 Dec. 31, 2014
Loan payable $ 100 $ 100 Other financial liabilities 259 231
Total other non-current financial liabilities $ 359 $ 331
Included in other non-current financial liabilities is a loan payable of $92 million at March 31, 2015 (December 31, 2014 – $92 million) maturing in 2019, bearing interest at 7% and secured by the company’s preferred equity interest in 1625 Eye Street in Washington, D.C. At March 31, 2015, other non-current financial liabilities also includes derivative liabilities with a carrying amount of $173 million (December 31, 2014 – $142 million) and obligations under ground leases accounted for as finance leases in the United Kingdom of $86 million (December 31, 2014 – $89 million). NOTE 14: ACCOUNTS PAYABLE AND ACCRUED LIABILITIES Accounts payable and accrued liabilities was $1,163 million at March 31, 2015 (December 31, 2014 – $1,032 million). Current tax liabilities included in accounts payable amount to $23 million at March 31, 2015 (December 31, 2014 – $27 million). Included in accounts payable and accrued liabilities are derivative liabilities with a carrying amount of $198 million at March 31, 2015 (December 31, 2014 – $161 million). Refer to Note 22, Financial Instruments. NOTE 15: INCOME TAXES At March 31, 2015, the company had a net deferred tax liability of $1,471 million (December 31, 2014 – $1,400 million). The movements of deferred income tax balances are as follows:
(Millions) Dec. 31, 2014
Recognized in
Mar. 31, 2015 Income Equity OCI Deferred tax assets related to non-capital losses and capital losses $ 219 $ (16) $ ― $ (25) $ 178 Deferred tax liabilities related to differences in tax and book basis, net (1,619) (90) ― 60 (1,649)
Net deferred tax liabilities $ (1,400) $ (106) $ ― $ 35 $ (1,471)
At March 31, 2015, the company and its Canadian subsidiaries have deferred tax assets of $68 million (December 31, 2014 – $94 million) related to non-capital losses that expire over the next 20 years, and $72 million (December 31, 2014 – $85 million) related to capital losses that have no expiry. The company’s U.S. subsidiaries have deferred tax assets of $38 million (December 31, 2014 – $40 million) related to net operating losses that expire over the next 20 years. The major components of income tax expense include the following: Three months ended March 31 (Millions) 2015 2014
Current tax expense $ 10 $ 14 Deferred tax expense(1) 105 324
Total income taxes $ 115 $ 338 (1) Includes $1 million tax benefit amortization recorded in accumulated other comprehensive income (loss) related to losses on derivatives designated as cash flow hedges for the three
months ended March 31, 2015 (2014 – $1 million)
Three months ended March 31 (Millions) 2015 2014
Income tax expense at the Canadian federal and provincial income tax rate of 26.5% (2014 – 26.5%)
$ 205 $ 125
Increase (decrease) in income tax expense due to Non-deductible preferred share dividends and other expenses 2 2 Lower income tax rates in other jurisdictions (80) (53) Non-controlling interests in income of flow-through entities (8) (11) Net reversal of reserves ― 1 Changes in tax rates ― 273 Other (4) 1
Total income taxes $ 115 $ 338
For the three months ended March 31, 2015 the applicable tax rate is the aggregate of the Canadian Federal income tax rate of 15.0% (2014 – 15.0%) and the Provincial income tax rate of 11.5% (2014 – 11.5%).
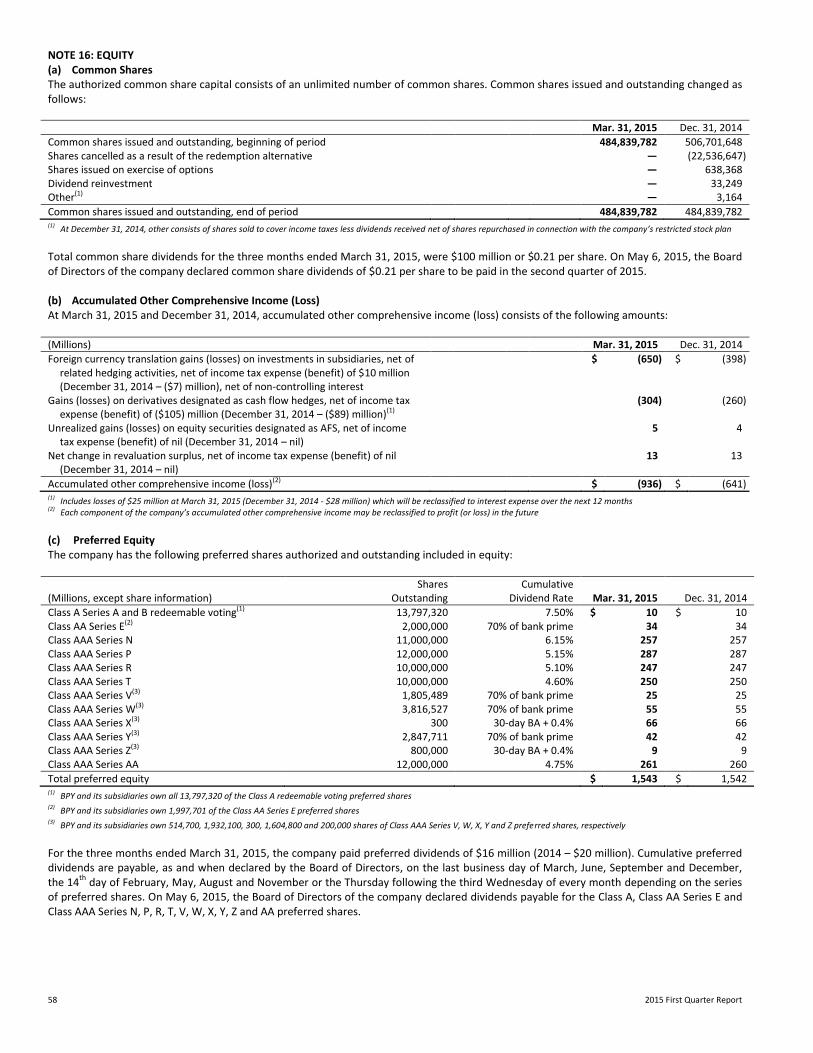
58 2015 First Quarter Report
NOTE 16: EQUITY (a) Common Shares The authorized common share capital consists of an unlimited number of common shares. Common shares issued and outstanding changed as follows:
Mar. 31, 2015 Dec. 31, 2014
Common shares issued and outstanding, beginning of period 484,839,782 506,701,648 Shares cancelled as a result of the redemption alternative ― (22,536,647) Shares issued on exercise of options ― 638,368 Dividend reinvestment ― 33,249 Other(1) ― 3,164
Common shares issued and outstanding, end of period 484,839,782 484,839,782 (1) At December 31, 2014, other consists of shares sold to cover income taxes less dividends received net of shares repurchased in connection with the company’s restricted stock plan
Total common share dividends for the three months ended March 31, 2015, were $100 million or $0.21 per share. On May 6, 2015, the Board of Directors of the company declared common share dividends of $0.21 per share to be paid in the second quarter of 2015. (b) Accumulated Other Comprehensive Income (Loss) At March 31, 2015 and December 31, 2014, accumulated other comprehensive income (loss) consists of the following amounts: (Millions) Mar. 31, 2015 Dec. 31, 2014
Foreign currency translation gains (losses) on investments in subsidiaries, net of related hedging activities, net of income tax expense (benefit) of $10 million (December 31, 2014 – ($7) million), net of non-controlling interest
$ (650) $ (398)
Gains (losses) on derivatives designated as cash flow hedges, net of income tax expense (benefit) of ($105) million (December 31, 2014 – ($89) million)(1)
(304) (260)
Unrealized gains (losses) on equity securities designated as AFS, net of income tax expense (benefit) of nil (December 31, 2014 – nil)
5 4
Net change in revaluation surplus, net of income tax expense (benefit) of nil (December 31, 2014 – nil)
13 13
Accumulated other comprehensive income (loss)(2) $ (936) $ (641) (1) Includes losses of $25 million at March 31, 2015 (December 31, 2014 - $28 million) which will be reclassified to interest expense over the next 12 months (2) Each component of the company’s accumulated other comprehensive income may be reclassified to profit (or loss) in the future
(c) Preferred Equity The company has the following preferred shares authorized and outstanding included in equity: Shares Cumulative (Millions, except share information) Outstanding Dividend Rate Mar. 31, 2015 Dec. 31, 2014
Class A Series A and B redeemable voting(1) 13,797,320 7.50% $ 10 $ 10 Class AA Series E(2) 2,000,000 70% of bank prime 34 34 Class AAA Series N 11,000,000 6.15% 257 257 Class AAA Series P 12,000,000 5.15% 287 287 Class AAA Series R 10,000,000 5.10% 247 247 Class AAA Series T 10,000,000 4.60% 250 250 Class AAA Series V(3) 1,805,489 70% of bank prime 25 25 Class AAA Series W(3) 3,816,527 70% of bank prime 55 55 Class AAA Series X(3) 300 30-day BA + 0.4% 66 66 Class AAA Series Y(3) 2,847,711 70% of bank prime 42 42 Class AAA Series Z(3) 800,000 30-day BA + 0.4% 9 9 Class AAA Series AA 12,000,000 4.75% 261 260
Total preferred equity $ 1,543 $ 1,542 (1)
BPY and its subsidiaries own all 13,797,320 of the Class A redeemable voting preferred shares (2) BPY and its subsidiaries own 1,997,701 of the Class AA Series E preferred shares (3)
BPY and its subsidiaries own 514,700, 1,932,100, 300, 1,604,800 and 200,000 shares of Class AAA Series V, W, X, Y and Z preferred shares, respectively
For the three months ended March 31, 2015, the company paid preferred dividends of $16 million (2014 – $20 million). Cumulative preferred dividends are payable, as and when declared by the Board of Directors, on the last business day of March, June, September and December, the 14
th day of February, May, August and November or the Thursday following the third Wednesday of every month depending on the series
of preferred shares. On May 6, 2015, the Board of Directors of the company declared dividends payable for the Class A, Class AA Series E and Class AAA Series N, P, R, T, V, W, X, Y, Z and AA preferred shares.
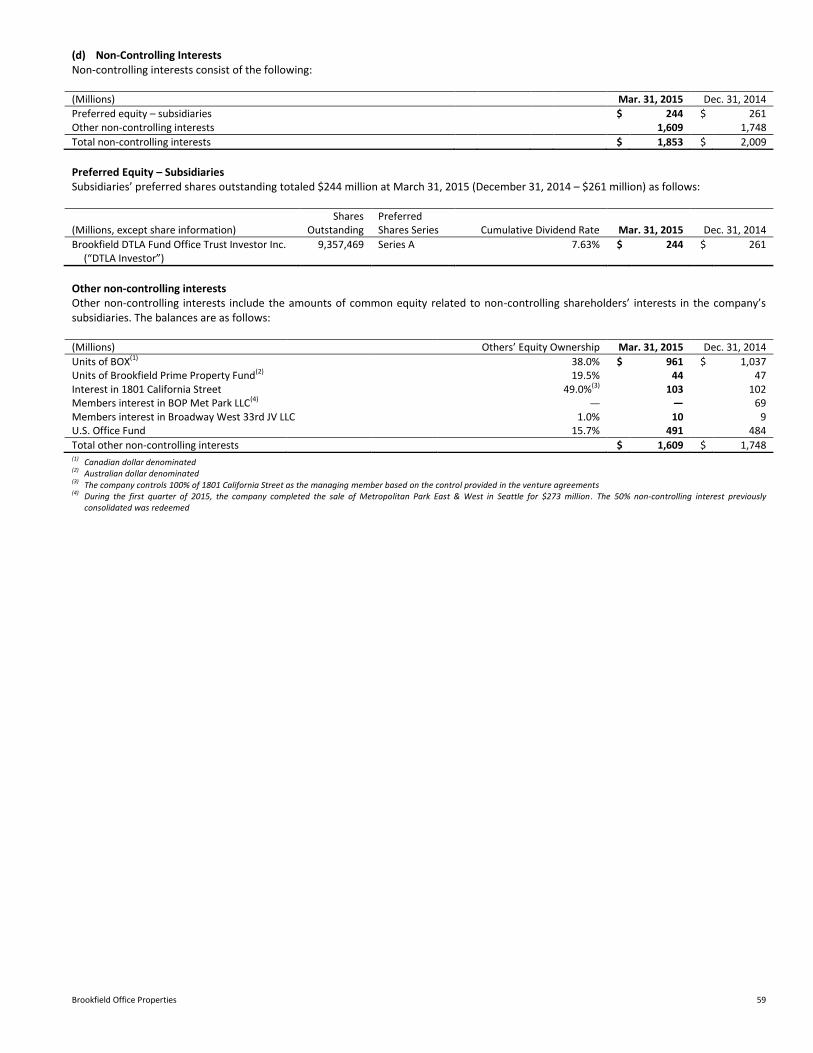
Brookfield Office Properties 59
(d) Non-Controlling Interests Non-controlling interests consist of the following: (Millions) Mar. 31, 2015 Dec. 31, 2014
Preferred equity – subsidiaries $ 244 $ 261 Other non-controlling interests 1,609 1,748
Total non-controlling interests $ 1,853 $ 2,009
Preferred Equity – Subsidiaries Subsidiaries’ preferred shares outstanding totaled $244 million at March 31, 2015 (December 31, 2014 – $261 million) as follows:
(Millions, except share information) Shares
Outstanding Preferred Shares Series Cumulative Dividend Rate Mar. 31, 2015 Dec. 31, 2014
Brookfield DTLA Fund Office Trust Investor Inc. (“DTLA Investor”)
9,357,469 Series A 7.63% $ 244 $ 261
Other non-controlling interests Other non-controlling interests include the amounts of common equity related to non-controlling shareholders’ interests in the company’s subsidiaries. The balances are as follows: (Millions) Others’ Equity Ownership Mar. 31, 2015 Dec. 31, 2014
Units of BOX(1) 38.0% $ 961 $ 1,037 Units of Brookfield Prime Property Fund(2) 19.5% 44 47 Interest in 1801 California Street 49.0%(3) 103 102 Members interest in BOP Met Park LLC(4) ― ― 69 Members interest in Broadway West 33rd JV LLC 1.0% 10 9 U.S. Office Fund 15.7% 491 484
Total other non-controlling interests $ 1,609 $ 1,748 (1) Canadian dollar denominated (2) Australian dollar denominated (3) The company controls 100% of 1801 California Street as the managing member based on the control provided in the venture agreements (4) During the first quarter of 2015, the company completed the sale of Metropolitan Park East & West in Seattle for $273 million. The 50% non-controlling interest previously
consolidated was redeemed
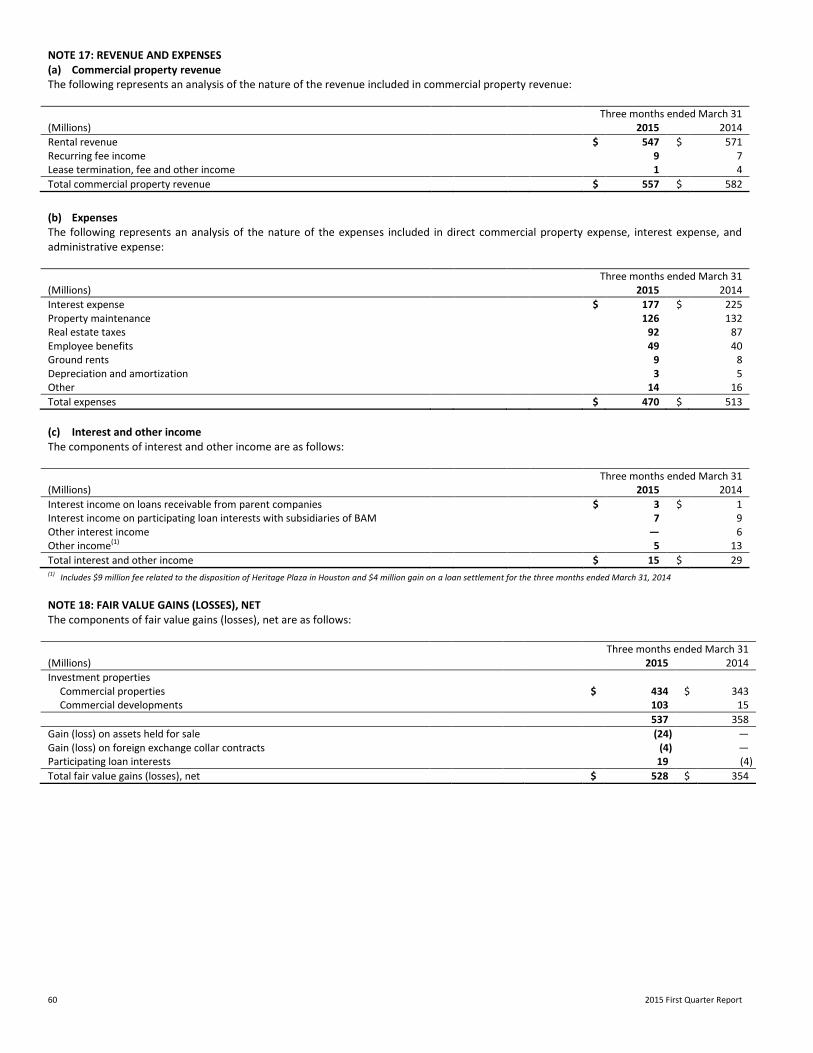
60 2015 First Quarter Report
NOTE 17: REVENUE AND EXPENSES (a) Commercial property revenue The following represents an analysis of the nature of the revenue included in commercial property revenue: Three months ended March 31 (Millions) 2015 2014
Rental revenue $ 547 $ 571 Recurring fee income 9 7 Lease termination, fee and other income 1 4
Total commercial property revenue $ 557 $ 582
(b) Expenses The following represents an analysis of the nature of the expenses included in direct commercial property expense, interest expense, and administrative expense: Three months ended March 31 (Millions) 2015 2014
Interest expense $ 177 $ 225 Property maintenance 126 132 Real estate taxes 92 87 Employee benefits 49 40 Ground rents 9 8 Depreciation and amortization 3 5 Other 14 16
Total expenses $ 470 $ 513
(c) Interest and other income The components of interest and other income are as follows: Three months ended March 31 (Millions) 2015 2014
Interest income on loans receivable from parent companies $ 3 $ 1 Interest income on participating loan interests with subsidiaries of BAM 7 9 Other interest income ― 6 Other income(1) 5 13
Total interest and other income $ 15 $ 29 (1) Includes $9 million fee related to the disposition of Heritage Plaza in Houston and $4 million gain on a loan settlement for the three months ended March 31, 2014
NOTE 18: FAIR VALUE GAINS (LOSSES), NET The components of fair value gains (losses), net are as follows: Three months ended March 31 (Millions) 2015 2014
Investment properties Commercial properties $ 434 $ 343 Commercial developments 103 15
537 358
Gain (loss) on assets held for sale (24) ― Gain (loss) on foreign exchange collar contracts (4) ― Participating loan interests 19 (4)
Total fair value gains (losses), net $ 528 $ 354
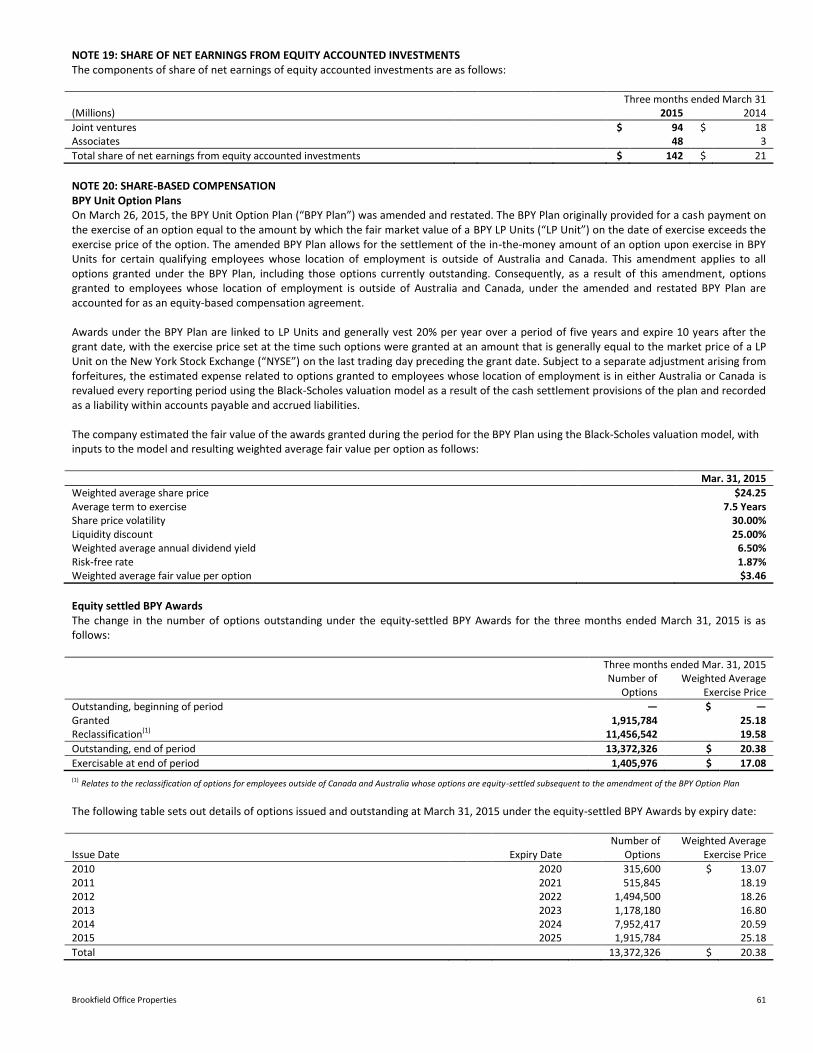
Brookfield Office Properties 61
NOTE 19: SHARE OF NET EARNINGS FROM EQUITY ACCOUNTED INVESTMENTS The components of share of net earnings of equity accounted investments are as follows: Three months ended March 31 (Millions) 2015 2014
Joint ventures $ 94 $ 18 Associates 48 3
Total share of net earnings from equity accounted investments $ 142 $ 21
NOTE 20: SHARE-BASED COMPENSATION BPY Unit Option Plans On March 26, 2015, the BPY Unit Option Plan (“BPY Plan”) was amended and restated. The BPY Plan originally provided for a cash payment on the exercise of an option equal to the amount by which the fair market value of a BPY LP Units (“LP Unit”) on the date of exercise exceeds the exercise price of the option. The amended BPY Plan allows for the settlement of the in-the-money amount of an option upon exercise in BPY Units for certain qualifying employees whose location of employment is outside of Australia and Canada. This amendment applies to all options granted under the BPY Plan, including those options currently outstanding. Consequently, as a result of this amendment, options granted to employees whose location of employment is outside of Australia and Canada, under the amended and restated BPY Plan are accounted for as an equity-based compensation agreement. Awards under the BPY Plan are linked to LP Units and generally vest 20% per year over a period of five years and expire 10 years after the grant date, with the exercise price set at the time such options were granted at an amount that is generally equal to the market price of a LP Unit on the New York Stock Exchange (“NYSE”) on the last trading day preceding the grant date. Subject to a separate adjustment arising from forfeitures, the estimated expense related to options granted to employees whose location of employment is in either Australia or Canada is revalued every reporting period using the Black-Scholes valuation model as a result of the cash settlement provisions of the plan and recorded as a liability within accounts payable and accrued liabilities. The company estimated the fair value of the awards granted during the period for the BPY Plan using the Black-Scholes valuation model, with inputs to the model and resulting weighted average fair value per option as follows: Mar. 31, 2015
Weighted average share price $24.25 Average term to exercise 7.5 Years Share price volatility 30.00% Liquidity discount 25.00% Weighted average annual dividend yield 6.50% Risk-free rate 1.87% Weighted average fair value per option $3.46
Equity settled BPY Awards The change in the number of options outstanding under the equity-settled BPY Awards for the three months ended March 31, 2015 is as follows: Three months ended Mar. 31, 2015
Number of
Options Weighted Average
Exercise Price
Outstanding, beginning of period ― $ ― Granted 1,915,784 25.18 Reclassification(1) 11,456,542 19.58
Outstanding, end of period 13,372,326 $ 20.38
Exercisable at end of period 1,405,976 $ 17.08
(1) Relates to the reclassification of options for employees outside of Canada and Australia whose options are equity-settled subsequent to the amendment of the BPY Option Plan The following table sets out details of options issued and outstanding at March 31, 2015 under the equity-settled BPY Awards by expiry date:
Issue Date Expiry Date Number of
Options Weighted Average
Exercise Price
2010 2020 315,600 $ 13.07 2011 2021 515,845 18.19 2012 2022 1,494,500 18.26 2013 2023 1,178,180 16.80 2014 2024 7,952,417 20.59 2015 2025 1,915,784 25.18
Total 13,372,326 $ 20.38
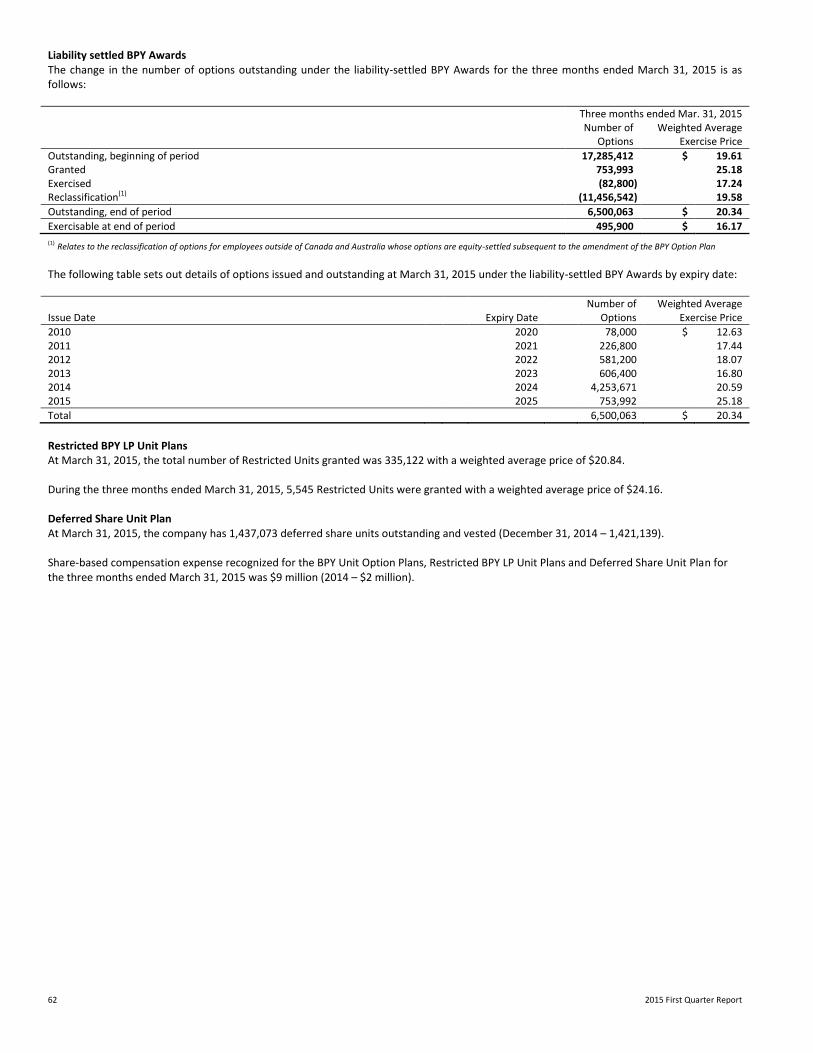
62 2015 First Quarter Report
Liability settled BPY Awards The change in the number of options outstanding under the liability-settled BPY Awards for the three months ended March 31, 2015 is as follows: Three months ended Mar. 31, 2015
Number of
Options Weighted Average
Exercise Price
Outstanding, beginning of period 17,285,412 $ 19.61 Granted 753,993 25.18 Exercised (82,800) 17.24 Reclassification(1) (11,456,542) 19.58
Outstanding, end of period 6,500,063 $ 20.34
Exercisable at end of period 495,900 $ 16.17
(1) Relates to the reclassification of options for employees outside of Canada and Australia whose options are equity-settled subsequent to the amendment of the BPY Option Plan The following table sets out details of options issued and outstanding at March 31, 2015 under the liability-settled BPY Awards by expiry date:
Issue Date Expiry Date Number of
Options Weighted Average
Exercise Price
2010 2020 78,000 $ 12.63 2011 2021 226,800 17.44 2012 2022 581,200 18.07 2013 2023 606,400 16.80 2014 2024 4,253,671 20.59 2015 2025 753,992 25.18
Total 6,500,063 $ 20.34
Restricted BPY LP Unit Plans At March 31, 2015, the total number of Restricted Units granted was 335,122 with a weighted average price of $20.84. During the three months ended March 31, 2015, 5,545 Restricted Units were granted with a weighted average price of $24.16. Deferred Share Unit Plan
At March 31, 2015, the company has 1,437,073 deferred share units outstanding and vested (December 31, 2014 – 1,421,139). Share-based compensation expense recognized for the BPY Unit Option Plans, Restricted BPY LP Unit Plans and Deferred Share Unit Plan for the three months ended March 31, 2015 was $9 million (2014 – $2 million).

Brookfield Office Properties 63
NOTE 21: GUARANTEES, CONTINGENCIES AND OTHER In the normal course of operations, the company and its consolidated entities execute agreements that provide for indemnification and guarantees to third parties in transactions such as business dispositions, business acquisitions, sales of assets and sales of services. Guarantees, Commitments and Contingencies The company and its operating subsidiaries may be contingently liable with respect to litigation and claims that arise from time to time in the normal course of business or otherwise. During the quarter, the company has reached an agreement to settle a specific litigation brought by the former MPG Office Trust, Inc.’s preferred shareholders related to the acquisition of MPG Office Trust, Inc. As per the settlement, the company is required to pay a portion of previously accrued and unpaid preferred dividends as well as the plaintiffs’ attorney fees which are not yet estimable. At March 31, 2015, the company has commitments totaling approximately $1,201 million for the development of Manhattan West in Midtown New York, approximately C$423 million for the development of Bay Adelaide East in Toronto and Brookfield Place East Tower in Calgary, approximately A$154 million for the development of Brookfield Place Perth Tower 2 and approximately £375 million for the development of London Wall Place and Principal Place Commercial in London. The company has also agreed to indemnify certain of its directors and certain of its officers and employees. The nature of substantially all of the indemnification undertakings prevent the company from making a reasonable estimate of the maximum potential amount that it could be required to pay third parties as the agreements do not specify a maximum amount and the amounts are dependent upon the outcome of future contingent events, the nature and likelihood of which cannot be determined at this time. Historically, neither the company nor its consolidated subsidiaries have made significant payments under such indemnification agreements. The company does not conduct its operations, other than those of equity accounted investments, through entities that are not fully or proportionately consolidated in its consolidated financial statements, and has not guaranteed or otherwise contractually committed to support any material financial obligations not reflected in its consolidated financial statements.
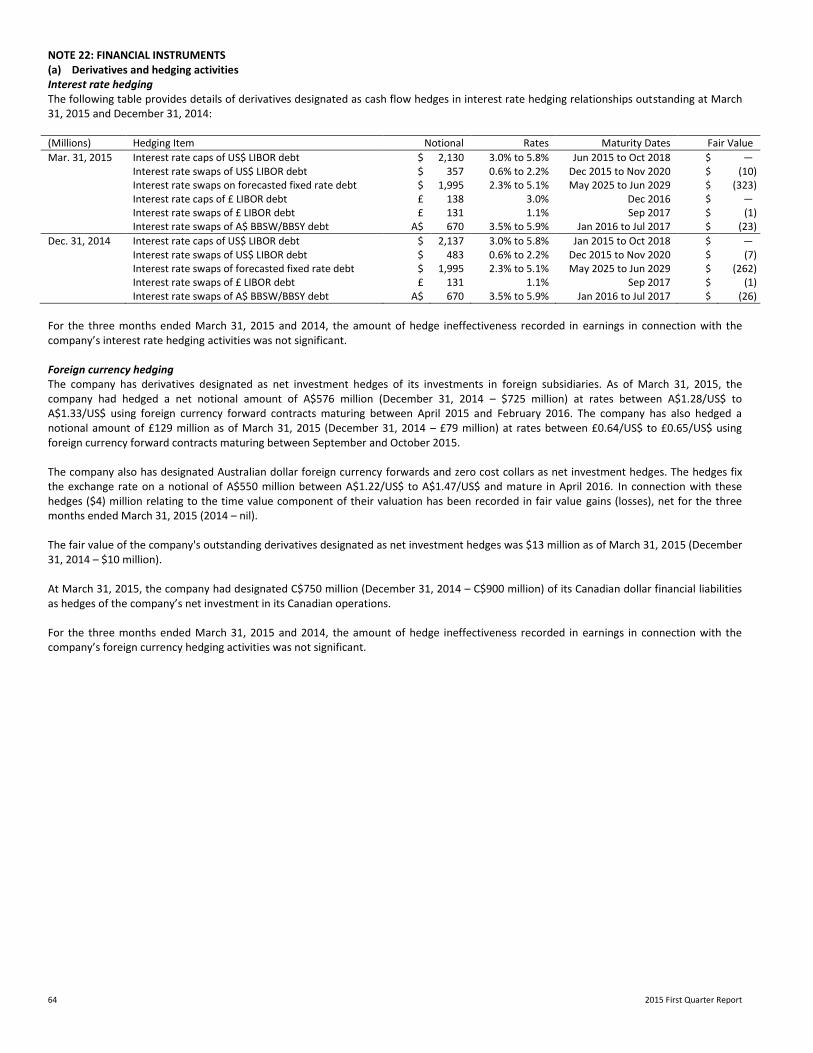
64 2015 First Quarter Report
NOTE 22: FINANCIAL INSTRUMENTS (a) Derivatives and hedging activities Interest rate hedging The following table provides details of derivatives designated as cash flow hedges in interest rate hedging relationships outstanding at March 31, 2015 and December 31, 2014: (Millions) Hedging Item Notional Rates Maturity Dates Fair Value
Mar. 31, 2015 Interest rate caps of US$ LIBOR debt $ 2,130 3.0% to 5.8% Jun 2015 to Oct 2018 $ ― Interest rate swaps of US$ LIBOR debt $ 357 0.6% to 2.2% Dec 2015 to Nov 2020 $ (10) Interest rate swaps on forecasted fixed rate debt $ 1,995 2.3% to 5.1% May 2025 to Jun 2029 $ (323) Interest rate caps of £ LIBOR debt £ 138 3.0% Dec 2016 $ ―
Interest rate swaps of £ LIBOR debt £ 131 1.1% Sep 2017 $ (1) Interest rate swaps of A$ BBSW/BBSY debt A$ 670 3.5% to 5.9% Jan 2016 to Jul 2017 $ (23)
Dec. 31, 2014 Interest rate caps of US$ LIBOR debt $ 2,137 3.0% to 5.8% Jan 2015 to Oct 2018 $ ― Interest rate swaps of US$ LIBOR debt $ 483 0.6% to 2.2% Dec 2015 to Nov 2020 $ (7) Interest rate swaps of forecasted fixed rate debt $ 1,995 2.3% to 5.1% May 2025 to Jun 2029 $ (262) Interest rate swaps of £ LIBOR debt £ 131 1.1% Sep 2017 $ (1) Interest rate swaps of A$ BBSW/BBSY debt A$ 670 3.5% to 5.9% Jan 2016 to Jul 2017 $ (26)
For the three months ended March 31, 2015 and 2014, the amount of hedge ineffectiveness recorded in earnings in connection with the company’s interest rate hedging activities was not significant. Foreign currency hedging The company has derivatives designated as net investment hedges of its investments in foreign subsidiaries. As of March 31, 2015, the company had hedged a net notional amount of A$576 million (December 31, 2014 – $725 million) at rates between A$1.28/US$ to A$1.33/US$ using foreign currency forward contracts maturing between April 2015 and February 2016. The company has also hedged a notional amount of £129 million as of March 31, 2015 (December 31, 2014 – £79 million) at rates between £0.64/US$ to £0.65/US$ using foreign currency forward contracts maturing between September and October 2015. The company also has designated Australian dollar foreign currency forwards and zero cost collars as net investment hedges. The hedges fix the exchange rate on a notional of A$550 million between A$1.22/US$ to A$1.47/US$ and mature in April 2016. In connection with these hedges ($4) million relating to the time value component of their valuation has been recorded in fair value gains (losses), net for the three months ended March 31, 2015 (2014 – nil). The fair value of the company's outstanding derivatives designated as net investment hedges was $13 million as of March 31, 2015 (December 31, 2014 – $10 million). At March 31, 2015, the company had designated C$750 million (December 31, 2014 – C$900 million) of its Canadian dollar financial liabilities as hedges of the company’s net investment in its Canadian operations. For the three months ended March 31, 2015 and 2014, the amount of hedge ineffectiveness recorded in earnings in connection with the company’s foreign currency hedging activities was not significant.
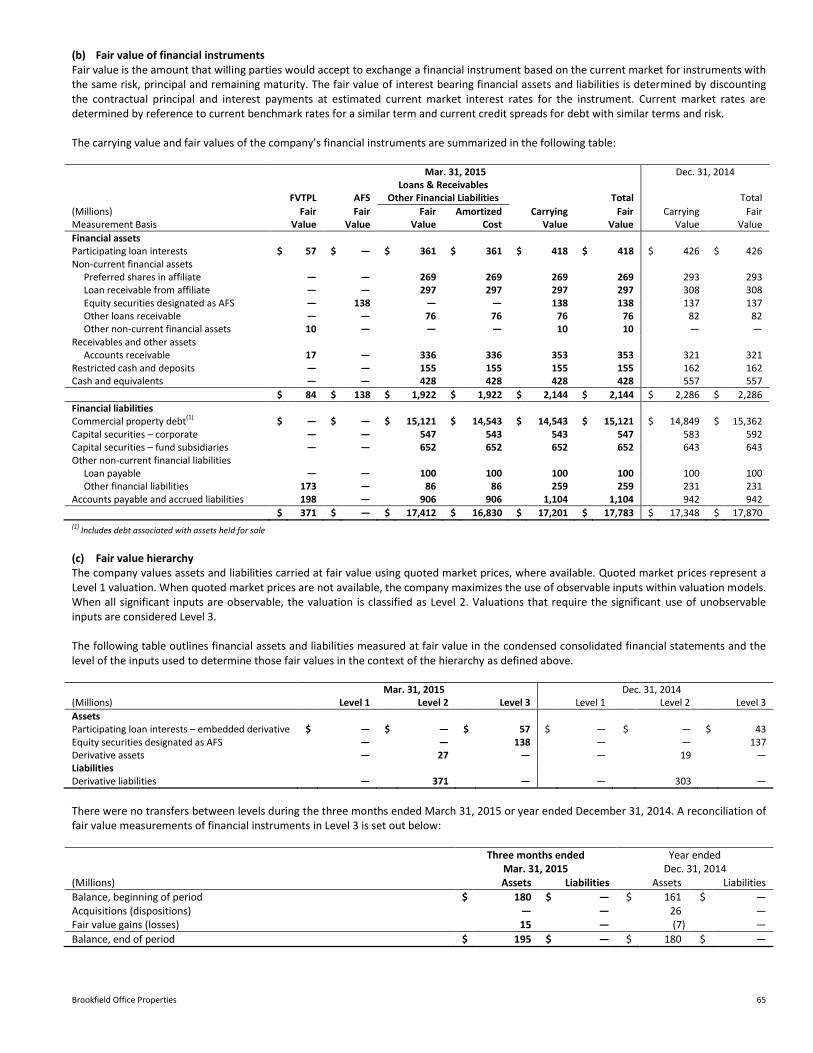
Brookfield Office Properties 65
(b) Fair value of financial instruments Fair value is the amount that willing parties would accept to exchange a financial instrument based on the current market for instruments with the same risk, principal and remaining maturity. The fair value of interest bearing financial assets and liabilities is determined by discounting the contractual principal and interest payments at estimated current market interest rates for the instrument. Current market rates are determined by reference to current benchmark rates for a similar term and current credit spreads for debt with similar terms and risk. The carrying value and fair values of the company’s financial instruments are summarized in the following table: Mar. 31, 2015 Dec. 31, 2014 Loans & Receivables FVTPL AFS Other Financial Liabilities Total Total
(Millions) Fair Fair Fair Amortized Carrying Fair Carrying Fair Measurement Basis Value Value Value Cost Value Value Value Value
Financial assets Participating loan interests $ 57 $ ― $ 361 $ 361 $ 418 $ 418 $ 426 $ 426 Non-current financial assets
Preferred shares in affiliate ― ― 269 269 269 269 293 293 Loan receivable from affiliate ― ― 297 297 297 297 308 308 Equity securities designated as AFS ― 138 ― ― 138 138 137 137 Other loans receivable ― ― 76 76 76 76 82 82 Other non-current financial assets 10 ― ― ― 10 10 ― ―
Receivables and other assets Accounts receivable 17 ― 336 336 353 353 321 321
Restricted cash and deposits ― ― 155 155 155 155 162 162 Cash and equivalents ― ― 428 428 428 428 557 557
$ 84 $ 138 $ 1,922 $ 1,922 $ 2,144 $ 2,144 $ 2,286 $ 2,286
Financial liabilities Commercial property debt(1) $ ― $ ― $ 15,121 $ 14,543 $ 14,543 $ 15,121 $ 14,849 $ 15,362 Capital securities – corporate ― ― 547 543 543 547 583 592 Capital securities – fund subsidiaries ― ― 652 652 652 652 643 643 Other non-current financial liabilities
Loan payable ― ― 100 100 100 100 100 100 Other financial liabilities 173 ― 86 86 259 259 231 231
Accounts payable and accrued liabilities 198 ― 906 906 1,104 1,104 942 942
$ 371 $ ― $ 17,412 $ 16,830 $ 17,201 $ 17,783 $ 17,348 $ 17,870 (1) Includes debt associated with assets held for sale
(c) Fair value hierarchy The company values assets and liabilities carried at fair value using quoted market prices, where available. Quoted market prices represent a Level 1 valuation. When quoted market prices are not available, the company maximizes the use of observable inputs within valuation models. When all significant inputs are observable, the valuation is classified as Level 2. Valuations that require the significant use of unobservable inputs are considered Level 3. The following table outlines financial assets and liabilities measured at fair value in the condensed consolidated financial statements and the level of the inputs used to determine those fair values in the context of the hierarchy as defined above. Mar. 31, 2015 Dec. 31, 2014 (Millions) Level 1 Level 2 Level 3 Level 1 Level 2 Level 3
Assets Participating loan interests – embedded derivative $ — $ — $ 57 $ — $ — $ 43 Equity securities designated as AFS — — 138 — — 137 Derivative assets — 27 — — 19 — Liabilities Derivative liabilities — 371 — — 303 —
There were no transfers between levels during the three months ended March 31, 2015 or year ended December 31, 2014. A reconciliation of fair value measurements of financial instruments in Level 3 is set out below: Three months ended Year ended Mar. 31, 2015 Dec. 31, 2014 (Millions) Assets Liabilities Assets Liabilities
Balance, beginning of period $ 180 $ — $ 161 $ — Acquisitions (dispositions) — — 26 — Fair value gains (losses) 15 — (7) —
Balance, end of period $ 195 $ — $ 180 $ —
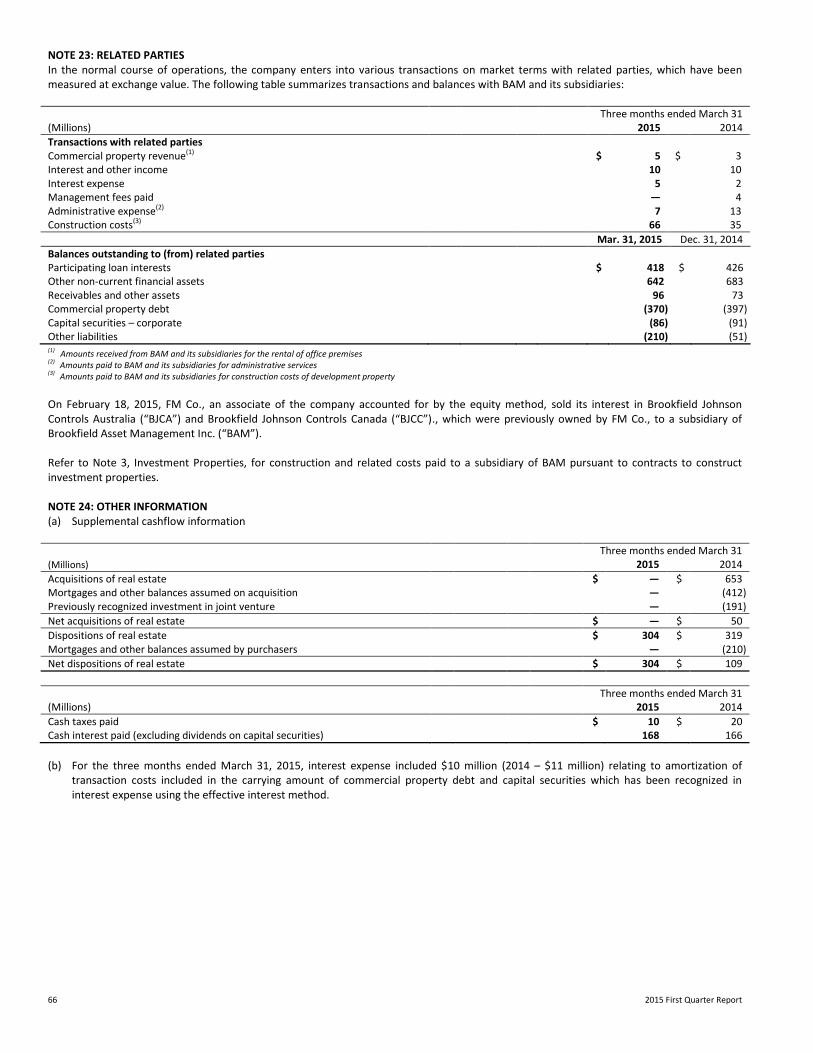
66 2015 First Quarter Report
NOTE 23: RELATED PARTIES In the normal course of operations, the company enters into various transactions on market terms with related parties, which have been measured at exchange value. The following table summarizes transactions and balances with BAM and its subsidiaries: Three months ended March 31 (Millions) 2015 2014
Transactions with related parties Commercial property revenue(1) $ 5 $ 3 Interest and other income 10 10 Interest expense 5 2 Management fees paid — 4 Administrative expense(2) 7 13 Construction costs(3) 66 35
Mar. 31, 2015 Dec. 31, 2014
Balances outstanding to (from) related parties Participating loan interests $ 418 $ 426 Other non-current financial assets 642 683 Receivables and other assets 96 73 Commercial property debt (370) (397) Capital securities – corporate (86) (91) Other liabilities (210) (51) (1) Amounts received from BAM and its subsidiaries for the rental of office premises (2) Amounts paid to BAM and its subsidiaries for administrative services (3) Amounts paid to BAM and its subsidiaries for construction costs of development property
On February 18, 2015, FM Co., an associate of the company accounted for by the equity method, sold its interest in Brookfield Johnson Controls Australia (“BJCA”) and Brookfield Johnson Controls Canada (“BJCC”)., which were previously owned by FM Co., to a subsidiary of Brookfield Asset Management Inc. (“BAM”). Refer to Note 3, Investment Properties, for construction and related costs paid to a subsidiary of BAM pursuant to contracts to construct investment properties. NOTE 24: OTHER INFORMATION (a) Supplemental cashflow information Three months ended March 31 (Millions) 2015 2014
Acquisitions of real estate $ — $ 653 Mortgages and other balances assumed on acquisition — (412) Previously recognized investment in joint venture — (191)
Net acquisitions of real estate $ — $ 50
Dispositions of real estate $ 304 $ 319 Mortgages and other balances assumed by purchasers — (210)
Net dispositions of real estate $ 304 $ 109
Three months ended March 31 (Millions) 2015 2014
Cash taxes paid $ 10 $ 20 Cash interest paid (excluding dividends on capital securities) 168 166
(b) For the three months ended March 31, 2015, interest expense included $10 million (2014 – $11 million) relating to amortization of
transaction costs included in the carrying amount of commercial property debt and capital securities which has been recognized in interest expense using the effective interest method.

Brookfield Office Properties 67
NOTE 25: SUBSEQUENT EVENTS On April 30, 2015, the company sold a 49% interest in 75 State Street in Boston for net proceeds of $136 million. Subsequent to March 31, 2015, there was a change in tax legislation in a jurisdiction that the company operates in that would change the tax rate on certain taxable temporary differences from 10.8% to 15.9% beginning in the second quarter of 2015.
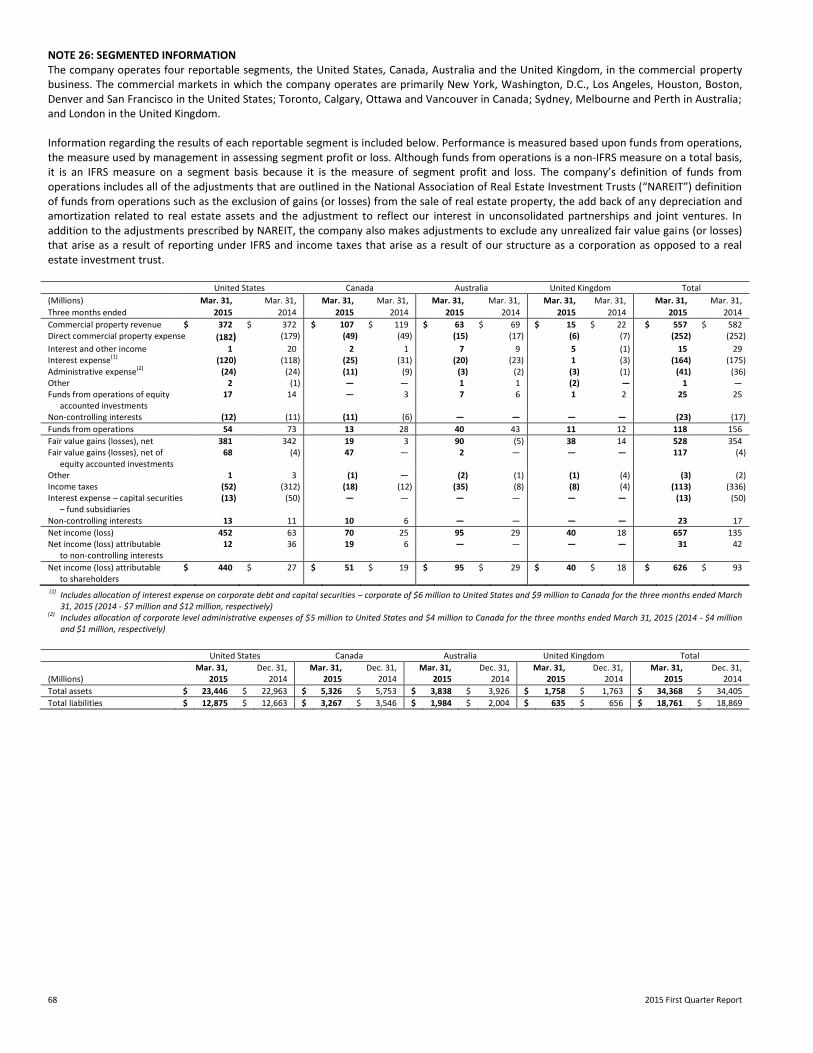
68 2015 First Quarter Report
NOTE 26: SEGMENTED INFORMATION The company operates four reportable segments, the United States, Canada, Australia and the United Kingdom, in the commercial property business. The commercial markets in which the company operates are primarily New York, Washington, D.C., Los Angeles, Houston, Boston, Denver and San Francisco in the United States; Toronto, Calgary, Ottawa and Vancouver in Canada; Sydney, Melbourne and Perth in Australia; and London in the United Kingdom. Information regarding the results of each reportable segment is included below. Performance is measured based upon funds from operations, the measure used by management in assessing segment profit or loss. Although funds from operations is a non-IFRS measure on a total basis, it is an IFRS measure on a segment basis because it is the measure of segment profit and loss. The company’s definition of funds from operations includes all of the adjustments that are outlined in the National Association of Real Estate Investment Trusts (“NAREIT”) definition of funds from operations such as the exclusion of gains (or losses) from the sale of real estate property, the add back of any depreciation and amortization related to real estate assets and the adjustment to reflect our interest in unconsolidated partnerships and joint ventures. In addition to the adjustments prescribed by NAREIT, the company also makes adjustments to exclude any unrealized fair value gains (or losses) that arise as a result of reporting under IFRS and income taxes that arise as a result of our structure as a corporation as opposed to a real estate investment trust. United States Canada Australia United Kingdom Total
(Millions) Mar. 31, Mar. 31, Mar. 31, Mar. 31, Mar. 31, Mar. 31, Mar. 31, Mar. 31, Mar. 31, Mar. 31,
Three months ended 2015 2014 2015 2014 2015 2014 2015 2014 2015 2014
Commercial property revenue $ 372 $ 372 $ 107 $ 119 $ 63 $ 69 $ 15 $ 22 $ 557 $ 582 Direct commercial property expense (182) (179) (49) (49) (15) (17) (6) (7) (252) (252)
Interest and other income 1 20 2 1 7 9 5 (1) 15 29 Interest expense(1) (120) (118) (25) (31) (20) (23) 1 (3) (164) (175) Administrative expense(2) (24) (24) (11) (9) (3) (2) (3) (1) (41) (36) Other 2 (1) — — 1 1 (2) — 1 — Funds from operations of equity
accounted investments 17 14 — 3 7 6 1 2 25 25
Non-controlling interests (12) (11) (11) (6) — — — — (23) (17)
Funds from operations 54 73 13 28 40 43 11 12 118 156
Fair value gains (losses), net 381 342 19 3 90 (5) 38 14 528 354 Fair value gains (losses), net of
equity accounted investments 68 (4) 47 — 2 —
— — 117 (4)
Other 1 3 (1) — (2) (1) (1) (4) (3) (2) Income taxes (52) (312) (18) (12) (35) (8) (8) (4) (113) (336) Interest expense – capital securities
– fund subsidiaries (13) (50) — — — — — — (13) (50)
Non-controlling interests 13 11 10 6 — — — — 23 17
Net income (loss) 452 63 70 25 95 29 40 18 657 135 Net income (loss) attributable
to non-controlling interests 12 36 19 6 — — — — 31 42
Net income (loss) attributable to shareholders
$ 440 $ 27 $ 51 $ 19 $ 95 $ 29 $ 40 $ 18 $ 626 $ 93
(1) Includes allocation of interest expense on corporate debt and capital securities – corporate of $6 million to United States and $9 million to Canada for the three months ended March 31, 2015 (2014 - $7 million and $12 million, respectively)
(2) Includes allocation of corporate level administrative expenses of $5 million to United States and $4 million to Canada for the three months ended March 31, 2015 (2014 - $4 million and $1 million, respectively)
United States Canada Australia United Kingdom Total
Mar. 31, Dec. 31, Mar. 31, Dec. 31, Mar. 31, Dec. 31, Mar. 31, Dec. 31, Mar. 31, Dec. 31, (Millions) 2015 2014 2015 2014 2015 2014 2015 2014 2015 2014
Total assets $ 23,446 $ 22,963 $ 5,326 $ 5,753 $ 3,838 $ 3,926 $ 1,758 $ 1,763 $ 34,368 $ 34,405
Total liabilities $ 12,875 $ 12,663 $ 3,267 $ 3,546 $ 1,984 $ 2,004 $ 635 $ 656 $ 18,761 $ 18,869

Brookfield Office Properties 69
NOTE 27: APPROVAL OF CONDENSED CONSOLIDATED FINANCIAL STATEMENTS The condensed consolidated financial statements were approved by the board of directors and authorized for issue on May 6, 2015.
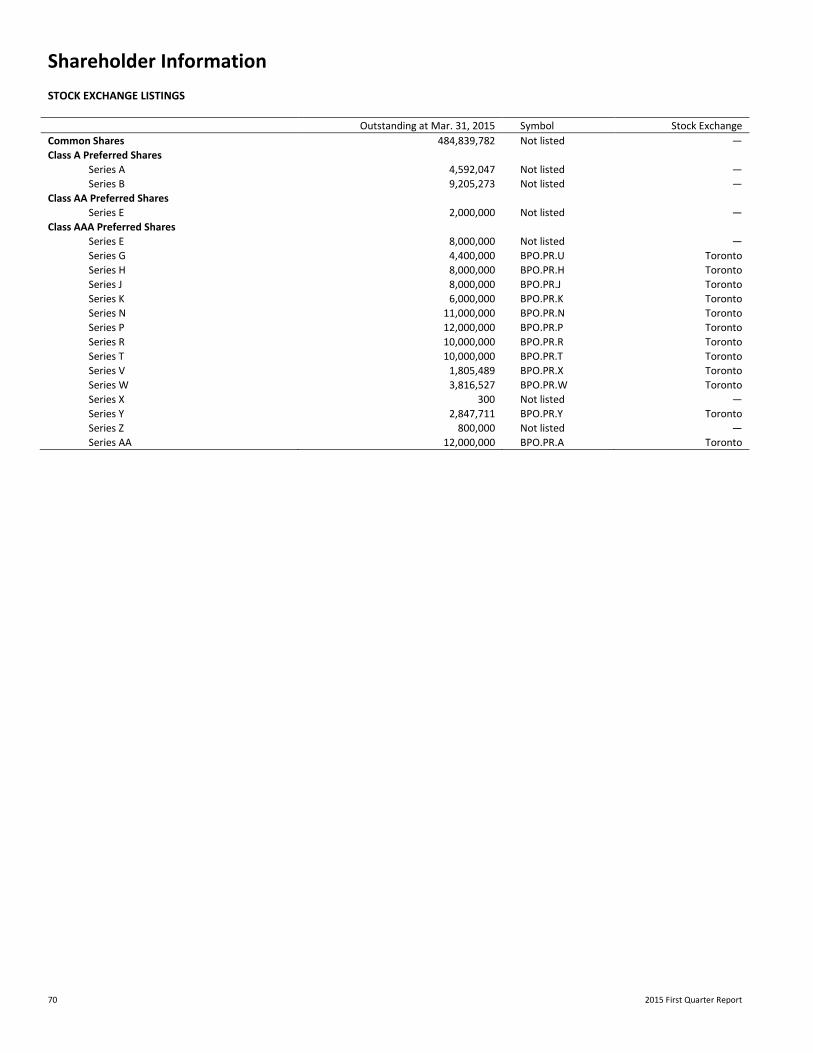
70 2015 First Quarter Report
Shareholder Information STOCK EXCHANGE LISTINGS
Outstanding at Mar. 31, 2015 Symbol Stock Exchange
Common Shares 484,839,782 Not listed ―
Class A Preferred Shares
Series A 4,592,047 Not listed ―
Series B 9,205,273 Not listed ―
Class AA Preferred Shares
Series E 2,000,000 Not listed ―
Class AAA Preferred Shares
Series E 8,000,000 Not listed ―
Series G 4,400,000 BPO.PR.U Toronto
Series H 8,000,000 BPO.PR.H Toronto
Series J 8,000,000 BPO.PR.J Toronto
Series K 6,000,000 BPO.PR.K Toronto
Series N 11,000,000 BPO.PR.N Toronto
Series P 12,000,000 BPO.PR.P Toronto
Series R 10,000,000 BPO.PR.R Toronto
Series T 10,000,000 BPO.PR.T Toronto
Series V 1,805,489 BPO.PR.X Toronto
Series W 3,816,527 BPO.PR.W Toronto
Series X 300 Not listed ―
Series Y 2,847,711 BPO.PR.Y Toronto
Series Z 800,000 Not listed ―
Series AA 12,000,000 BPO.PR.A Toronto
Brookfield Office Properties 71
Corporate Information CORPORATE PROFILE Brookfield Office Properties Inc. is a division of Brookfield Property Partners, a global commercial property company that owns, operates and invests in best-in-class office, retail, industrial, multifamily and hotel assets. Brookfield Office Properties owns, develops and manages premier office properties in the United States, Canada, Australia and the United Kingdom. Its portfolio is comprised of interests in 108 properties totaling 86 million square feet in the downtown cores of New York, Washington, D.C., Houston, Los Angeles, Toronto, Calgary, Ottawa, London, Sydney, Melbourne and Perth, making Brookfield the global leader in the ownership and management of office assets. Landmark properties include Brookfield Places in Manhattan, Toronto and Perth, Bank of America Plaza in Los Angeles, Bankers Hall in Calgary and Darling Park in Sydney. For more information, visit www.brookfieldofficeproperties.com. BROOKFIELD OFFICE PROPERTIES Brookfield Place Brookfield Place 250 Vesey Street, 15
th Floor 181 Bay Street, 3
rd Floor
New York, New York 10281 Toronto, Ontario M5J 2T3 Tel: (212) 417-7000 Tel: (416) 369-2300 Fax: (212) 417-7214 Fax: (416) 369-2301 www.brookfieldofficeproperties.com SHAREHOLDER INQUIRIES Brookfield Office Properties welcomes inquiries from shareholders, media representatives and other interested parties. Questions relating to investor relations or media inquiries can be directed to Matt Cherry, Vice President, Investor Relations and Communications at (212) 417-7488 or via e-mail at [email protected]. Shareholder questions relating to dividends, address changes and share certificates should be directed to the company’s Transfer Agent, CST Trust Company, as listed below. CST TRUST COMPANY By mail: P.O. Box 700 Station B Montreal, Quebec, H3B 3K3 By courier: 2001 University Street Suite 1600 Montreal, Quebec, H3A 2A6 Tel: (416) 682-3860; (800) 387-0825 Fax: (888) 249-6189 E-mail: [email protected] Web site: www.canstockta.com

www.brookfieldofficeproperties.com
Related Documents


