CHAPTER 8 ASSET AND LIABILITY MANAGEMENT Chapter Page 8.1 Net Debt and Net Financial Liabilities 251 8.2 Unfunded Superannuation Liability 253 8.3 Management of Financial Assets 259 and Liabilities 2015-16 Budget Paper No. 3 249 Asset and Liability Management

Welcome message from author
This document is posted to help you gain knowledge. Please leave a comment to let me know what you think about it! Share it to your friends and learn new things together.
Transcript

CHAPTER 8
ASSET AND LIABILITY MANAGEMENT Chapter Page 8.1 Net Debt and Net Financial Liabilities 251 8.2 Unfunded Superannuation Liability 253 8.3 Management of Financial Assets 259 and Liabilities
2015-16 Budget Paper No. 3 249 Asset and Liability Management

2015-16 Budget Paper No. 3 250 Asset and Liability Management

8.1 NET DEBT AND NET FINANCIAL LIABILITIES
The ACT continues to maintain a strong balance sheet. The key indicators, measured as a proportion of Gross State Product (GSP) and using the most recent budget documentation, are broadly in line with other jurisdictions.
Table 8.1.1 provides a summary of the key balance sheet measures for the General Government Sector (GGS).
Table 8.1.1 GGS Key Balance Sheet Measures
2014-15 Budget
$m
2014-15 Estimated Outcome
$m
2015-16 Budget
$m
2016-17 Estimate
$m
2017-18 Estimate
$m
2018-19 Estimate
$m
4,435.6 Net Financial Liabilities 4,641.8 5,663.9 6,141.0 6,432.3 6,247.9 1,227.5 Net Debt (excluding super) 1,348.0 2,425.7 2,848.6 3,130.0 2,867.3
16,730.7 Net Worth 16,478.2 16,232.7 16,371.5 16,472.0 16,768.7
Comparisons with other jurisdictions can be found in the Fiscal Strategy (Chapter 2.2).
Net Debt
Net debt is a key balance sheet measure taking into account gross debt liabilities as well as financial assets (such as cash reserves and investments). Table 8.1.2 below presents net debt and net debt to GSP for the GGS.
Table 8.1.2 General Government Sector Net Debt
2014-15 Budget
$m
2014-15 Estimated Outcome
$m
2015-16 Budget
$m
2016-17 Estimate
$m
2017-18 Estimate
$m
2018-19 Estimate
$m
1,227.5 Net debt (excluding super) 1,348.0 2,425.7 2,848.6 3,130.0 2,867.3 3.2% Net debt to GSP 3.7% 6.4% 7.1% 7.5% 6.5%
Net debt over the budget and forward estimates period is positive, indicating that GGS cash reserves and investments are lower than gross debt liabilities. Compared to the 2014-15 Budget, net debt has increased. It is forecast to reach a peak in 2017-18 before declining, reflecting a net increase in borrowings over the budget and two forward years, before reducing as the budget returns to surplus.
The increase of $1,078 million in the 2015-16 Budget compared to the 2014-15 estimated outcome is substantially due to the impact of the loan provided by the Commonwealth to support the Asbestos Eradication Scheme. The increase also reflects borrowings undertaken to support the Territory's capital works program.
The net debt measure includes a provision for Capital Metro. Although the Government intends to fund that project as a Public Private Partnership (PPP), it has adopted the approach of including Capital Metro in the Infrastructure Investment Provision, which gives rise to an impact on net debt. If the project is procured through a PPP, there will be no requirement to debt fund the capital cost of the project.
2015-16 Budget Paper No. 3 251 Net Debt and Net Financial Liabilities

Net Financial Liabilities
Net financial liabilities are a broad measure of GGS liabilities, including net debt and superannuation liabilities. Table 8.1.3 below details net financial liabilities and net financial liabilities to GSP for the GGS.
Table 8.1.3 General Government Sector Net Financial Liabilities
2014-15 Budget
$m
2014-15 Estimated Outcome
$m
2015-16 Budget
$m
2016-17 Estimate
$m
2017-18 Estimate
$m
2018-19 Estimate
$m
4,435.6 Net financial liabilities 4,641.8 5,663.9 6,141.0 6,432.3 6,247.9 11.6% Net financial liabilities to GSP 12.6% 14.9% 15.3% 15.3% 14.2%
Over the budget and first two forward years, net financial liabilities are forecast to increase as further borrowings are undertaken to support capital projects. This estimate includes capital provisions to account for some high value projects for which budgets are either yet to be settled or which are commercially sensitive. This increase is also attributed to a higher forecast superannuation liability. Net financial liabilities are estimated to peak in 2017-18, declining slightly in 2018-19.
The ratio of net financial liabilities to GSP provides an indicator of the sustainability of a jurisdiction’s debt. The ACT’s ratio is broadly in line with other AAA rated jurisdictions. While this ratio is subject to volatility (net financial liabilities in particular can fluctuate, sometimes substantially, depending on the condition of financial markets), it is desirable that it remains broadly stable over time while maintaining sustainable levels of borrowings.
Net Worth
Net worth reflects the value of all financial and non-financial assets less liabilities. The ACT maintains strong positive net worth. Table 8.1.4 below presents net worth and net worth to GSP for the GGS.
Table 8.1.4 General Government Sector Net Worth
2014-15 Budget
$m
2014-15 Estimated Outcome
$m
2015-16 Budget
$m
2016-17 Estimate
$m
2017-18 Estimate
$m
2018-19 Estimate
$m
16,730.7 Net worth 16,478.2 16,232.7 16,371.5 16,472.0 16,768.7 43.9% Net worth to GSP 44.8% 42.6% 40.9% 39.2% 38.0%
Net worth is forecast to increase across the budget and forward estimates from $16.2 billion in 2015-16 to $16.8 billion in 2018-19.
With net worth to GSP at 42.6 per cent, the ACT continues to be one of the strongest of all Australian jurisdictions against this measure.
2015-16 Budget Paper No. 3 252 Net Debt and Net Financial Liabilities

8.2 UNFUNDED SUPERANNUATION LIABILITY
Introduction
ACT Government employees (“employees”) are members of a number of different superannuation schemes as arrangements have changed over time. A large proportion of current full time employees are members of defined benefit superannuation schemes that are closed to new employee members, and where the liabilities are unfunded. All superannuation liabilities incurred for new employees since 1 July 2005 are fully funded through defined contribution scheme arrangements.
Managing the defined benefit superannuation liability over time is a key financial objective of the Government. Unlike other jurisdictions, the Government does not operate a superannuation fund for employees. The Government has established a Superannuation Provision Account (SPA) for the purpose of holding and investing financial assets set aside to meet the Government’s ongoing employer superannuation benefit obligations (emerging cost payments) to the Commonwealth Government.
ACT Government Employee Superannuation Arrangements
Superannuation arrangements for employees vary due to the type of superannuation scheme available at the time of commencing employment. The superannuation arrangements applicable to permanent employees are outlined below.
Defined Benefit Superannuation Schemes
The defined benefit superannuation schemes are the Commonwealth Superannuation Scheme (CSS) and the Public Sector Superannuation Scheme (PSS). The CSS has been closed to new members since 1 July 1990 and the PSS since 30 June 2005.
The CSS and PSS are types of defined benefit superannuation schemes, in which some or all of the benefits payable to members are defined in advance according to a set of formulas which are linked to factors such as years of service, final average salary and level of individual member contribution over time. With the exception of employer productivity contributions, the employer financed component of entitlements is unfunded and is not required to be paid until a member takes his/her benefit entitlement.
The Trustee of the CSS and PSS is the Commonwealth Government agency, Commonwealth Superannuation Corporation (CSC)1. The administration of the CSS and PSS is undertaken by the Commonwealth Government agency, ComSuper1, with all benefits paid to employees by ComSuper. The Government reimburses ComSuper for the annual cost of superannuation benefits paid in respect of current and former employees that reflects the period of service with the ACT Government.
1CSC and ComSuper will merge on 1 July 2015, subject to the passage of the Governance of Australian Government Superannuation Schemes Legislation Amendment Bill 2015 introduced into the Commonwealth House of Representatives on 19 March 2015. The new entity will be called Commonwealth Superannuation Corporation (CSC). The merger will have no impact on scheme rules, member entitlements or services.
2015-16 Budget Paper No. 3 253 Unfunded Superannuation Liability

Public Sector Superannuation Accumulation Plan (PSSap)
From 1 July 2005, all new employees were required to become members of the PSSap, a defined contribution plan (accumulation) arrangement where the employer (ACT Government) is required to contribute 15.4 per cent of an employee’s salary. Existing CSS and PSS members were not able to transfer to the new superannuation scheme. The PSSap closed to new employees on 6 October 2006.
Post 6 October 2006 – Fund of Choice Arrangements
From 6 October 2006, the Government introduced superannuation fund of choice arrangements for all new employees. Employees can elect to join a superannuation fund of their choice. If an employee does not elect a fund, he or she becomes an automatic member of the Government’s appointed default superannuation fund.
The fund of choice arrangement is one where employees must join a defined contribution (accumulation) fund into which the employer (ACT Government) is required to contribute at a minimum, the prevailing superannuation guarantee percentage rate as set by Commonwealth Government legislation. The current employer contribution rate is 9.50 per cent. The Government will contribute an additional 1 per cent for employees who contribute 3 per cent or more of their salary to their chosen fund.
Members of the Legislative Assembly (MLAs)
There are two superannuation arrangements for Members of the ACT Legislative Assembly. Members who were elected before the 2008 general election and have a relevant period of service, and no discontinuance, are members of an unfunded defined benefit superannuation arrangement (DB Scheme), prescribed under the Legislative Assembly (Members’ Superannuation) Act 1991.
Those Members elected at or after the 2008 general election, and who were not an existing member of the DB Scheme prior to the election, assume membership of a choice of fund accumulation scheme. The employer (ACT Government) is required to contribute the equivalent of 14 per cent of the Member’s eligible salary. The Government will contribute an additional 1 per cent for Members who contribute 3 per cent or more of their salary to their chosen fund.
Defined Benefit Unfunded Superannuation Liabilities
The value of accrued defined benefit employer superannuation liabilities is calculated as the present value of the future payment of benefits that have actually accrued in respect of service at the calculation date. This approach is in accordance with AASB 119 Employee Benefits and the requirement to use a projected unit credit valuation approach.
Table 8.2.1 sets out details on the estimation and calculation of the liability.
2015-16 Budget Paper No. 3 254 Unfunded Superannuation Liability
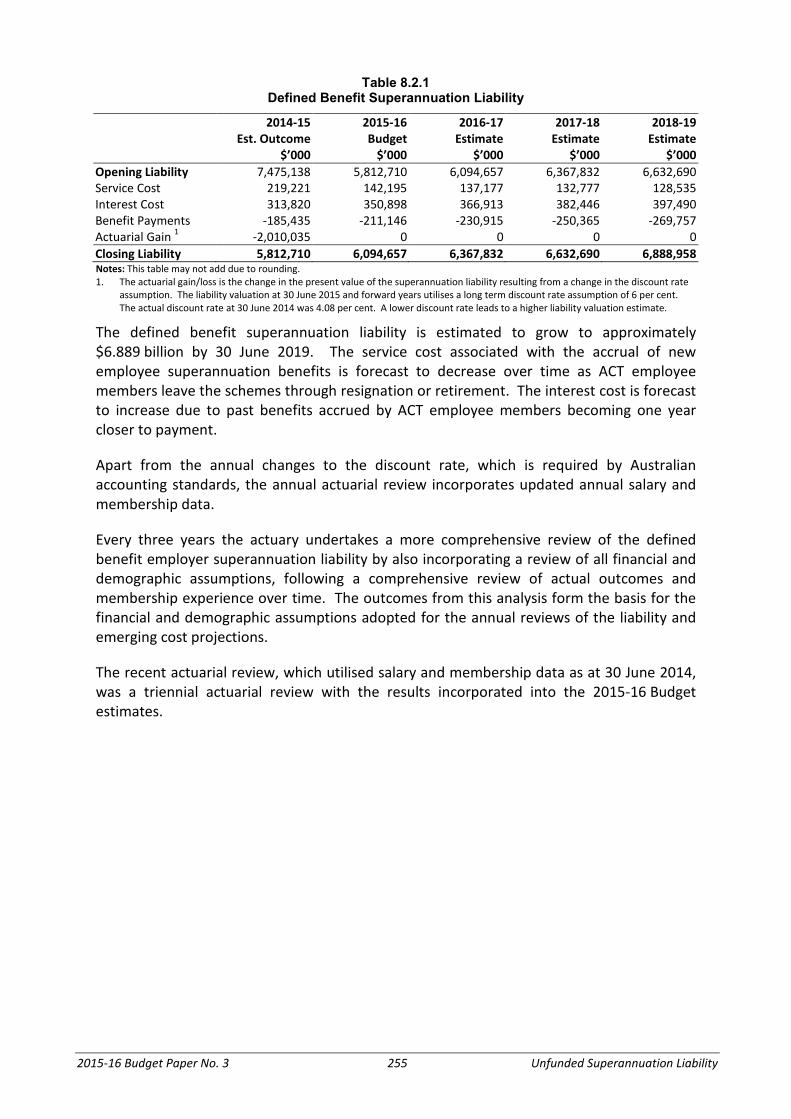
Table 8.2.1 Defined Benefit Superannuation Liability
2014-15
Est. Outcome $’000
2015-16 Budget
$’000
2016-17 Estimate
$’000
2017-18 Estimate
$’000
2018-19 Estimate
$’000 Opening Liability 7,475,138 5,812,710 6,094,657 6,367,832 6,632,690 Service Cost 219,221 142,195 137,177 132,777 128,535 Interest Cost 313,820 350,898 366,913 382,446 397,490 Benefit Payments -185,435 -211,146 -230,915 -250,365 -269,757 Actuarial Gain 1 -2,010,035 0 0 0 0 Closing Liability 5,812,710 6,094,657 6,367,832 6,632,690 6,888,958 Notes: This table may not add due to rounding. 1. The actuarial gain/loss is the change in the present value of the superannuation liability resulting from a change in the discount rate
assumption. The liability valuation at 30 June 2015 and forward years utilises a long term discount rate assumption of 6 per cent. The actual discount rate at 30 June 2014 was 4.08 per cent. A lower discount rate leads to a higher liability valuation estimate.
The defined benefit superannuation liability is estimated to grow to approximately $6.889 billion by 30 June 2019. The service cost associated with the accrual of new employee superannuation benefits is forecast to decrease over time as ACT employee members leave the schemes through resignation or retirement. The interest cost is forecast to increase due to past benefits accrued by ACT employee members becoming one year closer to payment.
Apart from the annual changes to the discount rate, which is required by Australian accounting standards, the annual actuarial review incorporates updated annual salary and membership data.
Every three years the actuary undertakes a more comprehensive review of the defined benefit employer superannuation liability by also incorporating a review of all financial and demographic assumptions, following a comprehensive review of actual outcomes and membership experience over time. The outcomes from this analysis form the basis for the financial and demographic assumptions adopted for the annual reviews of the liability and emerging cost projections.
The recent actuarial review, which utilised salary and membership data as at 30 June 2014, was a triennial actuarial review with the results incorporated into the 2015-16 Budget estimates.
2015-16 Budget Paper No. 3 255 Unfunded Superannuation Liability

Table 8.2.2 ACT Employee Defined Benefit Scheme Membership
Contributors
Deferred Beneficiaries
Current Pensioners
Dependent Pensioners
Total
Group A Members 1 CSS 789 236 5,452 395 6,872 PSS 8,288 8,629 3,372 159 20,448 Total 9,077 8,865 8,825 554 27,320 Group B Members 2 CSS 351 172 908 24 1,455 PSS 3,511 3,371 988 26 7,896 Total 3,862 3,543 1,896 50 9,351 Notes: 1. Group A membership data includes CSS and PSS contributors who were employees of the ACT Government at 30 June 2014 and CSS
and PSS deferred beneficiaries and pensioners who were employees of the ACT Government when their employment ceased. 2. Group B membership data includes CSS and PSS contributors who were not employees of the ACT Government at 30 June 2014, but
were so previously, and CSS and PSS deferred beneficiaries and pensioners who were not employees of the ACT Government when their employment ceased, but were so previously.
The 2015-16 Budget estimates for the liability and emerging cost payments have been impacted by a membership base being higher than assumed at the end of the 2013-14 financial year, higher salary growth, higher pension indexation, higher pension election rates by retiring employees, and an improvement in pensioner mortality expectations.
The impact on the estimates for the projected defined benefit employer superannuation liabilities is illustrated in Figure 8.2.1, with the impact on the benefit payment estimates illustrated in Figure 8.2.2.
Figure 8.2.1 Triennial Actuarial Revision to the Estimated Employer Superannuation Liability
-1,000 2,000 3,000 4,000 5,000 6,000 7,000 8,000 9,000
10,000
Mill
ions
2014-15 Budget Liability 2015-16 Budget Liability
The defined benefit superannuation liability is projected to peak, in nominal terms, at approximately $8.8 billion by 30 June 2033.
2015-16 Budget Paper No. 3 256 Unfunded Superannuation Liability

The impact on the estimates for the Territory’s projected emerging cost payments is illustrated below in Figure 8.2.2.
Figure 8.2.2 Actuarial Revision to Estimated Employer Emerging Cost Payments
-
100
200
300
400
500
600
700
800
Mill
ions
2014-15 Budget Benefits 2015-16 Budget Benefits
The annual superannuation payments (in nominal terms) made to the Commonwealth to extinguish the liability are projected to increase over time from approximately $185 million in 2014-15 to a peak of $685 million by 2043.
The total superannuation payments to the Commonwealth are projected to be approximately $962 million across the 2015-16 Budget and forward years.
Defined Benefit Superannuation Funding
The Government maintains, as a key financial objective, a funding plan to extinguish the Territory’s unfunded defined benefit superannuation liability by way of accumulating funds in the SPA through investment earnings.
The 2015-16 Budget maintains the defined benefit superannuation funding plan with Budget appropriation to the SPA matching the expected annual benefit payments to the Commonwealth. This allows the financial investment assets to grow over time with all investment earnings re-invested, leaving the SPA investment portfolio unencumbered by the management of the cash flows associated with benefit payments.
Details on the budget appropriation to the SPA, projected benefit payments to the Commonwealth, and the estimated investment portfolio assets, investment earnings, and SPA expenses are set out below in Table 8.2.3.
2015-16 Budget Paper No. 3 257 Unfunded Superannuation Liability

Table 8.2.3 Defined Benefit Superannuation Assets
2014-15
Est. Outcome $’000
2015-16 Budget
$’000
2016-17 Budget
$’000
2017-18 Budget
$’000
2018-19 Budget
$’000 Opening Assets 3,030,349 3,358,680 3,609,360 3,879,159 4,169,383 Net Investment Earnings 320,968 256,100 275,213 295,786 317,926 Appropriation 198,209 211,146 230,915 250,365 269,757 Benefit Payments -185,435 -211,146 -230,915 -250,365 -269,757 Other Payments -5,412 -5,418 -5,414 -5,562 -5,561 Closing Assets 3,358,680 3,609,360 3,879,159 4,169,383 4,481,748 Note: This table may not add due to rounding.
The funding plan for the defined benefit superannuation liability will help reduce the longer term cost as investment returns provide a source of funding for future liabilities.
The margin between the estimated liability and investment assets represents the level of unfunded superannuation liability. The estimated funding percentage of the employer superannuation liability over the Budget and forward years is projected to increase as illustrated below in Table 8.2.4.
Table 8.2.4 Superannuation Liability Funding
2014-15
Est. Outcome $’000
2015-16 Budget
$’000
2016-17 Estimate
$’000
2017-18 Estimate
$’000
2018-19 Estimate
$’000 Superannuation Liability1 5,812,710 6,094,657 6,367,832 6,632,690 6,888,958 Investments 3,358,680 3,609,360 3,879,159 4,169,383 4,481,748 Unfunded Liability 2,454,030 2,485,297 2,488,673 2,463,307 2,407,210 Funding Percentage 58% 59% 61% 63% 65% Notes: This table may not add due to rounding. 1. The superannuation liability estimate at 30 June 2015 and across the forward years assumes a long-term discount rate assumption of
6 per cent.
2015-16 Budget Paper No. 3 258 Unfunded Superannuation Liability

8.3 MANAGEMENT OF FINANCIAL ASSETS AND LIABILITIES
Financial Assets
The Territory’s financial assets account for approximately 44 per cent of total assets held by the General Government Sector (GGS).
Figure 8.3.1 shows the proportion of these assets by category. GGS investment in other public sector entities (the Public Trading Enterprise (PTE) sector) makes up almost half of the Territory’s financial assets.
Investments held to meet future liabilities, such as superannuation, also represent a significant portion of total financial assets at 34 per cent.
Figure 8.3.1 General Government Sector – Estimated Financial Assets
Cash and Deposits3%
Advances Paid14%
Investments and Loans34%
Receivables3%
Investment in Other Public Sector Entities
46%
Investments in Other Public Sector Entities
Investments in other public sector entities reflect the GGS investment in the PTE sector as the carrying amount of the net assets held by the sector. Significant assets held by the PTE sector include land, water and sewerage infrastructure, and public housing.
2015-16 Budget Paper No. 3 259 Management of Financial Assets and Liabilities

Financial Investments
The Chief Minister, Treasury and Economic Development Directorate (CMTEDD) manages the Territory Banking Account (TBA) and Superannuation Provision Account (SPA) investment portfolios. These investment portfolios comprise the majority of the Territory’s financial investment assets.
The purpose and role of the investment portfolios is to derive competitive financial returns, based on prudent financial and portfolio management principles, with an investment structure that is low cost, efficient to manage, and effective in deriving market-based returns. These investment assets are managed in accordance with an established Investment Plan and Responsible Investment Policy.
The Government holds significant financial investments. Table 8.3.1 outlines the components of investments held by the GGS, including the TBA and SPA.
Table 8.3.1 General Government Sector Investments
2014-15 2014-15 2015-16 2016-17 2017-18 2018-19 Budget Est. Outcome Budget Estimate Estimate Estimate
$’000 $’000 $’000 % $’000 $’000 $’000
302,963 Cash and Deposits 359,815 317,777 -12 312,802 310,130 306,649 3,854,957 Investments and Loans 4,162,137 4,231,169 2 4,440,287 4,831,265 5,161,601
4,157,920 Total Investments 4,521,952 4,548,946 1% 4,753,089 5,141,395 5,468,250
Comprising:
3,241,212 Superannuation Provision Account 3,354,976 3,605,656 7 3,875,455 4,165,679 4,478,044 79,103 Territory Banking Account 305,233 144,611 -53 141,064 128,761 111,885 26,739 Investments held on behalf of PTE
agencies 112,658 117,495 4 25,888 104,095 103,512
375,020 ACTIA Investments 381,592 348,710 -9 374,466 398,952 422,246 110,179 Home Loan Portfolio1 - - - - - - 325,667 Other GGS agency investments 367,493 332,474 -10 336,216 343,908 352,563
4,157,920 Total Investments 4,521,952 4,548,946 1% 4,753,089 5,141,395 5,468,250
Note: 1. The Home Loan Portfolio investments have been transferred to the Territory Banking Account and the Chief Minister, Treasury and
Economic Development Directorate.
2015-16 Budget Paper No. 3 260 Management of Financial Assets and Liabilities

Territory Banking Account Investment Portfolio
Any cash of the GGS which is not required for immediate expenditure is invested domestically with exposures to shorter term money markets and fixed interest securities, including cash, bank term deposits, bank bill securities, residential mortgage backed securities and bonds issued by the Commonwealth and State Governments and some corporate investment grade bonds. The investments are currently made via allocations to three externally managed funds: the Cash Fund; the Cash Enhanced Fund; and the Fixed Interest Fund.
The estimated 2014-15 net nominal return for the total portfolio of invested funds is 3.4 per cent; this compares to the original Budget estimate of 2.5 per cent, net of fees. The budgeted full year return (net of fees) for 2015-16 is estimated to be 2.4 per cent.
Superannuation Provision Account Investment Portfolio
Funds set aside in the SPA are earmarked to assist the Government in meeting its long-term defined benefit employer superannuation obligations. These funds are invested in accordance with an established Investment Plan and Responsible Investment Policy that takes into account the long-term nature of the superannuation liability and projected cash flow requirements.
The long-term net investment return objective for the SPA is Consumer Price Index (CPI) plus 5 per cent per annum. The investment strategy recognises the risk associated with targeting the long term investment return objective and the asset allocation modelling identifies a risk of negative investment returns once every three to five years.
The long-term strategic asset allocation, consistent with this long-term investment objective, currently equates to 75 per cent of the portfolio being invested in growth assets (such as shares and property) and 25 per cent of the portfolio being invested in defensive assets (such as cash and fixed interest investments).
The nominal net return of the portfolio for 2014-15 is estimated to be 10.7 per cent, with investment earnings of approximately $321 million. The actual net investment return for the 2013-14 financial year was 15.8 per cent with investment earnings of $407 million.
Incorporating the estimated 2014-15 investment return outcome, the SPA portfolio will have generated an annualised net investment return of CPI plus 5.1 per cent over the past 19 years (1996-97 to 2014-15), which is currently ahead of the long-term investment return objective.
Loan Receivables
GGS financial assets include loans provided to Icon Water Ltd, ACTION, CMTEDD (for Community Housing Canberra and Exhibition Park) and the University of Canberra.
2015-16 Budget Paper No. 3 261 Management of Financial Assets and Liabilities

• Icon Water Ltd loans are funded by matching external borrowings from the Territory’s debt issuance program. Forms of funding include inflation-linked bonds, fixed rate medium term notes, and short-term discount securities. Loan maturity dates range from June 2018 to June 2048. The total estimated outstanding principal at 30 June 2015 is $1.492 billion.
• CMTEDD Community Housing Canberra loans have been provided through capital injection appropriations from the budget. The total estimated outstanding principal at 30 June 2015 is $68.112 million (refer to the Summary and Terms of Debt Capital Injection (Appendix N) for further information).
• The University of Canberra loan has been provided from the TBA from a credit facility established by a disallowable instrument. The total estimated outstanding principal at 30 June 2015 is $31.409 million.
• The ACTION loan relates to funding provided from the Commonwealth Government at the commencement of self-government. The loan matures in June 2023. The total estimated outstanding principal at 30 June 2015 is $2.7 million.
• The CMTEDD Exhibition Park loan is to support the development and operation of low cost accommodation facilities. The total estimated outstanding principal at 30 June 2015 is $1.5 million (refer to the Summary and Terms of Debt Capital Injection (Appendix N) for further information).
2015-16 Budget Paper No. 3 262 Management of Financial Assets and Liabilities

Total Liabilities
Figure 8.3.2 demonstrates the proportion of liabilities by category. The majority of the GGS liabilities comprise superannuation (50 per cent) and borrowings (31 per cent).
Further details regarding the superannuation liability can be found in Unfunded Superannuation Liability (Chapter 8.2).
Figure 8.3.2 General Government Sector Liabilities
Deposits Held1%
Advances Received9%
Borrowings31%
Superannuation50%
Employee Benefits 5%
Other provisions0%
Payables4%
Other Liabilities0%
Borrowings
The funding and management of the Government’s financial markets borrowings is undertaken by CMTEDD. The Government’s funding requirements are mainly achieved by the issuance of debt securities in the financial capital markets.
Debt management objectives include: establishing bond lines of select debt maturity and volume (around $500 million); maximising investor diversification; minimising refinancing risk and managing the Government’s liquidity requirements.
Debt securities issued include:
• long-term inflation-linked bonds where the interest and principal repayments are indexed to inflation that feature differing maturity profiles (2020, 2030 and 2048), and the repayment of principal over time or at maturity;
2015-16 Budget Paper No. 3 263 Management of Financial Assets and Liabilities

• nominal bonds where the interest cost (coupon) is fixed for the life of each bond and that feature differing maturity profiles (2018, 2020, 2022 and 2024), with the repayment of principal at maturity; and
• short-term discount debt securities with maturities of less than 12 months.
The debt funding program was supplemented in 2014-15 by a loan provided from the Commonwealth to support the funding of the costs of the Asbestos Eradication Scheme.
A summary of the current borrowing estimates for the 2015-16 Budget are detailed below in Tables 8.3.2 and 8.3.3.
Table 8.3.2 Territory Borrowings – Principal Outstanding
2014-15 Budget
2014-15 Est. Outcome
2015-16 Budget
2016-17 Estimate
2017-18 Estimate
2018-19 Estimate
$m $m $m $m $m $m General Government Sector
2,146.0 Market Borrowings 1,644.6 2,244.7 2,695.0 3,045.2 2,846.6 79.4 Historic Commonwealth Loans
(self-government) 79.4 75.7 71.8 67.8 63.7
0 Commonwealth Loan – Asbestos Eradication Scheme
750.0 1,000.0 1,000.0 950.0 900.0
2,225.4 Sub-Total 2,474.0 3,320.4 3,766.8 4,063.0 3,810.3 Public Trading Enterprise Sector
1,509.6 Market Borrowings 1,490.2 1,582.0 1,677.9 1,755.3 1,798.4 72.2 Historic Commonwealth Loans
(self-government) 72.2 67.5 62.8 58.1 53.5
1,581.8 Sub-Total 1,562.4 1,649.5 1,740.7 1,813.4 1,851.9
3,807.2 Total 1 4,036.4 4,969.9 5,507.5 5,876.4 5,662.2 Note: 1. Refer to sum of ‘Advances Received’ and ‘Other Borrowings’ Table I.6, Consolidated Financial Statements – Public Trading Enterprises
and Total Territory (Appendix I).
2015-16 Budget Paper No. 3 264 Management of Financial Assets and Liabilities

Table 8.3.3 Territory Borrowings – Interest Expense
2014-15 Budget
2014-15 Est. Outcome
2015-16 Budget
2016-17 Estimate
2017-18 Estimate
2018-19 Estimate
$m $m $m $m $m $m General Government Sector
82.1 Market Borrowings 71.4 89.2 99.7 113.7 118.7 4.1 Historic Commonwealth
Loans (self-government) 4.1 3.9 3.7 3.5 3.3
0 Commonwealth Loan – Asbestos Eradication Scheme
8.2 26.7 27.0 27.0 25.7
86.2 Sub-Total 83.7 119.8 130.4 144.2 147.7 Public Trading Enterprise
Sector
79.7 Market Borrowings 70.3 79.1 83.6 86.0 81.5 3.5 Historic Commonwealth
Loans (self-government) 3.5 3.2 3.0 2.8 2.6
83.2 Sub-Total 73.8 82.3 86.6 88.8 84.1
169.4 Total1 157.5 202.1 217.0 233.0 231.8 Note: 1. Refer to ’Interest Expenses’, Table I.5, Consolidated Financial Statements – Public Trading Enterprises and Total Territory
(Appendix I).
General Government Sector
Total market financed borrowings for the GGS are estimated to be $1.645 billion as at 30 June 2015 compared with the 2014-15 Budget estimate of $2.146 billion. No new long-term GGS borrowings were required in 2014-15 as a result of actual cash flows and liquidity outcomes.
It is estimated that there will be a net increase in GGS borrowings of $1.2 billion (excluding the Commonwealth loan supporting the Asbestos Eradication Scheme) over the 2015-16 Budget and forward estimates period. This increase is consistent with the borrowing plan estimated in the 2014-15 Budget (a $1.1 billion increase over the 2014-15 Budget and forward estimates). The 2015-16 borrowing plan reflects re-profiling of borrowing requirements due to prevailing cash flow and liquidity requirements.
The borrowings in the forward years are largely to support future capital projects. Capital provisions are included in these estimates to account for some high value projects for which budgets are either yet to be settled or which are commercially sensitive. As planning or procurement progresses, future Territory budgets will contain specific financial details for these projects. However, these projects may be procured as Public Private Partnerships, in which case the direct borrowing associated with the future works provision in the 2015-16 Budget may not eventuate.
2015-16 Budget Paper No. 3 265 Management of Financial Assets and Liabilities

Public Trading Enterprise Sector
Total market-financed borrowings for the Public Trading Enterprise (PTE) sector are estimated to be $1.490 billion as at 30 June 2015 compared with the 2014-15 Budget estimate of $1.510 billion. The decrease is due to Icon Water having a lower new borrowing requirement and higher than anticipated inflation-linked bond principal repayments.
It is estimated that there will be a net increase in PTE market-financed borrowings (for Icon Water) of $308.2 million over the 2015-16 Budget and forward estimates period. This increase is slightly lower than the funding requirements estimated in the 2014-15 Budget (a $365.8 million increase over the 2014-15 Budget and forward estimates).
Total Outstanding Borrowings
Figure 8.3.3 shows the total outstanding principal value of borrowings by funding type and year of maturity estimated as at 30 June 2015.
Figure 8.3.3 Total External Territory Borrowings
0.0
200.0
400.0
600.0
800.0
1,000.0
1,200.0
1,400.0
<12-months 2018 maturity 2020 maturity 2022 maturity 2024 maturity 2030 maturity 2040 maturity
Short-Term Notes Fixed Rate Medium Term Bonds Inflation-Linked Bonds Commonwealth Government Loans
Curr
ent O
utst
andi
ngVa
lue
($ m
illio
n)
2015-16 Budget Paper No. 3 266 Management of Financial Assets and Liabilities
Related Documents