Isotopes in Environmental and Health Studies Vol. 39, No. 4, December 2003, pp. 259–272 BOX-MODELING OF BONE AND TOOTH PHOSPHATE OXYGEN ISOTOPE COMPOSITIONS AS A FUNCTION OF ENVIRONMENTAL AND PHYSIOLOGICAL PARAMETERS* C. LANGLOIS a,y , L. SIMON a and CH. LE ´ CUYER a,b a Laboratoire Pale ´oenvironnements et Pale ´obiosphe `re, UMR CNRS 5125, ba ˆtiment Ge ´ode, Universite ´ Claude Bernard Lyon 1, 69622 Villeurbanne, France; b Institut Universitaire de France, 103 boulevard Saint-Michel, 75005 Paris, France (Received 9 December 2002; In final form 20 April 2003) A time-dependent box model is developed to calculate oxygen isotope compositions of bone phosphate as a function of environmental and physiological parameters. Input and output oxygen fluxes related to body water and bone reservoirs are scaled to the body mass. The oxygen fluxes are evaluated by stoichiometric scaling to the calcium accretion and resorption rates, assuming a pure hydroxylapatite composition for the bone and tooth mineral. The model shows how the diet composition, body mass, ambient relative humidity and temperature may control the oxygen isotope composition of bone phosphate. The model also computes how bones and teeth record short-term variations in relative humidity, air temperature and d 18 O of drinking water, depending on body mass. The documented diversity of oxygen isotope fractionation equations for vertebrates is accounted for by our model when for each specimen the physiological and diet parameters are adjusted in the living range of environmental conditions. Keywords: Body water; Bone; Box-modeling; Oxygen isotope; Paleoenvironment; Phosphate; Tooth INTRODUCTION Stable isotope compositions of phosphatic tissues from terrestrial vertebrates have been recognized as pertinent proxies of their living environments ever since Longinelli’s pioneer work [1]. Thereafter numerous studies have attempted to assess the ecological parameters of various fossil animals from their oxygen, carbon or nitrogen isotope contents [2]. Never- theless, empirical studies of the phosphate oxygen isotope composition of various animals, mainly mammals, revealed complex relationships with environmental parameters such as sur- face water or rainfall compositions, air temperature, and relative humidity [3–5]. Moreover, the environmental record is disturbed by the metabolic activity and diet of animals [6, 7]. Modeling the isotopic composition of phosphatic tissues is a remarkable approach to con- * The code to perform calculations is available upon request to the first author. y Corresponding author. Tel.: 33 (0)4 72 44 58 02; E-mail: [email protected] ISSN 1025-6016 print; ISSN 1477-2639 online # 2003 Taylor & Francis Ltd DOI: 10.1080=10256010310001621146

Welcome message from author
This document is posted to help you gain knowledge. Please leave a comment to let me know what you think about it! Share it to your friends and learn new things together.
Transcript

Isotopes in Environmental and Health Studies
Vol. 39, No. 4, December 2003, pp. 259–272
BOX-MODELING OF BONE AND TOOTHPHOSPHATE OXYGEN ISOTOPE COMPOSITIONSAS A FUNCTION OF ENVIRONMENTAL AND
PHYSIOLOGICAL PARAMETERS*
C. LANGLOISa,y, L. SIMONa and CH. LECUYERa,b
aLaboratoire Paleoenvironnements et Paleobiosphere, UMR CNRS 5125, batiment Geode,Universite Claude Bernard Lyon 1, 69622 Villeurbanne, France; bInstitut Universitaire de France,
103 boulevard Saint-Michel, 75005 Paris, France
(Received 9 December 2002; In final form 20 April 2003)
A time-dependent box model is developed to calculate oxygen isotope compositions of bone phosphate as a functionof environmental and physiological parameters. Input and output oxygen fluxes related to body water and bonereservoirs are scaled to the body mass. The oxygen fluxes are evaluated by stoichiometric scaling to the calciumaccretion and resorption rates, assuming a pure hydroxylapatite composition for the bone and tooth mineral. Themodel shows how the diet composition, body mass, ambient relative humidity and temperature may control theoxygen isotope composition of bone phosphate. The model also computes how bones and teeth record short-termvariations in relative humidity, air temperature and d18O of drinking water, depending on body mass. Thedocumented diversity of oxygen isotope fractionation equations for vertebrates is accounted for by our modelwhen for each specimen the physiological and diet parameters are adjusted in the living range of environmentalconditions.
Keywords: Body water; Bone; Box-modeling; Oxygen isotope; Paleoenvironment; Phosphate; Tooth
INTRODUCTION
Stable isotope compositions of phosphatic tissues from terrestrial vertebrates have been
recognized as pertinent proxies of their living environments ever since Longinelli’s pioneer
work [1]. Thereafter numerous studies have attempted to assess the ecological parameters
of various fossil animals from their oxygen, carbon or nitrogen isotope contents [2]. Never-
theless, empirical studies of the phosphate oxygen isotope composition of various animals,
mainly mammals, revealed complex relationships with environmental parameters such as sur-
face water or rainfall compositions, air temperature, and relative humidity [3–5]. Moreover,
the environmental record is disturbed by the metabolic activity and diet of animals [6, 7].
Modeling the isotopic composition of phosphatic tissues is a remarkable approach to con-
* The code to perform calculations is available upon request to the first author.y Corresponding author. Tel.: 33 (0)4 72 44 58 02; E-mail: [email protected]
ISSN 1025-6016 print; ISSN 1477-2639 online # 2003 Taylor & Francis LtdDOI: 10.1080=10256010310001621146
strain the respective influences of the environmental, physiological and behavioural para-
meters. Indeed, the oxygen isotope records in biogenic apatites (bone, tooth) have been
extensively used as proxies of past surface water isotopic values [8], themselves known to
be related to mean air temperatures [9–11].
Some authors [7, 12, 13] have already attempted to model the relationships between the
environmental parameters and the d18O value of body water. In the frame of these models,
body water is treated as a unique reservoir exchanging oxygen isotopes with the environ-
ment, which is itself considered as an infinite reservoir. The d18O value of the phosphatic
tissue is calculated from the body water composition taking into account a temperature-
dependent fractionation factor derived from the equation proposed by Longinelli and Nuti
[14]. In our time-dependent box-model, the animal reservoirs are the bone mineral, the
tooth enamel and the body water, that are connected by elemental and isotopic fluxes of
bone accretion, bone resorption, and tooth enamel accretion. These body reservoirs are them-
selves connected by fluxes with external reservoirs that contain oxygen sources used during
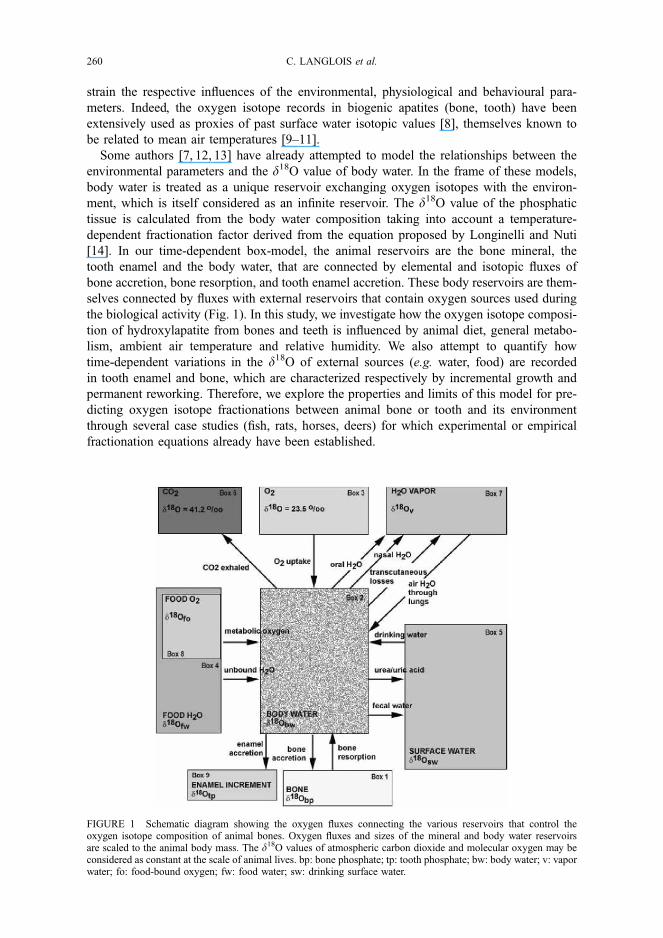
the biological activity (Fig. 1). In this study, we investigate how the oxygen isotope composi-
tion of hydroxylapatite from bones and teeth is influenced by animal diet, general metabo-
lism, ambient air temperature and relative humidity. We also attempt to quantify how
time-dependent variations in the d18O of external sources (e.g. water, food) are recorded
in tooth enamel and bone, which are characterized respectively by incremental growth and
permanent reworking. Therefore, we explore the properties and limits of this model for pre-
dicting oxygen isotope fractionations between animal bone or tooth and its environment
through several case studies (fish, rats, horses, deers) for which experimental or empirical
fractionation equations already have been established.
FIGURE 1 Schematic diagram showing the oxygen fluxes connecting the various reservoirs that control theoxygen isotope composition of animal bones. Oxygen fluxes and sizes of the mineral and body water reservoirsare scaled to the animal body mass. The d18O values of atmospheric carbon dioxide and molecular oxygen may beconsidered as constant at the scale of animal lives. bp: bone phosphate; tp: tooth phosphate; bw: body water; v: vaporwater; fo: food-bound oxygen; fw: food water; sw: drinking surface water.
260 C. LANGLOIS et al.

FORMULATION OF THE MODEL
The Mathematical Formalism
The different reservoirs and connecting oxygen fluxes of the model are represented in
Figure 1. The mass transfer between reservoirs is treated by first-order kinetic reactions
[15]. Using the same formalism as used by Albarede et al. [16], the mass conservation of
oxygen for a reservoir i leads to define:
dMi
dt¼
Xj 6¼i
Qj!i �Xj 6¼i
Qi!j, (1)
where Mi is the mass of the box i, t is the time and Qi!j is the mass flux from box i to box j.
The mass conservation of 18O with the concentration Ci in the reservoir i is
dCi
dt¼ �
Xi6¼j
Qi!jKi!j
Mi
þXi6¼j
Qj!i � Qi!j
Mi
" #Ci þ
Pj 6¼i Qj!iKj!i
Mi
Cj, (2)
where Ki!j is the enrichment factor of 18O due to the fractionation of oxygen isotopes upon
transferring from box i to box j. All isotopic values are expressed on the d scale in ‰
SMOW: d18O¼ 1000[(Rsample=Rstandard)7 1], where Rsample and Rstandard are the molar ratios
of the heavier to the lighter isotopes.
Oxygen Fluxes between Reservoirs
Oxygen fluxes are scaled to the animal energetic requirements, according to the method
developed by Kohn [12]. The oxygen need of a given animal is estimated on the basis of
its metabolic rate that relates with the body mass, M, as a power function: E¼ aMb. The a
and b coefficients are assigned depending on the animal and its diet (e.g. herbivorous
mammal, carnivorous mammal, rodent, reptile, fish), according to equations reported in
[17–20] (see Tab. I). Atmospheric oxygen uptake is proportional to the energy requirement
by using a given oxygen conversion factor [12]. According to Kohn’s model [12], all envir-
onmental fluxes are based on this basic scaling law, and are calculated on the basis of the
physiological parameters summarized in Table I. Input oxygen fluxes to the animal body
are (1) air through the lungs and associated water vapor, (2) food, and (3) drinking water
(see more details in Fig. 1). Output oxygen fluxes from the animal body are (1) faeces
and urinary water, (2) urea or uric acid, (3) transcutaneous and exhaled water vapor (via
respiration or, for some mammals like carnivores, via panting), and (4) expired carbon
dioxide.
The oxygen fluxes between body water and bone phosphate have been stoichiometrically
calculated from calcium fluxes considering the phosphate group (PO3�4 ) of the bone apatite
(Ca10(PO4)6(OH)2). We thus estimate the phosphate oxygen content of bone from its calcium
content which is 1.65% of the total body weight according to [21]. In the absence of better
constrained data, this value was used for all the studied species. Calcium fluxes for different
kinds of animals have been compiled [22–29]. Adult vertebrates have similar rates of bone
accretion and resorption, leading to a global steady state of the skeleton mass. The calcium
accretion and resorption rates, called Voþ and Vo�, respectively, are computed from litera-
ture data [22–29] after selection of the pathological-free animals:
Voþ (mg=day) ¼ Vo� ¼ 140:65M 0:64 (R2 ¼ 0:68): (3)
BOX-MODELING OF PHOSPHATE OXYGEN ISOTOPES 261
Considering the biological mechanism of bone reworking that occurs from its outer sur-
face, the relation linking calcium fluxes (accretion and resorption rates) and bone or body
mass is expected to have the form of a 2=3 (surface=volume) exponent power relation.
Therefore we propose a general scaling relation:
Voþ (mg=day) ¼ 140M 2=3: (4)
Tooth enamel is modeled by incremental growth; each increment is a reservoir with a sur-
face of 30� 0.1 mm2. The growth rate is 3.5 mm=day over a period of 10 days, according to
available data on the morphology and growth of human teeth [30]. After 10 days, a new
increment is added to the existing tooth enamel crown. Similar tooth growth rates are
assumed for modeled animals. In the case of rodents, tooth growth rates are of the same
order of magnitude as human tooth [31].
Oxygen Isotope Fractionations through Mass Transfer
The mechanism of bone resorption does not introduce any isotopic fractionation as the
degraded tissue is quantitatively destroyed before the synthesis of a new one. On the contrary,
the fractionation factor between the newly synthesized bone and body water is calculated
from the equation determined by Longinelli and Nuti [14] that relates the d18O values of
trace phosphate present in marine invertebrate carbonate shells and the ambient water. The
flux of water through the body of marine invertebrates is so high that the d18O value of
their body water is maintained similar to that of ambient water. It means that for a given
body temperature, the fractionation value deduced from Longinelli and Nuti’s equation
[14] may be used to calculate the bone phosphate–body water fractionation. Isotopic fractio-
nation factors associated with other oxygen fluxes are taken from previously published
studies [9, 12, 32, 33]. Some assumptions are also required in the frame of this model.
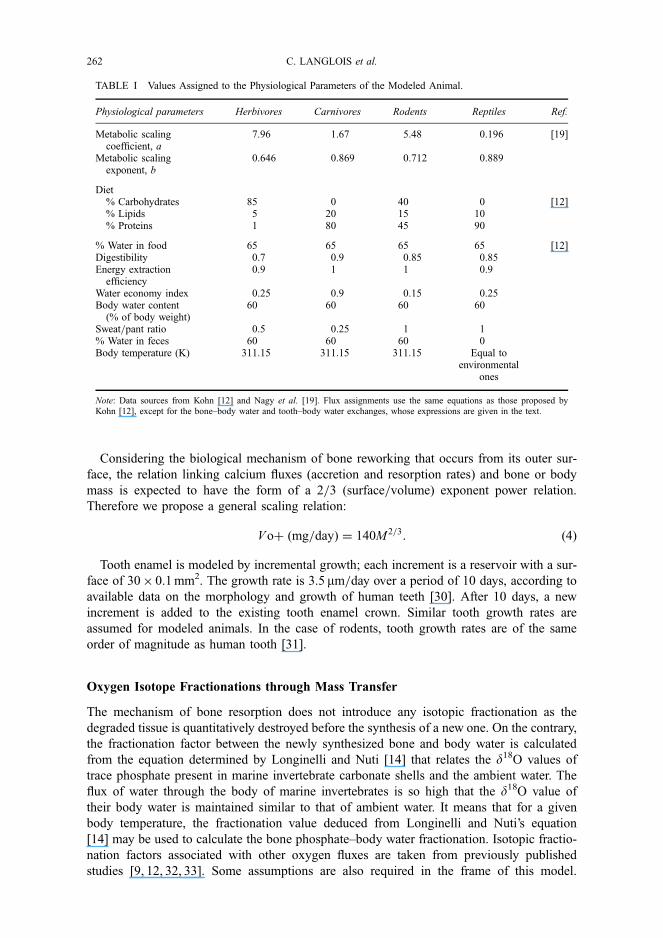
TABLE I Values Assigned to the Physiological Parameters of the Modeled Animal.
Physiological parameters Herbivores Carnivores Rodents Reptiles Ref.
Metabolic scalingcoefficient, a
7.96 1.67 5.48 0.196 [19]
Metabolic scalingexponent, b
0.646 0.869 0.712 0.889
Diet% Carbohydrates 85 0 40 0 [12]% Lipids 5 20 15 10% Proteins 1 80 45 90
% Water in food 65 65 65 65 [12]Digestibility 0.7 0.9 0.85 0.85Energy extraction
efficiency0.9 1 1 0.9
Water economy index 0.25 0.9 0.15 0.25Body water content
(% of body weight)60 60 60 60
Sweat=pant ratio 0.5 0.25 1 1% Water in feces 60 60 60 0Body temperature (K) 311.15 311.15 311.15 Equal to
environmentalones
Note: Data sources from Kohn [12] and Nagy et al. [19]. Flux assignments use the same equations as those proposed byKohn [12], except for the bone–body water and tooth–body water exchanges, whose expressions are given in the text.
262 C. LANGLOIS et al.
For example, the d18O of oxygen from food ingested by herbivorous animals is considered
equal to the d18O of food cellulose, the latter being itself related to the surface water d18O
value. Leaf water and then leaf cellulose are 18O-enriched relative to stem water during
the process of evapotranspiration. The proportions of stem and leaves are the input para-
meters which can be adjusted depending on the available information related to animal diets.
The d18O values of atmospheric carbon dioxide and molecular oxygen are þ41.2‰ and
þ23.5‰, respectively [32]. Carbon dioxide is at isotopic equilibrium with ocean water and
its value is fixed by the mean Earth surface temperature. As carbon dioxide is a by-product
of metabolism, a precise knowledge of its isotopic composition does not influence the isotopic
composition of animal tissues. The isotopic composition of molecular oxygen results from the
so-called ‘Dole’ effect, i.e. the budget between photosynthesis and respiration. If measurements
are not available, the d18O values of surface water are estimated from the linear relationship
between the isotopic composition of meteoric waters and the mean air temperature [9]. The
water vapor isotope composition is calculated using the vapor–liquid water fractionation
equation given by Horita and Wesolowski [33], which is also very close to that of Majoube
[34]. Fractionation factors between body water and water vapor and between body water
and liquid surface water are calculated from equations x and c (Tab. II). Isotopic fractionations
related to the inhaled water vapor, water and bound oxygen derived from diet depend on
temperature, saturated water vapor pressure and relative humidity (Tab. II).
RESULTS OF THE MODEL
Aquatic Animals
A preliminary test may be performed to validate the model. Heterothermic aquatic animals
such as fish are exposed to a large exchange of water between their bodies and the environ-
ment (‘fast water turnover’) and their body temperature is fixed by the temperature of the
surrounding waters. We keep in mind that these rules are not checked for some big animals
like tunas and large reptiles for which their body temperature may differ from the ambient
one because of specific metabolic activities or mass homeothermy. In contrast to the case
of terrestrial animals, modeling the aquatic animals requires removing from the model the
water vapor reservoir and the related fluxes. Moreover, isotope compositions of dissolved
oxygen and carbon dioxide differ from the atmospheric reservoirs.
Assuming a water turnover that is one hundred times higher for aquatic animals than for
terrestrial ones [18], phosphate–water fractionation factors are computed for a temperature
range from 0 to 30 �C (Fig. 2). In the case of fish, our computed equation
T (�C) ¼ �4:31Dþ 111:3 with D ¼ d18O(PO4) � d18O(H2O) (5)
well matches the equation determined by Kolodny et al. [35],
T (�C) ¼ �4:38Dþ 113:3 (6)
on the basis of d18O measurements of modern fresh and sea water fish that lived under var-
ious latitudes. In the case of aquatic homeotherms (e.g. cetaceans), their oxygen isotope com-
positions are controlled by the composition of the ambient marine water (d18O¼ 0‰). This
property results from a phosphate–water isotopic fractionation value that is set by the internal
body temperature close to 38 �C [12]. It is noteworthy that our computed fractionation value
of about 17‰ (Fig. 2) is comparable to the value of 17.8‰ deduced from a set of measure-
ments performed on fluvial and marine modern cetaceans [36].
BOX-MODELING OF PHOSPHATE OXYGEN ISOTOPES 263
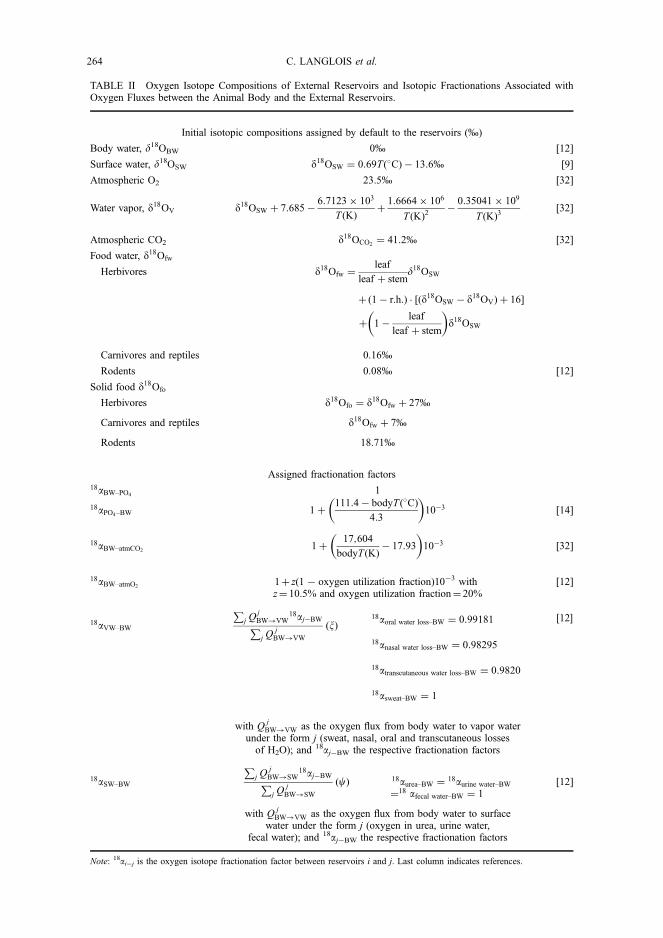
TABLE II Oxygen Isotope Compositions of External Reservoirs and Isotopic Fractionations Associated withOxygen Fluxes between the Animal Body and the External Reservoirs.
Initial isotopic compositions assigned by default to the reservoirs (‰)
Body water, d18OBW 0‰ [12]
Surface water, d18OSW d18OSW ¼ 0:69T(�C) � 13:6‰ [9]
Atmospheric O2 23.5‰ [32]
Water vapor, d18OV d18OSW þ 7:685 �6:7123 � 103
T (K)þ
1:6664 � 106
T (K)2�
0:35041 � 109
T (K)3[32]
Atmospheric CO2 d18OCO2¼ 41:2‰ [32]
Food water, d18Ofw
Herbivores d18Ofw ¼leaf
leaf þ stemd18OSW
þ (1 � r.h.) � [(d18OSW � d18OV) þ 16]
þ 1 �leaf
leaf þ stem
� �d18OSW
Carnivores and reptiles 0.16‰
Rodents 0.08‰ [12]
Solid food d18Ofo
Herbivores d18Ofo ¼ d18Ofw þ 27‰
Carnivores and reptiles d18Ofw þ 7‰
Rodents 18.71‰
Assigned fractionation factors18aBW–PO4
1
18aPO4–BW 1 þ111:4 � bodyT (�C)
4:3
� �10�3 [14]
18aBW–atmCO21 þ
17;604
bodyT (K)� 17:93
� �10�3 [32]
18aBW–atmO21þ z(17 oxygen utilization fraction)10�3 withz¼ 10.5% and oxygen utilization fraction¼ 20%
[12]
18aVW–BW
Pj Q
jBW!VW
18aj�BWPj Q
jBW!VW
(x)18aoral water loss–BW ¼ 0:99181
18anasal water loss–BW ¼ 0:98295
18atranscutaneous water loss–BW ¼ 0:9820
18asweat–BW ¼ 1
½12�
with Qj
BW!VW as the oxygen flux from body water to vapor waterunder the form j (sweat, nasal, oral and transcutaneous losses
of H2O); and 18aj�BW the respective fractionation factors
18aSW–BW
Pj Q
jBW!SW
18aj�BWPj Q
jBW!SW
(c) 18aurea–BW ¼ 18aurine water–BW
¼18 afecal water–BW ¼ 1[12]
with Qj
BW!VW as the oxygen flux from body water to surfacewater under the form j (oxygen in urea, urine water,
fecal water); and 18aj�BW the respective fractionation factors
Note: 18ai�j is the oxygen isotope fractionation factor between reservoirs i and j. Last column indicates references.
264 C. LANGLOIS et al.

Terrestrial Animals
Computed oxygen isotope fractionation equations for mammals are compared with those
deduced from measurements performed on modern animals. These tests are more pertinent
for herbivorous than for carnivorous mammals because the oxygen isotope composition of
their diet can be estimated from the environmental parameters, hence limiting the number
of unconstrained input parameters.
Two empirical equations for horse bones and teeth were determined by Sanchez-Chillon
et al. [37] and Bryant et al. [38]. In order to obtain reasonable surface water (SW) isotope
compositions, we use Bowen et al.’s [39] formula [Eq. (7)] that relates the d18O value of
meteoric waters to the latitude and altitude.
d18OSW ¼ �0:0051(jLatitudej)2 þ 0:1805jLatitudej � 0:002 Altitude � 5:247: (7)
For a given relative humidity and altitude, the d18O values are calculated for various latitudes.
The ambient temperatures are deduced from Dansgaard’s [9] formula:
T (�C) ¼d18OSW þ 13:6
0:69(8)
The model d18O values of phosphates are calculated as a function of water d18O values and
air temperatures by using Eqs. (7) and (8), along with the set of fixed oxygen fluxes and iso-
topic fractionations given in Tables I and II (Fig. 3). Two model equations are proposed for a
diet leaf=(leafþ stem) ratio of 0.5 and 1, respectively. They bracket the two empirical equa-
tions and have similar slopes, while the intercept of these model equations clearly depends on
the animal diet. In the case of these herbivorous mammals, the oxygen isotope composition
FIGURE 2 Modeled phosphate–environmental water and phosphate–body water oxygen isotope fractionations forfish and cetaceans in relation with the oxygen isotope composition and the temperature of ambient water. The d18Ovalue of seawater is set to 0‰ and the temperature range covers the temperature variations of seawater at the surfaceof the Earth. The phosphate–environmental water relation determined by Kolodny et al. [35] for fish phosphate (greyline) is reported for comparison with the modeled isotopic fractionations for a fish of 1 kg (black line with filleddiamonds) and a cetacean of 1000 kg (black line with filled triangles).
BOX-MODELING OF PHOSPHATE OXYGEN ISOTOPES 265

of the food cannot be neglected in the isotopic budget of phosphatic tissues, even though
drinking water remains the main source controlling the composition of horse bones.
In addition to the sensitive diet parameter, body mass, relative humidity and temperature of
air also influence the oxygen isotope composition of terrestrial mammal apatite as shown in
Figure 4. In a general trend of decreasing phosphate–water fractionations (D) with increasing
temperatures, increasing air humidities are responsible for a strong decrease of D. With
the increase of the animal mass, the slopes of fractionation equations decrease. Respective
FIGURE 4 Respective influences of the relative air humidity (r.h.), external temperature, and body mass on thephosphate–surface water oxygen isotope fractionation for modeled herbivorous mammals. Increase in the body massreduces the slopes of the fractionation lines whereas an increase in the air humidity causes a lowering of thephosphate–water fractionation.
FIGURE 3 Modeled and empirical phosphate d18O values for a large mammal herbivore (horse) reported againstd18O values of environmental waters. The empirical phosphate–water fractionation equations were determined byBryant et al. [38] and Sanchez-Chillon et al. [37] on the basis of horse bones and teeth. The mammal is modeled onthe basis of a body weight of 240 kg and a 65% relative air humidity. For a comparison with horse data, water d18Ovalues are calculated by using Eq. (7) for an altitude of 200 m and longitudes from 0 to 90 �N.
266 C. LANGLOIS et al.
contributions of these parameters on both the slope and the intercept of the oxygen isotope
fractionation lines may partly explain the scattering commonly observed within the data
obtained from animals living in their natural environment.
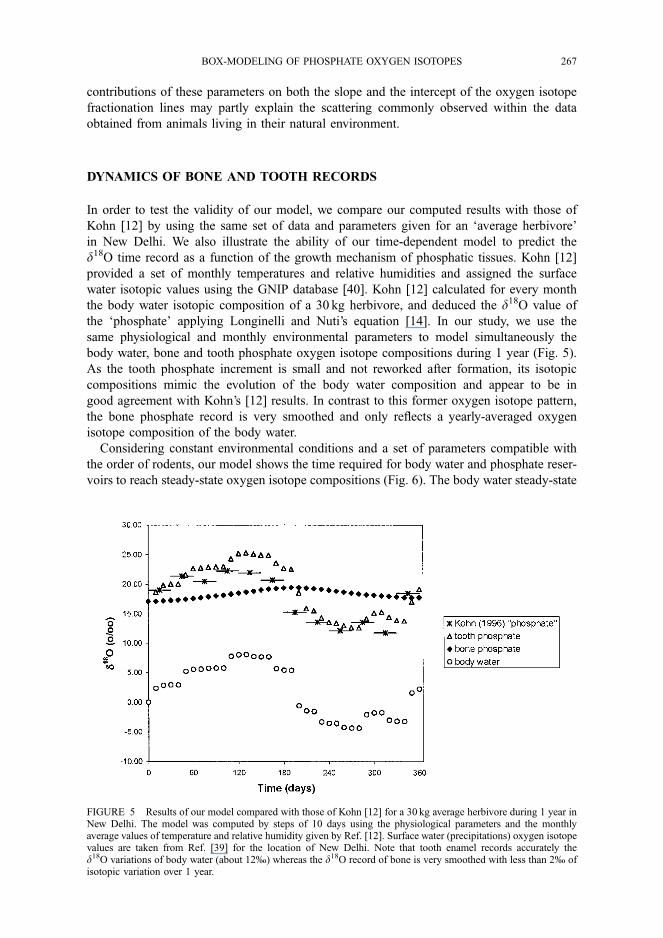
DYNAMICS OF BONE AND TOOTH RECORDS
In order to test the validity of our model, we compare our computed results with those of
Kohn [12] by using the same set of data and parameters given for an ‘average herbivore’
in New Delhi. We also illustrate the ability of our time-dependent model to predict the
d18O time record as a function of the growth mechanism of phosphatic tissues. Kohn [12]
provided a set of monthly temperatures and relative humidities and assigned the surface
water isotopic values using the GNIP database [40]. Kohn [12] calculated for every month
the body water isotopic composition of a 30 kg herbivore, and deduced the d18O value of
the ‘phosphate’ applying Longinelli and Nuti’s equation [14]. In our study, we use the
same physiological and monthly environmental parameters to model simultaneously the
body water, bone and tooth phosphate oxygen isotope compositions during 1 year (Fig. 5).
As the tooth phosphate increment is small and not reworked after formation, its isotopic
compositions mimic the evolution of the body water composition and appear to be in
good agreement with Kohn’s [12] results. In contrast to this former oxygen isotope pattern,
the bone phosphate record is very smoothed and only reflects a yearly-averaged oxygen
isotope composition of the body water.
Considering constant environmental conditions and a set of parameters compatible with
the order of rodents, our model shows the time required for body water and phosphate reser-
voirs to reach steady-state oxygen isotope compositions (Fig. 6). The body water steady-state
FIGURE 5 Results of our model compared with those of Kohn [12] for a 30 kg average herbivore during 1 year inNew Delhi. The model was computed by steps of 10 days using the physiological parameters and the monthlyaverage values of temperature and relative humidity given by Ref. [12]. Surface water (precipitations) oxygen isotopevalues are taken from Ref. [39] for the location of New Delhi. Note that tooth enamel records accurately thed18O variations of body water (about 12‰) whereas the d18O record of bone is very smoothed with less than 2‰ ofisotopic variation over 1 year.
BOX-MODELING OF PHOSPHATE OXYGEN ISOTOPES 267

value is obtained after a few days whereas several months or years are required for bones,
which is in good agreement with the experimental results obtained on rats by Longinelli
and Peretti-Padalino [43]. The time required for reaching steady-state isotopic compositions
of bones increases with the increasing mass of the animal (Fig. 6).
When simulating sinusoidal seasonal variations in the oxygen isotope composition of surface
water, this sinusoidal isotopic signal is preserved in body waters and teeth whatever the animal
mass (Fig. 7). The mode of isotopic record through time of the environmental parameters in
bones depends on the animal mass. Indeed, the amplitude of the computed isotopic records
in bones decreases with the increasing animal mass (Fig. 7). We emphasize that very smoothed
FIGURE 6 Computed evolution over 3 years of oxygen isotope compositions of both body water and bonephosphate from rodents that tend to reach steady-state values depending on the body mass.
FIGURE 7 Oxygen isotope records in body water and bone phosphate when herbivorous mammals are exposedto seasonal changes in the isotopic composition of drinking water. Note that the amplitude of the original sinusoidalsignal decreases with the increasing animal mass. Furthermore, time shifts of about 2–4 months, relative to the inputsurface water isotopic signal, appear in the records of animal bones with body masses of 0.5 and 50 kg, respectively.
268 C. LANGLOIS et al.
isotopic records in the bones of animals whose mass exceeds 50 kg will be potentially difficult
to use as proxies of short-term variations with time in the d18O of surface waters (Fig. 7).
Our calculations confirm that bones cannot be used as recorders of short-term environ-
mental variations because of their permanent reworking. On the contrary, tooth enamel
from hypsodonts (bovidae, equidae, rodents) is able to record seasonal variations in the
d18O of drinking water. Laser ablation techniques are well designed for sampling at the
scale of enamel increments and have already given promising results [42, 43].
CASE STUDIES
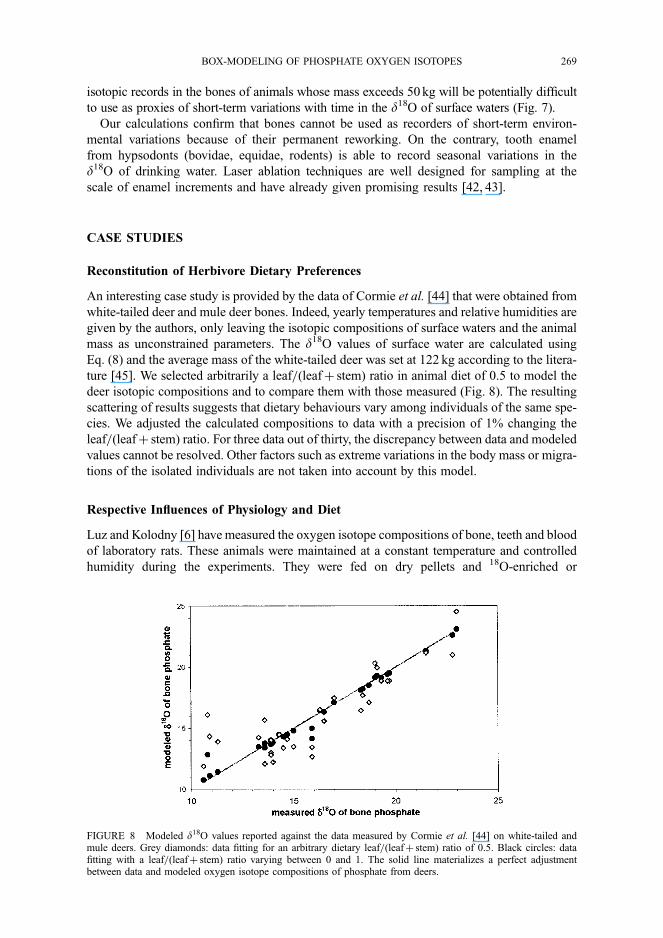
Reconstitution of Herbivore Dietary Preferences
An interesting case study is provided by the data of Cormie et al. [44] that were obtained from
white-tailed deer and mule deer bones. Indeed, yearly temperatures and relative humidities are
given by the authors, only leaving the isotopic compositions of surface waters and the animal
mass as unconstrained parameters. The d18O values of surface water are calculated using
Eq. (8) and the average mass of the white-tailed deer was set at 122 kg according to the litera-
ture [45]. We selected arbitrarily a leaf=(leafþ stem) ratio in animal diet of 0.5 to model the
deer isotopic compositions and to compare them with those measured (Fig. 8). The resulting
scattering of results suggests that dietary behaviours vary among individuals of the same spe-
cies. We adjusted the calculated compositions to data with a precision of 1% changing the
leaf=(leafþ stem) ratio. For three data out of thirty, the discrepancy between data and modeled
values cannot be resolved. Other factors such as extreme variations in the body mass or migra-
tions of the isolated individuals are not taken into account by this model.
Respective Influences of Physiology and Diet
Luz and Kolodny [6] have measured the oxygen isotope compositions of bone, teeth and blood
of laboratory rats. These animals were maintained at a constant temperature and controlled
humidity during the experiments. They were fed on dry pellets and 18O-enriched or
FIGURE 8 Modeled d18O values reported against the data measured by Cormie et al. [44] on white-tailed andmule deers. Grey diamonds: data fitting for an arbitrary dietary leaf=(leafþ stem) ratio of 0.5. Black circles: datafitting with a leaf=(leafþ stem) ratio varying between 0 and 1. The solid line materializes a perfect adjustmentbetween data and modeled oxygen isotope compositions of phosphate from deers.
BOX-MODELING OF PHOSPHATE OXYGEN ISOTOPES 269
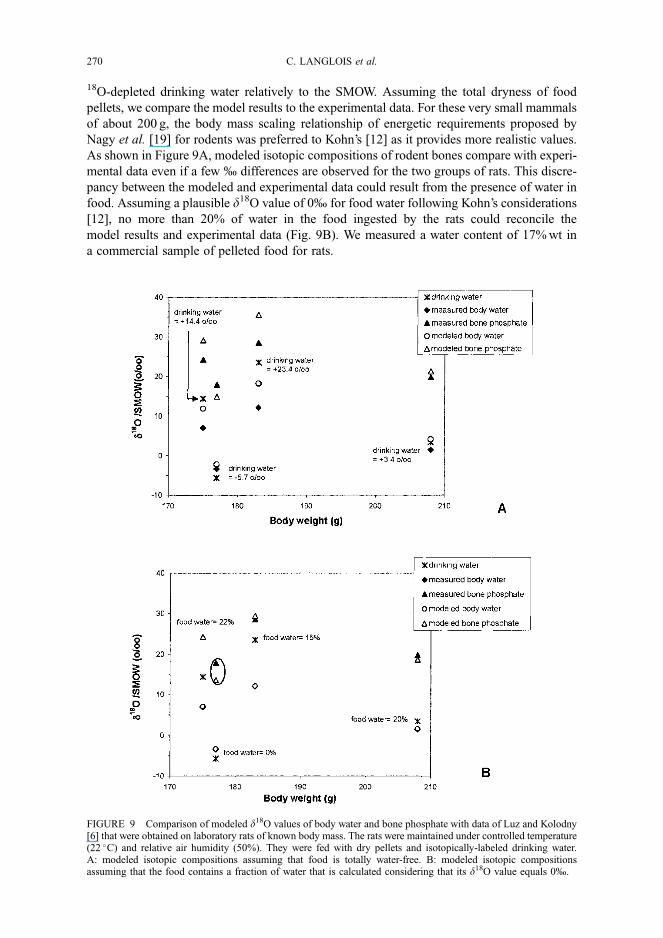
18O-depleted drinking water relatively to the SMOW. Assuming the total dryness of food
pellets, we compare the model results to the experimental data. For these very small mammals
of about 200 g, the body mass scaling relationship of energetic requirements proposed by
Nagy et al. [19] for rodents was preferred to Kohn’s [12] as it provides more realistic values.
As shown in Figure 9A, modeled isotopic compositions of rodent bones compare with experi-
mental data even if a few ‰ differences are observed for the two groups of rats. This discre-
pancy between the modeled and experimental data could result from the presence of water in
food. Assuming a plausible d18O value of 0‰ for food water following Kohn’s considerations
[12], no more than 20% of water in the food ingested by the rats could reconcile the
model results and experimental data (Fig. 9B). We measured a water content of 17% wt in
a commercial sample of pelleted food for rats.
FIGURE 9 Comparison of modeled d18O values of body water and bone phosphate with data of Luz and Kolodny[6] that were obtained on laboratory rats of known body mass. The rats were maintained under controlled temperature(22 �C) and relative air humidity (50%). They were fed with dry pellets and isotopically-labeled drinking water.A: modeled isotopic compositions assuming that food is totally water-free. B: modeled isotopic compositionsassuming that the food contains a fraction of water that is calculated considering that its d18O value equals 0‰.
270 C. LANGLOIS et al.

CONCLUDING REMARKS
In the frame of this model, we proposed a general scaling relationship between the bone
calcium fluxes and the body mass that were based on data compilation from the literature
and a set of oxygen and isotopic fluxes between animal and external reservoirs. When
most of the environmental and dietary parameters can be constrained, we obtain a global
agreement between the modeled and measured oxygen isotope compositions of body waters
and phosphatic tissues from some marine and terrestrial mammals.
The model also provides plausible explanations for some discrepancies previously
observed between determined empirical equations that relate the phosphate d18O value of
vertebrates with environmental parameters (T, d18OSW). They concern metabolic rates, diet-
ary behaviors, water fluxes with the environment, and isotopic compositions of ingested food
and water. For example, the oxygen isotope composition of drinking water is estimated from
rainfall compositions, themselves related to mean air temperatures; however, this drinking
water could also derive from other sources like groundwater. The use of this model could
be improved by a better knowledge of oxygen fluxes connecting the phosphatic tissues
with body waters.
Finally, we suggest that such a time-dependent box-modeling approach can be adapted to
study the behaviour of any trace element (153-Sm) or isotopic systems (e.g. calcium iso-
topes) that could help to quantify residence times of elements in bones and body waters
or to investigate the mechanisms of bone metabolism.
Acknowledgement
This study was supported by the French CNRS program ‘ECLIPSE’.
References
[1] Longinelli, A. (1984). Oxygen isotopes in mammal bone phosphate: A new tool for paleohydrological andpaleoclimatological research? Geochim. Cosmochim. Acta 48, 385–390.
[2] Koch, P. L., Fogel, M. L. and Tuross, N. In: Stable Isotopes in Ecology and Environmental Science (ed. by Lajtha,K. and Michener, R. H.). Blackwell Scientific Publications: Oxford, 1988; Chapter 4.
[3] Iacumin, P. and Longinelli, A. (2002). Relationship between d18O values for skeletal apatite from reindeer andfoxes and yearly mean d18O values of environmental water. Earth Planet. Sci. Lett. 201, 213–219.
[4] D’Angela, D. and Longinelli, A. (1990). Oxygen isotopes in living mammal’s bone phosphate: Further results.Chem. Geol. 86, 75–82.
[5] Delgado Huertas, A., Iacumin, P., Stenni, B. and Sanchez Chillon, B. (1995). Oxygen isotope variations ofphosphate in mammalian bone and tooth enamel. Geochim. Cosmochim. Acta 59, 4299–4305.
[6] Luz, B. and Kolodny, Y. (1985). Oxygen isotope variation in phosphate of biogenic apatites, IV. Mammal teethand bones. Earth Planet. Sci. Lett. 75, 29–36.
[7] Bryant, J. D. and Froelich, P. N. (1995). A model of oxygen isotope fractionation in body water of largemammals. Geochim. Cosmochim. Acta 59, 4523–4537.
[8] Genoni, L., Iacumin, P., Nikolaev, V., Gribchenko, Y. and Longinelli, A. (1998). Oxygen isotopes measurementsof mammoth and reindeer skeletal remains: an archive of Late Pleistocene environmental conditions in EurasianArctic. Earth Planet. Sci. Lett. 160, 587–592.
[9] Dansgaard, W. (1964). Stable isotopes in precipitations. Tellus 4, 436–468.[10] Fricke, H. C. and O’Neil, J. R. (1999). The correlation between 18O=16O ratios of meteoric water and surface
temperature: its use in investigating terrestrial climate change over geologic time. Earth Planet. Sci. Lett. 170,181–196.
[11] Rozanski, K., Araguas-Araguas, L. and Gonfiantini, R. Isotopic patterns in modern global precipitations.In: Climate Change in Continental Isotopic Climate Records (ed. by Swart, P. K., Lottmann, K. C., McKenzie, J.and Savin, S.). Am. Geophys. Union, Geophys. Monogr., 1983; pp. 1–36.
[12] Kohn, M. J. (1996). Predicting animal d18O: Accounting for diet and physiological adaptation. Geochim.Cosmochim. Acta 60, 4811–4829.
[13] Tatner, P. (1988). A model of the natural abundance of oxygen-18 and deuterium in the body water of animal.J. Theor. Biol. 133, 267–280.
BOX-MODELING OF PHOSPHATE OXYGEN ISOTOPES 271

[14] Longinelli, A. and Nuti, S. (1973). Revised phosphate-water isotopic temperature scale. Earth Planet. Sci. Lett.19, 373–376.
[15] Lasaga, A. C. (1980). The kinetic treatment of geochemical cycles. Geochim. Cosmochim. Acta 44, 815–828.[16] Albarede, F. (1998). Time-dependent models of U-Th-He and K-Ar evolution and the layering of mantle
convection. Chem. Geol. 145, 413–429.[17] Nagy, K. A. (1987). Field metabolic rate and food requirement scaling in mammals and birds. Ecol. Monogr.
57, 111–128.[18] Nagy, K. A. and Peterson, C. C. (1988). Scaling of water flux rate in animals. U. Calif. Publ. Zoology 120, 1–172.[19] Nagy, K. A., Girard, I. A. and Brown, T. K. (1999). Energetics of free-ranging mammals, reptiles, and birds.
Annu. Rev. Nutr. 19, 247–277.[20] Clarke, A. and Johnston, N. M. (1999). Scaling of metabolic rate with body mass and temperature in teleost fish.
J. Anim. Ecol. 68, 893–905.[21] Grasse, P-P. Traite de Zoologie. Tome XVI. Masson: Paris, 1965.[22] Besancon, P. Les mouvements du calcium chez le porc et le lapin. In: Physiologie comparee des echanges
calciques. (ed. by Pansu, D.). SIMEP-Editions: Lyon, 1974; pp. 89–96.[23] Gueguen, L. Le metabolisme du calcium chez les ruminants. In: Physiologie comparee des echanges calciques.
(ed. by Pansu, D.). SIMEP-Editions: Lyon, 1974; pp. 67–78.[24] Bell, N. H. (1997). Bone and mineral metabolism in African Americans. Trends Endocrinol. Metab. 8, 240–245.[25] Fernandez, J. A. (1995). Calcium and phosphorus metabolism in growing pigs. III. A model resolution. Livest.
Prod. Sci. 41, 255–261.[26] Martin, A., Bailey, D., McKay, H. and Whiting, S. (1997). Bone mineral and calcium accretion during puberty.
Am. J. Clin. Nutr. 66, 611–615.[27] Molgaard, C., Thomsen, B. L. and Michaelsen, K. F. (1999). Whole body bone mineral accretion in healthy
children and adolescents. Arch. Dis. Child. 81, 10–15.[28] Norris, S. A., Pettifor, J. M., Gray, D. A. and Buffenstein, R. (2001). Calcium metabolism and bone mass in
female rabbits during skeletal maturation: effects of dietary calcium intake. Bone 29, 62–69.[29] Weaver, C. M., et al. (1997). Quantification of biochemical markers of bone turnover by kinetic measures of bone
formation and resorption in young healthy females. J. Bone Min. Res. 12, 1714–1720.[30] FitzGerald, C. M. (1998). Do enamel microstructures have regular time dependency? Conclusions from the
literature and a large-scale study. J. Hum. Evol. 35, 371–386.[31] Moinichen, C. B., Lyngstadaas, S. P. and Risnes, S. (1996). Morphological characteristics of mouse incisor
enamel. J. Anat. 189, 325–333.[32] Mook, W. G. (ed.) Environmental Isotopes in the Hydrological Cycle: Principles and Applications. IHP-V,
Technical Documents in Hydrology No. 39, UNESCO, Paris, 2001.[33] Horita, J. and Wesolowski, D. J. (1994). Liquid-vapor fractionation of oxygen and hydrogen isotopes of water
from the freezing to the critical-temperature. Geochim. Cosmochim. Acta 58, 3425–3437.[34] Majoube, M. (1971). Oxygen-18 and deuterium fractionation between water and steam. J. Chim. Phys. PCB
68, 1423–1436.[35] Kolodny, Y., Luz, B. and Navon, S. (1983). Oxygen isotope variations in phosphates of biogenic apatites, I. Fish
bone apatite rechecking the rules of the game. Earth Planet. Sci. Lett. 64, 389–404.[36] Yoshida, N. and Miyazaki, N. (1991). Oxygen isotope correlation of cetacean bone phosphate with environ-
mental water. J. Geophys. Res. 96, 815–820.[37] Sanchez Chillon, B., Alberdi, M. T., Leone, G., Bonadonna, F. P., Stenni, B. and Longinelli, A. (1994). Oxygen
isotopic composition of fossil equid tooth and bone phosphate: an archive of difficult interpretation.Palaeogeogr. Palaeoclimatol. Palaeoecol. 107, 317–328.
[38] Bryant, J. D., Luz, B. and Froelich, P. N. (1994). Oxygen isotopic composition of fossil horse tooth phosphate as arecord of continental paleoclimate. Palaeogeogr. Palaeoclimatol. Palaeoecol. 107, 303–316.
[39] Bowen, G. J. and Wilkinson, B. (2002). Spatial distribution of d18O in meteoric precipitation. Geology 30,315–318.
[40] IAEA=WMO (2001). Global Network of Isotopes in Precipitation. The GNIP Database. Accessible at:http://isohis.iaea.org
[41] Jones, A. M., Iacumin, P. and Young, E. D. (1999). High-resolution d18O analysis of tooth enamel phosphateby isotope ratio gas chromatography mass spectrometry and ultraviolet laser fluorination. Chem. Geol. 153,241–248.
[42] Lindars, E. S., Grimes, S. T., Mattey, D. P., Collinson, M. E., Hooker, J. J. and Jones, T. P. (2001). Phosphate d18Odetermination of modern rodent teeth by direct laser fluorination: an appraisal of methodology and potentialapplication to palaeoclimate reconstruction. Geochim. Cosmochim. Acta 65, 2535–2548.
[43] Longinelli, L. and Peretti Padalino, A. (1980). Oxygen isotopic composition of water from mammal blood: firstresults. Mass Spectr. in Bioch., Med. Env. Sciences 1, 135–139.
[44] Cormie, A. B., Luz, B. and Schwarcz, H. P. (1994). Relationship between the hydrogen and oxygen isotopes ofdeer bone and their use in the estimation of relative-humidity. Geochim. Cosmochim. Acta 58, 3439–3449.
[45] Nowak, R. M. Walkers Mammals of the World, Johns Hopkin’s Univ. Press, 1999.
272 C. LANGLOIS et al.
Related Documents


