STO-MP-AVT-338 12 - 1 Advanced Boundary Simulations of an Aeroacoustic and Aerodynamic Wind Tunnel Máté Szőke, William Devenport, Aurélien Borgoltz, Christopher Roy and Todd Lowe Center for Renewable Energy and Aero/hydrodynamic Technology (CREATe) Department of Aerospace and Ocean Engineering, Virginia Tech, Blacksburg VA, 24060 USA [email protected] Keywords: wind tunnel boundary simulation, porous walls, CFD, FSI, cambered airfoil ABSTRACT This study presents the first 3D two-way coupled fluid structure interaction (FSI) simulation of a hybrid anechoic wind tunnel (HAWT) test section with modeling all important effects, such as turbulence, Kevlar wall porosity and deflection, and reveals for the first time the complete 3D flow structure associated with a lifting model placed into a HAWT. The Kevlar deflections are captured using finite element analysis (FEA) with shell elements operated under a membrane condition. Three-dimensional RANS CFD simulations are used to resolve the flow field. Aerodynamic experimental results are available and are compared against the FSI results. Quantitatively, the pressure coefficients on the airfoil are in good agreement with experimental results. The lift coefficient was slightly underpredicted while the drag was overpredicted by the CFD simulations. The flow structure downstream of the airfoil showed good agreement with the experiments, particularly over the wind tunnel walls where the Kevlar windows interact with the flow field. A discrepancy between previous experimental observations and juncture flow-induced vortices at the ends of the airfoil is found to stem from the limited ability of turbulence models. The qualitative behavior of the flow, including airfoil pressures and cross-sectional flow structure is well captured in the CFD. From the structural side, the behavior of the Kevlar windows and the flow developing over them is closely related to the aerodynamic pressure field induced by the airfoil. The Kevlar displacement and the transpiration velocity across the material is dominated by flow blockage effects, generated aerodynamic lift, and the wake of the airfoil. The airfoil wake increases the Kevlar window displacement, which was previously not resolved by two-dimensional panel-method simulations. The static pressure distribution over the Kevlar windows is symmetrical about the tunnel mid-height, confirming a dominantly two-dimensional flow field. 1.0 INTRODUCTION Hybrid-anechoic wind tunnels (HAWTs) are relatively new type of aeroacoustic test facility whose test section sidewalls are formed by tensioned Kevlar fabric. The novelty of this wind tunnel lies in the unique characteristics of Kevlar; the Kevlar is transparent to sound with low acoustic transmission loss and it is almost impervious to flow, while it is highly durable and has high tensile strength. Hence, HAWTs are considered an important emerging technology in the area for aeroacoustic testing. The primary effect of HAWTs is to combine the desirable acoustic characteristics of an open jet wind tunnel, with the comparatively low levels of aerodynamic interference associated with a hard wall test section. Secondary effects include stabilizing of the jet allowing for a much longer test section and much closer placement of acoustic sensors to the test article, the combined effect of which is a considerable gain in acoustic performance, such as signal to noise ratio and the improvement of far field acoustic observer angles (Bahr et al., 2018; Szőke et al., 2020). The Kevlar concept was first introduced at the Stability Wind Tunnel (SWT) of Virginia Tech (W. J. Devenport et al. 2013). It has since been adopted by a number of other facilities including the 2-m tunnel at JAXA (Ito et al. 2010) (Japan), the 2.44-m Anechoic Flow Facility at

Welcome message from author
This document is posted to help you gain knowledge. Please leave a comment to let me know what you think about it! Share it to your friends and learn new things together.
Transcript
STO-MP-AVT-338 12 - 1
Advanced Boundary Simulations of an Aeroacoustic and Aerodynamic Wind Tunnel
Máté Szőke, William Devenport, Aurélien Borgoltz, Christopher Roy and Todd Lowe
Center for Renewable Energy and Aero/hydrodynamic Technology (CREATe) Department of Aerospace and Ocean Engineering, Virginia Tech, Blacksburg VA, 24060 USA
Keywords: wind tunnel boundary simulation, porous walls, CFD, FSI, cambered airfoil
ABSTRACT This study presents the first 3D two-way coupled fluid structure interaction (FSI) simulation of a hybrid anechoic wind tunnel (HAWT) test section with modeling all important effects, such as turbulence, Kevlar wall porosity and deflection, and reveals for the first time the complete 3D flow structure associated with a lifting model placed into a HAWT. The Kevlar deflections are captured using finite element analysis (FEA) with shell elements operated under a membrane condition. Three-dimensional RANS CFD simulations are used to resolve the flow field. Aerodynamic experimental results are available and are compared against the FSI results. Quantitatively, the pressure coefficients on the airfoil are in good agreement with experimental results. The lift coefficient was slightly underpredicted while the drag was overpredicted by the CFD simulations. The flow structure downstream of the airfoil showed good agreement with the experiments, particularly over the wind tunnel walls where the Kevlar windows interact with the flow field. A discrepancy between previous experimental observations and juncture flow-induced vortices at the ends of the airfoil is found to stem from the limited ability of turbulence models. The qualitative behavior of the flow, including airfoil pressures and cross-sectional flow structure is well captured in the CFD. From the structural side, the behavior of the Kevlar windows and the flow developing over them is closely related to the aerodynamic pressure field induced by the airfoil. The Kevlar displacement and the transpiration velocity across the material is dominated by flow blockage effects, generated aerodynamic lift, and the wake of the airfoil. The airfoil wake increases the Kevlar window displacement, which was previously not resolved by two-dimensional panel-method simulations. The static pressure distribution over the Kevlar windows is symmetrical about the tunnel mid-height, confirming a dominantly two-dimensional flow field.
1.0 INTRODUCTION
Hybrid-anechoic wind tunnels (HAWTs) are relatively new type of aeroacoustic test facility whose test section sidewalls are formed by tensioned Kevlar fabric. The novelty of this wind tunnel lies in the unique characteristics of Kevlar; the Kevlar is transparent to sound with low acoustic transmission loss and it is almost impervious to flow, while it is highly durable and has high tensile strength. Hence, HAWTs are considered an important emerging technology in the area for aeroacoustic testing. The primary effect of HAWTs is to combine the desirable acoustic characteristics of an open jet wind tunnel, with the comparatively low levels of aerodynamic interference associated with a hard wall test section. Secondary effects include stabilizing of the jet allowing for a much longer test section and much closer placement of acoustic sensors to the test article, the combined effect of which is a considerable gain in acoustic performance, such as signal to noise ratio and the improvement of far field acoustic observer angles (Bahr et al., 2018; Szőke et al., 2020). The Kevlar concept was first introduced at the Stability Wind Tunnel (SWT) of Virginia Tech (W. J. Devenport et al. 2013). It has since been adopted by a number of other facilities including the 2-m tunnel at JAXA (Ito et al. 2010) (Japan), the 2.44-m Anechoic Flow Facility at
Boundary Simulations of an Aeroacoustic and Aerodynamic Wind Tunnel
12 - 2 STO-MP-AVT-338
David Taylor Research Center in Maryland (US), at the University of Bristol (UK) (Mayer et al. 2019) and the new 2 by 3-m aeroacoustic wind tunnel at the Technical University of Denmark (DTU), the Poul la Cour Tunnel. This technology is also undergoing testing for application to facilities at NASA Langley (Bahr et al., 2018).
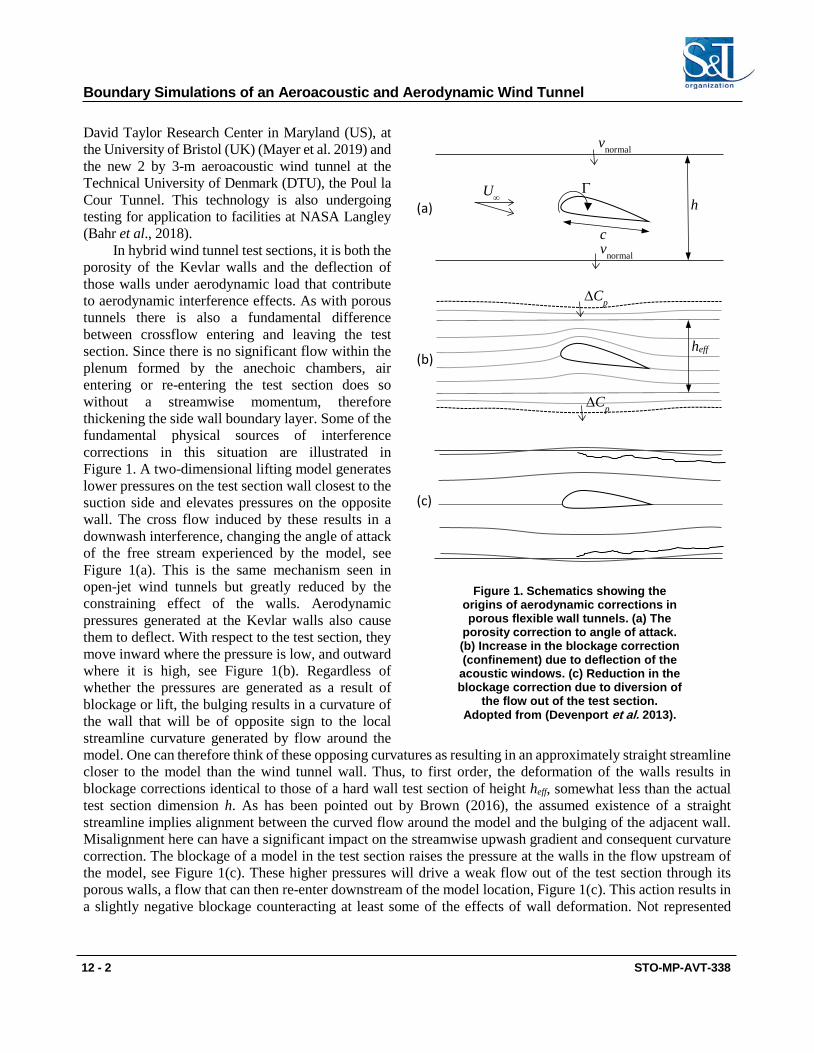
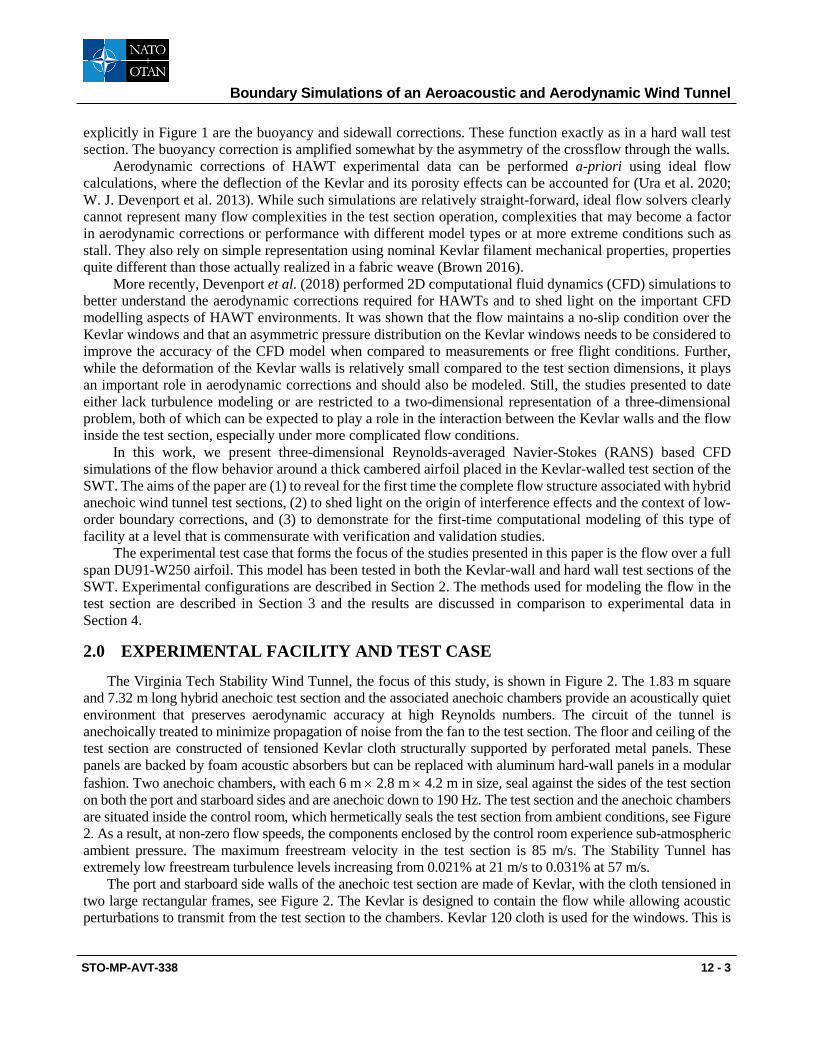
In hybrid wind tunnel test sections, it is both the porosity of the Kevlar walls and the deflection of those walls under aerodynamic load that contribute to aerodynamic interference effects. As with porous tunnels there is also a fundamental difference between crossflow entering and leaving the test section. Since there is no significant flow within the plenum formed by the anechoic chambers, air entering or re-entering the test section does so without a streamwise momentum, therefore thickening the side wall boundary layer. Some of the fundamental physical sources of interference corrections in this situation are illustrated in Figure 1. A two-dimensional lifting model generates lower pressures on the test section wall closest to the suction side and elevates pressures on the opposite wall. The cross flow induced by these results in a downwash interference, changing the angle of attack of the free stream experienced by the model, see Figure 1(a). This is the same mechanism seen in open-jet wind tunnels but greatly reduced by the constraining effect of the walls. Aerodynamic pressures generated at the Kevlar walls also cause them to deflect. With respect to the test section, they move inward where the pressure is low, and outward where it is high, see Figure 1(b). Regardless of whether the pressures are generated as a result of blockage or lift, the bulging results in a curvature of the wall that will be of opposite sign to the local streamline curvature generated by flow around the model. One can therefore think of these opposing curvatures as resulting in an approximately straight streamline closer to the model than the wind tunnel wall. Thus, to first order, the deformation of the walls results in blockage corrections identical to those of a hard wall test section of height heff, somewhat less than the actual test section dimension h. As has been pointed out by Brown (2016), the assumed existence of a straight streamline implies alignment between the curved flow around the model and the bulging of the adjacent wall. Misalignment here can have a significant impact on the streamwise upwash gradient and consequent curvature correction. The blockage of a model in the test section raises the pressure at the walls in the flow upstream of the model, see Figure 1(c). These higher pressures will drive a weak flow out of the test section through its porous walls, a flow that can then re-enter downstream of the model location, Figure 1(c). This action results in a slightly negative blockage counteracting at least some of the effects of wall deformation. Not represented
Γ
c
h
vnormal
U∞
vnormal
∆Cp
∆Cp
heff
(a)
(b)
(c)
Figure 1. Schematics showing the origins of aerodynamic corrections in porous flexible wall tunnels. (a) The
porosity correction to angle of attack. (b) Increase in the blockage correction (confinement) due to deflection of the
acoustic windows. (c) Reduction in the blockage correction due to diversion of
the flow out of the test section. Adopted from (Devenport et al. 2013).
Boundary Simulations of an Aeroacoustic and Aerodynamic Wind Tunnel
STO-MP-AVT-338 12 - 3
explicitly in Figure 1 are the buoyancy and sidewall corrections. These function exactly as in a hard wall test section. The buoyancy correction is amplified somewhat by the asymmetry of the crossflow through the walls.
Aerodynamic corrections of HAWT experimental data can be performed a-priori using ideal flow calculations, where the deflection of the Kevlar and its porosity effects can be accounted for (Ura et al. 2020; W. J. Devenport et al. 2013). While such simulations are relatively straight-forward, ideal flow solvers clearly cannot represent many flow complexities in the test section operation, complexities that may become a factor in aerodynamic corrections or performance with different model types or at more extreme conditions such as stall. They also rely on simple representation using nominal Kevlar filament mechanical properties, properties quite different than those actually realized in a fabric weave (Brown 2016).
More recently, Devenport et al. (2018) performed 2D computational fluid dynamics (CFD) simulations to better understand the aerodynamic corrections required for HAWTs and to shed light on the important CFD modelling aspects of HAWT environments. It was shown that the flow maintains a no-slip condition over the Kevlar windows and that an asymmetric pressure distribution on the Kevlar windows needs to be considered to improve the accuracy of the CFD model when compared to measurements or free flight conditions. Further, while the deformation of the Kevlar walls is relatively small compared to the test section dimensions, it plays an important role in aerodynamic corrections and should also be modeled. Still, the studies presented to date either lack turbulence modeling or are restricted to a two-dimensional representation of a three-dimensional problem, both of which can be expected to play a role in the interaction between the Kevlar walls and the flow inside the test section, especially under more complicated flow conditions.
In this work, we present three-dimensional Reynolds-averaged Navier-Stokes (RANS) based CFD simulations of the flow behavior around a thick cambered airfoil placed in the Kevlar-walled test section of the SWT. The aims of the paper are (1) to reveal for the first time the complete flow structure associated with hybrid anechoic wind tunnel test sections, (2) to shed light on the origin of interference effects and the context of low-order boundary corrections, and (3) to demonstrate for the first-time computational modeling of this type of facility at a level that is commensurate with verification and validation studies.
The experimental test case that forms the focus of the studies presented in this paper is the flow over a full span DU91-W250 airfoil. This model has been tested in both the Kevlar-wall and hard wall test sections of the SWT. Experimental configurations are described in Section 2. The methods used for modeling the flow in the test section are described in Section 3 and the results are discussed in comparison to experimental data in Section 4.
2.0 EXPERIMENTAL FACILITY AND TEST CASE
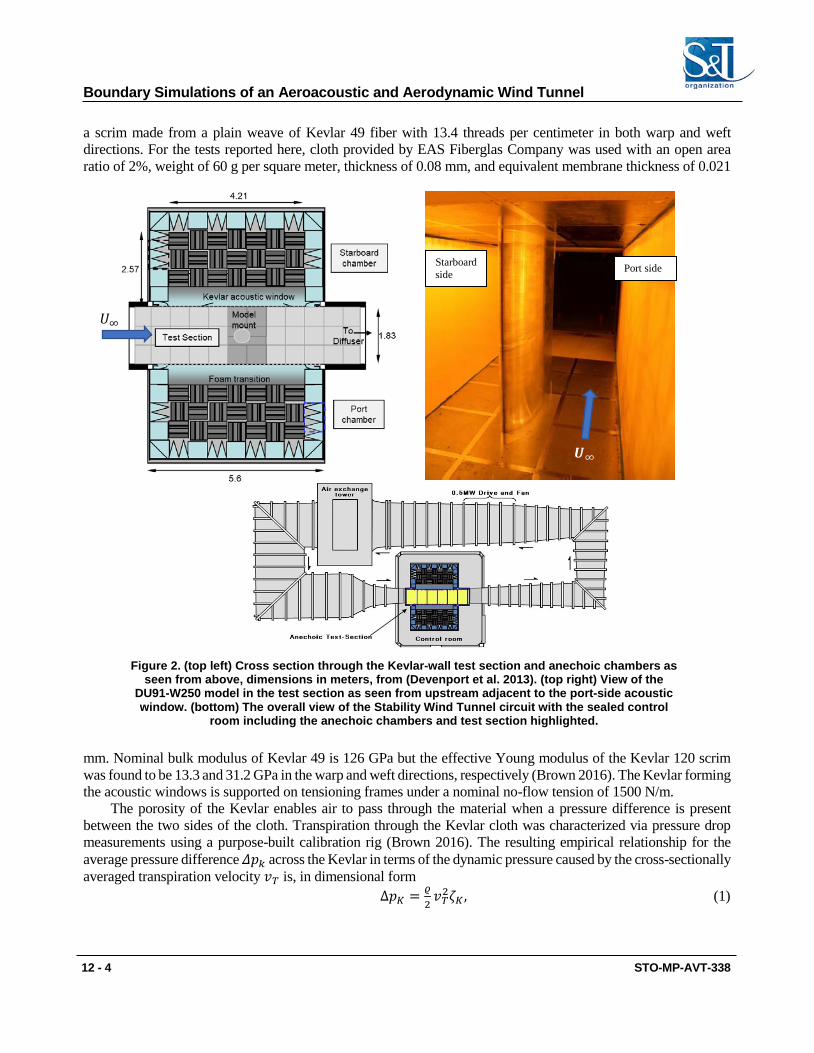
The Virginia Tech Stability Wind Tunnel, the focus of this study, is shown in Figure 2. The 1.83 m square and 7.32 m long hybrid anechoic test section and the associated anechoic chambers provide an acoustically quiet environment that preserves aerodynamic accuracy at high Reynolds numbers. The circuit of the tunnel is anechoically treated to minimize propagation of noise from the fan to the test section. The floor and ceiling of the test section are constructed of tensioned Kevlar cloth structurally supported by perforated metal panels. These panels are backed by foam acoustic absorbers but can be replaced with aluminum hard-wall panels in a modular fashion. Two anechoic chambers, with each 6 m × 2.8 m × 4.2 m in size, seal against the sides of the test section on both the port and starboard sides and are anechoic down to 190 Hz. The test section and the anechoic chambers are situated inside the control room, which hermetically seals the test section from ambient conditions, see Figure 2. As a result, at non-zero flow speeds, the components enclosed by the control room experience sub-atmospheric ambient pressure. The maximum freestream velocity in the test section is 85 m/s. The Stability Tunnel has extremely low freestream turbulence levels increasing from 0.021% at 21 m/s to 0.031% at 57 m/s.
The port and starboard side walls of the anechoic test section are made of Kevlar, with the cloth tensioned in two large rectangular frames, see Figure 2. The Kevlar is designed to contain the flow while allowing acoustic perturbations to transmit from the test section to the chambers. Kevlar 120 cloth is used for the windows. This is
Boundary Simulations of an Aeroacoustic and Aerodynamic Wind Tunnel
12 - 4 STO-MP-AVT-338
a scrim made from a plain weave of Kevlar 49 fiber with 13.4 threads per centimeter in both warp and weft directions. For the tests reported here, cloth provided by EAS Fiberglas Company was used with an open area ratio of 2%, weight of 60 g per square meter, thickness of 0.08 mm, and equivalent membrane thickness of 0.021
mm. Nominal bulk modulus of Kevlar 49 is 126 GPa but the effective Young modulus of the Kevlar 120 scrim was found to be 13.3 and 31.2 GPa in the warp and weft directions, respectively (Brown 2016). The Kevlar forming the acoustic windows is supported on tensioning frames under a nominal no-flow tension of 1500 N/m.
The porosity of the Kevlar enables air to pass through the material when a pressure difference is present between the two sides of the cloth. Transpiration through the Kevlar cloth was characterized via pressure drop measurements using a purpose-built calibration rig (Brown 2016). The resulting empirical relationship for the average pressure difference 𝛥𝛥𝑝𝑝𝑘𝑘 across the Kevlar in terms of the dynamic pressure caused by the cross-sectionally averaged transpiration velocity 𝑣𝑣𝑇𝑇 is, in dimensional form Δ𝑝𝑝𝐾𝐾 = 𝜚𝜚
2𝑣𝑣𝑇𝑇2𝜁𝜁𝐾𝐾 , (1)
Figure 2. (top left) Cross section through the Kevlar-wall test section and anechoic chambers as seen from above, dimensions in meters, from (Devenport et al. 2013). (top right) View of the
DU91-W250 model in the test section as seen from upstream adjacent to the port-side acoustic window. (bottom) The overall view of the Stability Wind Tunnel circuit with the sealed control
room including the anechoic chambers and test section highlighted.
Port side
𝑈𝑈∞
Starboard side
𝑼𝑼∞

Boundary Simulations of an Aeroacoustic and Aerodynamic Wind Tunnel
STO-MP-AVT-338 12 - 5
where 𝜚𝜚 is the density of air and 𝜁𝜁𝐾𝐾 = 3794 is the pressure loss coefficient of the Kevlar cloth. This relationship is known to be unaffected by the mean tunnel flow at least at lower transpiration velocities, see W. J. Devenport et al. (2010).
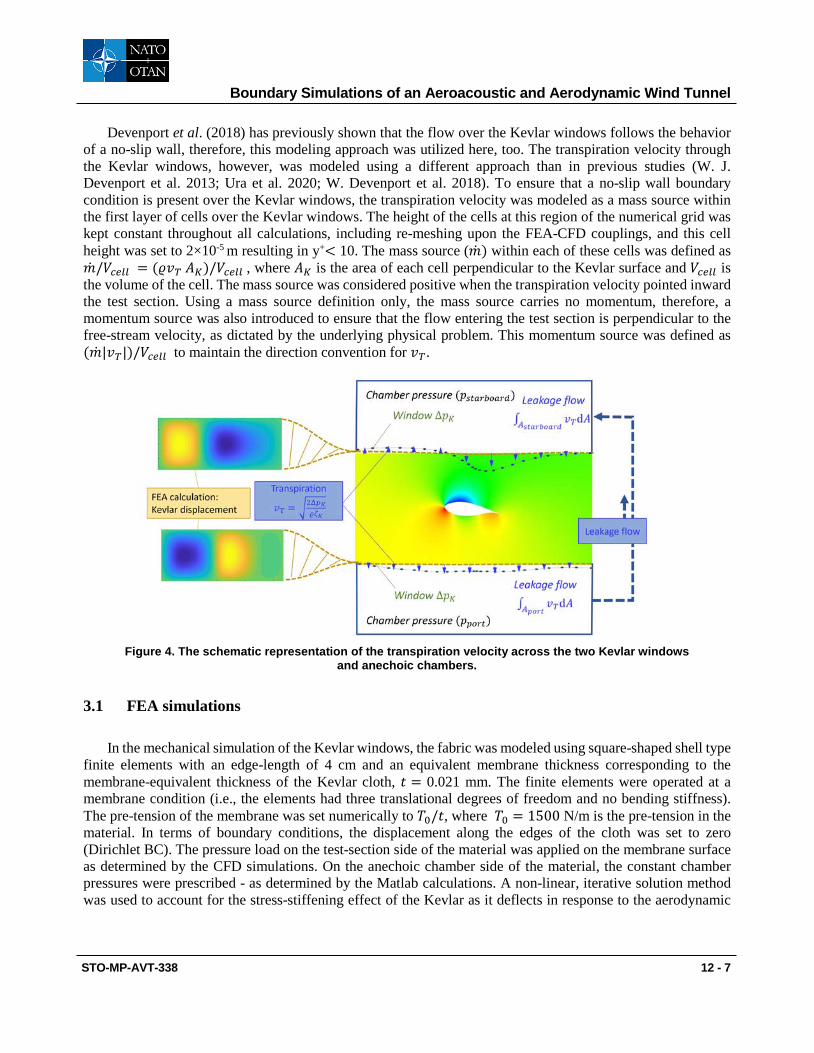
When airfoil models are placed inside the test section, the model will generate a pressure loading on the Kevlar windows. At positive angles of attack, the port side window experiences a higher pressure distribution than the starboard side window. The pressure difference over the two Kevlar windows induces a leakage flow. The route of this leakage flow is external to the test section and it must remain within the control room as it hermetically seals the chambers and the test section from atmospheric conditions, see Figures 2 and 4. Therefore, the flow exiting the test section through the pressurized Kevlar window can only re-enter the test section across the other Kevlar window. In other words, the leakage flow must observe a zero-net volume flow rate from the wind tunnel perspective because the control room is hermetically sealed from the atmosphere. Due to the presence of this leakage flow, each anechoic chamber operates at a different static pressure compared to the control room. The schematic representation of the leakage flow is given in Figure 4.
The leakage flow can be characterized by knowing the pressure losses across each Kevlar window (𝛥𝛥𝑝𝑝𝑘𝑘) and the pressure loss within the control room (𝛥𝛥𝑝𝑝𝐶𝐶ℎ), which is the pressure difference between the two anechoic chambers. The pressure loss within the control room was also characterized by a pressure loss coefficient (𝜁𝜁𝐶𝐶ℎ), which was experimentally determined by Brown, 2016. Here, the empirical result of Brown is used in the form Δ𝑝𝑝𝐶𝐶ℎ = 𝜚𝜚
2�̅�𝑣𝑇𝑇2𝜁𝜁𝐶𝐶ℎ , (2)
where 𝛥𝛥𝑝𝑝𝐶𝐶ℎ is the pressure difference across the two chambers induced by the dynamic pressure of the mean transpiration velocity 𝑣𝑣𝑇𝑇��� , and 𝜁𝜁𝐶𝐶ℎ = 2891.
The governing equations of the leakage flow are given by Eqs. (3) and (4), where Eq. (3) enforces a zero-sum flow rate over the two Kevlar windows and Eq. (4) ensures that the pressure difference across the two anechoic chambers is balanced by the dynamic pressure of the mean leakage flow. The complexity of solving these equations lies in the fact that the integrals in Eq. (3) cannot be simplified by the mean pressure difference across the windows as the pressure distribution on the flow side of the window is non-uniform.
∫ 𝑣𝑣𝑇𝑇d𝐴𝐴𝐴𝐴𝑝𝑝𝑝𝑝𝑝𝑝𝑝𝑝
+ ∫ 𝑣𝑣𝑇𝑇d𝐴𝐴𝐴𝐴𝑠𝑠𝑝𝑝𝑠𝑠𝑝𝑝𝑠𝑠𝑝𝑝𝑠𝑠𝑝𝑝𝑠𝑠= 0 (3)
𝜚𝜚 2𝑣𝑣𝑇𝑇���2 𝜁𝜁𝐶𝐶ℎ − �𝑝𝑝𝑝𝑝𝑝𝑝𝑝𝑝𝑝𝑝 − 𝑝𝑝𝑠𝑠𝑝𝑝𝑠𝑠𝑝𝑝𝑠𝑠𝑝𝑝𝑠𝑠𝑝𝑝𝑠𝑠� = 0 (4)
Tests were performed using a 0.9-m chord DU91W250 airfoil model. This is a 25% thick wind turbine blade section with 1.6-mm thick trailing edge. The model is instrumented with 90 pressure taps centered on the model midspan and arranged in diagonal rows on both sides of the model at an angle of 15 degrees to the chordwise direction. The model was rotated to angle of attack at its quarter chord location. Measurements were performed both with the model clean and with it tripped, though only results for the clean airfoil are shown here. Natural transition on the clean airfoil was verified during testing using Naphthalene flow visualization.
Free-stream flow speed, flow temperature and barometric pressure during the measurements in the test section was monitored. Pressure measurements on the airfoil, used to infer the lift coefficient, were made using an Esterline 9816/98RK pressure scanner system with a range of ±2.5psi and uncertainty of ±0.05% full scale. Drag measurements in the anechoic test section were made using a wake rake system placed 2.74m downstream of the model center of rotation. The rake consists of 113 Pitot probes and 7 Pitot static probes distributed across the full width of the test section on an aerodynamic support structure that can be traversed in the spanwise direction. Rake pressures are sensed using four DTC Initium ESP-32HD 32-channel pressure scanners with a range of ±2.5psi.
The 0.9m DU91W250 was tested in the anechoic test section at a nominal Reynolds number of 3 million and a nominal freestream velocity of 50 m/s, in clean and tripped conditions between -13 and 11°. Drag data was obtained from spanwise scans covering 75% of the span. Additional information on the experimental approach and apparatus is available in Devenport et al. 2018.
Boundary Simulations of an Aeroacoustic and Aerodynamic Wind Tunnel
12 - 6 STO-MP-AVT-338
3.0 COMPUTATIONAL METHODS AND APPROACH
Various three-dimensional CFD simulations of the DU91-W250 wing section installed in the Stability Wind Tunnel Kevlar-walled (anechoic) test section were carried out. Results are presented at -3.2° (zero lift), 0° and 6° geometrical angles of attack (AoA) while incorporating the effects of the flexible and porous Kevlar walls and their deflections. The displacement of the Kevlar walls was considered using CFD and finite element analysis (FEA) through two-way coupled fluid-structure interaction (FSI) simulations. The numerical grids were created using Pointwise, while the simulations were performed using Ansys Fluent and Mechanical APDL within the Ansys Workbench environment (ANSYS 2019). The anechoic chamber pressures were determined using Matlab and Eqs. (3) and (4). The Matlab calculations were performed simultaneously with the FSI simulations such that a three-way communication between Matlab, Fluent and Mechanical APDL ensured that the chamber pressures were determined and kept up to date within both CFD and FEA calculations.
3.1 CFD simulations The flow was considered incompressible in the simulations. The k-ω SST turbulence model (Menter 1994)
was used. In Fluent, the pressure-velocity coupling was set to the “Coupled” method (ANSYS 2019) to enhance the stability of the simulations. All numerical discretization schemes, namely, convective, and diffusive terms, were modeled using second-order accurate numerical scheme.
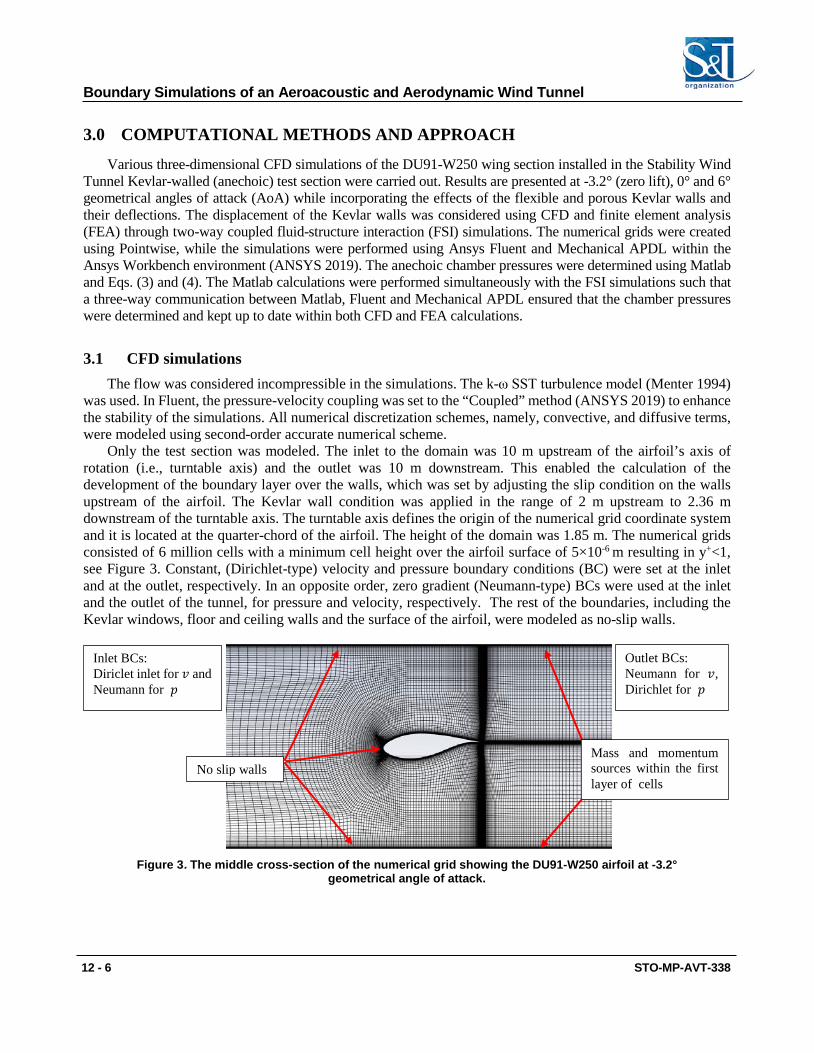
Only the test section was modeled. The inlet to the domain was 10 m upstream of the airfoil’s axis of rotation (i.e., turntable axis) and the outlet was 10 m downstream. This enabled the calculation of the development of the boundary layer over the walls, which was set by adjusting the slip condition on the walls upstream of the airfoil. The Kevlar wall condition was applied in the range of 2 m upstream to 2.36 m downstream of the turntable axis. The turntable axis defines the origin of the numerical grid coordinate system and it is located at the quarter-chord of the airfoil. The height of the domain was 1.85 m. The numerical grids consisted of 6 million cells with a minimum cell height over the airfoil surface of 5×10⁻⁶ m resulting in y+<1, see Figure 3. Constant, (Dirichlet-type) velocity and pressure boundary conditions (BC) were set at the inlet and at the outlet, respectively. In an opposite order, zero gradient (Neumann-type) BCs were used at the inlet and the outlet of the tunnel, for pressure and velocity, respectively. The rest of the boundaries, including the Kevlar windows, floor and ceiling walls and the surface of the airfoil, were modeled as no-slip walls.
Figure 3. The middle cross-section of the numerical grid showing the DU91-W250 airfoil at -3.2°
geometrical angle of attack.
Inlet BCs: Diriclet inlet for 𝑣𝑣 and Neumann for 𝑝𝑝
Outlet BCs: Neumann for 𝑣𝑣, Dirichlet for 𝑝𝑝
No slip walls Mass and momentum sources within the first layer of cells
Boundary Simulations of an Aeroacoustic and Aerodynamic Wind Tunnel
STO-MP-AVT-338 12 - 7
Devenport et al. (2018) has previously shown that the flow over the Kevlar windows follows the behavior of a no-slip wall, therefore, this modeling approach was utilized here, too. The transpiration velocity through the Kevlar windows, however, was modeled using a different approach than in previous studies (W. J. Devenport et al. 2013; Ura et al. 2020; W. Devenport et al. 2018). To ensure that a no-slip wall boundary condition is present over the Kevlar windows, the transpiration velocity was modeled as a mass source within the first layer of cells over the Kevlar windows. The height of the cells at this region of the numerical grid was kept constant throughout all calculations, including re-meshing upon the FEA-CFD couplings, and this cell height was set to 2×10⁻⁵ m resulting in y+< 10. The mass source (�̇�𝑚) within each of these cells was defined as �̇�𝑚/𝑉𝑉𝑐𝑐𝑐𝑐𝑐𝑐𝑐𝑐 = (𝜚𝜚𝑣𝑣𝑇𝑇 𝐴𝐴𝐾𝐾)/𝑉𝑉𝑐𝑐𝑐𝑐𝑐𝑐𝑐𝑐 , where 𝐴𝐴𝐾𝐾 is the area of each cell perpendicular to the Kevlar surface and 𝑉𝑉𝑐𝑐𝑐𝑐𝑐𝑐𝑐𝑐 is the volume of the cell. The mass source was considered positive when the transpiration velocity pointed inward the test section. Using a mass source definition only, the mass source carries no momentum, therefore, a momentum source was also introduced to ensure that the flow entering the test section is perpendicular to the free-stream velocity, as dictated by the underlying physical problem. This momentum source was defined as (�̇�𝑚|𝑣𝑣𝑇𝑇|)/𝑉𝑉𝑐𝑐𝑐𝑐𝑐𝑐𝑐𝑐 to maintain the direction convention for 𝑣𝑣𝑇𝑇.
Figure 4. The schematic representation of the transpiration velocity across the two Kevlar windows
and anechoic chambers.
3.1 FEA simulations In the mechanical simulation of the Kevlar windows, the fabric was modeled using square-shaped shell type
finite elements with an edge-length of 4 cm and an equivalent membrane thickness corresponding to the membrane-equivalent thickness of the Kevlar cloth, 𝑡𝑡 = 0.021 mm. The finite elements were operated at a membrane condition (i.e., the elements had three translational degrees of freedom and no bending stiffness). The pre-tension of the membrane was set numerically to 𝑇𝑇0/𝑡𝑡, where 𝑇𝑇0 = 1500 N/m is the pre-tension in the material. In terms of boundary conditions, the displacement along the edges of the cloth was set to zero (Dirichlet BC). The pressure load on the test-section side of the material was applied on the membrane surface as determined by the CFD simulations. On the anechoic chamber side of the material, the constant chamber pressures were prescribed - as determined by the Matlab calculations. A non-linear, iterative solution method was used to account for the stress-stiffening effect of the Kevlar as it deflects in response to the aerodynamic
Boundary Simulations of an Aeroacoustic and Aerodynamic Wind Tunnel
12 - 8 STO-MP-AVT-338
pressure load. The FEA model was validated against a measurement where a uniform static pressure distribution was applied to the Kevlar cloth while its displacement was also measured (Brown 2016).
4.0 RESULTS
In this section, the results of the CFD simulations are shown and compared to experimental data. Results from various types of simulations are presented. In terms of boundary conditions, the CFD simulations were performed for non-deforming, non-porous walls (labeled as hard wall), non-deforming, but porous walls (labeled as porous walls) and deforming, porous walls (labeled as FSI). Results are shown for three geometrical angles of attack (𝛼𝛼), namely, -3.2° (zero lift), 0° and 6°, as arranged by increasing lift values. Section 4.1 discusses how the reference conditions (pressure and velocity) were determined from the CFD simulations. In Section 4.2, the aerodynamic performance of the DU91-W250 airfoil is investigated under the different boundary conditions. Section 4.3 presents the three-dimensional flow field in the vicinity of the airfoil and over the Kevlar windows.
4.1 Determining freestream conditions In the wind tunnel experiments, the freestream conditions (reference pressure and freestream velocity) are
determined based on a pressure data measured upstream (settling chamber) and within the contraction section. This pressure data is calibrated against a Pitot-static probe placed at the model rotation axis location at empty tunnel configuration. Therefore, the calibrated freestream conditions account for the growth of the boundary layer over the test section walls (and the blockage and buoyancy it causes).
The contraction portion of the wind tunnel is not modeled in the present CFD simulations to save computational time. Therefore, to follow a similar way of determining the reference conditions in the CFD, the following approach was used. The pressure and velocity data were considered along the tunnel centerline upstream of the model, i.e., with the model being present in the tunnel. This data was curve-fitted upstream of the axis of model rotation and using the curve fit found, the freestream conditions, namely, reference static pressure, 𝑝𝑝∞, and stagnation pressure, 𝑝𝑝0, were determined at the model rotation axis. This data was then used to determine pressure coefficients, 𝐶𝐶𝑝𝑝, which are defined as
𝐶𝐶𝑝𝑝 =𝑝𝑝 − 𝑝𝑝∞𝑝𝑝0 − 𝑝𝑝∞
,
where 𝑝𝑝 is either static pressure (e.g., over the airfoil surface, Kevlar windows, etc.) or stagnation pressure (e.g., wake rake).
Boundary Simulations of an Aeroacoustic and Aerodynamic Wind Tunnel
STO-MP-AVT-338 12 - 9
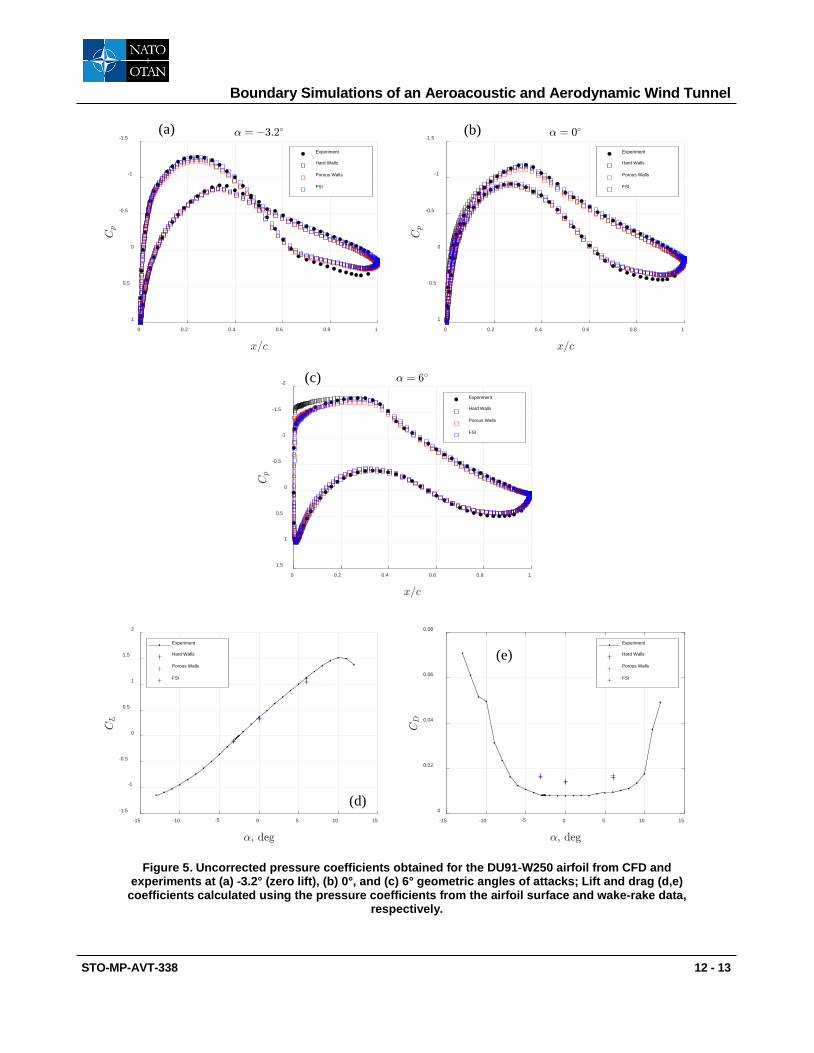
4.2 Aerodynamic characterization of the DU91-W250 airfoil Figure 5 presents the pressure coefficient (𝐶𝐶𝑃𝑃) over the surface of the airfoil, the lift coefficients (𝐶𝐶𝐿𝐿) and
the drag coefficients (𝐶𝐶𝐷𝐷). The lift coefficients were determined from the airfoil surface pressure coefficients (Anderson 2010). The drag coefficient (𝐶𝐶𝐷𝐷) was obtained by integrating the momentum deficit in the wake of the airfoil at the mid-span location (Bicknell 1939). All results presented were determined identically both from the experimental and CFD data.
Generally, there is a good agreement between the pressure coefficients (𝐶𝐶𝑃𝑃) obtained from CFD simulations and experiments over the airfoil surface, see Figure 5(a-c). The qualitative behavior of the pressure distribution is well captured by the CFD simulations, with some discrepancy observed near the trailing edge on the pressure side of the airfoil. In this region, the DU91-W250 profile has a relatively high curvature. Here, the CFD data suggests flow separation, see for example the 𝐶𝐶𝑃𝑃 results for 𝛼𝛼 = -3.2° and 0° at 𝑥𝑥/𝑐𝑐 ≈ 0.8, where the CFD results show a linear behavior. This discrepancy may be due to a thinner boundary layer present over the surface of the airfoil when compared to experiments, or the turbulence model might predict a boundary layer that has a lower resistance against flow separation. There is a good agreement between the different types of simulations, namely, hard wall, porous wall and FSI, except at 𝛼𝛼 =6° close to the leading edge where the hard wall results differ from both the porous wall and FSI results. An important observation is that porous wall simulations show a worse agreement with the experimental 𝐶𝐶𝑃𝑃 results than hard wall simulations, but when wall deflections are considered alongside with porous walls (FSI), the agreement improves. This confirms previous observations that the combination of transpiration and Kevlar deflection result in similar corrections as would present for a hard wall case.
The observations made about the pressure coefficient data are well represented in the lift coefficient results, see Figure 5(d). The trend of the lift curves obtained from CFD and experiment show a good agreement. The lift coefficient is somewhat underpredicted at 𝛼𝛼 = 6° and a better agreement is found at lower angles (i.e., at lower lift). The generated lift is observed to drive the discrepancy between the different boundary conditions (hard walls, porous walls, FSI), namely the 𝐶𝐶𝐿𝐿 results have a wider spread at 𝛼𝛼 =6° than at 𝛼𝛼 =-3.2°.
Figure 6 presents both experimentally and numerically obtained pressure coefficients in the wake of the airfoil, taken 2.74 m downstream of the model rotation axis, i.e., at the wake-rake location. In general, the CFD simulations overestimate the pressure deficit in the airfoil wake. This is clearly indicated by lower 𝐶𝐶𝑝𝑝 values in the wake data of the FSI simulations when compared to the experiments. This is believed to be due to a thinner boundary layer predicted over the surface of the airfoil, which is expected to be more stable as such a boundary layer is characterized with lower turbulence levels, hence it is more stable within a certain streamwise distance. Similar observations were made by Devenport et al. 2018, who reported that increasing the freestream turbulence levels significantly impacted the drag (i.e., the wake deficit) of the airfoil. Presumably, enforcing transition in the CFD at the same location as in the experiments, or tripping the flow both numerically and experimentally could improve the agreement. Unfortunately, no experimental data is available on the state of the boundary layer at the trailing edge of the airfoil to assess this assumption, but experimental data of tripped conditions are available and further numerical simulations are planned where transition is enforced at 5% of the airfoil chord.
At certain spanwise locations within the experimental data, there is a local increase in the size of the airfoil wake, see Figure 6(a,c,e). These areas of higher wake deficit values were due to surface contamination present over the corresponding portion of the airfoil surface. Here, the surface contaminations triggered an earlier transition of the boundary layer than natural.
Boundary Simulations of an Aeroacoustic and Aerodynamic Wind Tunnel
12 - 10 STO-MP-AVT-338
4.3 Flow field characterization The three-dimensional flow field in the test section is now considered through investigating the stagnation
pressure coefficient at the cross-section of the wake-rake (2.74 m downstream of the model rotation axis), and various properties over the Kevlar windows, namely, Kevlar pressure coefficient, displacement, and transpiration velocity.
Figure 6 presents the stagnation pressure coefficients at the cross-section of the wake rake for the FSI simulations. Vortex pairs can be seen at the ends of the airfoil, on both the suction and pressure side of the airfoil. These vortices are more prominent and become more asymmetrical with increasing lift, and they appear larger in size than typically observed in measurements. The complexity of the flow in this region of the airfoil walls poses challenges to the turbulence model. At this location, two boundary layers intersect. Namely, one boundary layer is present on the walls of the tunnel (floor or ceiling) and the other one on the surface of the airfoil. Such flow region is also known as juncture flow (Perkinst 1970). Modeling turbulence in these regions is an active area of research (Rumsey 2021). The numerical difficulty of modeling juncture flows stems from the anisotropy of the Reynolds stress matrix that causes the formation of streamwise vortices and capturing these anisotropic inhomogeneous regions of turbulent structures is a challenge to RANS CFD models.
The effect of Kevlar deflection can be observed on the side of the test section closest to the suction side of the airfoil, located on the right edge of the contour plots in Figure 6. Here, the Kevlar windows move inward the test section due to the drop in the static pressure and air gets drawn into the test section through the Kevlar. This results in a thicker boundary layer over the tunnel wall facing the suction side of the airfoil. This can be well observed for both experimental and numerical results, particularly at 𝛼𝛼 = 6°, i.e. in Figure 6(e,f). The curvature of the boundary layer edge in the spanwise direction and the thickness of the boundary layer matches well between the experiments and FSI simulations. On the opposite wall (left side of the contour plots), the boundary layer becomes thinner as the angle of attack increases, which is partially due to the favorable pressure gradient generated by the airfoil pressure side downstream of the airfoil and because transpiration velocity here is dominantly outward the test section.
To gain a better view of the three-dimensional flow field, the pressure coefficient over the windows, the displacement of the Kevlar windows, and the transpiration velocity across the Kevlar are presented in Figures 7, 8 and 9, respectively. The pressure coefficient distributions over the Kevlar windows (𝐶𝐶𝑝𝑝,𝐾𝐾𝑐𝑐𝐾𝐾𝑐𝑐𝑠𝑠𝑝𝑝) are presented in Figure 7. According to the current modeling approach, and in agreement with previous observations (W. J. Devenport et al. 2013; Ura et al. 2020; W. Devenport et al. 2018), the pressure distribution over the Kevlar windows dictate the displacement and the transpiration velocity across them. For this reason, understanding the 𝐶𝐶𝑝𝑝,𝐾𝐾𝑐𝑐𝐾𝐾𝑐𝑐𝑠𝑠𝑝𝑝 distribution can later be used to interpret Kevlar displacement and transpiration velocity, hence it is considered first for discussion.
Figure 7 shows the pressure coefficient results over the port and starboard side Kevlar windows. First, we observe in Figure 7(g,h) that the 𝐶𝐶𝑝𝑝,𝐾𝐾𝑐𝑐𝐾𝐾𝑐𝑐𝑠𝑠𝑝𝑝 results are independent of the angle of attack for 𝑥𝑥 < −1.5 m. In this region, the blockage caused by the airfoil decelerates the flow, hence the pressure coefficient increases. In the mid-portion of the Kevlar windows, i.e., around the turntable axis (𝑥𝑥 ≈ 0 m), a maximum absolute value of the pressure coefficient is observed on both the port and starboard sides, with the only exception of the port side at 𝛼𝛼 = 6∘, where the peak is present at 𝑥𝑥 ≈ 2 m. These peak values of 𝐶𝐶𝑝𝑝,𝐾𝐾𝑐𝑐𝐾𝐾𝑐𝑐𝑠𝑠𝑝𝑝 move downstream over the port side (facing airfoil pressure side) and move upstream over the starboard side (facing airfoil suction side) with increasing angle of attack as they are linked with the lift generated by the airfoil. Finally, the pressure coefficients reduce to freestream conditions downstream of the airfoil, but this drop is less steep than the increase in 𝐶𝐶𝑝𝑝,𝐾𝐾𝑐𝑐𝐾𝐾𝑐𝑐𝑠𝑠𝑝𝑝 upstream of the airfoil. Another important observation here is the spanwise uniformity of the pressure coefficient distributions. Within 𝑧𝑧 ≈ ±0.5 m, the contour levels are rather independent of the spanwise location. This confirms the efficacy and robustness of previous 2D representation of the flow-field and suggests that the corner flow within the test section corners play only a minor effect on the developing flow field within the domain.
Boundary Simulations of an Aeroacoustic and Aerodynamic Wind Tunnel
STO-MP-AVT-338 12 - 11
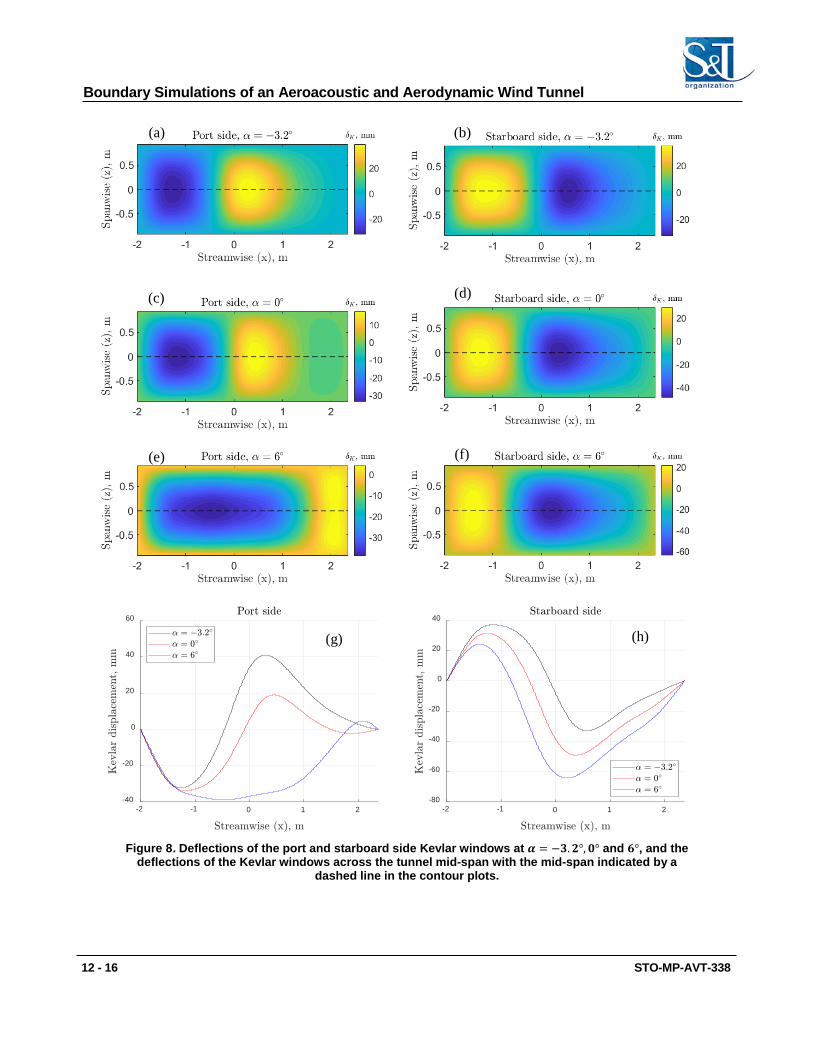
In Figure 8, results of Kevlar displacement, 𝛿𝛿𝐾𝐾, are shown as contour plots and data is also presented along the tunnel mid-height (i.e., model mid-span) for all angles of attack considered. The displacement is considered with respect to the original plane of the Kevlar, and it is positive in the direction of positive lift. The behavior of the Kevlar, as revealed previously, is dictated by the wall pressure coefficient, airfoil blockage and the generated lift.
When observing the deflections along the tunnel mid-height, the Kevlar deflections can be split up to three distinct regions matching those seen in the pressure coefficient. First, we observe that the displacements are independent of the angle of attack for 𝑥𝑥 < −1.5 m. In this region, the blockage caused by the airfoil increases the static pressure, hence 𝛿𝛿𝐾𝐾 is negative over the port window and positive over the starboard window. Where previously the maximum 𝐶𝐶𝑃𝑃 values were observed, i.e., turntable axis, a maximum absolute displacement is observed over each window. When observing the contour plots on the port side, the streamwise location of this maximum displacement moves downstream with increasing 𝛼𝛼 over the port window and it moves upstream with increasing 𝛼𝛼 on the starboard window. The only exception is at 𝛼𝛼 = 6∘ over the port side, where this location most likely is not covered by the span of the Kevlar windows, hence it is not observed. Past the maximum displacement point, the slope of the curves in Figure 8(g,h) are different to the slope upstream of the maximum displacement. A symmetrical Kevlar displacement was observed about the turntable axis by Devenport et al., (2018) when considering a two-dimensional panel method model of the flow. Other studies concerning a different airfoil but also using two-dimensional panel method (Brown, 2016) also observed a discrepancy between the measured and simulated Kevlar displacement (and pressure coefficient) downstream of the model axis of rotation. There, the momentum displacement effect of the airfoil wake was not resolved, while in the present simulation it is captured by the RANS simulations. Here, the momentum deficit in the wake is responsible for a less steep Kevlar displacement curve past 𝑥𝑥 = 0 m as the wake acts as a blockage downstream of the airfoil. This observation was previously taken into account within the 3D panel method simulations of Ura et al., (2020). There, the authors reported that the agreement between their simulated and experimentally obtained Kevlar displacement results improved significantly when a model of the wake was included in their panel method.
A noteworthy observation is that the Kevlar faithfully follows the aerodynamic forces acting on it (i.e., 𝐶𝐶𝑃𝑃 distribution) because it has no bending stiffness. During preliminary simulations of the present work, a reasonably low level of bending stiffness was considered to enhance the numerical stability of the FEA problem. During these preliminary simulations, no outward displacement of the Kevlar was observed at 𝑥𝑥 < −1.5 m, which indicates that excluding bending stiffness in the FEA model is required. The outward displacement of Kevlar reduces the blockage of the test object; hence it is an important feature of the windows. This observation also confirms why Kevlar is a good candidate for hybrid-anechoic wind tunnel sidewalls.
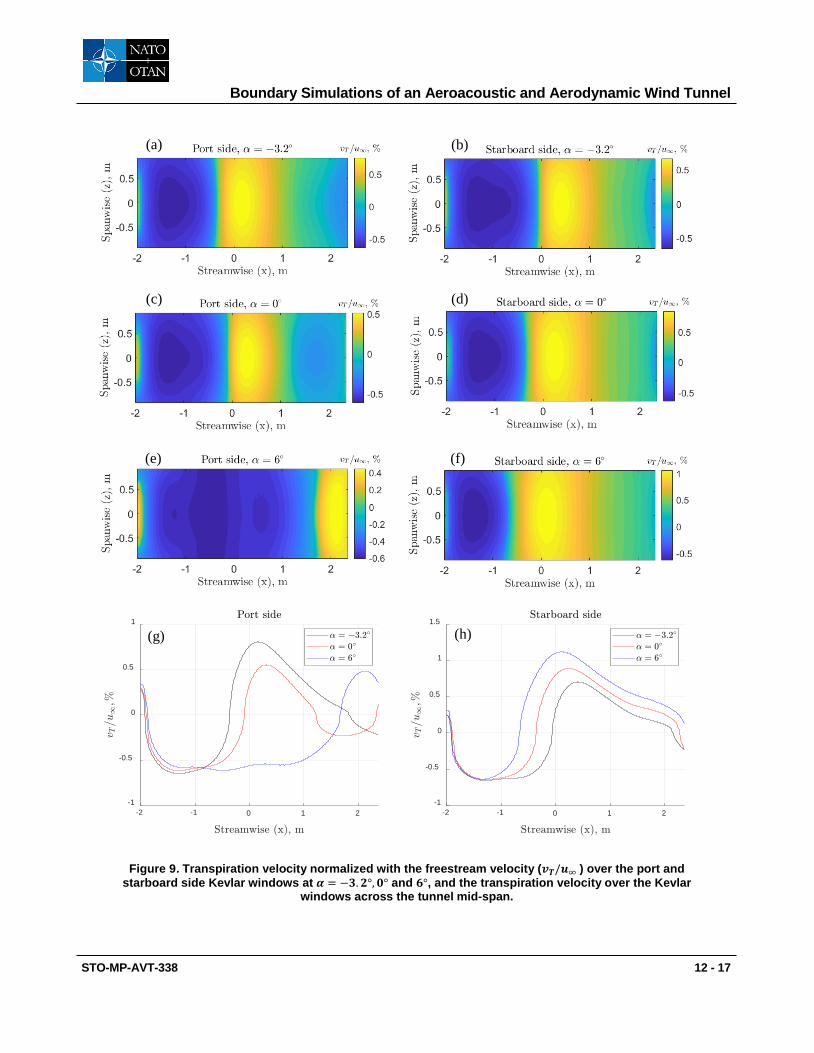
The transpiration velocity through the Kevlar windows is presented in Figure 9. In agreement with the model, the transpiration velocity is dictated by the pressure distribution over the windows, but it is proportional to the square-root of the pressure difference across the two sides of the Kevlar. Indeed, a sharper change between positive and negative transpiration velocities are observed due to this non-linear relationship between pressure and transpiration velocity, see for example the region 𝑥𝑥 ≈ −0.5 m over the port side window. The magnitude of the transpiration velocity is low, usually remains below 1% of the free-stream velocity, which is due to the low porosity of the Kevlar cloth. While this magnitude agrees with previous findings, the transpiration velocity results still require validation experiments which are planned as a future work of this study.
Boundary Simulations of an Aeroacoustic and Aerodynamic Wind Tunnel
12 - 12 STO-MP-AVT-338
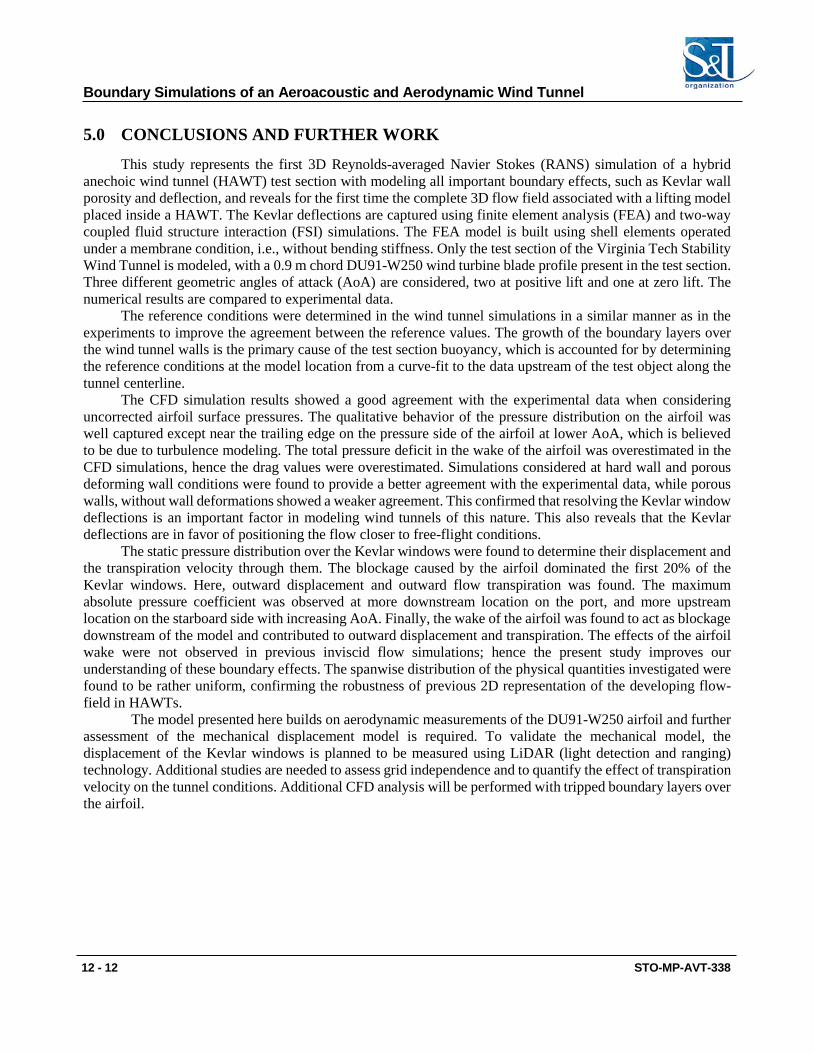
5.0 CONCLUSIONS AND FURTHER WORK
This study represents the first 3D Reynolds-averaged Navier Stokes (RANS) simulation of a hybrid anechoic wind tunnel (HAWT) test section with modeling all important boundary effects, such as Kevlar wall porosity and deflection, and reveals for the first time the complete 3D flow field associated with a lifting model placed inside a HAWT. The Kevlar deflections are captured using finite element analysis (FEA) and two-way coupled fluid structure interaction (FSI) simulations. The FEA model is built using shell elements operated under a membrane condition, i.e., without bending stiffness. Only the test section of the Virginia Tech Stability Wind Tunnel is modeled, with a 0.9 m chord DU91-W250 wind turbine blade profile present in the test section. Three different geometric angles of attack (AoA) are considered, two at positive lift and one at zero lift. The numerical results are compared to experimental data.
The reference conditions were determined in the wind tunnel simulations in a similar manner as in the experiments to improve the agreement between the reference values. The growth of the boundary layers over the wind tunnel walls is the primary cause of the test section buoyancy, which is accounted for by determining the reference conditions at the model location from a curve-fit to the data upstream of the test object along the tunnel centerline.
The CFD simulation results showed a good agreement with the experimental data when considering uncorrected airfoil surface pressures. The qualitative behavior of the pressure distribution on the airfoil was well captured except near the trailing edge on the pressure side of the airfoil at lower AoA, which is believed to be due to turbulence modeling. The total pressure deficit in the wake of the airfoil was overestimated in the CFD simulations, hence the drag values were overestimated. Simulations considered at hard wall and porous deforming wall conditions were found to provide a better agreement with the experimental data, while porous walls, without wall deformations showed a weaker agreement. This confirmed that resolving the Kevlar window deflections is an important factor in modeling wind tunnels of this nature. This also reveals that the Kevlar deflections are in favor of positioning the flow closer to free-flight conditions.
The static pressure distribution over the Kevlar windows were found to determine their displacement and the transpiration velocity through them. The blockage caused by the airfoil dominated the first 20% of the Kevlar windows. Here, outward displacement and outward flow transpiration was found. The maximum absolute pressure coefficient was observed at more downstream location on the port, and more upstream location on the starboard side with increasing AoA. Finally, the wake of the airfoil was found to act as blockage downstream of the model and contributed to outward displacement and transpiration. The effects of the airfoil wake were not observed in previous inviscid flow simulations; hence the present study improves our understanding of these boundary effects. The spanwise distribution of the physical quantities investigated were found to be rather uniform, confirming the robustness of previous 2D representation of the developing flow-field in HAWTs. The model presented here builds on aerodynamic measurements of the DU91-W250 airfoil and further assessment of the mechanical displacement model is required. To validate the mechanical model, the displacement of the Kevlar windows is planned to be measured using LiDAR (light detection and ranging) technology. Additional studies are needed to assess grid independence and to quantify the effect of transpiration velocity on the tunnel conditions. Additional CFD analysis will be performed with tripped boundary layers over the airfoil.
Boundary Simulations of an Aeroacoustic and Aerodynamic Wind Tunnel
STO-MP-AVT-338 12 - 13
Figure 5. Uncorrected pressure coefficients obtained for the DU91-W250 airfoil from CFD and experiments at (a) -3.2° (zero lift), (b) 0°, and (c) 6° geometric angles of attacks; Lift and drag (d,e)
coefficients calculated using the pressure coefficients from the airfoil surface and wake-rake data, respectively.
0 0.2 0.4 0.6 0.8 1
-1.5
-1
-0.5
0
0.5
1
Experiment
Hard Walls
Porous Walls
FSI
0 0.2 0.4 0.6 0.8 1
-1.5
-1
-0.5
0
0.5
1
Experiment
Hard Walls
Porous Walls
FSI
0 0.2 0.4 0.6 0.8 1
-2
-1.5
-1
-0.5
0
0.5
1
1.5
Experiment
Hard Walls
Porous Walls
FSI
-15 -10 -5 0 5 10 15
-1.5
-1
-0.5
0
0.5
1
1.5
2
Experiment
Hard Walls
Porous Walls
FSI
-15 -10 -5 0 5 10 15
0
0.02
0.04
0.06
0.08
Experiment
Hard Walls
Porous Walls
FSI
(a) (b)
(d)
(c)
(e)

Boundary Simulations of an Aeroacoustic and Aerodynamic Wind Tunnel
12 - 14 STO-MP-AVT-338
Figure 6. Comparison of experimental (left column) and FSI (right column) wake-rake pressure coefficients at 𝜶𝜶 = −𝟑𝟑.𝟐𝟐°,𝟎𝟎° and 𝟔𝟔°.
-1 -0.5 0 0.5 1
-1
-0.5
0
0.5
1
0.65
0.7
0.75
0.8
0.85
0.9
0.95
1
-1 -0.5 0 0.5 1
-1
-0.5
0
0.5
1
0.65
0.7
0.75
0.8
0.85
0.9
0.95
1
-1 -0.5 0 0.5 1
-1
-0.5
0
0.5
1
0.65
0.7
0.75
0.8
0.85
0.9
0.95
1
(a) (b)
(c) (d)
(e) (f)

Boundary Simulations of an Aeroacoustic and Aerodynamic Wind Tunnel
STO-MP-AVT-338 12 - 15
Figure 7. Pressure coefficient over the port and starboard side Kevlar windows at 𝜶𝜶 = −𝟑𝟑.𝟐𝟐°,𝟎𝟎° and 𝟔𝟔°, and the pressure coefficient over the Kevlar windows across the tunnel mid-span.
-2 -1 0 1 2-0.2
-0.1
0
0.1
0.2
0.3
-2 -1 0 1 2-0.2
0
0.2
0.4
0.6
(g) (h)
(a) (b)
(c) (d)
(e) (f)
Boundary Simulations of an Aeroacoustic and Aerodynamic Wind Tunnel
12 - 16 STO-MP-AVT-338
Figure 8. Deflections of the port and starboard side Kevlar windows at 𝜶𝜶 = −𝟑𝟑.𝟐𝟐°,𝟎𝟎° and 𝟔𝟔°, and the
deflections of the Kevlar windows across the tunnel mid-span with the mid-span indicated by a dashed line in the contour plots.
-2 -1 0 1 2-40
-20
0
20
40
60
-2 -1 0 1 2-80
-60
-40
-20
0
20
40
(a) (b)
(c) (d)
(e) (f)
(g) (h)
Boundary Simulations of an Aeroacoustic and Aerodynamic Wind Tunnel
STO-MP-AVT-338 12 - 17
Figure 9. Transpiration velocity normalized with the freestream velocity (𝒗𝒗𝑻𝑻/𝒖𝒖∞ ) over the port and starboard side Kevlar windows at 𝜶𝜶 = −𝟑𝟑.𝟐𝟐°,𝟎𝟎° and 𝟔𝟔°, and the transpiration velocity over the Kevlar
windows across the tunnel mid-span.
-2 -1 0 1 2-1
-0.5
0
0.5
1
-2 -1 0 1 2-1
-0.5
0
0.5
1
1.5
(g) (h)
(a) (b)
(c) (d)
(e) (f)

Boundary Simulations of an Aeroacoustic and Aerodynamic Wind Tunnel
12 - 18 STO-MP-AVT-338
ACKNOWLEDGEMENTS
The work reported in this paper has been conducted with the support of the Stability Wind Tunnel and Virginia Tech. We would also like to acknowledge the long-time support of the Office of Naval Research and of General Electric for the facility and its hybrid anechoic capabilities that are the focus of this work. The authors would also like to thank the National Science Foundation, in particular Dr. Ron Joslin, for the support through research grant CBET-2012443. We would like to thank Dr. Robert Canfield for his constructive comments and support during the development of the FEA model. We would like to thank Dr. Nanya Intaratep, Dr. Matthew Kuester, Mr. Tim Meyers and Mr. Bill Oetjens for their assistance with the Stability Wind Tunnel experiments.
REFERENCES
Anderson, J. D. 2010. Fundamentals of Aerodynamics. 6th edition. McGraw Hill Inc. ANSYS, Inc. 2019. Ansys Fluent V19 Theory Guide. Bahr, Christopher J., Florence V. Hutcheson, and Daniel J. Stead. 2018. “Assessment of Unsteady
Propagation Characteristics and Corrections in Aeroacousticwind Tunnels Using an Acoustic Pulse.” In 2018 AIAA/CEAS Aeroacoustics Conference, AIAA-2018-3118.
Bicknell, J. 1939. “Determination of the Profile Drag of an Airplane Wing in Flight At High Reynolds Numbers.” In US Government Printing Office.
Brown, Kenneth A. 2016. “Understanding and Exploiting Wind Tunnels with Porous Flexible Walls for Aerodynamic Measurement.” Virginia Tech.
Devenport, William, Ken Brown, Aurelien Borgoltz, Eric Paterson, Christian Bak, Niels N Sørensen, Anders Smærup Olsen, Mac Gaunaa, Andreas Fischer, and Christian Grinderslev. 2018. “Advanced Wind Tunnel Boundary Simulation for Kevlar Wall Aeroacoustic Wind Tunnels.” In Advanced Wind Tunnel Boundary Simulation, STO-MP-AVT-284.
Devenport, William J., Ricardo A. Burdisso, Aurelien Borgoltz, Patricio A. Ravetta, Matthew F. Barone, Kenneth A. Brown, and Michael A. Morton. 2013. “The Kevlar-Walled Anechoic Wind Tunnel.” Journal of Sound and Vibration 332 (17): 3971–91.
Devenport, William J., Ricardo A. Burdisso, Aurelien Borgoltz, Patricio Ravetta, and Matthew F. Barone. 2010. “Aerodynamic and Acoustic Corrections for a Kevlar-Walled Anechoic Wind Tunnel.” In 16th AIAA/CEAS Aeroacoustics Conference (31st AIAA Aeroacoustics Conference), AIAA-2010-3749.
Ito, Takeshi, Hiroki Ura, Kazuyuki Nakakita, Yuzuru Yokokawa, Wing F. Ng, Ricardo A. Burdisso, Akihito Iwasaki, et al. 2010. “Aerodynamic/Aeroacoustic Testing in Anechoic Closed Test Sections of Low-Speed Wind Tunnels.” In 16th AIAA/CEAS Aeroacoustics Conference (31st AIAA Aeroacoustics Conference), AIAA-2010-3750.
Mayer, Y.D., H.K. Jawahar, M. Szőke, S.A.S. Ali, and M. Azarpeyvand. 2019. “Design and Performance of an Aeroacoustic Wind Tunnel Facility at the University of Bristol.” Applied Acoustics 155.
Menter, F. R. 1994. “Two-Equation Eddy-Viscosity Turbulence Models for Engineering
Boundary Simulations of an Aeroacoustic and Aerodynamic Wind Tunnel
STO-MP-AVT-338 12 - 19
Applications.” AIAA Journal 32 (8). Perkinst, H J. 1970. “The Formation of Streamwise Vorticity in Turbulent Flow.” Journal of Fluid
Mechanics 44 (4): 721–40. Rumsey, Christopher. 2021. “NASA Juncture Flow Experiments.” NASA. 2021.
https://turbmodels.larc.nasa.gov/Other_exp_Data/junctureflow_exp.html. Szőke, M., C.J. Bahr, F.V. Hutcheson, and W.J. Devenport. 2020. “Characterization of Hybrid Wind
Tunnel Environments Using Laser-Induced Acoustic Sources.” In AIAA Scitech 2020 Forum. Vol. AIAA-2020-1253.
Ura, Hiroki, Masashi Shigemi, Tomonari Hirotani, and Tomoyuki Homma. 2020. “Wall Interference Correction Method for Kevlar Wall Test Section.” Journal of Aircraft 57 (5): 889–900.
Boundary Simulations of an Aeroacoustic and Aerodynamic Wind Tunnel
12 - 20 STO-MP-AVT-338
Related Documents