Bottom- up Cost Modelling for Bitstream Services in Broadband Access Networks K.D. HACKBARTH 1 , G. KULEMKAMPFF 2 , A. MENENDEZ 1 , L. RODRIGUEZ DE LOPE 1 1 Telematics Engineering Group, University of Cantabria, Santander, SPAIN 2 WIK consult,Bad Honnef, GERMANY http://www.tlmat.unican.es , http://www.wik.org Abstract: - This contribution provides a definition of Bitstream Access Services and shows its importance inside the European Regulation. For this purpose a traffic model for the bitstream services is developed and a network structure for the corresponding broadband access network is determined. Additionally the contribution provides a model for a cost optimal Network planning and dimensioning and indicates a corresponding tool implementation. The cost model to be applied is exposed and applied to a network example. Additionally some problems arising for QoS differentiation in providing bitstream access services are shown and a first approach is indicated. Key-Words: - bitstream access service, network design and dimensioning, broadband network, cost modelling. 1 Introduction Bitstream Access Services, BAS, are important to increase the penetration of broadband services via Internet inside the framework of a free market development for broadband access to the Internet and corresponding services. A BAS connection results from the end user equipment (CPE) or network (CPN) up to the first point of presence of the IP network domain of the ISP contracted by the client. Some ISPs implement a proper IP domain on national level (Tier 2) while most of them provide only a regional IP domain (Tier3). It is mainly the dominant operator who implements a broadband access infrastructure in xDLS ranging from the end of the subscriber access network connection point, at Main Distribution Frame locations (MDF), up to its proper IP domain. This network segment is known as Broadband Access Network (BAN). To offer BAS under an effective competition framework, the dominant operator has at least to provide a BAS in form of a wholesale service, implemented by virtual tunnels, which fulfils required capacities and QoS parameters. Regional ISPs require even a prolongation of this tunnel inside the IP domain of the dominant operator up to one of its PoPs where an interconnection to the ISP IP domain is provided. To assure a legal competition, the national telecom regulation authorities have to control the price scheme of the wholesale regimen for the BAS or even to determine upper price levels. European organism has to provide the directives to assure certain homogeneity in the price regulation scheme. Price regulation for Telecom services is currently implemented under a so called Bottom up cost model together with a Forward Looking Long Run Average Incremental Cost model, FL-LRAIC, see [1]. Bottom up modelling means studying a network configuration considering the offered services, see [2]. FL-LRAIC means selecting the best network technology and an optimal network design without considering historical costs or an already existing network. Anyway, in most cases the last aspect is slightly modified taking into account the location of the MDF where the proper network starts. This is called scorch node approach. The FL-LRAIC requires that the network design has to consider all services integrated in the different network parts used by the BAS virtual tunnel and not only the traffic from the proper BAS. This contribution outlines first the requirements for a price regulation of BAS. Then, it treats the traffic and network modelling, considering mainly the BAN but also partially the IP core one for the tunnel prolongation up to a regional ISP PoP. The paper considers the influence of QoS parameter under the integration of the different types of broadband services in the BAN. It indicates a scheme for a fair distribution of the corresponding integration benefit. This contribution is based on a recent study from the same authors provided for the German regulator BNA-Bonn, see [3]. Proceedings of the 5th WSEAS Int. Conf. on Signal Processing, Robotics and Automation, Madrid, Spain, February 15-17, 2006 (pp356-363)

Welcome message from author
This document is posted to help you gain knowledge. Please leave a comment to let me know what you think about it! Share it to your friends and learn new things together.
Transcript
Bottom- up Cost Modelling for Bitstream Services in Broadband Access Networks
K.D. HACKBARTH1, G. KULEMKAMPFF2, A. MENENDEZ1, L. RODRIGUEZ DE LOPE1
1Telematics Engineering Group, University of Cantabria, Santander, SPAIN 2WIK consult,Bad Honnef, GERMANY
http://www.tlmat.unican.es , http://www.wik.org
Abstract: - This contribution provides a definition of Bitstream Access Services and shows its importance inside the European Regulation. For this purpose a traffic model for the bitstream services is developed and a network structure for the corresponding broadband access network is determined. Additionally the contribution provides a model for a cost optimal Network planning and dimensioning and indicates a corresponding tool implementation. The cost model to be applied is exposed and applied to a network example. Additionally some problems arising for QoS differentiation in providing bitstream access services are shown and a first approach is indicated. Key-Words: - bitstream access service, network design and dimensioning, broadband network, cost modelling. 1 Introduction Bitstream Access Services, BAS, are important to increase the penetration of broadband services via Internet inside the framework of a free market development for broadband access to the Internet and corresponding services. A BAS connection results from the end user equipment (CPE) or network (CPN) up to the first point of presence of the IP network domain of the ISP contracted by the client. Some ISPs implement a proper IP domain on national level (Tier 2) while most of them provide only a regional IP domain (Tier3). It is mainly the dominant operator who implements a broadband access infrastructure in xDLS ranging from the end of the subscriber access network connection point, at Main Distribution Frame locations (MDF), up to its proper IP domain. This network segment is known as Broadband Access Network (BAN). To offer BAS under an effective competition framework, the dominant operator has at least to provide a BAS in form of a wholesale service, implemented by virtual tunnels, which fulfils required capacities and QoS parameters. Regional ISPs require even a prolongation of this tunnel inside the IP domain of the dominant operator up to one of its PoPs where an interconnection to the ISP IP domain is provided. To assure a legal competition, the national telecom regulation authorities have to control the price scheme of the wholesale regimen for the BAS or even to determine upper price levels. European organism has to provide the directives to assure certain
homogeneity in the price regulation scheme. Price regulation for Telecom services is currently implemented under a so called Bottom up cost model together with a Forward Looking Long Run Average Incremental Cost model, FL-LRAIC, see [1]. Bottom up modelling means studying a network configuration considering the offered services, see [2]. FL-LRAIC means selecting the best network technology and an optimal network design without considering historical costs or an already existing network. Anyway, in most cases the last aspect is slightly modified taking into account the location of the MDF where the proper network starts. This is called scorch node approach. The FL-LRAIC requires that the network design has to consider all services integrated in the different network parts used by the BAS virtual tunnel and not only the traffic from the proper BAS. This contribution outlines first the requirements for a price regulation of BAS. Then, it treats the traffic and network modelling, considering mainly the BAN but also partially the IP core one for the tunnel prolongation up to a regional ISP PoP. The paper considers the influence of QoS parameter under the integration of the different types of broadband services in the BAN. It indicates a scheme for a fair distribution of the corresponding integration benefit. This contribution is based on a recent study from the same authors provided for the German regulator BNA-Bonn, see [3].
Proceedings of the 5th WSEAS Int. Conf. on Signal Processing, Robotics and Automation, Madrid, Spain, February 15-17, 2006 (pp356-363)
2 Requirements for Price Regulation of Bitstream Access Services The implementation of BAS is considered to be important with regard to the enhancing competition in the broadband market. In this context ERG1 defines the main elements of bitstream access as follows [4]:
• “high speed access link to the customers’ premises (end user part) provided by the incumbent;
• transmission capacity for broadband data in both direction enabling new entrants to offer their own, value-added services to end users;
• new entrants have the possibility to differentiate their services by altering (directly or indirectly) technical characteristics and/or the use of their own network;
• bitstream access is a wholesale product consisting of the DSL part (access link) and “backhaul” services of (data) backbone network (ATM, IP backbone), see [5].”
According to this definition it is important to note that the bitstream access is not equitable (from regulatory view) with a combined wholesale product consisting of an unbundled or shared access and a conveyance service in the access network, respectively the backbone. The ERG does not define the point of traffic handover, but outlines possible points of access which include access at the DSLAM, the ATM level (parent or distant PoP) or at the IP level (parent or distant PoP). Although the ERG’s common position is not binding on member states, many countries already have implemented BAS or are about to introduce it. A survey reveals quite a few differences between the implemented services, not at least with regard to the possibility of competitors to differentiate their services. Since the ability for product differentiation is a particular characteristic of BAS, special attention should be paid to the provision of different QoS classes. As we have seen in section 1, the BAS are mainly defined as bandwidth tubes (tunnels) and do not consider the source traffic resulting from the different applications that use these tunnels. These tunnels are mainly provided by the BAN but for regional ISP a
1ERG: European Regulator Group composed by representatives of national regulators, see http://erg.eu.int/
certain prolongation in the IP Core network should be added. The application of the FL-LRAIC method with a bottom up approach requires a detailed knowledge of an efficient network configuration and the traffic load on it. For this purpose we have to study mainly the architecture of the BAN and to provide an optimal network design, traffic routing and dimensioning. Additionally, we have to consider the tunnel prolongation to the IP Core where the BAN interconnects. 3 Traffic Description for BAS and BAN Architecture This section considers mainly the BAN architectures currently implemented by most European operators and the BAS traffic description and its routing inside. 3.1 BAN Architecture The network architecture for an end to end BAS is structured in four network segments, see [6]:
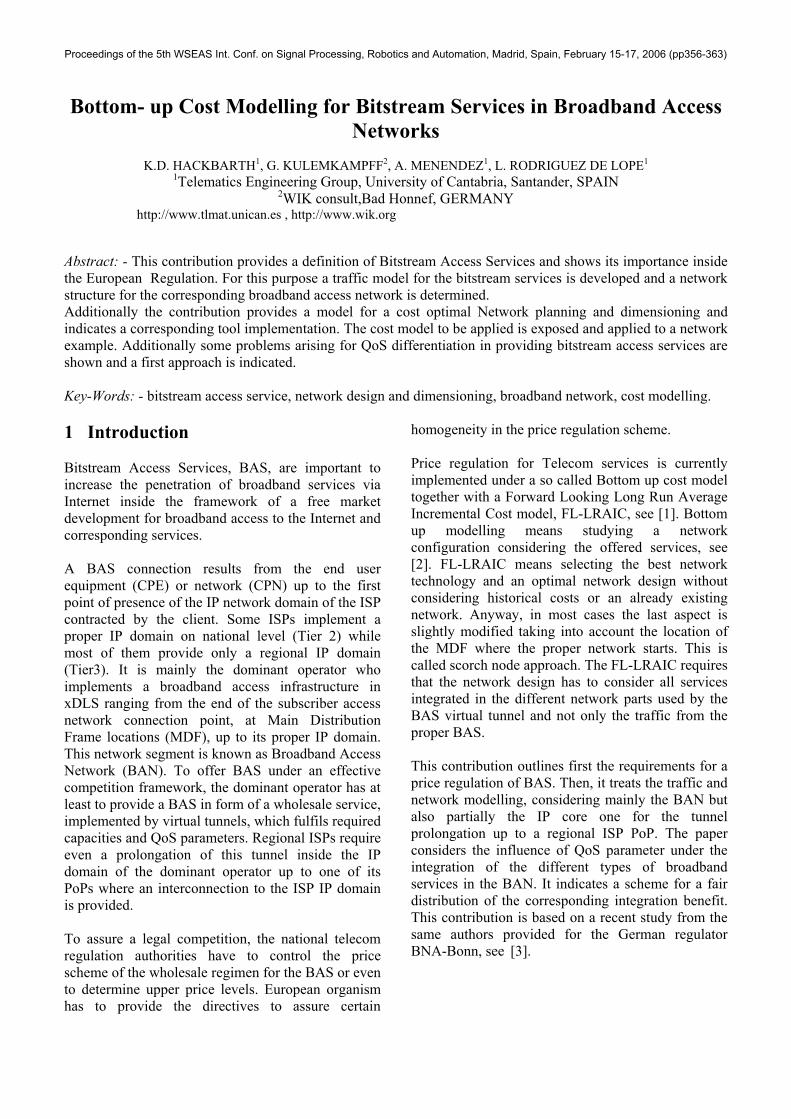
• Subscriber access network. • Broadband access network. • IP core. • Service provider equipment.
Figure 1. xDSL reference architecture The BAN is required because an IP core network does not reach to all the MDF locations, where the subscriber access ends and the DSLAMs are installed, due to its high figure, e.g. the Spanish PSTN/ISDN has approximately 3000 MDF locations and the German one more than 7000. Hence, the BAN covers the section between the DSLAMs and the interconnection point at the entrance to the IP Core provided either by a Broadband Remote Access Server (BRAS) mainly for mass services or by a Label Edge Router (LER) specially for business services and virtual private networks provision.
Proceedings of the 5th WSEAS Int. Conf. on Signal Processing, Robotics and Automation, Madrid, Spain, February 15-17, 2006 (pp356-363)
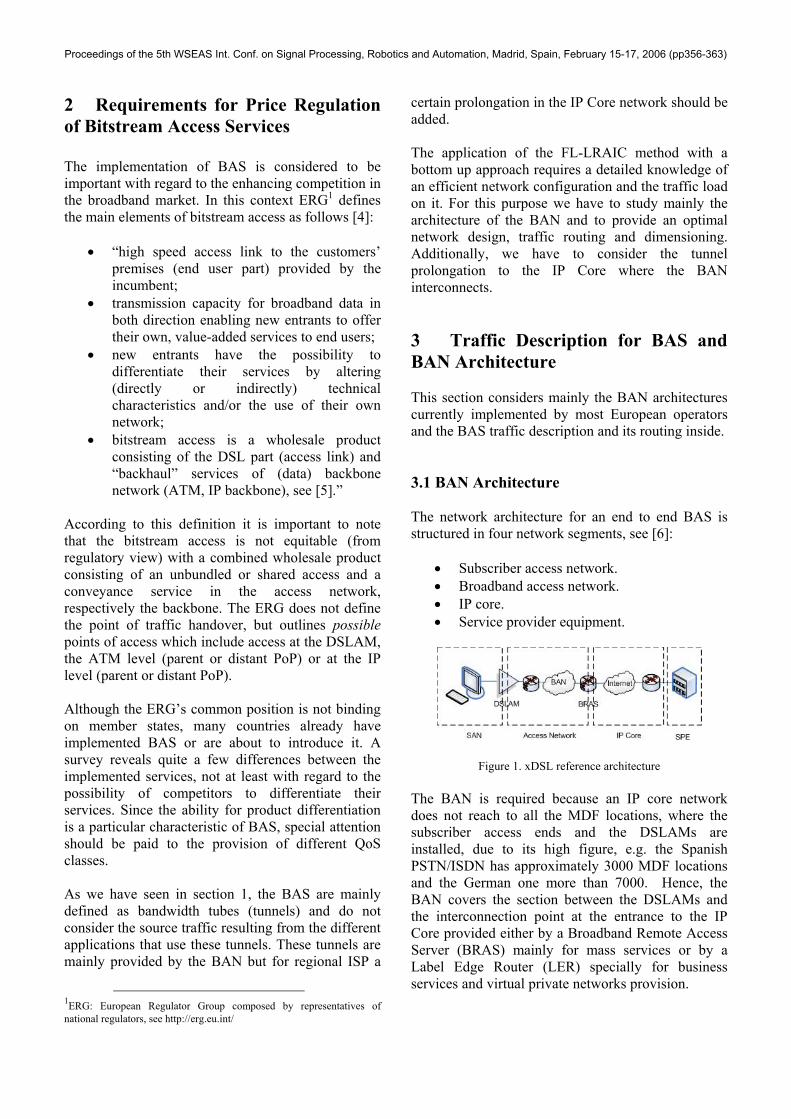
In most European countries this network section is implemented by an OSI layer 2 network, currently with ATM technology. The implementation of BAN under Ethernet technology is growing up but, at the moment, its penetration is low and thus will not be considered for the network design and pricing schemes under regulation purposes, see [7]. A large BAN, at national level, is composed by a hierarchical structure with mostly three levels but in some cases until up to four levels, as shown in Figure 2. The first level, or level 0, is composed by pure DSLAM locations, mainly at nodes with a low concentration of users. The next level has the objective to collect traffic from level 0 nodes and concentrate it with its proper traffic, on a set of ATM concentration units. Levels 2 and 3 consist on ATM traffic selectors providing not only traffic concentration, but also traffic routing in terms of virtual paths (VPs). The provision of two levels with ATM traffic selectors is mainly relevant in case the regulation requires facilities for termination and interconnection on different network elements or differentiated QoS characteristics for different traffic service classes. The highest BAN levels are situated at IP core locations, where BRAS and/or LER are installed for interconnecting with the IP core network. The determination of an optimal number of levels and locations of BAN nodes is one of the most important parameters to be studied in national regulator cost studies for BAS.
Figure 2. Hierarchy of an ATM based BAN Under the four levels hierarchy, the network describes a three level star topology, shown in Figure 2. This network structure can be subdivided into an ATM access network and an ATM backbone one. Given a strict hierarchical routing, all IP traffic generated at the DSLAMs is routed up to the corresponding traffic selector at level 3, using a different virtual path VP for each service class. For business and VPN purposes mainly a VP based on an AAL-1 is provided meanwhile the traffic from mass
services are aggregated into AAL-5 VPs, see [8]. 3.2 Traffic Pattern For dimensioning links and node’s equipment we require the knowledge of the flow in all network elements based on the peak load traffic demand. For this purpose a detailed description of the traffic resulting from the different offered services is normally used. In the case of BAS, operators do not consider the individual services used by a costumer in the high traffic load period but consider only a service class description in form of a bandwidth tube for different types of users. The capacity of this tube depends on the total bandwidth required from the users of the corresponding service class, normally determined in the high load period similar as the business hour in the telephone service. Therefore, the following parameters for each user of a certain service class are defined:
• equivalent bandwidth in kbps (covering relevant aspects of QoS, e.g. bit rate, packet loss, latency, jitter)
• total number of users for each service class • number of parallel sessions in terms of
number of users being active simultaneously in the high load period.
• Minimum bandwidth guaranteed per user Most BAS currently offered are mainly grouped into four different service classes which are shown in Table 1.
DSL Products Equivalent Bandwidth
Bandwidth Guaranteed
Number of users
DSL mass market low no High DSL business middle yes Middle IP-VPN enterprises high yes Limited ATM access high yes Strongly
limited Table 1. Broadband access services and its characteristic
parameters For QoS provision the traffic of each service class is aggregated and routed in a separated VP up to the PoP for the interconnection either to the ATM core network for pure ATM traffic or to the IP core network. 4 BAN Design Model The aim of the network design model is to provide an
Proceedings of the 5th WSEAS Int. Conf. on Signal Processing, Robotics and Automation, Madrid, Spain, February 15-17, 2006 (pp356-363)
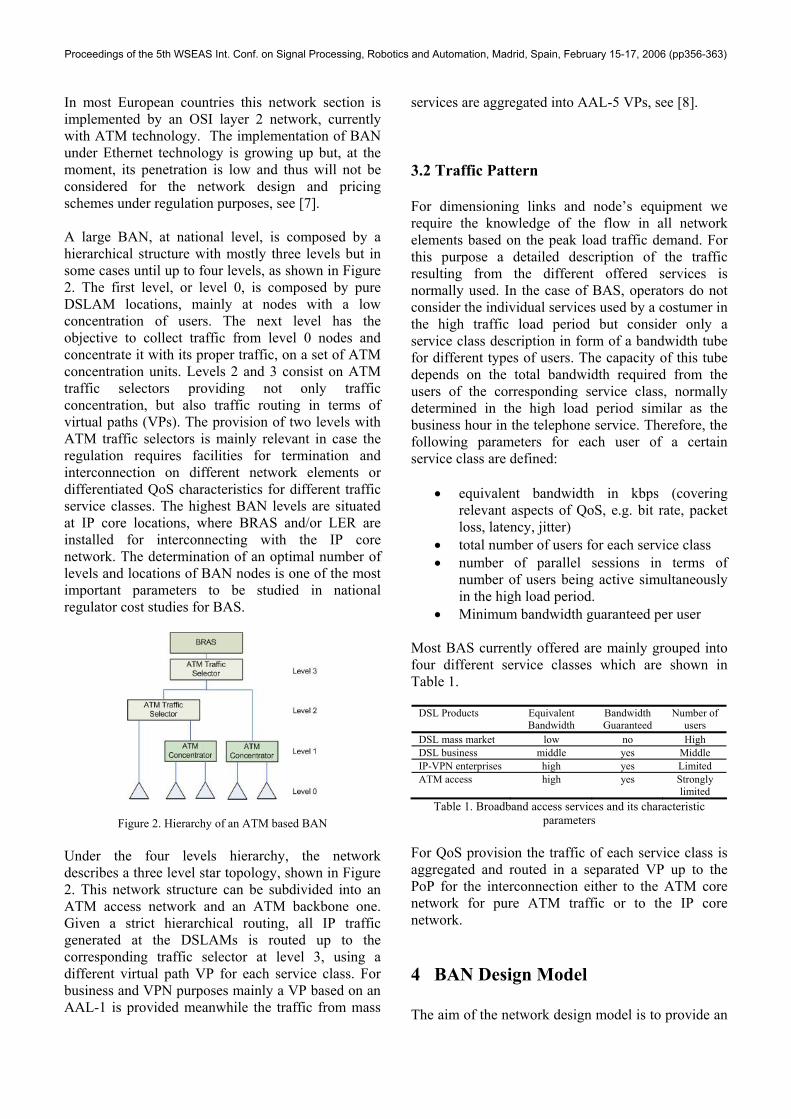
efficient network configuration within information about the traffic load and equipment required for its implementation. This information provides the input data to calculate network costs, mainly based on the unit cost for each service class, with the FL-LRAIC model.
Figure 3. Inputs and outputs of the model As long as the model follows a scorched node approach, the main input data refers to the geographical location of the MDF. Hence, the network design model is divided in five different stages shown in Figure 4.
Figure 4. Logical structure design stages The first stage, traffic calculation, evaluates the number of users and traffic load at each node produced by BAS. This stage allows mainly discarding those MDF locations from BAS provision which are not economically accessible for the BAN. The next stage, node classification, represents an optimization process based on a p-median model and implemented by a deepest first algorithm in relation with the hierarchy of PSTN/ISDN and by considering a minimal distance between nodes in higher hierarchical levels (2-3) to get an equilibrated geographical distribution of these nodes. The assignment of the lower level nodes to the higher ones provides an algorithm based on the shortest geographical distance with a capacity site constrain limiting the maximal number of assigned nodes. The third stage, traffic routing, starts from the traffic load at the DSLAMs grouped in VPs for the different
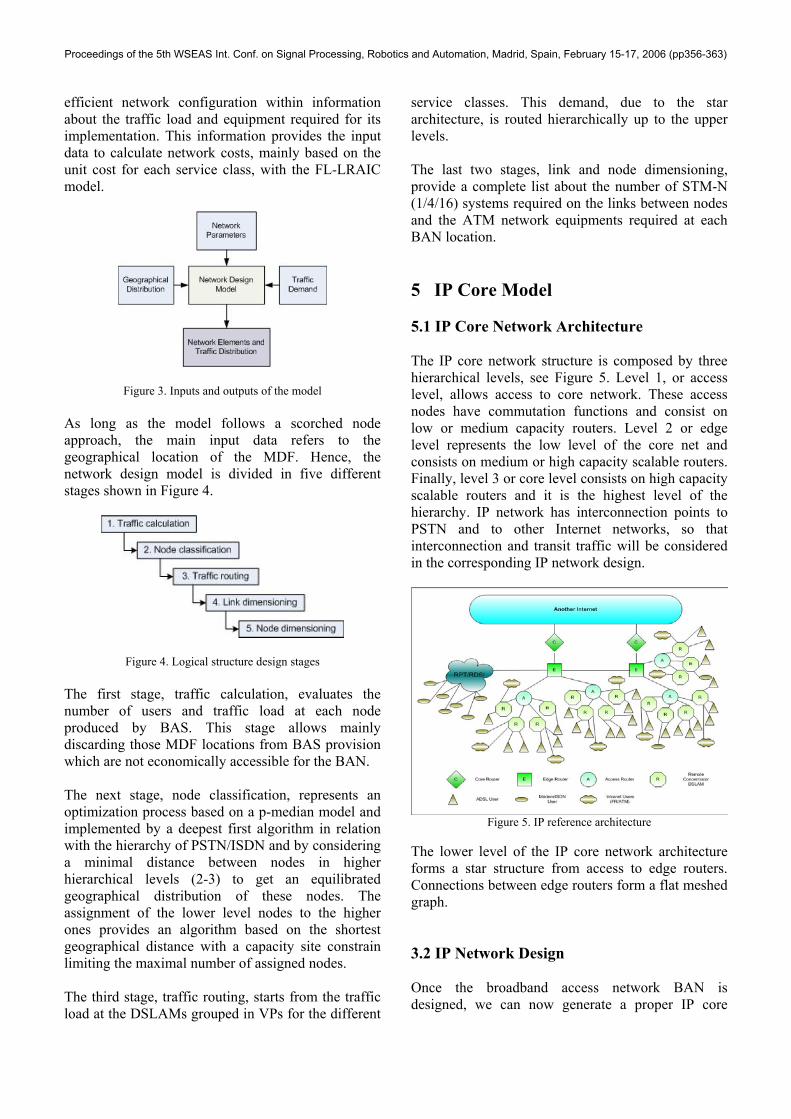
service classes. This demand, due to the star architecture, is routed hierarchically up to the upper levels. The last two stages, link and node dimensioning, provide a complete list about the number of STM-N (1/4/16) systems required on the links between nodes and the ATM network equipments required at each BAN location. 5 IP Core Model 5.1 IP Core Network Architecture The IP core network structure is composed by three hierarchical levels, see Figure 5. Level 1, or access level, allows access to core network. These access nodes have commutation functions and consist on low or medium capacity routers. Level 2 or edge level represents the low level of the core net and consists on medium or high capacity scalable routers. Finally, level 3 or core level consists on high capacity scalable routers and it is the highest level of the hierarchy. IP network has interconnection points to PSTN and to other Internet networks, so that interconnection and transit traffic will be considered in the corresponding IP network design.
Figure 5. IP reference architecture
The lower level of the IP core network architecture forms a star structure from access to edge routers. Connections between edge routers form a flat meshed graph. 3.2 IP Network Design Once the broadband access network BAN is designed, we can now generate a proper IP core
Proceedings of the 5th WSEAS Int. Conf. on Signal Processing, Robotics and Automation, Madrid, Spain, February 15-17, 2006 (pp356-363)
network according to access nodes and traffic figures obtained previously.
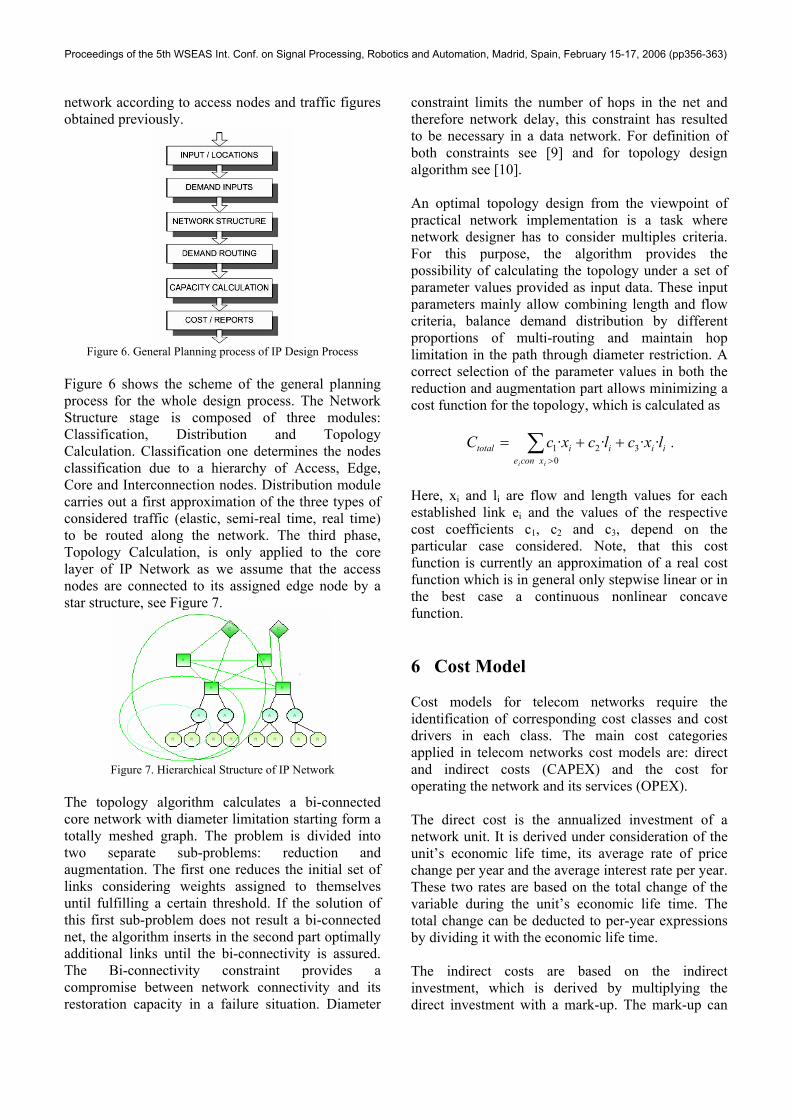
Figure 6. General Planning process of IP Design Process
Figure 6 shows the scheme of the general planning process for the whole design process. The Network Structure stage is composed of three modules: Classification, Distribution and Topology Calculation. Classification one determines the nodes classification due to a hierarchy of Access, Edge, Core and Interconnection nodes. Distribution module carries out a first approximation of the three types of considered traffic (elastic, semi-real time, real time) to be routed along the network. The third phase, Topology Calculation, is only applied to the core layer of IP Network as we assume that the access nodes are connected to its assigned edge node by a star structure, see Figure 7.
Figure 7. Hierarchical Structure of IP Network
The topology algorithm calculates a bi-connected core network with diameter limitation starting form a totally meshed graph. The problem is divided into two separate sub-problems: reduction and augmentation. The first one reduces the initial set of links considering weights assigned to themselves until fulfilling a certain threshold. If the solution of this first sub-problem does not result a bi-connected net, the algorithm inserts in the second part optimally additional links until the bi-connectivity is assured. The Bi-connectivity constraint provides a compromise between network connectivity and its restoration capacity in a failure situation. Diameter
constraint limits the number of hops in the net and therefore network delay, this constraint has resulted to be necessary in a data network. For definition of both constraints see [9] and for topology design algorithm see [10]. An optimal topology design from the viewpoint of practical network implementation is a task where network designer has to consider multiples criteria. For this purpose, the algorithm provides the possibility of calculating the topology under a set of parameter values provided as input data. These input parameters mainly allow combining length and flow criteria, balance demand distribution by different proportions of multi-routing and maintain hop limitation in the path through diameter restriction. A correct selection of the parameter values in both the reduction and augmentation part allows minimizing a cost function for the topology, which is calculated as
∑>
++=0
321 ····ii xcone
iiiitotal lxclcxcC .
Here, xi and li are flow and length values for each established link ei and the values of the respective cost coefficients c1, c2 and c3, depend on the particular case considered. Note, that this cost function is currently an approximation of a real cost function which is in general only stepwise linear or in the best case a continuous nonlinear concave function. 6 Cost Model Cost models for telecom networks require the identification of corresponding cost classes and cost drivers in each class. The main cost categories applied in telecom networks cost models are: direct and indirect costs (CAPEX) and the cost for operating the network and its services (OPEX). The direct cost is the annualized investment of a network unit. It is derived under consideration of the unit’s economic life time, its average rate of price change per year and the average interest rate per year. These two rates are based on the total change of the variable during the unit’s economic life time. The total change can be deducted to per-year expressions by dividing it with the economic life time. The indirect costs are based on the indirect investment, which is derived by multiplying the direct investment with a mark-up. The mark-up can
Proceedings of the 5th WSEAS Int. Conf. on Signal Processing, Robotics and Automation, Madrid, Spain, February 15-17, 2006 (pp356-363)
be interpreted as a percentage supplement that has to be added to the investment. These expenditures are needed to carry out the installation of the network equipment, including the following positions: motor and vehicles, office facilities, network support, network management and land and building. After calculating indirect investment, the indirect cost can be derived in the same way as direct cost. For costing in telecom networks and services see [11], [12]. The cost driver indicates, for each network element, the dependency of the equipment from service and traffic parameters. The cost drivers are mainly divided into two types: access lines cost driver and traffic demand cost driver. The cost driven by access lines (i.e. cost for DSLAM incoming cards, cabinet, etc.) are equally allocated to the total number of access lines. As the cost driver is not traffic-dependent results a cost part Aservice_i. The costs driven by bandwidth (costs for DSLAM’s outgoing cards, ATM concentrators, ATM switches and BRAS) are divided by the total bandwidth that is routed through the respective element providing a unit cost figure named Bunit . The corresponding cost part for a service results then from the product of the required bandwidth bandwidthService i with the corresponding unit cost,. The total cost for a service i is then expressed by the following formula:
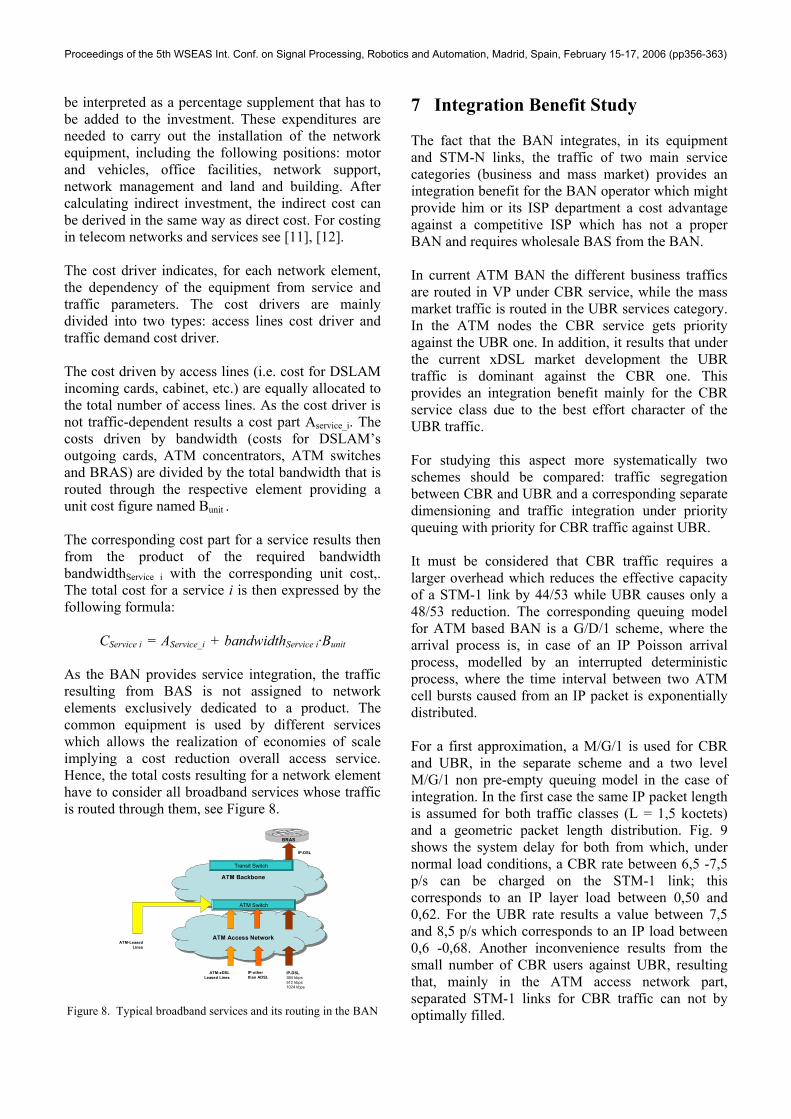
CService i = AService_i + bandwidthService i·Bunit As the BAN provides service integration, the traffic resulting from BAS is not assigned to network elements exclusively dedicated to a product. The common equipment is used by different services which allows the realization of economies of scale implying a cost reduction overall access service. Hence, the total costs resulting for a network element have to consider all broadband services whose traffic is routed through them, see Figure 8.
Figure 8. Typical broadband services and its routing in the BAN
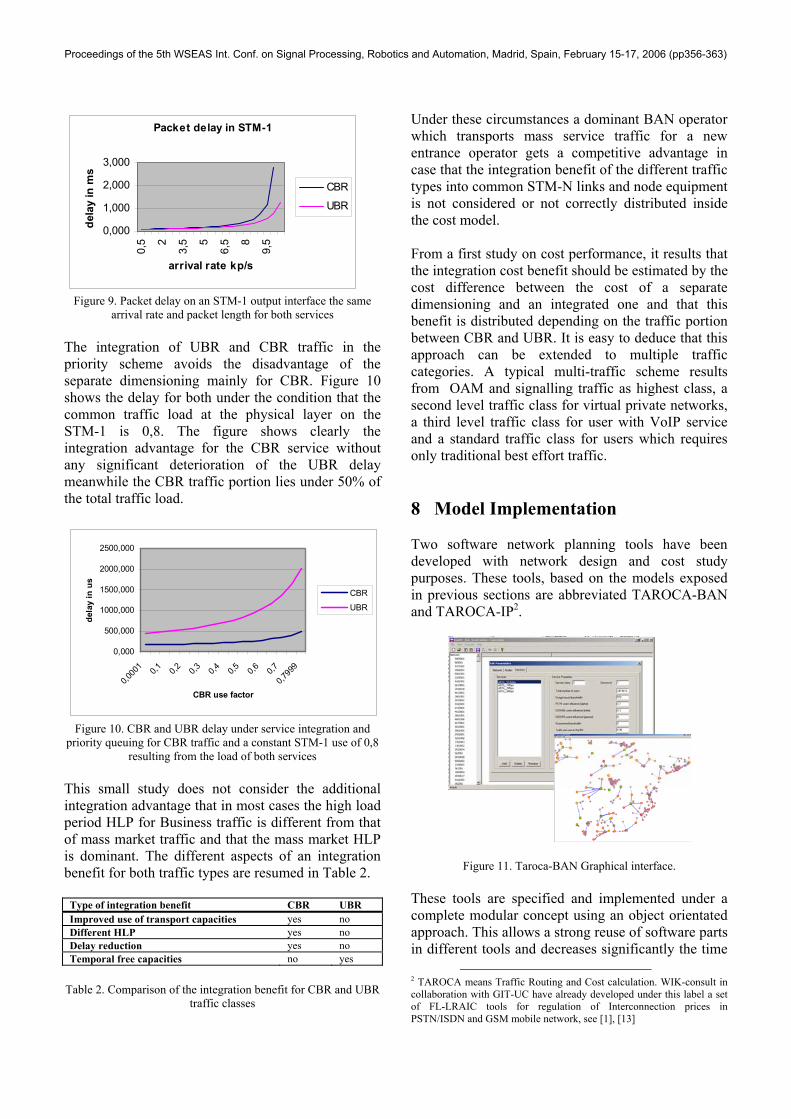
7 Integration Benefit Study The fact that the BAN integrates, in its equipment and STM-N links, the traffic of two main service categories (business and mass market) provides an integration benefit for the BAN operator which might provide him or its ISP department a cost advantage against a competitive ISP which has not a proper BAN and requires wholesale BAS from the BAN. In current ATM BAN the different business traffics are routed in VP under CBR service, while the mass market traffic is routed in the UBR services category. In the ATM nodes the CBR service gets priority against the UBR one. In addition, it results that under the current xDSL market development the UBR traffic is dominant against the CBR one. This provides an integration benefit mainly for the CBR service class due to the best effort character of the UBR traffic. For studying this aspect more systematically two schemes should be compared: traffic segregation between CBR and UBR and a corresponding separate dimensioning and traffic integration under priority queuing with priority for CBR traffic against UBR. It must be considered that CBR traffic requires a larger overhead which reduces the effective capacity of a STM-1 link by 44/53 while UBR causes only a 48/53 reduction. The corresponding queuing model for ATM based BAN is a G/D/1 scheme, where the arrival process is, in case of an IP Poisson arrival process, modelled by an interrupted deterministic process, where the time interval between two ATM cell bursts caused from an IP packet is exponentially distributed. For a first approximation, a M/G/1 is used for CBR and UBR, in the separate scheme and a two level M/G/1 non pre-empty queuing model in the case of integration. In the first case the same IP packet length is assumed for both traffic classes (L = 1,5 koctets) and a geometric packet length distribution. Fig. 9 shows the system delay for both from which, under normal load conditions, a CBR rate between 6,5 -7,5 p/s can be charged on the STM-1 link; this corresponds to an IP layer load between 0,50 and 0,62. For the UBR rate results a value between 7,5 and 8,5 p/s which corresponds to an IP load between 0,6 -0,68. Another inconvenience results from the small number of CBR users against UBR, resulting that, mainly in the ATM access network part, separated STM-1 links for CBR traffic can not by optimally filled.
ATM Access NetworkATM Access Network
ATM BackboneATM Backbone
ATM-xDSLLeased Lines
IP-DSL384 kbps512 kbps1024 kbps
ATM Switch
ATM-LeasedLines
BRAS
Transit Switch
IP-DSL
IP-other than ADSL
Proceedings of the 5th WSEAS Int. Conf. on Signal Processing, Robotics and Automation, Madrid, Spain, February 15-17, 2006 (pp356-363)
Packet delay in STM-1
0,000
1,000
2,000
3,000
0,5 2
3,5 5
6,5 8
9,5
arrival rate kp/s
dela
y in
ms
CBR
UBR
Figure 9. Packet delay on an STM-1 output interface the same
arrival rate and packet length for both services The integration of UBR and CBR traffic in the priority scheme avoids the disadvantage of the separate dimensioning mainly for CBR. Figure 10 shows the delay for both under the condition that the common traffic load at the physical layer on the STM-1 is 0,8. The figure shows clearly the integration advantage for the CBR service without any significant deterioration of the UBR delay meanwhile the CBR traffic portion lies under 50% of the total traffic load.
0,000
500,000
1000,000
1500,000
2000,000
2500,000
0,000
1 0,1 0,2 0,3 0,4 0,5 0,6 0,7
0,799
9
CBR use factor
dela
y in
us
CBR
UBR
Figure 10. CBR and UBR delay under service integration and priority queuing for CBR traffic and a constant STM-1 use of 0,8
resulting from the load of both services This small study does not consider the additional integration advantage that in most cases the high load period HLP for Business traffic is different from that of mass market traffic and that the mass market HLP is dominant. The different aspects of an integration benefit for both traffic types are resumed in Table 2.
Type of integration benefit CBR UBR Improved use of transport capacities yes no Different HLP yes no Delay reduction yes no Temporal free capacities no yes
Table 2. Comparison of the integration benefit for CBR and UBR
traffic classes
Under these circumstances a dominant BAN operator which transports mass service traffic for a new entrance operator gets a competitive advantage in case that the integration benefit of the different traffic types into common STM-N links and node equipment is not considered or not correctly distributed inside the cost model. From a first study on cost performance, it results that the integration cost benefit should be estimated by the cost difference between the cost of a separate dimensioning and an integrated one and that this benefit is distributed depending on the traffic portion between CBR and UBR. It is easy to deduce that this approach can be extended to multiple traffic categories. A typical multi-traffic scheme results from OAM and signalling traffic as highest class, a second level traffic class for virtual private networks, a third level traffic class for user with VoIP service and a standard traffic class for users which requires only traditional best effort traffic. 8 Model Implementation Two software network planning tools have been developed with network design and cost study purposes. These tools, based on the models exposed in previous sections are abbreviated TAROCA-BAN and TAROCA-IP2.
Figure 11. Taroca-BAN Graphical interface. These tools are specified and implemented under a complete modular concept using an object orientated approach. This allows a strong reuse of software parts in different tools and decreases significantly the time
2 TAROCA means Traffic Routing and Cost calculation. WIK-consult in collaboration with GIT-UC have already developed under this label a set of FL-LRAIC tools for regulation of Interconnection prices in PSTN/ISDN and GSM mobile network, see [1], [13]
Proceedings of the 5th WSEAS Int. Conf. on Signal Processing, Robotics and Automation, Madrid, Spain, February 15-17, 2006 (pp356-363)
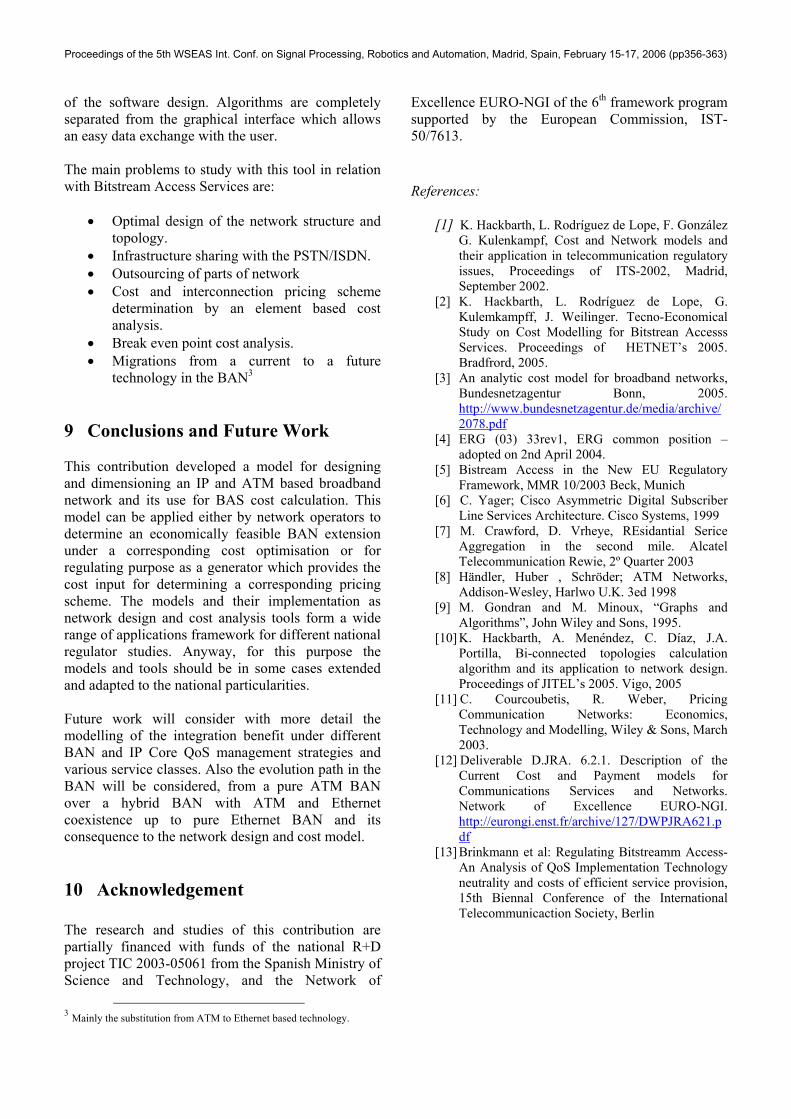
of the software design. Algorithms are completely separated from the graphical interface which allows an easy data exchange with the user. The main problems to study with this tool in relation with Bitstream Access Services are:
• Optimal design of the network structure and topology.
• Infrastructure sharing with the PSTN/ISDN. • Outsourcing of parts of network • Cost and interconnection pricing scheme
determination by an element based cost analysis.
• Break even point cost analysis. • Migrations from a current to a future
technology in the BAN3 9 Conclusions and Future Work This contribution developed a model for designing and dimensioning an IP and ATM based broadband network and its use for BAS cost calculation. This model can be applied either by network operators to determine an economically feasible BAN extension under a corresponding cost optimisation or for regulating purpose as a generator which provides the cost input for determining a corresponding pricing scheme. The models and their implementation as network design and cost analysis tools form a wide range of applications framework for different national regulator studies. Anyway, for this purpose the models and tools should be in some cases extended and adapted to the national particularities. Future work will consider with more detail the modelling of the integration benefit under different BAN and IP Core QoS management strategies and various service classes. Also the evolution path in the BAN will be considered, from a pure ATM BAN over a hybrid BAN with ATM and Ethernet coexistence up to pure Ethernet BAN and its consequence to the network design and cost model. 10 Acknowledgement The research and studies of this contribution are partially financed with funds of the national R+D project TIC 2003-05061 from the Spanish Ministry of Science and Technology, and the Network of
3 Mainly the substitution from ATM to Ethernet based technology.
Excellence EURO-NGI of the 6th framework program supported by the European Commission, IST-50/7613. References:
[1] K. Hackbarth, L. Rodríguez de Lope, F. González G. Kulenkampf, Cost and Network models and their application in telecommunication regulatory issues, Proceedings of ITS-2002, Madrid, September 2002.
[2] K. Hackbarth, L. Rodríguez de Lope, G. Kulemkampff, J. Weilinger. Tecno-Economical Study on Cost Modelling for Bitstrean Accesss Services. Proceedings of HETNET’s 2005. Bradfrord, 2005.
[3] An analytic cost model for broadband networks, Bundesnetzagentur Bonn, 2005. http://www.bundesnetzagentur.de/media/archive/2078.pdf
[4] ERG (03) 33rev1, ERG common position – adopted on 2nd April 2004.
[5] Bistream Access in the New EU Regulatory Framework, MMR 10/2003 Beck, Munich
[6] C. Yager; Cisco Asymmetric Digital Subscriber Line Services Architecture. Cisco Systems, 1999
[7] M. Crawford, D. Vrheye, REsidantial Serice Aggregation in the second mile. Alcatel Telecommunication Rewie, 2º Quarter 2003
[8] Händler, Huber , Schröder; ATM Networks, Addison-Wesley, Harlwo U.K. 3ed 1998
[9] M. Gondran and M. Minoux, “Graphs and Algorithms”, John Wiley and Sons, 1995.
[10] K. Hackbarth, A. Menéndez, C. Díaz, J.A. Portilla, Bi-connected topologies calculation algorithm and its application to network design. Proceedings of JITEL’s 2005. Vigo, 2005
[11] C. Courcoubetis, R. Weber, Pricing Communication Networks: Economics, Technology and Modelling, Wiley & Sons, March 2003.
[12] Deliverable D.JRA. 6.2.1. Description of the Current Cost and Payment models for Communications Services and Networks. Network of Excellence EURO-NGI. http://eurongi.enst.fr/archive/127/DWPJRA621.pdf
[13] Brinkmann et al: Regulating Bitstreamm Access-An Analysis of QoS Implementation Technology neutrality and costs of efficient service provision, 15th Biennal Conference of the International Telecommunicaction Society, Berlin
Proceedings of the 5th WSEAS Int. Conf. on Signal Processing, Robotics and Automation, Madrid, Spain, February 15-17, 2006 (pp356-363)
Related Documents