Both the gasoline and diesel engines will be winners Mitsuo Hitomi Mazda Motor Corporation 26th International AVL Conference « Engine & Environment » 1

Welcome message from author
This document is posted to help you gain knowledge. Please leave a comment to let me know what you think about it! Share it to your friends and learn new things together.
Transcript

Both the gasoline and diesel engines will be winners
Mitsuo HitomiMazda Motor Corporation
26th International AVL Conference« Engine & Environment »
1

Contents
Target for ICE powered vehicles
Improving thermal efficiency of ICEs
Status of gasoline and diesel engines: Technological issues
Thermal efficiency improvement
Will ICE vehicles catch up with EVs?
Conclusions
2
Target for ICE powered vehicles
Improving thermal efficiency of ICEs
Status of gasoline and diesel engines: Technological issues
Thermal efficiency improvement
Will ICE vehicles catch up with EVs?
Conclusions

3It is impossible to improve environments without improving ICEs.
Forecast of world annual vehicle sales volume
Calendar year
Internal CombustionEngine
HEV
PHEVEV
0
Sales volume /year (
billi
on)
0.5
1.0
1.5
2.0
2010 2015 2020 20302025
Hybrid vehicle belongs to ICE family, not to EV family.
Ref. Marubeni Research Institute
2035
2.5
2.0
1.5
1.0
0.5
0
202020102000 2030 2040 2050
Automobile stocks by region
Non-OECD: Others
Non-OECD: ASIA
OECD
Calendar year
Sales volume /year (
billi
on)
Target for ICE powered vehicles

After 2011 big earthquake in Japan
0.97
0.80
0.520.470.450.430.39
0.170.09
(kg-CO2/kWh)1.2
1.0
0.8
0.6
0.4
0.2
0France Canada Japan Italy UK Germany USA China India
0.52
Specific CO2 emission from electric power generation is assumed to be 0.5kg-CO2/kWh.
Specific CO2 emissions of electric power generation
4
Target for ICE powered vehicles

A carB car
C car average15%
30%
45%
0%
Electric power consumption of C car in the real world: 21.2kWh/100km.Fuel consumption of Mazda 2L C car in the real world: 5.2L/100km
10 12 14 16 18 2010
12
14
16
18
20
22
24
26
28
30
Specific electricity consumption at NEDC (kWh/100km)
3
4
5
6
7
3 4 5 6 7
I2 0.9L
I3 I.0L
I3 0.9L
1.4L
I3 1.0L
1.2L
1.4L
A 1.8L1.6L
1.4L1.6L1.6L
1.2LI3 1.0L
1.4L1.6L
1.2L
1.6L
2.0L
1.4L
1.6L
1.4L
*Source : ADAC EcoTest NEU ab März 2012
1.4L
1.2L
Mazda3 2.0L SKYACTIV-G
Note I3I.2L
1.2L
F/E at NEDC (L/100km)
A car
B car
C car
5
Target for ICE powered vehiclesFuel consumption reduction target for ICE powered vehicle in real world
21.2kWh/100km

0 0.1 0.2 0.3 0.4 0.5 0.6 0.7 0.8 0.9 1.00
20
40
60
80
100
120
140
Specific CO2 emission of electric power generation kg/kwh
Wel
l-to-
Whe
el_C
O2
(g/k
m)
4L/100km
3L/100km
Average
21.2kwh/100km=C car in the real world
Fuel consumption reduction target for ICE powered vehicle in real world
LCA considering just Li-ion Battery manufacturing2 ton (minimum estimation ever found)CO2 for 20kWh batteryLifetime mileage assumed 200,000km
Mazda3 2.0L = 5.2L/100km
Target for Mazda 3 5.2L/100km 4L (3.8L-4.2L)/100km
Around 25% fuel consumption reduction required
3.8L/100km
6
Target for ICE powered vehicles
4.2L/100kmTarget; 4L/100km
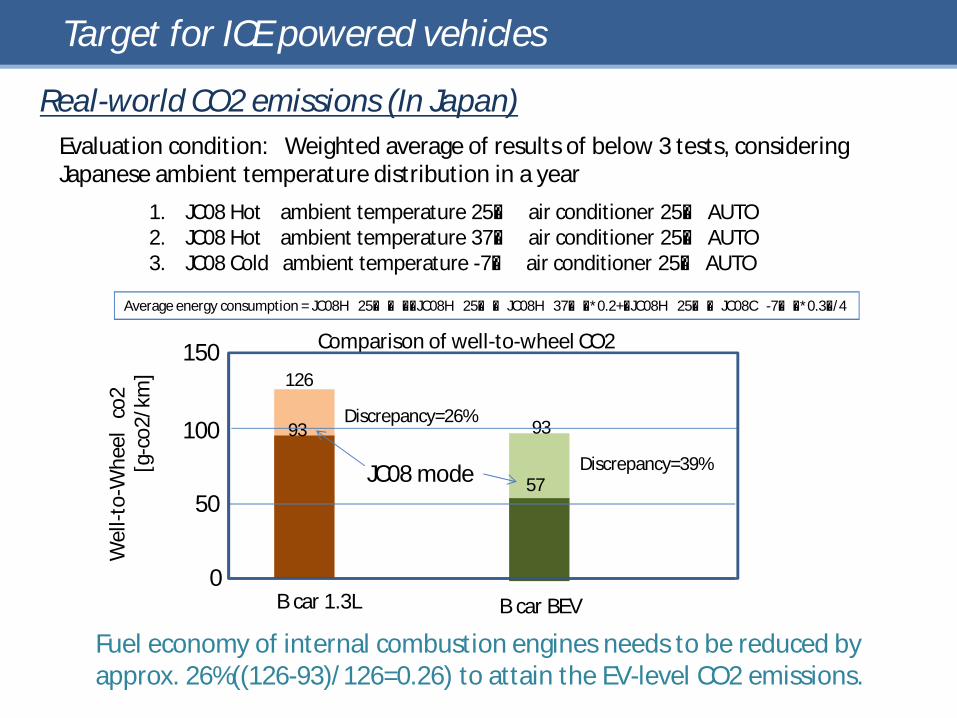
Comparison of well-to-wheel CO2
Wel
l-to-
Whe
elco
2[g
-co2
/km
]
B car 1.3L B car BEV
126
93 93
57Discrepancy=39%
Discrepancy=26%
1. JC08 Hot ambient temperature 25℃ air conditioner 25℃ AUTO2. JC08 Hot ambient temperature 37℃ air conditioner 25℃ AUTO3. JC08 Cold ambient temperature -7℃ air conditioner 25℃ AUTO
Real-world CO2 emissions (In Japan)Evaluation condition: Weighted average of results of below 3 tests, considering Japanese ambient temperature distribution in a year
0
50
100
150
Fuel economy of internal combustion engines needs to be reduced by approx. 26%((126-93)/126=0.26) to attain the EV-level CO2 emissions.
7
Target for ICE powered vehicles
Average energy consumption = JC08H 25℃-((JC08H 25℃-JC08H 37℃)*0.2+(JC08H 25℃-JC08C -7℃)*0.3)/4
JC08 mode
4000
5000
3000
2000
1000
00 10 20 30 40 50 60 70 80 90 100
EV equivalent CO2 in C car
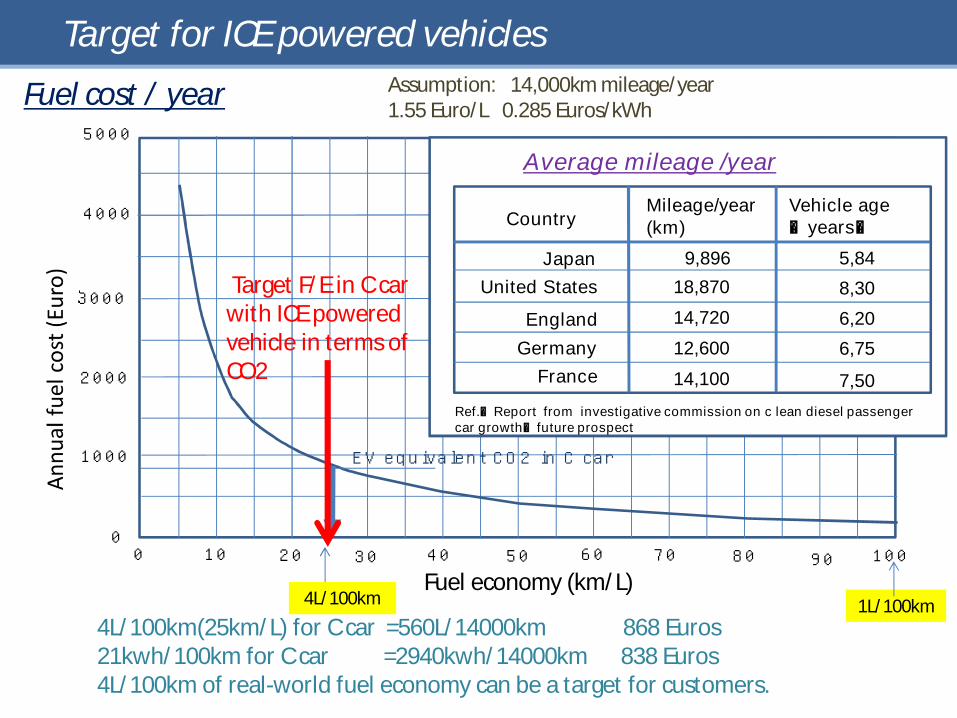
Fuel cost / year
4L/100km(25km/L) for C car =560L/14000km 868 Euros 21kwh/100km for C car =2940kwh/14000km 838 Euros 4L/100km of real-world fuel economy can be a target for customers.
Fuel economy (km/L)
Assumption: 14,000km mileage/year 1.55 Euro/L 0.285 Euros/kWh
Country
JapanUnited States
EnglandGermany
France
Vehicle age(years)
9,89618,87014,72012,600
5,848,306,206,75
14,100 7,50Ref.)Report from investigative commission on c lean diesel passenger car growth・future prospect
Mileage/year (km)
Target F/E in C carwith ICE powered vehicle in terms of CO2
Average mileage /year
Target for ICE powered vehicles
8
4L/100km 1L/100km
Contents
Target for ICE powered vehicles
Improving thermal efficiency of ICEs
Status of gasoline and diesel engines: Technological issues
Thermal efficiency improvement
Will ICE vehicles catch up with EVs?
Conclusions
9
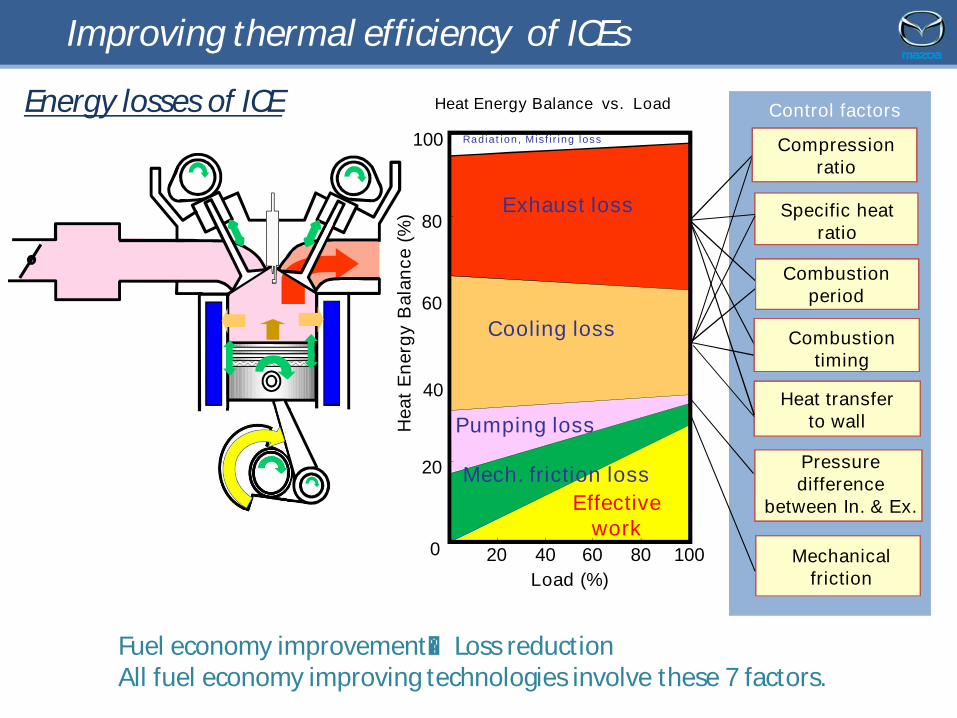
Energy losses of ICE
Fuel economy improvement=Loss reductionAll fuel economy improving technologies involve these 7 factors.
Effective work
Exhaust loss
Hea
t Ene
rgy
Bal
ance
(%)
Heat Energy Balance vs. Load
0
20
60
80
100
20 40 60 80 100Load (%)
40
Radiation, Misfiring loss
Cooling loss
Control factors
Pressure difference
between In. & Ex.
Mechanical friction
Specific heat ratio
Heat transferto wallPumping loss
Mech. friction loss
Combustionperiod
Combustion timing
Compression ratio
10
Improving thermal efficiency of ICEs
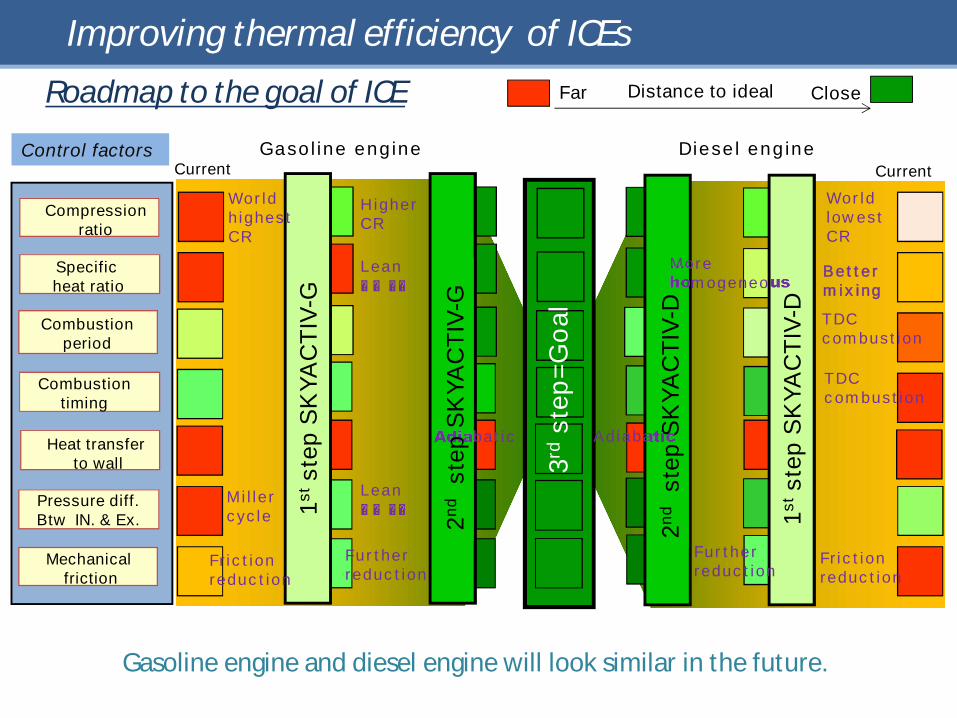
Gasoline engine Diesel engine
Further reduction
LeanHCCI
Adiabatic
Higher CR
LeanHCCI
Roadmap to the goal of ICE Distance to idealFar Close
Specificheat ratio
Heat transferto wall
Compression ratio
Combustion period
Control factors
Combustiontiming
Pressure diff.Btw IN. & Ex.
Mechanicalfriction
Gasoline engine and diesel engine will look similar in the future.
Adiabatic
Further reduction
Friction reduction
More homogeneous
World lowest CR
TDC combustion
TDC combustion
World highest CR
Friction reduction
Miller cycle 1stst
ep S
KYA
CTI
V-G
1stst
ep S
KYA
CTI
V-D
2ndst
ep S
KYA
CTI
V-G
2ndst
ep S
KYA
CTI
V-D
3rd
step
=Goa
l
Current Current
Better mixing
Improving thermal efficiency of ICEs
11
Contents
Target for ICE powered vehicles
Improving thermal efficiency of ICEs
Status of gasoline and diesel engines: Technological issues
Thermal efficiency improvement
Will ICE vehicles catch up with EVs?
Conclusions
12

13
Specific heat ratio(λ,G/F)Combustion period 40
Indicated work(gross)
DieselGasoline
Exhaust loss
Cooling loss
Unburned loss
Heat balance analysis
40.8
34.7
20.8
42.8
33.5
21.2
Thermal efficiencyCompression ( Expansion) ratio
Combustion timing
Heat transfer to wall LIC
Indicated work(gross)
14 14 λ:1,G/F:17 λ:2.8,EGR ratio:57%,G/F:63
75
40.8% 42.8%
Light load: 2000rpm – IMEP290kPa
Status of gasoline and diesel engines

14
Gasoline Heat balance analysis
Indicated work(gross)
Exhaust loss
Cooling loss
Unburned loss
41.3
39.3
16.0
42.8
40.6
15.9
75
14 14
λ:1,G/F:15 λ:1.6,EGR ratio:35%,G/F:3350
41.3% 42.8%
Specific heat ratio(λ,G/F)Combustion period
Thermal efficiencyCompression ( Expansion) ratio
Combustion timing
Heat transfer to wall
DieselMiddle load: 2000rpm – IMEP940kPa
Status of gasoline and diesel engines
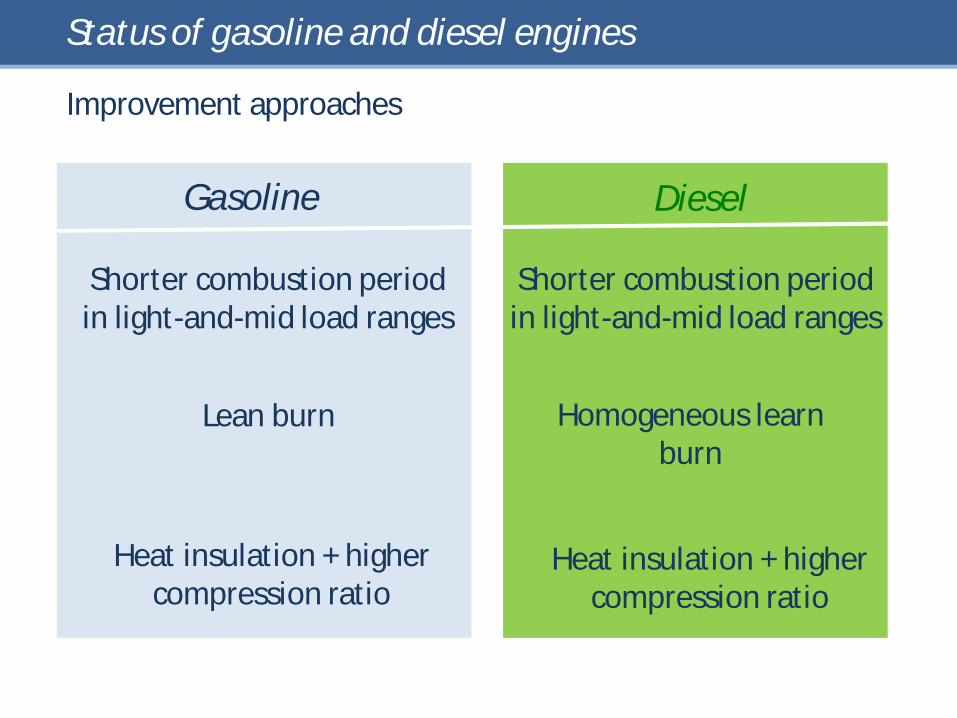
Shorter combustion periodin light-and-mid load ranges
Shorter combustion period in light-and-mid load ranges
Lean burn Homogeneous learn burn
Heat insulation + higher compression ratio
Heat insulation + higher compression ratio
Improvement approaches
DieselGasoline
Status of gasoline and diesel engines
15

Contents
Target for ICE powered vehicles
Improving thermal efficiency of ICEs
Status of gasoline and diesel engines: Technological issues
Thermal efficiency improvement
Will ICE vehicles catch up with EVs?
Conclusions
16
17
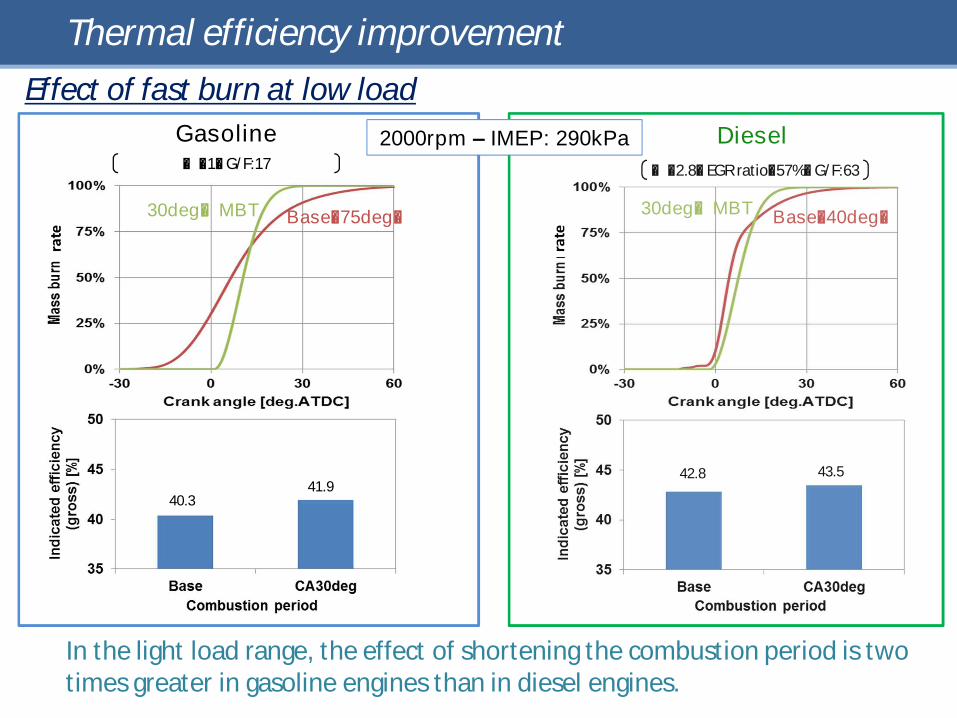
Effect of fast burn at low load
In the light load range, the effect of shortening the combustion period is two times greater in gasoline engines than in diesel engines.
Thermal efficiency improvement
λ:1,G/F:17
Gasolineλ:2.8,EGR ratio:57%,G/F:63
Diesel
Base(75deg)30deg@MBT Base(40deg)30deg@MBT
40.341.9
42.8 43.5
2000rpm – IMEP: 290kPa

18
Effect of fast burn at high load
In the high load range, the effect of shortening the combustion period is almost the same between gasoline and diesel engines.
Thermal efficiency improvement
λ:1.6,EGR ratio:37%,G/F:33λ:1,G/F:15
DieselGasoline
Base(50deg)30deg@MBT Base(75deg)30deg@MBT
41.0
43.2 42.845.2
2000rpm – IMEP: 940kPa

Effect of homogeneity in diesel 2000rpm CR:14 Combustion timing:MBT Combustion period:30deg
1/Φ<1; 2 zone combustion1/Φ>1; 2 zone combustion until oxygen consumed then Oxygen fed from air zone
Diesel stratifiedmixture
Homogenous mixture
(2zone 0D-calc.)
Homogeneous
Φ=1Zone image
Fuel moleculeOxygen molecule
Stratified
Homogenous mixture
(2zone 0D-calc.)
IMEP: 290kPa λ:2.8 EGR ratio: 57%
IMEP940kPa λ:1.6 EGR ratio: 37%
Thermal efficiency improvement is possible to some degree with an enhancement of homogeneous air and fuel mixture during fuel combustion.
3D CFD
Excess air ratio
IMEP=290kPa
IMEP=940kPa
IMEP=940kPaIn-cylinder average
IMEP=290kPaIn-cylinder average
Freq
uenc
y (in
com
bust
ion
area
)
19
Thermal efficiency improvement
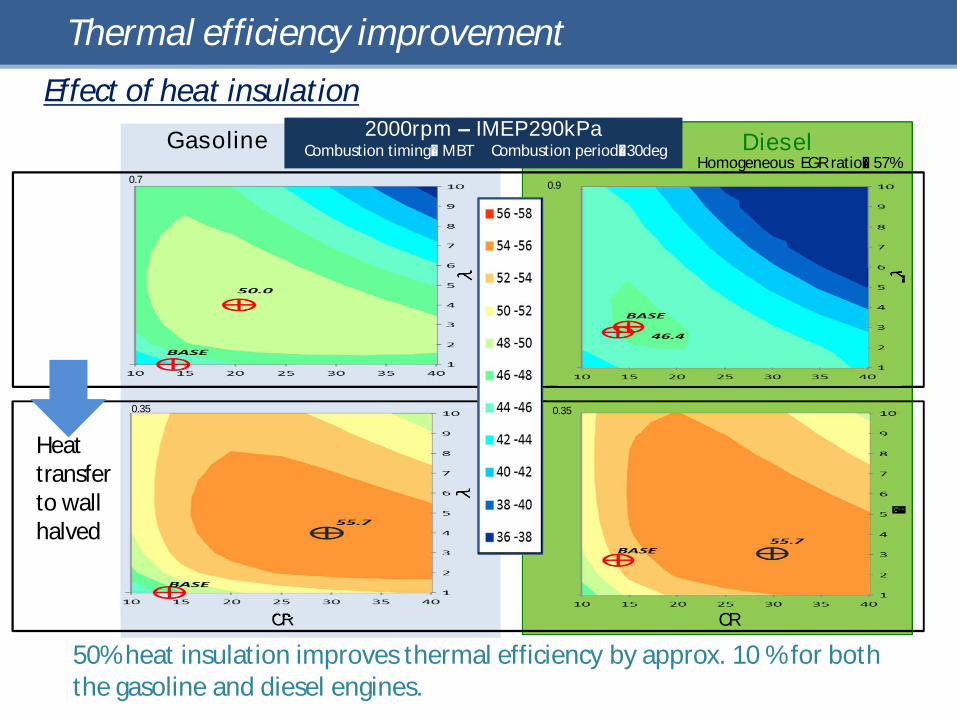
50% heat insulation improves thermal efficiency by approx. 10 % for both the gasoline and diesel engines.
Effect of heat insulation
20
Thermal efficiency improvement
Gasoline
ελ
λ
Diesel
CR
λλ
Homogeneous EGR ratio: 57%
CR
2000rpm – IMEP290kPaCombustion timing:MBT Combustion period:30deg
Heat transfer to wall halved
0.7 0.9
0.35 0.35
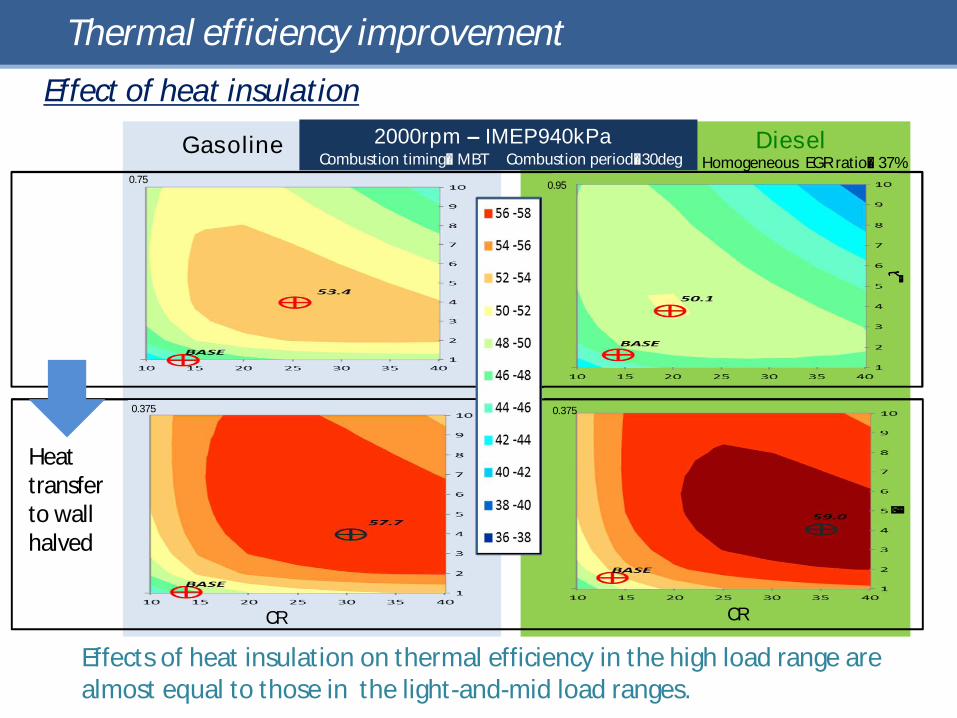
Effects of heat insulation on thermal efficiency in the high load range are almost equal to those in the light-and-mid load ranges.
Effect of heat insulation
21
Gasoline Diesel
CR CR
Homogeneous EGR ratio: 37%2000rpm – IMEP940kPa
Combustion timing:MBT Combustion period:30deg
λλ
Thermal efficiency improvement
Heat transfer to wall halved
0.75 0.95
0.375 0.375

There is room for improving thermal efficiency in the light load range:Approx. 30% for diesel engines Approx. 40% for gasoline engines 22
Light load: 2000rpm – IMEP290kPaWalk of efficiency improvement
Thermal efficiency improvement
Combustion period GE:DE:
Specific heat ratioGE:
DE:
Compression raio GE:DE:
Wall heat transfer GE:DE:
Intake valve close GE:DE:
93deg ABDC36deg ABDC
Base ← ← ←Base ← ← ←
40deg 30deg ← ← ←
Homogeneous
Stratified
←←
Homogeneous←
14 ← ← 20 30
←λ=1
λ=2.8 λ=2.8 λ=4
0.5*GE
40
45
50
55
60
Gasoline (GE) Diesel (DE)
75deg
←←
←←
←←
←←
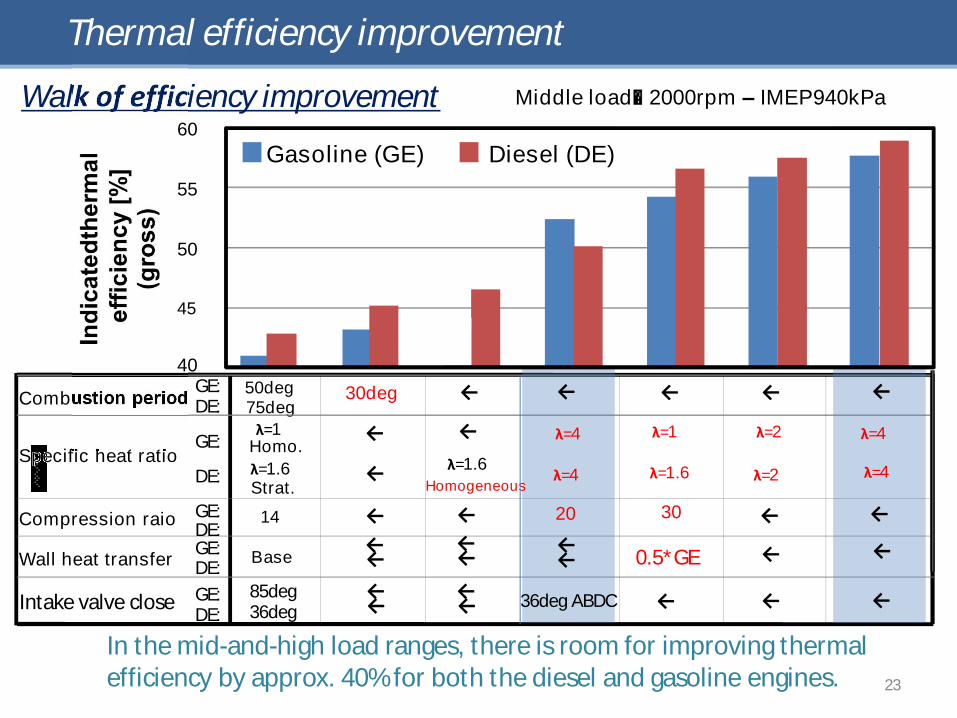
Middle load: 2000rpm – IMEP940kPa
Thermal efficiency improvement
Walk of efficiency improvement
In the mid-and-high load ranges, there is room for improving thermal efficiency by approx. 40% for both the diesel and gasoline engines. 23
Combustion period 50deg75deg
Specific heat ratioλ=1
Homo.
Strat.
Compression raio 14
Wall heat transfer Base
λ=1.6
Intake valve close GE:DE:
GE:DE:
GE:DE:
GE:
DE:
GE:DE:
85deg36deg 36deg ABDC
30deg
Homogeneous
20 30
λ=1.6 λ=1.6
λ=4
λ=4
λ=1 λ=2
λ=2
λ=4
λ=4
←
←
←←←
←
←
←←←
← ←
←
←←
← ←
←
←← 0.5*GE
40
45
50
55
60Gasoline (GE) Diesel (DE)
←←
←← ← ←←
Contents
Target for ICE powered vehicles
Improving thermal efficiency of ICEs
Status of gasoline and diesel engines: Technological issues
Thermal efficiency improvement
Will ICE vehicles catch up with EVs?
Conclusions
24

Indicated Specific Fuel Consumption
Targeted ISFC improvements Light-and-mid load: 30% in the 2nd step & 40% in the 3rd step High load rang : 10% in the 2nd step under λ=1.
20% in the 2nd step & 35% in the 3rd step under boosted lean burn 25
0 200 400 600 800 1000 1200IMEP (kPa)
180
240
260
280
120
140
100g/kwh
λ=1 area Target for 2nd step
Target for 3rd step
1st step SKYACTIV
Boosted lean burn
Will ICE vehicles catch up with EVs?
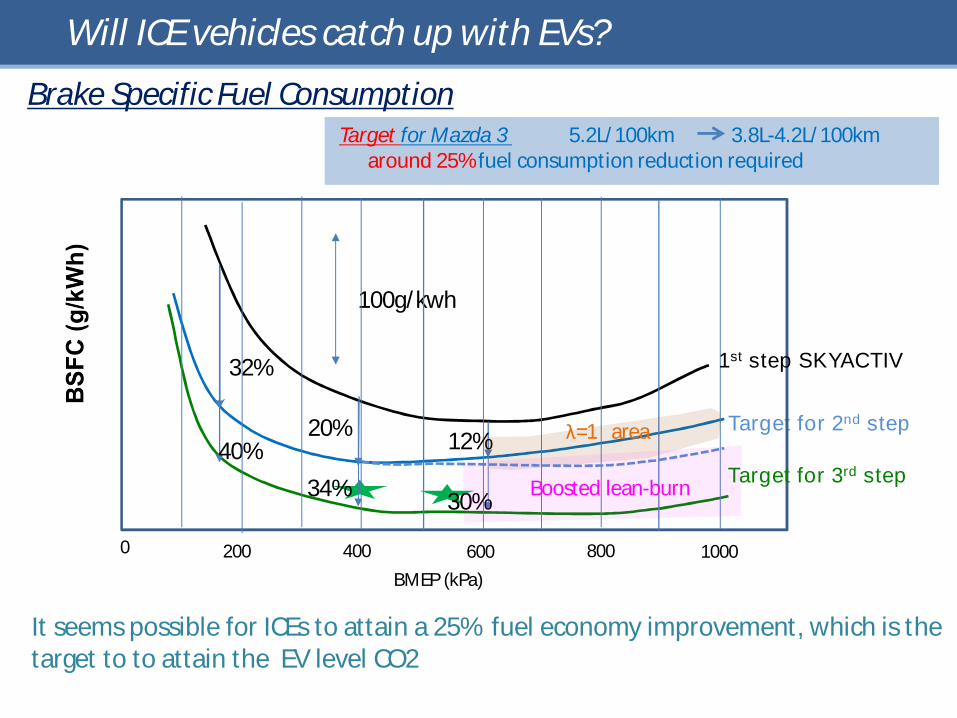
It seems possible for ICEs to attain a 25% fuel economy improvement, which is the target to to attain the EV level CO2
Brake Specific Fuel Consumption
26
Target for 2nd step
100g/kwh
0
Target for 3rd step
200 400 600 800 1000BMEP (kPa)
32%
40%20%
34%
12%
30%
1st step SKYACTIV
λ=1 area
Boosted lean-burn
Will ICE vehicles catch up with EVs?
Target for Mazda 3 5.2L/100km 3.8L-4.2L/100kmaround 25% fuel consumption reduction required

Will ICE vehicles catch up with EVs?Comparison of thermal efficiency improvement during driving
20
30
40
50
60[%
]
Engine Efficiency
020406080
100120
580 680 780 880 980 1080 1180
[km
/h]
Time [sec]
Vehicle Speed
1st step
2nd step
3rd step
60
70
80
90
100
[%]
Motor and Battery Efficiency
ICE vehicles will be able to attain the CO2 level of EVs based on mode simulation. Efficiency improvement for EVs is nearing its limit.
27

Contents
Target for ICE powered vehicles
Improving thermal efficiency of ICEs
Status of gasoline and diesel engines: Technological issues
Thermal efficiency improvement
Will ICE vehicles catch up with EVs?
Conclusions
28
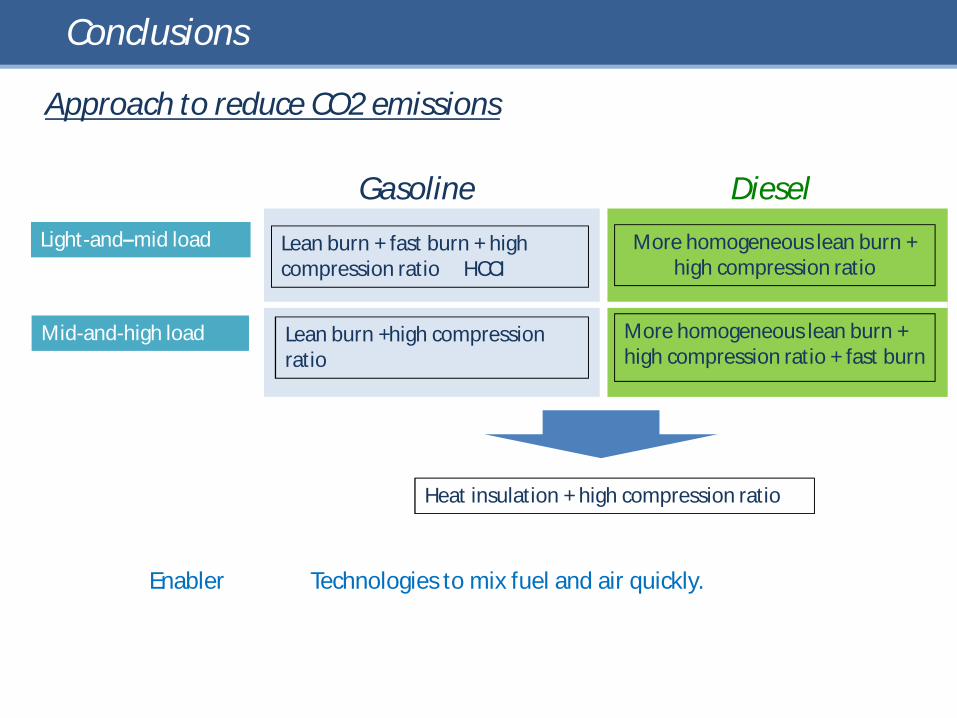
DieselGasolineLight-and–mid load More homogeneous lean burn +
high compression ratioLean burn + fast burn + high compression ratio HCCI
Approach to reduce CO2 emissions
Mid-and-high load More homogeneous lean burn + high compression ratio + fast burn
Enabler Technologies to mix fuel and air quickly.
Conclusions
Lean burn +high compression ratio
Heat insulation + high compression ratio
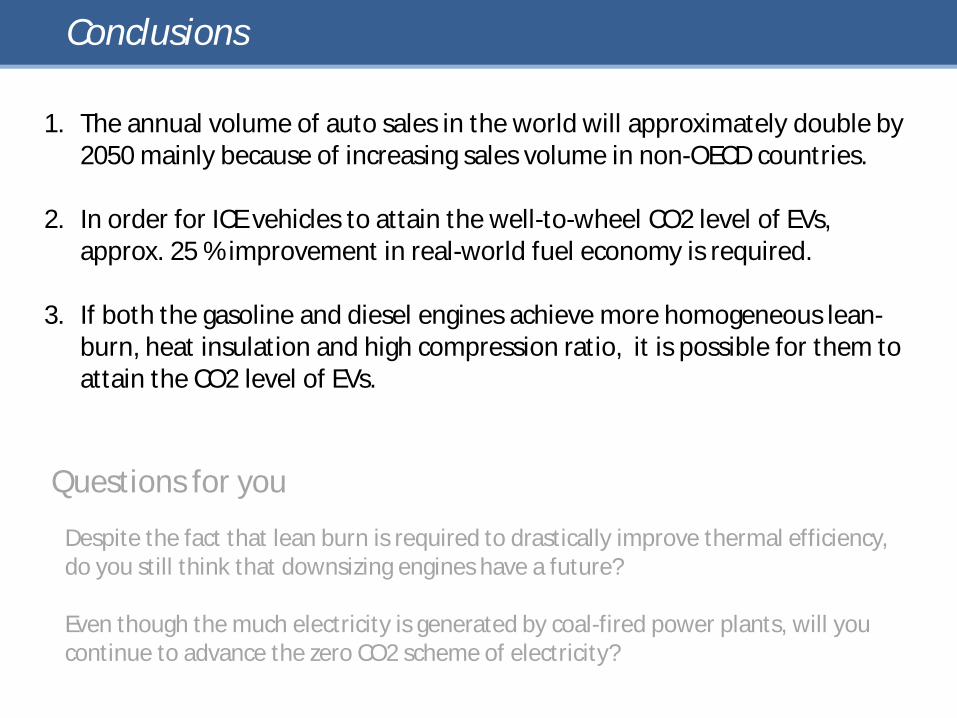
Despite the fact that lean burn is required to drastically improve thermal efficiency, do you still think that downsizing engines have a future?
Even though the much electricity is generated by coal-fired power plants, will you continue to advance the zero CO2 scheme of electricity?
1. The annual volume of auto sales in the world will approximately double by 2050 mainly because of increasing sales volume in non-OECD countries.
2. In order for ICE vehicles to attain the well-to-wheel CO2 level of EVs, approx. 25 % improvement in real-world fuel economy is required.
3. If both the gasoline and diesel engines achieve more homogeneous lean-burn, heat insulation and high compression ratio, it is possible for them to attain the CO2 level of EVs.
Conclusions
30
Questions for you

Thank you for your attention!
Related Documents