ARTICLE Both fallopian tube and ovarian surface epithelium are cells-of-origin for high-grade serous ovarian carcinoma Shuang Zhang 1 *, Igor Dolgalev 1 , Tao Zhang 1 , Hao Ran 1 , Douglas A. Levine 1 & Benjamin G. Neel 1 * The cell-of-origin of high grade serous ovarian carcinoma (HGSOC) remains controversial, with fallopian tube epithelium (FTE) and ovarian surface epithelium (OSE) both considered candidates. Here, by using genetically engineered mouse models and organoids, we assessed the tumor-forming properties of FTE and OSE harboring the same oncogenic abnormalities. Combined RB family inactivation and Tp53 mutation in Pax8 + FTE caused Serous Tubal Intraepithelial Carcinoma (STIC), which metastasized rapidly to the ovarian surface. These events were recapitulated by orthotopic injection of mutant FTE organoids. Engineering the same genetic lesions into Lgr5 + OSE or OSE-derived organoids also caused metastatic HGSOC, although with longer latency and lower penetrance. FTE- and OSE-derived tumors had distinct transcriptomes, and comparative transcriptomics and genomics suggest that human HGSOC arises from both cell types. Finally, FTE- and OSE-derived organoids exhibited differential chemosensitivity. Our results comport with a dualistic origin for HGSOC and suggest that the cell-of-origin might influence therapeutic response. https://doi.org/10.1038/s41467-019-13116-2 OPEN 1 Laura and Isaac Perlmutter Cancer Center, NYU Langone Health, New York, NY 10016, USA. *email: [email protected]; [email protected] NATURE COMMUNICATIONS | (2019)10:5367 | https://doi.org/10.1038/s41467-019-13116-2 | www.nature.com/naturecommunications 1 1234567890():,;

Welcome message from author
This document is posted to help you gain knowledge. Please leave a comment to let me know what you think about it! Share it to your friends and learn new things together.
Transcript

ARTICLE
Both fallopian tube and ovarian surface epitheliumare cells-of-origin for high-grade serous ovariancarcinomaShuang Zhang1*, Igor Dolgalev 1, Tao Zhang 1, Hao Ran1, Douglas A. Levine1 & Benjamin G. Neel1*
The cell-of-origin of high grade serous ovarian carcinoma (HGSOC) remains controversial,
with fallopian tube epithelium (FTE) and ovarian surface epithelium (OSE) both considered
candidates. Here, by using genetically engineered mouse models and organoids, we assessed
the tumor-forming properties of FTE and OSE harboring the same oncogenic abnormalities.
Combined RB family inactivation and Tp53 mutation in Pax8+ FTE caused Serous Tubal
Intraepithelial Carcinoma (STIC), which metastasized rapidly to the ovarian surface. These
events were recapitulated by orthotopic injection of mutant FTE organoids. Engineering the
same genetic lesions into Lgr5+OSE or OSE-derived organoids also caused metastatic
HGSOC, although with longer latency and lower penetrance. FTE- and OSE-derived tumors
had distinct transcriptomes, and comparative transcriptomics and genomics suggest that
human HGSOC arises from both cell types. Finally, FTE- and OSE-derived organoids exhibited
differential chemosensitivity. Our results comport with a dualistic origin for HGSOC and
suggest that the cell-of-origin might influence therapeutic response.
https://doi.org/10.1038/s41467-019-13116-2 OPEN
1 Laura and Isaac Perlmutter Cancer Center, NYU Langone Health, New York, NY 10016, USA. *email: [email protected]; [email protected]
NATURE COMMUNICATIONS | (2019) 10:5367 | https://doi.org/10.1038/s41467-019-13116-2 | www.nature.com/naturecommunications 1
1234
5678
90():,;

H igh-grade serous ovarian cancer (HGSOC) is the mostcommon and deadly ovarian epithelial cancer, causing~70% of deaths1. HGSOC typically presents as a large
ovarian mass accompanied by widespread peritoneal metastasis,but its cell-of-origin remains controversial2–5. Initially, HGSOCwas thought to arise from invaginations of the ovarian surfaceepithelium (OSE) that result from normal ovulatory wounds.Trapped OSE within these so-called cortical inclusion cysts werebelieved to undergo Mullerian metaplasia and accumulate causalmutations5–7. Cortical inclusion cysts with columnar (Mullerian)epithelia and focal p53 immunoreactivity, but not frank carci-noma, have been reported, but such lesions are relatively rare8,9
Later, attention turned to the fallopian tube epithelium (FTE) asthe likely cell-of-origin after serous tubular intra-epithelial car-cinomas (STICs), defined as in situ neoplasms with increasedproliferative capacity, TP53 mutation, and other characteristicmarkers, were reported in the fallopian tube fimbria of womenwith BRCA1/2 mutations undergoing risk-reducing salpingoo-phorectomy10–12. Subsequently, STICs were reported in up to60% of sporadic HGSOC cases13–15.
Multiple studies have attempted to define the cell-of-origin forHGSOC by genetic approaches. Essentially all HGSOCs havesomatic mutations in TP53, and STICs, primary HGSOC, andmetastases have the same TP53 mutation, implying a sharedorigin16–19. More comprehensive characterization (e.g., exomesequencing, copy number analysis, targeted amplicon sequencing,gene expression profiling) has shown that ovarian masses anddistant metastases usually have the same truncal lesions as STICs,along with additional, often sub-clonal, abnormalities, suggestingthat STICs are precursor lesions13,20. In addition, the tran-scriptomes of most HGSOCs more closely resemble normal FTEthan OSE21. Nevertheless, up to 12% of HGSOCs show greatertranscriptional similarity to OSE21; similar results were postedrecently by others22. Proteomic analyses of ovarian cancer celllines and primary tumors also suggest two subtypes of HGSOC,one FTE-derived and the other OSE-derived, with the latterhaving a worse prognosis23. A detailed re-analysis of publictranscriptome data from multiple FTE, OSE, and HGSOC sam-ples reached the same conclusion24. Moreover, some genomicstudies have found that HGSOCs can metastasize to the FT andmimic STICs25,26, consistent with a non-FTE origin, whereasmetastases from other sites (e.g., uterine serous carcinoma) alsocan apparently mimic STICs26–29.
Conclusions based on bioinformatic analysis are, by definition,inferences, and experimental evaluation of the relative roles of FTEand OSE in HGSOC pathogenesis remains lacking. Existing mousemodels have failed to definitively resolve the cell-of-origin question.For example, injection of adenovirus expressing Cre recombinase(Ad-Cre) into the ovarian bursae of mice bearing conditional allelesof tumor suppressor genes and/or oncogenes, such as Myc;Tp53;Brca130, Pten;Pik3ca31, Tp53;Rb132, or TgK18GT121 (N-terminal121 amino acids of SV40 T antigen (T121) under the control of thekeratin 18 promoter) and flTp53, +flBrca133, result in HGSOC-liketumors. These studies assume that bursal injection specificallytargets the OSE, but others have argued that such adjacent tissueis also infected, including the FT or even the uterus34. Mice withPten deletion, Tp53 deletion or mutation, and Brca1/2 deletiondriven by the Pax8 promoter, which is expressed selectively in FTEsecretory cells (not in OSE), develop STIC-like lesions and even-tually, widely metastatic HGSOC35. Similar results were seenwith in mice expressing SV40 large T-antigen (TAg)36, or withsimultaneous mutation of Brca1, Tp53, Rb1, and Nf1, in Ovgp1-expressing secretory FTE37. These studies establish that FTE can bethe cell-of-origin for HGSOC, but whether the same (or other)oncogenic events can cause HGSOC to arise in OSE was notaddressed.
Different cells-of-origin could, along with distinct genomicabnormalities, contribute to inter-tumor heterogeneity and clin-ical behavior38–40. Here, we use lineage-specific Cre recombinase(Cre) lines and FTE-derived and OSE-derived organoids to askwhether introducing the same genetic defects into FTE or OSEcan cause HGSOC, and if so, how the cell-of-origin affects tumorbiology.
ResultsPerturbing Tp53 and the RB family in Pax8+ cells cause STICand metastasis. TgK18GT121 (hereafter, T121) mice harbor abacterial artificial chromosome (BAC) containing a loxP-GFP-stop-loxP (LSL) T121 cassette inserted into the mouse cytokeratin(CK) 18 gene. This construct ensures that T121 (the N-terminal121 amino acids of SV40 T antigen, which inactivates all RBfamily members) is only expressed upon exposure to Cre. Ad-Creinjection into the ovarian bursa of mice harboring TgK18GT121and Tp53 deletion or heterozygotic Tp53R172H expression causesHGSOC33. These findings were interpreted as showing that OSEgives rise to HGSOC, but the mouse FT (oviduct) is also housedwithin the bursa and could have been infected in these experi-ments. Indeed, Ad-Cre injection into mice bearing a Cre-inducible lacZ allele (Rosa26-lacZ) resulted in mosaic stainingfor the lacZ gene product β-galactosidase (β-gal) in FTE, inaddition to the expected strong β-gal staining in OSE. Moreover,Ad-Cre injection into the bursae of T121;Tp53R172H mice evokedexcess proliferation of both FTE and OSE, leaving the cell-of-origin in this model unclear (Supplementary Fig. 1).
To resolve this ambiguity, we generated T121;Tp53R172H micethat selectively express Cre in OSE or FTE. Pax8rtTA micereportedly enable doxycycline (Dox)-inducible gene expression insecretory cells of the FTE35. To confirm the lineage fidelity of thisline, we studied Pax8rtTA;TetOCre:Rosa26-tdTomato andPax8rtTA;TetOCre:Rosa26-LacZ reporter mice (Fig. 1a, Supple-mentary Fig. 2). Following 2 weeks of Dox administration(0.2 mg/ml in drinking water ad libitum), histologic analysis ofPax8rtTA;TetOCre:Rosa26-Lacz mice revealed strong β-gal reac-tivity in FTE, but no staining in the ovary, including the OSE(Fig. 1b). After Pax8rtTA;TetOcre;Rosa26-tdTomato mice wereexposed to Dox for 2 days (pulse), Tomato+ cells were found toco-localize with PAX8+ secretory FTE cells (SupplementaryFig. 2a, b). When similarly treated mice were switched to Dox-free water for 2 months (chase), both secretory (PAX8+) andciliated (acetylated α-tubulin+) cells were Tomato+ (Supple-mentary Fig. 2c, d). These data confirm that Pax8rtTA drivesexpression in FTE, but not OSE, and that PAX8+ FTE cells giverise to ciliated cells in vivo, consistent with a recent study41.
We next generated Pax8rtTA;TetOcre;T121 (PTT) mice, whichhave Dox-inducible expression of T121 alone, Pax8rtTA;TetOcre;Tp53R172H/fl (PTP) mice, which allow Dox-inducible generationof Tp53R172H hemizygosity, and Pax8rtTA;TetOcre;Tp53R172H/fl;T121 (PTPT) mice, which show Dox-dependent combined T121expression/Tp53R172H hemizygosity, all specifically in Pax8+ cells(Fig. 1c). A GFP reporter is embedded within the LSL cassette ofthe T121 transgene (Fig. 1c), allowing assessment of deletionefficiency. As expected, in control PTPT mice, GFP was detectedthroughout the FTE, which also showed little proliferation(Ki67 staining). After 2 weeks of Dox administration, Creactivation in Pax8+ cells had resulted in deletion of the LSLcassette, indicated by the appearance of GFP− cells. The newlygenerated GFP− (T121-expressing) cells, but not GFP+ (Pax8−)cells, were Ki67-positive, demonstrating that T121 evokes FTEproliferation (Fig. 1d). At 1 month after Dox administration wascompleted, FTE from all (10/10) treated PTPT mice showedmorphological features of STIC, including secretory cell
ARTICLE NATURE COMMUNICATIONS | https://doi.org/10.1038/s41467-019-13116-2
2 NATURE COMMUNICATIONS | (2019) 10:5367 | https://doi.org/10.1038/s41467-019-13116-2 | www.nature.com/naturecommunications
K18
Pax8
CAG
Tp53R172H
Tp53
EGFP T121
rtTA
TetO-Cre
TetO-Cre
STOP LacZ
rtTA
nsns
n =
10
n =
9
n =
9
OS
E m
etas
tasi
s ra
tio
Metastasis
No metastasis
ns100%
80%
60%
40%
20%
0%
100%
80%
60%
40%
20%
0%
Wild
type
PTP (Dox
)
n =
10
PTT (Dox
)
PTPT (Dox
)
n =
10
n =
10
n =
9
n =
10
STIC
Non-STIC
ST
IC o
ccur
ence
rat
io
Wild
type
PTP (Dox
)
PTT (Dox
)
PTPT (Dox
)
FT
O
FTO
U
‘PTPT mice’ PTPT
FTE
a b c d
e f
g
h i
jG
FP
Ki6
7D
AP
I
p53 Ki67 Stathmin1 PAX8
–Dox +Dox
p53 Ki67 Stathmin1 PAX8
–Dox +Dox
–Dox +Dox
X
X
X
X
X
STOP
Pax8
CAG
CAG
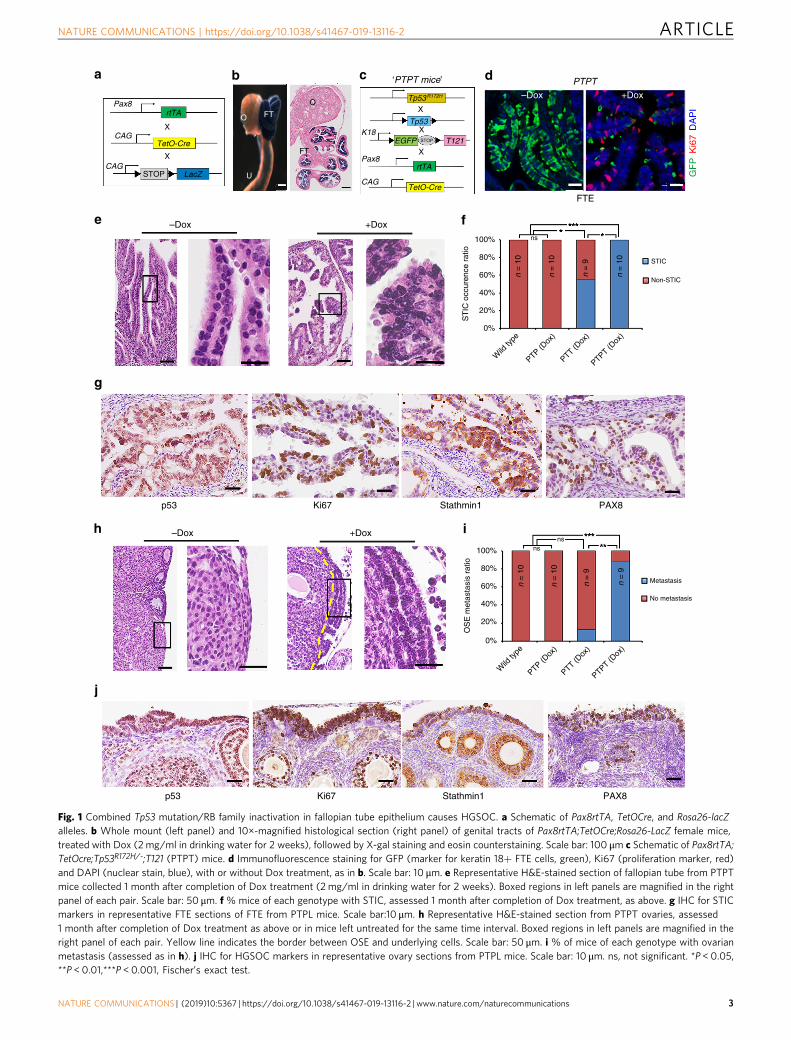
Fig. 1 Combined Tp53 mutation/RB family inactivation in fallopian tube epithelium causes HGSOC. a Schematic of Pax8rtTA, TetOCre, and Rosa26-lacZalleles. b Whole mount (left panel) and 10×-magnified histological section (right panel) of genital tracts of Pax8rtTA;TetOCre;Rosa26-LacZ female mice,treated with Dox (2 mg/ml in drinking water for 2 weeks), followed by X-gal staining and eosin counterstaining. Scale bar: 100 μm c Schematic of Pax8rtTA;TetOcre;Tp53R172H/-;T121 (PTPT) mice. d Immunofluorescence staining for GFP (marker for keratin 18+ FTE cells, green), Ki67 (proliferation marker, red)and DAPI (nuclear stain, blue), with or without Dox treatment, as in b. Scale bar: 10 μm. e Representative H&E-stained section of fallopian tube from PTPTmice collected 1 month after completion of Dox treatment (2 mg/ml in drinking water for 2 weeks). Boxed regions in left panels are magnified in the rightpanel of each pair. Scale bar: 50 μm. f % mice of each genotype with STIC, assessed 1 month after completion of Dox treatment, as above. g IHC for STICmarkers in representative FTE sections of FTE from PTPL mice. Scale bar:10 μm. h Representative H&E-stained section from PTPT ovaries, assessed1 month after completion of Dox treatment as above or in mice left untreated for the same time interval. Boxed regions in left panels are magnified in theright panel of each pair. Yellow line indicates the border between OSE and underlying cells. Scale bar: 50 μm. i % of mice of each genotype with ovarianmetastasis (assessed as in h). j IHC for HGSOC markers in representative ovary sections from PTPL mice. Scale bar: 10 μm. ns, not significant. *P < 0.05,**P < 0.01,***P < 0.001, Fischer’s exact test.
NATURE COMMUNICATIONS | https://doi.org/10.1038/s41467-019-13116-2 ARTICLE
NATURE COMMUNICATIONS | (2019) 10:5367 | https://doi.org/10.1038/s41467-019-13116-2 | www.nature.com/naturecommunications 3
proliferation, loss of polarity, cellular atypia, serous histology, andexpression of characteristic immunohistochemical markers(Fig. 1e–g), as well as metastasis to the ovarian surface (Fig. 1h;compare boxed regions). We did not detect STIC in PTP mice (0/10), although 5/9 PTT mice showed FTE transformation,suggesting that RB family inactivation alone can cause STIC.Nevertheless, combined Tp53 perturbation/T121 expressionsignificantly increased FTE transformation (from 55% to 100%)and metastasis (from 0% to 88%) to the ovary (Fig. 1i, j).Immunohistochemistry (IHC) showed HGSOC-related features,including TP53 accumulation, proliferation, and PAX8 expres-sion in primary lesions (Fig. 1g) and ovarian metastases in PTPTmice (Fig. 1j).
Unexpectedly, nearly all PTT and PTPT mice died within2 months (Supplementary Fig. 3a), but their demise was not dueto peritoneal masses/obstruction, as expected from lethalHGSOC. Instead, their thymi were massively enlarged, owing toincreased numbers of thymic epithelial cells (SupplementaryFig. 3b and c), which led to breathing difficulty and ultimately,respiratory arrest. Combined Rb/p130 deletion/p107 heterozyg-osity causes a similar phenotype42, and surprisingly, re-analysis ofPax8rTtA;TetOCre;Rosa26-tdTomato mice showed that TetOCreis active in thymic epithelial cells (although not in FTE) evenwithout Dox (Supplementary Fig. 3d). The unanticipatedleakiness of TetOCre in the thymic epithelium precluded us fromasking if Pax8-driven T121 expression/Tp53 perturbation leads towidespread metastasis, although the early ovarian studding andour organoid studies (see below) make this highly likely.
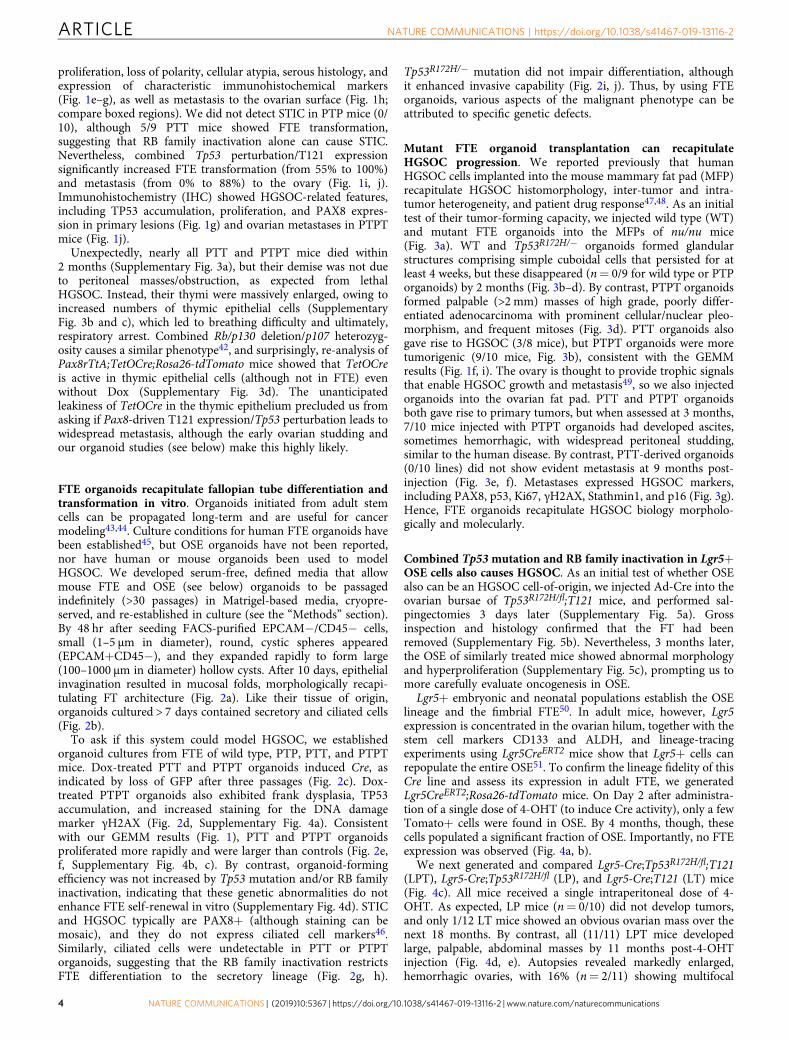
FTE organoids recapitulate fallopian tube differentiation andtransformation in vitro. Organoids initiated from adult stemcells can be propagated long-term and are useful for cancermodeling43,44. Culture conditions for human FTE organoids havebeen established45, but OSE organoids have not been reported,nor have human or mouse organoids been used to modelHGSOC. We developed serum-free, defined media that allowmouse FTE and OSE (see below) organoids to be passagedindefinitely (>30 passages) in Matrigel-based media, cryopre-served, and re-established in culture (see the “Methods” section).By 48 hr after seeding FACS-purified EPCAM−/CD45− cells,small (1–5 μm in diameter), round, cystic spheres appeared(EPCAM+CD45−), and they expanded rapidly to form large(100–1000 μm in diameter) hollow cysts. After 10 days, epithelialinvagination resulted in mucosal folds, morphologically recapi-tulating FT architecture (Fig. 2a). Like their tissue of origin,organoids cultured > 7 days contained secretory and ciliated cells(Fig. 2b).
To ask if this system could model HGSOC, we establishedorganoid cultures from FTE of wild type, PTP, PTT, and PTPTmice. Dox-treated PTT and PTPT organoids induced Cre, asindicated by loss of GFP after three passages (Fig. 2c). Dox-treated PTPT organoids also exhibited frank dysplasia, TP53accumulation, and increased staining for the DNA damagemarker γH2AX (Fig. 2d, Supplementary Fig. 4a). Consistentwith our GEMM results (Fig. 1), PTT and PTPT organoidsproliferated more rapidly and were larger than controls (Fig. 2e,f, Supplementary Fig. 4b, c). By contrast, organoid-formingefficiency was not increased by Tp53 mutation and/or RB familyinactivation, indicating that these genetic abnormalities do notenhance FTE self-renewal in vitro (Supplementary Fig. 4d). STICand HGSOC typically are PAX8+ (although staining can bemosaic), and they do not express ciliated cell markers46.Similarly, ciliated cells were undetectable in PTT or PTPTorganoids, suggesting that the RB family inactivation restrictsFTE differentiation to the secretory lineage (Fig. 2g, h).
Tp53R172H/− mutation did not impair differentiation, althoughit enhanced invasive capability (Fig. 2i, j). Thus, by using FTEorganoids, various aspects of the malignant phenotype can beattributed to specific genetic defects.
Mutant FTE organoid transplantation can recapitulateHGSOC progression. We reported previously that humanHGSOC cells implanted into the mouse mammary fat pad (MFP)recapitulate HGSOC histomorphology, inter-tumor and intra-tumor heterogeneity, and patient drug response47,48. As an initialtest of their tumor-forming capacity, we injected wild type (WT)and mutant FTE organoids into the MFPs of nu/nu mice(Fig. 3a). WT and Tp53R172H/− organoids formed glandularstructures comprising simple cuboidal cells that persisted for atleast 4 weeks, but these disappeared (n= 0/9 for wild type or PTPorganoids) by 2 months (Fig. 3b–d). By contrast, PTPT organoidsformed palpable (>2 mm) masses of high grade, poorly differ-entiated adenocarcinoma with prominent cellular/nuclear pleo-morphism, and frequent mitoses (Fig. 3d). PTT organoids alsogave rise to HGSOC (3/8 mice), but PTPT organoids were moretumorigenic (9/10 mice, Fig. 3b), consistent with the GEMMresults (Fig. 1f, i). The ovary is thought to provide trophic signalsthat enable HGSOC growth and metastasis49, so we also injectedorganoids into the ovarian fat pad. PTT and PTPT organoidsboth gave rise to primary tumors, but when assessed at 3 months,7/10 mice injected with PTPT organoids had developed ascites,sometimes hemorrhagic, with widespread peritoneal studding,similar to the human disease. By contrast, PTT-derived organoids(0/10 lines) did not show evident metastasis at 9 months post-injection (Fig. 3e, f). Metastases expressed HGSOC markers,including PAX8, p53, Ki67, γH2AX, Stathmin1, and p16 (Fig. 3g).Hence, FTE organoids recapitulate HGSOC biology morpholo-gically and molecularly.
Combined Tp53mutation and RB family inactivation in Lgr5+OSE cells also causes HGSOC. As an initial test of whether OSEalso can be an HGSOC cell-of-origin, we injected Ad-Cre into theovarian bursae of Tp53R172H/fl;T121 mice, and performed sal-pingectomies 3 days later (Supplementary Fig. 5a). Grossinspection and histology confirmed that the FT had beenremoved (Supplementary Fig. 5b). Nevertheless, 3 months later,the OSE of similarly treated mice showed abnormal morphologyand hyperproliferation (Supplementary Fig. 5c), prompting us tomore carefully evaluate oncogenesis in OSE.
Lgr5+ embryonic and neonatal populations establish the OSElineage and the fimbrial FTE50. In adult mice, however, Lgr5expression is concentrated in the ovarian hilum, together with thestem cell markers CD133 and ALDH, and lineage-tracingexperiments using Lgr5CreERT2 mice show that Lgr5+ cells canrepopulate the entire OSE51. To confirm the lineage fidelity of thisCre line and assess its expression in adult FTE, we generatedLgr5CreERT2;Rosa26-tdTomato mice. On Day 2 after administra-tion of a single dose of 4-OHT (to induce Cre activity), only a fewTomato+ cells were found in OSE. By 4 months, though, thesecells populated a significant fraction of OSE. Importantly, no FTEexpression was observed (Fig. 4a, b).
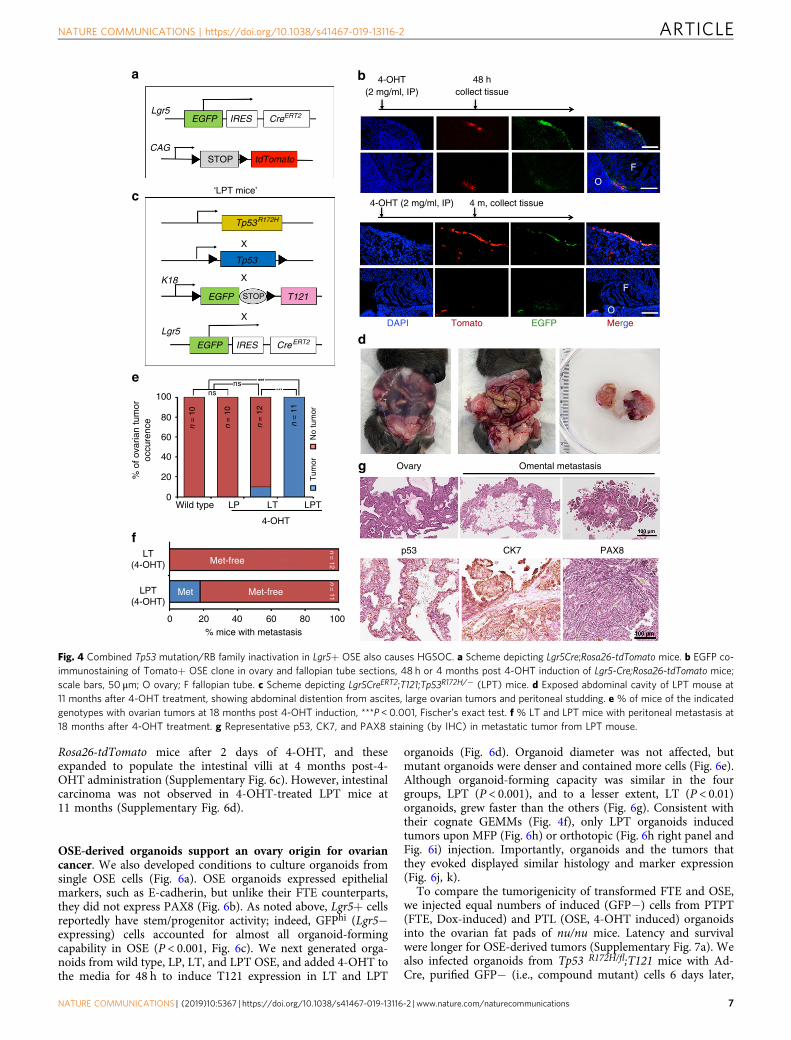
We next generated and compared Lgr5-Cre;Tp53R172H/fl;T121(LPT), Lgr5-Cre;Tp53R172H/fl (LP), and Lgr5-Cre;T121 (LT) mice(Fig. 4c). All mice received a single intraperitoneal dose of 4-OHT. As expected, LP mice (n= 0/10) did not develop tumors,and only 1/12 LT mice showed an obvious ovarian mass over thenext 18 months. By contrast, all (11/11) LPT mice developedlarge, palpable, abdominal masses by 11 months post-4-OHTinjection (Fig. 4d, e). Autopsies revealed markedly enlarged,hemorrhagic ovaries, with 16% (n= 2/11) showing multifocal
ARTICLE NATURE COMMUNICATIONS | https://doi.org/10.1038/s41467-019-13116-2
4 NATURE COMMUNICATIONS | (2019) 10:5367 | https://doi.org/10.1038/s41467-019-13116-2 | www.nature.com/naturecommunications
peritoneal carcinomatosis and ascites (Fig. 4d, f). Histologyand IHC revealed poorly differentiated adenocarcinomawith papillary and micropapillary/filigree morphology (Fig. 4g),resembling human HGSOC. Notably, these tumors showed littlePAX8 staining.
As an additional test of whether Lgr5+ OSE cells directly evokeHGSOC transformation, we generated compound LPT;Rosa26-tdTomato mice (Fig. 5a), administered one dose of 4-OHT, andanalyzed mice at 3, 6, or 9 months (Fig. 5b). At 3 months afterCre activation, neoplasia had developed from Lgr5+ cells (Fig. 5c).
These lesions expanded, and at 6 months, >50% of the ovariansurface was covered by malignant Tomato+ cells; at 9 months,the surface was almost entirely overrun (Fig. 5c–f). Histologyagain showed multi-villus neoplasia (Fig. 5d, g), and IHC revealedhighly proliferative tumors expressing HGSOC markers, includ-ing Wilms’ tumor 1 (WT1) and Stathmin1 (Fig. 5g). Neitherhyperproliferation nor neoplasia was evident in the FT of LT mice(Supplementary Fig. 6a), and the OSE-derived, LPT tumors alsowere PAX8-negative (Supplementary Fig. 6b). As expected52, wealso saw Tomato+ clones in the intestines of Lgr5CreERT2;
D1 D2 D3
D10 D12
a
–Dox
Wild type PTP (Dox) PTT (Dox) PTPT (Dox)
30
Edu
+ c
ell n
umbe
r (%
)In
vasi
ve c
elle
per
fiel
dC
illia
ted
cell
ratio
/org
anoi
d (%
)
20
10
0
40 ns
30
20
10
0
400
300
200
100
0
Wild
type
PTP (Dox
)
PTT (Dox
)
PTPT (Dox
)
Wild
type
PTP (Dox
)
PTT (Dox
)
PTPT (Dox
)
Wild
type
PTP (Dox
)
PTT (Dox
)
PTPT (Dox
)
Wild type PTP (Dox) PTT (Dox) PTPT (Dox)
Wild type PTP (Dox) PTT (Dox) PTPT (Dox)
–Dox
+Dox
+Dox
H&
Ep5
3
Ace
tyl α
-Tub
PAX
8
Ace
tyl α
-Tub
PAX
8
DA
PI
Edu
DA
PI
γ-H
2AX
PTPT
D4 D6 c d
b
e f
g h
i j
NATURE COMMUNICATIONS | https://doi.org/10.1038/s41467-019-13116-2 ARTICLE
NATURE COMMUNICATIONS | (2019) 10:5367 | https://doi.org/10.1038/s41467-019-13116-2 | www.nature.com/naturecommunications 5

Fig. 2 Establishment and characterization of FTE organoids a Bright field images of organoid developing from a single FTE cell after the indicated days ofculture. Scale bar, 20 μm. b Immunofluorescence staining for ciliated cell marker acetyl-α-tubulin (green) and secretory cell marker PAX8 (red) in FTEorganoid after 7 days in culture. Scale bar, 2 μm. c Top: Schematic showing generation of FTE organoids from PTPT mice. Bottom: GFP in organoids with orwithout Dox treatment; Dox (500 ng/ml) was added after seeding, and GFP− cells were removed by FACS 4 days after Dox addition. The organoid in theright panel was photographed before Dox addition; the organoids in the left panel were photographed after Dox (see the “Methods” section for details).Scale bar, 10 μm. d Sections of PTPT organoids after two consecutive passages, with or without Dox treatment (500 ng/ml), stained with H&E or subjectedto immunofluorescence or IHC staining for the indicated markers. Scale bar, 20 μm. e Organoids established from the indicated mice, incubated with EdU(2 μM) and DAPI (1 μg/ml) for 2 h on day 7 of culture and visualized by immunofluorescence; scale bar, 20 μm. f % EdU-positive cells in organoidsestablished from the indicated mice. g Representative immunofluorescence images of PAX8 (red) and acetylated-α-tubulin (green) in the indicatedorganoids at day 7 of culture; scale bar, 20 μm. h % ciliated cells (aceylated-α-tubulin+) in organoids established from the indicated mice. i Representativeimages of the bottom surface of Transwell units seeded with the indicated organoids. j Quantification of invasive cells in i. Data represent mean ± SEM fromthree mice of each genetic background. *P < 0.05, **P < 0.01,***P < 0.001, Tukey’s multiple comparison test. Source data are provided as a Source Data file.
Expand mutantorganoids
Dissociate
Mix with matrigel
MFP injection
100
a5
4
3
Tum
or v
olum
e (c
m3 )
2
1
00 2
Wild type
Wild type
Orthotopic injection
100n = 10
Met-free
Met-free
Met
n = 10
40
60
80
% m
ice
with
met
asta
sis
20
0
PTP (Dox)
PTP (Dox)
Pax8 p53
Stathmin1γ-H2AX p16
Ki67
nsns
n =
9
n =
9
n =
9
n =
8 PTT (Dox)
PTT (Dox)
Tum
orN
odul
e
PTPT (Dox)
PTPT (Dox)
PTT (Dox) PTPT (Dox)
4
Months
6
80%
of t
umor
form
atio
n
60
40
20
0
Wild
type
PTP (Dox
)
PTT (Dox
)
PTPT (Dox
)
b c
d
e
f
g
Fig. 3 Transplanted organoids recapitulate HGSOC progression and metastasis. a Scheme depicting mammary fat pad (MFP) transplantation. b % oftumors formed in MFPs within 6 months after injection of 105 cells from wild type, PTP, PTT, and PTPT organoids (all Dox-treated); ns, not significant, *P <0.05, ***P < 0.001, Fischer’s exact test. c Graph showing the average tumor volume in MFPs injected with organoids of the genotypes indicated in b. Datarepresent mean ± SE, *P < 0.05, **P < 0.01, two-way ANOVA; Source data are provided as a Source Data file. d H&E-stained sections of MFPs from miceinjected with 105 cells from the indicated organoids, 3 months after injection; inserts show gross appearance of nodules/tumors. Scale bar, 50 μm. e Leftpanel: exposed abdomen of mouse 3 months after orthotopic injection with 105 PTPT organoid cells, showing ovarian masses (circles) and widespreadperitoneal metastasis (arrows). Right panel: genital duct dissected from the left panel shows large tumors on ovary. f % of mice injected with Dox-treatedPTT (0%, n= 10) and PTPT (30%, n= 10) organoids that develop peritoneal metastasis, assessed at 6 months following injection of 105 organoid cells;**P < 0.01, Fischer’s exact test. g H&E-stained sections and IHC for the indicated HGSOC markers in omental metastases; scale bar, 50 μm.
ARTICLE NATURE COMMUNICATIONS | https://doi.org/10.1038/s41467-019-13116-2
6 NATURE COMMUNICATIONS | (2019) 10:5367 | https://doi.org/10.1038/s41467-019-13116-2 | www.nature.com/naturecommunications
Rosa26-tdTomato mice after 2 days of 4-OHT, and theseexpanded to populate the intestinal villi at 4 months post-4-OHT administration (Supplementary Fig. 6c). However, intestinalcarcinoma was not observed in 4-OHT-treated LPT mice at11 months (Supplementary Fig. 6d).
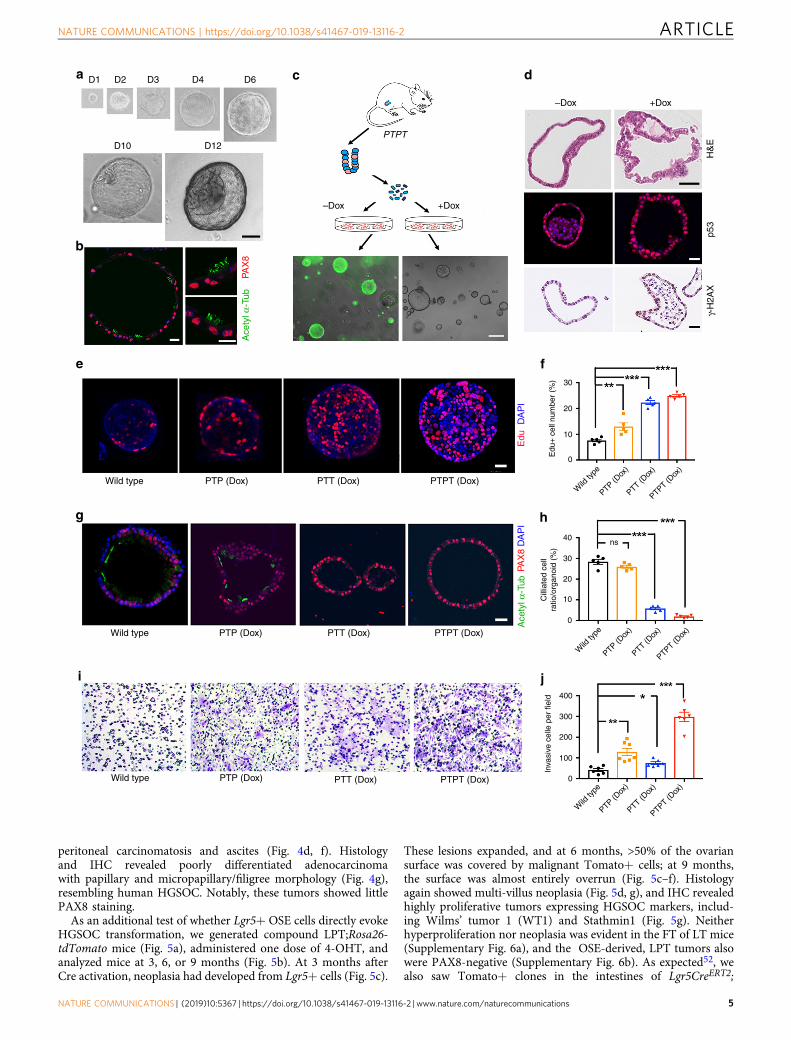
OSE-derived organoids support an ovary origin for ovariancancer. We also developed conditions to culture organoids fromsingle OSE cells (Fig. 6a). OSE organoids expressed epithelialmarkers, such as E-cadherin, but unlike their FTE counterparts,they did not express PAX8 (Fig. 6b). As noted above, Lgr5+ cellsreportedly have stem/progenitor activity; indeed, GFPhi (Lgr5−expressing) cells accounted for almost all organoid-formingcapability in OSE (P < 0.001, Fig. 6c). We next generated orga-noids from wild type, LP, LT, and LPT OSE, and added 4-OHT tothe media for 48 h to induce T121 expression in LT and LPT
organoids (Fig. 6d). Organoid diameter was not affected, butmutant organoids were denser and contained more cells (Fig. 6e).Although organoid-forming capacity was similar in the fourgroups, LPT (P < 0.001), and to a lesser extent, LT (P < 0.01)organoids, grew faster than the others (Fig. 6g). Consistent withtheir cognate GEMMs (Fig. 4f), only LPT organoids inducedtumors upon MFP (Fig. 6h) or orthotopic (Fig. 6h right panel andFig. 6i) injection. Importantly, organoids and the tumors thatthey evoked displayed similar histology and marker expression(Fig. 6j, k).
To compare the tumorigenicity of transformed FTE and OSE,we injected equal numbers of induced (GFP−) cells from PTPT(FTE, Dox-induced) and PTL (OSE, 4-OHT induced) organoidsinto the ovarian fat pads of nu/nu mice. Latency and survivalwere longer for OSE-derived tumors (Supplementary Fig. 7a). Wealso infected organoids from Tp53 R172H/fl;T121 mice with Ad-Cre, purified GFP− (i.e., compound mutant) cells 6 days later,
Wild type LP LT LPT
4-OHT
100
80
60
40
20
0
Tum
or
No
tum
or
nsns
n =
10
n =
10
n =
12
n =
11
% o
f ova
rian
tum
oroc
cure
nce
4-OHT (2 mg/ml, IP) 4 m, collect tissue
4-OHT(2 mg/ml, IP)
48 hcollect tissue
p53
0 20 40 60% mice with metastasis
80
X
X
X
100
CK7 PAX8
Ovary Omental metastasis
F
O
F
a b
c
d
g
e
f
O
LT(4-OHT)
LPT(4-OHT)
Met-free
Met Met-free
n = 11
n = 12
‘LPT mice’
EGFP IRES CreERT2
STOP tdTomato
Tp53R172H
Tp53
EGFP STOP T121
EGFP IRES CreERT2
Lgr5
CAG
K18
Lgr5DAPI Tomato EGFP Merge
Fig. 4 Combined Tp53 mutation/RB family inactivation in Lgr5+ OSE also causes HGSOC. a Scheme depicting Lgr5Cre;Rosa26-tdTomato mice. b EGFP co-immunostaining of Tomato+ OSE clone in ovary and fallopian tube sections, 48 h or 4 months post 4-OHT induction of Lgr5-Cre;Rosa26-tdTomato mice;scale bars, 50 μm; O ovary; F fallopian tube. c Scheme depicting Lgr5CreERT2;T121;Tp53R172H/− (LPT) mice. d Exposed abdominal cavity of LPT mouse at11 months after 4-OHT treatment, showing abdominal distention from ascites, large ovarian tumors and peritoneal studding. e % of mice of the indicatedgenotypes with ovarian tumors at 18 months post 4-OHT induction, ***P < 0.001, Fischer’s exact test. f % LT and LPT mice with peritoneal metastasis at18 months after 4-OHT treatment. g Representative p53, CK7, and PAX8 staining (by IHC) in metastatic tumor from LPT mouse.
NATURE COMMUNICATIONS | https://doi.org/10.1038/s41467-019-13116-2 ARTICLE
NATURE COMMUNICATIONS | (2019) 10:5367 | https://doi.org/10.1038/s41467-019-13116-2 | www.nature.com/naturecommunications 7

and injected 105 each into MFPs (Supplementary Fig. 7b). Again,OSE-derived tumors had a slower growth rate and longer latency(P < 0.05 at 4 months, P < 0.001 at 5 months, two-way ANOVA,Supplementary Fig. 7c) than their FTE counterparts.
Similarities and differences between transcriptomes and gen-omes of FTE-derived and OSE-derived HGSOC. We used RNAsequencing (RNAseq) to explore the molecular basis for the dis-tinct behavior of FTE-derived and OSE-derived HGSOC. Five
independent tumors from FTE-derived PTPT organoids (T-FT)were compared to three tumors from OSE-derived organoids (T-O), all at 6 months post-injection. Pooled normal OSE (N-O) andFTE (N-FT) samples (three each) served as controls. FTE (tumorand normal) and OSE (tumor and normal) samples segregated byunsupervised clustering (Fig. 7a). Of the 8623 differentiallyexpressed genes (DEGs) in FTE- versus OSE-derived tumors(Padj < 0.05), 3641(42%) were differentially expressed in cognatenormal tissue (intersection between N-O vs. N-FT, purple ovals,
a c
d
b e f
g
4000
3000
2000
1000
0
Hyp
erpl
astic
clon
e si
ze (
μm)
150
100
50
0Rel
ativ
e td
Tom
ato+
clon
e ar
ea (
%)
3m 6m 9m 3m 6m 9m
9m 3m 6m 9m
Ki6
7S
tath
min
1W
T1
3m 6m 9m
3m 6m 9m
tdTomato/DAPI tdTomato/DAPI tdTomato/DAPI
Without 4-OHT with 4-OHT
4-OHT
Time post-induction Time post-inuction
0 3 6 9 Months3 month chase
6 month chase
9 month chase
Tp53R172H
Tp53
Harvest Harvest Harvest
EGFP STOP
X
X
X
X
T121
EGFP IRES CreERT2
STOP tdTomato
K18
Lgr5
Rosa 26
Fig. 5 Lgr5+ cells can initiate tumors with markers of HGSOC. a Schematic depicting crosses of Tp53R172H/−;T121;Lgr5Cre; and Rosa26-tdTomato mice.b Lineage tracing scheme for Lgr5Cre;Rosa26-Tdtomato mice. c Whole mounts of ovaries from LPT;Rosa26-Tdtomato mice induced with 4-OHT at 6 weeks(pulse), followed by sacrifice and analysis at the indicated times (chase), showing Tomato (red), and DAPI (blue) fluorescence; region within the white boxin left top panel is magnified below. Note expansion of isolated Tomato+ cells into Tomato+ clones. Scale bar, 50 μm. d Corresponding H&E-stainedsections from ovaries in c; e Relative areas of Tomato+ OSE clones at the indicated times after 4-OHT induction (chase times); clone size was determinedby measuring the longest length of a discrete Tomato+ clone. Each circle represents a distinct Tomato+ clone, with n= 3 ovaries analyzed/time point, anda total of 180 clones counted (full data are provided as a Source Data file). f Quantification of hyperplastic clone size on the ovarian surface, determined bymeasuring the longest ‘length’ of epithelial protrusions (tumor cells) from the border with stromal cells. For each time point, 20 cross-sections from threeovaries were counted. Data represent mean ± SEM; *P < 0.05, **P < 0.01, and ***P < 0.001, Tukey’s multiple comparison test; Source data are provided as aSource Data file. g Representative IHC (Ki67 and Stathmin-1) and immunofluorescence (WT-1) staining for HGSOC markers in OSE from LPT mice at theindicated times after 4-OHT induction or without treatment; scale bars: 100 μm.
ARTICLE NATURE COMMUNICATIONS | https://doi.org/10.1038/s41467-019-13116-2
8 NATURE COMMUNICATIONS | (2019) 10:5367 | https://doi.org/10.1038/s41467-019-13116-2 | www.nature.com/naturecommunications
GF
Pne
g
GFPneg GFPhi
GF
Phi
a c
b
d e
f g
h j
i k
% o
f tum
or fo
rmat
ion
H&E P53 WT1 Ki67
Cel
l num
bers
Cel
l num
bers
Passages (7 days/passage) Passages (7 days/passage)
Serially passaged (P0-P3) Serially passaged (P3-P6)
Wild type
LP (4-OHT)
LT (4-OHT)
LPT (4-OHT)
Wild type
LP (4-OHT)
LT (4-OHT)
LPT (4-OHT)
ns
FS
C
GFP
4
3
2
1
0Org
anoi
d fo
rmin
g ef
ficie
ncy
(%)
p53
T121
ERK2
Wt –4-OHT +4-OHT
Day 1 Day 2
O FT
FT
GFPneg
GFPhi
Day 6Day 8
Day 10Day 12
Wild type LP (4-OHT) LT (4-OHT) LPT (4-OHT)
H&E E-Cad Ki67 DAPI PAX8 DAPI
LPT
Rel
ativ
e or
gano
id-
form
ing
effic
ienc
y
Wild
type
Wild
type
LP (4
-OHT)
LP (4
-OHT)
LT (4
-OHT)
LT (4
-OHT)
LPT (4
-OHT)
LPT (4
-OHT)
250 K
200 K
150 K
100 K
50 K
0
–103 103 104 1050
1.5
1.0
0.5
0.0
100
80
60
40
Tum
or-f
ree
Tum
or-f
ree
Tum
or-f
ree
Tum
or
20
0
10(×105) (×105)
7.5
5
2.5
0
10
7.5
5
2.5
0P0 P1 P2 P3 P3 P4 P5 P6
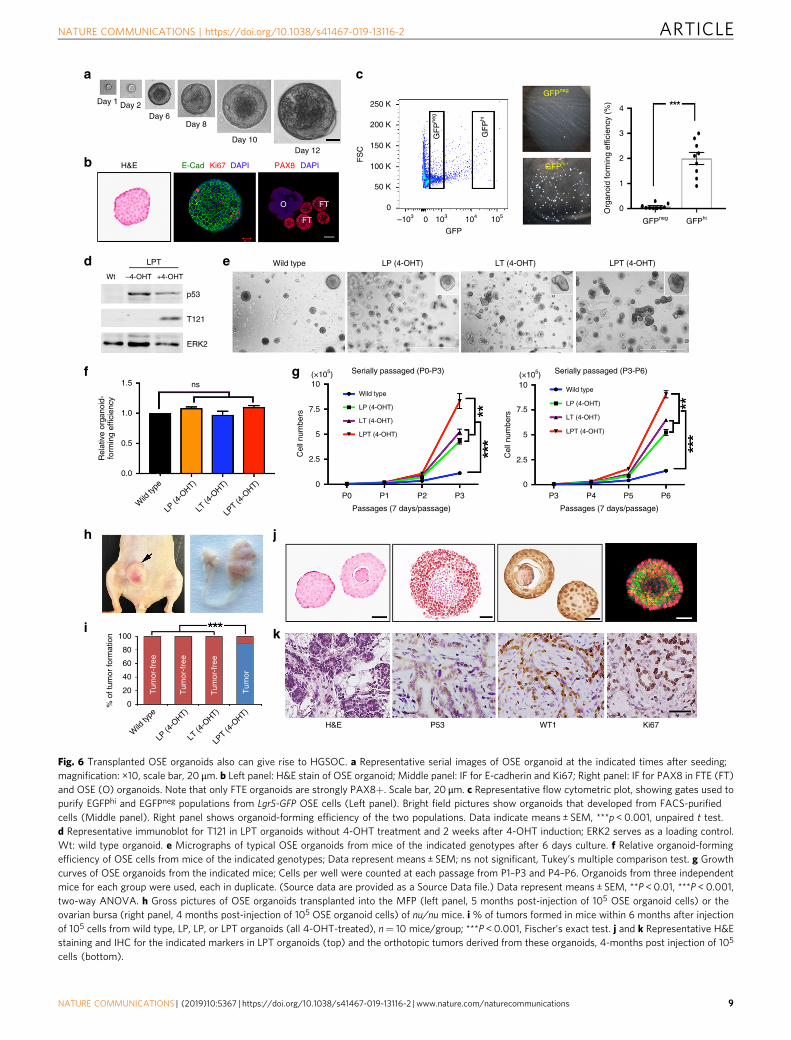
Fig. 6 Transplanted OSE organoids also can give rise to HGSOC. a Representative serial images of OSE organoid at the indicated times after seeding;magnification: ×10, scale bar, 20 μm. b Left panel: H&E stain of OSE organoid; Middle panel: IF for E-cadherin and Ki67; Right panel: IF for PAX8 in FTE (FT)and OSE (O) organoids. Note that only FTE organoids are strongly PAX8+. Scale bar, 20 μm. c Representative flow cytometric plot, showing gates used topurify EGFPhi and EGFPneg populations from Lgr5-GFP OSE cells (Left panel). Bright field pictures show organoids that developed from FACS-purifiedcells (Middle panel). Right panel shows organoid-forming efficiency of the two populations. Data indicate means ± SEM, ***p < 0.001, unpaired t test.d Representative immunoblot for T121 in LPT organoids without 4-OHT treatment and 2 weeks after 4-OHT induction; ERK2 serves as a loading control.Wt: wild type organoid. e Micrographs of typical OSE organoids from mice of the indicated genotypes after 6 days culture. f Relative organoid-formingefficiency of OSE cells from mice of the indicated genotypes; Data represent means ± SEM; ns not significant, Tukey’s multiple comparison test. g Growthcurves of OSE organoids from the indicated mice; Cells per well were counted at each passage from P1–P3 and P4–P6. Organoids from three independentmice for each group were used, each in duplicate. (Source data are provided as a Source Data file.) Data represent means ± SEM, **P < 0.01, ***P < 0.001,two-way ANOVA. h Gross pictures of OSE organoids transplanted into the MFP (left panel, 5 months post-injection of 105 OSE organoid cells) or theovarian bursa (right panel, 4 months post-injection of 105 OSE organoid cells) of nu/nu mice. i % of tumors formed in mice within 6 months after injectionof 105 cells from wild type, LP, LP, or LPT organoids (all 4-OHT-treated), n= 10 mice/group; ***P < 0.001, Fischer’s exact test. j and k Representative H&Estaining and IHC for the indicated markers in LPT organoids (top) and the orthotopic tumors derived from these organoids, 4-months post injection of 105
cells (bottom).
NATURE COMMUNICATIONS | https://doi.org/10.1038/s41467-019-13116-2 ARTICLE
NATURE COMMUNICATIONS | (2019) 10:5367 | https://doi.org/10.1038/s41467-019-13116-2 | www.nature.com/naturecommunications 9
and T-O vs. T-FT, orange ovals, in Fig. 7b; also see SupplementaryFig. 8a). These included ~15% of the top 500 and 1000 DEGs,respectively (Supplementary Fig. 8b). Known FT-specific genes53,including Pax8 (log2FC=−3.97, Padj= 7.68 × 10⁻⁷; log2FC=
−6.85, Padj < 10−15), Ltf (log2FC=−5.43; Padj= 3.24 × 10⁻⁶;log2FC=−8.72, Padj < 10−15), Slc34a2 (log2FC=−4.4, Padj=1.8 × 10⁻⁴; log2FC=−4.84, Padj= 2.7 × 10⁻⁶), were highlyexpressed in N-FT and T-FT, compared with N-O and T-O. By
1.0
0.5
0.0
–0.5
–1.0
IPL420–2–4
Diff
End
othe
lial_
cell_
mig
ratio
n_(a
bstr
act)
Pho
spho
ryla
ted_
Mcm
2-7_
com
plex
_(co
mpl
ex)
Fra
2/JU
NB
_(co
mpl
ex)
Ost
eocl
ast_
diffe
rent
iatio
n_(a
bstr
act)
TIM
P1
ND
RG
1
Arg
inas
e_1_
hom
otrim
er_(
com
plex
)
AR
G1
CC
BP
2/C
CB
P2_
ligan
ds_(
com
plex
)
CC
BP
2_lig
ands
_(fa
mily
)
TG
FB
1/T
GF
BR
2/E
ndog
lin_(
dim
er)_
(com
plex
)
Dim
eric
_TG
F-b
eta1
/type
_II_
rece
ptor
_com
plex
_(co
mpl
ex)
uPA
_(co
mpl
ex)
Uro
kina
se_p
lasm
inog
en_a
ctiv
ator
_(tw
o-ch
ain)
_(co
mpl
ex)
Ade
nosi
ne_d
eoxy
aden
osin
e_gu
anos
ine_
inos
ine_
(fam
ily)
Cyt
idin
e_th
ymid
ine_
urid
ine_
(fam
ily)
TP
_alp
ha/T
GM
2/G
DP
/G_b
eta/
gam
a_(c
ompl
ex)
IL5_
hom
odim
er/IL
5RA
_(co
mpl
ex)
IL5/
IL5R
A_(
com
plex
)
IL_h
omod
imer
_(co
mpl
ex)
IL5
PLA
U
Liga
nd_(
fam
ily)
P55
269
Syn
deca
n-4/
TS
P1_
(com
plex
)
uPA
R-D
III/fM
LP_r
ecep
tors
_(co
mpl
ex)
uPA
R_(
dim
er)_
(com
plex
)
PLA
UR
LIF
LMN
A
EP
HA
2
Tum
or_c
ell_
inva
sion
_(ab
stra
ct)
C13
orf1
5
JUN
/FO
S_(
com
plex
)
Fra
1/JU
N_(
com
plex
)
DC
N
Col
lage
n_I_
(fam
ily)
Typ
e_I_
Col
lage
n_(c
ompl
ex)
Pro
colla
gen_
type
_I_(
com
plex
)
Fib
robl
ast_
(abs
trac
t)
MM
P-1
_and
_MM
P2_
(fam
ily)
MM
P2
Syn
deca
n-2/
MM
P2_
(com
plex
)
5prim
e-nu
cleo
tidas
e_ec
to_(
CD
73)_
holo
enzy
me_
(com
plex
)
VD
R
VD
R/V
DR
/DN
A_(
com
plex
)
IL4R
p53_
(tet
ram
er)_
(com
plex
)
FT:O1
0.5
–0.5
–1
NT
5E
GF
PT
2
Mes
ench
ymal
Diff
eren
tiate
d
Imm
unor
eact
ive
Pro
lifer
ativ
e
FT/O enrichmentBased on mouse Top 50 T-specific genes
FT
:O r
elat
ive
enric
hmen
t
Molecular subtype
FT:OPARADIGM integrated pathway levels
GeneRatio
0.1
0.2
0.3
p.adjust
p.adust
0.01
0.02
0.03
0.04
Gene ratio
0.1
0.2
0.3
0.4
0.5
0.01
0.02
0.03
0.04
Cell cycle
DNA replication
Oocyte meiosis
Homologous recombination
p53 signaling pathway
MicroRNAs in cancer
Cellular senescence
Fanconi anemia pathway
Ribosome
Mismatch repair
T-FT > N-FT T-FT and T-OT-O > N-OT-FT > N-FT T-FT and T-OT-O > N-O
Platinum drug resistance
HALLMARK_G2M_CHECKPOINT
HALLMARK-E2F-TARGETS
HALLMARK-MITOTIC-SPINDLE
HALLMARK-SPERMATOGENESIS
400
300
200
100
0
T-O
3
T-O
1
T-O
2
N-O
2
N-O
1
N-O
3
T-F
T2
T-F
T1
T-F
T3
T-F
T5
T-F
T4
N-F
T3
N-F
T1
N-F
T2
N-FT2
a
N-FT1
N-FT3
T-FT4
T-FT5
T-FT3
T-FT1
T-FT2
N-O3
N-O1
N-O2
N-O2
T-O1
T-O3
Enriched pathways: KEGG Enriched pathways: GSEA hallmark gene sets
b
c d
e f
ARTICLE NATURE COMMUNICATIONS | https://doi.org/10.1038/s41467-019-13116-2
10 NATURE COMMUNICATIONS | (2019) 10:5367 | https://doi.org/10.1038/s41467-019-13116-2 | www.nature.com/naturecommunications
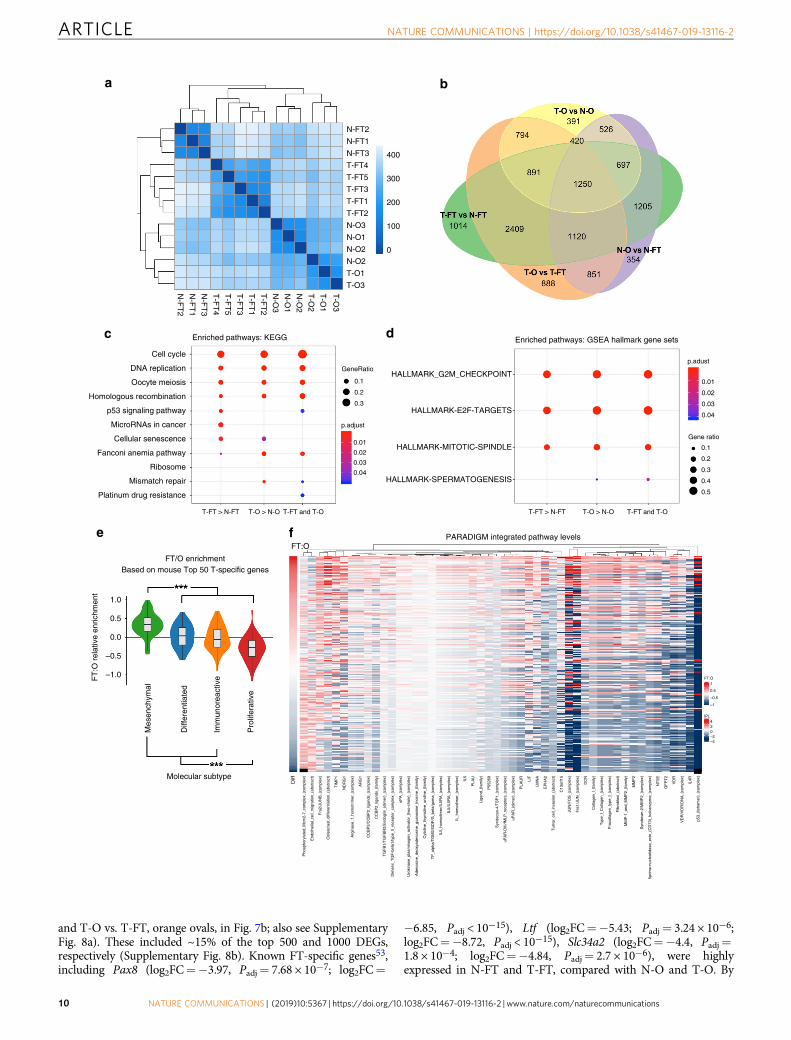
contrast, the known OSE-specific gene Lgr5 (log2FC= 5.44, Padj <10−15; log2FC= 4.41, Padj= 3 × 10⁻¹⁵) had significantly higherexpression in N-O and T-O than N-FT and T-FT, as did Nr5a1(encoding a transcriptional activator involved in sex determina-tion/differentiation of steroidogenic tissues, log2FC= 6.52, Padj <1 × 10⁻¹⁵; log2FC= 9.62, Padj < 1 × 10⁻¹⁵), Gata4 (encoding a zincfinger transcription factor, log2FC= 5.9, Padj= 1.79 × 10⁻⁶;log2FC= 6.4, Padj= 5.42 × 10⁻⁹), Lhx9 (encoding a GATA4 target,log2FC= 7.08, Padj < 1 × 10⁻¹⁵; log2FC= 10.01, Padj < 1 × 10⁻¹⁵),and Unc45b (encoding a GATA4 chaperone, log2FC= 6.23, Padj=9 × 10⁻¹¹; log2FC= 5.72, Padj= 2.92 × 10⁻¹¹). Hence, the cell-of-origin makes a significant contribution to the tumor transcriptome.
FTE-derived and OSE-derived tumors also shared multipleDEGs, compared with their respective cells-of-origin. OSE-derived tumors had nearly 6000 DEGs, compared with normalOSE, whereas >9600 DEGs were observed in T-FT vs. N-FT (all atPadj < 0.05) (entire green oval, including overlaps with otherovals). T-FT and T-O shared 3258 of these DEGs (Fig. 7b,Supplementary Fig. 8a, overlap between yellow and green ovals).By KEGG analysis, tumors were enriched for genes involved inthe cell cycle, DNA replication, and DNA repair. Notably, p53-signaling pathway was enhanced in FTE-derived tumors, whereasseveral DNA repair pathways were more enriched in OSE-derivedtumors (Fig. 7c). Likewise, the most enriched GO categoriesinvolved cell/nuclear division, cell cycle, and DNA replication andrepair (Supplementary Fig. 9a). GSEA revealed a predominanceof G2/M checkpoint control and E2F target genes in all tumorsamples (Fig. 7d, Supplementary Fig. 9b); the latter comports withdysregulation of RB family/E2F regulation.
To assess the relevance of these findings to human HGSOC, weidentified protein-coding genes with human orthologs (17,465genes) in each group (T-FT, T-O, N-FT, N-O), and useddifferentially expressed genes (in each group, compared with allother groups) to generate group-specific signatures (see the“Methods” section and Source Data in Source Data File).Comparison of the mean scaled expression of the top (mostdifferentially expressed) 50, 100, 250, or 500 T-FT-specific, andT-O-specific genes, respectively, with the other four groupsconfirmed the expected segregation of samples (SupplementaryFig. 10a–d). We developed a cell-of-origin score (see the“Methods” section), and applied it to TCGA ovarian cancer data.Whether the score was based on the top 50, 100, 250, or 500DEGs, human tumors classified as mesenchymal were moresimilar transcriptionally to mouse FTE-derived tumors than tomouse OSE-derived tumors. By contrast, proliferative-typehuman tumors more closely resembled mouse OSE-derivedtumors (Fig. 7e, Supplementary Fig. 10e). Tumors adjudged (bycell-of-origin score) more FTE- versus more OSE-like alsoshowed differences in PARADIGM integrated pathway level(IPL) scores54. For example, greater FTE character was associatedwith higher enrichment for TP53 tetramer and FOS/JUNcomplex features (Fig. 7f).
Finally, we compared the somatic single nucleotide variant(SNV) and copy number abnormality (CNA) landscape in TCGAsamples rated (by cell-of-origin score) more likely to derive fromFTE versus OSE, respectively. Examples of all major recurrentCNAs and SNVs could be found in individual tumors inferred tooriginate from both cell types. Interestingly, however, there mightbe relative enrichment for specific CNAs in OSE-derived, and forspecific SNVs in FTE-derived, tumors (Supplementary Figs. 11and 12).
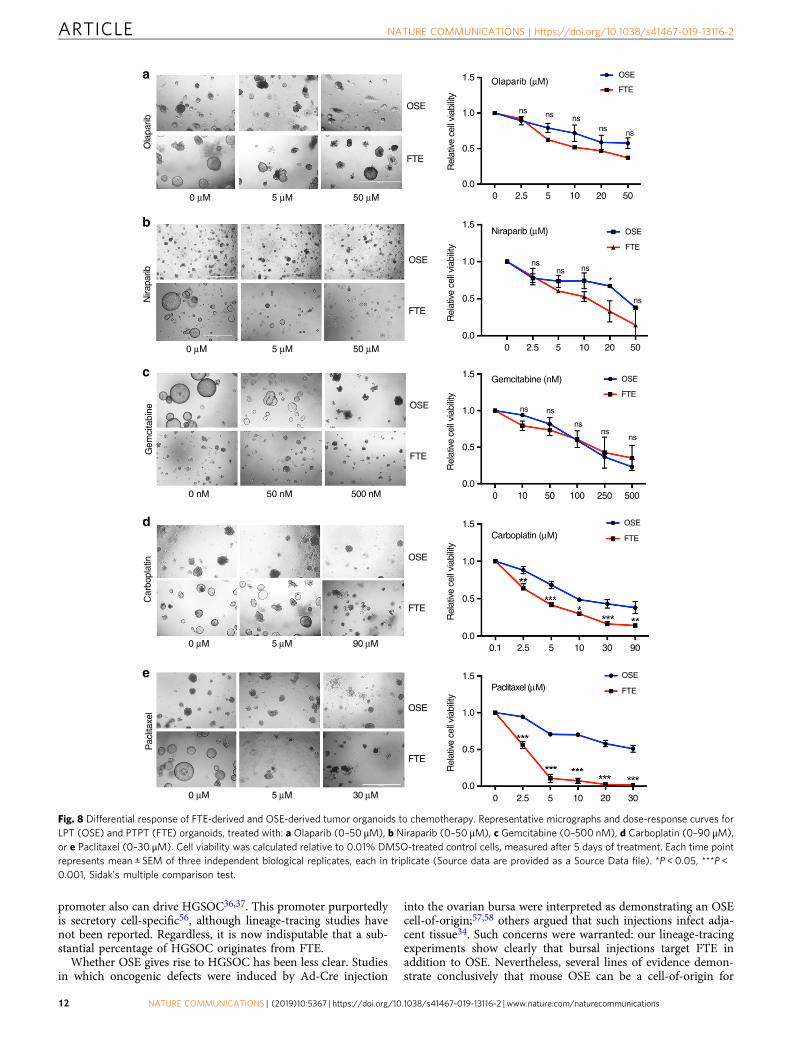
The cell-of-origin can affect response to chemotherapeuticagents. To ask if cell-of-origin can affect therapeutic response, weassessed the response of tumorigenic organoids to clinically usedovarian cancer drugs. PTPT (FTE) and LPT (OSE) organoids atday 4 of culture (>3 passages post-Dox or 4-OHT treatment) werereleased from Matrigel, ~150 organoids were re-seeded in eachwell of 96-well plates pre-coated with Matrigel with/without drugadded, and morphology and viability were assessed 5 days later.Tumorigenic FTE and OSE organoids responded similarly toniriparib, olaparib and gemcitabine (Fig. 8a–c). By contrast, FTE-derived organoids were more sensitive to carboplatin (P < 0.05 at10 μM, Sidak’s multiple comparison test) and, even more pro-minently, to paclitaxel (P < 0.001 at 5, 10, and 25 μM, Sidak’smultiple comparison test) treatment (Fig. 8d and e). Therefore,the cell-of-origin might influence response to the current first-line, standard-of-care therapy for HGSOC.
DiscussionHGSOC typically presents as widely metastatic, bulky, multifocaldisease, complicating identification of its cell-of-origin55. Previousmouse models showed that FTE can be the cell-of-origin ofHGSOC, but a similar role for OSE had neither been excluded, nordemonstrated convincingly. By introducing the same geneticabnormalities into FTE or OSE in GEMMs and organoids, weestablish that HGSOC can originate from either cell type (Supple-mentary Fig. 13). FTE-derived and OSE-derived tumors differ inlatency, metastatic behavior, transcriptome, chemosensitivity, andpossibly causative genomic abnormalities, suggesting that the cell-of-origin makes a substantial contribution to inter-tumor hetero-geneity, molecular pathogenesis, biology, and drug response.
Similar to a previous report, in which combined Tp53;Brca1/2;Pten deletion was driven by Pax8rtTA;TetOCre35, PTPT micerapidly developed STIC-like lesions and metastasized early(<2 months) to the ovarian surface. Lineage tracing confirmedselective expression of Pax8rtTA in FTE secretory cells, butimportantly, consistent with a recent study41, we find that Pax8-ciliated cells derive from Pax8+ progenitors (SupplementaryFig. 2). Thus, while HGSOC can arise from mouse FTE, wecannot conclude that FTE secretory cells (as opposed to Pax8-derived, but Pax8−, ciliated cells or a specialized Pax8+ pro-genitor) are the actual/unique cell-of-origin in FTE. The Ovgp1
Fig. 7 Comparative transcriptome analysis of mouse and human HGSOC. a Heatmap of sample distances by hierarchical clustering, based on total geneexpression levels in normal FTE (N-FT), normal OSE (N-O), and tumors derived from FTE (T-FT), and OSE (T-O) organoids, respectively. Shadingrepresents Euclidian distance for each sample pair. b Venn diagram showing number of differentially expressed genes (Padj < 0.05) in T-FT vs. N-FT, N-Ovs. N-FT, T-O vs. N-O, and T-O vs. T-FT samples. Source data are provided as a Source Data file. c, d Significantly enriched KEGG (c) and GSEA (d)pathways of the top 250 differentially expressed genes (DEGs) between the indicated groups.T-FT > N-FT means genes enriched in FT-derived tumors,compared with normal FT; T-O > N-O denotes genes enriched in OSE-derived tumors compared with normal OSE; T-FT and T-O means genes enriched inboth tumors compared with both noro. e Application of cell-of-origin score, based on the top 50 DEGs in T-FT vs. T-O samples, to TCGA samples. Colorcoding indicates transcriptional subtype assigned to each sample by TCGA; for details, see the “Methods” section. FTE character was highest in themesenchymal subgroup; OSE signature was highest in the proliferative subgroup, ∗∗∗p < 0.001, Wilcoxon rank sum test. Source data are provided as aSource Data file. f Top 50 PARADIGM IPLs that distinguish TCGA samples with greater T-FT character from those with more T-O character (calculated byPearson correlation of IPLs and cell-of-origin score based on top 50 DEGs).
NATURE COMMUNICATIONS | https://doi.org/10.1038/s41467-019-13116-2 ARTICLE
NATURE COMMUNICATIONS | (2019) 10:5367 | https://doi.org/10.1038/s41467-019-13116-2 | www.nature.com/naturecommunications 11
promoter also can drive HGSOC36,37. This promoter purportedlyis secretory cell-specific56, although lineage-tracing studies havenot been reported. Regardless, it is now indisputable that a sub-stantial percentage of HGSOC originates from FTE.
Whether OSE gives rise to HGSOC has been less clear. Studiesin which oncogenic defects were induced by Ad-Cre injection
into the ovarian bursa were interpreted as demonstrating an OSEcell-of-origin;57,58 others argued that such injections infect adja-cent tissue34. Such concerns were warranted: our lineage-tracingexperiments show clearly that bursal injections target FTE inaddition to OSE. Nevertheless, several lines of evidence demon-strate conclusively that mouse OSE can be a cell-of-origin for
a
b
c
d
e
Pac
litax
el
Car
bopl
atin
Gem
cita
bine
Nira
parib
O
lapa
rib
OSE
OSE1.5
1.0
0.5
0.0
1.5
1.0
0.5
0.0
1.5
1.0
0.5
0.0
1.5
1.0
0.5
0.0
1.5
1.0
0.5
0.00 2.5 5 10 20 30
0 2.5 5 10 20 50
0
0
0.1 2.5 5 10 30 90
10 50 100 250 500
2.5 5 10 20 50
FTE
FTE
OSE
FTE
OSE
FTE
OSE
FTE
OSE
FTE
ns ns nsns ns
nsns ns
ns
ns ns
nsns
ns
OSE
FTE
OSE
FTE
OSE
FTE
OSE
FTE
0 μM 5 μM 50 μM
0 μM 5 μM 50 μM
0 nM 50 nM 500 nM
0 μM 5 μM 90 μM
0 μM 5 μM 30 μM
Rel
ativ
e ce
ll vi
abili
ty
Rel
ativ
e ce
ll vi
abili
ty
Olaparib (μM)
Niraparib (μM)
Gemcitabine (nM)
Carboplatin (μM)
Paclitaxel (μM)
Rel
ativ
e ce
ll vi
abili
ty
Rel
ativ
e ce
ll vi
abili
ty
Rel
ativ
e ce
ll vi
abili
ty
Fig. 8 Differential response of FTE-derived and OSE-derived tumor organoids to chemotherapy. Representative micrographs and dose-response curves forLPT (OSE) and PTPT (FTE) organoids, treated with: a Olaparib (0–50 μM), b Niraparib (0–50 μM), c Gemcitabine (0–500 nM), d Carboplatin (0–90 μM),or e Paclitaxel (0–30 μM). Cell viability was calculated relative to 0.01% DMSO-treated control cells, measured after 5 days of treatment. Each time pointrepresents mean ± SEM of three independent biological replicates, each in triplicate (Source data are provided as a Source Data file). *P < 0.05, ***P <0.001, Sidak’s multiple comparison test.
ARTICLE NATURE COMMUNICATIONS | https://doi.org/10.1038/s41467-019-13116-2
12 NATURE COMMUNICATIONS | (2019) 10:5367 | https://doi.org/10.1038/s41467-019-13116-2 | www.nature.com/naturecommunications

HGSOC, at least HGSOC induced by combined Tp53 mutation/inactivation and RB family inactivation. Ad-Cre-injectedTp53R172H/fl;T121 mutant mice develop frank HGSOC evenafter salpingectomy. Also, Lgr5-Cre, which we confirm by lineage-tracing marks OSE, but not FTE, in adult mice, drives HGSOCcaused by combined RB family inactivation/Tp53 mutation/hemizygosity. OSE organoids with the same genetic defects alsogive rise to HGSOC.
Brca1/2;Pten;Tp53 deletion driven by the same Pax8rtTA;TetOCre transgene that we used causes STIC, invasive HGSOC,and ultimately, peritoneal carcinomatosis35. By contrast, PTPTmice died prematurely from thymic hyperplasia, and subsequentanalysis revealed unexpected, leaky expression of TetOCre inthymic epithelial cells. Previous work showed that active E2F,resulting from RB family inactivation, increases Foxn1 expression,which drives thymic epithelial cell proliferation42. Presumably,Brca1/2;Pten;Tp53 deletion does not cause such hyperprolifera-tion, explaining the absence of thymic hyperplasia in thesemice35. However, these genes might affect other thymic epithelialcell properties and, indirectly, immune function, so our resultsargue for caution in using the TetOCre line to study tumorbiology and oncogenesis.
Although we could not evaluate metastasis in PTPT mice,organoid transplantation studies show that mouse FTE-derivedHGSOC metastasizes widely. We also used organoids to directlycompare tumorigenesis by FTE-derived and OSE-derivedHGSOC. These experiments strongly suggest that the cell-of-origin can influence HGSOC behavior: FTE-derived tumors hadgreater propensity to disseminate, whereas OSE-derived HGSOCformed large, solitary lesions that showed less frequent (althoughnonetheless significant) metastasis. Human HGSOC also differsin its pattern of growth and metastasis, with some cases forminglarge primary tumors and fewer, less diffuse tumor deposits,whereas others show peritoneal carcinomatosis59. It will beinteresting to see if such differences reflect distinct cells-of-ori-gins, which can now be assessed by transcriptomic21,22,24, pro-teomic23, and possibly epigenomic22 analysis of such tumors.
Although we only studied the effects of RB family inactivation/Tp53 mutation in FTE and OSE, other defined combinations ofgenetic defects (e.g., as found in TCGA) can be engineered intoorganoids, allowing the transformation process (proliferation,polarity, cell death, invasion) to be deconstructed in vitro andtumorigenicity to be assessed in vivo. It will be important todetermine whether the different tumor properties that we observereflect the particular combination of cell-of-origin/oncogenicdefects vs. the cell-of-origin per se and if all mutational combi-nations are equally transforming in both cell types. Notably, Haoet al. concluded that some genetic defects are more frequent intumors likely derived from FTE vs. OSE24, although importantly,consistent with our results, virtually all genetic abnormalitiesassociated with human HGSOC were found in tumors inferred toarise from either cell type. By introducing these mutations intoorganoids, we can directly assess their relative transformingpotency and biological effects in future studies. Nevertheless,RNAseq suggests that while RB inactivation/Tp53 mutation affectsimilar pathways and processes in FTE and OSE, the cell-of-origin influences the specific genes affected. These transcriptionaldifferences might contribute to differential sensitivity to carbo-platin and paclitaxel: for example, while repair genes are differ-entially expressed in FTE-derived and OSE-derived tumors(compared with their cognate normal tissues), expression isaltered more in the latter. By contrast, signaling from p53-dependent pathways (presumably by alternative mechanisms,given the combined Tp53 mutation/deletion in both types oftumors) is elevated to a greater extent in FTE-derived, than inOSE-derived tumors.
Several lines of evidence suggest that our results are relevant forhuman HGSOC. A recent case report documented the develop-ment of stage IV HGSOC 3 years post-salpingectomy withoutevident STIC in the excised FT60. Recent exome sequencing25,proteomic23, transcriptomic21,24, and ChiPseq experiments22
support the notion that HGSOC can arise at sites other than FTE.These studies also concluded that HGSOC inferred to arise fromOSE has a worse prognosis than putatively FTE-derived tumors.Our results provide unambiguous, biological validation of thepredictions of these studies. The primary determinant of survivalin HGSOC patients is their response to platinum/taxol-basedchemotherapy23,24. Hence, the lower chemo-responsiveness ofOSE-derived HGSOC organoids could explain the poorer prog-nosis of OSE-like HGSOC, while future studies using organoidmodels could be used to unravel the molecular basis of this dif-ferential response. Our findings clearly demonstrate the need tounderstand how the cell-of-origin contributes to HGSOCpathogenesis, given that OSE-derived and FTE-derived tumori-genic organoids have distinct biologic behavior, including sensi-tivities to front-line anti-neoplastic drugs. Finally, our analyses,along with those of Hao et al.24, raise the possibility that OSE andFTE might be differentially sensitive to transformation by specificgenetic combinations and different mutational processes.
MethodsMouse strains. Rosa26-tdTomato [B6;129S6-Gt(ROSA)26SORtm9(CAG-tdTomato)Hze],[B6;129-Gt(ROSA)26SorTM1sor], Lgr5–EGFP–ires–CreER (Lgr5-Cre) [B6.129P2-Lgr5tm1(cre/ERT2)Cle], Tp53R172H [B6.129S4(Cg)-Trp53 tm2.1Tyj], Trp53flox/flox
[FVB;129-Trp53tm1Brn] and nu/nu [NU/J] mice were obtained from The JacksonLaboratory. Conditional TgK18GT121tg/+ BAC transgenic mice (T121 mice) weregenerated earlier33. Briefly, T121 (N-terminal 121 amino acids of SV40 large Tantigen) was directed to OSE using transgenic TgK18GT121tg/+ mice, which carry aBAC containing the mouse CK 18 gene and an inserted loxP-GFP-stop-loxP (LSL)T121 cassette. This cassette ensures that T121 is only expressed after Cre exposure.Pax8rtTA mice (which express the reverse tetracycline-controlled transactivator(rtTA) under control of the Pax8 promoter) and TetOcre (mice expressing Crerecombinase in a tetracycline-dependent manner) strains (C57/Bl6 background)also were used35. Tp53R172H, Trp53flox/flox, and T121 mice were interbred withPax8rtTA and TetOcre mice to obtain Pax8rtTA;TetOcre;Tp53R172H/fl (PTP),Pax8rtTA;TetOcre;T121 (PTT) and Pax8rtTA; TetOcre; Tp53 R172H/fl;T121 (PTPT)mice. Trp53R172H, Trp53flox/flox, T121, and Lgr5CreERT2 were interbred to obtainLgr5Cre;Tp53 R172H/fl (LP), Lgr5Cre;T121(LT), and Lgr5Cre; Trp53R172H/fl;T121(LPT) mice. Rosa26-lacz and Rosa26-tdTomato mice were bred to Pax8rtTA andTetOcre strains to obtain Pax8rtTA;TetOcre;Rosa26-LacZ and Pax8rtTA;TetOcre;Rosa26-tdTomato mice. Genotyping primers are provided in the supplementaryinformation. When indicated, mice were euthanized by CO2 inhalation and FT and/or ovaries were harvested for histology and organoid culture. All animal experi-ments were approved by, and conducted in accordance with the procedures of, theIACUC at New York University School of Medicine (Protocol no.170602).
Animal experiments. For lineage tracing, Pax8rtTA;TetOcre;Rosa26-LacZ females(6–8 weeks old) were given 2 mg/ml Dox in their drinking water for 2 days. Two(2) or 60 days later, mice were sacrificed, and their reproductive systems werecollected. Before administering 4-OHT, mice were superovulated by injection of 5IU pregnant mare serum gonadotropin (PMSG, Sigma) and 5 IU of humanchorionic gonadotropin (hCG, Sigma), spaced 48 h apart. Lgr5-Cre; Rosa26-tdTomato mice (6–8 weeks old) were injected intraperitoneally with 2 mg of 4-OHT in sesame oil (10 mg/ml) and sacrificed 48 h or 4 months later. For Creinduction in PTP, PTT, and PTPT mice, Dox (2 mg/ml) was added for 2 weeks tothe drinking water of 6-week-old females, and tissues were collected for H&E andIHC one month after the end of Dox treatment. For Cre induction in LP, LT, andLPT mice, 6-week-old females were injected with 4-OHT, and mice were sacrificedat the indicated times.
Ovarian bursae were injected with recombinant adenovirus Ad5-CMV-Cre(Ad-Cre), purchased from the Vector Development Lab, Baylor College ofMedicine. Tp53R172H/fl;T121 females (6–8 weeks) were superovulated, and~1.5 days later, 10 μl virus (1011–1012 infectious particles/ml) were delivered intoone surgically exposed bursa, with the contralateral ovary serving as a control.Rosa26-LacZ female mice were used to test Cre expression, and were euthanized2 weeks post-injection. Where indicated, salpingectomies were performed 3 daysafter Ad-Cre injection, and mice were euthanized 3 months later. Animals weremonitored routinely for signs of distress, poor body condition, and tumor burden,and were euthanized according to veterinary recommendations. For survivalexperiments, mice were monitored until death or upon recommended euthanasia.
NATURE COMMUNICATIONS | https://doi.org/10.1038/s41467-019-13116-2 ARTICLE
NATURE COMMUNICATIONS | (2019) 10:5367 | https://doi.org/10.1038/s41467-019-13116-2 | www.nature.com/naturecommunications 13
Organoids were injected into 8-week-old nu/nu females. Mice were anesthetizedby intraperitoneal injection of 0.2 ml xylazine hydrochloride, shaved, and cleanedwith betadine. A midline dorsal incision was made, followed by an incision into theperitoneal cavity above the right ovarian fat pad. The ovary was externalized, and0.5 × 106 cells/Matrigel mixture (1:1, 15–20 μl) was injected by inserting a 27 Gneedle into the fat pad. The contralateral ovary served as a control. Injected tissuewas returned to the peritoneal cavity, the inner incision was sutured, and the outerincision was sealed with wound clips. Cells in Matrigel (1:1, ~15 μl) were injectedinto the MFP just inferior to the nipples of 6–8-week-old females with a 28 Gneedle (BD insulin syringe). Mice that developed tumors were euthanized at theindicated times, when tumors ulcerated or reached a maximum diameter of 20 mm,or when mice showed any signs of discomfort.
Organoid cultures and assays. For FTE organoids, fimbriae from wild type, PTP,PTT, and PTPT mice were dissected under a microscope, minced, and digestedwith Collagenase type I and 0.012% (w/v) Dispase (STEMCELL Technologies) at37 °C for 1 h, followed by incubation in TrypLE™ Express Enzyme (Thermo FisherScientific) for 10 min at 37 °C and inactivation with 1% FBS in DMEM (Gibco).Dispersed FTE cells were passed through a strainer (70 μm), mixed with Matrigel(BD Bioscience), seeded, and maintained in culture61. After the Matrigel solidified(10 min at 37 °C incubator), culture medium was added. The medium was based onAd+++ (AdDMEM/F12, Invitrogen; HEPES, Thermo Fisher Scientific, 100×diluted; penicillin/streptomycin, Life Technologies, Glutamax, Life Technologies,100× diluted), supplemented with B27 (Invitrogen, 50× diluted), N2 supplement(Thermo Fisher Scientific, 100× diluted), 1.25 mM N-acetylcysteine (Sigma), 50 ng/ml EGF (Thermo Fisher Scientific), 500 ng/ml RSPO1 (Peprotech) or R-spondin-1-conditioned medium (25%, v/v), WNT3a- conditioned medium (25%, v/v) and100 ng/ml Noggin (Peprotech). For the first 3 days after thawing, media weresupplemented with 10 μM Y-27632 (Sigma-Aldrich). For OSE organoids, fat andadjacent FT were removed carefully under a microscope, and the ovaries weredigested with 0.25% trypsin/EDTA (Invitrogen), followed by protease inactivationwith DMEM containing 1% FBS (Gibco) at 37 °C for 30 min. Supernatants,containing cells stripped from the OSE, were seeded in Matrigel, and culturedin Ad+++ medium, supplemented with B27, 1 mM N-acetylcysteine (Sigma),WNT3a-conditioned medium (50% v/v), R-spondin-1-conditioned medium(10% v/v), 100 ng/ml Noggin (Peprotech), 12.5 ng/ml EGF, 10 mM nicotinamide(Sigma), 0.5 μMA83-01 (Tocris Bioscience), 0.5 μg/ml hydrocortisone (Sigma), and100 nM β-estradiol (Sigma). WNT3a-conditioned and R-spondin-1-conditionedmedia were obtained from a commercially available cell line ATCC® CRL-2647™
(ATCC) and Cultrex® R-spondin1 (Rspo1) Cells (Trevigen), respectively.Media were changed every 2–3 days, and organoids were passaged
(~10,000 cells/well) every 6–8 days. For passaging, growth medium was removed,and Matrigel was resuspended in cold Cultrex® Organoid Harvesting Solution andtransferred to a 15-ml Falcon tube, which was placed on ice for 15 min. Organoidswere recovered by centrifugation at 1000×g for 5 min, and resuspended in 500 μlTrypLE Express Enzyme (Gibco) for 10 min at 37 °C. Cells were seeded asindicated for each experiment. For freezing, cells were resuspended in organoidmedium with 10% DMSO and 10% FBS, cooled, and stored in liquid nitrogen.
To activate Cre in vitro, 0.5 μl of Dox (1 mg/ml) were added to 500 μl of freshlyisolated PTP, PTT, or PTPT cells, which were plated as above. Similarly, 1 μg/ml 4-OHT was used to activate Cre in LP, LT, and LPT organoids. All data weregenerated at least three passages after induction. Organoid size was quantified asthe surface area of horizontal cross sections. If all organoids in a well could not bemeasured, several random, non-overlapping images were acquired from each wellusing an Invitrogen™ EVOS™ FL Digital Inverted Fluorescence Microscope andanalyzed by using ImageJ software. Organoid perimeters for area measurementswere defined manually and by automated determination using the Analyze Particlefunction of ImageJ, with investigator verification of the automated determinations.Organoids touching the edges of images were excluded from counting.
To compare the organoid-forming efficiency of different genotypes, 5000 cellswere seeded into a 24-well plate, organoid number was counted under a lightmicroscope after 5–7 days in culture, and the percentage of mutant organoidsformed relative to those formed by wild type cells was calculated. For in vitrogrowth curves, organoids were incubated in TrypLE Express (Gibco) for 15 min at37 °C, followed by an additional 5 min digestion in dispase. Isolated cells werepassed through a strainer, seeded at 2 × 10⁴ cells/well in a 24-well plate, and placedin culture medium. At the indicated times, cells were recovered as above, and viablecounts were obtained by trypan blue exclusion.
Drugs were tested in organoids based on a previous protocol62. Briefly,organoids in culture at day 4 were released from Matrigel and diluted to 50organoids/μl in growth medium lacking N-acetylcysteine and Y-27632. Clearbottom 96-well plates were coated with 20 μl Matrigel before the addition of 30 μlof organoid suspension. The indicated concentrations of paclitaxel (Selleck Chem),carboplatin (Sigma), olaparib (Selleck Chem), niraparib (Selleck Chem), or DMSO(control) were added in triplicate. On day 5 of treatment, media were removed, andthe Matrigel drops were suspended in 40 μl CellTiter-Glo 3D (Promega) and 80 μladvanced AdDMEM/F12, and incubated for 30 min at room temperature beforeluminescence was measured in a FlexStation® 3 Multi-Mode Microplate Reader.Results were normalized to DMSO controls.
Invasion was assessed by using chambers with 8 μm pore size polycarbonatemembrane (Transwell) inserts (Costar). Matrigel (30 μl) was added to the chambersand allowed to solidify at 37 °C for 10 min. Wild type, PTP, PTT, or PTPT cells(2 × 10⁴/50 μl Ad+++ medium/well) were seeded into the Matrigel-coated topchamber and allowed to attach for 12 h, followed by the addition of 500 μl ofculture medium to each well. After an additional 96 h incubation, the upper surfaceof the membrane was scrubbed carefully several times with a cotton swab soaked inPBS to remove non-invaded cells. The lower membrane was then rinsed carefullyseveral times with PBS, and cells that had invaded were visualized by staining withcrystal violet and counted under a microscope. Invasion was calculated as theaverage number of cells per 10× field, determined by Image J software.
FACS. Ovaries from Lgr5-Cre (Lgr5–EGFP–ires–CreERT2) females (6–8 weeks) weredigested as above, and recovered OSE cells were passed through a strainer (40 μm)to obtain single-cell suspensions. OSE cells were recovered by centrifugation at1000×g for 5 min and resuspended in PBS containing 2% FBS, 10 μM Y-27632,(STEMCELL Technologies Inc.), and DAPI (1 μg/ml). FACS was performedimmediately on a MoFloTM XDP, and GFPhi and GFPneg cells were seeded at 5000/well. Organoids were counted 6 days later, and organoid forming efficiency wascalculated, n= 10 wells/group, combined from three experiments.
Histology and immunostaining. Tissues were fixed in 4% paraformaldehyde(PFA) in PBS at 4 °C for 4 h. Organoids were fixed in 4% PFA for 15 min andplaced in Histogel (Thermo Fisher Scientific) before tissue processing andembedding. Formalin-fixed paraffin-embedded (FFPE) tissue sections (5 μm) werede-paraffinized, rehydrated, and then stained with hematoxylin and eosin (H&E)or subjected to IHC. For antigen retrieval, slides were autoclaved in 0.01M citratebuffer (pH 6.0). Endogenous peroxidase activity was quenched in 3% H2O2 inmethanol for 15 min, and sections were blocked with 0.5% BSA–PBS for 1 h.Primary antibodies were added overnight at 4 °C, then washed with PBS (3 × ,10 min. each), incubated with HRP-labeled secondary antibodies, and washed againwith PBS (3× , 10 min each). Signals were visualized by using the HRP PolymerDetection Kit and DAB peroxidase (HRP) substrate (34002, Life Technologies).Primary antibodies included: Ki67 1:200 (ab15580, Abcam), γ-H2AX 1:500 (05-636, Thermo Fisher Scientific), CK7 1:200 (ab181598, Abcam), Stathmin1 1:200(3352 S, Cell Signaling), P16 1:200 (sc-1661, Santa Cruz), PAX8 1:200 (10336-1-AP, Proteintech), and p53 1:800 (P53-CM5P-L, Leica). Secondary antibodies weregoat anti-chicken IgY-HRP 1:200 (sc-2428, Santa Cruz) and goat anti-rabbit IgG-HRP 1:200 (sc-2030, Santa Cruz), as appropriate.
Immunofluorescence was performed on frozen tissue sections (5 μm) or wholeorganoids released by gently dissolving the Matrigel in ice-cold PBS. Followingfixation as above, cells were permeabilized in PBS containing 0.5% Triton X-100and blocked in PBS containing 1% BSA, 3% normal goat serum, and 0.2% TritonX-100. Primary antibodies were incubated at 4 °C overnight, and sections werewashed in PBS (3×, 10 min each), followed by incubation with DAPI (2 μg/ml) andAlexa 488-conjugated, 555-conjugated, or 647-conjugated anti-chicken, anti-rabbit,or anti-mouse antibodies, as indicated. After washing, samples were mounted withProLong Gold Antifade reagent (Life Technology). Primary antibodies were: GFP(ab13970, 1:300), WT1 (ab15249, 1:200), E-cadherin (ab15148, 1:200), all fromAbcam. Secondary antibodies included (all at 1:200): goat anti-mouse IgG, AlexaFluor® 647 conjugate (A28181, Thermo Fisher Scientific), goat anti-rabbit IgG,Alexa Fluor® 555 conjugate (A27039, Thermo Fisher Scientific), and goat anti-chicken IgY H&L, Alexa Fluor® 488 conjugate (ab150169, Abcam).
Immunoblotting. Organoids were released from Matrigel and the cell pellets werelysed in SDS lysis buffer (50 mM Tris–HCl pH 7.5, 100 mM NaCl, 1 mM EDTA,1% SDS, 2 mM Na3VO4), and subjected to SDS–PAGE, followed by transfer toImmobilon-FL PVDF membranes (Millipore). Membranes were blocked in 1%BSA/TBS containing 0.1% Tween20 for 30 min, and treated with primary anti-bodies in blocking buffer for 1 h, followed by treatment with IRDye-conjugatedsecondary antibodies (LI-COR). Primary antibodies were Tp53 1:1000 (P53-CM5P-L, Leica), Erk2 1:1000 (sc-1647, Santa Cruz), T1211:1000 (Anti-SV40 TAntigen (Ab-1) Mouse mAb (PAb419) (DP01)), γ-H2AX 1:1000 (05-636, ThermoFisher Scientific). Images were obtained by using an ODYSSEY CLx quantitative IRfluorescent detection system (LI-COR). Unprocessed images of scanned immu-noblots shown in Fig. 6d, Supplementary Fig. 4a are provided in a Source Data file.
Laser capture microdissection and RNA extraction. Tissues were embedded inFSC 22 Clear Frozen Section Compound and frozen immediately in liquid N2.Blocks were sectioned at 5–8 μm, and sections were mounted on a PEN membraneframe (Leica). Slides were air-dried for 30 min at room temperature. Laser capturewas performed with a Leica LMD6000 laser microdissection system. Excised pieceswere harvested into 200 μl RNase-free tubes, which were carefully recovered fromthe microscope, centrifuged, and placed on ice. RNA was extracted by using themiRNeasy mini Kit (Qiagen), following the manufacturer’s instruction.
RNA-sequencing and data processing. Libraries were prepared using the Illu-mina TruSeq Stranded Total RNA Sample Preparation Kit and sequenced on an
ARTICLE NATURE COMMUNICATIONS | https://doi.org/10.1038/s41467-019-13116-2
14 NATURE COMMUNICATIONS | (2019) 10:5367 | https://doi.org/10.1038/s41467-019-13116-2 | www.nature.com/naturecommunications
Illumina HiSeq 4000 using 150 bp paired-end reads by the Perlmutter CancerCenter Genome Technology Center shared resource (GTC). Sequencing resultswere demultiplexed and converted to FASTQ format using Illumina bcl2fastqsoftware. The average number of read pairs/sample was 60.3M. Data were pro-cessed by the Perlmutter Cancer Center Applied Bioinformatics Laboratory sharedresource (ABL). Briefly, reads were adapter- and quality-trimmed with Trimmo-matic63 and then aligned to the mouse genome (build mm10/GRCm38) using thesplice-aware STAR aligner64. The featureCounts program65 was utilized to generatecounts for each gene, based on how many aligned reads overlap its exons. Thesecounts were normalized and tested for differential expression, using negativebinomial generalized linear models implemented by the DESeq2 R package66.Statistical analysis and visualization of gene sets were performed using the clus-terProfiler R package67.
Bioinformatic analysis. Cell type-specific gene signatures were determined bycalculating differentially expressed genes pair-wise between all four groups exam-ined (N-FT, N-0, T-FT, T-O, six comparisons). The genes were subset to protein-coding and available human ortholog predictions in any of the 14 databasesindexed by the HUGO Gene Nomenclature Committee Comparison of OrthologyPredictions resource. For each group, we identified genes that were upregulatedrelative to each of the other groups. Each gene has three P-values (indicative of thesignificance of upregulation of that gene in the group of interest vs. each othergroup). We then selected the highest (least significant) P-value, and then ranked allgenes in ascending order to generate signatures of a specific size (50, 100, 250, 500genes) for the T-FT and T-O groups, respectively. To measure enrichment in eachsample, log2-transformed counts per million (logCPM) were computed for eachdataset using edgeR. The logCPM matrix was scaled and centered to generate a z-score for each gene, and the mean z-score of all genes comprising each signaturewas calculated. Combined cell-of-origin scores (FT-O) were determined by sub-tracting the OSE score from the FTE score.
Quantification and statistical analysis. Unless otherwise specified, data arepresented as mean ± SEM. Survival rates were analyzed by log‐rank test, usingGraphPad Prism software. P values were determined by two-tailed Student’s t‐test,unless otherwise specified, with P < 0.05 considered statistically significant.
Reporting summary. Further information on research design is available inthe Nature Research Reporting Summary linked to this article.
Data availabilityRNA sequence data have been deposited in the GEO database under the accession codeGSE125016. TCGA ovarian cancer batch effects-normalized mRNA data, somaticmutations, tumor gene-level copy number data, PARADIGM pathway activity, andmolecular subtypes referenced during the study are available in a public repository fromthe UCSC Xena Pan-Cancer Atlas hub. The data underlying Figs. 2f, h, i, 3c, 5e, f, 6c, d, f,g, 7b, e, 8 and Supplementary Figs. 3a, b, 4a, b, c, 7a, c, 8a, 10e, 11, 12 are provided as aSource Data file. All other data supporting the findings of this study are available withinthe article, the Supplementary information files, or the corresponding author upon request.A reporting summary for this article is available as a Supplementary Information file.
Received: 2 April 2019; Accepted: 22 October 2019;
References1. Kobel, M. et al. Differences in tumor type in low-stage versus high-stage
ovarian carcinomas. Int. J. Gynecol. Pathol. 29, 203–211 (2010).2. Klotz, D. M. & Wimberger, P. Cells of origin of ovarian cancer: ovarian surface
epithelium or fallopian tube? Arch. Gynecol. Obstet. 296, 1055–1062 (2017).3. Kurman, R. J. Origin and molecular pathogenesis of ovarian high-grade serous
carcinoma. Ann. Oncol. 24(Suppl. 10), x16–x21 (2013).4. Karnezis, A. N., Cho, K. R., Gilks, C. B., Pearce, C. L. & Huntsman, D. G. The
disparate origins of ovarian cancers: pathogenesis and prevention strategies.Nat. Rev. Cancer 17, 65–74 (2017).
5. Auersperg, N. Ovarian surface epithelium as a source of ovarian cancers:unwarranted speculation or evidence-based hypothesis? Gynecol. Oncol. 130,246–251 (2013).
6. Auersperg, N., Woo, M. M. & Gilks, C. B. The origin of ovarian carcinomas: adevelopmental view. Gynecol. Oncol. 110, 452–454 (2008).
7. Bell, D. A. & Scully, R. E. Early de novo ovarian carcinoma. A study offourteen cases. Cancer 73, 1859–1864 (1994).
8. Scully, R. E. Pathology of ovarian cancer precursors. J. Cell. Biochem. Suppl.23, 208–218 (1995).
9. Pothuri, B. et al. Genetic analysis of the early natural history of epithelialovarian carcinoma. PLoS ONE 5, e10358 (2010).
10. Zweemer, R. P. et al. Molecular evidence linking primary cancer of thefallopian tube to BRCA1 germline mutations. Gynecol. Oncol. 76, 45–50(2000).
11. Colgan, T. J., Murphy, J., Cole, D. E., Narod, S. & Rosen, B. Occult carcinomain prophylactic oophorectomy specimens: prevalence and association withBRCA germline mutation status. Am. J. Surg. Pathol. 25, 1283–1289 (2001).
12. Rebbeck, T. R. et al. Prophylactic oophorectomy in carriers of BRCA1 orBRCA2 mutations. N. Engl. J. Med. 346, 1616–1622 (2002).
13. Labidi-Galy, S. I. et al. High grade serous ovarian carcinomas originate in thefallopian tube. Nat. Commun. 8, 1093 (2017).
14. Bowtell, D. D. et al. Rethinking ovarian cancer II: reducing mortality fromhigh-grade serous ovarian cancer. Nat. Rev. Cancer 15, 668–679 (2015).
15. Kindelberger, D. W. et al. Intraepithelial carcinoma of the fimbria and pelvicserous carcinoma: evidence for a causal relationship. Am. J. Surg. Pathol. 31,161–169 (2007).
16. Kuhn, E. et al. TP53 mutations in serous tubal intraepithelial carcinoma andconcurrent pelvic high-grade serous carcinoma—evidence supporting theclonal relationship of the two lesions. J. Pathol. 226, 421–426 (2012).
17. Cancer Genome Atlas Research, N. Integrated genomic analyses of ovariancarcinoma. Nature 474, 609–615 (2011).
18. Mehra, K. et al. STICS, SCOUTs and p53 signatures; a new language for pelvicserous carcinogenesis. Front. Biosci. (Elite Ed) 3, 625–634 (2011).
19. Gilks, C. B. et al. Incidental nonuterine high-grade serous carcinomas arise inthe fallopian tube in most cases: further evidence for the tubal origin of high-grade serous carcinomas. Am. J. Surg. Pathol. 39, 357–364 (2015).
20. Bashashati, A. et al. Distinct evolutionary trajectories of primary high-gradeserous ovarian cancers revealed through spatial mutational profiling. J. Pathol.231, 21–34 (2013).
21. Ducie, J. et al. Molecular analysis of high-grade serous ovarian carcinoma withand without associated serous tubal intra-epithelial carcinoma. Nat. Commun.8, 990 (2017).
22. Lawrenson, K. F., et al. Integrated molecular profiling studies to characterizethe cellular origins of high-grade serous ovarian cancer. Preprint at https://doi.org/10.1101/330597 (2018).
23. Coscia, F. et al. Integrative proteomic profiling of ovarian cancer cell linesreveals precursor cell associated proteins and functional status. Nat. Commun.7, 12645 (2016).
24. Hao, D. et al. Integrated analysis reveals tubal- and ovarian-originated serousovarian cancer and predicts differential therapeutic responses. Clin. CancerRes. 23, 7400–7411 (2017).
25. Eckert, M. A. et al. Genomics of ovarian cancer progression reveals diversemetastatic trajectories including intraepithelial metastasis to the fallopian tube.Cancer Discov. 6, 1342–1351 (2016).
26. McDaniel, A. S. et al. Next-generation sequencing of tubal intraepithelialcarcinomas. JAMA Oncol. 1, 1128–1132 (2015).
27. Kommoss, F. et al. Uterine serous carcinomas frequently metastasize to thefallopian tube and can mimic serous tubal intraepithelial carcinoma. Am. J.Surg. Pathol. 41, 161–170 (2017).
28. Rabban, J. T., Vohra, P. & Zaloudek, C. J. Nongynecologic metastases tofallopian tube mucosa: a potential mimic of tubal high-grade serouscarcinoma and benign tubal mucinous metaplasia or nonmucinoushyperplasia. Am. J. Surg. Pathol. 39, 35–51 (2015).
29. Reyes, C., Murali, R. & Park, K. J. Secondary involvement of the adnexa anduterine corpus by carcinomas of the uterine cervix: a detailed morphologicdescription. Int J. Gynecol. Pathol. 34, 551–563 (2015).
30. Xing, D. & Orsulic, S. A mouse model for the molecular characterization ofbrca1-associated ovarian carcinoma. Cancer Res. 66, 8949–8953 (2006).
31. Kinross, K. M. et al. An activating Pik3ca mutation coupled with Pten loss issufficient to initiate ovarian tumorigenesis in mice. J. Clin. Invest. 122,553–557 (2012).
32. Flesken-Nikitin, A., Choi, K. C., Eng, J. P., Shmidt, E. N. & Nikitin, A. Y.Induction of carcinogenesis by concurrent inactivation of p53 and Rb1 in themouse ovarian surface epithelium. Cancer Res. 63, 3459–3463 (2003).
33. Szabova, L. et al. Perturbation of Rb, p53, and Brca1 or Brca2 cooperate ininducing metastatic serous epithelial ovarian cancer. Cancer Res. 72,4141–4153 (2012).
34. Sale, S. & Orsulic, S. Models of ovarian cancer metastasis: Murine models.Drug Discov. Today Dis. Models 3, 149–154 (2006).
35. Perets, R. et al. Transformation of the fallopian tube secretory epithelium leadsto high-grade serous ovarian cancer in Brca;Tp53;Pten models. Cancer Cell 24,751–765 (2013).
36. Sherman-Baust, C. A. et al. A genetically engineered ovarian cancer mousemodel based on fallopian tube transformation mimics human high-gradeserous carcinoma development. J. Pathol. 233, 228–237 (2014).
37. Zhai, Y. et al. High-grade serous carcinomas arise in the mouse oviduct viadefects linked to the human disease. J. Pathol. 243, 16–25 (2017).
38. Van Keymeulen, A. et al. Reactivation of multipotency by oncogenic PIK3CAinduces breast tumour heterogeneity. Nature 525, 119–123 (2015).
NATURE COMMUNICATIONS | https://doi.org/10.1038/s41467-019-13116-2 ARTICLE
NATURE COMMUNICATIONS | (2019) 10:5367 | https://doi.org/10.1038/s41467-019-13116-2 | www.nature.com/naturecommunications 15
39. Turashvili, G. & Brogi, E. Tumor heterogeneity in breast cancer. Front. Med.4, 227 (2017).
40. Sutherland, K. D. & Visvader, J. E. Cellular mechanisms underlyingintertumoral heterogeneity. Trends Cancer 1, 15–23 (2015).
41. Ghosh, A., Syed, S. M. & Tanwar, P. S. In vivo genetic cell lineage tracingreveals that oviductal secretory cells self-renew and give rise to ciliated cells.Development 144, 3031–3041 (2017).
42. Garfin, P. M. et al. Inactivation of the RB family prevents thymus involutionand promotes thymic function by direct control of Foxn1 expression. J. Exp.Med. 210, 1087–1097 (2013).
43. Drost, J. & Clevers, H. Organoids in cancer research. Nat. Rev. Cancer 18,407–418 (2018).
44. Dutta, D., Heo, I. & Clevers, H. Disease modeling in stem cell-derived 3Dorganoid systems. Trends Mol. Med. 23, 393–410 (2017).
45. Kessler, M. et al. The Notch and Wnt pathways regulate stemness anddifferentiation in human fallopian tube organoids. Nat. Commun. 6, 8989 (2015).
46. Laury, A. R. et al. PAX8 reliably distinguishes ovarian serous tumors frommalignant mesothelioma. Am. J. Surg. Pathol. 34, 627–635 (2010).
47. Stewart, J. M. et al. Phenotypic heterogeneity and instability of human ovariantumor-initiating cells. Proc. Natl Acad. Sci. USA 108, 6468–6473 (2011).
48. Cybulska, P. et al. A genomically characterized collection of high-grade serousovarian cancer xenografts for preclinical testing. Am. J. Pathol. 188,1120–1131 (2018).
49. Auersperg, N., Wong, A. S., Choi, K. C., Kang, S. K. & Leung, P. C. Ovariansurface epithelium: biology, endocrinology, and pathology. Endocr. Rev. 22,255–288 (2001).
50. Ng, A. et al. Lgr5 marks stem/progenitor cells in ovary and tubal epithelia.Nat. Cell Biol. 16, 745–757 (2014).
51. Flesken-Nikitin, A. et al. Ovarian surface epithelium at the junction areacontains a cancer-prone stem cell niche. Nature 495, 241–245 (2013).
52. Barker, N. et al. Very long-term self-renewal of small intestine, colon, and hairfollicles from cycling Lgr5+ve stem cells. Cold Spring Harb. Symp. Quant.Biol. 73, 351–356 (2008).
53. O’Shannessy, D. J. et al. Gene expression analyses support fallopian tubeepithelium as the cell of origin of epithelial ovarian cancer. Int. J. Mol. Sci. 14,13687–13703 (2013).
54. Vaske, C. J. et al. Inference of patient-specific pathway activities from multi-dimensional cancer genomics data using PARADIGM. Bioinformatics 26,i237–i245 (2010).
55. Swisher, E. M., Garcia, R. L., Kilgore, M. R. & Norquist, B. M. Culprit orbystander? The role of the fallopian tube in “ovarian” high-grade serouscarcinoma. Cancer Discov. 6, 1309–1311 (2016).
56. Wu, R. et al. Impact of oviductal versus ovarian epithelial cell of origin onovarian endometrioid carcinoma phenotype in the mouse. J. Pathol. 240,341–351 (2016).
57. Bobbs, A. S., Cole, J. M. & Cowden Dahl, K. D. Emerging and evolving ovariancancer animal models. Cancer Growth Metastasis 8, 29–36 (2015).
58. Stuckelberger, S. & Drapkin, R. Precious GEMMs: emergence of faithfulmodels for ovarian cancer research. J. Pathol. 245, 129–131 (2018).
59. Lengyel, E. Ovarian cancer development and metastasis. Am. J. Pathol. 177,1053–1064 (2010).
60. Sato, E. et al. High-grade serous ovarian cancer 3 years after bilateralsalpingectomy: a case report. Mol. Clin. Oncol. 6, 201–203 (2017).
61. Sato, T. et al. Single Lgr5 stem cells build crypt-villus structures in vitrowithout a mesenchymal niche. Nature 459, 262–265 (2009).
62. Sachs, N. et al. A Living Biobank of breast cancer organoids captures diseaseheterogeneity. Cell 172, 373–386 e310 (2018).
63. Bolger, A. M., Lohse, M. & Usadel, B. Trimmomatic: a flexible trimmer forIllumina sequence data. Bioinformatics 30, 2114–2120 (2014).
64. Dobin, A. et al. STAR: ultrafast universal RNA-seq aligner. Bioinformatics 29,15–21 (2013).
65. Liao, Y., Smyth, G. K. & Shi, W. featureCounts: an efficient general purposeprogram for assigning sequence reads to genomic features. Bioinformatics 30,923–930 (2014).
66. Love, M. I., Huber, W. & Anders, S. Moderated estimation of fold change anddispersion for RNA-seq data with DESeq2. Genome Biol. 15, 550 (2014).
67. Yu, G., Wang, L. G., Han, Y. & He, Q. Y. clusterProfiler: an R package forcomparing biological themes among gene clusters. OMICS 16, 284–287(2012).
AcknowledgementsWe thank Dr. Terry Van Dyke for sharing T121 mice, the PCC Experimental Pathology,Microscopy, GTC, and ABL shared resources (P30CA016087) for technical support, andDrs. Jiyuan Hu (Division of Biostatistics), Chan Wang (Division of Biostatistics), KwanHo Tang (PCC), and Victor Ho (Princess Margaret Cancer Center) for advice anddiscussion. Initial work on this project was supported by grant-MOP-191992 from theCanadian Institutes for Health Research to B.G.N., further funds were provided byCancer Center Core Grant P30 CA016087. D.A.L. is supported by the Department ofDefense Ovarian Cancer Research Program (W81XWH-15-1-0429), S.Z. was supportedby a post-doctoral fellowship from Ovarian Cancer Research Fund Alliance
Author contributionsS.Z. and B.G.N. designed the experiments, and S.Z. performed the majority of theexperiments. I.D. performed the computational analyses. T.Z. performed organoid cul-tures and immunostaining of some samples. H.R. assisted with superovulation and sal-pingectomy. B.G.N., S.Z., I.D. and D.A.L wrote the manuscript.
Competing interestsB.G.N. is a co-founder, holds equity in, and received consulting fees from NavirePharmaceuticals and Northern Biologics, Inc. He also is a member of the ScientificAdvisory Board, and receives consulting fees and equity from Avrinas, Inc, and is anexpert witness for the Johnson and Johnson ovarian cancer talc litigation. His spouse hasequity in Mirati Therapuetics, Amgen, Inc., Arvinas, Inc. and Array Biopharma. Theother authors declare no competing interests.
Additional informationSupplementary information is available for this paper at https://doi.org/10.1038/s41467-019-13116-2.
Correspondence and requests for materials should be addressed to S.Z. or B.G.N.
Peer review information Nature Communications thanks Hani Gabra, Viive Howell andthe other, anonymous, reviewer for their contribution to the peer review of this work.Peer reviewer reports are available
Reprints and permission information is available at http://www.nature.com/reprints
Publisher’s note Springer Nature remains neutral with regard to jurisdictional claims inpublished maps and institutional affiliations.
Open Access This article is licensed under a Creative CommonsAttribution 4.0 International License, which permits use, sharing,
adaptation, distribution and reproduction in any medium or format, as long as you giveappropriate credit to the original author(s) and the source, provide a link to the CreativeCommons license, and indicate if changes were made. The images or other third partymaterial in this article are included in the article’s Creative Commons license, unlessindicated otherwise in a credit line to the material. If material is not included in thearticle’s Creative Commons license and your intended use is not permitted by statutoryregulation or exceeds the permitted use, you will need to obtain permission directly fromthe copyright holder. To view a copy of this license, visit http://creativecommons.org/licenses/by/4.0/.
© The Author(s) 2019
ARTICLE NATURE COMMUNICATIONS | https://doi.org/10.1038/s41467-019-13116-2
16 NATURE COMMUNICATIONS | (2019) 10:5367 | https://doi.org/10.1038/s41467-019-13116-2 | www.nature.com/naturecommunications
Related Documents