Botany Appendix Appendix A – Lists of Species Recorded 2008-2012 Appendix B – Field Data Forms Appendix C – Vegetation Characterization Report Presott Creeks Preservation Association Watson Woods Riparian Preserve Restoration Project Final Report 233

Welcome message from author
This document is posted to help you gain knowledge. Please leave a comment to let me know what you think about it! Share it to your friends and learn new things together.
Transcript

Botany Appendix
Appendix A – Lists of Species Recorded 2008-2012 Appendix B – Field Data Forms
Appendix C – Vegetation Characterization Report
Presott Creeks Preservation Association Watson Woods Riparian Preserve Restoration Project Final Report
233

Appendix A – Lists of Species Recorded 2008-2012
List of herbs recorded during 2009-2012 monitoring, including their common names. Shrubs and tree seedlings are also included. Species listed by habit and native
status.Species Common name Acronym
Native perennials Achillea millefolium common yarrow ACMI
Ambrosia psilostachya Cuman ragweed AMPS Artemisia carruthii Carruth sagewort ARCA Aristida purpurea three-awn ARPU Artemisia carruthii Carruth wormwood ARTCAR Aristida divaricata poverty three-awn ARDI Aster lanceolatum
(Symphyotrichum lanceolatumvar. hesperium (A. Gray) G.L.
Nesom)Bouteloua curtipendula side-oats grama BOCU
Bouteloua gracilis blue grama BOGR Brickellia floribunda showy brickellia BRFL
Coryphantha vivipara spinystar COVI Cucurbita foetidissima buffalo-gourd CUFO Cyperus esculentus Yellow nutsedge CYSE
Datura wrightii Wright jimsonweed DAWR Elymus canadensis Canadian wildrye ELCAN
Elymus glaucus blue wildrye ELGL Eleocharis parishii Parish spikerush ELPAR
Eragrostis intermedia plains lovegrass ERIN Fallugina paradoxa Apache plume FAPA Hordeum jubatum foxtail barley HOJU
Juncus nevadensis Sierra rush JUNE Leptochloa dubia green sprangletop LEDU
Macharanthera canescens hoary-daisy MACA Melampodium leucanthum plains blackfoot MELE
Mentzelia multiflora blazing-star MEMU Muhlenbergia asperifolia stratchgrass MUAS
Muhlenbergia rigens deergrass MURI Oenothera cespitosa tufted evening primrose OECE
Oenothera elata Hooker evening primrose OEEL Pascopyrum smithii Western wheatgrass PASM
Sphaeralcea parviflora Arizona globemallow SPPA Sporobolus contractus spike dropseed SPCO
Sporobolus cryptandrus sand dropseed SPCR Sphaeralcea fendleri Fendler globe-mallow SPFE
Symphyotrichum lanceolatum ssp. herperium
white panicle aster SYLA
Thymophylla pentachaeta five-needle pricklyleaf THPE
Prescott Creeks Preservation Association Watson Woods Riparian Preserve Restoration Project Final Report
234
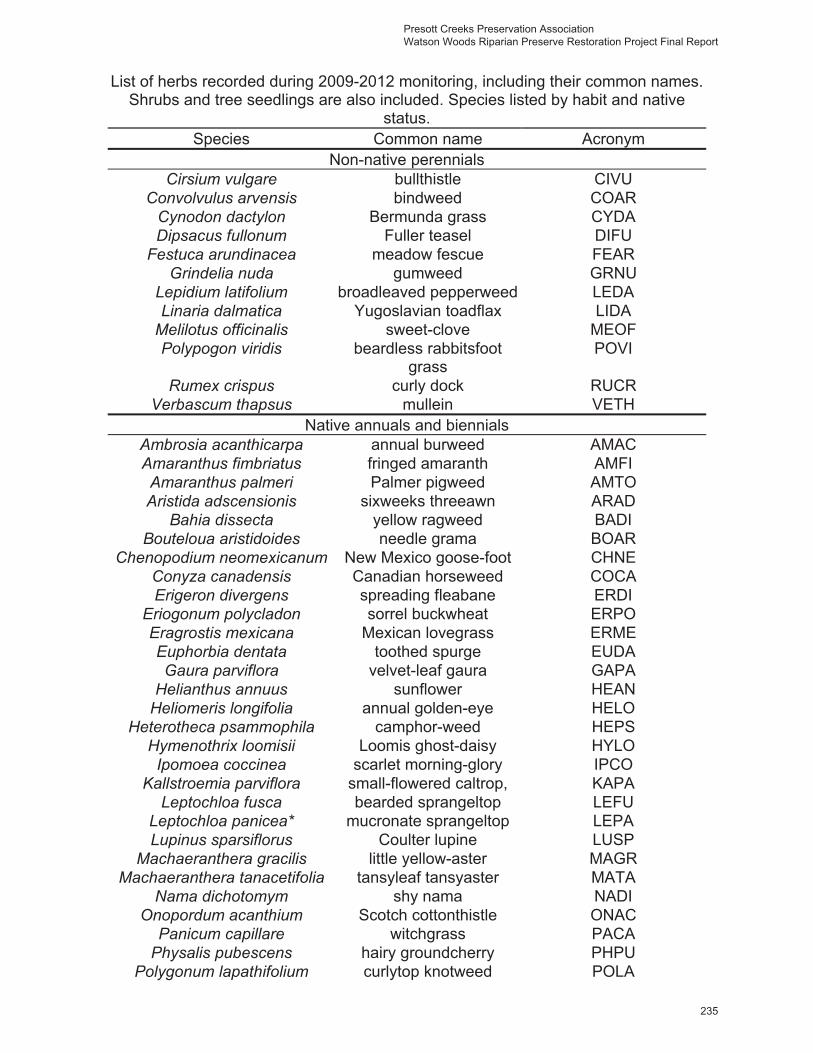
List of herbs recorded during 2009-2012 monitoring, including their common names. Shrubs and tree seedlings are also included. Species listed by habit and native
status.Species Common name Acronym
Non-native perennials Cirsium vulgare bullthistle CIVU
Convolvulus arvensis bindweed COAR Cynodon dactylon Bermunda grass CYDA Dipsacus fullonum Fuller teasel DIFU
Festuca arundinacea meadow fescue FEAR Grindelia nuda gumweed GRNU
Lepidium latifolium broadleaved pepperweed LEDA Linaria dalmatica Yugoslavian toadflax LIDA
Melilotus officinalis sweet-clove MEOF Polypogon viridis beardless rabbitsfoot
grassPOVI
Rumex crispus curly dock RUCR Verbascum thapsus mullein VETH
Native annuals and biennials Ambrosia acanthicarpa annual burweed AMAC Amaranthus fimbriatus fringed amaranth AMFI Amaranthus palmeri Palmer pigweed AMTO Aristida adscensionis sixweeks threeawn ARAD
Bahia dissecta yellow ragweed BADI Bouteloua aristidoides needle grama BOAR
Chenopodium neomexicanum New Mexico goose-foot CHNE Conyza canadensis Canadian horseweed COCA Erigeron divergens spreading fleabane ERDI
Eriogonum polycladon sorrel buckwheat ERPO Eragrostis mexicana Mexican lovegrass ERME Euphorbia dentata toothed spurge EUDA Gaura parviflora velvet-leaf gaura GAPA
Helianthus annuus sunflower HEAN Heliomeris longifolia annual golden-eye HELO
Heterotheca psammophila camphor-weed HEPS Hymenothrix loomisii Loomis ghost-daisy HYLO Ipomoea coccinea scarlet morning-glory IPCO
Kallstroemia parviflora small-flowered caltrop, KAPA Leptochloa fusca bearded sprangeltop LEFU
Leptochloa panicea* mucronate sprangeltop LEPA Lupinus sparsiflorus Coulter lupine LUSP
Machaeranthera gracilis little yellow-aster MAGR Machaeranthera tanacetifolia tansyleaf tansyaster MATA
Nama dichotomym shy nama NADI Onopordum acanthium Scotch cottonthistle ONAC
Panicum capillare witchgrass PACA Physalis pubescens hairy groundcherry PHPU
Polygonum lapathifolium curlytop knotweed POLA
Presott Creeks Preservation Association Watson Woods Riparian Preserve Restoration Project Final Report
235

List of herbs recorded during 2009-2012 monitoring, including their common names. Shrubs and tree seedlings are also included. Species listed by habit and native
status.Species Common name Acronym
Polanisia dodecandra western clammy-weed POLDOD Salvia reflexa lanceleaf sage SARE
Veronica anagallis-aquatica* water speedwell VEAN Veronica peregrina neckweed VEPE
Verbesina encelioides VERENC Non-native annuals and biennials
Amaranthus blitoides mat amaranth AMBL Brassica campestris field mustard BRCA
Bromus diandrus ripgut grass BRDI Bromus japonicus Japanese brome BRJA Centaurea stoebe spotted knapweed CEST Chloris virgata** windmill grass CHVI
Cyperus esculentus yellow nutsedge CYES Echinochloa crus-galli barnyard grass ECCR Eragrostis cilianensis stinking lovegrass ERCIL
Kochia scoparia summer-cypress, kochia KOSC Lactuca serriola prickly lettuce LASE
Polygonum aviculare prostrate knotweed POAV Polypogon monspeliensis rabbitfoot grass POMO
Portulacca oleracea purslane POOL Salsola tragus Russian-thistle SATR
Solanum rostratum buffalo-bur SORO Sonchus oleraceus common sowthistle SOOL Tribulus terrestris goat-heads, puncture-vine TRTE
* perennial in some habitats, ** Native to the US according to the USDA but apparently introduced to waste places in our area (Kearny and Peebles)
Prescott Creeks Preservation Association Watson Woods Riparian Preserve Restoration Project Final Report
236
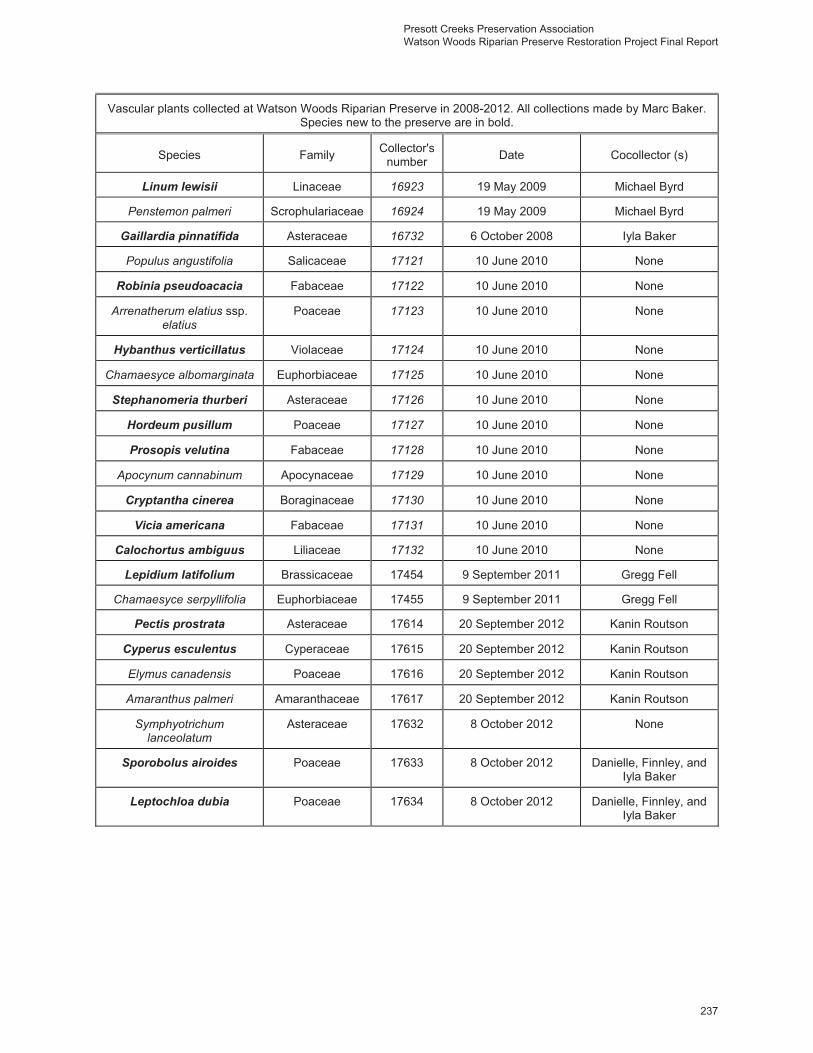
Vascular plants collected at Watson Woods Riparian Preserve in 2008-2012. All collections made by Marc Baker. Species new to the preserve are in bold.
Species Family Collector's number Date Cocollector (s)
Linum lewisii Linaceae 16923 19 May 2009 Michael Byrd
Penstemon palmeri Scrophulariaceae 16924 19 May 2009 Michael Byrd
Gaillardia pinnatifida Asteraceae 16732 6 October 2008 Iyla Baker
Populus angustifolia Salicaceae 17121 10 June 2010 None
Robinia pseudoacacia Fabaceae 17122 10 June 2010 None
Arrenatherum elatius ssp.elatius
Poaceae 17123 10 June 2010 None
Hybanthus verticillatus Violaceae 17124 10 June 2010 None
Chamaesyce albomarginata Euphorbiaceae 17125 10 June 2010 None
Stephanomeria thurberi Asteraceae 17126 10 June 2010 None
Hordeum pusillum Poaceae 17127 10 June 2010 None
Prosopis velutina Fabaceae 17128 10 June 2010 None
Apocynum cannabinum Apocynaceae 17129 10 June 2010 None
Cryptantha cinerea Boraginaceae 17130 10 June 2010 None
Vicia americana Fabaceae 17131 10 June 2010 None
Calochortus ambiguus Liliaceae 17132 10 June 2010 None
Lepidium latifolium Brassicaceae 17454 9 September 2011 Gregg Fell
Chamaesyce serpyllifolia Euphorbiaceae 17455 9 September 2011 Gregg Fell
Pectis prostrata Asteraceae 17614 20 September 2012 Kanin Routson
Cyperus esculentus Cyperaceae 17615 20 September 2012 Kanin Routson
Elymus canadensis Poaceae 17616 20 September 2012 Kanin Routson
Amaranthus palmeri Amaranthaceae 17617 20 September 2012 Kanin Routson
Symphyotrichum lanceolatum
Asteraceae 17632 8 October 2012 None
Sporobolus airoides Poaceae 17633 8 October 2012 Danielle, Finnley, and Iyla Baker
Leptochloa dubia Poaceae 17634 8 October 2012 Danielle, Finnley, and Iyla Baker
Presott Creeks Preservation Association Watson Woods Riparian Preserve Restoration Project Final Report
237

App
endi
x B
– F
ield
Dat
a Fo
rms
Fiel
d da
ta fo
rm fo
r the
Wat
son
Woo
ds R
esto
ratio
n P
roje
ct: R
ipar
ian
line
inte
rcep
t tra
nsec
ts (a
zflo
ra/w
atso
n_w
oods
_200
9/da
ta/ri
paria
n_tra
nsec
t_lin
e_in
terc
ept.d
oc)
____
____
____
_beg
inni
ng _
____
____
____
mE
___
____
____
__m
N, e
ndin
g __
____
____
__m
E __
____
____
___M
n
NA
D83
Tran
sect
leng
th _
____
___c
m
Dat
e:
2009
Tech
nici
ans:
Mar
c B
aker
, Mic
hael
Byr
d
TS
p H
In
O
t S
p H
In
O
t S
p H
In
O
t S
p H
In
O
t S
p H
In
O
t S
p H
In
O
t S
p H
In
O
t S
p T
L S
p T
L 1
2
3
4
5
6
7
8
9
10
11
12
13
14
15
16
17
18
19
20
Intercep
t�data�in�cm.�G
aps�less�than�10
�cen
timeters�a
re�igno
red.�Record�layers�fo
r�each�species�a
long�th
e�tape
.�Maxim
um�height�is�
measured�directly�over�the
�tape
;�size
�classes:�1�=���0.5�m
,�2�=���1.0�m
,�3�=���2.0�m
,�4�=���5.0�m
,�5�=���10.0�m,�6�=�>10.0�m
.�Pale�gray�
columns
forsurvivorship2m
widebe
lttransects,T=To
talind
s.forsp,L=No.liveinds.
Pre
scot
t Cre
eks
Pre
serv
atio
n A
ssoc
iatio
n W
atso
n W
oods
Rip
aria
n P
rese
rve
Res
tora
tion
Pro
ject
Fin
al R
epor
t
238

Sp
H
In
Ot
Sp
H
In
Ot
Sp
H
In
Ot
Sp
H
In
Ot
Sp
H
In
Ot
Sp
H
In
Ot
Sp
H
In
Ot
Sp
T L
Sp
T L
21
22
23
24
25
26
27
28
29
30
31
32
33
34
35
36
37
38
39
40
Not
es: S
=SA
LAS
, X=S
AE
X, E
=SAL
AE
, F=P
OFR
, H=P
OH
I
Pre
sott
Cre
eks
Pre
serv
atio
n A
ssoc
iatio
n W
atso
n W
oods
Rip
aria
n P
rese
rve
Res
tora
tion
Pro
ject
Fin
al R
epor
t
239

Field data form for the Watson Woods Restoration Project: Riparian line intercept transects, herbaceous layer DATE:
__________________beginning _____________mE _____________mN, ending ____________mE _____________mN
Herbaceous Species Perennial Cover Annual Cover
T Sp. 1
Cvr
. 1
Sp. 2
Cvr
. 2
Sp. 3
Cvr
. 3
Sp. 4
Cvr
. 4
Sp. 5
Cvr
. 5
Sp. 1
Cvr
. 1
Sp. 2
Cvr
. 2
Sp. 3
Cvr
. 3
Sp. 4
Cvr
. 4
Sp. 5
Cvr
. 5
Sp. 6
Cvr
. 5
Sp.7
Cvr
.7
Sp. 8
Cvr
.8
1 2 3 4 5 6 7 8 9 10 11 12 13 14 15 16 17 18 19 20 21 22 23 24 25 26 27 28 29 30
Prescott Creeks Preservation Association Watson Woods Riparian Preserve Restoration Project Final Report
240

Vegetation characterization of the Watson Woods Riparian Preserve, Prescott, Arizona
Part 3: A comparison of changes in estimates of foliar-height
density and in species diversity since 1997 and 2005 and changes values of parameters from point-
center-quarter sampling since 2005.
Marc Baker
Final Report Draft 1
1 November 2012
Presott Creeks Preservation Association Watson Woods Riparian Preserve Restoration Project Final Report
241
Appendix C - Vegetation Characterization Report

i
Abstract
In fall 2012, vegetation within the Watson Woods Riparian Preserve, Prescott Arizona, was characterized by estimating foliar height distribution (FHD), cover of perennial and annual herbs, and density of trees and shrubs. In addition, vegetation associations were digitally mapped and a checklist of vascular plant taxa was made. The primary goal of the study was to compare estimates with those made in 1997 and 2005. Mean FHD among transects, as measured in meters, remained constant (2.34 m³/m²) between fall 2005 and fall 2012.Although mean FHD, as measured in decimeters increased slightly in 2012 (1.34 m³/m² from 1.28 m³/m²), the increase was not statistically significant. Between 1997 and 2012, FHD increased markedly for six species:
� Festuca arundinacea, is an exotic perennial grass; � Salix exigua, and S. lasiolepis, are desirable native shrubs; � Populus angustifolia, P. ×hinckleyana, are desirable native trees; and
Ulmus pumila, is an undesirable exotic and highly invasive tree.
There was slight but statistically insignificant increase in mean maximum height among all transects between 1997 (5.92m) and 2005 (7.59m) and between 2005 and 2012. Total absolute density of woody perennials more than doubled for riparian species between 2005 (204 individuals per ha) and 2012 (416.5 individuals per ha), and nearly doubled for non-riparian perennials (59.2 vs 92.2 individuals per ha). Estimates for average canopy cover increased between fall 2005 and fall 2012, with riparian species increasing from 25.4% in 2005 to 31.9% in 2012. Similarly, average canopy cover for non-riparian species jumped from 8.4% in 2005 to 20.4% in 2012. Specimens were made of approximately 15 previously undocumented taxa. Riparian woodland was the dominate vegetation type in 2012, representing a nearly 10% increase over fall 2005. There were notable increases in both ds of Fallugia paradoxa and Chrysothamnusnauseosus scrub. Areas of disturbed perennial and grassland both fell between 2005 and 2012. There were no significant areas of emergents or Dipsacusfullonum in 2012.
Prescott Creeks Preservation Association Watson Woods Riparian Preserve Restoration Project Final Report
242

ii
Table of Contents
Abstract .......................................................................................................................i Introduction ............................................................................................................... 1
Methodology.............................................................................................................. 2
Results ....................................................................................................................... 6
Vegetation Sampling ............................................................................................... 6
Transect method ............................................................................................... 6
Foliar height density .................................................................................. 6
Percent cover of annuals ......................................................................... 15
Point Center Quarter method ......................................................................... 16
Floristics ............................................................................................................... 33
Vegetation Mapping .............................................................................................. 34
Discussion and conclusions.................................................................................. 37
Literature cited ........................................................................................................ 38
TablesTable 1. Locations of transects with respect to nearest reference point ................ 4
Table 2. Maximum height, average height and average foliage-height density
(FHD), by transect, for 1997 and 2005 sampling .............................................. 8
Table 3. Maximum height, average height and average foliage-height density
(FHD), by transect, for 2012 sampling ............................................................ 9
Table 4. Changes in vegetation association and average total FHD for each
transect between 1997 and 2005 sampling . .................................................. 10
Table 5. Changes in vegetation association and average total FHD (by meter)
for each transect between 2005 and 2012 sampling ..................................... 11
Table 6. Maximum height, average height, average foliage-height density
(FHD), and total FHD, by reference reach transect, 2005 .............................. 12
Table 7. Average percent cover of annuals, by transect, for 1997, 2005, and
2012 sampling.. .............................................................................................. 15
Table 8. Summary of Riparian Woody Perennial PCQ data for the September
2005 sampling in the Watson Woods Preserve .............................................. 16
Presott Creeks Preservation Association Watson Woods Riparian Preserve Restoration Project Final Report
243

iii
Table 9. Summary of Riparian Woody Perennial PCQ data for the September
2012 sampling in the Watson Woods Preserve .............................................. 17
Table 10. Summary of non-riparian woody perennial PCQ data for the
September 2005 sampling in the Watson Woods Preserve. .......................... 18
Table 11. Summary of non-riparian woody perennial PCQ data for the
September 2012 sampling in the Watson Woods Preserve. ... ...................... 19
Table 12. Summary of average distance from PCQ point for woody species, by
plot ................................................................................................................. 23
Table 13. Summary of average percent cover for riparian and non-riparian
perennial herbs .............................................................................................. 24
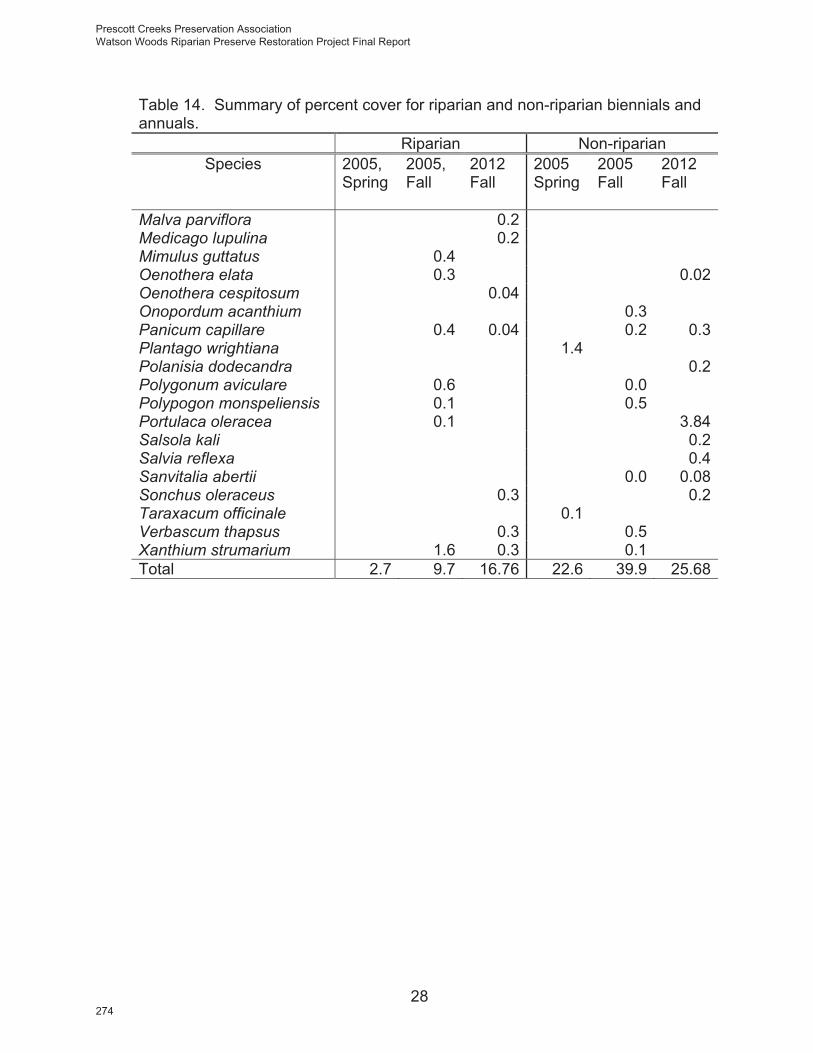
Table 14. Summary of percent cover for riparian and non-riparian biennials
and annuals. ................................................................................................... 27
Table 15. Summary of percent cover of perennials from PCQ points, by plot.... .. 31
Table 16. Summary of percent cover of annuals from PCQ points, by plot .......... 32
Table 17. List of year 2005 vascular plant collections made within Watson
Woods Riparian Preserve .............................................................................. 33
Table 19. Descriptions of vegetation types recorded during 2005 and 2102. ................. 35
Table 20. Total estimated areas for vegetation types within the Watson Woods
Riparian Preserve, 2005 and 2012....................................................................... 35
FiguresFigure 1. Comparison of average FHD (as measured by meters), by transect,
for September 1997, September 2005, and September 2012. ....................... 12
Figure 2a. Total hits FHD (by meters) of perennials for all transects, by
species A-L .................................................................................................... 13
Figure 2b. Total hits FHD (meters) of perennials for all transects, by species
M-Z ................................................................................................................. 14
Figure 3. Comparison of the absolute densities of riparian woody perennials
between September 2005 and September 2012 ............................................ 20
Figure 4. Comparison of the absolute densities of upland woody perennials
between September 2005 and September 2012 ............................................ 21
Figure 5. Average percent cover for perennial herbs as estimated with PCQ
Prescott Creeks Preservation Association Watson Woods Riparian Preserve Restoration Project Final Report
244

iv
method for riparian and non-riparian samplings made in the spring and fall
of 2005 and the fall of 2012 ............................................................................ 26
Figure 6a. Average percent cover for annual and biennial herbs (A-K) as
estimated with PCQ method for riparian and non-riparian samplings made
in the spring and fall of 2005 and the fall of 2012 ........................................... 29
Figure 6b. Average percent cover for annual and biennial herbs (L-Z) as
estimated with PCQ method for riparian and non-riparian samplings made
in the spring and fall of 2005 and the fall of 2012 ........................................... 30
Figure 7. 2012 vegetation map of Watson Woods Riparian Preserve. ................. 36
Appendix 1. Field forms Form 1. Field data form for the Watson Woods Restoration Project: Riparian
line intercept transects ................................................................................... 39
Form 2. Field data form for the Watson Woods Restoration Project: Riparian
line intercept transects, herbaceous layer. ..................................................... 40
Appendix 2. Reference point photos ..................................................................... 42 Appendix 3. Transect photos for 1997, 2005, and 2012 ....................................... 44 Appendix 4. FHD graphs, by transect, for 1997, 2005, and 2012 ........................ 62 Appendix 5. Graphs of annual cover, by transect for 1997, 2005, and 2012 ..... 88 Appendix 5. Decimal degree WGS84 and UTM (Zone 12, UTM, NAD83)
coordinates for FHD transects .................................................................. 113
Presott Creeks Preservation Association Watson Woods Riparian Preserve Restoration Project Final Report
245
1
Introduction
The Watson Woods Riparian Preserve is located toward the northeastern edge of Prescott, Arizona, just east of State Highway 89 (Fig 1). Its boundaries roughly parallel and include a section of Granite Creek between Watson Lake, to the north, and what was once the Whipple Military Reservation, to the south (now owned by the Yavapai Nation and the Department of Veterans Affairs Medical Center). The 125 acre preserve is comprised of a flood plain dissected by anastomosing channels of the intermittent Granite Creek. The alluvium of the flood plain is composed mainly of granitic and basaltic silts, sands, and gravels. Some sandstone has been imported as fill for the now abandoned railroad. Although much of the substrate retains evidence of disturbance from historical mining of sand and gravel, some has remained stable long enough to allow young wooded and perennial grassland areas to form as a sparse mosaic throughout the flood plain. There is a small pond at the north end of the Preserve that often dries up during the late spring-early summer. A small portion of the Preserve along the floodplain consists of dry slopes supporting disclimax grassland, chaparral, and juniper-piñon pine woodland. In June of 1997, a large fire occurred within the largest portion of woodland and many of the larger trunks were killed. Another fire in 2005 burned approximately three acres of the same area. In 1997/1998, the vegetation within the Preserve was characterized by estimating foliar height density (FHD, also referred to as foliar height distribution and foliar height diversity) for perennial species, estimating percent cover for annual species, mapping plant associations, and cataloguing vascular plant taxa. It was the intent of the present study to repeat the 1997/1998 sampling in order to record changes in vegetation and introduce sampling by Point-Center-Quarter (PCQ) in order to estimate additional parameters, such as tree and shrub density, and to compare the advantages and disadvantages of PCQ with those of FHD.
Prescott Creeks Preservation Association Watson Woods Riparian Preserve Restoration Project Final Report
246

2
Methods
Vegetation sampling
The primary objectives of the 2012 vegetation sampling were to estimate changes since 2005 for foliar-height density (FHD) of perennial vegetation and cover of annuals along the FHD transects. Because the Point Center Quarter Method (PCQ) was introduced in 2005, objectives of this study also included estimates in changes since that time in values of parameters associated with PCQ samples, which included densities of shrubs and trees; percent canopy cover; and cover of annuals and perennial herbs.
Transect method
Vegetation sampling using transects was conducted within one month of the period of the highest average rainfall for central Arizona (Bulk 1985). In September of 1997 twenty-six 40m transects were established, including one along the creek channel near the northwestern corner of the preserve (Table 1). In September 2005 the sampling was repeated with the exception of one transect that had been buried by construction of the Prescott Lakes Parkway Bridge and another that had been inundated by the swelling of the pond at the north end to the Preserve. The latter was relocated as a straight transect to the east-southeast of the pond. Foliar height density was estimated as the total number hits, by taxon, at each of 20 points along each transect. This parameter is very similar to vegetation volume. The method is a modified version of the vertical-line intercept of MacArther & Horn (1969) and vegetation volume of Mills et al. (1991). FHD estimation was chosen over the line intercept method because the latter estimates vegetation cover only and does not account for vegetation height or structure within the canopy. Both Total FHD and total vegetation volume (the sum total of cubic decimeters within the site boundaries that contain vegetation) correlate closely with breeding bird densities (Mills et al. 1991), which is a primary management concern for the preserve. For the purposes of this report, FHD is treated synonymously with VV and the FHD data are presented as m³/m². For example, if a ground cover was sampled at every point along a transect within the first meter of the vertical pole, then it would constitute 1 m³/m² (20 hits/ 20 points). If a tree was sampled at every point along a transect from meter one to meter three of the vertical pole, then it would constitute 3 m³/m² (60 hits/ 20 points). Data measured by decimeters are simply more accurate and are nearly always less than those measured to the nearest meter. For example, if the ground cover from the first example reached only .5m tall on the average, then its FHD or VV as measured in dm would be only 0.5 m³/m² (100 hits/10 hits per m/ 20 points) Transects were relocated using the seven reference points established in 1997; four at well sites and three at fence posts. All reference points were photographed in both 1997 and in 2005 (Appendix 2). In 1997, starting points for all transects were fixed by measuring their distance and direction from a specified reference point (Table 1). In 2005, Universal Transverse Mercator (UTM) coordinates using the zone 12, NAD27 grid (datum of the most recent USGS 7.5’
Presott Creeks Preservation Association Watson Woods Riparian Preserve Restoration Project Final Report
247

3
topographic quadrangle) were recorded to the nearest 5m for all of the reference points and transect starting points. In 2012, FHD transect start, middle, and end points were recorded to within 1m using decimal degrees, WGS84 (Appendix 6), which obsoleted the reference points. Most transects continued in the same direction along the determined heading (from reference point) for 20m and then proceed perpendicular for another 20m to the right. Each starting, pivot, and ending point was marked in 1997 with rebar. Rebar was not placed in water-saturated soil or within stream bottoms. Two transects continued without the 90° bend for 40m along the eastern edge (toe zone) of the bank of Granite Creek. Five reference reach transects were non-randomly located and sampled during spring 2006 within the portions of the Preserve that possessed, based on 1997 data, the apparent oldest, highest density, and diversity of native species; lowest density and diversity of exotic species; and most apparent stability in terms of geomorphic characters (Moody 2006). Two transects were located along toe zone of Granite Creek, which affectively sampled vegetation within the canopy from the toe and bank zones. A single transect was located within the low to high overbank zone (suitable habitat was lacking for a second transect in this zone) and two transects were located within the transition zone (upland habitat).
Foliar height-density
Measurements were taken every two meters along the transect beginning with meter two, where a nine meter graduated collapsible pole was set vertically and living perennial vegetation within 1dm of the pole was recorded, by species, in height increments of 1m (see field data form 1, Appendix 1). Thus for each 40m transect, FHD was sampled within twenty cylinders with a radius of 1dm. FHD was calculated for each transect, by taxon, as the number of hits of each taxon divided by the number of transect points (20). Total FHD for each taxon was simply the sum of FHD hits for each taxon of all transects. Total FHD for all taxa, by transect, was the sum of all hits along each transect, and estimated average total FHD for the Preserve was the average of Total FHD, by transect.
Prescott Creeks Preservation Association Watson Woods Riparian Preserve Restoration Project Final Report
248
4
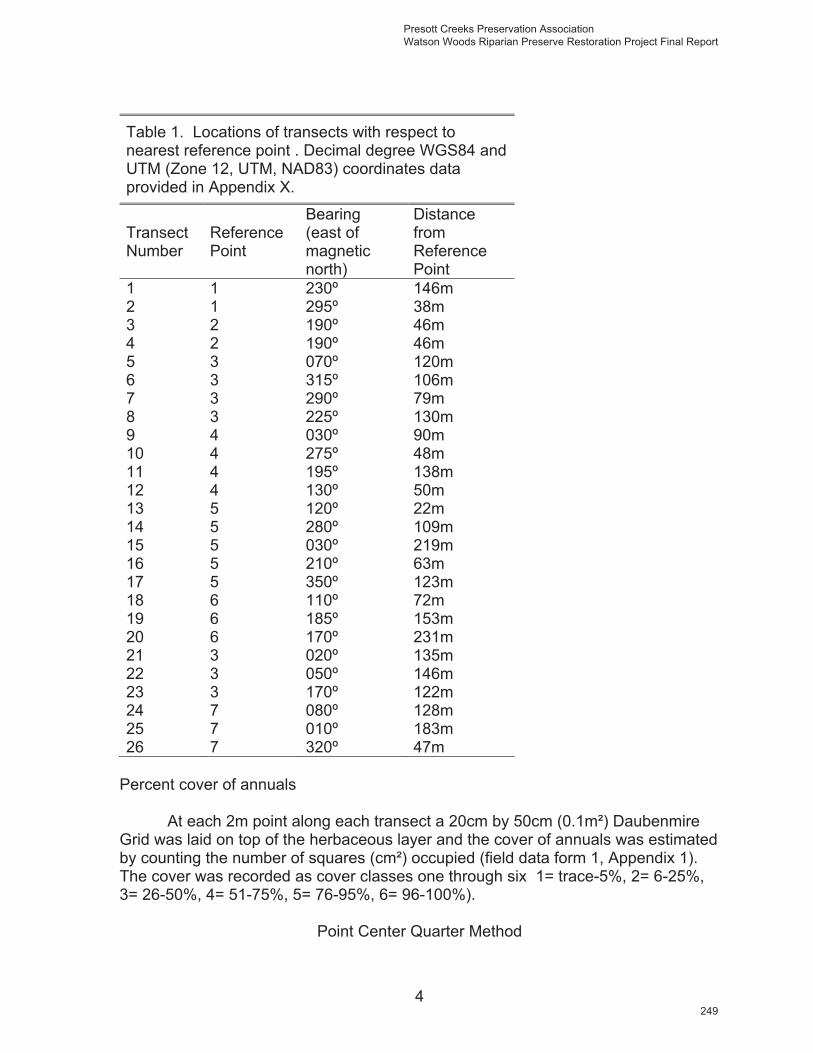
Table 1. Locations of transects with respect to nearest reference point . Decimal degree WGS84 and UTM (Zone 12, UTM, NAD83) coordinates data provided in Appendix X.
TransectNumber
ReferencePoint
Bearing(east of magneticnorth)
DistancefromReferencePoint
1 1 230º 146m 2 1 295º 38m 3 2 190º 46m 4 2 190º 46m 5 3 070º 120m 6 3 315º 106m 7 3 290º 79m 8 3 225º 130m 9 4 030º 90m 10 4 275º 48m 11 4 195º 138m 12 4 130º 50m 13 5 120º 22m 14 5 280º 109m 15 5 030º 219m 16 5 210º 63m 17 5 350º 123m 18 6 110º 72m 19 6 185º 153m 20 6 170º 231m 21 3 020º 135m 22 3 050º 146m 23 3 170º 122m 24 7 080º 128m 25 7 010º 183m 26 7 320º 47m
Percent cover of annuals
At each 2m point along each transect a 20cm by 50cm (0.1m²) Daubenmire Grid was laid on top of the herbaceous layer and the cover of annuals was estimated by counting the number of squares (cm²) occupied (field data form 1, Appendix 1).The cover was recorded as cover classes one through six 1= trace-5%, 2= 6-25%, 3= 26-50%, 4= 51-75%, 5= 76-95%, 6= 96-100%).
Point Center Quarter Method
Presott Creeks Preservation Association Watson Woods Riparian Preserve Restoration Project Final Report
249

5
The Point Center Quarter Method, as described by Krebs (1998) was conducted both in the spring and fall 2005 to estimate density of woody individuals, by species; and modified to estimate annual plant cover, perennial plant cover, height of woody individuals, and percent canopy cover (field data form 2, Appendix 1). Two subplots were sampled, one representing vegetation along the perennial water channel and the other representing the non-channel vegetation. Fifty non-permanent points were selected randomly within each of the two subplots by acquiring X:Y coordinates from a table of random numbers (Elzinga et al. 1998).The ranges of coordinates were determined from a UTM grid overlay of the study area. Points within 50m of any other previously chosen point were re-constructed. Coordinates of the sampling sites were then downloaded into a GPS unit and points were visited parsimoniously using the "nearest waypoint" function. Tree and shrub density was estimated by measuring the distance from the point to the nearest individual in each quarter. Total absolute density of individuals (the density of all woody species) was calculated using the following equation: (individuals/ha) = (10,000m²/ha)/ (mean)², where the mean is the sum of all distances divided by the total number of quadrates (4 times the number of points). Relative density, by species, was calculated by dividing the number of hits for a particular species counted by the total number of quadrates. The absolute density for any one species was calculated by multiplying its relative density times total absolute density. Cover of perennial and annual plants was estimated with the Daubenmire Grid at the base of each point. Percent canopy cover was estimated using a clear Plexiglass® square marked with randomly distributed black dots. Percent cover was simply calculated as the number of dots covered by canopy per 100 counts.
Vegetation mapping
Vegetation was mapped May-September 1997 using the relative cover occurrence of the dominant plant species (see Munz & Keck 1949-1950, Whittaker 1962). The method follows traditional approaches to vegetation mapping in Arizona (Brown et al. 1979, Warren et al. 1982). Procedure generally followed that of Kuchler's comprehensive method (Kuchler 1967) and Braun-Blanquet's table method (see Ellenberg 1956). Mapping resolution was ca. 5m. The approach used in 2005 made use of GIS technology that was unavailable to the author in 1998. WWRP was visited on three separate occasions and over 300 waypoints were entered into a Garmin® GPS unit. For each waypoint, a tree or shrub species, or a floristic cover designation was recorded, such as annual disturbed, perennial disturbed, or grassland. GPS data were then downloaded using IGage® software and used to create an ArcGIS® shapefile. Field data were added to the shapefile by importing the database portion of the shapefile into Excel®. The spreadsheet was then pasted into the annotation editor of ALL TOPO V7®, converted from NAD27 to State Plane, and exported back into an Arcview® shapefile. The new shapefile was then overlaid onto the winter and summer WWRP ortho-rectified digital aerial photographs to aid in the creation of a shapefile composed of polygons.
Prescott Creeks Preservation Association Watson Woods Riparian Preserve Restoration Project Final Report
250

6
Floristics
The study site was visited in early spring, late spring/early summer before monsoon rains, and late summer/early fall after monsoon rains. If possible, at least two collections were made from reproductive individuals of all new or previously uncollected plant taxa encountered. Specimens were processed on site using a 12" X 18" field press and later rearranged and repressed using a standard herbarium press. Presses were placed within a well-ventilated plant press dryer. Field notes for included elevation, locality data (including both latitude/longitude [decimal degrees WGS84] and the NAD83, Zone 12, Universal Transverse Mercator [UTM] grid system), name of USGS 7.5' quadrangle, distances from major landmarks, date, collection number, substrate type, community type, frequency of individuals, and plant associates. In addition, a record was made of characteristics of the plant that would not be apparent after the specimen was pressed and dried. Photographs were taken for most collections, including views of habitat and close-ups of flowers and/or fruits. Duplicate specimens were deposited variously in the following public herbaria: Northern Arizona University (ASC), Arizona State University (ASU), Yavapai College (YCH), and institution of the taxonomic specialist. For each collection, at least one duplicate was mounted for the Prescott Creeks herbarium with MO type glue on U/C type 11.5 × 16.5in herbarium mounting paper. Fragment packets and labels were made of 100% cotton, acid-free paper and affixed with acid-free adhesive.
Results
Vegetation sampling
Foliar height density (FHD)
Overall mean FHD among transects remained constant between 2005 and 2012 at 2.34 m³/m² (Tables 2 and 3). As measured in dm, there was a slight increase from 1.28 m³/m² in 2005 to 1.34 m³/m² in 2012. Analysis of variance (ANOVA) indicated the difference was not significant (p = .85). The difference between the means of transects within disturbed areas between 2005 and 2012 was obviously insignificant (see transects 1, 7, 9, 12, 14, 16, 17, 18, 21, and 25 in Appendix 4). Only transects 9 and 18 showed marked signs of an increase in woody species. Among all transects, two showed positive changes from highly disturbed or dominated by exotic invasives to dominated by natives, Transect 1 and 18, while two showed negative changes, Transect 7 and 13 (Table 5). Five transects had a change of dominant woody species. FHD values by year, by transect, are presented in figure 1. In 2005 mean FHD among transects increased from 1.49 m³/m² in 1997 to 2.34 m³/m² in 2005, an overall increase of 57% (Tables 2 and 3, fig. 1). In general, the areas that were most disturbed in 1997 had the highest percent change in FHD (Table 4). Analysis of variance (ANOVA) indicated a significant difference between the means of the two trials (p = 0.062). The difference between the means of
Presott Creeks Preservation Association Watson Woods Riparian Preserve Restoration Project Final Report
251

7
transects within disturbed areas (transects 7, 9, 14, 15, 16, 17, 18, 21, 23. and 25) for the two trials was significant (p = 0.010), while the difference between means for transects within relatively undisturbed areas was not significant (p = 0.273). Mean FHD for the five transects along the reference reaches (2006) was 8.51 (Table 6). Mean maximum height among transects increased slightly between 2005 (7.59 m) and 2012 (8.96 m) (p = 1.0). Although mean maximum height among transects increased more dramatically between 1997 (5.92 m) and 2005, ANOVA indicated that there was no significant difference between the means of the two trials (p = 0.248). Similarly, mean average height among transects increased from 2.17m per transect point in 1997 to 2.61m in 2005 but the difference was not significant (p = 0.334). For transects located within disturbed areas, however, the means were significant between 1997 and 2005 (p = 0.015). The exotic perennial grass, Festuca arundinacea, had a noticeable gain in estimated FHD between 2005 and 2012, and to a lesser extent, there were gains in the estimate FHDs for Populus angustifolia, P. ×hinckleyana, Salix exigua, and S.lasiolepis, while that for Ulmus pumila had a decrease (Figures 2a and 2b).
Prescott Creeks Preservation Association Watson Woods Riparian Preserve Restoration Project Final Report
252

8
Table 2. Maximum height, average height and average foliage-height density (FHD), by transect, for 1997 and 2005 sampling. 2005 data given for hits as decimeters and as meters. ND = no data available. Shaded transects represent those of highly disturbed areas that were lacking or nearly lacking in FHD of shrubs or trees in 1997. September 1997
(measured by meters)September 2005
(measured by meters)September 2005
(measured by decimeters)
Transectnumber
Max. Ht.(m)
Ave.Ht*(m)
Ave.FHD
Max. Ht.(m)
Ave.Ht*(m)
Ave.FHD
Max. Ht.(m)
Ave.Ht*(m)
Ave.FHD
1 7 0.65 0.40 14.0 4.1 2.85 13.5 3.64 1.662 9 2.20 1.60 11.0 4.7 2.30 10.6 4.22 1.133 14 8.35 4.65 18.0 11.85 6.45 18.0 11.66 5.574 7 1.85 1.75 9.0 2.85 3.45 8.8 2.40 1.665 1 0.50 0.60 ND ND ND ND ND ND6 15 10.95 6.90 17.0 10.6 5.50 17.0 10.42 3.957 4 0.65 0.65 9.0 1.3 1.25 8.9 0.95 0.468 9 3.90 2.85 7.0 4.5 3.35 7.0 4.10 2.059 1 0.15 0.15 2.0 0.6 0.70 2.0 0.33 0.2410 5 1.25 1.65 6.0 1.4 1.85 5.8 0.71 0.6011 5 1.30 1.30 6.0 2.2 2.30 5.6 1.78 0.9412 1 0.20 0.20 8.0 1.2 1.85 7.5 0.64 0.7913 7 2.70 1.55 8.0 2.5 1.95 8.0 2.05 0.8414 1 0.65 0.80 18.0 3.3 3.40 18.0 2.95 2.0515 11 2.25 1.45 4.0 1.1 1.70 3.5 0.63 0.5516 2 0.80 1.10 5.0 1.35 1.50 5.0 0.85 0.6617 1 0.50 0.55 8.0 1.3 1.55 7.4 0.84 0.7618 1 0.80 1.15 1.0 0.85 1.10 0.8 0.40 0.4719 16 7.25 2.50 12.0 4.9 2.45 11.5 4.35 1.3720 2 1.10 1.40 8.0 3.45 3.25 7.1 2.98 1.5621 1 0.05 0.05 2.0 0.5 0.70 1.1 0.29 0.3022 4 1.15 1.30 7.0 1.9 2.40 6.4 1.23 1.1723 0 0.00 0.00 1.0 0.35 0.45 1.0 0.20 0.2924 17 1.75 0.35 2.0 1.1 1.60 1.5 0.36 0.2725 1 0.45 0.50 1.0 0.85 1.15 0.8 0.31 0.3926 12 5.05 3.45 13.0 7.3 3.50 13.0 6.92 2.22
Meanamong
transects5.92 2.17 1.49 7.88 3.04 2.34 7.59 2.61 1.28
*Average height is the sum of the maximum heights for all transect points divided by the number of points (20)
Presott Creeks Preservation Association Watson Woods Riparian Preserve Restoration Project Final Report
253

9
Table 3. Maximum height, average height and average foliage-height density (FHD), by transect, for 2012 sampling. Data presented in hits as both decimeters and meters. ND = no data available. p =.988 m, .846 dm September 2012
(measured by meters)September 2012
(measured by decimeters)
Transectnumber
Max. Ht.(m)
Ave.Ht*(m)
Ave.FHD
Max. Ht.(m)
Ave.Ht*(m)
Ave.FHD
1 13 3.4 1.95 12.8 3.21 1.182 15 8.9 4.5 14.8 8.3 2.313 20 13.6 5.35 19.5 13.1 4.224 15 2.95 3.7 14.2 2.5 2.416 20 10.85 5 19.2 10.34 3.157 9 0.8 0.45 8.3 0.49 0.268 9 2.7 2.05 2.23 9 1.089 3 0.95 1.05 3 0.625 0.4710 3 1.45 1.55 2.8 0.98 0.7711 6 2.25 1.8 5.6 1.74 0.8912 12 2.5 3 11.6 2.145 1.1713 7 2.55 1.85 6.2 2.105 0.8114 11 5.2 3.3 10.4 4.76 1.9215 5 1.45 1.2 4.6 0.98 0.4316 7 1.8 1.95 6.6 1.445 1.3117 11 1.95 2.1 10.7 1.715 1.1518 2 0.8 1.1 1.1 0.345 0.4619 14 5.2 3.05 13.5 4.685 1.8120 9 4.3 2.1 8.5 3.945 1.5521 1 0.7 0.8 0.7 0.365 0.4022 8 2.05 1.8 7.1 1.76 1.0923 1 0.45 0.45 0.8 0.235 0.2124 10 3.85 3.6 9.4 3.255 1.8425 1 0.85 1.25 0.7 0.24 0.3126 12 4.45 3.45 11.8 4.055 2.35
Meanamong
transects8.96 3.44 2.34 8.25 3.29 1.34
Prescott Creeks Preservation Association Watson Woods Riparian Preserve Restoration Project Final Report
254

10
Table 4. Changes in vegetation association and average total FHD for each transect between 1997 and 2005 sampling. Transect Dominant woody
species 1997 Dominant woody species 2006
Change in averageFHD
Percentchangeaverage FHD
1 Ulmus pumila Ulmus pumila 2.45 6132* Salix laevigata Salix laevigata 0.70 443 Populus fremontii Populus fremontii 1.80 394 Salix laevigata Salix laevigata 1.70 975** Herbaceous only N/A N/A N/A 6 Populus fremontii Populus fremontii -1.40 -207 Salix laevigata Salix laevigata 0.60 928 Salix laevigata Salix laevigata 0.50 189 Herbaceous only Salix exigua 0.55 36710 Juglans major Juglans major 0.20 1211 Populus
angustifoliaPopulusangustifolia
1.00 77
12 Herbaceous only Populus fremontii 1.65 82513 Populus fremontii Populus fremontii 0.40 2614 Herbaceous only Populus
angustifolia2.60 325
15 Populus fremontii Salix laevigata 0.25 1716 Salix exigua Juglans major 0.40 3617 Herbaceous only Populus
�hinckleyana1.00 182
18 Salix exigua Herbaceous only -0.05 -419 Populus fremontii Populus fremontii -0.05 -220 Salix laevigata Tamarix
ramosissima1.85 132
21 Herbaceous only Herbaceous only 0.65 130022 Salix lasiolepis Acer negundo 1.10 8523 Herbaceous only Herbaceous only 0.45 N/A 24 Populus fremontii Salix lasiolepis 1.25 35725 Herbaceous only Herbaceous only 0.65 13026 Salix laevigata Salix laevigata 0.05 1 Overall average 0.85 ***57*Transect 2 was redirected because the 1997 legs were under water in 2005.**Transect 5 was destroyed during bridge construction prior to 2005. ***calculated as the percent change of average FHD and not as the average percent change in FHD, which would be much higher,162.9.
Presott Creeks Preservation Association Watson Woods Riparian Preserve Restoration Project Final Report
255

11
Table 5. Changes in vegetation association and average total FHD (by meter) for each transect between 2005 and 2012 sampling. Transect Dominant woody
species 2005 Dominant woody species 2012
Change in averageFHD
Percentchange in averageFHD
1 Ulmus pumila Populus fremontii -0.90 -322 Salix laevigata Populus fremontii 2.20 963 Populus fremontii Populus fremontii -1.10 -174 Salix laevigata Populus fremontii 0.25 76 Populus fremontii Populus fremontii -0.50 -97 Salix laevigata Herbaceous only -0.80 -648 Salix laevigata Salix laevigata -1.30 -399 Salix exigua Salix exigua 0.35 5010 Juglans major Juglans major -0.30 -1611 Populus
angustifoliaPopulus angustifolia
-0.50 -2212 Populus fremontii Populus
×hinckleyana 1.15 6213 Populus fremontii Ulmus pumila -0.10 -514 Populus
angustifoliaPopulus fremontii
-0.10 -315 Salix laevigata Salix laevigata -0.50 -2916 Juglans major Juglans major 0.45 3017 Populus
�hinckleyanaPopulus�hinckleyana 0.55 35
18 Herbaceous only Salix exigua 0.00 019 Populus fremontii Populus fremontii 0.60 2420 Tamarix
ramosissimaTamarix ramosissima
-1.15 -3521 Herbaceous only Herbaceous only 0.10 1422 Acer negundo Acer negundo -0.60 -2523 Herbaceous only Herbaceous only 0.00 024 Salix lasiolepis Populus fremontii 2.00 12525 Herbaceous only Herbaceous only 0.10 926 Salix laevigata Salix laevigata -0.05 -1 Overall average 0.00 0*calculated as the percent change of average FHD and not as the average percent change in FHD, which would be much higher,162.9.
Prescott Creeks Preservation Association Watson Woods Riparian Preserve Restoration Project Final Report
256
12
Transect number
1 2 3 4 5 6 7 8 9 10 11 12 13 14 15 16 17 18 19 20 21 22 23 24 25 26
Ave
. FH
D (m
eter
s/pl
ot)
0
2
4
6
8
September 1997 September 2005 September 2012
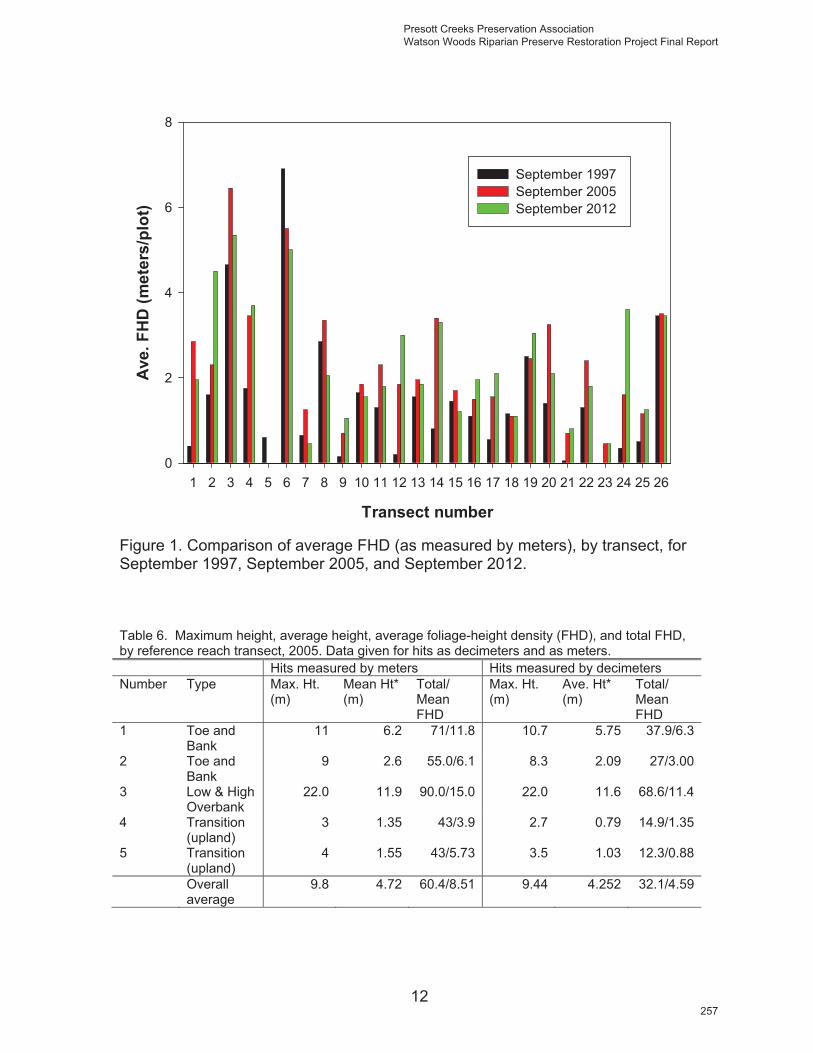
Figure 1. Comparison of average FHD (as measured by meters), by transect, for September 1997, September 2005, and September 2012.
Table 6. Maximum height, average height, average foliage-height density (FHD), and total FHD, by reference reach transect, 2005. Data given for hits as decimeters and as meters. Hits measured by meters Hits measured by decimeters Number Type Max. Ht.
(m) Mean Ht* (m)
Total/MeanFHD
Max. Ht. (m)
Ave. Ht* (m)
Total/MeanFHD
1 Toe and Bank
11 6.2 71/11.8 10.7 5.75 37.9/6.3
2 Toe and Bank
9 2.6 55.0/6.1 8.3 2.09 27/3.00
3 Low & High Overbank
22.0 11.9 90.0/15.0 22.0 11.6 68.6/11.4
4 Transition (upland)
3 1.35 43/3.9 2.7 0.79 14.9/1.35
5 Transition (upland)
4 1.55 43/5.73 3.5 1.03 12.3/0.88
Overall average
9.8 4.72 60.4/8.51 9.44 4.252 32.1/4.59
Presott Creeks Preservation Association Watson Woods Riparian Preserve Restoration Project Final Report
257

13
Total Hits (m)
0 50 100 150 200 250
Spec
ies
Linaria dalmaticaLepidium latifoliumLathyrus latifolius
Juncus balticusJuncus badiusJuglans major
Ipomoea equitansGnapalium canescens
Gaura coccineusFraxinus velutina
Festuca arundinaceaFallugia paradoxa
Eriogonum wrightiiEragrostis curvula
Elymus trachycaulisEleocharis parishii
Eleocharis palustrisElymus canadensisElymus elymoides
Datura wrightiiDalea candida
Cynodon dactylonCurcubita foetitissimaConvolvulus arvensis
Carex occidentalisBrickelia floribunda
Brickellia eupatorioidesBouteloua gracilis
Boutleoua curtipendulaAster lanceolatusAristida ternipes
Aristida purpureaAristida hamulosaAristida divaricataArtemisia caruthii
Atriplex canescensAmbrosia psilostachya
September 1998 September 200 September 2012
Figure 2a. Total hits FHD (by meters) of perennials for all transects, by species A-L.
Prescott Creeks Preservation Association Watson Woods Riparian Preserve Restoration Project Final Report
258

14
Total hits (m)
0 50 100 150 200 250
0 50 100 150 200 250
Spec
ies
Verbascum thapsus
Ulmus pumila
Typha latifolia
Tamarix ramosissima
Saponaria officinalis
Sporobolus cryptandrus
Sporobolus contractus
Sphaeralcea fendleri
Salix lasiolepis
Salix. laevigata
Salix goodingii x S. laevigata
Salix exigua
Rumex crispus
Ribes cereum
Rhus aromatica
Prunus serotina
Polypogon viridis
Polygonum lapathifolium
Populus ×hinckleyana
Populus fremontii
Populus angusifolia
Penstemon eatoni
Pascopyrum smithii
Opuntia macrorhiza
Oenothera elata
Oenothera. cespitosa
Muhlenbergia rigens
Mirabilis pumila
Mirablilis longiflora
Mirablilis glabra
Mirablilis multiflora
Medicago officinalis
Medicago alba
Marrubium vulgare
Machaeranthera canescens
September 1997 September 2005 September 2012
Figure 2b. Total hits FHD (meters) of perennials for all transects, by species M-Z.
Presott Creeks Preservation Association Watson Woods Riparian Preserve Restoration Project Final Report
259

15
Percent cover of annuals
Total percent cover of annuals within transects increased 37% between 1997 and 2005 and decreased 13% between 2005 and 2012 with average cover along some transects considerably lower and others considerably higher (Table 7).Graphs depicting annual cover, by species is presented in Appendix 5.
Table 7. Average percent cover of annuals, by transect, for 1997, 2005, and 2012 sampling. ND = no data available.
Transectnumber
Percent cover 1997 2005 2012
1 42.8 50.2 40.252 40.1 18.9 1.253 42.1 55.1 11.154 9.8 4.6 43.955 8.3 ND ND 6 9.8 39.4 3.57 35.3 27.4 32.48 11.6 17.4 35.49 16.0 8.9 13.610 3.3 16.5 30.9511 6.0 11.5 1012 39.4 29.8 22.1513 4.4 17.6 7.814 2.7 8.6 20.7515 1.4 43.5 13.6516 4.9 14.8 32.917 34.4 23.5 23.618 6.9 9.5 22.719 13.1 33.1 1120 4.3 38.5 21.7521 36.7 43.1 38.0522 31.9 13.4 22.3523 38.8 67.3 46.4524 0 4.5 3.0525 16.4 16.8 14.326 13.8 9.5 18.7Meanamongtransects
18.2 24.9 21.7
Prescott Creeks Preservation Association Watson Woods Riparian Preserve Restoration Project Final Report
260

16
Point center quarter method
Total density of woody perennials more than doubled for riparian species between 2005 (204 individuals per ha) and 2012 (416.5 individuals per ha), and nearly doubled for non-riparian perennials (59.2 vs 92.2 individuals per ha)(Tables 8–11). However, because density increases as the square of the distances, these data are not as dramatic as they first appear and neither are significant at the p = 001 level (p = 002 for riparian and p = .158 for non-riparian). Estimates for average canopy cover increased between fall 2005 and fall 2012, with riparian species increasing from 25.4% in 2005 to 31.9% in 2012. Similarly, average canopy cover for non-riparian species increased from 8.4% in 2005 to 20.4% in 2012.
Table 8. Summary of Riparian Woody Perennial PCQ data for the September 2005 sampling in the Watson Woods Preserve.Average canopy cover was 25.4%.
Species
Averagewidth
Averageheight
Relative density
Absolutedensity(individuals per ha)
Acer negundo 3.0 3.0 0.010 2.04Amorpha fruticosa 0.9 0.9 0.005 1.02Fraxinus velutina 7.5 7.8 0.010 2.04Gleditzia triacantha 9.0 10.0 0.005 1.02Juglans major 1.5 2.0 0.005 1.02Populus angustifolia 3.5 6.0 0.005 1.02Populus fremontii 4.9 7.3 0.110 22.44Populus�hinckleyana
3.4 6.5 0.055 11.22
Robiniapseudoacacia
1.3 2.9 0.005 1.02
Salix exigua 1.2 2.1 0.065 13.26Salix laevigata 6.4 7.3 0.235 47.94Salix lasiolepis 4.1 3.7 0.345 70.38Tamarix ramosissima
0.8 2.2 0.005 1.02
Ulmus pumila 4.2 5.9 0.140 28.56Overall Average 4.5 5.3 Total density 204.00
Presott Creeks Preservation Association Watson Woods Riparian Preserve Restoration Project Final Report
261

17
Table 9. Summary of Riparian Woody Perennial PCQ data for the September 2012 sampling in the Watson Woods Preserve.Average canopy cover was 31.9%. Species
Averagewidth
Averageheight
Relative density
Absolutedensity(individuals per ha)
Acer negundo 6.4 5.6 0.005 2.1Fraxinus velutina 2.0 1.3 0.005 2.1Populus angustifolia 0.8 1.7 0.025 10.4Populus fremontii 4.2 8.5 0.170 70.8Populus�hinckleyana 2.9 5.3 0.040 16.7Ribes cereum 1.2 1.5 0.005 2.1Salix exigua 0.7 1.8 0.245 102.0Salix laevigata 5.6 9.4 0.075 31.2Salix lasiolepis 2.9 3.6 0.310 129.1Tamarix ramosissima 1.8 2.2 0.015 6.2Ulmus pumila 2.2 3.2 0.105 43.7
Overall Average 2.8 4.0 Total density: 416.5
Prescott Creeks Preservation Association Watson Woods Riparian Preserve Restoration Project Final Report
262

18
Table 10. Summary of non-riparian woody perennial PCQ data for the September 2005 sampling in the Watson Woods Preserve. Average canopy cover was 8.4%.
Species Average
width Averageheight
Relative density
Absdensity
(individuals per ha)
Acer negundo 5.00 8.17 0.015 0.89Cercocarpusmontanus
2.30 1.00 0.005 0.30
Eriogonum wrightii 1.30 0.55 0.010 0.59Fallugia paradoxa 1.56 1.32 0.025 1.48Fraxinus velutina 4.18 6.63 0.020 1.18Gleditziatriacanthos
3.50 0.80 0.005 0.30
Juglans major 7.06 6.55 0.050 2.96Pinus ponderosa 3.00 7.80 0.005 0.30Populusangustifolia
6.30 7.40 0.050 2.96
Populus fremontii 11.36 12.11 0.135 7.99Populus×hinckleyana
6.06 7.01 0.065 3.85
Purshiastansburiana
3.00 4.50 0.005 0.30
Robinianeomexicana
1.27 1.67 0.015 0.89
Salix exigua 2.16 2.24 0.035 2.07Salix gooddingii 2.50 2.20 0.005 0.30Salix laevigata 6.62 7.14 0.155 9.17Salix lasiolepis 5.74 4.84 0.090 5.33Tamarix ramosissima
5.60 3.74 0.060 3.55
Ulmus pumila 4.61 5.51 0.250 14.79Overall average 6.00 6.41 Total density: 59.17
Presott Creeks Preservation Association Watson Woods Riparian Preserve Restoration Project Final Report
263

19
Table 11. Summary of non-riparian woody perennial PCQ data for the September 2012 sampling in the Watson Woods Preserve. Average canopy cover was 20.4%.
Species Average
width Averageheight
Relative density
Absdensity
(individuals per ha)
Acer negundo 7.4 11.4 0.010 0.9Amorpha fruticosa 7.6 1.9 0.005 0.5Baccharispteronioides 0.8 0.8 0.010 0.9Celtis reticulata 2.4 3.1 0.010 0.9Chrysothamnusnauseosus 1.0 0.7 0.020 1.8Elaeagnusangustifolia 1.3 1.5 0.005 0.5Eriogonum wrightii 0.4 0.2 0.020 1.8Fallugia paradoxa 1.8 1.3 0.015 1.4Fraxinus velutina 5.8 7.3 0.035 3.2Gutierreziasarothrae 0.7 0.4 0.005 0.5Juniperusdeppeana 1.0 4.3 0.005 0.5Juglans major 6.3 6.9 0.035 3.2Lycium pallidum 0.5 0.7 0.020 1.8Populusangustifolia 2.4 4.2 0.050 4.6Populus fremontii 8.3 12.5 0.105 9.7Populus×hinckleyana 4.5 6.7 0.100 9.2Rhus aromatica 1.5 2.2 0.015 1.4Ribes cereum 1.5 1.3 0.010 0.9Robiniapseudoacacia 2.8 9.1 0.010 0.9Salix exigua 1.7 2.9 0.125 11.5Salix laevigata 7.4 11.2 0.120 11.1Salix lasiolepis 3.2 3.8 0.115 10.6Tamarix ramosissima 4.7 6.2 0.020 1.8Ulmus pumila 4.5 11.4 0.135 12.5
Overall average 3.3 4.7 Total density: 92.2
Prescott Creeks Preservation Association Watson Woods Riparian Preserve Restoration Project Final Report
264
20
Individuals per hectare
0 10 20 30 40 50 60 70 80 90 100 110 120 130
Spec
ies
U. pumila
T. ramosissima
S. lasiolepis
S. laevigata
S. exigua
R. pseudoacacia
R. cereum
P. fremontii
P. angustifolia
P. ×hinckleyana
J. major
G. triacantha
F. velutina
A. fruticosa
A. negundo
2005, September 2012, September
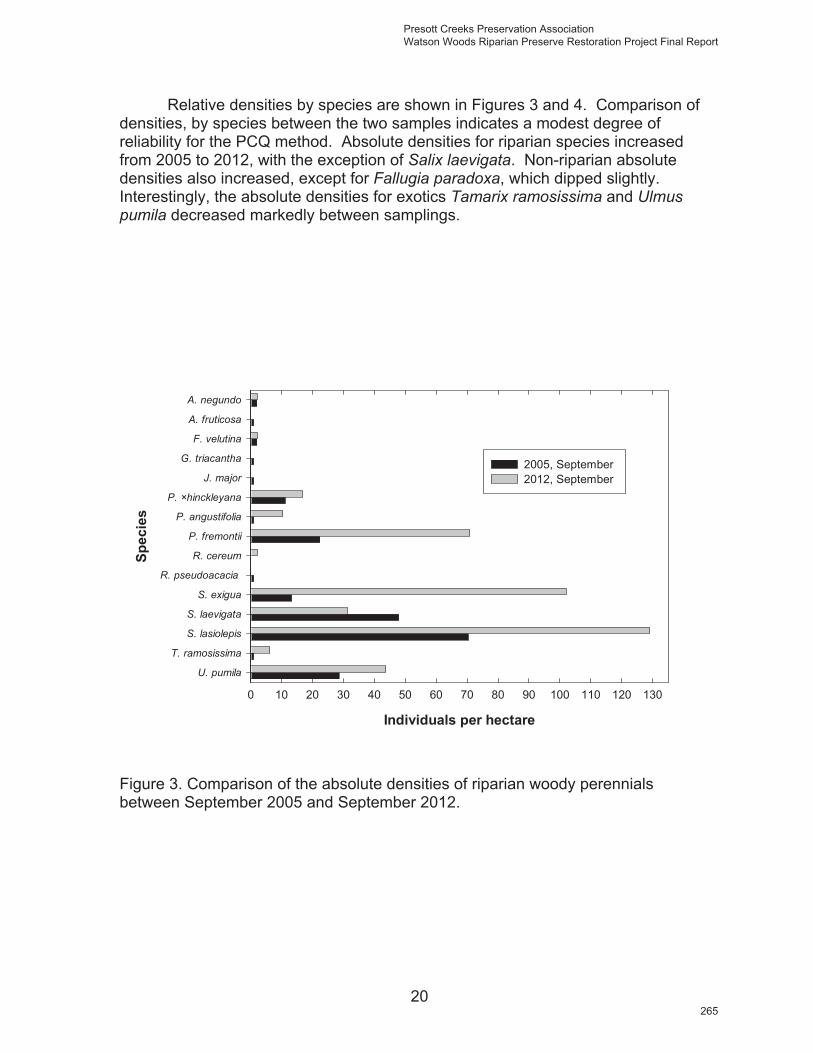
Relative densities by species are shown in Figures 3 and 4. Comparison of densities, by species between the two samples indicates a modest degree of reliability for the PCQ method. Absolute densities for riparian species increased from 2005 to 2012, with the exception of Salix laevigata. Non-riparian absolute densities also increased, except for Fallugia paradoxa, which dipped slightly.Interestingly, the absolute densities for exotics Tamarix ramosissima and Ulmus pumila decreased markedly between samplings.
Figure 3. Comparison of the absolute densities of riparian woody perennials between September 2005 and September 2012.
Presott Creeks Preservation Association Watson Woods Riparian Preserve Restoration Project Final Report
265

21
Individuals per hectare
0 2 4 6 8 10 12 14 16
Spec
ies
U. pumilaT. ramosissima
S. lasiolepisS. laevigata
S. gooddingiiS. exigua
R. neomexicana R. aureum
R. aromaticaP. stansburiana
P. fremontiiP. angustifolia
P. ×hinckleyanaP. ponderosa
L. pallidumJ. deppeana
J. majorG. triacanthos
G. sarothraeF. velutina
F. paradoxaE. wrightii
E. angustifoliaC. nauseosusC. montanusC. reticulata
B. pteronioidesA. fruticosaA. negundo
2005, September 2012, September
Figure 4. Comparison of the absolute densities of upland woody perennials between September 2005 and September 2012.
Prescott Creeks Preservation Association Watson Woods Riparian Preserve Restoration Project Final Report
266

22
In 2005, percent cover of perennial herbs was much higher for riparian PCQ plots (61.4%) than for non-riparian PCQ plots (31.8%) and much higher for both riparian and non-riparian plots in the fall than in the spring (Tables 12-13). Results from a T-test indicated that neither riparian (p = .007) or non-riparian (p = .478) perennial samples from September 2012 are significantly different than those of September 2005. For fall 2012, the difference between riparian and non-riparian perennial herb percent cover was not as dramatic with the riparian decreasing to 43.62% and the non-riparian increasing to 36.5%. In the fall of 2005, Festucaarundinacea, an invasive exotic grass, and Melilotus officinalis, an invasive perennial herb, both had a percent covers three times as high as that of Ambrosia psilostachya, the native perennial with the highest cover. However, percent cover estimates for M. officinalis decreased dramatically in the 2012 sampling. Cynodondactylon, another invasive exotic grass, also had high percent cover in 2005 but decreased in 2012. In fall 2005, the native perennial herb, Mirabilis longiflora, was much more abundant in comparison to fall 2005. Unfortunately, the invasive exotic Lepidium latifolium occurred within PCQ plots for the first time in 2012 (Figure 5). In contrast to perennial herbs, annuals and biennials had a much higher cover in non-riparian plots in comparison to that on riparian plots in both fall 2005 and fall 2012 (Table 14, Figures 6a and 6b). Results from a T-test indicated that neither riparian (p = ..026) or non-riparian (p = .017) annual samples from September 2012 are significantly different than those of September 2005. In spring 2005, two invasive exotic grasses, Bromus japonicum and B. tectorum, dominated the spring flora, and a third B. diandrus, was dominant only in the non-riparian plots. The three species were also prevalent in the fall 2005 flora. Two additional fall 2005 annuals were abundant, Helianthus annuus, a native, and Kochia scoparia, a non-native. Probably the most important change in the 2012 herb flora was the widespread occurrence of Centaurea stoebe, an very invasive exotic biennial. Other noteworthy changes were a large increase in percent covers for two exotic annuals, Chloris virgata and Portulaca oleracea and a large decrease in percent cover for the native annual Machaeranthera tanacetifolia. A summary of percent cover of perennials from PCQ points, by plot is provided in Table 15 and a summary of percent cover of annuals and biennials, by plot, is provided in Table 16.
Presott Creeks Preservation Association Watson Woods Riparian Preserve Restoration Project Final Report
267

23
Table 12. Summary of average distance from PCQ point for woody species, by plot. p = .002 for both riparian and non-riparian.
Plot
September 2005 September 2012 Riparian Non-
riparianRiparian Non-
riparian1 4.73 3.90 3.875 6.28 2 4.48 5.00 6.5 7.78 3 7.78 14.38 5.2 12.60 4 6.13 12.65 5.525 9.55 5 4.00 7.93 5.775 9.73 6 2.00 23.08 2.725 3.53 7 3.28 28.98 4.25 3.95 8 6.18 45.75 3.45 8.05 9 2.68 1.38 3.475 9.30 10 4.83 10.93 2.125 9.40 11 11.80 21.58 1.7 2.15 12 12.10 21.58 10.85 10.48 13 19.40 8.23 5.875 6.93 14 5.50 47.63 6.225 5.00 15 5.40 5.10 3.875 33.93 16 2.55 36.00 1.875 25.85 17 5.13 9.10 2.65 2.33 18 4.15 3.68 8.15 4.20 19 5.40 6.88 5.45 5.18 20 1.60 41.95 6.325 19.58 21 2.25 14.95 1.925 5.20 22 6.28 12.03 9 2.20 23 4.93 8.13 8.65 10.08 24 24.78 10.13 2.525 7.63 25 6.28 15.65 3.2 9.65 26 8.20 7.25 1.825 17.88 27 11.98 12.53 5.325 5.00 28 20.40 8.30 3.2 12.15 29 13.18 20.25 6.5 8.40 30 9.70 5.78 9.85 11.73 31 12.60 15.15 4.45 5.60 32 10.28 21.23 7.95 14.60 33 14.50 17.75 20.175 5.30 34 4.35 8.03 1.5 9.03 35 5.95 6.38 5.95 3.83 36 7.55 5.68 1.3 25.55 37 7.88 4.50 1.075 10.40 38 9.03 5.45 0.475 14.55 39 4.55 2.20 0.85 15.50
Prescott Creeks Preservation Association Watson Woods Riparian Preserve Restoration Project Final Report
268

24
Table 12. Summary of average distance from PCQ point for woody species, by plot. p = .002 for both riparian and non-riparian.
Plot
September 2005 September 2012 Riparian Non-
riparianRiparian Non-
riparian40 8.35 3.10 1.525 24.70 41 9.48 2.08 5.325 16.73 42 2.95 6.28 3.85 16.48 43 2.50 7.18 12.725 5.48 44 4.85 8.50 8.9 15.03 45 13.35 12.88 1.675 16.80 46 8.43 9.38 0.775 6.78 47 13.60 4.93 0.675 4.28 48 3.83 11.88 2.325 2.85 49 3.10 3.95 6.7 14.68 50 10.88 24.50 9.35 6.85
Presott Creeks Preservation Association Watson Woods Riparian Preserve Restoration Project Final Report
269

25
Table 13. Summary of average percent cover for riparian and non-riparian perennial herbs.
Riparian sampling Non-riparian sampling Species 2005
Spring2005Fall
2012Fall
2005Spring
2005Fall
2012Fall
Achillea millefolium 0.2 2.1Ambrosia psilostachya 0.9 5.68 9.54 0.2 6.3 5.74Aristida orcuttiana 0.3 Aristida purpurea 0.2 Aristida ternipes 0.6 0.2 Artemisia caruthii 0.6 0.2 1.1Artemisia dracunculus 0.5 1.8 Aster lanceolatus 0.70 0.2 Bouteloua curtipendula 1.3 2.0 1.9Bouteloua gracilis 0.1 0.12Brickellia eupatorioides 0.2 0.20 0.1 Brickellia floribunda 0.1 2.1 2.1Bromus marginatus 5.5 1.4 Carex occidentalis 0.4 Convolvulus arvensis 0.0 0.24 0.7 0.2 1.4Cucurbita foetidissima 0.6 0.3Cynodon dactylon 4.40 1.6 Datura wrightii 1.6 1.2Eleocharismontevidensis
0.9
Eleocharis palustris 0.04 Eleocharis parishii 1.0 1.54 0.4 0.3 Elymus canadensis 2.40 1.1 0.1 2Elymus repens 1.1Festuca arundinacea 11.2 19.20 16.2 0.7 2.5 4.1Grindelia aphanactis 0.1Hymenothrix wrightii 0.4Juncus balticus 0.8 1.9 1.2Juncus nevadensis 1.3 0.8 Juncus tenuis 0.2 Juncus torreyi 0.1 Lathyrus latifolius 0.8 0.5 Lepidium latifolium 0.8Linanthus dalmatica 0.1 0.06Machaerantheracanescens 0.9Marrubium vulgare 0.9 0.04Melilotus officinalis 0.4 19.10 1.3 4.3 0.1Mirabilis longiflorus 0.80 8.4 3.6
Prescott Creeks Preservation Association Watson Woods Riparian Preserve Restoration Project Final Report
270

26
Table 13. Summary of average percent cover for riparian and non-riparian perennial herbs.
Riparian sampling Non-riparian sampling Species 2005
Spring2005Fall
2012Fall
2005Spring
2005Fall
2012Fall
Muhlenbergia rigens 3.8 3.50 Oenotheracaespitosum
0.4
Panicum obtusum 0.04Pascopyrum smithii 2.1 0.9 0.4 1Paspalum dilitatum 1.0 Polygonumlapathifolium
0.50
Polypogon viridis (Ag) 1.50 4.28 0.6Rumex crispus 1.1 1.00 0.5 0.6 0.2 0.14Scirpus acutus 0.1 Sporobolus airoides 0.7Sporobolus contractus 0.3 1.1 1.8Sporobolus cryptandrus 0.2Sphaeralcea fendleri 0.4 0.5 1.72Typha angustifolia 0.0 0.04 0.7 Typha latifolia 0.20 Total 30.9 61.04 43.62 7.2 31.8 36.5
Presott Creeks Preservation Association Watson Woods Riparian Preserve Restoration Project Final Report
271

26
Percent Cover
0 5 10 15 20
Spec
ies
Typha latifoliaTypha angustifolia
Sporobolus cryptandrusSporobolus contractus
Sporobolus airoidesSphaeralcea fendleri
Scirpus acutusRumex crispus
Polypogon viridis (Ag)Polygonum lapathifolium
Paspalum dilitatumPascopyrum smithii
Panicum obtusumOenothera caespitosum
Muhlenbergia rigensMirabilis longiflorusMelilotus officinalisMarrubium vulgare
Machaeranthera canescensLinanthus dalmatica
Lepidium latifoliumLathyrus latifolius
Juncus torreyiJuncus tenuis
Juncus nevadensisJuncus balticus
Hymenothrix wrightiiGrindelia aphanactisFestuca arundinacea
Elymus repensElymus canadensisEleocharis parishii
Eleocharis palustrisEleocharis montevidensis
Datura wrightiiCynodon dactylon
Cucurbita foetidissimaConvolvulus arvensis
Carex occidentalisBromus marginatusBrickellia floribunda
Brickellia eupatorioidesBouteloua gracilis
Bouteloua curtipendulaAster lanceolatus
Artemisia dracunculusArtemisia caruthiiAristida ternipes
Aristida purpureaAristida orcuttiana
Ambrosia psilostachyaAchillea millefolium
2005 Spring Riparian 2005 Fall Riparian 2012 Fall Riparian 2005 Spring Non-riparian 2005 Fall Non-riparian 2012 Fall Non-riparian
Figure 5. Average percent cover for perennial herbs as estimated with PCQ method for riparian and non-riparian samplings made in the spring and fall of 2005 and the fall of 2012.
Prescott Creeks Preservation Association Watson Woods Riparian Preserve Restoration Project Final Report
272

27
Table 14. Summary of percent cover for riparian and non-riparian biennials and annuals.
Riparian Non-riparian Species 2005,
Spring2005,Fall
2012Fall
2005Spring
2005Fall
2012Fall
Ambrosia acanthicarpa 1.3 0.04Amaranthus retroflexus 0.1 Amaranthus palmeri 0.1 0 0.8 1.04Bahia dissecta 0.2 0.2 0.1Bidens tenuisecta 0.1 0.2 0.24Bromus diandrus 0.8 4.5 4.1 7.6 2Bromus japonicus 1.1 0.6 2.0Bromus tectorum 1.6 0.4 1.4 9.7 5.1 0.3Centaurium stoebe 3.6 0.5Chamaesyce serpyllifolia 0.54Chenopodium neomexicanum
0.7 0.4 1.0 1.1
Chloris virgata 0.1 0.4 2.64Conyza canadensis 0.8 0.4 2.0 Conium maculatum 0.1 0.7 0.5 Cyperus esculentum 0.1 0.2Dipsacus fullonum 0.4 1.4 1.3Echinochloa crus-galli 0.4 1.9 0.24Eragrostis lutescens 0.1 1.7 0.2 Eragrostis mexicana 0.4 0.1 0.4Erigeron divergens 0.2 0.2 0.1 0.1 Eriogonum polycladon 0.1 2.0 0.44Erodium cicutarium 0.7Erysimum repandrum 0.4 0.02Gaura parviflora 0.0 0.34Grindelia aphanactis 0.1 0.5 1.2Helianthus annuus 1.0 0.1 0.1 2.5 0.1Heterotheca psammophila 0.1 2.7 3Hymenothrix loomsii 0.7 0.6 0.4 0.84Ipomoea coccineus 0.1 0.08 0.2 0.14Ipomoea purpurea 0.2 0.3 Kallstroemia parviflora 0.02Kochia scoparia 0.1 3.8 1.4Lamium amplexicaule 0.3Lepidium densiflorum 0.1Lolium perenne 0.3Machaeranthera gracilis 0.5 0.2Machaerantheratanacetifolia
1.0 3.7 1.3
Presott Creeks Preservation Association Watson Woods Riparian Preserve Restoration Project Final Report
273
28
Table 14. Summary of percent cover for riparian and non-riparian biennials and annuals.
Riparian Non-riparian Species 2005,
Spring2005,Fall
2012Fall
2005Spring
2005Fall
2012Fall
Malva parviflora 0.2 Medicago lupulina 0.2 Mimulus guttatus 0.4Oenothera elata 0.3 0.02Oenothera cespitosum 0.04 Onopordum acanthium 0.3 Panicum capillare 0.4 0.04 0.2 0.3Plantago wrightiana 1.4Polanisia dodecandra 0.2Polygonum aviculare 0.6 0.0 Polypogon monspeliensis 0.1 0.5 Portulaca oleracea 0.1 3.84Salsola kali 0.2Salvia reflexa 0.4Sanvitalia abertii 0.0 0.08Sonchus oleraceus 0.3 0.2Taraxacum officinale 0.1Verbascum thapsus 0.3 0.5 Xanthium strumarium 1.6 0.3 0.1 Total 2.7 9.7 16.76 22.6 39.9 25.68
Prescott Creeks Preservation Association Watson Woods Riparian Preserve Restoration Project Final Report
274

29
Figure 6a. Average percent cover for annual and biennial herbs (A-K) as estimated with PCQ method for riparian and non-riparian samplings made in the spring and fall of 2005 and the fall of 2012.
Percent cover
0 2 4 6 8 10
Spec
ies
Hymenothrix loomsii
Heterotheca psammophila
Helianthus annuus
Grindelia aphanactis
Gaura parviflora
Erysimum repandrum
Erodium cicutarium
Eriogonum polycladon
Erigeron divergens
Eragrostis mexicana
Eragrostis lutescens
Echinochloa crus-galli
Dipsacus fullonum
Cyperus esculentum
Conyza canadensis
Conium maculatum
Chloris virgata
Chenopodium neomexicanum
Chamaesyce serpyllifolia
Centaurium stoebe
Bromus tectorum
Bromus japonicus
Bromus diandrus
Bidens tenuisecta
Bahia dissecta
Ambrosia acanthicarpa
Amaranthus retroflexus
Amaranthus palmeri
2005, Spring riparian 2005, Fall riparian 2012 Fall riparian 2005 Spring non-riparian 2005 Fall non-riparian 2012 Fall non-riparian
Presott Creeks Preservation Association Watson Woods Riparian Preserve Restoration Project Final Report
275

30
Figure 6b. Average percent cover for annual and biennial herbs (L-Z) as estimated with PCQ method for riparian and non-riparian samplings made in the spring and fall of 2005 and the fall of 2012.
Percent cover
0 2 4 6 8 10
Spec
ies
Xanthium strumarium
Verbascum thapsus
Taraxacum officinale
Sonchus oleraceus
Sanvitalia abertii
Salvia reflexa
Salsola kali
Portulaca oleracea
Polypogon monspeliensis
Polygonum aviculare
Polanisia dodecandra
Plantago wrightiana
Panicum capillare
Onopordum acanthium
Oenothera elata
Oenothera cespitosum
Mimulus guttatus
Medicago lupulina
Malva parviflora
Machaeranthera tanacetifolia
Machaeranthera gracilis
Lolium perenne
Lepidium densiflorum
Lamium amplexicaule
Kochia scoparia
Kallstroemia parviflora
Ipomoea purpurea
Ipomoea coccineus
2005, Spring riparian 2005, Fall riparian 2012 Fall riparian 2005 Spring non-riparian 2005 Fall non-riparian 2012 Fall non-riparian
Prescott Creeks Preservation Association Watson Woods Riparian Preserve Restoration Project Final Report
276

31
Table 15. Summary of percent cover of perennials from PCQ points, by plot.
Transect
September 2005 September 2012 Riparian Non-
riparianRiparian Non-
riparian1 105 35 10 30 2 72 35 30 10 3 70 95 20 75 4 90 30 75 85 5 100 0 30 40 6 12 30 0 55 7 90 0 65 75 8 30 25 45 50 9 100 10 89 210 60 25 0 511 80 5 90 70 12 65 7 100 30 13 82 40 0 214 65 0 45 49 15 95 55 40 016 60 0 55 10 17 35 5 20 40 18 100 45 0 90 19 90 50 75 65 20 70 0 80 55 21 0 40 35 35 22 102 0 70 2 23 60 35 75 70 24 90 15 70 025 25 5 5 10 26 95 65 60 64 27 10 10 70 80 28 10 85 100 40 29 80 75 25 50 30 25 30 20 35 31 90 35 80 60 32 15 35 100 533 30 55 10 034 85 20 65 035 0 30 25 30 36 0 0 50 037 55 45 10 23 38 40 25 35 40 39 80 85 40 35 40 100 65 85 041 60 0 0 45
Presott Creeks Preservation Association Watson Woods Riparian Preserve Restoration Project Final Report
277

32
Table 15. Summary of percent cover of perennials from PCQ points, by plot.
Transect
September 2005 September 2012 Riparian Non-
riparianRiparian Non-
riparian42 55 100 2 61 43 95 40 40 25 44 100 0 0 045 72 65 40 046 100 35 20 55 47 70 45 0 50 48 42 5 90 45 49 0 85 55 35 50 20 0 25 90
Table 16. Summary of percent cover of annuals and biennials from PCQ points, by plot.
Transect
September 2005 September 2012 Riparian Non-
riparianRiparian Non-
riparian1 0 15 31 45 2 20 20 45 25 3 0 0 40 04 0 45 2 05 0 80 45 06 0 60 0 07 0 65 15 80 8 4 65 10 40 9 0 5 0 75 10 35 15 0 23 11 0 70 0 20 12 57 55 0 51 13 0 5 0 32 14 0 100 25 30 15 0 10 7 016 0 65 0 80 17 20 65 32 10 18 0 40 42 019 10 80 0 020 0 100 0 15 21 0 10 0 722 0 65 0 40 23 2 25 0 15 24 10 6 5 47 25 37 92 2 23
Prescott Creeks Preservation Association Watson Woods Riparian Preserve Restoration Project Final Report
278

33
Table 16. Summary of percent cover of annuals and biennials from PCQ points, by plot.
Transect
September 2005 September 2012 Riparian Non-
riparianRiparian Non-
riparian26 1 75 0 35 27 19 19 2 20 28 24 0 0 34 29 35 0 65 030 0 0 55 35 31 20 65 10 032 10 20 0 45 33 0 31 55 32 34 5 50 10 20 35 0 60 0 036 0 0 20 37 37 42 10 25 738 7 30 20 25 39 35 7 35 35 40 0 80 0 80 41 20 40 20 15 42 2 0 0 243 0 24 25 25 44 0 0 100 92 45 7 90 50 65 46 0 10 50 047 20 50 0 048 25 80 0 049 0 0 30 050 20 95 45 22
Presott Creeks Preservation Association Watson Woods Riparian Preserve Restoration Project Final Report
279

33
Floristics
Specimens were made of 15 previously undocumented taxa (Table 17). Lepidium latifolium is an aggressive exotic invasive and is spreading quickly throughout the preserve. The individual of Prosopis velutina with Watson Woods at an unusually high elevation and perhaps could be a good seed source for attempts at growing the species as an ornamental in the Prescott area.
Table 17. Vascular plants collected at Watson Woods Riparian Preserve in 2008-2012. All collections made by Marc Baker. Species new to the preserve are in bold.
Species Family Collector's number Date
Linum lewisii Linaceae 16923 19 May 2009
Penstemon palmeri Scrophulariaceae 16924 19 May 2009
Gaillardia pinnatifida Asteraceae 16732 6 October 2008
Populus angustifolia Salicaceae 17121 10 June 2010
Robinia pseudoacacia Fabaceae 17122 10 June 2010
Arrenatherum elatius Poaceae 17123 10 June 2010
Hybanthus verticillatus Violaceae 17124 10 June 2010
Chamaesyce albomarginata Euphorbiaceae 17125 10 June 2010
Stephanomeria thurberi Asteraceae 17126 10 June 2010
Hordeum pusillum Poaceae 17127 10 June 2010
Prosopis velutina Fabaceae 17128 10 June 2010
Apocynum cannabinum Apocynaceae 17129 10 June 2010
Cryptantha cinerea Boraginaceae 17130 10 June 2010
Vicia americana Fabaceae 17131 10 June 2010
Calochortus ambiguus Liliaceae 17132 10 June 2010
Lepidium latifolium Brassicaceae 17454 9 September 2011
Chamaesyce serpyllifolia Euphorbiaceae 17455 9 September 2011
Pectis prostrata Asteraceae 17614 20 September 2012
Cyperus esculentus Cyperaceae 17615 20 September 2012
Elymus canadensis Poaceae 17616 20 September 2012
Amaranthus palmeri Amaranthaceae 17617 20 September 2012
Symphyotrichum lanceolatum Asteraceae 17632 8 October 2012
Sporobolus airoides Poaceae 17633 8 October 2012
Leptochloa dubia Poaceae 17634 8 October 2012
Prescott Creeks Preservation Association Watson Woods Riparian Preserve Restoration Project Final Report
280

34
Vegetation mapping
Descriptions of vegetation types recorded during 2005 and 2102 are presented in Table 18. Vegetation polygons are mapped and presented in Figure 7. Riparian woodland was the dominate vegetation type of the Watson Woods Riparian Preserve in fall 2012, and represented a nearly 10% increase over fall 2005 Table 19). Stands of Fallugia paradoxa nearly doubled in size between the two samples and Chrysothamnus nauseosus scrub went from one or two individuals in 2005 to an area of .2 hectares in 2012. Areas of disturbed perennial and grassland both fell between 2005 and 2012. There were no significant areas of emergents or Dipsacusfullonum in 2012.
Table 18. Descriptions of vegetation types recorded during 2005 and 2102. Vegetationclassification Description
Chrysothamnusnauseosus
Scrub dominated by shrubs of Chrysothamnus nauseosus.
Disturbedannual
Areas of past disturbance that remain dominated by exotic or native annuals or biennials.
Dipsacusfullonum
Seasonally wet areas dominated by the biennial Dipsacus fullonum.
Disturbedperennial
Areas of past disturbance that remain dominated by mostly exotic perennial herbs.
Emergent Seasonally wet areas dominated by sedges (Carex, Cyperus)and rushes (Scirpus, Juncus, Eleocharis).
Fallugiaparadoxa
Scrub dominated by shrubs (often rhizomatous clones) of Fallugia paradoxa.
Grassland Areas dominated by perennial native grasses. Mixedsclerophyll
Scrub dominated by upland shrubs.
Nativeperennial
Areas dominated by perennial native herbs.
Riparianwoodland
Open to dense woodland dominated by riparian shrub and trees, primarily Acer, Populus and Salix.
Tamarix ramosissima
Woodland dominated by Tamarix ramosissima.
Ulmus pumila Woodland dominated by Ulmus pumila.
Presott Creeks Preservation Association Watson Woods Riparian Preserve Restoration Project Final Report
281

35
Table 19. Total estimated areas for vegetation types within the Watson Woods Riparian Preserve, 2005 and 2012.
Vegetation classification 2005 2012 Hectares Acres Hectares Acres
Chrysothamnus nauseosus 0 0 0.2 0.5Disturbed annual 14.7 36.4 14.3 35.4Dipsacus fullonum 0.2 0.4 0 0Disturbed perennial 6.9 17.0 5.7 14.2Emergent 0.1 0.2 0 0Fallugia paradoxa 0.3 0.6 0.5 1.2Grassland 8.1 20.0 6.9 17.1Mixed sclerophyll 0.8 2.0 0.9 2.3Native perennial 0 0 0.2 0.4Riparian woodland 17.0 41.9 18.6 45.9Tamarix ramosissima 0.0 0.1 0.0 0.0Ulnus pumila 0.7 1.7 1.0 2.5
Prescott Creeks Preservation Association Watson Woods Riparian Preserve Restoration Project Final Report
282

36
2012
Veg
etat
ion
Cla
ssifi
catio
ns
Chy
soth
amnu
s na
useo
sus
(0.5
acr
es)
Dis
turb
ed a
nnua
l (35
.4 a
cres
)
Dis
turb
ed p
eren
nial
(14.
2 ac
res)
Fallu
gia
para
doxa
(1.2
acr
es)
Gra
ssla
nd (1
7.1
acre
s)
Mix
ed s
cler
ophy
ll (2
.3 a
cres
)
Nat
ive
pere
nnia
l (0.
4 ac
res)
Rip
aria
n w
oodl
and
(45.
9 ac
res)
Sign
ifica
nt ro
ads
(2.8
acr
es)
Tam
arix
ram
osis
sim
a (0
.0 a
cres
)
Ulm
us p
umila
(2.5
acr
es)
Wat
er
±
01,
000
2,00
03,
000
Feet
Figu
re 7
. 201
2 ve
geta
tion
map
of W
atso
n W
oods
Rip
aria
n P
rese
rve.
Pre
sott
Cre
eks
Pre
serv
atio
n A
ssoc
iatio
n W
atso
n W
oods
Rip
aria
n P
rese
rve
Res
tora
tion
Pro
ject
Fin
al R
epor
t
283

37
Discussion and conclusions
Mean FHD for perennials remained constant as measured in meters (2.34 m³/m²) and nearly constant as measured in decimeters (1.34 m³/m² from 1.28 m³/m²) between fall 2005 and fall 2012. Of the six species that had a noticeable gain in estimated FHD between 1997 and 2012, Festuca arundinacea is the most disturbing, since it is an exotic perennial grass that occurs primarily on moist channel banks. In a more positive note, the FHD for Ulmus pumila, which is an undesirable exotic and highly invasive tree, decreased between 2005 and 2012. The remaining four, Populus angustifolia, P. ×hinckleyana, Salix exigua, S. lasiolepis, which are desirable native shrubs are good indicators of habitat within the Preserve converting to a more native-species rich woodland. Only one of these, Populus angustifolia,had a decrease in estimated FHD between 2005 and 2012, while the others had an increase. The estimated FHD for three perennial herbs, Machaerantheracanescens, Medicago officinalis, and Mirabilis longiflora decreased dramatically between 2005 and 2012. The slight increase in mean maximum height among all transects between 1997 (5.92 m) and 2005 (7.59 m) and between 2005 and 2012 (8.96 m) could be explained by the increase in FHD, at least as measured in decimeters, since, the two are inexorably linked. Also, at least some of the FHD accounted for by low-growing herbs in 2005, such as M. canescens, M. officinalis,and M. longiflora, was not present in 2012 and the aforementioned tree and shrub species had higher estimated FHD values in 2012. Estimated percent cover of annuals along the FHD transects fluctuated among 1997, 2005, and 2012 indicating a lack of general trend and there were no obvious trends among the three samples in terms of specific herbs (see Appendix 5).
Although estimated total absolute density of woody perennials more than doubled for riparian species between 2005 (204 individuals per ha) and 2012 (416.5 individuals per ha), and nearly doubled for non-riparian perennials (59.2 vs 92.2 individuals per ha), the results were not statistically significant at the p = 001. level.For riparian sample, however, the difference was significant at the p = 01 level. Estimates for average canopy cover increased between fall 2005 and fall 2012, with riparian species increasing from 25.4% in 2005 to 31.9% in 2012. Similarly, average canopy cover for non-riparian species jumped from 8.4% in 2005 to 20.4% in 2012. Specimens were made of approximately 15 previously undocumented taxa.
Data from PCQ sampling has much better resolution that that of FHD methodology as judged by probability values. This combined with the fact that the FHD method is much more labor intensive, suggests that the FHD method is much less efficient than the PCQ method. The FHD method, however, has an advantage of presenting a more pictorial graphing of transects. Because of the rather large discrepancy in estimates between FHD measured in meters vs those measured in decimeters, and the personal observation that measuring in decimeters does not entail much added effort, measurements in decimeters is probably better. Two exotic invasive species are of management concern, Centaurea stoebeand Lepidium latifolium. Individuals of these species have only recently been recorded within the Preserve and are spreading rapidly.
Prescott Creeks Preservation Association Watson Woods Riparian Preserve Restoration Project Final Report
284

38
Literature cited
Bulk, H. 1985. Useful climatic statistics for thirty-eight Arizona locations. Climatological Publications, Climate & Energy Series #6:98. Laboratory of Climatology, Arizona State University, Tempe, Arizona.
Brown, D. E., C. H. Lowe, and C. P. Page. 1979. A digitized classification system for the biotic communities of North America, with community (series) and association examples for the Southwest. Journal of the Arizona-Nevada Academy of Sciences 14:(suppl. 1).
Brown, D. (ed.). 1982. Biotic communities of the American Southwest-United States and Mexico. Desert Plants 4(1-4):1-342.
Ellenberg, H. 1956. Aufgaben und Methoden der Vegetationskunde. Stuttgart: Ulmer Verlag.
Elzinga, C. L., D. W. Salzar, and J. W. Willoughby. 1998. Measuring and Monitoring Plant Populations. BLM Technical Reference 1730-1, BLM Denver Service Center.
Krebs, C. J. 1998. Ecological Methodology. Addison, Wesley, Longman, Menlo Park, California.
Küchler, A. W. 1967. Vegetation Mapping. The Ronald Press Company: New York.
MacArther, R. and H. Horn. 1969. Foliage profile by vertical measurements. Ecology 50:802-804.
Mills, S., J. Dunning, and J. Bates. 1991. The relationship between breeding bird density and vegetation volume. Wilson Bulletin 103:468-479.
Moody. 2006.
Munz, P. A. and D. D. Keck. 1949-1950. California plant communities. Aliso 2:87-105, 199-202.
Presott Creeks Preservation Association Watson Woods Riparian Preserve Restoration Project Final Report
285

Appendix 1. Forms
Prescott Creeks Preservation Association Watson Woods Riparian Preserve Restoration Project Final Report
286

39
Form 1. Transect field form for Foliar height-density, cover of annuals, and DBD of woody perennials.
Technicians: ______ ______ Date: ________ Transect no. m from reference point no. @ � E of magnetic north
Perennial foliar height distribution for Watson Woods Riparian Preserve, Reference Reach
Ht (dm)
2
4
6
8
10
12
14
16
18
20
22
24
26
28
30
32
34
36
38
40
Annual Cover 2 12 22 32
4 14 24 34
6 16 26 36
8 18 28 38
10 20 30 40
DBH within 1m of transect:
Presott Creeks Preservation Association Watson Woods Riparian Preserve Restoration Project Final Report
287

40
Form
2. P
oint
-qua
rter m
etho
d fie
ld fo
rm.
Pre
scot
t Cre
eks
Pre
serv
atio
n A
ssoc
iatio
n W
atso
n W
oods
Rip
aria
n P
rese
rve
Res
tora
tion
Pro
ject
Fin
al R
epor
t
288
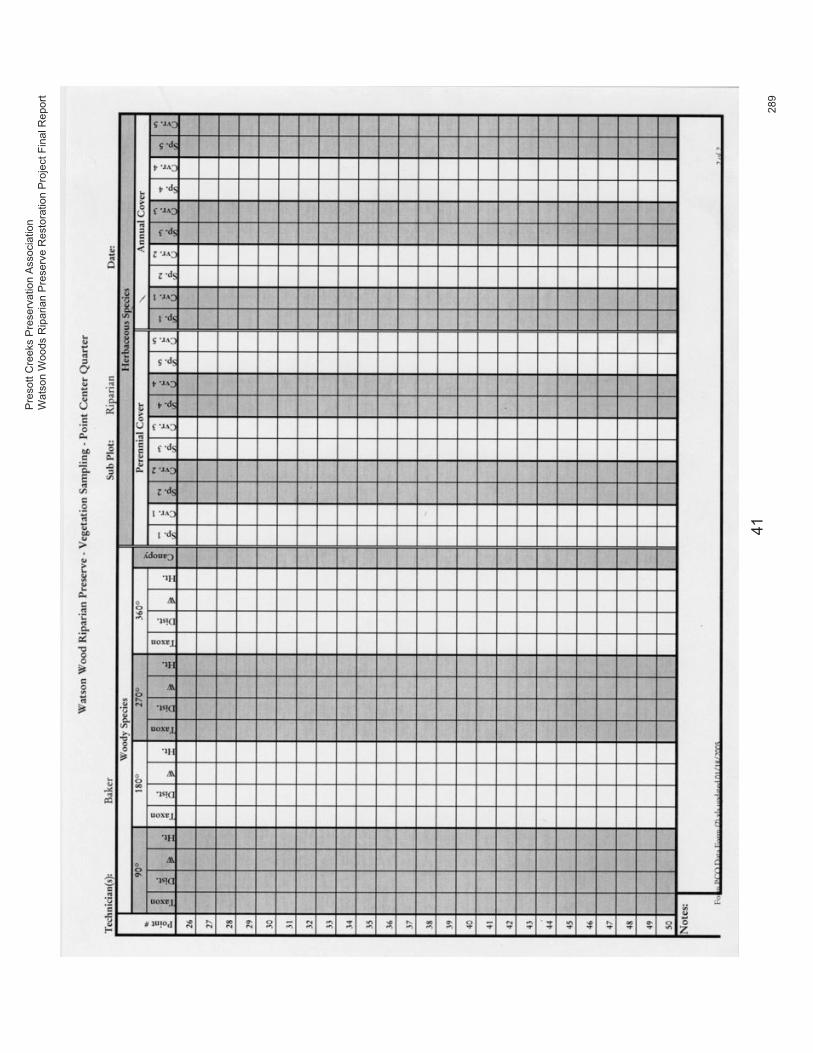
41
Pre
sott
Cre
eks
Pre
serv
atio
n A
ssoc
iatio
n W
atso
n W
oods
Rip
aria
n P
rese
rve
Res
tora
tion
Pro
ject
Fin
al R
epor
t
289

41
Appendix 2. Reference point photos.
Prescott Creeks Preservation Association Watson Woods Riparian Preserve Restoration Project Final Report
290

42
Reference point 1, 1997 Reference point 1, 2006
Reference point 2, 1997 Reference point 2, 2006
Reference point 3, 1997 Reference point 3, 2006
Presott Creeks Preservation Association Watson Woods Riparian Preserve Restoration Project Final Report
291
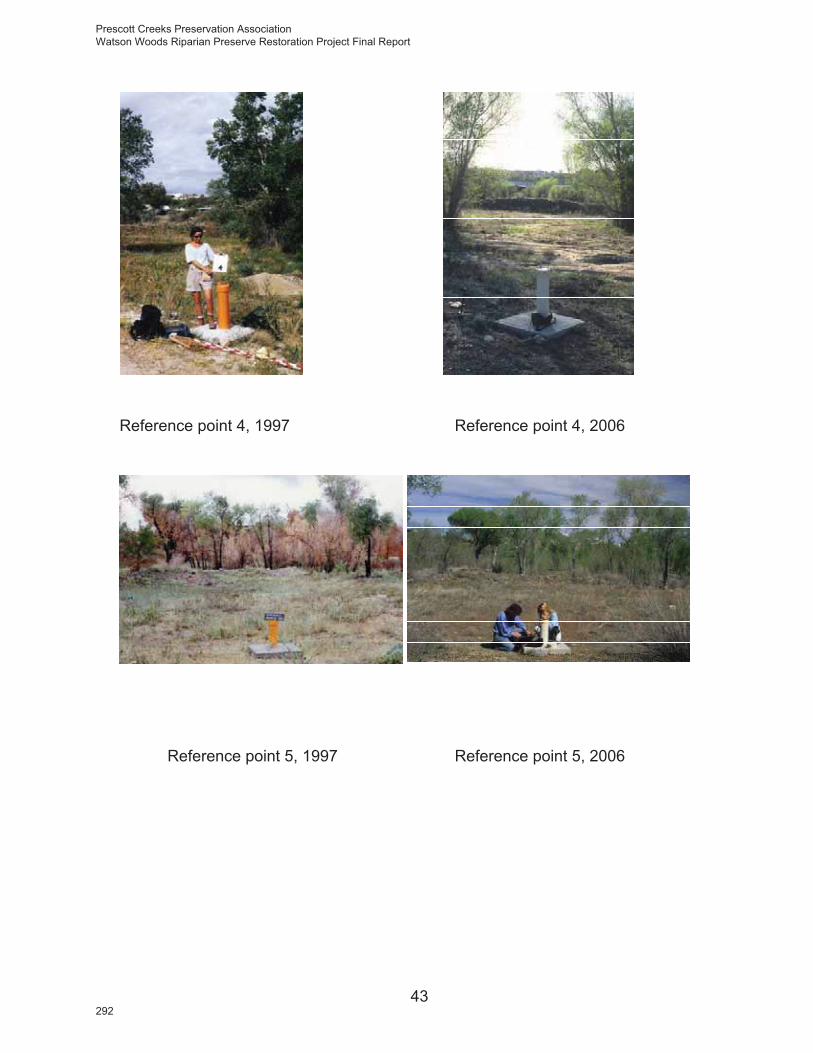
43
Reference point 4, 1997 Reference point 4, 2006
Reference point 5, 1997 Reference point 5, 2006
Prescott Creeks Preservation Association Watson Woods Riparian Preserve Restoration Project Final Report
292

44
Reference point 6, 1997 Reference point 6, 2006
Reference point 7, 1997 Reference point 7, 2006
Presott Creeks Preservation Association Watson Woods Riparian Preserve Restoration Project Final Report
293

Appendix 3. Transect photos for 1997, 2005, and 2012.
Prescott Creeks Preservation Association Watson Woods Riparian Preserve Restoration Project Final Report
294

44
FHD transect 1, 00m, 1997.
FHD transect 1, 20m, 1997.
FHD transect 2, 00m, 1997.
FHD transect 1, 00m, 2005.
FHD transect 1, 20m, 2005.
FHD transect 2, 00m, 2005.
FHD transect 1, 00m, 2012.
FHD transect 1, 20m, 2012.
FHD transect 2, 00m, 2012.
Presott Creeks Preservation Association Watson Woods Riparian Preserve Restoration Project Final Report
295

45
FHD
tran
sect
2, 2
0m, 1
997.
FHD
tran
sect
3, 0
0m, 1
997.
FHD
tran
sect
2, 2
0m, 2
005.
FHD
tran
sect
3, 0
0m, 2
005.
FHD
tran
sect
2, 2
0m, 2
012.
FHD
tran
sect
3, 0
0m, 2
012.
Pre
scot
t Cre
eks
Pre
serv
atio
n A
ssoc
iatio
n W
atso
n W
oods
Rip
aria
n P
rese
rve
Res
tora
tion
Pro
ject
Fin
al R
epor
t
296

46
.
FHD
tran
sect
4, 0
0m, 1
997.
FHD
tran
sect
3, 2
0m, 2
005.
FHD
tran
sect
4, 0
0m, 2
005.
FHD
tran
sect
3, 2
0m, 2
012.
FHD
tran
sect
4, 0
0m, 2
012.
FHD
tran
sect
3, 2
0m, 1
997.
Pre
sott
Cre
eks
Pre
serv
atio
n A
ssoc
iatio
n W
atso
n W
oods
Rip
aria
n P
rese
rve
Res
tora
tion
Pro
ject
Fin
al R
epor
t
297

47
FHD
trans
ect4
,20m
,FH
D tr
anse
ct 4
, 20m
, 199
7.
FHD
tran
sect
5, 0
0m, 1
997.
FH
D tr
anse
ct 5
, 20m
, 199
7.
FHD
tran
sect
4, 2
0m, 2
005.
Pre
scot
t Cre
eks
Pre
serv
atio
n A
ssoc
iatio
n W
atso
n W
oods
Rip
aria
n P
rese
rve
Res
tora
tion
Pro
ject
Fin
al R
epor
t
298

48
FHD transect 6, 20m, 1997.
FHD transect 7, 00m, 1997.
FHD transect 6, 00m, 1997. FHD transect 6, 00m, 2005.
FHD transect 6, 20m, 2005.
FHD transect 7, 00m, 2005.
FHD transect 6, 00m, 2012.
FHD transect 6, 20m, 2012.
FHD transect 7, 00m, 2012.
Presott Creeks Preservation Association Watson Woods Riparian Preserve Restoration Project Final Report
299
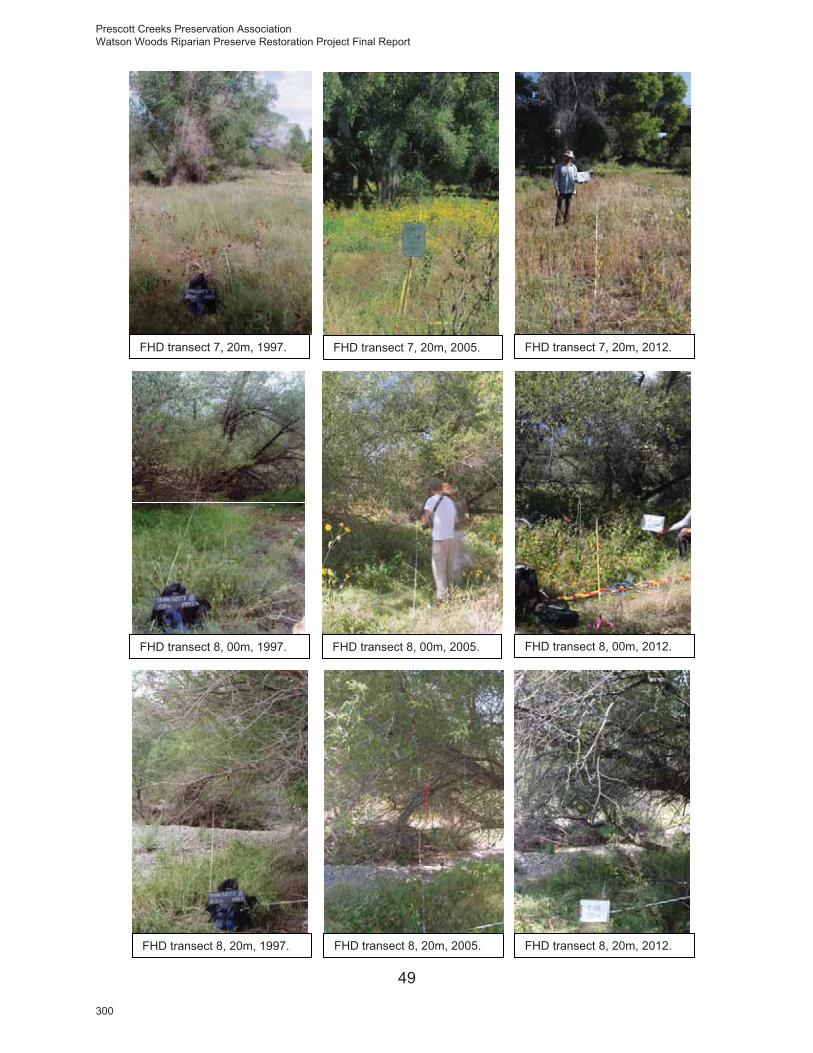
49
FHD transect 7, 20m, 1997.
FHD transect 8, 00m, 1997.
FHD transect 8, 20m, 1997.
FHD transect 7, 20m, 2005.
FHD transect 8, 00m, 2005.
FHD transect 8, 20m, 2005.
FHD transect 7, 20m, 2012.
FHD transect 8, 00m, 2012.
FHD transect 8, 20m, 2012.
Prescott Creeks Preservation Association Watson Woods Riparian Preserve Restoration Project Final Report
300
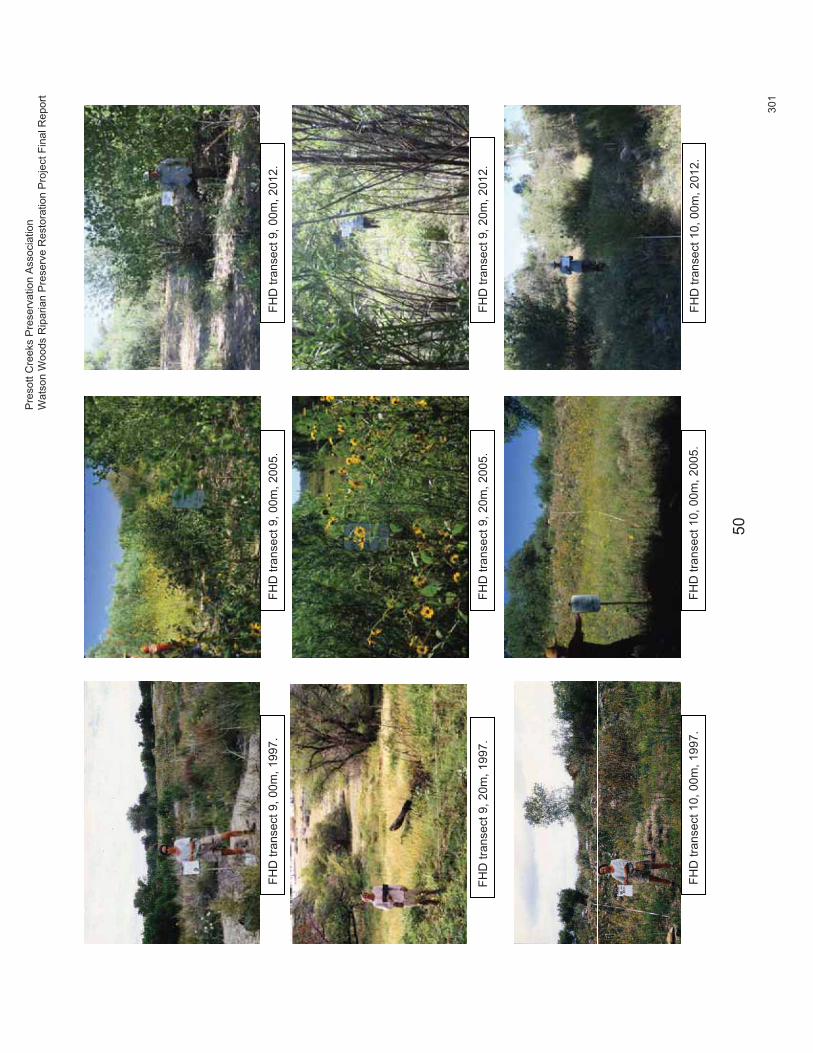
50
FHD
tran
sect
9, 0
0m, 1
997.
FHD
tran
sect
9, 2
0m, 1
997.
FHD
tran
sect
9, 0
0m, 2
005.
FHD
tran
sect
9, 2
0m, 2
005.
FHD
tran
sect
10,
00m
, 200
5.FH
D tr
anse
ct 1
0, 0
0m, 1
997.
FHD
tran
sect
9, 0
0m, 2
012.
FHD
tran
sect
9, 2
0m, 2
012.
FHD
tran
sect
10,
00m
, 201
2.
Pre
sott
Cre
eks
Pre
serv
atio
n A
ssoc
iatio
n W
atso
n W
oods
Rip
aria
n P
rese
rve
Res
tora
tion
Pro
ject
Fin
al R
epor
t
301

51
FHD
tran
sect
10,
20m
, 199
7.
FHD
tran
sect
11,
00m
, 199
7.
FHD
tran
sect
10,
20m
, 200
5.
FHD
tran
sect
11,
00m
, 200
5.
FHD
tran
sect
11,
20m
, 200
5.FH
D tr
anse
ct 1
1, 2
0m, 1
997.
FHD
tran
sect
10,
20m
, 201
2.
FHD
tran
sect
11,
00m
, 201
2.
FHD
tran
sect
11,
20m
, 201
2.
Pre
scot
t Cre
eks
Pre
serv
atio
n A
ssoc
iatio
n W
atso
n W
oods
Rip
aria
n P
rese
rve
Res
tora
tion
Pro
ject
Fin
al R
epor
t
302

52
FHD
tran
sect
12,
00m
, 199
7.
FHD
tran
sect
12,
20m
, 199
7.
FHD
tran
sect
13,
00m
, 199
7.
FHD
tran
sect
12,
00m
, 200
5.
FHD
tran
sect
12,
20m
, 200
5.
FHD
tran
sect
13,
00m
, 200
5.
FHD
tran
sect
12,
00m
, 201
2.
FHD
tran
sect
12,
20m
,
FHD
tran
sect
13,
00m
, 201
2.
Pre
sott
Cre
eks
Pre
serv
atio
n A
ssoc
iatio
n W
atso
n W
oods
Rip
aria
n P
rese
rve
Res
tora
tion
Pro
ject
Fin
al R
epor
t
303

53
FHD
tran
sect
13,
20m
, 199
7.
FHD
tran
sect
14,
00m
, 199
7.
FHD
tran
sect
14,
20m
, 199
7.
FHD
tran
sect
13,
20m
, 200
5.
FHD
tran
sect
14,
00m
, 200
5.
FHD
tran
sect
14,
20m
, 200
5.
FHD
tran
sect
13,
20m
, 201
2.
FHD
tran
sect
14,
00m
, 201
2.
FHD
tran
sect
14,
20m
, 201
2.
Pre
scot
t Cre
eks
Pre
serv
atio
n A
ssoc
iatio
n W
atso
n W
oods
Rip
aria
n P
rese
rve
Res
tora
tion
Pro
ject
Fin
al R
epor
t
304

54
FHD
tran
sect
15,
00m
, 199
7.
FHD
tran
sect
15,
20m
, 199
7.
FHD
tran
sect
16,
00m
, 199
7.
FHD
tran
sect
15,
00m
, 200
5.
FHD
tran
sect
16,
00m
, 200
5.
FHD
tran
sect
15,
20m
, 200
5.
FHD
tran
sect
15,
00m
, 201
2.
FHD
tran
sect
15,
20m
, 201
2.
FHD
tran
sect
16,
00m
, 201
2.
Pre
sott
Cre
eks
Pre
serv
atio
n A
ssoc
iatio
n W
atso
n W
oods
Rip
aria
n P
rese
rve
Res
tora
tion
Pro
ject
Fin
al R
epor
t
305

55
FHD
tran
sect
16,
20m
, 199
7.
FHD
tran
sect
17,
00m
, 199
7.
FHD
tran
sect
17,
20m
, 199
7.
FHD
tran
sect
16,
20m
, 200
5.
FHD
tran
sect
17,
00m
, 200
5.
FHD
tran
sect
17,
20m
, 200
5.
FHD
tran
sect
16,
20m
, 201
2.
FHD
tran
sect
17,
00m
, 201
2.
FHD
tran
sect
17,
20m
, 201
2.
Pre
scot
t Cre
eks
Pre
serv
atio
n A
ssoc
iatio
n W
atso
n W
oods
Rip
aria
n P
rese
rve
Res
tora
tion
Pro
ject
Fin
al R
epor
t
306
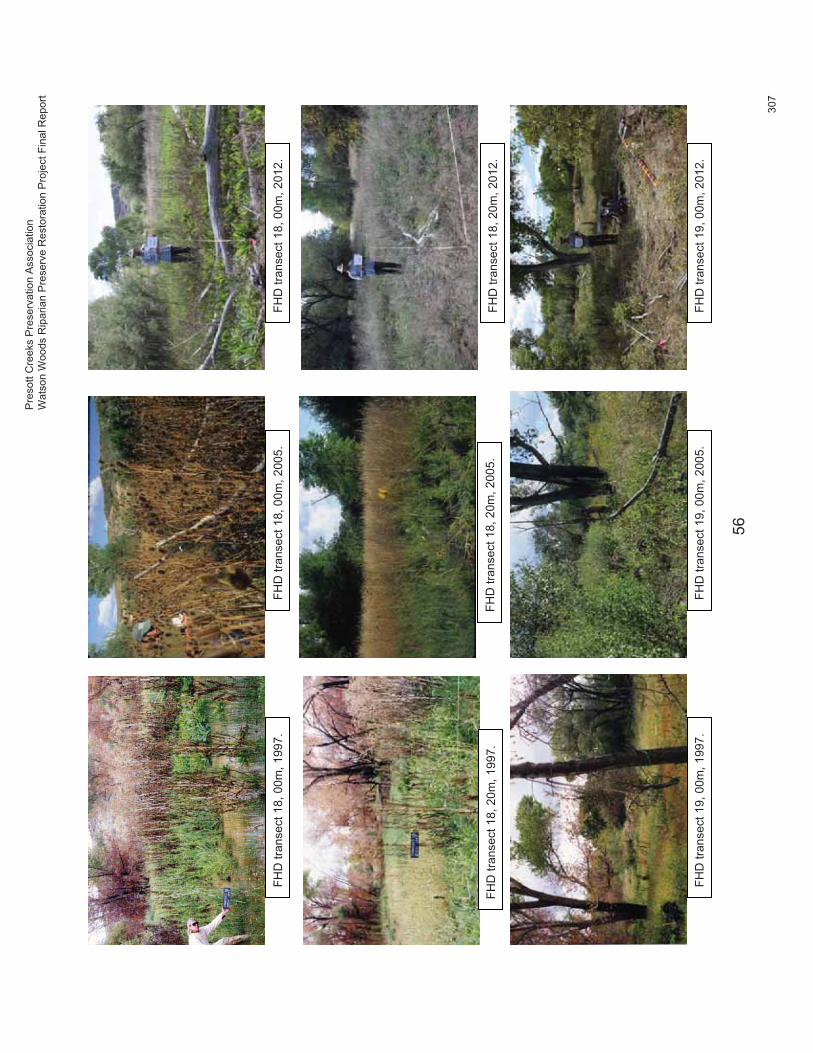
56
FHD
tran
sect
18,
00m
, 199
7.
FHD
tran
sect
18,
20m
, 199
7.
FHD
tran
sect
19,
00m
, 199
7.
FHD
tran
sect
18,
00m
, 200
5.
FHD
tran
sect
18,
20m
, 200
5.
FHD
tran
sect
19,
00m
, 200
5.
FHD
tran
sect
18,
00m
, 201
2.
FHD
tran
sect
18,
20m
, 201
2.
FHD
tran
sect
19,
00m
, 201
2.
Pre
sott
Cre
eks
Pre
serv
atio
n A
ssoc
iatio
n W
atso
n W
oods
Rip
aria
n P
rese
rve
Res
tora
tion
Pro
ject
Fin
al R
epor
t
307

57
FHD
tran
sect
19,
20m
, 199
7.
FHD
tran
sect
20,
00m
, 199
7.
FHD
tran
sect
20,
20m
, 199
7.
FHD
tran
sect
19,
20m
, 200
5.
FHD
tran
sect
20,
00m
, 200
5.
FHD
tran
sect
20,
20m
, 200
5.
FHD
tran
sect
19,
20m
, 201
2.
FHD
tran
sect
20,
00m
, 201
2.
FHD
tran
sect
20,
20m
, 201
2.
Pre
scot
t Cre
eks
Pre
serv
atio
n A
ssoc
iatio
n W
atso
n W
oods
Rip
aria
n P
rese
rve
Res
tora
tion
Pro
ject
Fin
al R
epor
t
308

58
v
FHD
tran
sect
21,
00m
, 199
7.
FHD
tran
sect
21,
20m
, 199
7.
FHD
tran
sect
22,
00m
, 199
7.
FHD
tran
sect
21,
00m
, 200
5.
FHD
tran
sect
21,
20m
, 200
5.
FHD
tran
sect
22,
00m
, 200
5.
FHD
tran
sect
21,
00m
, 201
2.
FHD
tran
sect
21,
20m
, 201
2.
FHD
tran
sect
22,
00m
, 201
2.
Pre
sott
Cre
eks
Pre
serv
atio
n A
ssoc
iatio
n W
atso
n W
oods
Rip
aria
n P
rese
rve
Res
tora
tion
Pro
ject
Fin
al R
epor
t
309

59
FHD
tran
sect
22,
20m
, 199
7.
FHD
tran
sect
23,
00m
, 199
7.
FHD
tran
sect
23,
20m
, 199
7.
FHD
tran
sect
22,
20m
, 200
5.
FHD
tran
sect
23,
00m
, 200
5.
FHD
tran
sect
23,
20m
, 200
5.
FHD
tran
sect
22,
20m
, 201
2.
FHD
tran
sect
23,
00m
, 201
2.
FHD
tran
sect
23,
20m
, 201
2.
Pre
scot
t Cre
eks
Pre
serv
atio
n A
ssoc
iatio
n W
atso
n W
oods
Rip
aria
n P
rese
rve
Res
tora
tion
Pro
ject
Fin
al R
epor
t
310
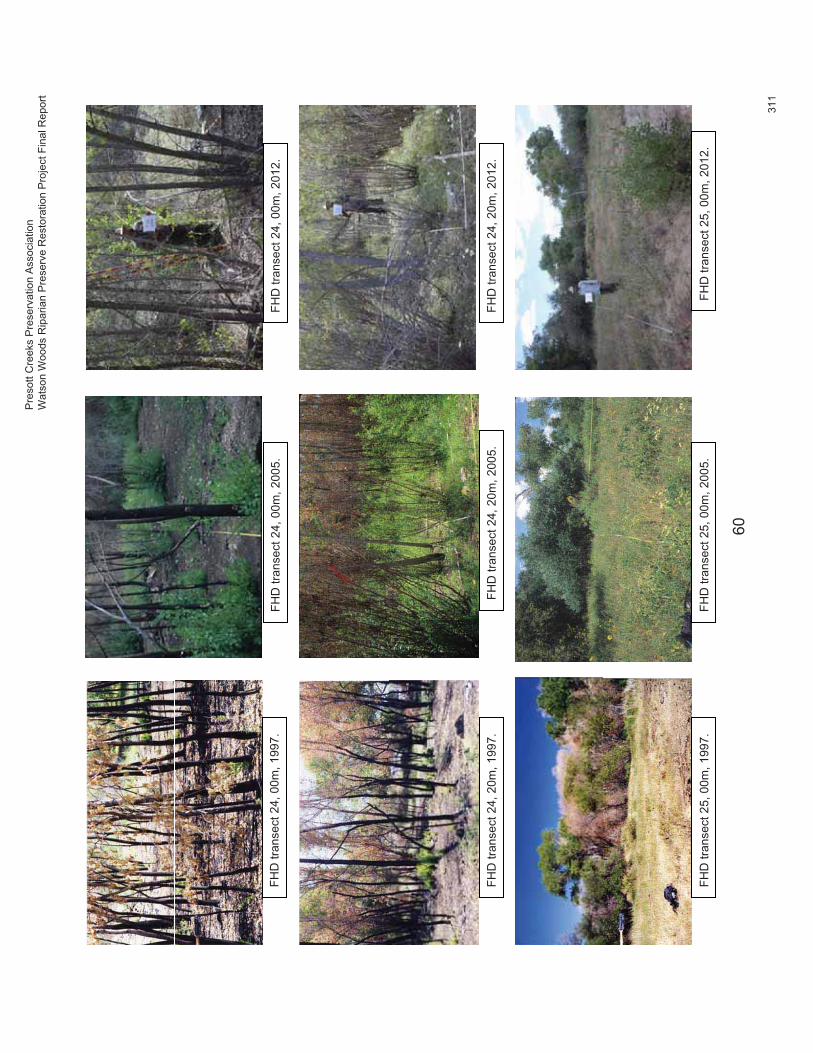
60
FHD
tran
sect
24,
00m
, 199
7.
FHD
tran
sect
24,
20m
, 199
7.
FHD
tran
sect
25,
00m
, 199
7.
FHD
tran
sect
24,
00m
, 200
5.
FHD
tran
sect
24,
20m
, 200
5.
FHD
tran
sect
25,
00m
, 200
5.
FHD
tran
sect
24,
00m
, 201
2.
FHD
tran
sect
24,
20m
, 201
2.
FHD
tran
sect
25,
00m
, 201
2.
Pre
sott
Cre
eks
Pre
serv
atio
n A
ssoc
iatio
n W
atso
n W
oods
Rip
aria
n P
rese
rve
Res
tora
tion
Pro
ject
Fin
al R
epor
t
311

61
FHD
tran
sect
15,
20m
, 199
7.
FHD
tran
sect
26,
00m
, 199
7.
FHD
tran
sect
26,
20m
, 199
7.
FHD
tran
sect
25,
20m
, 200
5.
FHD
tran
sect
26,
00m
, 200
5.
FHD
tran
sect
26,
20m
, 200
5.
FHD
tran
sect
25,
20m
, 201
2.
FHD
tran
sect
26,
00m
,
FHD
tran
sect
26,
200m
, 201
2.
Pre
scot
t Cre
eks
Pre
serv
atio
n A
ssoc
iatio
n W
atso
n W
oods
Rip
aria
n P
rese
rve
Res
tora
tion
Pro
ject
Fin
al R
epor
t
312

Appendix 4. FHD graphs, by transect, for 1997, 2005, and 2012.
Presott Creeks Preservation Association Watson Woods Riparian Preserve Restoration Project Final Report
313

62
METER POINT ALONG TRANSECT 1
0 2 4 6 8 10 12 14 16 18 20 22 24 26 28 30 32 34 36 38 40
HE
IGH
T (m
)
0123456789
1011121314151617181920
Ambrosia psilostachyaOpuntia macrorhizaUlmus pumila
Foliar height distribution along transect 01, 1998
Foliar height distribution along transect 01, 2005.
Foliar height distribution along transect 01, 2012
METER POINT ALONG TRANSECT 1
0 2 4 6 8 10 12 14 16 18 20 22 24 26 28 30 32 34 36 38 40
HEI
GH
T (m
)
0123456789
1011121314151617181920
Ambrosia psilostachyaAchillea millefoliumArtemisia caruthiiElymus canadensisMelilotus officinalisMirabilis longifloraPopulus fremontiiRumus crispusUlmus pumila
METER POINT ALONG TRANSECT 1
0 2 4 6 8 1012 14 16 18 2022 24 26 28 30 32 34363840
HEI
GH
T (m
)
0123456789
1011121314151617181920
Achillia millefolia Ambrosia psilostachya Artemisia carruthii Brickellia floribunda Datura wrightii Festuca arundinaceaLathyrus latifolius Opuntia macrorhiza
Populus fremontii Rumex hymenosepalus Sporobolus cryptandrus Ulmus pumila
Prescott Creeks Preservation Association Watson Woods Riparian Preserve Restoration Project Final Report
314

63
Foliar height distribution along transect 02, 2005.
Foliar height distribution along transect 02, 2012.
METER POINT ALONG TRANSECT 2
0 2 4 6 8 10 12 14 16 18 2022 24 26 28 30 32 34 36 38 40
HE
IGH
T (m
)
0123456789
1011121314151617181920
Achillea millefoliumElymus elymoidesPascopyrum smithiiSalix laevigataTypha latifolia
METER POINT ALONG TRANSECT 2
0 2 4 6 8 10 12 14 16 18 20 22 24 26 28 30 32 34 36 38 40
HE
IGH
T (m
)
0123456789
1011121314151617181920
Ambrosia psilostachyaEleocharis parishiiElymus trachycaulusMelilotus officinalisPopulus fremontiiRumex crispusSalix laevigata
Foliar height distribution along transect 02, 1998.
METER POINT ALONG TRANSECT 2
0 2 4 6 8 10 12 14 16 18 20 22 24 26 28 30 32 34 36 38 40
HEI
GH
T (m
)
0123456789
1011121314151617181920
Festuca arundinacea Populus fremontii Rumex crispus Salix laevigata
Presott Creeks Preservation Association Watson Woods Riparian Preserve Restoration Project Final Report
315

64
METER POINT ALONG TRANSECT 3
0 2 4 6 8 10 12 14 16 18 20 22 24 26 28 30 32 34 36 38 40
HEI
GH
T (m
)
0123456789
1011121314151617181920
Populus fremontiiSalix laevigata
Foliar height distribution along transect 03, 2005.
METER POINT ALONG TRANSECT 3
0 2 4 6 8 10 12 14 16 18 20 22 24 26 28 30 32 34 36 38 40
HE
IGH
T (m
)
0123456789
1011121314151617181920
Datura wrightiiFestuca arundinaceaMelilotus officinalisMirabilis longifloraPopulus fremontiiSalix laevigataVerbascum thapsus
Foliar height distribution along transect 03, 1998.
Foliar height distribution along transect 03, 2012.
METER POINT ALONG TRANSECT 3
0 2 4 6 8 10 12 14 16 18 20 22 24 26 28 30 32 34 36 38 40
HEI
GH
T (m
)
0123456789
1011121314151617181920
Ambrosia psilostachya
Aster lanceolatusFestuca arundinaceaMirabilis longifloraPopulus fremontiiSalix laevigata
Prescott Creeks Preservation Association Watson Woods Riparian Preserve Restoration Project Final Report
316

65
METER POINT ALONG TRANSECT 4
0 2 4 6 8 10 12 14 16 18 2022 24 26 28 30 32 34 36 38 40
HEI
GH
T (m
)
0123456789
1011121314151617181920
Ambrosia psilostachyaEleocharis palustrisFestuca arundinaceaJuncus balticusRumex crispusSalix laevigataSalix lasioepis
Foliar height distribution along transect 04, 2005.
METER POINT ALONG TRANSECT 4
0 2 4 6 8 10 12 14 16 18 20 22 24 26 28 30 32 34 36 38 40
HE
IGH
T (m
)
0123456789
1011121314151617181920
Agrostis viridisAster lanceolatusCynodon dactylonElymus elymoidesElymus glaucusEleocharis parishii Elymus trachycaulusFestuca arundinaceaJuncus nevadensisMachaerathera canescensMelilotus officinalisPopulus fremontiiPopulus xhinckleyanaPolygonum lapathifoliumSalix laevigataSalix lasiolepis
Foliar height distribution along transect 04, 1998.
Foliar height distribution along transect 04, 2012.
METER POINT ALONG TRANSECT 4
0 2 4 6 8 10 12 14 16 18 20 22 24 26 28 30 32 34 36 38 40
HEI
GH
T (m
)
0123456789
1011121314151617181920
Aster Lanceolatus
Eleocharis parishii Festuca arundinacea Juncus nevadensisPopulus fremontiiPolypogon viridisRumux crispusSalix laevigataSalix lasiolepis
Presott Creeks Preservation Association Watson Woods Riparian Preserve Restoration Project Final Report
317
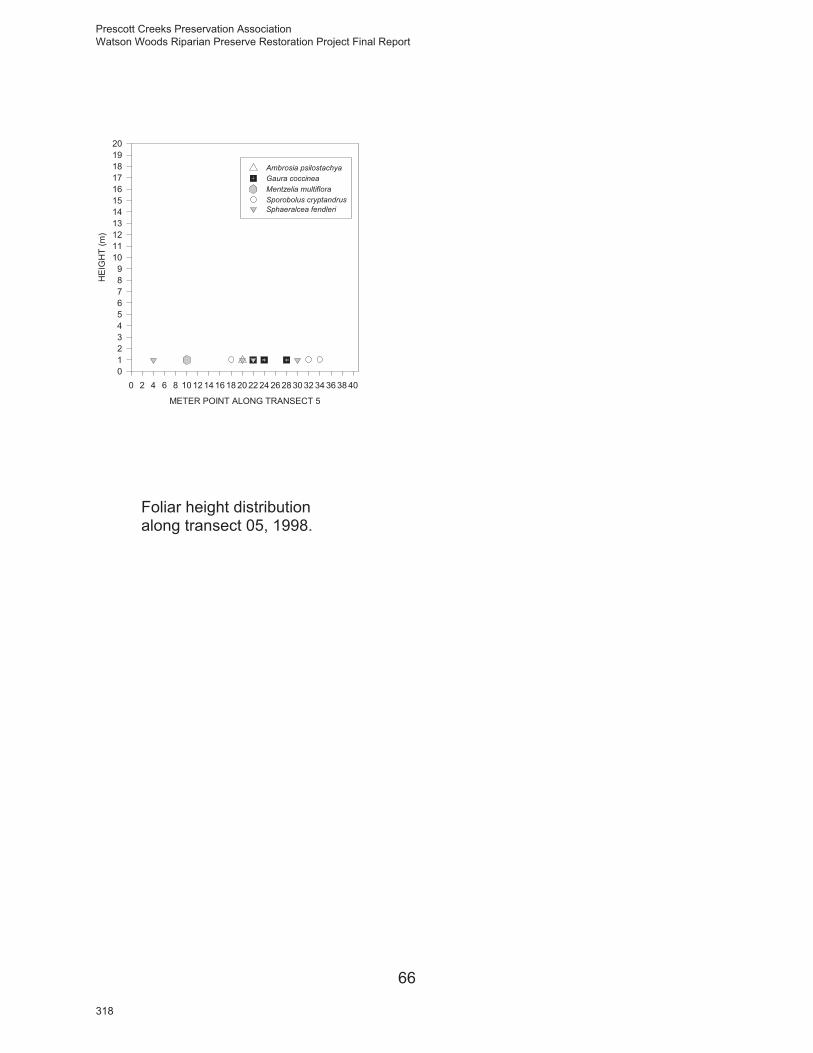
66
METER POINT ALONG TRANSECT 5
0 2 4 6 8 10 12 14 16 18 20 22 24 26 28 30 32 34 36 38 40
HE
IGH
T (m
)
0123456789
1011121314151617181920
Ambrosia psilostachyaGaura coccineaMentzelia multifloraSporobolus cryptandrusSphaeralcea fendleri
Foliar height distribution along transect 05, 1998.
Prescott Creeks Preservation Association Watson Woods Riparian Preserve Restoration Project Final Report
318

67
METER POINT ALONG TRANSECT 6
0 2 4 6 8 10 12 14 16 18 20 22 24 26 28 30 32 34 36 38 40
HE
IGH
T (m
)
0123456789
1011121314151617181920
Ambrosia psilostachyaApocynum cannabinumS. gooddingii x. S. laevigataMelilotus albaPascopyrum smithiiPopulus fremontiiSalix laevigataSporobolus cryptandrus
Foliar height distribution along transect 06, 2005.
METER POINT ALONG TRANSECT 6
0 2 4 6 8 10 12 14 16 18 20 22 24 26 28 30 32 34 36 38 40
HE
IGH
T (m
)
0123456789
1011121314151617181920
Ambrosia psilostachyaBrickellia eupatorioidesDatura wrightiiElocharis parishiiFestuca arundinaceaMelilotus officinalisPopulus fremontiiRumex crispusSalix laevigata
Foliar height distribution along transect 06, 1998.
Foliar height distribution along transect 06, 2012.
METER POINT ALONG TRANSECT 6
0 2 4 6 8 10 12 14 16 18 2022 24 26 28 30 32 34 36 38 40
HEI
GH
T (m
)
0123456789
1011121314151617181920
Datura wrightii Festuca arundinacea Lepidium latifolium Populus fremontii Rhus trilobata Salix laevigata
Presott Creeks Preservation Association Watson Woods Riparian Preserve Restoration Project Final Report
319

68
Foliar height distribution along transect 07, 2005.
METER POINT ALONG TRANSECT 7
0 2 4 6 8 10 12 14 16 18 20 22 24 26 28 30 32 34 36 38 40
HE
IGH
T (m
)
0123456789
1011121314151617181920
Ambrosia psilostachyaConvolvulus arvensisLinaria dalmaticaMachaeranthera canescensPascopyrum smithiiSalix laevigataSphaeralcea fendleriSporobolus cryptandrus
METER POINT ALONG TRANSECT 7
0 2 4 6 8 10 12 14 16 18 20 22 24 26 28 30 32 34 36 38 40
HE
IGH
T (m
)
0123456789
1011121314151617181920
Ambrosia psilostachyaConvolvulus arvensisEleocharis palustrisFestuca arundinaceaRumex crispusSalix laevigataSporobolus cryptandrus
Foliar height distribution along transect 07, 1998.
Foliar height distribution along transect 07, 2012.
METER POINT ALONG TRANSECT 7
0 2 4 6 8 10 12 14 16 18 2022 24 26 28 30 32 34 36 38 40
HEI
GH
T (m
)
0123456789
1011121314151617181920
Ambrosia psilostachya Convolvulus arvensis Cucurbita foetidissima Elymus glaucusPascopyrum smithii
Prescott Creeks Preservation Association Watson Woods Riparian Preserve Restoration Project Final Report
320

69
METER POINT ALONG TRANSECT 8
0 2 4 6 8 10 12 14 16 18 2022 24 26 28 30 32 34 36 38 40
HEI
GH
T (m
)
0123456789
1011121314151617181920
Ambrosia psilostachya Brickella floribunda Datura wrightii Elymus glaucusFestuca arundinacea Gnaphalium canescens Melilotus officinalis Mirabilis longiflora Salix laevigata
Foliar height distribution along transect 08, 2005
METER POINT ALONG TRANSECT 8
0 2 4 6 8 10 12 14 16 18 20 22 24 26 28 30 32 34 36 38 40
HE
IGH
T (m
)
0123456789
1011121314151617181920
Ambrosia psilostachyaElymus glaucusFestuca arundinaceaSalix laevigataSalix lasiolepis
Foliar height distribution along transect 08, 1998.
Foliar height distribution along transect 08, 2012.
METER POINT ALONG TRANSECT 8
0 2 4 6 8 10 12 14 16 18 20 22 24 26 28 30 32 34 36 38 40
HE
IGH
T (m
)
0123456789
1011121314151617181920
Ambrosia psilostachyaCucurbita foetidissimaFestuca arundinaceaMelilotus officinalisMirabilis longifloraRumex crispusSalix laevigata
METER POINT ALONG TRANSECT 8
0 2 4 6 8 10 12 14 16 18 20 22 24 26 28 30 32 34 36 38 40
HEI
GH
T (m
)
0123456789
1011121314151617181920
Ambrosia psilostachya Brickella floribunda Datura wrightii Elymus glaucusFestuca arundinacea Gnaphalium canescens Melilotus officinalis Mirabilis longiflora Salix laevigata
Presott Creeks Preservation Association Watson Woods Riparian Preserve Restoration Project Final Report
321
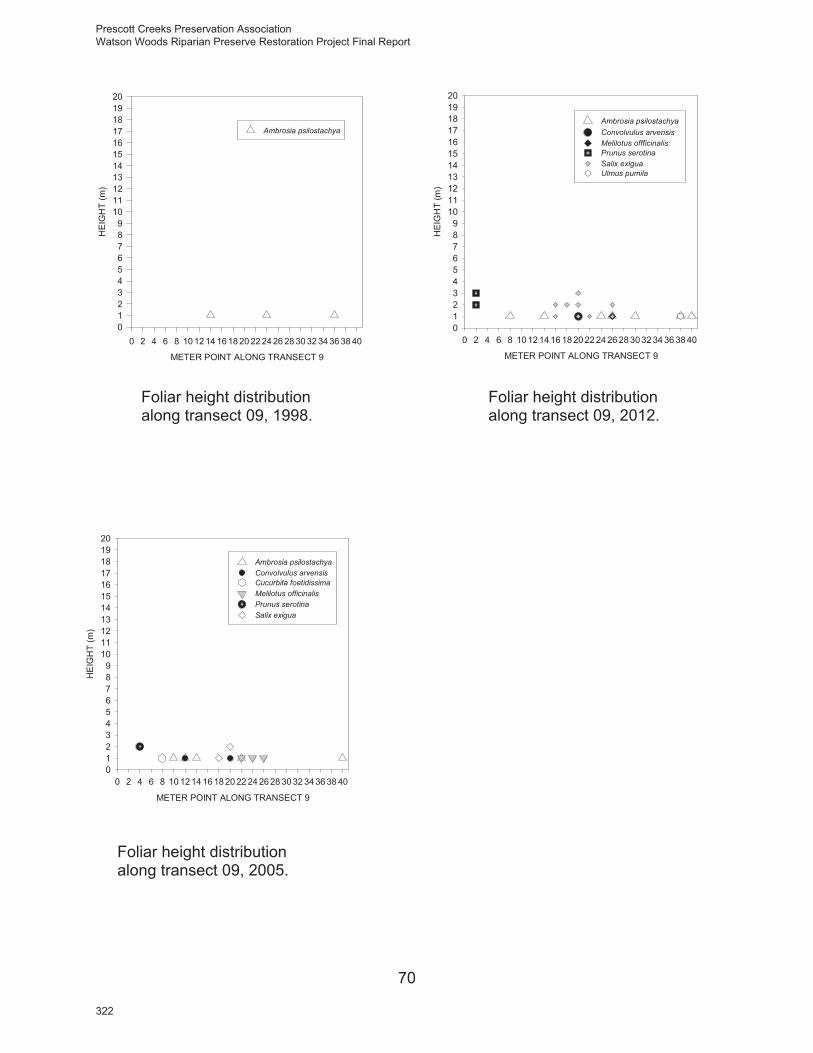
70
Foliar height distribution along transect 08, 2005.
Foliar height distribution along transect 09, 2005.
Foliar height distribution along transect 09, 1998.
Foliar height distribution along transect 09, 2012.
METER POINT ALONG TRANSECT 9
0 2 4 6 8 10 12 14 16 18 20 22 24 26 28 30 32 34 36 38 40
HEI
GH
T (m
)
0123456789
1011121314151617181920
Ambrosia psilostachya Convolvulus arvensis Melilotus offficinalis Prunus serotina Salix exigua Ulmus pumila
METER POINT ALONG TRANSECT 9
0 2 4 6 8 10 12 14 16 18 20 22 24 26 28 30 32 34 36 38 40
HE
IGH
T (m
)
0123456789
1011121314151617181920
Ambrosia psilostachya
METER POINT ALONG TRANSECT 9
0 2 4 6 8 10 12 14 16 18 20 22 24 26 28 30 32 34 36 38 40
HE
IGH
T (m
)
0123456789
1011121314151617181920
Ambrosia psilostachyaConvolvulus arvensisCucurbita foetidissimaMelilotus officinalisPrunus serotinaSalix exigua
Prescott Creeks Preservation Association Watson Woods Riparian Preserve Restoration Project Final Report
322

71
Foliar height distribution along transect 10, 2005.
METER POINT ALONG TRANSECT 10
0 2 4 6 8 10 12 14 16 18 20 22 24 26 28 30 32 34 36 38 40
HEI
GH
T (m
)
0123456789
1011121314151617181920
Ambrosia psilostachyaAristida purpureaConvolvulus arvensisErigonum wrightiiJuglans majorLinaria dalmatica
Foliar height distribution along transect 10, 1998.
Foliar height distribution along transect 10, 2012.
METER POINT ALONG TRANSECT 10
0 2 4 6 8 10 12 14 16 182022 242628 30 32 34 363840
HEI
GH
T (m
)
0123456789
1011121314151617181920
Ambrosia psilostachyaAristida purpureaConvolvulus arvensisElymus elymoidesEriogonum wrightiiJuglans majorMachaeranthera canescensSphaeralcea fendleri
METER POINT ALONG TRANSECT 10
0 2 4 6 8 10 12 14 16 18 20 22 24 26 28 30 32 34 36 38 40
HEI
GH
T (m
)
0123456789
1011121314151617181920
Ambrosia psilostachya Artemisia carruthiiBouteloua curtipendulaBouteloua gracilisConvolvulus arvensisJuglans majorPenstemon eatonSalix exiguaSporobolus cryptandrus
Presott Creeks Preservation Association Watson Woods Riparian Preserve Restoration Project Final Report
323

72
Foliar height distribution along transect 11, 2005.
METER POINT ALONG TRANSECT 11
0 2 4 6 8 10 12 14 16 18 2022 24 26 28 30 32 34 36 38 40
HEI
GH
T (m
)
0123456789
1011121314151617181920
Artemisia ludoviciana Bouteloua curtipendula Brickella floribunda Fallugia paradoxa Populus angustifolia Populus xhinckleyana Sporobolus contractus
METER POINT ALONG TRANSECT 11
0 2 4 6 8 10 12 14 16 18 2022 24 26 28 30 32 34 36 38 40
HEI
GH
T (m
)
0123456789
1011121314151617181920
Aristida divaricataBouteloua curtipendulaCucurbita foetidissimaLinaria dalmaticaMirabilis longifloraPopulus angustifoliaSporobolus contractusSporobolus cryptandrus
Foliar height distribution along transect 11, 1998. Foliar height distribution
along transect 11, 2012.
METER POINT ALONG TRANSECT 11
0 2 4 6 8 10 12 14 16 18 2022 24 26 2830 32 34 36 38 40
HE
IGH
T (m
)
0123456789
1011121314151617181920
Aristida teripesBouteloua curtipendulaBrickellia floribundaCucurbita foetidissimaForestiera pubescensMirabilis longifloraPopulus angustifoliaSphaeralcea fendleriSporobolus contractus
Prescott Creeks Preservation Association Watson Woods Riparian Preserve Restoration Project Final Report
324

73
Foliar height distribution along transect 12, 2005.
METER POINT ALONG TRANSECT 12
0 2 4 6 8 10 12 1416 18 2022 2426 28 30 32 34 36 3840
HEI
GH
T (m
)
0123456789
1011121314151617181920
Ambrosia psilostachyaArtemisia carruthiiOenothera caespitosaPascopyrum smithii
Foliar height distribution along transect 12, 1998.
Foliar height distribution along transect 12, 2012.
METER POINT ALONG TRANSECT 12
0 2 4 6 8 10 12 14 16 182022 24 26 28 3032 3436 38 40
HEI
GH
T (m
)
0123456789
1011121314151617181920
Ambrosia psilostachyaConvolvulus equitansDatura wrightiiFestuca arundinaceaMachaeranthera canescensMelilotus officinalisPopulus fremontiiSporobolus cryptandrus
METER POINT ALONG TRANSECT 12
0 2 4 6 8 10 12 14 16 18 20 22 24 26 28 30 32 34 36 38 40
HEI
GH
T (m
)
0123456789
1011121314151617181920
Achillea millefolium Ambrosia psilostachya
Artemisia carruthii Bouteloua curtipendula Cirsium neomexicanum Convolvulus arvensisFestuca arundinacea Melilotus officinalisPascopyrum smithii Populus fremontiiPopulus xhinckleyana Sporobolus cryptandrus
Presott Creeks Preservation Association Watson Woods Riparian Preserve Restoration Project Final Report
325

74
Foliar height distribution along transect 13, 2005.
METER POINT ALONG TRANSECT 13
0 2 4 6 8 10 12 1416 1820 22 24 2628 30 3234 3638 40
HEI
GH
T (m
)
0123456789
1011121314151617181920
Ambrosia psilostachyaElymus elymoidesMelilotus albaMirabilis longifloraPopulus fremontiiSporobolus cryptandrusSphaeralcea fendleriUlmus pumila
METER POINT ALONG TRANSECT 13
0 2 4 6 8 10 12 14 1618 202224 26 28 30 3234 3638 40
HE
IGH
T (m
)
0123456789
1011121314151617181920
Ambrosia psilostachyaAristida purpureaBouteloua curtipendulaBrickellia eupatorioidesElymus elymoidesMelilotus officinalisMirabilis longifloraPopulus fremontiiSporobolus cryptandrusUlmus pumila
Foliar height distribution along transect 13, 1998.
Foliar height distribution along transect 13, 2012.
METER POINT ALONG TRANSECT 13
0 2 4 6 8 10 12 14 16 18 20 22 24 26 28 30 32 34 36 38 40
HEI
GH
T (m
)
0123456789
1011121314151617181920
Ambrosia psilostachya Achillea millefolium Aristida purpurea Linaria dalmatica Pascopyrum smithii Populus fremontii Sporobolus cryptandrus Sphaeralcea fendleri Ulmus pumila Verbascum thapsus
Prescott Creeks Preservation Association Watson Woods Riparian Preserve Restoration Project Final Report
326

75
Foliar height distribution along transect 14, 2005.
METER POINT ALONG TRANSECT 14
0 2 4 6 8 10 12 14 16 18 20 22 24 26 28 30 32 34 36 38 40
HE
IGH
T (m
)
0123456789
1011121314151617181920
Ambrosia psilostachyaAscelpias subverticillataBrickellia floribundaConvolvulus arvensisFestuca arundinaceaMirabilis longifloraPopulus angustifoliaSphaeralcea fendleriSporobolus cryptandrus
METER POINT ALONG TRANSECT 14
0 2 4 6 8 10 12 14 16 18 20 22 24 26 28 30 32 34 36 38 40
HE
IGH
T (m
)
0123456789
1011121314151617181920
Achillea millefoliumBouteloua curtipendulaBrickellia floribundaCarex occidentalisElymus glaucusGnapalium canescensLinaria dalmaticaMirabilis longifloraPopulus angustifoliaPopulus xhinckleyanaSalix laevigataSphaeralcea fendleri
Foliar height distribution along transect 14, 1998.
Foliar height distribution along transect 14, 2012.
METER POINT ALONG TRANSECT 14
0 2 4 6 8 10 12 14 16 18 20 22 24 26 28 30 32 34 36 38 40
HEI
GH
T (m
)
0123456789
1011121314151617181920
Achillea millefolium Ambrosia psilostachya Brickella floribunda Carex occidentalisFestuca arundinacea
Populus angustifolia Populus fremontii Salix lasiolepis
Presott Creeks Preservation Association Watson Woods Riparian Preserve Restoration Project Final Report
327

76
Foliar height distribution along transect 15, 2005.
.
METER POINT ALONG TRANSECT 15
0 2 4 6 8 10 12 14 16 18 20 22 24 26 28 30 32 34 36 38 40
HE
IGH
T (m
)
0123456789
1011121314151617181920
Achillea millefoliumAmbrosia psilostachyaJuncus balticusPopulus fremontiiSalix laevigataSporobolus cryptandrusVerbascum thapsus
METER POINT ALONG TRANSECT 15
0 2 4 6 8 10 12 14 16 18 20 22 24 26 28 30 32 34 36 38 40
HE
IGH
T (m
)
0123456789
1011121314151617181920
Achillea millefoliumAmbrosia psilostachyaElymus elymoidesEleocharis palustrisFestuca arundinaceaJuncus balticusLinaria dalmaticaMelilotus officinalisPopulus fremontiiRumex crispusSalix laevigata
Foliar height distribution along transect 15, 1998.
Foliar height distribution along transect 15, 2012.
METER POINT ALONG TRANSECT 15
0 2 4 6 8 10 12 14 16 18 20 22 24 26 28 30 32 34 36 38 40
HEI
GH
T (m
)
0123456789
1011121314151617181920
Ambrosia psilostachya Aster falcatus Eleocharis parishii Festuca arundinacea Juncus balticus Populus fremontii salix laevigata
Prescott Creeks Preservation Association Watson Woods Riparian Preserve Restoration Project Final Report
328

77
Foliar height distribution along transect 16, 2005.
METER POINT ALONG TRANSECT 16
0 2 4 6 8 10 12 14 16 18 2022 24 26 28 30 32 34 36 38 40
HEI
GH
T (m
)
0123456789
1011121314151617181920
Ambrosia psilostachya Bouteloua curtipendula Convolvulus arvensis Cucurbita foetidissima Datura wrightii Juglans major Mirabilis longiflora Pascopyrum smithii Ribes cereum Salix exigua Salix lasiolepis Sporobolus cryptandrus Ulmus pumila
METER POINT ALONG TRANSECT 16
0 2 4 6 8 10 12 1416 18 2022 24 26 28 30 32 34 36 38 40
HE
IGH
T (m
)
0123456789
1011121314151617181920
Ambrosia psilostachyaConvolvulus arvensisDatura wrightiiMirabilis longifloraSalix exigua
METER POINT ALONG TRANSECT 16
0 2 4 6 8 10 12 14 16 18 20 22 24 26 28 30 32 34 36 38 40
HE
IGH
T (m
)
0123456789
1011121314151617181920
Ambrosia psilostachyaConvolvulus arvensisCucurbita foetidissimaJuglans majorMirabilis longifloraPascopyrum smithiiSalix exigua
Foliar height distribution along transect 16, 1998.
Foliar height distribution along transect 16, 2012.
Presott Creeks Preservation Association Watson Woods Riparian Preserve Restoration Project Final Report
329
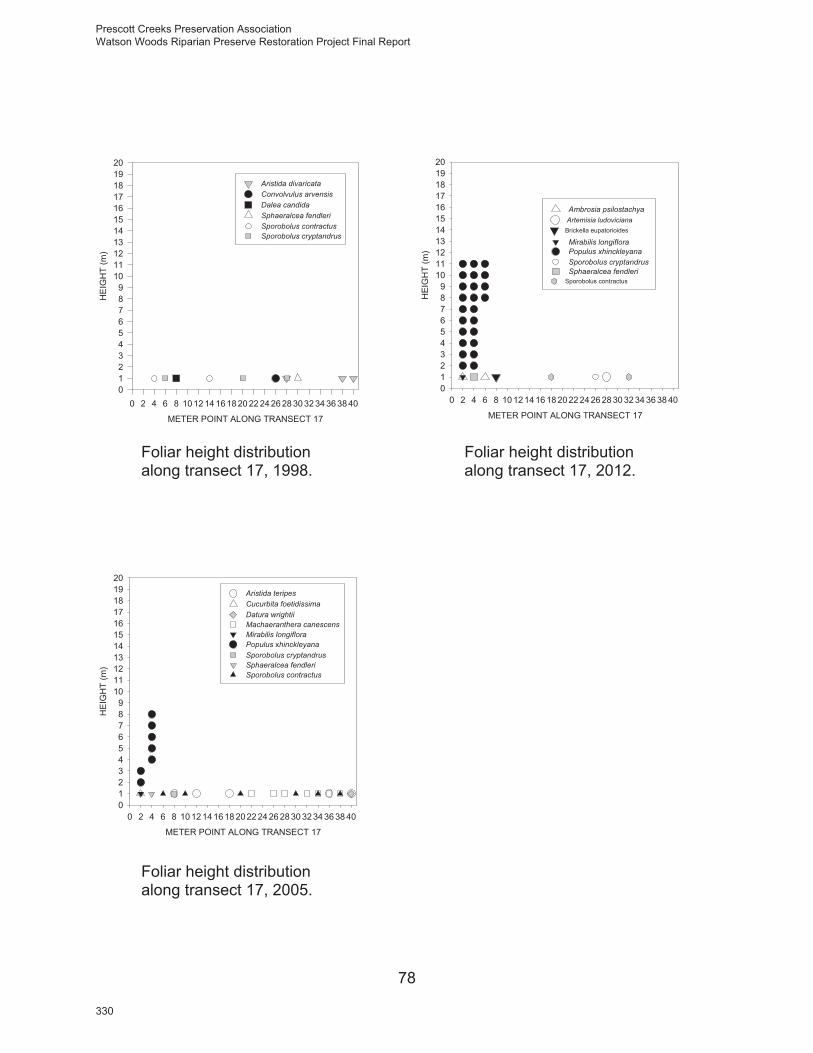
78
Foliar height distribution along transect 17, 2005.
METER POINT ALONG TRANSECT 17
0 2 4 6 8 10 12 14 16 18 2022 24 26 28 30 32 34 36 38 40
HEI
GH
T (m
)
0123456789
1011121314151617181920
Ambrosia psilostachya Artemisia ludoviciana
Brickella eupatorioides
Mirabilis longifloraPopulus xhinckleyana Sporobolus cryptandrus Sphaeralcea fendleri
Sporobolus contractus
METER POINT ALONG TRANSECT 17
0 2 4 6 8 10 12 14 16 18 20 22 24 26 28 30 32 34 36 38 40
HE
IGH
T (m
)
0123456789
1011121314151617181920
Aristida divaricataConvolvulus arvensisDalea candidaSphaeralcea fendleriSporobolus contractusSporobolus cryptandrus
METER POINT ALONG TRANSECT 17
0 2 4 6 8 10 12 14 16 18 20 22 24 26 28 30 32 34 36 38 40
HEI
GH
T (m
)
0123456789
1011121314151617181920
Aristida teripesCucurbita foetidissimaDatura wrightiiMachaeranthera canescensMirabilis longifloraPopulus xhinckleyanaSporobolus cryptandrusSphaeralcea fendleriSporobolus contractus
Foliar height distribution along transect 17, 1998.
Foliar height distribution along transect 17, 2012.
Prescott Creeks Preservation Association Watson Woods Riparian Preserve Restoration Project Final Report
330

79
Foliar height distribution along transect 18, 2005.
METER POINT ALONG TRANSECT 18
0 2 4 6 8 10 12 14 16 18 20 22 24 26 28 30 32 34 36 38 40
HEI
GH
T (m
)
0123456789
1011121314151617181920
Convolfulus arvensis Elymus glaucus Festuca arundinacea Juncus balticus Rumex crispus
Salix exigua
METER POINT ALONG TRANSECT 18
0 2 4 6 8 10 12 14 16 18 2022 24 26 28 30 32 34 36 38 40
HE
IGH
T (m
)
0123456789
1011121314151617181920
Ambrosia psilostachyaFestuca arundinaceaJuncus balticusMuhlenbergia rigensSalix exigua
METER POINT ALONG TRANSECT 18
0 2 4 6 8 10 12 14 16 18 20 22 24 26 28 30 32 34 36 38 40
HE
IGH
T (m
)
0123456789
1011121314151617181920
Ambrosia psilostachyaFestuca arundinaceaJuncus balticusRumex crispus
Foliar height distribution along transect 18, 1998.
Foliar height distribution along transect 18, 2012.
Presott Creeks Preservation Association Watson Woods Riparian Preserve Restoration Project Final Report
331
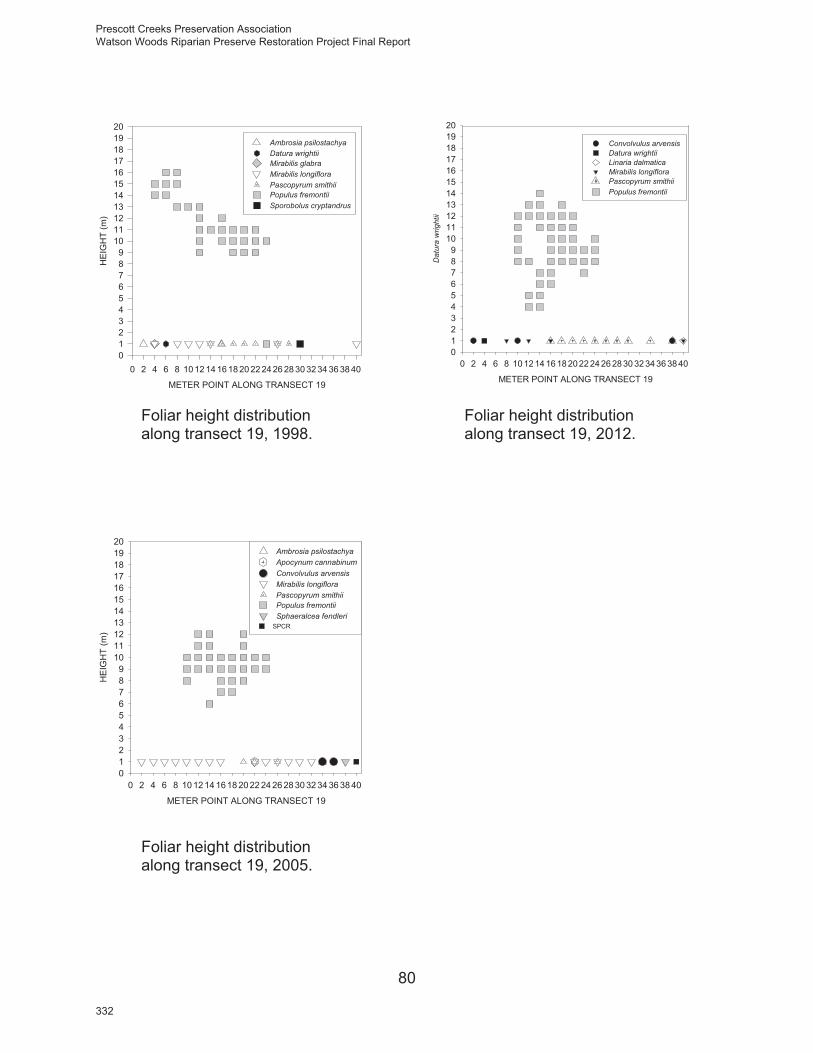
80
Foliar height distribution along transect 19, 2005.
METER POINT ALONG TRANSECT 19
0 2 4 6 8 10 12 14 16 18 20 22 24 26 28 30 32 34 36 38 40
HEI
GH
T (m
)
0123456789
1011121314151617181920
Ambrosia psilostachyaDatura wrightiiMirabilis glabraMirabilis longifloraPascopyrum smithiiPopulus fremontiiSporobolus cryptandrus
METER POINT ALONG TRANSECT 19
0 2 4 6 8 10 12 14 1618 2022 24 26 28 30 32 34 36 38 40
HEI
GH
T (m
)
0123456789
1011121314151617181920
Ambrosia psilostachyaApocynum cannabinumConvolvulus arvensisMirabilis longifloraPascopyrum smithiiPopulus fremontiiSphaeralcea fendleri
SPCR
Foliar height distribution along transect 19, 1998.
Foliar height distribution along transect 19, 2012.
METER POINT ALONG TRANSECT 19
0 2 4 6 8 10 12 14 16 18 2022 24 26 28 30 32 34 36 38 40
Dat
ura
wrig
htii
0123456789
1011121314151617181920
Convolvulus arvensis Datura wrightii Linaria dalmatica Mirabilis longiflora Pascopyrum smithii Populus fremontii
Prescott Creeks Preservation Association Watson Woods Riparian Preserve Restoration Project Final Report
332

81
Foliar height distribution along transect 20, 2005.
METER POINT ALONG TRANSECT 20
0 2 4 6 8 10 12 14 16 18 20 22 24 26 28 30 32 34 36 38 40
HEI
GH
T (m
)
0123456789
1011121314151617181920
Ambrosia psilostachya Apocynum cannabinum Artemisia carruthii Bouteloua curtipendula Brickella floribunda Fraxinus velutina Juglans major Mirabilis longiflora Muhlenbergia rigens Salix exigua Salix laevigata Sphaeralcea fendleri Taraxacum officinale
METER POINT ALONG TRANSECT 20
0 2 4 6 8 10 12 14 16 18 2022 24 26 28 30 32 34 36 38 40
HE
IGH
T (m
)
0123456789
1011121314151617181920
Apocynum cannabinumBouteloua curtipendulaBrickellia floribundaEragrotis curvulaJuglans majorMirabilis longifloraSalix exiguaSalix laevigataSporobolus cryptandrusTamarix ramosissimaUlmus pumila
METER POINT ALONG TRANSECT 20
0 2 4 6 8 10 12 14 16 18 20 22 24 26 28 30 32 34 36 38 40
HEI
GH
T (m
)
0123456789
1011121314151617181920
Ambrosia psilostachyaBouteloua curtipendulaBrickellia floribundaDatura wrightiiFraxinus velutinaJuglans majorMirabilis longifloraSalix exiguaSalix laevigataSphaeralcea fendleriSporobolus cryptandrusTamarix ramosissimaUlmus pumila
Foliar height distribution along transect 20, 1998.
Foliar height distribution along transect 20, 2012.
Presott Creeks Preservation Association Watson Woods Riparian Preserve Restoration Project Final Report
333

82
Foliar height distribution along transect 21, 1998.
Foliar height distribution along transect 21, 2005.
METER POINT ALONG TRANSECT 21
0 2 4 6 8 10 12 14 16 18 2022 24 26 28 30 32 34 36 38 40
HEI
GH
T (m
)
0123456789
1011121314151617181920
Ambrosia psilostachya Cucurbita foetidissima Marrubium bulgare Pascopyrum smithii Sporobolus contractus Sphaeralcea fendleri
Foliar height distribution along transect 21, 2012.
METER POINT ALONG TRANSECT 21
0 2 4 6 8 10 12 14 16 18 20 22 24 26 28 30 32 34 36 38 40
HEI
GH
T (m
)
0123456789
1011121314151617181920
Ambrosia psilostachya
METER POINT ALONG TRANSECT 21
0 2 4 6 8 10 12 14 16 18 2022 24 26 28 30 32 34 36 38 40
HE
IGH
T (m
)
0123456789
1011121314151617181920
Abrosia psilostachyaMachaeranthera canescensMelilotus officinalisPolygonum lapathifolium
Prescott Creeks Preservation Association Watson Woods Riparian Preserve Restoration Project Final Report
334
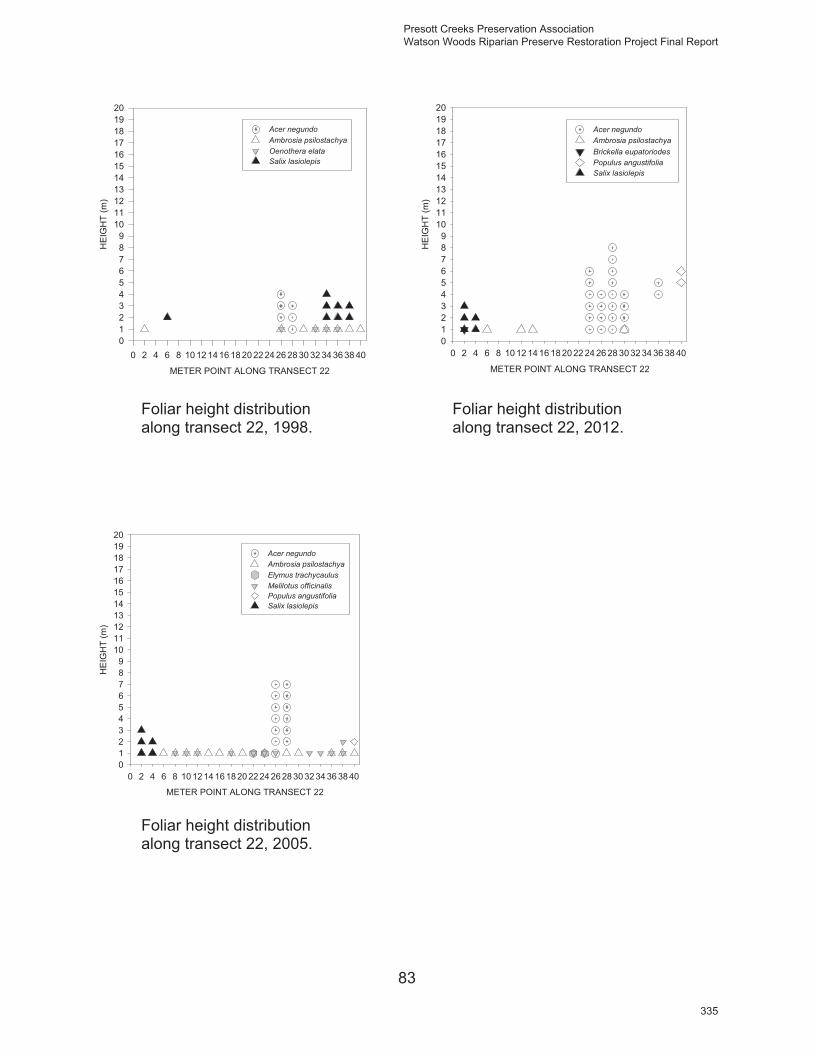
83
Foliar height distribution along transect 22, 1998.
Foliar height distribution along transect 22, 2005.
METER POINT ALONG TRANSECT 22
0 2 4 6 8 10 12 14 16 18 20 22 24 26 28 30 32 34 36 38 40
HEI
GH
T (m
)
0123456789
1011121314151617181920
Acer negundo Ambrosia psilostachya Brickella eupatoriodesPopulus angustifolia Salix lasiolepis
Foliar height distribution along transect 22, 2012.
METER POINT ALONG TRANSECT 22
0 2 4 6 8 10 12 14 16 18 20 22 24 26 28 30 32 34 36 38 40
HEI
GH
T (m
)
0123456789
1011121314151617181920
Acer negundoAmbrosia psilostachyaOenothera elataSalix lasiolepis
METER POINT ALONG TRANSECT 22
0 2 4 6 8 10 12 14 16 18 20 22 24 26 28 30 32 34 36 38 40
HE
IGH
T (m
)
0123456789
1011121314151617181920
Acer negundoAmbrosia psilostachyaElymus trachycaulusMelilotus officinalisPopulus angustifoliaSalix lasiolepis
Presott Creeks Preservation Association Watson Woods Riparian Preserve Restoration Project Final Report
335

84
Foliar height distribution along transect 23, 2005.
METER POINT ALONG TRANSECT 23
0 2 4 6 8 101214 16 18 2022 24 26 28 30323436 38 40
HEI
GH
T (m
)
0123456789
1011121314151617181920
Ambrosia psilostachya Elymus glaucus Lepidium latifolium Pascopyrum smithii
Foliar height distribution along transect 23, 2012.
Foliar height distribution along transect 23, 1998. No FHD was recorded.
METER POINT ALONG TRANSECT 23
0 2 4 6 8 10 12 14 16 18 20 22 24 26 28 30 32 34 36 38 40
HEI
GH
T (m
)
0123456789
1011121314151617181920
Achillea millefoliumAgrostis viridisAmbrosia psilostachya
METER POINT ALONG TRANSECT 23
0 2 4 6 8 10 12 14 16 18 20 22 24 26 28 30 32 34 36 38 40
HE
IGH
T (m
)
0123456789
1011121314151617181920
Prescott Creeks Preservation Association Watson Woods Riparian Preserve Restoration Project Final Report
336

85
Foliar height distribution along transect 24, 1998.
Foliar height distribution along transect 24, 2005.
Foliar height distribution along transect 24, 2012.
METER POINT ALONG TRANSECT 24
0 2 4 6 8 10 12 14 16 18 20 22 24 26 28 30 32 34 36 38 40
HE
IGH
T (m
)
0123456789
1011121314151617181920
Ambrosia psilostchyaBrickellia eupatorioidesPopulus fremontiiUlmus pumila
METER POINT ALONG TRANSECT 24
0 2 4 6 8 10 12 14 16 18 20 22 24 26 28 30 32 34 36 38 40
HE
IGH
T (m
)
0123456789
1011121314151617181920
Achillea millefolium Ambrosia psilostachya Aster falcatus Festuca arundinacea Populus fremontii Salix exigua Salix lasiolepis
METER POINT ALONG TRANSECT 24
0 2 4 6 8 10 12 14 16 18 2022 24 26 28 30 32 34 36 38 40
HEI
GH
T (m
)
0123456789
1011121314151617181920
Achillea millefoliumAmbrosia psilostachyaBrickellia eupatorioidesElymus elymoidesEleocharis parishiiMarrubium vulgareMelilotus officinalisMirabilis longifloraPascopyrum smithiiPopulus fremontiiSalix lasiolepisUlmus pumila
Presott Creeks Preservation Association Watson Woods Riparian Preserve Restoration Project Final Report
337

86
Foliar height distribution along transect 25, 1998.
Foliar height distribution along transect 25, 2005.
METER POINT ALONG TRANSECT 25
0 2 4 6 8 101214 16 18 2022 24 26 28 30323436 38 40
HE
IGH
T (m
)
0123456789
1011121314151617181920
Ambrosia psilostachya Brickella floribunda Convolvulus arvensis Cucurbita foetidissima Linaria dalmatica mirabilis longiflora Mirabilis pumila Sporobolus contractus Sphaeralcea fendleri
Foliar height distribution along transect 25, 2012.
METER POINT ALONG TRANSECT 25
0 2 4 6 8 10 12 14 16 18 2022 24 26 28 30 32 34 36 38 40
HEI
GH
T (m
)
0123456789
1011121314151617181920
Bouteloua curtipendulaBrickellia floribundaConvolvulus arvensisConvolvulus equitansMirabilis longifloraSporobolus contractus
METER POINT ALONG TRANSECT 25
0 2 4 6 8 10 12 14 16 18 202224 26 28 30 32 34 36 38 40
HEI
GH
T (m
)
0123456789
1011121314151617181920
Ambrosia psilostachyaBouteloua curtipendulaBrickellia floribundaConvolvulus arvensisDatura wrightiiMachaeranthera canescensMirabilis longifloraSporobolus cryptandrusSporobolus contractus
Prescott Creeks Preservation Association Watson Woods Riparian Preserve Restoration Project Final Report
338

87
Foliar height distribution along transect 26, 1998.
Foliar height distribution along transect 26, 2005.
METER POINT ALONG TRANSECT 26
0 2 4 6 8 10 12 14 16 18 20 22 24 26 28 30 32 34 36 38 40
HEI
GH
T (m
)
0123456789
1011121314151617181920
Ambrosia psilostachya Bouteloua gracilis Festuca arundinacea Lathyrus latifolius Mirabilis longiflora Pascopyrum smithii salix exigua salix laevigata
Foliar height distribution along transect 26, 2012.
METER POINT ALONG TRANSECT 26
0 2 4 6 8 10 12 14 16 18 20 22 24 26 28 30 32 34 36 38 40
HEI
GH
T (m
)
0123456789
1011121314151617181920
Ambrosia psilostachyaFestuca arundinaceaLinaria dalmaticaMirabilis longifloraSalix laevigataUlmus pumila
METER POINT ALONG TRANSECT 26
0 2 4 6 8 10 12 14 16 18 20 22 24 26 28 30 32 34 36 38 40
HEI
GH
T (m
)
0123456789
1011121314151617181920
Ambrosia psilostachyaFestuca arundinaceaMelilotus officinalisMirabilis longifloraSalix laevigataSaponaria officinalisUlmus pumila
Presott Creeks Preservation Association Watson Woods Riparian Preserve Restoration Project Final Report
339

Appendix 5. Graphs of annual cover, by transect for 1997, 2005, and 2012.
Prescott Creeks Preservation Association Watson Woods Riparian Preserve Restoration Project Final Report
340

88
METER POINT ALONG TRANSECT 1
4 8 12 16 20 24 28 32 36 40
CO
VER
CLA
SS
1
2
3
4
5
6
Ambrosia acanthicarpaBidens tenuisectaChenopodium fremontiiEchinochloa crus-galliKochia scopariaPortulaca oleraceaSalsola kaliVerbascum thapsus
METER POINT ALONG TRANSECT 1
4 8 12 16 20 24 28 32 36 40
CO
VE
R C
LAS
S
1
2
3
4
5
6Bromus japonicusBromus diandrusCentaurea stoebeChenopodium neomexicanumConyza canadensisEragrostis mexicanaGrindelia nudaHelianthus annuusHeliomeris longifloraHeterotheca psammophiliaKochia scopariaLactuca serriolaMarrubium vulgareOnopordum acanthiumPolypogon monspeliensis
METER POINT ALONG TRANSECT 1
4 8 12 16 20 24 28 32 36 40
CO
VE
R C
LAS
S
1
2
3
4
5
6
Ambrosia acanthicarpa
Amaranthus palmeriBidens tenuisecta
Bromus tectorumCentaurea stoebeChenopodium neomexicanumHeterotheca psammophilaKochia scoparia
Annuals alongtransect 1, 1998.
Annuals alongtransect 1, 2005.
Annuals alongtransect 1, 2012.
Presott Creeks Preservation Association Watson Woods Riparian Preserve Restoration Project Final Report
341

89
METER POINT ALONG TRANSECT 2
4 8 12 16 20 24 28 32 36 40
CO
VER
CLA
SS
1
2
3
4
5
6
Bidens tenuisectaEchinochloa crus-galli
METER POINT ALONG TRANSECT 2
4 8 12 16 20 24 28 32 36 40
CO
VER
CLA
SS
1
2
3
4
5
6Ambrosia acanthicarpaConyza canadensisEchinochloa crus-galliErodium cicutariumHelianthus annuusHeterotheca psammophiliaMimulus guttatusMirabilis glabraPolygonum avicularePolygonum lapathifoliumXanthium strumarium
METER POINT ALONG TRANSECT 2
4 8 12 16 20 24 28 32 36 40
CO
VER
CLA
SS
1
2
3
4
5
6
Gaura parviflora
Annuals alongtransect 2, 1998.
Annuals alongtransect 2, 2005.
Annuals alongtransect 2, 2012.
Prescott Creeks Preservation Association Watson Woods Riparian Preserve Restoration Project Final Report
342

90
METER POINT ALONG TRANSECT 3
4 8 12 16 20 24 28 32 36 40
CO
VER
CLA
SS
1
2
3
4
5
6 Bidens tenuisectaBromus diandrusBromus tectorumChenopodium neomexicanumConyza canadensisGaura parvifloraHelianthus annuusHeterotheca psammophiliaIpomoea coccineaIpomoea purpureaKochia scopariaMachaeranthera gracilisMarrubium vulgareOnopordum acanthiumPanicum capillareVerbascum thapsus
METER POINT ALONG TRANSECT 3
4 8 12 16 20 24 28 32 36 40
CO
VER
CLA
SS
1
2
3
4
5
6
Aster lanceolatusBidens tenuisectaBromus diandrusCentaurea stoebeEragrostis mexicanaIpomoea coccinea
METER POINT ALONG TRANSECT 3
4 8 12 16 20 24 28 32 36 40
CO
VER
CLA
SS
1
2
3
4
5
6
Amaranthus palmeriBromus diandrusChamaesyce serpyllifoliaEragrotis cilianensisEragrotis mexicanaEuphorbia dentataHeterotheca psammophiliaPanicum capillareSalsola kaliSetaria viridisVerbesina encelioides
Annuals alongtransect 3, 1998.
Annuals alongtransect 3, 2005.
Annuals alongTransect 3, 2012.
Presott Creeks Preservation Association Watson Woods Riparian Preserve Restoration Project Final Report
343

91
METER POINT ALONG TRANSECT 5
4 8 12 16 20 24 28 32 36 40
CO
VER
CLA
SS
1
2
3
4
5
6
Amaranthus palmeriAmbrosia acanthicarpaEriogonum polycladonKochia scopariaMachaeranthera gracilisSalsola kali
METER POINT ALONG TRANSECT 5
4 8 12 16 20 24 28 32 36 40
CO
VER
CLA
SS
1
2
3
4
5
6
Amaranthus palmeriAmbrosia acanthicarpaEriogonum polycladonKochia scopariaMachaeranthera gracilisSalsola kali
METER POINT ALONG TRANSECT 4
4 8 12 16 20 24 28 32 36 40
CO
VER
CLA
SS
1
2
3
4
5
6
Aster lanceolatusCuscuta pentagonaEragrostis mexicanaHelianthus annuusXanthium strumarinum
METER POINT ALONG TRANSECT 4
4 8 12 16 20 24 28 32 36 40
CO
VER
CLA
SS
1
2
3
4
5
6
Aster lanceolatusDipsacus fullonum
Annuals alongtransect 4, 1998.
Annuals alongtransect 4, 2005.
Annuals alongTransect 4, 2012.
Prescott Creeks Preservation Association Watson Woods Riparian Preserve Restoration Project Final Report
344

92
METER POINT ALONG TRANSECT 6
4 8 12 16 20 24 28 32 36 40
CO
VER
CLA
SS
1
2
3
4
5
6Amaranthus palmeriBromus diandrusBromus tectorumChamaesyce serpyllifoliaConyza canadensisDipsacus fullonumEchinochloa crus-galliGnaphalium luteo-albumHelianthus annuusHeterotheca psammophiliaIpomoea coccineaLactuca serriolaPanicum capillareXanthium strumarium
METER POINT ALONG TRANSECT 6
4 8 12 16 20 24 28 32 36 40
CO
VER
CLA
SS
1
2
3
4
5
6
Bromus diandrusCentaurea stoebeChenopodium neomexicanumDipsacus fullonumGaura parviflora
Ipomoea coccineaIpomoea purpurea
METER POINT ALONG TRANSECT 6
4 8 12 16 20 24 28 32 36 40
CO
VER
CLA
SS
1
2
3
4
5
6
Bromus diandrusDipsacus fullonumIpomoea purpureaKochia scopariaPortulaca oleracea
Annuals alongtransect 6, 1998.
Annuals alongtransect 6, 2012.
Annuals alongtransect 6, 2005.
Presott Creeks Preservation Association Watson Woods Riparian Preserve Restoration Project Final Report
345

93
METER POINT ALONG TRANSECT 7
4 8 12 16 20 24 28 32 36 40
CO
VER
CLA
SS
1
2
3
4
5
6 Anoda cristataAmaranthus palmeriBidens tenuisectaBromus tectorumChenopodium graveolensChloris virgataEragrostis barrelieriHelianthus annuusHeterotheca psammophiliaIpomoea coccineaIpomoea purpureaMachaeranthera canescensOnopordum acanthiumPanicum capillare
METER POINT ALONG TRANSECT 7
4 8 12 16 20 24 28 32 36 40
CO
VER
CLA
SS
1
2
3
4
5
6 Amaranthus palmeri
Bidens tenuisecta
Bromus tectorum
Chenopodium neomexicanum
Chloris virgataEragrostis mexicanaEragrostis cilianensisEuphorbia dentataGaura parvifloraIpomoea coccineaMachaeranthera tanacetifoliaOnopordum acanthiumPanicum capillarePortulaca oleraceaSalvia reflexa
METER POINT ALONG TRANSECT 7
4 8 12 16 20 24 28 32 36 40
CO
VER
CLA
SS
1
2
3
4
5
6 Amaranthus palmeriChenopodium neomexicanumEchinochloa crus-galliEragrostis cilianensisEragrostis mexicanaErodium cicutariumEuphorbia dentataGaura parvifloraIPPL Ipomoea purpureaKochia scopariaLactuca serriolaLeptochloa filiformisPanicum capillarePolygonum aviculareXanthium strumarium
Annuals alongtransect 7, 1998.
Annuals alongtransect 7, 2005.
Annuals alongtransect 7, 2012.
Prescott Creeks Preservation Association Watson Woods Riparian Preserve Restoration Project Final Report
346

94
METER POINT ALONG TRANSECT 8
4 8 12 16 20 24 28 32 36 40
CO
VER
CLA
SS
1
2
3
4
5
6
Bromus diandrusBromus tectorumConium maculatumIpomoea purpureaPolygonum aviculare
METER POINT ALONG TRANSECT 8
4 8 12 16 20 24 28 32 36 40
CO
VER
CLA
SS
1
2
3
4
5
6
Aster lanceolatusBidens tenuisecta
Bromus diandrusBromus marginatusDipsacus fullonumEragrostis mexicanaEuphorbia dentata
Ipomoea coccineaIpomoea purpureaPanicum capillare
METER POINT ALONG TRANSECT 8
4 8 12 16 20 24 28 32 36 40
CO
VER
CLA
SS
1
2
3
4
5
6
Amaranthus palmeriBromus diandrusChamaesyce serpyllifoliaEchinochloa crus-galliEragrostis mexicanaIpomoea coccineaIpomoea purpureaKochia scopariaSalsola kali
Annuals alongtransect 8, 1998.
Annuals alongtransect 8, 2005.
Annuals alongtransect 8, 2012.
Presott Creeks Preservation Association Watson Woods Riparian Preserve Restoration Project Final Report
347

95
METER POINT ALONG TRANSECT 9
4 8 12 16 20 24 28 32 36 40
CO
VER
CLA
SS
1
2
3
4
5
6Amaranthus palmeriAnoda crisataBidens tenuisecta Chenopodium neomexicanumChloris virgataConyza canadensisEchinochloa crus-galliEragrostis lutescensEragrostis mexicanaHelianthus annuusIpomoea coccineaPanicum capillare
METER POINT ALONG TRANSECT 9
4 8 12 16 20 24 28 32 36 40
CO
VER
CLA
SS
1
2
3
4
5
6Ambrosia acanthicarpa
Amaranthus palmeri
Anoda cristataBahia dissecta
Bidens teniusectaCentaurea stoebeChenopodium graveolensChamaesyce serpyllifoliaCyperus esculentusEragrostis mexicanaHelianthus annuusHymenothrix loomisiiIpomoea coccineaPectis prostrataPhysalis pubescensPortulaca oleracea
METER POINT ALONG TRANSECT 9
4 8 12 16 20 24 28 32 36 40
CO
VE
R C
LAS
S
1
2
3
4
5
6
Ambrosia acanthicarpaEuphorbia dentataIpomoea coccineaIpomoea purpureaKochia scopariaSalsola kali
Annuals alongtransect 9, 1998.
Annuals alongtransect 9, 2005.
Annuals alongtransect 9, 2012.
Prescott Creeks Preservation Association Watson Woods Riparian Preserve Restoration Project Final Report
348
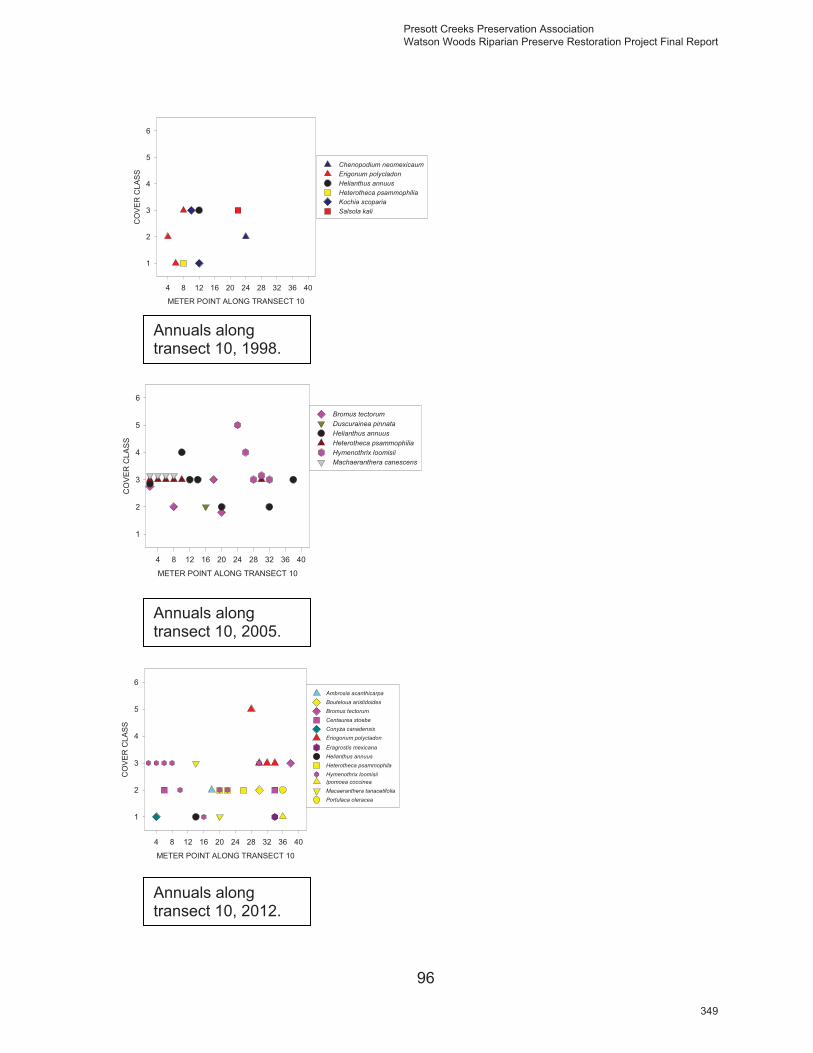
96
METER POINT ALONG TRANSECT 10
4 8 12 16 20 24 28 32 36 40
CO
VER
CLA
SS
1
2
3
4
5
6
Bromus tectorumDuscurainea pinnataHelianthus annuusHeterotheca psammophiliaHymenothrix loomisiiMachaeranthera canescens
METER POINT ALONG TRANSECT 10
4 8 12 16 20 24 28 32 36 40
CO
VER
CLA
SS
1
2
3
4
5
6Ambrosia acanthicarpaBouteloua aristidoidesBromus tectorumCentaurea stoebeConyza canadensisEriogonum polycladon
Eragrostis mexicanaHelianthus annuusHeterotheca psammophilaHymenothrix loomisiiIpomoea coccineaMacaeranthera tanacetifoliaPortulaca oleracea
METER POINT ALONG TRANSECT 10
4 8 12 16 20 24 28 32 36 40
CO
VER
CLA
SS
1
2
3
4
5
6
Chenopodium neomexicaumErigonum polycladonHelianthus annuusHeterotheca psammophiliaKochia scopariaSalsola kali
Annuals alongtransect 10, 1998.
Annuals alongtransect 10, 2005.
Annuals alongtransect 10, 2012.
Presott Creeks Preservation Association Watson Woods Riparian Preserve Restoration Project Final Report
349

97
METER POINT ALONG TRANSECT 11
4 8 12 16 20 24 28 32 36 40
CO
VER
CLA
SS
1
2
3
4
5
6
Bromus tectorumConyza canadensisChloris virgataErigonum abertianumEragrostis lutescensHeterotheca psammophilia
METER POINT ALONG TRANSECT 11
4 8 12 16 20 24 28 32 36 40
CO
VER
CLA
SS
1
2
3
4
5
6
Boerhavia coccineaBromus tectorumChloris virgataErodium cicutariumIpomoea coccinea
METER POINT ALONG TRANSECT 11
4 8 12 16 20 24 28 32 36 40
CO
VER
CLA
SS
1
2
3
4
5
6
Amaranthus palmeriErodium cicutariumIpomoea coccineaPortulaca oleracea
Annuals alongtransect 11, 1998.
Annuals alongtransect 11, 2005.
Annuals alongtransect 11, 2012.
Prescott Creeks Preservation Association Watson Woods Riparian Preserve Restoration Project Final Report
350

98
METER POINT ALONG TRANSECT 12
4 8 12 16 20 24 28 32 36 40
CO
VER
CLA
SS
1
2
3
4
5
6Bidens tenuisectaBromus tectorumChloris virgataEragrostis mexicanaEuphorbia dentataHelianthus annuusHeliomeris longifloraHeterotheca psammophiliaIpomoea coccineaIpomoea purpureaOnopordum acanthiumPolygonum aviculareSalvia reflexa
METER POINT ALONG TRANSECT 12
4 8 12 16 20 24 28 32 36 40
CO
VER
CLA
SS
1
2
3
4
5
6
Ambrosia acanthicarpaBidens tenuisectaBromus tectorumCentaurea stoebeChamaesyce serpyllifoliaHelianthus annuusHymenothrix loomisiiIpomoea coccineaIpomoea costellata
METER POINT ALONG TRANSECT 13
4 8 12 16 20 24 28 32 36 40
CO
VER
CLA
SS
1
2
3
4
5
6
Amaranthus palmeriBromus diandrusChenopodium fremontiiIpomoea coccineaLepidium densiflorumPortulaca oleracea
Annuals alongtransect 12, 1998.
Annuals alongtransect 12, 2005.
Annuals alongtransect 12, 2012.
Presott Creeks Preservation Association Watson Woods Riparian Preserve Restoration Project Final Report
351
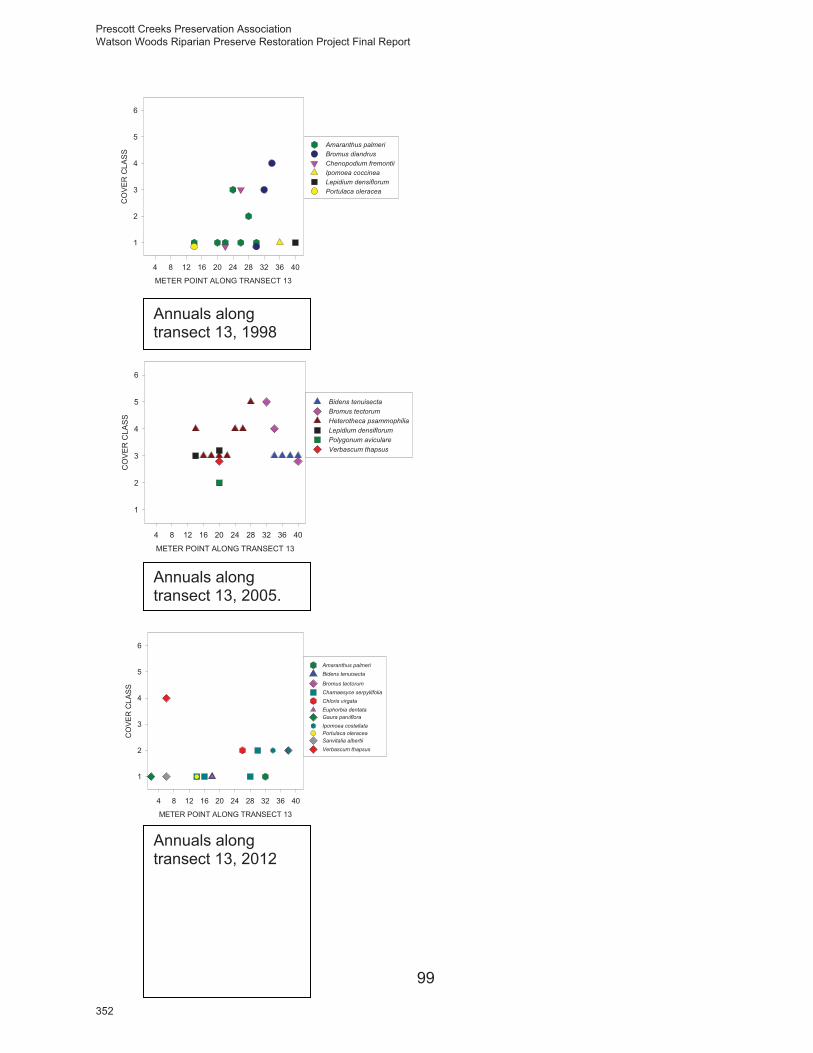
99
METER POINT ALONG TRANSECT 13
4 8 12 16 20 24 28 32 36 40
CO
VER
CLA
SS
1
2
3
4
5
6
Bidens tenuisectaBromus tectorumHeterotheca psammophiliaLepidium densiflorumPolygonum aviculareVerbascum thapsus
METER POINT ALONG TRANSECT 13
4 8 12 16 20 24 28 32 36 40
CO
VER
CLA
SS
1
2
3
4
5
6
Amaranthus palmeriBidens tenuisecta
Bromus tectorumChamaesyce serpyllifoliaChloris virgataEuphorbia dentataGaura parvifloraIpomoea costellataPortulaca oleraceaSanvitalia albertiiVerbascum thapsus
METER POINT ALONG TRANSECT 13
4 8 12 16 20 24 28 32 36 40
CO
VER
CLA
SS
1
2
3
4
5
6
Amaranthus palmeriBromus diandrusChenopodium fremontiiIpomoea coccineaLepidium densiflorumPortulaca oleracea
Annuals alongtransect 13, 2005.
Annuals alongtransect 13, 1998
Annuals along transect 13, 2012
Prescott Creeks Preservation Association Watson Woods Riparian Preserve Restoration Project Final Report
352

100
METER POINT ALONG TRANSECT 14
4 8 12 16 20 24 28 32 36 40
CO
VER
CLA
SS
1
2
3
4
5
6
Bromus diandrusBromus tectorumChloris virgataConyza canadensisEragrostis barrelieriIpomoea coccineaOxalis albicansPortulaca oleraceaVerbascum thapsus
METER POINT ALONG TRANSECT 14
4 8 12 16 20 24 28 32 36 40
CO
VER
CLA
SS
1
2
3
4
5
6
Bromus tectorumEragrostis mexicanaIpomoea coccineaIpomoea costellataMirabilis pumilaOenothera caespitosaVerbascum thapsus
METER POINT ALONG TRANSECT 14
4 8 12 16 20 24 28 32 36 40
CO
VER
CLA
SS
1
2
3
4
5
6
Echinochloa crus-galliEragrostis mexicanaIpomoea coccinea
Annuals alongtransect 14, 1998.
Annuals alongtransect 14, 2012.
Annuals alongtransect 14, 2005.
Presott Creeks Preservation Association Watson Woods Riparian Preserve Restoration Project Final Report
353

101
METER POINT ALONG TRANSECT 15
4 8 12 16 20 24 28 32 36 40
CO
VE
R C
LAS
S
1
2
3
4
5
6
Bromus diandrusBromus japonicusChloris virgataErigeron divergensGaura parvifloraHelianthus annuusHeterotheca psammophiliaIpomoea coccineaLepidium densiflorumPanicum miliaceumPolygonum avicularePolypogon monspeliensis
METER POINT ALONG TRANSECT 15
4 8 12 16 20 24 28 32 36 40
CO
VER
CLA
SS
1
2
3
4
5
6Amaranthus palmeriBidens tenuisectaChamaesyce serpyllifoliaEragrostis cilianensis
Euphorbia dentataGaura parvifloraHelianthus annuusIpomoea coccineaLactuce serriola
Lepidium latifoliumPanicum capillarePolygonum aviculare
METER POINT ALONG TRANSECT 14
4 8 12 16 20 24 28 32 36 40
CO
VER
CLA
SS
1
2
3
4
5
6
Echinochloa crus-galliEragrostis mexicanaIpomoea coccinea
Annuals alongtransect 15, 2005.
Annuals alongtransect 15, 1998.
Annuals alongtransect 15, 2012.
Prescott Creeks Preservation Association Watson Woods Riparian Preserve Restoration Project Final Report
354

102
METER POINT ALONG TRANSECT 16
4 8 12 16 20 24 28 32 36 40
CO
VER
CLA
SS
1
2
3
4
5
6
Amaranthus palmeriBidens tenuisectaBromus diandrusBromus tectorumChloris virgataEragrostis mexicanaHelianthus annuusHeterotheca psammophiliaVerbascum thapsus
METER POINT ALONG TRANSECT 16
4 8 12 16 20 24 28 32 36 40
CO
VER
CLA
SS
1
2
3
4
5
6
Amaranthus palmeriBahia dissecta
Bidens tenuisectaBoerhavia coccinea
Bromus diandrusConyza canadensisChloris virgataEragrostis mexicanaPortulaca oleracea
METER POINT ALONG TRANSECT 15
4 8 12 16 20 24 28 32 36 40
CO
VER
CLA
SS
1
2
3
4
5
6
Evolvulus sericeusHordeum jubatumPortulaca oleracea
Annuals alongtransect 16, 2005.
Annuals alongtransect 16, 1998.
Annuals alongtransect 16, 2012.
Presott Creeks Preservation Association Watson Woods Riparian Preserve Restoration Project Final Report
355

103
METER POINT ALONG TRANSECT 17
4 8 12 16 20 24 28 32 36 40
CO
VER
CLA
SS
1
2
3
4
5
6
Amaranthus palmeriBidens tenuisectaBromus tectorumChloris virgataEragrostis mexicanaErigonum abertianumHeterotheca psammophiliaIpomoea costellataLepidium densiflorum
METER POINT ALONG TRANSECT 17
4 8 12 16 20 24 28 32 36 40
CO
VER
CLA
SS
1
2
3
4
5
6
Amaranthus palmeriBoerhavia coccineaChamaesyce serpyllifoliaEuphorbia dentata
Eriogonum polycladonIpomoea coccineaIpomoea costellataKallstroemia parviflora
METER POINT ALONG TRANSECT 17
4 8 12 16 20 24 28 32 36 40
CO
VE
R C
LAS
S
1
2
3
4
5
6
Amaranthus palmeriChloris virgataEragrostis mexicanaIpomoea coccineaKallstroemia parviflora
Annuals alongtransect 17, 1998.
Annuals alongtransect 17, 2005.
Annuals alongtransect 17, 2012.
Prescott Creeks Preservation Association Watson Woods Riparian Preserve Restoration Project Final Report
356

104
METER POINT ALONG TRANSECT 18
4 8 12 16 20 24 28 32 36 40
CO
VER
CLA
SS
1
2
3
4
5
6
Agrostis viridisConium maculatumDipsacus fullonumGaura parviflora
METER POINT ALONG TRANSECT 18
4 8 12 16 20 24 28 32 36 40
CO
VER
CLA
SS
1
2
3
4
5
6Ambrosia acanthicarpa
Bidens tenuisecta
Bromus tectorumCentaurea stoebeConium maculatumCyperus esculentusDipsacus fullonumEragrostis mexicana
Oenothera caespitosaPanicum capillarePortulaca oleraceaVerbascum thapsus
METER POINT ALONG TRANSECT 18
4 8 12 16 20 24 28 32 36 40
CO
VER
CLA
SS
1
2
3
4
5
6
Amaranthus palmeriChamaesyce serpyllifoliaDigitaria sanguinalisEchinochloa crus-galliEragrostis mexicanaEuphorbia dentataIpomoea purpureaPanicum capillarePortulaca oleraceaTaraxacum officinale
Annuals alongtransect 18, 1998.
Annuals alongtransect 18, 2005.
Annuals alongtransect 18, 2012.
Presott Creeks Preservation Association Watson Woods Riparian Preserve Restoration Project Final Report
357

105
METER POINT ALONG TRANSECT 19
4 8 12 16 20 24 28 32 36 40
CO
VER
CLA
SS
1
2
3
4
5
6Bidens tenuisectaBromus diandrusBromus japonicusBromus tectorumChloris virgataConyza canadensisEragrostis mexicanaHelianthus annuusHeterotheca psammophiliaIpomoea coccineaIpomoea purpureaLactuca serriolaOnopordum acanthiumPolygonum aviculare
METER POINT ALONG TRANSECT 19
4 8 12 16 20 24 28 32 36 40
CO
VER
CLA
SS
1
2
3
4
5
6
Amaranthus palmeriBromus diandrusBromus tectorum
Chenopodium neomexicanum
Cyperus esculentusIpomoea coccineaOnopordum acanthiumPhysalis pubescens
METER POINT ALONG TRANSECT 19
4 8 12 16 20 24 28 32 36 40
CO
VER
CLA
SS
1
2
3
4
5
6
Amaranthus palmeriChamaesyce serpyllifoliaEragrostis mexicanaEuphorbia dentataIpomoea purpureaPanicum capillarePaspalum dilatatum
Annuals alongtransect 19, 1998.
Annuals alongtransect 19, 2005.
Annuals alongtransect 19, 2012.
Prescott Creeks Preservation Association Watson Woods Riparian Preserve Restoration Project Final Report
358

106
METER POINT ALONG TRANSECT 20
4 8 12 16 20 24 28 32 36 40
CO
VER
CLA
SS
1
2
3
4
5
6
Bahia dissectaBidens tenuisectaBromus diandrusBromus tectorum Gaura parvifloraHeterotheca psammophiliaIpomoea coccineaLepidium densiflorumPanicum miliaceumVerbascum thapsus
METER POINT ALONG TRANSECT 20
4 8 12 16 20 24 28 32 36 40
CO
VER
CLA
SS
1
2
3
4
5
6
Bahia dissectaBidens tenuisecta
Bromus diandrus
Bromus tectorumCentaurea stoebeEragrostis mexicanaGaura parvifloraIpomoea coccineaOenothera caespitosaPanicum capillare
METER POINT ALONG TRANSECT 20
4 8 12 16 20 24 28 32 36 40
CO
VER
CLA
SS
1
2
3
4
5
6
Amaranthus palmeriBidens tenuisectaChamaesyce seryllifoliaEragrostis mexicanaEuphorbia dentataIpomoea coccineaIpomoea purpureaPortulaca oleracea
Annuals alongtransect 20, 1998.
Annuals alongtransect 20, 2005.
Annuals alongtransect 20, 2012.
Presott Creeks Preservation Association Watson Woods Riparian Preserve Restoration Project Final Report
359

107
METER POINT ALONG TRANSECT 21
4 8 12 16 20 24 28 32 36 40
CO
VER
CLA
SS
1
2
3
4
5
6
Ambrosia acanthicarpaChenopodium neomexicanumConyza canadensisErigonum abertianumHelianthus annuusHeliomeris longifloraHeterotheca psammophiliaKochia scopariaOnopordum acanthium
METER POINT ALONG TRANSECT 21
4 8 12 16 20 24 28 32 36 40
CO
VER
CLA
SS
1
2
3
4
5
6
Eragrostis mexicanaChenopoduim neomexicanum
Chamaesyce serpyllifolia
Eragrostis mexicanaEriogonum polycladonHeterotheca psammophilaKochia scopariaMachaeranthera tanacetifoliaPanicum capillare
METER POINT ALONG TRANSECT 21
4 8 12 16 20 24 28 32 36 40
CO
VER
CLA
SS
1
2
3
4
5
6
Ambrosia acanthicarpaKochia scopariaPortulaca oleracea
Annuals alongtransect 21, 1998.
Annuals alongtransect 21, 2005.
Annuals along transect 21, 2012.
Prescott Creeks Preservation Association Watson Woods Riparian Preserve Restoration Project Final Report
360

108
METER POINT ALONG TRANSECT 22
4 8 12 16 20 24 28 32 36 40
CO
VER
CLA
SS
1
2
3
4
5
6
Bromus japonicusConyza canadensisEchinochloa crus-galliGrindelia nudaHelianthus annuusHeterotheca psammophiliaKochia scoparia
METER POINT ALONG TRANSECT 22
4 8 12 16 20 24 28 32 36 40
CO
VER
CLA
SS
1
2
3
4
5
6 Bromus tectorum
Chenopodium neomexicanum
Chloris virgataConyza canadensisErodium cicutariumEragrostis mexicanaEriogonum polycladonGaura parvifloraHelianthus annuusHeterotheca psammophilaIpomoea costellataLactuca serriolaLepidium latifoliumPanicum capillarePolygonum aviculareVerbascum thapsus
METER POINT ALONG TRANSECT 22
4 8 12 16 20 24 28 32 36 40
CO
VER
CLA
SS
1
2
3
4
5
6
Chloris virgataEragrostis mexicanaKochia scopariaPortulaca oleracea
Annuals alongtransect 22, 1998.
Annuals alongtransect 22, 2005.
Annuals along transect 22,2012
Presott Creeks Preservation Association Watson Woods Riparian Preserve Restoration Project Final Report
361

109
METER POINT ALONG TRANSECT 23
4 8 12 16 20 24 28 32 36 40
CO
VE
R C
LAS
S
1
2
3
4
5
6
Amaranthus palmeriBidens tenuisectaBromus japonicusChenopodium neomexicanumChloris virgataConyza canadensisEragrostis lutescensEragrostis mexicanaErigeron divergensGrindelia nudaHelianthus annuusHeliomeris longifloraKochia scopariaLactuca serriolaMachaeranthera gracilisMarrubium vulgarePolygonum aviculareVerbesina encelioides
METER POINT ALONG TRANSECT 23
4 8 12 16 20 24 28 32 36 40
CO
VER
CLA
SS
1
2
3
4
5
6
Amaranthus palmeriBromus tectorumChamaesyce serpyllifolia
Cyperus esculentusErodium cicutariumEragrostis mexicanaEriogonum polycladonKochia scopariaMacaeranthera gracilisMachaeranthera tanacetifoliaPortulaca oleracea
METER POINT ALONG TRANSECT 23
4 8 12 16 20 24 28 32 36 40
CO
VER
CLA
SS
1
2
3
4
5
6
Chloris virgataEragrostis mexicanaKochia scopariaPortulaca oleracea
Annuals alongtransect 23, 1998.
Annuals alongtransect 23, 2005.
Annuals along transect 23, 2012
Prescott Creeks Preservation Association Watson Woods Riparian Preserve Restoration Project Final Report
362

110
METER POINT ALONG TRANSECT 23
4 8 12 16 20 24 28 32 36 40
CO
VER
CLA
SS
1
2
3
4
5
6
Hymenothrix loomisiiTaraxacum officinale
METER POINT ALONG TRANSECT 23
4 8 12 16 20 24 28 32 36 40
CO
VER
CLA
SS
1
2
3
4
5
6
Bahia dissecta
Bidens tenuisectaBromus diandrusIpomoea coccineaPortulaca oleraceaVerbascum thapsus
Annuals alongtransect 24, 2005.
Annuals along transect 24, 1998
Annuals along transect 24, 2012
4 8 12 16 20 24 28 32 36 40
CO
VE
R C
LAS
S
1
2
3
4
5
6
Presott Creeks Preservation Association Watson Woods Riparian Preserve Restoration Project Final Report
363

111
METER POINT ALONG TRANSECT 25
4 8 12 16 20 24 28 32 36 40
CO
VER
CLA
SS
1
2
3
4
5
6
Amaranthus palmeriBidens tenuisectaBoerhavia coccineaBromus tectorumChenopodium neomexicanumChloris virgataErigonum abertianumEragrostis mexicanaHelianthus annuusHeliomeris longifloraHeterotheca psammophiliaIpomoea coccinea
METER POINT ALONG TRANSECT 25
4 8 12 16 20 24 28 32 36 40
CO
VER
CLA
SS
1
2
3
4
5
6Acalypha neomexicana
Amaranthus palmeriBidens tenuisecta
Bromus tectorumCyperus esculentusEragrostis mexicanaIpomoea coccineaPanicum capillarePortulaca oleraceaSalvia reflexa
METER POINT ALONG TRANSECT 25
4 8 12 16 20 24 28 32 36 40
CO
VER
CLA
SS
1
2
3
4
5
6
Amaranthus palmeriBoerhavia spicataChloris virgataCyperus fendlerianusEragrostis mexicanaSalsola kali
Annuals alongtransect 25, 1998.
Annuals alongtransect 25, 2005.
Annuals along transect 25, 2012
Prescott Creeks Preservation Association Watson Woods Riparian Preserve Restoration Project Final Report
364

112
METER POINT ALONG TRANSECT 26
4 8 12 16 20 24 28 32 36 40
CO
VER
CLA
SS
1
2
3
4
5
6
Bromus diandrusBromus tectorumChenopodium neomexicanumHelianthus annuusIpomoea coccineaLepidium densiflorumPlantago majorPolygonum aviculare
METER POINT ALONG TRANSECT 26
4 8 12 16 20 24 28 32 36 40
CO
VER
CLA
SS
1
2
3
4
5
6Amaranthus palmeriAster lanceolatusBidens tenuisecta
Centaurea stoebeChenopodium neomexicanum
Eragrostis mexicanaEriogonum polycladonHelianthus annuusHeterotheca psammophilaHymenothrix loomisiiIpomoea coccineaKochia scopariaOenothera caespitosaSanvitalia abertiiVerbascum thapsus
METER POINT ALONG TRANSECT 26
4 8 12 16 20 24 28 32 36 40
CO
VER
CLA
SS
1
2
3
4
5
6
Amaranthus palmeriBidens tenuisectaBromus diandrusChamaesyce serpyllifoliaChloris virgataEchinochloa crus-galliEragrostis mexicanaIpomoea purpureaXanthium strumarium
Annuals alongtransect 26, 1998.
Annuals alongtransect 26, 2005.
Annuals along transect 26, 2012
Presott Creeks Preservation Association Watson Woods Riparian Preserve Restoration Project Final Report
365

Appendix 6. Decimal degree WGS84 and UTM (Zone 12, UTM, NAD83) coordinates for FHD transects.
Prescott Creeks Preservation Association Watson Woods Riparian Preserve Restoration Project Final Report
366

113
Decimal degree WGS84 and UTM (Zone 12, UTM, NAD83) coordinates for beginning (meter 00), middle (meter 02) and end (meter 40) of FHD transects.Transec
t Meter Latitude Longitude Northing Easting 1 0 34.57726731 -112.4289462 368934 38270931 20 34.57718955 -112.4291437 368916 38270851 40 34.57733894 -112.4292690 368905 38271012 0 34.57805467 -112.4280359 369019 38271792 20 34.57821097 -112.4279068 369031 38271962 40 34.57837307 -112.4278102 369040 38272143 0 34.57891226 -112.4284747 368980 38272753 20 34.57874310 -112.4285164 368976 38272563 40 34.57880698 -112.4287424 368955 38272634 0 34.57792806 -112.4301781 368822 38271684 20 34.57779476 -112.4303190 368809 38271534 40 34.57766566 -112.4304682 368795 38271395 Not available, transect no longer exists 6 0 34.57610923 -112.4317355 368677 38269686 20 34.57628879 -112.4318568 368666 38269886 40 34.57638227 -112.4316980 368681 38269987 0 34.57572427 -112.4317112 368678 38269257 20 34.57583308 -112.4318761 368663 38269387 40 34.57597157 -112.4317554 368675 38269538 0 34.57488822 -112.4323750 368616 38268348 20 34.57481122 -112.4325698 368598 38268258 40 34.57497008 -112.4326712 368589 38268439 0 34.57368343 -112.4321247 368637 38267009 20 34.57384816 -112.4320512 368644 38267189 40 34.57378978 -112.4318493 368663 3826711
10 0 34.57317598 -112.4333349 368525 382664510 20 34.57318984 -112.4335488 368506 382664710 40 34.57336277 -112.4334962 368511 382666611 0 34.57208757 -112.4334294 368515 382652411 20 34.57193761 -112.4335299 368506 382650811 40 34.57200971 -112.4337299 368487 382651612 0 34.57279932 -112.4324594 368605 382660212 20 34.57265453 -112.4323554 368614 382658612 40 34.57253772 -112.4325136 368600 382657313 0 34.56815879 -112.4359447 368278 382609213 20 34.56804801 -112.4357727 368294 382607913 40 34.56789998 -112.4359019 368282 382606314 0 34.56867452 -112.4372274 368161 382615114 20 34.56875871 -112.4374176 368144 3826160
Presott Creeks Preservation Association Watson Woods Riparian Preserve Restoration Project Final Report
367

114
Decimal degree WGS84 and UTM (Zone 12, UTM, NAD83) coordinates for beginning (meter 00), middle (meter 02) and end (meter 40) of FHD transects.Transec
t Meter Latitude Longitude Northing Easting 14 40 34.56892356 -112.4373272 368152 382617815 0 34.56971841 -112.4346938 368395 382626315 20 34.56986191 -112.4345680 368407 382627915 40 34.56974543 -112.4343984 368422 382626616 0 34.56790136 -112.4366485 368213 382606416 20 34.56776750 -112.4367955 368199 382605016 40 34.56789553 -112.4369666 368184 382606417 0 34.56938980 -112.4360795 368268 382622917 20 34.56956457 -112.4360522 368270 382624817 40 34.56957377 -112.4358256 368291 382624918 0 34.57118759 -112.4367322 368211 382642918 40 34.57093962 -112.4366237 368229 382641918 40 34.57110407 -112.4365342 368220 382640119 0 34.57039068 -112.4376977 368121 382634219 20 34.57020802 -112.4377267 368118 382632119 40 34.57024371 -112.4379386 368098 382632620 0 34.56975017 -112.437283 368158 382627020 20 34.56956221 -112.437287 368157 382624920 40 34.56955767 -112.437504 368137 382624921 0 34.57633918 -112.4302839 368810 382699221 20 34.57649360 -112.4301724 368821 382700921 40 34.57641123 -112.4299778 368838 382699922 0 34.57597263 -112.4297434 368859 382695022 20 34.57606839 -112.4295591 368876 382696122 40 34.57592697 -112.4294278 368888 382694523 0 34.57412191 -112.4310528 368736 382674723 20 34.57394518 -112.4310552 368736 382672723 40 34.57393062 -112.4312753 368715 382672624 0 34.56807397 -112.4375955 368126 382608524 20 34.56805659 -112.4373919 368145 382608224 40 34.56788285 -112.4373787 368146 382606325 0 34.56978319 -112.4381511 368078 382627525 20 34.56995180 -112.4380612 368087 382629325 40 34.56987189 -112.4378682 368104 382628426 0 34.56863122 -112.4392229 367978 382614926 20 34.56877261 -112.4393517 367966 382616426 40 34.56884340 -112.4391597 367984 3826172
Prescott Creeks Preservation Association Watson Woods Riparian Preserve Restoration Project Final Report
368
Related Documents
![· XLS file · Web view2018-01-01 · pennispinosa v. nazasensis SB_489 > Rodeo/DUR/Mexique ... [DH_1002/90] CORYPHANTHA sous-genre Coryphantha, ... OPUNTIA OREOCEREUS OROYA acollana](https://static.cupdf.com/doc/110x72/5b9b51ac09d3f20b318d27a8/-xls-file-web-view2018-01-01-pennispinosa-v-nazasensis-sb489-rodeodurmexique.jpg)