Maternal effects reveal species niche dimensions Rachel M. Germain and Benjamin Gilbert Dept. Ecology & Evolutionary Biology, U. Toronto

Welcome message from author
This document is posted to help you gain knowledge. Please leave a comment to let me know what you think about it! Share it to your friends and learn new things together.
Transcript

Maternal effects reveal species niche dimensions Rachel M. Germain and Benjamin GilbertDept. Ecology & Evolutionary Biology, U. Toronto

“Why are there so many kinds of [species]?”-G. E. Hutchinson 1958
Answer: Environmental variation

Temporal environmental variation promotes diversity
Assumption: species demographic parameters in current conditions are independentof conditions experienced in the previous generation
Figure modified from Levine & Rees 2002
Variable Constant

The presence of maternal effects violates this assumption
good year bad yearseed
Galloway 2005, Sultan et al. 2006, Dyer et al. 2010, Germain et al. 2013

The presence of maternal effects violates this assumption
good year bad year
reinforcing numeric responses
seed
Galloway 2005, Sultan et al. 2006, Dyer et al. 2010, Germain et al. 2013

The presence of maternal effects violates this assumption
good year bad year
counteracting numeric responses
seed
Galloway 2005, Sultan et al. 2006, Dyer et al. 2010, Germain et al. 2013

The presence of maternal effects violates this assumption
good year bad yearseed

All existing tests have:
1. included ≤ 3 species only
2. controlled for genotypic differences among individuals
Problem: It is not known how common maternal effects are in biological communities

How common are maternal effects, and how do they compare to regular numeric responses?

Study system: Mediterranean annual plants
hyper-diverse ▪ variable rainfall ▪ many annual species
Papaver dubium
Nemophila menziesii
Uropappus lindleyi
Vulpia microstachysSalvia columbariae
Lasthenia californica

Greenhouse experiment
30 species x 2 env’ts (wet and dry) x 7 pots= total 420 pots
each pot population of ~8 individuals
enumerated seed number, mass per seed, and % seed dormancy
gls: x ~ ME*species

30 species x 2 env’ts (wet and dry) x 7 pots= total 420 pots
each pot population of ~8 individuals
enumerated seed number, mass per seed, and % seed dormancy
gls: x ~ ME*species
Greenhouse experiment
Raised the offspring generation under similar conditions for first three weeks of growth, measured aboveground biomass as performance measure
30 species x 2 env’ts (wet and dry) x 7 pots= total 420 pots
each pot population of ~8 individuals
enumerated seed number, mass per seed, and % seed dormancy
gls: x ~ ME*species

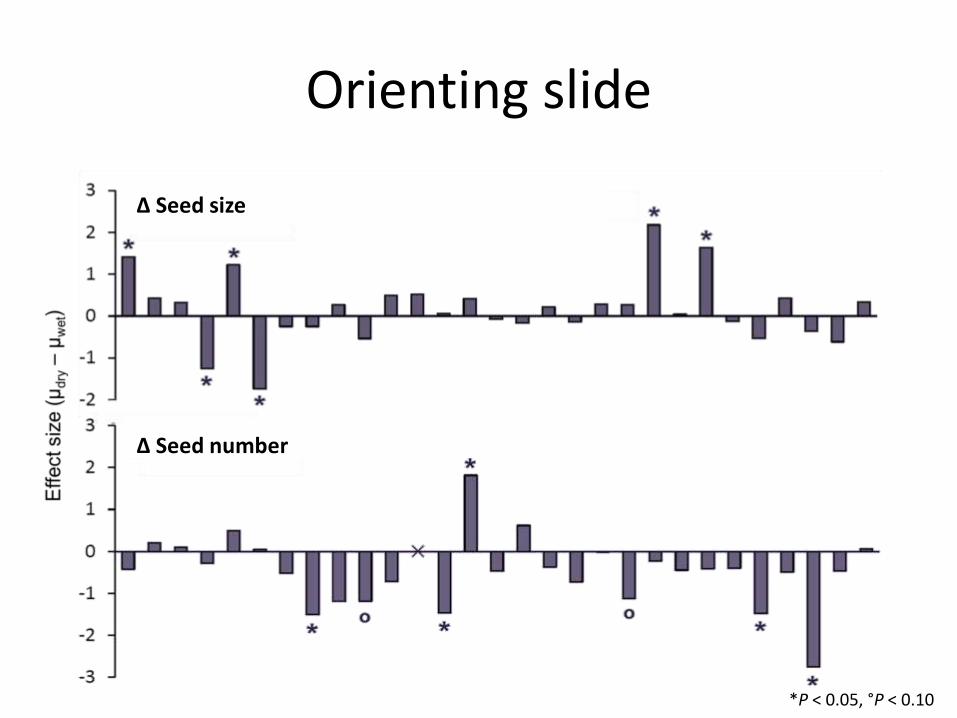
*P < 0.05, °P < 0.10
Orienting slide
∆ Seed size
∆ Seed number
maternal effect
regular numeric effects

Orienting slide
∆ Seed size
∆ Seed number
*P < 0.05, °P < 0.10

Orienting slide
∆ Seed size
∆ Seed number
* = significant response
*P < 0.05, °P < 0.10
Orienting slide
∆ Seed size
∆ Seed number
*P < 0.05, °P < 0.10

Result 1: seed size and seed number responses occurred in similar frequencies
∆ Seed size
∆ Seed number
six species
five species
*P < 0.05, °P < 0.10

Result 2: seed size but not seed number responses were bidirectional
∆ Seed size
∆ Seed number
*P < 0.05, °P < 0.10
non-sig. ME effect
sig. ME effect

Result 3: no species responded through both seed size and seed number
∆ Seed size
∆ Seed number
*P < 0.05, °P < 0.10

Result 4: seed size responses are phylogenetically convergent
∆ Seed size
K = 0.09, P = 0.057
*P < 0.05, °P < 0.10

Results summary
Maternal effects:
→ occurred as or more frequently than seed number responses
→ exhibited a fuller range of responses than seed number
→were only observed in species that did not respond through seed number
→were phylogenetically convergent

Results summary
Maternal effects:
→ occurred as or more frequently than seed number responses
→ exhibited a fuller range of responses than seed number
→were only observed in species that did not respond through seed number
→were phylogenetically convergent

Take home messageMaternal effects are common, and should be considered by ecologists
Germain, R. M. and B. Gilbert. (2014). Ecology Letters 17: 662-669

Acknowledgements
Jason Weir
The Gilbert LabBoth AlexsSome of my cats
Bruce HallAndrew Petri
Webpage: rgermain.wordpress.comEmail: [email protected]
Chris BlackfordAlanna LealeAlly MushkaRosemary MartinYvonne ChanAlicia HouKevin HawkshawMags Ngo

Seed size-seed number correlations
Germain & Gilbert 2014 Eco Lett

Seed dormancy responses to the maternal environment vary across species
Germain & Gilbert 2014 Eco Lett

Seed size effects on offspring performance
r = 0.11, P = 0.047
Germain & Gilbert 2014 Eco Lett
Related Documents