Session 8D: Measuring Economic Performance in China and India II Time: Friday, August 10, 2012 PM Paper Prepared for the 32nd General Conference of The International Association for Research in Income and Wealth Boston, USA, August 5-11, 2012 Household Income Surveys in India: Lancunae and Illustrations from Village Surveys Aparajita Bakshi Vikas Rawal V.K. Ramachandran Madhura Swaminathan For additional information please contact: Name: Madhura Saminathan Affiliation: Indian Statistical Institute Kolkata Email Address: [email protected] This paper is posted on the following website: http://www.iariw.org

Welcome message from author
This document is posted to help you gain knowledge. Please leave a comment to let me know what you think about it! Share it to your friends and learn new things together.
Transcript
Session 8D: Measuring Economic Performance in China and India II
Time: Friday, August 10, 2012 PM
Paper Prepared for the 32nd General Conference of
The International Association for Research in Income and Wealth
Boston, USA, August 5-11, 2012
Household Income Surveys in India: Lancunae and Illustrations from Village Surveys
Aparajita Bakshi
Vikas Rawal
V.K. Ramachandran
Madhura Swaminathan
For additional information please contact:
Name: Madhura Saminathan
Affiliation: Indian Statistical Institute Kolkata
Email Address: [email protected]
This paper is posted on the following website: http://www.iariw.org
1
HOUSEHOLD INCOME SURVEYS IN INDIA: LACUNAE AND ILLUSTRATIONS
FROM VILLAGE SURVEYS
Aparajita Bakshi, Vikas Rawal, V.K. Ramachandran and Madhura Swaminathan∗
1. Introduction
Despite income growth, persistent and pervasive poverty remain the most important features of
the Indian economy. India is also characterised by high income inequality and a diverse
economic structure with almost 90 per cent of the work force employed in the informal sector.
In addition, the rural economy is affected by sharp seasonality. In such a situation, it is necessary
to have elaborate methods of collection of data on household incomes that are sensitive to
specific local conditions. The Indian government, however, has given up on this important
though difficult exercise of collecting data on household incomes.
In this paper, we review existing household incomes surveys and show that there are no reliable
large-scale sources of data on household incomes (Section 2). We then discuss a methodological
framework that we have developed for estimation of rural household incomes (Section 3). In
Section 4, we present some features of income distribution based on findings from eight village
surveys conducted using the approach outlined in the previous section. These village surveys
show extremely high levels of income inequality. In the concluding Section 5, we argue that there
is urgent need to undertake large-scale household income surveys in India.
2. Household Income Surveys in India
Household incomes can be measured in two ways: by using national accounts statistics or by
means of household surveys. The income definition in the National Accounts Statistics (NAS)
that comes closest to describing household incomes is that of personal incomes (Anand, 1983).
The NAS data on personal income can be obtained at various levels of regional and sectoral
disaggregation. In India, disaggregated data from National Accounts Statistics are available at the
level of States and by different sectors of the economy. It is not possible to estimate income for
the rural or urban household sector separately, since the method of collection of National
Accounts data does not allow for rural-urban disaggregation. Income from agriculture (or
primary sector) is often considered a proxy for rural incomes, though, given the increasing
∗
Aparajita Bakshi, Tata Institute of Social Sciences, Tuljapur; Vikas Rawal, Centre for Economic Studies and Planning, Jawaharlal Nehru University, New Delhi; and V. K. Ramachandran and Madhura Swaminathan, Indian Statistical Institute, Kolkata.
2
diversification of the rural economy, the expansion of the rural manufacturing and service
sectors, rural household incomes go beyond agricultural incomes alone. One of the major
limitations of using macro aggregates is that while the levels of income can be estimated through
these aggregates, it is not possible to analyse patterns of income distribution in the economy.
In developed economies, another source of data on personal incomes is from income tax
assessment records. These provide information on income levels, sources and distribution. In a
developing economy like India, however, income-tax payers constitute only a small fraction of
the total working population and direct tax records are not useful sources of data on household
incomes.1 Personal income tax in India constituted only 1.8 per cent of GDP in 2011-12
(Government of India, 2012).2
Data on household incomes can be collected directly through household surveys. In many
countries of the world, including developed countries like the United States and the United
Kingdom, and less developed countries such as Sri Lanka, China, and Malaysia household
income data is collected through household surveys. The merit of household survey data is that
they allow for inter-personal comparisons of income and analysis of the sources and patterns of
income generation. At the same time the estimation of income from household survey based
data involves some well recognised problems, such as problem of defining the components of
household incomes (inflows and outflows) and underestimation of household incomes.3
Given the complexity of occupational patterns in the informal economies of less developed
countries, the conceptual issues involved in the analysis of household incomes are
correspondingly complex. Although India has a long and well-established system of statistical
data collection, there are no regular surveys on incomes, in rural or urban areas. There are very
few studies of household incomes in India primarily because of the dearth of data. The only
nation-wide surveys that have directly collected data on household income are the attempts by
National Sample Survey Organisation (NSSO) in the 1960s and the recent Situation Assessment
Survey of Farmers in 2002-03, and those of the National Council of Applied Economic Research
(NCAER).
1 See Bardhan (1974) on this. 2 Income tax records can be used only to analyse the incomes of the top few percentiles (see Banerji and Piketty, 2005). 3 See Smeeding and Weinberg (2001), Atkinson (1990), Smeeding and Schmaus (1990), Anand (1983), Deaton (1997), Anand and Harris (1994).
3
2.1 Household Income Surveys Conducted by the NSSO in 1950s and 1960s
Although the National Sample Survey Organisation conducts quinquennial surveys on
consumption expenditure in India, it does not conduct regular surveys on household incomes. In
the early years of its existence, the NSSO attempted to collect information on household
incomes along with the consumption expenditure data at the 9th (1955) and 15th (1958-59) rounds
(NSSO 1993). The NSSO reported that the two income surveys were conducted on “an
experimental basis” and that “no proper methodology for systematic data collection on
household income had yet been evolved” (ibid). The data that were collected on household
incomes were not published in the NSSO reports on the 9th and 15th rounds.
In the 1960s, as part of its Integrated Household Surveys in the 19th (1964-65) and 24th (1968-69)
rounds, the NSSO collected data on receipts and disbursements of households, that is, on their
income flows. However, these efforts were not continued, as it was found that the estimates of
income that were made from survey data were lower than the estimates of consumption and
savings put together (Joshi 1996, NSSO 1993).
The two most important surveys on household incomes conducted by the NSSO were the pilot
survey of income, consumption and savings in 1983-84 and the Situation Assessment Survey of
Farmer Households in the 59th round in 2003.4
2.2 Pilot Survey of Income, Consumption and Savings (1983-84).
In 1983-84 the NSSO attempted a pilot enquiry into household incomes in rural and urban areas
in five States (Haryana, Maharashtra, Tamil Nadu, Orissa and Uttar Pradesh) and the
metropolitan cities of Delhi and Calcutta. A hundred villages and 80 urban blocks in the five
States were covered under this pilot enquiry. The reference period of the survey was January to
December 1983. The objective of this enquiry was to “explore the possibility of evolving an
operationally feasible and technically sound methodology for collection of data on household
incomes through household interview” (Joshi 1996).
Sample households in each village and urban block were divided into three sets. For the first set,
only income data were collected, for the second set data on consumption and savings were
collected, and from the third set data on all three variables were collected. The logic behind such
a sample design was that data on incomes should be comparable with data on consumption and
4 Sections 2.2 and 2.3 draw heavily on Bakshi (2010).
4
savings. A total of 24 households were selected from each village and urban block. Each
household was interviewed twice in the year, in June and December, and data on incomes and
savings were collected for the periods January to June and July to December. Data on
consumption were collected for the 30 days preceding the interview, it being assumed that
consumption patterns are stable over the six-month period (NSSO 1993).
The two main findings from the pilot survey were that, (a) household incomes were under-
reported in rural areas, and (b) household incomes were lower than the aggregate of
consumption and savings.
In all five States it was found that the average annual household income for rural areas was
almost half of the corresponding urban incomes. This led the NSS to infer that rural incomes
were seriously under-reported in the survey. Household incomes in metropolitan cities were
much higher than incomes in other urban areas (NSSO 1993, Joshi 1996). There were also
discrepancies in income estimates obtained from the three sub-samples in rural and urban areas.
Though the discrepancies in the three income estimates were lower in rural areas than in urban
areas, income estimates from Set III (income, consumption and savings) were significantly higher
than estimates from Set I (income only) for rural areas (NSSO 1993, Joshi 1996).
Comparison of rural income data with rural consumption and savings data showed serious
discrepancies. In rural areas, income estimates were found to be 30 to 40 per cent lower than the
sum of consumption and savings. For urban areas as well, estimates for consumption and
savings were marginally higher than estimates of incomes, but the differences were not
statistically significant (NSSO 1993, Joshi 1996). In metropolitan areas the estimates were almost
equal.
To summarise, the NSS pilot survey did not solve the twin problems of underestimating incomes
and generating income estimates that are consistent with estimates of consumption and savings.
All household surveys on incomes by the NSSO prior to the Situation Assessment Survey were
experimental in nature, and these studies have not adequately been discussed and evaluated. We
focus on two issues in this review of the pilot survey. The first relates to the measurement of
household incomes and components of income and the second relates to discrepancies in
estimates of income and consumption.
5
Issues in measurement of household incomes. Most rural households in India are self-employed, and the
difficulties of collecting income data on self-employed households are well known. It is
important to use an accounting framework to estimate incomes of self-employed households
with any degree of precision. Such a framework was not used in the questionnaire of the pilot
survey. The data collected on agricultural costs are not adequately disaggregated by crop or crop
operation in order to facilitate recall by the respondent.
Discrepancy in income and consumption estimates. The NSSO has been critical of income estimates
obtained from household surveys because estimated incomes are consistently lower than
estimates of consumption expenditure and savings. The most important problem here is that the
NSSO did not apply the same standards of accuracy to the collection of consumption data at the
survey of household incomes that it does to its regular consumption expenditure surveys. In
particular, the NSS pilot surveys are inaccurate in their measurement of household consumption
because they did not take seasonal fluctuations in consumption into account, as the regular NSS
surveys of consumer expenditure do.
The NSS Consumption Expenditure Surveys collect consumption expenditure data in four sub-
rounds spread across the year in order to account for seasonal variations in consumption
behaviour of households. The NSS pilot surveys, by contrast, were conducted in June and
December. In most parts of India, these two months are months that closely follow the harvest,
when food stocks and realised incomes from agriculture are high. In this respect, the method
used at the pilot surveys is likely to overstate annual consumption.
There are further conceptual problems with regard to equating household incomes with
consumption and savings. First, the accrual of incomes and their disbursal as consumption and
savings are not synchronous processes. Consumption and savings in period t are both functions
of income in period (t-n). Secondly, in situations where consumption is financed through
borrowings, the sum of consumption and savings overestimates incomes, unless we consider
“net savings”, that is, savings net of borrowings.
2.3 Situation Assessment Survey of Farmer Households (2003)
The most comprehensive and large-scale attempt by the NSS to collect data on household
incomes through direct enquiry was the Situation Assessment Survey of Farmer Households
(SAS), conducted as part of the 59th round in 2003. This survey covered many issues related to
6
farming households in India, including levels of income, consumption, farming practices,
indebtedness, access to modern technology in farming, and ownership of productive assets and
livestock. Surveys were conducted in 51,105 households in 6634 villages in all States and Union
Territories of India (NSSO 2005).
The SAS was limited to farmer households. Farmer households do not represent all households
dependent on agriculture. Agricultural labour households and households earning rental earnings
from leased out land were not included in the sample. Nevertheless, the SAS is the single largest
data source on rural household incomes in India at present.
The reference period for the SAS coincided with the agricultural year July 2002 to June 2003.
The survey was conducted in two phases in 2003. Each household in the sample was visited
twice. The first phase of the survey was January to August 2003, when information on the
cultivation of kharif crops was collected. Second-round visits to households were conducted
between September and December 2003, when information on rabi crops were collected.5
Issues in definition and measurement of household incomes. The SAS questionnaire was an improvement
on the NSS pilot survey in that it used an accounting framework to derive incomes from self-
employment activities such as cultivation, animal husbandry and non-farm business. However,
certain features of the survey method may have affected the quality of SAS data. First, costs of
labour and other inputs are disaggregated by crop and not by crop operations or the type of
input used, which may lead to recall errors by farmers. In most cases, farmers have a tendency to
overstate costs, and inaccuracies can be checked to some extent by disaggregating the cost
components.
Secondly, the SAS used different recall periods for different kinds of occupations. The recall
period for farming was an agricultural season, the recall period for non-farm business was 30
days, and for wages and salaries it was seven days. The appropriateness of a seven-day recall
period (instead of 30 days) for wages and salaries can be questioned. Salaries are generally
received on a monthly basis. Wage employment is highly seasonal and uncertain in character, and
a 30-day recall is likely to provide more stable data on wage earnings than a 7-day recall.
5 Kharif is the main agricultural season in India. It starts with the beginning of monsoon in June and lasts till October/November. Kharif crops are generally rainfed. Rabi is the winter cropping season, from December to March/April. Rabi crops are primarily irrigated crops.
7
Rental incomes from agricultural land and machinery are considered non-farm business income
in the SAS and income estimates from these components are based on a 30-day recall period. A
30-day recall period is likely to underestimate incomes from these sources, since rental incomes
from agricultural land and machinery are received for an agricultural season or for specific
operations in each season. Like agricultural incomes, the reference period for such rental
incomes should also be the agricultural season.
Thirdly, the very definition of income used by the NSSO in SAS has two drawbacks. First,
income from cultivation does not adhere to any of the commonly accepted definitions of farm
business income in India (such as the cost and income concepts specified by the Commission for
Agricultural Costs and Prices, CACP). Specifically, costs of owned animal labour, and
depreciation costs of agricultural machinery were not included in costs of cultivation. Secondly,
transfer earnings from remittances, pensions and scholarships and earnings from interest were
not included in the questionnaire.
Differences in levels of income and consumption. The income data from SAS show discrepancies
between income and consumption levels, even though data on incomes and consumption were
collected in the same questionnaire. The average consumption expenditure per farmer household
was significantly higher than income in all States other than Assam, Jammu and Kashmir and
Jharkhand (Bhalla 2006, NSSO 2005). Bhalla (2006) has also shown that in 14 out of 18 States,
the income of farmer households owning up to two hectares of land was insufficient to meet
consumption needs.
The survey was conducted in two phases all through the year, and thus consumption estimates
were less affected by seasonal fluctuations than the data collected at the pilot study. In fact, the
average monthly household consumption expenditure of farmer households as estimated from
SAS data was found to be the same as the corresponding estimate for all rural households
obtained from the NSS consumption expenditure survey that was conducted the same year
(NSSO 2005). The SAS experience suggests that even when fluctuations in expenditure are taken
partially into account and consumption data are collected together with income data, income
estimates remain lower than consumption. However, this is a phenomenon observed in many
income surveys in the world, and does not pose an insurmountable conceptual problem since
there are conceptual and definitional differences in income and expenditure that does not make
8
the two variables strictly comparable over all time periods (see Anand and Harris 1994, Bakshi
2010).
2.4 NCAER Surveys
The NCAER conducted an all-India consumption-expenditure survey in 1964-65 that also
collected data on incomes (Bardhan 1974). The survey covered a sample of 3,331 households.
Between 1968 and 1971, the NCAER undertook another study to measure changes in income
levels and income distribution and consequent changes in consumption patterns, and the
investment and saving behaviour of rural households. Data on household incomes, consumption
and savings were collected from 261 villages over three consecutive years between 1968-69 and
1970-71 for this study. A sample of 5,115 households was selected for the survey, though the
actual number of households surveyed was much less, because many selected household did not
respond to the questionnaire. The sample was a multi-stage stratified sample (NCAER 1987).
In 1981-82, the NCAER resurveyed households that were surveyed in 1970-71 in order to collect
longitudinal information on the variables that were covered in 1970-71 (NCAER 1987). A total
of 5263 households were covered in this survey, of which 3299 households belonged to the list
of households surveyed in 1970-71. These 3299 households were taken up for the longitudinal
study, which was to be a study of changes in income, inter-class mobility, the incidence of
poverty, consumption levels and patterns of and changes in demographic behaviour.
In 1993-94, NCAER conducted a much bigger survey, with a sample size of 35,130 households
from 1765 villages in 16 States of India. The data was mainly used for the “Human Development
Profile of India” (Shariff 2001). Unlike the previous NCAER surveys, information on
consumption and savings were not collected in the 1993-94 survey, but information on income
was collected.
In 2004-05 the NCAER conducted a survey titled “India Human Development Survey 2005”, in
collaboration with the University of Maryland (Desai, Dubey, Joshi, Sen, Shariff and Vanneman
2010). Data on household incomes, consumption and other human development indicators were
collected in this survey. The survey covered 26,734 rural and 14820 urban households in all the
States and union territories in India, except Andaman, Nicobar and Lakshwadeep islands (ibid.).
9
Of the 26,734 rural households 13,593 households were households that were included in the
human development survey of 1993-94.
2.5 A Critique of the NCAER Surveys
The major critique of the NCAER surveys of the 1960s and 1970s was that the estimates of
income obtained from these surveys were lower than National Accounts Statistics (NAS)
estimates of private income of the Central Statistical Organisation (CSO) (Bardhan 1974, Gaiha
1988). According to Bardhan (1974), the under-estimation of household incomes in the NCAER
1964-65 survey could originate from four sources: a. response errors, b. exclusion of unrealised
interest incomes, c. exclusion of income from certain agricultural by-products and d. exclusion of
households with annual incomes above Rs. 100,000. Bardhan, however, was cautious in his
criticism of NCAER data, since the CSO estimates of private incomes were also inaccurate,
especially for the unorganized sector, which constituted the bulk of the rural economy (ibid).
The method of data collection and estimation of incomes from the later surveys of the NCAER
have not been widely discussed in the contemporary literature. Users of the data, such as
Lanjouw and Shariff (2004) state that “a fairly comprehensive measure of rural household
incomes” could be constructed from the NCAER 1993-94 survey data. An examination of the
questionnaire, however, shows that detailed data on various components of income were not
collected in the survey. We argue that estimates of household income from this survey are not
reliable.6
The questionnaire of the 1993 NCAER survey has the following problems in respect of the
major sources of rural incomes.
(1) Crop incomes. In the 1993 survey, no information on income from different crops was
collected. Data were collected from each household only on the extent of land holdings and
crops grown (by season and variety). Incomes from crop cultivation were simply imputed for
each household using some standard values. So, data on crop-wise production and costs were
not collected but imputed. Crop incomes are a major component of rural households incomes.
(2) Wage incomes for agricultural labourers. Workers were asked to report total earnings from sowing,
harvesting and other operations. Data were collected for each worker engaged in agricultural
labour under three categories of crop operation (sowing, harvesting and other operations). These
6 See, also, Swaminathan, Rawal and Dhar (2008).
10
questions pertained to the annual number of days of employment and wages, and data were not
collected separately for different crops and seasons. Respondents were expected to report data
on earnings from major crop operations (such as land preparation, transplanting, weeding and
threshing) collectively, as earnings from “other operations”. Further, respondents were expected
to aggregate the information not for an agricultural year (for which recall is likely to be better)
but for a calendar year (1993). The agricultural year and the calendar year are, of course, very
different in all parts of India.
(3) Incomes from other occupations. For all non-crop, non-wage-labour activities, the question asked
was simply: “Give details of income for 1993.” In other words, a household was asked to report
total net incomes from livestock, from petty trade, from non-agricultural wage employment, and
all other activities. It is clear that such a question can not be answered accurately because of
serious problems of valuation and because most households do not have any written accounts of
output and costs associated with these activities. Even if the respondent did provide a number,
there was no way of ensuring that all incomes and costs were accounted for in making such a
valuation nor was there a mechanism to ensure that valuations were made in any
methodologically consistent manner across households.
It is clear that an accounting framework necessary to obtain an accurate estimate of incomes in
the unorganised economy was not used in the NCAER 1993 survey.
The 2005 survey conducted by the NCAER used a different and more detailed questionnaire,
but some serious problems remain.7
(1) Crop incomes. In 2005, the questionnaire solicited information on the area cultivated,
production and price of each crop cultivated by a household. Information on costs of
cultivation, however, was collected in a highly aggregated manner. Households were asked to
report total annual expenses in rupee terms for major items of cost (hired labour, seeds,
fertilizers, pesticides, irrigation, machinery, loans and maintenance). Once again, unreliability
arises from asking cultivators to value all inputs, irrespective of crop, crop-mix or season, recall
costs for a whole year and aggregate them in a consistent manner.
7 Detailed documentation of the India Human Development Survey, 2005 is available at http://ihds.umd.edu/index.html and http://dx.doi.org/10.3886/ICPSR22626.
11
In India, there is an established methodology for the estimation of crop incomes. Standard cost
concepts have been specified in the Comprehensive Cost of Cultivation of Principal Crops
(CCPC) surveys, that currently collect data on crop incomes for 24 crops across 20 States (CACP
2010). Neither the methodology used in the NCAER survey, nor the net incomes from crop
cultivation reported in the NCAER survey, correspond to those in the CACP surveys; the
reliability of the NCAER data thus cannot be validated by cross-checking with CCPC data.
(2) Wages and salaries. In the 2005 survey, respondents were asked to report total earnings from
agricultural labour for the whole year. The questionnaire asked each worker to report the
number of days of employment and cash and kind payments by occupation. The occupation
code lists “agricultural labour” as one occupation. In other words, a worker was asked to recall
the number of days of employment and earnings for all crops and operations, and provide
aggregate information to the investigator. Since most agricultural workers are casual workers,
providing such aggregate information with a recall period of one year is likely to give highly
inaccurate information. In respect of agricultural labour, the 2005 questionnaire is less detailed
than the 1993 questionnaire. Further, the questionnaire on incomes from labour earnings does
not follow the format of the National Sample Survey Organisation (NSSO) or Rural Labour
Enquiry (RLE), making it difficult to cross-check figures for consistency.
(3) Income from animal resources. Although there was a separate block in the 2005 survey
questionnaire on animals, information in this block was collected only on money incomes from
the sale of milk, eggs, chicken and livestock, and on the total value of home-grown and
purchased feed. There were three major gaps in the data collected. First, no information was
collected on animal products that were consumed by the household. Secondly, products other
than the four listed items were not covered. Thirdly, costs other than the cost of feed were not
covered. As a result, the accounts of income from animals in the survey remain incomplete.
(4) Other activities. For all non-farm business activities, the 2005 survey gathered information on
gross annual receipts, total expenditure on materials and inputs, and total cost of hiring workers.
The survey then solicited information on other sources of income, particularly with respect to
transfer incomes (pensions, scholarships, etc.). For these sources of income, the respondent was
asked to provide a single estimate of total annual net income.
12
To sum up, while the 2005 survey questionnaire collected information on a longer list of items
than the 1993 survey questionnaire did, the data are nevertheless likely to be affected by serious
errors. In general, the errors have two sources. First, the methods used were arbitrary, and did
not draw on tested methodologies for the collection of data on, for example, crop incomes or
employment. Secondly, rather than collecting detailed information on the components of income
and then building a profile of information on incomes on incomes, the data collected were
aggregates, and thus subject to error.
3. Methodology for estimation of incomes in PARI village surveys
India has detailed official statistics on crop incomes, employment, wages, debt and assets.
Concepts used in data collection and estimation of these statistics, most notably for the
estimation of crop incomes, provide useful inputs for developing a methodological framework
that can be utilised, with some modifications, in the calculation of rural household incomes.
There have been some studies of rural incomes in India by independent scholars and groups.
These include the ICRISAT studies (Walker and Ryan 1990, Deb et. al. 2002), surveys conducted
by Farrington, Deshingkar, Johnson and Start (2006), Bhaumik (2007), Vatta and Sidhu (2007)
and Vatta and Garg (2008). Most of the small-scale surveys, however, do not adequately specify
the methodology used for estimating incomes.8
The Foundation for Agrarian Studies (FAS) has been conducting detailed village surveys in
different States and agro-climatic regions in India as part of the Project on Agrarian Relations in
India (PARI) since 2005-06.9 The questionnaire used in these census type household surveys
cover a host of information, the most important being on household incomes and employment.
Based on the household level data collected in these surveys it is possible to construct reliable
estimates of household incomes in the study villages.
It is important to understand that the majority of rural households in India are self-employed in
crop production or other non-agricultural occupations and are unable to report their total
household income as such. Thus, income has to be treated as a derived variable, in other words,
derived on the basis of a detailed accounting of output and costs of all economic activities. The
derivation is complex given that markets are thin or even absent for many outputs and inputs. A
second factor is the relevant time period. Given that income is a flow variable, it has to be
8 See Rawal, Swaminathan and Dhar (2008) for a discussion of methodological problems in estimates of incomes in some of these studies. 9 For details of the Project and villages and States covered, see http://www.fas.org.in/pages.asp?menuid=16
13
estimated for a uniformly specified period. In contrast, stock variables – like assets or debt – are
valued at a specified date (for example, at the time of the survey). For the most important rural
economic activities, there tends to be an annual production cycle. It would, therefore, be
reasonable to estimate income for a period of one year. Since agriculture is the most important
economic activity in rural areas, crop production can be treated on an annual cycle and used to
estimate annual income (for the crop year, that is, July to June in India). However, there are
some crops with a longer production cycle (perennial tree crops, ratoon crops, etc) for which an
annual income will need to be derived. Thirdly, a household has to be considered as the basic
unit for estimation of incomes. In the official statistics in India (for example, the Census of India
and the NSSO surveys), a household is defined as persons normally residing together (under the
same roof) and normally taking food from the same kitchen. In the FAS-PARI surveys, we use
the same definition of household for the sake of comparability with official statistics. However,
this poses challenges such as accurate estimation of remittances of household members that are
not regularly resident, or apportioning of incomes in the presence of joint cultivation (say, by
brothers residing in two separate households).
The estimates of income in PARI include all cash and kind incomes; they account for all cash
and kind receipts other than from borrowing and from sale of assets (including cash transfers).10
All incomes are net of costs incurred by the households in the process of production and income
generation.
Incomes of households in the FAS-PARI villages are estimated separately for following sources.
The surveys used detailed modules on incomes from each of the sources.
1. Crop production
2. Animal resources (including rental income from animals)
3. Wage labour
(a) Agricultural labour (casual)
(b) Agricultural labour (long-term)
(c) Non-agricultural labour (casual)
(d) Non-agricultural labour (monthly/long-term)
4. Salaried jobs
(a) Government salaried jobs
10 Transfers in kind such as food subsidies are not included.
14
(b) Other salaried jobs
5. Business and trade
6. Money-lending
7. Income from savings in financial institutions and equity
8. Pensions and scholarships
9. Remittances and gifts
10. Rental income
(a) Rental income from agricultural land
(b) Rental income from machinery
(c) Rental income from other assets
11. Artisanal work and work at traditional caste calling
12. Any other sources
Gross incomes net of paid-out costs from crop production were calculated for each individual
crop or crop-mix. The definition here of “costs of cultivation” closely resembles the definition
of the “Cost A2” category used under the Comprehensive Scheme for Studying Cost of
Cultivation/Production of Principal Crops (CCPC) of the Commission of Agricultural Costs and
Prices, India. It includes, broadly speaking, the cost of all material inputs (purchased and home-
produced), the cost of hired labour, rental payments, the imputed value of interest on working
capital, and depreciation of owned fixed capital other than land. No cost is imputed for family
labour and no rent is imputed for owned land. Conceptual and methodological problems in
imputing the costs of family labour and owned land have been discussed at length in the writing
on CCPC data (see Sen and Bhatia 2004, for a summary), and shall not detain us here. We shall
note, however, the consequences of exclusion of these items of costs from our calculations. As a
result of exclusion of the cost of family labour, other factors being constant, a household using a
greater share than others of family labour incurs a lower cost of cultivation than other
households. Similarly, the cost of cultivation is higher for a tenant than for a landowner because
rental payments of a tenant are included in the costs while no cost is imputed for owned land.
Similarly, for wage labour in agriculture, each worker was asked questions on the number of days
of employment and on earnings (in cash, kind, or both) for each season, crop, and crop
operation. In order systematically to record labour use and employment in different agricultural
tasks, FAS has prepared a comprehensive list of all field operations and categorized them using a
four-digit system of classification. Using this system of classification, the Foundation’s survey
15
team prepares, for each village, a separate set of survey codes covering all operations involved in
the cultivation of each crop cultivated in the village. These village-specific survey codes take into
account village-specific variations in production processes, techniques of production, and
systems of labour hiring. When preparing these codes, care is taken to list all the tasks involved
in the production of a crop. An appropriately disaggregated and comprehensive list of all crop
operations is crucial for collecting accurate data on labour use and employment.
In the following section, we present some estimates of the distribution of household income in
eight villages across four States of India, based on FAS household survey data, which can
provide a cross-sectional picture of incomes in selected locations. As incomes fluctuate
substantially across households and over time, it must be reiterated that the absolute values
pertain to a particular year and do not describe long-run incomes.
4. Some features of income distribution in rural India: illustrations from eight villages
4.1 Village Description
The PARI villages covered in this paper were surveyed between 2005 and 2007 (Table 1). In
2005–06, we conducted in-depth census and sample surveys in three villages of Andhra Pradesh:
Ananthavaram, a village in the paddy-growing region of Guntur district; Bukkacherla, a village in
the dry and drought-prone district of Anantapur; and Kothapalle, a village in a groundwater-
irrigated region of north Telengana (Karimnagar district). This was followed in June 2006 by
census-type surveys in two villages of Uttar Pradesh: Harevli, located in the canal-irrigated,
sugarcane-growing district of Bijnor; and Mahatwar, selected from eastern Uttar Pradesh.
Mahatwar is in Ballia district and is located in a groundwater-irrigated wheat–paddy-growing belt.
In 2007, surveys were conducted in two villages of Maharashtra. Nimshirgaon, located in
Kolhapur district, has a relatively prosperous agriculture based on irrigated sugarcane and a
variety of vegetable and fruit crops. Warwat Khanderao is a village in the unirrigated, cotton-
growing tracts of Buldhana district. 25 F Gulabewala village, in the Gang Canal region of
western Rajasthan, was also surveyed in 2007.
16
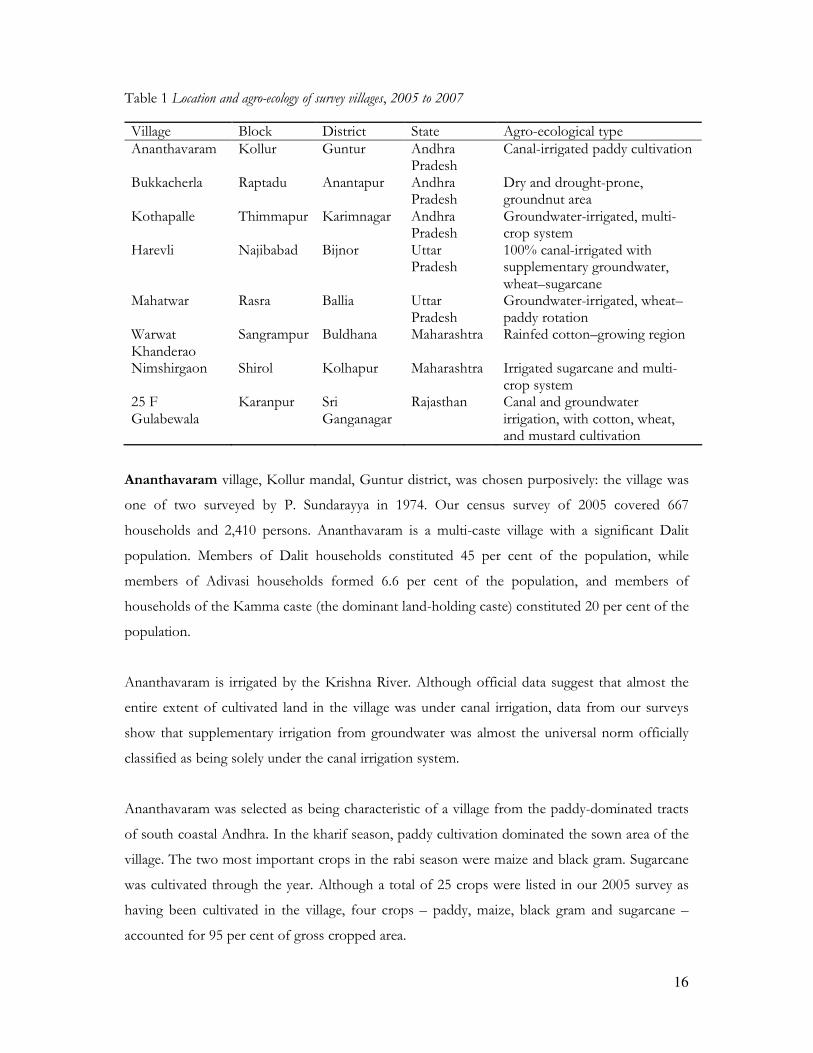
Table 1 Location and agro-ecology of survey villages, 2005 to 2007
Village Block District State Agro-ecological type Ananthavaram Kollur Guntur Andhra
Pradesh Canal-irrigated paddy cultivation
Bukkacherla Raptadu Anantapur Andhra Pradesh
Dry and drought-prone, groundnut area
Kothapalle Thimmapur Karimnagar Andhra Pradesh
Groundwater-irrigated, multi-crop system
Harevli Najibabad Bijnor Uttar Pradesh
100% canal-irrigated with supplementary groundwater, wheat–sugarcane
Mahatwar Rasra Ballia Uttar Pradesh
Groundwater-irrigated, wheat–paddy rotation
Warwat Khanderao
Sangrampur Buldhana Maharashtra Rainfed cotton–growing region
Nimshirgaon Shirol Kolhapur Maharashtra Irrigated sugarcane and multi-crop system
25 F Gulabewala
Karanpur Sri Ganganagar
Rajasthan Canal and groundwater irrigation, with cotton, wheat, and mustard cultivation
Ananthavaram village, Kollur mandal, Guntur district, was chosen purposively: the village was
one of two surveyed by P. Sundarayya in 1974. Our census survey of 2005 covered 667
households and 2,410 persons. Ananthavaram is a multi-caste village with a significant Dalit
population. Members of Dalit households constituted 45 per cent of the population, while
members of Adivasi households formed 6.6 per cent of the population, and members of
households of the Kamma caste (the dominant land-holding caste) constituted 20 per cent of the
population.
Ananthavaram is irrigated by the Krishna River. Although official data suggest that almost the
entire extent of cultivated land in the village was under canal irrigation, data from our surveys
show that supplementary irrigation from groundwater was almost the universal norm officially
classified as being solely under the canal irrigation system.
Ananthavaram was selected as being characteristic of a village from the paddy-dominated tracts
of south coastal Andhra. In the kharif season, paddy cultivation dominated the sown area of the
village. The two most important crops in the rabi season were maize and black gram. Sugarcane
was cultivated through the year. Although a total of 25 crops were listed in our 2005 survey as
having been cultivated in the village, four crops – paddy, maize, black gram and sugarcane –
accounted for 95 per cent of gross cropped area.
17
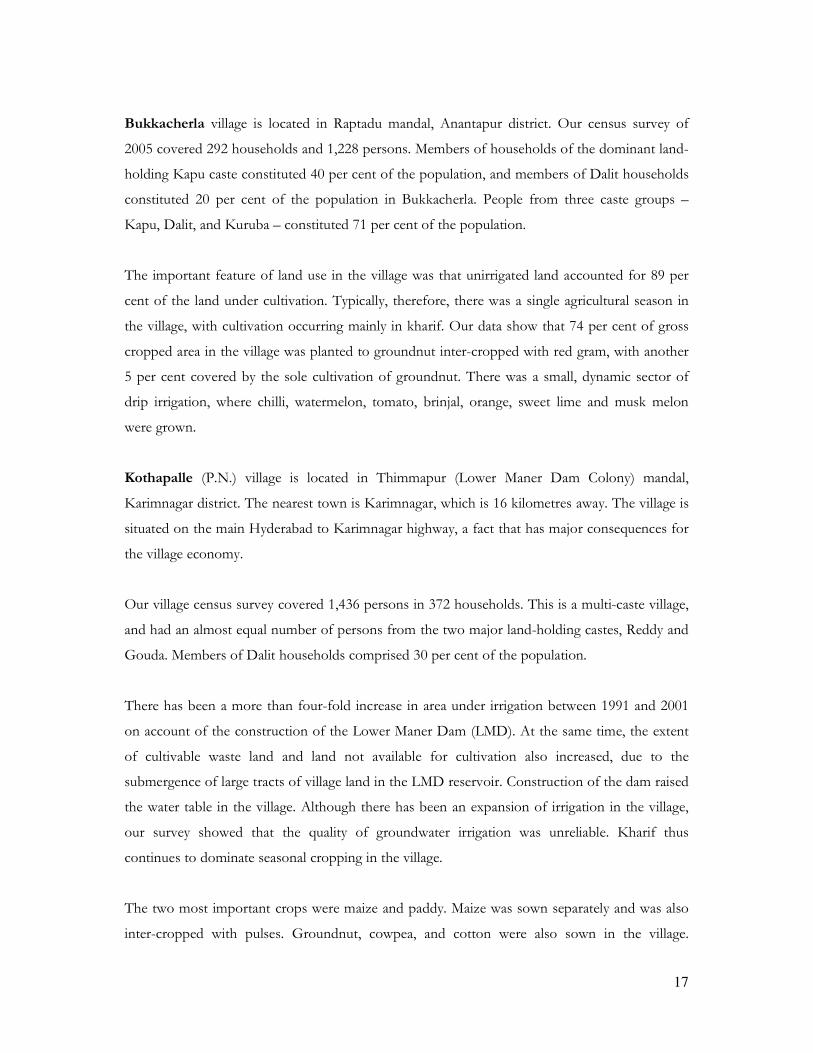
Bukkacherla village is located in Raptadu mandal, Anantapur district. Our census survey of
2005 covered 292 households and 1,228 persons. Members of households of the dominant land-
holding Kapu caste constituted 40 per cent of the population, and members of Dalit households
constituted 20 per cent of the population in Bukkacherla. People from three caste groups –
Kapu, Dalit, and Kuruba – constituted 71 per cent of the population.
The important feature of land use in the village was that unirrigated land accounted for 89 per
cent of the land under cultivation. Typically, therefore, there was a single agricultural season in
the village, with cultivation occurring mainly in kharif. Our data show that 74 per cent of gross
cropped area in the village was planted to groundnut inter-cropped with red gram, with another
5 per cent covered by the sole cultivation of groundnut. There was a small, dynamic sector of
drip irrigation, where chilli, watermelon, tomato, brinjal, orange, sweet lime and musk melon
were grown.
Kothapalle (P.N.) village is located in Thimmapur (Lower Maner Dam Colony) mandal,
Karimnagar district. The nearest town is Karimnagar, which is 16 kilometres away. The village is
situated on the main Hyderabad to Karimnagar highway, a fact that has major consequences for
the village economy.
Our village census survey covered 1,436 persons in 372 households. This is a multi-caste village,
and had an almost equal number of persons from the two major land-holding castes, Reddy and
Gouda. Members of Dalit households comprised 30 per cent of the population.
There has been a more than four-fold increase in area under irrigation between 1991 and 2001
on account of the construction of the Lower Maner Dam (LMD). At the same time, the extent
of cultivable waste land and land not available for cultivation also increased, due to the
submergence of large tracts of village land in the LMD reservoir. Construction of the dam raised
the water table in the village. Although there has been an expansion of irrigation in the village,
our survey showed that the quality of groundwater irrigation was unreliable. Kharif thus
continues to dominate seasonal cropping in the village.
The two most important crops were maize and paddy. Maize was sown separately and was also
inter-cropped with pulses. Groundnut, cowpea, and cotton were also sown in the village.
18
Orchards of mango and other fruit trees (lime, coconut, and pomegranate) accounted for almost
5 per cent of total gross cropped area. Tapping toddy from palmyra trees was an important
village occupation.
Harevli village is located in Najibabad block, Bijnor district, western Uttar Pradesh. There is no
all-weather road to the village and the main mode of transport from the village to Mandavli, the
nearest town, is by horse- or bullock-cart. Harevli is a small village in terms of population: the
population was 668 persons at the Census of 2001. At the time of our survey, 115 households
and 674 persons were resident in the village. The dominant caste in the village was Tyagi. Dalit
households comprised 38 per cent of all households.
Agriculture is the mainstay of the economy of Harevli. At the Census of 2001, 90 per cent of
workers were reported to be cultivators or agricultural labourers. Sugarcane is the most
important crop; wheat, paddy, and fodder crops are also cultivated. Irrigation from a public
canal, part of the Eastern Ganga canal project, provides water during the kharif season, and
tubewells (with both diesel and electric pumpsets) provide water throughout the year. Most
tubewells are owned by the landowning Tyagi households. There is a high degree of inequality in
land ownership. One-third of all households in Harevli were landless.
Mahatwar village is in Rasra block, Ballia district, eastern Uttar Pradesh. Mahatwar is located
near the highway linking Rasra to Mau, and there are bus and jeep transport services to nearby
towns as well as cities such as Varanasi. At the time of our survey, there were 159 households
and 1,114 persons resident in the village. Mahatwar is a multi-caste village. Dalits constituted the
majority in the village: 60 per cent of all households were Dalit.
The major crops grown in Mahatwar were paddy during the kharif season and wheat (sometimes
inter-cropped with mustard) during the rabi season. The source of irrigation was groundwater,
and tubewells were energized by diesel or electricity. Twenty per cent of households owned no
land and 71 per cent owned less than 1 acre of land, and there were no very large land owners
resident in the village. Non-agricultural occupations within and outside the village provided an
important source of income to resident households.
Warwat Khanderao is in Sangrampur tehsil, Buldhana district, in the Vidarbha region of
Maharashtra. The nearest town is Shegaon, at a distance of 20 kilometres from the village,
19
connected by an all-weather road. At our survey, there were 250 households in the village with a
population of 1,308 persons. The major caste in the village was Kunbi (43 per cent of all
households).
Agriculture is the main occupation of the residents, with 69 per cent of workers reported to be
cultivators and another 15 per cent reported to be agricultural labourers. The major crop
cultivated in 2007 was cotton, both Bt (genetically modified) and other varieties. Other crops
grown were groundnut, sunflower, green gram, sesamum, jowar, maize, pulses, wheat, red gram,
and black gram. The village had no irrigation. The median extent of household ownership
holding was 3.5 acres (excluding the landless), which is not high given the fact that land is mostly
unirrigated and single-cropped.
Nimshirgaon is a village in Shirol taluk, Kolhapur district, in the sugarcane-growing region of
western Maharashtra. It is connected by an all-weather road to the highway. The number of
households in our listing was 768, with a population of 3,515 persons. Nimshirgaon is a multi-
caste village. Almost one-third of all households are Jain and another one-third are Dalit.
Agriculture in Kolhapur is relatively modern and dynamic. Sugarcane is the major crop, and
soyabean, pulses, and millets are also cultivated, as are a variety of vegetables and fruit (including
grape and mango). Irrigation is from a water-supply system linked to the Krishna river. There are
also hundreds of open wells, borewells, and tubewells in the fields. Intensive irrigation has
transformed the scale of cultivation in the village.
25 F Gulabewala is in Karanpur tehsil, Sri Ganganagar district, Rajasthan. The village is about
25 kilometres from Sri Ganganagar town and is connected by an all-weather road. In 2007, 204
households lived in 25 F Gulabewala. The main castes in the village were Jat Sikh, Mazhabi
(Dalit) Sikh, and Nayak (Dalit).
The village is irrigated by the Ganga Canal project. The main crops cultivated in Gulabewala
were wheat, rapeseed, cotton, cluster beans, and fodder crops. In recent years, a decline in the
availability of water has resulted in a decline in the cultivation of cotton. Agricultural operations
in the village are highly mechanized.
20
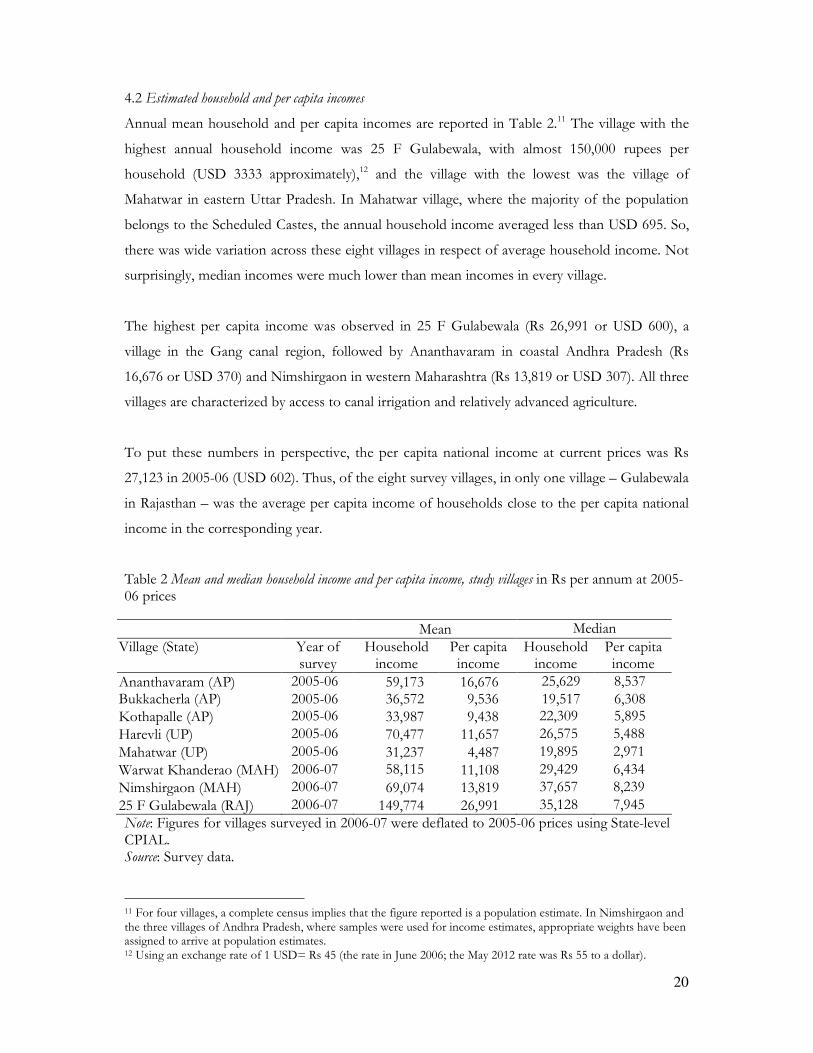
4.2 Estimated household and per capita incomes
Annual mean household and per capita incomes are reported in Table 2.11 The village with the
highest annual household income was 25 F Gulabewala, with almost 150,000 rupees per
household (USD 3333 approximately),12 and the village with the lowest was the village of
Mahatwar in eastern Uttar Pradesh. In Mahatwar village, where the majority of the population
belongs to the Scheduled Castes, the annual household income averaged less than USD 695. So,
there was wide variation across these eight villages in respect of average household income. Not
surprisingly, median incomes were much lower than mean incomes in every village.
The highest per capita income was observed in 25 F Gulabewala (Rs 26,991 or USD 600), a
village in the Gang canal region, followed by Ananthavaram in coastal Andhra Pradesh (Rs
16,676 or USD 370) and Nimshirgaon in western Maharashtra (Rs 13,819 or USD 307). All three
villages are characterized by access to canal irrigation and relatively advanced agriculture.
To put these numbers in perspective, the per capita national income at current prices was Rs
27,123 in 2005-06 (USD 602). Thus, of the eight survey villages, in only one village – Gulabewala
in Rajasthan – was the average per capita income of households close to the per capita national
income in the corresponding year.
Table 2 Mean and median household income and per capita income, study villages in Rs per annum at 2005-06 prices
Mean Median
Village (State) Year of survey
Household income
Per capita income
Household income
Per capita income
Ananthavaram (AP) 2005-06 59,173 16,676 25,629 8,537 Bukkacherla (AP) 2005-06 36,572 9,536 19,517 6,308 Kothapalle (AP) 2005-06 33,987 9,438 22,309 5,895
Harevli (UP) 2005-06 70,477 11,657 26,575 5,488
Mahatwar (UP) 2005-06 31,237 4,487 19,895 2,971
Warwat Khanderao (MAH) 2006-07 58,115 11,108 29,429 6,434
Nimshirgaon (MAH) 2006-07 69,074 13,819 37,657 8,239
25 F Gulabewala (RAJ) 2006-07 149,774 26,991 35,128 7,945 Note: Figures for villages surveyed in 2006-07 were deflated to 2005-06 prices using State-level CPIAL. Source: Survey data.
11 For four villages, a complete census implies that the figure reported is a population estimate. In Nimshirgaon and the three villages of Andhra Pradesh, where samples were used for income estimates, appropriate weights have been assigned to arrive at population estimates. 12 Using an exchange rate of 1 USD= Rs 45 (the rate in June 2006; the May 2012 rate was Rs 55 to a dollar).
21
4.3 Features of income distribution
To study income distribution, we ranked households by total household income and ranked
persons by per capita household income.13 This exercise was undertaken for each village
separately, and the last column reports the figures for the pooled data from eight villages (a total
of 2,800 households and 12,869 persons).14 As it is not clear how we should interpret the pooled
data, our focus is on each village as a separate entity and income distribution within that village
(and not on a aggregate exercise). Tables 3 and 4 show the decile-wise distribution of incomes
for the eight study villages.
13 We have simply divided total household income by household size and not used equivalence scales. 14 In Nimshirgaon and the three villages of Andhra Pradesh, where samples were used for income estimates, appropriate weights have been assigned.
22
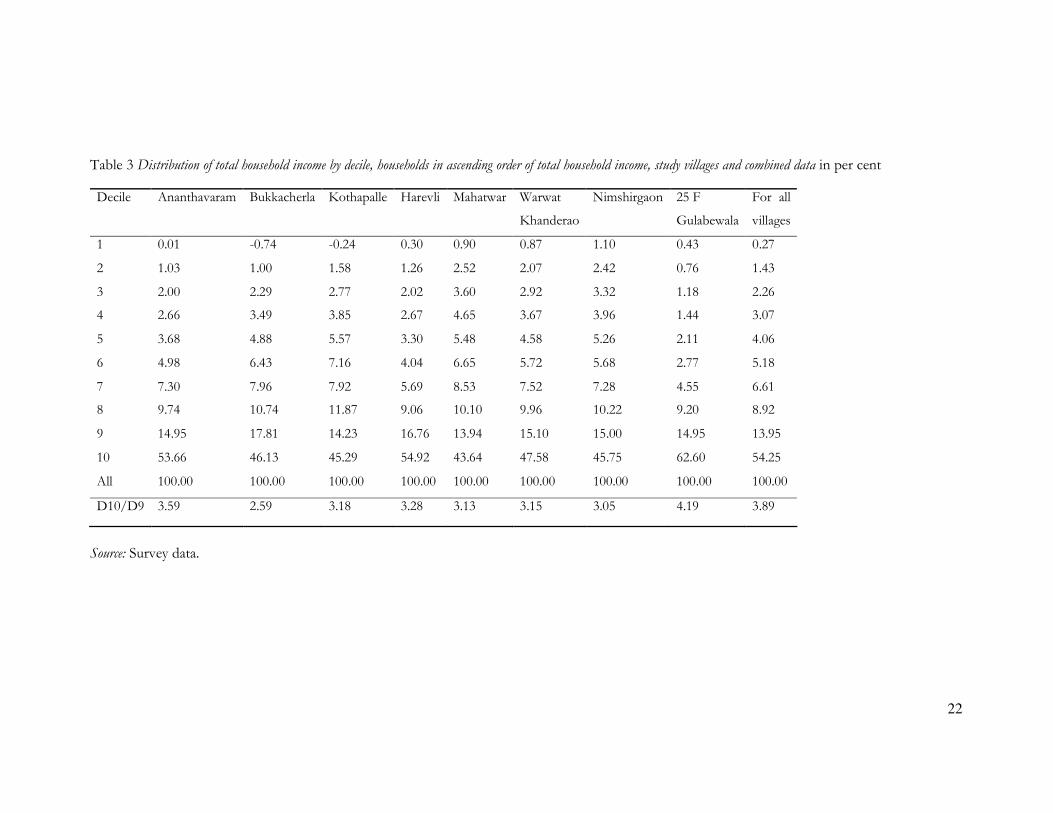
Table 3 Distribution of total household income by decile, households in ascending order of total household income, study villages and combined data in per cent
Decile Ananthavaram Bukkacherla Kothapalle Harevli Mahatwar Warwat
Khanderao
Nimshirgaon 25 F
Gulabewala
For all
villages
1 0.01 -0.74 -0.24 0.30 0.90 0.87 1.10 0.43 0.27
2 1.03 1.00 1.58 1.26 2.52 2.07 2.42 0.76 1.43
3 2.00 2.29 2.77 2.02 3.60 2.92 3.32 1.18 2.26
4 2.66 3.49 3.85 2.67 4.65 3.67 3.96 1.44 3.07
5 3.68 4.88 5.57 3.30 5.48 4.58 5.26 2.11 4.06
6 4.98 6.43 7.16 4.04 6.65 5.72 5.68 2.77 5.18
7 7.30 7.96 7.92 5.69 8.53 7.52 7.28 4.55 6.61
8 9.74 10.74 11.87 9.06 10.10 9.96 10.22 9.20 8.92
9 14.95 17.81 14.23 16.76 13.94 15.10 15.00 14.95 13.95
10 53.66 46.13 45.29 54.92 43.64 47.58 45.75 62.60 54.25
All 100.00 100.00 100.00 100.00 100.00 100.00 100.00 100.00 100.00
D10/D9 3.59 2.59 3.18 3.28 3.13 3.15 3.05 4.19 3.89
Source: Survey data.
23
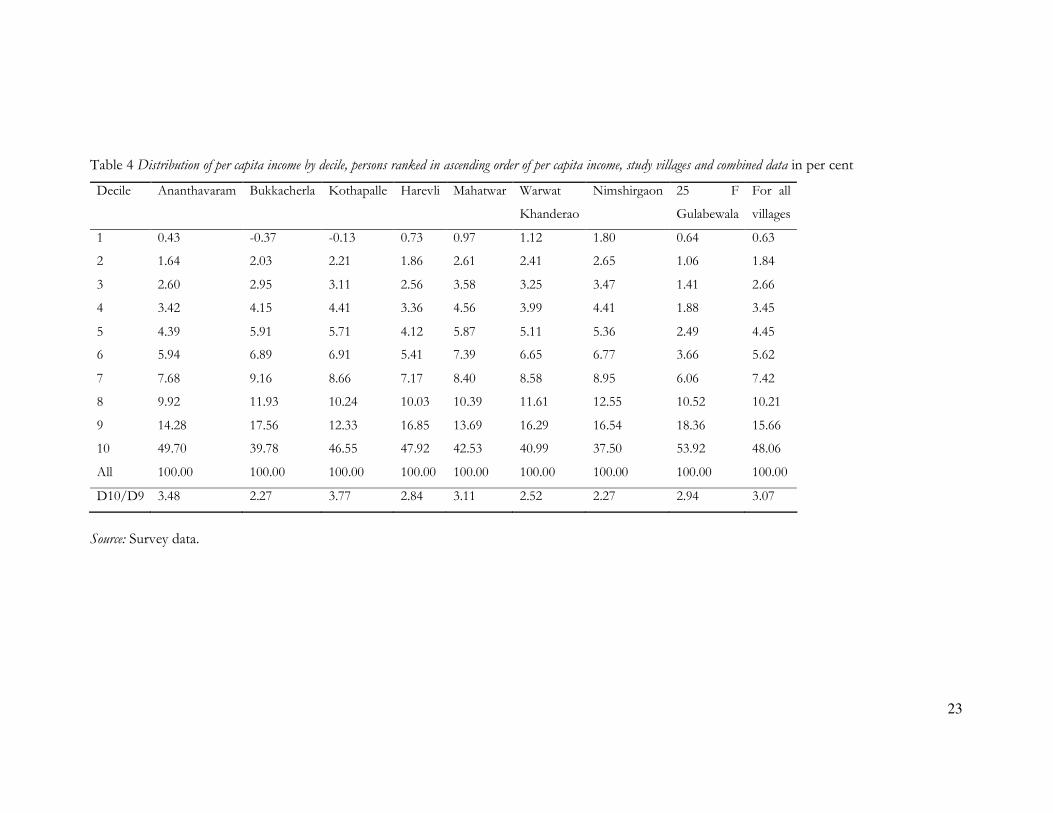
Table 4 Distribution of per capita income by decile, persons ranked in ascending order of per capita income, study villages and combined data in per cent
Decile Ananthavaram Bukkacherla Kothapalle Harevli Mahatwar Warwat
Khanderao
Nimshirgaon 25 F
Gulabewala
For all
villages
1 0.43 -0.37 -0.13 0.73 0.97 1.12 1.80 0.64 0.63
2 1.64 2.03 2.21 1.86 2.61 2.41 2.65 1.06 1.84
3 2.60 2.95 3.11 2.56 3.58 3.25 3.47 1.41 2.66
4 3.42 4.15 4.41 3.36 4.56 3.99 4.41 1.88 3.45
5 4.39 5.91 5.71 4.12 5.87 5.11 5.36 2.49 4.45
6 5.94 6.89 6.91 5.41 7.39 6.65 6.77 3.66 5.62
7 7.68 9.16 8.66 7.17 8.40 8.58 8.95 6.06 7.42
8 9.92 11.93 10.24 10.03 10.39 11.61 12.55 10.52 10.21
9 14.28 17.56 12.33 16.85 13.69 16.29 16.54 18.36 15.66
10 49.70 39.78 46.55 47.92 42.53 40.99 37.50 53.92 48.06
All 100.00 100.00 100.00 100.00 100.00 100.00 100.00 100.00 100.00
D10/D9 3.48 2.27 3.77 2.84 3.11 2.52 2.27 2.94 3.07
Source: Survey data.
24
A quick look at the figures in these two tables shows the very high concentration of incomes at
the top. The top 10 per cent of households received 62.6 per cent of total incomes in 25 F
Gulabewala, 54.9 per cent in Harevli and 53.6 per cent in Ananthavaram village. All these three
villages are characterized by relatively high productivity canal-irrigated agriculture. Thus, more
than one-half of total household incomes was cornered by the top decile in these three villages.15
Though high, the share of the top decile was lower in Nimshirgaon, Kothapalle, Bukkacherla and
Warwat Khanderao villages. Warwat Khanderao and Bukkacherla are primarily rainfed villages
with unirrigated crop cultivation and a predominance of small-holder cultivation (and could be
referred to as “dry villages”). The fact that Nimshirgaon does not have the same degree of
concentration of incomes as the three villages that are characterized by relatively advanced
agriculture may be because the village is located close to urban and semi-urban areas that provide
opportunities for non-agricultural employment. Similarly, Kothapalle village is located on a
highway and that brings access to non-agricultural employment for a large section of the
population.
At the other extreme, the lowest decile of households did not receive more than one per cent of
total incomes (and barely above in Nimshirgaon village of Maharashtra, Table 3). In two villages
of Andhra Pradesh – Bukkacherla and Kothapalle – the lowest decile had a negative income
share, because it covered, on average, loss-making households.16 Andhra Pradesh is a State where
large-scale agrarian distress was reported in the 1990s.17
Similar patterns are observed with the data on individuals, ranked by per capita income.
Note that in each village, households and persons up to and including those in the seventh decile
did not receive an income share corresponding to their population share.
Indeed, it appears that income distribution in these villages is of the Latin American “winner
takes all” model (Palma, 2006), that is, of extreme concentration in the 10th decile, with even the
9th decile not gaining a significant share of income. Taking the distribution of per capita income
income across persons, the share of decile 9 was only 12 per cent in Kothapalle and 13.7 per cent
in Mahatwar. Nevertheless, in all villages, there was a clear divide between deciles 10 and 9 in the
15 In the eight villages surveyed, the top 5 per cent of households accounted for 42.9 per cent of incomes. In other words, even looking at the top decile is rather misleading because incomes of the top 5 per cent are much higher than those of the next 5 per cent. 16 For a discussion of negative incomes in these village surveys, see Swaminathan and Rawal (2011a). 17 See Government of Andhra Pradesh (2005).
25
level and share of income. The biggest difference occurred in Kothapalle, where persons in
decile 10 received almost four times the income share of those in decile 9.
Gini Coefficient
To get a measure of inequality, we compute the Gini coefficient. However, if negative incomes
are included in the standard Gini coefficient, the value of the Gini can exceed one. This makes
interpretation and comparison with other estimates difficult. Chen, Tsaur and Rhai (1982)
proposed a normalization of the Gini such that the adjusted Gini coefficient remained in the
range 0 to 1. We have computed, as per their suggestion, adjusted Gini coefficients for all our
data.18
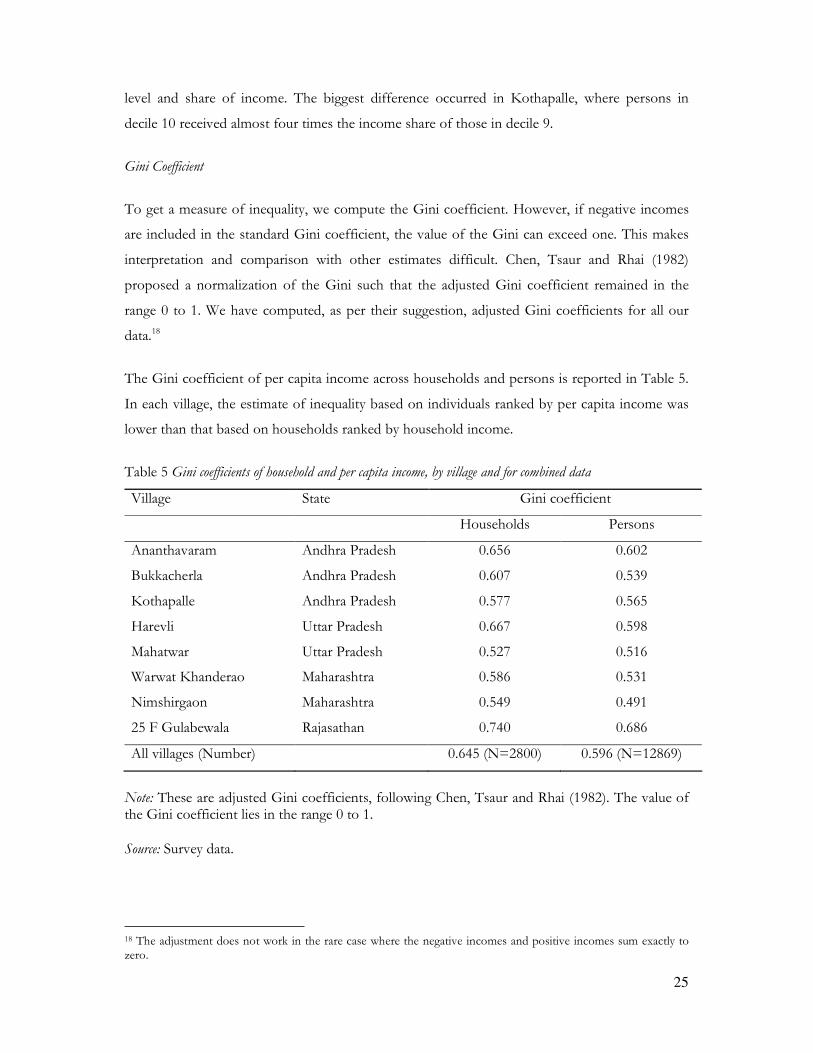
The Gini coefficient of per capita income across households and persons is reported in Table 5.
In each village, the estimate of inequality based on individuals ranked by per capita income was
lower than that based on households ranked by household income.
Table 5 Gini coefficients of household and per capita income, by village and for combined data
Village State Gini coefficient
Households Persons
Ananthavaram Andhra Pradesh 0.656 0.602
Bukkacherla Andhra Pradesh 0.607 0.539
Kothapalle Andhra Pradesh 0.577 0.565
Harevli Uttar Pradesh 0.667 0.598
Mahatwar Uttar Pradesh 0.527 0.516
Warwat Khanderao Maharashtra 0.586 0.531
Nimshirgaon Maharashtra 0.549 0.491
25 F Gulabewala Rajasathan 0.740 0.686
All villages (Number) 0.645 (N=2800) 0.596 (N=12869)
Note: These are adjusted Gini coefficients, following Chen, Tsaur and Rhai (1982). The value of the Gini coefficient lies in the range 0 to 1.
Source: Survey data.
18 The adjustment does not work in the rare case where the negative incomes and positive incomes sum exactly to zero.
26
These estimates indicate very high levels of income inequality in Indian villages.19 The value of
the Gini coefficient was more than 0.5 in all but one village. To put these numbers in
perspective, it may be noted that the Gini coefficient for rural India, based on per capita
household expenditure, was 0.3045 in 2004-05(Dev and Ravi, 2007).
There were, however, large variations across the villages (Table 5). The lowest estimated Gini
coefficient was 0.491 for Nimshirgaon (western Maharashtra) and the highest was 0.686 for 25 F
Gulabewala (western Rajasthan), a difference of 19.5 Gini points (in per cent). Among the eight
villages, the three villages with a relatively high Gini coefficient were Ananthavaram, Harevli and
25 F Gulabewala. All three were canal-irrigated villages.
5 Concluding remarks
Despite having a well-developed statistical system, the National Sample Statistical Organisation
of India does not conduct regular household income surveys, on the grounds that available
methods result in serious under-estimation. The problem of under-estimation of household
incomes through household surveys is not specific to India. We believe that response errors and
underestimation of household incomes can be minimized through a meticulous design of the
questionnaire. If all components and sources of income are identified accurately and an
accounting framework is applied to estimate incomes from each source, fairly accurate estimates
of income can be prepared. The accounting framework should, of course, disaggregate the items
of costs and receipts in a way so as to facilitate recall and minimise under-reporting.
The National Council of Applied Economic Research (NCAER) has undertaken household
income surveys over the last four decades. However, we have shown that the income estimates
of the two recent surveys, and the 1993 survey in particular, are not based on a comprehensive
accounting framework, and are therefore likely to be inaccurate.
As part of the Project on Agrarian Relations in India, we have attempted to develop a framework
for estimation of household incomes, and the paper discusses some of the major methodological
issues in estimation of household incomes. We have applied this methodology in 20 village
19 For a discussion of the role of caste in within-village inequality, see Rawal and Swaminathan (2011).
27
census surveys. In this paper, we illustrate patterns of income distribution using data from eight
village surveys conducted between 2005 and 2007.
While not attempting to generalize from these village surveys, we report estimates of household
and per capita income to highlight certain features of incomes distribution in Indian villages.
First, we have provided estimates of household and per capita income for the study villages.
There was a lot of variation even across these eight villages, but in general, estimated incomes
were low and lower than the national per capita income with one exception.
Secondly, decile-wise distributions and measures such as the Gini coefficient clearly indicate that
income inequality was high in all the survey villages, with a concentration of incomes in the top
percentiles and top deciles. The common feature of the three villages with higher than average
inequality was that they were canal-irrigated villages with a relatively modern agricultural sector.
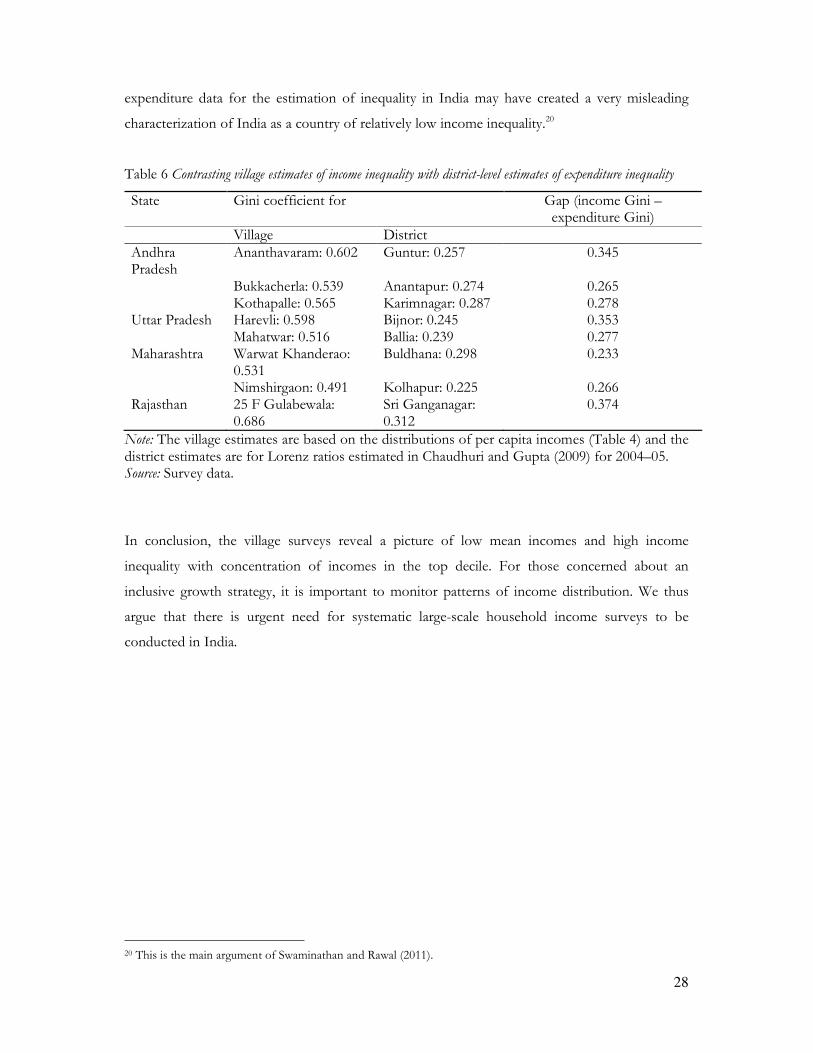
Thirdly, estimates of income inequality for the survey villages (although not in any way
representative of rural India) are much higher than the Gini coefficients based on expenditure
data obtained from the NSSO. To illustrate, we show the Gini values estimated at the district
level, using the NSS 2004–05 data (Chaudhuri and Gupta 2009) for the districts from which the
eight villages are drawn (Table 6). The difference between village income inequality and district
expenditure inequality ranged from 23 Gini points in Buldhana district (in which Warwat
Khanderao village is located) to 33 Gini points in Guntur district (in which Ananthavaram village
is located) and 37 Gini points in Sri Ganganagar district (in which 25 F Gulabewala village is
located). In other words, the estimates of inequality based on income for the survey villages were
significantly higher than the estimates for the corresponding districts based on household
consumption expenditure. To reiterate, although not strictly comparable, there is a gap of around
30 Gini points between our estimates of income inequality at the village level and standard
estimates for rural areas based on household consumer expenditure. This gap is much higher
than the internationally used assumption of a gap of 6–7 Gini points between estimates of the
Gini coefficient based on income and expenditure (Li et al. 1998). Interestingly, a recent study of
rural Bangladesh reports a large gap between expenditure and income Gini coefficients: 0.465
based on per capita income and 0.291 based on expenditure (Osmani and Sen 2011). The use of
28
expenditure data for the estimation of inequality in India may have created a very misleading
characterization of India as a country of relatively low income inequality.20
Table 6 Contrasting village estimates of income inequality with district-level estimates of expenditure inequality
State Gini coefficient for Gap (income Gini – expenditure Gini)
Village District Andhra Pradesh
Ananthavaram: 0.602 Guntur: 0.257 0.345
Bukkacherla: 0.539 Anantapur: 0.274 0.265 Kothapalle: 0.565 Karimnagar: 0.287 0.278 Uttar Pradesh Harevli: 0.598 Bijnor: 0.245 0.353 Mahatwar: 0.516 Ballia: 0.239 0.277 Maharashtra Warwat Khanderao:
0.531 Buldhana: 0.298 0.233
Nimshirgaon: 0.491 Kolhapur: 0.225 0.266 Rajasthan 25 F Gulabewala:
0.686 Sri Ganganagar: 0.312
0.374
Note: The village estimates are based on the distributions of per capita incomes (Table 4) and the district estimates are for Lorenz ratios estimated in Chaudhuri and Gupta (2009) for 2004–05. Source: Survey data.
In conclusion, the village surveys reveal a picture of low mean incomes and high income
inequality with concentration of incomes in the top decile. For those concerned about an
inclusive growth strategy, it is important to monitor patterns of income distribution. We thus
argue that there is urgent need for systematic large-scale household income surveys to be
conducted in India.
20 This is the main argument of Swaminathan and Rawal (2011).
29
References
Anand, Sudhir (1983), Inequality and Poverty in Malaysia, Oxford University Press, Oxford.
Anand, S., and Harris, C. J. (1994), “Choosing a Welfare Indicator,” American Economic Review, 84,
2, pp. 226–31.
Anand, S., and Segal, P. (2008), “What Do We Know about Global Income Inequality?” Journal
of Economic Literature, 46, 1, pp. 57–94.
Atkinson, A. B. (1990), Introduction, in Smeeding, T. M. (ed.) (1990), Poverty, Inequality and Income
Distribution in Comparative Perspective: The Luxemberg Income Study, Harvester Wheatsheaf, New York.
Atkinson, A. B., Rainwater, L. and Smeeding, T. M. (1995), Income Distribution in OECD Countries:
The Evidence from Luxembourg Income Study, Organization for Economic Cooperation and
Development, Paris
Anon. (2009), “By the Numbers: Income,” http://www.demos.org/inequality/numbers.cfm,
viewed on 30 June 2009.
Azam, M., and Shariff, A. (2009), “Income Inequality in Rural India: Decomposing the Gini by
Incomes Sources,” April, http://papers.ssrn.com/sol3/papers.cfm?abstract_id=1433105,
viewed on 12 April 2010.
Bakshi, Aparajita (2010), Rural Household Incomes, Ph. D. thesis submitted to the University of
Calcutta.
Banerji, A. and T. Piketty (2005), “Top Indian Incomes, 1922-2000.” World Bank Economic
Review, 9, 1, pp 1-20.
Bardhan, P. K (1974), The pattern of Income Distribution in India: A Review, in T.N. Srinivasan
and P. K. Bardhan (eds) (1974), Poverty and Income Distribution in India, Statistical Publishing
Society, Calcutta
Bhaumik, S. K. (2007), “Diversification of Employment and Earnings by Rural Households in
West Bengal,” Indian Journal of Agricultural Economics, 62, 4.
Chaudhuri, S., and Gupta, N. (2009), “Levels of Living and Poverty Patterns: A District-wise
Analysis for India,” Economic and Political Weekly, 64, 9, 28 February.
Chen, Chau-Nan, Tsaur, Tien-Wang, and Rhai, Tong-Shieng (1982), “The Gini Coefficient and
Negative Income,” Oxford Economic Papers, 34, 3, pp. 473–78.
Dev, Mahendra S., and Ravi, C. (2007), “Poverty and Inequality: All-India and States, 1983–
2005,” Economic and Political Weekly, 42, 6, 10 February.
Desai, S. B., Dubey, A., Joshi, B. L., Sen, M., Shariff, A., and Vanneman, R. (2010), Human
Development in India: A Profile, Oxford University Press, Delhi.
30
ESCAP (2010), Statistical Yearbook for Asia and the Pacific 2009, available at
www.unescap.org/start/data.syb2009/18_poverty_and_inequality.asp, viewed on 1 August 2010.
Expert Group of Household Income Statistics (2001), Final Report and Recommendations, available
at: http://www.lisproject.org/links/canberra/finalreport.pdf
Farrington, J., Deshingkar, P., Johnson, C. and D. Start (eds.) (2006), Policy Windows and Livelihood
Futures: Prospects of Poverty Reduction in Rural India, Oxford University Press, New Delhi.
Foundation for Agrarian Studies, “Project on Agrarian Relations in India,”
www.agrarianstudies.org.
Gasparini, L., Cruces, G., and Tornarolli, L. (2009), “Recent Trends in Income Inequality in
Latin America,” ECINEQ Working Paper 2009–132, September,
http://www.ecineq.org/milano/WP/ECINEQ2009-132.pdf, viewed on 12 April 2010.
Government of Andhra Pradesh (2005), Report of the Commission on Farmer’s Welfare,
http://www.macroscan.org/pol/apr05/pol070405Andhra_Pradesh.htm, viewed on 30 June
2009.
Government of India (2010), National Accounts Statistics 2010, Central Statistical Organisation,
Ministry of Statistics and Programme Implementation
Government of India (2012), Economic Survey 2011-12, Planning Commission
Li, Hongyi, Squire, Lyn, and Zou, Heng-fu (1998), “Explaining International and Intertemporal
Variations in Income Inequality,” The Economic Journal, 108, 446, January, pp. 26–43.
Litchfield, Julie A. (1999), “Inequality: Methods and Tools,”
www.wordlbank.org/poverty/inequal/index.htm, viewed on 30 June 2009.
Milanovic, Branko (2002), “True World Income Distribution, 1988 and 1993: First Calculation
Based on Household Surveys Alone,” The Economic Journal, 112, 476, January, pp. 51–92.
Milanovic, Branko (2005), Worlds Apart: Measuring International and Global Inequality, Princeton
University Press, Princeton, New Jersey.
NCAER (1986), Changes in Household Income, Inter-class Mobility and Income Distribution in
Rural India – A Longitudinal Study: 1970-71 – 1981-82, presented at the seminar on April 28, in
NCAER.
NCAER (1987), Changes in the Structure of Household Income and Distribution of Gains in
the Rural Household Sector – An All India Temporal Analysis, 1970-71 – 1981-82
NCAER (1987), Changes in the Structure of Household Income and Distribution of Gains in
the Rural Household Sector – An All India Temporal Analysis, 1970-71 – 1981-82
NSSO (1993), Report on the Pilot Survey of Income, Consumption and Savings, Part I and II,
Department of Statistics, Delhi
31
NSSO (2005), Income, Expenditure and Productive Assets of Farmer Households, Ministry of
Statistics and Programme Implementation, Government of India
Osmani, S. R., and B. Sen (2011), “Inequality in Rural Bangladesh in the 2000s: Trends and
Causes,” Bangladesh Development Studies, 34, 4, pp 1-36.
Palma, Jose Gabriel (2006), “Globalizing Inequality: ‘Centrifugal’ and ‘Centripetal’ Forces at
Work,” UN DESA Working Paper no. 35, September,
http://secint24.un.org/esa/desa/papers/2006/wp35_2006.pdf, viewed on 30 June 2009.
Ramachandran, V. K., Vikas Rawal and Madhura Swaminathan (eds.) (2010) Socio-Economic
Surveys of Three Villages in Andhra Pradesh: A Study of Agrarian Relations, Tulika Books, New Delhi.
Rao, K. P. C., and Charyulu, D. Kumara (2007), “Changes in Agriculture and Village
Economies,” ICRISAT Research Bulletin no. 21, Hyderabad, www.icrisat.org/gt-
mpi/whatsnew/Changes_in_Agriculture_and_Village_Economies.pdf, viewed on 30 June 2009.
Rawal, Vikas and Madhura Swaminathan (2011), “Income Inequality and Caste in Village India,”
Review of Agrarian Studies, 1, 2, July-Dec., pp 108-133.
Sen, Abhijit, and Himanshu (2004), “Poverty and Inequality in India – II,” Economic and Political
Weekly, 24 September, pp. 4361–75.
Sen, Abhijit, and Bhatia, M.S. (2004), State of the Indian Farmer: A Millennium Study, Vol. 14, Cost of
Cultivation and Farm Income, Academic Publishers, New Delhi.
Swaminathan, Madhura and Vikas Rawal (2011), “Is India Really a Country of Low Income
Inequality: Observations from Eight Villages,” Review of Agrarian Studies, 1, 1, Jan-June, pp 1-22.
UNU-WIDER, World Income Inequality Database and User Guide and Data Sources,
www.wider.unu/wiid, viewed on 30 June 2009.
Vanneman, R., and Dubey, A. (2010), “Horizontal and Vertical Inequalities in India,”
www.lisproject.org/conference/papers/vanneman-dubey.pdf, viewed on 1 August 2010.
Walker, T. S., and Ryan, J. G. (1990), Village and Household Economies in India's Semi-Arid Tropics,
The Johns Hopkins University Press, Baltimore, Maryland.
Related Documents


