NBER WORKING PAPER SERIES BORROWING FROM THE FUTURE: 401(K) PLAN LOANS AND LOAN DEFAULTS Timothy (Jun) Lu Olivia S. Mitchell Stephen P. Utkus Jean A. Young Working Paper 21102 http://www.nber.org/papers/w21102 NATIONAL BUREAU OF ECONOMIC RESEARCH 1050 Massachusetts Avenue Cambridge, MA 02138 April 2015 The views expressed herein are those of the authors and do not necessarily reflect the views of the National Bureau of Economic Research. At least one co-author has disclosed a financial relationship of potential relevance for this research. Further information is available online at http://www.nber.org/papers/w21102.ack NBER working papers are circulated for discussion and comment purposes. They have not been peer- reviewed or been subject to the review by the NBER Board of Directors that accompanies official NBER publications. © 2015 by Timothy (Jun) Lu, Olivia S. Mitchell, Stephen P. Utkus, and Jean A. Young. All rights reserved. Short sections of text, not to exceed two paragraphs, may be quoted without explicit permission provided that full credit, including © notice, is given to the source.

Welcome message from author
This document is posted to help you gain knowledge. Please leave a comment to let me know what you think about it! Share it to your friends and learn new things together.
Transcript
NBER WORKING PAPER SERIES
BORROWING FROM THE FUTURE:401(K) PLAN LOANS AND LOAN DEFAULTS
Timothy (Jun) LuOlivia S. MitchellStephen P. UtkusJean A. Young
Working Paper 21102http://www.nber.org/papers/w21102
NATIONAL BUREAU OF ECONOMIC RESEARCH1050 Massachusetts Avenue
Cambridge, MA 02138April 2015
The views expressed herein are those of the authors and do not necessarily reflect the views of theNational Bureau of Economic Research.
At least one co-author has disclosed a financial relationship of potential relevance for this research.Further information is available online at http://www.nber.org/papers/w21102.ack
NBER working papers are circulated for discussion and comment purposes. They have not been peer-reviewed or been subject to the review by the NBER Board of Directors that accompanies officialNBER publications.
© 2015 by Timothy (Jun) Lu, Olivia S. Mitchell, Stephen P. Utkus, and Jean A. Young. All rightsreserved. Short sections of text, not to exceed two paragraphs, may be quoted without explicit permissionprovided that full credit, including © notice, is given to the source.

Borrowing from the Future: 401(k) Plan Loans and Loan DefaultsTimothy (Jun) Lu, Olivia S. Mitchell, Stephen P. Utkus, and Jean A. YoungNBER Working Paper No. 21102April 2015JEL No. D04,D14,H24,J26
ABSTRACT
Tax-qualified retirement plans seek to promote saving for retirement, yet most employers permit pre-retirement access by letting 401(k) participants borrow plan assets. This paper examines who borrowsand why, and who defaults on their loans. Our administrative dataset tracks several hundred plansover 5 years, showing that 20% borrow at any given time, and almost 40% do at some point over fiveyears. Employer policies influence borrowing behavior, in that workers are more likely to borrowand borrow more in aggregate, when a plan permits multiple loans. We estimate loan default “leakage”at $6 billion annually, more than prior studies.
Timothy (Jun) LuPeking UniversityHSBC Business SchoolRoom 725University Town, Nanshan District Shenzhen 518055 P.R. [email protected]
Olivia S. MitchellUniversity of PennsylvaniaWharton School3620 Locust Walk, St 3000 SH-DHPhiladelphia, PA 19104-6302and [email protected]
Stephen P. UtkusVanguard Center for Retirement Research100 Vanguard Boulevard, M38Malvern, PA [email protected]
Jean A. YoungVanguard100 Vanguard BoulevardMalvern, PA [email protected]

2
Borrowing from the Future: 401(k) Plan Loans and Loan Defaults
I. INTRODUCTION
Defined contribution (DC) retirement plans in the U.S. generally are accorded
tax-deferred status as a means to encourage saving for old age,1 yet most plans also include
liquidity features giving workers pre-retirement access to their money.2 The tax code typically
discourages such pre-retirement access by imposing a tax liability and an additional 10 percent
penalty tax on amounts withdrawn early. Nevertheless, estimates of aggregate premature
withdrawals (so-called account “leakage”) from all tax-deferred accounts, including both 401(k)s
and IRAs, amount to 30-45 percent of annual total contributions (depending on the economic
environment; Argento, Bryant, and Sabelhaus, 2015). Such sizeable outflows relative to inflows
raise the important question of how these liquidity features may influence future retirement
security.
A few recent papers (Li and Smith, 2010; Beshears et al., 2012) have examined the
demographic and financial aspects of 401(k) borrowers, but no previous study has explored how
employer loan policy affects participant behavior and consequent default outcomes. This is
notwithstanding the fact that most DC participants in the U.S. have the option of borrowing from
their retirement accounts.3 Accordingly, here we address several questions regarding borrowing
from retirement accounts. First, we ask whether and how participants’ borrowing patterns
1 Here we use the terms “DC plan,” “401(k) plan,” “retirement plan,” and “pension plan” interchangeably. More than 88 million private sector workers are covered by DC retirement plans holding more than $3.8 trillion in assets (U.S. Department of Labor, 2013). 2 Pre-retirement liquidity mechanisms include hardship withdrawals (the worker can access his own contributions under limited conditions); certain types of non-hardship withdrawals (e.g. the withdrawal of employer profit-sharing contributions); and full access to savings on termination of employment with the current employer. Hardship and non-hardship withdrawals and loans are at the prerogative of the plan sponsor; they are generally subject to income tax and a 10 percent penalty tax though there are exemptions to the penalty. 3 In total, around 90 percent of plan participants had access to plan loans, and one-fifth of active workers had outstanding loans (in 2011; Vanderhei et al., 2012).

3
respond to different loan policies. Second, we investigate who defaults on plan loans, and how
this pattern is related to employer loan policy. And finally, we offer our thoughts on the
implications for retirement security of allowing 401(k) loans.
Drawing on a rich administrative dataset of 401(k) plans containing information on plan
borrowing and loan defaults, we demonstrate that retirement account loans are quite common,
with 20 percent of DC participants having an outstanding loan at any point in time, and nearly 40
percent borrowing over a five-year period. Prior research has suggested that the availability of
plan loans encourages higher retirement plan contributions by making tax-deferred retirement
accounts more liquid (Mitchell, Utkus, and Yang, 2007). Yet by law, participants must repay
their 401(k) loans on a set schedule, usually through payroll deduction, and we estimate that
fully 90 percent of loans are repaid in a timely way. Yet one in 10 loans is not repaid – failure to
repay typically occurs when the worker leaves his current employer – and such loan “defaults”
represent a permanent reduction or “leakage” from retirement savings.4 We also show that
employer loan policy has a sizeable effect on 401(k) borrowing. When a plan sponsor permits
multiple rather than only one loan, each individual loan tends to be smaller; this is consistent
with workers taking a buffer-stock approach, retaining the option to borrow more in case of
future consumption shocks (Carroll, 1992).5 At the same time, the probability of plan borrowing
nearly doubles, and the aggregate amount borrowed rises by 16 percent, suggesting that
employees perceive that easier loans are actually an encouragement to borrow (i.e., an
“endorsement effect”). It is possible that firm loan policy might reflect endogenous differences in
credit demand across groups of workers, so we undertake several tests to rule out such
4 Inasmuch as 401(k) loans are a way people access their own saving, there is no technical “default” as with a conventional loan from a bank or other intermediary. 5 As Carroll (1992:62) stated: “consumers hold assets mainly so that they can shield their consumption against unpredictable fluctuations in income.”

4
endogeneity. Plan loan interest rates are generally low and have no significant impact on
borrowing behavior.
Turning to defaults, we find that a vast majority – 86 percent – of employees who leave
their jobs with a plan loan outstanding do default, exposing them to both penalty and any income
tax due. Workers at firms allowing multiple loans have default rates that are higher by 1.7
percent points. Participants having only a single loan when multiple loans are allowed are 2.2
percent less likely to default, compared to workers in plans allowing a single loan, suggesting
some underlying heterogeneity in credit demand. We also consider whether the economic
turmoil of 2008-09 dramatically changed 401(k) plan borrowing and default patterns. This turns
out not to be the case: in fact, participants were less likely to borrow during the downturn, and
default rates remained stable. This could have been because voluntary job changes fell during the
recession, so defaults declined; this seems to have offset higher involuntary job loss rates.
Finally, we use our results to estimate an aggregate effect of 401(k) loan defaults on
retirement savings. Our leakage figure totals around $6 billion due to loan defaults per year, a
value far larger than prior estimates which relied on incomplete data.6 Nevertheless, this is still
an order of magnitude lower than retirement plan leakage due to account cash-outs on job
change, which the GAO (2009) reported at $74 billion in 2006. The small relative size of loan
defaults is relevant to the question of whether retirement leakage should be further restricted
(Leonard, 2011).
In what follows, Section II provides an overview of 401(k) loan rules, and Section III
reviews related studies. Section IV describes the data and develops our hypotheses. In Section V
we present empirical results on borrowing, and in Section VI we provide results on loan defaults.
6 GAO (2009) estimated plan loan defaults at $561 million for the tax year 2006. Yet that estimate relied on data on “deemed distributions” of loans representing a small fraction of actual loan defaults. We say more on this below.

5
Section VII reports our estimate of the aggregate tax revenue impact of loan defaults, and
Section VIII concludes.
II. 401(K) LOAN RULES
Borrowing from tax-qualified 401(k) plans is permitted under U.S. Treasury regulation
governing loans, repayment, interest rates, and defaults, along with associated tax and penalty
consequences.7 A 401(k) loan is not a credit instrument in the conventional sense, but rather an
arrangement allowing the plan participant to gain access to his retirement accumulations under
certain conditions. First, the participant may only borrow up to half of his account balance, with
a maximum loan of $50,000 (in nominal terms). Second, the participant must agree at the time of
the loan to replenish the withdrawn funds plus interest in accordance with a standard flat-dollar
amortizing loan schedule, typically through payroll deduction.
Plan sponsors also may impose their own requirements on plan loans, including whether
401(k) loans are permissible at all, although as a practical matter, 90 percent of active
contributors have access to loans. Sponsors may also determine the number of individual loans
allowed, whether loans must be for some minimum amount (e.g., $1,000), and what the
participant must pay in terms of an interest rate. In general, plan and regulatory rules interact as
follows: if a 401(k) plan offers a loan feature with a minimum required loan amount of Lmin, the
participant with an account balance W401k seeking to borrow loan amount L must satisfy two
conditions:
and
$50,000.
7 See GAO (2009) for additional background on regulations and laws for 401(k) loans.
6
For a typical Lmin = $1,000, a participant will not be eligible to borrow until such time as his
account reaches or surpasses $2,000; at that point, he may borrow up to half of his account
balance. The 50 percent limit will be binding until the participant’s account balance exceeds
$100,000; above that, the maximum withdrawal amount cannot exceed $50,000. If a plan only
allows one loan, a borrower must fully repay the current loan outstanding before she can take
another plan loan. Some plan sponsors permit participants to take out multiple loans (some
permitting two, others allow three or even more) in increments L1, L2, and so on, with ∑ .
In those cases, borrowers can hold as many loans as the plans permit at a time, given that the
total amount of outstanding loans do not exceed the cap described above.
Tax rules require a series of loan repayments PMT according to a schedule given by
∑ where the loan interest rate is i and n refers to the number of periods over which
the loan must be repaid.8 The loan repayment is taken from the participant’s after-tax salary. A
portion of the payment stream represents principal repayment while the other part represents
interest. Loan interest payments are unlike the traditional cost of credit, in that the participant is
effectively repaying himself; hence, a higher interest rate leads to more rapid replenishment of
borrowed funds. The payments are deposited to the participant’s account as if they were pre-tax
plan accruals. In exchange for agreeing to these repayment terms, the participant can spend
pre-tax L on consumption with no immediate income tax consequences. In other words, when the
plan loan is exercised, the participant avoids paying current taxes as well as an early withdrawal
penalty on the amount withdrawn from his pre-tax retirement account. Li and Smith (2010) show
8 Most loans are general purpose, with a maximum loan term of 60 months. Loans for purchase of a principal residence, which require documentary evidence of a home purchase, have a maximum term of 360 months. Interest rates are set according to the terms of the plan.

7
that, in most circumstances, the opportunity cost of a 401(k) loan will be less than the cost of
paying all interest to a financial institution.9
When the borrower leaves his job, any remaining balance due on a 401(k) loan, Lbal,
typically converts to a balloon payment. If a plan borrower leaves his job and does not repay Lbal
within 60-90 days, the participant loan is considered in default and is reported to the IRS as a
taxable distribution from the plan at that time, resulting in tax liability Lbal(τ+.1). In other words,
the 10 percent penalty is imposed on the amount borrowed if it is not returned to the account. It
is worth noting that τ 0 for many low- and middle-income households today, due to a variety of
tax credits, so the expected cost of default may be simply 0.1Lbal.10
Because 401(k) loans are not conventional borrowing arrangements but rather represent
withdrawals from one’s own savings, they are not subject to credit underwriting and not reflected
on credit reports. Accordingly, a 401(k) loan can be a convenient way of accessing credit,
particularly for the credit-constrained. Moreover, loan defaults have no credit reporting
consequences, and defaulting on a 401(k) loan has no effect on a borrower’s ability to take a new
loan from a new plan.
III. PRIOR STUDIES
Saving and borrowing from a 401(k) plan is usefully examined against the broader
literature on the impact of tax-advantaged retirement saving on total saving.11 Focusing just on
9 Lu and Tang (2014) compare different types of loans using scenario analysis, and find that, under reasonable assumptions, a 401(k) loan is typically less costly than a credit card loan. 10 The rules on loan issuance and repayment are somewhat more complex than summarized here. For example, the plan sponsor can also limit borrowing. Also the period for repaying a loan can vary by plan but cannot exceed the end of the calendar quarter following the quarter in which the participant terminates employment. Some employers also allow repayment of loans from participant bank accounts during the loan period or on job termination. Participants usually have the right to repay a loan balance at any time. 11 For instance, Poterba, Venti, and Wise (1995) find that most 401(k) contributions represent net new saving. Both Benjamin (2003) and Gelber (2011) report that people eligible to participate in company 401(k) plans save more
8
401(k) plans, several prior studies have examined aspects of borrowing behavior. Work by the
GAO (1997) concluded that allowing plan loans can raise both participation and contribution
rates, while others have observed that making loans available influences savings mainly on the
intensive margin, in the form of higher DC plan contribution rates (Munnell, Sunden, and Taylor,
2001/02; Holden and Vanderhei, 2001; Mitchell, Utkus, and Yang, 2007). In a survey of about
900 DC plan participants, Utkus and Young (2011) reported that about 40 percent of borrowers
used plan loans for bill or debt consolidation, while over 30 percent used them for home
improvement and repair. They also found that the least financially literate borrowers used 401(k)
loans for consumption rather than investment purposes. Using the Survey of Consumer Finances,
Sunden and Surette (2000) and Li and Smith (2010) found that people who borrowed from their
401(k) accounts had higher DC account balances, but they also had lower total financial assets,
higher debt, and were more credit-constrained. In a study related to ours, Beshears et al. (2012)
used participant-level information to show that plan borrowing followed a hump-shape age
profile. That analysis did not evaluate defaults nor the role of employer policy on behavior as we
do in what follows.12
In a distinct but related context, Gross and Souleles (2002a, 2002b) examined credit card
borrower behavior. They concluded that their sample exhibited “buffer stock” behavior: that is,
they tended to not borrow the maximum so as to leave a margin in case of emergency. That study
reported credit card interest rates averaging 16 percent, compared to, for example, an average
401(k) loan interest rate of just over seven percent (in our dataset about which we say more
inside and outside their retirement plans. Using Danish data, Chetty et al. (2014) found little evidence of crowd-out for the 85% of the population they deemed passive decision-makers, who saved more when they shifted employers with higher automatic contributions. 12 A related body of work considers the use of lump-sum distributions from 401(k) plans, whether penalized or not; see Basset, Fleming and Rodrigues (1998), Burman, Coe and Gale (1999), Burman, Coe, Dworsky and Gale (2012), Sabelhaus and Weiner (1999), and Amromin and Smith (2003).

9
below). Such a large difference in borrowing rates suggests that employees with access to plan
loans might benefit from substituting lower-cost 401(k) loans for much higher-cost credit card
debt. Somewhat surprisingly, Li and Smith (2010) reported that many people held substantial
credit card debt even when a plan loan would have been less expensive. Those authors suggested
that this seemingly illogical behavior could be shaped by financial advisers’ negative views of
401(k) loans,13 along with a mental accounting perspective, namely that 401(k) accounts might
be thought of as restricted for retirement purposes rather than to be used for current
consumption.14,15
IV. DATA AND HYPOTHESES
A. Data
Our analysis uses a rich administrative dataset for DC plan participants covering the
five-year period July 2004--June 2009.16 The dataset includes 882 different 401(k) (or similar)
DC plans. To assess the propensity to borrow, we use a time-varying sample of over 900,000
participants observed monthly, with over 55 million observations. In this sample, we observe on
average over 13,000 new plan borrowers each month (or a total of 780,000 borrower
observations). Variables available include plan characteristics and participant
demographic/financial characteristics. We also observe information on loan default behavior for
workers terminating employment.
13 Suze Orman, host of CNBC’s “The Suze Orman Show” has been quoted at stating “It makes no sense in any circumstance to take a loan from a 401(k)” (Jansing, 2013). 14 Financial literacy may also play a role: using survey data, Utkus and Young (2011) found that workers with lower levels of financial literacy were more likely to borrow from their DC accounts. Lusardi and Mitchell (2007) discuss how financial illiteracy influences retirement savings. 15 In non-pension settings, Ayres and Nablebuff (2013) have argued that it is optimal for young people to buy stocks on margin. Hurst and Willen (2007) found that young households were sufficiently constrained that permitting them to use Social Security wealth to pay off debt could be welfare-enhancing. 16 The data were provided by recordkeeper Vanguard under restricted access conditions, and the identities of individual firms and plan participants are masked.

10
In any given month, an average of 1.38 percent of eligible participants took a new loan in
our data (Table 1). The average amount borrowed was just over $7,800 (in $2010), with a
median of nearly $4,600; the mean total amount borrowed was around $10,000, with a median of
about $5,900. Loan interest rates varied by plan, though many plans peg the interest rate to the
Prime Rate plus one percent. Loan interest rates were only modestly higher for borrowers than
for the entire participant sample. The average age of borrowers was 42, slightly younger than the
average participant; borrowers had about eight years of tenure and somewhat lower income,
lower non-retirement financial wealth, and half the plan account balance compared to all
loan-eligible participants. Borrowers were also more likely to be in plans where multiple loans
were allowed. During the period of the global financial crisis, defined here as September
2008-June 2009, fewer participants borrowed from their retirement accounts.
Table 1 here
Figure 1 illustrates the monthly and cumulative percentage of loan-eligible participants
having one or more outstanding loans. A first observation is that about 20 percent of active
participants had a loan outstanding in any given month, so the loan origination rate was
approximately offset by the rate of loan repayments or defaults. Over the entire five-year period
of our study, the cumulative proportion of participants borrowing from their retirement plan rose
to nearly 40 percent. In other words, instead of the same participants taking repeated plan loans,
many different participants eventually borrow from their retirement accounts over a longer time
horizon.
Figure 1 here
We are also interested in the impact of employer plan design on participant borrowing.
Figure 2 presents the mean proportion of new plan borrowers over the five-year period, where

11
we compare plans offering only a single loan at a time, with those permitting multiple loans.
When only one loan was allowed, an average of 1.10 percent of eligible participants took a new
loan each month. With multiple loans, the average rose to 1.69 percent per month.
Figure 2 here
B. Hypotheses
We seek to examine how plan loan policies influence plan borrowing and default
patterns. As noted above, the buffer-stock model suggests that cautious borrowers will remain
just below the maximum borrowing limit to protect against future consumption shocks. In a
401(k) setting, participants will be restricted by employer policy regarding both the number of
loans allowed at one time, and the total amount that can be borrowed. In our dataset, 40 percent
of plans covering 52 percent of participants permitted workers to take out two or more loans at
once. In such cases, buffer-stock participants would be predicted to be more likely to borrow
from their plan, but take smaller loans, compared to patterns in plans permitting only a single
loan. We also hypothesize that the availability of multiple loans could be seen as an employer
“endorsement” of plan borrowing (Benartzi, 2001). If this were true, we would anticipate that
aggregate borrowing would be higher when multiple loans are permitted.
Permitting multiple loans may or may not affect default behavior at job termination. On
the one hand, default behavior depends only on whether the borrower can pay off his outstanding
balance, regardless of how many loans he has taken. In that case, there may be no relationship
between defaults and multiple loans. On the other hand, taking multiple loans could indicate lack
of self-control or inability to manage one’s finances. If so, those who took several loans might be
more likely to default.

12
Employers also have control over another plan feature that may affect borrowing
behavior: the interest rate that workers must pay when borrowing from their plans. Yet the effect
of the interest rate is complex, since a higher interest rate makes the loan costlier to the worker,
while a higher interest rate boosts the worker’s retirement account more quickly. Ultimately,
which effect dominates is an empirical question.
Another issue we explore is whether plan borrowing and loan default rates changed
materially during the financial crisis of 2008-09. With respect to borrowing, the predicted impact
is ambiguous: on the one hand, employees may have become more cautious and borrowed less,
but on the other hand, they might have sought additional loans due to financial insecurity or
household financial shocks. Regarding defaults, there are again two potentially competing
effects: voluntary job changes would be expected to decline during a recession, reducing the
incidence of default. Yet involuntary job losses rise, raising the risk. Again, empirical analysis is
required to discern the net effect.
In addition to our focus on the most relevant employer plan design features, we are also
able to control on several demographic and financial factors that could affect plan borrowing and
default behavior. Naturally age is important, as borrowing would be expected to be higher among
the credit-constrained young and then decline with age. Yet in 401(k) accounts, borrowing is
conditioned on the employee’s account balance which rises with both age and salary. Therefore
we would anticipate a hump-shared age profile for borrowing (as in Beshears et al. 2012) since
the ability to borrow rises with age and salary, but the demand for plan borrowing falls with age.
Li and Smith (2010) have also noted that liquidity-constrained households are more likely to rely
on 401(k) borrowing. Using our much more extensive dataset, we examine the robustness of this

13
finding. Moreover we hypothesize that liquidity constraints are also more likely to associate with
loan defaults on job termination, since the outstanding balance accelerates as a balloon payment.
V. MULTIVARIATE ANALYSIS OF 401(K) BORROWING AND LOAN AMOUNTS
To investigate borrowing patterns from 401(k) accounts we use a multivariate model of
the following form:
BORROWi,j,t = δ + α’ PLANj + β’ PARTICIPANTi,j +’MACROt + i,j,t
where BORROWi,j,t refers to a vector of several outcomes including the probability of borrowing,
the size of new loans, and the total amount borrowed by the ith participant in the jth plan in
month t. We examine all loan-eligible participants, defined as those having assets at least twice
the minimum loan amount set by the plan and not otherwise subject to any other IRS or plan
limit (whether in terms of dollars or number of loans allowed). The PLANj vector includes a flag
for whether the plan permitted multiple loans, the loan interest rate, and plan size (number of
participants); The PARTICIPANTi vector refers to participant characteristics including age, sex,
job tenure, income, account balance, and non-retirement household wealth.17 We also control on
the employer’s main industry. The MACROt vector controls for the lagged three-month average
state-specific unemployment rate, and a flag indicating the financial crisis period (September
2008-June 2009).18 Finally, we cluster observations at the plan level for robust standard errors.19
A. Factors Determining Borrowing from the Plan
17 Due to data limitation, we do not observe participants’ education levels; Utkus and Young (2011) and Li and Smith (2010) find that higher educated individuals are less likely to take plan loans. 18When a participant defaults on an outstanding loan, the default is typically recorded at the end of the quarter following the quarter in which the job termination occurs. We therefore use the prior three-month average unemployment rate at the state level as a regressor, lagged by a month. We also experimented with a simple three-month lagged unemployment rate, the one-month lagged rate, and the current month rate as robustness checks, with results similar to those reported below. We provide a detailed description of all explanatory variables in Appendix Table 1. 19Computer limitations preclude clustering at the participant level for the entire sample. When we do so for a subset of observations as a robustness check, results are similar to those reported here.

14
Our first dependent variable captures the probability of a participant taking a new loan in
month t, estimated using Probit as indicated in Table 2. The mean value of the dependent
variable is 1.4 percent per month. The basic model in Column 1 is supplemented in Column 2
with interactions between multiple loan availability with participant demographics. In both cases,
the particularly salient plan feature is the ability to take more than one loan at a time.
Specifically, if a plan sponsor allowed employees to take out multiple loans, the probability that
participants took a new loan rose by 2.7 percentage points. Since the mean probability of taking a
new loan was 1.4 percent, allowing multiple loans boosted the loan take-up rate by twice.
By contrast, the employer-determined loan interest rates had no material effect on
borrowing patterns. Our dataset includes wide dispersion in interest rates (the low was 1.8
percent and the high was 11.5 percent), so this result seems quite robust. We therefore conclude
that 401(k) loan demand is fairly insensitive to the price of a plan loan, due to the interplay from
lower take-home pay due to a higher interest rate for the loan repayment, versus faster account
replenishment via a higher interest rate.
Table 2 here
Other results in Table 2 are also of interest. As hypothesized, participants were more
likely to borrow from their 401(k) plans when they earned lower incomes, had fewer
non-retirement financial assets, and had a lower plan account balance. These are likely the most
liquidity-constrained participants. There is also an inverted U-shape age pattern by age, with
participants age 35-44 more likely to borrow compared to their younger and older peers,
consistent with prior studies. Moreover, shorter-tenured workers were also less likely to borrow,
suggesting that familiarity with the loan feature and ability to borrow grew with job tenure and
time in the plan.
15
One concern voiced by policymakers is that plan borrowing might have ramped up
during the financial crisis; nonetheless, our evidence suggests otherwise. That is, during the
turmoil, participants were 41 percent less likely to take new loans (0.6 percentage points).20 One
reason might be that plan borrowing is often tied to home purchases and improvements (Utkus
and Young, 2011). Given the housing market precipitated the financial crisis, this effect could
explain why 401(k) borrowing fell.
Table 2 also helps us examine which participants were likely to be affected by key plan
features. Column 2 shows that, in plans allowing multiple loans, younger and less senior
participants were more likely to boost their probability of borrowing. Specifically, participants
under age 35 (our reference category) were 50 percent more likely (than the mean, or 0.7
percentage points) to borrow from their plans when multiple loans were permitted. Furthermore,
if an employer allowed more than one loan, participants with low household income (<$35,000)
were 29 percent (0.4 percentage points) more likely to borrow from their own accounts, versus
those with medium household income ($35,000- $87,500, the reference category). In other
words, permitting multiple loans disproportionally induces young and low-income participants to
borrow more.
Overall, plan loan policies appear to have a strong impact on participants’ borrowing
behavior. Permitting multiple loans boosts loan take-up rates dramatically, and these increases in
borrowing are especially influential for young and lower-income individuals.
B. Determinants of Loan Size
Next we turn to the intensive margin of borrowing, examining both the size of new loans
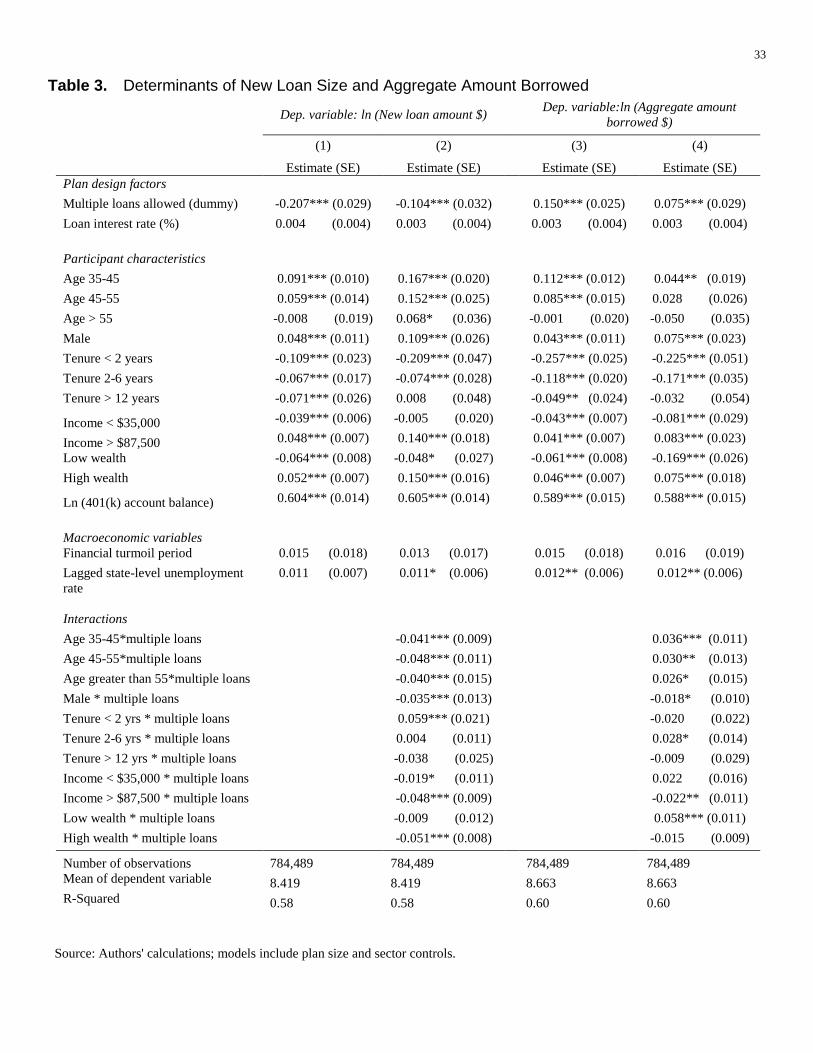
and the aggregate value of plan borrowing. Table 3 reports estimation results using multivariate
20 This confirms simulation results from Vanderhei et al. (2012) who, using a different dataset, observed that loan activity did not change much over the period 1996-2011.

16
ordinary least squares (OLS) models. Columns 1-2 examine the size of new loans (in natural
logs) with a mean of 8.42 (or $4,532). Columns 3-4 focus on the total amount borrowed (in
natural logs) with a mean of 8.66 (or $5,785). Because we control on participants’ 401(k)
account balances, these results should be interpreted as the relative proportion borrowed from
participant accounts.
Table 3 here
Previously we showed that plans allowing multiple loans increased the probability of
borrowing. This again was a significant determinant of the amount borrowed. When the
employer permitted multiple loans, each individual loan was smaller by 19 percent (see Column
1).21 This finding is directly supportive of the buffer stock hypothesis, where participants seek to
maintain some unused loan capacity as protection against future consumption shocks. When a
participant has the option of taking another loan, he is more likely to preserve the buffer in his
account to keep the borrowing option open. Here, again, the plan loan interest rate is not
statistically significant.
Mirroring the loan incidence results, we again find a hump-shaped pattern with age for
loan amounts, with the largest loans (as a fraction of account wealth) taken by participants age
35-44. Although less likely to borrow in the first place, the better-off (those with higher income
and more non-retirement financial assets) were more likely to take larger loans. One reason may
be that better-off households have greater non-plan resources to repay their loans, and so they
would be more willing to borrow. Another possibility is that better-off households may
understand that 401(k) loan interest rates are generally more favorable than
commercially-available borrowing rates. We also find that those with little non-retirement wealth
were less likely to borrow more from their 401(k) plans. The financial crisis did not affect loan 21 The log mean of 8.419 declines by -0.207; in linear terms, the mean of $4,532 declines to $3,685 or 19 percent.

17
amounts, suggesting that, conditional on the lower borrowing rates during the crisis, proportions
borrowed remained the same. State-specific unemployment rates had negligible effects.
Coefficient estimates on the factors associated with participants’ aggregate loan size are
provided in Columns 3-4 of Table 3. Most strikingly, the availability of multiple loans raised
aggregate borrowing by 16 percent in Column 3, in contrast to our earlier finding that individual
loans were smaller under this plan provision.22 This difference does suggest that the availability
of multiple loans could serve as an employer “endorsement effect” (Benartzi, 2001): that is,
employees may perceive the chance to take multiple loans as reflective of employer
encouragement to do so. The age pattern of loans also differs in this column compared to
Column 1: in multiple-loan plans, participants age 35+ were likely to borrow 11 percent more
than younger participants. In other words, when plan sponsors permitted multiple loans, younger
workers took out more (Column 2), but those age 35+ borrowed a higher fraction of their
retirement wealth (Column 4).
C. Endogeneity Tests
An alternative explanation for the effect of loans limits on borrowing might be that the
result reflects endogenous credit demand. That is, some firms might attract employees with an
inherently higher demand for credit (due to lifecycle reasons or behavioral biases), and so they
might offer a 401(k) plan with multiple loan features to attract such individuals. For example, an
employer anticipating that its workers might need small frequent loans might be more likely to
adopt a multiple-loan policy. In such a case, the positive correlation between participant
borrowing and the number of plan loans allowed would reflect plan sponsor anticipation of
worker borrowing needs, rather than workers’ reactions to loan features.
22 The log mean of 8.663 rises by 0.150; in linear terms, the loan value grows from $5,785 to $6,721, or 16 percent.

18
While we cannot completely rule out this possibility, we have undertaken several
additional analyses to test for robustness. If plan sponsors did, in fact, set loan policy in
anticipation of participant needs, we might expect that plans allowing multiple loans would differ
systematically from single-loan plans according to key characteristics. By contrast, if differences
in borrowing behavior were due to participants reacting independently to plan loan policies, there
should be no systematic differences across plans. To test this hypothesis, we run the following
OLS regression:
MULTI_LOAN,j = δ + α’ PLAN_CHARj + ,j
Here the dependent variable takes the value of one if the plan allowed its participants to hold
multiple loans, and 0 if it allowed only a single loan. The PLAN_CHARj vector consists of plan
and plan participant characteristics including the plan mean and standard deviation of
participants’ age, tenure, household income, financial wealth, the plan loan interest rate, the
number of participants in the plan, and controls for the firm’s industrial sector. Our hypothesis is
that there should be no statistically significant difference in observable characteristics between
plans allowing multiple loans and plans allowing only one loan. Results provided in the appendix
show that few factors are statistically significant.23 In particular, household income and financial
wealth did not influence whether a plan allowed multiple loans. Accordingly, we believe that
plan sponsors did not establish plan loan policies in anticipation of participants’ observable
characteristics associated with borrowing needs.
Nevertheless, there could be unobserved factors that could potentially affect plan loan
policies including differences in underlying demand for credit, discount rates, or liquidity needs.
To address this possibility, we hypothesize that if plans allowed multiple loans due to plan
participant demand, then the proportion of participants holding multiple loans in those plans 23 See Appendix Table 2.

19
should be relatively large. Instead, we find that 86.2 percent of eligible borrowers took out no
additional loans in plans allowing multiple loans; in other words only 14.8 percent took
additional loans when allowed to do so. This result suggests that employer policy on multiple
loans is not strongly tailored to unobserved loan demand. Another way to interpret this finding is
to compare it with sequential borrowing in plans permitting only a single loan at a time.
Sequential borrowers are defined to be those who take one loan at a time and then take a new
loan after fully repaying the prior one. Those borrowers may have high loan demand yet they are
constrained by the fact that the plan allows one loan at a time. In the latter plans, 13.9 percent of
participants are sequential borrowers, a level rather similar to the 14.8 percent of multiple loan
takers in plans allowing multiple loans. The similarity of these two results suggests that sponsors
are not tailoring plan loan policy to employee characteristics. In sum, then, our findings appear
robust to endogeneity considerations.
VI. DETERMINANTS OF PLAN LOAN DEFAULTS
Next we explore the determinants of 401(k) loan defaults via summary statistics in Table
4. About one-fifth of loan-eligible employees in our sample had one or more loans outstanding.
Among participants terminating employment with one or more loans outstanding, 86 percent
failed to repay the outstanding balance due on their loans, on average; the remainder paid their
account loans and hence avoided default. Since participants defaulting on their outstanding loan
balances totaled around 10 percent of all participants with outstanding loans, we estimate that

20
about 90 percent of participants repaid their loans over the period during which we observed
them.24
Table 4 here
Descriptive statistics on participants who defaulted versus repaid their loans are provided
in Table 5, along with data on all borrowers and all loan-eligible plan participants. The default
sample includes 151,458 participants in 401(k) plans who terminated employment with at least
one loan outstanding.25 Compared to other plan borrowers, they were somewhat younger, had
shorter job tenure, and held lower balances. Those who defaulted on their loans also had lower
income, lower balances, and had less non-retirement wealth, than those who repaid their loans on
job termination.
Table 5 here
To analyze loan defaults, we focus only on participants whose jobs terminated while they
held plan loans.26 Our goal here is to compare employees who terminated employment and
defaulted on their 401(k) loans, with those leaving employment who repaid their loans in full.
We estimate a multivariate Probit model where the dependent variable, Di,j,t, refers to the
probability of the individual defaulting; the mean of the dependent variable is 86 percent.
24 Ninety-five percent of the loans in our sample were general-purpose loans with a maximum term of five years. For this reason our five-year sample period offers a reasonable view of steady state default rates over time, though default rates might vary under different economic conditions. 25 We exclude plans that changed record-keepers during the five-year period and also exclude participants associated with any "divisional transfer outs" during the period (e.g., when a division is sold and participant accounts are moved to another recordkeeper). We model a "divisional transfer-out” rule for each plan by calculating the monthly average number of participants terminating with a loan outstanding. If in a given month, the number of participant terminations exceeds 100, and it exceeds two times the average monthly plan terminations, we code the plan as having a “divisional transfer-out” that month and delete observations for those participants. In addition to IRS loan maximums, some employers impose their own more restrictive rules. Accordingly we eliminated 41 plans where no participant borrowed at the 50 percent limit over the five-year period. Borrowers who terminated employment with multiple loans outstanding are counted as a single observation. Fewer than 2 percent of terminating participants with outstanding loans paid off a portion of the outstanding loans and then defaulted on the remainder. 26 Approximately 10% of plan sponsors allowed terminated plan participants to continue to repay their plan loans. However, in our dataset, only five percent took advantage of this feature (authors’ calculation).

21
Regressors are identical to those in our previous examination of loan probabilities and amounts
borrowed. In addition, we also control for the borrower’s remaining outstanding loan balance.
Results on loan default patterns appear in Table 6. Unlike before, we see that permitting
participants to take multiple loans has no influence on default rates. The statistically significant
effects in Column 1 indicate that the young, low-income, and lower-wealth borrowers were more
likely to default, though the coefficients indicate small economic magnitudes relative to the mean
default rate. In Column 2, several interaction effects are significant, but the main effect on
multiple loans is not, suggesting that having a multiple loan policy did influence loan defaults on
job change. Loan interest rates were also not statistically significant, nor were the financial crisis
flag and our measure of local labor market conditions.
Table 6 here
While allowing multiple loans had no influence on default rates, such a policy could still
have a different impact on single versus multiple-loan borrowers. To better understand the role
that plan design plays in influencing default behavior, we categorized borrowers into three
groups: (1) those allowed only one loan; (2) those permitted to take multiple loans, but who had
a single loan outstanding; and (3) those with multiple loans. Since we control for the aggregate
loan balance of each borrower on termination of employment, the coefficients of these variables
should be statistically insignificant if the variation of default rates across groups is solely due to
loan balance. By contrast if we found a significant effect of these regressors, it would suggest a
relationship between the number of loans allowed and default behavior. Results appear in Table
7. Here we see that employees permitted to take multiple loans but who held just one loan were
significantly less likely to default. By contrast, those participants having multiple loans were
more likely to default, with a marginal increase of 1.7 percentage points in the default rate (or a
22
relative change of 2 percent relative to an 86 percent mean default rate, controlling on borrower
aggregate loan balances). In other words, given two participants with the same 401(k) total debt,
the employee who took one loan is less likely to default, compared to a participant with multiple
loans.
Table 7 here
These results imply that borrowers may exhibit some heterogeneity in their demand for
credit or in their degree of self-control. For instance, participants with a single loan might have
the foresight to anticipate a possible future default, or they might have more self-control,
reserving the additional loan as a buffer for future borrowing. By contrast someone taking
multiple loans might simply be more impatient; for instance, he may have taken out a first loan
when first allowed to do so, but then as his account grew, he might have borrowed again. In
other words, limiting the number of loans outstanding could lower default rates, though the effect
is small.
Since default rates are rather widespread among those leaving jobs with a loan, yet few of
our control variables have economically meaningful effects on the mean default rate of 86
percent, we conclude that other unobserved factors may be driving pension loan defaults. These
could include financial illiteracy, discounting, or lack of self-control.27 In our context, this could
mean that many employees taking plan loans were simply unaware of the consequences of job
termination for their 401(k) loans.
VII. AGGREGATE LOAN LEAKAGE
27 For instance, the least financially savvy tend to be unaware of how much debt they hold (Lusardi and Tufano (2009); also Agarwal and Mazumder (2013) show that financial mistakes are most prevalent for the least cognitively adept. Present-biased people are also more likely to have credit-card and general debt than those with lower discount rates (Meier and Springer 2010). And Mastrobuoni and Weinberg (2009) find some Social Security beneficiaries suffer from low self-control, resulting in low saving.

23
In recent years, several policymakers have proposed legislation to restrict retirement plan
losses including plan loans.28 In light of this interest, we use our empirical findings to estimate
the aggregate amount of loan default leakage flowing from 401(k) plans annually.
The primary data source used to address this question to date has been the Private
Pension Plan Bulletin, an abstract of the Form 5500 Annual Reports which retirement plans must
file with the Employee Benefits Security Administration of the US Department of Labor
(USDOL 2012). One item reported in this document refers to the “Income Statement of Pension
Plans with 100 or More Participants” and it lists the amount of “deemed distribution of
participant loans.” Some analysts have incorrectly interpreted this amount as representing the
total amount of loan defaults,29 yet this number actually measures loan defaults only for active
plan members due to temporary lay-off, long-term disability, maternity leave, or a leave of
absence such as parental leave. Loan defaults due to job termination are instead recorded as
offsets to participants’ account balances at the time of default, reported as “direct benefit
payments” in the Labor Department’s nomenclature.
In our dataset, only eight percent of the loan defaults observed were “deemed” loan
distributions; the remaining 92 percent resulted from defaults on job termination (the latter being
the focus of our main analysis). Accordingly, data on “deemed distributions” seriously
understates the total value of loan defaults. Applying our sample fractions to the entire private
401(k) system indicates that aggregate system-wide loan defaults are on the order of $6 billion
per year, or ten times the $600 million in “deemed” loan distributions.30 This is smaller than the
28For example, U.S. Senators Kohl and Enzi proposed the 2011 Savings Enhancement by Alleviating Leakage in 401(k) Savings Act (SEAL Act). In their press release the Senators remarked that “[a] 401(k) savings account should not be used as a piggy bank” (Leonard, 2011). 29 This number is reported in the GAO estimate of loan leakages (GAO, 1997). 30 During our five year period, we see about 130,000 loan defaults with an aggregate annual defaulted loan balance of around $0.156 billion. In 2006 there were 58.4 million active 401(k) participants (USDOL 2013), and assuming 90 percent had access to plan loans, this implies that about 52.5 million workers were eligible to take 401(k) loans

24
leakage from account cash-outs on job termination of $74 billion (in 2006; GAO 2009) though
not inconsequential. Assuming an effective tax rate of 10 percent and factoring in the 10 percent
penalty associated with early distributions, we estimate that the tax revenue flowing to the U.S.
Government associated with defaulted DC plan loans to be over $1 billion per year.
VIII. CONCLUSION AND DISCUSSION
More than two decades ago, Nobel Prize winner Franco Modigliani patented a method for
issuing 401(k) credit cards with the aim of making it easier for workers to withdraw from their
retirement accounts to cover short-term consumption needs (Vise, 2004). Although the idea of
401(k) credit cards faded under criticism, that proposal highlighted the dual-purpose nature of
U.S. defined contribution plans. DC retirement accounts, which represent a growing fraction of
US household wealth, are in essence dual-purpose, being used both to finance old-age retirement
security and also to help cover current consumption needs. The loan feature is one of the
prominent pre-retirement liquidity features of 401(k) plans permitting current spending.
Our study has focused on the effects of employer plan loan policy, and we conclude that
loan policy is economically meaningful in shaping participant borrowing. In our dataset,
one-fifth of plan participants had a loan at any given time, while almost 40 percent did so over a
five-year period. Most importantly, when a plan allowed participants to take out multiple loans,
participants were more likely to borrow in the first place, while individual loan amounts shrank.
This suggests a buffer-stock approach to credit, similar to that found among users of credit cards.
That is, given the ability to borrow multiple times, workers seem more willing to take the first
that year. Extrapolating from our 1.3 million person sample provides an estimate of $6.3 billion for total 401(k) annual defaults. Alternatively, if we were to use a count of 65.8 million participants for all private DC plans, this would raise the estimate to $7.1 billion, although it is unclear whether plan borrowing in non-401(k) plans is as high as in 401(k) plans.

25
loan when they retain slack borrowing capacity for future consumption shocks. Moreover, in
multiple-loan plans, participants borrow greater amounts in aggregate, suggesting that they view
the multiple-loan feature as an employer endorsement of borrowing. Although our paper has not
explicitly evaluated a Modigliani-like proposal for a 401(k) credit card, a concern about
enhancing 401(k) access is that it might boost this endorsement effect.
With our dataset we are uniquely able to assess loan default patterns. We show that nine
of 10 loans are repaid, yet when workers with an outstanding loan balance terminate
employment, 86 percent of them default on their loans. Although more liquidity-constrained
participants are more likely to default, the size of these effects is small relative to the high default
rate broadly. This finding implies that other factors, such as low financial literacy, impatience, or
inattention, may be at work: many borrowers may simply be surprised by an unanticipated job
change and its effect on an outstanding 401(k) loan. Another finding is that holding multiple
loans at the time of job change is associated with more defaults, although the size of the effect is
small. This effect is statistically significant after controlling for aggregate loan balances,
implying unobserved heterogeneity of credit demand and self-control among these groups of
borrowers. This phenomenon has not been previously documented in studies of credit card loan
delinquency.
Finally, we estimate the aggregate effect of loan defaults on retirement savings at
approximately $6 billion per year. This estimate is larger higher than previous estimates which
relied on incomplete data, though it is still much smaller than retirement plan leakage due to
account cash-outs on job termination.
Our research findings should be of interest to policymakers and plan sponsors seeking to
evaluate the effectiveness of access features in U.S DC retirement plans. The fact that many
26
workers do borrow from and default on their plans has led some to argue that 401(k) loans
should be restricted.31 Based on our results, those concerns seem overstated, particularly when
compared to leakage from account cash-outs upon job change. We do, however, find that
limiting the number of loans to a single one would be likely to reduce the incidence of borrowing
and the fraction of total wealth borrowed, thereby reducing the impact of future defaults. Another
option might be to limit the size and scope of loans in an effort to reduce the total dollars of loan
default leakage.32 For example, participant loans could be restricted to only a quarter of account
balances. These findings underscore the fact that DC retirement accounts are intended mainly for
old-age financial security, although they do offer pre-retirement liquidity to meet current
consumption needs.
ACKNOWLEDGEMENTS
The research reported herein was performed pursuant to a grant from the U.S. Social Security Administration (SSA) funded as part of the Retirement Research Consortium. The authors also acknowledge support provided by the Pension Research Council/Boettner Center at the Wharton School of the University of Pennsylvania, and the Vanguard Group. Programming assistance from Yong Yu is also appreciated. Opinions and conclusions expressed herein are solely those of the authors and do not represent the opinions or policy of SSA, any other Federal agency, or any institution with which the authors are affiliated. Opinions and errors are solely those of the authors and not of the institutions providing funding for this study or with which the authors are affiliated.
31 For instance, see Reeves and Villareal (2008), and Weller and Wenger (2008). 32 Vanderhei’s (2014) simulation results also indicated that retirement balances would be greatly increased if plan loan defaults were substantially reduced or eliminated.

27
REFERENCES
Agarwal, Sumit and Bhashkar Mazumder, 2013. “Cognitive Abilities and Household Financial
Decisions. American Economic Journal: Applied Economics. 5 (1): 193-207.
Argento, Robert, Victoria L. Bryant and John Sabelhaus, 2015. “Early Withdrawals from
Retirement Accounts during the Great Recession.” Contemporary Economic Policy
33(1): 1–16.
Amromin, Gene and Paul Smith, 2003. “What Explains Early Withdrawals from Retirement
Accounts? Evidence from a Panel of Taxpayers.” National Tax Journal. 56 (3):
595-612.
Ayres, Ian, and Barry Nalebuff, 2013. “Diversification Across Time.” Journal of Portfolio
Management. 39(2): 73-86.
Bassett, William F., Michael J. Fleming and Anthony P. Rodrigues, 1998. “How Workers Use
401(k) Plans: The Participation, Contribution and Withdrawal Decisions.” National Tax
Journal. 51(2): 263-89.
Benjamin, Daniel J., 2003. “Does 401(k) Eligibility Increase Saving? Evidence from Propensity
Score Subclassification.” Journal of Public Economics 87, 1259-1290.
Beshears, John, James J. Choi, David Laibson, and Brigitte C. Madrian, 2012. “The Availability
and Utilization of 401(k) Loans.” In David A. Wise, Ed. Investigations in the Economics
of Aging. Chicago: University of Chicago Press: 145-72.
Benartzi, Shlomo, 2001. “Excessive Extrapolation and the Allocation of 401(k) Accounts to
Company Stock.” Journal of Finance. LVI (5): 1747-1764.
Burman, Leonard E., Norma B. Coe, and William G. Gale, 1999. “Lump Sum Distributions from
Pension Plans: Recent Evidence and Issues for Policy and Research.” National Tax
Journal. 52(3): 553-62.
Burman, Leonard E., Norma B. Coe, Michael Dworksy and William G. Gale, 2012. “Effects of
Public Policies on the Disposition of Pre-Retirement Lump Sum Distributions: Rational
and Behavioral Influences.” National Tax Journal. 65(4): 863-888.
Carroll, Christopher D, 1992. “The Buffer-Stock Theory of Saving: Some Macroeconomic
Evidence.” BPEA 2 : 61-156.

28
Chetty, Raj, John N. Freidman, Soren Leth-Petersen, Torben Heien Nielsen, and Tore Olsen,
2014. “Active vs Passive Decisions and Crowd-Out in Retirement Savings Accounts:
Evidence from Denmark.” Quarterly Journal of Economics. 129(3): 1141-1219.
GAO, 1997. 401(k) Pension Plans - Loan Provisions Enhance Participation but May Affect
Income Security for Some. GAO Report. Washington, DC: GAO.
GAO. 2009. Policy Changes Could Reduce the Long-Term Effects of Leakage on Workers’
Retirement Savings. GAO Report. Washington, DC: GAO.
Gelber, Alex M., 2011. “How do 401(k) Affect Saving? Evidence from Changes in 401(k)
Eligibility.” American Economic Journal: Economic Policy 3(4): 103-122.
Gross, David B., and Nicholas S. Souleles, 2002a. “An Empirical Analysis of Personal
Bankruptcy and Delinquency.” The Review of Financial Studies. 15(1): 319-347.
Gross, David B., and Nicholas S. Souleles, 2002b. “Do Liquidity Constraints and Interest Rates
Matter for Consumer Behavior? Evidence from Credit Card Data.” Quarterly Journal of
Economics, 117(1): 149-185.
Holden, Sarah, and Jack Vanderhei, 2001. “Contribution Behavior of 401(k) Plan Participants.”
ICI Perspective. 7(4). Washington, D.C., Investment Company Institute.
Hurst, Erik, and Paul Willen, 2007. “Social Security and Unsecured Debt.” Journal of Public
Economics. 91(7-8): 1273-1297.
Jansing, Chris, 2013. “More Americans Raiding 401(k)s to Pay the Bills.” NBC News,
www.nbcnews.com/business/more-americans-raiding-401-k-s-pay-bills-1B7989986.
Leonard, Bill, 2011. “Senate Bill Would Limit Retirement Savings 'Leakage'.” SHRM.org, 5/24.
http://www.shrm.org/hrdisciplines/benefits/Articles/Pages/RetirementLeakage.aspx
Li, Geng, and Paul A. Smith, 2010. “401(k) Loans and Household Balance Sheets.” National Tax
Journal. 63(3): 479-508.
Lu, Timothy (Jun), and Ning Tang, 2014. “Are You Making the Right Debt Choice? Evidence
from National Financial Capability Study Surveys.” Journal of Financial Planning.
27(10): 39-47.
Lusardi, Annamaria and Olivia S. Mitchell, 2007. “Baby Boomer Retirement Security: The
Roles of Planning, Financial Literacy, and Housing Wealth.” Journal of Monetary
Economics. 54(1) January: 205-224.

29
Lusardi, Annamaria, and Peter Tufano, 2009. “Debt Literacy, Financial Experiences, and
Overindebtedness.” NBER Working Paper 14808.
Mastrobuoni, Giovanni, and Matthew Weinberg, 2009. "Heterogeneity in Intra-monthly
Consumption Patterns, Self-Control, and Savings at Retirement." American Economic
Journal: Economic Policy, 1(2): 163-89.
Meier, Stephan and Charles Sprenger, 2010. “Present-Biased Preferences and Credit Card
Borrowing. American Economic Journal: Applied Economics. 2(1):193-210.
Mitchell, Olivia S., Stephen P. Utkus, and Tongxuan (Stella) Yang, 2007. “Turning Workers into
Savers? Incentives, Liquidity, and Choice in 401(k) Plan Design.” National Tax Journal.
LX(3): 469-489.
Munnell, Alicia H., Annika Sunden, and Catharine Taylor, 2001/02. “What Determines 401(k)
Participation and Contributions?” Social Security Bulletin. 64(3): 64-75.
Poterba, James M., Steven F. Venti, and David A. Wise, 1995. “Do 401(k) Contributions Crowd
Out Other Personal Saving?” Journal of Public Economics 58, 1-32.
Reeves, Robert, and Pamela Villarreal, 2008. “401(k) Loans = Retirement Insecurity.” National
Center for Policy Analysis Brief. No. 615.
Sabelhaus, John and David Weiner, 1999. “Disposition of Lump-Sum Pension Distributions:
Evidence from Tax Returns.” National Tax Journal. 52(3):593-614.
Sunden, Annika, and Brian Surette, 2000. “Household Borrowing from 401(k) Plans.” Just the
Facts on Retirement Issue No. 1. Center for Retirement Research Working Paper, Boston
College.
U.S. Department of Labor, USDOL: 2012. Private Pension Plan Bulletin: Abstract of 2010
Form 5500 Annual Reports. Employee Benefits Security Administration. Washington,
D.C.: USDOL.
U.S. Department of Labor, USDOL: 2013. Private Pension Plan Bulletin Historical Tables and
Graphs. Employee Benefits Security Administration. Washington, D.C.: USDOL.
Utkus, Stephen P., and Jean Young, 2011. “Financial Literacy and 401(k) Loans.” In Financial
Literacy: Implications for Retirement Security and the Financial Marketplace. Eds.
Olivia S. Mitchell and Annamaria Lusardi. Oxford: Oxford University Press.
30
Vanderhei, Jack., 2014. “The Impact of Leakages on 401(k) Accumulations at Retirement Age.”
Testimony to the ERISA Advisory Committee.
http://www.ebri.org/pdf/publications/testimony/T-180.pdf
Vanderhei, Jack, Sarah Holden, Craig Copeland and Luis Alonso, 2012. “401(k) Plan Asset
Allocation, Account Balances, and Loan Activity in 2011.” Employee Benefit Research
Institute Issue Brief, No.380.
Vise, David A., 2004. “A Card to Borrow Your Future: Can Access to Credit Encourage
Savings?” Washington Post. October 24: F01.
http://www.washingtonpost.com/wp-dyn/articles/A56183-2004Oct23.html
Weller, Christian E., and Jeffrey B. Wenger, 2008. “Robbing Tomorrow to Pay for Today:
Economically Squeezed Families Are Turning to Their 401(k)s to Make Ends Meet.”
Center for American Progress Working Paper. Washington, D.C.

31
Table 1. Characteristics of 401(k) Loan-Eligible Participants and Borrowers Loan-Eligible
Participants Borrowers
Outcomes of Interest
% Participants taking new loan 1.38 N/A
Loan amount ($) N/A $7,841
Aggregate Loan amount ($) N/A $9,969
Plan Factors
% Multiple loans allowed 48 57
% Loan interest rate 7.16 7.29
Demographic Controls
Age 44.68 41.58
% AgeLT35 20.19 26.51
% Age35-45 27.84 33.87
% Age45-55 32.01 29.52
% AgeGE55 19.97 10.11
% Male 51.81 44.91
Tenure 8.63 8.24
% TenureLT2 17.88 15.24
% Tenure2-6 29.71 33.2
% Tenure6-12 28.08 29.03
% TenureGE12 24.32 22.52
Financial Controls
% IncomeLT35K 7.97 13.86
% Income35-87.K5 48.84 59.99
% IncomeGT87.5K 43.19 26.15
% Low wealth 42.97 64.92
% Medium wealth 31.24 24.79
% High wealth 25.79 10.29
Account balance ($) 86,541 44,482
Ln Account balance ($) 10.38 9.83
Macro Controls
% Financial turmoil 18.98 16.27
% Lagged state unemployment rate 5.31 5.27
# Observations 55,175,718 784,489
Source: Authors’ calculations

32
Table 2. Determinants of the Probability of Taking a New Loan
Dependent Variable: Probability of Taking a New Loan
(1) (2)
Estimate (SE) Marginal effect
Estimate (SE) Marginal effect
Plan design factors
Multiple loans allowed (dummy) 0.169*** (0.029) 2.7% 0.255*** (0.047) 4.3%
Loan interest rate (%) -0.006 (0.004) -0.1% -0.006 (0.004) -0.1%
Participant characteristics
Age 35-45 0.042*** (0.010) 0.7% 0.067*** (0.012) 1.1%
Age 45-55 -0.032** (0.014) -0.5% -0.014 (0.016) -0.2%
Age > 55 -0.245*** (0.016) -3.5% -0.250*** (0.019) -3.8%
Male -0.030*** (0.010) -0.5% 0.007 (0.017) 0.1%
Tenure < 2 years -0.336*** (0.022) -4.6% -0.278*** (0.026) -4.1%
Tenure 2-6 years -0.113*** (0.014) -1.7% -0.104*** (0.020) -1.7%
Tenure > 12 years 0.046*** (0.009) 0.7% 0.056*** (0.015) 1.0%
Income < $35,000 0.107*** (0.005) 1.8% 0.096*** (0.007) 1.7%
Income > $87,500 -0.109*** (0.005) -1.7% -0.130*** (0.008) -2.1%
Low wealth 0.185*** (0.006) 3.0% 0.203*** (0.007) 3.4%
High wealth -0.160*** (0.005) -2.4% -0.170*** (0.007) -2.7%
Ln (401(k) account balance) -0.116*** (0.008) -0.5% -0.117*** (0.008) -0.5%
Macroeconomic variables
Financial turmoil period -0.038** (0.018) -0.6% -0.039** (0.017) -0.6%
Lagged state-level unemployment rate 0.007 (0.006) 0.1% 0.007 (0.006) 0.1%
Interactions
Age 35-45*multiple loans -0.043** (0.017) -0.7%
Age 45-55*multiple loans -0.031 (0.024) -0.5%
Age > 55*multiple loans 0.011 (0.030) 0.2%
Male * multiple loans -0.066** (0.027) -1.1%
Tenure < 2 yrs * multiple loans -0.112*** (0.028) -1.7%
Tenure 2-6 yrs * multiple loans -0.017 (0.024) -0.3%
Tenure > 12 yrs * multiple loans -0.020 (0.019) -0.3%
Income < $35,000 * multiple loans 0.021** (0.010) 0.4%
Income > $87,500 * multiple loans 0.038*** (0.009) 0.6%
Low wealth * multiple loans -0.033*** (0.010) -0.5%
High wealth * multiple loans 0.018* (0.010) 0.3%
Number of observations 55,175,718 55,175,718
Mean of dependent variable 0.014 0.014
R-squared 0.01 0.01
Source: Authors’ calculations; models include plan size and sector controls.
33
Table 3. Determinants of New Loan Size and Aggregate Amount Borrowed
Dep. variable: ln (New loan amount $) Dep. variable:ln (Aggregate amount
borrowed $)
(1) (2) (3) (4) Estimate (SE) Estimate (SE) Estimate (SE) Estimate (SE) Plan design factors Multiple loans allowed (dummy) -0.207*** (0.029) -0.104*** (0.032) 0.150*** (0.025) 0.075*** (0.029)
Loan interest rate (%) 0.004 (0.004) 0.003 (0.004) 0.003 (0.004) 0.003 (0.004)
Participant characteristics
Age 35-45 0.091*** (0.010) 0.167*** (0.020) 0.112*** (0.012) 0.044** (0.019)
Age 45-55 0.059*** (0.014) 0.152*** (0.025) 0.085*** (0.015) 0.028 (0.026)
Age > 55 -0.008 (0.019) 0.068* (0.036) -0.001 (0.020) -0.050 (0.035)
Male 0.048*** (0.011) 0.109*** (0.026) 0.043*** (0.011) 0.075*** (0.023)
Tenure < 2 years -0.109*** (0.023) -0.209*** (0.047) -0.257*** (0.025) -0.225*** (0.051)
Tenure 2-6 years -0.067*** (0.017) -0.074*** (0.028) -0.118*** (0.020) -0.171*** (0.035)
Tenure > 12 years -0.071*** (0.026) 0.008 (0.048) -0.049** (0.024) -0.032 (0.054)
Income < $35,000 -0.039*** (0.006) -0.005 (0.020) -0.043*** (0.007) -0.081*** (0.029)
Income > $87,500 0.048*** (0.007) 0.140*** (0.018) 0.041*** (0.007) 0.083*** (0.023)
Low wealth -0.064*** (0.008) -0.048* (0.027) -0.061*** (0.008) -0.169*** (0.026)
High wealth 0.052*** (0.007) 0.150*** (0.016) 0.046*** (0.007) 0.075*** (0.018)
Ln (401(k) account balance) 0.604*** (0.014) 0.605*** (0.014) 0.589*** (0.015) 0.588*** (0.015)
Macroeconomic variables
Financial turmoil period 0.015 (0.018) 0.013 (0.017) 0.015 (0.018) 0.016 (0.019)
Lagged state-level unemployment rate
0.011 (0.007) 0.011* (0.006) 0.012** (0.006) 0.012** (0.006)
Interactions
Age 35-45*multiple loans -0.041*** (0.009) 0.036*** (0.011)
Age 45-55*multiple loans -0.048*** (0.011) 0.030** (0.013)
Age greater than 55*multiple loans -0.040*** (0.015) 0.026* (0.015)
Male * multiple loans -0.035*** (0.013) -0.018* (0.010)
Tenure < 2 yrs * multiple loans 0.059*** (0.021) -0.020 (0.022)
Tenure 2-6 yrs * multiple loans 0.004 (0.011) 0.028* (0.014)
Tenure > 12 yrs * multiple loans -0.038 (0.025) -0.009 (0.029)
Income < $35,000 * multiple loans -0.019* (0.011) 0.022 (0.016)
Income > $87,500 * multiple loans -0.048*** (0.009) -0.022** (0.011)
Low wealth * multiple loans -0.009 (0.012) 0.058*** (0.011)
High wealth * multiple loans -0.051*** (0.008) -0.015 (0.009)
Number of observations 784,489 784,489 784,489 784,489 Mean of dependent variable 8.419 8.419 8.663 8.663 R-Squared 0.58 0.58 0.60 0.60
Source: Authors' calculations; models include plan size and sector controls.

34
Table 4. Default Patterns from 401(k) Loans: Full Period and by Year
Period Total
7/04-6/05 7/05-6/06 7/06-6/07 7/07-6/08 7/08-6/09
Number of active participants 6,590,888 1,102,478 1,206,118 1,331,802 1,490,111 1,460,379
% of active participants with a loan outstanding 20.6 21.5 21.0 20.7 19.6 20.3
Terminations
% of those with a loan terminating 11.2 10.3 11.0 10.6 10.6 13.1
Default rates
% of those terminating with a loan who default 86.0 84.8 84.2 85.4 87.3 87.6
% of defaults as a fraction of loans outstanding 9.6 8.7 9.3 9.1 9.3 11.5

35
Table 5. Characteristics of Participants Defaulting on, or Repaying, Their Loans on Leaving Their Jobs All
Participants
Participants
with a Loan
Participants Terminating
with Outstanding Loans
All Defaulting Repaying
Number of observations 6,590,888 1,354,900 151,458 130,295 21,163
Plan design factors
Multiple loans allowed (%) 43.3 49.7 47.6 47.1 50.6
# Loans taken N/A 1.3 1.3 1.3 1.2
Loan interest rate (%) 6.89 6.88 7.04 7.07 6.85
Participant characteristics
Mean age 43.6 44.1 42.9 42.4 46.1
Male (%) 49.0 51.0 48.0 48.0 53.0
Mean tenure 8.0 10.5 8.6 8.1 11.3
Mean income (%) 84,371 73,252 67,369 64,958 81,503
Low wealth (%) 50 64 65 67 52
Medium wealth (%) 29 25 24 24 29
High wealth (%) 21 11 11 10 19
Mean account balance ($) 73,248 63,780 43,667 35,415 94,716
Loan balance ($) N/A 8,132 6,318 6,099 7,663

36
Table 6. Determinants of the Probability of Participants Defaulting on 401(k) Plan Loans Outstanding
Dependent Variable: Probability of Participant Defaulting on Plan Loans Outstanding
(1) (2)
Estimate (SE) Marginal Effect
Estimate (SE) Marginal Effect
Plan design factors
Multiple loans allowed (dummy) -0.078 (0.051) -1.0% -0.040 (0.076) -0.5%
Loan interest rate (%) 0.010* (0.006) 0.1% 0.010 (0.006) 0.1%
Participant characteristics
Age 35-45 -0.039** (0.018) 0.5% 0.053 (0.044) 0.7%
Age 45-55 -0.062** (0.025) 0.8% 0.036 (0.049) 0.5%
Age > 55 -0.000 (0.030) 0.017 (0.056) 0.2%
Male 0.015 (0.016) 0.2% 0.072** (0.034) 1.0%
Tenure < 2 years 0.027 (0.034) 0.4% -0.043 (0.066) -0.6%
Tenure 2-6 years 0.053** (0.022) 0.7% 0.008 (0.050) 0.1%
Tenure > 12 years -0.043* (0.026) -0.5% -0.053 (0.048) -0.7%
Income < $35,000 0.072*** (0.016) 1.0% 0.025 (0.033) 0.3%
Income > $87,500 -0.121*** (0.013) -1.5% -0.118*** (0.028) -1.5%
Low wealth 0.147*** (0.013) 1.8% 0.122*** (0.034) 1.6%
High wealth -0.158*** (0.017) -1.8% -0.176*** (0.042) -2.1%
Ln (401(k) account balance) -0.389*** (0.016) -1.9% -0.389*** (0.016) -2.0%
Ln Loan balance 0.276*** (0.013) 1.1% 0.276*** (0.013) 1.1%
Macroeconomic variables
Financial turmoil period -0.007 (0.040) -0.1% -0.008 (0.040) -0.1%
Lagged state-level unemployment rate -0.005 (0.011) -0.1% -0.005 (0.011) -0.1%
Interactions
Age 35-45*multiple loans -0.056** (0.027) -4.4%
Age 45-55*multiple loans -0.059** (0.028) -4.5%
Age > 55*multiple loans -0.011 (0.032) -1.1%
Male * multiple loans -0.035* (0.021) -3.1%
Tenure < 2 yrs * multiple loans 0.045 (0.039) 6.1%
Tenure 2-6 yrs * multiple loans 0.028 (0.030) 3.3%
Tenure > 12 yrs * multiple loans 0.006 (0.025) 0.7%
Income < $35,000 * multiple loans 0.030 (0.019) 3.7%
Income > $87,500 * multiple loans -0.001 (0.015) -0.2%
Low wealth * multiple loans 0.015 (0.019) 1.7%
High wealth * multiple loans 0.011 (0.022) 1.2%
Number of observations 151,458 151,458
Mean of dependent variable (%) 0.86 0.86
R-squared 0.12 0.12
Source: Authors' calculations; models include plan size and sector controls.

37
Table 7. Determinants of the Probability of Loan Defaults: Extended Model
Estimate (SE) Marginal Effect
Plan design factors # loans allowed > 1, #loans taken > 1 (dummy)
0.130** (0.061) 1.7%
# loans allowed > 1, #loans taken = 1 (dummy)
-0.193*** (0.049) -2.2%
Loan interest rate (%) 0.010 (0.006) 0.1%
Participant characteristics Age 35-45 -0.041** (0.018) -0.5% Age 45-55 -0.065** (0.025) -0.8% Age > 55 0.002 (0.030) 0.0% Male 0.020 (0.015) 0.2% Tenure < 2 years 0.063* (0.034) 0.8% Tenure 2-6 years 0.062*** (0.022) 0.8% Tenure > 12 years -0.044* (0.026) -0.5% Income < $35,000 0.069*** (0.016) 0.9% Income > $87,500 -0.115*** (0.013) -1.4% Low wealth 0.141*** (0.013) 1.7% High wealth -0.151*** (0.017) -1.7% Ln (401(k) account balance) -0.375*** (0.016) -1.8% Ln Loan balance ($) 0.255*** (0.014) 1.0% Macroeconomic variables Financial turmoil period -0.002 (0.041) 0.0% Lagged state-level unemployment rate -0.005 (0.011) -0.1%
Number of observations 151,458 Mean of dependent variable (%) 0.86 R-squared 0.12
Source: Authors' calculations; models include plan size and sector controls.

38
Figure 1. Percentage of Participants with 401(k) Loans Outstanding
0%
10%
20%
30%
40%
Jul-04 Jan-05 Jul-05 Jan-06 Jul-06 Jan-07 Jul-07 Jan-08 Jul-08 Jan-09
% w
ith lo
ans
outs
tand
ing
Month
Cumulative
At end of month

39
Figure 2. Loan Incidence by Number of Plan Loans
0.0%
0.5%
1.0%
1.5%
2.0%
2.5%
Jan-04 Jan-05 Jan-06 Jan-07 Jan-08
% o
f elig
ible
par
ticip
ants
taki
ng a
new
lo
an (
ave
rag
e p
er m
ont
h)
1 loan allowed >1 loan allowed

40
Appendix Table 1. Description of Explanatory and Control Variables
Variables Descriptions
Plan design factors Multiple loans allowed (dummy) 1 if a plan permits participants holding multiple loans, 0 otherwise Loan interest rate (%) Plan loan interest rate charged by a plan in a given month Participant characteristics Age < 35 Reference group. 1 if a participant ages below 35 years, 0 otherwise Age 35-45 1 if a participant ages between 35 and 45 years, 0 otherwise Age 45-55 1 if a participant ages between 45 and 55 years, 0 otherwise Age > 55 1 if a participant ages above 55 years, 0 otherwise Male 1 if a participant is male, 0 otherwise Tenure < 2 years 1 if a participant joins the plan less than 2 years, 0 otherwise Tenure 2-6 years 1 if a participant joins the plan from 2 to 6 years, 0 otherwise Tenure 6-12 years Reference group. 1 if a participant joins the plan from 6 to 12 years, 0 otherwise Tenure > 12 years 1 if a participant joins the plan longer than 12 years, 0 otherwise Income < $35,000 1 if a particiant's household income is less than $35,000, 0 otherwise Income $35,000 - $87,500 Reference group. 1 if a particiant's household income is between $35,000 and
$87,500, 0 otherwise
Income > $87,500 1 if a particiant's household income is more than $87,500, 0 otherwise Low wealth We use data from the IXI company to impute non-retirement household financial
wealth at the ZIP+4 level. The data, which are categorical in nature, are collapsed into three groupings. The low wealth dummy takes value 1 if a participant has IXI imputed wealth less than $7,280, 0 otherwise
Medium wealth Reference group. 1 if a participant has IXI imputed wealth between $7,280 and $61,289, 0 otherwise
High wealth 1 if a participant has IXI imputed wealth more than $61,289, 0 otherwise Ln (401(k) account balance) The natural log of a participant's 401(k) account balance in a given month,
standardized in 2010 dollar
Ln Loan balance ($) The natural log of a 401(k) borrower's total outstanding loan balance in a given month, standardized in 2010 dollar
Macroeconomic variables
Financial turmoil period 1 if the time is between September 2008 and June 2009, 0 otherwise
Lagged state-level unemployment rate
In month t, the average state-level unemployment rate of months t-1, t-2, t-3
Other control variables
# plan participants The number of plan participants in a given month, divided by 10,000 for normalization. Results not shown.
Industry dummies We categorize plans in 10 different industries: manufacture, agriculture, transportation, finance, retail, media, business, education, public, and others. Each plan takes value 1 in its own corresponding industry, and 0 in others. The manufacture industry is treated as reference group. Results not shown.
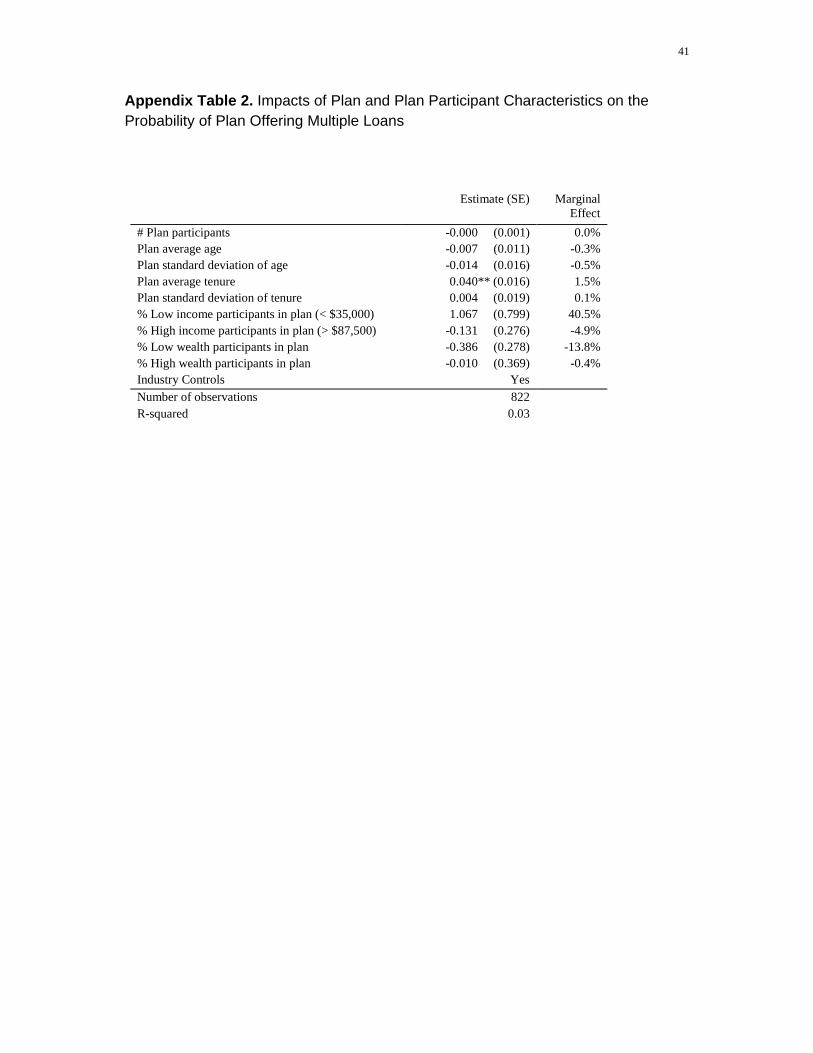
41
Appendix Table 2. Impacts of Plan and Plan Participant Characteristics on the Probability of Plan Offering Multiple Loans
Estimate (SE) Marginal Effect
# Plan participants -0.000 (0.001) 0.0% Plan average age -0.007 (0.011) -0.3% Plan standard deviation of age -0.014 (0.016) -0.5% Plan average tenure 0.040** (0.016) 1.5% Plan standard deviation of tenure 0.004 (0.019) 0.1% % Low income participants in plan (< $35,000) 1.067 (0.799) 40.5% % High income participants in plan (> $87,500) -0.131 (0.276) -4.9% % Low wealth participants in plan -0.386 (0.278) -13.8% % High wealth participants in plan -0.010 (0.369) -0.4% Industry Controls Yes
Number of observations 822 R-squared 0.03
Related Documents