Welcome message from author
This document is posted to help you gain knowledge. Please leave a comment to let me know what you think about it! Share it to your friends and learn new things together.
Transcript
· Wheat Special Report No. 11
Boron Deficiency in Wheat
Multiple Cropping CenterChiang Mai UniversityChiang Mai, Thailand
February 17-19, 1992
CIMMYT is an internationally funded, nonprofit scientific research and trainingorganization. Headquartered in Mexico, the Center is engaged in a worldwide researchprogram for maize, wheat, and triticale, with emphasis on improving the productivity ofagricultural resources in developing countries. It is one of 18 nonprofit internationalagricultural research and training centers supported by the Consultative Group onInternational Agricultural Research (CGIAR), which is sponsored by the Food andAgriculture Organization (FAO) of the United Nations, the International Bank forReconstruction and Development (World Bank), and the United Nations DevelopmentProgramme (UNDP). The CGIAR consists of a combination of 40 donor countries,international and regional organizations, and private foundations.
CIMMYT receives core support through the CGIAR from a number of sources, includingthe international aid agencies of Australia, Austria, Belgium, Brazil, Canada, China,Denmark, Finland, France, Germany, India, Italy, Japan, Mexico, the Netherlands,Norway, the Philippines, Spain, Switzerland, the United Kingdom, and the USA, andfrom the European Economic Commission, Ford Foundation, Inter-AmericanDevelopment Bank, OPEC Fund for International Development; UNDP, and WorldBank. CIMMYT also receives non-CGIAR extra-core support from the InternationalDevelopment Research Centre (IDRC) of Canada, the Rockefeller Foundation, and manyof the core donors listed above.
Responsibility for this publication rests solely with CIMMYT.
Correct Citation: Mann, C.E., and B. Rerkasem, eds. 1992. Boron Deficiency in Wheat.Wheat Special Report No. 11. Mexico, D.F.: CIMMYT.
ISBN: 968-6127-80-1AGROVOC descriptors: Triticum aestivum, boron, trace element deficiencies,functional disorders, plant breedingAGRIS category codes: H50, F01Dewey decimal classification: 581.13356
Table of Contentsiv Preface
v Acknowledgment
vi Workshop Participants
1 Methods
1 Principles and practices in micronutrient research with emphasis on boron workin developing countries, J. Loneragan
5 Effects of boron on male fertility in wheat, C. Cheng and B. Rerkasem
9 Predicting grain set failure with tissue boron analysis, B. Rerkasem andS. Lordkaew
15 Procedures for boron analysis in plants, R. Netsantip and S. Lordkaew
21 Boron deficiency probe nursery, B. Rerkasem
32 Techniques to study the anther in wheat, C. Cheng, J.A. McComb, andB. Rerkasem
34 Country Reports and Varietal Screening
34 Boron deficiency in Nepal, T.B. Khatri-Chhetri and S.K. Ghimire
57 Wheat sterility in Nepal-a review, K. Subedi
65 Sterility work in wheat at Tarahara in the eastern Tarai of Nepal, R. Misra,R.C. Munankarmi, S.P. Pandey, and P.R. Hobbs
72 Wheat Boron deficiency in Yunnan, China, Y. Yanhua
76 Wheat varietal screening for boron deficiency in India, J.P. Tandon,and S.MA. Naqvi
79 Screening for boron deficiency in wheat, S. Jamjod, C.E. Mann, and B. Rerkasem
83 Genetics
83 Combining ability of the response to boron deficiency in wheat~ S. Jamjod,C.E. Mann, and B. Rerkasem
86 Inheritance of boron deficiency response in two wheat crosses, S. Jamjod,C.E. Mann, and B. Rerkasem
90 Boron Toxicity
90 Genetics and breeding of wheat for boron toxicity, J.G. Paull, D.B. Moody,and A.J. Rathjen
98 Mechanism of tolerance to boron toxicity in plants, R.O. Nable
110 Minutes of the Final Discussion, P.R. Hobbs
113 Appendices
113 Appendix 1. Selected Boron Bibliography, C.E. Mann
126 Appendix 2. Boron Deficiency Nurseries, 1990-91
129 Appendix 3. Sample of Information Requested for the Boron DeficiencyProbe Nursery (BPN)
iii
Preface
Boron deficiency in soils has been reported to affect more and more crops, especially soin the warmer environments. Two reasons come to mind:
• Either the problem has not been recognized in the past and the symptoms havenot been attributed to other causes, or
• Intensification of cropping over the last few decades has accelerated depletionof existing soil boron.
Probably both of these playa role.
In a timely manner, the Australian Centre for International Agricultural Research(ACIAR) has supported research in boron deficiency of grain legumes at Chiang MaiUniversity (CMU) in Thailand. More recently, the Australian International DevelopmentAssistance Bureau (AIDAB) has provided funds to the regional office of the InternationalMaize and Wheat Improvement Center (CIMMYT) in Southeast Asia to cooperate withCMU as an expert institution and national research institutions in South and SoutheastAsia to gain some more knowledge about the same problem in wheat. Part of this projectwas a small boron workshop conducted at Chiang Mai University, Feb. 17-19, 1992, theproceedings of which make up this Wheat Special Report. The various papers report awide range of findings and knowledge currently available in South and Southeast Asia.Some results of the AIDAB-funded research are also included.
Generally, micronutrient deficiency research requires special care as compared to toxicitywork or macronutrient experimentation (Loneragan, page 1) because contaminationoccurs easily during the experimental process and tiny amounts can blur results.Problems also arise frequently due to the masking effect of other nutrient deficiencies inpoor soils. The major symptom of boron deficiency in wheat is grain set failure. Wheatgrowing in low boron soils may develop malformed anthers and pollen grain; theexternal boron supply may also limit the germination of healthy pollen (Cheng andRerkasem, page 5). Prediction of grain set failure from boron analysis of wheat tissues iscomplicated (Rerkasem and Lordkaew, page 9) because 1) boron is immobile inside theplant, and 2) grain set fails if boron availability is interrupted during a few crucial days atpollen development or fertilization.
On the other hand, chemical analysis of soil or plant tissue boron does not require highlysophisticated equipment and can be done in many laborato~ies (Netsangtip andLordkaew, page 15). Once boron deficiency is established through chemical analysis asthe most probable factor causing sterility in a given environment, then other more simplemethods can be employed for surveys or varietal screening. These methods could includeboron probe nurseries (Rerkasem, page 21), measurements of anthers and pollen (Chenget aI., page 32) or grain set counting as the simplest and most rapid method (Appendix 2,page 126).
How widespread is the problem? Various soils are prone to boron deficiency (KhatriChhetri and Ghimire, page 34) and reports are available from many countries worldwide(see bibliography in Appendix 1, page 113). But despite numerous anecdotalobservations of severe sterility problems in different years by researchers from nationalprograms, nobody reports yield loss estimates on a national or even provincial level. Thisdoes not mean losses are minimal, but given the year to year changes of water status,which in turn controls boron availability, varietal differences, macronutrient fertilizer
iv
contamination with boron, and temperature at flowering plus the difficulty ofdetermining boron as the cause of sterility make loss estimates of a sizeable area aformidable task. Most probably, minor sterility often goes unrecognized. If it is severe, itcan also be attributed to drought, cold, or waterlogging (Subedi, page 57). It is unclearwhether waterlogging alone can cause sterility (Misra et aI., page 65) or whether it isonly an indirect factor reducing the availability and/or uptake of boron. Superimposedboron fertilizer experiments (Yang, page 72) may show one way to obtain better yieldloss estimates, but due to the above mentioned interactions, fertilizer experiments are notalways conclusive (Subedi). Due to all these problems, there is currently a lack ofawareness and diagnosis as well as inadequate research for solutions.
Varietal differences are reported by many authors from various soils based onexperiments in farmers' fields (Yang), experiment stations (Tandon and Naqvi, page 76;Misra et aI.; and Subedi) or under controlled conditions in sand culture (Jamjod et aI.,page 79; numerous additional references can be found in Appendix 1). First estimates ofinheritance and heritability (Jamjod et aI., page 86) as well as mode of gene action(Jamjod et aI., page 83) are available. Nevertheless genetic knowledge is still far fromwhat is known about boron toxicity (Paull et aI., page 90) although some inferences canbe made.
In the same way, physiological research of boron toxicity in wheat adds to the presentknowledge of physiological processes in boron-deficient wheat plants (Nable, page 98).
Much remains to be researched for a better understanding of the problems as well as forthe most practical solutions. The workshop participants listed areas in which they wouldwant to continue research on their own or in cooperation with the current project andbeyond (See minutes of final discussion, page 110).
Christoph E. Mann and B. RerkasemConference OrganizersBangkok, Thailand
Acknowledgment
The financial support of the Australian Centre for International Agricultural Research(ACIAR) to boron deficiency research in general and specifically to the Boron Workshopin Chiang Mai, Thailand, is gratefully acknowledged.
v
Workshop Participants
AustraliaRoss NableCSIRO SoilsAdelaide
Jeff PaullWaite InstituteAdelaide
IndiaS.M.A. NaqviDirectorate of Wheat ResearchKamal
NepalTej BahadurIAAS, Rampur, Chitwan
Naba R. DevkotaIAASRampur
Surya Kant GhimireTej BahadurlAAS, Rampur, Chitwan
Peter HobbsCIMMYT Regional OfficeKathmandu
Raghwendra MishraAgri. Res. StationSurkhet
Ram MunankarmyCentral Soil Science Div.Khumultar
Kalidas SubediLumle Regional Agri.Research Center
ThailandConhong ChengAgricultural Systems ProgramChiang Mai University
Supapat ComwongCIMMYT Regional OfficeBankgok
Sithichai LordkaewMultiple Cropping CentreChiang Mai University
Christoph MannCIMMYT Regional OfficeBangkok
Sawit MeechouiLampang AgriculturalResearch and Training Center
Rojare NetsangtipMultiple Cropping CentreChiang Mai University
Benjavin RerkasemAgronomy DepartmentChiang Mai University
Kittipat UkoskitLampang AgriculturalResearch and Training Center
Somkiat WattakawigranSamoeng Upland Rice and TemperateCereals Experiment Station
vi
PRINCIPLES AND PRACTICES IN MICRONUTRIENT RESEARCH WITHEMPHASIS ON BORON WORK IN DEVELOPING COUNTRIES
J.F. LoneraganEmeritus Professor and Research FellowMurdoch University, Western Australia
Abstract
Proper attention to two factors-contamination and other deficiencies-is the key tosuccessful micronutrient research. In principle, the diagnosis of micronutrientdeficiencies in crops is relatively simple. However, in practice, it is frequently verydifficult owing to contamination that hides a deficiency and other deficiencies thatprevent a crop from responding to micronutrient fertilizers. This paper particularlyemphasizes the importance of contamination because it can mask deficiencies and so leadresearchers to conclude that a soil has an adequate supply of a micronutrient when in factit is deficient.
Introduction
The principles involved in research on micronutrient deficiencies are no different fromthose used in research of the common macronutrient deficiencies. However, the practiceof research in micronutrient deficiencies is much more difficult due to the tiny amountsof each micronutrient that plants require and the ease with which contamination fromvarious sources can supply these amounts.
Throughout this paper, I emphasize contamination:
• How easily it happens,• The problems it creates, and• How it can be best prevented.
Contamination can mask deficiencies and so lead researchers to conclude that a soil hasan adequate supply of a micronutrient when in fact it is deficient. Many researchers havealso failed to recognize deficiencies of micronutrients in soils because other deficienciesin the soil have prevented the expression of a micronutrient response.
Proper attention to these two factors-contamination and other deficiencies-is the keyto successful micronutrient research.
Diagnosis and Prognosis
Symptoms, analysis of plant parts, and plant response are all useful in the diagnosis ofmicronutrient deficiencies, that is, in the recognition that a plant is suffering from adeficiency at the time of observation or sampling.
For prognosis of a micronutrient deficiency, Le., the prediction that crop yield will sufferfrom that micronutrient deficiency at final harvest, both plant and soil analyses have beenused. Prognosis has the great advantage over diagnosis in that it permits treatment of acrop before any deficiency develops, so that yield loss may be avoided. Another widelyused method to avoid crop yield loss from deficiencies has been to base general fertilizerrecommendations for particular crops on specific soil types in a region on past experiencein diagnostic trials in the region.
1
Symptoms
If you have ever tried to identify a nutrient deficiency in a sick plant by comparing itwith color photographs of nutrient deficiencies, you know how difficult symptoms are asa diagnostic tool. But with a lot of experience with particular crops, symptoms can be auseful guide to micronutrient deficiencies. And in a few cases, symptoms may besufficiently specific to give a definite diagnosis of a deficiency. This appears to be thecase for B deficiency in peanuts where hollow heart (a depression on the internal surfaceof one or both cotyledons) in the peanut seed seems specific to B deficiency.
Plant Analysis
The use of plant analysis for diagnosis and prognosis is based upon the assumption thatthe concentration of a nutrient or chemical component in the plant is related to yield. Acritical concentration is recognized that separates tissues, which are deficient from thosethat are adequate in the nutrient under test.
Plant analysis has proved very useful in diagnosing deficiencies provided care is taken inselecting the tissue to be sampled and in avoiding contamination of the sample duringcollection, preparation, and analysis. For B, young leaves are recommended.
Soil Analysis
Soil analysis would provide an ideal prognostic tool if only it provided accurate andreliable predictions for micronutrient deficiencies over a wide range of soils, crops, andenvironments. Unfortunately, most soil tests for micronutrients have not yet beendeveloped to a point where they can be applied with confidence outside the situation forwhich they have been developed. However, soil tests can sometimes be used as a usefulguide to likely problems. For example, the extraction into hot water of 15 mg B from 1kg of soil has been recommended as a critical value for the prognosis of hollow heart inpeanuts. But this value will vary for different plant species, for different soils and fordifferent seasons. For example, black gram cultivars commonly used in Thailand aremuch more sensitive to B deficiency than soybean cultivars. The amount of clay in thesoil affects the critical value for hot water soluble boron (HWSB), and the water contentof the soil affects the supply of B to plants, dry soils inducing B deficiency, and wet soilsovercoming it.
As with plant analysis, great care must be taken to avoid contamination during thecollection, preparation, and analysis of soil samples.
Plant Response
All of the methods discussed so far for diagnosing a micronutrient deficiency areindirect-all of them must be calibrated against the direct measurement of a response bythe plant to application of the micronutrient. Moreover, observation of a response tomicronutrient application by plants in the field is the only positive diagnosis that cropproduction is depressed by that deficiency.
For a standing crop, deficiencies may be tested by spraying or topdressing variousfertilizers onto strips set out in a proper statistical arrangement: responses may show upin differences in color, symptoms or yield among the treatments. Alternatively, an area of
, uniform soil may be prepared and a new crop sown and treated with combinations ofvarious fertilizers. For agronomists, the procedures are relatively easy, provided weremember contamination and other deficiencies (COD).
2
Contamination
Some may think that I am being too cautious about the dangers of contamination. Ifcontamination can occur so easily, how is it possible for micronutrient deficiencies tooccur in the dirty field environment? Some simple examples may persuade you that theproblems are very real.
In the 1930s when researchers were investigating the "little leaf" disease of peach trees inCalifornia, they were often able to overcome the disease by spraying the leaves with Iron(Fe) salts. But sometimes the treatment failed. Eventually, they found that the diseasewas in fact caused by Zn deficiency and that when Fe salts were dissolved in galvanizediron buckets, sufficient Zn could dissolve from the galvanized surface to correct theproblem.
In 1958, I visited Tasmania to see the work of David Paton of the Tasmanian Departmentof Agriculture. He showed me a farmer's field with stunted, yellow clover except for athin line of lush, green clover running across the middle of the field from the road to thehouse. The yellow clover was severely Cu-deficient, while the green clover was beingsupplied with Cu by contamination from metallic Cu telephone lines, which were strungfrom the road to the house! On the same visit, David also showed me some fieldexperiments that had been troubling him for several years. Clover plants showed clearsymptoms of Zn deficiency in their early growth but then recovered and grew as well asplants supplied with Zn. At the time of my visit in spring, there were no symptoms of Zndeficiency and no response at all to Zn. When I visited him in the spring of the followingyear, he showed me plants on the same soil with severe Zn deficiency. He explained thathe had changed the brand of his basal superphosphate fertilizer-the new brand wasvirtually Zn free; but the first brand was so heavily contaminated with Zn that when theroots of plants came into contact with it, they recovered from their initial deficiency.
More recently, fertilizer manufacturers in Australia have been producing moreconcentrated phosphatic fertilizers to replace superphosphate. The new fertilizers havevery much lower Zn concentrations than the relatively small amounts generally present insuperphosphate. As a result, Zn deficiency is appearing in crops on soils where it hasnever been seen before.
In 1981, Dr. Ross Welch, who has recently shown that Ni is essential for plants, came towork on Zn deficiency with us at Murdoch. We had done a lot of work with Zn and hadno problems in producing Zn deficiency in wheat growing in soil or nutrient solutions.But Dr. Welch could not get Zn deficiency in his plants. At last we checked every step inhis procedure. It was identical to ours except for one small detail-Ross had covered thetop of the lids of his beakers with white plastic in order to reduce the heat trapped by ourblack plastic. The white pigment in the plastic, like most white pigments in plastic,paints, and rubber was ZnO. Sufficient Zn was leached from the tiny surface of plasticsprayed by the nutrient solution to supply the needs of the plants.
In the case of Mo and Co, seed can contain sufficient amounts of each of thesemicronutrients to supply all of the needs of a crop to maturity, even when the deficiencyis severe. Hence, scientists bringing in seed from a nondeficient area may fail to diagnoseMo and Co deficiencies on soil that may, in fact, be seriously deficient for the farmerwho sows seed saved from his previous crops on the same soil.
These examples show how easy it is for contaminants to ruin good experiments andobscure micronutrient deficiencies. They also show some of the sources of contaminationin the experimental environment. Other serious sources of potential contamination arewater, insecticides, and fungicides.
3
While researchers must be aware of potential problems from all sources ofcoritamination, they must be especially wary of basal fertilizers. Contamination of basalfertilizers has had a long history of misleading researchers trying to define themicronutrient status of soils. In our recent ACIAR Project, we avoided this problem byanalyzing all basal macronutrient fertilizers for their micronutrient content before usingthem in any experiments. We analyzed a large number ofthe common fertilizers whichwere available in Thailand. The levels of micronutrient contamination were very variableand in many cases sufficiently high to ruin experiments. For example, some batches oftriple superphosphate had little B while others had enough to supply the needs of cropson a B deficient soil. It was thus essential to analyze each and every new batch of basalfertilizer BEFORE using it.
One might ask if basal fertilizers are so troublesome, why use them? The answer lies inthe second of the two key factors in successful micronutrient reSearch--otherdeficiencies.
Other Deficiencies
Nearly 200 years ago, Sprengel and later Liebig formulated "the Law of the Minimum",which states that supplying a plant with a nutrient that is deficient will not increase itsgrowth if another nutrient is more limiting. Hence, it is only possible to test a soil for amicronutrient deficiency when the soil contains adequate amounts of all other nutrients.
The principle is illustrated well by David Paton's Zn experiments which I discussedearlier. In those experiments, Zn deficiency suppressed clover growth very severely whena Zn-free source of P was applied. So why add any basal P and risk Zn contamination?The answer is simple-the soil is so deficient in P that if you don't add a basal Pfertilizer, the clover doesn't grow at all and hence cannot respond to Zn!
Potential problems such as this one, created by other deficiencies obscuring amicronutrient deficiency, have led to the use of fertilizer experiment designs known asomission experiments. In an omission experiment, control plots are supplied withfertilizers containing all nutrients which are likely to be deficient. Care must be taken togive adequate but not toxic amounts of the basal nutrients. Treatment plots receive allnutrients, except the one being tested.
We used omission trials in Thailand to see which micronutrients might be important on anumber of soils. We also used a very simple factorial design using the principle of theomission trial to examine a large number of farmers' peanut crops for B deficiency: itwas a 2x2 factorial combination of two B treatments (minus and plus) and two basalfertilizer treatments (minus and plus a basal fertilizer of N, P, K, S). In some crops,peanuts failed to respond to B when no basal fertilizers were added: but whenmacronutrients were applied as basal fertilizers they corrected another deficiency and thecrop responded strongly to B. The experiments illustrated another important pointwhen no B was applied, basal fertilizers often intensified B deficiency and depressed .peanut yield severely, probably by promoting the plant's vegetative growth and depletingthe soil of B for seed production.
Omission experiments are especially useful on soils that are deficient in many elementsas, for example, some sandy soils from Western Australia. Some of these soils are sodeficient in both Nand P that, when fertilizers are added separately, plants do notrespond to anyone of the nutrients N, P, Cu or Zn: but they respond strongly when all ofthe deficient nutrients are added together.
4
EFFECTS OF BORON ON MALE FERTILITY IN WHEAT
Canhong Cheng and B. RerkasemFaculty of AgricultureChiang Mai UniversityChiang Mai, Thailand
Abstract
This study clearly shows that development of wheat anthers and pollen is affected byboron (B) deficiency. It also shows a good correlation between anther length and pollendevelopment. In B-deficient wheat, the pollen does not accumulate starch and the nucleiwhen present are abnormal. It has been suggested that B-deficiency affects pollendevelopment during the pollen mother cell stage. The results show that B is essential forwheat pollen germination and pollen tube growth. B may playa role in the control ofprotein secretory activity in pollen tubes through the redistribution and capture ofmaterials including protein from membrane fusion events involving vesicles, which leadto pollen tube extension.
Introduction
It is known that boron (B) may have both indirect and direct effects on reproductiongrowth. An indirect effect has been suggested to relate to the sugar amount andcomposition of the nectar, whereby the flowers of species that rely on pollinating insectsbecome more attractive to insects (Smith and Johnson 1969, Erikson 1979). Directeffects of B are reflected by the close relationship between B supply and the pollenproducing capacity of anthers, as well as viability of pollen grains (Agarwala et aI. 1981).
Wheat yield may be limited by B deficiency by at least two processes leading to grain setfailure:
• Development of reproductive organs (Li et aI. 1978, Rerkasem 1989), and
• Fertilization.
This paper reports on some studies of effects of B on the male reproductive system inwheat.
Materials and Methods
Experiment 1: Effects of severe B deficiencyThis experiment was carried out at Chiang Mai University, Thailand, during the 1991-92growing season. The wheat cultivar used was Sonora 64. Ten seeds were sown per 5-Lpot and supplied with nutrient solution (Broughton and Dillworth 1970) with two levelsof B: BO and B+. The solution was changed each week. From each B level, the anthersand pollen were examined. Starch accumulation in the pollen was examined with KI/l2staining.
Experiment 2: In vitro pollen germinationThis experiment was carried out at Murdoch University, Western Australia, March-June1991, using wheat cultivars Sonora 64, Vulcan, and Eradu. Six seeds were sown per 140ml pot in a soil mix of 2 parts coarse sand to 2 parts composted jarrah bark to 1 part peat.One gram of slow release fertilizer was used as a basal dressing followed by liquid
5
fertilizer (20 mIlL SpringR each week after week 3, at a rate of 150 ml per pot. Seed wassown at biweekly intervals from March to April in a glasshouse heated at night so theminimum temperature was kept above 10°C. The daily maximum during the floweringperiod was 20-32°C. Pollen was shaken directly into dishes of 0.7% agar mediumcontaining 0.75 M raffinose and 300 mgIL CaCI2.2H
20 with various B levels, as soon as
possible after the anthers were extruded from the glumes.
Pollen was observed under the microscope at 100x magnification and was recorded asgerminated if the pollen tube was longer than half the diameter of the grain. Burst pollenwas also scored and notes were taken on the occurrence of double pollen tubes and sterilegrains. In calculations of percentage germination, the germinated grains were taken as apercentage of the total of: grains germinated, grains intact but ungerminated and burstgrains. Sterile grains were not included in the total, but were only at 0.3-4.8%. Pollengrains in three randomly chosen fields were scored in each of five sectors on each plate.
The lengths of pollen tubes were recorded after drawing germinated pollen fromrandomly selected fields (to a total of 30 tubes for each treatment or time) using anOlympus drawing apparatus (BH 2-DA). Tube length was then calculated by using apiece of damp cotton thread to measure the drawing, and the length calculated from themeasured value.
Results
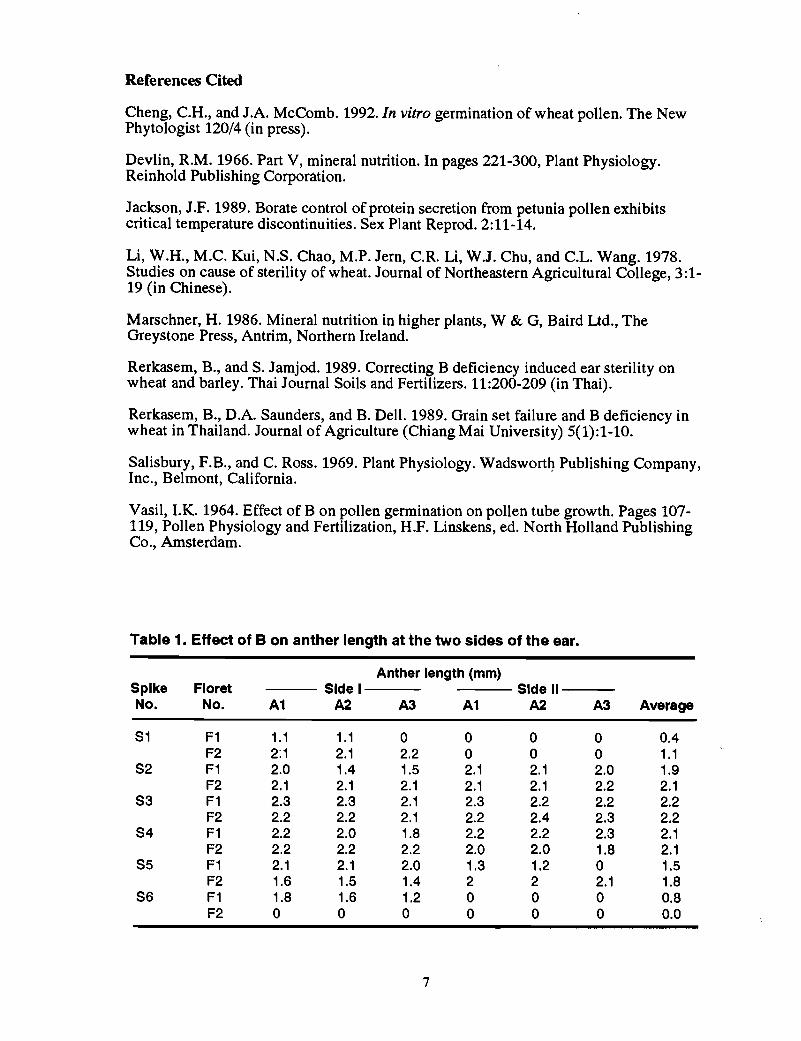
Experiment 1Development of the anthers in BO was severely suppressed. In some florets, the antherswere totally absent; those that were present were very small (Table I}. A comparison ofanthers and pollen in the florets from the top, middle, and bottom of the ear showedmuch larger anthers in B+, with a high percentage of pollen that could be stained withiodine (designating starch deposit), compared with very little pollen that contained starchin BO (Table 2).
Experiment 2The effect of different levels of Bin 0.7% agar media containing 0.75 M raffinose and300 mgIL CaCI
2.2H
20 showed that the optimum level was 100 mgIL H3B03 (Table 3).
There were significant differences of pollen germination and tube length among B levelsand genotypes, and also a significant interaction.
Discussion
This study has clearly shown that development of wheat anthers and pollen is affected byB deficiency. It also shows a good correlation between anther length and pollendevelopment. In B-deficient wheat, the pollen does not accumulate starch and the nucleiwhen present are abnormal (Rerkasem et al. 1989). It has been suggested that Bdeficiency affects pollen development during the pollen mother cell stage (Li et al.1978).
The results show that B is essential for wheat pollen germination and pollen tube growth.Marschner (1986) reported that B stimulates germination, particularly pollen tubegrowth. It has been suggested that B plays a role in the control of protein secretoryactivity in pollen tubes, through the redistribution and capture of materials including (andespecially) protein from membrane fusion events involving vesicles (Picton and Steer1983), which lead to pollen tube extension (Johnson 1989).
6
References Cited
Cheng, C.H., and J.A. McComb. 1992. In vitro germination of wheat pollen. The NewPhytologist 120/4 (in press).
Devlin, R.M. 1966. Part V, mineral nutrition. In pages 221-300, Plant Physiology.Reinhold Publishing Corporation.
Jackson, J.F. 1989. Borate control of protein secretion from petunia pollen exhibitscritical temperature discontinuities. Sex Plant Reprod. 2:11-14.
Li, W.H., M.C. Kui, N.S. Chao, M.P. Jern, C.R. Li, W.J. Chu, and C.L. Wang. 1978.Studies on cause of sterility of wheat. Journal of Northeastern Agricultural College, 3:119 (in Chinese).
Marschner, H. 1986. Mineral nutrition in higher plants, W & G, Baird Ud., TheGreystone Press, Antrim, Northern Ireland.
Rerkasem, B., and S. Jamjod. 1989. Correcting B deficiency induced ear sterility onwheat and barley. Thai Journal Soils and Fertilizers. 11:200-209 (in Thai).
Rerkasem, B., D.A. Saunders, and B. Dell. 1989. Grain set failure and B deficiency inwheat in Thailand. Journal of Agriculture (Chiang Mai University) 5(1):1-10.
Salisbury, F.B., and C. Ross. 1969. Plant Physiology. Wadsworth, Publishing Company,Inc., Belmont, California.
Vasil, I.K. 1964. Effect of B on pollen germination on pollen tube growth. Pages 107119, Pollen Physiology and Fertilization, H.F. Linskens, ed. North Holland PublishingCo., Amsterdam.
Table 1. Effect of B on anther length at the two sides of the ear.
Anther length (mm)Spike Floret Side I Side \INo. No. A1 A2 A3 A1 A2 A3 Average
81 F1 1.1 1.1 0 0 0 0 0.4F2 2:1 2.1 2.2 0 0 0 1.1
82 F1 2.0 1.4 1.5 2.1 2.1 2.0 1.9F2 2.1 2.1 2.1 2.1 2.1 2.2 2.1
83 F1 2.3 2.3 2.1 2.3 2.2 2.2 2.2F2 2.2 2.2 2.1 2.2 2.4 2.3 2.2
84 F1 2.2 2.0 1.8 2.2 2.2 2.3 2.1F2 2.2 2.2 2.2 2.0 2.0 1.8 2.1
85 F1 2.1 2.1 2.0 1.3 1.2 0 1.5F2 1.6 1.5 1.4 2 2 2.1 1.8
86 F1 1.8 1.6 1.2 0 0 0 0.8F2 0 0 0 0 0 0 0.0
7
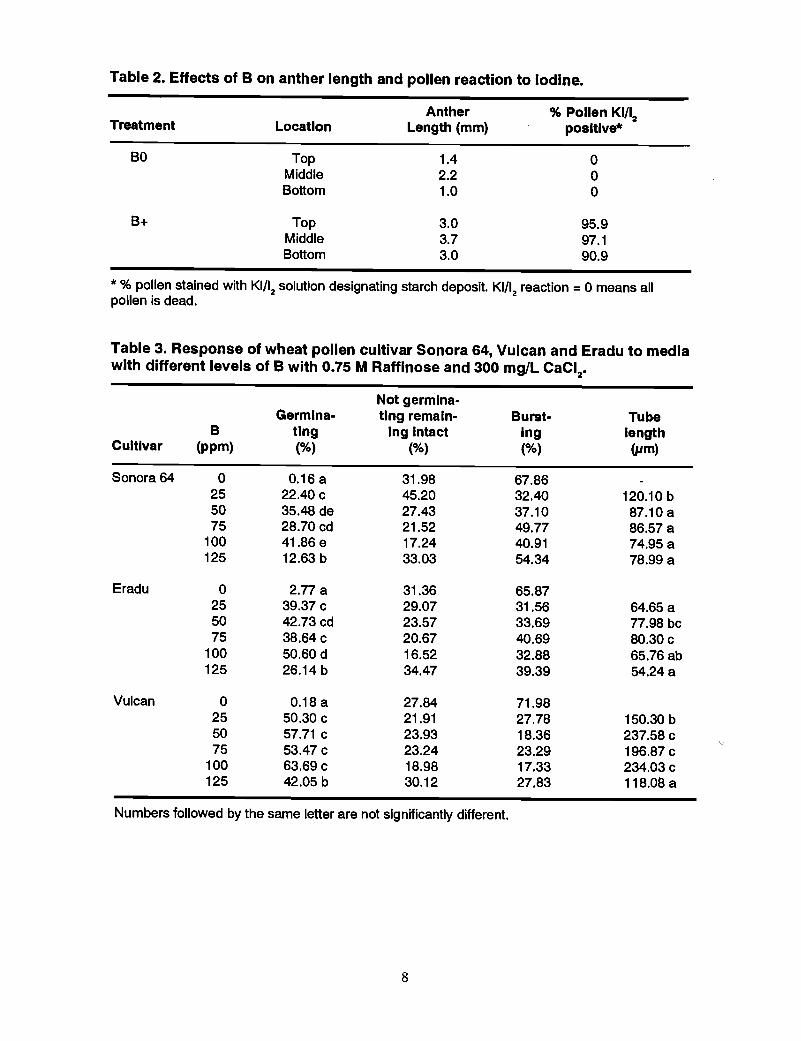
Table 2. Effects of B on anther length and pollen reaction to Iodine.
Treatment
BO
B+
Anther % Pollen KI/12Location Length (mm) posltlve*
Top 1.4 0Middle 2.2 0Bottom 1.0 0
Top 3.0 95.9Middle 3.7 97.1Bottom 3.0 90.9
* % pollen stained with KI/12 solution designating starch deposit. KI/12 reaction =0 means allpollen is dead.
Table 3. Response of wheat pollen cultivar Sonora 64, Vulcan and Eradu to mediawith different levels of B with 0.75 M Raffinose and 300 mglL CaClz•
Not gernllna-Germina- ting remain- Burst- Tube
B tlng Ing Intact log lengthCultlvar (ppm) (%) (%) (%) ijlm)
Sonora 64 0 0.16 a 31.98 67.8625 22.40 c 45.20 32.40 120.10 b50 35.48 de 27.43 37.10 87.10 a75 28.70 cd 21.52 49.77 86.57 a
100 41.86 e 17.24 40.91 74.95 a125 12.63 b 33.03 54.34 78.99 a
Eradu 0 2.77 a 31.36 65.8725 39.37 c 29.07 31.56 64.65 a50 42.73 cd 23.57 33.69 77.98 bc75 38.64 c 20.67 40.69 80.30 c
100 50.60 d 16.52 32.88 65.76 ab125 26.14 b 34.47 39.39 54.24 a
Vulcan 0 0.18 a 27.84 71.9825 50.30 c 21.91 27.78 150.30 b50 57.71 c 23.93 18.36 237.58 c75 53.47 c 23.24 23.29 196.87 c
100 63.69 c 18.98 17.33 234.03 c125 42.05 b 30.12 27.83 118.08 a
Numbers followed by the same letter are not significantly different.
8
PREDICTING GRAIN SET FAILURE WITH TISSUE BORON ANALYSIS
B. Rerkasem and S. LordkaewMultiple Cropping Centre
Chiang Mai UniversityChiang Mai, Thailand
Abstract
Results of this study show that relationships can be established between tissue boron (B)concentration and grain set. A critical B concentration can be defined above which grainset can be expected not to fail. However, below this level, the sharp depression in grainset with decreasing tissue B concentration makes it virtually impossible to separate thedifferent levels of grain set failure. There is an indication of differences amonggenotypes.
Introduction
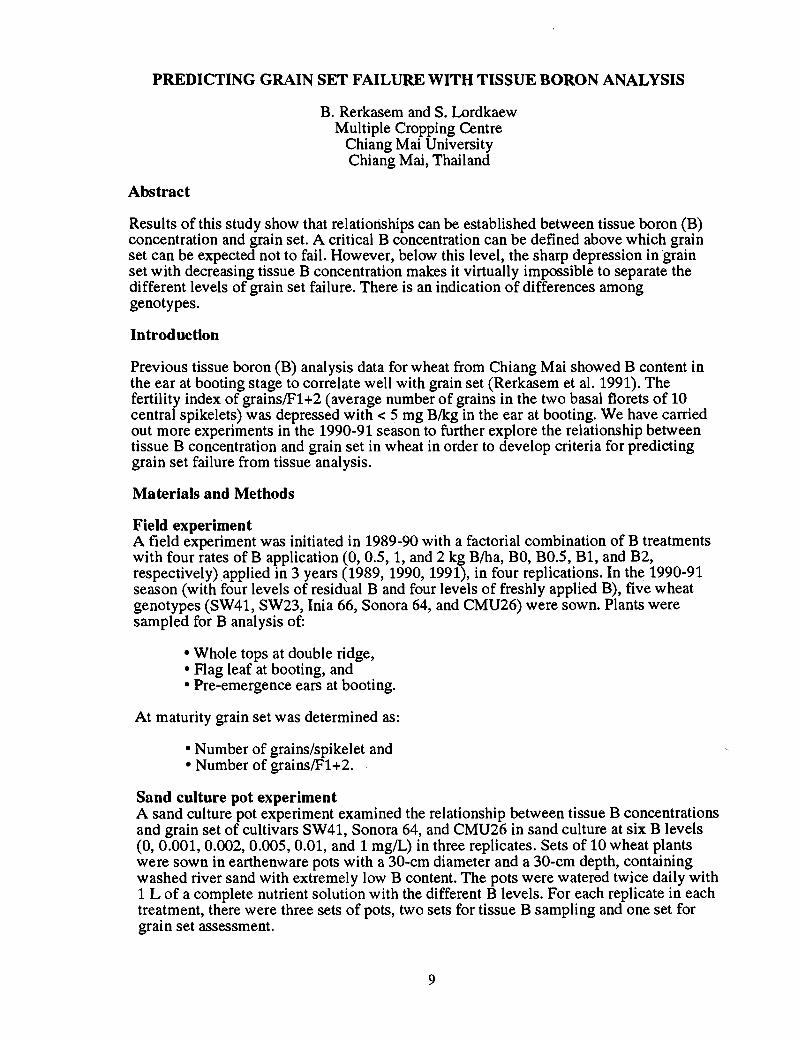
Previous tissue boron (B) analysis data for wheat from Chiang Mai showed B content inthe ear at booting stage to correlate well with grain set (Rerkasem et al. 1991). Thefertility index of grainslF1+2 (average number of grains in the two basal florets of 10central spikelets) was depressed with < 5 mg B/kg in the ear at booting. We have carriedout more experiments in the 1990-91 season to further explore the relationship betweentissue B concentration and grain set in wheat in order to develop criteria for predictinggrain set failure from tissue analysis.
Materials and Methods
Field experimentA field experiment was initiated in 1989-90 with a factorial combination of B treatmentswith four rates of B application (0,0.5, 1, and 2 kg B/ha, BO, BO.5, B1, and B2,respectively) applied in 3 years (1989, 1990, 1991), in four replications. In the 1990-91season (with four levels of residual B and four levels of freshly applied B), five wheatgenotypes (SW41, SW23, Inia 66, Sonora 64, and CMU26) were sown. Plants weresampled for B analysis of:
• Whole tops at double ridge,• Flag leaf at booting, and• Pre-emergence ears at booting.
At maturity grain set was determined as:
• Number of grains/spikelet and• Number of grainsIF1+2.
Sand culture pot experimentA sand culture pot experiment examined the relationship between tissue B concentrationsand grain set of cultivars SW41, Sonora 64, and CMU26 in sand culture at six B levels(0, 0.001, 0.002, 0.005, 0.01, and 1 mg/L) in three replicates. Sets of 10 wheat plantswere sown in earthenware pots with a 30-cm diameter and a 30-cm depth, containingwashed river sand with extremely low B content. The pots were watered twice daily with1 L of a complete nutrient solution with the different B levels. For each replicate in eachtreatment, there were three sets of pots, two sets for tissue B sampling and one set forgrain set assessment.
9
Results
Field experimentExcept in Sonora 64, grain set in all genotypes was depressed in BO and respondedpositively to B application. When grain/F1+2 is plotted against tissue B concentrations,the data points can be separated into two populations at a certain critical B concentration.Above this concentration, there was no response to B. The response to changes in Bconcentration below this level was somewhat variable with a strong genotype effect.
Boron in whole tops at double ridge. The "critical" value for B in the whole tops atdouble ridge predicting grain set in wheat was about 10 mg Blkg (Figure 1), above whichgrain set was approaching the maximum value of 2. Below 10 mg Blkg, grain setdecreased sharply with decreasing B concentration in the whole tops. A sharp decrease ingrain set was associated with 6-8 mg Blkg in SW41, but only a slight depression in Inia66 and CMU26 and no reduction in grain set at ~ll in Sonora 64. A slight grain setdepression in SW23 was associated with 8-10 mg Blkg.
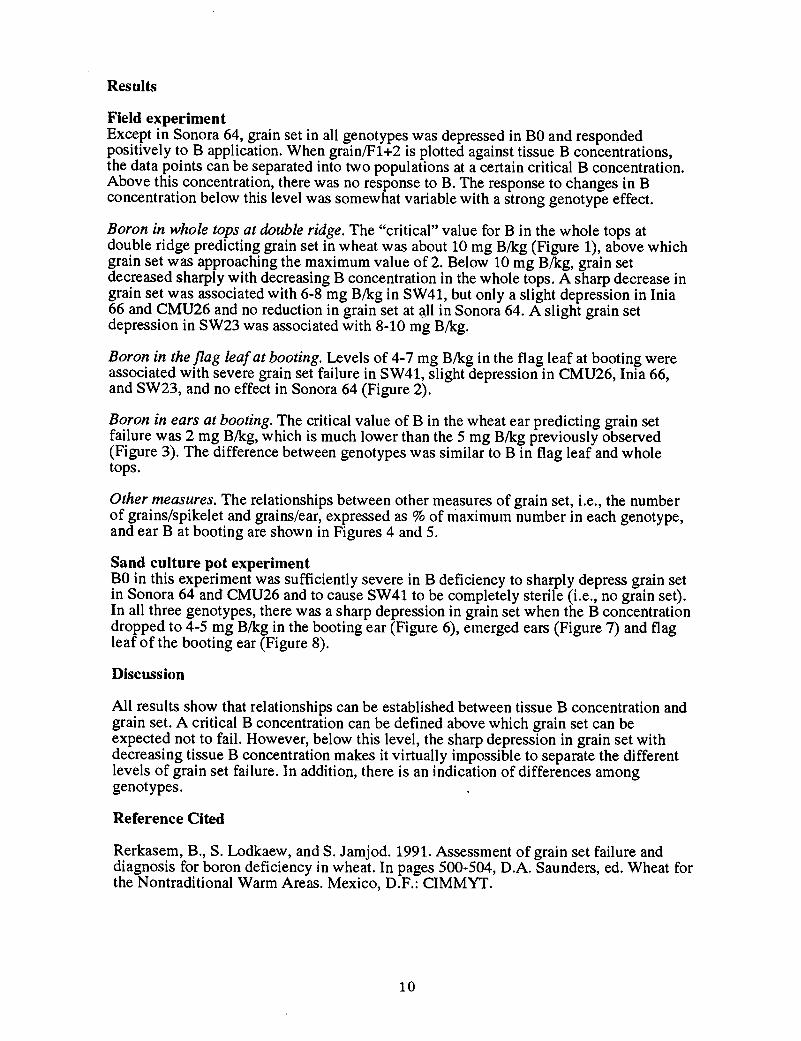
Boron in the flag leaf at booting. Levels of 4-7 mg Blkg in the flag leaf at booting wereassociated with severe grain set failure in SW41, slight depression in CMU26, Inia 66,and SW23, and no effect in Sonora 64 (Figure 2).
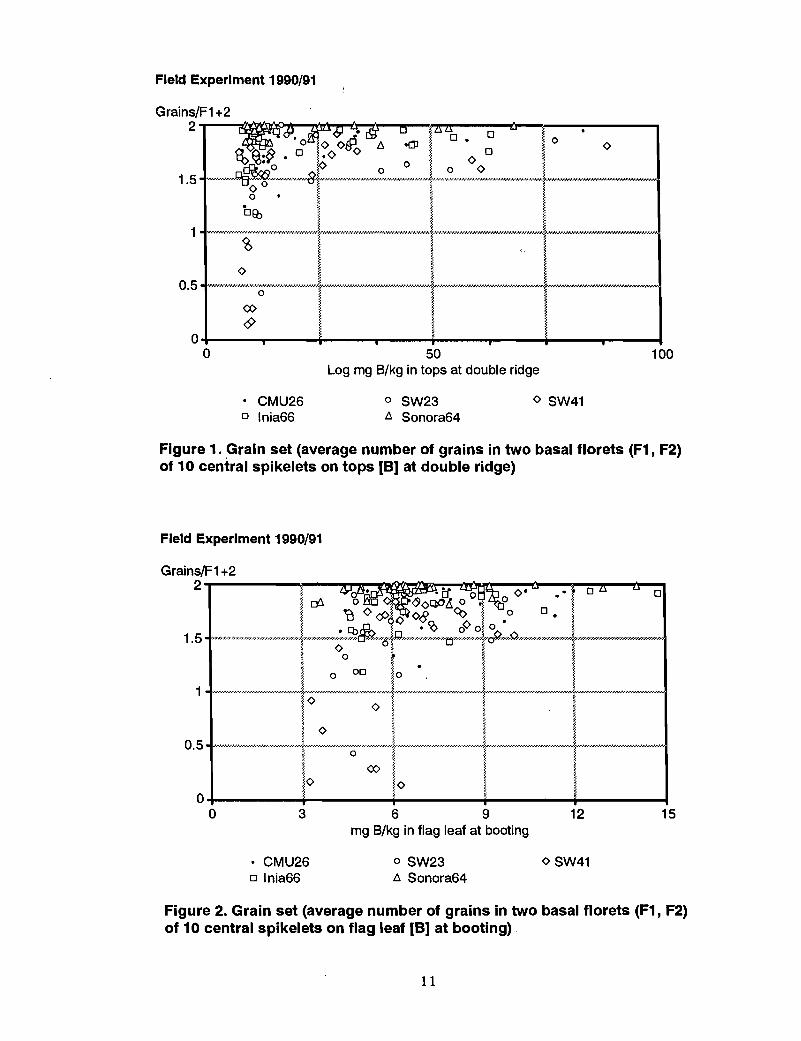
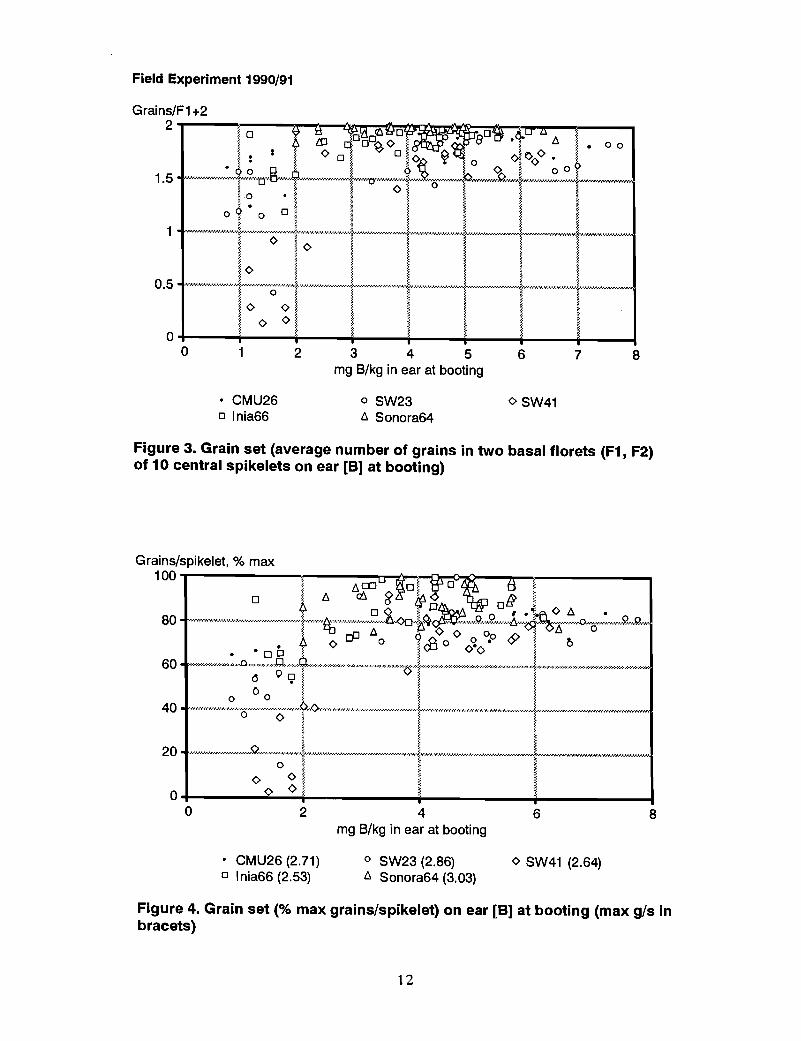
Boron in ears at booting. The critical value of B in the wheat ear predicting grain setfailure was 2 mg Blkg, which is much lower than the 5 mg Blkg previously observed(Figure 3). The difference between genotypes was similar to B in flag leaf and wholetops.
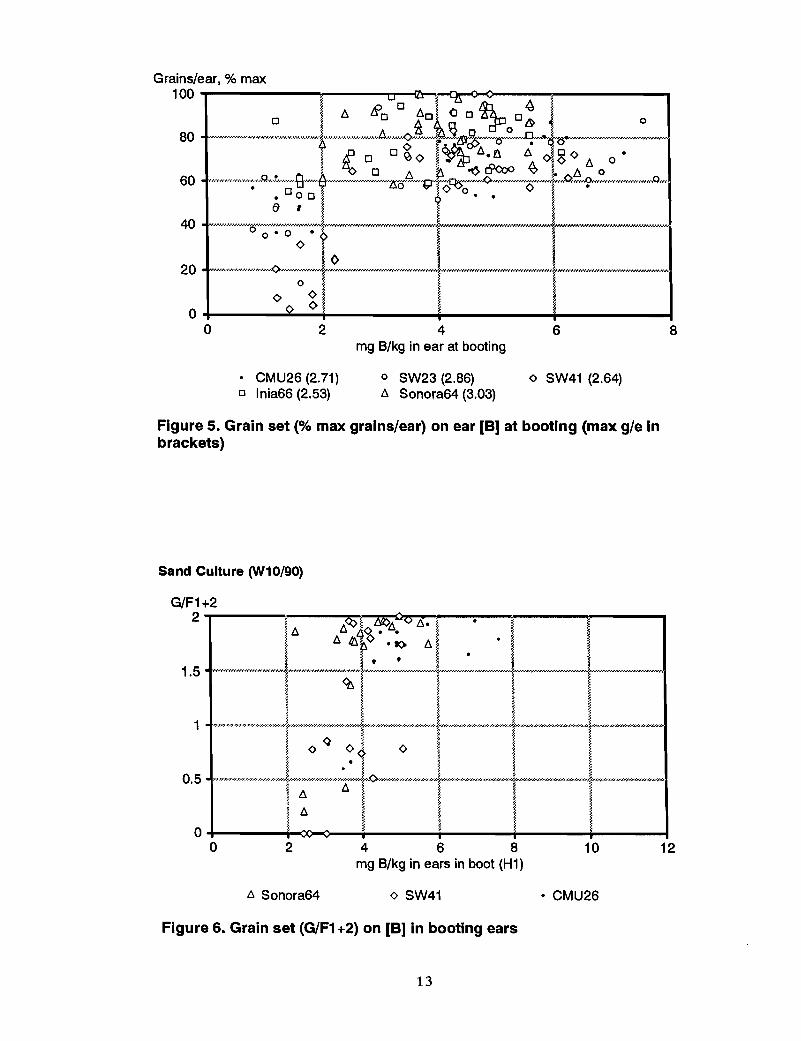
Other measures. The relationships between other measures of grain set, Le., the numberof grains/spikelet and grains/ear, expressed as % of maximum number in each genotype,and ear B at booting are shown in Figures 4 and 5.
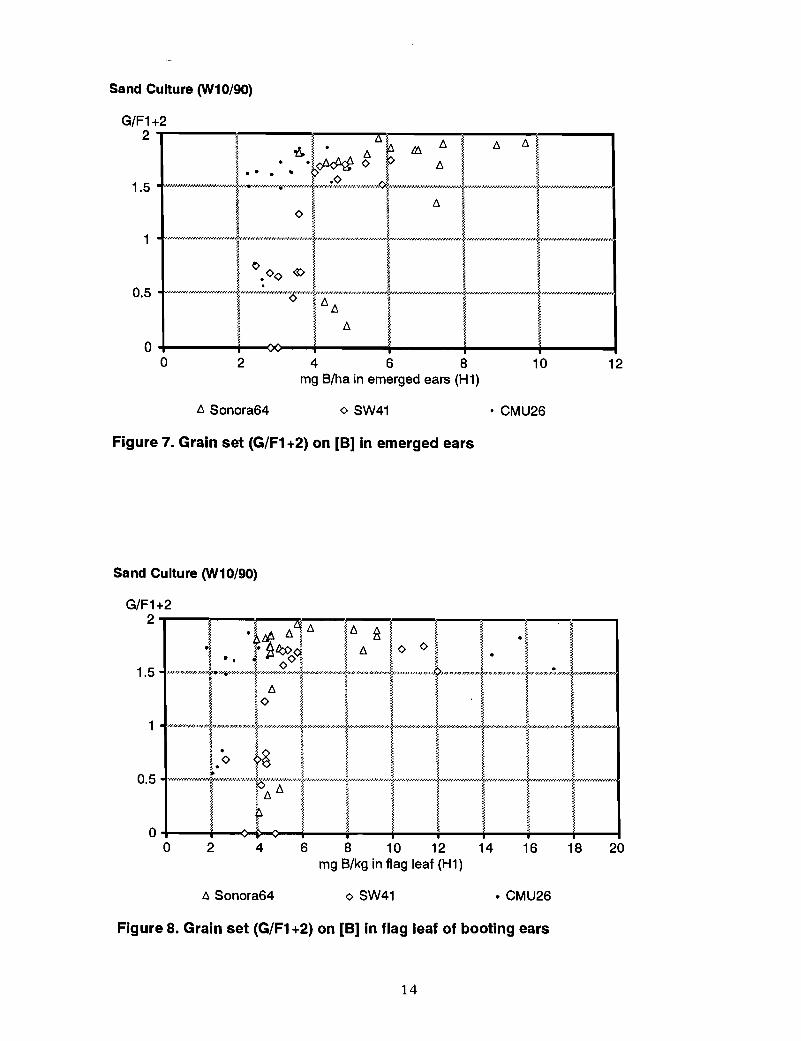
Sand culture pot experimentBO in this experiment was sufficiently severe in B deficiency to sharply depress grain setin Sonora 64 and CMU26 and to cause SW41 to be completely sterile (Le., no grain set).In all three genotypes, there was a sharp depression in grain set when the B concentrationdropped to 4-5 mg Blkg in the booting ear (Figure 6), emerged ears (Figure 7) and flagleaf of the booting ear (Figure 8).
Discussion
All results show that relationships can be established between tissue B concentration andgrain set. A critical B concentration can be defined above which grain set can beexpected not to fail. However, below this level, the sharp depression in grain set withdecreasing tissue B concentration makes it virtually impossible to separate the differentlevels of grain set failure. In addition, there is an indication of differences amonggenotypes.
Reference Cited
Rerkasem, 8., S. Lodkaew, and S. Jamjod. 1991. Assessment of grain set failure anddiagnosis for boron deficiency in wheat. In pages 500-504, D.A. Saunders, ed. Wheat forthe Nontraditional Warm Areas. Mexico, D.F.: CIMMYT.
10
Field Experiment 1990/91
0.5
50Log mg B/kg in tops at double ridge
100
• CMU26o Inia66
o SW236. Sonora64
<> SW41
Figure 1. Grain set (average number of grains in two basal florets (F1, F2)of 10 central spikelets on tops [8] at double ridge)
Field Experiment 1990/91
1.5
3
• CMU26o Inia66
6 9mg B/kg in flag leaf at booting
o SW236. Sonora64
12
<> SW41
15
Figure 2. Grain set (average number of grains in two basal florets (F1, F2)of 10 central spikelets on flag leaf [8] at booting)
11
Field Experiment 1990/91
0.5
1 2 3 4 5mg B/kg in ear at booting
6 7 8
• CMU26o Inia66
o SW23t:,. Sonora64
°SW41
Figure 3. Grain set (average number of grains in two basal florets (F1, F2)of 10 central spikelets on ear [B] at booting)
40
864mg B/kg in ear at booting
2
oo+- ..;:;o......;..r. -+ -+- ---I
o
• CMU26 (2.71)o Inia66 (2.53)
o SW23 (2.86)t:,. Sonora64 (3.03)
° SW41 (2.64)
Figure 4. Grain set (% max grains/spikelet) on ear [B] at booting (max g/s inbracets)
12
o 2
CMU26 (2.71)o Inia66 (2.53)
4mg B/kg in ear at booting
o SW23 (2.86)6. Sonora64 (3.03)
6
<> SW41 (2.64)
8
Figure 5. Grain set (% max grains/ear) on ear [B] at booting (max g/e inbrackets)
Sand Culture (W10/90)
o 2
!:J. Sonora64
4 6 8mg B/kg in ears in boot (H1)
<> SW41
10
• CMU26
12
Figure 6. Grain set (G/F1 +2) on [B] in booting ears
13
Sand Culture (W10/90)
12104 6 8mg B/ha in emerged ears (H 1)
2oo
1
0.5
G/F1+22 T"""----r----~--,l,..<PM-o--6""&~~;--ItJ.--6-"--6--6-"D'
0- <> w 6 ~
~ ..... t> ~ ~~ ~.o ~ ~
1 5 ·~ N<I'..NN.." ••• ;:.·.· ••• ·.·N.· • •••••" ••••••••h b ••••••••••• • ••• •..~.· "N • ·,.." ....., 'i(.· "''''" • • • • • ~ ,. ,. ". ~ ~ ~ :: ~
I I 6~ <> ~
-~J---~ ~ ;. ~ ::~ ..... ~ ~ ~ ~IVo <t>~ ~ ~ ::~ .<> i ~ i ~
......................................................j : ~ ~ ~ ~ ,.. ..~ <> ~L\ i ~ ~? ~ ~ ~ ~ ~~ ~ ~ ~ ~
~ ~ 11 ~ ~ ~$. f, ~ t.' ~~ 'i! i!
6 Sonora64 <> SW41 • CMU26
Figure 7. Grain set (G/Fl +2) on [B] in emerged ears
Sand Culture (W10/90)
201816148 10 12mg B/kg in flag leaf (H1)
64oo
1
G/F1+22 "I"'""---;~-_--~&r;~!"-6---:l.'.·-A-/\--;~--=,..-_·<-"--="---:!"""-.......
• ~ IIt.A ~ ~ ,. u z:s:: .~ ~l¥ ~ ~ ~ ~ ~ • ~ ~~ ::e fJ.!<::f>.<j j 6 ~ <> <> ~ ~ ~ ~~. ~ P <>* ~ ~ * ~. ~ ~~ " oE. ~ ~ ~ ~ ~.~1 5 ;o- :-- >*'.;o- ;o: :: ;o: § ;0- :.0: ;;. ;0: ;; ;0- ;0- 9' :o:.;o- ..::;. y ." -:: ~..y..: ;0: ..: :0:
• ~ ~ t. ~ ~ ~ ~ ~ ~
2
6 Sonora64 <> SW41 o CMU26
Figure 8. Grain set (G/Fl +2) on [B] in flag leaf of booting ears
14
PROCEDURES FOR BORON ANALYSIS IN PLANTS
R. Netsangtip and S. LordkaewMultiple Cropping Center
Chiang Mai University
Abstract
This paper briefly outlines procedures for sample preparation and boron analysis. Whendoing boron analyses in plants, great care must be taken in sampling, preparation ofsamples, and analysis in order to avoid contamination. Only plastic containers should beused.
Introduction
The procedures described here are adapted from Loshe (1982) by Derek Plaskett,Murdoch University, Western Australia.
Sample Preparation
The sampling equipment for plant analysis used at Multiple Cropping Center (MCC) isshown in Figure 1. Plant samples are oven-dried at 80°C for 48 hours, ground and sievedthrough 1-mm mesh (Figure 2). However, it is not necessary to grind the plant sample ifits weight is lower than 2 g.
Boron Analysis
ExtractionThe dry-ashing technique is used to extract B from the plant sample:
• Weigh approximately 300 mg of oven-dried ground material into a tall crucible(Figure 3) and place it in a cold furnace. Samples of standard reference materialand blanks are included with each batch of samples. Ash the samples at 500°C for8 hours and cool (Figure 4).
• Remove the crucible from the furnace and place in electric frying pans. Rinsethe crucible walls down with 2 ml HCI (1:1 concentrated HCI to deionized (0.1.)water. Adjust frying pan temperature to 50°C and heat gently for approximately30 minutes (Figure 5).
• Cool and transfer the solution from crucible to a 10-ml graduated polystyrenevial with small washes of 0.1. water. Dilute to a lO-ml volume. Cap the vial andshake well (Figure 6).
• Allow the precipitate to settle by standing overnight or centrifuge at 2500-3000rpm for 4 minutes.
Boron determinationThe azomethine-H method is used to determine B content in the extracted solution.
Reagent.• Buffer-masking reagent:Dissolve 280 g ammonium acetate, 20 g potassium acetate, 20 g tetra sodium saltof EDTA, and 8 g nitrilotriacetic acid in 400 ml of 0.1. water.
15
After contents are completely dissolved, slowly add 125 ml concentrated aceticacid. Dilute solution to 2 L. Stand overnight at room temperature. Filter through a# 1 filter paper.
• Azomethine-H reagent:Prepare 24 hours before using. Dissolve 0.8 g of fresh azomethine-H (Merk) and2 g ascorbic acid in 60 ml D.I. water. Dilute solution to 100 roI. Store inpolypropylean bottle wrapped in aluminum foit and place in a refrigerator. Thisreagent is usable for 14 days.
• N Hydrochloric acid:Dilute 97 ml of concentrated HCI (A.R. grade) to 1 L with D.I. water.
• Boron solution (100 ppm)Dissolve 0.5716 g boric acid (A.R. grade) in 1 L D.I. water. This solution is usedto prepare a series of boron standards in N HCI (0, 1,2,3,4 and 5 ppm standardsolutions: diluting 0,1,2,3,4 and 5 ml of the 100 ppm boron standard,respectively, to 100 ml).
• Mixed reagentMix two parts (by volume) of the buffer-masking reagent with one part of theazomethine-H reagent. This reagent must be used within 4 hours.
Procedure.Pipette 1 ml of the extracted solution into a vial. Add 3 ml of the mixed reagentin a strong jet with an Eppendorf to mix well with sample. Stand for 1 hourbefore boron content is determined colorimet,rically at 420 nm (Figure 7).
Sample readings are compared with a series of boron standards (0, 1, 2, 3, 4 and 5ppm) prepared at the same time and treated in the same way as sample solutions.
Cleaning.All of the plastic containers are cleaned with DJ. water left In 20 % concentratedHCI overnight, rinsed with D.~. water and air-dried.
Reference Cited
Loshe, G. 1982. Soil Sci. Plant Anal. 13:127-134.
16
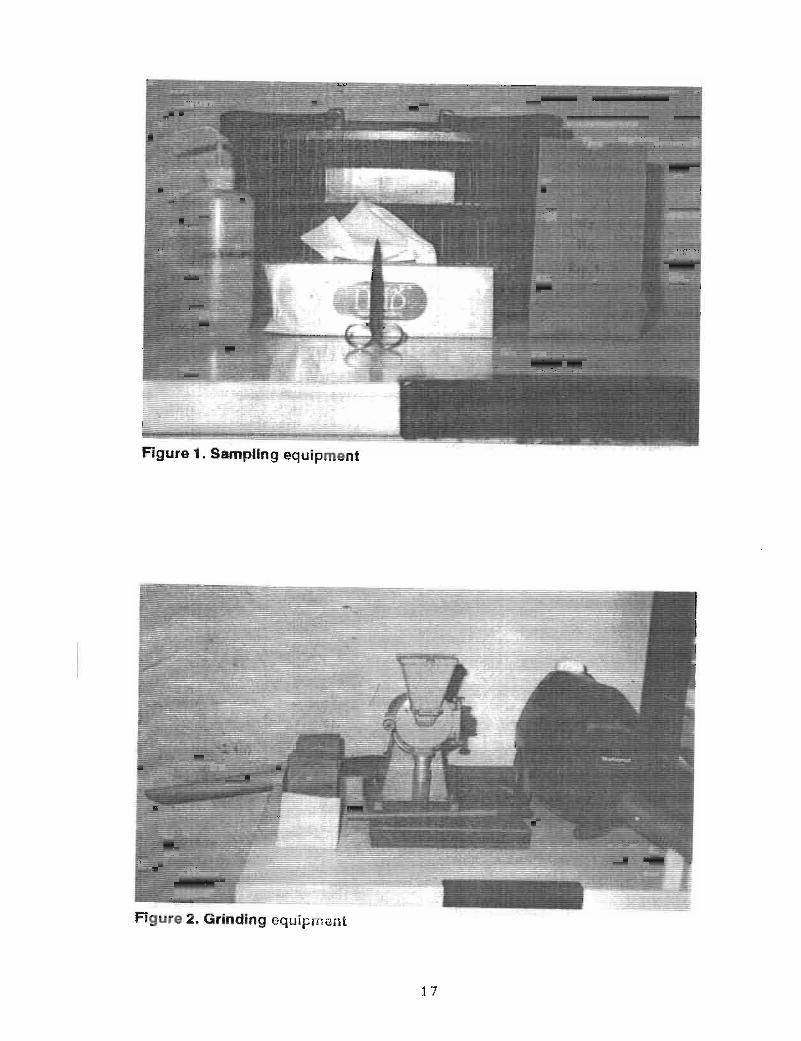
Figure 1. Sampling equipment
Figure 2. Grinding equipment
1"1~ (
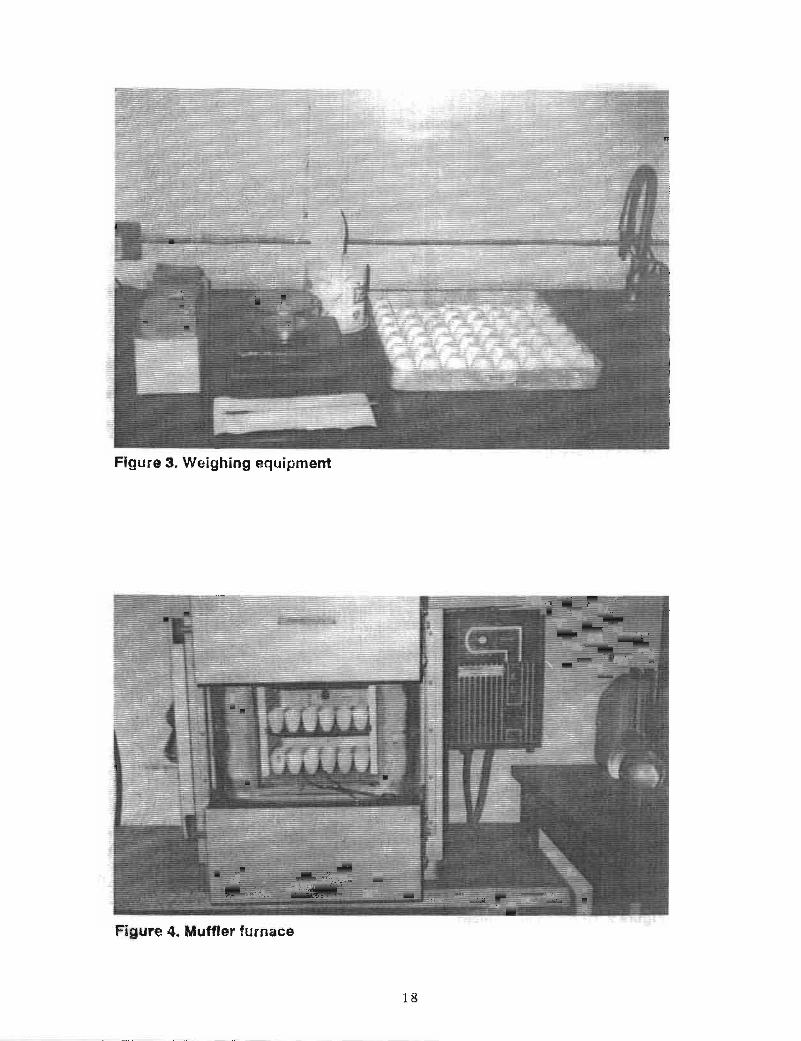
Figure 3. Weighing equipment
Figure 4. Muffler furnace
18
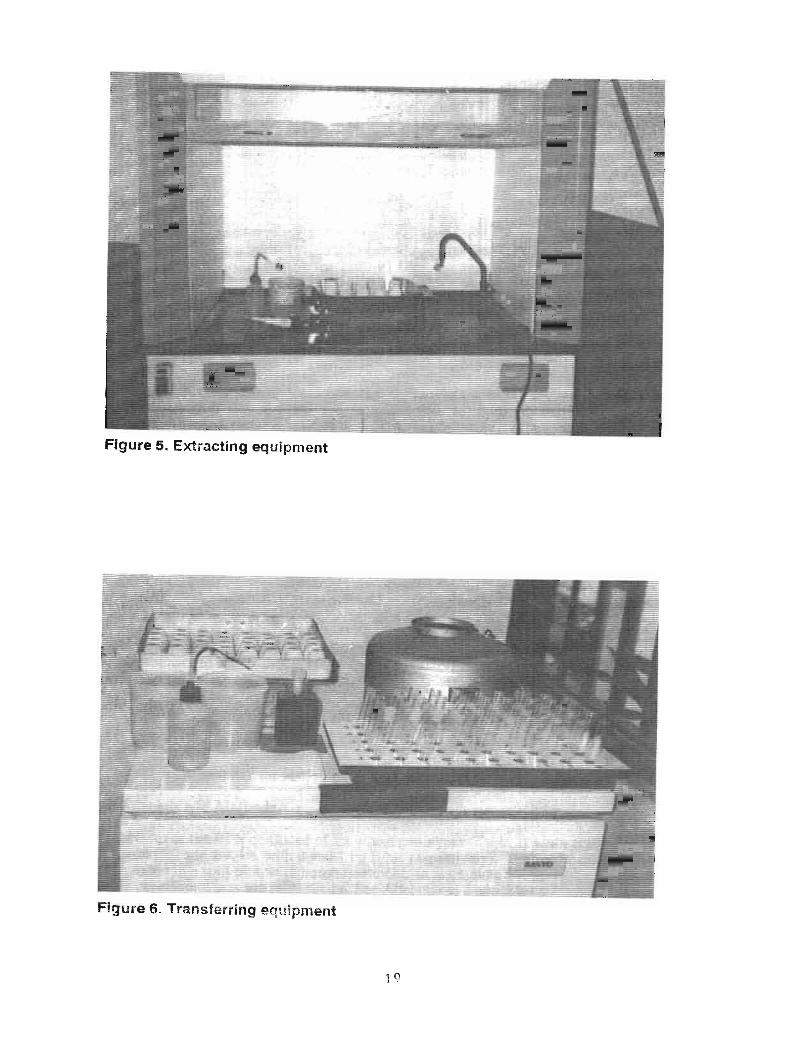
Figure 5. Extracting equipment
Figure 6. Transferring equipment
i 9
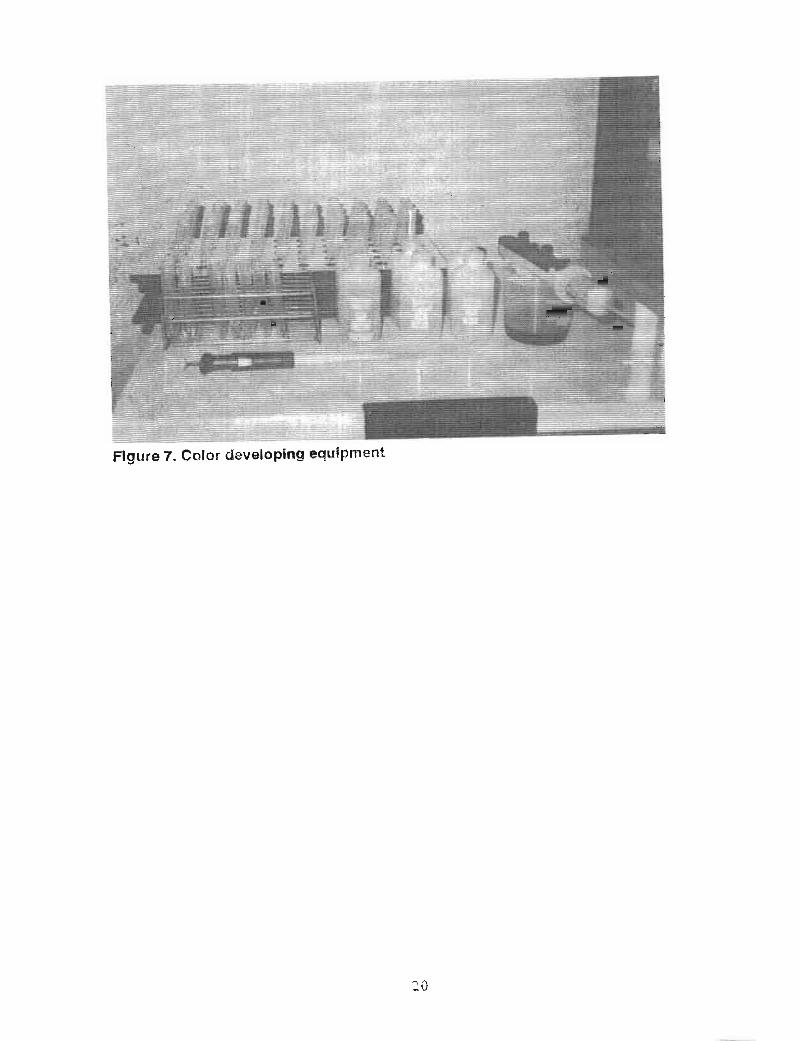
Figure 7. Color developing equipment
20
BORON DEFICIENCY PROBE NURSERY
B. RerkasemMultiple Cropping Centre
Chiang Mai UniversityChiang Mai, Thailand
Abstract
The Boron Probe Nursery (BPN) is organized to: 1) compare response to boron in wheatacross different environments, and 2) characterize the response of wheat genotypesacross these environments. In the 1990-91 BPN, no response to boron (B) was observedin all genotypes at two sites: Mae Hia Station of CMU and Dehong. Responses to B bySW41, BL1022 (previously identified as susceptible to B deficiency), Insee 1, CMU26,and Sonora 64 (previously determined as tolerant to B deficiency) were consistentthroughout all the sites reporting responses: MCC Station of CMU Lumle, TARC,Samoeng and Chiang RaL Responses of other genotypes (CMU285--sensitive; Sonalika,Kanchan, SW23-moderately susceptible; and NL46D-tolerant) were somewhatvariable. In general, B application increased B concentration in tissues (whole tops atdouble ridge, flag leaf, and ear at booting). The relationship between B concentrations inthese tissues and grain set, however, appears to vary with location and genotype.
Introduction
Grain set failure (sterility) is a widespread problem in many tropical and subtropicalwheat growing areas. For example, in Dehong Prefecture, Yunnan Province of China;Nepal; Bangladesh; northern Thailand, and Brazil, the problem has often been identifiedas boron deficiency when an application of boron (B) improved grain set. But there havealso been instances where there was no response to B.
One feature of the sterility problem is a wide range of responses observed amonggenotypes. Reports of relative tolerance of some common genotypes are also sometimesvariable. For example, UP262 was found to be tolerant in Chiang Mai, but sensitiveelsewhere. The use of genotypes with "tolerance" to B deficiency is one effective way toovercome this widespread problem. While genetic and ,breeding work is initiated onselected tolerant and susceptible genotypes identified in Chiang Mai, a characterizationof responses to B deficiency would ensure the stability of B deficiency tolerance genesacross these different environments.
The Boron Probe Nursery (BPN) is organized to:
• Compare response to boron in wheat across different environments,
• Character,ize the response of wheat genotypes across these environments.
Materials and Methods
Each set of the BPN consisted of six wheat genotypes (Table 1) sown at two levels ofboron (BO and B+, Le. with 0 and 1 kg B/ha, respectively). The treatments werearranged in a split plot, with boron treatments in main plots and genotypes in subplots;the experiment was run in duplicate. See Appendices 2 and 3 for management andsampling details. '
21
Seventeen sets of the BPN were prepared and distributed to collaborating institutions inAsia (11 sets) and South America (6 sets). Each set was accompanied by two copies ofthe field book and instructions for management of the experiment and sampling(Appendices 2 and 3).
Results
Results were obtained from seven stations in Asia and one in Brazil:
• Agricultural Research Institute of Dehong Prefecture, Yunnan Province, China.
• Samoeng Experiment Station for Upland Rice and Temperate Cereals, ChiangMai, Thailand.
• Tarhara Agricultural Research Centre (TARC), Sansari, Nepal.
• Lumle Regional Agricultural Research Centre, Nepal.
• Chiang Rai Horticultural Research Centre, Chiang Rai, Thailand.
• Multiple Cropping Centre (MCC), Chiang Mai University, Thailand.
• Mae Hia Experiment Station, Chiang Mai University, Thailand.
• Secretaria de Estado dos Negocios de Agricultura e Abastecimento,Coordenadoria da Pesquisa Agropecuaria, Campinas, Sao Paulo, Brazil.
The number of grains/spikelet is the only measure of grain set that was obtained from allsites, so it has been used to compare responses to B across all of the sites. Tissue sampleswere obtained from only four sites: TARC, Lumle, MCC, and Mae Hia.
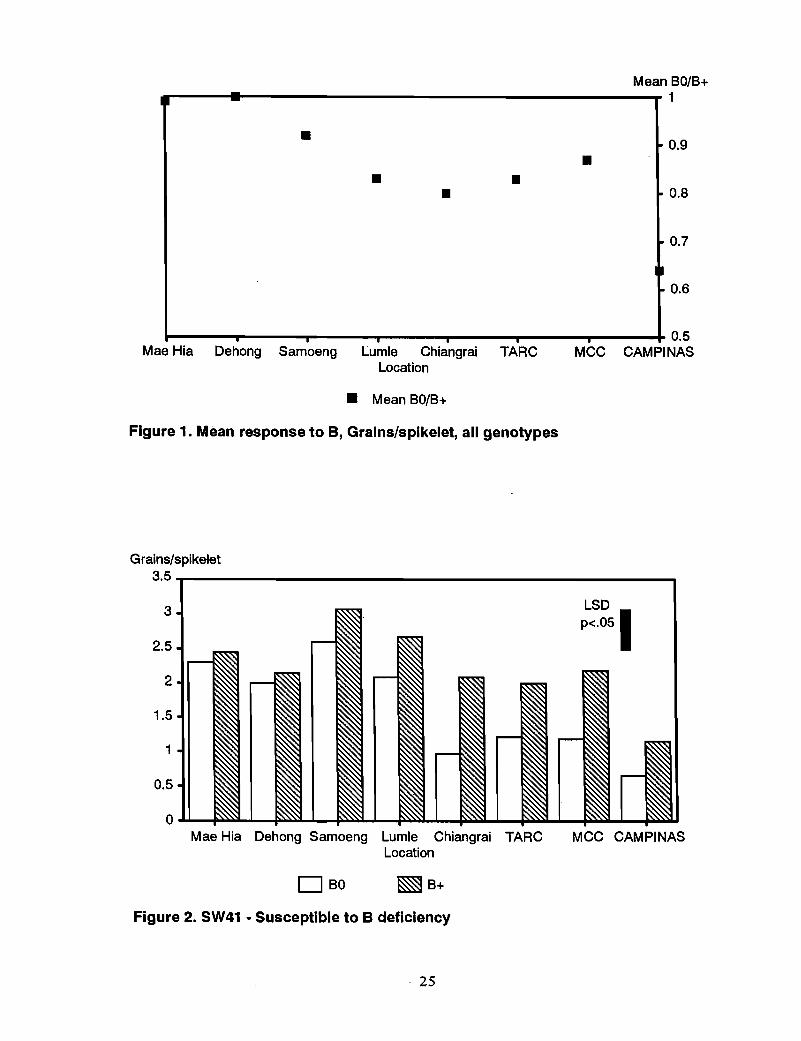
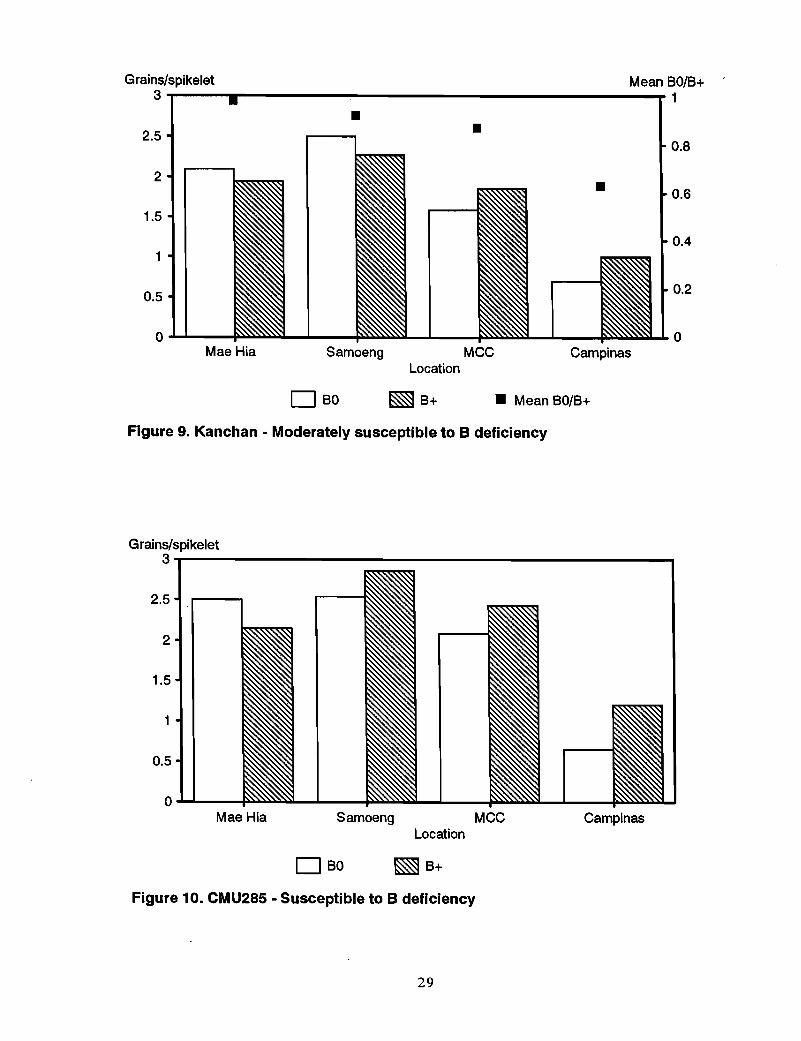
Grn~~ .No response to B was observed in all genotypes at Mae Hia and Dehong. The grain set(grains/spikelet) in BO was about the same as that in B+. This was reflected in therelative mean grain set in BO/B+ over all genotypes being close to 1 for these two sites,compared with the relative grain set BO/B+ at responsive sites that ranged from 0.63 atCampinas to 0.88 at MCC (Figure 1).
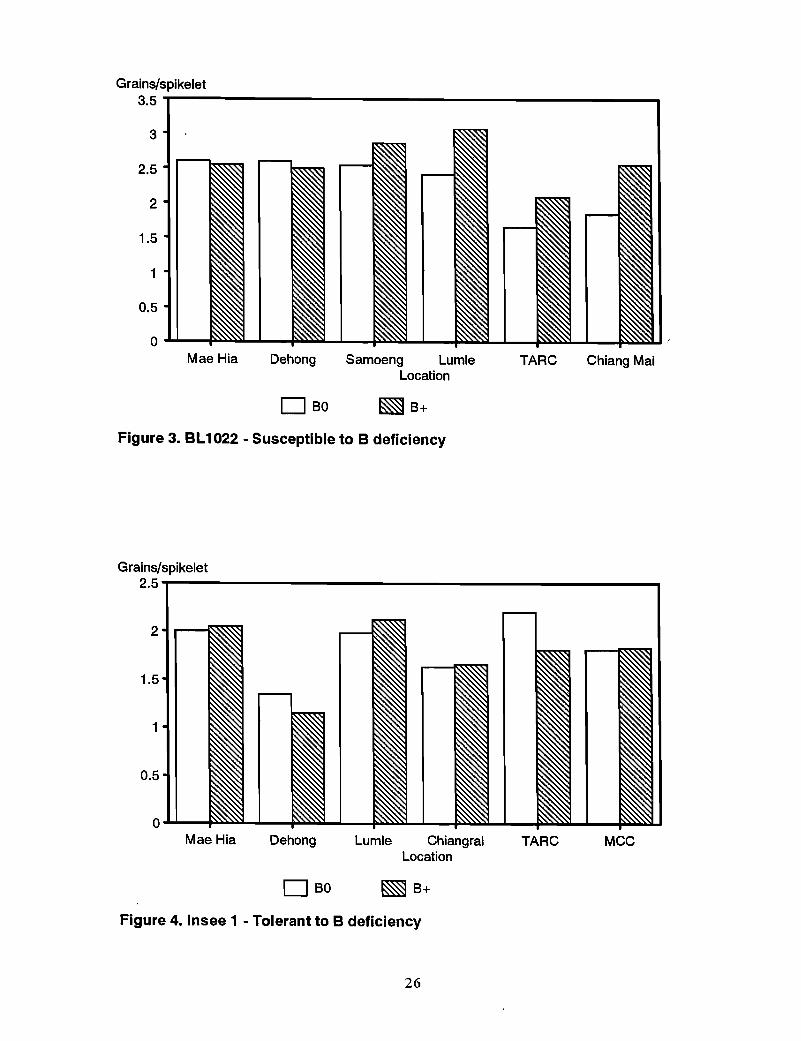
Susceptible genotypes-SW41 (Bds) responded to B application in all of the remainingsix sites, with B application increasing grain set (grains/spikelet) 16% at Samoeng to139% at Chiang Rai (Figure 2). BLI022 (Bds), which was tested at fewer sites, showed asimilar but less marked response to B (Figure 3).
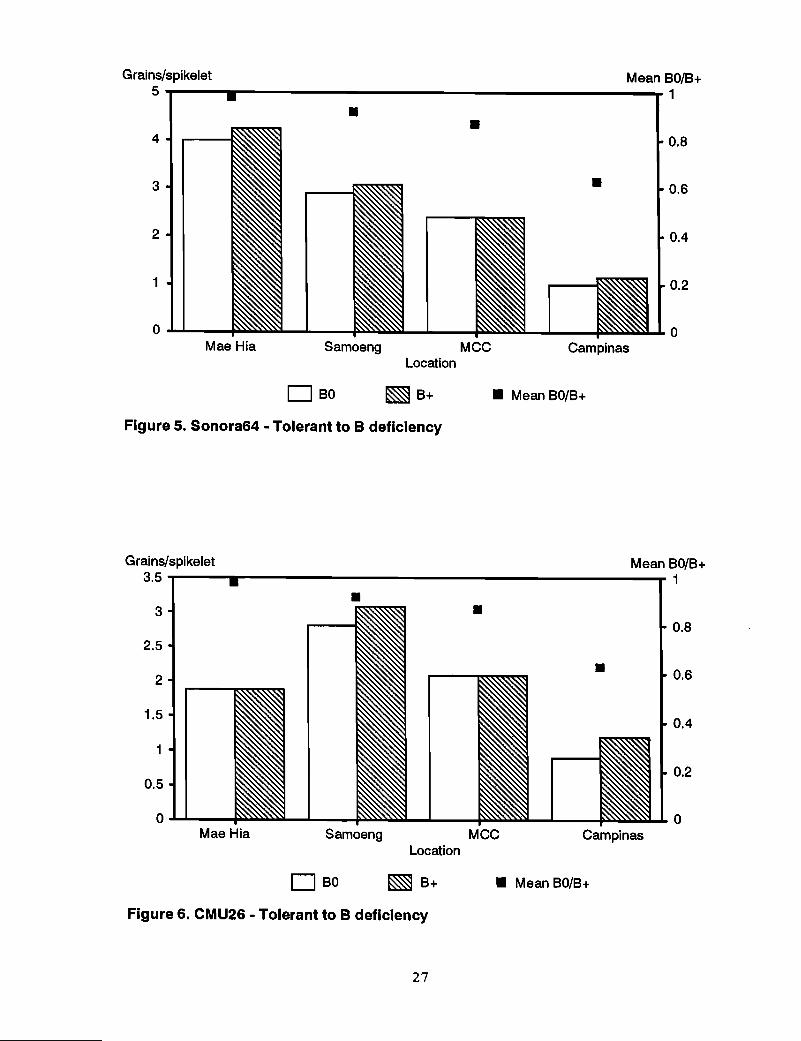
Tolerant genotypes~n contrast to the sensitive genotypes, Insee 1, Sonora 64, andCMU26, previously identified as tolerant to B deficiency, showed no response to B at allat the sites where they were tested (Figures 4-6). Mean relative grain set in BO/B+ overall sites was 0.90, 0.94, and 1.03 for CMU26, Sonora 64, and Insee 1, respectively.
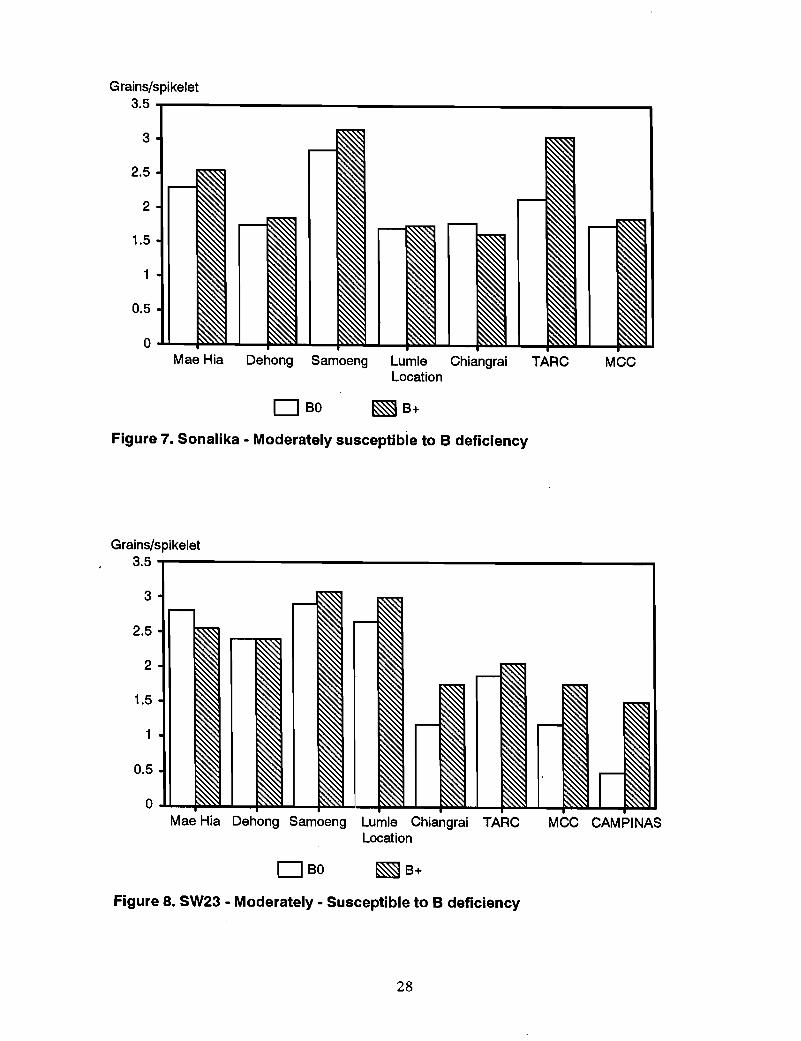
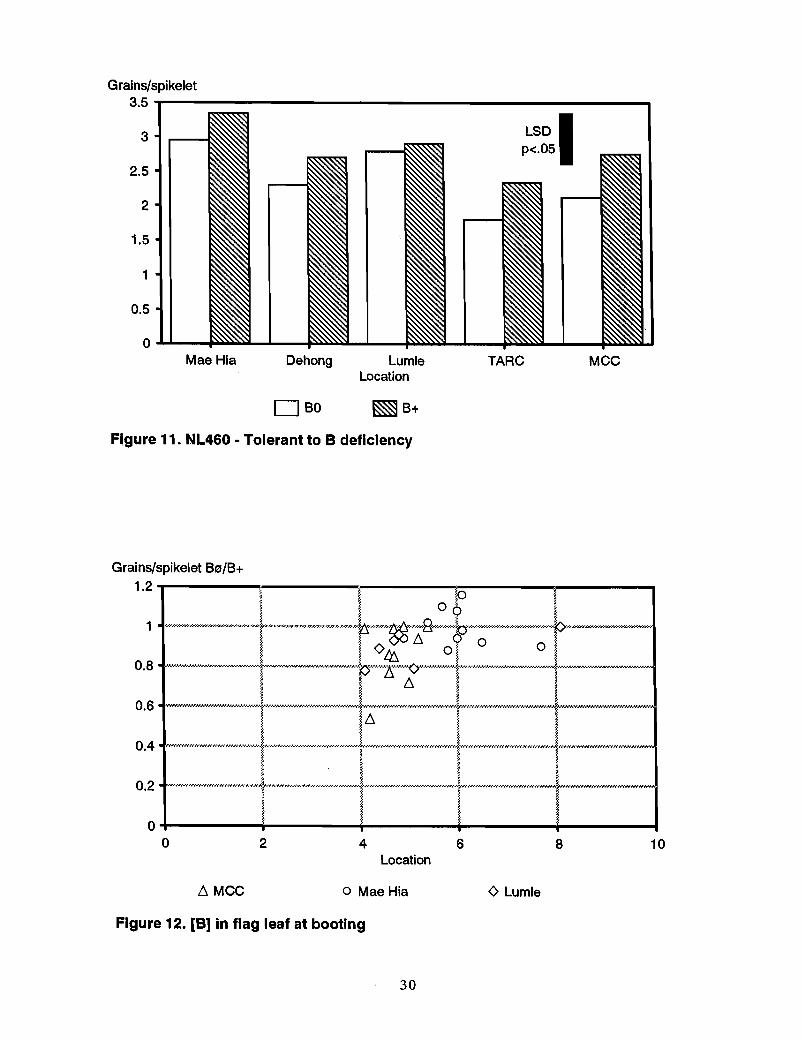
Other genotypes-Responses to B in moderately susceptible genotypes Sonalika, SW23,and Kanchan were somewhat variable (Figures 7-9). Sonalika showed a marked responseto B applicati90 only at TARC. SW23 responded at Campinas and slightly at MCC andChiang Rai. The response of Kanchan was also slight at MCC and Campinas. Theresponse of CMU285, previously defined as susceptible, was also slight at MCC andCampinas (Figure 10), whereas the "tolerant" NL460 showed a response to B at TARCand MCC (Figure 11).
22
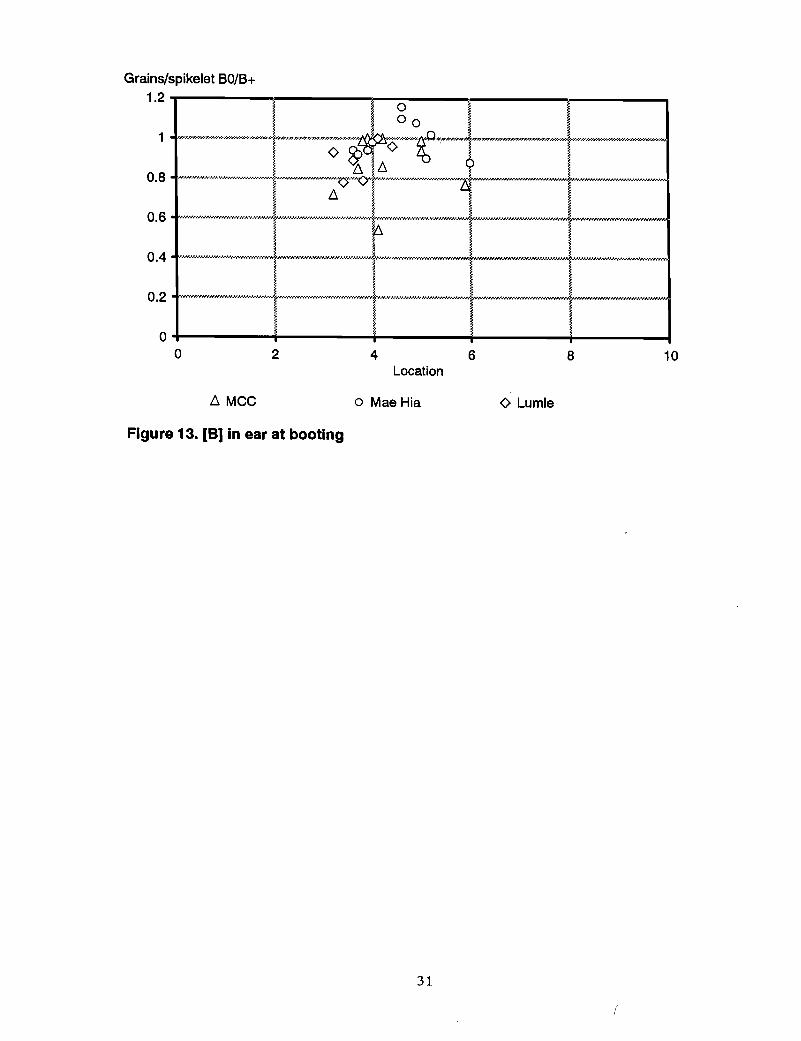
Boron concentrations in plantsIn general, B application led to an increase in B concentration in the parts of the wheatplant that were sampled and analyzed (Table 2). Relationships between tissue Bconcentrations and response to B in terms of grain set, however, were unclear (Figures 12and 13). In BO, B concentration in the flag leaf and ear at booting did not differsignificantly between responsive and nonresponsive genotypes (e.g., SW41 and Insee 1).Often there was no correlation between tissue B concentration and grain set between BOand B+. This raises a critical question about the use of tissue B analysis to predict grainset failure in wheat.
Acknowledgments
The author thanks the following collaborating scientists: Mr. Yu Ya Xiong, AgriculturalResearch Institute of Dehong Prefecture, Yunnan Province, China; Ms. Sutira Moolsri,Samoeng Experiment Station for Upland Rice and Temperate Cereals, Chiang Mai,Thailand; Mr. S.L. Chaudhry, Tarahara Agricultural Research Centre, Sansari, Nepal andthe Lumle Regional Agricultural Research Centre, Lumle, Nepal; Mr. SompongBhupuang, Chiang Rai Horticultural Research Centre, Chiang Rai, Thailand; Mr. JoseGuilherme De Freitas, Coordenadoria da Pesquisa Agropecuaria, Campinas, Sao Paulo,Brazil.
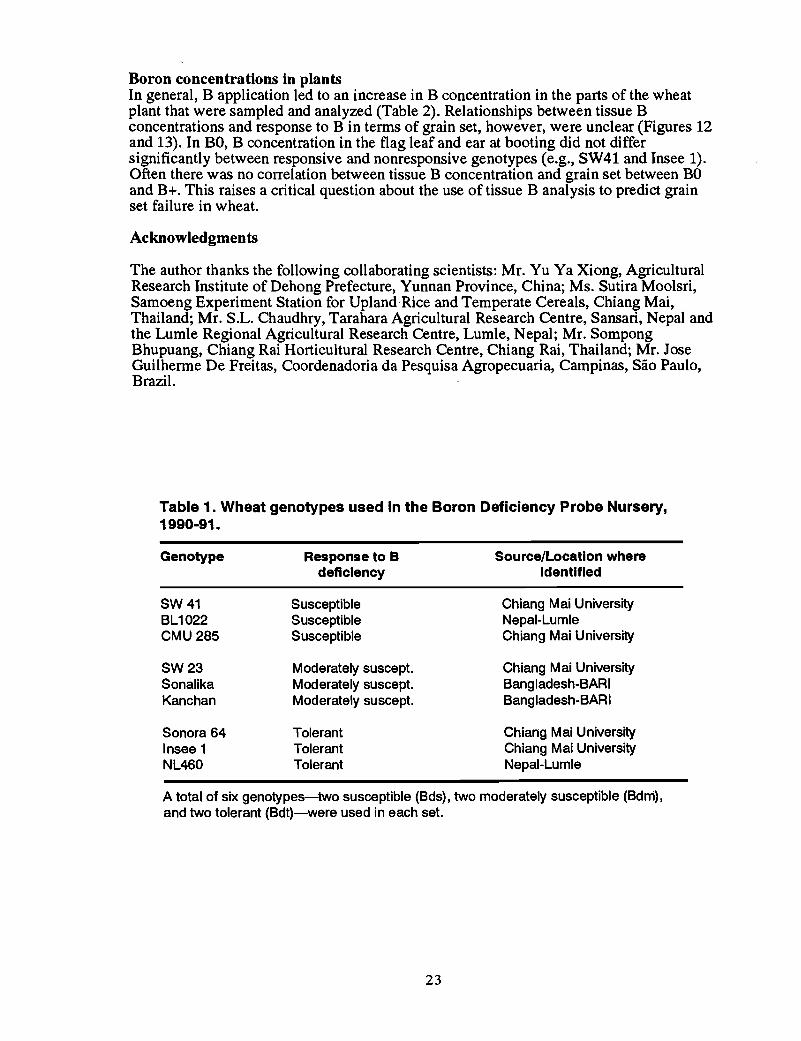
Table 1. Wheat genotypes used in the Boron Deficiency Probe Nursery,1990-91.
Genotype Response to B Source/Location wheredeficiency Identified
SW41 Susceptible Chiang Mai UniversityBL1022 Susceptible Nepal-LumleCMU 285 Susceptible Chiang Mai University
SW23 Moderately suscept. Chiang Mai UniversitySomilika Moderately suscept. Bangladesh-BARIKanchan Moderately suscept. Bangladesh-BARI
Sonora 64 Tolerant Chiang Mai UniversityInsee 1 Tolerant Chiang Mai UniversityNL460 Tolerant Nepal-Lumle
A total of six genotypes-two susceptible (Bds) , two moderately susceptible (Bdm),and two tolerant (Bdt)-were used in each set.
23
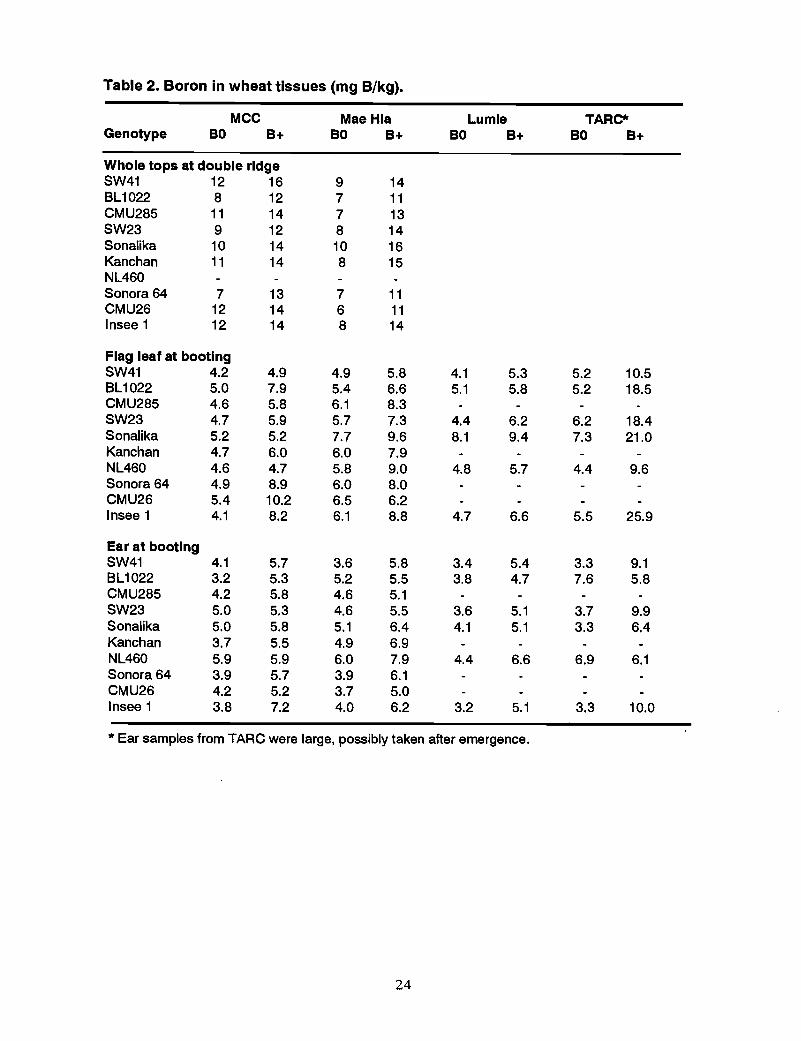
Table 2. Boron in wheat tissues (mg B/kg).
MCC Mae Hla Lumle TARC*Genotype BO B+ BO B+ BO B+ BO B+
Whole tops at double ridgeSW41 12 16 9 14BL1022 8 12 7 11CMU285 11 14 7 13SW23 9 12 8 14Sonalika 10 14 10 16Kanchan 11 14 8 15NL460Sonora 64 7 13 7 11CMU26 12 14 6 11Insee 1 12 14 8 14
Flag leaf at bootingSW41 4.2 4.9 4.9 5.8 4.1 5.3 5.2 10.5BL1022 5.0 7.9 5.4 6.6 5.1 5.8 5.2 18.5CMU285 4.6 5.8 6.1 8.3SW23 4.7 5.9 5.7 7.3 4.4 6.2 6.2 18.4Sonalika 5.2 5.2 7.7 9.6 8.1 9.4 7.3 21.0Kanchan 4.7 6.0 6.0 7.9NL460 4.6 4.7 5.8 9.0 4.8 5.7 4.4 9.6Sonora 64 4.9 8.9 6.0 8.0CMU26 5.4 10.2 6.5 6.2Insee 1 4.1 8.2 6.1 8.8 4.7 6.6 5.5 25.9
Ear at bootingSW41 4.1 5.7 3.6 5.8 3.4 5.4 3.3 9.1BL1022 3.2 5.3 5.2 5.5 3.8 4.7 7.6 5.8CMU285 4.2 5.8 4.6 5.1SW23 5.0 5.3 4.6 5.5 3.6 5.1 3.7 9.9Sonalika 5.0 5.8 5.1 6.4 4.1 5.1 3.3 6.4Kanchan 3.7 5.5 4.9 6.9NL460 5.9 5.9 6.0 7.9 4.4 6.6 6.9 6.1Sonora 64 3.9 5.7 3.9 6.1CMU26 4.2 5.2 3.7 5.0Insee 1 3.8 7.2 4.0 6.2 3.2 5.1 3.3 10.0
* Ear samples from TARC were large, possibly taken after emergence.
24
Mean BO/B+
I~1
• ~ 0.9
•• •• 0.8
'" 0.7
• 0.6
0.5. . . .Mae Hia Dehong Samoeng Lumle Chiangrai TARC MCC CAMPINAS
Location
• Mean BO/B+
Figure 1. Mean response to B, Grains/spikelet, all genotypes
Grains/spikelet
3.5 'T"""-------------------------.,3
2.5
2
1.5
1
0.5
Mae Hia Dehong Samoeng Lumle Chiangrai TARCLocation
LSDp<.osl
MCC CAMPINAS
DBO ~B+
Figure 2. SW41 - Susceptible to B deficiency
. 25
Grains/spikelet3.5 ----------------------------
3
2.52
1.5
1
0.5
o ........--P
Mae Hia Dehong
DBO
Samoeng LumleLocation
~B+
TARC Chiang Mai
Figure 3. BL1022 - Susceptible to B deficiency
Grains/spikelet2.5-r-------------------------.....,
2
1.5
1
0.5
0 ........-Mae Hia Dehong
DBO
Lumle ChiangraiLocation
~B+
TARC MCC
Figure 4. Insee 1 - Tolerant to B deficiency
26
Grains/spikelet Mean 80/8+5.,....--__-----------------------...1•
o
0.4
0.2
0.8
0.6
0..&...1---
2
1
3
4
Mae Hia Samoeng MCCLocation
Campinas
D80 ~8+ • Mean 80/8+
Figure 5. Sonora64 • Tolerant to B deficiency
o
0.4
0.2
0.8
0.6
Mean 80/8+1
••
O~---
2
1
3
0.5
1.5
2.5
Grains/spikelet3.5
Mae Hia SamoengLocation
MCC Campinas
D80 ~ 8+ • Mean 80/8+
Figure 6. CMU26 • Tolerant to B deficiency
27
Grains/spikelet
3.5 .,....------------------------.....,
3
2.5
2
1.5
1
0.5
oMae Hia Dehong Samoeng Lumle Chiangrai TARC MCC
Location
DBO ~B+
Figure 7. Sonalika - Moderately susceptible to B deficiency
Grains/spikelet3.5 -r---------------------------.
3
2.5
2
1.5
1
0.5
oMae Hia Dehong Samoeng Lumle Chiangrai TARC
LocationMCC CAMPINAS
DBO ~B+
Figure 8. SW23 - Moderately - Susceptible to B deficiency
28
Mean BO/B+1
•0.8
0.6
0.4
0.2
00..a....L--~
1
2
0.5
1.5
2.5
Grains/spikelet3.,...---.------------------------...
Mae Hia Samoeng MCCLocation
Campinas
DBO ~B+ • Mean BO/B+
Figure 9. Kanchan • Moderately susceptible to B deficiency
Grains/spikelet3.,...--------------------------.2.5
2
1.5
1
0.5
O~""---
Mae Hia SamoengLocation
MCC Campinas
DBO ~B+
Figure 10. CMU285 • Susceptible to B deficiency
29
Grains/spikelet3.5
3
2.5
2
1.5
1
0.5
oMae Hia Dehong
DBO
LumleLocation
~B+
LSD Ip<.05
TARC MCC
Flgure 11. NL460 • Tolerant to 8 deficiency
o
6 MCC
2 4Location
o Mae Hia
6 8
o Lumle
10
Figure 12. [8] in flag leaf at booting
30
108642oo
1
Grains/spikelet 80/8+
1.2
Location
t::. MCC o Mae Hia <> Lumle
Figure 13. [B) in ear at booting
31
/
TECHNIQUES TO STUDY THE ANTHER IN WHEAT
C.H. Chengl, I.A. McComb2, and B. RerkasemllFaculty of AgricultureChiang MaiUniversityChiang Mai, Thailand
andSchool of Biological Environmental Science
2Murdoch UniversityMurdoch, Western Australia
AbstractThis paper briefly descibes techniques with which to study the anther in the wheat plantincluding measurement of anther length, amount of pollen to use, and pollen reaction toiodine. Aspects of in vitro germination including pollen collection, the proper medium,and scoring are also discussed.
Measurement ofAnther Length
The anther is collected before pollen shedding and put on grid paper (1 mm2) andmeasured under the microscope at 35x magnification.
Pollen Amount and Pollen Reaction to Iodine
An anther is taken before pollen dehiscence and split in 1 ml KIII2solution under themicroscope. A drop (1/20 ml) of pollen suspension is placed upon the grid paper. Pollenis observed under the microscope at 35x magnification and counted in 10 drops of pollensuspension. Thus, the total number of pollen grains in a 1 ml-suspension is equal to theaverage number in 10 drops multiplied by 20.
Pollen that turns dark in the KIII2solution is classified as stained (designating a starchdeposit). Pollen that remains transparent is dead.
In Vitro Germination
Pollen collectionFor pollen studies, collection in a viable condition is a primary requirement. Pollen: isshaken directly into dishes of agar medium as soon as possible after the anthers areextruded from glumes.
Medium.A medium, containing 0.7% agar with 0.75 raffinose, 100 mg/L H
3B0
3, and 300 mg/L
CaCl2.02, is prepared using distilled water and agar dissolved by boiling briefly in amicrowave oven. Approximately 4 ml of medium are poured into a 5-cm diameter plasticpetri dished. The medium is stored at 25°C until use. If the medium is to be stored forlonger than 12 hours, nonsterile dishes could be used. After sowing with pollen, opendishes are placed on moist filter paper in a tray covered with plastic film, at 25°C.
ScoringPollen, observed under the microscope at 100x magnification, is recorded as germinatedif the pollen tube is longer than half the diameter of the grain. Burst pollen is also scored.Make note of the occurrence of double pollen tubes. In calculating the germinationpercentage, the germinated grains are taken as a percentage of the total of: grainsgerminated, grains intact but ungerminated, and burst grains. Pollen grains in threerandomly chosen fields are scored in each of five sectors on each plate.
32
The lengths of the pollen tubes are recorded after drawing germinated pollen fromrandomly selected fields (to a total of 30 tubes for each treatment, or time), using anOlympus drawing apparatus (BH 2-DA). Tube length is then calculated by using a pieceof damp cotton thread to measure the drawing and the length calculated from themeasured value.
33
BORON DEFICIENCY IN NEPAL
T.B. Khatri-Chhetri and S.K. GhimireInstitute of Agriculture and Animal Science
Tribhvan University, Nepal
Abstract
After reviewing briefly the presence of B in the soil and its role in plants, this paperreviews work done on plant available B in the soils of Nepal. Nepalese farmers cultivatetheir land very intensively and grow two or three crops a year from the same piece ofland and harvest everything above ground. Very little residue is left to go back to thesoil. Results of such practices are showing up in patches in many parts of Nepal wherestunted plant growth with reduced yields have been frequent even with an adequatesupply of N, P, and K fertilizers. Visible symptoms of nutrient deficiencies are beingobserved in Nepal. Deficiencies of Boron (B), Mo, and Mg are suspected in maize.Similarly, the deficiencies of Band Mo in cauliflower have been observed.
Introduction
Boron is one of the seven micronutrients established as essential for the nutrition ofhigher plants. It is required in a relatively small quantity for normal growth. Agulhon(1910) was the first scientist to show a yield-increasing effect of B on wheat, oats, andradish. Subsequently, Maaze (1919), Warrington (1923), Sommer and Lipman (1926),and Sommer (1927) conclusively established the essentiality of B in higher plants. Sincethen, B has received considerable attention from concerned scientists.
Role of Boron in Plants
Some of the important roles of B in the growth and development of plants have beenreported to include:
• Proper pollination of fruits or seed set (Berger et al. 1957, Johnson and Wear1967, Vaughan 1977, Ganguly 1979, Garg et al. 1979).
• New cell development and differentiation in meristematic tissues (Lachance andQuellette 1954, Odhnoff 1957, Robertson and Loughman 1974, Cohen andLeeper 1977).
• Regulation of carbohydrate metabolism and translocation of sugars, starch,nitrogen, and phosphate (Backenback 1944, Mcllarath and Palser 1956, Sisler etal. 1956, Dugger and Humphreys 1960, Stiles 1961, Weiser et al. 1964, Lee andAronoff 1967, Amberger 1975, Biranbaum et al. 1977, Gupta and MacLeod1977, Pollards et al. 1977).
• Synthesis of amino acids, proteins, phyto-hormones and nucleic acids (Coke andWillington 1968, Price et al. 1972, Crisp et al. 1976; Bohnsack and Albert, 1977).
• Maintenance of correct water relationship within plants (Stiles 1961, Tisdaleand Nelson 1975).
• Nodule formation in legumes (Turner 1980).
34
Boron in the Soil
The B content of the earth's crust is 10 ppm (Goldschmidt, according to Mitchell 1964).Sedimentary rocks, especially of marine origin, are richer in B than igneous rocks. Inmetamorphic rocks, B is incorporated in the mineral tourmaline (3 to 4% B), which isvery resistant to weathering so that the B is not readily available. Major sources of Barefound in continental basins of volcanic and post-volCanic activities. Boron compoundsare present in bore-holes of petroleum fields and also in the ash of many coal deposits.Soils developed under drier environments contain in general high to toxic levels of B.
Boron is present in all the soil types of the world, and the total content ranges from 2 to100 ppm with an average of 30 to 40 ppm (Whetstone at al. 1942, Swaine 1955, Mitchell1964, Bradford 1966, Sauchelli 1969, Chapman 1971, Kraukopf 1972, Sillanpaa 1972).Aubert and Pinta (1977) reported a total B content of surface soil as low as 1 to 2 ppm(in podzol soils of Bictorussia) to as high as 250 to 270 ppm (in eutropeaty soils ofIsrael), with an average of about 20 to 50 ppm.
Only a small portion of total B (generally less than 5%) has been reported to be available(Berger 1965, Bowen 1977, Gupta 1979). The contribution of organic matter to the totalB content of the soil ranges from 10% in soils with low organic matter to 100% of thetotal B found in peat soils (Berger 1965). The distribution of B in different horizons ofthe soil profile follows that of humus, being highest at the surface then decreasing in thezone of eluviation to a level equal to or lower than that in the parent material(Woodbridge 1940, Whetstone et al. 1942, Kanwar and Singh 1961, Miljkovic et al.1966, Paliwal and Mehta 1973, Robertson et al. 1975, 1976, Aubert and Pinta 1977). Inpoorly drained soils, concentrations of soluble B have been observed in the lowerhorizons (Butler 1954).
Boron in solid soilIn chemical combination, three main forms ofB are recognized (Fleming 1980): 1) B insilicate structures, 2) B associated with clay minerals and sesquioxides (adsorbed B), and3) organically combined B.
Boron may enter silicate structures by substitution for AP+ and/or Si4+ions. Research hasdemonstrated that illite or hydrous mica is the dominant silicate mineral fixing B (Parksand White 1952, Scharrer et al. 1956, Harder 1961, Hingston 1964, Fleet 1965, Hatcheret al. 1967, Couch and Grim 1968, Griffin and Burau 1974). Two mechanisms of Bretention by illite are proposed (Couch and Grim 1968) and consist of an initial rapidchemical adsorption of the tetrahedral B(OH)-4 anion in the frayed edge sites of illiteflakes, followed by slow diffusion into tetrahedral sites in the crystal. Possibilities ofsuch substitutions by dissolution studies (Goldburg and Arhenmian 1958, according toCouch and Grim 1968) and a fit of B in the tetrahedral part of a mica-type structure bysynthesis (Engster and Wright 1960; Stubican and Roy 1962, according to Couch andGrim 1968) have been demonstrated. Of the known borosilicate minerals, only thosebelonging to the tourmaline group appear to be of any significance in agriculture.
The broken Si-O and AI-O bonds at edges of alumino-silicate minerals, amorphoushydroxide structures, magnesium hydroxide clusters, and iron and aluminum oxy- andhydroxy-compounds have been recognized as B-adsorption sites in soils (Fleming 1980).Descriptions of the B adsorption mechanism on these sites are found elsewhere (Scharreret al. 1956, Hatcher et al. 1967, Sims and Bingham 1968a,b, Rhodes et al. 1970,Colembera etal. 1971, Greenland 1971, Bingham and Page 1971, Bingham et al. 1971,McPhail et al. 1972, Langdon et al. 1973, Schalscha et al. 1973, EI-Damaty et al. 1974,Griffin a,nd Burau 1974, Metwally et al. 1974, Perrott et al. 1974a,b, Huang 1975).
35
Most of the available B is held in the organic fraction of soil and is recycled asdecomposition proceeds. Increase in organic matter content generally increases availableB as pH is raised (Berger and Troug 1939, Olson and Berger 1946). Increased Bretention with increased organic matter was reported (Midgley and Dunklee 1940,Hatcher et al. 1967, Gupta 1968, Basar and Lodha 1971, Singh 1971, Paliwal and Mehta1973, John et al. 1977). Complex formation with dihydroxy compounds in soil organicmatter is an important mechanism for B retention (Parks and White 1952). Boric acid isalso held by humic colloids in soils since carboxylic acid can condense with boric acid(Russell 1973). Boron is also capable of reacting with sugars and in microbial breakdownof soil polysacchrides to simpler sugars, the generation of diol-type structures suitable forB combination can be envisaged (Fleming 1980).
Boron in soil solutionUndissociated boric acid, H3B03, is the predominant species in the soil solution and isindependent of the normal pH effect. The dissociated anion form, B(OH)-4, is pHdependent and is predominant only at a pH of 9.2 or above. Boric acid is the form inwhich B is used by plants (Tisdale and Nelson 1975). The concentration of B in solutionis of great agronomic importance because plant responses are influenced only by it andnot directly by the presence of adsorbed B (Hatcher et al. 1959). However, adequateabsorbed B is necessary to maintain solution B at a concentration high enough to satisfyplant requirements throughout the growing season.
Factors Affecting Boron Availability
Apart from the solid forms of B in soils, other factors affecting the availability of B toplants are: mineral supply, pH and liming, soil moisture, soil texture, leaching, lightintensity, etc.
Availability and uptake of native and added B by plants is generally lower in calcareousthan in non-calcareous soils. B adsorption has been shown to be independent of pHbelow neutrality, but it increases rapidly as the system is made alkaline (Midgley andDunklee 1940, Wolf 1940, Berger and Truog 1945, Olson and Berger 1946, Mathur et al.1964). Publications showing negative correlations between B uptake and soil pH haveaccumulated (Gupta 1972b, Bartlett and Picarelli 1973, Bennett and Mathia 1973).Liming strongly acid soils reduces the B concentration in the aerial part of several crops(Gupta 1968, 1972, Gupta and Cutcliffe 1972, Gupta and MacLeod 1977). Formation ofpolymerizable Ca-metaborate in soils following liming has been suggested as the causeof reduced B uptake by plants (Colwell and Cummings 1944). Another explanation isthat the reaction between exchangeable AI and lime [2AIX3+ 3CaC03+ 3H 0 =2AI(OH)3 + 3CaX
2], where X =exchange site, produces AL(OH)3' and this freshly
precipitated AI(OH)3 adsorbs B from the soil solution (Fleming 1980).
Boron availability is strongly affected by the moisture content of the soil, and itsavailability decreases under dry conditions. This might be related to the rate ofdecomposition of organic matter and to the rate of root proliferation in the soil whichwill generally be reduced under extremely dry conditions (Tisdale and Nelson 1975).Another explanation would appear to lie in the plant'sinability to absorb B from soilduring drought due to reduced mass flow and diffusion rates and consequently affectingtranspiration flow in plants as well. Plants require a constant small supply of B because itis not translocated in the plants. Drought induced B deficiency is temporary in nature andis alleviated as soon as an adequate amount of water is supplied to the soil.
In the coarse-textured soils of the humid regions, the leaching loss of B is high (Kubotaet al. 1947, Wilson et al. 1951, Quellette 1958). Therefore, sandy soils contain lessavailable B than fine-textured soils, and B deficiency is more common in these soils.
36
Crop removal is still another and very important factor affecting B availability in soils,especially under conditions where crop residues are not returned to the soil. Alfalfa hayremoved the equivalent of almost 1 kg of borax (11 % B) per ton of hay when grown insoils that were adequately supplied with the element (Revee et al. 1944).
Efforts to isolate the effects of anyone of the soil factors on B availability would not bean easy job. Of the numerous, certain ones are more dominant. Others might be lessimportant, but the understanding of each of them is a prerequisite for any meaningfulinterpretation of soil analysis for B. The soils likely to be deficient in B, in general, are(Bradford 1966):
• Soils naturally low in B, such as those derived from igneous rocks or from freshwater sedimentary deposits.
• Naturally-acidic soils from which much of the original B content has beenremoved by leaching.
• Light-colored, sandy soils.
• Alkaline soils, especially those containing free lime.
• Irrigated soils where the content of B in the irrigation water is low and wheresalt or carbonate deposition has occurred.
• Soils low in organic matter.
Boron may be applied to the soil in irrigation water, municipal compost, and fly-ash as asoil amendment and as fertilizer and a herbicide when borax is used in large quantities.Depending upon the situation and the nature and properties of the soil receiving them, theadded B has a great agronomic significance both from correcting B deficiency andpreventing toxicity. It is very important for agronomists and soil scientists to understandthe B needs of plants as too much of it in some plants may be as harmful as too little inothers. The ratio of a toxic to adequate level is narrower for B than for any other element(Fleming 1980).
Assessment of Boron Availability
Tissue analysisAdequacy of fertilizer is frequently determined and evaluated through plant analysis.Scientists have worked out and established the "critical concentration" of nutrient levelsin plants and some plant parts, below which the growth or crop yield is restricted orreduced (Ulrich and Hill 1967). Critical levels for specific crops have been publishedelsewhere (Bradford 1966, Junes 1967, Melsted et al. 1969, Gupta 1979). Borondeficiency in a variety of plants is characterized by levels less than 15 to 20 ppm.Adequate but not excessive levels are commonly between 25 to 100 ppm. Amounts over200 ppm are often associated with symptoms of B excess (Bradford 1966). The criticallevel of B in maize earleafs at silking is 5 ppm (Jones 1967).
Soil analysisResearchers have tested many methods of extraction and determination of plant availableB in soils. The extracting solutions used have ranged from water to weak acids, saltsolutions, organic complexing agents, and many combinations of acids and salts. Areview of the methods developed revealed that the superiority of anyone method overanother has been a subject of controversy. It is also evident that the hot water extraction
37
procedure is the most widely used for routine analysis of available B in laboratories inmany countries. This method is also used as standard by which other methods arecompared. A good insight into the development and use of soil tests for plant available Bin soil can be found in Reisenauer et al. (1973), Farrar (1975), Gupta (1979), and Guptaet al. (1985). The B extracted mostly correlates well with that available to crops aremeasured by plant uptake. The tests must also be able to differentiate between B deficientsoils, those with an adequate supp'ly and those in which B may be excessive. Agroclimatic conditions, levels of other nutrients, especially calcium and magnesium and theircarbonates in soil, pH, organic matter, texture, and soil moisture all affect the uptake ofB by plants. Prediction of B uptake has been improved greatly by inclusion of some ofthese parameters in regression equations (Stinson 1953, Wear and Patterson 1962,Mi.ljkovic et al. 1966a,b, Martens 1968).
Boron Deficiency Problems in Nepal
The Institute of Agriculture and Animal Science is located in the Chitwan district, whichis one of the 75 administrative districts of Nepal. It is situated at the southwestern comerof the Central Development Region, between longitudes 83°55' to 85°351 East andlatitudes 27°21' to 27°461 North and covers an area of 2,510 km2• About three-fourths ofthe total area of the Chitwan District is flat to almost flat plain. The average altitude ofthe valley is about 244 masl. Figure 1 is a map of Nepal showing the location of theInstitute of Agriculture and Animal Science (IAAS) in the Chitwan District in relation toKathmandu, the capital of Nepal.
The climate of the valley is a subtropical monsoon type with hot, humid summers andcold, dry winters. Over 75% of the annual rainfall (average annual rainfall = 2000 mm)falls during summer (June through September). The remaining rainfall is erratic withrespect to time and amount. Heavy dews are characteristics of the valley, especially inthe winter months, and this supplies a significant part of the moisture requirement of thewinter crops. Average monthly temperatures and rainfall recorded at Rampur are given inFigure 2.
The main crops grown in the valley include rice, maize, mustard and wheat. Other cropsare also grown but on a small scale. Rice followed by wheat or spring maize is thecommon rotation in the lowlands. Some farmers grow double crops of rice. In theuplands, maize-mustard is the most favored rotation. Maize after maize is also popular.Seasonal vegetables are grown on a small scale. Pineapples, guava, banana, mango, andlichi plantations are also common in this valley.
In modern agriculture, high productivity per unit area is the aim. This requires not onlyadditional amounts of N, P, and K but also more secondary nutrients (Ca, Mg, and S) aswell as more micronutrients (B, Cu, CI, Fe, Mn, Mo, and Zn).
In Nepal, fanners cultivate their land very intensively and grow two or three crops a yearfrom the same piece of land and harvest everything above ground. Very little residue isleft to go back to the soil. Application of farmyard manure (FYM) and compost is limitedto small farms and to little areas of large farms. Results of such a practice are showing upin patches in many parts of Nepal where stunted plant growth with reduced yields havebeen frequent even with an adequate supply of N, P, and K fertilizers. Visible symptomsof nutrient deficiencies are observed every here and the~re in Nepal. Zinc deficiency inmaize and rice, and possibly Sin dhaincha (Sesbania aculeata) were observed in theIAAS-fann and Chitwan Valley. Deficiencies of B, Mo, and Mg were also suspected inmaize. Similarly, the deficiencies of Band Mo in cauliflower were observed. A review ofthe work done on plant available B in the soils of Nepal follows.
38
Survey of plant available B in soils and plants .Khatri-Chhetri and Schulte (1984) surveyed the nutrient supplying capacity of the soilsof the Chitwan Valley. The chemical analyses of the soil samples are presented inhistograms of the frequency distributions of the nutrient elements in soils (Figure 3). Asummary of soil analysis data and the available nutrient status of soils are presented inTables 1 and 2.
All soils tested were very low to low in available B and nearly the same occurred to theirZn status. A summary of the analysis of plant samples and the proportion of samples inwhich the nutrient content is falling below the critical level of different nutrients aregiven in Tables 3 and 4.
In the interpretation of plant analysis data, the concept of critical plant nutrientcomposition values is employed.
• Of the 32 rice samples analyzed, 94% of the samples wee below the criticallevel for N, 59% for Band 22% for Zn.
• 95% of the maize samples analyzed contained B below the critical level.
• Cauliflower has a high B requirement (Vitosh et al. 1973), and both samplesanalyzed were below the critical level.
• If the critical level of nutrients for cauliflower is used for mustard as well, 100%of the samples analyzed fall below critical level in B content.
It can be concluded that Boron is the most limiting element in crop production in theChitwan Valley.
Responses of Different Crops to Boron Deficiency
In the case of micro-nutrients that are required in relatively small quantities, it might bemore practical to consider yields in terms of economic responses. If the increment inyield due to borated fertilizer and its value exceeds the cost of B fertilizer, application ofB might be justifiable. Some experiments summarized below conducted on cauliflower,mustard, and maize and illustrate this conclusion.
Field experiments on cauliflower with added BThe results are in Tables 5-9. It is apparent that 10 kg/ha of borax is sufficient to correctB deficiency. The yield increase due to added B is significantly greater than that fromcontrol (Le., 0 B added).
The tissue B concentration of the control plot that the plants were deficient in B «10ppm). The addition of B increased the tissue B concentration significantly in B addedplots with the B concentration being more than seven-fold (control vs. 60 kg/ha borax).
It can be concluded that boron and magnesium are the most limiting nutrients for theproduction of cauliflower in the soils of the Chitwan Valley.
Response of mustard to added BThe results are in Tables 10 and 11. Mustard yields tended to increase due to added B.An application of 20 kg/ha of borax increased yield by over 29%, but the increase wasnonsignificant at P = 0.05.
39
B concentration in leaf tissue samples increased as the rate of borax applicationincreased, e.g., more than tenfold after application of 25 kg/ha of borax. Leaf Bconcentration of less than 10 ppm is related to B deficiency. The highest B concentrationof 104 ppm was reported to show no visual symptom of abnormality. Boronconcentration as high as 100 ppm does not cause toxic effects in cole crops like broccoli,cauliflower, and brussels sprouts (Gupta 1979).
Field experiments on maize with added BThe results of one experiment in Table 12 indicated an increasing trend of grain yield ofmaize due t6 added B. However, it failed to demonstrate statistical significance overcontrol.
The results in two other experiments are in Tables 13-17. The application of B had apositive response at 60% of the locations, but the average increase in yield was notstatistically significant. There was a yield depression in 38% of the locations.
The tissue concentration of B was also deficient to marginal irrespective of the Btreatment. The addition of B increased the tissue B, but the increase was not sufficient inmost cases.
The availability of B under high rainfall in a coarse textured soil has been reported to bemost limiting due to leaching of B to below the root zone (Kubota et al. 1947, Quellette1958). The soils of the experimental sites were also reported to be coarse textured andthere was high rainfall during the cropping season.
References Cited
Agulhon, H. 1910. The use of boron as a catalytic fertilizer. Compl. rendu Acad. Sci.150:288-291.
Amberger, A. 1975. Protein synthesis and effect of plant nutrients on the process ofprotein formation. In pages 75-89, Fertilizer Use and Protein Production. Int. PotashInst., Berne.
Aubert, H., and M. Pinta. 1977. Trace elements in soils. Development in Soil Science7. Elsevier Scientific Publishing Co., New York. (Translated from French by L.Zeckerman and P. Segalen).
Backenback, J.R. 1944. Functional relationships between boron and various anions in thenutrition of tomato. Florida Agric. Exp. Stn. Bull. No. 395.
Baral, D., T.B. Khatri-Chhetri, and R. Adhikari. 1986. Assessment of the need ofsecondary and micro-nutrients for cauliflower in Rampur, Chitwan, Nepal. J. Inst. Agric.Anim. Sci. 7:21-30.
Bartlett, R.J., and c.J. Picarelli. 1973. Availability of boron and phosphorus as affectedby liming an acid potato soil. Soil Sci. 116:77-83.
Bennett; O.L., and E.L. Mathias. 1973. Growth and chemical composition of crownvetch as affected by lime, boron, soil source and temperature regime. Agron. J. 65:587591.
Berger, K.c. 1965. Introductory Soil Science. The Macmillan Co., New York.
40
Berger, K.C., and E. Troug. 1939. Boron determination in soils and plants. Ind. Eng.Echem. Anal. Ed. 11:540-544.
Berger, K.C., and E. Troug. 1945. Boron availability in relation to soil reaction andorganic matter content. Soil Sci. Soc. Am. Proc. 10:113-116.
Berger, K.C., T. Heikkinen, and E. Zube. 1957. Boron deficiency: a cause of blank stalksand barren ears in corn. Soil Sci. Soc. Am. Proc. 21:629-632.
Bingham, F.T., and A.L. Page. 1971. Specific character of boron adsorption by anamorphous soil. Soil Sci. Soc. Am. Proc. 35:892-893.
Bingham, F.T., A.L. Page, N.T. Coleman, and K. Flach. 1971. Boron adsorptioncharacteristics of selected amorphous soils from Mexico and Hawaii. Soil Sci. Soc. Am..Proc. 35 :546-550.
Biranbaum, E.H., W.M. Dugger, and B.C.A. Beasley. 1977. Interaction of boron withcomponents of nucleic acid metabolism in cotton ovules cultured in vitro. Plant Physiol.59:1034-1038.
Bohnsack, C.W., and L.S. Albert. 1977. Early effect of boron deficiency on indoleaceticacid oxidase levels of squash root tips. Plant Physiol. 59:1047-1050.
Bowen, J.E. 1977. The fine art of using enough, but not too much boron. Crops Soils29:12-14.
Bradford, G.R 1966. Boron. In pages 33-61, H.D. Chapman, ed., Diagnostic Criteria forPlants and Soils. Univ. of California.
Butler, J.R. 1954. Trace element distribution in some Lancashire soils. J. Soil Sci. 5:156166.
Chapman, H.D. 1971. Evaluation of the micronutrient status of soils. Int. Symp. SoilFert. Evaluation (India) Proc. 1:928-947.
Cohen, M.S., and R Leeper, Jr. 1977. Effect of boron on cell elongation and division insquash roots. Plant Physiol. 59:884-887.
Coke, L., and W.J. Willington. 1968. The role of boron in plant growth. IV.Interrelationships between indoleacetic acid in the metabolism of bean radicles. J. Exp.Bot. 19:295-308.
Colwell, W.R., and RW. Cummings. 1944. Chemical and biological studies on aqueoussolutions of boric acid and calcium, sodium and potassium metabolites. Soil Sci. 57:3749.
Couch, E.L., and RE. Grim. 1968. Boron fixation by illite. Clays Clay Miner. 16:249256.
Crisp, P., G.F. Collier, and T.H. Thomas. 1976. The effect of boron on tip burn andauxin activity in lettuce. Sci. Hort. 5:215-226.
Dugger, W.M., and T.E. Humphreys. 1960. Influence of boron on enzymatic reactionsassociated with biosynthesis of sucrose. Plant Physiol. 35:523-530.
41
EI-Damaty, A.H., A.I. Metwally, and M. Yousry. 1974. Boron retention of alluvial andcalcareous soils and clay minerals. Agrokemia Es Talatan 23:71-82.
Farrar, K. 1975. A review of extraction techniques used to determine available boron insoils. Agric. Dev. Advis. Servo Q. Rev. 19:93-100.
Fleet, M.E.L. 1965. Preliminary investigation into the sorption of boron by clayminerals. Clays Clay Miner 6:3-16.
Fleming, G.A. 1980. Essential micronutrients. I. Boron and molybdenum. In pages 155197, B.E. Davies, ed., Applied Trace Elements. John Wiley and Sons, New York.
Ganguly, B. 1979. Note on seedlessness in some wheat varieties caused by borondeficiency. Indian J. Agric. Sci. 5:384-386.
Garg, O.K., A.N. Shanna, and G.R.S.S. Kona. 1979. Effect of boron on the pollenvitality and yield of plants. Plant Soil 52:591-594.
Greenland, DJ. 1971. Interactions between himid and fulvic acid clays. Soil Sci. 111:3441.
Griffin, RA., and R.G. Burau. 1974. Kinetic and equilibrium studies of boron desorptionfrom soil. Soil Sci. Soc. Am. Proc. 38:892-897.
Gupta, V.C. 1968. Relationship of total and hot-water soluble boron and fixation ofadded boron to properties of podzol soils. Soil Sci. Plant Analysis 3:45-48.
Gupta, V.C. 1972. Effect of boron and lime on boron concentration and growth of foragelegumes under greenhouse conditions. Commun. Soil Sci. Am. Proc. 36:332-334.
Gupta, V.C. 1979. Boron nutrition of crops. Adv. Agron. 31:273-307.
Gupta, V.C., and J.A. Cutcliffe. 1972. Effect of lime and boron on brown-heart, leaftissue Ca/B ratio, and boron concentration of rutabaga, Soil Sci. Soc. Am. Proc. 26:936939.
Gupta, V.C., and J.A. MacLeod. 1977. Influence of Ca and Mg sources on boron uptakeand yield of rutabagas as related to soil pH. Soil Sci. 124:279-284.
Gupta, V.C., Y.W. Jame, C.A. Compbell, AJ. Layshon, and W. Nicholaichuk. 1985.Boron toxicity and deficiency. A Review. Can. J. Soil Sci. 65:381-409.
Harder, H. 1961. Incorporation of boron in detrital clay minerals. Experimentsexplaining the boron content of clay sediments. Geochim. Cosmochim. Acta 21:284-294(English summary).
Hatcher, J.T., G.Y. Blair, and CA. Bower. 1959. Response of beans to dissolved andadsorbed boron. Soil Sci. 88:98-100.
Hatcher, J.T., C.A. Bower, and M. Clark. 1967. Adsorption of boron by soils asinfluenced by hydroxy aluminum and surface area. Soil Sci. 104:422-426.
Hingston, F.J. 1964. Reaction between boron and clays. Aust. J. Soil Res. 2:83-95.
42
Huang, P.M. 1975. Retention of arsenic by hydroxy-aluminum on surfaces of micaceousmineral colloids. Soil Sci. Soc. Am. Proc. 39:271-274.
Johnson, W.C., and J.1. Wear. 1967. Effect of boron on white clover (Trifolium repensL.) seed production. Agron. J. 59:205-206
Jones, J.B., Jr. 1967. Interpretation of plant analysis for several agronomic crops. Inpages 49-58, Hardy et aI., eds., Soil Testing and Plant Analysis, Part II. Soil Sci. Soc.Am. Special Pub. No.2, Madison, Wis.
Kanwar, J.S., and S.S. Singh. 1961. Boron in normal and saline alkali soils of theirrigated areas of the Punjab. Soil Sci. 92:207-211.
Khatri-Chhetri, T.B., and A.B. Karki. 1979a. Effect of Borax on the yield of cauliflower.J. Inst. Agric. Anim. Sci. 2:1-10.
Khatri-Chhetri, T.B., and A.B. Karki. 1979b. Response of mustard to Borax. J. Inst.Agric. Anim. Sci. 2:25-29.
Khatri-Chhetri, T.B., A.B. Karki, and R.C. Prasad. 1979. Borax fertilization of maizeunder Rampur conditions. J. Inst. Agric. Anim. Sci. 2:21-23.
Khatri-Chhetri, T.B., and E.E. Schulte. 1984. An assessment of the secondary andmicronutrient status of selected soils and crops of the Chitwan Valley, Nepal. Nepal. J.Agric. 15:1-10.
Khatri-Chhetri, T.B., and E.E. Schulte. 1985a. Response of maize to the application ofsecondary and micronutrients in the soils of the Chitwan Valley, Nepal I. Results of thelAAS and NMDP Farm. Nep. J. Agric. 16:48-56.
Khatri-Chhetri, T.B., and E.E. Schulte. 1985b. Response of maize to the application ofsecondary and micronutrients in the soils of the Chitwan Valley Nepal. II. Result ofmultilocation trials. J. Inst. Agric. Anim. Sci. 6:59-75.
Kubota, J., K.C. Berger, and E. Truog. 1947~ Boron movement in soils. Soil Sci. Soc.Am. Proc. 13:130-134.
Lachance, R.O., and G.J. Quellette. 1954. Pathological histology of boron deficientalfalfa stems and leaves as an aid in diagnosing alfalfa yellows. Can. J. Agric. Sci.34:488-493.
Langdon, A.G., K.W. Perott, and A.T. Wilson. 1973. Iron (III) enhanced phosphate andsulphate adsorption at the 001 face of mica. J. Colloid. Interface Sci. 44:486-494.
Lee, S.G., and S. Arnoff. 1967. Boron in plants: A biochemical role. Science 158:798799.
Martens, D.C. 1968. Plant availability of extractable boron, copper, and zinc as related toselected soil properties. Soil Sci. 106:23-28.
Mathur, C.M., V.M. Moghe, and N.R. Talati. 1964. Distribution of boron in soils ofRajasthan irrigated with high boron waters. J. Indian Soc. SoilSci. 12:319-324.
Maaze, P. 1919. Recherche d'un solution purement minerale capable d'assurerl'evolution complete du mais cultive a labri des microbes. Ann. Inst. Pasteur 33:139-173.
43
Mcllarath, W.J., and B.F. Palser. 1956. Response of tomato, turnip, and cotton tovariations in boron nutrition. I. Physiological responses. Bot. Gaz. 118:43-52.
McPhail, M., A.L. Page, and F.T. Bingham. 1972. Adsorption and interactions ofmonosilicic and boric acid in hydrous oxides or iron and aluminum. Soil Sci. Soc. Am.Proc.36:510-514.
Melsted, S.W., H.L. Motto, and T.R.Peck. 1969. Critical plant nutrient compositionvalues useful in interpreting plant analysis data. Agron. J. 61:17-20.
Metwally, A.I., A.H. EI-Damaty, and M. Yousry. 1974. Anion adsorption as a possiblemechanism of boron retention by soils. Egypt J. Soil Sci. 14:23-31.
Midgley, A.R., and D.E. Dunklee. 1940. The effect of lime on the fixation ofborates bysoils. Soil Sci. Soc. Am. Proc. 4:302-307.
Miljkovic, N.S., B.C. Mathews, and M.H. Miller. 1966a. The available boron content ofthe genetic horizons of some Ontario soils. I. The relationship between water solubleboron and other soil properties. Can. J. Soil Sci. 46:133-138.
Miljkovic, N.S., B.C. Mathews, and M.H. Miller. 1966b. The available boron content ofthe genetic horizons of some Ontario soils. II. The relationship between boron absorptionby sunflowers and other soil properties. Can. J. Soil Sci. 46:139-145.
Mitchell, R.L. 1964. Trace elements in soils. In pages 320-368, F.E. Bear, ed., Chemistryof the Soil. Reinhold, New York.
Odhnoff, C. 1957. Boron deficiency and growth. Physiol. Plant. 10:984-1000.
Olson, R.V., and KC. Berger. 1946. Boron fixation as influenced by pH, organic mattercontent, and other factors. Soil Sci. Soc. Am. Proc. 11:216-226.
Paliwal, K V., and KK Mehta. 1973. Boron status of some soils irrigated with salinewaters in Kota and Bhilwara regions of Rajasthan. Indian J. Agric. Sci. 43:766-772.
Parks, W.L., and J.L. White. 1952. Boron retention by clay and humus systems saturatedby various cations. Soil Sci. Soc. Am. proc. 16:298-300.
Perrott, K W., A.G. Langdon, and A.T. Wilson. 1974a. Sorption of phosphates byaluminum and iron (III)-hydroxy species on mica surfaces. Geoderma 12:233-231.
Perrott, K W., A.G. Langdon, and A.T. Wilson. 1974b. Sorption of anions by the cationexchange surface of muscovite. J. Colloid Interface Sci. 28:10-19.
Pollards, A.S., A.J. Parr, and B.c. Loughman. 1977. Boron in relation to membranefunction in higher plants. J. Exp. Bot. 28:831-841.
Price, C.A., H.E. Clark, and E.A. Funkhauser. 1972. Functions of micronutrients inplants. In pages 231-242, J.J. Mortvedt, P.M. Giordano, and W.L. Lindsay, eds.,Micronutrients in Agriculture. Soil Sci. Soc. Am., Madison, Wise.
Quellette, G.J. 1958. Persistence of borax in sandy soils. Can. J. Soil Sci. 38:77-84.
Reeve, E., and J.W. Shive. 1944. Potassium-boron and calcium- boron relationships inplant nutrition. Soil Sci. 57:1-14.
44
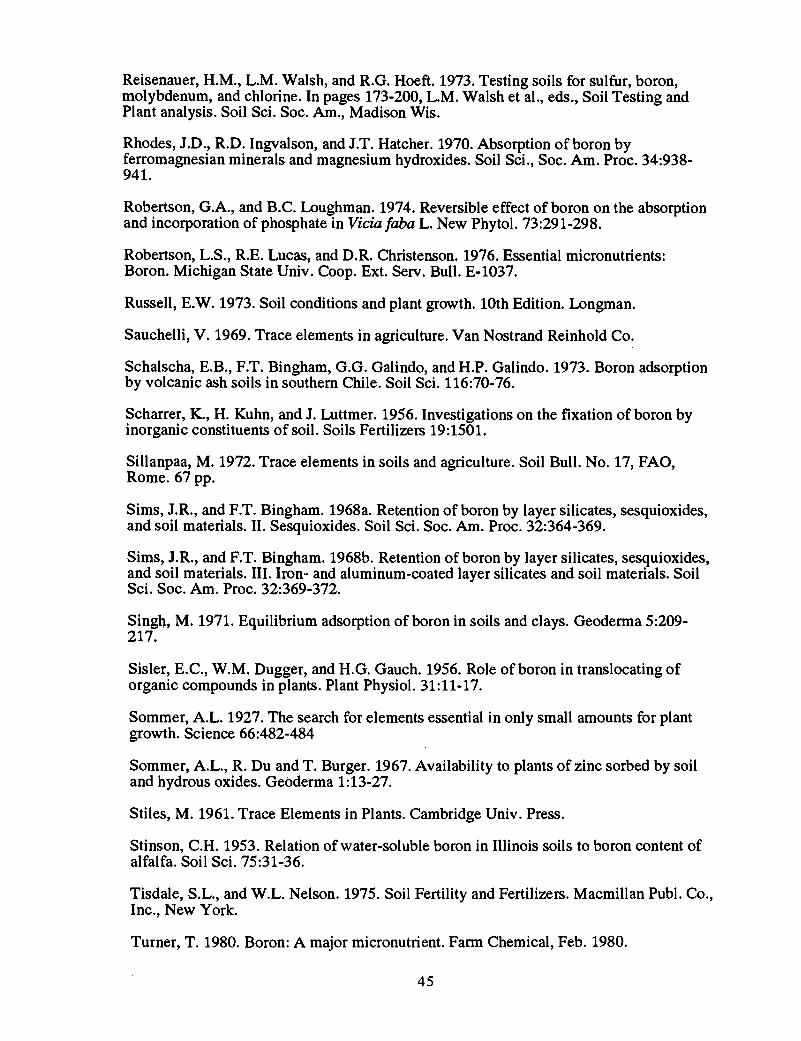
Reisenauer, H.M., L.M. Walsh, and R.G. Hoeft. 1973. Testing soils for sulfur, boron,molybdenum, and chlorine. In pages 173-200, L.M. Walsh et aI., eds., Soil Testing andPlant analysis. Soil Sci. Soc. Am., Madison Wis.
Rhodes, J.D., R.D. Ingvalson, and J.T. Hatcher. 1970. Absorption of boron byferromagnesian minerals and magnesium hydroxides. Soil Sci., Soc. Am. Proc. 34:938941.
Robertson, G.A., and B.C. Loughman. 1974. Reversible effect of boron on the absorptionand incorporation of phosphate in Vida laba L. New Phytol. 73:291-298.
Robertson, L.S., R.E. Lucas, and D.R. Christenson. 1976. Essential micronutrients:Boron. Michigan State Univ. Coop. Ext. Servo Bull. E-1037.
Russell, E.W. 1973. Soil conditions and plant growth. 10th Edition. Longman.
Sauchelli, V. 1969. Trace elements in agriculture. Van Nostrand Reinhold Co:
Schalscha, E.B., F.T. Bingham, G.G. Galindo, and H.P. Galindo. 1973. Boron adsorptionby volcanic ash soils in southern Chile. Soil Sci. 116:70-76.
Scharrer, K., H. Kuhn, and J. Luttmer. 1956. Investigations on the fixation of boron byinorganic constituents of soil. Soils Fertilizers 19:1501.
Sillanpaa, M. 1972. Trace elements in soils and agriculture. Soil Bull. No. 17, FAO,Rome. 67pp.
Sims, l.R., and F.T. Bingham. 1968a. Retention of boron by layer silicates, sesquioxides,and soil materials. II. Sesquioxides. Soil Sci. Soc. Am. Proc. 32:364-369.
Sims, J.R., and F.T. Bingham. 1968b. Retention of boron by layer silicates, sesquioxides,and soil materials. III. Iron- and aluminum-coated layer silicates and soil materials. SoilSci. Soc. Am. Proc. 32:369-372.
Singh, M. 1971. Equilibrium adsorption of boron in soils and clays. Geoderma 5:209217.
Sisler, E.C., W.M. Dugger, and H.G. Gauch. 1956. Role of boron in translocating oforganic compounds in plants. Plant Physiol. 31:11-17.
Sommer, A.L. 1927. The search for elements essential in only small amounts for plantgrowth. Science 66:482-484
Sommer, A.L., R. Du and T. Burger. 1967. Availability to plants of zinc sorbed by soiland hydrous oxides. Gebderma 1:13-27.
Stiles, M. 1961. Trace Elements in Plants. Cambridge Univ. Press.
Stinson, C.H. 1953. Relation of water-soluble boron in Illinois soils to boron content ofalfalfa. Soil Sci. 75:31-36.
Tisdale, S.L., and W.L. Nelson. 1975. Soil Fertility and Fertilizers. Macmillan Publ. Co.,Inc., New York.
Turner, T. 1980. Boron: A major micronutrient. Farm Chemical, Feb. 1980.
45
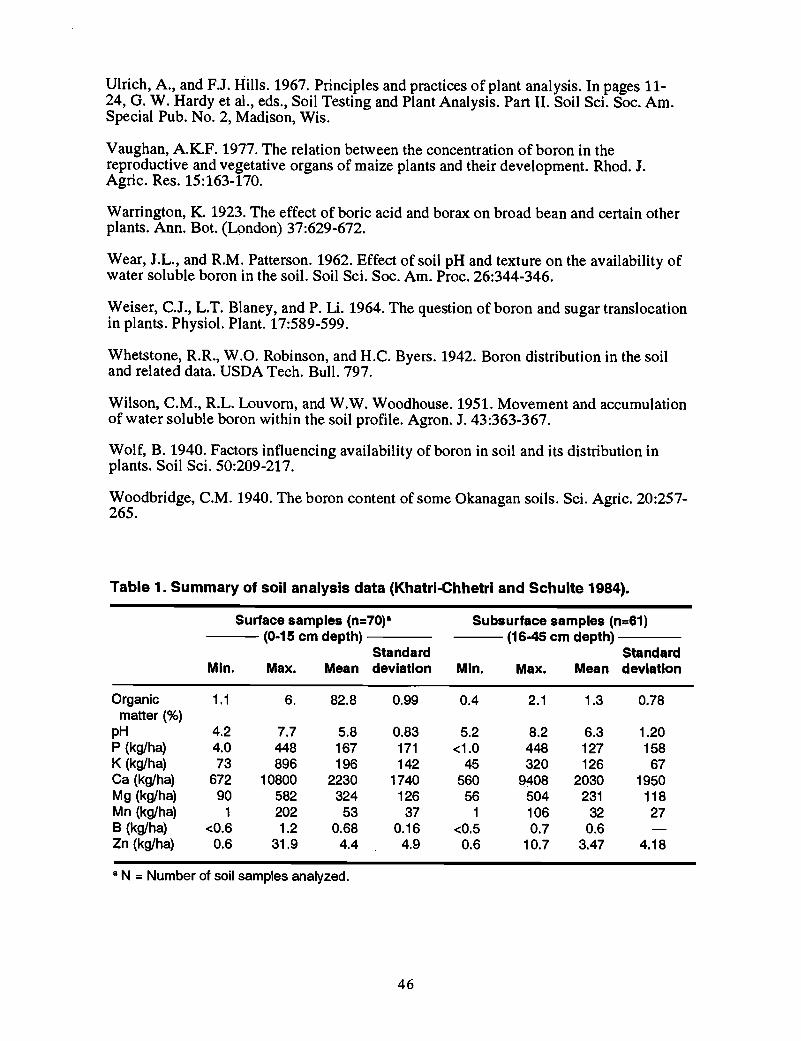
Ulrich, A., and FJ. Hills. 1967. Principles and practices of plant analysis. In pages 1124, G. W. Hardy et aI., eds., Soil Testing and Plant Analysis. Part II. Soil Sci. Soc. Am.Special Pub. No.2, Madison, Wis.
Vaughan, A.K.F. 1977. The relation between the concentration of boron in thereproductive and vegetative organs of maize plants and their development. Rhod. J.Agric. Res. 15:163-170.
Warrington, K. 1923. The effect of boric acid and borax on broad bean and certain otherplants. Ann. Bot. (Lpndon) 37:629-672.
Wear, J.L., and R.M. Patterson. 1962. Effect of soil pH and texture on the availability ofwater soluble boron in the soil. Soil Sci. Soc. Am. Proc. 26:344-346.
Weiser, C.J., L.T. Blaney, and P. Li. 1964. The question of boron and sugar translocationin plants. Physiol. Plant. 17:589-599.
Whetstone, R.R., W.O. Robinson, and H.C. Byers. 1942. Boron distribution in the soiland related data. USDA Tech. Bull. 797.
Wilson, C.M., R.L. Louvorn, and W.W. Woodhouse. 1951. Movement and accumulationof water soluble boron within the soil profile. Agron. J. 43:363-367.
Wolf, B. 1940. Factors influencing availability of boron in soil and its distribution inplants. Soil Sci. 50:209-217.
Woodbridge, C.M. 1940. The boron content of some Okanagan soils. Sci. Agric. 20:257265.
Table 1. Summary of soil analysis data (Khatri-Chhetri and Schulte 1984).
Surface samples (n=70)· Subsurface samples (n=61)(0-15 cm depth) (16-45 cm depth)
Standard StandardMin. Max. Mean deviation Min. Max. Mean deviation
Organic 1.1 6. 82.8 0.99 0.4 2.1 1.3 0.78matter (%)
pH 4.2 7.7 5.8 0.83 5.2 8.2 6.3 1.20P (kg/ha) 4.0 448 167 171 <1.0 448 127 158K (kg/ha) 73 896 196 142 45 320 126 67Ca (kg/ha) 672 10800 2230 1740 560 9408 2030 1950Mg (kg/ha) 90 582 324 126 56 504 231 118Mn (kg/ha) 1 202 53 37 1 106 32 27B (kg/ha) <0.6 1.2 0.68 0.16 <0.5 0.7 0.6Zn (kg/ha) 0.6 31.9 4.4 4.9 0.6 10.7 3.47 4.18
aN = Number of soil samples analyzed.
46
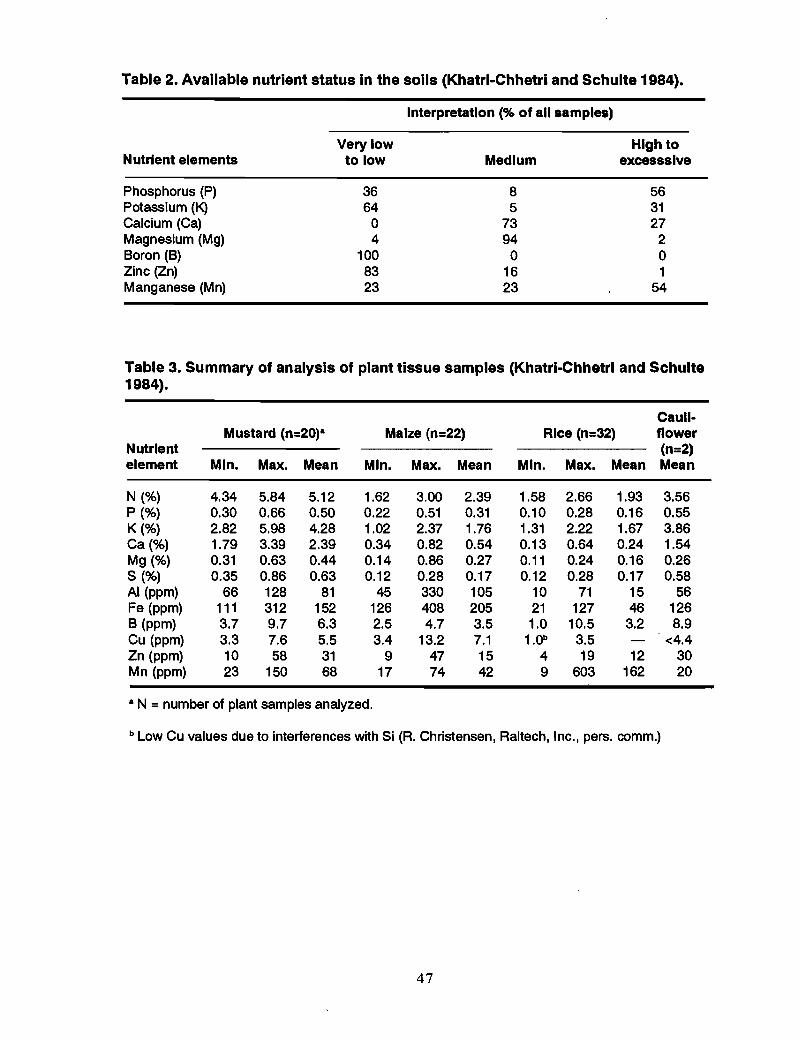
Table 2. Available nutrient status In the soils (Khatrl-Chhetri and Schulte 1984).
Interpretation (% of all samples)
Very low High toNutrient elements to low Medium excesssive
Phosphorus (P) 36 8 56Potassium (K) 64 5 31Calcium (Ca) 0 73 27Magnesium (Mg) 4 94 2Boron (B) 100 0 0Zinc (Zn) 83 16 1Manganese (Mn) 23 23 54
Table 3. Summary of analysis of plant tissue samples (Khatrl-Chhetrl and Schulte1984).
Caull·Mustard (n=20)- Maize (n=22) Rice (n=32) flower
Nutrient (n=2)element Min. Max. Mean Min. Max. Mean Min. Max. Mean Mean
N (%) 4.34 5.84 5.12 1.62 3.00 2.39 1.58 2.66 1.93 3.56P (%) 0.30 0.66 0.50 0.22 0.51 0.31 0.10 0.28 0.16 0.55K (%) 2.82 5.98 4.28 1.02 2.37 1.76 1.31 2.22 1.67 3.86Ca (%) 1.79 3.39 2.39 0.34 0.82 0.54 0.13 0.64 0.24 1.54Mg (%) 0.31 0.63 0.44 0.14 0.86 0.27 0.11 0.24 0.16 0.26S (%) 0.35 0.86 0.63 0.12 0.28 0.17 0.12 0.28 0.17 0.58AI (ppm) 66 128 81 45 330 105 10 71 15 56Fe (ppm) 111 312 152 126 408 205 21 127 46 126B (ppm) 3.7 9.7 6.3 2.5 4.7 3.5 1.0 10.5 3.2 8.9Cu (ppm) 3.3 7.6 5.5 3.4 13.2 7.1 1.0b 3.5 <4.4Zn (ppm) 10 58 31 9 47 15 4 19 12 30Mn (ppm) 23 150 68 17 74 42 9 603 162 20
aN = number of plant samples analyzed.
bLow Cu values due to interferences with Si (R. Christensen, Raltech, Inc., pers. comm.)
47
Table 4. Plant samples below the criticall levels of specified nutrients (% of totalnumber of samples) (Khatri-Chhetri and Schulte 1984).
Nutrient Cropelements Rlce(32)8 Malze(22) Mustard (20)b Caullflower(2)
Nitrogen 94 41 0 0Phosphorus 3 9 5 0Potassium 0 45 90 100Calcium 6 0 0 0Magnesium 0 4 70 100Sulfur 3 14 0 0Boron 59 95 100 100Copper 100C 0 30 50Zinc 22 82 45 0Manganese 0 0 5 100Iron 81 0 0 0
a Number in parentheses indicates number of plant samples analyzed.b On the basis of the critical values for radish.C This value is presumed to be affected by interference from Si, which was not removed.
Table 5. Soil test of available nutrients (Khatri-Chhetri and Karki 1979a).
Organic Kg/ha ofDepth matter
cm Texture pH % P K Ca Mg B Mn Zn
0-15 Sandy 5.2 2.9 79 174 896 112 0.6 52 1.7loam
Plant-available Band Zn are deficient in the soil.
Table 6. Yield response of cauliflower to added Borax* (Khatri-Chhetri and Karki,1979a).
Borox Whole plant Curd Population Concentrationadded weight weight Curd per plot of B In tissuekg/ha kg/ha kg/ha (%) number ppm
0 19.5a 4.30a 22.1a 26.2a 5.1410 43.9b 15.40c 35.1c 33.2b 23.50
20 39.4b 12.12bc 30.8b 34.5b 25.8040 35.4b 10.92b 30.8b 32.5b 34.1060 40.4b 13.80bc 34.2b 32.8b 36.20
Mean 35.6 11.31 30.6 31.6CV% 18.4 25.4 8.3 10.4FatP=0.05 8.60 8.85 16.5 3.57
1< Numbers followed by the same letter are not significantly different at P = 0.05.
48
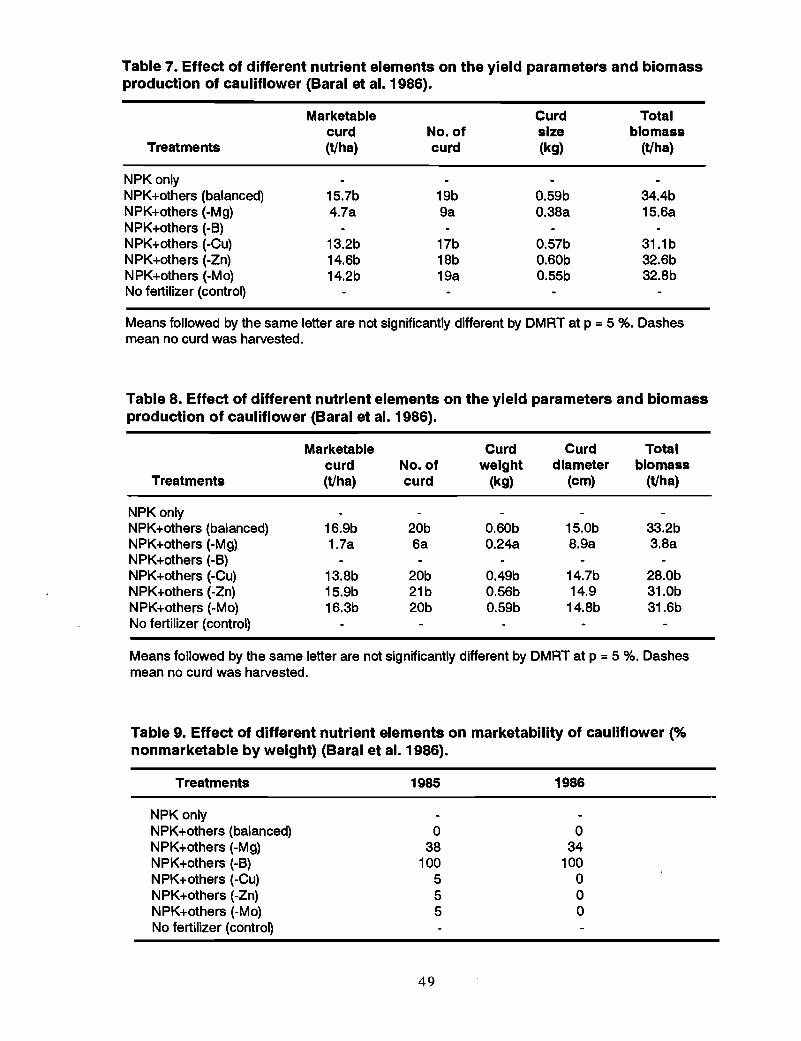
Table 7. Effect of different nutrient elements on the yield parameters and biomassproduction of cauliflower (Baral et al. 1986).
Marketable Curd Totalcurd No. of size biomass
Treatments (t/ha) curd (kg) (t/ha)
NPKonlyNPK+others (balanced) 15.7b 19b 0.59b 34.4bNPK+others (-Mg) 4.7a 9a 0.38a 15.6aNPK+others (-B)NPK+others (-Cu) 13.2b 17b 0.57b 31.1bNPK+others (-Zn) 14.6b 18b 0.60b 32.6bNPK+others (-Mo) 14.2b 19a 0.55b 32.8bNo fertilizer (control)
Means followed by the same letter are not significantly different by DMRT at p = 5 %. Dashesmean no curd was harvested.
Table 8. Effect of different nutrient elements on the yield parameters and biomassproduction of cauliflower (Baral et al. 1986).
Marketable Curd Curd Totalcurd No. of weight diameter biomass
Treatments (t/ha) curd (kg) (cm) (t/ha)
NPKonlyNPK+others (balanced) 16.9b 20b 0.60b 15.0b 33.2bNPK+others (-Mg) 1.7a 6a 0.24a 8.9a 3.8aNPK+others (-B)NPK+others (-Cu) 13.8b 20b 0.49b 14.7b 28.0bNPK+others (-Zn) 15.9b 21b 0.56b 14.9 31.0bNPK+others (-Mo) 16.3b 20b 0.59b 14.8b 31.6bNo fertilizer (control)
Means followed by the same letter are not significantly different by DMRT at p = 5 %. Dashesmean no curd was harvested.
Table 9. Effect of different nutrient elements on marketability of cauliflower (%nonmarketable by weight) (Baral et al. 1986).
Treatments 1985 1986
NPKonlyNPK+others (balanced) 0 0NPK+others (-Mg) 38 34NPK+others (-B) 100 100NPK+others (-Cu) 5 0NPK+others (-Zn) 5 0I\IPK+others (-Mo) 5 0No fertilizer (control)
49
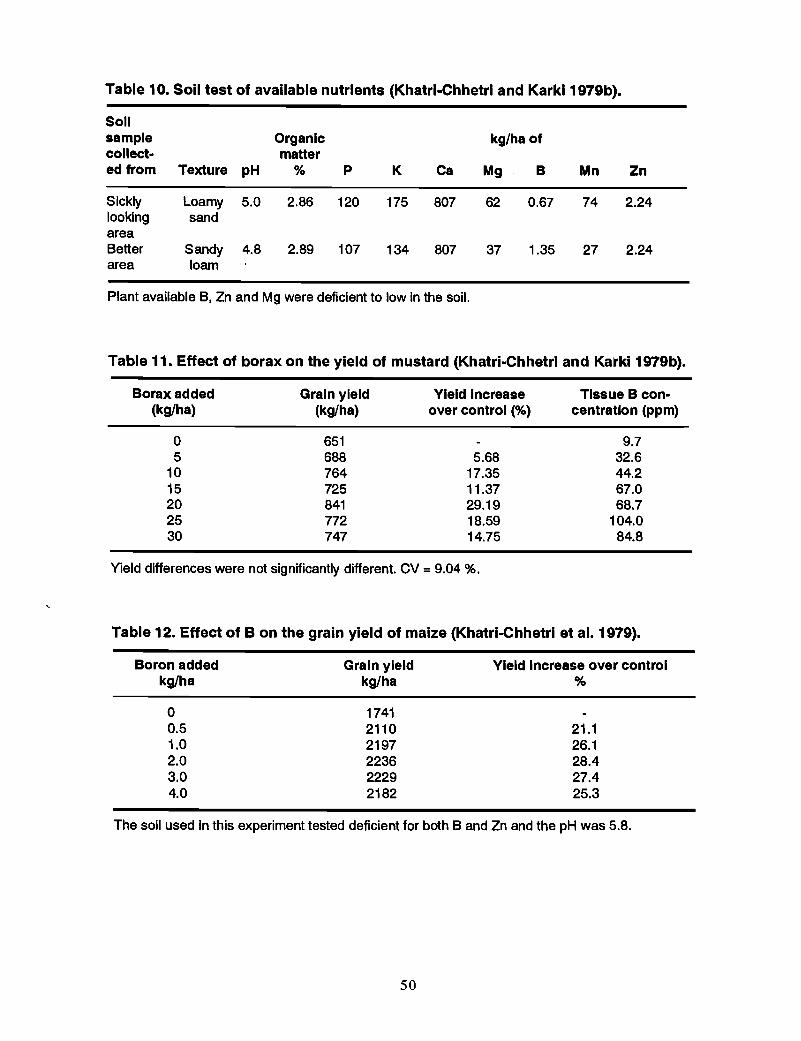
Table 10. Soil test of available nutrients (Khatrl-Chhetrl and Karkl 1979b).
Solisample Organic kg/ha ofcollect- mattered from Texture pH % P K Ca Mg B Mn Zn
Sickly Loamy 5.0 2.86 120 175 807 62 0.67 74 2.24looking sandareaBetter Sandy 4.8 2.89 107 134 807 37 1.35 27 2.24area loam
Plant available B, Zn and Mg were deficient to low in the SOil.
Table 11. Effect of borax on the yield of mustard (Khatri-Chhetrl and Karki 1979b).
Borax added(kg/ha)
o5
1015202530
Grain yield(kg/ha)
651688764725841772747
Yield Increaseover control (%)
5.6817.3511.3729.1918.5914.75
Tissue B concentration (ppm)
9.732.644.267.068.7
104.084.8
Yield differences were not significantly different. CV =9.04 %.
Table 12. Effect of B on the grain yield of maize (Khatri-ehhetrl et al. 1979).
Boron addedkg/ha
o0.51.02.03.04.0
Grain yieldkg/ha
174121102197223622292182
Yield Increase over control%
21.126.128.427.425.3
The soil used in this experiment tested deficient for both Band Zn and the pH was 5.8.
50
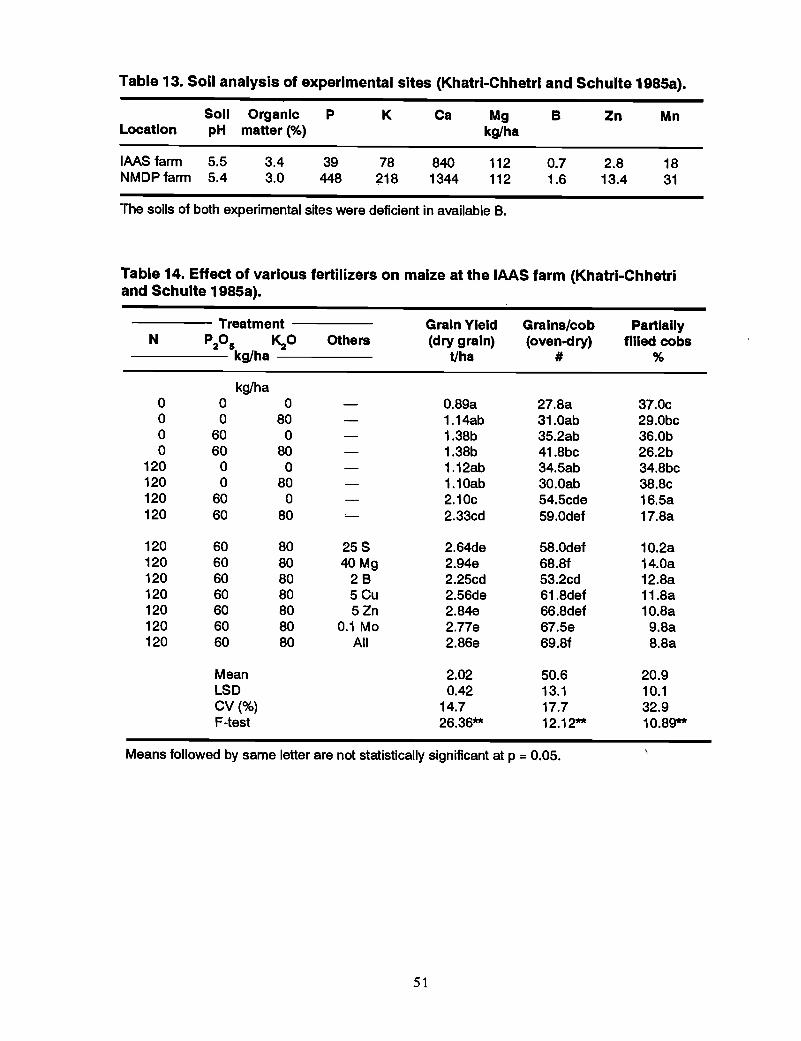
Table 13. Soli analysis of experimental sites (Khatri-Chhetri and Schulte 1985a).
Soli Organic P K Ca Mg B Zn MnLocation pH matter (%) kg/ha
IAAS farm 5.5 3.4 39 78 840 112 0.7 2.8 18NMDPfarm 5.4 3.0 448 218 1344 112 1.6 13.4 31
"rhe soils of both experimental sites were deficient in available 8.
Table 14. Effect of various fertilizers on maize at the IAAS farm (Khatri-Chhetriand Schulte 1985a).
Treatment Grain Yield Grains/cob PartiallyN P20 S ~O Others (dry grain) (oven-dry) filled cobs
kg/ha t/ha # %
kg/ha0 0 0 0.89a 27.8a 37.0c0 0 80 1.14ab 31.0ab 29.0bc0 60 0 1.38b 35.2ab 36.0b0 60 80 1.38b 41.8bc 26.2b
120 0 0 1.12ab 34.5ab 34.8bc120 0 80 1.10ab 30.0ab 38.8c120 60 0 2.10c 54.5cde 16.5a120 60 80 2.33cd 59.0def 17.8a
120 60 80 25S 2.64de 58.0def 10.2a120 60 80 40Mg 2.94e 68.8f 14.0a120 60 80 28 2.25cd 53.2cd 12.8a120 60 80 5Cu 2.56de 61.8def 11.8a120 60 80 5Zn 2.84e 66.8def 10.8a120 60 80 0.1 Mo 2.77e 67.5e 9.8a120 60 80 All 2.86e 69.8f 8.8a
Mean 2.02 50.6 20.9LSD 0.42 13.1 10.1CV(%) 14.7 17.7 32.9F-test 26.36** 12.12** 10.89**
Means followed by same letter are not statistically significant at p = 0.05.
51
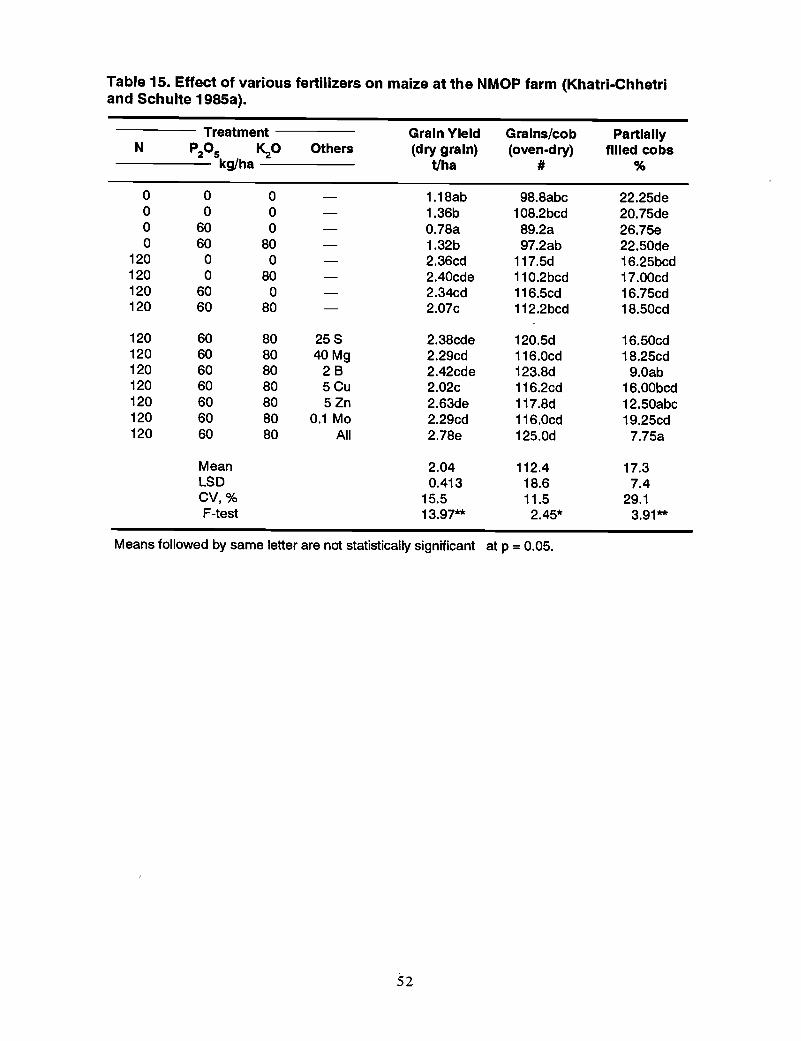
Table 15. Effect of various fertilizers on maize at the NMOP farm (Khatri-Chhetriand Schulte 1985a).
Treatment Grain Yield Grains/cob PartiallyN P20 S ~O Others (dry grain) (oven-dry) filled cobs
kg/ha t/ha # %
0 0 0 1.18ab 98.8abc 22.25de0 0 0 1.36b 108.2bcd 20.75de0 60 0 0.78a 89.2a 26.75e0 60 80 1.32b 97.2ab 22.50de
120 0 0 2.36cd 117.5d 16.25bcd120 0 80 2.40cde 110.2bcd 17.00cd120 60 0 2.34cd 116.5cd 16.75cd120 60 80 2.07c 112.2bcd 18.50cd
120 60 80 25S 2.38cde 120.5d 16.50cd120 60 80 40Mg 2.29cd 116.0cd 18.25cd120 60 80 28 2.42cde 123.8d 9.0ab120 60 80 5Cu 2.02c 116.2cd 16.00bcd120 60 80 5Zn 2.63de 117.8d 12.50abc120 60 80 0.1 Mo 2.29cd 116.0cd 19.25cd120 60 80 All 2.78e 125.0d 7.75a
Mean 2.04 112.4 17.3LSD 0.413 18.6 7.4CV,% 15.5 11.5 29.1F-test 13.97** 2.45* 3.91**
Means followed by same letter are not statistically significant at p =0.05.
52
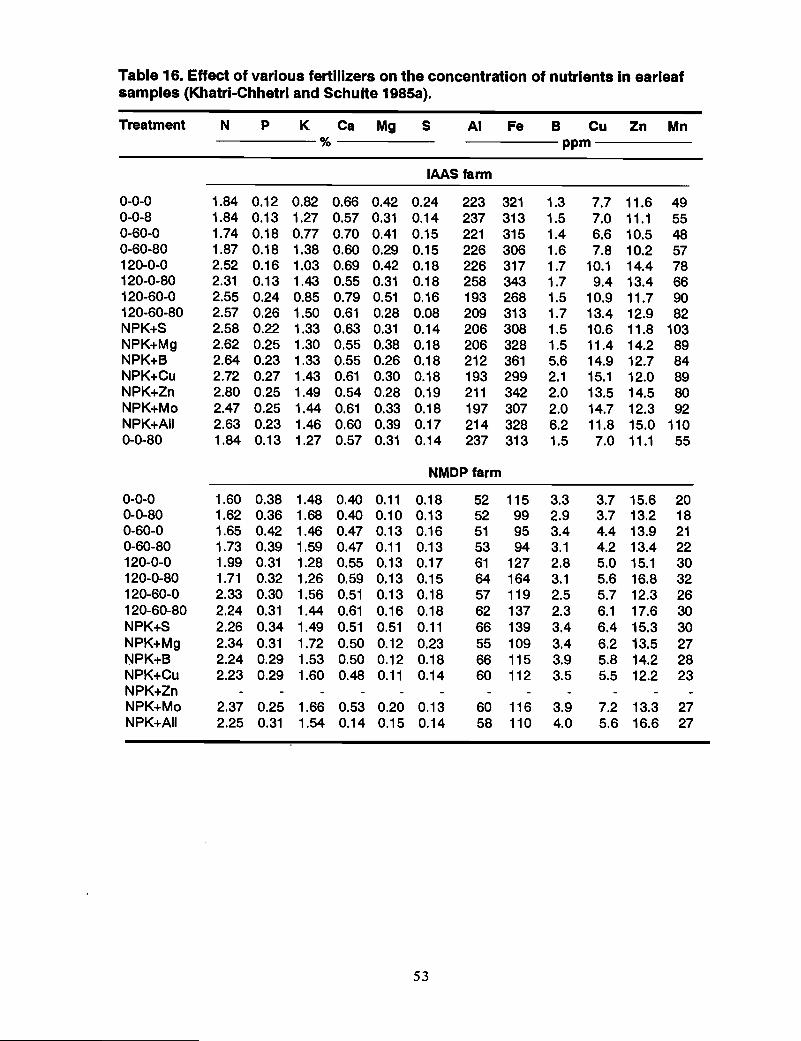
Table 16. Effect of various fertilizers on the concentration of nutrients In earleafsamples (Khatrl-Chhetri and Schulte 1985a).
Treatment N P K Ca Mg S AI Fe B Cu Zn Mn% ppm
IAAS farm
0-0-0 1.84 0.12 0.82 0.66 0.42 0.24 223 321 1.3 7.7 11.6 490-0-8 1.84 0.13 1.27 0.57 0.31 0.14 237 313 1.5 7.0 11.1 550-60-0 1.74 0.18 0.77 0.70 0.41 0.15 221 315 1.4 6.6 10.5 480-60-80 1.87 0.18 1.38 0.60 0.29 0.15 226 306 1.6 7.8 10.2 57120-0-0 2.52 0.16 1.03 0.69 0.42 0.18 226 317 1.7 10.1 14.4 78120-0-80 2.31 0.13 1.43 0.55 0.31 0.18 258 343 1.7 9.4 13.4 66120-60-0 2.55 0.24 0.85 0.79 0.51 0.16 193 268 1.5 10.9 11.7 90120-60-80 2.57 0.26 1.50 0.61 0.28 0.08 209 313 1.7 13.4 12.9 82NPK+S 2.58 0.22 1.33 0.63 0.31 0.14 206 308 1.5 10.6 11.8 103NPK+Mg 2.62 0.25 1.30 0.55 0.38 0.18 206 328 1.5 11.4 14.2 89NPK+B 2.64 0.23 1.33 0.55 0.26 0.18 212 361 5.6 14.9 12.7 84NPK+Cu 2.72 0.27 1.43 0.61 0.30 0.18 193 299 2.1 15.1 12.0 89NPK+Zn 2.80 0.25 1.49 0.54 0.28 0.19 211 342 2.0 13.5 14.5 80NPK+Mo 2.47 0.25 1.44 0.61 0.33 0.18 197 307 2.0 14.7 12.3 92NPK+AII 2.63 0.23 1.46 0.60 0.39 0.17 214 328 6.2 11.8 15.0 1100-0-80 1.84 0.13 1.27 0.57 0.31 0.14 237 313 1.5 7.0 11.1 55
NMDP farm
0-0-0 1.60 0.38 1.48 0.40 0.11 0.18 52 115 3.3 3.7 15.6 200-0-80 1.62 0.36 1.68 0.40 0.10 0.13 52 99 2.9 3.7 13.2 180-60-0 1.65 0.42 1.46 0.47 0.13 0.16 51 95 3.4 4.4 13.9 210-60-80 1.73 0.39 1.59 0.47 0.11 0.13 53 94 3.1 4.2 13.4 22120-0-0 1.99 0.31 1.28 0.55 0.13 0.17 61 127 2.8 5.0 15.1 30120-0-80 1.71 0.32 1.26 0.59 0.13 0.15 64 164 3.1 5.6 16.8 32120-60-0 2.33 0.30 1.56 0.51 0.13 0.18 57 119 2.5 5.7 12.3 26120-60-80 2.24 0.31 1.44 0.61 0.16 0.18 62 137 2.3 6.1 17.6 30NPK+S 2.26 0.34 1.49 0.51 0.51 0.11 66 139 3.4 6.4 15.3 30NPK+Mg 2.34 0.31 1.72 0.50 0.12 0.23 55 109 3.4 6.2 13.5 27NPK+B 2.24 0.29 1.53 0.50 0.12 0.18 66 115 3.9 5.8 14.2 28NPK+Cu 2.23 0.29 1.60 0.48 0.11 0.14 60 112 3.5 5.5 12.2 23NPK+ZnNPK+Mo 2.37 0.25 1.66 0.53 0.20 0.13 60 116 3.9 7.2 13.3 27NPK+AII 2.25 0.31 1.54 0.14 0.15 0.14 58 110 4.0 5.6 16.6 27
53
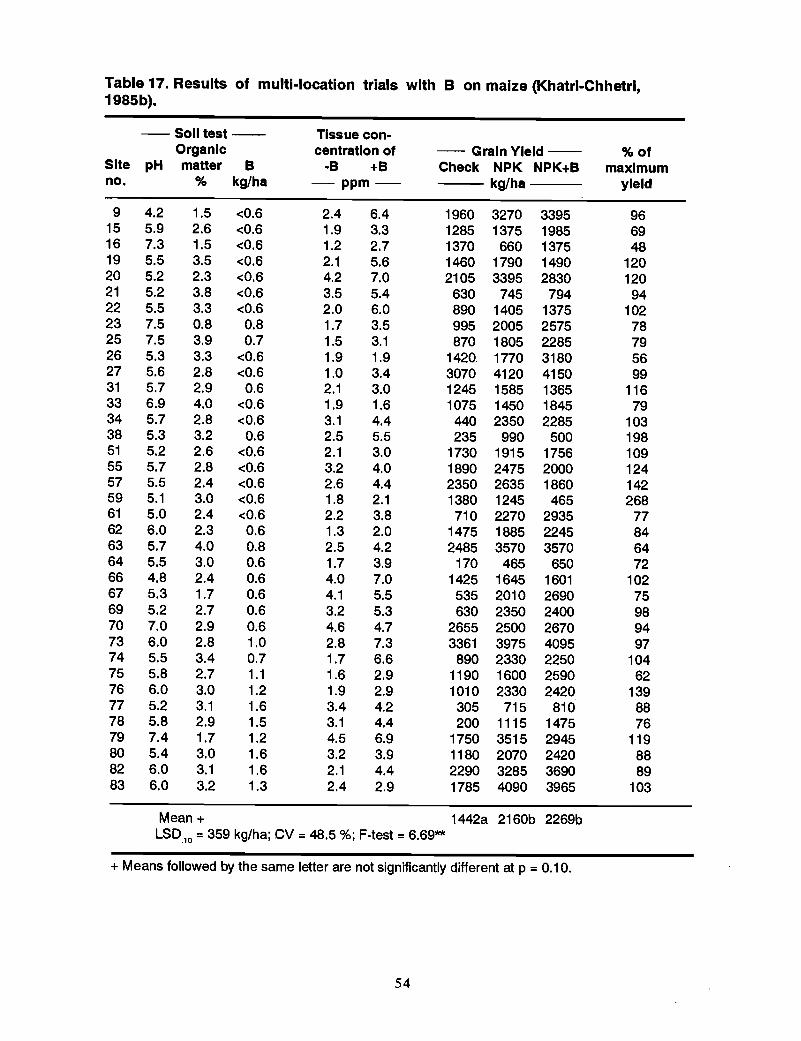
Table 17. Results of multi-location trials with B on maize (Khatrl-Chhetrl,1985b).
- Soli test -- Tissue con-Organic centratlon of - Grain Yield -- %of
Site pH matter B -B +B Check NPK NPK+B maximumno. % kg/ha -ppm- kglha yield
9 4.2 1.5 <0.6 2.4 6.4 1960 3270 3395 9615 5.9 2.6 <0.6 1.9 3.3 1285 1375 1985 6916 7.3 1.5 <0.6 1.2 2.7 1370 660 1375 4819 5.5 3.5 <0.6 2.1 5.6 1460 1790 1490 12020 5.2 2.3 <0.6 4.2 7.0 2105 3395 2830 12021 5.2 3.8 <0.6 3.5 5.4 630 745 794 9422 5.5 3.3 <0.6 2.0 6.0 890 1405 1375 10223 7.5 0.8 0.8 1.7 3.5 995 2005 2575 7825 7.5 3.9 0.7 1.5 3.1 870 1805 2285 7926 5.3 3.3 <0.6 1.9 1.9 1420 1770 3180 5627 5.6 2.8 <0.6 1.0 3.4 3070 4120 4150 9931 5.7 2.9 0.6 2.1 3.0 1245 1585 1365 11633 6.9 4.0 <0.6 1.9 1.6 1075 1450 1845 7934 5.7 2.8 <0.6 3.1 4.4 440 2350 2285 10338 5.3 3.2 0.6 2.5 5.5 235 990 500 19851 5.2 2.6 <0.6 2.1 3.0 1730 1915 1756 10955 5.7 2.8 <0.6 3.2 4.0 1890 2475 2000 12457 5.5 2.4 <0.6 2.6 4.4 2350 2635 1860 14259 5.1 3.0 <0.6 1.8 2.1 1380 1245 465 26861 5.0 2.4 <0.6 2.2 3.8 710 2270 2935 7762 6.0 2.3 0.6 1.3 2.0 1475 1885 2245 8463 5.7 4.0 0.8 2.5 4.2 2485 3570 3570 6464 5.5 3.0 0.6 1.7 3.9 170 465 650 7266 4.8 2.4 0.6 4.0 7.0 1425 1645 1601 10267 5.3 1.7 0.6 4.1 5.5 535 2010 2690 7569 5.2 2.7 0.6 3.2 5.3 630 2350 2400 9870 7.0 2.9 0.6 4.6 4.7 2655 2500 2670 9473 6.0 2.8 1.0 2.8 7.3 3361 3975 4095 9774 5.5 3.4 0.7 1.7 6.6 890 2330 2250 10475 5.8 2.7 1.1 1.6 2.9 1190 1600 2590 6276 6.0 3.0 1.2 1.9 2.9 1010 2330 2420 13977 5.2 3.1 1.6 3.4 4.2 305 715 810 8878 5.8 2.9 1.5 3.1 4.4 200 1115 1475 7679 7.4 1.7 1.2 4.5 6.9 1750 3515 2945 11980 5.4 3.0 1.6 3.2 3.9 1180 2070 2420 8882 6.0 3.1 1.6 2.1 4.4 2290 3285 3690 8983 6.0 3.2 1.3 2.4 2.9 1785 4090 3965 103
Mean + 1442a 2160b 2269bLSD.,O = 359 kg/ha; CV = 48.5 %; F-test = 6.69**
+ Means followed by the same letter are not significantly different at p = 0.10.
54
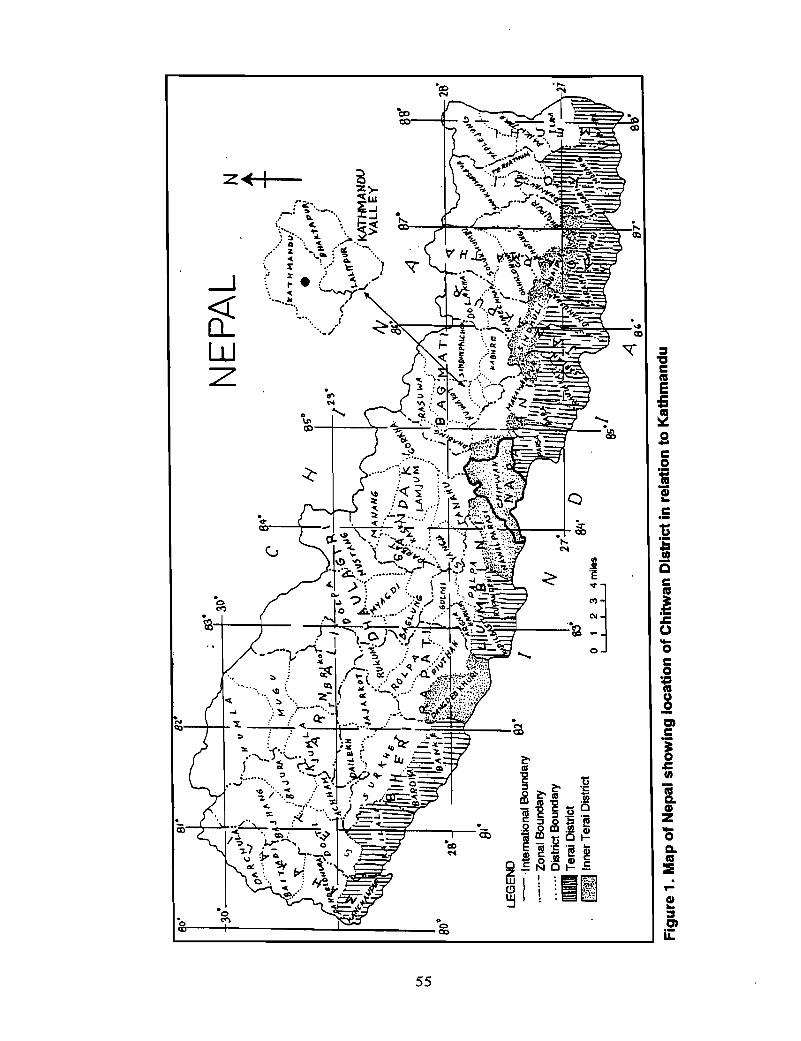
80
'al
"8
2'
17
N
(.....,..'.......
Tit
AT
..•.•
•;:"
...roO
'Ii
M...,.r>~/
L..,......
),.
."
0,1
,.pllP
;'"
{....
.:..,I
1"'·:
t"
._,......
{'...
.,~
'--<
\.~\
.lfP
IIIl
\•.•·
····
l..:
AJ/"
)K
AT
If'vt
AtlD
UJ~
~_/
VA
LL
EY
NE
PA
L
jH"
85""
Iy
27" a-l
j.---=D
--''''''1
J.l,..1..1
C64
"
83"
o1
23
4m
iles
II
I,
I
92
'
28'
I......
.'"II
I'II
LEG
END
--
.Inte
rnat
iona
lBou
ndar
y..-
.•-
Zon
alB
ound
ary
....
..D
istri
ctB
ound
ary
DIIIII
lITer
aiD
istri
ctIWi~el'nner
Ter
aiD
istri
ct
81'
30"
£\,
/'\
83"
7"_
•I
>=--"
I30
"
80"
VI
VI
Fig
ure
1.M
ap
of
Nep
alsh
ow
ing
loca
tio
no
fC
hit
wan
Dis
tric
tin
rela
tio
nto
Kat
hm
and
u
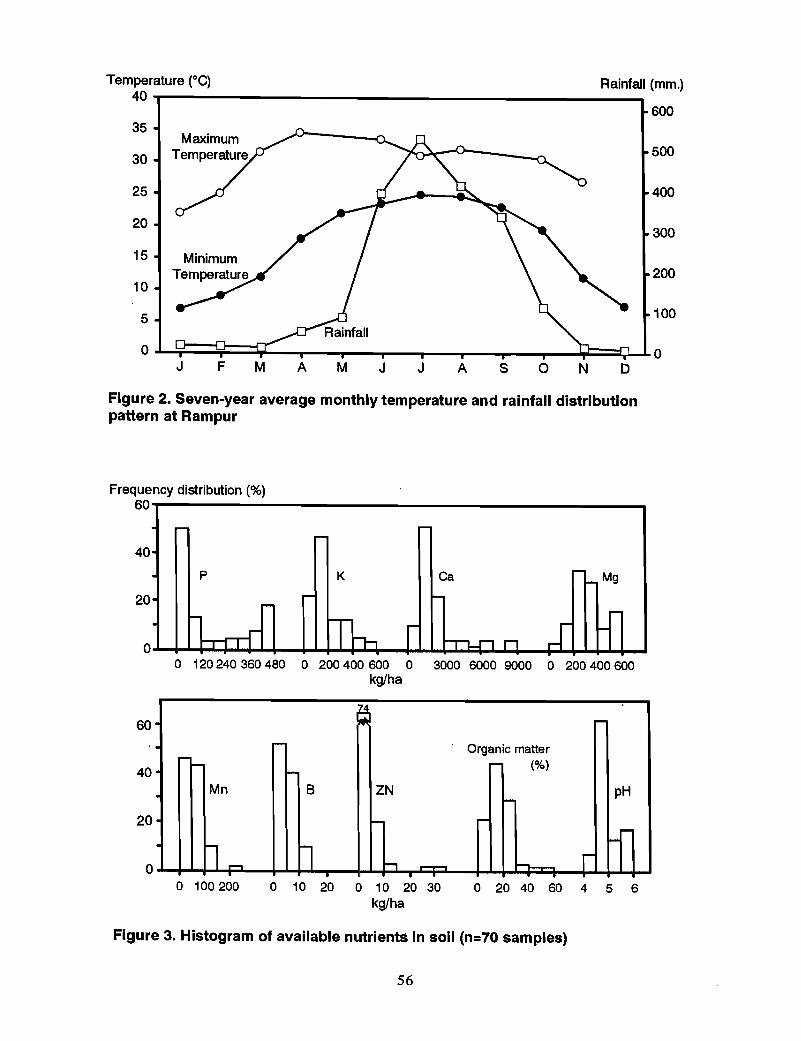
Temperature (0C)40
Rainfall (mm.)
600
35
30
25
20
15
10
5
500
400
300
200
100
o .LJ;/=::::iit=:::1;I:=--__-"r___.,~.....,..-__-"r___.,~....I;1=:Q_.J.0J F M A M J J A s o N D
Figure 2. Seven-year average monthly temperature and rainfall distributionpattern at Rampur
Frequency distribution (%)60.,....------------------------.....,
40
p K Ca Mg
o 120 240 360 480 0 200 400 600 0 3000 6000 9000 0 200 400 600kg/ha
20
60
40
o
~
· ~ r-
· r- Organic matterr- r- (%)r- -
· Mn B ZN pH-· f- - -
f-n.... n h ........... r. . .o 100200 o 10 20 0 10 20 30
kglhao 20 40 60 4 5 6
Figure 3. Histogram of available nutrients in soil (n=70 samples)
56
WHEAT STERILITY IN NEPAL-A REVIEW
Kalidas SubediSenior Crop Scientist
Lumle Regional Agricultural Research CentreKathmandu, Nepal
Abstract
Sterility in wheat is an increasingly important problem in Nepal. It occurs at all altitudesand a number of factors are involved. In the high hills (above 1200 m), low temperatures,frost, and snow at anthesis seem to be the major factors responsible. In the low hills(below 1200 m), temperatures are low enough to cause sterility and soil problems,particularly low boron availability. Waterlogging has also been identified as an importantfactor in the low hills. Further work on the sterility problem is recommended.
Introduction
Wheat is the third most important cereal crop in Nepal, both in area and production, afterrice and maize. Wheat is widely grown in all agro-ecological zones of Nepal from theterai (below 100 m) up to the high hills (2500 m) in both irrigated and rainfed lands.Wheat area and production in Nepal have increased sharply since the mid-1960s with theintroduction of Mexican varieties such as Lerma-52, Lerma Rojo-64, and the CIMMYTbased Indian variety Sonalika (= RR-21).
In 1989-90, wheat was cultivated on 604,240 ha (17% of the total cereal area);production was 854,960 t with an average yield of 1.415 tlha (CBS 1991). Fifty-twopercent of the wheat cultivation is in the subtropical zone (terai and inner terai region),41% is in the hills (300-2000 masl), and 7% in the mountains (>2000 masl). Wheat is awinter crop, but varieties grown are spring types. The main wheat-based croppingpatterns are wheat-rice, wheat-rice-rice, wheat-maize-rice, and maize/millet-wheat, butmore than 80% of the wheat cultivation is in the rice-wheat systems (Hobbs 1991). Thecrop is planted in September/October in the high hills (>1500 masl) and in November/December in the terai and the low and mid-hills (100-1500 masl).
Sterility of wheat in Nepal has been reported by several workers (NWDP 1977, Rana1980, Sthapit 1989, Sthapit and Subedi 1990, Sthapit et al. 1989, Subedi et al. 1991) indifferent parts of Nepal. However, the real causes of this problem are not yet wellunderstood. This paper briefly highlights the nature of the problem, its extent, andpossible causes based on the review of past work.
Nature of the Problem
Floret infertility or grain set failure in wheat has been frequently observed in differentparts of Nepal and in recent years has been found to be an increasing problem. It hasbeen reported from Chitwan, Lumle, Gorkha, Lamjung, Kaski, Makawanpur, Tanahun,Syangja, Morang, Sunsari, and Pakhribas (Sthapit and Subedi 1990b, Subedi et al. 1991).These problems were observed in advanced varietal trials, seed multiplication plots, inthe farmers' production plots, and in national and international (CIMMYT) segregatinglines (Sthapit and Subedi 1990a, Subedi et al. 1991). Partial to full grain set failure hasbeen observed and estimated yield loss ranges from 30 to 100%, (Sthapit and Subedi1990a, Subedi et al. 1991, Mishra, unpublished data). In farmers' fields, the problem isobserved mostly in patches.
57
In the sterile spikes, the florets appear complete with fully developed palea and lemmabut the anthers are absent or poorly developed with few and malformed pollen grains.The spike gives a transparent appearance against the sun. At higher altitudes, however,the symptoms may be different in that glumes turn blackish and, in most cases, sterileflorets are observed at the tip portion of the ear. At these altitudes, the cause of grain setfailure is almost certainly due to cold injury during anthesis either to frost or snow orcold temperatures.
The assessment of grain set failure in Nepal is done by various methods such as visually,feeling, and LAC as described by Sthapit and Subedi (1990b). The LAC method hasbeen found to be simplest, but it does tend to overestimate sterility by 20% in sterilityresistant varieties. Sterility is calculated as:
Sterility % =(a-b)---x 100
a
where, a = No. of florets/spike and b = No. of grains set/spike.
Causes of Wheat Sterility in Nepal
Research on the cause of sterility in wheat has been initiated in Nepal (Mishra,unpublished data, 1975-89; Pandey 1979; Sthapit 1987). Preliminary surveys and studiesconducted in Nepal indicated that ear sterility in wheat is caused by at least two or morefactors, such as cool temperatures, boron (B) deficiency, waterlogging, etc. However,cold stress and B deficiency are found to be the most important factors.
Environmental stressesLiterature review suggests that sterility in wheat can be caused by environmental stresssuch as cold injury at anthesis (Sthapit et al. 1989, Prescott et al. 1986, Brooking 1976,Kim et al. 1985, Wang 1983, Euthumiades, 1981), drought or water stress at anthesis(Evans et al. 1975, Prescott et al. 1986), waterlogging (Cannell and Belford 1982) andlow relative humidity and high temperature during flowering (Evans et al. 1975).
It has been reported that a temperature around 2°C kills pollen grains within 15-24 hours(Singh 1982). A cold temperature of 3°C for 48 hours during this stage has detrimentaleffects on successful fertilization (Euthumiades 1981, Wang 1983). The optimumtemperature for fertilization is 18-24°C with minimum and maximum temperatures of 10and 32°C, respectively (Evans et al. 1975). However, as in any part of Nepal, themaximum temperature does not reach 32°C during the time of anthesis, which isgenerally January-February. So high temperature is not a likely cause of ear sterility. Onthe other hand, a minimum temperature of 10°C and even lower temperatures prevailduring the anthesis season in most of the mid- and high hills of Nepal. For example,minimum temperatures at Lumle (1675 masl) during anthesis are sufficient to causesterility (Figure 1). The mean minimum temperatures recorded at Lumle during anthesistime were 5-7°C.
Moreover, different studies done at Lumle also indicated that cold-induced sterility ismore common in the hills than the lower areas. For example, a 2-year trial conducted atLumle with B application revealed an insignificant effect of B suggesting that coldtemperature must be responsible for causing sterility at Lumle.
There are varietal differences for the ability to tolerate the cold-induced sterility. Forexample, varieties BL-1020, HD-1982, Vinayak, and HD-2380 developed in the terai
58
(Bhairahwa) and recommended for the lower elevation areas have the most sterilityproblems (mean of 93%) when planted at Lumle. On the other hand, varieties such asAnnapurna-l and Annapurna-2, released for the hills, have least sterility (mean of 24%)at the same location (Subedi et al. 1991).
In the hills, farmers prefer to grow short-duration wheat varieties to escape the postanthesis drought and to fit the crop into the existing cropping patterns. However, anthesisperiod coincides with the coldest month (January) and as a result the crop suffers fromcold induced sterility. Joshi et al. (1989) found that in various varietal trials conducted inthe hills, the majority of the early heading cultivars of wheat and barley showed partial orcomplete sterility. However, late maturing varieties escape the critical cold period andmight have suffered least from the cold.
Sthapit et al. (1989) observed that delaying planting by 15 days reduced sterility indifferent varieties of wheat at Lumle (from 59-64 to 2-22% in RR-21, from 11-34 to 912% in NL-460, and from 21-27 to 11-13% in Triveni). This might be due to escapingthe critical cold period at anthesis. Similar results were also observed at Pakhribas (1700masl). Irrespective of the planting time, variety RR-21 showed the highest degree ofsterility followed by Triveni and NL-460 both at Lumle and Pakhribas (Tables 1 and 2).
In the high hills, where frost, hail, and snow occur frequently and cause considerablesterility, the entire crop sometimes may be lost. Therefore, in the high hills, factorscausing sterility in wheat and barley are already established.
Besides cold temperatures, waterlogging at anthesis is also thought to be an importantfactor contributing to sterility in wheat. The effect of waterlogging was reported byMishra at Tarahara Agricultural Station (pers. comln.) and the author has also observedsituations where sterility was greater in wet and low lying fields. However, there is noreported evidence to support the involvement of waterlogging in sterility.
B deficiencyB has been said to playa special role in fertil.ization in higher plants as anthers appear tobe specially sensitive to B deficiency (Vasil 1963). B deficiency as a cause of spikeletsterility in wheat was reported by Oliver et al. (1974), Singh et al. (1976), Sthapit et al.(1989), and Rerkasem et al. (1989, 1990). In Nepal, wheat sterility due to B deficiency issuspected in lower areas where temperatures are not sufficiently cool to cause sterility,for example, at Khairenitar (450 masl), Tarahara (100 masl), and Chitwan (160 masl),where minimum temperatures are never lower than 10°C. More severe sterility problemsare reported in the rice-wheat system (khetlands) than in any of the others. Moreover,more patchy occurrences of the problem in the lower area hint at a soil problem.
To investigate whether B is responsible for sterility or not, experiments were conductedat Lumle, Pakhribas, Khairenitar, and Tarahara during 1987-88. Similarly, B-basedexperiments have been conducted at Lumle since 1987. The results (e.g., Tables 1 and 2)of the different experiments suggest that, in higher areas like Lumle and Pakhribas, thecause of partial sterility in wheat is mainly frost and cold temperatures and that B is ofminor importance (Sthapit et al. 1989, Subedi et. al. 1991).
Unlike at Lumle and Pakhribas, B application of 15 kg/ha significantly reduced sterility(from 30 to 2%) at Tarahara where effect of cold temperature was unlikely (Table 3).Similarly at Khairenitar, B applied at the same rate reduced sterility by 7% (Table 4).From these results, it was concluded that B deficiency could be the primary cause ofwheat sterility in these areas.
59
Response to B deficiency differs between varieties. In an experiment conducted atYampaphant (450 masl), soil application of 1 kg/ha (Le., 9 kg Borax/ha) has a significanteffect on yield components viz. grains/F1+2, grains/spikelet and grains/spike (Subedi etal. 1991). A significant interaction (P<0.05) was also evident between B and genotypes(Figure 2) for grains/F1+2. For example, varieties SW-41 and KUHR-12 were highlyresponsive to B whereas NL-460, Sonalika, and SW-23 have no response at all.
Additional evidence of B deficiency was observed in the Farmers' Field Trials (FFrs)conducted in different low hill sites during 1990 season. At Bhoteodar (600 masl),sterility among the six tested varieties ranged between 40 and 75% and was highest inBL-1022. Similarly at Batulechaur (1000 masl), sterility was 80% in BL-1022 whereasUP-2121 and NL-297 were least affected (25%) (Subedi et al. 1991).
Soil samples were collected from the plots where sterility was very high and analyzed(Table 5).
This analysis gave more evidence that sterility at Bhoteodar and Batulechaur was mainlydue to B deficiency. At Lumle, trace amounts ofB were available, therefore itsdeficiency was less likely to cause sterility. Pot experiments with B application in thesoils collected from Bhoteodar and Batulechaur are currently being conducted at Lumle.
Conclusions
Wheat sterility is becoming an increasingly serious problem in Nepal. This problem iscomplex and involves more than one factor. Research and studies during the last 4 yearsat Lumle and elsewhere in Nepal reveal that at mid-altitude areas (above 1300 masl),sterility is caused by low temperatures (below 5°C) at the time of pre-anthesis. At highaltitudes (about 1600 masl), low temperature as well as snow and frost cause sterility. Inthe lower areas where temperatures are not sufficiently low to cause sterility, soilproblems, especially B deficiency, seem to be the major cause of sterility. Varietaldifferences exist in response to cold tolerance as well as to B deficiency. Thecontribution of waterlogging and alkalinity in sterility needs to be studied. Evaluation ofcold tolerant and less B responsive varieties should be the breeding strategy in future.Breeding programs should include screening for cold tolerance and tolerance to low soilB levels. The study ofwheat sterility in Nepal is still in its infancy and requires furtherattention.
Acknowledgments
The author expresses gratitude to J.E. Abington, LRARC director and P.R. Hobbs,regional agronomist, CIMMYT, for providing the opportunity to prepare this brief reportand participating in the seminar. Thanks also to C.N. Floyd and B.R. Sthapit for theirvaluable suggestions, J.K. Tuladhar for .helping in the soil analyses, and Lil PrasadGurung in ass~sting with the preparation of this report.
References Cited
Brooking, I.R. 1976. Male sterility in Sorghum bieolor induced by low nighttemperature, timing and stage of sensitivity. Aust. J. PI. Physiology 3:589-96.
Cannell, R.Q., and R.K. Belford. 1982. Crop growth after transient waterlogging. Inpages 163-170, Advances in Drainage.
60
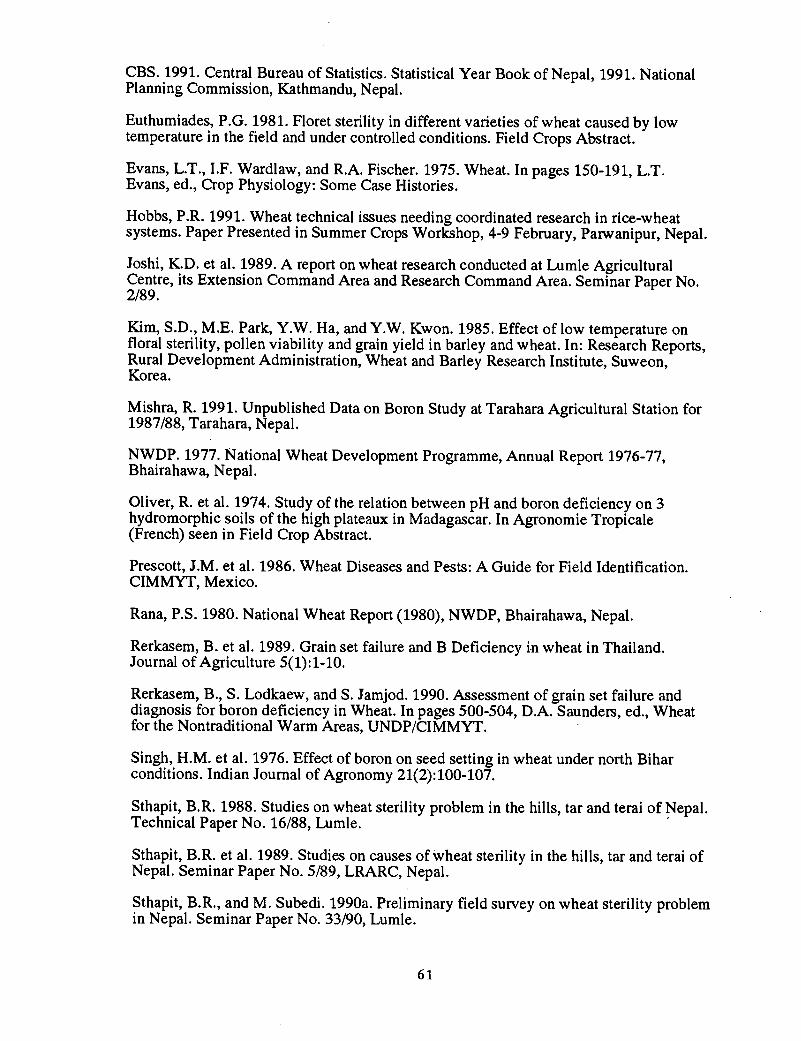
CBS. 1991. Central Bureau of Statistics. Statistical Year Book of Nepal, 1991. NationalPlanning Commission, Kathmandu, Nepal.
Euthumiades, P.G. 1981. Floret sterility in different varieties of wheat caused by lowtemperature in the field and under controlled conditions. Field Crops Abstract.
Evans, L.T., I.F. Wardlaw, and R.A. Fischer. 1975. Wheat. In pages 150-191, L.T.Evans, ed., Crop Physiology: Some Case Histories.
Hobbs, P.R. 1991. Wheat technical issues needing coordinated research in rice-wheatsystems. Paper Presented in Summer Crops Workshop, 4-9 February, Parwanipur, Nepal.
Joshi, K.D. et al. 1989. A report on wheat research conducted at Lumle AgriculturalCentre, its Extension Command Area and Research Command Area. Seminar Paper No.2/89.
Kim, S.D., M.E. Park, Y.W. Ha, and Y.W. Kwon. 1985. Effect of low temperature onfloral sterility, pollen viability and grain yield in barley and wheat. In: Research Reports,Rural Development Administration, Wheat and Barley Research Institute, Suweon,Korea.
Mishra, R. 1991. Unpublished Data on Boron Study at Tarahara Agricultural Station for1987/88, Tarahara, Nepal.
NWDP. 1977. National Wheat Development Programme, Annual Report 1976-77,Bhairahawa, Nepal.
Oliver, R. et al. 1974. Study of the relation between pH and boron deficiency on 3hydromorphic soils of the high plateaux in Madagascar. In Agronomie Tropicale(French) seen in Field Crop Abstract.
Prescott, J.M. et al. 1986. Wheat Diseases and Pests: A Guide for Field Identification.CIMMYT, Mexico.
Rana, P.S. 1980. National Wheat Report (1980), NWDP, Bhairahawa, Nepal.
Rerkasem, B. et al. 1989. Grain set failure and B Deficiency in wheat in Thailand.Journal of Agriculture 5(1):1-10.
Rerkasem, B., S. Lodkaew, and S. Jamjod. 1990. Assessment of grain set failure anddiagnosis for boron deficiency in Wheat. In pages 500-504, D.A. Saunders, ed., Wheatfor the Nontraditional Warm Areas, UNDP/CIMMYT.
Singh, H.M. et aI. 1976. Effect of boron on seed setting in wheat under north Biharconditions. Indian Journal of Agronomy 21(2):100-107.
Sthapit, B.R. 1988. Studies on wheat sterility problem in the hills, tar and terai of Nepal.Technical Paper No. 16/88, Lumle. '
Sthapit, B.R. et al. 1989. Studies on causes of wheat sterility in the hills, tar and terai ofNepal. Seminar Paper No. 5/89, LRARC, Nepal.
Sthapit, B.R., and M. Subedi. 1990a. Preliminary field survey on wheat sterility problemin Nepal. Seminar Paper No. 33/90, Lumle.
61
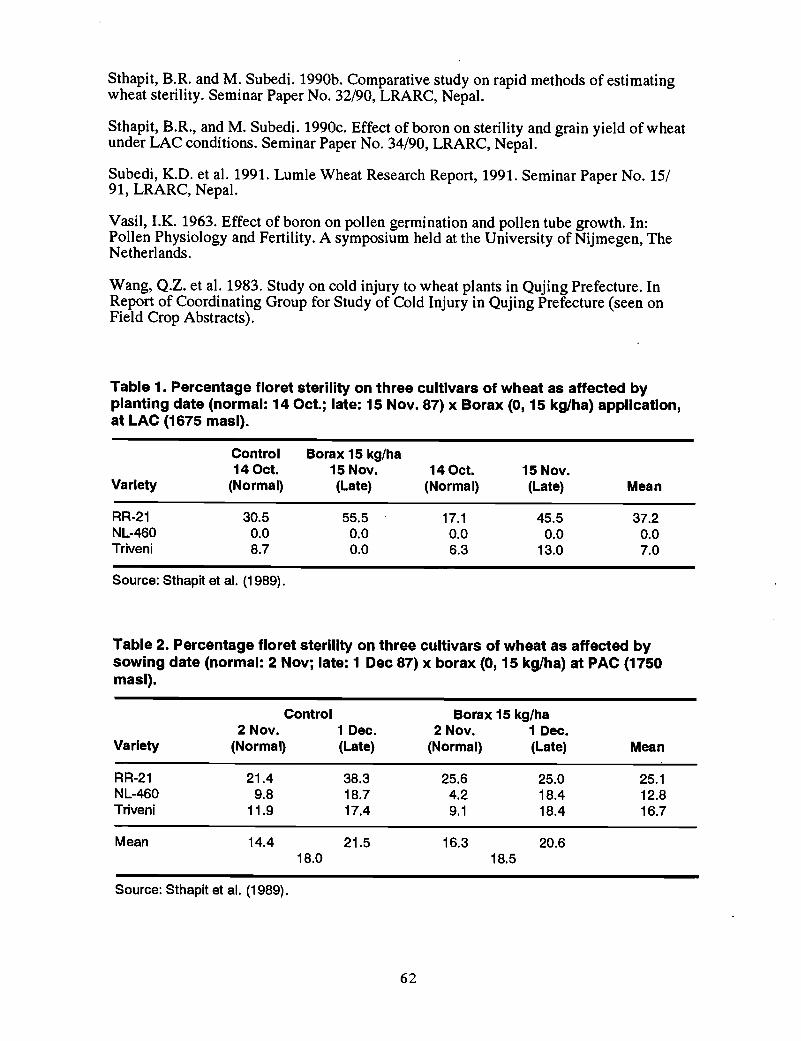
Sthapit, B.R. and M. Subedi. 1990b. Comparative study on rapid methods of estimatingwheat sterility. Seminar Paper No. 32/90, LRARC, Nepal.
Sthapit, B.R., and M. Subedi. 1990c. Effect of boron on sterility and grain yield of wheatunder LAC conditions. Seminar Paper No. 34/90, LRARC, Nepal.
Subedi, K.D. et al. 1991. Lumle Wheat Research Report, 1991. Seminar Paper No. 15/91, LRARC, Nepal.
Vasil, I.K. 1963. Effect of boron on pollen germination and pollen tube growth. In:Pollen Physiology and Fertility. A symposium held at the University of Nijmegen, TheNetherlands.
Wang, Q.Z. et al. 1983. Study on cold injury to wheat plants in Qujing Prefecture. InReport of Coordinating Group for Study of Cold Injury in Qujing Prefecture (seen onField Crop Abstracts).
Table 1. Percentage floret sterility on three cultivars of wheat as affected byplanting date (normal: 14 Oct.; late: 15 Nov. 87) x Borax (0,15 kg/hal application,at LAC (1675 masl).
Control Borax 15 kg/ha14 Oct. 15 Nov. 14 Oct. 15 Nov.
Variety (Normal) (Late) (Normal) (Late) Mean
RR-21 30.5 55.5 17.1 45.5 37.2NL-460 0.0 0.0 0.0 0.0 0.0Triveni 8.7 0.0 6.3 13.0 7.0
Source: Sthapit et al. (1989).
Table 2. Percentage floret sterility on three cultivars of wheat as affected bysowing date (normal: 2 Nov; late: 1 Dec 87) x borax (0,15 kg/ha) at PAC (1750masI).
Control Borax 15 kg/ha2 Nov. 1 Dec. 2 Nov. 1 Dec.
Variety (Normal) (Late) (Normal) (Late) Mean
RR-21 21.4 38.3 25.6 25.0 25.1NL-460 9.8 18.7 4.2 18.4 12.8Triveni 11.9 17.4 9.1 18.4 16.7
Mean 14.4 21.5 16.3 20.618.0 18.5
Source: Sthapit et al. (1989).
62
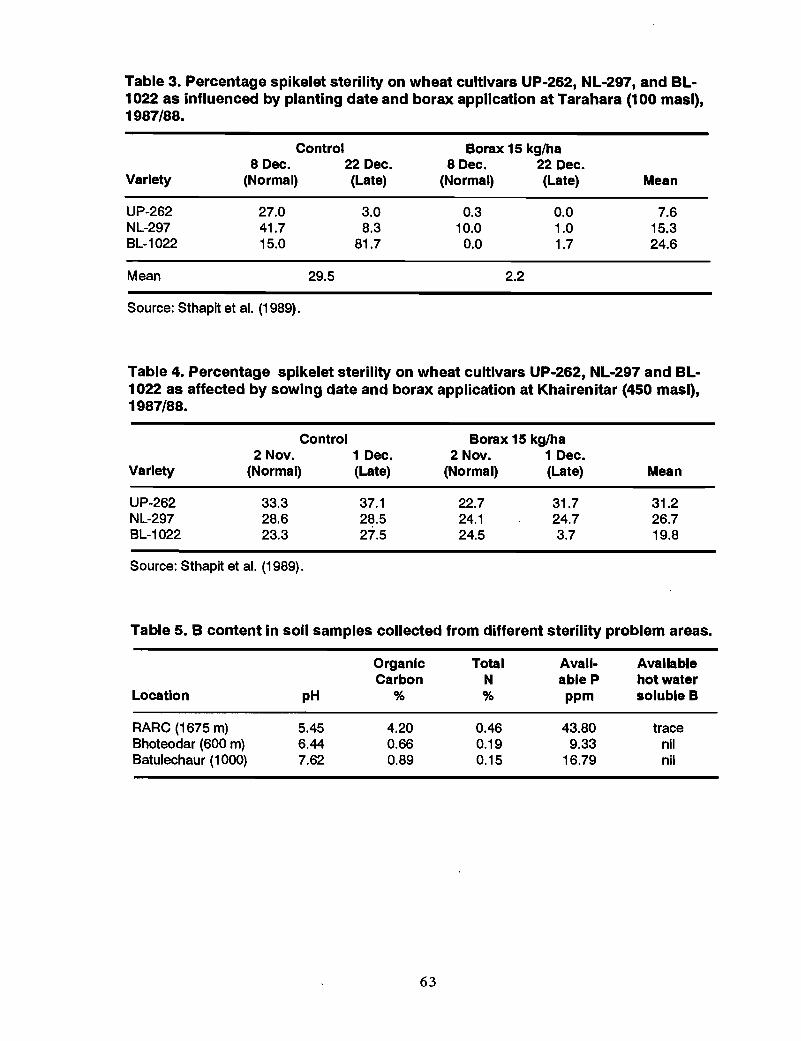
Table 3. Percentage spikelet sterility on wheat cultivars UP-262, NL-297, and BL1022 as influenced by planting date and borax application at Tarahara (100 masl),1987/88.
Variety
Control8 Dec. 22 Dec.
(Normal) (Late)
Borax 15 kg/ha8 Dec. 22 Dec.
(Normal) (Late) Mean
UP-262NL-297BL-1022
Mean
27.041.715.0
29.5
3.08.3
81.7
0.310.00.0
2.2
0.01.01.7
7.615.324.6
Source: Sthapit et a!. (1989).
Table 4. Percentage spikelet sterility on wheat cultivars UP-262, NL-297 and BL1022 as affected by sowing date and borax application at Khairenitar (450 masl),1987/88.
Control Borax 15 kglha2 Nov. 1 Dec. 2 Nov. 1 Dec.
Variety (Normal) (Late) (Normal) (Late) Mean
UP-262 33.3 37.1 22.7 31.7 31.2NL-297 28.6 28.5 24.1 24.7 26.7BL-1022 23.3 27.5 24.5 3.7 19.8
Source: Sthapit et a!. (1989).
Table 5. B content in soil samples collected from different sterility problem areas.
Organic Total Ava11- AvailableCarbon N ableP hot water
Location pH % % ppm soluble B
RARe (1675 m) 5.45 4.20 0.46 43.80 traceBhoteodar (600 m) 6.44 0.66 0.19 9.33 nilBatulechaur (1000) 7.62 0.89 0.15 16.79 nil
63
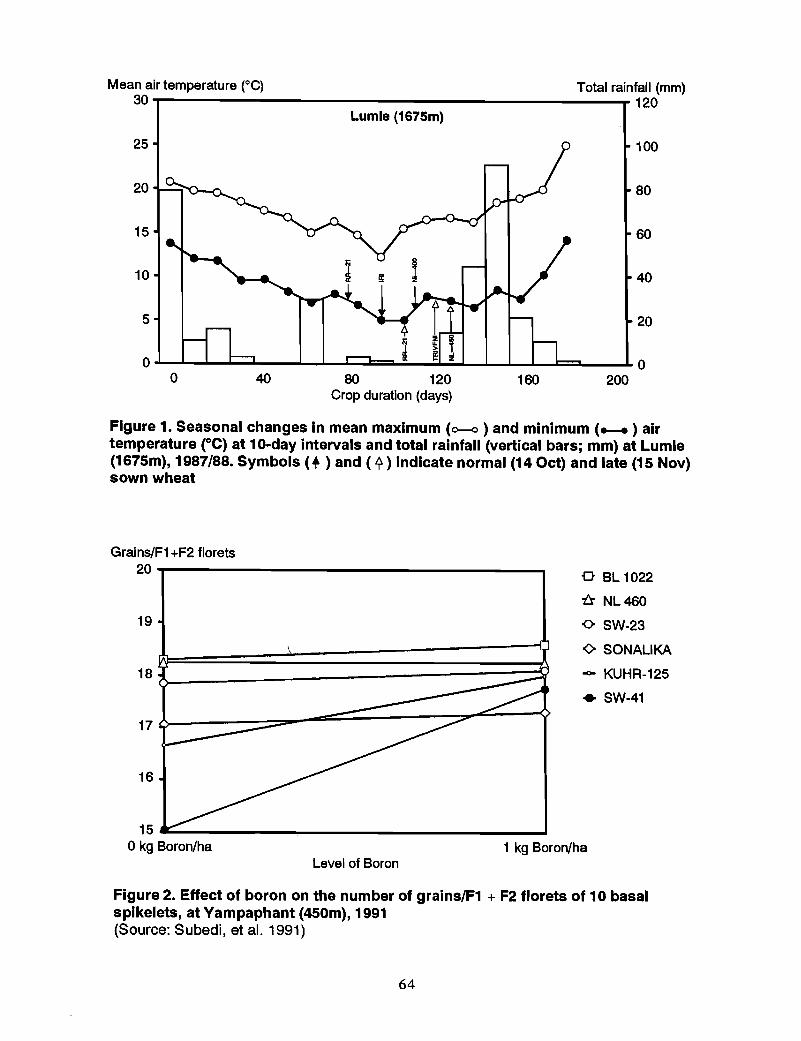
Mean air temperature (0C) Total rainfall (mm)30 120
Lumle (1675m)
25 100
20 80
15 60
10 40
5 20
0 00 40 80 120 160 200
Crop duration (days)
Figure 1. Seasonal changes In mean maximum (0-0 ) and minimum (...... ) airtemperature eC) at 10-day intervals and total rainfall (vertical bars; mm) at Lumle(1675m), 1987/88. Symbols (+ ) and ( ~ ) indicate normal (14 Oct) and late (15 Nov)sown wheat
o BL 1022
ft NL460
o SW-23
<> SONALIKA
- KUHR-125
• SW-41
1 kg Boron/ha
16
17 !-----::::=---====:::::=-----=7"~-__y
18~-----------==::::::1.
19
15 ----1
okg Boron/ha
Grains/F1 +F2 florets20..,....------------------__,
Level of Boron
Figure 2. Effect of boron on the number of grains/F1 + F2 florets of 10 basalspikelets, at Yampaphant (450m), 1991(Source: Subedi, et al. 1991)
64
STERILITY WORK IN WHEAT AT TARAHARA IN THE EASTERN TARAIOF NEPAL
R. Misra, R.C. Munankarmi, S.P. PandeySurkhet Agricultural Station
NARC, Nepal
and P.R. HobbsCIMMYT Regional Program
Kathmandu, Nepal
Abstract
Sterility has been shown to be important in the eastern Tarai areas of Nepal. There areconsiderable varietal differences in susceptibility to this problem that can be useful forscreening varieties suitable for farmers in this area. More work is needed on quantifyingthis problem in Nepal and determining the mechanism and cause of sterility. Care mustbe taken to sample the basal florets for sterility to distinguish between sterility caused byinfertility and sterility caused by insufficient photosynthate to fill available florets. Thispaper reports on research from the Tarahara Research Station situated in the EasternTarai Region. Sterility is related to waterlogging there, with lower, poorer drained areasof the farm showing severe sterility symptoms, whereas higher, better drained plots showno problem at all. Two research projects are discussed, which highlight sterilityobservations at this station. .
Introduction
Sterility in wheat is a problem in the Eastern part of the Nepalese Tarai (Figure 1), buthas also been reported as far west as Rupandehi District in the Tarai and in the hills. Thefirst reports of sterility as a serious problem in the Eastern Tarai area of Nepal were in1964 when improved, high yielding Mexican wheats were first made available tofarmers. It was observed on Indian varieties in Sunsari, Morang, and Jhapa Districts ofEastern Tarai in 1965 (Joshi 1976). Since then, the problem has been reported up to theWestern Region of Nepal where it has been observed in the mid-hills, river valleys, andthe Tarai. Sterility was also observed in 1974-75 on Tanori 71 at zero nitrogen when airtemperatures were below 1DOC during anthesis in the Western Tarai Region. There wasvariation among varieties in relation to sterility incidence.
To date, no conclusive reason has been found to account for this problem. Many studieshave been carried out on research stations and farmers' fields on this problem. Variousfactors have been studied and shown to be related to sterility, such as low nitrogen levelsand late seeding (Pandey 1977), low and high temperatures, hot dry winds duringmaturity, water stagnation during flowering (Misra 1985), and boron deficiency (Sthapit1988). The appearance of the problem varies from year to year and there appears to bevariability in varietal response to this problem.
The following research is reported from the Tarahara Research Station situated in theEastern Tarai Region. Sterility is related to waterlogging there, with lower, poorerdrained areas of the farm showing severe sterility symptoms, whereas higher, betterdrained plots show no problem at all. Two research projects are discussed in this paper tohighlight sterility observations at this station:
• Three years of screening of wheat cultivars for sterility induced bywaterlogging.
65
• The effect of nitrogen level, seeding dates and variety on wheat sterility.
Materials and Methods
Waterlogging trialsA set of 117 wheat lines consisting of Nepalese (NL and BL lines) and exotic germplasmwas grown at Tarahara in 1983-84 in plots known to produce sterility in wheat.Measurements on sterility were taken in two ways from two planted replications:
• Spikes were evaluated during grain filling for percentage sterility by feeling thespike by hand. About 100 to 250 spikes were selected at random from each entry.Spikes were graded as 100, 75, 50,25 or 0% sterile. Sterility percentage wascalculated by multiplying the number of spikes in each category by thepercentage of sterility and summing the values.
• Twenty spikes from each replication were randomly selected and the number offlorets and filled grains counted. Sterility percentage was calculated as the ratio ofthe number of grains to the number of florets and expressed as a percentage.
The above process was repeated in 1984-85 and 1985-86 with as many common lines aspossible over the years. But some lines had 100% sterility in 1983-84 and seed was notavailable for a second or third year. New lines were added for a total of 120 entries.These were kept constant over the last 2 years. In the second and third years, anotherreplication of entries was planted in better drained soil to obtain grain weight wheresterility was not a problem. The grain weight of the two reps where sterility plots dividedby the normal plot was used as a third measure of sterility. .
Nitrogen, seeding dates, and variety trialThis trial was conducted at Tarahara during 1976-77. In a 3-factor factorial there werethree dates of sowing (Nov. 15,30 and Dec. 15), four varieties (RR21, NL-30, Jupateco,and Tanori) and four nitrogen levels (10, 50, 100, and 150 kg/ha). Sterility wasdetermined by counting the total number of florets from randomly selected spikes anddividing by the total number of grains to get grains per floret.
Results and Discussion
WaterloggingThe results are summarized in Tables 1 and 2 for the 10 best and 10 worst entriesaveraged over the last 2 years of the experiment. There is obviously a large difference ingenotype response that was surprisingly constant over the years. As expected, thedifferent methods gave similar results. The best correlation was between grain yield andnumber of grainslfloret (Figure 2) followed by grain yield and sterility percentage(Figure 3). Grains per floret and sterility percentage were also highly significantlycorrelated (Figure 4). The ratio of sterile plots to normal plots was less well correlated.
The incidence of sterility is not constant within any field, but occurs in patchesalthough inducing waterlogging appears to partially correct this problem in Tarahara.The ratio of sterile to normal plots was obviously affected by this plot variability.
In Tables 1 and 2, we have listed the pedigrees of the entries. These data are notcomplete since the pedigrees of Indian lines are not available at present, but attempts arebeing made to get full pedigrees of all entries to see if common parents are involved inthe response to sterility. Note that the two main wheat varieties used by farmers inTarahara are RR21 and NL297.
66
It would also be useful to check if the lines listed in Tables 1 and 2 respond similarly indifferent environments in South and Southeast Asia. For example, are. the 10 best linestolerant to the identified boron deficiency in Chiang Mai? If they are the same, then wemay be looking at the same problem induced by different circumstances. Waterloggingmay reduce B uptake and movement in the plant. Low B levels can cause sterilitythrough slow pollen tube growth in plants susceptible to boron deficiency (Vasil 1964).Sthapit (1988) showed a 28% increase in wheat yield with the application of 10% boraxto the soil.
Nitrogen, seeding dates, and variety dataNitrogen supply had a significant influence on floret sterility (Figure 5). However, therewas a significant N by variety and N by seeding date interaction. Nitrogen supply up to alevel of 100 kalha had a marked effect on the reduction of spike sterility for all dates ofsowing and in three varieties, but not in RR21. Later sowing gave less sterility (Figure6).
Unfortunately, the method of measuring sterility in this experiment does not distinguishbetween sterility caused by infertility and sterility caused by problems of grain filling.The low nitrogen and late planting effect could be the result of lower photosyntheticactivity in these treatments and a shortage of photosynthate to fill all the florets in thespikelets. It is important that the two basal florets of the spikelet are used for sterilitymeasures to distinguish grain filling from fertility problems.
Conclusion
Sterility has been shown to be important in the Eastern Tarai areas of Nepal. There areconsiderable varietal differences in susceptibility to this problem that can be useful forscreening varieties suitable for farmers in this area. More work is needed on quantifyingthis problem in Nepal and determining the mechanism and cause of sterility. Care mustbe taken to sample the basal florets for sterility to distinguish between sterility caused byinfertility and sterility caused by insufficient photosynthate to fill available florets.
References Cited
Joshi, D. 1976. Effect of low levels of nitrogen fertilization on sterility of wheat (var.Tanori 71). Paper presented at the Winter Crop Workshop, DOA, Kathmandu.
Misra, R. 1985. Personal observation on experiment "varietal screening nursery forsterility resistant under moisture excess conditions" at Tarahara Agricultural researchstation.
Pandey, S.P. 1990. Effect of nitrogen supply, seeding date and varieties on the reductionof wheat sterility under Eastern Tarai conditions. Unpublished.
Sthapit, B.R. 1988. Studies on wheat sterility problem in the hills, tar, and tarai of Nepal.Lumle Agricultural Centre Technical Paper No. 16/88.
Vasil, I.K. 1964. Effect of boron on pollen germination and pollen tube growth. In pages107-199, H.F. Linskens, ed., Pollen Physiology and Fertilization. North HollandPublishing Co., Amsterdam.
67
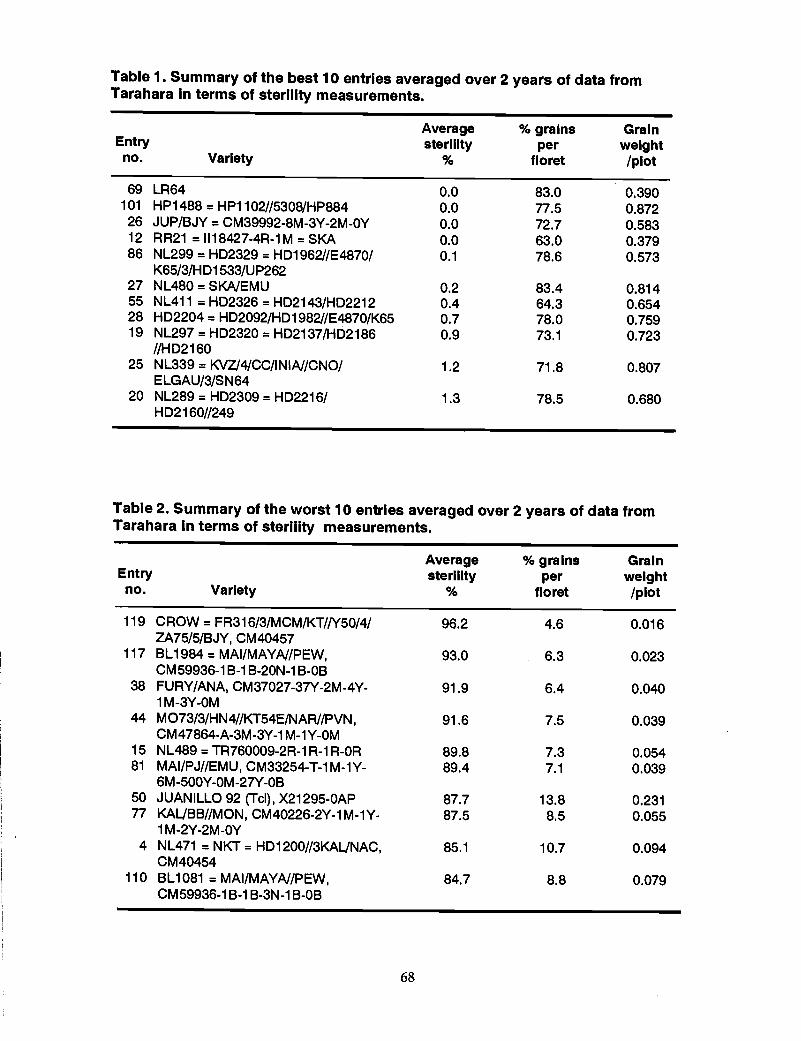
Table 1. Summary of the best 10 entries averaged over 2 years of data fromTarahara In terms of sterility measurements.
Average % grains GrainEntry sterility per weightno. Variety % floret /plot
69 LR64 0.0 83.0 0.390101 HP1488 =HP11 02//5308/HP884 0.0 77.5 0.87226 JUP/BJY =CM39992-8M-3Y-2M-OY 0.0 72.7 0.58312 RR21 =1118427-4R-1 M =SKA 0.0 63.0 0.37986 NL299 =HD2329 =HD1962//E4870/ 0.1 78.6 0.573
K65/3/HD1533/UP26227 NL480 =SKA/EMU 0.2 83.4 0.81455 NL411 =HD2326 =HD2143/HD2212 0.4 64.3 0.65428 HD2204 =HD2092/HD1982//E4870/K65 0.7 78.0 0.75919 NL297 =HD2320 =HD2137/HD2186 0.9 73.1 0.723
//HD216025 NL339 =KVZ/4/CC/INIAI/CNO/ 1.2 71.8 0.807
ELGAU/3/SN6420 NL289 =HD2309 =HD2216/ 1.3 78.5 0.680
HD2160//249
Table 2. Summary of the worst 10 entries averaged over 2 years of data fromTarahara In terms of sterility measurements.
Average % grains GrainEntry sterility per weightno. Variety % floret /plot
119 CROW =FR316/3/MCM/KT//Y50/4/ 96.2 4.6 0.016ZA75/5/BJY, CM40457
117 BL1984 =MAI/MAYAI/PEW, 93.0 6.3 0.023CM59936-1 B-1 B-20N-1 B-OB
38 FURY/ANA, CM37027-37Y-2M-4Y- 91.9 6.4 0.0401M-3Y-OM
44 M073/3/HN4//KT54E/NAR//PVN, 91.6 7.5 0.039CM47864-A-3M-3Y-1 M-1 Y-OM
15 NL489 =TR760009-2R-1 R-1 R-OR 89.8 7.3 0.05481 MAI/PJ//EMU, CM33254-T-1M-1Y- 89.4 7.1 0.039
6M-500Y-OM-27Y-OB50 JUANILLO 92 (Tel), X21295-0AP 87.7 13.8 0.23177 KAL/BB//MON, CM40226-2Y-1M-1Y- 87.5 8.5 0.055
1M-2Y-2M-OY4 NL471 =NKT =HD1200//3KAL/NAC, 85.1 10.7 0.094
CM40454110 BL1081 =MAI/MAYAI/PEW, 84.7 8.8 0.079
CM59936-1 B-1 B-3N-1 B-OB
68
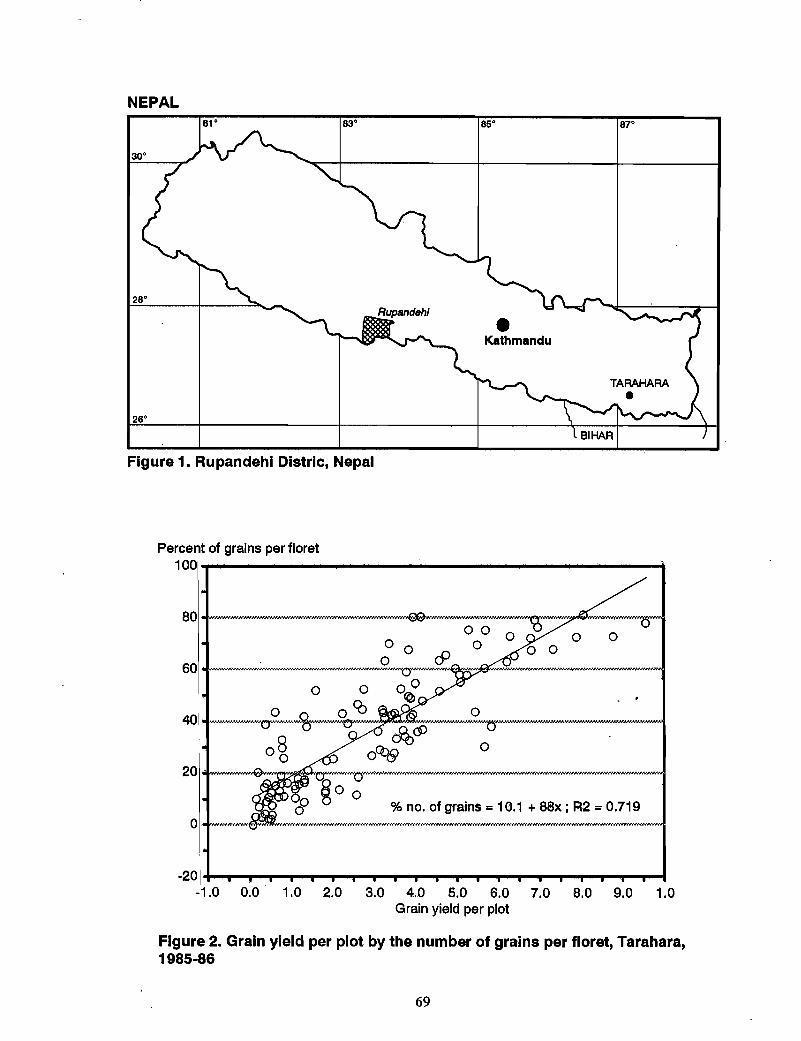
NEPAL81° 83° 85° 87°
26°
Figure 1. Rupandehl Distrlc, Nepal
Percent of grains per floret100~----------------------t
20
o
1.09.08.07.03.0 4.0 5.0 6.0Grain yield per plot
2.01.00.0
-201 .....-r-____r--r......__r.............,r--lr--r-r-__......--r- .......-1
-1.0
Figure 2. Grain yield per plot by the number of grains per floret, Tarahara,1985·86
69
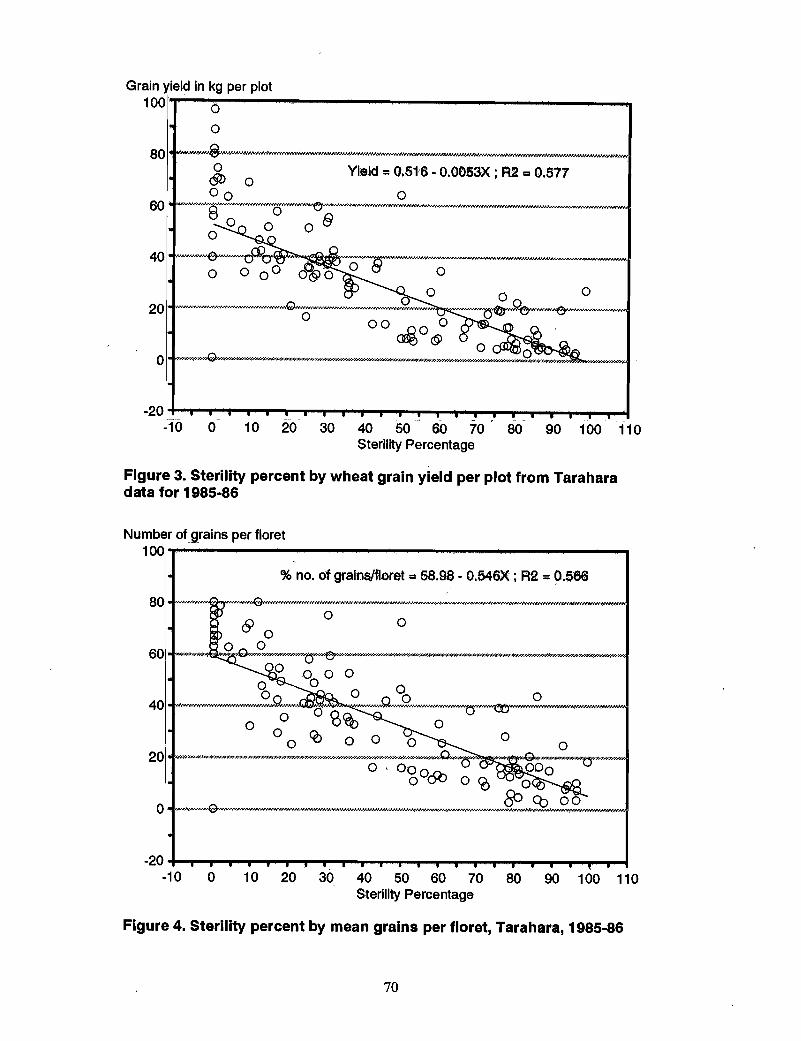
10 20 30 40 50 60 70' 80 90 100 110Sterility Percentage
10 20 30 40 50 60 70 80 90 100 110Sterility Percentage
Grain yield in k~ per plot100 0
o
o
20
o O'fQl"~I,,",o ;.'h"h" .,....»l':O--/h'..;'O,.o»"Ph" h" :<'..:.'.H .o»" .ol"h" :.:~:o''O»» :o'...:«<o' ..-I»" ~»' hY p»"..«,o)ow ,..~"' hv.J'.oXlo»
-201-t- --------...- -...- ...-~
-10 0
Figure 3. Sterility percent by wheat grain yield per plot from Taraharadata for 1985·86
Number of grains per floret100
% no. of grains/floret =58.98 " 0.546X ; R2 =0.566
-201......__....-...-~.......,r-"I'.....,......._-.......,..~ .........-...-...............,r-""I--r.....-I-10 0
Figure 4. Sterility percent by mean grains per floret, Tarahara, 1985·86
70
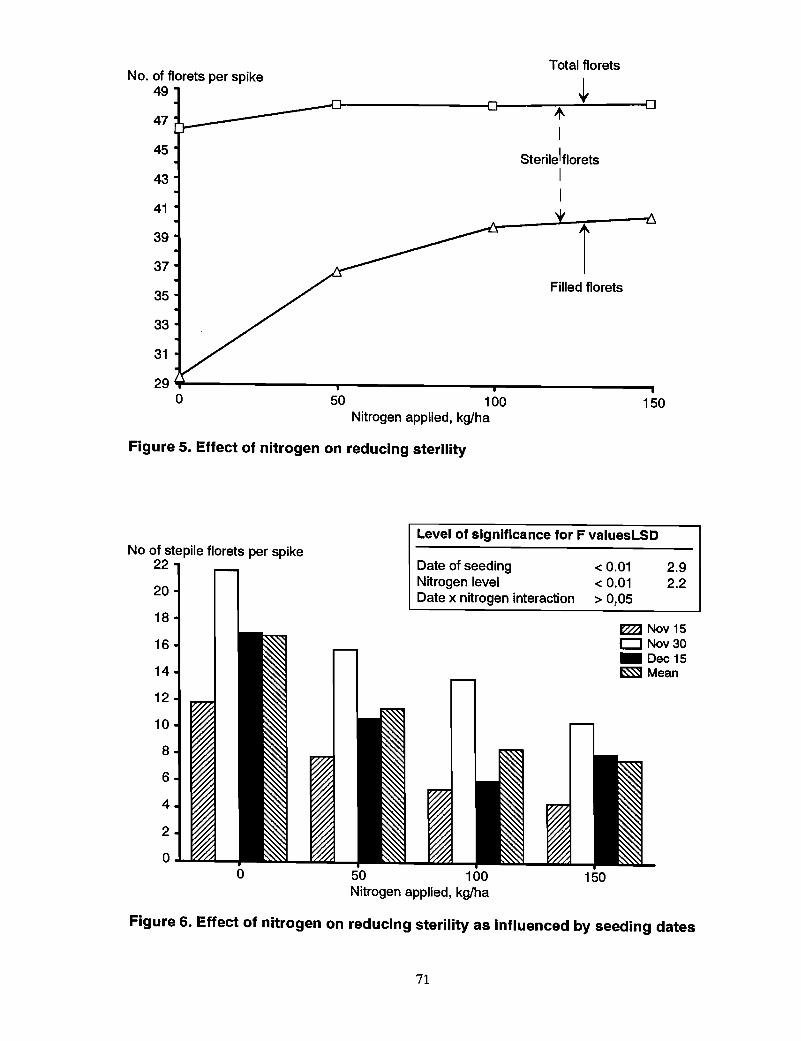
Total florets
150
Filled florets
+I
Sterile1floretsII
50 100Nitrogen applied, kg/ha
37
35
33
31
29 ¥--------_----------T----------.o
47
45
43
41
39
No. of florets per spike49
Figure 5. Effect of nitrogen on reducing sterility
Level of significance for F valuesLSD
IZ?a Nov 15o Nov 30_ Dec 15
~Mean
No of stepile florets per spike22
20
18
16
14
12
10
8
6
4
2
o~""""'_
Date of seedingNitrogen levelDate x nitrogen interaction
< 0.01< 0.01> 0,05
2.92.2
o 50 100Nitrogen applied, kg/ha
150
Figure 6. Effect of nitrogen on reducing sterility as influenced by seeding dates
71
WHEAT BORON DEFICIENCY IN YUNNAN, CHINA
YangYanhuaCereals Research Institute
Yunnan Academy of Agricultural ScienceKunming, Yunnan, China
Abstract
All soils in Yunnan Province, China, are boron (B)-deficient. Based on research results,it has been determined that B deficiency is the main cause of empty wheat spikelets orspikes and that the empty spikelets or spikes can be nearly or fully avoided by applyingboric fertilizers.
Boron Content of the Soils in Yunnan
In the province, the average total boron (B) in the soil is 37.4 ppm, while in China as awhole it is 64 ppm. The average available B is only 0.177 ppm.
Normally, soils in the region developed from base- and superbase-igneous rock,limestone soil, strongly-leached acid soil, light soil, peat soil with high humus, bog soil,and soil with pH 7.1-8.1. All are B-deficient.
All soils in Dehong, Baoshan, Simao, and Xishuangbanna prefectures are red earthsdeveloped from granite, with light texture and low total B content. Moreover, strongleaching greatly decrease the content of water soluble boron of these soils. In Dehong, Bdeficiency is more severe. Available B is 0 to 0.33 ppm with an average of 0.084 ppm.The critical value for B deficiency is 0.5 ppm (HWSB).
Symptoms of B Deficiency in Wheat and Influencing Factors
During the flowering stage, glumes of spikelets open for 7 to 10 days or even longer,exposing very short filaments and thin, white anthers containing fewer and off-typepollen grains or none at all-thus causing sterile spikelets. The female gamete isobserved to be normal.
Observations showed that there were some differences in reaction to B deficiency causedby three factors.
• Difference of sterility between varieties. In Dehong, sterility in varieties "SaricF70", ''Tanori F71", "Spring 980", and others is more severe than in varieties"Nanyuan No.1" and "Sonora 64".
• Sterility in sites that have lower, damp, badly drained soils is also more severe.
• Late sowing normally causes higher sterility, e.g., the following values werefound in variety "Saric F70":
Sowing date
Mid-OctoberEarly NovemberLate November
Percentage of sterility
193188
72
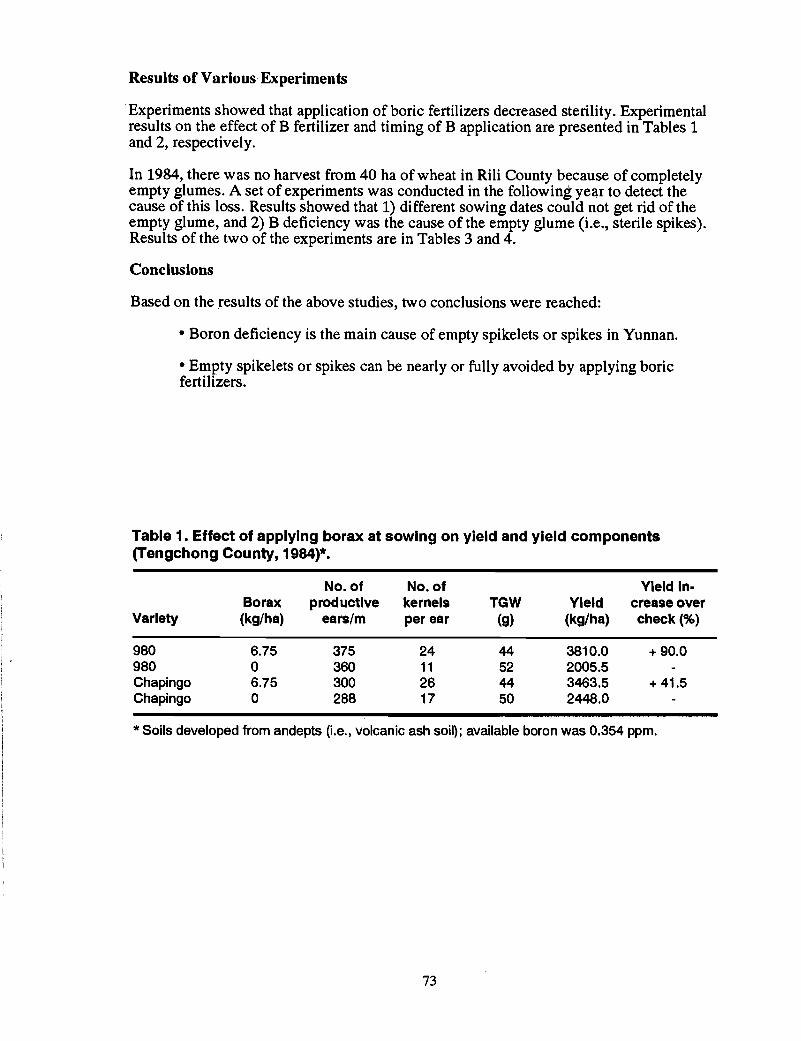
Results of Various Experiments
.Experiments showed that application of boric fertilizers decreased sterility. Experimentalresults on the effect of B fertilizer and timing of B application are presented in Tables 1and 2, respectively.
In 1984, there was no harvest from 40 ha of wheat in Rili County because of completelyempty glumes. A set of experiments was conducted in the following year to detect thecause of this loss. Results showed that 1) different sowing dates could not get rid of theempty glume, and 2) B deficiency was the cause of the empty glume (Le., sterile spikes).Results of the two of the experiments are in Tables 3 and 4.
Conclusions
Based on the results of the above studies, two conclusions were reached:
• Boron deficiency is the main cause of empty spikelets or spikes in Yunnan.
• Empty spikelets or spikes can be nearly or fully avoided by applying boricfertilizers.
Table 1. Effect of applying borax at sowing on yield and yield components(Tengchong County, 1984)*.
No. of No. of Yield In-Borax productive kernels TGW Yield crease over
Variety {kg/hal ears/m per ear (g) (kg/hal check{%)
980 6.75 375 24 44 3810.0 + 90.0980 0 360 11 52 2005.5Chapingo 6.75 300 26 44 3463.5 + 41.5Chapingo 0 288 17 50 2448.0
* Soils developed from andepts (i.e., volcanic ash soil); available boron was 0.354 ppm.
73
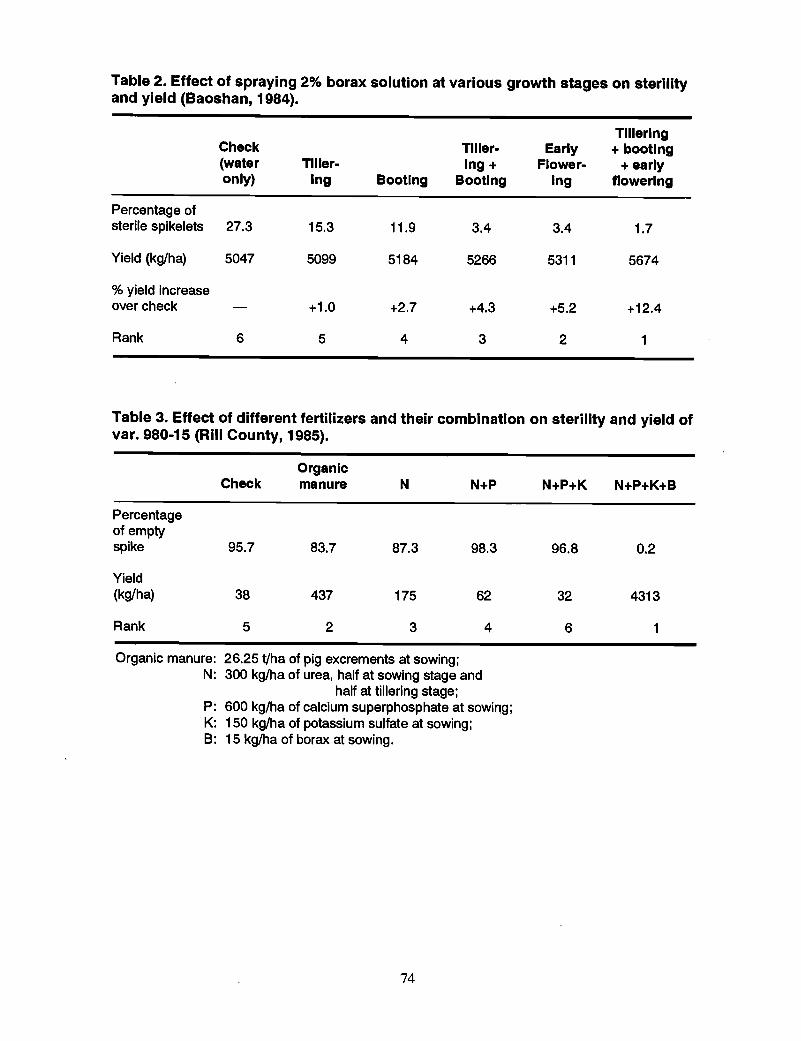
Table 2. Effect of spraying 2% borax solution at various growth stages on sterilityand yield (Baoshan, 1984).
TllleringCheck Tiller- Early + booting(water Tiller- Ing + Flower- + earlyonly) Ing Booting Booting Ing flowering
Percentage ofsterile spikelets 27.3 15.3 11.9 3.4 3.4 1.7
Yield (kg/ha) 5047 5099 5184 5266 5311 5674
% yield increaseover check +1.0 +2.7 +4.3 +5.2 +12.4
Rank 6 5 4 3 2 1
Table 3. Effect of different fertilizers and their combination on sterility and yield ofvar. 980-15 (Rili County, 1985).
OrganicCheck manure N N+P N+P+K N+P+K+B
Percentageof emptyspike 95.7 83.7 87.3 98.3 96.8 0.2
Yield(kg/ha) 38 437 175 62 32 4313
Rank 5 2 3 4 6 1
Organic manure: 26.25 t/ha of pig excrements at sowing;N: 300 kg/ha of urea, half at sowing stage and
half at tillering stage;P: 600 kg/ha of calcium superphosphate at sowill9;K: 150 kg/ha of potassium sulfate at sowing;B: 15 kg/ha of borax at sowing.
74
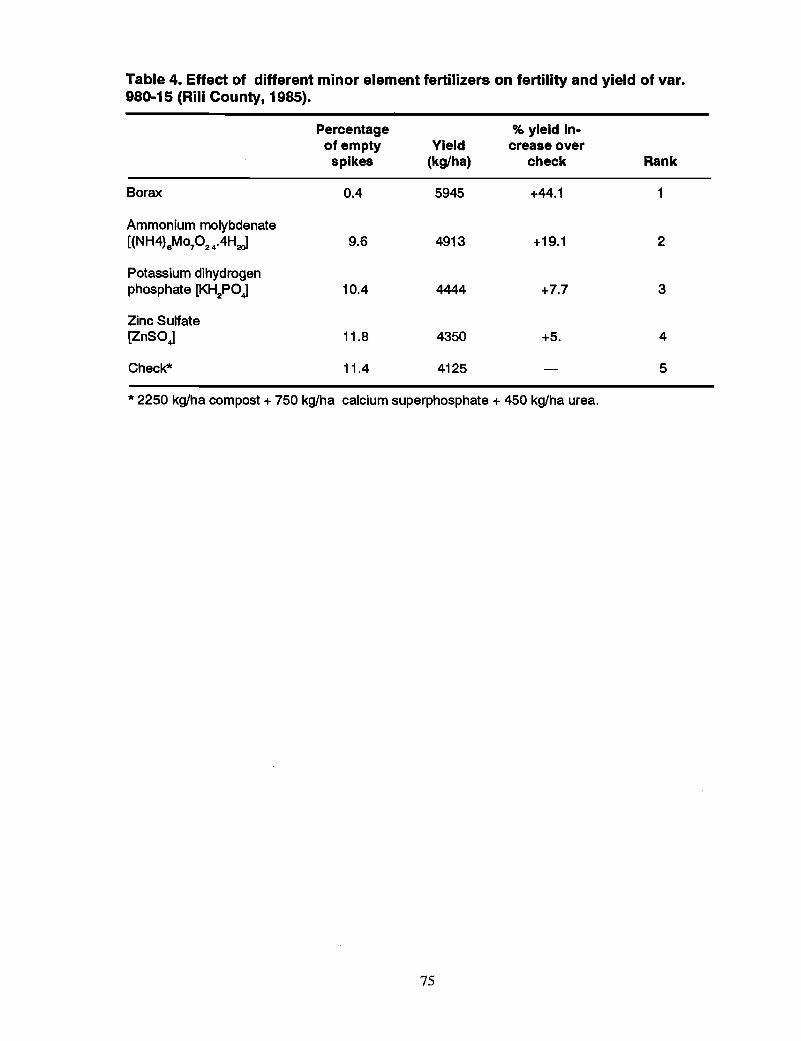
Table 4. Effect of different minor element fertilizers on fertility and yield of var.980-15 (Rili County, 1985).
Percentage % yield In-of empty Yield crease overspikes (kg/ha) check Rank
Borax 0.4 5945 +44.1 1
Ammonium molybdenate[(NH4)eMoP24.4H2J 9.6 4913 +19.1 2
Potassium dihydrogenphosphate [KH2POJ 10.4 4444 +7.7 3
Zinc Sulfate[ZnSOJ 11.8 4350 +5. 4
Check* 11.4 4125 5
* 2250 kg/ha compost + 750 kg/ha calcium superphosphate + 450 kg/ha urea.
75
WHEAT VARIETAL SCREENING FOR BORON DEFICIENCY IN INDIA
J.P. Tandon and S.M.A. NaqviDirectorate of Wheat Research
Kamal, India
Abstract
In general, Indian soils are not deficient in boron (B), but in some pockets in thenortheastern parts of the country this problem occurs. B deficiency symptoms vary withthe kind and age of the plant, the conditions of growth, and the severity of deficiency.Each crop produces its characteristic growth abnormalities associated with B deficiency.In wheat, it causes floret infertility or grain set failure. The Directorate of WheatResearch has conducted some probe experiments in the form of preliminary screeningnurseries at a few selected locations during 1988-89 and 1989-90. It was concluded thatvarieties BW 11, BW 1008, and HDR 77 appear to possess a fair degree of tolerance to Bdeficiency, while HD 2285, HD 2402, and Sonalika may be classified as moderatelytolerant. .
Introduction
Wheat is the most important winter cereal in India. During 1990-91, the crop was grownon an area of about 23.977 million hectares, producing nearly 54.52 million tons ofgrain. The major wheat producing areas lie in North and Central India. In general, Indiansoils are not deficient in boron (B), but in some pockets in the northeastern parts of thecountry this problem occurs. These pockets are mainly located in the states of WestBengal, Assam, Orissa, and along the Indo-Nepal border.
Boron is an essential nutrient for normal development of plants. B deficiency symptomsvary with the kind and age of the plant, the conditions of growth, and the severity ofdeficiency. Each crop produces its characteristic growth abnormalities associated with Bdeficiency. In wheat, it causes floret infertility or grain set failure. The grain set may failin any floret from the basal upward, although the florets appear complete with fullydeveloped palea and lemma. The anthers are absent or not properly developed with a fewmalformed pollen grains. The florets usually remain open for several days at the time ofanthesis, giving the ear a transparent appearance against light.
Materials and Methods
Because of the localized occurrence and erratic nature of this problem, it has not beengiven sufficient attention in the past. However, as it is a cause of great concern in theaffected areas, the Directorate of Wheat Research has conducted some probe experimentsin the form of preliminary screening nurseries at a few selected locations during 1988-89and 1989-90. A set of the 15 most widely grown and recently developed wheat varietiesfor the region were selected for this experiment. The varieties tested were: HP 1102, HP1209, UP 262, HD 1982, HD 2285, HD 2307, HD 2385, HD 2402, HDR 77, HOW 206,HUW 234, C 306, Sonalika, BW 11, and BW 1008.
In a plot with a known history of sterility problems, two 6-row plots of 6 x 1.38 m eachof every variety were grown. In one plot, no borax was applied while the other plot wasgiven borax at the rate of 10 kg/ha. The cooperators were requested to recordobservations on germination percentage, general vigor, sterility percentage (visual atanthesis), number of spikelets per main ear, number of grains per ear, 1000-grain weight,and grain yield per plot.
76
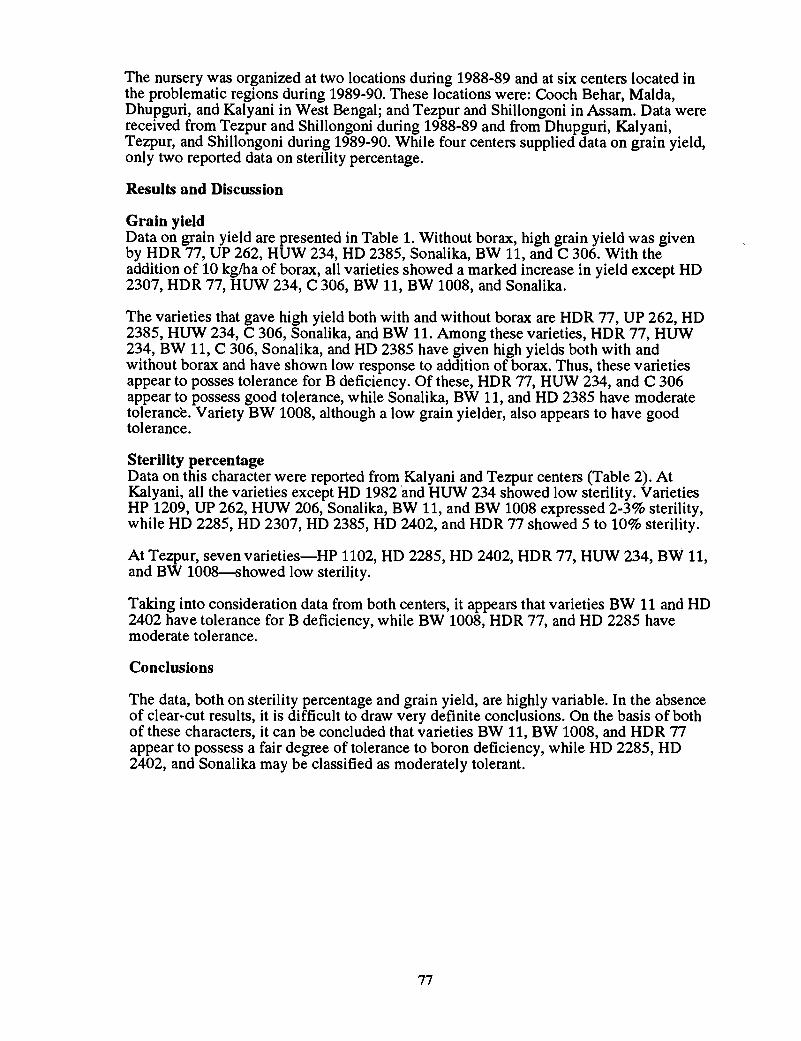
The nursery was organized at two locations during 1988-89 and at six centers located inthe problematic regions during 1989-90. These locations were: Cooch Behar, MaIda,Dhupguri, and Kalyani in West Bengal; and Tezpur and Shillongoni in Assam. Data werereceived from Tezpur and Shillongoni during 1988-89 and from Dhupguri, Kalyani,Tezpur, and Shillongoni during 1989-90. While four centers supplied data on grain yield,only two reported data on sterility percentage.
Results and Discussion
Grain yieldData on grain yield are presented in Table 1. Without borax, high grain yield was givenby HDR 77, UP 262, HUW 234, HD 2385, Sonalika, BW 11, and C 306. With theaddition of 10 kglha of borax, all varieties showed a marked increase in yield except HD2307, HDR 77, HUW 234, C 306, BW 11, BW 1008, and Sonalika.
The varieties that gave high yield both with and without borax are HDR 77, UP 262, HD2385, HOW 234, C 306, Sonalika, and BW 11. Among these varieties, HDR 77, HOW234, BW 11, C 306, Sonalika, and HD 2385 have given high yields both with andwithout borax and have shown low response to addition of borax. Thus, these varietiesappear to posses tolerance for B deficiency. Of these, HDR 77, HUW 234, and C 306appear to possess good tolerance, while Sonalika, BW 11, and HD 2385 have moderatetolerance. Variety BW 1008, although a low grain yielder, also appears to have goodtolerance.
Sterility percentageData on this character were reported from Kalyani and Tezpur centers (Table 2). AtKalyani, all the varieties except HD 1982 and HUW 234 showed low sterility. VarietiesHP 1209, UP 262, HUW 206, Sonalika, BW 11, and BW 1008 expressed 2-3% sterility,while HD 2285, HD 2307, HD 2385, HD 2402, and HDR 77 showed 5 to 10% sterility.
At Tezpur, seven varieties-HP 1102, HD 2285, HD 2402, HDR 77, HOW 234, BW 11,and BW 1008---showed low sterility.
Taking into consideration data from both centers, it appears that varieties BW 11 and HD2402 have tolerance for B deficiency, while BW 1008, HDR 77, and HD 2285 havemoderate tolerance.
Conclusions
The data, both on sterility percentage and grain yield, are highly variable. In the absenceof clear-cut results, it is difficult to draw very definite conclusions. On the basis of bothof these characters, it can be concluded that varieties BW 11, BW 1008, and HDR 77appear to possess a fair degree of tolerance to boron deficiency, while HD 2285, HD2402, and Sonalika may be classified as moderately tolerant.
77
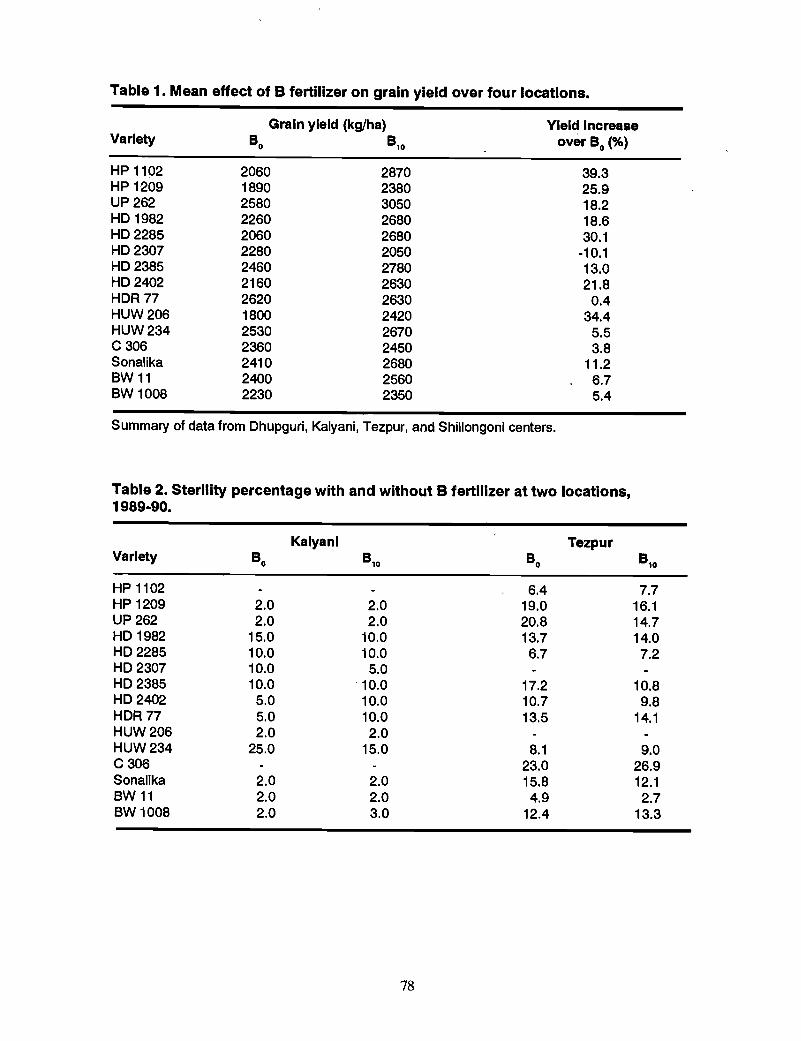
Table 1. Mean effect of B fertilizer on grain yield over four locations.
VarietyGrain yield (kg/ha)
8 0 8'0Yield Increase
over 80
(%)
HP 1102HP 1209UP 262HD 1982HD 2285HD 2307HD 2385HD 2402HDR77HUW206HUW234C306SonalikaBW 11BW 1008
206018902580226020602280246021602620180025302360241024002230
287023803050268026802050278026302630242026702450268025602350
39.325.918.218.630.1
-10.113.021.8
0.434.4
5.53.8
11.26.75.4
Summary of data from Dhupguri, Kalyani, Tezpur, and Shillongoni centers.
Table 2. Sterility percentage with and without B fertilizer at two locations,1989·90.
Kalyani TezpurVariety 8 0 8'0 8 0 8'0
HP 1102 6.4 7.7HP 1209 2.0 2.0 19.0 16.1UP 262 2.0 2.0 20.8 14.7HD 1982 15.0 10.0 13.7 14.0HD 2285 10.0 10.0 6.7 7.2HD 2307 10.0 5.0HD 2385 10.0 ·10.0 17.2 10.8HD 2402 5.0 10.0 10.7 9.8HDR77 5.0 10.0 13.5 14.1HUW206 2.0 2.0HUW234 25.0 15.0 8.1 9.0C306 23.0 26.9Sonalika 2.0 2.0 15.9 12.1BW 11 2.0 2.0 4.9 2.7BW 1008 2.0 3.0 12.4 13.3
78
SCREENING FOR BORON DEFICIENCY IN WHEAT
S. Jamjod1, C.E. Mann2, and B. Rerkasem1
1 Agronomy Department, Faculty of AgricultureChiang Mai University, Chiang Mai, Thailand
2 CIMMYT, Bangkok, Thailand
Abstract
To supply breeders in Thailand and the region of South and Southeast Asia withinformation of genetic boron (B) deficiency tolerance of bread wheat germplasm, broadscreening of adapted and newly introduced material was undertaken. A two-step testingsystem is used. Field plots with and without B fertilizer in a deficient soil (< 0.12 mg hotwater soluble B/kg soil) followed by sand culture of promising lines with 0 and 0.2 ~Mof B in a nutrient solution. The following lines proved to be better than deficiencytolerant checks CMU26 and Sonora 64: Fang 60, HAHN*2IPRL, #144, CN079*2IPRL,Iosee 2, and #1510.
Introduction
Boron-deficient soils are known to affect yields of several crops in Thailand (Rerkasemet al. 1987). Genetic variability for tolerance has been reported in wheat (Ganguly 1979,Chatterjee et al. 1980, Mehrotra et al. 1980, Mandai 1987, Rerkasem 1990). Bread wheatis currently being introduced to farmers in Thailand as a new crop. In order to give localand regional breeders information on boron deficiency tolerance (Bdt) of adapted linesscreening of suitable introductions and varieties with proven value was undertaken.
Materials and Methods
A two-step approach for identification of Bdt was used:
-During the first year, screening of numerous lines in the field in low B soil «0.12 mg of hot water soluble B/kg) with (1 kg B/ha) and without B application(Boron Deficiency Observation Nursery or BDON) was done. Plot size in thisnursery was single rows of 2.5 m with B+ and BO rows facing each other. Thesusceptible check, SW41, was sown every 20 rows.
- During the second year, screening was done in sand culture watered twice dailywith a nutrient solution containing two levels of Boron: nil (BO) and 0.2 ~M (B+)(Boron Screening Nursery or BSN). Two replications of five plants per varietywere sown together with deficiency susceptible (Bds) standards, SW41 andSW23, and deficiency tolerant standards, Sonora 64 and CMU26.
Data taken were: days to anthesis and grainslFl+2, Le., average number of grains in thetwo basal florets (Fl +2) of the 10 central spikelets of an ear.
The genetic material for BDON included:
- Recent introductions from various countries, including the latest advanced linesfrom CIMMYT as far as they passed a moderate selection for general adaptationto North Thailand;
79
- The 5th and 6th Hot Climate Wheat Screening Nursery made from submissionsby breeders in hot environments worldwide; and
-The Thai national wheat nurseries, 1990-91, representing the most promisinglines in the country. Altogether, 714 entries were tested. The BSN consisted ofthe most Bdt material of the BDON of 1989-90, 20 entries in total.
Results
In the BO plot of the BDON, 312 lines had less than 1.5 grains/F1+2; 330 entries setmore grains in B+ plots than in BO; 17 lines set less; 188 were not different. Fertilityvalues of the 25 most tolerant lines of the BDON are given in Table 1 together with theaverage of the Bds check, SW41.
In the BSN, the Bds standards, SW41 and SW23, set virtually no grain (Table 2). TheBdt standards CMU26 and Sonora 64 set 0.65 and 0.33 grains/F1+2, respectively. Threegenotypes were significantly more tolerant than the better Bdt check under bothconditions, BO and B+. These were #144, Fang 60 (sister line of #144), and HAHN*2/PRL. Three others were significantly different in either BO or B+: CN079*2IPRL, Insee2, and #1510. Three more could be classified as similar in reaction to Bdt checks. All"others were as low as the Bds checks.
Discussion
The ratio between BO and B+ values is expected to be equal or smaller than 1. Findingvalues above one (Table 1) indicates considerable variability of the soil B content.Therefore, confirmation of the BDON results will be sought through more precise sandculture testing of the best 25 lines in 1991-92. Such testing under severe conditions tendsto correct wrong classification as is shown in BSN results, where about half of the firstyear Bdt entries are rejected (Table 2).
In the BSN, low values for Bdt checks in the BO plots indicate the severity of deficiency.The best lines detected have now been made checks for further B deficiency research.Fang 60 is currently considered the best adapted variety in Thailand; it may owe part ofthis to its B deficiency tolerance. The lines identified here as Bdt are considered usefulfor parental material in crossing programs in Thailand and the region because they showa good degree of adaptation in addition to deficiency tolerance.
Acknowledgment
Financial assistance for this research from AIDAB is gratefully acknowledged.
References Cited
Chatterjee, B.N., M. Chatterjee, and N.R. Das. 1980. Note on differences in the responseof wheat varieties to boron. Indian J. Agr. Sc. 50:796.
Ganguly, B. 1979. Note on seedlessness in some wheat varieties caused by borondeficiency. Indian J. Agr. Sc. 49:384-386.
MandaI, A.B. 1987. Genetic responses of boron on bread wheat varieties under terai soil.J. Maharashtra Agr. U. 12:268-269.
80
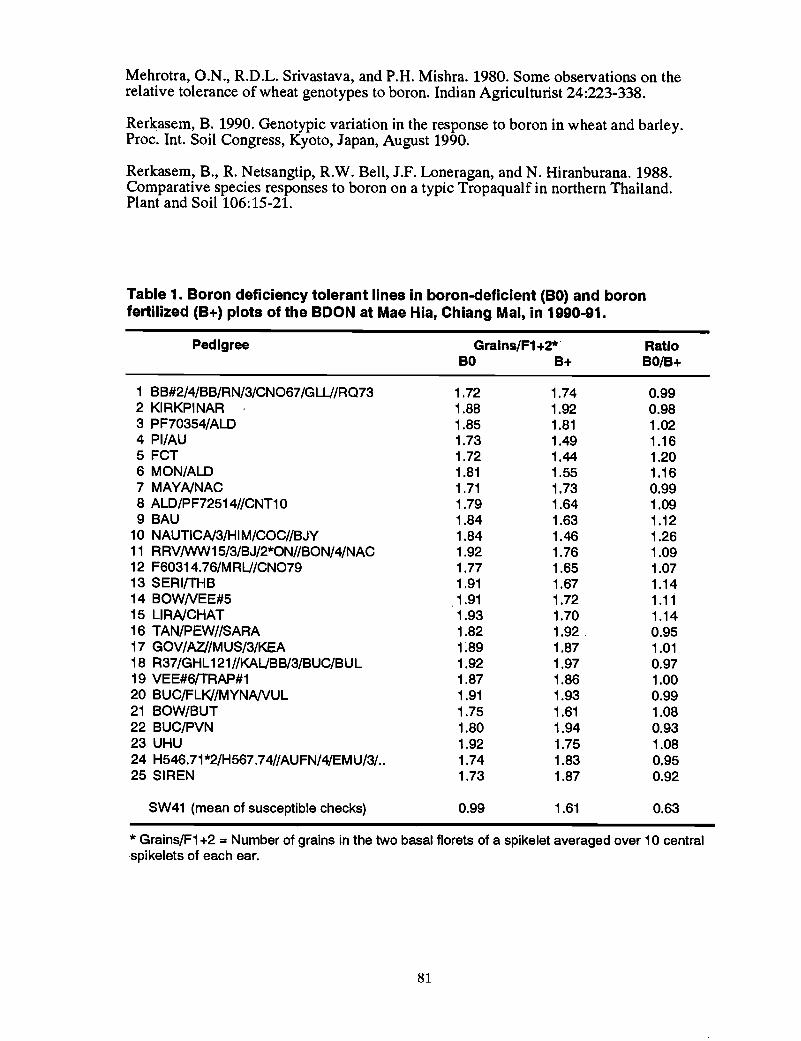
Mehrotra, a.N., R.D.L. Srivastava, and P.H. Mishra. 1980. Some observations on therelative tolerance of wheat genotypes to boron. Indian Agriculturist 24:223-338.
Rerkasem, B. 1990. Genotypic variation in the response to boron in wheat and barley.Proc. Int. Soil Congress, Kyoto, Japan, August 1990.
Rerkasem, B., R. Netsangtip, R.W. Bell, J.F. Loneragan, and N. Hiranburana. 1988.Comparative species responses to boron on a typic Tropaqualf in northern Thailand.Plant and Soil 106:15-21.
Table 1. Boron deficiency tolerant lines in boron-deficient (BO) and boronfertilized (B+) plots of the BOON at Mae Hia, Chiang Mal, in 1990-91.
Pedigree Gralns/F1+2* Ratio80 8+ 80/8+
1 BB#2/4/BB/RN/3/CN067/GLU/RQ73 1.72 1.74 0.992 KIRKPINAR 1.88 1.92 0.983 PF70354/ALD 1.85 1.81 1.024 PI/AU 1.73 1.49 1.165 FCT 1.72 1.44 1.206 MON/ALD 1.81 1.55 1.167 MAYA/NAC 1.71 1.73 0.998 ALD/PF72514//CNT10 1.79 1.64 1.099 BAU 1.84 1.63 1.12
10 NAUTICA/3/HIM/COC//BJY 1.84 1.46 1.2611 RRV/WW15/3/BJ/2*ON//BON/4/NAC 1.92 1.76 1.0912 F60314.76/MRU/CN079 1.77 1.65 1.0713 SERI/THB 1.91 1.67 1.1414 BOWNEE#5 1.91 1.72 1.1115 LIRA/CHAT 1.93 1.70 1.1416 TAN/PEW//SARA 1.82 1.92. 0.9517 GOV/AZ//MUS/3/KEA 1:89 1.87 1.0118 R37/GHL121//KAUBB/3/BUC/BUL 1.92 1.97 0.9719 VEE#6/TRAP#1 1.87 1.86 1.0020 BUC/FLK//MYNA/VUL 1.91 1.93 0.9921 BOW/BUT 1.75 1.61 1.0822 BUC/PVN 1.80 1.94 0.9323 UHU 1.92 1.75 1.0824 H546.71*2/H567.74//AUFN/4/EMU/3/.. 1.74 1.83 0.9525 SIREN 1.73 1.87 0.92
SW41 (mean of susceptible checks) 0.99 1.61 0.63
* Grains/F1 +2 =Number of grains in the two basal florets of a spikelet averaged over 10 centralspikelets of each ear.
81
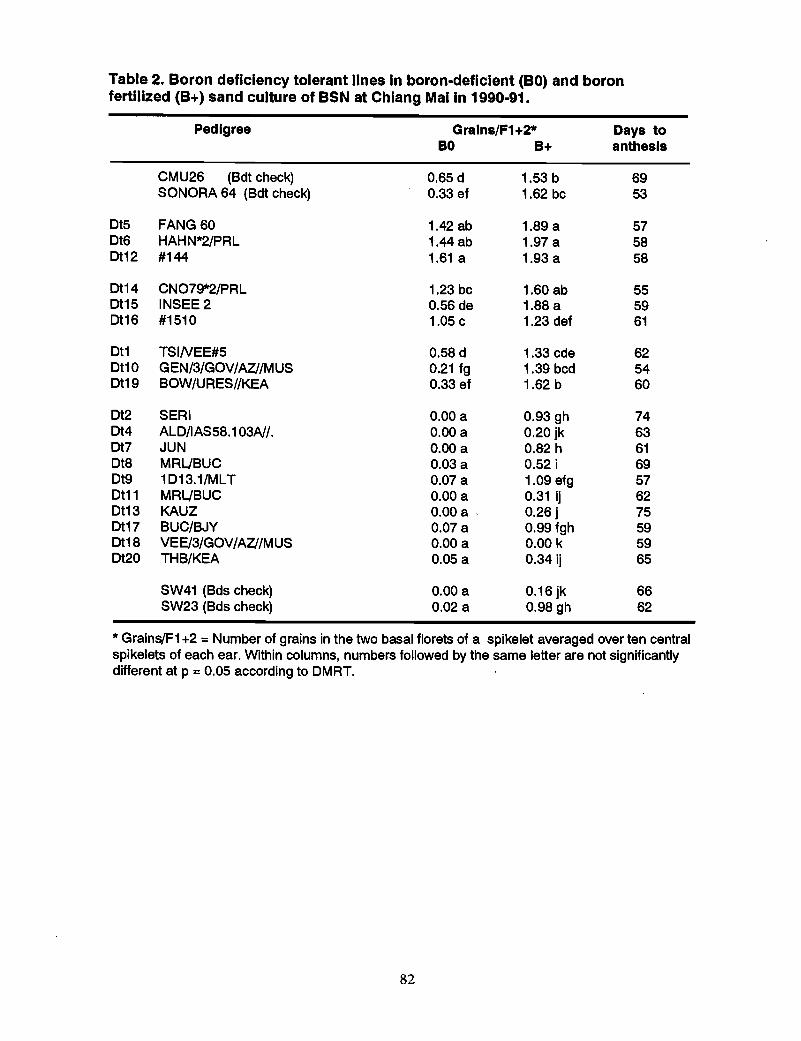
Table 2. Boron deficiency tolerant lines In boron-deficient (BO) and boronfertilized (B+) sand culture of BSN at Chiang Malin 1990-91.
Pedigree Gralns/F1+2* Days toBO B+ anthesls
CMU26 (Bdt check) 0.65d 1.53 b 69SONORA 64 (Bdt check) 0.33 ef 1.62 bc 53
Dt5 FANG 60 1.42 ab 1.89 a 57Dt6 HAHN*2/PRL 1A4ab 1.97 a 58Dt12 #144 1.61 a 1.93 a 58
Dt14 CN079*2/PRL 1.23 bc 1.60 ab 55Dt15 INSEE2 0.56 de 1.88 a 59Dt16 #1510 1.05 c 1.23 def 61
Dt1 TSINEE#5 0.58 d 1.33 cde 62Dt10 GEN/3/GOV/AZI/MUS 0.21 fg 1.39 bcd 54Dt19 BOW/URESI/KEA 0.33 ef 1.62 b 60
Dt2 SERI 0.00 a 0.93 gh 74Dt4 ALD/IAS58.103A//. 0.00 a 0.20 jk 63Dt7 JUN 0.00 a 0.82 h 61Dt8 MRUBUC 0.03 a 0.52 i 69Dt9 1D13.1/MLT 0.07 a 1.09 efg 57Dt11 MRUBUC 0.00 a 0.31 ij 62Dt13 KAUZ 0.00 a . 0.26 j 75Dt17 BUC/BJY 0.07 a 0.99 fgh 59Dt18 VEE/3/GOV/AZI/MUS 0.00 a 0.00 k 59Dt20 THB/KEA 0.05 a 0.34ij 65
SW41 (Bds check) 0.00 a 0.16 jk 66SW23 (Bds check) 0.02 a 0.98 gh 62
* Grains/F1 +2 =Number of grains in the two basal florets of a spikelet averaged over ten centralspikelets of each ear. Within columns, numbers followed by the same letter are not significantlydifferent at p =0.05 according to DMRT.
82
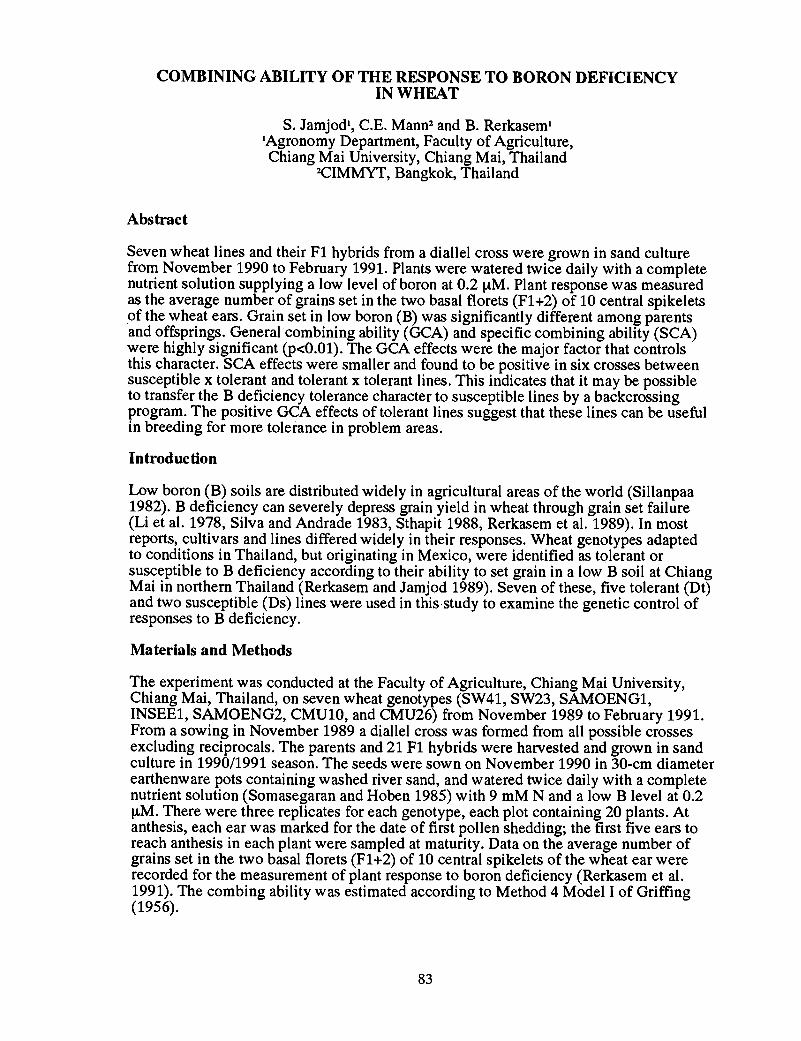
COMBINING ABILITY OF THE RESPONSE TO BORON DEFICIENCYIN WHEAT
S. Jamjod1, C.E. Mann2 and B. Rerkasem1
lAgronomy Department, Faculty of Agriculture,Chiang Mai University, Chiang Mai, Thailand
2CIMMYT, Bangkok, Thailand
Abstract
Seven wheat lines and their Fl hybrids from a diallel cross were grown in sand culturefrom November 1990 to February 1991. Plants were watered twice daily with a completenutrient solution supplying a low level of boron at 0.2 ~M. Plant response was measuredas the average number of grains set in the two basal florets (Fl+2) of 10 central spikeletsof the wheat ears. Grain set in low boron (B) was significantly different among parentsand offsprings. General combining ability (GCA) and specific combining ability (SCA)were highly significant (p<O.OI). The GCA effects were the major factor that controlsthis character. SCA effects were smaller and found to be positive in six crosses betweensusceptible x tolerant and tolerant x tolerant lines. This indicates that it may be possibleto transfer the B deficiency tolerance character to susceptible lines by a backcrossingprogram. The positive GCA effects of tolerant lines suggest that these lines can be usefulin breeding for more tolerance in problem areas.
Introduction
Low boron (B) soils are distributed widely in agricultural areas of the world (Sillanpaa1982). B deficiency can severely depress grain yield in wheat through grain set failure(Li et al. 1978, Silva and Andrade 1983, Sthapit 1988, Rerkasem et al. 1989). In mostreports, cultivars and lines differed widely in their responses. Wheat genotypes adaptedto conditions in Thailand, but originating in Mexico, were identified as tolerant orsusceptible to B deficiency according to their ability to set grain in a low B soil at ChiangMai in northern Thailand (Rerkasem and Jamjod 1989). Seven of these, five tolerant (Dt)and two susceptible (Ds) lines were used in this study to examine the genetic control ofresponses to B deficiency.
Materials and Methods
The experiment was conducted at the Faculty of Agriculture, Chiang Mai University,Chiang Mai, Thailand, on seven wheat genotypes (SW41, SW23, SAMOENGl,INSEEl, SAMOENG2, CMUI0, and CMU26) from November 1989 to February 1991.From a sowing in November 1989 a diallel cross was formed from all possible crossesexcluding reciprocals. The parents and 21 Fl hybrids were harvested and grown in sandculture in 1990/1991 season. The seeds were sown on November 1990 in 30-cm diameterearthenware pots containing washed river sand, and watered twice daily with a completenutrient solution (Somasegaran and Hoben 1985) with 9 mM N and a low B level at 0.2~M. There were three replicates for each genotype, each plot containing 20 plants. Atanthesis, each ear was marked for the date of first pollen shedding; the first five ears toreach anthesis in each plant were sampled at maturity. Data on the average number ofgrains set in the two basal florets (Fl+2) of 10 central spikelets of the wheat ear wererecorded for the measurement of plant response to boron deficiency (Rerkasem et at.1991). The combing ability was estimated according to Method 4 Model I of Griffing(1956).
83
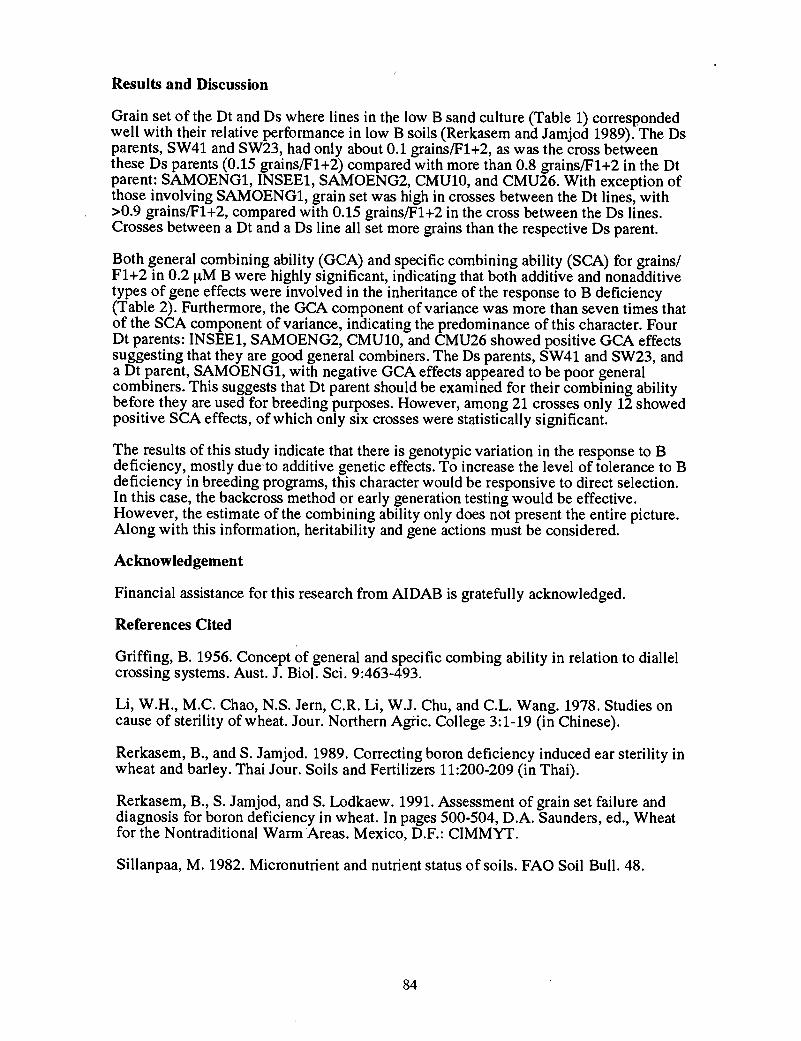
Results and Discussion
Grain set of the Ot and Os where lines in the low B sand culture (Table 1) correspondedwell with their relative performance in low B soils (Rerkasem and Jamjod 1989). The Osparents, SW41 and SW23, had only about 0.1 grainsIF1+2, as was the cross betweenthese Ds parents (0.15 grainsIF1+2) compared with more than 0.8 grainslF1+2 in the Otparent: SAMOENG1, INSEE1, SAMOENG2, CMU10, and CMU26. With exception ofthose involving SAMOENG1, grain set was high in crosses between the Dt lines, with>0.9 grainsIF1+2, compared with 0.15 grainslF1+2 in the cross between the Ds lines.Crosses between a Ot and a Os line all set more grains than the respective Ds parent.
Both general combining ability (GCA) and specific combining ability (SCA) for grains/F1+2 in 0.2 I-tM B were highly significant, indicating that both additive and nonadditivetypes of gene effects were involved in the inheritance of the response to B deficiency(Table 2). Furthermore, the GCA component of variance was more than seven times thatof the SCA component of variance, indicating the predominance of this character. FourDt parents: INSEE1, SAMOENG2, CMU10, and CMU26 showed positive GCA effectssuggesting that they are good general combiners. The Os parents, SW41 and SW23, anda Dt parent, SAMOENG1, with negative GCA effects appeared to be poor generalcombiners. This suggests that Dt parent should be examined for their combining abilitybefore they are used for breeding purposes. However, among 21 crosses only 12 showedpositive SCA effects, of which only six crosses were statistically significant.
The results of this study indicate that there is genotypic variation in the response to Bdeficiency, mostly due to additive genetic effects. To increase the level of tolerance to Bdeficiency in breeding programs, this character would be responsive to direct selection.In this case, the backcross method or early generation testing would be effective.However, the estimate of the combining ability only does not present the entire picture.Along with this information, heritability and gene actions must be considered.
Acknowledgement
Financial assistance for this research from AIOAB is gratefully acknowledged.
References Cited
Griffing, B. 1956. Concept of general and specific combing ability in relation to diallelcrossing systems. Aust. J. BioI. Sci. 9:463-493.
Li, W.H., M.C. Chao, N.S. Jern, C.R. Li, W.J. Chu, and C.L. Wang. 1978. Studies oncause of sterility of wheat. Jour. Northern Agfic. College 3:1-19 (in Chinese).
Rerkasem, 8., and S. Jamjod. 1989. Correcting boron deficiency induced ear sterility inwheat and barley. Thai Jour. Soils and Fertilizers 11:200-209 (in Thai).
Rerkasem, B., S. Jamjod, and S. Lodkaew. 1991. Assessment of grain set failure anddiagnosis for boron deficiency in wheat. In pages 500-504, D.A. Saunders, ed., Wheatfor the Nontraditional Warm Areas. Mexico, O.F.: CIMMYT.
Sillanpaa, M. 1982. Micronutrient and nutrient status of soils. FAO Soil Bull. 48.
84
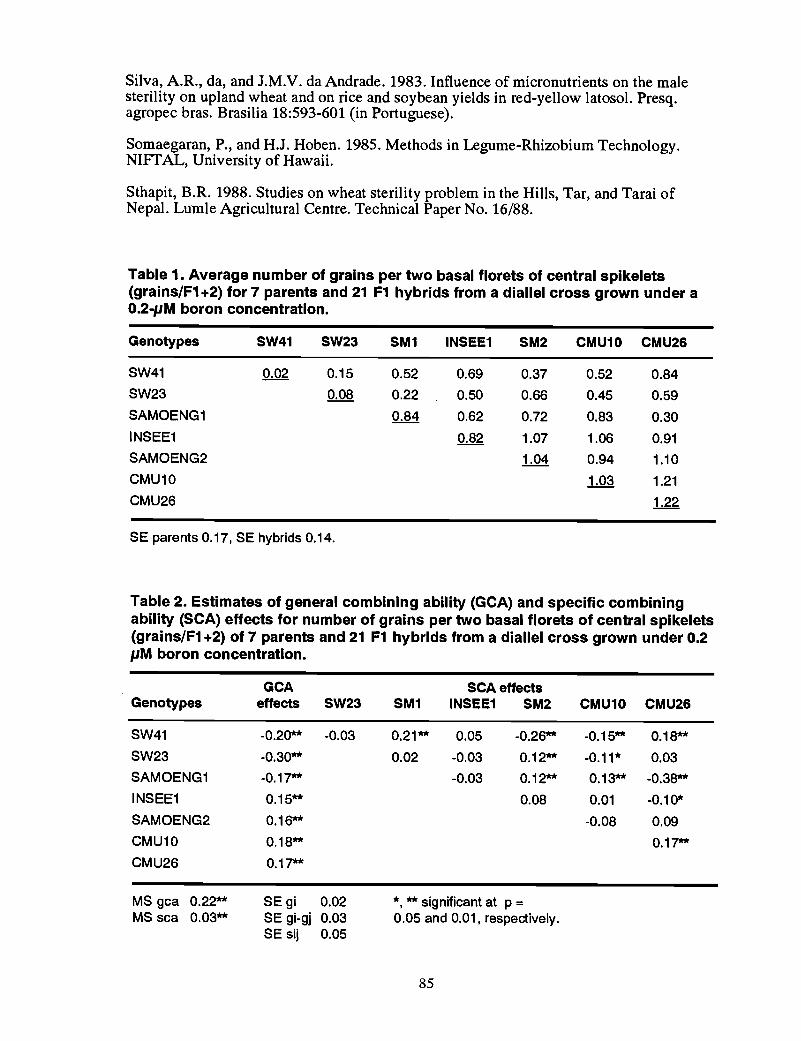
Silva, A.R., da, and J.M.V. da Andrade. 1983. Influence of micronutrients on the malesterility on upland wheat and on rice and soybean yields in red-yellow latosol. Presq.agropec bras. Brasilia 18:593-601 (in Portuguese).
Somaegaran, P., and H.J. Hoben. 1985. Methods in Legume-Rhizobium Technology.NIFfAL, University of Hawaii.
Sthapit, B.R. 1988. Studies on wheat sterility problem in the Hills, Tar, and Tarai ofNepal. Lumle Agricultural Centre. Technical Paper No. 16/88.
Table 1. Average number of grains per two basal florets of central spikelets(grains/F1 +2) for 7 parents and 21 F1 hybrids from a diallel cross grown under a0.2-pM boron concentration.
Genotypes SW41 SW23 SM1 INSEE1 SM2 CMU10 CMU26
SW41 0.02 0.15 0.52 0.69 0.37 0.52 0.84
SW23 0.08 0.22 0.50 0.66 0.45 0.59
SAMOENG1 0.84 0.62 0.72 0.83 0.30
INSEE1 0.82 1.07 1.06 0.91
SAMOENG2 1.04 0.94 1.10
CMU10 1.03 1.21
CMU26 1.22
SE parents 0.17, SE hybrids 0.14.
Table 2. Estimates of general combining ability (GCA) and specific combiningability (SeA) effects for number of grains per two basal florets of central spikelets(grains/F1 +2) of 7 parents and 21 F1 hybrids from a diallel cross grown under 0.2pM boron concentration.
GCAGenotypes effects SW23
SW41 -0.20** -0.03
SW23 -0.30**
SAMOENG1 -0.17**
INSEE1 0.15**
SAMOENG2 0.16**
CMU10 0.18**
CMU26 0.17**
MS gea 0.22** SEgi 0.02MS sea 0.03** SE gi-gj 0.03
SE sij 0.05
SCAeffectsSM1 INSEE1 SM2 CMU10 CMU26
0.21** 0.05 -0.26** -0.15** 0.18**
0.02 -0.03 0.12** -0.11* 0.03
-0.03 0.12** 0.13** -0.38**
0.08 0.01 -0.10*
-0.08 0.09
0.17**
*, ** signifieant at p =0.05 and 0.01, respectively.
85
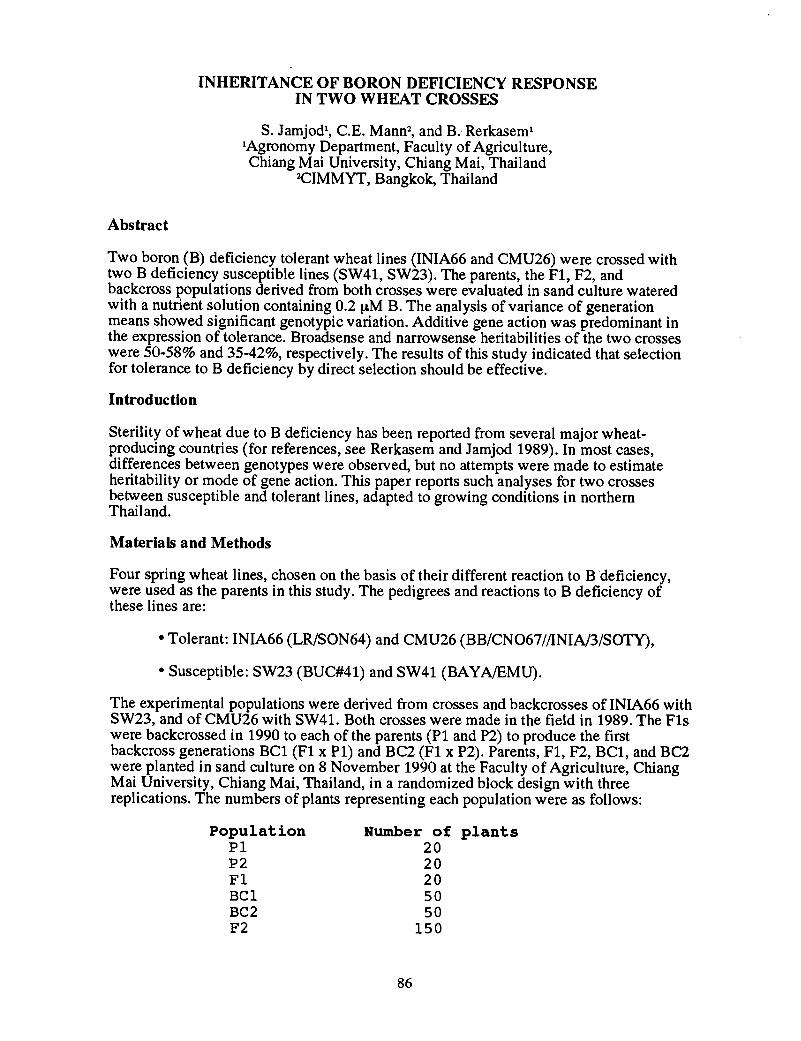
INHERITANCE OF BORON DEFICIENCY RESPONSEIN TWO WHEAT CROSSES
S. Jamjod1, C.E. Mann2, and B. Rerkasem1
lAgronomy Department, Faculty of Agriculture,Chiang Mai University, Chiang Mai, Thailand
2CIMMYT, Bangkok, Thailand
Abstract
Two boron (B) deficiency tolerant wheat lines (INIA66 and CMU26) were crossed withtwo B deficiency susceptible lines (SW41, SW23). The parents, the Fl, F2, andbackcross populations derived from both crosses were evaluated in sand culture wateredwith a nutrient solution containing 0.2 ~M B. The analysis of variance of generationmeans showed significant genotypic variation. Additive gene action was predominant inthe expression of tolerance. Broadsense and narrowsense heritabilities of the two crosseswere 50-58% and 35-42%, respectively. The results of this study indicated that selectionfor tolerance to B deficiency by direct selection should be effective.
Introduction
Sterility of wheat due to B deficiency has been reported from several major wheatproducing countries (for references, see Rerkasem and Jamjod 1989). In most cases,differences between genotypes were obselVed, but no attempts were made to estimateheritability or mode of gene action. This paper reports such analyses for two crossesbetween susceptible and tolerant lines, adapted to growing conditions in northernThailand.
Materials and Methods
Four spring wheat lines, chosen on the basis of their different reaction to Bdeficiency,were used as the parents in this study. The pedigrees and reactions to B deficiency ofthese lines are:
• Tolerant: INIA66 (LRISON64) and CMU26 (BB/CN067/IININ3/S0TY),
• Susceptible: SW23 (BUC#41) and SW41 (BAYAlEMU).
The experimental populations were derived from crosses and backcrosses of INIA66 withSW23, and of CMU26 with SW41. Both crosses were made in the field in 1989. The Flswere backcrossed in 1990 to each of the parents (Pl and P2) to produce the firstbackcross generations BCl (Fl x Pl) and BC2 (Fl x P2). Parents, Fl, F2, BC1, and BC2were planted in sand culture on 8 November 1990 at the Faculty of Agriculture, ChiangMai University, Chiang Mai, Thailand, in a randomized block design with threereplications. The numbers of plants representing each population were as follows:
PopulationPIP2FlBClBC2F2
Number of plants2020205050
150
86
After emergence, the plants were watered with a nutrient solution (Somasegaram andHoben 1985) containing 9 mM Nand 0.2 J-tM B twice daily. At maturity, five wheat earsfrom each plant were harvested. Counts of the average number of grains set in the twobasal florets (F1+2) of the 10 central spikelets of the ears were made on an individualplant basis.
The data from three replications were pooled to compute means and variances of eachpopulation for use in statistical interpretation of genetic effects. These were estimatedusing the additive-dominance model (Mather and Jinks 1971). Broadsense andnarrowsense heritability were calculated using the method of Warner (1952).
Results
Means, variances, and heritabilityGeneration means, estimates on components of variances, and heritabilities of the twocrosses and their offspring under low B availability are presented in Table 1. The sixpopulations for either cross differed significantly for the number of grains set per F1+2.The F1 means were intermediate between the two parental means in both crosses.Additive variance was almost three times that of dominance variance in both crosses,environmental variance was relatively high in CMU26 x SW41 cross. Broadsenseheritability was rather high (>50%). Narrowsense heritability estimates were also similarin magnitude, but rather low in the cross CMU26 x SW41 due to the high value of theenvironmental variance.
Gene effectsEstimates of parameters from generation mean analyses are presented in Table 2. Forboth crosses, a satisfactory fit of expected and observed generation means was obtainedwith the three-parameter model. The additive effects were significant; dominance effectswere negative, but not significant for either cross.
Discussion
In each cross, P1 exhibited a higher grain set than P2, but even these deficiency-tolerantparents had a severely reduced grain set of 0.58 and 0.99 grainsIF1 + 2 instead of 2.00 asexpected under normal conditions. Negative dominance effects indicated incompletedominance for susceptibility at this level of B concentration (0.2 J-tM); this is also evidentfrom the means of the F1 populations being below the mid-point between their parents.
Preponderance of additive effects is in agreement with the results of a diallel followingGriffing's (1956) method 4, model 1 (Jamjod et al. 1992). These findings, together withthe degree of heritability obtained in this study, suggest that selection for tolerance to Bdeficiency should be effective in this material under sand culture. In the field, theimmobility of B within the plant, interacting with the low availability in the soil andearliness of the genotype, may render selection in segregating populations unreliable.Several years of testing of homozygous populations may be preferable.
Acknowledgment
Financial assistance for this research from AIDAB is gratefully acknowledged.
87
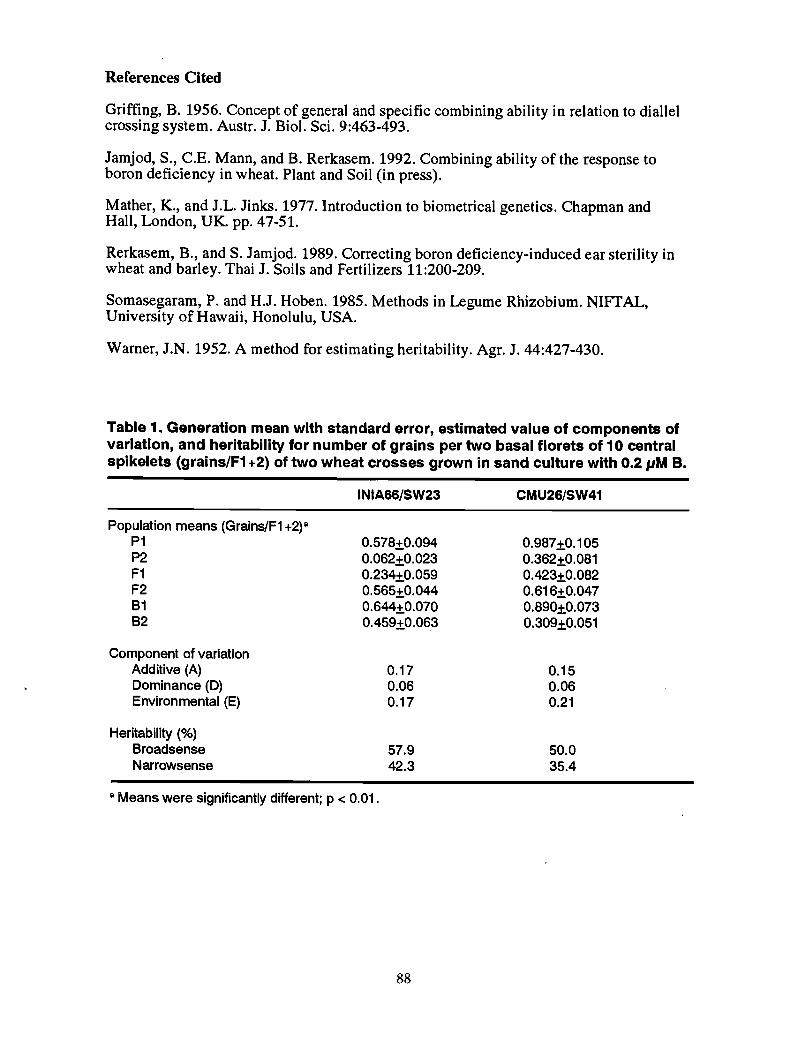
References Cited
Griffing, B. 1956. Concept of general and specific combining ability in relation to diallelcrossing system. Austr. J. BioI. Sci. 9:463-493.
Jamjod, S., C.E. Mann, and B. Rerkasem. 1992. Combining ability of the response toboron deficiency in wheat. Plant and Soil (in press).
Mather, K., and J.L. Jinks. 1977. Introduction to biometrical genetics. Chapman andHall, London, UK. pp. 47-51.
Rerkasem, B., and S. Jamjod. 1989. Correcting boron deficiency-induced ear sterility inwheat and barley. Thai J. Soils and Fertilizers 11:200-209.
Somasegaram, P. and H,J. Hoben. 1985. Methods in Legume Rhizobium. NIFTAL,University of Hawaii, Honolulu, USA.
Warner, J.N. 1952. A method for estimating heritability. Agr. J. 44:427-430.
Table 1. Generation mean with standard error, estimated value of components ofvariation, and heritability for number of grains per two basal florets of 10 centralspikelets (grains/F1 +2) of two wheat crosses grown in sand culture with 0.2 pM B.
Population means (Grains/F1 +2)8P1P2F1F28182
Component of variationAdditive (A)Dominance (D)Environmental (E)
Heritability (%)8roadsenseNarrowsense
INIA66/SW23
0.578±0.0940.062±0.0230.234±0.0590.565±0.0440.644±0.0700.459±0.063
0.170.060.17
57.942.3
CMU26/SW41
0.987±0.1050.362±0.0810.423±0.0820.616±0.0470.890±0.0730.309±0.051
0.150.060.21
50.035.4
8Means were significantly different; p < 0.01 .
88
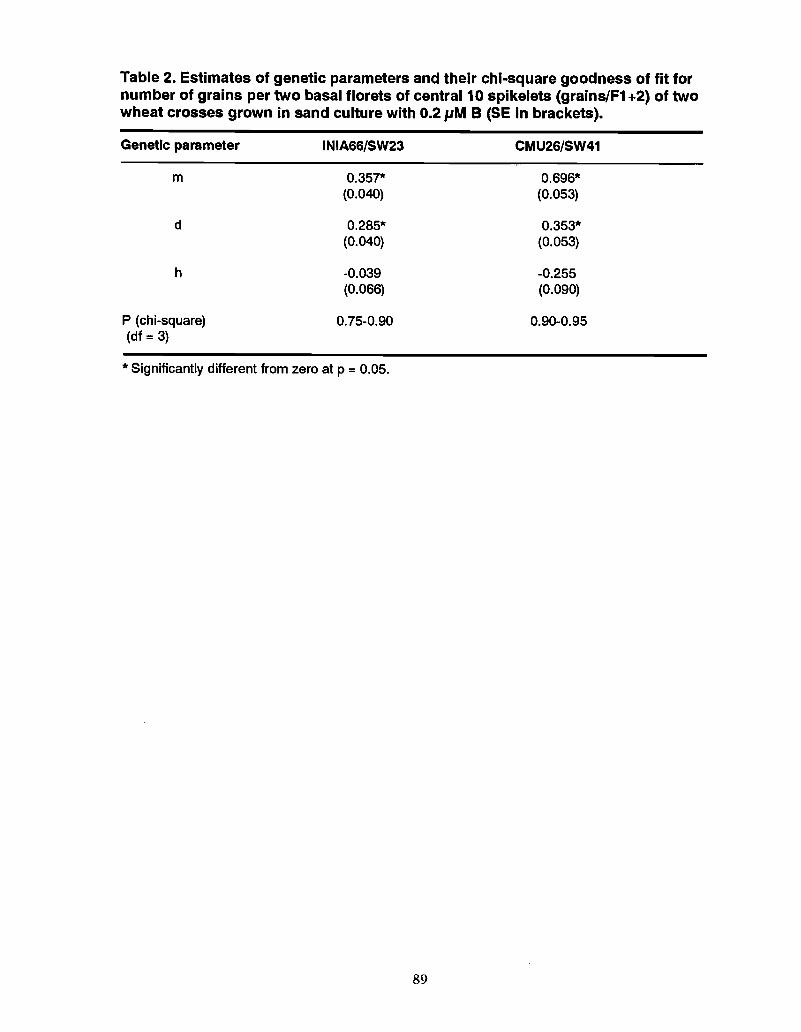
Table 2. Estimates of genetic parameters and their chi-square goodness of fit fornumber of grains per two basal florets of central 10 spikelets (grains/F1 +2) of twowheat crosses grown in sand culture with 0.2 11M B (SE in brackets).
Genetic parameter
m
d
h
P (chi-square)(df =3)
INIA66/SW23
0.357*(0.040)
0.285*(0.040)
-0.039(0.066)
0.75-0.90
CMU26/SW41
0.696*(0.053)
0.353*(0.053)
-0.255(0.090)
0.90-0.95
* Significantly different from zero at p = 0.05.
89
GENETICS AND BREEDING OF WHEAT FOR BORON TOXICITY
J.G. Paull, D.B. Moody, and A.J. RathjenWaite Agricultural Research Institute,
Glen Osmond, South Australia
Abstract
This paper reviews the strategy employed for breeding wheat tolerant to highconcentrations of boron (B). Similar methods have also been adopted for most otheragricultural species of southern Australia, including barley, oats, peas, and pasturemedics. The general steps involved in breeding for tolerance or resistance to anenvironmental stress are listed. Topics discussed include screening procedures, sources oftolerance, genetic control, and the backcrossing method for transferring tolerance.
Introduction
The occurrence of high concentrations of boron (B) in the soils of southern Australia andthe effect upon plant growth have been described by Nable (1992). A number of generalsteps are involved in breeding for tolerance or resistance to an environmental stress,including:
• Defining the extent of the problem and so determining whether breeding iswarranted. This will also identify selection sites within the target environment forlater field evaluation.
• Establishing genetic variation and identify sources of tolerance/resistance fortransfer to local varieties.
• Developing a screening technique to enable the large number of lines generatedby the breeding program to be assessed. The response of lines should beconsistent between the screening procedure and under naturally occurring stressconditions.
• Understanding the genetic control to devise an efficient breeding strategy.
• Understanding the physiological control to assist in developing screeningprocedures.
• Field evaluating advanced lines and selecting agronomically adapted types withhigh yield potential.
Nable (1992) has covered the extent of B toxicity and established that genetic variationexists among wheat, and indeed a number of important crops, and also described thephysiological control of tolerance to B. The remaining points will be discussed in relationto breeding wheat varieties tolerant to high concentrations of B.
Screening Procedures
The procedure adopted for mass screening for tolerance to B consists of growing plantsin large boxes (2 x 1 x 0.25 m) containing soil (surface soil of a red-brown earth) towhich a high concentration of B has been uniformly mixed (Moody et al. 1988). Theusual concentration of B, applied as a solution of boric acid (H3BOJ, is 150 mg/kg, but
90
lower concentrations are used when populations consist of generally sensitive material.The soil is re-used and periodically mixed to redistribute to B. The soil used is quitefertile, but supplementary nutrients are applied occasionally.
Seeds are imbibed in petri dishes containing moistened filter papers for 2-3 days and thensown in rows 4 cm apart with 2-3 cm between seeds. Standard tolerant and sensitivevarieties are included as a grid for reference. Plants are watered regularly for about 3weeks and then only occasionally. The restriction of moisture accentuates the differencebetween tolerant and sensitive lines as the tolerant lines produce more extensive rootsystems under high B conditions (Nable 1988) and are therefore able to draw uponmoisture deeper in the soil.
Plants are rated for tolerance to B between 4 and 6 weeks after sowing, depending uponthe season and plant growth rates (less time during periods of rapid growth). Plants arecompared with the grid of standard varieties with respect to vigor, symptom expression,and the development of tillers. Symptoms of B toxicity consist of necrosis developingfrom the tips of leaves to the base and are most severe on the oldest leaves (Paull et al.1990). Tolerant lines are more vigorous and develop less severe symptoms then sensitivelines and may also produce tillers whereas sensitive lines do not (Paull et al. 1990).
While this system has proved quite reliable, problems may be encountered when soil isobtained from a different source. When applied to soil, a portion of B is adsorbed to clay(Hingston 1964) and the uptake of B by plants is inversely related to the clay content(Wear and Patterson 1962). Therefore, the concentration of B to be applied to produce agiven degree of toxicity varies between soil types. Approximately 50% of the B appliedto the soil used for screening is adsorbed. As less B would be adsorbed by a soil with ahigher content of sand, lower B concentrations would be more appropriate.
To avoid problems that may be encountered with variable amounts of B adsorbed by soil,plants may also be screened for response to B in solution. One low-input, lowmaintenance system consists of imbibing seeds in water in petri dishes for 2 days, placingthem along the center of large sheets of filter paper, which have been soaked in a solutionof boric acid, rolling the paper up, covering the roll with aluminium foil and storing at15-20° C for about 7 days. Seedlings are then examined for root and shoot growth.Tolerant lines produce longer shoots and roots and also more roots. The concentrations ofB solutions appropriate for this method are of the order of 100 mg BIL, but this may bevaried according to the level of tolerance of the lines being tested.
Sources of Boron Tolerance
Investigations soon after the identification of high concentrations of B demonstratedgenetic variation among Australian varieties and breeding material and the varietyHalberd, which has been widely grown in southern Australia, was among the mosttolerant of local material (Paull et al. 1988). A germplasm collection of geographicallydiverse lines was subsequently screened, in soil containing 150 mg/kg applied B asoutlined above, to identify lines more tolerant than Halberd which might be used asdonor parents in the breeding program.
A total of 1576 lines, obtained from the Australian Winter Cereals Collection, was testedfor response to B and compared with Halberd, which was rated as moderately tolerant.There were large differences among countries or geographical regions in the proportionof lines within the more tolerant classes and tolerant lines were most frequent among theAsia/Asia Minor and South American regions (Table 1) (Moody et al. 1988). Themajority of the tolerant lines from Asia/Asia Minor originated in India, an area where
91
toxic levels of B have been reported (Chauhan and Powar 1978). Regional differences inthe frequency of tolerant lines were also observed among a collection of annual medicswith the greatest number of tolerant lines originating in the Middle East (Paull et at.1992). The identification of regions in which a high proportion of tolerant lines occurwould allow a more defined search when looking for agronomically adapted toleranttypes.
Lines identified as tolerant or very tolerant to B were evaluated in the field to ensure thattolerance (Le., low concentrations of B in shoots and grain) was also expressed undernaturally occurring high B conditions. The majority of lines classified as tolerant to Bcontained significantly lower concentrations of B in shoots than Halberd when grown at ahigh B site (Moody et at. 1988). Tolerant lines considered to be best adapted to SouthAustralian growing conditions were chosen as donor parents for a backcrossing programto introduce higher levels of tolerance into local wheat varieties.
Genetic Control
The genetic control of tolerance to B has been studied for a similar group of lines asthose used for experiments on the mechanism of tolerance (Nable 1992). The mode ofexpression of tolerance was tested by comparing the F1 hybrid between 061450 (mosttolerant) and Kenya Farmer (most sensitive) with the two parents for dry weight andconcentration of B in shoots at a range of B treatments. The response of the F1 hybridwas intermediate to the two parents (Table 2), as has also been found for a greaternumber of combinations (Paull et at. 1991), indicating that tolerance to B is expressed asa partially dominant trait.
The nature of expression of tolerance to high levels of B will influence the level oftreatments selected for screening in a breeding program aimed at enhanced levels oftolerance. The level of B should be toxic to homozygous sensitives rather thanheterozygotes for a backcrossing program, whereas the level should be toxic to theheterozygotes but not the homozygous tolerant genotypes when screening an F2 or othersegregating generation. The optimal treatment will also vary for different parentalcombinations and will be higher for combinations including more tolerant lines.
In order to determine the number of genes controlling tolerance to B, five lines wereintercrossed in all combinations, excluding reciprocals, and the F2 and F3 generationswere tested for segregation under high B conditions. The procedure used was similar tothat described for the collection of wheat lines, the only differences being that the soilwas placed in smaller plastic trays and boron treatments were varied according to theresponse of the more sensitive parent. Lower levels of B were applied for combinationsincluding a sensitive line as a parent. Plants of the segregating generations werecompared with a grid of the parents for vigor and symptom expression. As tolerance tohigh concentrations of B is eexpressed as a partially dominant trait with the response ofheterozygotes being intermediate to the two parents, segregation at the F2 generationappears to be continuous (Paull et at. 1991). The genetic control of tolerance has,therefore, been studied at the F3 generation and segregation ratios derived on the basis ofthe response of F2-derived families. The F2-derived families were classified as beingeither homozygous sensitive, that is all members of the family were as sensitive as themore sensitive parent, homozygous tolerant when all plants were as tolerant as the moretolerant parent, or segregating when several types were observed within the family.
Segregation ratios at the F3 generation were consistent with tolerance to highconcentrations of B being controlled by at least three major genes, but it is possible toidentify segregation at a single locus for several combinations of lines (Table 3) (Paull et
92
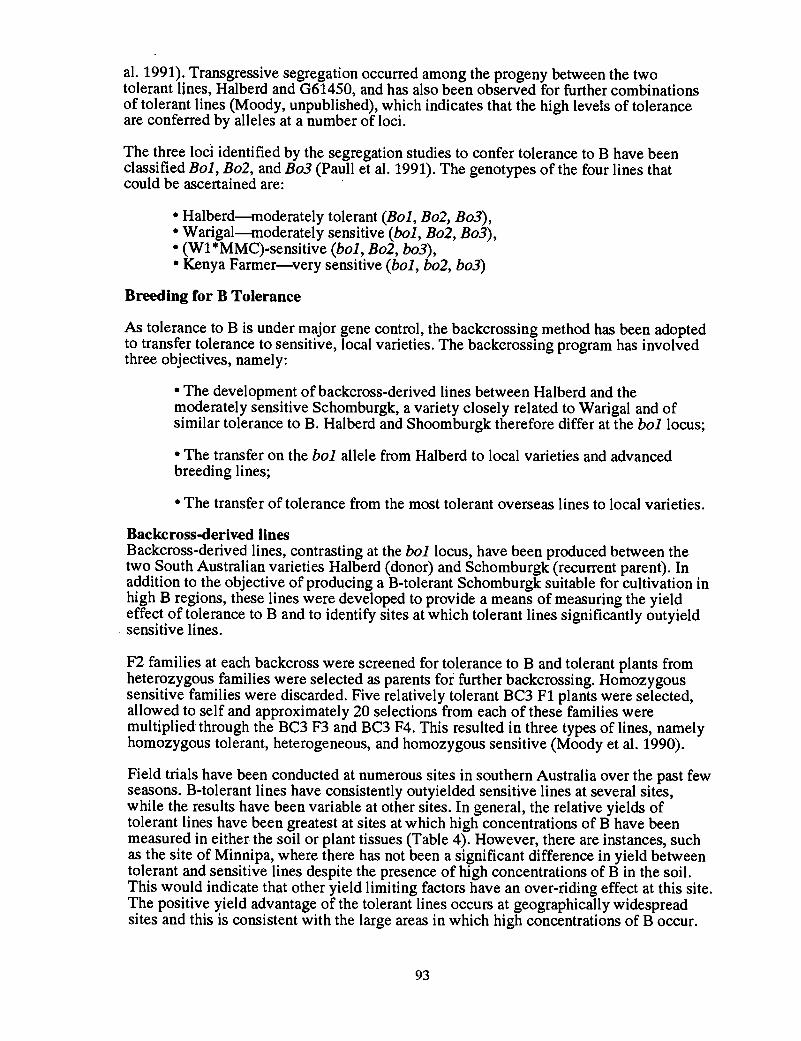
al. 1991). Transgressive segregation occurred among the progeny between the twotolerant lines, Halberd and G61450, and has also been observed for further combinationsof tolerant lines (Moody, unpublished), which indicates that the high levels of toleranceare conferred by alleles at a number of loci.
The three loci identified by the segregation studies to confer tolerance to B have beenclassified Bol, Bo2, and Bo3 (Paull et al. 1991). The genotypes of the four lines thatcould be ascertained are:
• Halberd-moderately tolerant (Bol, Bo2, Bo3),• Warigal-moderately sensitive (bol, Bo2, Bo3),• (W1 *MMC)-sensitive (bol, Bo2, bo3),• Kenya Farmer-very sensitive (bol, bo2, bo3)
Breeding for B Tolerance
As tolerance to B is under major gene control, the backcrossing method has been adoptedto transfer tolerance to sensitive, local varieties. The backcrossing program has involvedthree objectives, namely:
• The development of backcross-derived lines between Halberd and themoderately sensitive Schomburgk, a variety closely related to Warigal and ofsimilar tolerance to B. Halberd and Shoomburgk therefore differ at the bol locus;
• The transfer on the bol allele from Halberd to local varieties and advancedbreeding lines;
• The transfer of tolerance from the most tolerant overseas lines to local varieties.
Backcross-deriv.ed linesBackcross-derived lines, contrasting at the bollocus, have been produced between thetwo South Australian varieties Halberd (donor) and Schomburgk (recurrent parent). Inaddition to the objective of producing a B-tolerant Schomburgk suitable for cultivation inhigh B regions, these lines were developed to provide a means of measuring the yieldeffect of tolerance to B and to identify sites at which tolerant lines significantly outyield
, sensitive lines.
F2 families at each backcross were screened for tolerance to B and tolerant plants fromheterozygous families were selected as parents for further backcrossing. Homozygoussensitive families were discarded. Five relatively tolerant BC3 F1 plants were selected,allowed to self and approximately 20 selections from each of these families weremultiplied through the BC3 F3 and BC3 F4. This resulted in three types of lines, namelyhomozygous tolerant, heterogeneous, and homozygous sensitive (Moody et al. 1990). .
Field trials have been conducted at numerous sites in southern Australia over the past fewseasons. B-tolerant lines have consistently outyielded sensitive lines at several sites,while the results have been variable at other sites. In general, the relative yields oftolerant lines have been greatest at sites at which high concentrations of B have beenmeasured in either the soil or plant tissues (Table 4). However, there are instances, suchas the site of Minnipa, where there has not been a significant difference in yield betweentolerant and sensitive lines despite the presence of high concentrations of B in the soil.This would indicate that other yield limiting factors have an over-riding effect at this site.The positive yield advantage of the tolerant lines occurs at geographically widespreadsites and this is consistent with the large areas in which high concentrations of B occur.
93
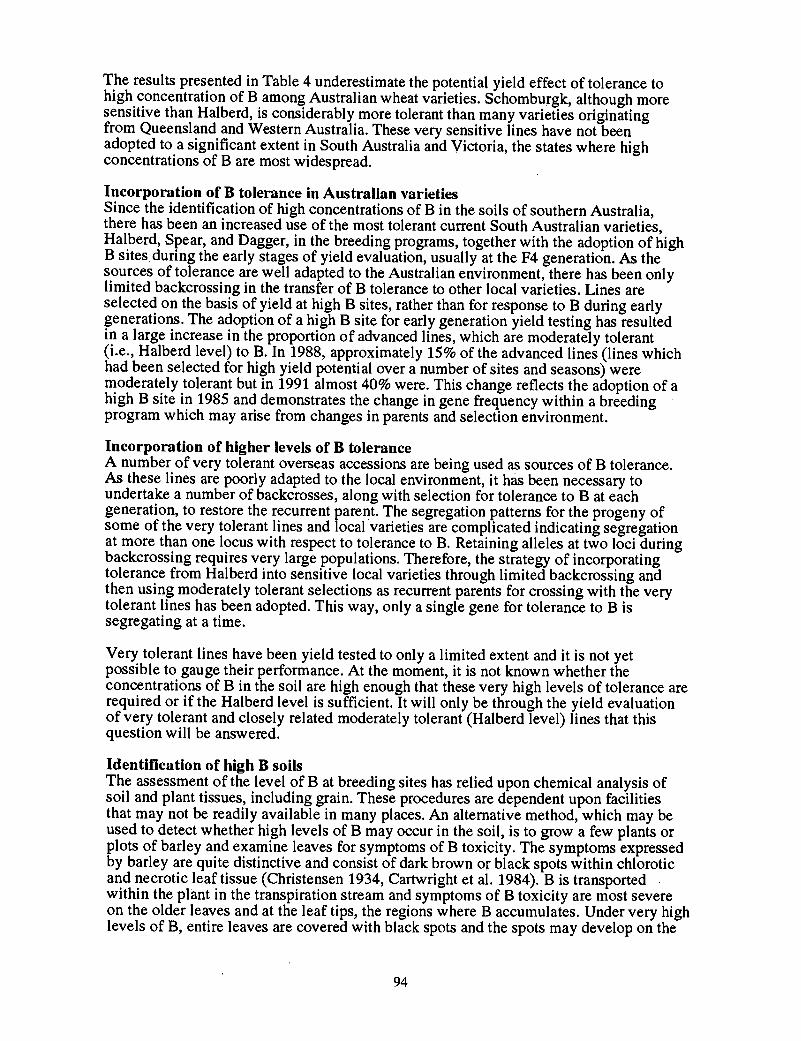
The results presented in Table 4 underestimate the potential yield effect of tolerance tohigh concentration of B among Australian wheat varieties. Schomburgk, although moresensitive than Halberd, is considerably more tolerant than many varieties originatingfrom Queensland and Western Australia. These very sensitive lines have not beenadopted to a significant extent in South Australia and Victoria, the states where highconcentrations of B are most widespread.
Incorporation of B tolerance in Australian varietiesSince the identification of high concentrations of B in the soils of southern Australia,there has been an increased use of the most tolerant current South Australian varieties,Halberd, Spear, and Dagger, in the breeding programs, together with the adoption of highB sitesduring the early stages of yield evaluation, usually at the F4 generation. As thesources of tolerance are well adapted to the Australian environment, there has been onlylimited backcrossing in the transfer of B tolerance to other local varieties. Lines areselected on the basis of yield at high B sites, rather than for response to B during earlygenerations. The adoption of a high B site for early generation yield testing has resultedin a large increase in the proportion of advanced lines, which are moderately tolerant(Le., Halberd level) to B. In 1988, approximately 15% of the advanced lines (lines whichhad been selected for high yield potential over a number of sites and seasons) weremoderately tolerant but in 1991 almost 40% were. This change reflects the adoption of ahigh B site in 1985 and demonstrates the change in gene frequency within a breedingprogram which may arise from changes in parents and selection environment.
Incorporation of higher levels of B toleranceA number of very tolerant overseas accessions are being used as sources of B tolerance.As these lines are poorly adapted to the local environment, it has been necessary toundertake a number of backcrosses, along with selection for tolerance to B at eachgeneration, to restore the recurrent parent. The segregation patterns for the progeny ofsome of the very tolerant lines and local varieties are complicated indicating segregationat more than one locus with respect to tolerance to B. Retaining alleles at two loci duringbackcrossing requires very large populations. Therefore, the strategy of incorporatingtolerance from Halberd into sensitive local varieties through limited backcrossing andthen using moderately tolerant selections as recurrent parents for crossing with the verytolerant lines has been adopted. This way, only a single gene for tolerance to B issegregating at a time.
Very tolerant lines have been yield tested to only a limited extent and it is not yetpossible to gauge their performance. At the moment, it is not known whether theconcentrations of B in the soil are high enough that these very high levels of tolerance arerequired or if the Halberd level is sufficient. It will only be through the yield evaluationof very tolerant and closely related moderately tolerant (Halberd level) lines that thisquestion will be answered.
Identification of high B soilsThe assessment of the level of B at breeding sites has relied upon chemical analysis ofsoil and plant tissues, including grain. These procedures are dependent upon facilitiesthat may not be readily available in many places. An alternative method, which may beused to detect whether high levels of B may occur in the soil, is to grow a few plants orplots of barley and examine leaves for symptoms of B toxicity. The symptoms expressedby barley are quite distinctive and consist of dark brown or black spots within chloroticand necrotic leaf tissue (Christensen 1934, Cartwright et al. 1984). B is transportedwithin the plant in the transpiration stream and symptoms of B toxicity are most severeon the older leaves and at the leaf tips, the regions where B accumulates. Under very highlevels of B, entire leaves are covered with black spots and the spots may develop on the
94
stem and spike. There is a wide range in tolerance to B among barley (Nable 1988) andsensitive lines, such as the Australian variety Stirling, may be used as indicators of thepresence of high concentrations of B in the soil.
References Cited
Cartwright, B., B.A. Zarcinas, and A.H. Mayfield. 1984. Toxic concentrations of boronin a red-brown earth at Goldstone, South Australia. Aust. J. Soil Res. 22:261-272.
Chauhan, R.P.S., and S.L. Powar. 1978. Tolerance of wheat and pea to boron inirrigation water. Plant Soil 50:145-149.
Christensen, J.J. 1934. Nonparasitic leaf spots of barley. Phytopathology 34:726-742.
Hingston, F.J. 1964. Reactions between boron and clay. Aust. J. Soil Res. 2:83-95.
Moody, D.B. A.J. Rathjen, B. Cartwright, J.G. Paull, and J. Lewis. 1988. Geneticdiversity and geographical distribution of tolerance to high levels of soil boron. In pages859-966, T.E. Miller and R.M.D. Koebner, eds., Proc., 7th International Wheat GeneticsSymposium, Cambridge, England. 1988.
Moody, D.B., A.J. Rathjen, and B. Cartwright. 1990. Yield evaluation of a gene forboron tolerance using backcross- derived lines. In pages 117-121, L. O'Brien et aI., eds.,Proc., 6th Assembly Wheat Breeding Society of Australia, Tamworth, New South Wales.
Nable, R.O. 1988. Resistance to boron toxicity amongst several barley and wheatcultivars: A preliminary examination of the resistance mechanism. Plant Soil 112:45-52.
Nable, R.O. 1992. Mechanism of tolerance to boron toxicity in plants. TheseProceedings, pp. 98-109.
Paull, J.G., B. Cartwright, and AJ. Rathijen. 1988. Response of wheat and barleygenotypes to toxic concentrations of soil boron. Euphytica 39:137-144.
Paull, J.G., R.O. Nable, A.W.H. Lake, M.A. Materne, and A.J. Rathjen. 1992. Responseof annual medics (Medicago spp.) and field peas (Pisum sativum) to high concentrationsof boron: Genetic variation and the mechanism of tolerance. Aust. J. Agric. Res. 43:203213.
Paull, J.G., A.J. Rathjen, B. Cartwright, and R.O. Nable, 1990. Selection parameters forassessing the tolerance of wheat to high concentrations of boron. In pages 361-369, N.E.Bassam and B.C. Longhman, eds., Genetic Aspects of Plant Mineral Nutrition. KluwerAcademic Press, The Netherlands.
Paull, J.G., A.J. Rathjen, and B. Cartwright. 1991. Major gene control of tolerance ofbread wheat to high concentrations of soil boron. Euphytica 55:217-228.
Wear, J.I., and R.M. Patterson. 1962. Effect of soil pH and texture on the availability ofwater-soluble boron in the soil. Soil Sci. Soc. Am. Proc. 26:344-346.
95
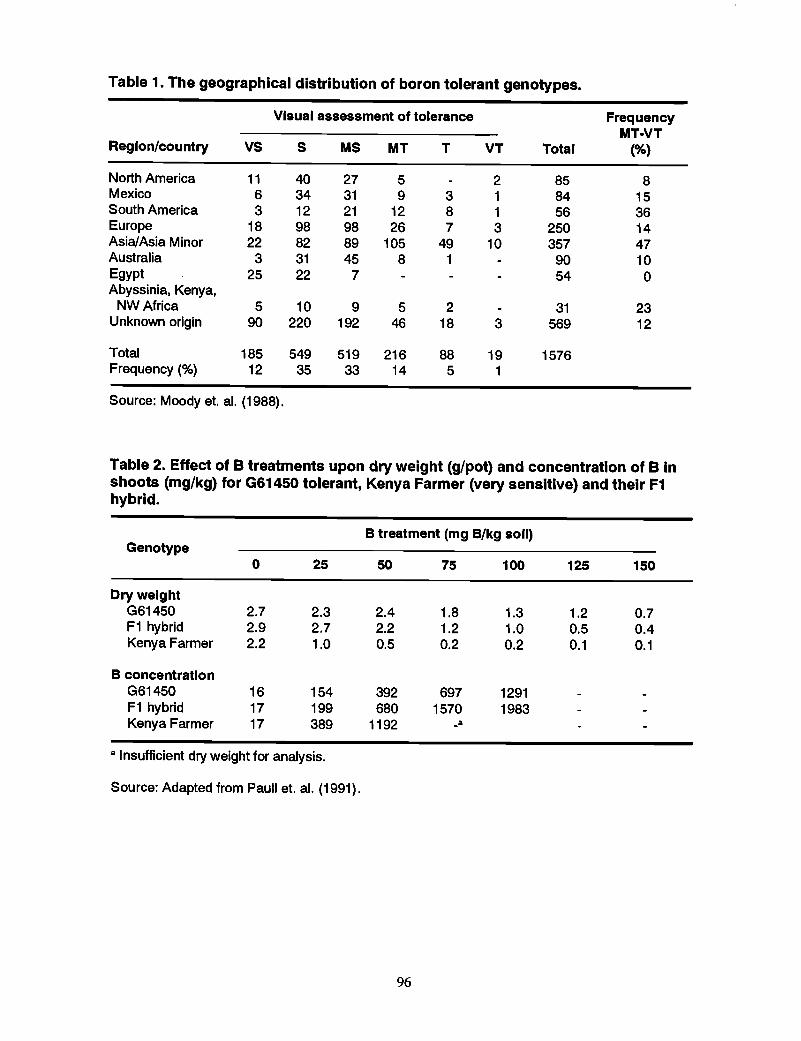
Table 1. The geographical distribution of boron tolerant genotypes.
Visual assessment of tolerance FrequencyMT·VT
Region/country VS S MS MT T VT Total (%)
North America 11 40 27 5 2 85 8Mexico 6 34 31 9 3 1 84 15South America 3 12 21 12 8 1 56 36Europe 18 98 98 26 7 3 250 14Asia/Asia Minor 22 82 89 105 49 10 357 47Australia 3 31 45 8 1 90 10Egypt 25 22 7 54 0Abyssinia, Kenya,
NWAfrica 5 10 9 5 2 31 23Unknown origin 90 220 192 46 18 3 569 12
Total 185 549 519 216 88 19 1576Frequency (%) 12 35 33 14 5 1
Source: Moody et. al. (1988).
Table 2. Effect of B treatments upon dry weight (g1pot) and concentration of B inshoots (mg/kg) for G61450 tolerant, Kenya Farmer (very sensitive) and their F1hybrid.
B treatment (mg B/kg soli)Genotype
0 25 50 75 100 125 150
Dry weightG61450 2.7 2.3 2.4 1.8 1.3 1.2 0.7F1 hybrid 2.9 2.7 2.2 1.2 1.0 0.5 0.4Kenya Farmer 2.2 1.0 0.5 0.2 0.2 0.1 0.1
B concentrationG61450 16 154 392 697 1291F1 hybrid 17 199 680 1570 1983Kenya Farmer 17 389 1192 _8
8 Insufficient dry weight for analysis.
Source: Adapted from Paull et. al. (1991).
96
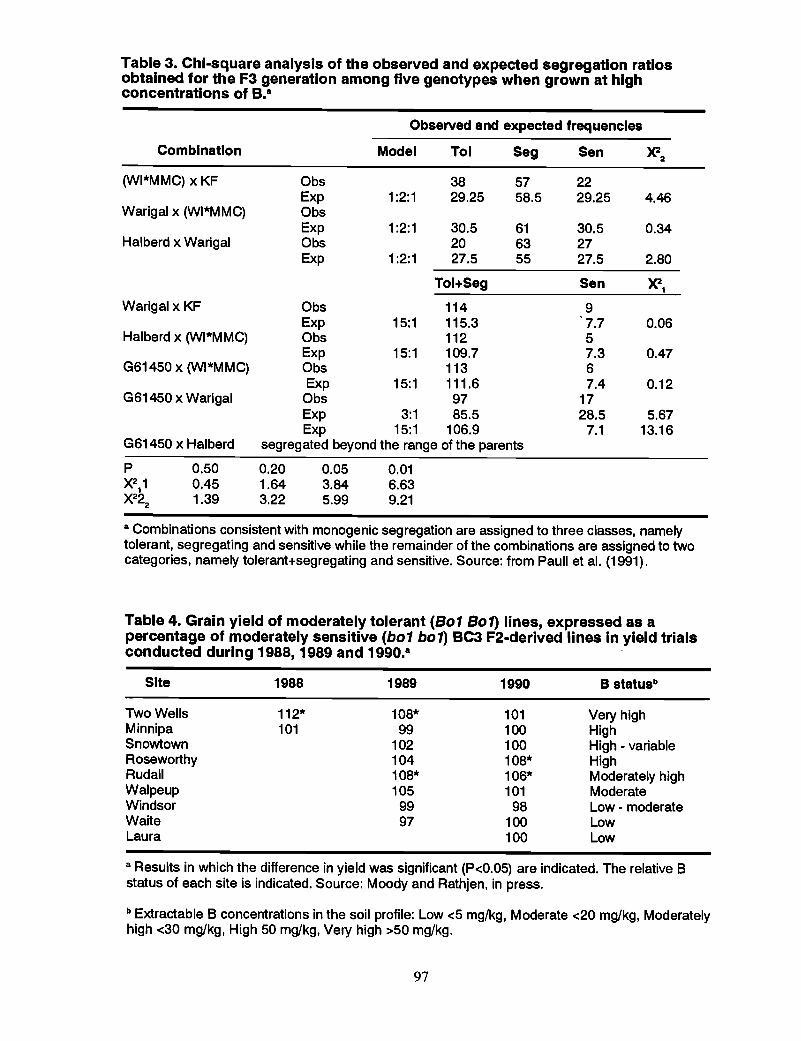
Table 3. Chi-square analysis of the observed and expected segregation ratiosobtained for the F3 generation among five genotypes when grown at highconcentrations of B.8
Observed and expected frequencies
Combination Model Tol Seg Sen )(22
(WI*MMC) x KF Obs 38 57 22Exp 1:2:1 29.25 58.5 29.25 4.46
Warigal x (WI*MMC) ObsExp 1:2:1 30.5 61 30.5 0.34
Halberd x Warigal Obs 20 63 27Exp 1:2:1 27.5 55 27.5 2.80
Tol+Seg Sen )(21
Warigal x KF Obs 114 9Exp 15:1 115.3 7.7 0.06
Halberd x (WI*MMC) Obs 112 5Exp 15:1 109.7 7.3 0.47
G61450 x (WI*MMC) Obs 113 6Exp 15:1 111.6 7.4 0.12
G61450 x Warigal Obs 97 17Exp 3:1 85.5 28.5 5.67Exp 15:1 106.9 7.1 13.16
G61450 x Halberd segregated beyond the range of the parents
P 0.50 0.20 0.05 0.01X2
11 0.45 1.64 3.84 6.63X222 1.39 3.22 5.99 9.21
a Combinations consistent with monogenic segregation are assigned to three classes, namelytolerant, segregating and sensitive while the remainder of the combinations are assigned to twocategories, namely tolerant+segregating and sensitive. Source: from Paull et al. (1991).
Table 4. Grain yield of moderately tolerant (Bot Bot) lines, expressed as apercentage of moderately sensitive (bot bot) BC3 F2-derived lines in yield trialsconducted during 1988, 1989 and 1990.8
Site 1988 1989 1990 B statusb
Two Wells 112* 108* 101 Very highMinnipa 101 99 100 HighSnowtown 102 100 High· variableRoseworthy 104 108* HighRudall 108* 106* Moderately highWalpeup 105 101 ModerateWindsor 99 98 Low - moderateWaite 97 100 LowLaura 100 Low
a Results in which the difference in yield was significant (P<0.05) are indicated. The relative Bstatus of each site is indicated. Source: Moody and Rathjen, in press.
b Extractable B concentrations in the soil profile: Low <5 mg/kg, Moderate <20 mg/kg, Moderatelyhigh <30 mg/kg, High 50 mg/kg, Very high >50 mg/kg.
97
MECHANISM OF TOLERANCE TO BORON TOXICITY IN PLANTS
R.O. NableCSIRO Division of Soils
Glen Osmond, South A':!stralia
Abstract
This paper reviews the results of studies on the physiological control of tolerance to highconcentrations of B. These studies were initiated following the identification of highlevels of B in the subsoil throughout southern Australia to facilitate the breeding of Btolerant varieties. Genetic variation in response to B has been identified for the majorcrop and pasture species of South Australia, including lines more tolerant than anyAustralian varieties of wheat, barley, pasture medics, and peas. There is the potential forimproving the level of B tolerance of local varieties. The apparently similar mechanismcontrolling B tolerance for all species suggests relatively simple genetic control alsoexists for species other than wheat.
Introduction
Boron (B) toxicity is most common in arid and semi-arid regions of the world. A numberof the regions and crops for which B toxicity has been reported are listed in Table 1.High concentrations of B may occur naturally in soils (e.g., 8), or in groundwater (e.g.,14). The concentration of B in sea water ranges from 0.5-9.6 mglkg and the averageconcentration is approximately 4.6 mglkg (28) and high concentrations of B are commonin soils formed in parent materials of marine origin (35). Continuous irrigation usingwater containing only moderately high B concentrations can also lead to accumulation insoils of toxic levels of B (14). Additionally, toxic concentrations of B may be applieddirectly to crops through over-application of B fertilizer when correcting B deficiency, oras a contaminant of sewage sludge (2) and municipal and industrial waste, such as coalfly ash (17).
Excessive B concentrations in soils of the cereal growing regions of southern Australiawere first described by Cartwright et al. (8) and a yield reduction of 17% in a crop ofbarley could be attributed to B toxicity. Cartwright et al. (9).reported B toxicity in cerealcrops at numerous other locations, indicating that substantial yield losses were common.The growth of pasture species (especially medics) and grain legumes has also been foundto be significantly reduced by B levels similar to those affecting wheat and barley,indicating yield losses for these crops.
The amelioration of B toxicity through soil modification (e.g., incorporating gypsum,leaching with water) is not an economic proposition in South Australia, therefore thebreeding of more tolerant varieties offered the most hopeful approach to minimizingyield losses. Screening trials showed that considerable genetic variation in tolerance tohigh concentrations of B was present amongst the existing Australian wheat lines (41).Even greater levels of tolerance were identified from international collections (27,43).Accordingly, greater levels of tolerance to B toxicity are currently being incorporatedinto local breeding programs.
An understanding of the mechanism(s) and genetics of B tolerance was seen as afundamental component necessary for the development of an efficient breeding programfor B tolerance. At the commencement of our project, however, there was essentially noinformation in the published literature regarding the mechanism and genetics of toleranceto high levels of B. This paper describes our laboratory's attempts to examine thesephenomena.
98
Broad Mechanism of B Tolerance
There is little association between the concentration of B in leaves and the B tolerancerating over a diverse set of species (15,19), therefore the most susceptible species do notnecessarily have the highest concentrations of B in tissues. For more closely relatedspecies, however, there is evidence that susceptible genotypes have higher concentrationsof B in leaves and shoots than do tolerant genotypes. Jerusalem artichoke (Helianthustuberosus) is considered more susceptible to B toxicity and has higher concentrations ofB in leaves than sunflower (Helianthus annus), while lemon (Citrus limon) is moresusceptible to B toxicity and accumulates more B in leaves than the Chinese bos orange(Severinia buxifolia). For both comparisons, the response to B is related to Baccumulation in shoots, which is under control of the rootstock, and may be modified byreciprocal grafting (16). Similarly, the cultivated tomato (Lycopersicon esculentum) ismore susceptible to B toxicity and accumulates more B in shoots than the wild relative L.cheesmanii (47). In cereal genotypes displaying a wide range of susceptibility to Btoxicity, B concentrations in shoots of tolerant genotypes were lower than in susceptiblegenotypes (12,41).
Concentrations of B in roots were not reported for the above studies and so it is notpossible to determine from these experiments the type of broad B tolerance mechanismtolerance, exclusion, avoidance~perating. Accordingly, experiments have beenconducted using solution and sand culture to examine the effect of B toxicity onsymptom development, growth, and nutrient composition of numerous barley, wheat,medic, and pea genotypes. Considerable genotypic variation in susceptibility to Btoxicity has been identified for all species examined and this was reflected in symptomdevelopment and growth. Increased B supply was accompanied by an increase in theconcentration of B in tissues, development of B toxicity symptoms and depressedgrowth. At each level of B supply, however, tolerant genotypes accumulatedconsiderably less B than did susceptible genotypes, and this response occurred in bothroo'ts and shoots (29). The pattern of B distribution among individual leaves and rootswas remarkably similar between barley genotypes having differing susceptibilities to Btoxicity, despite great differences in total amounts of B accumulated and the actual Bconcentrations of individual part (31). In all cases examined, B-susceptible and Btolerant genotypes were distinguished by differences in net accumulation of B in thewhole plant (e.g., medics, Figure 1).
Furthermore, symptom development and growth in barley were similar among genotypesat particular B concentrations in leaves (7). Susceptibility to B toxicity was apparentlynot a function of tissue tolerance. Similarly, Oertli and Kohl (37) analyzed green,chlorotic, and necrotic leaf tissue from 29 species grown in sand culture at a high level ofB and found the concentration of B in the leaf tissue associated with chlorosis, andnecrosis was of the same order for all species. Chlorosis developed at a B concentrationof approximately 1000 mg/kg DM and necrosis at greater than 1500 mg/kg DM. Thedifferences between species in the development of toxicity symptoms was attributed todifferences in the rate of B accumulation in leaves, rather than the tolerance of tissues toB. We have found no evidence to indicate an ability of a genotype to tolerate highconcentrations of B in tissues.
In addition to a direct effect of toxicity, an excessive supply of B could also indirectlyaffect plant growth by causing imbalances in other nutrients, with genotypic variation forthe magnitude of such interactions. However, Nable (30) showed that an excessive Bsupply had no detectable effect on the concentrations of other nutrients (P, K, S, Mg, Ca,Cu, Zn, Mn, and Fe) in several barley and wheat genotypes. Yet such results do notpreclude the possibility that within the total pools of each nutrient are fractions at
99
suboptimal levels. For example, Graham et al. (21) showed that in barley plantscontaining apparently more than adequate concentrations of Zn in both roots and shoots,toxic accumulations of B could be markedly decreased by Zn supply. In examining thispossibility, we found that when Zn supply was markedly increased, and despite increasedZn concentrations in roots and shoots, there was no change in the response of genotypesto B supply (34). We conclude that it is unlikely the B tolerance is mediated indirectlythrciugh other nutrients. It remains possible, however, that B toxicity is more prevalent insoils deficient in other nutrients, especially Zn.
Another mechanism by which plants might tolerate high concentrations of B in soil,namely avoidance by the roots of regions containing excess B, could not operate underour experimental conditions of solution and sand culture and so has not been examineddirectly. Interestingly though, the genotypes in all species so far examined have shownsimilar rankings under all cultural conditions, including high B in the field (29,39,40,41).Therefore, avoidance is unlikely to be a mechanism of B tolerance for these genotypes.
Detailed Mechanism of B Tolerance
It thus appears that tolerance to B toxicity is governed by the ability of plants to restrict Baccumulation. But how is this achieved? Does limited accumulation result from restrictedabsorption or enhanced efflux and is it a passive or an active process? The absorption ofB is known to be greatly influenced by transpiration rates (44), yet in our studiesdifferences in tolerance to B toxicity among genotypes could not be explained simply bycontrol over transpiration rates (29).
There is very little information in the literature on B uptake and that which is available iscontradictory. From short-term studies with excised barley roots, it has been concludedthat B is passively absorbed over the range of external concentrations from normal toexcessive (3,36). By contrast, others have concluded that B uptake is fundamentally anactive process at normal to high external B concentration (4,5,6). Raven (44) reviewed indetail these disparate views on the relative significance of active and passive transport ofB across plant membranes. He questioned several arguments supporting active transportand concluded that while B uptake is not simply related to mass flow of water into theplant, the high permeability of membranes to B (as undissociated, uncharged boric acid)would effectively 'short-circuit' any active regulation mechanism so that the uptake of Binto plants would be governed primarily by passive transport processes.
To better understand the mechanism of B tolerance, we compared the uptake of B inbarley and medic genotypes with differing susceptibilities to B toxicity. Whetherdifferences in B uptake were controlled by an active or a passive process was alsoexamined. Furthermore, because of several similarities in the transport characteristics ofB(OH)3 and Si(OH)4 (44,45), the uptake of silicon by genotypes was also compared.
In long-term experiments with whole plants, B uptake was linearly related to B supplyover a range of B concentrations from normal to excessive (Figure 2; 40). Thecomparative susceptibility of genotypes to B toxicity was reflected in the relativedifferences in B uptake rates over the entire range of B supply. Root temperature over therange 5-25° C markedly affected plant growth, but had no effect on the relativesusceptibilities of genotypes to B toxicity, also indicating that differences in B uptakerates resulted from nonmetabolic processes.
Another feature of these results was that relative B uptake rates of genotypes weredifferent over the entire range of external B concentrations. Thus, each genotypedisplayed a characteristically different ability to passively transport B, a difference which
100
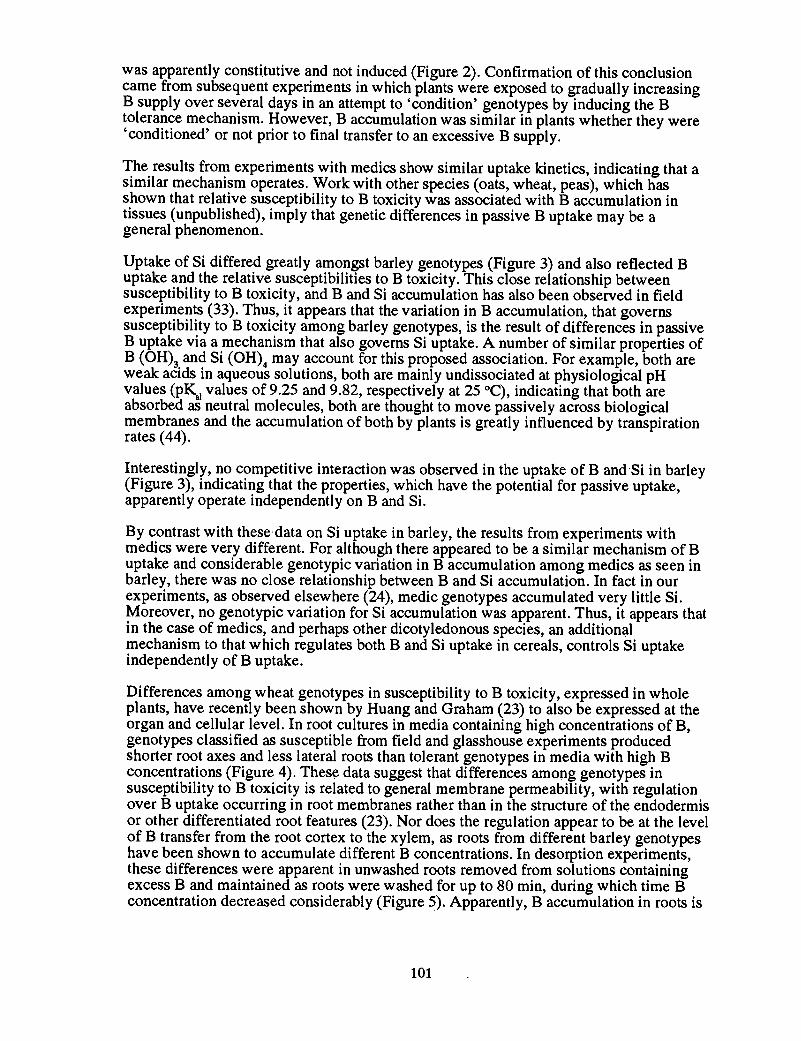
was apparently constitutive and not induced (Figure 2). Confirmation of this conclusioncame from subsequent experiments in which plants were exposed to gradually increasingB supply over several days in an attempt to 'condition' genotypes by inducing the Btolerance mechanism. However, B accumulation was similar in plants whether they were'conditioned' or not prior to final transfer to an excessive B supply.
The results from experiments with medics show similar uptake kinetics, indicating that asimilar mechanism operates. Work with other species (oats, wheat, peas), which hasshown that relative susceptibility to B toxicity was associated with B accumulation intissues (unpublished), imply that genetic differences in passive B uptake may be ageneral phenomenon.
Uptake of Si differed greatly amongst barley genotypes (Figure 3) and also reflected Buptake and the relative susceptibilities to B toxicity. This close relationship betweensusceptibility to B toxicity, and Band Si accumulation has also been observed in fieldexperiments (33). Thus, it appears that the variation in B accumulation, that governssusceptibility to B toxicity among barley genotypes, is the result of differences in passiveB uptake via a mechanism that also governs Si uptake. A number of similar properties ofB (OH)3 and Si (OH)4 may account for this proposed association. For example, both areweak acids in aqueous solutions, both are mainly undissociated at physiological pHvalues (pKal values of 9.25 and 9.82, respectively at 25 °C), i~dicating that ~oth ~re
absorbed as neutral molecules, both are thought to move passively across bIOlogicalmembranes and the accumulation of both by plants is greatly influenced by transpirationrates (44).
Interestingly, no competitive interaction was observed in the uptake of B andSi in barley(Figure 3), indicating that the properties, which have the potential for passive uptake,apparently operate independently on Band Si.
By contrast with these data on Si uptake in barley, the results from experiments withmedics were very different. For although there appeared to be a similar mechanism of Buptake and considerable genotypic variation in B accumulation among medics as seen inbarley, there was no close relationship between Band Si accumulation. In fact in ourexperiments, as observed elsewhere (24), medic genotypes accumulated very little Si.Moreover, no genotypic variation for Si accumulation was apparent. Thus, it appears thatin the case of medics, and perhaps other dicotyledonous species, an addition~l
mechanism to that which regulates both Band Si uptake in cereals, controls Si uptakeindependently of B uptake.
Differences among wheat genotypes in susceptibility to B toxicity, expressed in wholeplants, have recently been shown by Huang and Graham (23) to also be expressed at theorgan and cellular level. In root cultures in media containing high concentrations of B,genotypes classified as susceptible from field and glasshouse experiments producedshorter root axes and less lateral roots than tolerant genotypes in media with high Bconcentrations (Figure 4). These data suggest that differences among genotypes insusceptibility to B toxicity is related to general membrane permeability, with regulationover B uptake occurring in root membranes rather than in the structure of the endodermisor other differentiated root features (23). Nor does the regulation appear to be at the levelof B transfer from the root cortex to the xylem, as roots from different barley genotypeshave been shown to accumulate different B concentrations. In desorption experiments,these differences were apparent in unwashed roots removed from solutions containingexcess B and maintained as roots were washed for up to 80 min, during which time Bconcentration decreased considerably (Figure 5). Apparently, B accumulation in roots is
101
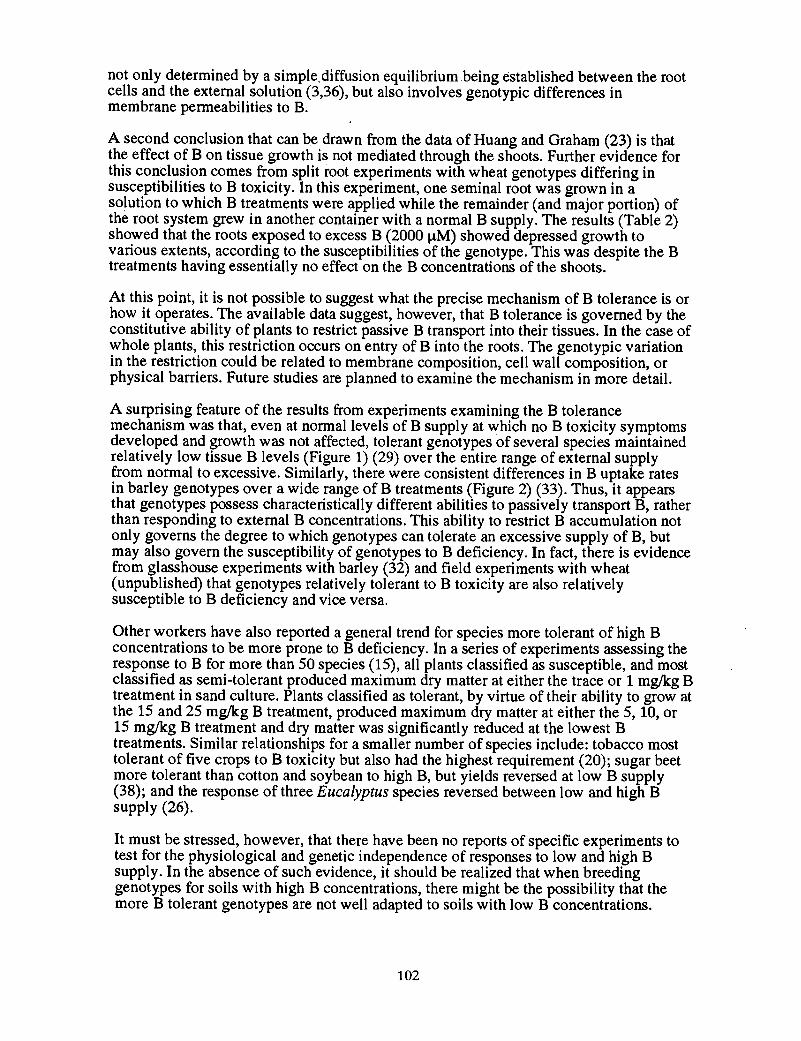
not only determined by a simple,diffusion equilibrium .being established between the rootcells and the external solution (3,36), but also involves genotypic differences inmembrane permeabilities to B.
A second conclusion that can be drawn from the data of Huang and Graham (23) is thatthe effect of B on tissue growth is not mediated through the shoots. Further evidence forthis conclusion comes from split root experiments with wheat genotypes differing insusceptibilities to B toxicity. In this experiment, one seminal root was grown in asolution to which B treatments were applied while the remainder (and major portion) ofthe root system grew in another container with a normal B supply. The results (Table 2)showed that the roots exposed to excess B (2000 ~M) showed depressed growth tovarious extents, according to the susceptibilities of the genotype. This was despite the Btreatments having essentially no effect on the B concentrations of the shoots.
At this point, it is not possible to suggest what the precise mechanism of B tolerance is orhow it operates. The available data suggest, however, that B tolerance is governed by theconstitutive ability of plants to restrict passive B transport into their tissues. In the case ofwhole plants, this restriction occurs on entry of B into the roots. The genotypic variationin the restriction could be related to membrane composition, cell wall composition, orphysical barriers. Future studies are planned to examine the mechanism in more detail.
A surprising feature of the results from experiments examining the B tolerancemechanism was that, even at normal levels of B supply at which no B toxicity symptomsdeveloped and growth was not affected, tolerant genotypes of several species maintainedrelatively low tissue B levels (Figure 1) (29) over the entire range of external supplyfrom normal to excessive. Similarly, there were consistent differences in B uptake ratesin barley genotypes over a wide range of B treatments (Figure 2) (33). Thus, it appearsthat genotypes possess characteristically different abilities to passively transport B, ratherthan responding to external B concentrations. This ability to restrict B accumulation notonly governs the degree to which genotypes can tolerate an excessive supply of B, butmay also govern the susceptibility of genotypes to B deficiency. In fact, there is evidencefrom glasshouse experiments with barley (32) and field experiments with wheat(unpublished) that genotypes relatively tolerant to B toxicity are also relativelysusceptible to B deficiency and vice versa.
Other workers have also reported a general trend for species more tolerant of high Bconcentrations to be more prone to B deficiency. In a series of experiments assessing theresponse to B for more than 50 species (15), all plants classified as susceptible, and mostclassified as semi-tolerant produced maximum dry matter at either the trace or 1 mg/kg Btreatment in sand culture. Plants classified as tolerant, by virtue of their ability to grow atthe 15 and 25 mg/kg B treatment, produced maximum dry matter at either the 5, 10, or15 mg/kg B treatment and dry matter was significantly reduced at the lowest Btreatments. Similar relationships for a smaller number of species include: tobacco mosttolerant of five crops to B toxicity but also had the highest requirement (20); sugar beetmore tolerant than cotton and soybean to high B, but yields reversed at low B supply(38); and the response of three Eucalyptus species reversed between low and high Bsupply (26).
It must be stressed, however, that there have been no reports of specific experiments totest for the physiological and genetic independence of responses to low and high Bsupply. In the absence of such evidence, it should be realized that when breedinggenotypes for soils with high B concentrations, there might be the possibility that themore B tolerant genotypes are not well adapted to soils with low B concentrations.
102
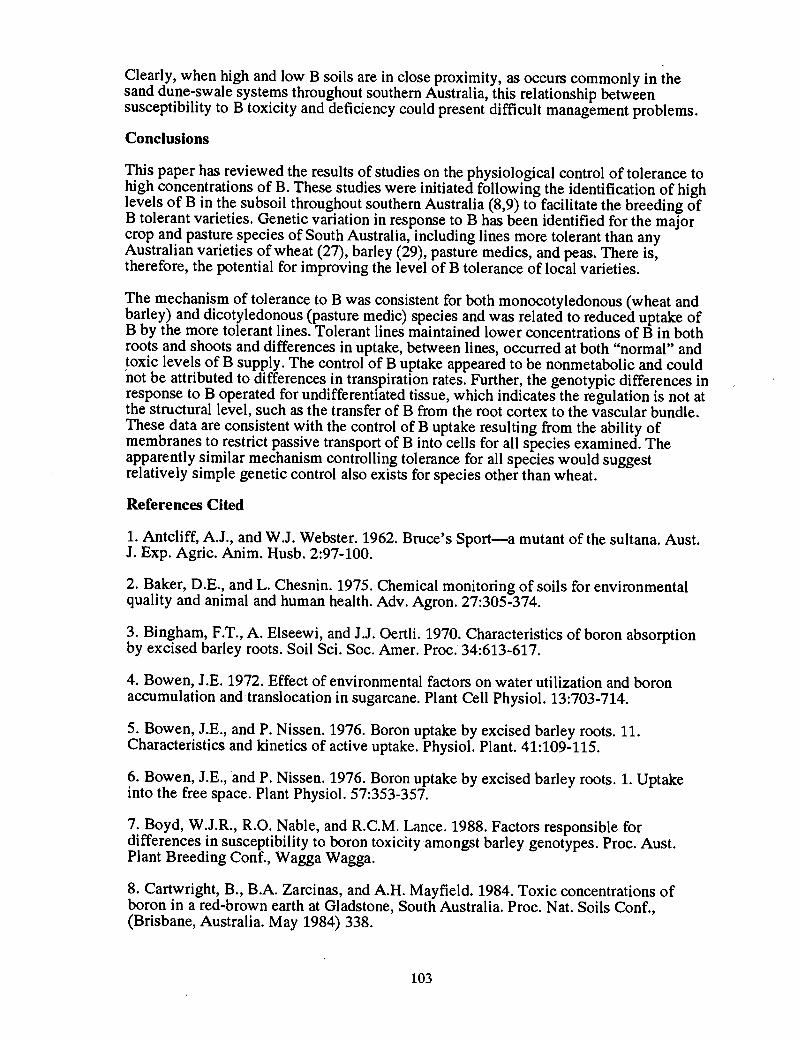
Clearly, when high and low B soils are in close proximity, as occurs commonly in thesand dune-swale systems throughout southern Australia, this relationship betweensusceptibility to B toxicity and deficiency could present difficult management problems.
Conclusions
This paper has reviewed the results of studies on the physiological control of tolerance tohigh concentrations of B. These studies were initiated following the identification of highlevels of B in the subsoil throughout southern Australia (8,9) to facilitate the breeding ofB tolerant varieties. Genetic variation in response to B has been identified for the majorcrop and pasture species of South Australia, including lines more tolerant than anyAustralian varieties of wheat (27), barley (29), pasture medics, and peas. There is,therefore, the potential for improving the level of B tolerance of local varieties.
The mechanism of tolerance to B was consistent for both monocotyledonous (wheat andbarley) and dicotyledonous (pasture medic) species and was related to reduced uptake ofB by the more tolerant lines. Tolerant lines maintained lower concentrations of B in bothroots and shoots and differences in uptake, between lines, occurred at both "normal" andtoxic levels of B supply. The control of B uptake appeared to be nonmetabolic and couldnot be attributed to differences in transpiration rates. Further, the genotypic differences inresponse to B operated for undifferentiated tissue, which indicates the regulation is not atthe structural level, such as the transfer of B from the root cortex to the vascular bundle.These data are consistent with the control of B uptake resulting from the ability ofmembranes to restrict passive transport of B into cells for all species examined. Theapparently similar mechanism controlling tolerance for all species would suggestrelatively simple genetic control also exists for species other than wheat.
References Cited
1. Antcliff, A.J., and W.J. Webster. 1962. Bruce's Sport-a mutant of the sultana. Aust.J. Exp. Agric. Anim. Husb. 2:97-100.
2. Baker, D.E., and L. Chesnin. 1975. Chemical monitoring of soils for environmentalquality and animal and human health. Adv. Agron. 27:305-374.
3. Bingham, F.T., A. Elseewi, and J.J. Oertli. 1970. Characteristics of boron absorptionby excised barley roots. Soil Sci. Soc. Amer. Proc. 34:613-617.
4. Bowen, J .E. 1972. Effect of environmental factors on water utilization and boronaccumulation and translocation in sugarcane. Plant Cell PhysioI. 13:703-714.
5. Bowen, J.E., and P. Nissen. 1976. Boron uptake by excised barley roots. 11.Characteristics and kinetics of active uptake. PhysioI. Plant. 41:109-115.
6. Bowen, J.E.,and P. Nissen. 1976. Boron uptake by excised barley roots. 1. Uptakeinto the free space. Plant PhysioI. 57:353-357.
7. Boyd, W.J.R., R.O. Nable, and R.C.M. Lance. 1988. Factors responsible fordifferences in susceptibility to boron toxicity amongst barley genotypes. Proc. Aust.Plant Breeding Conf., Wagga Wagga.
8. Cartwright, B., B.A. Zarcinas, and A.H. Mayfield. 1984. Toxic concentrations ofboron in a red-brown earth at Gladstone, South Australia. Proc. Nat. Soils Conf.,(Brisbane, Australia. May 1984) 338.
103
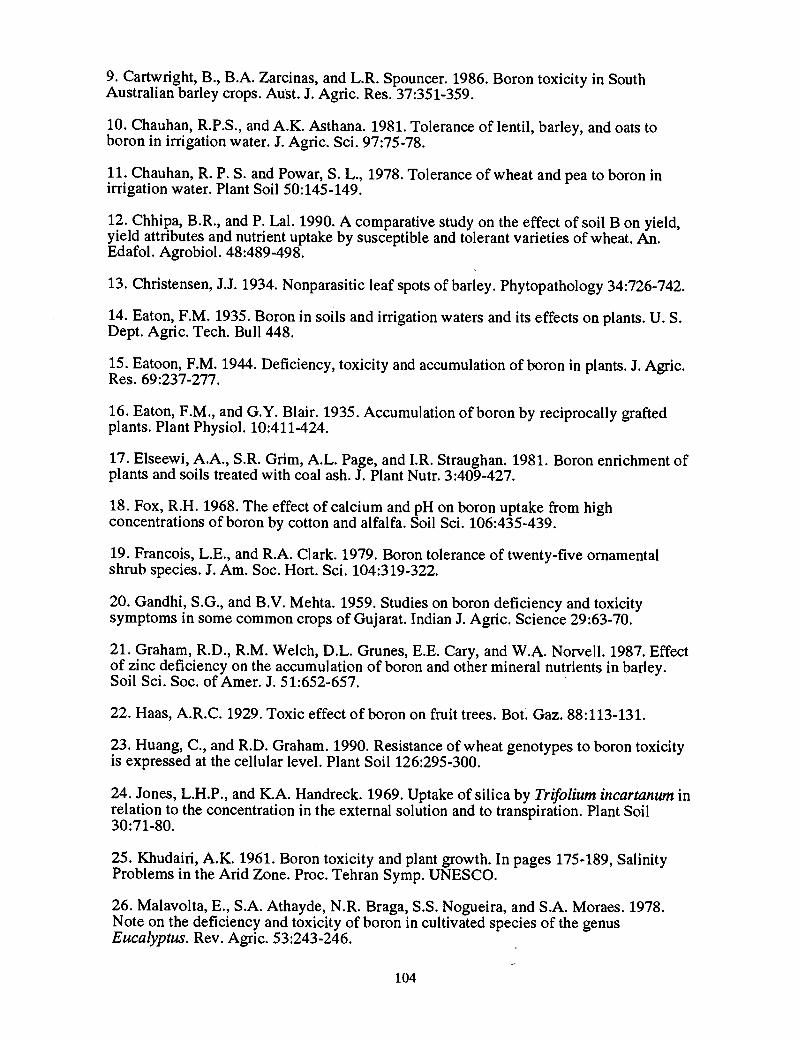
9. Cartwright, B., B.A. Zarcinas, and L.R. Spouncer. 1986. Boron toxicity in SouthAustralian barley crops. Aust. J. Agric. Res. 37:351-359.
10. Chauhan, R.P.S., and A.K. Asthana. 1981. Tolerance of lentil, barley, and oats toboron in irrigation water. J. Agric. Sci. 97:75-78.
11. Chauhan, R. P. S. and Powar, S. L., 1978. Tolerance of wheat and pea to boron inirrigation water. Plant Soil 50:145-149.
12. Chhipa, B.R., and P. Lal. 1990. A comparative study on the effect of soil B on yield,yield attributes and nutrient uptake by susceptible and tolerant varieties of wheat. An.Edafol. Agrobiol. 48:489-498.
13. Christensen, J.J. 1934. Nonparasitic leaf spots of barley. Phytopathology 34:726-742.
14. Eaton, F.M. 1935. Boron in soils and irrigation waters and its effects on plants. U. S.Dept. Agric. Tech. Bull 448.
15. Eatoon, F.M. 1944. Deficiency, toxicity and accumulation of boron in plants. J. Agric.Res. 69:237-277.
16. Eaton, F.M., and G.Y. Blair. 1935. Accumulation of boron by reciprocally graftedplants. Plant Physiol. 10:411-424.
17. Elseewi, A.A., S.R. Grim, A.L. Page, and I.R. Straughan. 1981. Boron enrichment ofplants and soils treated with coal ash. J. Plant Nutr. 3:409-427.
18. Fox, R.H. 1968. The effect of calcium and pH on boron uptake from highconcentrations of boron by cotton and alfalfa. Soil Sci. 106:435-439.
19. Francois, L.E., and R.A. Clark. 1979. Boron tolerance of twenty-five ornamentalshrub species. J. Am. Soc. Hort. Sci. 104:319-322.
20. Gandhi, S.G., and B.V. Mehta. 1959. Studies on boron deficiency and toxicitysymptoms in some common crops of Gujarat. Indian J. Agric. Science 29:63-70.
21. Graham, R.D., R.M. Welch, D.L. Grunes, E.E. Cary, and W.A. Norvell. 1987. Effectof zinc deficiency on the accumulation of boron and other mineral nutrients in barley.Soil Sci. Soc. of Amer. J. 51:652-657. .
22. Haas, A.R.C. 1929. Toxic effect of boron on fruit trees. BoL Gaz. 88:113-131.
23. Huang, C., and R.D. Graham. 1990. Resistance of wheat genotypes to boron toxicityis expressed at the cellular level. Plant Soil 126:295-300.
24. Jones, L.H.P., and K.A. Handreck. 1969. Uptake of silica by Trifolium incartanum inrelation to the concentration in the external solution and to transpiration. Plant Soil30:71-80.
25. Khudairi, A.K. 1961. Boron toxicity and plant growth. In pages 175-189, SalinityProblems in the Arid Zone. Proc. Tehran Symp. UNESCO.
26. Malavolta, E., S.A. Athayde, N.R. Braga, S.S. Nogueira, and S.A. Moraes. 1978.Note on the deficiency and toxicity of boron in cultivated species of the genusEucalyptus. Rev. Agric. 53:243-246.
104
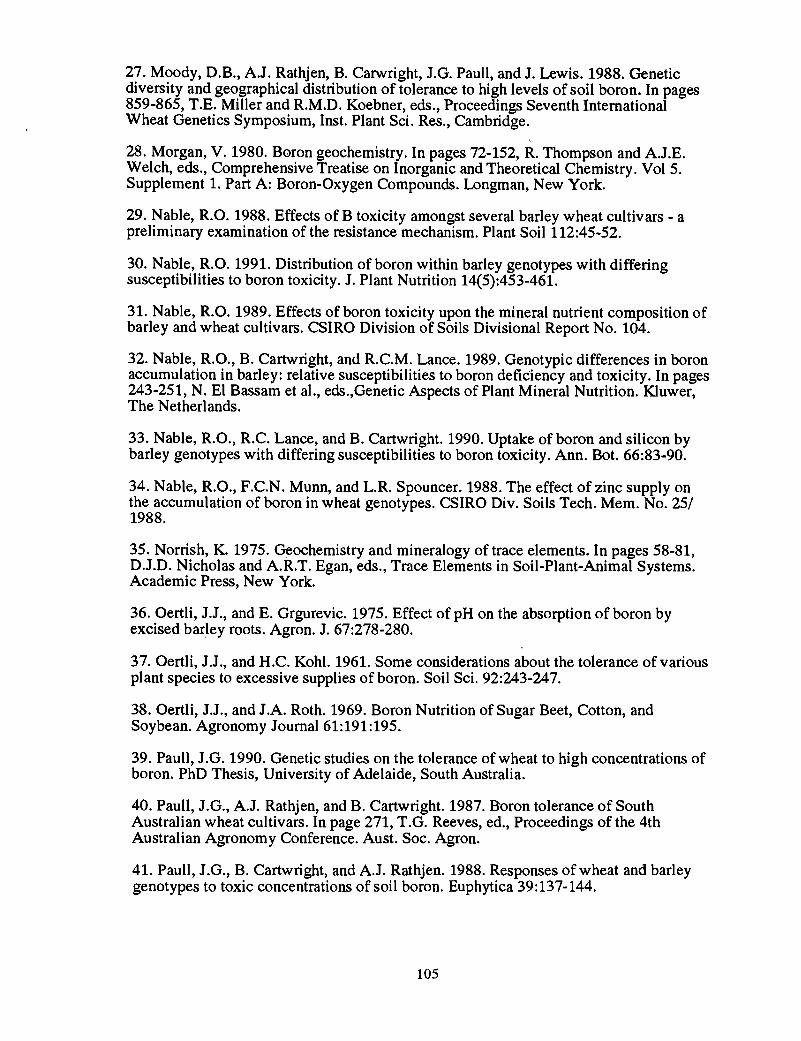
27. Moody, D.B., A.J. Rathjen, B. Carwright, J.G. Paull, and J. Lewis. 1988. Geneticdiversity and geographical distribution of tolerance to high levels of soil boron. In pages859-865, T.E. Miller and R.M.D. Koebner, eds., Proceedings Seventh InternationalWheat Genetics Symposium, Inst. Plant Sci. Res., Cambridge.
28. Morgan, V. 1980. Boron geochemistry. In pages 72-152, R. Thompson and A.J.E.Welch, eds., Comprehensive Treatise on Inorganic and Theoretical Chemistry. Vol 5.Supplement 1. Part A: Boron-Oxygen Compounds. Longman, New York.
29. Nable, RD. 1988. Effects of B toxicity amongst several barley wheat cultivars - apreliminary examination of the resistance mechanism. Plant Soil 112:45-52.
30. Nable, RD. 1991. Distribution of boron within barley genotypes with differingsusceptibilities to boron toxicity. J. Plant Nutrition 14(5):453-461.
31. Nable, RD. 1989. Effects of boron toxicity upon the mineral nutrient composition ofbarley and wheat cultivars. CSIRO Division of Soils Divisional Report No. 104.
32. Nable, RD., B. Cartwright, and R.C.M. Lance. 1989. Genotypic differences in boronaccumulation in barley: relative susceptibilities to boron deficiency and toxicity. In pages243-251, N. EI Bassam et aI., eds.,Genetic Aspects of Plant Mineral Nutrition. Kluwer,The Netherlands.
33. Nable, RD., R.C. Lance, and B. Cartwright. 1990. Uptake of boron and silicon bybarley genotypes with differing susceptibilities to boron toxicity. Ann. Bot. 66:83-90.
34. Nable, R.O., F.C.N. Munn, and L.R Spouncer. 1988. The effect of zinc supply onthe accumulation of boron in wheat genotypes. CSIRO Div. Soils Tech. Mem. No. 25/1988.
35. Norrish, K. 1975. Geochemistry and mineralogy of trace elements. In pages 58-81,D.J.D. Nicholas and A.R.T. Egan, eds., Trace Elements in Soil-Plant-Animal Systems.Academic Press, New York.
36. Oertli, J.J., and E. Grgurevic. 1975. Effect of pH on the absorption of boron byexcised barley roots. Agron. J. 67:278-280.
37. Oertli, J.J., and H.C. Kohl. 1961. Some considerations about the tolerance of variousplant species to excessive supplies of boron. Soil Sci. 92:243-247.
38. Oertli, J.J., and J.A. Roth. 1969. Boron Nutrition of Sugar Beet, Cotton, andSoybean. Agronomy Journal 61:191:195.
39. Paull, J.G. 1990. Genetic studies on the tolerance of wheat to high concentrations ofboron. PhD Thesis, University of Adelaide, South Australia.
40. Paull, J.G., A.J. Rathjen, and B. Cartwright. 1987. Boron tolerance of SouthAustralian wheat cultivars. In page 271, T.G. Reeves, ed., Proceedings of the 4thAustralian Agronomy Conference. Aust. Soc. Agron.
41. Paull, J.G., B. Cartwright, and A.J. Rathjen. 1988. Responses of wheat and barleygenotypes to toxic concentrations of soil boron. Euphytica 39:137-144.
105
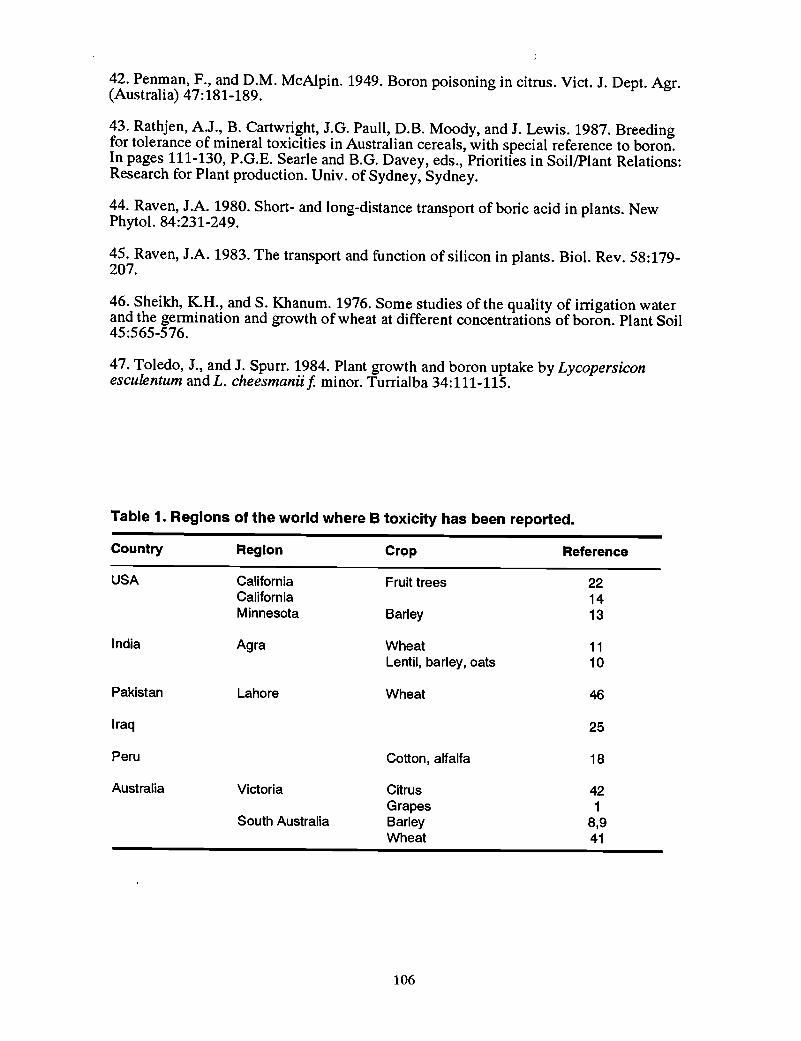
42. Penman, F., and D.M. McAlpin. 1949. Boron poisoning in citrus. Viet. J. Dept. Agr.(Australia) 47:181-189.
43. Rathjen, AJ., B. Cartwright, J.G. Paull, D.B. Moody, and J. Lewis. 1987. Breedingfor tolerance of mineral toxicities in Australian cereals, with special reference to boron.In pages 111-130, P.G.E. Searle and B.G. Davey, eds., Priorities in SoillPlant Relations:Research for Plant production. Univ. of Sydney, Sydney.
44. Raven, J.A. 1980. Short- and long-distance transport of boric acid in plants. NewPhytol. 84:231-249.
45. Raven, J.A. 1983. The transport and function of silicon in plants. BioI. Rev. 58:179207.
46. Sheikh, K.H., and S. Khanum. 1976. Some studies of the quality of irrigation waterand the germination and growth of wheat at different concentrations of boron. Plant Soil45:565-576.
47. Toledo, J., and J. Spurr. 1984. Plant growth and boron uptake by Lycopersiconesculentum andL. cheesmaniif. minor. Turrialba 34:111-115.
Table 1. Regions of the world where B toxicity has been reported.
Country Region Crop Reference
USA California Fruit trees 22California 14Minnesota Barley 13
India Agra Wheat 11Lentil, barleyI oats 10
Pakistan Lahore Wheat 46
Iraq 25
Peru Cotton, alfalfa 18
Australia Victoria Citrus 42Grapes 1
South Australia Barley 8,9Wheat 41
106
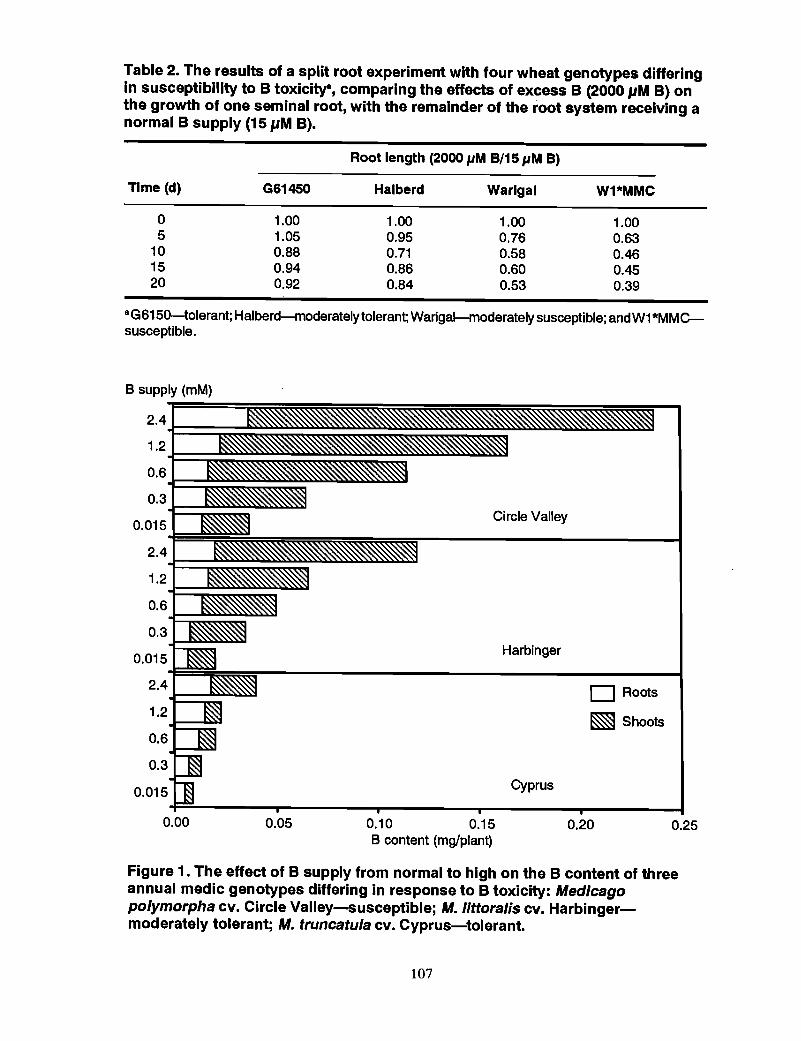
Table 2. The results of a split root experiment with four wheat genotypes differingin susceptibility to B toxicity-, comparing the effects of excess B (2000 pM B) onthe growth of one seminal root, with the remainder of the root system receiving anormal B supply (15 pM B).
Root length (2000 11M B/15I1M B)
Time (d) G61450 Halberd Warlgal W1*MMC
0 1.00 1.00 1.00 1.005 1.05 0.95 0.76 0.63
10 0.88 0.71 0.58 0.4615 0.94 0.86 0.60 0.4520 0.92 0.84 0.53 0.39
a G615Q-tolerant; Halberd-moderately tolerant; Warigal-moderately susceptible; andW1 *MMCsusceptible.
B supply (mM)
2.4-t===::;~1.2J-__
0.6
0.3.J-_~
0.015
2.4..1--_
1.2
0.6.J---~
0.3
0.015
0.00 0.05
Circle Valley
Harbinger
Cyprus
0.10 0.15B content (mg/plant)
D Roots
~ Shoots
0.20 0.25
Figure 1. The effect of B supply from normal to high on the B content of threeannual medic genotypes differing in response to B toxicity: Medicagopolymorpha cv. Circle Valley-susceptible; M. littoralis cv. Harbingermoderately tolerant; M. truncatula cv. Cyprus-tolerant.
107
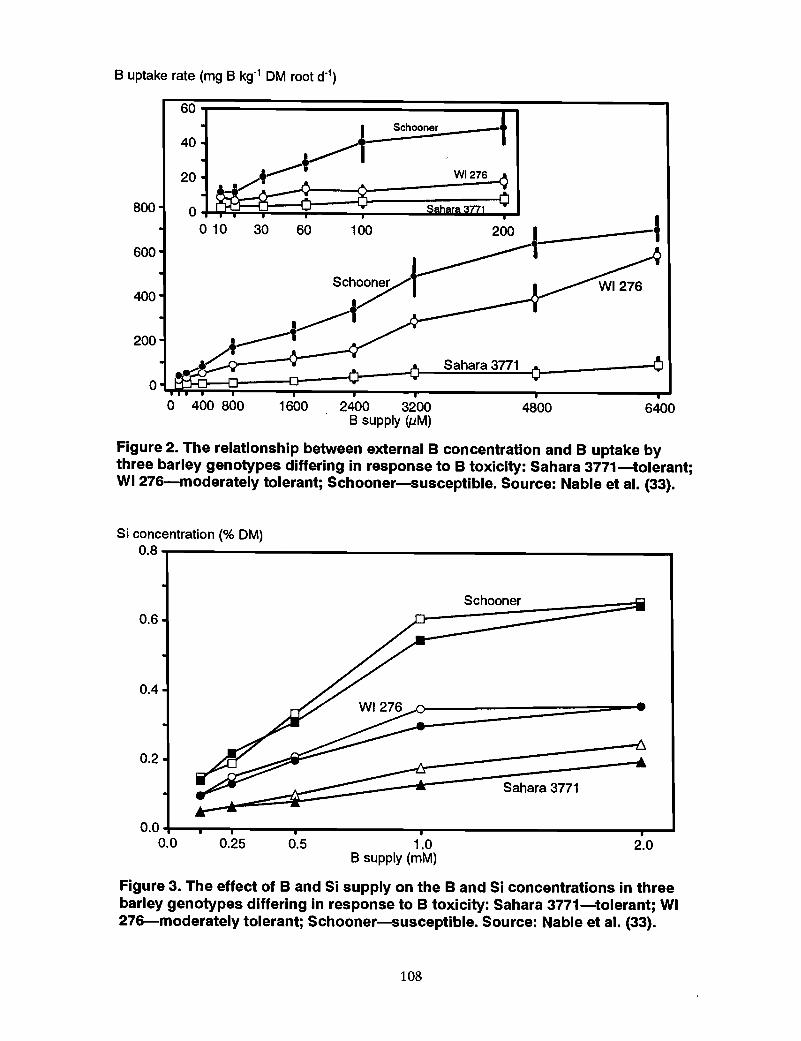
B uptake rate (mg B kg-1 0M root dol)
40
60
-I
Schooner
1006030O~r-:i:"""'-":;;'---T---~.lilI.lil~""''''''''''
o 10
20
200
400
800
600
640048001600o 400 800 2400 3200B supply (PM)
Figure 2. The relationship between external B concentration and B uptake bythree barley genotypes differing in response to B toxicity: Sahara 3771-tolerant;WI 276-moderately tolerant; Schooner-susceptible. Source: Nable et al. (33).
Si concentration (% OM)
0.8 T"""---------------------------,
0.6
0.4
0.2 ---------------:=~Sahara 3771
2.00.50.250.0+-.....,--r---~------r__----------,._.....
0.0 1.0B supply (mM)
Figure 3. The effect of Band Si supply on the Band Si concentrations in threebarley genotypes differing in response to B toxicity: Sahara 3771-tolerant; WI276-moderately tolerant; Schooner-susceptible. Source: Nable et al. (33).
108
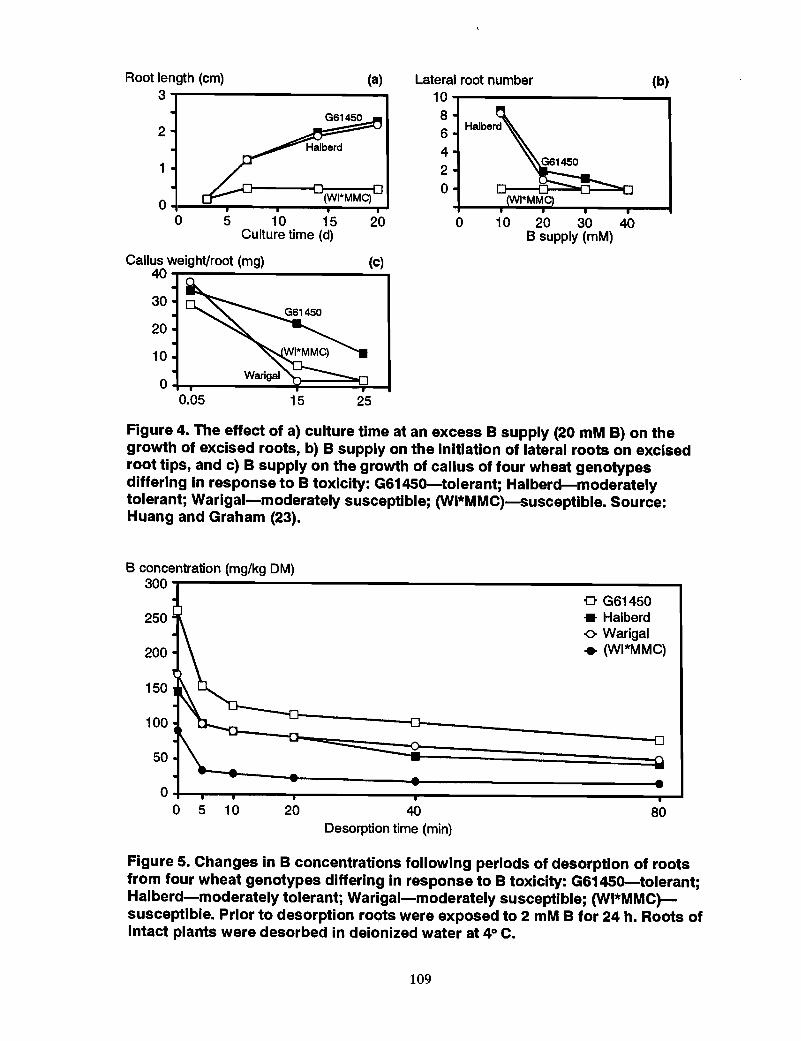
30
20
10
0+--_':'::'::="';~==:l.,L...I
Root length (cm) (a) Lateral root number (b)3 10
82 6
41 2
00
0 5 10 15 20 0 10 20 30 40Culture time (d) B supply (mM)
Callus weight/root (mg) (c)40
0.05 15 25
Figure 4. The effect of a) culture time at an excess B supply (20 mM B) on thegrowth of excised roots, b) B supply on the initiation of lateral roots on excisedroot tips, and c) B supply on the growth of callus of four wheat genotypesdiffering In response to B toxicity: G6145o-tolerant; Halberd-moderatelytolerant; Warlgal-moderately susceptible; (W1*MMC)-susceptible. Source:Huang and Graham (23).
B concentration (mg/kg DM)300~-------------------------...,
250
200
150
100
50
o G61450• Halberd0- Warigal• (WI*MMC)
8020 40Desorption time (min)
0+-__._-...---__------.._------------...-....o 5 10
Figure 5. Changes in B concentrations following periods of desorption of rootsfrom four wheat genotypes differing In response to B toxicity: G6145O-tolerant;Halberd-moderately tolerant; Warigal-moderately susceptible; (W1*MMC)susceptibie. Prior to desorption roots were exposed to 2 mM B for 24 h. Roots ofintact plants were desorbed in deionized water at 40 C.
109
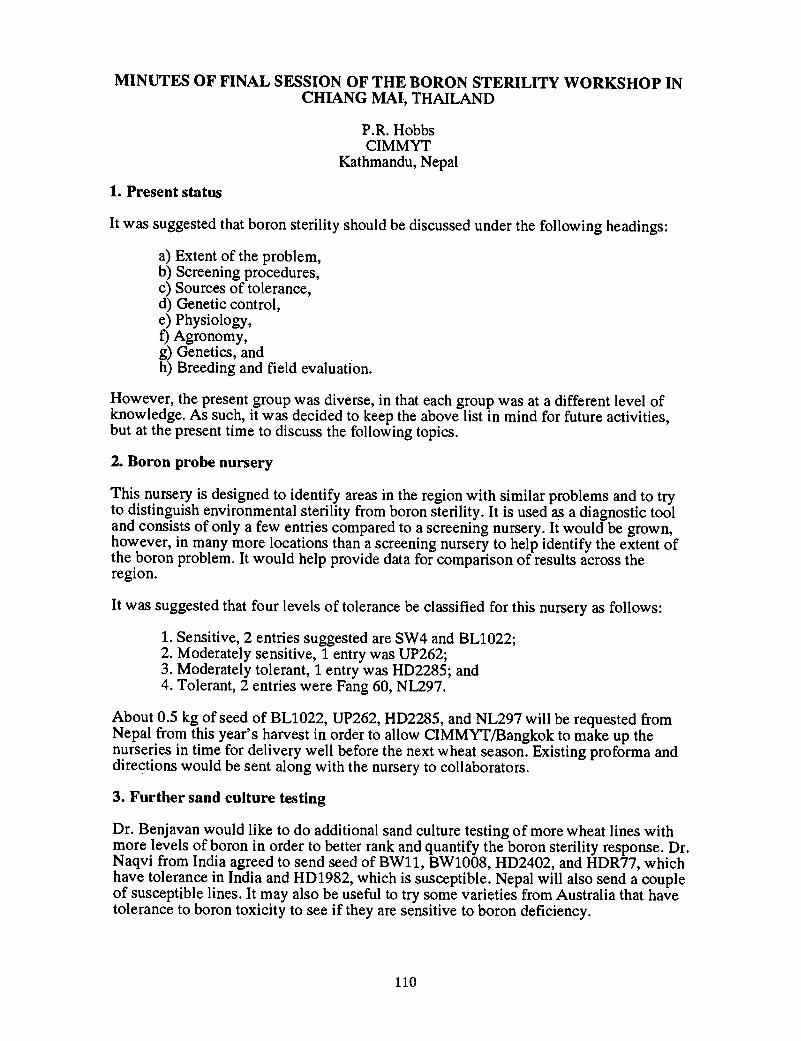
MINUTES OF FINAL SESSION OF THE BORON STERILITY WORKSHOP INCHIANG MAl, THAILAND
P.R. HobbsCIMMYT
Kathmandu, Nepal
1. Present status
It was suggested that boron sterility should be discussed under the following headings:
a) Extent of the problem,b) Screening procedures,c) Sources of tolerance,d) Genetic control,e) Physiology,t) Agronomy,g) Genetics, and .h) Breeding and field evaluation.
However, the present group was diverse, in that each group was at a different level ofknowledge. As such, it was decided to keep the above list in mind for future activities,but at the present time to discuss the following topics.
2. Boron probe nursery
This nursery is designed to identify areas in the region with similar problems and to tryto distinguish environmental sterility from boron sterility. It is used as a diagnostic tooland consists of only a few entries compared to a screening nursery. It would be grown,however, in many more locations than a screening nursery to help identify the extent ofthe boron problem. It would help provide data for comparison of results across theregion.
It was suggested that four levels of tolerance be classified for this nursery as follows:
1. Sensitive, 2 entries suggested are SW4 and BLI022;2. Moderately sensitive, 1 entry was UP262;3. Moderately tolerant, 1 entry was HD2285; and4. Tolerant, 2 entries were Fang 60, NL297.
About 0.5 kg of seed of BLI022, UP262, HD2285, and NL297 will be requested fromNepal from this year's harvest in order to allow CIMMYT/Bangkok to make up thenurseries in time for delivery well before the next wheat season. Existing proforma anddirections would be sent along with the nursery to collaborators.
3. Further sand culture testing
Dr. Benjavan would like to do additional sand culture testing of more wheat lines withmore levels of boron in order to better rank and quantify the boron sterility response. Dr.Naqvi from India agreed to send seed of BWll, BWlO08, HD2402, and HDR77, whichhave tolerance in India and HD1982, which is susceptible. Nepal will also send a coupleof susceptible lines. It may also be useful to try some varieties from Australia that havetolerance to boron toxicity to see if they are sensitive to boron deficiency.
110
4. Boron screening nursery
It was agreed that this nursery should be constituted by CIMMYflBangkok and include10 lines from each country. The entries sent should be prescreened and tolerant with acouple of susceptible checks. The trial would be planted in plots with and without boronusing two replications and should only be planted in areas where sterility is known tooccur. Fewer of these nurseries will be made than the probe nursery. Participatingcountries (India, Nepal, and Bangladesh) are asked to send seed just after halVest of thisseasons' wheat crop to Chris Mann in Bangkok. The seed should be treated and have aphytosanitary certificate; 200 g of each line is needed.
Proforma will be sent along with the trial to collect a full set of data on flowering dates,basal sterility, anther health, pollen health, and seed set plus some climatic andexperimental site data (soils, management).
S. Sterility data collection
The group agreed to standardize the sterility obselVation to the number of grains in thefloret 1 and floret 2 of the 10 central spikelets of an ear. This technique wasdemonstrated in the workshop and all participants are now familiar with it. Thistechnique is relatively quick and distinguishes between sterility per se and sterility causedby low source-sink levels caused by environmental and climatic problems. For example,data presented by Nepal showed more sterility measured as number of filled grains perfloret at low compared to high nitrogen levels. This can be explained by the poorergrowth and lower supply of photosynthate in the low nitrogen treatment and thereforeless florets are filled per spikelet. This is really not sterility since the two basal floretswere probably filled but more a problem of sufficient photosynthate to fill all thefertilized florets in the spikelets.
If time permits, another measure recommended was number of grains per spikelet. Inaddition data on the following would be useful:
a) air temperature at anthesis,b) heading date,c) irrigation dates and standing water,d) anthesis date,e) anther characteristics,t) pollen viability (Iodine staining),g) flag leaf tissue dried,h) spikes collected just before booting,i) fully headed spikes before anthesis, andj) fertilizer samples.
6. Laboratory analysis
Attempts would be made to develop a facility in Nepal for boron analysis in soils andtissue. Help from CMU in the form of a consultant may be needed or scientists ortechnicians could be sent to eMU for training. The former is preferable. Standardreference material would be available from CMU.
7. Regional visits
A visit to Nepal (hills and lowland tarai areas) for the group would be useful next year.The best dates are from mid-March to early April (the latter time for the hills).
111
8. Funding
Chris Mann informed the group that Australian money for the project finishes thissummer. Australia would then give more money to the CGIAR and CIMMYT, but not tospecial projects within CIMMYT directly. He would request that some of this money bemade available for future international collaboration. In the meantime, we may have torely on NARS funding and whatever help exists in the region.
The meeting ended with a vote of thanks to Dr. Benjavan and her CMU colleagues for avery useful workshop.
112
APPENDIX 1. BORON BIBLIOGRAPHY,CIMMYT SOUTHEAST ASIA REGIONAL WHEAT PROGRAM
Update: November 6, 1991
Compiled from various electronic searches and staff reading for use in the AIDABproject "Boron deficiency in Cereals" by C.E. Mann
Abbreviations: A = Abstract available at CIMMYT/Bangkok; P = Full paper available atCIMMYT/Bangkok; T = Title only.
1. Aaberg, B. 1983. Plant growth regulators 47: Some boronic and arsonic acids.Swedish J. Agr. Res. 13:101-106. T 0
2. Agarwala, S.C., P.N. Sharma, C. Chatterjee, and C.P. Sharma. 1981. Development andenzymatic changes during pollen development in boron deficient maize plant. J. PI.Nutrition 3:329-336. P
3. Aggarwal. S.C., and D.V.Yadav. 1984. Effect of boron and nitrogen on yield andboron content of wheat. J. Indian Soc. Soil Sc. 32:197-200. T
4. Alam, M., A. Latif, and M. Sharif. 1986. Effect of Zn and B application with orwithout Mn on the yield of wheat and triticale. NIAB Annual Rep. 1984-85:75-77. T
5. Anspok, P.1. 1972. Soil conditions and the effectiveness of trace elements in theLatvian SSR. Pochvovedenie 1972 No. 4:65-75. A
6. Bajwa, M.s., and K. Singh. 1977. Studies on the boron tolerance of berseem(Trifolium alexandrinum L.) and oats (Avena sativa L.).PI. & Soil 46:45-53. A
7. Berzina, I.G., E.B. Gusev, V.A. Ivanov, and I.G. Fomicheva. 1986. Detecting boronmicroheterogeneities in plants using N alpha-radiography and electron microscopy.Izv.Sev.-Kavk.Nauchn.Tsentra Vyssh.Shk.Estestv.Nauki 4:119-121. T
8. Bharadwaj, V., and B.R. Tripathi. 1981.. Note on the effect of irrigation watercontaining boron applied at different growth stages of wheat. J. Indian Soc. Soil Sc.29:570-571. A
9. Bingham, F.T., J.E. Strong, J.D. Rhoades, and R. Keren. 1985. An application of theMaas-Hoffman salinity response model on boron toxicity. SSSAJ.49:672-674. A
10. Bingham, F.T., J.E. Strong, J.D. Rhoades, and R. Keren. 1987. Effects of salinity andvarying boron concentrations on boron uptake and growth of wheat. PI. & Soil 97:345352. A
11. Bowen, J.E. 1981. Kinetics of active uptake of boron, zinc, copper and manganese inbarley and sugarcane. J. PI. Nutrition 3:215-223. A
12. Bowen, J.E., and P. Nissen. 1976. Boron uptake by excised barley roots. 1.Uptake inthe free space. PI. Physiology 57:353-357. A
13. Bowen, J.E., and P. Nissen. 1977. Boron uptake by excised barley roots.2.Characteristics and kinetics of active uptake. Physiologia Plantarum 41:109-115. A
113
14. Buchenauer, H., and F. Borghoff. 1982. The influence of silicate compounds andborax on the course of mildew attacks on barley and wheat seedlings. 34thInt.Symposium on Crop Protection, Part 3, 875-886. T
15. Cartwright, B., A.J. Rathjen, D.H. Sparrow, J.G. Paull, and B.A. Zarcinas. 1987.Boron tolerance in Australian varieties of wheat and barley. In pages 139-151, W.H.Gabelman and B. Cloughman, eds., Genetic Aspects of Plant Mineral Nutrition, 16-20June, 1985, Madison, USA. A
16. Cartwright, B., KG. Tiller, B.A. Zarcinas, and L.R. Spouncer. 1983. The chemicalasessment of the boron status of soils. Austr. J. Soils Res. 21:321-33. A
17. Cartwright, B., B.A. Zarcinas, and A.H. Mayfield. 1984 Toxic concentrations ofboron in a red-brown earth at Gladstone, South Australia. Austr. J. Soils Res. 22:261272. A
18. Cartwright, B., B.A. Zarcinas, and L.R. Spouncer. 1986. Boron toxicity in SouthAustralian barley crops. Austr.J. Agric. Res. 37:351-359. A
19. Cerda, A., and F.T. Bingham. 1979. Effects of the interaction of sodium chloride andphosphorus on the foliar content of iron, manganese, zinc, copper, and boron in plants(Sesame, wheat, tomatoes). Annales de Edafologia y Agrobiologia 38:233-243. T
20. Chatterjee, B.N., M. Chatterjee, and N.R. Das. 1980. Note on differences in theresponse of wheat varieties to boron. Indian J. Agr. Sc. 50:796. A
21. Chauhan, R.P.S., and A.K Asthana. 1981. Tolerance of lentil, barley and oats toboron in irrigation water. J. Agr. Sc. 97:75-78. A
22. Chauhan, R.P.S., and S.L. Powar. 1978. Tolerance of wheat and pea to boron inirrigation water. PI. & Soil 50:145-149. T
23. Coqueiro, E.P., and J.M.V de Andrade. 1974. Fertilization with zinc, copper,manganese, boron, and magnesium in wheat in Sete Lagoas Boletim TecnicoInst.Pesqisa Agropecuaria do Centro-Oeste, Brazil. No. 24. 4 pp. T
24. Crabb, D. 1970. Effect of boron on barley germination and malting. Inst. Brewing J.76:14-16. T
25. Dani, H.M., G.S. Paul, V.K Kakkar, H.S. Saini, and K Sareen. 1970. Effect ofboron on protein and nucleic acid contents of wheat plant. Punjab U. Res. Bull. 21:425430.T
26. Dani, H.M., H.S. Saini, I. Allag, and K Sareen. 1970. Role of boron in nucleic acidmetabolism of germinating wheat seedlings. Cur. Sc. 39:55-57. T
27. Dani, H.M., H.S. Saini, S.S. Saini, and K Sareen. 1970. Effect of boron on starchand protein contents of wheat grains. Cur. Sc. 39:235-236. T
28. Darra, B.L., N. Jain, and H. Singh. 1970. Effect of growth regulators and salts on thegermination of wheat (Triticum aestivum L.) under high salinity, sodium-adsorption ratioand boron levels. Indian J. Agr. Sc. 40:438-444. T
114
29. Darra, B.L., and S.N. Saxena. 1974. Effect of presoaking seed treatment with indoleacetic-acid on wheat under different salinity regimes coupled with SAR and boronlevels. Indian J. Agr. Res. 8:215-220. T
30. Dell, B. 1981. Male sterility and anther wall structure in copper deficient plants. Ann.Bot. 48:599-608. P
31. Dhir, S.c., H.M. Dani, and S. Ohja. 1982. Boron requirements of Haryana Indiasoils. Res. Bull. Punjab U. Sc. 33:109-112. A
32. Dongale, J.H., and G.K. Zende. 1978. Residual effect of manganese, boron andsulphur on the yield of wheat. Food Farming & Agr. 9:369<371. T
33. Durman, P., and L. Uscumlic. 1976. The problem of boron in some soils in intensiveagricultural production at the Agricultural Processing Plant Kutjevo. Agron. Glas38:147-150. T
34. Eizenberga, V. 1974. The effect of zinc and boron on the development of powderymildew in barley. Vestis Latv.PSR Zinat Akad. 6:30-33. T
35. Elseewi, A.A.E.M. 1968. Characteristics of boron absorption by barley plants. Ph.D.Thesis, U. California, Riverside. 102 pp. T
36. EI-Damaty, A., W.A. EI-Hamid, A.E. EI-Sherbeni, and N.M. EI-Mowelhi. 1974. CalB ratio in different soils and plants as affected by varying quantities of calcium carbonateand boron. Agr. Res. Review 52:63-74 A
37. EI-Hadidy, Z.A., R.R. Francis, and M.A.Shehata. 1980. Effect of spraying withsome micronutrients on the pigments in wheat blades, yield and carbohydrate fraction ofgrains. Res. Bull. Fac. Agr. Ain Shams U. Cairo No. 1315.23 pp. T
38. EI-Khomsi, T., and M. Rasheed. 1979. Effect of boron on barley grown on sandyloam saline soil. Agr. Res. Centre Tripoli, SIRU-Report No. 6/79. 13 pp. T
39. Erdman, J.A., and R. Moul. 1982. Mineral composition of small grain cultivars froma uniform test plot in South Dakota, USA. J. Agr. Food Chemistry 30:169-174. A
40. Falke, H. 1985. Influence of increasing boron rates on the boron content of soil andspring barley~ In pages 143-147, M. Anke, C. Bruckner, H. Gurtler, and M.GrunMengen, eds., und Spurenelemente, Karl-Marx-Universitaet, Leipzig, Germany. A
41. Fernandez Hernandez, J. 1976. Response to the foliar application of minor elementsin form of chelates and boron on Mochaca barley (Hordeum vulgare). Ing. agr. Thesis,U. Pedagogica y Technologica de Colombia, Tunja. 205 pp. T
42. Fontoura, J.U.G. 1986. Dry matter production, cumulative uptake and exportation ofmineral nutrients by two wheat cultivars, BH1146 and IAC24-Tucurui, under twoconditions of water levels in a purple latozol in Mato Grosso do Sui, Brazil. Ph. D.ThesisEscola Superior de Agricultura Luiz de Queiroz, Piracicabe, SP. 135 pp. T
43. Forna, D.A., C.J. Asher, D.G. Edwards. 1979. Boron nutrition of cassava, and theboron x temperature interaction. Field Cr. Res. 2:265-279. P
115
44. Gallardo-Lara, F., J. Robles, M. Gomez, and E. Esteban. 1984. Fertilizer value of atown refuse compost. IV. Direct and residual effects on availability of boron and copper.Proc. VIth Int. Colloquium for the Optimization of Plant Nutrition. Volume I.Montpellier Cedex, France. pp. 215-222. A
45. Gandapur, M.A.K, and A. Bhatti. 1984. Effect of copper, zinc and boron on theyield of wheat. Gomal U. J. Res. 4:1-5. T
46. Ganguly, B. 1979. Note on seedlessness in some wheat varieties caused by borondeficiency. Indian J. Agr. Sc. 49:384-386. A
47. Garg, O.K, A.n. Sharma, and G.R.S.S Kona. 1979. Effects of boron on pollenvitality and yield of rice plants (Oryza sativa L. var. Jaya). PI. & Soil 52:591-594. P
48. Graham, R.D. 1975. Male sterility in wheat plants deficient in copper. Nature254:514-515. P
49. Graham, R.D., R.M. Welch., D.L. Grunes, E.E. Cary, and W.A. Norvell. 1987.Effect of zinc deficiency on the accumulation of boron and other mineral nutrients inbarley. SSSA J. 51:652-657. A
50. Gulati, KL., M.C. Oswal, and KK Nagpui. 1980. Effect of concentration of boronon the uptake and yield of tomato and wheat at different levels of irrigation. PI. & Soil54:479-484. T
51. Gulati, KL, M.C. Oswal, KK Nagpui. 1986. Boron uptake by wheat as influencedby its profile distribution. Int. J. Trop. Agr. 4:126-129. A
52. Gupta, I.C. 1980. The effect of irrigation with high boron waters on the growth of.wheat. Current Agr.4:51-55. T
53. Gupta, I.C. 1981. Effects of boron and lithium in irrigation water on the growth ofbarley. Transactions, Indian Soc. Desert Technology and U. Centre of Desert Studies6:120-123. A
54. Gupta, U.C. 1971. Boron and molybdenum nutrition of wheat, barley and oats grownin Prince Edward Island soils. Can. J. Soil Sc. 51:415-422. T
55. Gupta, U.C. 1972. Interaction of boron and lime on barley. SSSA, Proceedings 1972.36:332-334. A
56. Gupta, U.C. 1972. Effects of manganese and lime on yield and on the concentrationsof manganese, molybdenum, boron, copper and iron in the boot stage tissue of barley.Soil Sc. 114:131-136. A '
57. Gupta, U.C. 1977. Effects of boron and limestone on cereal yields and on Band Nconcentration of plant tissue. PI. & Soil 47:283-287. A
58. Gupta, U.C., and J.A. Cutcliffe. 1982. Residual effect of boron applied to RatabagaBrassica napobrassica on subsequent cereal crops. Soil Sc. 133:155-159. A
59. Gupta, U.C., and J.A. Macleod. 1981. Plant and soil boron as influenced by soil pHand calcium sources on podzol soils. Soil Sc. 131:20-25. A
116
60. Gupta, V.C., J.A. Macleod, and J.D.E. Sterling. 1976. Effects of boron and nitrogenon grain yield and boron and nitrogen concentrations of barley and wheat. SSSA J.40:723-726. A
61. Gupta, V.C., J.D.E. Sterling, H.G. Nass. 1973. Influence of various rates of compostand nitrogen on the boron toxicity symptoms in barley and wheat. Can. J. PI. Sc. 53:451456. A
62. Iqtidar, A., and S.F. Rehman. 1984. Effect of boron on the protein and amino acidcomposition of wheat grain. J. Agr. Sc. 103:75-80. A
63. Ishizuka, Y. 1971. Nutrient deficiencies of crops. ASPAC Food and Fertilizer Center,Taipei, Taiwan. 112 pp. A
64. Jelenkovic, R. 1969. The effect of B, Cu, Zn and Mn on the wheat growth anddevelopment and dry matter yield. Contemporary Agr. 17:291-296. T
65. Jimenez, F., F.P. Montero, and J. Munoz. 1982. Influence of boron and gibberellicacid on the metabolism of glucides and proteins during the barley seed germination.Agrochimica 26:544-549. A
66. Jimenez-Lucena, F., and J.M. Barea. 1979. Inhibition of seed germination and alphaamylase activity by high doses of boron and reversal by Azotobacter producedgibberellin and gibberellic acid. Agrochimica 23:397-400. A
67. Jones, L.H.P., D.C. Whitehead, R.D. Hartley, and S.C. Javris. 1977. Mineral Contentof forage plants in relation to nutritional quality. Grassland Research Institute, Hurley,Maidenhead, Berks, VK. Annual Report 1976. A
68. Jost, M., and P. Durman. 1976. Potential use of boron preparations for additionalfertility restoration in partially restored wheat hybrids. Poljopr. Znan. Smotra 38:99-104.T
69. Jurkowska, H., and A. Rogoz. 1980. The effect of increasing doses of ammoniumnitrate on the content of mineral constituents in plants. 2. Micro el~ments. Acta AgrariaSilvestria Ser Agrar 19:76-84. A
70. Jurkowska, H., and A. Rogoz. 1981. The effect of the form of nitrogen and its doseon the content of macro elements and micro elements in plants. 2. Micro elements. ActaAgraria Silvestria Ser Agrar 20:121-132. A
71. Kaemmerer, K. 1978. Boron contamination of plant foods and feeds and of cow'smilk. Berliner und Muenchener Tieraerztliche Wochenschrift 91:227-232. A
72. Kandera, J. 1975. Effect of boron, copper, manganese, molybdenum and zinc onspring barley. Agrochemia 15:257-260. A
73. Karabach, M.L. 1976. Biogeochemical problems of boron uptake by plants in theboron provinces. Tr. Biogeochim. Lab. Akad. Nauk. SSSR 14:215-230. T
74. Kausar, M.A., and M. Sharif. 1986. Response of boron application on wheat andlucerne. NIAB Ann.Rep.1984-85:77-78. T
117
75. Keren, R., F.T. Bingham, and J.D. Rhoades. 1985. Effect of clay content in soil onboron uptake and yield of wheat. SSSAJ. 49:1466-1570. A
76. Khalil, M.N., M.A. El-Kadi, and S.E. EI-Demardash. 1978. Boron requirements ofcom and barley grown under the conditions of highly calcareous soils. The Desert Inst.Bull. 28:369-376. T
77. Khan, M.U., and S.N. Saxena. 1974. Effect of quality of irrigation water on drymatter production and on calcium, magnesium and phosphorus content of wheat, barleyand pea. Annals Arid Zone 13:11-16. A
78. Kluge, R., and W. Podlesak. 1985. Plant critical levels for the evaluation of borontoxicity in spring barley (Hordeum vulgare L.). Pl.& Soil 83:381-388. A
79. Korosi, F., L. Andras. and G. Patzay. 1986. Microelement treatment of wheat (SieteCerros) seeds. II. Effect of microelement soaking on enrichment of seeds as well as onleaching of nutrient elements during the soaking and the germination. Bull. U.Agr.Sciences 1:59-67. A
80. Korosi, F., L. Andras, and G. Patzay. 1986. Microelement treatment of wheat (SieteCerros) seeds. II. Effect of microelement soaking on manganese, copper and potassiumcontent of wheat seedlings. Bull. U. Agr. Sciences 1:69-72. A
81. Krupnikova, T.A., and Y.S. Smirnov. 1981. Content of phenol compounds in plantsin relation to boron supply. Bot.ZH.66:536-542. A
82. Krupnikova, T.A., Y.S. Smirnov, and M.Y. Shkol'nik. 1975. Effect of boron onactivity of auxin oxidase in plants differing its requirement. Fiziologiya BiokhimiyaKul'turnykh Rastenii 7:569-573. A
83. Kulshrestha, V.P., M.V. Rao, and A. Austin. 1976. Response of triticale to foliarspray of boron and its effect on grain quality. Genetica Agraria 30:75-83. A
84. Kumar, S. 1978. Plant growth and uptake of boron and molybdenum as affected bypotassium fertilization. Thesis Abstr.4:72-73. A
85. Lal, F., and P. Lal. 1980. A study on the evaluation of water quality with respect toboron for wheat and barley growth on loamy sand soil. Annals Arid Zone 19:239-241. A
86. Lashkevich, G.I. 1973. Trace elements and crop productivity on peat soils. DoklayAkademii Nauk BSSR 17:863-866. A
87. Lasztity, B. 1987. The variation of element contents in triticale during vegetativegrowth. Fertilizer Res. 13:155-160. A
88. Li, W.H., M.C .Kui, N.S. Chao, M.P. Jern, C.R. Li, W.J. Chu, and C.L. Wang. 1978.Studies on cause of sterility of wheat. J. Northeastern Agr. College 3:1-19. P
89. Lipsett, J., A. Pinkerton, and OJ. David. 1979. Boron deficiency as a factor in thereclamation by liming of a soil contaminated by mine waste. Environmental Polution20:231-240. A
90. Liu, Z., Q. Zhu, and L. Tang. 1981. Boron deficient soils and their distribution inChina. Inst.Soil Sc., Academia Sinica, Soil Res.Rep.No.3. Nanjing. P
118
91. Lu, Q.Q. 1981. Index of boron deficiency causing spring wheat infertility andprediction of adequacy of other trace elements in some areas of Northeast China. J. SoilSc.5:22-24. A
92. Maevskaya, A.N., V.N. Davydova, K.I. Mochenyat, and E.A. Troitskaya. 1983.Accumulation and distribution of boron in Avena sativa and Helianthus annuus with highboron concentrations in the medium. Fiziologiya Rastenii 30:1164-1170. A
93. Maevskaya, A.N., E.A. Troitskaya, G.A. Temp, and E.A. Andreeva. 1975. Activityof beta-glucosidase in plant differing in boron requirements. Fiziologiya Rastenii 22:571575. A
94. Maevskaya, A.N., EA. Troitskaya, and N.S. Yakovlevea. 1976. Effect of borondeficiency on beta-glucosidase activity in species of the leguminosae and the gramineae.Fiziologiya Rastenii 23:1269-1273. A
95. Mahler, R.L., J.E. Hammel, and R.W. Harder. 1985. The influence of crop rotationand tillage methods on the distribution of extractable boron in northern Idaho soils. SoilSc. 139:67-73. A
96. Manchanda, H.R. 1980. Soil salinity and boron in relation to the growth of barley.Int. Symp.on Salt Affected Soils. 18 to 20 Feb. 1980:389-395. T
97. Manchanda, H.R., and a.p. Yadav. 1978. Effect of boron application on barley in asierozem sandy soil. PI. & Soil 50:711-714. A
98. MandaI, A.B. 1987. Genetic responses ()fboron on bread wheat varieties under teraisoil. J. Maharashtra Agr. U. 12:268-269. T
99. Markovic, M., and M. Basovic. 1971. Correlation between the content of boron inwheat kernels and some agroecological factors. Agrohemija 1/2:27-30. T
100. McPhillips, K. 1980. Boron deficiency in wheat. Farming in Zambia 13:8-9. T
101. Mehrotra, a.N., R.D.L. Srivastava, and P.H. Mishra. 1980. Some observations onthe relative tolerance of wheat genotypes to boron. Indian Agriculturist 24:223-238. T
102. Melati, M.R., and E. Bellini. 1981. Boron distribution in barley (Hordeumdistichum) and radish (Raphanus sativus) seedlings. PI. Sc. Letter 22:205-210. A
103. Misra, N.M., and S. Venkateswarlu. 1981. Effect of soil vs. foliar application ofcertain micro-nutrients on wheat var. Kalyan Sona (Zinc, boron, copper, iron). FoodFarming & Agr.14:57-59. T
104. Moody, D.B., AJ. Rathjen, and B. Cartwright. 1990. Yield evaluation of borontolerance using backcross-derived lines. 6th Assembly of the Wheat Breeding Society ofAustralia, Tamworth. P
105. Moody, D.B., AJ. Rathjen, B. Cartwright, J.G. Paull, and J. Lewis. ? Geneticdiversity and geographical distribution of tolerance to high levels of soil boron. ? P
106. Mortvedt, JJ. 1983. Impacts of acid deposition on micronutrient cycling in agro':'ecosystems. Environmental and Experimental. Botany 23:243-249. A
119
107. Murdoch, U. ? Rapid method for plant boron. And: Dry-ashing technique fordetermination of boron. ? P
108. Nable, R.O., C.M. Lance Reg, and B. Cartwright. ? Uptake of boron and silicon bybarley genotypes with differing susceptibilities to boron toxicity. ? P
109. Nable, R.O., and J.G. Paull. ? Effect of excess grain boron concentrations on earlyseedling seedling developmnet and growth of several wheat (Triticum aestivum)genotypes with different susceptibilities to boron toxicity. ? P
110. Nable, R.O., J.G. Paull, and B. Cartwright? Problems associated with the use offolia~ analysis for diagnosing boron toxicity in barley. PI.& Soil? P
111. Nilsson, L.G., and P. Jennische. 1986. Determination of boron in soils and plants.Chemical methods and biological evaluation. Swedish J.Agr.Res.16:97-103. A
112. Oertli, J.J. 1970. Characteristics of boron uptake and loss in barley leaves.Agrochimica 13:212-219. T
113. Oertli, J.J., and N.Y. Ahmed. 1971. Artificially induced mobility of boron.Z.Pflanzenemaehrung und Bodenkunde 128:97-104. A
114. Oertli, J.J., and E. Grgurevic. 1975. Effect of pH on the absorption of boron byexcised barley roots. Agr. J. 67:278-280. A
115. Ohja, S., H.M. Dani, and S. Dhir. 1982. Boron requirements of Punjab India soils.Res. Bull. Punjab U. Sc. 33:3-4. A
116. Oliver, R., M. Damour, J. Velly, and J.B. Razafindramonjy. 1974. Study of pHboron deficiency relationships on three hydro- morphic soils of the high plateaux inMadagascar. Agron. Tropicale 29:28-42. A
117. Pathak, A.N., D.N. Sharma, and M.L. Sharma. 1981. Water soluble B concentrationas affected by different chemical amendments and its impact on B content of paddy andbarley plants in salt affected soils. Agrokemia es Talajtan 30 (Supplement):198-204. A
118. Paull, J.G., B. Cartwright, and A.J. Rathjen. 1988. Responses of wheat and barleygenotypes to toxic concentrations of soil boron. Euphytica 39:137-144. P
119. Paull, J.G., A.J. Rathjen, and B. Cartwright. 1990. Genetic control of tolerance toboron in wheat. 6th Assembly of the Wheat Breeding Society of Australia, Tamworth. P
120. Paull, J.G., A.J. Rathjen, B. Cartwright, and R.O. Nable. ? Selection parameters forassessing the tolerance of wheat to high concentrations of boron. PI. & Soil? P
121. Pereira, V.L.A.O., W.S. Faria, N.T. Teixeira, J.B. Vivarelli, and J.G. Depaoli. 1982.Effect of boron application on wheat and sunflower (Pot experiment). Ecosistema 7:150152. T
122. Pesant, A.R., and B.T. Cheng. 1984. The growth and nutliient content of cereals andforage crops as affected by temperature and moisture. Agrochimica 28:361-366. A
120
123. Pinkerton, A., and J.R. Simpson. 1986. Interactions of surface drying andsubsurface nutrients affecting plant growth on acidic soil profiles from an old pasture.Austr. J. Exp. Agr. 26:681-690. A
124. Potatueva, Y.A., L.S. Kuz'mich, and LA. Yanchuk. 1982. Effect of excessive boronrates on plants and soil. Agrokimiya (10):108-112. A
125. Powar, S., and R.P.S. Chauhan. 1979. Effect of boron in irrigation water on proteincontent of wheat and pea grains. Food Farming & Agr. 11:38-39. T
126. Ralph, W. 1986. Boron toxicity in southern cereals. Rural Res. No. 130:25-27. A
127. Reisenauer, H.M., L.M. Walsh, and R.G. Hoeft. 1977. Soil testing and plantanalysis. In pages 173-200, L.M. Walsh and J.D. Beaton, eds., Testing Soils for Sulphur,Boron, Molybdenum, and Chlorine. Wisconsin, USA, SSSA. A
128. Rerkasem, B. ? Critical boron concentration for grain set in wheat. ? P
129. Rerkasem, B. 1990. Genotypic variation in the response to boron in barley. Proc.Int. Soil Congress, Kyoto, August 1990. P
130. Rerkasem, B., and S. Jamjod. 1989. Correcting boron deficiency induced earsterility in wheat and barley. Thai J. Soils & Fertilizers 11:200-209. P
131. Rerkasem, B., S. Lodkaew, and S. Jamjod. 1991. Assessment of grain set failureand diagnosis for boron deficiency in wheat. In pages 500-504, D.A. Saunders, ed.,Wheat for the Nontraditional Warm Areas. Mexico, D.F. CIMMYT. P
132. Rerkasem, B., R. Netsangtip, R.W. Bell, J.F. Loneragan. 1987. Hollow-heartsymptom in groundnut used to survey for boron deficiency in Thailand. Int. ArachisNewsl. 2:11-12. P
133. Rerkasem, B., R. Netsangtip, R.W. Bell, J.F. Loneragan, and N. Hiranburana. 1988.Comparative species responses to boron on a typic tropaqualf in northern Thailand. PI. &Soil 106:15-21. P
134. Rerkasem, B., D.A. Saunders, and B. Dell. 1989. Grain set failure and borondeficiency in wheat in Thailand. J. Agr. (CMU) 5:1-10. P
135. Riley, M.M. 1986. Boron toxicity in barley. J. PI. Nutrition 10:9-16. T
136. Roberts, S., and W.H. Weaver. 1976. Residual availability of boron applied to anirrigated alkaline soil. Washington State U. College Agr. Res. Center Bull. 829. 4 pp. T
137. Ruhal, D.S., and R. Deo. 1971. Note on the effect of boron in irrigation water on"Sonora 64" wheat (Triticum aestivum). Indian J. Agr. Sc. 51:577-578. T
138. Ruszkowska, M., Z. Rebowska, A. Kapusta, M. Kusio, and S. Sykut. 1984. Balanceof mineral nutrients in a lysimetric experiment (1977-81).3. Balance of trace elements(B, Mn, Cu, Zn, Mo). Pamietnik Pulawski 82:51-68. A
139. Ryan, J., S. Miyamoto, and J.L. Stroehlein. 1977. Relation of solute and sorbedboron to the boron hazard in irrigation water. PI. & Soil 46:253-256. A
121
140. Sakal, R., A.P. Singh, KN. Thakur, and R.B. Sinha. 1980. Response of wheat andlentil to zinc, iron, and boron applications in calcareous soil (in the state of Bihar). TheMadras Agr. J. 67:131-133. T
141. Saleh, S.A., F.I. EI-Bastawesy, M.S. Khadr, and A.H. Abdel-Hadi. 1983. Nitrogenand boron effects on growth and yield component of wheat plants. Annals Agr. Sc.Moshtohor, Egypt 17:37-50. T
142. Sarasawat, S.N., and KS. Singh. 1974. Studies on the response of a dwarf and a tallvariety of wheat to levels of micronutrients. II.Effect of copper, molybdenum, boron, andmixture of micronutrients. Indian J. Agr. Res. 8:139-144. T
143. Sarma, R., and N.D. Das. 1982. Response of wheat to application ofZn, B and Mo.J. Maharashtra Agr. U. 7:155-157 T
144. Schnug, E. 1987. Pattern of nutritional elements as a genetic characteristic ofspecies and cultivars of agricultural plants. Int. Bot. Congress Abstr. 17:193. T
145. Schulte zu Bergen, J. 1972. The effect of boron, copper and zinc in combination oflate nitrogen fertilizing on the amino acid content of winter wheat protein at the time ofear development, milk and total maturity. Diss. Bonn. 113 pp. T
146. Schulte zu Bergen, J., and H. Kick. 1973. Influence of boron, copper and zincprovision as well as late nitrogen fertilizing on the amino acid content in the grain proteinof winter wheat. Landw. Forschung Sonderh. 28:84-93. T
147. Semb, G. 1978. Liming experiments in Soloer and Odal (Norway). II.Yield andmineral content (phosphorus, potassium, magnesium, calcium, manganese, zinc, boron,molybdenum) of the plants in field experiment. Res. in Norwegian Agr. 29:1-18. T
148. Sheikh, KH., and S. Khanum. 1976. Some studies of the quality of irrigation waterand the germination and growth of wheat at different concentrations of boron. PI. & Soil45:565-575. T
149. Shkol'nik, M.Y., and N.L. Il'inskaya. 1975. Effect of boron deficiency on theactivity of glucose-6-phosphate dehydrogenase. Fiziologiya Rastenii 22:801-805. A
150. Shkol'nik, M.Y., T.A. Krupnikova, and Y.S. Smirnov. 1981. Activity of polyphenoIoxidase and sensitivity to boron deficiency of some monocotyledonous anddicotyledonous plants. Fiziologiya Rastenii 28:391-397. A
151. Shkol'nik, M.Y., and A.N. Maevskaya. 1977. Differences in sensitivity of variousplant taxa to boron deficiency and their causes. Botanicheskii Zhurnal 62:1528-1540. A
152,. Shkol'nik, M.Y., and A.N. Maevskaya. 1977. Differences in sensitivity of variousplant taxa to boron deficiency and their causes. Botanicheskii Zhurnal 62:1528-1540. A
153. Shkol'nik, M.Y., A.N. Maevskaya, and A.A. Sergeichik. 1980. Activity of phenylalanine ammonia lyase and sensitivity to boron deficiency in some monocots and dicots.Fiziologiya Rastenii 27:773-777. A
154. Sikora, H. 1974. Influence of fertilization with trace elements on the content of B,Cu, Mn, Mo, and Zn in the soil and plants. Pamietnik Pulawski 59:101-131. A
122
155. Silva, A.R., da, and J.M.V. da Andrade. 1983. Influence of micronutrients on themale sterility of upland wheat and on rice and soybean yields in red-yellow latosol.Pesquisa Agropec. Bras. 18:593-601. P
156. Simojoki, P. 1972. Results of boron fertilizer experiments on barley. AnnalesAgriculturae Fenniae 11:333-341. A
157. Singh, A.P. 1986. Effect of soil nutrients and varietal reaction to the populationbuild-up of brown wheat mite Petrobia latens (Muller) on wheat. Entomon 11:115-120.A
158. Singh, B., and S.C. Singh. 1976. Effect of boron on quality and yield of wheatgrains (RR21). Proc. Indian Nat. Sc. Academy 42:130-134. A
159. Singh, H, and B.L. Darra. 1970. Influence of pre-soaking of seeds with gibberellinand auxins on growth and yield attributes of wheat (Triticum aestivum L.) under highsalinity, sodium-adsorption ratio and boron levels. Indian J. Agr. Sci. 41:998-1103. T
160. Singh, H., B.L. Darra, and N. Jain. 1974. Role of some phytohormones aspresoaking seed treatment on growth and yield attributes of wheat (Triticum aestivum L.)irrigated with saline-alkali water in conjunction with different levels of boron. AnnalsArid Zone 13:84-93. T
161. Singh, H.M., S.D. Sinha, and R.B. Prasad. 1976. Effect of boron on seed setting inwheat under North Bihar conditions. Indian J. Agron. 21:100-101. A
162. Singh, K.P., and H. Singha. 1976. Availability of boron in relation to certain soilproperties. J. Indian Soc. Soil Sc. 24:403-408. A
163. Singh, V., and S.P. Singh. 1984. Studies on boron toxicity in lentil and barley.Indian J. Agron. 29:545-546. T
164. Slusarczyk, M. 1975. Effect of boron on the content of skeletal substances in theculms of spring wheat. Pamiet Pulawski 62:197-205. T
165. Sotiriou. N. 1968. Effect of sulfur, zinc, copper and boron on the quality of wheat inrelation to the late application of nitrogen fertilizers. Diss. Bonn. 95 pp. T
166. Szabo, S.A. 1979. Investigations on the B content of plant materials and on thefactors affecting its uptake and distribution. Botanikai Koslemenyek 66:269-274. A
167. Szukalski, H. 1975. Trace element contents of agricultural crops and soils as relatedto application of micronutrients. 1. Boron and copper contents. Nowe Rolnictwo 24:1719.A
168. Szukalski, H., W. Mackowiak, S. Jakubowski, and H. Sikora. 1973. Results of fieldexperiments with applied boron, manganese and molybdenum. Pamietnik Pulawski157:57-74. A
169. Tanev, B., and M. Georgiev. 1977. Influence of soil moisture on the content anddisttubution of boron and copper of winter wheat "Bezostaya". Agrochemija 9/10:357363.T
123
170. Troitskaya, E.A., A.N. Maevskaya, and G.A. Temp. 1975. Hydroxiproline contentin cell walls of plants with different boron requirements. Fiziologiya Rastenii 22:976980.T
171. Varju, M. 1969. Effect of manganese and boron on winter wheat. MagyarMezogazdasag 24:14. T
172. Vaughan, A.K.F. 1977. The relation between the concentration of boron in thereproductive and vegetatve organs of maize plants and their development. Rhod. J. Agric.Res. 15:163-170. T
173. Verma, L.P. 1983. Tolerance of wheat to boron in irrigation water. J. Indian Soc.Soil Sc. 31:167-168. T
174. Singh, V., and S.P. Singh. 1984. Effect of applied boron on nutrients and uptake bybarley crop. Current Agr. 8:86-90. A
175. Singh, V., and· S.P. Singh. 1984. Studies on boron toxicity in lentil and barley.Indian J. Agron. 19:545-546. A
176. Vlamis, J., and D.E. Williams. 1970. Comparative accumulation of manganese andboron in barley tissues. PI. & Soil 33:623-628. T
177. Vlasyuk, P.A., E.A. Rubanyuk, and I.G. Shmat'ko. 1969. Effect of zinc and boronon nucleic metabolism in winter wheat varieties under drought conditions. FiziologiyaRastenii 16:1049-154. T
178. Vogt, P., and A. Jaakkola. 1978. The effect of mineral elements added to Finnishsoils on the mineral contents of cereal, potato, and hay drops. 2. Aluminium, boron,molybdenum, strontium, chronium, cobalt, and lead. Acta Agriculturae Scandinavica.Supplementum 20:69-79. T
179. Vorisek, V., M. Kummerova, and Z. Tesarova. 1974. The role of trace elementsboron, copper and manganese in the photosynthesis and respiration of cultivated plants.Acta Universitatis Agriculturae, Bmo, Facultas Agronomica 2:645-652. A
180. Watanabe, H., C. Chermsiri, S. Attajarusit, S. Kaiwroj, J. Tuntiwarawit, and W.Cholitkul. 1990. Boron deficiency in garlic (Allium sativum) in an abruptic tropafluventof North Thailand. 1990 Annual Res.Conf., DoA Thailand, April 23-27, 1990, Pattaya. A
181. Yadav, a.p., and H.R. Manchanda. 1979. Boron tolerance studies in gram(chickpeas) and wheat grown on a Sierozem sandy soil. J. Indian Soc. Soil Sc. 27:174180. T
182. Yamanaouchi, M. 1979; Boron nutrition in crop plants. Bull. Fac. Agr., Tottori U.31:37-91. T
183. Ylaranta, T., H. Jansson, and J. Sippola. 1979. Seasonal variations in micronutrientcontents of wheat (Boron, copper, iron, manganese, molybdenum, zinc). AnnalesAgriculturae Fenniae 18:218-224. T
184. Zeleny, F. J. Neuberg, L. Chval, and F. Paty. 1982. Content of copper, zinc,manganese, molybdenum, and boron in the main cultivars of winter wheat. RostlinnaVyroba UVTIZ 28:1143-1152. T
124
185. Zeleny, F., F. Paty, J. Neuberg, and L. Chval. 1982. Relation between the content ofN, P, K, Ca, Mg, Cu, Zn, Mn, Mo, and B in the above ground parts of winter wheat andthe yield of grain. Rostlinna Vyroba UVTIZ 28:1241-1253. T
186. Zia-ur-Rehman. 1982. Available boron status of six soil series of Peshawar valleyand wheat response to its fertilization. M.S. Thesis NWFP Agr. U. Peshawar, Pakistan.61 pp. T
187. Zielin~ka, A. 1973. The effect of liming and of magnesium, boron, copper andmolybdenum fertilization on quantity and quality of summer barley and red clover yields.Rocz. Nauk Roln. Ser. A. Rosl. 98:85-101. T
188. Zielinski, A., and A. Zielinska. 1973. After-effect of liming and fertilization withmagnesium, boron, copper, molybdenum on soil and winter wheat and winter rye yields.Rocz. Nauk. Roln., Ser. A Prod. Rosl. 99:132-132. T
125
APPENDIX 2. BORON DEFICIENCY NURSERIES, 1990-91
When completed, please return this book to:
Dr. B. Rerkasem,Multiple Cropping Centre,Faculty of Agriculture,Chiang Mai University,Chiang Mai 50002Thailand.
Also send plant samples for B analysis to the above address.Any query relating to the Boron Probe Nursery and the Boron Screening Nursery may besent to Dr. Rerkasem at the above address or by
Telex No: 43553 UNICHIM THFax No: 6653 210 000
Boron Deficiency Nurseries, 1990-91
Indications of B deficiency in wheat, especially severe floret sterility or grain set failure,have been observed over wide areas in Bangladesh, Nepal, India, Thailand, and China inthe last few years. In most of these places, wheat genotypes have been observed to vary agreat deal in their responses to B deficiency. Two boron deficiency nurseries of wheathave been prepared from materials identified in Chiang Mai, Nepal, and Bangladesh fortesting collaborating institutions in the 1990-91 growing season:
• Boron Deficiency Probe Nursery: 120 m2 (5x24 m or 10x12 m),
• Boron Deficiency Tolerance Screening Nursery: 20 m2 (2.5x8 m).
Site selectionA site where sterility or severe sterility has been observed in wheat in previous yearswould be ideal. If possible, the level of available soil boron (hot water soluble, HWS)should be recorded. It would be preferable to plant the nurseries on soils with ~ 0.15 mgHWSBlkg (~ 0.15 ppm).
General crop managementThe seeds sent will have been treated with a fungicide (Vitavax) and an insecticide(Marshal-Carbofuran). Seed in each individual packet will be enough to plant one 2.5-mrow, with a 0.25-m spacing between the rows.
The crop should receive the optimum general management, Le., for land preparation,irrigation, and pest and weed control, as normally applied to your other wheat nurseries.
Note on fertilizer applicationAnalyses of fertilizers have shown consistently high levels of boron contamination (170mg Blkg in a sample from Bangladesh; highest at 683 mg Blkg found in Thailand) intriple superphosphate. It is suggested that the use of triple phosphate is avoided ifpossible.
126
Please take two 30-g samples of each of any fertilizers used and send them to ChiangMai (address: see inside cover of this booklet). The number in brackets in the textcorresponds to the similarly numbered column on the data sheet.
Stages or growthPlease refer to stages of growth by scale of 1 to 11 as in Figure 1.
Grain set assessmentTake a random subsample of 20 ears from each plot at stage 11 (ripening):
1. Number of spikelets/ear. Do not count the incompletely developed spikelets atbase of ear, but count terminal spikelet.
2. Number of grains/ear. Count all of the grains in the ear; make sure that evenvery small grains are counted.
3. Grain set is expressed as: number of grains/spikelet (2./1.)
4. Number of grainslFl+2 of 10 central spikelets of each ear, recorded as theaverage number of grains in Fl+F2 per spikelet. In each of the 10 centralspikelets, five on each side of the rachis, beginning from spikelet number 3 or 4from the bottom (or number 2 or 3 in smaller ears), count the number of grains inthe first two florets (floret 1 and floret 2, Fl+F2) from the base of the spikelet(See Figure 2).
5. 1000 grains weight. Take the sample for 1000 grains weight from the bulksample.
6. Please provide daily climatic data for the duration of the growing season in thesheets provided at the back of this booklet.
127
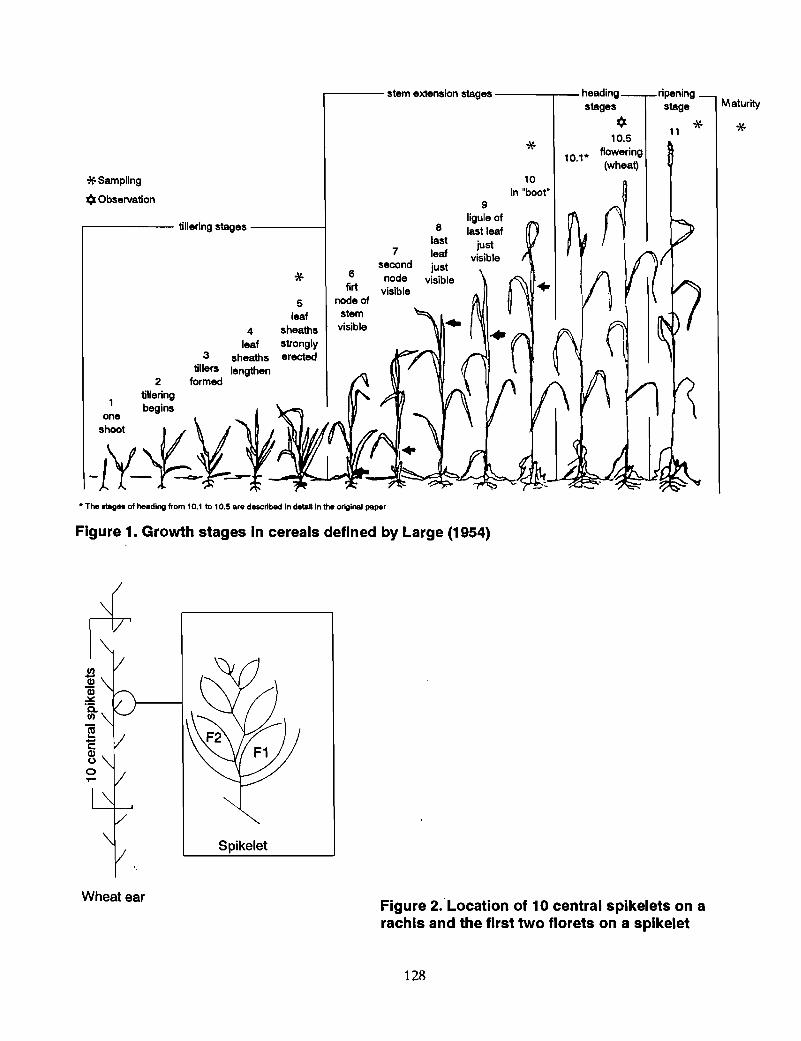
,..------ tillering stages----~
*Maturity
ripeningstage
11 **10
in "boot"
8lastleafjust
visible
7secondnode
visible
6firt
node ofstem
visible
.------- stem extension stages ------,__ heading
stages
*10.5
10.1* flowering(wheat)
*5
leafsheathsstronglyerected
4leaf
sheathslengthen
3tillers
formed
*Sampling*Observation
2tillering
-iY~~~* The .tag.. of heading from 10.1 to 10.5 are deocrlbed In detail In the original paper
Figure 1. Growth stages in cereals defined by Large (1954)
Spikelet
Wheat earFigure 2.Location of 10 central spikelets on arachis and the first two florets on a spikelet
128
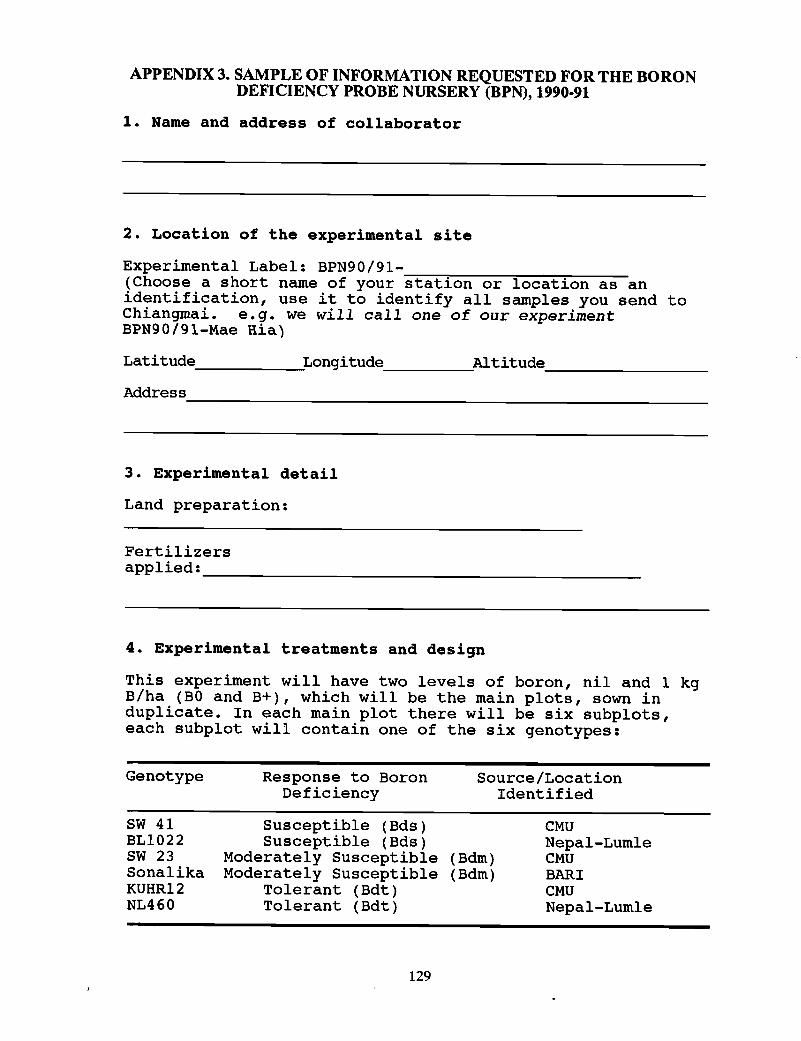
APPENDIX 3. SAMPLE OF INFORMATION REQUESTED FOR THE BORONDEFICIENCY PROBE NURSERY (BPN), 1990·91
1. Name and address of collaborator
2. Location of the experimental site
Experimental Label: BPN90/91-~~~ ~~__~ __(Choose a short name of your station or location as anidentification, use it to identify all samples you send toChiangmai. e.g. we will call one of our experimentBPN90/91-Mae Ria)
Latitude ~Longitude ~Altitude _
Address------------------------------------------------------
3. Experimental detail
Land preparation:
Fertilizersapplied: _
4. Experimental treatments and design
This experiment will have two levels of boron, nil and 1 kgB/ha (BO and B+), which will be the main plots, sown induplicate. In each main plot there will be six subplots,each subplot will contain one of the six genotypes:
Genotype Response to BoronDeficiency
Source/LocationIdentified
SW 41BL1022SW 23SonalikaKUHR12NL460
Susceptible (Bds)Susceptible (Bds)
Moderately Susceptible (Bdm)Moderately Susceptible (Bdm)
Tolerant (Bdt)Tolerant (Bdt)
129
CMUNepal-LumleCMUBARICMUNepal-Lumle
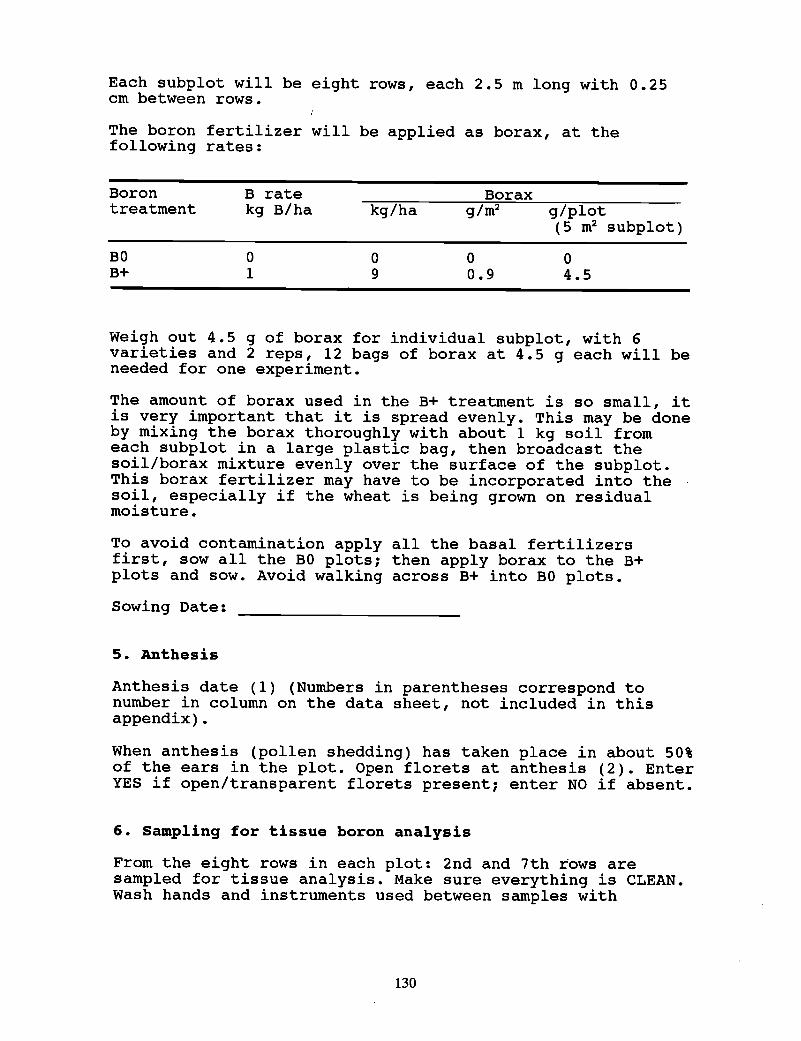
Each subplot will be eight rows, each 2.5 m long with 0.25cm between rows.
The boron fertilizer will be applied as borax, at thefollowing rates:
Borontreatment
BOB+
B ratekg B/ha
o1
kg/ha
o9
Borax
o0.9
g/plot(5 m2 subplot)
o4.5
Weigh out 4.5 g of borax for individual subplot, with 6varieties and 2 reps, 12 bags of borax at 4.5 g each will beneeded for one experiment.
The amount of borax used in the B+ treatment is so small, itis very important that it is spread evenly. This may be doneby mixing the borax thoroughly with about 1 kg soil fromeach subplot in a large plastic bag, then broadcast thesoil/borax mixture evenly over the surface of the subplot.This borax fertilizer may have to be incorporated into thesoil, especially if the wheat is being grown on residualmoisture.
To avoid contamination apply all the basal fertilizersfirst, sow all the BO plots; then apply borax to the B+plots and sow. Avoid walking across B+ into BO plots.
Sowing Date:
5. Anthesis
Anthesis date (1) (Numbers in parentheses correspond tonumber in column on the data sheet, not included in thisappendix).
When anthesis (pollen shedding) has taken place in about 50%of the ears in the plot. Open florets at anthesis (2). EnterYES if open/transparent florets present; enter NO if absent.
6. Sampling for tissue boron analysis
From the eight rows in each plot: 2nd and 7th rows aresampled for tissue analysis. Make sure everything is CLEAN.Wash hands and instruments used between samples with
130
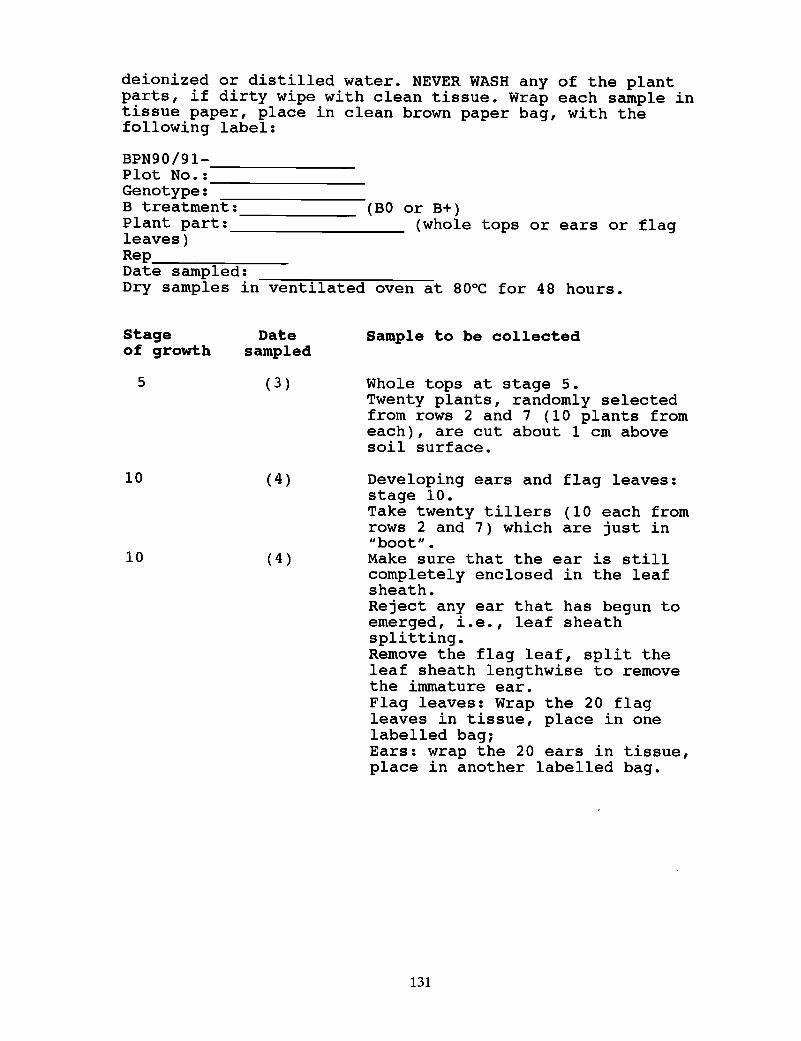
ventilated oven at 80aC for 48 hours.
(BO or B+)(whole tops or ears or flag
deionized or distilled water. NEVER WASH any of the plantparts, if dirty wipe with clean tissue. Wrap each sample intissue paper, place in clean brown paper bag, with thefollowing label:
BPN90/91---------Plot No. : _Genotype:B treatment:Plant part: -------leaves)Rep """":"""---:- _Date sampled:Dry samples in
stageof growth
5
10
10
Datesampled
( 3 )
( 4 )
(4 )
Sample to be collected
Whole tops at stage 5.Twenty plants, randomly selectedfrom rows 2 and 7 (10 plants fromeach), are cut about 1 cm abovesoil surface.
Developing ears and flag leaves:stage 10.Take twenty tillers (10 each fromrows 2 and 7) which are just in"boot".Make sure that the ear is stillcompletely enclosed in the leafsheath.Reject any ear that has begun toemerged, i.e., leaf sheathsplitting.Remove the flag leaf, split theleaf sheath lengthwise to removethe immature ear.Flag leaves: Wrap the 20 flagleaves in tissue, place in onelabelled bag;Ears: wrap the 20 ears in tissue,place in another labelled bag.
131
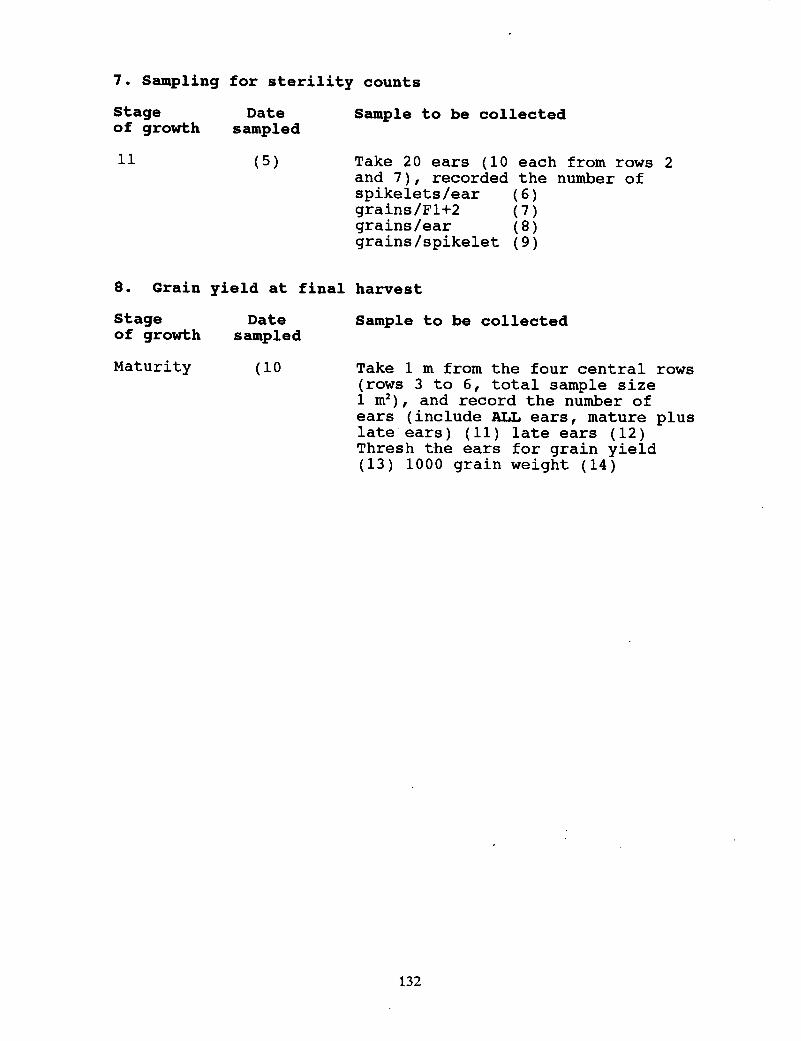
7. Sampling for sterility counts
Stageof growth
11
Datesampled
(5 )
Sample to be collected
Take 20 ears (10 each from rows 2and 7), recorded the number ofspikelets/ear (6)grains/F1+2 (7)grains/ear (8)grains/spikelet (9)
8. Grain yield at final harvest
Stageof growth
Maturity
Datesampled
(10
Sample to be collected
Take 1 m from the four central rows(rows 3 to 6, total sample size1 m2 ), and record the number ofears (include ALL ears, mature pluslate ears) (11) late ears (12)Thresh the ears for grain yield(13) 1000 grain weight (14)
132

CENTRO INTERNACIONAL DE MEJORAMIENTO DE MAIZ Y TRIGOINTERNATIONAL MAIZE AND WHEAT IMPROVEME T CENTERLisboa 27 Apartado Postal 6-641 06 00 Mexico, D.F. Mexico
Related Documents