________________________________________________ BORN BROKE: How the MBTA found itself with too much debt, the corrosive effects of this debt, and a comparison of the T’s deficit to its peers ________________________________________________ Brian Kane Budget & Policy Analyst MBTA Advisory Board April 2009 MBTA Advisory Board

Welcome message from author
This document is posted to help you gain knowledge. Please leave a comment to let me know what you think about it! Share it to your friends and learn new things together.
Transcript

________________________________________________
BORN BROKE:
How the MBTA found itself with too much debt, the corrosive effects of this debt, and a comparison of the
T’s deficit to its peers
________________________________________________
Brian Kane Budget & Policy Analyst MBTA Advisory Board
April 2009
MBTA Advisory
Board

The MBTA Advisory Board is an independent statutory organization which represents the interests of the 175 cities and towns in the MBTA service district. Each year these municipalities are assessed by the MBTA and these assessments constitute over 10% of T financing. The Advisory Board is completely funded by municipalities Under Massachusetts law the Advisory Board has final approval and cutting authority over the MBTA’s annual operating budget and its 25 year capital plan. The Board also provides a host of other regulatory and oversight functions in the interests of its members. The Board’s mission is to provide public oversight of the MBTA as well as technical assistance and information on behalf of our members and T customers.
MBTA Advisory Board 177 Tremont Street, 4th Floor
Boston, MA 02111
Phone: 617-426-6054 Fax: 617-451-2054
Email: [email protected] Website: www.mbtaadvisoryboard.org
Acknowledgements: Rachel Szakmary and Sonia Sujanani provided valued research assistance.

BORN BROKE: How the MBTA found itself with too much debt, the corrosive effects of this
debt, and a comparison of the T’s deficit to its peers
Table of Contents Section I: Introduction 1
Recent History 1 Sales Tax 1 Debt 2 Restructuring 3 Other Budget Activities 3
Section II: Budget 4 Financing 4 Expenses 5 Pensions 5 Section III: National Context 5 National Transportation Database 6 MTA – NYC Transit 6 CTA – Chicago 8 LACMTA – Los Angeles 9 WMATA – Washington, DC 10 MBTA – Boston 11 SEPTA – Philadelphia 11 NJT – New Jersey 12 MUNI – San Francisco 13 MARTA – Atlanta 14 KCM – Seattle 15 Section IV: Conclusions 15 Comparative Debt 15
Recommendations 16 End Notes 17

Born Broke April 2009
MBTA Advisory Board
Executive Summary For the past several years the MBTA has only balanced its budgets by restructuring debt,
liquidating cash reserves, selling land, and other one-time actions. Today, with credit
markets frozen, cash reserves depleted and the real estate market at a stand still, the
MBTA has used up these options. This recession has laid bare the fact that the MBTA is
mired in a structural, on-going deficit that threatens its viability.
In 2000 the MBTA was re-born with the passage of the Forward Funding legislation.
This legislation dedicated 20% of all sales taxes collected state-wide to the MBTA. It
also transferred over $3.3 billion in Commonwealth debt from the State’s books to the
T’s books. In essence, the MBTA was born broke.
Throughout the 1990’s the Massachusetts sales tax grew at an average of 6.5% per year.
This decade the sales tax has barely averaged 1% annual growth. The underperformance
of the sales tax coupled with too much debt has been slowly strangling the T for years. In
FY10 the MBTA faces a $160.4 million deficit and without external assistance in the
form of debt relief or new revenue the Authority will be forced to make draconian service
cuts and impose dramatic fare increases.
The MBTA is not alone in facing financial difficulties. New economic realities have
affected each of the 10 largest transit agencies in the United States. All are facing
dwindling government subsidies and many are considering fare increases, layoffs, service
cuts or some combination thereof.
The MBTA is stuck in a financial, not organizational quagmire. No amount of
reorganization, reform, or efficiencies can generate the $160 million needed to close the
FY10 budget gap, let alone the even larger deficits projected in the future. Until the
MBTA’s underlying debt and financing weaknesses are addressed, all such changes, at
best, will only delay the T’s day of reckoning. Relief of the $3.3 billion in
Commonwealth debt currently on the MBTA’s books is the fairest, most efficient and
most feasible way to solve for the MBTA’s underlying financial deficiencies.

Born Broke April 2009
MBTA Advisory Board 1
I. Introduction: The Massachusetts Bay Transportation
Authority (MBTA) is a key component
of the economic and environmental
health of Massachusetts. Nearly 1.3
million unlinked trips in and around
Boston are made each day by T,
including 55% of all work trips into
Boston, and 42% of all trips into its
financial district.1
In FY10 the MBTA faces a $160.4
million budget deficit2, a $2.7 billion
maintenance backlog3, and a debt load of
$8 billion (including interest)4.
Recent History In 2000 the MBTA was re-born with the
passage of the Forward Funding
legislation. This legislation forced the
MBTA to be more fiscally prudent and
leaner by dedicating a set amount of
financing to it at the start of each fiscal
year, and requiring it to end that year
with a balanced budget.
The signature parts of Forward Funding
were the annual dedication of 20% of all
Massachusetts sales taxes receipts and
the transferal of over $3.3 billion in
Commonwealth debt to the MBTA.
Sales Tax Sales tax is the principal financing
source for the MBTA. Between 1990
and 2000 the Massachusetts sales tax
grew at an average of 6.5% per year.5
When the MBTA received a dedicated
portion of this revenue source in 2000,
many believed that the T’s budgetary
problems were over. But, since 2000 the
sales tax has grown at a meager 1.0%
per year on average.6
By 2003 it was clear that the sales tax
had failed as the principal financing
source for the MBTA. In 2007 the
report of the independent, bi-partisan
Massachusetts Transportation Finance
Commission noted that “the state sales
tax has generated far less revenue than
anticipated, and it is unlikely that those
revenue targets will ever be achieved …
Actual Sales Tax Grow th vs . 3% Projected Grow th FY01- FY09
S o u r c e : M B T A A d v i so r y B a o r d
625
650
675
700
725
750
775
800
825
FY01 FY02 FY03 FY04 FY05 FY06 FY07 FY08 FY09
Act ual Sales Taxgrowt h
Project ed SalesTax growt h (3%)

Born Broke April 2009
MBTA Advisory Board 2
this is a significant shortfall for MBTA
operations and capital programs.7”
In FY10 the MBTA expects to receive
no increase in sales tax revenue on the
FY09 amount.8
Debt The MBTA owes over $8 billion in debt
principal and interest to its bondholders.
Before it was re-born, the MBTA did not
issue debt for major projects. Instead,
the Commonwealth borrowed for transit
projects on the T’s behalf and paid back
these debts over time. Under Forward
Funding the MBTA gained the authority
to issue debt and the responsibility to
pay it back.
Forward Funding also transferred
billions in transit debt from the
Commonwealth’s books to the MBTA’s
books. Of the $5.2 billion in principal
currently on the T’s books, $3.3 billion
was transferred by the State.9
MBTA debt is categorized in three ways:
capital investment program, prior
obligations, and legal commitments.
Capital improvement program debt
($1.869 billion) corresponds to money
the MBTA has borrowed since 2000 for
maintenance and infrastructure
modernization.
Prior obligation debts ($1.652 billion)
were borrowed by the Commonwealth to
build projects and perform maintenance
for the benefit of public transportation
users in eastern Massachusetts prior to
2000. In 2000 these debts were
transferred to the MBTA.
Legal obligations debt ($1.688 billion)
corresponds to state implementation plan
(SIP) commitment projects. These were
public transportation projects the state
agreed to build as part of the Big Dig.
As with prior obligation debt, SIP
commitment debt was transferred to the
T in 2000. The State also transferred the
responsibility to finish many SIP
commitment projects, and the T
borrowed to do so. In 2007 the State
M BTA Debt Principal SourcesSource: MBTA
Prior Ob-ligations31.84%
CIP36.02%
Legal Commit32.14%

Born Broke April 2009
MBTA Advisory Board 3
agreed re-assume responsibility for
outstanding SIP projects, but not the
debt for such projects borrowed before
2007.10
Restructuring Since 2004 the Authority has often relied
on debt restructuring to avoid deficits.
In many cases restructuring allowed it to
take advantage of lower interest rates
and save money. In other cases
restructuring only lowered principal
payments in return increased interest
payments. Since 2000 interest payments
have steadily increased, while principal
payments have steadily declined. Unless
this trend is reversed the T will continue
to spend hundreds of millions on debt
service each year without ever getting
out of debt
Debt service payments have consistently
consumed between 20%–30% of MBTA
spending since 2000. Unlike many of its
peers, the T lacks a dedicated revenue
source for capital or debt spending.
Instead, the T is forced to make debt
service payments from the same sources
it uses to funds operations, basic
maintenance, and system enhancements.
Other Budget Actions This decade the MBTA has often relied
on other budget actions to stave off
deficits. Over the past 8 years the T has
steadily sold off property to raise cash,
and all but exhausted its rainy day funds.
Today, this $1.6 billion agency has less
than $27.4 million in reserve, of which
only $8.8 million is available for
operating costs.11
The current economy has made the
MBTA’s financial deficiencies clear.
Conditions are only expected to worsen
and deficits grow larger in the near
future. As fewer commuters have jobs
to commute to, fare and parking
revenues may decline. The frozen credit
market makes refinancing next to
impossible. The soft real estate market
precludes most land sales and declines in
MBTA Principal & Interest Paym entsSource: MBTA Advisory Board
0
50
100
150
200
250
FY 2001 FY 2002 FY 2003 FY 2004 FY 2005 FY 2006 FY 2007 FY 2008 FY 2009
Interest
principal

Born Broke April 2009
MBTA Advisory Board 4
consumer spending make the rebound of
sales tax revenues unlikely.
II. Budget
All major American transportation
organizations are financed through a
combination of system generated
revenues (SGR) and government
subsidies. System generated revenues
come from fares, parking fees,
advertising contracts, investment
income, station rents, land sales, utility
credits, etc. Government subsidies are
either dedicated portions of taxes, or
appropriations from state, county of
municipal general funds. In either case
subsidies are derived from taxes.
Financing The MBTA is no different from its
peers, in that it is financed by a
combination of system generated
revenues and subsidies.
Fares are the largest component of
system generated revenues and
constituted 31.32% of total financing in
FY08, the last year for which final
numbers are available. MBTA fares
have increased 25% every three years
since 2000.12
Parking fees, rents by concessionaires in
T stations and advertising contracts
generated 3.47% of total financing in
FY08.13
The MBTA’s subsidy sources are
assessments on cities and towns and
sales tax receipts. Each municipality
within the MBTA service district is
assessed by the MBTA annually.
Assessment rates are determined by
population and collected by the state on
the T’s behalf. 175 of the
Commonwealth’s 351 cities and towns
and over 73% of the Massachusetts
population lives within the MBTA
service district.14
As detailed above, the MBTA receives
20% of all sales tax receipts collected in
Massachusetts. In FY08 sales tax
MBTA FY08 Financing (Actuals)Source: MBTA Advisory Board
Asses-m ents
10.15%
Sales Tax
53.70%
Other SGR
4.82%
Fares31.32%
Born Broke April 2009
MBTA Advisory Board 5
receipts constituted over 53% of total
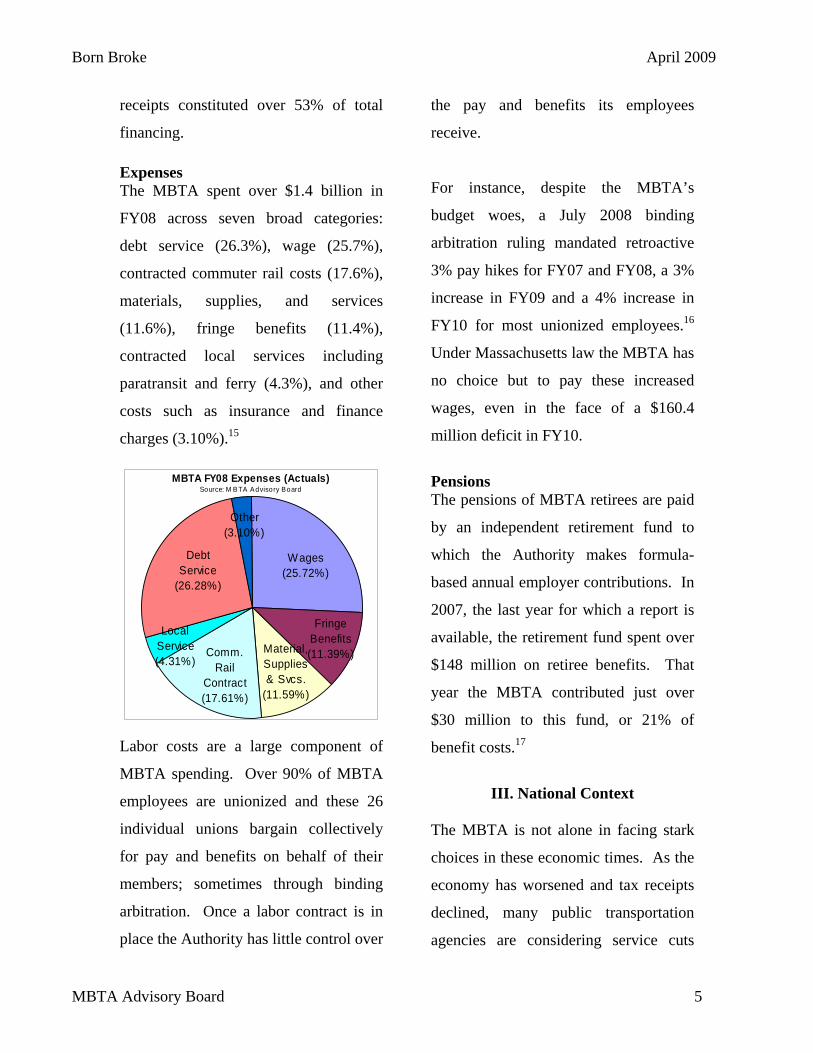
financing. Expenses The MBTA spent over $1.4 billion in
FY08 across seven broad categories:
debt service (26.3%), wage (25.7%),
contracted commuter rail costs (17.6%),
materials, supplies, and services
(11.6%), fringe benefits (11.4%),
contracted local services including
paratransit and ferry (4.3%), and other
costs such as insurance and finance
charges (3.10%).15
Labor costs are a large component of
MBTA spending. Over 90% of MBTA
employees are unionized and these 26
individual unions bargain collectively
for pay and benefits on behalf of their
members; sometimes through binding
arbitration. Once a labor contract is in
place the Authority has little control over
the pay and benefits its employees
receive.
For instance, despite the MBTA’s
budget woes, a July 2008 binding
arbitration ruling mandated retroactive
3% pay hikes for FY07 and FY08, a 3%
increase in FY09 and a 4% increase in
FY10 for most unionized employees.16
Under Massachusetts law the MBTA has
no choice but to pay these increased
wages, even in the face of a $160.4
million deficit in FY10.
Pensions The pensions of MBTA retirees are paid
by an independent retirement fund to
which the Authority makes formula-
based annual employer contributions. In
2007, the last year for which a report is
available, the retirement fund spent over
$148 million on retiree benefits. That
year the MBTA contributed just over
$30 million to this fund, or 21% of
benefit costs.17
III. National Context
The MBTA is not alone in facing stark
choices in these economic times. As the
economy has worsened and tax receipts
declined, many public transportation
agencies are considering service cuts
MBTA FY08 Expenses (Actuals)Source: M B TA Advisory Board
Local Service (4.31%)
Fringe Benefits (11.39%)Material,
Supplies & Svcs.
(11.59%)
Comm. Rail
Contract (17.61%)
Other (3.10%)
Debt Service
(26.28%)
Wages (25.72%)

Born Broke April 2009
MBTA Advisory Board 6
and/or fare increases in 2009 or 2010. A
partial list of agencies with projected
FY10 deficits include:
Agency Projected Deficit • MTA- New York: $1.2b18
• LACMTA- LA: $400m19
• MBTA- Boston $160m
• CTA- Chicago: $155m20
• WMATA- Wash. DC: $154m21
• SEPTA- Philadelphia: $150m22
• KCM- Seattle: $100m23
• MARTA- Atlanta: $65m24
• MUNI- San Francisco: $65m25
• Metro- St. Louis: $50m26
• Tri-Met- Portland, OR $13.5m27
National Transportation Database
Each year the Federal Transit
Administration collects data from public
transportation agencies, collates it and
produces the National Transit Database
(NTD). Even though data may differ
slightly from agency documents, since
NTD data remains consistent
throughout, for the purposes of
comparison such differences are moot.
All numbers reported are taken from the
NTD 2007 report, the most recent
edition.
For the purposes of comparison the 10
largest agencies, in terms of unlinked
trips, were evaluated. Particular
attention was paid to governance
structure, financing sources, projected
deficits, and deficit closing strategies.
NYCT – New York New York City Transit (NYCT) is a
NTD 2007 Report - Top 10 Largest Public Transportation Agencies Organization NYCT CTA LACMTA WMATA MBTA
Size Rank 1 2 3 4 5 Region New York Chicago Los Angeles Wash. DC Boston
Governance Ops Unit Pub. Authority Pub. Authority Pub. Authority Pub. AuthorityOperations Financing $ 6,473,476,165 1,117,505,455 1,286,350,062 1,344,979,661 1,241,654,161
Operations Expenditure $ 5,397,368,807 1,408,238,949 1,124,937,069 1,240,615,192 987,148,623 # FT Employees 49,391 10,589 9,587 10,207 7,428
Organization SEPTA NJT MUNI MARTA KCM Size Rank 6 7 8 9 10
Region Philadelphia New Jersey San Francisco Atlanta Seattle Governance Pub. Authority Pub. Authority Govt. Unit Pub. Authority Govt. Unit
Operations Financing $ 962,655,190 1,707,288,936 531,910,848 455,390,523 463,474,018 Operations Expenditure $ 916,470,647 1,605,189,531 509,391,225 373,519,151 497,519,684
# FT Employees 8,784 10,309 3,802 4,459 3,073 Source: NTD 2007 Report
Born Broke April 2009
MBTA Advisory Board 7
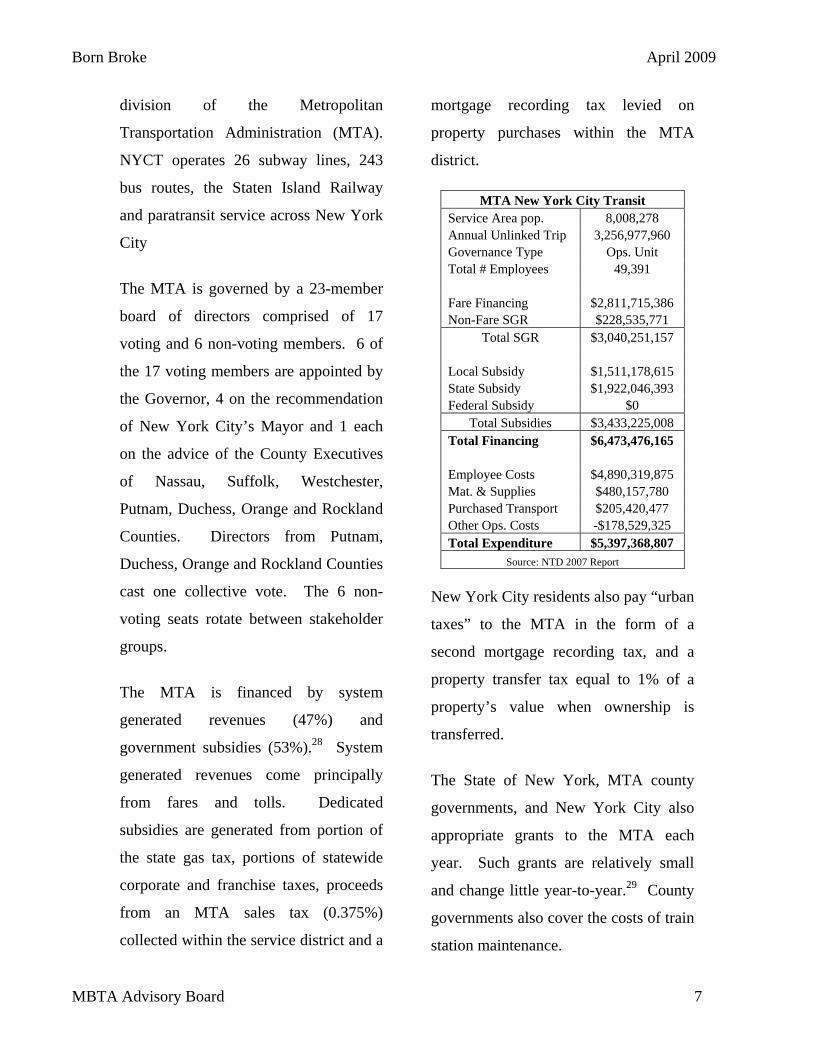
division of the Metropolitan
Transportation Administration (MTA).
NYCT operates 26 subway lines, 243
bus routes, the Staten Island Railway
and paratransit service across New York
City
The MTA is governed by a 23-member
board of directors comprised of 17
voting and 6 non-voting members. 6 of
the 17 voting members are appointed by
the Governor, 4 on the recommendation
of New York City’s Mayor and 1 each
on the advice of the County Executives
of Nassau, Suffolk, Westchester,
Putnam, Duchess, Orange and Rockland
Counties. Directors from Putnam,
Duchess, Orange and Rockland Counties
cast one collective vote. The 6 non-
voting seats rotate between stakeholder
groups.
The MTA is financed by system
generated revenues (47%) and
government subsidies (53%).28 System
generated revenues come principally
from fares and tolls. Dedicated
subsidies are generated from portion of
the state gas tax, portions of statewide
corporate and franchise taxes, proceeds
from an MTA sales tax (0.375%)
collected within the service district and a
mortgage recording tax levied on
property purchases within the MTA
district.
MTA New York City Transit Service Area pop. 8,008,278 Annual Unlinked Trip 3,256,977,960 Governance Type Ops. Unit Total # Employees 49,391 Fare Financing $2,811,715,386 Non-Fare SGR $228,535,771
Total SGR $3,040,251,157 Local Subsidy $1,511,178,615 State Subsidy $1,922,046,393 Federal Subsidy $0
Total Subsidies $3,433,225,008 Total Financing $6,473,476,165 Employee Costs $4,890,319,875 Mat. & Supplies $480,157,780 Purchased Transport $205,420,477 Other Ops. Costs -$178,529,325 Total Expenditure $5,397,368,807
Source: NTD 2007 Report
New York City residents also pay “urban
taxes” to the MTA in the form of a
second mortgage recording tax, and a
property transfer tax equal to 1% of a
property’s value when ownership is
transferred.
The State of New York, MTA county
governments, and New York City also
appropriate grants to the MTA each
year. Such grants are relatively small
and change little year-to-year.29 County
governments also cover the costs of train
station maintenance.

Born Broke April 2009
MBTA Advisory Board 8
In FY10 the MTA faces a projected $1.2
billion deficit.30 To close this gap an
independent state commission proposed
an 8% fare and toll increase, new tolls
on previously un-tolled bridges, and a
new 0.33% payroll tax within the MTA
district.31
As the New York Assembly considers
this proposal, the MTA Board recently
approved a 20% to 30% fare and toll
increase, the elimination of 35 bus
routes, the axing of 2 subway lines,
1,000 lay-offs, additional cuts to off-
peak service on all modes, extended
subway headways, and the outright
cancellation of some weekend bus
service.32
CTA – Chicago The Chicago Transit Authority (CTA)
operates 153 bus routes and 8 heavy rail
lines throughout the Chicago region.
CTA’s 7 member board consists of 4
mayoral and 3 gubernatorial appointees. CTA is financed by system generated
revenues (45%) and subsidies (55%).33
Its largest subsidy source is a dedicated
CTA sales tax (1.25% in Cook County,
0.75% in DuPage, Kane, Lake, McHenry
and Will counties) collected within its
service district.34 The City of Chicago
also collects a $1.50/$100 real estate
transfer tax on property transactions
dedicated to the CTA.
Illinois matches these locally generated
funds from its state transportation trust
fund, which is principally funded by the
state gas tax. The State, Counties and
the City of Chicago also directly
appropriates grants to CTA for mandated
free or reduced fares for students,
veterans and elderly or disabled persons
annually.35
Chicago Transit Authority Service Area pop. 3,763,791 Annual Unlinked Trip 499,544,307 Governance Type Authority Total # Employees 10,589 Fare Financing $459,670,179 Non-Fare SGR $44,175,591
Total SGR $503,845,770 Local Subsidy $307,176,469 State Subsidy $195,642,681 Federal Subsidy $110,840,535
Total Subsidies $613,659,685 Total Financing $1,117,505,455 Employee Costs $1,131,641,346 Mat. & Supplies $155,359,197 Purchased Transport $0 Other Ops. Costs $121,238,406 Total Expenditure $1,408,238,949
Source: NTD 2007 Report
In 2008, to close a $158 million deficit,
Illinois increased the CTA sales tax and
the Chicago real estate transfer tax.
Despite these increases, CTA recently
Born Broke April 2009
MBTA Advisory Board 9
announced a projected $155 million
deficit for in its current fiscal year.36
Prior to the tax increases, CTA intended
to cut 50% of its bus routes, layoff 2,400
employees and dramatically increase
fares. It remains unclear how it plans to
close this new deficit.
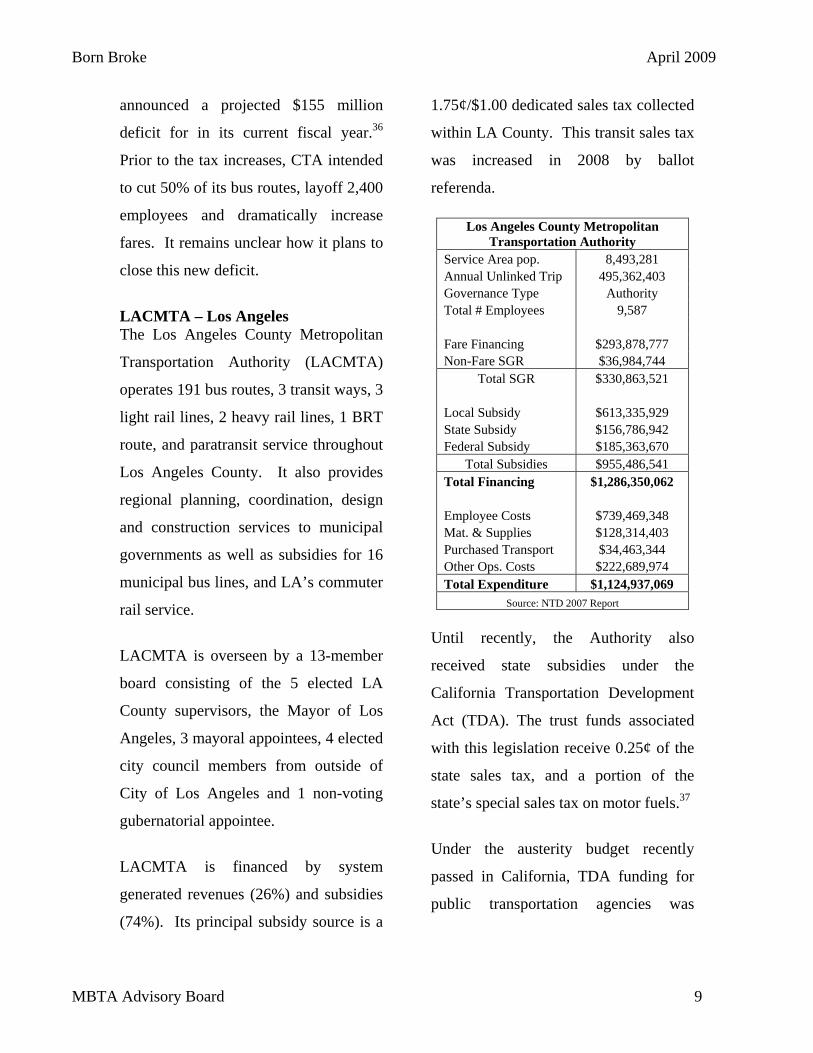
LACMTA – Los Angeles The Los Angeles County Metropolitan
Transportation Authority (LACMTA)
operates 191 bus routes, 3 transit ways, 3
light rail lines, 2 heavy rail lines, 1 BRT
route, and paratransit service throughout
Los Angeles County. It also provides
regional planning, coordination, design
and construction services to municipal
governments as well as subsidies for 16
municipal bus lines, and LA’s commuter
rail service.
LACMTA is overseen by a 13-member
board consisting of the 5 elected LA
County supervisors, the Mayor of Los
Angeles, 3 mayoral appointees, 4 elected
city council members from outside of
City of Los Angeles and 1 non-voting
gubernatorial appointee.
LACMTA is financed by system
generated revenues (26%) and subsidies
(74%). Its principal subsidy source is a
1.75¢/$1.00 dedicated sales tax collected
within LA County. This transit sales tax
was increased in 2008 by ballot
referenda.
Los Angeles County Metropolitan Transportation Authority
Service Area pop. 8,493,281 Annual Unlinked Trip 495,362,403 Governance Type Authority Total # Employees 9,587 Fare Financing $293,878,777 Non-Fare SGR $36,984,744
Total SGR $330,863,521 Local Subsidy $613,335,929 State Subsidy $156,786,942 Federal Subsidy $185,363,670
Total Subsidies $955,486,541 Total Financing $1,286,350,062 Employee Costs $739,469,348 Mat. & Supplies $128,314,403 Purchased Transport $34,463,344 Other Ops. Costs $222,689,974 Total Expenditure $1,124,937,069
Source: NTD 2007 Report
Until recently, the Authority also
received state subsidies under the
California Transportation Development
Act (TDA). The trust funds associated
with this legislation receive 0.25¢ of the
state sales tax, and a portion of the
state’s special sales tax on motor fuels.37
Under the austerity budget recently
passed in California, TDA funding for
public transportation agencies was

Born Broke April 2009
MBTA Advisory Board 10
eliminated, a loss of over $400 million in
FY10.38
WMATA – Washington, DC The Washington Metropolitan Area
Transit Authority operates 5 heavy rail
lines, 338 bus routes and paratransit
service in and around Washington, DC.39
Its 12 member board consists of 4
members each from Maryland, Virginia,
and Washington, DC.
Washington Metropolitan Area Transit Authority
Service Area pop. 1,305,693 Annual Unlinked Trip 411,598,592 Governance Type Authority Total # Employees 10,207 Fare Financing $514,611,829 Non-Fare SGR $222,227,288
Total SGR $736,839,117 Local Subsidy $368,815,007 State Subsidy $221,325,537 Federal Subsidy $18,000,000
Total Subsidies $608,140,544 Total Financing $1,344,979,661 Employee Costs $864,999,810 Mat. & Supplies $146,062,251 Purchased Transport $61,013,577 Other Ops. Costs $168,539,554 Total Expenditure $1,240,615,192
Source: NTD 2007 Report
WMATA is financed by system
generated revenues (55%) and subsidies
(45%).40 Operating and capital subsidies
are paid by the District of Columbia, the
State of Maryland and the Virginia
counties of Fairfax and Arlington and
the Cities of Fairfax, Falls Church, and
Alexandria.
The District of Columbia earmarks
portions of its 20.0¢ gas tax, parking
meter fees, traffic fines, and vehicle
registration fees to WMATA.41
Maryland pays its subsidies from the
Maryland Transportation Trust Fund,
which receives revenue from the state
23.5¢ gas tax, vehicle sales tax receipts,
registry fees, corporate income taxes,
rental car taxes, and other sources.42
In Virginia each local government funds
its subsidy amount differently, usually
through a combination of proceeds from
an extra 2% gas tax levied within service
district, property taxes and general fund
appropriations.43
IN FY10 WMATA faces a $154 million
deficit. Through layoffs and other
administrative reductions, this deficit
was reduced to $29 million in March
2009.44 To close the $29 million deficit,
WMATA plans to cut 10 bus routes,
truncate 12 others and stretch headways
on all modes.45

Born Broke April 2009
MBTA Advisory Board 11
MBTA - Boston The Massachusetts Bay Transportation
Authority (MBTA) operates 191 bus
routes, 14 commuter rail lines, 3 heavy
rail lines, 3 ferry routes, 1 light rail line,
and paratransit service. It is overseen by
a 7-member board of directors each of
whom is appointed by Governor.
The MBTA, like its peers, is financed by
system generated revenues (37%) and
subsidies (63%).46 Its largest financing
source is a dedicated 20% of all sales
taxed collected in Massachusetts.
Massachusetts Bay Transportation Authority
Service Area pop. 4,510,400 Annual Unlinked Trip 357,578,991 Governance Type Authority Total # Employees 7,428 Fare Financing $395,876,376 Non-Fare SGR $58,636,446
Total SGR $454,512,822 Local Subsidy $134,988,493 State Subsidy $644,117,259 Federal Subsidy $8,035,587
Total Subsidies $787,141,339 Total Financing $1,241,654,161 Employee Costs $704,584,507 Mat. & Supplies $111,002,988 Purchased Transport $65,068,810 Other Ops. Costs $106,492,318 Total Expenditure $987,148,623
Source: NTD 2007 Report
The MBTA faces a projected $160.4
million deficit in FY10.47
SEPTA – Philadelphia The Southeastern Pennsylvania
Transportation Authority (SEPTA)
operates 117 bus routes, 8 light rail lines
(trolley), 3 trackless trolley routes, 3
heavy rail lines, 13 commuter rail lines,
shared ride service, and paratransit
operations in Bucks, Chester, Delaware,
Montgomery and Philadelphia Counties.
Philadelphia City and County are
synonymous.
The Pennsylvania Governor, Senate
majority and minority leaders, and
House majority and minority leaders
each appoint 1 member of SEPTA’s 15-
member board. The remaining seats,
respectively, are appointed by
Philadelphia’s Mayor, Philadelphia’s
City Council President, and the
governments of Bucks (2), Chester (2),
Montgomery (2), and Delaware (2)
Counties. The 2 Philadelphia appointees
may collectively veto any board action,
but a 2/3 vote of the full board may
override this veto within 30 days.
SEPTA is financed by system generated
revenues (40%) and subsidies (60%).48
State subsidies are paid through the new
Pennsylvania Public Transportation
Trust Fund (PPTTF). This funds receives

Born Broke April 2009
MBTA Advisory Board 12
4.4% of all state sales tax receipts, PA
lottery proceeds (earmarked for free
transit for senior citizens) money from
the PA Turnpike Authority, a $1 per
purchased tire tax, a $2 per day tax on
car rentals, and a 3% tax on car lease
amounts.49
Local subsidies are appropriated
annually by city and county
governments as a match to state funds.
All local funds are earmarked for
projects and services benefiting those
jurisdictions.50 Southeastern Pennsylvania Transportation Authority
Service Area pop. 3,317,418 Annual Unlinked Trip 321,839,783 Governance Type Authority Total # Employees 8,784 Fare Financing $348,621,108 Non-Fare SGR $34,383,101
Total SGR $383,004,209 Local Subsidy $72,863,139 State Subsidy $407,191,156 Federal Subsidy $99,596,686
Total Subsidies $579,650,981 Total Financing $962,655,190 Employee Costs $755,547,558 Mat. & Supplies $84,737,506 Purchased Transport $38,581,837 Other Ops. Costs $37,603,746 Total Expenditure $916,470,647
Source: NTD 2007 Report
SEPTA also faces a difficult FY10.
Currently it is in the middle of
contentious negotiations with its labor
unions over its attempt to increase its
employee health insurance premium
cost-share amount from its current 1%.51
The viability of the PPTTF is also in
question. Payments by the PA Turnpike
Authority accounted for over 30% of all
PPTTF funding in FY08. To cover these
payments the Turnpike Authority
planned to add tolls on I-80, a previously
un-tolled, east-west highway. However,
in 2008 the Federal Highway
Administration rejected its tolling
request, raising doubts about the
Turnpike Authority’s ability to meet its
trust fund obligations.52
In late March 2009 SEPTA released its
FY10 budget. The transmittal letter
accompanying this budget warns of a
potential $150 million deficit in FY10
due to declining sales tax receipts and
the failure of the tolling proposal.53
NJT – New Jersey The New Jersey Transit (NJT)
Corporation is a state entity that operates
242 local and commuter bus routes, 11
commuter rail lines, 3 light rail lines and
paratransit service throughout the state.
NJT is overseen by a 7 member board,
each of whom is appointed by the

Born Broke April 2009
MBTA Advisory Board 13
Governor, who may unilaterally veto any
board decision.
NJT is financed from system generated
revenue (49%) and government
subsidies (51%). Its subsidies are paid
principally by casino gambling taxes54
and the state transportation trust fund.55
This trust fund is financed by a 10.5¢
gas tax, 13.5¢ diesel tax, 2.75% tax on
petroleum product distributors, sales
taxes on new vehicle purchases, vehicle
registration fees, special heavy truck
fees, and annual appropriations from toll
road authorities.
New Jersey Transit Corporation Service Area pop. 17,799,861 Annual Unlinked Trip 268,289,345 Governance Type Govt. Unit Total # Employees 10,309 Fare Financing $679,299,440 Non-Fare SGR $158,773,943
Total SGR $838,073,383 Local Subsidy $14,721,367 State Subsidy $598,848,801 Federal Subsidy $255,645,385
Total Subsidies $869,215,553 Total Financing $1,707,288,936 Employee Costs $959,316,831 Mat. & Supplies $220,339,772 Purchased Transport $155,309,304 Other Ops. Costs $270,223,624 Total Expenditure $1,605,189,531
Source: NTD 2007 Report As a unit of state government NJT’s
budget is wound into the overall state
budget. New Jersey faces a $7 billion
deficit in FY10.56 Additionally, six of
the state’s eleven casinos are currently in
bankruptcy, calling into question the
financing NJT receives from gambling
taxes.57
MUNI – San Francisco
San Francisco Municipal Railway Service Area pop. 808,844 Annual Unlinked Trip 206,458,675 Governance Type Govt. Unit Total # Employees 3,802 Fare Financing $142,993,651 Non-Fare SGR $12,724,692
Total SGR $155,718,343 Local Subsidy $277,074,154 State Subsidy $93,961,396 Federal Subsidy $5,156,955
Total Subsidies $376,192,505 Total Financing $531,910,848 Employee Costs $409,615,265 Mat. & Supplies $41,530,691 Purchased Transport $18,700,137 Other Ops. Costs $39,545,132 Total Expenditure $509,391,225
Source: NTD 2007 Report The San Francisco Municipal Railway
(MUNI) is a division of the San
Francisco Municipal Transportation
Agency (SFMTA), itself a unit of city
government. MUNI operates 54 bus
routes, 7 light rail lines and San
Francisco’s famed cable car.
SFMTA is overseen by a 7 member

Born Broke April 2009
MBTA Advisory Board 14
board of directors, each of whom is
appointed by San Francisco’s Mayor.
MUNI is financed by system generated
revenues (29.3%) and subsidies (71%).
Almost all subsidies are generated
locally58 from a tax on off-street parking,
parking fines, meter revenue, moving
violations and other automobile-related
fees.59 MUNI also receives annual
appropriations from the city general fund
and, until recently, from the state under
the TDA.
Like LACMTA, MUNI faces the loss of
TDA subsidies in 2009. Such a loss
could leave a $50 million hole in its
2009 budget and a $65 million shortfall
in 2010.60
MARTA – Atlanta The Metropolitan Atlanta Rapid Transit
Authority (MARTA) operates 4 heavy
rail lines, 138 bus routes and paratransit
service in and around Atlanta.
Atlanta’s Mayor appoints 4 of
MARTA’s 18 board members. Other
appointments are made by the County
Commissions of Fulton (3), DeKalb (5),
Clayton (1) and Gwinnett (1) Counties,
the Georgia Departments of Revenue
(1), the Georgia Department of
Transportation (1), the Atlanta Regional
Transportation Authority (1) and the
Atlanta Building Authority (1).
Metropolitan Atlanta Rapid Transit Authority
Service Area pop. 1,574,600 Annual Unlinked Trip 147,523,544 Governance Type Authority Total # Employees 4,459 Fare Financing $102,141,681 Non-Fare SGR $37,869,231
Total SGR $140,010,912 Local Subsidy $275,288,244 State Subsidy $0 Federal Subsidy $40,091,367
Total Subsidies $315,379,611 Total Financing $455,390,523 Employee Costs $329,163,776 Mat. & Supplies $36,372,958 Purchased Transport $0 Other Ops. Costs $7,982,417 Total Expenditure $373,519,151
Source: NTD 2007 Report System generated revenues (31%) and
subsidies (69%) finance MARTA.61 Its
principal subsidy source is a dedicated
sales tax collected within Fulton and
DeKalb counties.62 Neither the state nor
Clayton or Gwinnett Counties subsidize
MARTA.
MARTA’s projected deficit in FY10 is
$65 million due to a decline in sales tax
receipts.63 To close this gap the
Authority is considering a 25¢ fare

Born Broke April 2009
MBTA Advisory Board 15
increase and/or a 10% to 30% cut in
service.64
KCM – Seattle Seattle’s King County Metro (KCM)
operates 222 bus routes, a public van
pool operation, and paratransit service in
King County, Washington including the
City of Seattle. It will also operate a
new regional light rail line scheduled to
open this year.65
King County Metro Service Area pop. 1,861,300 Annual Unlinked Trip 113,928,156 Governance Type Govt. Unit Total # Employees 3,073 Fare Financing $85,138,566 Non-Fare SGR $73,445,979
Total SGR $158,584,545 Local Subsidy $290,956,818 State Subsidy $4,060,508 Federal Subsidy $9,872,147
Total Subsidies $304,889,473 Total Financing $463,474,018 Employee Costs $302,504,000 Mat. & Supplies $57,970,186 Purchased Transport $79,644,172 Other Ops. Costs $57,401,326 Total Expenditure $497,519,684
Source: NTD 2007 Report
A unit of county government, KCM is
answerable to the elected King County
Executive and County Council.
KCM’s is financed by system generated
revenues (34%) and subsidies (66%).66
Its principal subsidy is a dedicated
portion of the 8% King County sales
tax.67
Despite three fare increases since March
2008 and a 20% increase in ridership
since 2006, in FY10 KCM faces a $100
million deficit due to declining sales tax
receipts.68 To close this gap county
leaders are considering a 20% service
cut or a new local vehicle excise tax.69
IV. Conclusion: Comparative Debt All transit agencies have some debt. The
difference between them is the financing
sources available to service that debt,
and the ultimate responsibility for it.
Transit agencies which operate as units
of government, for all intents and
purposes, have their debts paid by their
parent government organization. Still
others have dedicated revenue streams
for debt service or maintenance.
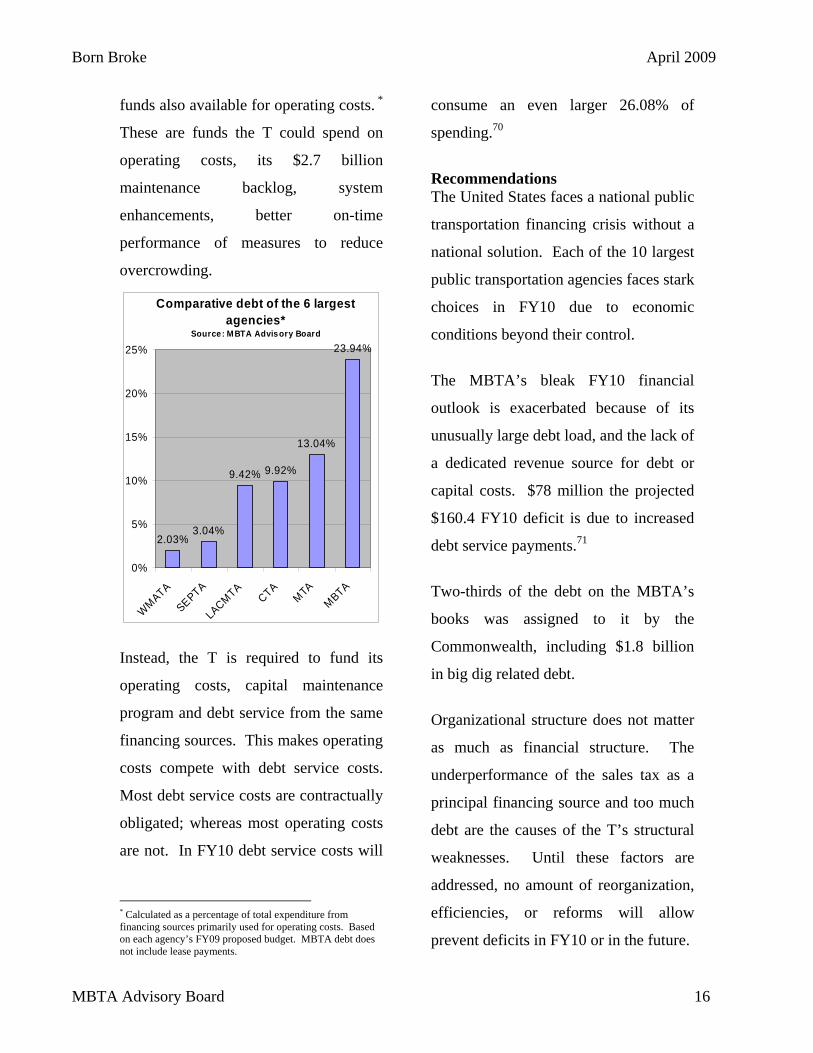
The MBTA is unique among its peers in
that it lacks a dedicated revenue source
for debt service or capital maintenance.
Among its peers, the MBTA spends the
most on debt service as a percentage of
Born Broke April 2009
MBTA Advisory Board 16
funds also available for operating costs. *
These are funds the T could spend on
operating costs, its $2.7 billion
maintenance backlog, system
enhancements, better on-time
performance of measures to reduce
overcrowding.
Comparative debt of the 6 largest agencies*
Source: MBTA Advisory Board
2.03%3.04%
9.42% 9.92%
13.04%
23.94%
0%
5%
10%
15%
20%
25%
WMATA
SEPTA
LACMTACTA
MTAMBTA
Instead, the T is required to fund its
operating costs, capital maintenance
program and debt service from the same
financing sources. This makes operating
costs compete with debt service costs.
Most debt service costs are contractually
obligated; whereas most operating costs
are not. In FY10 debt service costs will
* Calculated as a percentage of total expenditure from financing sources primarily used for operating costs. Based on each agency’s FY09 proposed budget. MBTA debt does not include lease payments.
consume an even larger 26.08% of
spending.70
Recommendations The United States faces a national public
transportation financing crisis without a
national solution. Each of the 10 largest
public transportation agencies faces stark
choices in FY10 due to economic
conditions beyond their control.
The MBTA’s bleak FY10 financial
outlook is exacerbated because of its
unusually large debt load, and the lack of
a dedicated revenue source for debt or
capital costs. $78 million the projected
$160.4 FY10 deficit is due to increased
debt service payments.71
Two-thirds of the debt on the MBTA’s
books was assigned to it by the
Commonwealth, including $1.8 billion
in big dig related debt.
Organizational structure does not matter
as much as financial structure. The
underperformance of the sales tax as a
principal financing source and too much
debt are the causes of the T’s structural
weaknesses. Until these factors are
addressed, no amount of reorganization,
efficiencies, or reforms will allow
prevent deficits in FY10 or in the future.

Born Broke April 2009
MBTA Advisory Board 17
The fairest, most equitable and fiscally
prudent step the Commonwealth could
take to make the T whole for next year
and for years to come would be to take
back its $3.3 billion in debt. Such an
action would save the MBTA hundreds
of millions of dollars in annual debt
service costs and free up financial
resources to operate the system and
reduce the backlog of maintenance
needs. Most importantly, it would make
the T whole in FY10 and for many,
years to come.
Endnotes: 1 J. Davis, MBTA CFO, presentation to the Regional Transportation Advisory Council 2/11/08 2 J. Davis, MBTA CFO, Presentation to MBTA Board of Directors Feb. 12, 2009 3 “Transportation Finance in Massachusetts: Building a Sustainable Transportation Financing System” Recommendations of the Massachusetts Transportation Finance Commission Vol. 2, September 17, 2007 4 MBTA Advisory Board FY09 Budget Report 5 J. Davis, MBTA CFO, presentation to MBTA Board of Directors Feb. 12, 2009 6 J. Davis, presentation to MBTA Board Feb. 12, 2009 7 “Transportation Finance in Massachusetts: An Unstainable System” Findings of the Massachusetts Transportation Finance Commission Vol. 1, March 28, 2007 8 J. Davis, presentation to MBTA Advisory Board 3/24/09 9 J. Davis, presentation to MBTA Board Feb. 12, 2009 10 http://www.eot.state.ma.us/ downloads/planning/SIP_SupportingMaterial.pdf 11 J. Davis, presentation to MBTA Advisory Board 3/24/09 12 D. Grabauskas, MBTA GM, briefing to legislators, State House, 3/10/09 13 MBTA Advisory Board staff analysis of FY09 budget 14 MBTA Advisory Board staff analysis based on census and MA A&F data. 15 MBTA Advisory Board “MBTA FY08 Transfer #2 Report” Nov. 6. 2008 16 MBTA Advisory Board “MBTA FY20 Transfer Request #2 Report” 11/6/08 17 Analysis based on the MBTA Retirement Fund’s 2007 Annual Report, p. 19. 18 New York Times, “M.T.A. Votes to Raise Fares and Cut Service” 3/25/09 19 LA Times “Former bus driver new MTA chief” 3/5/09 20 Chicago Tribune, “CTA service cuts, fare hikes on table” 3/12/09 21 Washington Post, “Proposed Metrobus Cuts to Get Public Hearings” 3/25/09 22 Philadelphia Inquirer “SEPTA budget proposal: No fare increases of service cuts” 3/30/09 23 Seattle Times “:Metro Transit fears $100 million potential shortfall; service cuts” 2/18/09 24 Atlanta Constitution-Journal “MARTA ridership growth was tops among cities during gas crunch” 3/9/09 25 http://www.livablecity.org/ 26 WBUR “MBTA Part of National Transit Funding Crisis” 3/12/09 27The Oregonian “TriMet cutbacks could leave riders at the curb” 4/2/09 28 NTD 2007 Report 29 New York City Independent Budget Office “Inside the Budget” No. 158, August 14, 2008 30 New York Times, “As Revenue Falls, MTA Deficit Could Rise by $650 million” 2/23/09 31 New York Times, “Resistance is Building to Payroll Tax in Rescue Plan for MTA” 2/12/09 32 New York Times, “M.T.A. Votes to Raise Fares and Cut Service” 3/25/09 33 NTD 2007 Report 34 Chicago RTA 2007 Annual Report 35 Report of the Illinois State Auditor” Mass Transit Agencies of Northeastern Illinois” March 2007, Vol. 2. 36 Chicago Tribune “CTA service cuts, fare hikes on table” 3/12/09 37 Caltrans Division of Mass Transportation “TDA Statues & California Code of Regulations” March 2009. 38 LA Times “Former bus driver new MTA chief” 3/5/09

Born Broke April 2009
MBTA Advisory Board 18
39 NTD 2007 Report 40 NTD 2007 Report 41 “Washington’s Metro: Deficits by Design” Brookings, June 2004 42 “Washington’s Metro: Deficits by Design” Brookings, June 2004 43 Harcum, Richard, P. WMATA Budget Director, email received 3/6/09 44Washington Post “Metro Facing Layoffs, Cutbacks” 1/9/09 45 Washington Post “Proposed Metrobus Cuts to Get Public Hearings” 3/25/09 46 NTD 2007 Report 47 http://www.youmovemassachusetts.org/ reform_gastaxoptions_022009.html 48 NTD 2007 Report 49 SW PA Commission 2009-2012 TIP Appendix A 50 SEPTA FY09 Budget Operating Budget Report 51 Philadelphia Inquirer “SEPTA, transport union in talks to avert strike” 3/6/09 52 Forbes: “Pew study assesses failed Pa. turnpike lease plan: 3/25/09 53 Philadelphia Inquirer “SEPTA budget proposal: No fare increases of service cuts” 3/30/09 54 Philadelphia Inquirer “Competition and economy take toll in A.C.” 2/15/09 55 NTD 2007 Report 56 NY Times “In a Tough Sell, Corzine Works to Connect” 3/9/09. 57 Philadelphia Inquirer “Competition and economy take toll in A.C.” 2/15/09 58 NTD 2007 Report “Tax Funds” appendix 59www.sfgov.org/site/uploadedfiles/controller/budget_information/taxrev/PkgTax.pdf 60 http://www.livablecity.org/ 61 NTD 2007 Report 62 MARTA “Comprehensive Annual Financial Report Year Ended June 30, 2008 63 Atlanta Constitution-Journal “MARTA ridership growth was tops among cities during gas crunch” 3/9/09 64 Atlanta Constitution-Journal “MARTA ridership growth was tops among cities during gas crunch” 3/9/09 65 King County DOT Annual Report 2007 66 NTD 2007 Report 67 NTD 2007 Report “Tax Funds” appendix 68 Seattle Times “:Metro Transit fears $100 million potential shortfall; service cuts” 2/18/09 69 King County Executive Press Release: “Metro’s potential service cuts equal to a full year of service in other counties” 2/24/09 70 J. Davis, Presentation to MBTA Board March. 12, 2009 71 J. Davis, Presentation to MBTA Board March. 12, 2009
MBTA Advisory Board 177 Tremont Street, 4th Floor
Boston, MA 02111
Phone: 617-426-6054 Fax: 617-451-2054
www.mbtaadvisoryboard.org
Related Documents