BOREHOLE GEOPHYSICAL LOGGING Applications for Environmental Site Remediation Prepared by: James L. Peterson, PG, LSRP Princeton Geoscience, Inc. 15 Vandeventer Avenue Princeton, NJ 08542 Tel. 609‐279‐0008 www.princetongeoscience.com [email protected]

Welcome message from author
This document is posted to help you gain knowledge. Please leave a comment to let me know what you think about it! Share it to your friends and learn new things together.
Transcript

BOREHOLE GEOPHYSICAL LOGGINGApplications for Environmental Site Remediation
Prepared by:
James L. Peterson, PG, LSRPPrinceton Geoscience, Inc.15 Vandeventer AvenuePrinceton, NJ 08542
Tel. 609‐279‐[email protected]

OUTLINE
1. Introduction: What is borehole geophysical logging?
2. Environmental CSM Support: Which important environmental site remediation problems can it help us solve?
3. Geophysical Logging Methods Description
4. References
2Princeton Geoscience, Inc., 2017

INTRODUCTION
3Princeton Geoscience, Inc., 2017

DefinitionBorehole Geophysics• “methods for making continuous or point
measurements down a drill hole… lowering different types of probes into borehole and electrically transmitting data to the surfacewhere recorded…as a function of depth.
• “measurements related to the physical and chemical properties of the rocks surrounding the borehole and the fluid in the borehole, to the construction of the well, or to some combination of these factors.”
(Keys, 1997)
(USGS, 2012)
4Princeton Geoscience, Inc., 2017

History
• First well log: 1927 by Schlumberger brothers (electrical resistivity) in France
• Additional electrical, nuclear, sonic, imaging and physical techniques developed for oil and gas, mineral exploration
• Adopted for use in water supply, geotechnical and environmental industries
5Princeton Geoscience, Inc., 2017

HistoryWell Log ‐ 1937 Modern Well Log
6Princeton Geoscience, Inc., 2017

General Applicability
• Methods Available to Assess– Bedrock and Unconsolidated Formations– Open Boreholes or Completed Wells– Through Steel or PVC Casing
• Conceptual Site Model (CSM) Development and Refinement
• Investigative or Corrective Action• Qualitatively or Quantitatively• Support Design or Verify Performance
7Princeton Geoscience, Inc., 2017
Pros and Cons
Benefits• Continuous record
• Objective, numerical data
• Repeatable
• New info from existing wells
• Low cost, relative to other methods (e.g., coring)
Limitations / Qualifications• Best applied with background
information to aid in analysis, (e.g., soil or rock core data)
• Single logging parameter rarely diagnostic; synergistic analysis necessary
• Log interpretation requires experience, knowledge of regional hydrogeology
8Princeton Geoscience, Inc., 2017
ENVIRONMENTAL CONCEPTUAL SITE MODEL SUPPORT
9Princeton Geoscience, Inc., 2017

Importance of Geology and Structure
• GW quality and hydraulic conditions can vary significantly over short distances in bedrock systems
• A purely “engineered” approach to characterization is almost always financially limited – cannot grid‐sample our way to a defined understanding of each fracture
• Rather, we must consider the problem systematically, invoking geologic context as a line of evidence to supplement a representative site‐specific data set
10Princeton Geoscience, Inc., 2017

Importance of Geology and Structure
• In many bedrock GW systems, fractures are the main pathways for flow between source and receptor
• Fracture occurrence, orientation, character and extent are functions of geologic events and characteristics:– Rock mechanics depends upon physical character of the rock (fractures
may concentrate at lithologic contacts)– Lateral extent of a rock unit may in turn limit the extent of a fracture
(mudstone units and fractures they enclose may extend for many thousands of feet; fractures associated with sandstone units of fluvial origin may be of more limited extent)
– Mineral dissolution may enhance permeability– Alternately, weathering in a mudstone may diminish permeability
along a fault• The “last mile” in decision process will frequently involve
reasoning based on systematic conditions resulting from geology
11Princeton Geoscience, Inc., 2017

Conceptual Site Models – Dipping Sedimentary Bedrock
12(Michalski, 2010 after Michalski and Britton, 1997) Princeton Geoscience, Inc., 2017

Conceptual Site Models – Dipping Sedimentary Bedrock (cont’d)
Discrete Fracture Network Effective Monitoring?
13(Parker et al., 2012) Princeton Geoscience, Inc., 2017

Conceptual Site Models – Dipping Sedimentary Bedrock (cont’d)
14
(Parker 2012) (Herman 2010)
Princeton Geoscience, Inc., 2017

How Accurately Should we Understand Bedrock Structure?
• Individual fractured units can have very different water quality and hydraulic conditions
• Typical monitoring well targets only a 10‐foot thickness
• Dipping units, common plume extents imply a need to accurately assess structure – but howaccurately?
15Princeton Geoscience, Inc., 2017

16
Shopping Commercial Property State HighwayAccess Road
Railroad Tracks / Drainage Ditches
Railroad Tracks
Manufacturing Site
Production Well
Dissolved Phase VOC Plume
Residual DNAPL in Aquifer Matrix
Down-Dip Monitoring
Well (Nearest Location Possible)
Monitoring Well
Monitoring Challenges – Dipping Sedimentary Bedrock
~ 300 ft
Princeton Geoscience, Inc., 2017

Source Area Well
Planar Feature Orientation – Implications for Monitoring Accuracy
17
Planned Well at Down‐dip Location
20
A
Dip Error Leads to Vertical Displacement –Missing the Intended Monitoring Zone
A’
Existing Source Area
Well
?
Former Release Area
Planned Down‐dip
Well
Former Release Area
Princeton Geoscience, Inc., 2017

Planar Feature Orientation – Implications for Monitoring Accuracy
18
100 300 500 10000.2 0.4 1.1 1.9 3.70.4 0.7 2.2 3.7 7.50.6 1.1 3.4 5.6 11.30.8 1.5 4.5 7.5 15.01.0 1.9 5.6 9.4 18.83.0 5.7 17.1 28.5 57.05.0 9.6 28.8 48.0 96.0
Error in Dip Angle (degrees)
Map Distance Parallel to Dip (ft) / Corresponding Vertical Error (ft) in
Expected Elevation of Planar Feature
Dip Angle (degrees)
15
Princeton Geoscience, Inc., 2017

Planar Feature Orientation – Implications for Monitoring Accuracy
19
Source Area Monitoring Well
Planned Downgradient Well (Along Strike)
25
A A’
ΔVΔV
Δh Δh
Δh = Horizontal offset due to strike error
ΔV = Vertical offset due to strike error
Strike Error Leads to Vertical Displacement –Missing the Intended Monitoring Zone
Princeton Geoscience, Inc., 2017

Planar Feature Orientation – Implications for Monitoring Accuracy
20
10 15 20 25 10 15 20 25 10 15 20 25 10 15 20 251.0 1.7 0.3 0.5 0.6 0.8 5.2 0.9 1.4 1.9 2.4 8.7 1.5 2.3 3.2 4.1 17.5 3.1 4.7 6.4 8.12.0 3.5 0.6 0.9 1.3 1.6 10.5 1.8 2.8 3.8 4.9 17.5 3.1 4.7 6.4 8.1 34.9 6.2 9.4 12.7 16.33.0 5.2 0.9 1.4 1.9 2.4 15.7 2.8 4.2 5.7 7.3 26.2 4.6 7.0 9.5 12.2 52.4 9.2 14.0 19.1 24.44.0 7.0 1.2 1.9 2.5 3.3 21.0 3.7 5.6 7.6 9.8 35.0 6.2 9.4 12.7 16.3 69.9 12.3 18.7 25.5 32.65.0 8.7 1.5 2.3 3.2 4.1 26.2 4.6 7.0 9.6 12.2 43.7 7.7 11.7 15.9 20.4 87.5 15.4 23.4 31.8 40.86.0 10.5 1.9 2.8 3.8 4.9 31.5 5.6 8.4 11.5 14.7 52.6 9.3 14.1 19.1 24.5 105.1 18.5 28.2 38.3 49.07.0 12.3 2.2 3.3 4.5 5.7 36.8 6.5 9.9 13.4 17.2 61.4 10.8 16.5 22.3 28.6 122.8 21.7 32.9 44.7 57.38.0 14.1 2.5 3.8 5.1 6.6 42.2 7.4 11.3 15.3 19.7 70.3 12.4 18.8 25.6 32.8 140.5 24.8 37.7 51.2 65.59.0 15.8 2.8 4.2 5.8 7.4 47.5 8.4 12.7 17.3 22.2 79.2 14.0 21.2 28.8 36.9 158.4 27.9 42.4 57.6 73.910.0 17.6 3.1 4.7 6.4 8.2 52.9 9.3 14.2 19.3 24.7 88.2 15.5 23.6 32.1 41.1 176.3 31.1 47.2 64.2 82.2
Dip, Resulting Vertical Error
Map Distance Along Assumed Strike (ft) / Corresponding Horizontal Error Perpendicular to Strike (ft) and Vertical Error in Expected Elevation of Planar Feature (ft) at Dip Angles of 10, 15, 20 and 25 Degrees
100Dip, Resulting Vertical
Error
Error in Strike Angle
(degrees) Hz Error
300
Hz Error
Dip, Resulting Vertical Error
500
Hz Error
1000
Hz Error
Dip, Resulting Vertical Error
Princeton Geoscience, Inc., 2017

Bedding Attitude from Quad Maps?
• Local measurements of strike and dip vary widely relative to area‐wide value needed for monitoring
• Strike ridge and Member plots meant to suggest larger scale – but mostly inferred
• These maps are a useful starting point for CSM
21(Monteverde et al., 2014) Princeton Geoscience, Inc., 2017
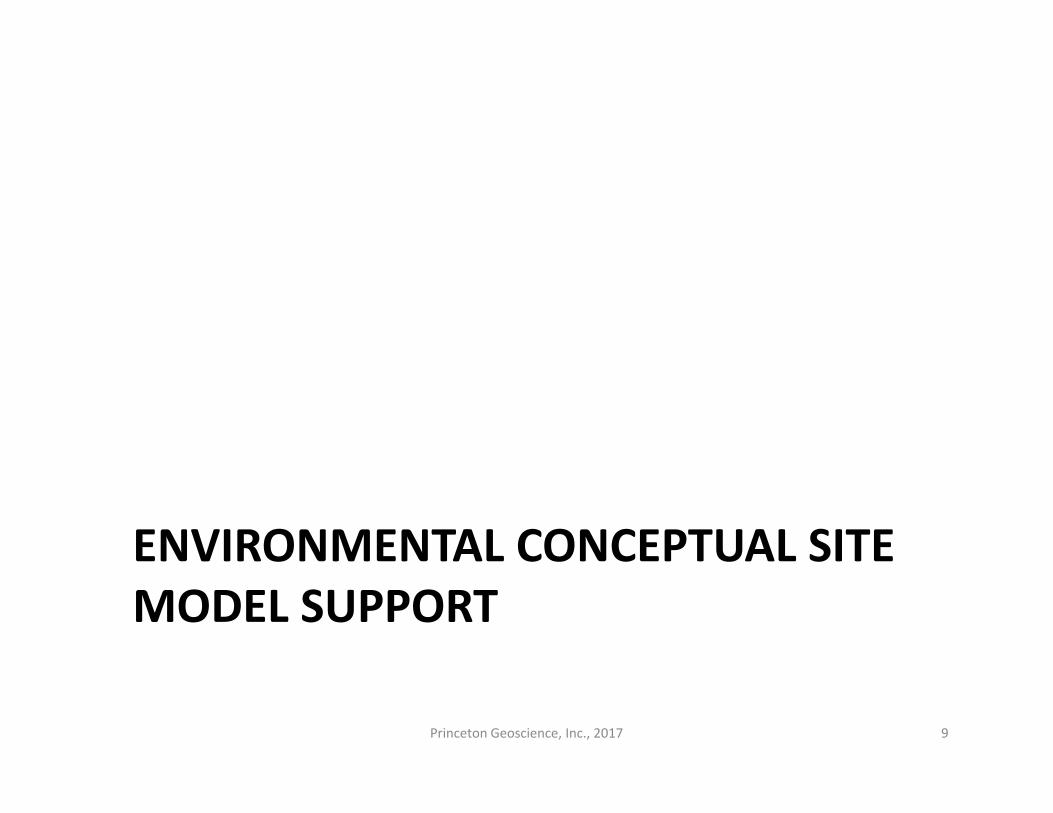
Site‐scale Geologic Mapping
• Can improve upon knowledge gained from published Quadrangle scale maps
• Onsite exposure often limited in urbanized areas
• Roadway and railroad cuts, foundation excavations may be helpful
22Princeton Geoscience, Inc., 2017

Cross‐Flow Hydraulics of Multi‐aquifer Wells
23
FLOWS HEADS2rw
Qi
Qo
so
si
Simple Case: 1 inflow, 1 outflow
General Case: 3+ zones
FLOWS HEADS2rw
Qi
Qo
Simple Case: 1 inflow, 1 outflow
(Sokol 1963; Michalski and Klepp 1990) Princeton Geoscience, Inc., 2017

Unconsolidated Formations – Potential CSM Complexity
• Hydrostratigraphy– Confining Unit Lateral Extent– Hydrostratigraphic Unit Definition and Delineation– Anomalous Water Levels, Chemistry
• Previously Unidentified Low‐K Lenses may Function as:– Contaminant Sinks (Diffusion)– Contaminant Sources (Back‐Diffusion)
24Princeton Geoscience, Inc., 2017

Unconsolidated Formations – Potential CSM Complexity (cont’d)
25(Matthieu, Brusseauet al. 2014)
Contaminant Back Diffusion from Clays causing Persistent, Low‐Level Impact in Former Plume Area after Source Remedy
Resid. Source / GW Impact
Hydraulic Control
Former Area of Continuous Plume
Back Diffusion from Contaminant Charged Clay Units
Princeton Geoscience, Inc., 2017

GEOPHYSICAL LOGGING METHODS DESCRIPTION
26Princeton Geoscience, Inc., 2017

Geophysical Logging Methods / Applications
27
LOG TYPES PRIMARY USES OTHER USE(S)
Natural GammaHydrostratigraphy, lithologic correlation, area‐wide structure
Natural radioactivity
Electrical Logs;EM Induction
Hydrostratigraphy, lithologic correlation, area‐wide structure
Water quality; conductive mineral content; estimate porosity
Caliper Assess hole or well condition, ID fractures Infer lithology, contacts
Fluid LogsID ambient vertical cross‐flows and the fractures or zones between which such exchange takes place
Assess water quality at inflow zones (estimate TDS)
Image LogsID and determine structural attitude of planar features (bedding, foliation, fractures); lithology and structure near borehole; visual inspection
ATV: Acoustic caliper; PVC casing/ cement inspection; steel casing corrosion loss; annular volume log to plan well construction/abandonment
Flow LogsQuantify direction and magnitude of ambient cross‐flows; determine hydraulic heads and Transmissivities for each hydraulically active fracture or zone while pumping
Multi‐well testing to assess and quantify hydraulic connections between wells
Water QualityDepth‐discrete grab sampling at inflow zones; vertical profiling of water quality / redox indicator parameters
Cross‐contamination assessment and mitigation planning
Princeton Geoscience, Inc., 2017

Natural Gamma
• Records Gamma Rays Emitted by Materials Adjacent to Hole
• Gamma from U, K‐40 and Th, Abundant in and Adsorbed to Clays
• Sometimes Called “Shale Log”
• Misnomer: K‐feldspar Rich Sands also Have High Gamma
28(Rider and Kennedy 2011)
Princeton Geoscience, Inc., 2017
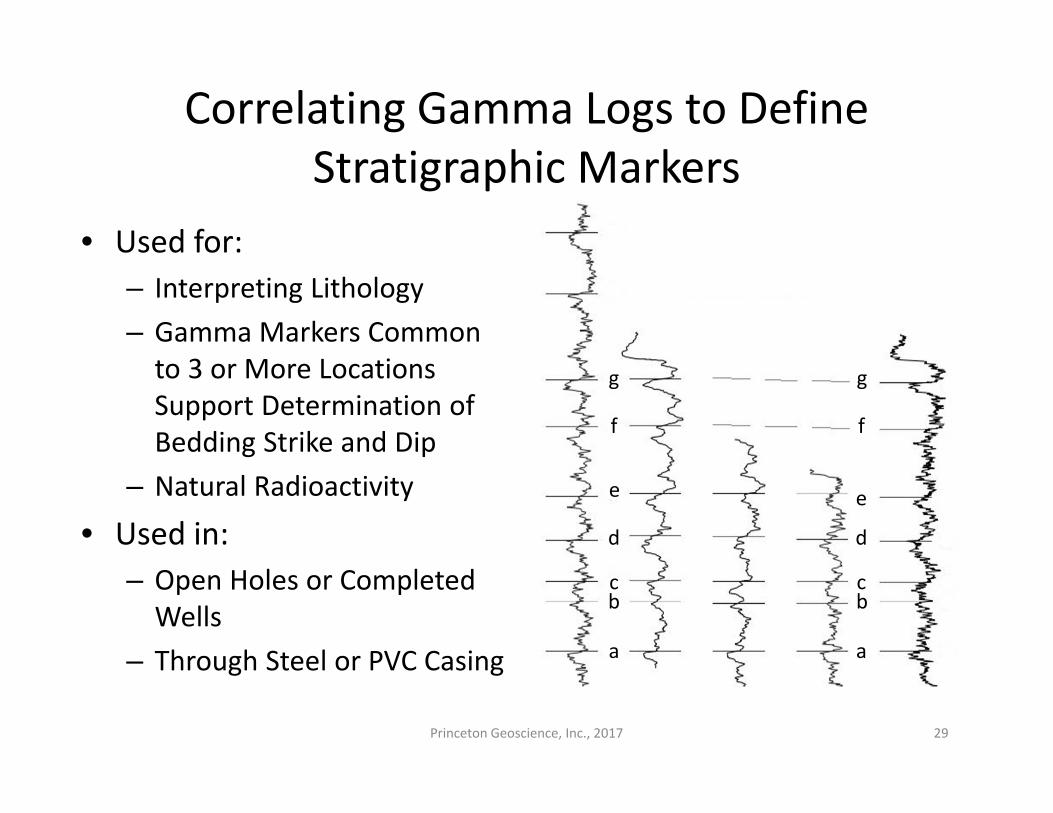
Correlating Gamma Logs to Define Stratigraphic Markers
• Used for:– Interpreting Lithology– Gamma Markers Common to 3 or More Locations Support Determination of Bedding Strike and Dip
– Natural Radioactivity
• Used in:– Open Holes or Completed Wells
– Through Steel or PVC Casing
29
a a
bb
d
cc
g
f
ee
d
f
g
Princeton Geoscience, Inc., 2017

Verifying that Stratigraphic Markers are Laterally Continuous and Parallel
30
Well 1 Well 2 Well 3 Well 4 Well 5 House 1 House 2
Princeton Geoscience
Princeton Geoscience
Princeton Geoscience
Princeton Geoscience
Princeton Geoscience
Company #2 Company #3
06/23/13 06/23/13 06/23/13 06/24/13 06/24/13 03/25/97 12/10/05PVC 304.47 299.55 265.72 287.34 264.47 * *RISER 304.79 299.73 265.89 287.58 264.66 270.64 293.66
GROUND 302.4 295.6 263.2 284.7 261.7 267.0 292.6PVC PVC PVC PVC PVC RISER RISERa ‐ f c ‐ f a ‐ f d ‐ f c ‐ e b ‐ f a ‐ f
Depth 181.0 190.0 23.0 89.0 112.5 192.5Elevation 123.5 109.6 242.7 198.3 158.1 101.2
22.5 23.5 23.0 24.0 22.5 22.0 22.9 0.7Depth 203.5 213.5 46.0 113.0 35.0 135.0 214.5Elevation 101.0 86.1 219.7 174.3 229.5 135.6 79.2
11.5 12.0 13.0 12.5 13.0 13.0 11.5 12.4 0.7Depth 215.0 225.5 59.0 125.5 48.0 148.0 226.0Elevation 89.5 74.1 206.7 161.8 216.5 122.6 67.7
20.0 19.5 21.0 20.0 20.0 20.0 20.1 0.5Depth 235.0 245.0 80.0 68.0 168.0 246.0Elevation 69.5 54.6 185.7 196.5 102.6 47.7
18.0 17.5 19.0 19.0 18.4 0.8Depth 253.0 97.5 187.0 265.0Elevation 51.5 168.2 83.6 28.7
11.0 11.5 9.5 10.7 1.0Depth 264.0 109.0 274.5Elevation 40.5 156.7 19.2
Site‐Wide Separation of
Stratigraphic Markers
MeanValue
Standard Deviation
e
d
Separation
c
b
Separation
Separation
f
WELL LOGGED BY
a
MARKERS INTERSECTED
REFERENCE ELEVATIONS
WELL ID
DATE OF LOGGING
LOGGING REFERENCE
Separation
Separation
Princeton Geoscience, Inc., 2017

Strike and Dip using Gamma Markers
31
Well 3Well 1
Well 2
356.5
332
302
∆z
α
Structural Contours –Compass Orientation on Map defines Strike Direction
Dip Angle (α) = ARCTAN (∆z / ∆h),
where:
∆h = Horizontal distance ⊥ Strike∆z = Elevation change along ∆h
Princeton Geoscience, Inc., 2017

Multi‐Point Solution to Confirm Planarity or Resolve Structure
32
Well 3Well 1
Well 2 222
212
184
b
Well 7
a
c
d
Well 5
a
bc
Well 4
b
a
cd
Well 6
b
a
c
de
f
236
266
181
228
Princeton Geoscience, Inc., 2017

Gamma Correlation with Regional Units• Newark Basin Coring Project (NBCP)– Extensive geologic framework– Electronic data available for gamma logs, lithology, color
– Many units correlate readily over large distances (miles)
• NJGS maps (e.g., Plainfield Quad) reflect NBCP sub‐units
• Elements of CSM per USGS at NAWC research site in West Trenton (Lacombe and Burton 2010)
• Understanding gained may support focused approach
33(Olsen, Kent et al. 1996)Princeton Geoscience, Inc., 2017

Mapping of Passaic Fm. Members
34(Volkert et al., 2013) Princeton Geoscience, Inc., 2017

Assigning Accurate Depths for Clays in Disturbed Cores – Gamma Log Enables CMT Placement
• When coring long intervals (20 ft with sonic), strata can be vertically displaced up to several feet in resulting core
• Gamma log to TD through sonic rods can establish bed boundaries of clays to w/in ~1 foot
• Enables assignment of soil sample depths and CMT® port/well screen placement with needed accuracy
35Princeton Geoscience, Inc., 2017

Electrical Logs
• Based on Ohm’s Law: Resistance (Ohms) = Potential (V) / Current (Amps)
• Single Point Resistance(SPR), Spontaneous Potential (SP): Bulk measures between surface electrode and probe in borehole
• SP interpretation complex in fresh ground water
36
(Keys 1989)Princeton Geoscience, Inc., 2017

Electrical Logs (cont’d)• SPR: Resistance to constant
applied A/C current• Indicated by voltage,
calculated in Ohms• Mostly affected by porosity
and salinity of porewater• Surface conduction on clays
and conductive minerals play lesser role
• Support lithology and fracture ID
37(Keys 1989)
Princeton Geoscience, Inc., 2017

Electrical Logs (cont’d)
• Normal Resistivity: Intrinsic measure of rock or soil and pore fluids around borehole(in Ohm‐Meters)
• Different electrode spacingsvary depth of investigation
• Related mostly to porewaterquality, moisture content, and porosity
• SPR and Normal Resistivity Complement Gamma for lithology
38(Keys 1989)Princeton Geoscience, Inc., 2017

Electrical Logs (cont’d)
39(Rider and Kennedy 2011) (Modified from Rider 1990)
Gamma log relatively featureless; resistivity needed to ID sand units
Princeton Geoscience, Inc., 2017
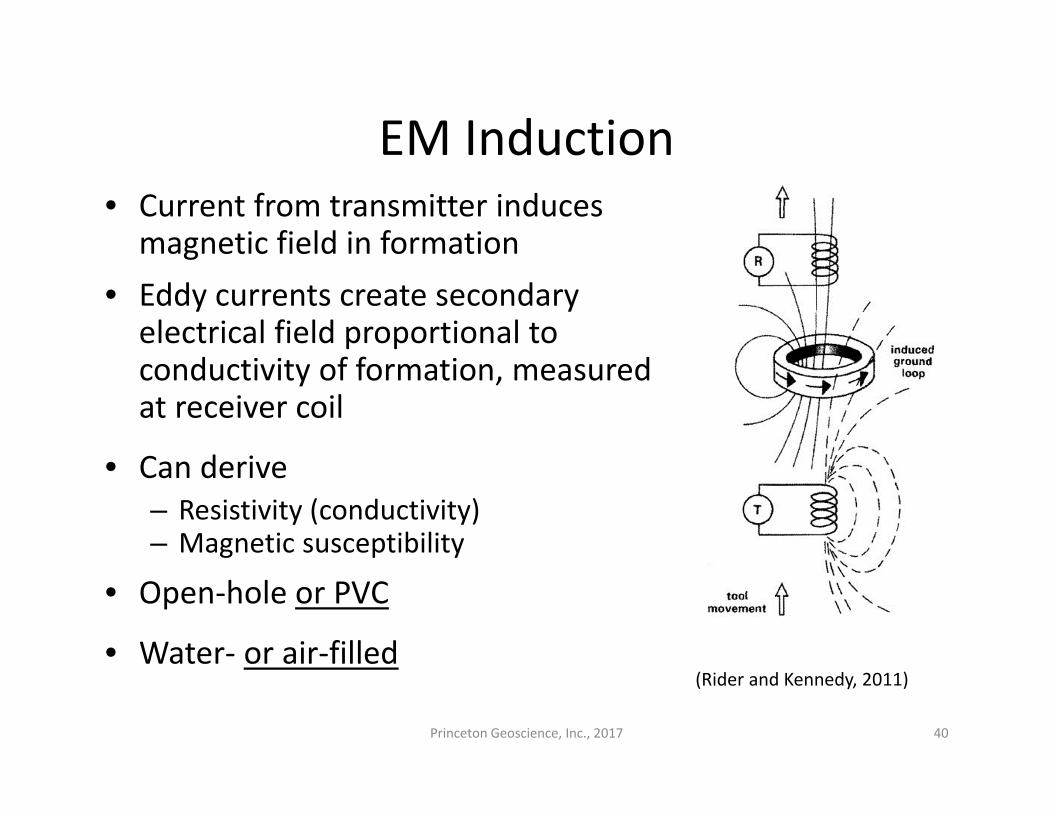
EM Induction• Current from transmitter induces magnetic field in formation
• Eddy currents create secondary electrical field proportional to conductivity of formation, measured at receiver coil
• Can derive– Resistivity (conductivity)– Magnetic susceptibility
• Open‐hole or PVC
• Water‐ or air‐filled
40
(Rider and Kennedy, 2011)
Princeton Geoscience, Inc., 2017

EM Induction (cont’d)• Applications
– Supplement to natural gamma, when NR or SPR not available (esp. to measure through PVC)
– Saltwater intrusion– Other conductive GW contaminants (leachate, metals)
41
GammaEM Conductivity
Zone with Electrically Conductive Contamination
(Williams et al., 1993)Princeton Geoscience, Inc., 2017

Logs Reveal Lithologic Changes, Identify Confining Units
Middle Stockton Formation
42(Sloto 2007) (Sugarman, Miller et al. 2005)
New Jersey Coastal Plain –Units of the Magothy Formation
Passaic Fm. – Cyclic mudstone/siltstone; varying clay, organic carbon content
Princeton Geoscience, Inc., 2017

Used Extensively for Coastal Plain Units
43(Stanford, 2012)
New Jersey Coastal Plain – Delineation of clay/sand facies within the Cohansey Formation; Identification of the top of the Kirkwood Formation confining unit
Princeton Geoscience, Inc., 2017

Coastal Plain Framework based on Logs
44
(Sugarman et al., 2013)
New Jersey Coastal Plain – Delineation of Aquifer Units
Princeton Geoscience, Inc., 2017

Caliper Logs
• Mechanical Three‐Arm Tool
• Records Hole Diameter• Used to Interpret
– Depth of Casing– Fractures– Washout zones– Lithology Changes
• Used in Open Holes
45Princeton Geoscience, Inc., 2017

Caliper Logs (cont’d)
46(Rider and Kennedy 2011) (Keys 1989)Princeton Geoscience, Inc., 2017

Fluid Logs• Temperature and Resistivity
of fluid column in the well or borehole
• Main use is for initial location of hydraulically active fractures or zones– Inflections indicate inflow or
outflow– Constant values over an
interval may indicate cross‐flow between hydraulically active fractures
• Can be used quantitatively e.g., via brine tracing (Michalski and Klepp 1990)
47Princeton Geoscience, Inc., 2017

Image Logs
• Centralized ATV and OTV• Circular traces vertically combined
• Cylindrical record “cut” at North, laid flat
• Log analyst selects and classifies planar features, which plot as sinusoids
• 3D positioning sensors and software allow reporting of structural measurements to North
48
(Wightman et al., 2003)Princeton Geoscience, Inc., 2017

Image Logs (cont’d)
49Princeton Geoscience, Inc., 2017

Image Logs (cont’d)• Image Log Analysis Workflow– Normalize image for centralization, colors
– Evaluate and correct for borehole diameter effects
– Select and classify planar features
– Correct for borehole deviation
– Adjust for magnetic declination (to True N)
50Princeton Geoscience, Inc., 2017
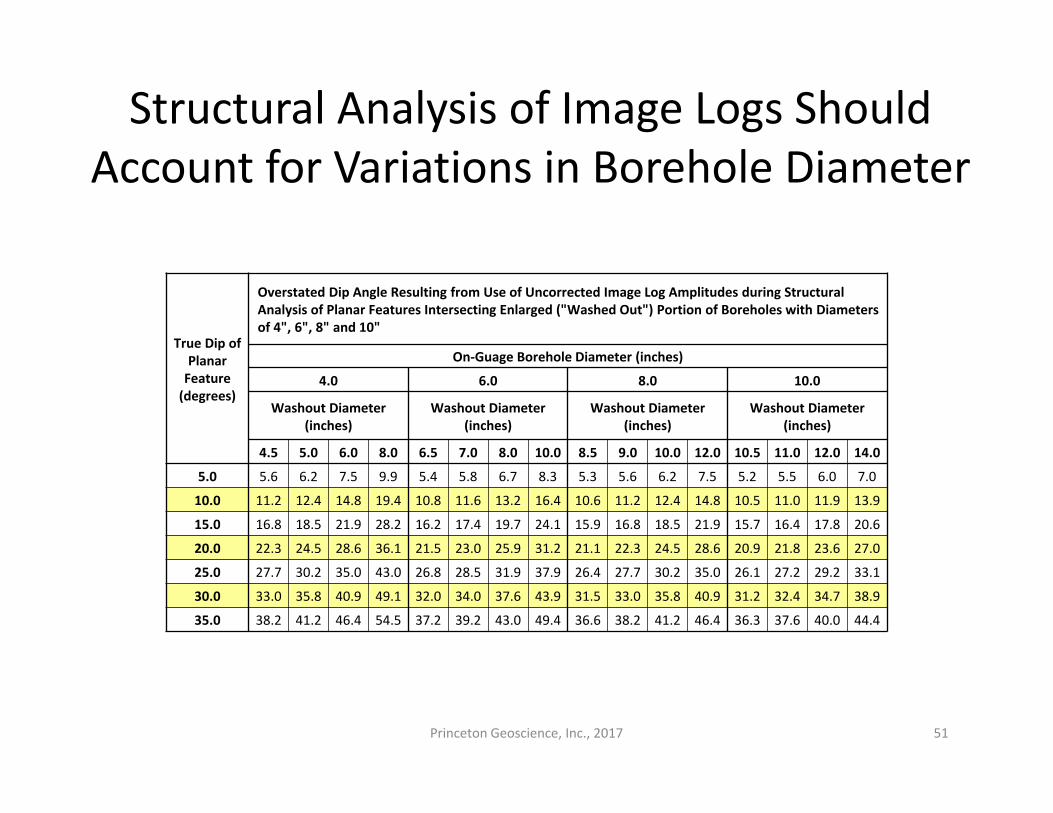
Structural Analysis of Image Logs Should Account for Variations in Borehole Diameter
51
True Dip of Planar Feature (degrees)
Overstated Dip Angle Resulting from Use of Uncorrected Image Log Amplitudes during Structural Analysis of Planar Features Intersecting Enlarged ("Washed Out") Portion of Boreholes with Diameters of 4", 6", 8" and 10"
On‐Guage Borehole Diameter (inches)
4.0 6.0 8.0 10.0
Washout Diameter (inches)
Washout Diameter (inches)
Washout Diameter (inches)
Washout Diameter (inches)
4.5 5.0 6.0 8.0 6.5 7.0 8.0 10.0 8.5 9.0 10.0 12.0 10.5 11.0 12.0 14.0
5.0 5.6 6.2 7.5 9.9 5.4 5.8 6.7 8.3 5.3 5.6 6.2 7.5 5.2 5.5 6.0 7.0
10.0 11.2 12.4 14.8 19.4 10.8 11.6 13.2 16.4 10.6 11.2 12.4 14.8 10.5 11.0 11.9 13.9
15.0 16.8 18.5 21.9 28.2 16.2 17.4 19.7 24.1 15.9 16.8 18.5 21.9 15.7 16.4 17.8 20.6
20.0 22.3 24.5 28.6 36.1 21.5 23.0 25.9 31.2 21.1 22.3 24.5 28.6 20.9 21.8 23.6 27.0
25.0 27.7 30.2 35.0 43.0 26.8 28.5 31.9 37.9 26.4 27.7 30.2 35.0 26.1 27.2 29.2 33.1
30.0 33.0 35.8 40.9 49.1 32.0 34.0 37.6 43.9 31.5 33.0 35.8 40.9 31.2 32.4 34.7 38.9
35.0 38.2 41.2 46.4 54.5 37.2 39.2 43.0 49.4 36.6 38.2 41.2 46.4 36.3 37.6 40.0 44.4
Princeton Geoscience, Inc., 2017

Image Logs (cont’d)
52Princeton Geoscience, Inc., 2017

Acoustic Televiewer
53
(ALT, 2014)
Princeton Geoscience, Inc., 2017

Acoustic Televiewer
• Two raw data tracks– Amplitude– Travel Time
• Amplitude of returned signal diminished (darker traces) in fractures, softer rock
• Travel time through borehole fluid increased (lighter traces) at fractures, other enlargements
54Princeton Geoscience, Inc., 2017

Acoustic Televiewer
55
• Imaging in mud‐ or water‐filled holes
• Structural evaluation
• Acoustic caliper
• Multi‐echo mode for measurements through PVC pipe
• Pipe‐inspection mode for inner and outer corrosion, wall thickness
(ALT, 2015)Princeton Geoscience, Inc., 2017

Acoustic Televiewer• Mean amplitude values can be related to lithology
• Cross‐plotting with other logs (e.g., gamma)
• Apparent rock hardness log can be derived normalizing for borehole and site conditions
56(Johnson et al., 2011)
Princeton Geoscience, Inc., 2017

Optical Televiewer
57
Light Bulbs
Mirror
Borehole Wall
Orientation System
CCD Camera
(ALT, 2015)
Princeton Geoscience, Inc., 2017

Optical Televiewer
• Imaging in air‐ or clear water‐filled holes
• Planar features– Bedding, foliation, layering
– Fractures• Open or mineralized• Apparent aperture
• Visual inspection– Staining, NAPL– Flow indicators– Well condition
58
Compositional layering, fracture in basalt
Princeton Geoscience, Inc., 2017

Optical Televiewer
59Princeton Geoscience, Inc., 2017

Optical Televiewer
60Princeton Geoscience, Inc., 2017

Mineralized Fractures in Mudstone
• Gypsum or calcite mineralization of bedding parallel and high angle fractures
• Some acoustic contrast evident (amplitude), but travel time log mostly featureless
• Fractures at this location and depth non‐conductive
• Dissolution, enhanced by pumping and local geochemistry, can lead to high T zones
61Princeton Geoscience, Inc., 2017

Typical Stereo Net Summary
62Princeton Geoscience, Inc., 2017

Stereo Net of Fractures Occurring within Defined Range ‐ Bedding Plane Fractures
• More useful than a simple average of all fractures
• Where bedding features in image logs are few, can define range based on expected bedding from geologic maps (e.g., map strike ±10°; map dip ± 5°)
• Mean value tends to average out measurement error and small‐scale variability
• Complements, but does not substitute for a 3‐point structural evaluation (represents local, not site‐wide conditions)
63Princeton Geoscience, Inc., 2017

DNAPL in Mudstone
• Freshly‐cored borehole • Vertical streak from dragging of logging tool
• Sampling of rock matrix showed elevated VOCs (adsorbed and diffused mass)
• VOCs non‐detected in rock matrix outside the release area
64Princeton Geoscience, Inc., 2017

Interpreted Structural Log
65Princeton Geoscience, Inc., 2017

Correlated Logs Show that Bedding Fractures are Laterally Continuous
66
~900 ft.
Princeton Geoscience, Inc., 2017

Logs Vertically Shifted to show Correlation; Individual Rock Units and Bedding Fractures can be Traced Hundreds of Feet across a Site in Mudstones
67
Boring Located Down‐Dip Borings Positioned Nearly Along Strike from One Another
Ground surface elevations at borings are similar, so depths of markers shown on logs give a good general indication of bedrock structure
Princeton Geoscience, Inc., 2017

Flow Meters
• Measure Vertical Flow in Well as Indicator of Conditions in Adjacent Aquifer– Standard HPFM range 0.03‐1.0 GPM; NJGS modified unit up to 7 GPM in 6‐inch holes
– Spinner Flow Meter ~2‐10+ GPM; lower rates require trolling
• Ambient or Pumping• Multiple Wells
68
HPFM Spinner
Princeton Geoscience, Inc., 2017

HPFM Operation and Response
69
Vertical flow in borehole diverted through instrument
(Hess 1986) (Hess and Paillet 1990)
Princeton Geoscience, Inc., 2017

<0.03 GPM
+0.45 GPM
<0.03 GPM
HPFM Quantifies Cross‐Flows
70
No Flow
No Flow
Cross‐Flow
Interval
Inflow Zone
Outflow Zone
TEST 1
TEST 2
TEST 3
Test Setup HPFMLog
Results Analysis
• Upward Flow implies Higher Head in Deep Zone
• Water Level in Well is Composite Head
• Vertical Cross‐Flow Causes Mixing, Possible Spread of Contamination
• 0.45 GPM ~ 650 GPD – Could be Significant Issue
• Easily Remedied (Install Screen and Gravel Pack Well)
Princeton Geoscience, Inc., 2017

71
HPFM Testing to Support Estimation of Transmissivity and Hydraulic Head
Data Analysis• Interpret variation in
flowmeter data collected in field
• Identify ambient and pumped flow rate above each zone / fracture
• Forward model head difference driving flow and zone transmissivityusing FWRAP or FLASH model
Field Procedures
Princeton Geoscience, Inc., 2017

FWRAP iterations provide hydraulic background
a. A sample run of F. Paillet’s FWRAP Model b. Excel Output of FWRAP Model
(Paillet, 1998)72Princeton Geoscience, Inc., 2017

FLASH solver helpful in studying highly fractured environments
a. FLASH Excel Inputs Sheet b. FLASH Excel Output Profiles
(Day‐Lewis et al., 2011)73Princeton Geoscience, Inc., 2017

Water Quality Logs
• Discrete depth sampler for grab sampling at inflow zones
• Trolling multi‐parameter water quality probe measures:– Pressure– Temperature– Fluid conductivity– pH– Dissolved oxygen– Oxidation‐reduction – Single ion (e.g., Nitrate,
Ammonia, Chloride)• Assess geochemistry for:
– Natural metals GW impact– Changes due to in‐situ
treatments74Princeton Geoscience, Inc., 2017

Assessing Inflow Zone Water Quality from Grab Sampling Results
75
Groundwater chemistry of water entering at inflow zone (Cf) can be estimated based on:• Vertical flow rates in well
upstream (Qa) and downstream (Qb) of inflow zone (e.g., by HPFM), and
• Water quality in well upstream (Ca) and downstream (Cb) of inflow zone inflow zone (e.g., depth‐discrete grab sampling)
(Michalski 2010; NJDEP‐SRP 2012) Princeton Geoscience, Inc., 2017

Additional Data Management Services
Legacy Data Revival
76Princeton Geoscience, Inc., 2017

Appropriate Scaling Assists Correlation
77
Same well and depth interval
Expanded scale good for composite plots, but gamma features vague
Need to “crunch” the scale vertically to bring out contrast for correlating logs from hole to hole.
Princeton Geoscience, Inc., 2017

...Additional Data Management ServicesLIDAR‐based Topographic Mapping
USGS 20 FT Contours
Contours generated by LIDAR point cloud data
78Princeton Geoscience, Inc., 2017

...Additional Data Management ServicesLIDAR‐based Topographic Mapping
Topographic Contours generated in LIDAR point cloud data, used in concert with bedrock structural data (contoured bedding or fracture elevations) –predict depth to zone of interest:
Subtract structural elevation of fracture or bed from LIDAR based ground surface elevation (e.g., at proposed drilling location)
79
Depth to Targeted Bedding Parallel Fracture Zone = 83’ BGS at Proposed Well
Princeton Geoscience, Inc., 2017

Why Princeton Geoscience?
• Common experience as LSRPs, consultants
• Geoscience expertise– Correlations w/ regional data– HPFM research– Outcrop data integration
• Extended services– Legacy data / LIDAR– Structural evaluation– WellCAD services
80Princeton Geoscience, Inc., 2017

Logging Project Workflow
81
Needs Assessment(Identify Objectives
with Client)
Background Data Review
(Work Scope, Cost Estimate Issued)
Field Work(Draft Logs Issued)
Data Analysis(Letter Report / Logs
Issued)
Client Incorporates Findings into Project
Reports
(Princeton Geoscience can Assist with
Correlation, CSM Development)
Princeton Geoscience, Inc., 2017

TYPICAL PROJECT TEAM
82Princeton Geoscience, Inc., 2017

REFERENCES
83Princeton Geoscience, Inc., 2017

References• Advanced Logic Technology (ALT), 2014, WellCAD Essentials for Mining & Geotechnical Logging Data.
• ALT, 2015, Product literature for downhole geophysical instruments, online at www.alt.lu.
• Alger, R. (1966). Interpretation of electric logs in fresh water wells in unconsolidated formations. SPWLA 7th Annual Logging Symposium, Society of Petrophysicists and Well‐Log Analysts.
• Day‐Lewis, F.D., Johnson, C.D., Paillet, F.L. and Halford, K.J., 2011, A Computer Program for Flow‐Log Analysis of Single Holes (FLASH). Groundwater, 49: 926‐931.
• Herman, G. (2010). Hydrogeology and Borehole Geophysics of Fractured‐Bedrock Aquifers, Newark Basin, New Jersey. Contributions to the geology and hydrogeology of the Newark basin. G. C. H. a. M. E. Serfes, NJ Geological Survey. Bulletin 77: F1‐F45.
• Herman, G.C., 2014, New Jersey Geological Survey research and testing to verify accuracy and reproduciblity of heat‐pulse flowmeter data and to design and calibrate modified flow diverters to extend the reliable measurement range of the heat‐pulse flowmeter. New Jersey Geological Survey.
• Hess, A. E. (1986). "Identifying hydraulically conductive fractures with a slow‐velocity borehole flowmeter." Canadian Geotechnical Journal 23(1): 69‐78.
• Hess, A. E. and F. L. Paillet (1990). "Applications of the thermal‐pulse flowmeter in the hydraulic characterization of fractured rocks." ASTM special technical publication(1101): 99‐112.
84Princeton Geoscience, Inc., 2017

References (cont’d)• Johnson, C.D., Mondazzi, R.A. and Joesten, P.K., 2011, Borehole Geophysical Investigation of a
Formerly Used Defense Site, Machiasport, Maine, 2003‐2006, Report
• Keys, W. S. (1989). Borehole geophysics applied to ground‐water investigations, National Water Well Association Dublin, OH.
• Keys, W. S. (1997). A practical guide to borehole geophysics in environmental investigations. Boca Raton, CRC Press.
• Lacombe, P. J. and W. C. Burton (2010). "Hydrogeologic framework of fractured sedimentary rock, Newark Basin, New Jersey." Groundwater Monitoring & Remediation 30(2): 35‐45.
• Matthieu, D. E., M. L. Brusseau, Z. Guo, M. Plaschke, K. C. Carroll and F. Brinker (2014). "Persistence of a Groundwater Contaminant Plume after Hydraulic Source Containment at a Chlorinated‐Solvent Contaminated Site." Groundwater Monitoring & Remediation 34(4): 23‐32.
• Michalski, A. and G. M. Klepp (1990). "Characterization of Transmissive Fractures by Simple Tracing of In‐Well Flow." Groundwater 28(2): 191‐198.
• Michalski, A. and Britton, R., 1997, The role of bedding fractures in the hydrogeology of sedimentary bedrock—evidence from the Newark Basin, New Jersey. Groundwater, 35: 318‐327.
85Princeton Geoscience, Inc., 2017

References (cont’d)• Michalski, A., 2010, Hydrogeologic Characterization of Contaminated Bedrock Sites in the Newark
Basin: Selecting Conceptual Flow Model and Characterization Tools. In: Herman, G.C.a.S., M.E. (ed.), Contributions to the geology and hydrogeology of the Newark Basin. NJ Geological Survey, Trenton, NJD1‐D12.
• Monteverde, D.H., Herman, G.C. and Stanford, S.D., 2014, Geology of the Hopewell Quadrangle, Hunterdon, Mercer and Somerset counties, New Jersey (1:24,000). New Jersey Geological Survey,, Trenton, N.J.
• NJDEP‐SRP (2012). Groundwater technical guidance: Site Investigation, Remedial Investigation, Remedial Action Performance Monitoring (version 1.0).
• Olsen, P. E., D. V. Kent, B. Cornet, W. K. Witte and R. W. Schlische (1996). "High‐resolution stratigraphy of the Newark rift basin (early Mesozoic, eastern North America)." GSA Bulletin 108(1): 40‐77.
• Parker, B. (2012). Characterization Techniques for Identifying Hydraulically Active Fractures in Sedimentary Rocks. MGWA Spring 2012 Conference: Conduits, Karst, and Contamination Addressing Groundwater Challenges, University of Guelph, e360 and Minnesota Geological Survey.
• Paillet, F., 1998, Flow modeling and permeability estimation using borehole flow logs in heterogeneous fractured formations. Water Resources Research, 34: 997‐1010.
86Princeton Geoscience, Inc., 2017

References (cont’d)• Parker, B.L., Cherry, J.A. and Chapman, S.W., 2012, Discrete fracture network approach for studying
contamination in fractured rock. AQUAMundi: Journal of Water Science, 60: 101‐116.
• Rider, M. H. (1990). "Gamma‐ray log shape used as a facies indicator: critical analysis of an oversimplified methodology." Geological Society, London, Special Publications 48(1): 27‐37.
• Rider, M. H. and M. Kennedy (2011). The geological interpretation of well logs. Scotland, Rider‐French Consulting Limited.
• Sloto, R. A. (2007). "Interpretation of Borehole Geophysical Logs, Aquifer‐Isolation Tests, and Water‐Quality Data for Sites 1, 3, and 5 at Willow Grove Naval Air Station/Joint Reserve Base, Horsham Township, Montgomery County, Pennsylvania, 2005."
• Stanford, S.D., 2012, The Geology of the Chatsworth Quadrangle, Burlington County, New Jersey (1:24000).
• Sugarman, P. J., K. G. Miller, J. V. Browning, A. A. Kulpecz, P. P. McLaughlin Jr and D. H. Monteverde (2005). "Hydrostratigraphy of the New Jersey Coastal Plain: Sequences and facies predict continuity of aquifers and confining units." Stratigraphy 2: 259‐275.
• Sugarman, P.J., Monteverde, D.H., Boyle, J.T. and Domber, S.E., 2013, Aquifer correlation map of Monmouth and Ocean Counties, New Jersey (1:150000).
87Princeton Geoscience, Inc., 2017

References (cont’d)• Volkert, R.A., Monteverde, D.H. and Silvestri, S.M., 2013, Bedrock Geologic Map of the Plainfield
Quadrangle, Union, Middlesex and Somerset Counties, New Jersey (1:24000).
• Wightman, W., F. Jalinoos, P. Sirles and K. Hanna (2003). Application of Geophysical Methods to Highway Related Problems. Federal Highway Administration, Central Federal Lands Highway Division, Lakewood, CO, Publication No, FHWA‐IF‐04‐021.
• Williams, J.H., Lapham, W.W. and Barringer, T.H., 1993, Application of Electromagnetic Logging to Contamination Investigations in Glacial Sand‐and‐Gravel Aquifers. Groundwater Monitoring & Remediation, 13: 129‐138.
88Princeton Geoscience, Inc., 2017
Related Documents