expression in Escherichia colf as described by X. Liao, K. R. Clemens, J. Cavanagh, L. Tennant, and P. E. Wright [J. Biomol. NMR 4, 433 (1994)1. We performed the NMR experiments at 300 K at a 'H frequency of 500 MHz, using a 0.5 mM solution of ZF1-3 in 30 mM phosphate buffer (pH 6.5) in a mixture of 90% H20 and 10% D20 containing 30 mM NaCI, 5 mM deuter- ated dithiothreitol, and 50 p.M ZnCI2. 7. Analysis of the data, accounting for both dipolar re- laxation of the 15N spin mediated by its directly at- tached proton and relaxation caused by chemical shielding anisotropy, was based on the classical ex- pressions (8) T. ' = lajJ(w) T21= = bjJ((o) =1 + -To TcjJ(Wi) with constant coefficients a., b., and c.. The power spectral density J(w) reflects molecular dynamics processes (intramolecular dynamics as well as over- all rotational tumbling) and is sampled at frequencies x>, which are combinations of the 15N and ' H Larmor frequencies ON and OH. 8. L. E. Kay, D. A. Torchia, A. Bax, Biochemistry 28, 8972 (1989). 9. M. J. Stone et al., ibid. 31,4394 (1992). 10. P. Debye, Polar Molecules (Dover, New York, 1929), chap. 5; F. Perrin, J. Phys. Radium 5,497 (1934); ibid. 7,1 (1936); L. D. Favro, Phys. Rev. 107,7 (1960). 11. G. Lipari and A. Szabo, J. Am. Chem. Soc. 104, 4546(1982). 12. W. H. Press, B. P. Flannery, S. A. Teukolsky, W. T. Vetterling, Numerical Recipes in C: The Art of Scien- tific Computing (Cambridge Univ. Press, Cambridge, 1988). 13. Structures were calculated from 1284 NOE distance constraints and 45 dihedral angle constraints by vari- able target function distance geometry and re- strained molecular dynamics (X. Liao and P. E. Wright, unpublished data). 14. M. S. Lee, G. P. Gippert, K. V. Soman, D. A. Case, P. E. Wright, Science 245,635 (1989); R. E. Klevit, J. R. Herriott, S. J. Horvath, Proteins 7, 215 (1990). 15. Y. Nakaseko, D. Neuhaus, A. Klug, D. Rhodes, J. Mol. Biol. 228, 619 (1992). 16. J. G. Omichinski et al., Biochemistry 31, 3907 (1992). 17. Contributions from aggregation can be excluded as a result of the excellent agreement found between the effective rotational tumbling correlation time ob- tained by tryptophan fluorescence depolarization measurements at a ZF1-3 concentration of 50 p.M and that derived from NMR relaxation measure- ments at more than 1 0-fold higher concentration (X. Liao, R. Bruschweiler, D. Millar, P. E. Wright, unpub- lished data). 18. A. G. Palmer, M. Rance, P. E. Wright, J. Am. Chem. Soc. 113, 4371 (1991). 19. G. Barbato, M. Ikura, L. E. Kay, R. W. Pastor, A. Bax, Biochemistry 31, 5269 (1992). 20. It is not possible to specify uniquely the relative ori- entations of the diffusion tensors as a consequence of the transformation properties of the responsible spin interactions. The relaxation data cannot distin- guish between orientations that relate individual do- mains by an orthorhombic symmetry transformation of the diffusion tensor ellipsoids. This means that a 1 80° rotation of any of the domains about the x, y, or z axes of their diffusion frames leaves the relaxation parameters unchanged. 21. I. Radhakrishnan, D. Millar, P. E. Wright, unpublished data. 22. K. R. Clemens et al., J. Mol. Biol. 244, 23 (1994). 23. We thank T. Macke for making Fig. 1 (with graphics program AVS) and D. Millar and J. Gottesfeld for helpful discussions. X.L. is a recipient of the Cancer Research Institute-Miriam and Benedict Wolf Fel- lowship. This work was funded by grant GM 36643 from the National Institutes of Health. 8 November 1994; accepted 21 February 1995 Borders of Multiple Visual Areas in Humans Revealed by Functional Magnetic Resonance Imaging M. 1. Sereno,* A. M. Dale, J. B. Reppas, K. K. Kwong, J. W. Belliveau, T. J. Brady, B. R. Rosen, R. B. H. Tootell The borders of human visual areas V1, V2, VP, V3, and V4 were precisely and noninvasively determined. Functional magnetic resonance images were recorded during phase-en- coded retinal stimulation. This volume data set was then sampled with a cortical surface reconstruction, making it possible to calculate the local visual field sign (mirror image versus non-mirror image representation). This method automatically and objectively out- lines area borders because adjacent areas often have the opposite field sign. Cortical magnification factor curves for striate and extrastriate cortical areas were determined, which showed that human visual areas have a greater emphasis on the center-of-gaze than their counterparts in monkeys. Retinotopically organized visual areas in humans extend anteriorly to overlap several areas previously shown to be activated by written words. Over half of the neocortex in nonhuman primates is occupied by visual areas. At least 25 visual areas beyond the primary visual cortex (V1) have been identified with a combination of microelectrode mapping, tracer injections, histological stains, and functional studies (1). The analysis of this data has been greatly aided by the use of flattened representations of the cortical sur- face made from conventional sections with graphical techniques (2) and flattened wire models (3), or more directly from sections of physically flat-mounted cortex (4). A large portion of the neocortex in hu- mans is likely to be occupied by visual areas too. It has been difficult, however, to out- line unambiguously any human cortical area with noninvasive techniques. Previous studies have mapped only a few locations in the visual field or have relied on stimulus features to activate different areas (5), and the tortuous convolutions of the human neocortex have defied previous attempts to see activity across all of its surface area at once. Many of the cortical visual areas in non- human primates are retinotopically orga- nized to some degree (3, 6). These areas are irregularly shaped and somewhat variable in location; consequently, recordings from many locations (400 to 600) in single ani- M. I. Sereno, Cognitive Science 0515, University of Cali- fornia, San Diego, La Jolla, CA 92093-0515, USA. A. M. Dale, Cognitive Science 0515, University of Califor- nia, San Diego, La Jolla, CA 92093-0515, USA, and De- partment of Neurophysiology, University of Oslo, 0316 Oslo, Norway. J. B. Reppas, Harvard-Massachusetts Institute of Tech- nology Division of Health Sciences and Technology, Bos- ton, MA 02115, USA. K. K. Kwong, J. W. Belliveau, T. J. Brady, B. R. Rosen, R. B. H. Tootell, Massachusetts General Hospital Nuclear Magnetic Resonance Center, 149 13th Street, Charles- town, MA 02129, USA. *To whom correspondence should be addressed. SCIENCE * VOL. 268 * 12 MAY 1995 mals have been required to define areal bor- ders with confidence (7). Here we demon- strate a technique for generating retinotopic maps of visual cortex in humans with a precision similar to that obtained in the most detailed invasive animal studies. Re- sponses to phase-encoded retinal stimula- tion (8) were recorded with echo-planar functional magnetic resonance imaging (MRI) (9) and analyzed with a Fourier- based method. The resulting volume data sets were sampled with a cortical surface reconstruction made from high-resolution structural MRI images collected separately for each participant (10). The cortical sur- face containing the data was then unfolded and analyzed with the visual field sign meth- od to distinguish mirror image from non- mirror image representations (7). By com- bining these four techniques (multislice functional MRI, stimulus phase-encoding and Fourier analysis, cortical surface recon- struction, and visual field sign calculations), it was possible to reconstruct the retinotopic organization of visual areas VI, V2, VP, V3, and V4 in humans in two dimensions and to accurately trace out the borders between these areas in the living human brain. To map polar angle (angle from the cen- ter-of-gaze), we obtained 128 asymmetric spin echo MRI images (11) of 8 to 16 ob- lique sections perpendicular to the calcarine sulcus (1024 to 2048 total) in a 512-s session (-8.5 min) while participants (n = 7) viewed a slowly rotating (clockwise or coun- terclockwise), semicircular checkerboard stimulus. Eccentricity (distance from the center-of-gaze) was mapped with a thick ring (dilating or contracting) instead of a semicircle. These four kinds of stimuli elicit periodic excitation at the rotation or dila- tion-contraction frequency at each point in a cortical retinotopic map (8, 12). The 889 INI

Welcome message from author
This document is posted to help you gain knowledge. Please leave a comment to let me know what you think about it! Share it to your friends and learn new things together.
Transcript

expression in Escherichia colf as described by X. Liao,K. R. Clemens, J. Cavanagh, L. Tennant, and P. E.Wright [J. Biomol. NMR 4, 433 (1994)1. We performedthe NMR experiments at 300 K at a 'H frequency of500 MHz, using a 0.5 mM solution of ZF1-3 in 30 mMphosphate buffer (pH 6.5) in a mixture of 90% H20and 10% D20 containing 30 mM NaCI, 5 mM deuter-ated dithiothreitol, and 50 p.M ZnCI2.
7. Analysis of the data, accounting for both dipolar re-laxation of the 15N spin mediated by its directly at-tached proton and relaxation caused by chemicalshielding anisotropy, was based on the classical ex-pressions (8)
T.' = lajJ(w)T21== bjJ((o)
=1 + -ToTcjJ(Wi)
with constant coefficients a., b., and c.. The powerspectral density J(w) reflects molecular dynamicsprocesses (intramolecular dynamics as well as over-all rotational tumbling) and is sampled at frequenciesx>, which are combinations of the 15N and 'H Larmorfrequencies ON and OH.
8. L. E. Kay, D. A. Torchia, A. Bax, Biochemistry 28,8972 (1989).
9. M. J. Stone et al., ibid. 31,4394 (1992).10. P. Debye, Polar Molecules (Dover, New York, 1929),
chap. 5; F. Perrin, J. Phys. Radium 5,497 (1934); ibid.7,1 (1936); L. D. Favro, Phys. Rev. 107,7 (1960).
11. G. Lipari and A. Szabo, J. Am. Chem. Soc. 104,4546(1982).
12. W. H. Press, B. P. Flannery, S. A. Teukolsky, W. T.Vetterling, Numerical Recipes in C: The Art of Scien-tific Computing (Cambridge Univ. Press, Cambridge,1988).
13. Structures were calculated from 1284 NOE distanceconstraints and 45 dihedral angle constraints by vari-able target function distance geometry and re-strained molecular dynamics (X. Liao and P. E.Wright, unpublished data).
14. M. S. Lee, G. P. Gippert, K. V. Soman, D. A. Case, P.E. Wright, Science 245,635 (1989); R. E. Klevit, J. R.Herriott, S. J. Horvath, Proteins 7, 215 (1990).
15. Y. Nakaseko, D. Neuhaus, A. Klug, D. Rhodes, J.Mol. Biol. 228, 619 (1992).
16. J. G. Omichinski et al., Biochemistry 31, 3907(1992).
17. Contributions from aggregation can be excluded asa result of the excellent agreement found betweenthe effective rotational tumbling correlation time ob-tained by tryptophan fluorescence depolarizationmeasurements at a ZF1-3 concentration of 50 p.Mand that derived from NMR relaxation measure-ments at more than 1 0-fold higher concentration (X.Liao, R. Bruschweiler, D. Millar, P. E. Wright, unpub-lished data).
18. A. G. Palmer, M. Rance, P. E. Wright, J. Am. Chem.Soc. 113, 4371 (1991).
19. G. Barbato, M. Ikura, L. E. Kay, R. W. Pastor, A. Bax,Biochemistry 31, 5269 (1992).
20. It is not possible to specify uniquely the relative ori-entations of the diffusion tensors as a consequenceof the transformation properties of the responsiblespin interactions. The relaxation data cannot distin-guish between orientations that relate individual do-mains by an orthorhombic symmetry transformationof the diffusion tensor ellipsoids. This means that a1 80° rotation of any of the domains about the x, y, orz axes of their diffusion frames leaves the relaxationparameters unchanged.
21. I. Radhakrishnan, D. Millar, P. E. Wright, unpublisheddata.
22. K. R. Clemens et al., J. Mol. Biol. 244, 23 (1994).23. We thank T. Macke for making Fig. 1 (with graphics
program AVS) and D. Millar and J. Gottesfeld forhelpful discussions. X.L. is a recipient of the CancerResearch Institute-Miriam and Benedict Wolf Fel-lowship. This work was funded by grant GM 36643from the National Institutes of Health.
8 November 1994; accepted 21 February 1995
Borders of Multiple Visual Areas in HumansRevealed by Functional Magnetic
Resonance ImagingM. 1. Sereno,* A. M. Dale, J. B. Reppas, K. K. Kwong,
J. W. Belliveau, T. J. Brady, B. R. Rosen, R. B. H. Tootell
The borders of human visual areas V1, V2, VP, V3, and V4 were precisely and noninvasivelydetermined. Functional magnetic resonance images were recorded during phase-en-coded retinal stimulation. This volume data set was then sampled with a cortical surfacereconstruction, making it possible to calculate the local visual field sign (mirror imageversus non-mirror image representation). This method automatically and objectively out-lines area borders because adjacent areas often have the opposite field sign. Corticalmagnification factor curves for striate and extrastriate cortical areas were determined,which showed that human visual areas have a greater emphasis on the center-of-gazethan their counterparts in monkeys. Retinotopically organized visual areas in humansextend anteriorly to overlap several areas previously shown to be activated by writtenwords.
Over half of the neocortex in nonhumanprimates is occupied by visual areas. At least25 visual areas beyond the primary visualcortex (V1) have been identified with acombination of microelectrode mapping,tracer injections, histological stains, andfunctional studies (1). The analysis of thisdata has been greatly aided by the use offlattened representations of the cortical sur-face made from conventional sections withgraphical techniques (2) and flattened wiremodels (3), or more directly from sectionsof physically flat-mounted cortex (4).A large portion of the neocortex in hu-
mans is likely to be occupied by visual areastoo. It has been difficult, however, to out-line unambiguously any human corticalarea with noninvasive techniques. Previousstudies have mapped only a few locations inthe visual field or have relied on stimulusfeatures to activate different areas (5), andthe tortuous convolutions of the humanneocortex have defied previous attempts tosee activity across all of its surface area atonce.
Many of the cortical visual areas in non-human primates are retinotopically orga-nized to some degree (3, 6). These areas areirregularly shaped and somewhat variable inlocation; consequently, recordings frommany locations (400 to 600) in single ani-
M. I. Sereno, Cognitive Science 0515, University of Cali-fornia, San Diego, La Jolla, CA 92093-0515, USA.A. M. Dale, Cognitive Science 0515, University of Califor-nia, San Diego, La Jolla, CA 92093-0515, USA, and De-partment of Neurophysiology, University of Oslo, 0316Oslo, Norway.J. B. Reppas, Harvard-Massachusetts Institute of Tech-nology Division of Health Sciences and Technology, Bos-ton, MA 02115, USA.K. K. Kwong, J. W. Belliveau, T. J. Brady, B. R. Rosen, R.B. H. Tootell, Massachusetts General Hospital NuclearMagnetic Resonance Center, 149 13th Street, Charles-town, MA 02129, USA.
*To whom correspondence should be addressed.
SCIENCE * VOL. 268 * 12 MAY 1995
mals have been required to define areal bor-ders with confidence (7). Here we demon-strate a technique for generating retinotopicmaps of visual cortex in humans with aprecision similar to that obtained in themost detailed invasive animal studies. Re-sponses to phase-encoded retinal stimula-tion (8) were recorded with echo-planarfunctional magnetic resonance imaging(MRI) (9) and analyzed with a Fourier-based method. The resulting volume datasets were sampled with a cortical surfacereconstruction made from high-resolutionstructural MRI images collected separatelyfor each participant (10). The cortical sur-face containing the data was then unfoldedand analyzed with the visual field sign meth-od to distinguish mirror image from non-mirror image representations (7). By com-bining these four techniques (multislicefunctional MRI, stimulus phase-encodingand Fourier analysis, cortical surface recon-struction, and visual field sign calculations),it was possible to reconstruct the retinotopicorganization of visual areas VI, V2, VP, V3,and V4 in humans in two dimensions and toaccurately trace out the borders betweenthese areas in the living human brain.
To map polar angle (angle from the cen-ter-of-gaze), we obtained 128 asymmetricspin echo MRI images (11) of 8 to 16 ob-lique sections perpendicular to the calcarinesulcus (1024 to 2048 total) in a 512-s session(-8.5 min) while participants (n = 7)viewed a slowly rotating (clockwise or coun-terclockwise), semicircular checkerboardstimulus. Eccentricity (distance from thecenter-of-gaze) was mapped with a thickring (dilating or contracting) instead of asemicircle. These four kinds of stimuli elicitperiodic excitation at the rotation or dila-tion-contraction frequency at each pointin a cortical retinotopic map (8, 12). The
889
INI

phase of the periodic response at the rota-tion or dilation-contraction frequency, mea-sured with the (complex-valued) Fouriertransform of the response profile over timeat each voxel, is closely related to the polarangle or eccentricity represented at that cor-tical location (13). This technique results inhigh signal-to-noise ratios (because at anyone point in time, approximately one-half ofeach visual field map will be activated) yetprovides fine spatial resolution. Common(for example, retinal) and between-areaphase delays can be removed and examinedby considering clockwise-counterclockwiserotation and expansion-contraction pairs(14, 15).
Figure lA shows a color plot of theresponse to a dilating ring on a medial viewof the cortical surface of the brain of thisparticipant (A.M.D.) (16). The hue of thecolor at each cortical surface point indicatesthe response phase, which is here propor-tional to the eccentricity of the local visualfield representation. In Fig. 1B the corticalsurface was unfolded. This process is similarto inflating a crumpled balloon except thatthe surface has not been stretched. In Fig.iC, the occipital lobe region containing theactivated area has been cut off and theresulting approximately conical surface cutagain along the fundus of the calcarinesulcus to allow it to be flattened completely(17).
There is a systematic increase in eccen-tricity (red to blue to green to yellow to red)moving anteriorly along the medial wall ofthe occipital cortex. Lines of isoeccentricityrun approximately in the coronal plane,cutting across several areas, as shown below.Ventrally, the region showing substantialretinotopy extends almost to the anterior-posterior midpoint of the unfolded ventraltemporal lobe.A parallel treatment of data from the
rotating hemifield stimulus collected a fewminutes later is shown in Fig. 1, D and E.The color again indicates the phase of theperiodic response, which is now proportion-al to the polar angle of the local visual fieldrepresentation. The picture of polar angle ismore complex, alternating between verticaland horizontal meridians both dorsally andventrally. The upper field vertical meridianis red, the horizontal meridian is blue, andthe lower field vertical meridian is green.Several alternations between red and bluestripes are visible ventrally, whereas severalalternations between green and blue stripesare visible dorsally. Mapping experiments inmonkeys suggest that several additional re-representations of the lower visual field ad-join V1 dorsally, including V2 (second vi-sual area) and V3 (third visual area), where-as several rerepresentations of the uppervisual field adjoin V1 ventrally, includingV2, VP (ventroposterior area), and V4v
890
(V4 ventral) (18). In particular, we wouldexpect vertical meridian representations atthe dorsal and ventral V1-V2 border, theventral VP-V4v border, and the dorsal V3-V4 border, and horizontal meridian repre-
sentations near the fundus of the calcarinesulcus in VI, at the dorsal V2-V3 border, atthe ventral V2-VP border, and at the ante-rior border of ventral V4v (4, 6, 7). Can-didates for all of the borders are visible in
Fig. 1. Isoeccentricity and isopolar angle maps of human visual areas. The top row shows isoeccentricitycoded by color [red (fovea) -* blue -> green (parafoveal) -* yellow -> red (periphery)] displayed on theoriginal cortical surface (A), the unfolded cortical surface (B), and the cut and flattened cortical surface (C).The bottom row shows polar angle [red (lower vertical meridian) -> blue (horizontal meridian) -* green(upper vertical meridian)] plotted on the same three surfaces (D), (E), and (F), respectively. Local eccen-tricity and polar angle were determined by considering the phase of the response to a slowly dilating ringor a slowly rotating hemifield at the dilation or rotation frequency. The unfolded representations in (B) and(E) were made by relaxing the curvature while approximately preserving local area and local angles (thesulcal cortex is dark gray and the gyral cortex light gray). The flattened representations in (C) and (F) weremade with the same algorithm after the occipital lobe was cut off and an additional cut in the fundus of thecalcarine sulcus was made.
Fig. 2. Analysis of the data in Fig. 1 byvisual field sign (mirror image versusnon-mirror image visual field represen-tation). Mirror image areas (yellow; forexample, V1), and non-mirror image ar-eas (blue; for example, V2) are shown ina medial view on the folded (A) and un-folded surface (B) and in a ventral view,folded (C) and unfolded (D). The incisionin the fundus of the calcarine is visible in(B). Ventral V1, V2, VP, and V4v (18),comprising four rerepresentations of theupper visual field, are visible below theincision, whereas lower visual field V1and V2 are visible above the incision.The complex folding pattern of the oc-cipital lobe coupled with the weak corre-lation between sulci and areal bound-aries underscores the need for an un-folded representation.
SCIENCE * VOL. 268 * 12 MAY 1995
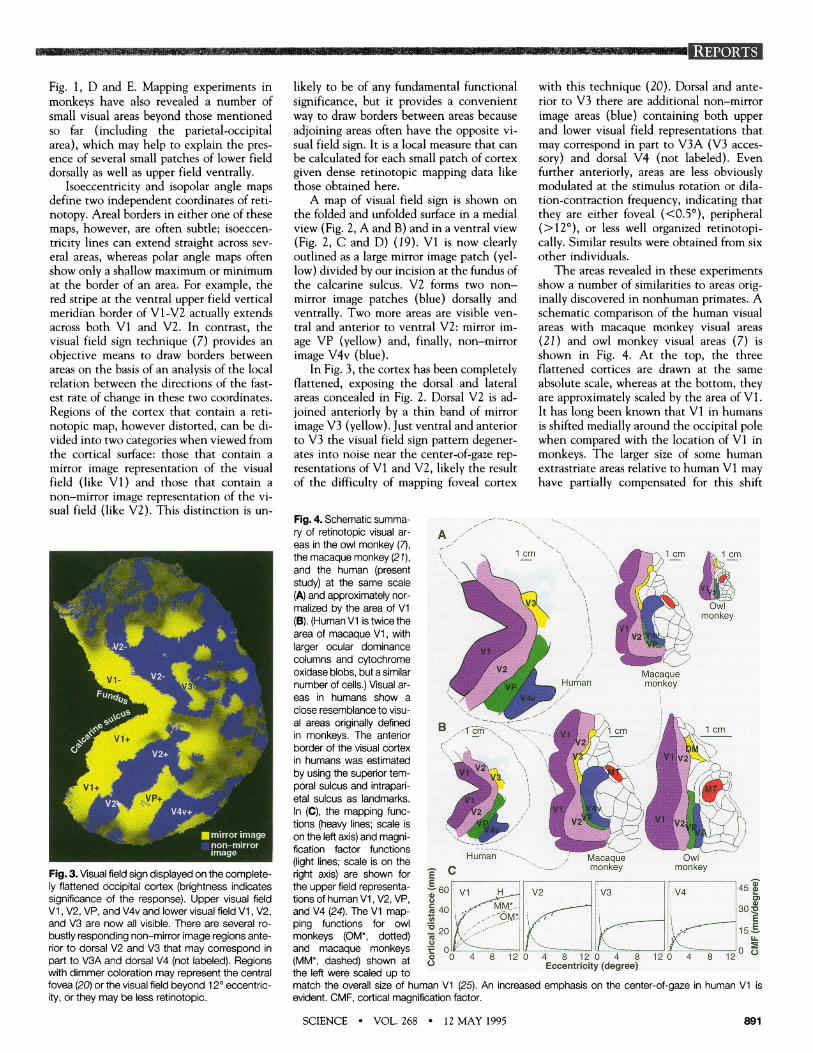
Fig. 1, D and E. Mapping experiments inmonkeys have also revealed a number ofsmall visual areas beyond those mentionedso far (including the parietal-occipitalarea), which may help to explain the pres-ence of several small patches of lower fielddorsally as well as tipper field ventrally.
Isoeccentricity and isopolar angle mapsdefine two independent coordinates of reti-notopy. Areal borders in either one of thesemaps, however, are often subtle; isoeccen-tricity lines can extend straight across several areas, whereas polar angle maps oftenshow only a shallow maximum or minimumat the border of an area. For example, thered stripe at the ventral tupper field verticalmeridian border of Vi-V2 actually extendsacross both Vi and V2. In contrast, thevisual field sign technique (7) provides anobjective means to draw borders betweenareas on the basis of an analysis of the localrelation between the directions of the fast-est rate of change in these two coordinates.Regions of the cortex that contain a reti-notopic map, however distorted, can be di-vided into two categories when viewed fromthe cortical surface: those that contain amirror image representation of the visualfield (like V1) and those that contain anon-mirror image representation of the vi-stual field (like V2). This distinction is u1n-
Fig. 3. Visual field sign displayed on the complete-ly flattened occipital cortex (brightness indicatessignificance of the response). Upper visual fieldV1, V2, VP, and V4v and lower visual field V1, V2,and V3 are now all visible. There are several ro-bustly responding non-mirror image regions ante-rior to dorsal V2 and V3 that may correspond inpart to V3A and dorsal V4 (not labeled). Regionswith dimmer coloration may represent the centralfovea (20) or the visual field beyond 12 eccentric-ity, or they may be less retinotopic.
likely to be of any fundamental functionalsignificance, but it provides a convenientway to draw borders between areas becauseadjoining areas often have the opposite vi-sual field sign. It is a local measure that canbe calculated for each small patch of cortexgiven dense retinotopic mapping data likethose obtained here.A map of visual field sign is shown on
the folded and unfolded surface in a medialview (Fig. 2, A and B) and in a ventral view(Fig. 2, C and D) (19). V1 is now clearlyoutlined as a large mirror image patch (yel-low) divided by our incision at the funduls ofthe calcarine sulcuis. V2 forms two non-mirror image patches (blue) dorsally andventrally. Two more areas are visible ven-tral and anterior to ventral V2: mirror im-age VP (yellow) and, finally, non-mirrorimage V4v (blue).
In Fig. 3, the cortex has been completelyflattened, exposing the dorsal and lateralareas concealed in Fig. 2. Dorsal V2 is ad-joined anteriorly by a thin band of mirrorimage V3 (yellow). Just ventral and anteriorto V3 the visual field sign pattern degener-ates into noise near the center-of-galze rep-resentations of Vi and V2, likely the resultof the difficulty of mapping foveal cortex
with this technique (20). Dorsal and ante-rior to V3 there are additional non-mirrorimage areas (blue) containing both upperand lower visual field representations thatmay correspond in part to V3A (V3 acces-sory) and dorsal V4 (not labeled). Evenfurther anteriorly, areas are less obviouslymodulated at the stimulus rotation or dila-tion-contraction frequency, indicating thatthey are either foveal (<0.50), peripheral(>120), or less well organized retinotopi-cally. Similar results were obtained from sixother individuals.
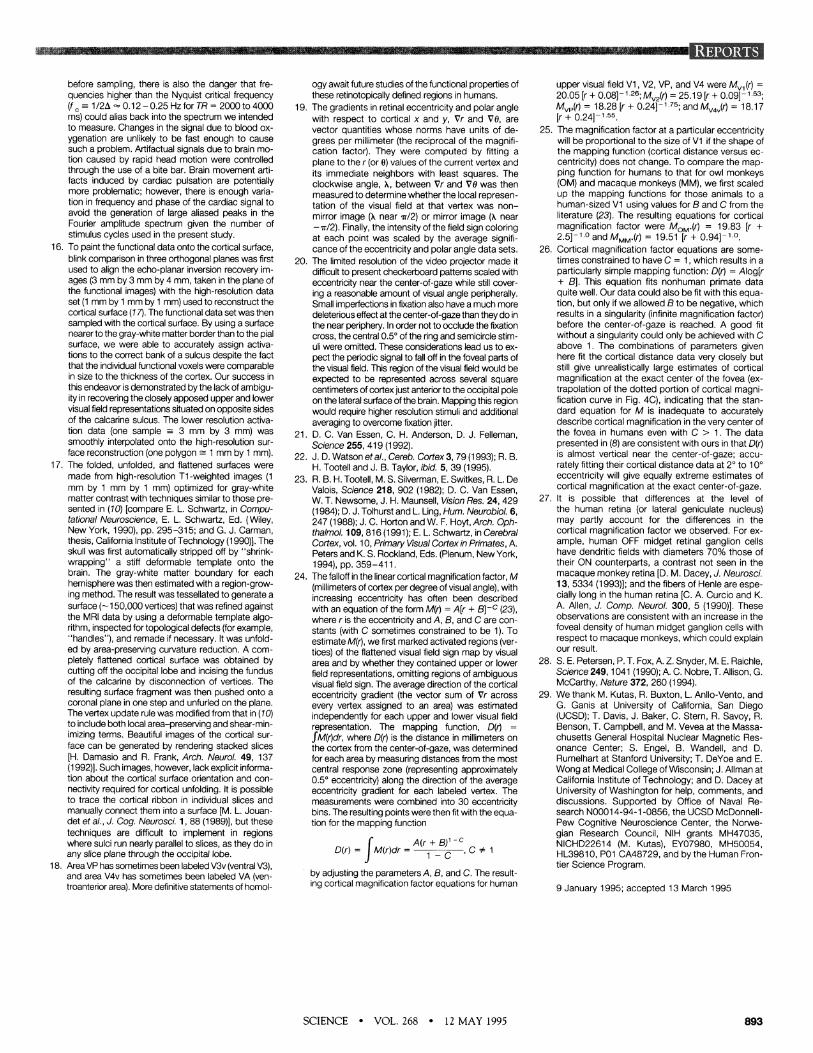
The areas revealed in these experimentsshow a number of similarities to areas originally discovered in nonhuman primates. Aschematic comparison of the human visualareas with imacaque monkey visual areas(21 ) and owl monkey visual areas (7) isshown in Fig. 4. At the top, the threeflattened cortices are drawn at the sameabsolute scale, whereas at the bottom, they{are approximately scaled by the area of V1.It has long been known that V1 in hlumansis shifted medially around the occipital polewhen comnpared with the location of V1 inmonkeys. The larger size of some human-extrastriate areas relative to humnan V1 mayhave partially comipensated for this shift
Fig. 4. Schematic summa-ry of retinotopic visual ar- Aeas in the owl monkey (7),the macaque monkey (21), 1 cm 1cm cm
and the human (present j cmstudy) at the same scale _ y(A) and approximately nor-malized by the area of V1 _ Owl(B). (Human Vi is twice the monkeyarea of macaque V1, withlarger ocular dominancecolumns and cytochromeoxidase blobs, but a similar Macaquenumber of cells.) Visual ar- Human monkeyeas in humans show aclose resemblance to visu-al areas originally defined B 1 cm i c
cm ~ ~~~cmin monkeys. The anterior 2border of the visual cortexin humans was estimated _ -by using the superior temporal sulcus and intrapari-etal sulcus as landmarks.In (C), the mapping func- -tions (heavy lines; scale is V2 -on the left axis) and magni-fication factor functions(light lines; scale is on the Human Macaque Owlright axis) are shown for - C monkey monkeythe upper field representa 45HV2Va V4 F 45,tions of human V1, V2, VP,
mM 3
and V4 (24). The V1 map- X 40 30Oping functions for owl , Emonkeys (OM*, dotted) X 201 15_and macaque monkeys f 0 -= ----_--= 0o(MM*, dashed) shown at <0 0 4 8 12 0 4 8 12 0 4 8 12 0 4 8 12(MM*,dashed)shown at c)Eccentricity (egree)the left were scaled up tomatch the overall size of human V1 (25). An increased emphasis on the center-of-gaze in human V1 isevident. CMF, cortical magnification factor.
SCIENCE * VOL. 268 * 12 MAY 1995 8
ROMENE
891

[see for example the width of VP in Fig. 4Band the region between V2 and MT in(22)]; retinotopic areas extend nearly to theanterior-posterior midpoint of the ventraltemporal lobe, just as they do in nonhumanprimates. The anterior extent of retinotopicvisual areas is most striking in the unfoldedventral view (Fig. 3D). Comparisons withthe folded ventral view (Fig. 3C) show thatmore cortex is hidden in the posterior foldsof the ventral occipital lobe than in themore anterior ventral temporal fissures.
The internal structure of a visual corticalmap can be characterized with the linearcortical magnification factor, M(r), millime-ters of cortex per degree of visual angle as afunction of eccentricity, r (23). We estimat-ed the value of the parameters in a standardequation for magnification factor by measur-ing eccentricity on the cortical surface par-allel to the average direction of fastestchange of eccentricity in each upper andlower visual field representation describedabove. The resulting measurements were fitwith a cortical mapping function, D(r) [thedistance on the cortex as a function of ec-centricity (the integral of the magnificationfactor equation)] by adjusting the parameters(24). Figure 4C shows the data and estimat-ed mapping functions (points and heavylines) and corresponding cortical magnifica-tion factor functions (light lines) for theupper field representations in human visualareas V1, V2, VP, and V4v.
Human visual areas show a prominentemphasis on central vision, as reflected inthe steepness of the mapping function,which corresponds to a large cortical magni-fication factor near the center-of-gaze. Tocompare these results with those from non-human primates, we first scaled the mappingfunctions for macaque monkey and owlmonkey V1 to compensate for the differenc-es in the overall size of V1 (human V1 isapproximately twice the area of macaque V1and about six times the area of owl monkeyV1) (25). The resulting scaled mappingfunctions are shown in the leftmost graph inFig. 4C. The macaque (dashed) and owlmonkey (dotted) curves are considerably lesssteep than the human curve, indicating thathuman visual areas have an extreme empha-sis on the center-of-gaze, surpassing that seennot only in the nocturnal owl monkey butalso that in the diurnal macaque monkey(26). It remains to be seen whether this willbe explained by an increased emphasis onthe center-of-gaze in the retina, in the reti-nogeniculocortical projection, or in both(27). Much has been made of the changes inareas beyond the primary cortex in humansin comparison with nonhuman primates. It isnow apparent that the human primary visualcortex is distinct as well.
These studies of retinotopy in humansprovide a framework for understanding the
892
results of experiments designed to examinecortical responses to more complex andmeaningful stimuli such as pictures, words,scenes, and sentences. It is interesting tonote that several of the foci identified inprevious noninvasive and invasive studiesof responses to complex stimuli such aswords (28) may overlap retinotopically or-ganized areas already known from nonhu-man primates. The techniques used herecould be adapted to map tonotopy and am-plitopy in the auditory cortex and somato-topy in the somatosensory cortex.
REFERENCES AND NOTES
1. M. I. Sereno and J. M. Allman, in The Neural Basis ofVisual Function, A. G. Leventhal, Ed. (Macmillan,London, 1991), pp. 160-172; J. H. Kaas and L. A.Krubitzer, Neuroanatomy of Visual Pathways andtheir Retinotopic Organization, B. Dreher and S. R.Robinson, Eds. (Macmillan, London, 1991), pp. 302-359; D. J. Felleman and D. C. Van Essen, Cereb.Cortex 1, 1 (1991); M. G. P. Rosa, J. G. Soares, M.Fiorani Jr., R. Gattass, Visual Neurosci. 10, 827(1993).
2. D. C. Van Essen and S. M. Zeki, J. Physiol. (London)277,193 (1978); D. C. Van Essen and J. H. Maunsell,J. Comp. Neurol. 191, 255 (1980).
3. R. Gattass, A. P. B. Sousa, C. G. Gross, J. Neurosci.8,1831 (1988).
4. R. B. Tootell, M. S. Silverman, R. L. De Valois, Sci-ence 214, 813 (1981); C. G. Cusick, H. J. Gould, J.H. Kaas, J. Comp. Neurol. 230, 311 (1984); R. B. H.Tootell, S. L. Hamilton, M. S. Silverman, J. Neurosci.5,2786 (1985); J. Olavarria and R. C. Van Sluyters, J.Neurosci. Methods 15, 191 (1985); L. A. Krubitzerand J. H. Kaas, Visual Neurosci. 5, 165 (1990).
5. P. T. Fox, F. M. Miezin, J. M. Allman, D. C. VanEssen, M. E. Raichle, J. Neurosci. 7, 913 (1987); S.Zeki et al., ibid. 11, 641 (1991); W. Schneider, D. C.Noll, J. D. Cohen, Nature 365, 150 (1993).
6. W. T. Newsome, J. H. R. Maunsell, D. C. Van Essen,J. Comp. Neurol. 252,129 (1986); D. J. Felleman, J.J. Knienm, D. C. Van Essen, Soc. Neurosci. Abstr.12,1182 (1986); R. Desimone and L. G. Ungerleider,J. Comp. Neurol. 248,164 (1986); D. R. Boussaoud,R. Desimone, L. G. Ungerleider, ibid. 306, 554(1991); S. Neuenschwander, R. Gattass, A. P. B.Sousa, M. C. G. P. PiRon, ibid. 340, 65 (1994).
7. M. I. Sereno, C. T. McDonald, J. M. Aliman, Cereb.Cortex 4, 601 (1994); Cereb. Cortex, in press.
8. S. A. Engel et al., Nature 369, 525 (1994); E. A.DeYoe, P. Bandettini, J. Neitz, D. Miller, P. Winans, J.Neurosci. Methods 54, 171 (1994).
9. J. W. Belliveau et al., Science 254, 716 (1991); K. K.Kwong et al., Proc. Natl. Acad. Sci. U.S.A. 89, 5675(1992).
10. A. M. Dale and M. I. Sereno, J. Cog. Neurosci. 5,162(1993).
11. Echo-planar images were collected on a 1 .5-T scan-ner (GE Signa) with full-body gradient coils (Ad-vanced NMR) by using an asymmetric spin echosequence [AT (offset time) = - 25 ms, TE (echo time)= 70 ms, TR (repetition time) = 3000 to 4000 ms] [G.L. Wismer et al., J. Comp. Assist. Tomogr. 12, 259(1988); J. R. Baker et al., Proc. Soc. Mag. Reson.Med., 12, 1400 (1993); R. B. H. Tootell et al., J.Neurosci., in press]. A 5-inch receive-only surfaceradio frequency (RF) coil or a receive-only wrap RFcoil was positioned near the occipital pole. Eight to16 contiguous oblique 4-mm slices (voxel size: 3 mmby 3 mm by 4 mm) were chosen to lie approximatelyperpendicular to the calcarine sulcus. Before andafter the set of functional scans for a participant, werecorded a T1 -weighted series of echo-planar imag-es [spin echo inversion recovery sequence: TE = 40ms, TI (inversion time) = 1050 ms, TR = 20,000 ms,NEX (number of extations) = 2] with the same ori-entation, slice thickness, and field of view as thefunctional scans. We used the T1 series to align thefunctional scans with the higher resolution structural
SCIENCE * VOL. 268 * 12 MAY 1995
scan (voxel size: 1 mm by 1 mm by 1 mm) used forsurface reconstruction that were collected in a sep-arate session with a head coil.
12. The visual stimuli were generated in real time on aSilicon Graphics Onyx computer with GL graphicslibrary functions. The high-resolution red green blue(RGB) video output signal was subsampled and con-verted to a composite video signal that was used todrive a Sony 2000 color liquid crystal display (LCD)projector. Informed consent to these experimentswas obtained from the participants, several of whomwere also authors (M.I.S., A.M.D., R.B.H.T.). Supineparticipants looked up into an adjustable angled mir-ror that allowed them to comfortably view a frostedback-projection screen arranged perpendicular tothe bore just below their chin. Residual head move-ments were controlled through the use of a dentalimpression bite bar made before the scan for eachparticipant and supported by an adjustable plasticyoke. Care was taken to block the participant's di-rect view of the screen. Participants were given theopportunity to take ibuprofen (200 to 600 mg) beforethe scan as a prophylactic against the minor discom-forts that typically accompany attempts to remainvery still for extended periods of time. Images wereprojected onto the screen through a collimating lensand subtended a maximum visual angle 35° wideand 260 tall. Stimuli consisted of black and whitecheckerboard patterns counterphase flickering at 4Hz (that is, one cycle consists of 1/8 s of black and1/8 s of white), which is near the optimal temporalfrequency for driving cortical neurons [(5); K. H. Fos-ter, J. P. Gaska, M. Nagler, D. A. Pollen, J. Physiol.365, 331 (1985)]. The checkerboard patterns werescaled with eccentricity. These patterns stimulated acircle in the visual field with a radius of 1 0° to 1 3. Thering and hemifield stimuli were designed to activateapproximately half of the ganglion cells in the central1 0° to 130 of the two retinae at any one point in time.
13. The time series of activation (across the 128 imagesof each slice) was examined on a pixel-by-pixel ba-sis. The linear trend and baseline offset for each pixeltime series was first removed by subtracting off a linefitted through the data by least squares. The discreteFourier transform of the time series for each pixelwas then computed to give 128 complex values. Inretinotopically organized areas, the amplitude spec-trum showed a sharp peak at the stimulus rotation ordilation-contraction frequency (-0.015 Hz) 5 to 30times as large as the peaks at other frequencies. Thephase angle of the response at the stimulus rotation(or dilation-contraction) frequency at a voxel is relat-ed to the polar angle (or eccentricity) representedthere. The phase angles for the pixels in a slice werethen corrected to take account of delays resultingfrom the known order in which the slices were col-lected (1, 3, 5... .2, 4, 6... .). Finally, the phase an-gles were mapped to different hues whose intensitywas a function of the ratio between the amplitude atthe stimulus frequency and the average amplitude ofall other frequencies (this ratio can reach 25 to 30 inV1). Our basic procedure is closely related to corre-lation of the signal with a sinusoid [compare P. A.Bandettini et al., Magn. Reson. Med. 25, 390 (1992);P. A. Bandettini, A. Jesmanowicz, E. C. Wong, J. S.Hyde, ibid. 30, 161 (1993)].
14. In general, the phase of the periodic response will bedelayed because of a finite vascular response time.The basic stimulus frequency was low enough sothat there was no whole-cycle phase ambiguity. Re-sidual phase delays were canceled by consideringthe circular average of the phase angles obtained foropposite directions of stimulus motion (contractionversus expansion, clockwise versus counterclock-wise) at each voxel after the phase angles for theopposite stimulus direction were reflected around 0.
15. We rejected scans in which substantial movement(-2 mm) had occurred. This was easily recognizedby viewing animations of the 128 images for eachslice. Nevertheless, even in the presence of suchmovements, a sharp peak at the basic stimulus fre-quency ( 0.015 Hz) was usually larger than the low-er frequency peaks due to movement. Note that wehave discretely sampled a continuous function: theintensity of a given voxel over time. Because thatsignal has not been explicitly limited in bandwidth
REEMEM 1 MMORNEWM EERIM-MWM
before sampling, there is also the danger that fre-quencies higher than the Nyquist critical frequency(f c-1/2A 0.12-0.25HzforTR=2000to4000ms) could alias back into the spectrum we intendedto measure. Changes in the signal due to blood ox-ygenation are unlikely to be fast enough to causesuch a problem. Artifactual signals due to brain mo-tion caused by rapid head motion were controlledthrough the use of a bite bar. Brain movement arti-facts induced by cardiac pulsation are potentiallymore problematic; however, there is enough varia-tion in frequency and phase of the cardiac signal toavoid the generation of large aliased peaks in theFourier amplitude spectrum given the number ofstimulus cycles used in the present study.
16. To paint the functional data onto the cortical surface,blink comparison in three orthogonal planes was firstused to align the echo-planar inversion recovery im-ages (3 mm by 3 mm by 4 mm, taken in the plane ofthe functional images) with the high-resolution dataset (1 mm by 1 mm by 1 mm) used to reconstruct thecortical surface (17). The functional data set was thensampled with the cortical surface. By using a surfacenearer to the gray-white matter border than to the pialsurface, we were able to accurately assign activa-tions to the correct bank of a sulcus despite the factthat the individual functional voxels were comparablein size to the thickness of the cortex. Our success inthis endeavor is demonstrated by the lack of ambigu-ity in recovering the closely apposed upper and lowervisual field representations situated on opposite sidesof the calcarine sulcus. The lower resolution activa-tion data (one sample 3 mm by 3 mm) wassmoothly interpolated onto the high-resolution sur-face reconstruction (one polygon 1 mm by 1 mm).
17. The folded, unfolded, and flattened surfaces weremade from high-resolution T1-weighted images (1mm by 1 mm by 1 mm) optimized for gray-whitematter contrast with techniques similar to those pre-sented in (10) [compare E. L. Schwartz, in Compu-tational Neuroscience, E. L. Schwartz, Ed. (Wiley,New York, 1990), pp. 295-315; and G. J. Carman,thesis, California Institute of Technology (1990)]. Theskull was first automatically stripped off by "shrink-wrapping' a stiff deformable template onto thebrain. The gray-white matter boundary for eachhemisphere was then estimated with a region-grow-ing method. The result was tessellated to generate asurface ( 150,000 vertices) that was refined againstthe MRI data by using a deformable template algo-rithm, inspected for topological defects (for example,"handles"), and remade if necessary. It was unfold-ed by area-preserving curvature reduction. A com-pletely flattened cortical surface was obtained bycutting off the occipital lobe and incising the fundusof the calcarine by disconnection of vertices. Theresulting surface fragment was then pushed onto acoronal plane in one step and unfurled on the plane.The vertex update rule was modified from that in (10)to include both local area-preserving and shear-min-imizing terms. Beautiful images of the cortical sur-face can be generated by rendering stacked slices[H. Damasio and R. Frank, Arch. Neurol. 49, 137(1992)]. Such images, however, lack explicit informa-tion about the cortical surface orientation and con-nectivity required for cortical unfolding. It is possibleto trace the cortical ribbon in individual slices andmanually connect them into a surface [M. L. Jouan-det et al., J. Cog. Neurosci. 1, 88 (1989)], but thesetechniques are difficult to implement in regionswhere sulci run nearly parallel to slices, as they do inany slice plane through the occipital lobe.
18. Area VP has sometimes been labeled V3v (ventral V3),and area V4v has sometimes been labeled VA (ven-troanterior area). More definitive statements of homol-
ogy await future studies of the functional properties ofthese retinotopically defined regions in humans.
19. The gradients in retinal eccentricity and polar anglewith respect to cortical x and y, Vr and VO, arevector quantities whose norms have units of de-grees per millimeter (the reciprocal of the magnifi-cation factor). They were computed by fitting aplane to the r (or 0) values of the current vertex andits immediate neighbors with least squares. Theclockwise angle, X, between Vr and VO was thenmeasured to determine whether the local represen-tation of the visual field at that vertex was non-mirror image (X near ir/2) or mirror image (X near-7r/2). Finally, the intensity of the field sign coloringat each point was scaled by the average signifi-cance of the eccentricity and polar angle data sets.
20. The limited resolution of the video projector made itdifficult to present checkerboard patterns scaled witheccentricity near the center-of-gaze while still cover-ing a reasonable amount of visual angle peripherally.Small imperfections in fixation also have a much moredeleterious effect at the center-of-gaze than they do inthe near periphery. In order not to occlude the fixationcross, the central 0.50 of the ring and semicircle stim-uli were omitted. These considerations lead us to ex-pect the periodic signal to fall off in the foveal parts ofthe visual field. This region of the visual field would beexpected to be represented across several squarecentimeters of cortex just anterior to the occipital poleon the lateral surface of the brain. Mapping this regionwould require higher resolution stimuli and additionalaveraging to overcome fixation jitter.
21. D. C. Van Essen, C. H. Anderson, D. J. Felleman,Science 255, 419 (1992).
22. J. D. Watson et al., Cereb. Cortex 3, 79 (1993); R. B.H. Tootell and J. B. Taylor, ibid. 5, 39 (1995).
23. R. B. H. Tootell, M. S. Silverman, E. Switkes, R. L. DeValois, Science 218, 902 (1982); D. C. Van Essen,W. T. Newsome, J. H. Maunsell, Vision Res. 24,429(1984); D. J. Tolhurst and L. Ling, Hum. Neurobiol. 6,247 (1988); J. C. Horton and W. F. Hoyt, Arch. Oph-thalmol. 109, 816 (1991); E. L. Schwartz, in CerebralCortex, vol. 10, Primary Visual Cortex in Primates, A.Peters and K. S. Rockland, Eds. (Plenum, New York,1994), pp. 359-41 1.
24. The falloff in the linear cortical magnification factor, M(millimeters of cortex per degree of visual angle), withincreasing eccentricity has often been describedwith an equation of the form M(r) = A[r + B]-c (23),where r is the eccentricity and A, B, and C are con-stants (with C sometimes constrained to be 1). Toestimate M(r), we first marked activated regions (ver-tices) of the flattened visual field sign map by visualarea and by whether they contained upper or lowerfield representations, omitting regions of ambiguousvisual field sign. The average direction of the corticaleccentricity gradient (the vector sum of Vr acrossevery vertex assigned to an area) was estimatedindependently for each upper and lower visual fieldrepresentation. The mapping function, D(r) =
fM(r)dr, where D(r) is the distance in millimeters onthe cortex from the center-of-gaze, was determinedfor each area by measuring distances from the mostcentral response zone (representing approximately0.50 eccentricity) along the direction of the averageeccentricity gradient for each labeled vertex. Themeasurements were combined into 30 eccentricitybins. The resulting points were then fit with the equa-tion for the mapping function
D(r) JM(r)dr i-A(r+ B)' cC 1
by adjusting the parameters A, B, and C. The result-ing cortical magnification factor equations for human
upper visual field V1, V2, VP, and V4 were Mv, (r) =20.05 [r + 0.08]- 1 26; Mv2(r) = 25.19 [r + 0.09]-1 53;Mvp(r) = 18.28 [r + 0.24]-1 75; and Mv4v(r) = 18.17[r + 0.24]-1 55.
25. The magnification factor at a particular eccentricitywill be proportional to the size of V1 if the shape ofthe mapping function (cortical distance versus ec-centricity) does not change. To compare the map-ping function for humans to that for owl monkeys(OM) and macaque monkeys (MM), we first scaledup the mapping functions for those animals to ahuman-sized V1 using values for B and C from theliterature (23). The resulting equations for corticalmagnification factor were MOM.(r) = 19.83 [r +2.5] 0 and MMM.(r) = 19.51 [r + 0.94] 1.0.
26. Cortical magnification factor equations are some-times constrained to have C = 1, which results in aparticularly simple mapping function: D(r) = Alog[r+ B]. This equation fits nonhuman primate dataquite well. Our data could also be fit with this equa-tion, but only if we allowed B to be negative, whichresults in a singularity (infinite magnification factor)before the center-of-gaze is reached. A good fitwithout a singularity could only be achieved with Cabove 1. The combinations of parameters givenhere fit the cortical distance data very closely butstill give unrealistically large estimates of corticalmagnification at the exact center of the fovea (ex-trapolation of the dotted portion of cortical magni-fication curve in Fig. 4C), indicating that the stan-dard equation for M is inadequate to accuratelydescribe cortical magnification in the very center ofthe fovea in humans even with C > 1. The datapresented in (8) are consistent with ours in that D(r)is almost vertical near the center-of-gaze; accu-rately fitting their cortical distance data at 20 to 100eccentricity will give equally extreme estimates ofcortical magnification at the exact center-of-gaze.
27. It is possible that differences at the level ofthe human retina (or lateral geniculate nucleus)may partly account for the differences in thecortical magnification factor we observed. For ex-ample, human OFF midget retinal ganglion cellshave dendritic fields with diameters 70% those oftheir ON counterparts, a contrast not seen in themacaque monkey retina [D. M. Dacey, J. Neurosci.13, 5334 (1993)]; and the fibers of Henle are espe-cially long in the human retina [C. A. Curcio and K.A. Allen, J. Comp. Neurol. 300, 5 (1990)]. Theseobservations are consistent with an increase in thefoveal density of human midget ganglion cells withrespect to macaque monkeys, which could explainour result.
28. S. E. Petersen, P. T. Fox, A. Z. Snyder, M. E. Raichle,Science 249,1041 (1990); A. C. Nobre, T. Allison, G.McCarthy, Nature 372, 260 (1994).
29. We thank M. Kutas, R. Buxton, L. AnIlo-Vento, andG. Ganis at University of California, San Diego(UCSD); T. Davis, J. Baker, C. Stern, R. Savoy, R.Benson, T. Campbell, and M. Vevea at the Massa-chusetts General Hospital Nuclear Magnetic Res-onance Center; S. Engel, B. Wandell, and D.Rumelhart at Stanford University; T. DeYoe and E.Wong at Medical College of Wisconsin; J. Allman atCalifornia Institute of Technology; and D. Dacey atUniversity of Washington for help, comments, anddiscussions. Supported by Office of Naval Re-search N00014-94-1-0856, the UCSD McDonnell-Pew Cognitive Neuroscience Center, the Norwe-gian Research Council, NIH grants MH47035,NICHD22614 (M. Kutas), EY07980, MH50054,HL3981 0, P01 CA48729, and by the Human Fron-tier Science Program.
9 January 1995; accepted 13 March 1995
SCIENCE * VOL. 268 * 12 MAY 1995 893

S £
BRAIN MAPPING
Researchers Get a SharperImage of the Human BrainTo the neuroscientist, the human brain isanything but crystal clear. Although neuro-scientists are anxious to see it in action, theycan't use the invasive methods that are avail-able for other species. As a result, althoughresearchers have been able to produce de-tailed maps ofbrain areas that perform particu-lar functions in primates such as the macaquemonkey, they haven't been able to duplicatethat knowledge for the human brain.
Now, aided by a set of new brain imagingtechniques, Martin Sereno and Anders Daleof the University of California, San Diego,with Roger Tootell's group at the Massachu-setts General Hospital Nuclear MagneticResonance Center in Charlestown have, forthe first time, mapped with a precision simi-lar to that achieved in monkeys the areas ofthe human brain that process visual images(see p. 889). "I consider this to be a veryimportant study," says neuroscientist DavidVan Essen of Washington University in St.Louis, a leader in mapping the monkey's vi-sual cortex. "It gives us significant new infor-mation about the organization of visual areasin the human cortex."
That new information supports what someresearchers have suspected for a while-thatthe human visual areas identified so far seemto follow the same basic organization as thoseof monkeys, although they differ in size andposition. By clearly defining the borders ofthese areas, this study has opened the way forresearchers to ask whether those areas whoselineage can be traced back to monkeys have,during the course of evolution, taken on newand distinctly human functions, such asthose necessary for language, or whethersuch functions are instead handled in areasunique to human brains. The techniques,which so far have been applied only to thevisual cortex, are also likely to prove usefulfor identifying and mapping brain areas thatprocess other types of sensory information,such as hearing or touch.
Until now, most human brain-mappingwork has used a noninvasive techniquecalled positron emission tomography (PET),which detects the changes in blood flow thataccompany increased activity in specificbrain regions. By making PET images of aperson's brain while that person performs amental task, PET can locate the brain areasinvolved in the task. PET has helped re-searchers identify visual areas that respond tocolor or motion and those that participate inrecognizing written words.
Those revelations constituted a major
advance, but they were a far cry from thedetailed visual maps available for animalbrains. A PET study that localizes a certainvisual function, such as word recognition, toa particular fold in the cerebral cortex is a bitlike a spy-satellite photo that reveals a mis-sile base on a hill. Without a detailed mapthat shows that hill's location relative to na-tional borders, you still don't know who ownsthe missile base.
Lighting up. The colored areas show the hu-man visual cortex responding to visual images.Red marks the center and also the periphery ofthe visual field.
Neurobiologists needed better maps thatprecisely locate the borders of the humanvisual areas. Such maps had been made ofmonkey brains by painstaking experimentsin which researchers inserted electrodes intothe monkeys' brains and recorded the activ-ity of neurons at many locations while im-ages were flashed before the monkeys' eyes.This, along with studies of brain structureand neural connections, enabled researchersto find more than 30 visual areas in the mon-key brain, each of which analyzes informa-tion corresponding to particular features, suchas shape, color, or movement, then passes theinformation to other areas. In many areas,each neuron responds to signals coming onlyfrom a specific part of the retina, resulting ina "retinotopic map," in which each positionin the visual area represents a position in thevisual world. With the detail provided byretinotopic maps, researchers were able todefine the borders of the visual areas.
Sereno and his colleagues set out to makecomparable maps of the human brain, but
SCIENCE * VOL. 268 * 12 MAY 1995
they realized that several technical hurdleshad to be overcome. The first was finding away to take snapshots of brain activity de-tailed enough to construct a retinotopicmap. For that task they turned to a brainimaging method developed in the early1990s, called functional magnetic resonanceimaging (fMRI), that not only has better spa-tial resolution than PET, but is also muchfaster, enabling researchers to take thou-sands of images in less than 10 minutes.
That speed, coupled with a clever trickcalled "phase encoding," developed by StephenEngel, a postdoc with neuroscientist BrianWandell at Stanford University, enabled theSereno team to get enough data to map aperson's visual areas in a matter of minutes.Phase encoding involves sweeping an imageacross the subject's field of view, in cycleslasting a minute, and tracking the responsewith fMRI images of the subject's brain. Ar-eas with retinotopic maps stand out, Serenosays, because "at each spot you see activitiesthat are going up and down every minute.The phase of that oscillating activity thentells you what visual field location is repre-sented at that spot."
But getting the images was only half thechallenge. The team next faced a compli-cated version of the old mapmaker's prob-lem: how to accurately project a map of arounded object-such as Earth or a brain-onto a flat surface. Without a way to flattenthe cortex, says Washington University'sVan Essen, "we would be hopelessly tangledtrying to wind our way through [the data]."But flattening a convoluted brain surface isa very difficult problem. Van Essen andother monkey researchers developed manualmethods that Van Essen calls "tedious andnot terribly accurate" and too cumbersometo apply to the much more convoluted hu-man brain; In the past few years, however,several groups have devised computer algo-rithms that can flatten human as well asmonkey brains. Sereno's group used one de-veloped by Sereno and Dale, who is now atthe University of Oslo in Norway.
This new bag of tricks has so far enabledthe Sereno group to map five visual areas inthe human brain that process informationthat has been received and passed along bythe primary visual cortex. Based on the posi-tions and other characteristics of these areas,the team concluded that they are counter-parts of visual areas found in monkeys. Oth-ers who have seen the data agree. "It looksjust like the monkey brain," says LeslieUngerleider, who does brain mapping inmonkeys and humans at the National Insti-tute of Mental Health. Ungerleider says thatis what she expected, but that "it was done insuch a convincing and elegant way that ... itjust blows you away."
In unpublished work, a team led by EdgarDeYoe of the Medical College of Wisconsin
803
al '.1. WIL doom*" -P-.'Emy15 -8 Wil; M 1-1m

in Milwaukee and George Carman of theSalk Institute has used similar methods tomap human visual areas. And DeYoe says"we get pretty much the same topographyand mapping" as Sereno's group.
Despite the striking similarity between thehuman and monkey visual areas, the studiesalso revealed salient differences. The humanareas are shifted in position along the brain'ssurface and are larger than their monkey-brain counterparts. Specifically, the centersof the human areas are expanded, with moreneurons devoted to processing images at thecenter of a person's gaze. That suggests hu-mans place a premium on getting detailedinformation from whatever they are lookingat, a trait, Sereno notes, that "would be quitehelpful for things like reading."
The methods pioneered by the Sereno
and DeYoe groups may help answer a hotquestion: Do functions that are uniquely hu-man, such as the recognition of writtenwords, take place in areas unique to humanbrains or in areas present in monkey brainsthat have taken on new functions in hu-mans? Sereno thinks his data suggest an an-
swer for at least one case. His team's studyplaces the human version of a visual area
called V4, known in monkeys to discern formand color, very close to an area that PETstudies have linked to word recognition."That [word recognition] area could in partbe V4," says Sereno. But Richard Frackowiakof Hammersmith Hospital in London, whohas done PET studies of word recognition,draws the opposite conclusion from Sereno'sdata-namely, that the word recognitionarea is separate from V4 and uniquely hu-
man. That ambiguity, says Van Essen, may
arise from "comparing analyses with differenttechniques and different individuals."
Washington University neuroscientist Ste-ven Petersen, who does brain mapping withPET, says that the final resolution ofambigu-ous cases such as this may come from new ex-
periments that first use fMRI to "map out theregions [in an individual subject], then bringthe person back and have them do a bunch ofword-recognition and color-discriminationtasks" to place those functions directly on thatperson's individual map. For this and otherquestions, adds Van Essen, "we now have thetools right at hand for a much more refinedset of analyses." And with those tools, re-
searchers will find that their window into thebrain has achieved a new level of clarity.
-Marcia Barinaga
MEASUREMENT STANDARDS
Keeping the Kilo From Gaining WeightThe French are known for their finesse inmany areas of life, and British physicists are
finding that the reputation holds in the ar-
cane realm of weights and measures as well.For years, a specialist named Georges Girardlabored unrecognized at the heart of the in-ternational metric system at the Bureau In-ternational des Poids et Mesures (BIPM)near Paris, keeping the standard kilogramfrom picking up contaminants-and henceweight. His tools: nothing more than a
chamois cloth, a bottle of cleaning fluid, andthat old je ne sais quoi. Now Girard has re-
tired, and Martin Seah and Peter Cumpsonat the U.K.'s National Physical Laboratory inTeddington near London are hoping that a
regimen of ozone and ultraviolet light can
match his deftness in keeping the standardkilogram, well-standard.
The curators of the kilogram, a platinum-iridium cylinder kept at the BIPM, say theyare eager to test the British scheme. For themoment, they are still trying to keep thekilogram clean by hand-polishing it. But as
the keepers of the only standard of measure-ment still based on an object rather than ona fundamental physical quantity-time, forexample, is set by a specific frequency of ra-
diation-they are eager to find ways to main-tain the standard that rely more on scienceand less on one man's skillful fingers.
Thought to have been made in the early1880s by a Paris instrument-maker, the 4-centimeter-high, 4-centimeter-wide cylin-der is the prototype for reference kilo-grams in national laboratories throughoutthe world. These standard kilograms-exactcopies of the French original-ultimately tieall mass-measuring systems back to the BIPMstandard. But over the last decade or so, im-proved balances have shown that the refer-ence kilogram and its duplicates vary in
804
weight. "We have been measuring the differ-ences between these apparently similar arti-facts, and we see they are drifting apart," says
Terry Quinn, director of the BIPM. Theweight of a freshly minted copy of the stan-dard mass, says Cumpson, "increases by tensof micrograms in the first few weeks aftermanufacture."
The explanation for this unwanted weightgain, say Seah and Cumpson, is contami-nants accumulating on the metal surface.Through spectroscopic analysis ofthe surfaceof replica kilograms, they have found thatthe platinum-iridium alloy picks up hydro-carbons from air pollution and other sources,
That special touch. Georges Girard uses achamois cloth to polish contamination from thesurface of a standard kilogram replica.
along with mercury vapor from laboratoryinstruments. Every so often, explains Cump-son, an instrument breaks, releasing "a verysubtle presence ofmercury-well below healthand safety levels-but enough to adsorb ontothe surface of the reference kilogram."
Girard was able to keep the hydrocarbonbuildup in check by rubbing the surface witha chamois cloth dipped in a mixture ofultrapure ethanol and ether; a hand-directedsteam jet then removed any residue. The
SCIENCE * VOL. 268 * 12 MAY 1995
cleaned mass "returned to [within] a few mi-crograms of where it was originally," saysCumpson. "He used just the right degree ofabrasion to remove the carbonaceous con-tamination without removing metal."
Cumpson believes that Girard's tech-nique probably didn't remove the mercury,which worked its way into the grain structureof the metal. Still, it was better than anyother standards laboratory could manage,even though a videotape of Girard at workpolishing the kilogram was circulated amongthem. Scientists from the U.S. National In-stitute of Standards and Technology and thePhysikalisch-Technische Bundesanstalt, theGerman standards institute, even flew toParis to watch him up close and personal, butto no avail. "It's almost impossible to get theright degree of pressure," says Cumpson.
Now, with Girard's retirement 2 yearsago, the BIPM faces the same dilemma. ButCumpson and Seah think they've come upwith an answer: Expose the kilogram toozone and ultraviolet light to oxidize thehydrocarbon contaminants, freeing themto diffuse away into thin air. "The tech-nique looks very promising," says Cump-son. "There's no contact with the mass at all,and the concentrations we use are low," sothere's little risk of oxidizing and damagingthe kilogram itself.
BIPM Director Quinn is intrigued. "Weshall be working with them to assess whatthey've found," he says. He also hopes totry out the cleaning technique on some ofthe laboratory's own platinum-iridium testobjects. But the laboratory isn't rushinginto anything. "We may not know exactlyhow the old process works," he says, "but wedon't want to change until we know how todo it better."
-Sally Croft
Sally Croft is a science writer in Bristol, U.K.
1: l.m iiiiialmilwiii
Related Documents