BOQ Group – 2015 Half Year Results Bank of Queensland Limited ABN 32 009 656 740. AFSL No. 244616. BOQ GROUP 2015 HALF YEAR RESULTS Incorporating the requirements of Appendix 4D This half year results announcement incorporates the Consolidated Interim Financial Report given to the Australian Securities Exchange (ASX) under Listing Rule 4.2A

Welcome message from author
This document is posted to help you gain knowledge. Please leave a comment to let me know what you think about it! Share it to your friends and learn new things together.
Transcript

BOQ Group – 2015 Half Year Results
1
BOQ Group – 2015 Half Year Results
Bank of Queensland Limited ABN 32 009 656 740. AFSL No. 244616.
BOQ GROUP2015 HALF YEAR RESULTS
Incorporating the requirements of Appendix 4D
This half year results announcement incorporates the Consolidated Interim Financial Report given to the Australian Securities Exchange (ASX) under Listing Rule 4.2A

2
BOQ Group – 2015 Half Year ResultsBOQ Group – 2015 Half Year Results
ASX APPENDIX 4D For the half year period ended 28 February 2015
RESULTS FOR ANNOUNCEMENT TO THE MARKET (1)
$m
Revenues from ordinary activities (2) Up 20% to 537
Profit from ordinary activities after tax attributable to members (2) Up 14% to 154
Profit for the period attributable to members (2) Up 14% to 154
(1) Rule 4.2A.3. Refer to Appendix 6.1 for the cross reference index for ASX Appendix 4D.
(2) On prior corresponding period (six months ended 28 February 2014).

BOQ Group – 2015 Half Year Results
3
BOQ Group – 2015 Half Year Results
CONTENTS
1 ASX ANNOUNCEMENT 4
2 HIGHLIGHTS & STRATEGY 8
2.1 DISCLOSURE CONSIDERATIONS 8
2.2 GROUP HIGHLIGHTS 9
2.3 STRATEGY 11
3 GROUP PERFORMANCE ANALYSIS 12
3.1 INCOME STATEMENT & KEY METRICS 12
3.2 BOQ SPECIALIST 14
3.3 NET INTEREST INCOME 16
3.4 NON-INTEREST INCOME 17
3.5 INSURANCE OVERVIEW 17
3.6 OPERATING EXPENSES 18
3.7 LENDING 19
4 BUSINESS SETTINGS 21
4.1 ASSET QUALITY 21
4.2 FUNDING AND LIQUIDITY 26
4.3 CAPITAL MANAGEMENT 29
4.4 TAXATION 29
5 CONSOLIDATED INTERIM FINANCIAL REPORT 30
6 APPENDICES 52
4
BOQ Group – 2015 Half Year Results
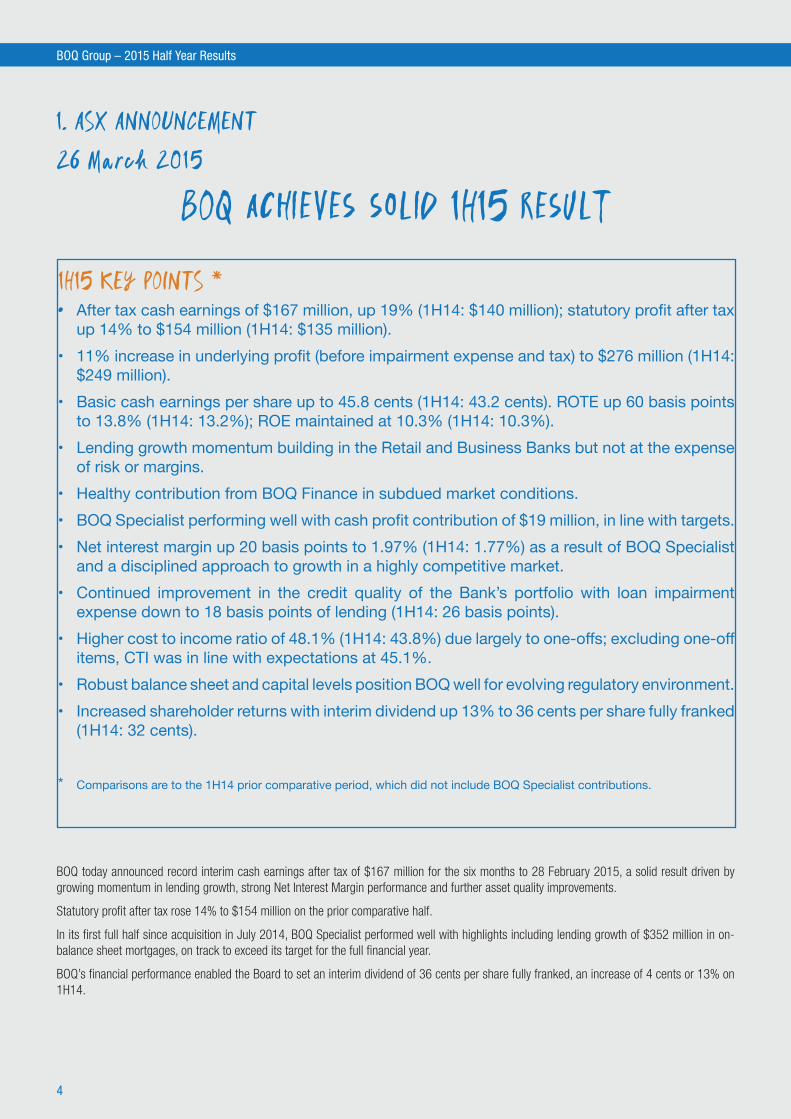
BOQ achieves solid 1H15 result
1H15 KEY POINTS *• �After�tax�cash�earnings�of�$167�million,�up�19%�(1H14:�$140�million);�statutory�profit�after�tax�
up 14% to $154 million (1H14: $135 million).•� �11%�increase�in�underlying�profit�(before�impairment�expense�and�tax)�to�$276�million�(1H14:�
$249�million).•� �Basic�cash�earnings�per�share�up�to�45.8�cents�(1H14:�43.2�cents).�ROTE�up�60�basis�points�
to�13.8%�(1H14:�13.2%);�ROE�maintained�at�10.3%�(1H14:�10.3%).•� �Lending�growth�momentum�building�in�the�Retail�and�Business�Banks�but�not�at�the�expense�
of�risk�or�margins.•� Healthy�contribution�from�BOQ�Finance�in�subdued�market�conditions.�•� BOQ�Specialist�performing�well�with�cash�profit�contribution�of�$19�million,�in�line�with�targets.�•� �Net�interest�margin�up�20�basis�points�to�1.97%�(1H14:�1.77%)�as�a�result�of�BOQ�Specialist�
and�a�disciplined�approach�to�growth�in�a�highly�competitive�market.�•� �Continued� improvement� in� the� credit� quality� of� the� Bank’s� portfolio� with� loan� impairment�
expense�down�to�18�basis�points�of�lending�(1H14:�26�basis�points).•� �Higher�cost�to�income�ratio�of�48.1%�(1H14:�43.8%)�due�largely�to�one-offs;�excluding�one-off�
items,�CTI�was�in�line�with�expectations�at�45.1%.•� Robust�balance�sheet�and�capital�levels�position�BOQ�well�for�evolving�regulatory�environment.•� �Increased�shareholder�returns�with�interim�dividend�up�13%�to�36�cents�per�share�fully�franked�
(1H14:�32�cents).
* �Comparisons�are�to�the�1H14�prior�comparative�period,�which�did�not�include�BOQ�Specialist�contributions.
BOQ today announced record interim cash earnings after tax of $167 million for the six months to 28 February 2015, a solid result driven by growing momentum in lending growth, strong Net Interest Margin performance and further asset quality improvements.
Statutory profit after tax rose 14% to $154 million on the prior comparative half.
In its first full half since acquisition in July 2014, BOQ Specialist performed well with highlights including lending growth of $352 million in on-balance sheet mortgages, on track to exceed its target for the full financial year.
BOQ’s financial performance enabled the Board to set an interim dividend of 36 cents per share fully franked, an increase of 4 cents or 13% on 1H14.
1. ASX ANNOUNCEMENT26 MARCH 2015

BOQ Group – 2015 Half Year Results
5
STEADY EXECUTION OF STRATEGY Managing Director and CEO Jon Sutton said the result showed BOQ was continuing to make steady progress in delivering its strategy.
“What you see today is a bank that has come a long way in recent years. Strong foundations are now in place and we’re well into building a Bank that is lower risk, lower volatility, and set up for sustainable growth,” he said.
“This is another solid result which represents a record half year profit for BOQ. I am particularly pleased to see lending growth improve while the Bank’s risk settings, margins, balance sheet and capital position are all strengthening.”
On a cash basis, BOQ’s basic earnings per share were up 6% on the prior half to 45.8 cents, return on average tangible equity increased 60 basis points to 13.8%, and return on average equity was stable at 10.3%.
Other key highlights for the half included:
LENDING GROWTH RETURNING TOWARDS SYSTEMLending growth headed back towards system levels as a result of the strategic initiatives BOQ has implemented in recent years, including expansion of the mortgage broker channel and investment in the Business Bank’s presence and capabilities.
Retail lending grew at an annualised 6% to $27.3 billion over the February half with $813 million underlying growth. The housing book saw increased diversification with 57% of applications originating from outside of Queensland, largely driven by the broker channel which contributed $420 million of loan growth and accounted for 14% of settlements.
Commercial lending balances continued to exceed system levels, growing by an annualised 10% over the six months to $8.0 billion. A greater presence in New South Wales, Victoria and Western Australia saw the geographic concentration of the portfolio in Queensland reduce further.
In its first full half of contribution, BOQ Specialist’s contribution to lending growth exceeded expectations delivering $352 million in on-balance sheet mortgages while maintaining margins and credit quality across the portfolio.
BOQ Finance grew by an annualised 6% over the half to $4.0 billion. This was a healthy result against an industry backdrop of lower volumes due to a slowdown in plant and equipment investment in the broader economy.
“While it was pleasing to see genuine growth momentum across each of our businesses, it was equally important that this wasn’t at the expense of our risk fundamentals or margins,” Mr Sutton said.
“We believe we can continue to drive growth through our existing strategy especially when you consider we’re still below our peers’ market share in the broker channel and we have further upside through BOQ Specialist, as well as Virgin Money Australia, where we expect to launch mortgages within 12 months.”
MARGIN INCREASED IN A COMPETITIVE MARKETDespite a highly competitive market, the Bank’s Net Interest Margin rose 20 basis points from February 2014 to 1.97% due to an 11 basis point increase from BOQ Specialist as well as ongoing pricing discipline.
“While the market remains incredibly competitive, both in business and home lending, we are growing our book without compromising asset quality or cutting pricing to the bone,” Mr Sutton said.
“Even with BOQ Specialist’s contribution, this is a very good performance given market conditions.”

6
BOQ Group – 2015 Half Year Results
CAPITAL AND FUNDING STRENGTH During the half, BOQ continued to strengthen its balance sheet, creating a sustainable funding profile that is able to support growth and deliver internal capital generation.
Fitch Ratings’ decision in November 2014 to lift its long-term credit rating from BBB+ to A- followed similar upgrades from other ratings agencies. These changes have improved access to long-term wholesale funding markets and allowed the Bank to actively manage its funding profile by diversifying composition and increasing duration, while reducing cost.
BOQ’s Common Equity Tier 1 ratio increased 19 basis points to 8.82% during the half. The Bank’s capital position remains the highest of Australia’s regional and major banks based on Standard and Poor’s risk-adjusted capital approach, positioning it well given the evolving domestic and global regulatory environment.
HIGHER COSTS DUE TO BOQ SPECIALIST AND ONE-OFFSCost to Income (CTI) ratio for the half increased to 48.1% due to the inclusion of BOQ Specialist for the entire period as well as one-off costs (property costs and CRM impairment expenses) already flagged to the market. Excluding BOQ Specialist, underlying expense growth was 3% annualised from 2H14.
FURTHER IMPROVEMENT IN ASSET QUALITY & RISK MANAGEMENTThe underlying credit quality of the Bank’s portfolio continued to improve in 1H15, reflecting improved credit management practices, favourable realisations in the commercial portfolio and the continuation of Australia’s low interest rate environment.
Total loan impairment expense was down 22% on prior comparative period to $36 million (1H14: $46 million). Total impaired assets across retail, commercial and BOQ Finance fell 13% to $259 million (1H14: $298 million).
“Balance sheet and capital strength is an absolute non-negotiable for BOQ and this result sees further improvement in key metrics with impaired asset levels and bad and doubtful debts both continuing to fall.” Mr Sutton said.
BOQ POSITIONED WELL FOR THE FUTURE Mr Sutton said BOQ remained focused on successfully delivering its strategic priorities which were aimed at building sustainable financial performance, consistent growth in returns to shareholders and superior service to customers and the wider community.
More broadly, Mr Sutton said the outlook for the national economy remained uncertain over the short to medium term.
“The economy is currently running at a pace below its long-run trend and, while there are some positive factors emerging, any sustained improvement will require a pick-up in consumer and business confidence,” he said.
Mr Sutton said BOQ’s balance sheet and capital levels continued to position it well amidst market uncertainty around global and domestic regulatory environments.
“At this stage, no-one can accurately predict the outcome of the Basel Committee and Financial System Inquiry processes,” he said.
“Given our robust comparative capital position, we are very comfortable with our position and ability to adjust to any new regulatory requirements.
“We continue to wholeheartedly support the findings of the Financial System Inquiry’s final report and urge the Federal Government and regulators to move quickly to create a more level playing field.”

BOQ Group – 2015 Half Year Results
7
RESULTS WEBCAST DETAILSA briefing covering BOQ’s 1H15 results will be held at the Museum of Sydney’s AGL Theatre at 11am AEDST (10:00am Brisbane) today.
BRIEFINGVenue: Museum of Sydney, AGL Theatre
Address: Corner of Bridge Street and Phillip Street, Sydney
TELECONFERENCEDial-in number (Australia): 1800 725 000
Dial-in number (International): +61 2 8373 3610
Conference ID: 3687407
Webcast address: http://edge.media-server.com/m/p/cctnx63e
ENDSMedia Contact Analyst Contact
Jamin Smith, Head of Media Relations Daniel Ryan, Head of Investor Relations
T: 07 3212 3018 M: 0478 333 316 T: 07 3212 3990 M: 0421 757 926
8
BOQ Group – 2015 Half Year Results
2. HIGHLIGHTS & STRATEGY 2.1 DISCLOSURE CONSIDERATIONSChanges to Financial Reporting
This reporting period reflects the first full 6 month contribution for BOQ Specialist since acquisition in July 2014. Section 3.2 provides further details of the contribution for the half.
Note on Statutory Profit and Cash Earnings
Statutory Profit is prepared in accordance with the Corporations Act 2001 and the Australian Accounting Standards, which comply with International Financial Reporting Standards (“IFRS”). The Cash Earnings provided is used by Management to present a clear view of the Bank’s underlying operating results. This excludes a number of items that introduce volatility and / or one-off distortions of the Bank’s current period performance, and allows for a more effective comparison of the Bank’s performance across reporting periods. Refer to 6.2 (a) and 6.2 (b) of the Appendices for the reconciliation of Statutory Profit to Cash Earnings.
Figures disclosed in this report are on a Cash Earnings basis unless stated as Statutory basis. Unless otherwise stated, all financial comparisons in this document refer to the prior half (to 31 August 2014) and the prior comparative period (to 28 February 2014).
These non-statutory measures have not been subject to review or audit.
Future performance
This presentation contains certain “forward looking statements”. Forward looking statements can generally be identified by the use of forward looking words such as “anticipate”, “believe”, “expect”, “project”, “forecast”, “estimate”, “likely”, “intend”, “should”, “will”, “could”, “may”, “target”, “plan” and other similar expressions within the meaning of securities laws of applicable jurisdictions. The forward looking statements contained in this presentation involve known and unknown risks and uncertainties and other factors, many of which are beyond the control of BOQ, and may involve significant elements of subjective judgement as to future events which may or may not be correct.
There can be no assurance that actual outcomes will not differ materially from these forward looking statements.
Rounding
In accordance with applicable financial reporting regulations and current industry practices all amounts in this report have been rounded off to the nearest one million dollars, unless otherwise stated.

BOQ Group – 2015 Half Year Results
9
2.2 GROUP HIGHLIGHTS
1H13 2H13 1H14 2H14
Cash Earnings after Tax ($m)
140131120
161
1H15
167
1H13 2H13 1H14 2H14
Statutory Profit after Tax ($m)
135
85101
126
1H15
154
Dividend per share (cents)
1H13 2H13 1H14 2H14
2830
32 34
1H15
36
Cash Basic Earnings per Share (EPS) (cents)
1H13 2H13 1H14 2H14
4137
4346
1H15
46
1H13 2H13 1H14 2H14
Cash Net Interest Margin (NIM) (%)
1.661.72
1.77 1.85
1H15
1.86
0.020.11
BOQ Specialist
1.971.87
1H13 2H13 1H14 2H14
Cash Cost to Income (%)
44.7 43.9 43.842.4
1H15
44.0
Property & CRM Impairment
1.1
3.0
BOQ Specialist
43.9
48.1
1.40.1
Return on Average Tangible Equity (ROTE) (%)
1H13 2H13 1H14 2H14
12.311.6
13.2 13.2
1H15
13.8
UP 19% UP 14%
UP 20bps UP 430bps
UP 6%UP 13%
Return on Average Equity (ROE) (%)
1H13 2H13 1H14 2H14
9.79.2
10.3 10.4
1H15
10.3
Flat UP 60bps

10
BOQ Group – 2015 Half Year Results
2.2 GROUP HIGHLIGHTS (CONTINUED)
CASH EARNINGS $167 millionIncreased by 19% on the prior corresponding period, including first full period of BOQ Specialist contribution
NET INTEREST MARGIN 1.97%Up 20 bps on the prior corresponding period reflecting rebasing for the addition of BOQ Specialist, deposit pricing initiatives and improved wholesale funding markets
CASH COST TO INCOME RATIO 48.1%Underlying annualised cost growth of 3% on the last reported half(1). Underlying Cost / Income ratio rebased at 45% for the Group post acquisition in FY15
LOAN IMPAIRMENT EXPENSE $36 millionDown 8 bps from prior corresponding half to 18 bps of lending
IMPAIRED ASSETS $259 millionReduced $34 million (12%) in the half
COMMON EQUITY TIER 1 8.82%Increased 19bps in the half with organic capital generated supporting asset growth
LENDING GROWTH In line with System at 7%. Growth momentum in new channels through “Customer In Charge” strategy
(1) Excluding the impact of BOQ Specialist and one off costs during the half.
BOQ’s performance in the first half reflects a continuation of the strong trends witnessed in 2014 with Cash Earnings increasing 19% from the prior corresponding half year to $167 million. We continue to make good progress in delivering the strategy, building a more streamlined and lower risk organisation with sustainable income streams based on the Bank’s “Customer in Charge” approach.
This is the first full reporting period with a contribution from BOQ Specialist which was acquired in July 2014. The Net Profit After Tax contribution of $19 million was in line with full year maintainable earnings guidance of $38 million provided on announcement of the acquisition. BOQ Specialist is delivering its strategy in providing specialised banking solutions to professional market sectors. The initiative to offer on-balance sheet mortgages to BOQ Specialist customers is performing ahead of targets and is expected to deliver enhanced earnings growth for this business in future periods.
The addition of the higher margin BOQ Specialist business has also rebased Net Interest Margin at a higher level of 1.97%, an increase of 10 basis points on the last half. BOQ Specialist contributed 9 basis points while recent ratings upgrades from Standard Poor’s, Moody’s and Fitch to the A- equivalent category have allowed us to actively manage our retail and wholesale deposit mix for both margin and diversity.
The Cost to Income ratio increased to 48%, though this was impacted by one-off costs. The pilot Customer Relationship Management (CRM) System was impaired for $10 million this half, whilst premises consolidation costs of $6 million were incurred. Excluding these one-offs and the first full period of BOQ Specialist, underlying expense growth was 3% annualised from the prior half and we are on target to transition to a 45% Cost Income ratio in the second half for the expanded Group. We are continuing the journey of substantial system re-investment to move to a digitised business which will provide a platform to deliver productivity and efficiency benefits, and drive future growth.
Lending growth was in line with APRA system credit growth of 7% as we gained further traction with our ‘Customer in Charge’ strategy by widening the channels our customers can deal with us. The Broker channel provided 14% of settlements in the half, BOQ Specialist is building a pipeline of business through its new on-balance sheet mortgage offering and BOQ Business continues to grow ahead of system growth through its targeted customer acquisition strategy. The branch network saw further lending growth whilst reducing concentration in lower quality lending sectors, including line of credit exposures.
Portfolio credit quality improvement was evidenced in further reductions in loan impairment expense and further declines in impaired asset levels, which were down 12% over the half. Underlying credit quality continues to improve with the low interest rate environment, but also as a result of the efforts undertaken in revising risk appetite and embedding heightened risk management strategies. Some seasonal increases in arrears occurred towards the end of the reporting period, particularly in the equipment finance portfolio.
We successfully transitioned to the new APS 210 Liquidity framework which improved the composition of our liquid asset portfolio and enabled us to manage a Liquidity Coverage Ratio within the target management range. Deposit ratios have been maintained whilst we termed out our long-term wholesale funding profile deepening the Bank’s funding diversity. The Common Equity Tier 1 ratio increased 19 basis points over the half to 8.82%, positioning the business well for future lending growth.
In line with the strong performance this half, the Board has determined to pay an interim dividend of 36 cents per share fully franked, an increase of 4 cents per share on the prior corresponding period.

BOQ Group – 2015 Half Year Results
11
2.3 STRATEGYBOQ is a full service financial institution, listed on the Australian Securities Exchange (“ASX”), regulated by the Australian Prudential Regulation Authority as an authorised deposit-taking institution (“ADI”) and ranked among the top 100 companies by market capitalisation on the ASX.
We have grown from being the first Permanent Building Society in Queensland in 1874 to the current day with a network of retail branches, and other points of presence spanning every state and territory in Australia.
Our brand positioning “It’s Possible to Love a Bank” builds on our long established reputation for superior customer service and supports the Bank’s strategic direction, customer proposition and internal cultural transformation. As a challenger bank, our flexibility and responsiveness to customer needs are paramount and our focus on this area complements the progress we are making under the Bank’s four strategic pillars – putting the customer in charge; growing the right way; finding a better way; and being loved like no other – and contributes to future growth.
In terms of Customer in Charge, we are continuing to expand our source of originations through entry into the mortgage broker market as well as improvements to mobile banking, call centre, online and social media. We have continued expanding our mortgage broker distribution network with accredited brokers servicing customers in New South Wales, Victoria, Western Australia, South Australia and, recently, our home state of Queensland.
Our acquisition of Investec Bank (Australia) Limited’s Professional Finance and Asset Finance & Leasing businesses was completed in July 2014. This compelling opportunity gives us access to a high net worth and quality customer base in specialist market niches (primarily medical, dental and accounting professionals). The Professional Finance Business was renamed ‘BOQ Specialist’ and operates as a separate division of our Business Bank, while Asset Finance and Leasing became part of BOQ Finance.
In our Retail network, a new balanced scorecard is being introduced for Owner Managed Branches. The new scorecard balances lending, deposits, cross sales and compliance components and is aimed at providing greater alignment between the interests of Owner Managers and the Bank. The new scorecard has formed the basis of a new standardised franchise agreement which is being rolled out. There is also significant work underway to optimise branch mix and locations.
To Grow the Right Way and achieve the right balance of return for risk taken, we continue to diversify our balance sheet by pursuing higher margin and return on equity segments in Business Banking and Agribusiness. In Business Banking, a tiered approach to origination through our distribution channels has been embedded to reflect deal complexity. A behavioural scorecard for assessing mortgage originations was introduced reflecting our new risk appetite framework. Business mix changes reflecting a core focus on credit quality were evident across the retail portfolio, with the concentration of poorer performing line of credit mortgages being substantially reduced.
There’s Always a Better Way, which is the pursuit of operational excellence, has seen continued back office consolidation and a focus on removing administrative tasks from branches. We continue to improve processes and systems, particularly to reduce the turnaround time on compliant retail and business lending applications. This year, we will look to further simplify the product suite to reinvigorate our customer offerings. A good example of this approach is our simple low cost mortgage offering ‘Clear Path’, launched in September 2013, which has performed particularly strongly.
Loved Like No Other is about building a culture that makes BOQ a great place to work and that supports an outcome where our customers love dealing with us. The major brand refresh around “It’s Possible to Love a Bank” resulted in an increase in national unprompted awareness of our brand. We have seen an increase in our Net Promoter Scores from 16.1% in August 2014 to 24.4% in February 2015 which demonstrates strong satisfaction.
Through continued focus on our four strategic pillars, we aim to deliver robust and sustainable financial performance, consistent growth in returns to shareholders and superior service to our customers and the wider community.

12
BOQ Group – 2015 Half Year Results
3. GROUP PERFORMANCE ANALYSIS3.1 INCOME STATEMENT & KEY METRICS (1)
$ million
Half Year PerformanceFeb 15 vs
Aug 14Feb 15 vs
Feb 14Feb-15 Aug-14 Feb-14
Net Interest Income 448 399 362 12% 24%
Non-Interest Income 84 87 82 (3%) 2%
Total Income 532 486 444 9% 20%
Operating Expenses (256) (213) (195) 20% 31%
Underlying Profit 276 273 249 1% 11%
Loan Impairment Expense (36) (40) (46) (10%) (22%)
Profit before Tax 240 233 203 3% 18%
Income Tax Expense (73) (72) (63) 1% 16%
Cash Earnings after Tax 167 161 140 4% 19%
Statutory Net Profit after Tax 154 126 135 22% 14%
Key Metrics
Half Year PerformanceFeb 15 vs
Aug 14Feb 15 vs
Feb 14Feb-15 Aug-14 Feb-14
Shareholder Returns
Share Price ($) 13.96 12.58 11.99 11% 16%
Market Capitalisation ($ million) 5,123 4,560 3,868 12% 32%
Dividends per share (fully franked) (cents) 36 34 32 6% 13%
Dividend yield (%) 5.20 5.36 5.38 (16bps) (18bps)
Grossed-up dividend yield (including franking) (%) 7.43 7.66 7.69 (23bps) (26bps)
Cash Earnings basis
Basic EPS (cents) 45.8 46.3 43.2 (1%) 6%
Diluted EPS (cents) 44.8 45.0 41.8 - 7%
Dividend payout ratio (%) 79.1 76.6 73.7 250bps 540bps
Statutory basis
Basic EPS (cents) 42.3 36.2 41.5 17% 2%
Diluted EPS (cents) 41.6 35.6 40.4 17% 3%
Dividend payout ratio (%) 85.8 97.8 76.5 large 930bps
(1) The half year performance for February 2015 reflects the first full half year results for BOQ Specialist acquired on 31 July 2014.

BOQ Group – 2015 Half Year Results
13
3.1 INCOME STATEMENT & KEY METRICS (CONTINUED) (1)
Key Metrics
Half Year PerformanceFeb 15 vs
Aug 14Feb 15 vs
Feb 14Feb-15 Aug-14 Feb-14
Profitability and efficiency measures
Cash Earnings basis
Net Profit After Tax ($ million) 167 161 140 4% 19%
Underlying Profit (2) ($ million) 276 273 249 1% 11%
Net Interest Margin (%) 1.97 1.87 1.77 10bps 20bps
Cost to Income Ratio (%) 48.1 43.9 43.8 420bps 430bps
Loan Impairment Expense to Gross Loans and Advances (“GLA”)
(bps) 18 22 26 (4bps) (8bps)
Return on Average Equity (%) 10.3 10.4 10.3 (10bps) -
Return on Average Tangible Equity (3) (%) 13.8 13.2 13.2 60bps 60bps
Statutory basis
Net Profit After Tax ($ million) 154 126 135 22% 14%
Underlying Profit (2) ($ million) 261 226 243 15% 7%
Net Interest Margin (%) 1.94 1.87 1.77 7bps 17bps
Cost to Income Ratio (%) 51.4 54.0 45.6 (260bps) 580bps
Loan Impairment Expense to GLA (bps) 18 22 26 (4bps) (8bps)
Return on Average Equity (%) 9.5 8.2 9.9 130bps (40bps)
Return on Average Tangible Equity (3) (%) 12.8 10.4 12.7 240bps 10bps
Asset Quality
30 days past due (“dpd”) Arrears ($ million) 533 456 527 17% 1%
90dpd Arrears ($ million) 259 221 272 17% (5%)
Impaired Assets ($ million) 259 293 298 (12%) (13%)
Specific Provisions to Impaired Assets (%) 51.9 52.1 50.5 (20bps) 140bps
Collective Provisions to Credit Risk Weighted Assets (%) 0.60 0.61 0.69 (1bps) (9bps)
Capital
Common Equity Tier 1 Ratio (%) 8.82 8.63 8.84 19bps (2bps)
Total Capital Adequacy Ratio (%) 12.03 12.02 12.41 1bps (38bps)
Risk Weighted Assets (“RWA”) ($ million) 26,057 25,032 21,718 4% 20%
(1) The half year performance for February 2015 reflects the first full half year results for BOQ Specialist acquired on 31 July 2014.(2) Profit before loan impairment expense and tax.(3) Based on after tax earnings applied to average shareholders’ equity (excluding preference shares and treasury shares) less goodwill and identifiable intangible assets.

14
BOQ Group – 2015 Half Year Results
3.2 BOQ SPECIALIST
(a) Income statementThe following analysis provides detail of the BOQ Specialist contribution to the Group result in the period. It also provides a view of underlying results excluding BOQ Specialist to allow a like for like comparison to prior periods.
$ million
Half Year Performance
Group Feb-15
BOQ Specialist
Feb-15
Group excluding
BOQ Specialist
Feb-15 Aug-14 Feb-14Feb 15 vs
Aug 14Feb 15 vs
Feb 14
Net Interest Income 448 61 387 390 362 (1%) 7%
Non-Interest Income 84 5 79 86 82 (8%) (4%)
Total Income 532 66 466 476 444 (2%) 5%
Operating Expenses (256) (35) (221) (208) (195) 6% 13%
Underlying Profit 276 31 245 268 249 (9%) (2%)
Loan Impairment Expense (36) (4) (32) (40) (46) (20%) (30%)
Profit before Tax 240 27 213 228 203 (7%) 5%
Income Tax Expense (73) (8) (65) (70) (63) (7%) 3%
Cash Earnings after Tax 167 19 148 158 140 (6%) 6%
(b) BOQ Specialist Financial PerformanceBOQ Specialist has made a solid contribution to the Group in its first full reporting period since acquisition. The business has driven strong loan growth of $476 million over the first half. The strategic focus on the new on-balance sheet residential mortgage offering has delivered $352 million of this growth and represents 74% of BOQ Specialist loan growth for the half. This is ahead of expectations at the date of acquisition for 50% of originations to be on-balance sheet on a run rate basis by the end of the financial year. Commercial lending growth of $113 million has also been achieved, which is a pleasing annualised growth rate of 11%, particularly as the BOQ Specialist business has a seasonally higher second half growth profile due to an end of tax year spike. BOQ Specialist continues to target niche customer segments in the health and medical profession and with professionals in the accounting industry. It benefits from the higher growth rates of these segments compared to the broader economy. Strong margins and credit quality have been maintained throughout this period.
The business is running at or ahead of targets outlined at the announcement of the acquisition with a half year cash earnings contribution of $19 million on track to deliver the full year maintainable earnings target of $38 million. The strategy to offer on-balance sheet mortgages to BOQ Specialist customers has come at a short term cost to earnings in the early phase of this initiative. The impact to the BOQ Specialist performance for the half year of the difference between the loss of upfront commissions previously received from third party banks on these mortgage originations, compared to the actual Net Interest Income earned, has approximated $1 million after tax. This strategy will deliver enhanced earnings growth for this business in future periods.

BOQ Group – 2015 Half Year Results
15
3.2 BOQ SPECIALIST (CONTINUED)
(c) Key Metrics Excluding Impact of BOQ Specialist The following analysis eliminates the impact of the BOQ Specialist acquisition and associated equity raising in the prior period on a proforma basis.
Key Metrics - Profitability and efficiency measures
Half Year Performance
Feb-15 Aug-14 Feb-14Feb 15 vs
Aug 14Feb 15 vs
Feb 14
Cash Earnings basis
Net Profit After Tax ($ million) 148 158 140 (6%) 6%
Underlying Profit ($ million) 245 268 249 (9%) (2%)
Net Interest Margin (%) 1.86 1.85 1.77 (1bps) 9bps
Cost to Income Ratio (%) 47.4 43.7 43.8 370bps 360bp
Loan Impairment Expense to Gross Loans and Advances (“GLA”) (bps) 18 22 26 (4bps) (8bps)
Return on Average Equity (%) 10.3 11.0 10.3 (70bps) -
Return on Average Tangible Equity (1) (%) 13.4 14.1 13.2 (70bps) 20bps
(1) Based on after tax earnings applied to average shareholders’ equity (excluding preference shares and treasury shares) less goodwill and identifiable intangible assets.
Excluding the acquisition of BOQ Specialist, Cash Net Profit after Tax of $148 million was a 6% increase on the prior corresponding period. Excluding the impact of the CRM impairment and one-off property transition costs of $11 million after tax in the half, Cash Earnings growth would have been 14%. This has predominantly been driven by the expansion in Net Interest Margin.
When comparing performance between the first and second half year periods there is a day count difference that needs to be considered, with the first half being 181 days and the second half 184 days. The day count difference equates to approximately $7 million of Net Interest Income, which if adjusted, together with the one-off expenses discussed above, demonstrates an underlying annualised growth rate in Cash Earnings after tax of 9%.

16
BOQ Group – 2015 Half Year Results
3.3 NET INTEREST INCOME
$ million
Half Year PerformanceFeb 15 vs
Aug 14Feb 15 vs
Feb 14Feb-15 Aug-14 Feb-14
Net Interest Income - excluding BOQ Specialist 387 390 362 (1%) 7%
Net Interest Income - including BOQ Specialist 448 399 362 12% 24%
Average Interest Earning Assets 45,924 42,418 41,371 8% 11%
Net Interest Margin 1.97% 1.87% 1.77% 10bps 20bps
Net Interest Income increased to $448 million, a 24% increase on the prior corresponding period. This included the BOQ Specialist contribution, representing 14% of the total result. Whilst competition in lending remains strong, we continue to actively manage our liability mix and reduced our reliance on higher cost, less stable segments of the retail deposit market. This has resulted in a relatively stable margin outcome compared to the last reported half year excluding the BOQ Specialist rebasing and one-off impacts. Net Interest Margin has increased by 20 basis points over the prior corresponding period, with 11bps of this increase reflecting the higher margins achieved in BOQ Specialist.
Average Interest Earning Assets
Average interest earning assets increased over the half as we gain traction in penetration of new channels and benefit from the contribution from BOQ Specialist’s new on-balance sheet mortgage offering (refer Section 6.5).
NET INTEREST MARGIN - AUGUST 2014 TO FEBRUARY 2015
• Net Interest Margin increased by 10bps to 1.97% for the half
Normalised Net Interest Margin improved 10bps over the half to 1.97%. Movement was attributed to a number of factors:
Asset Pricing & Mix: The reduction of 7bps over the half is due primarily to tighter new business pricing that reflects market pricing movements across the lending portfolio.
Funding Costs & Mix: 10bps improvement was driven by ongoing retail re-pricing initiatives and lower wholesale funding costs.
Capital and low cost deposits: The liquid asset “replicating portfolio” to manage the free funding benefit of capital and the spread on low cost deposits continues to decline in line with the movement in the yield curve. This had an impact of 3bps to Net Interest Margin. In addition, the prior half included a benefit from excess capital held post the capital raising prior to the BOQ Specialist acquisition.
BOQ Specialist: The benefit of a full half year earnings from higher spread business acquired through the acquisition of BOQ Specialist contributed 9bps improvement with 2bps of increase previously realised in the previous half.
Third Party Costs: Acquisition of BOQ Specialist has diluted the proportion of loans and deposits subject to third party commission distributions.
1.87%
2H14 Funding Costs and Mix
Capital and Low Cost Deposits
Third Party Costs (1)
1H15
0.31%
2.18%
Net Interest Margin Third Party Costs
0.09%
Asset Pricing and Mix (excluding BOQS)
BOQ Specialist
1.97%
2.27%
0.07% 0.10% 0.03% 0.01%0.30%
(1) Third party costs largely represent commissions to Owner Managers and brokers.

BOQ Group – 2015 Half Year Results
17
3.4 NON-INTEREST INCOME
$ million
Half Year PerformanceFeb 15 vs
Aug 14 Feb 15 vs
Feb 14Feb-15 Aug-14 Feb-14
Banking Income 51 50 47 2% 9%
Other Income 5 7 7 (29%) (29%)
Insurance Income 17 21 21 (19%) (19%)
Trading Income 10 9 7 11% 43%
Virgin Money (Australia) 1 - - n/a n/a
Total Non-Interest Income 84 87 82 (3%) 2%
The trend of customers switching to fee-free packaged products has continued this half with Banking Income relatively flat. The reduction in Other Income from the prior half periods reflects higher returns on joint venture investments in the prior period.
Virgin Money (Australia) (“VMA”) contributed $1 million profit before tax for the half. This result was driven by a strong performance in credit card margins, resulting in increased commissions received on the portfolio.
During the period we successfully managed the transition to the new APS 210 Liquidity standard. This resulted in a significant change in the composition of the liquid asset portfolio, with an increased weighting to higher quality assets such as government and semi government securities. Several key structural changes were introduced in the industry through this legislative change. These included requiring 31 days notice for customers to break term deposits (except in circumstances of hardship) and the introduction of the Reserve Bank of Australia’s Committed Liquidity Facility. As a result, the Bank’s absolute requirement to hold physical liquid assets reduced from the previous period. Profits were realised from some of these liquid assets when they were sold. As such, the Trading Income result should not be considered consistently repeatable.
The St Andrew’s result reduced by $4m over the prior corresponding period. This result is discussed in more detail in Section 3.5 below.
3.5 INSURANCE OVERVIEW
Half Year PerformanceFeb 15 vs
Aug 14Feb 15 vs
Feb 14$ million Feb-15 Aug-14 Feb-14
Gross Written Premium (net of refunds) 29 34 34 (15%) (15%)
Net Earned Premium 36 35 35 3% 3%
Underwriting Result 13 17 17 (24%) (24%)
Other Insurance Income 3 3 3 - -
Total Income 16 20 20 (20%) (20%)
Consolidation Adjustment 1 1 1 - -
Group Insurance Result 17 21 21 (19%) (19%)
St Andrew’s Insurance contributed $17 million to Non-Interest Income, a $4 million reduction from both the August half and the prior comparative period, resulting largely from higher than trend claims experience. In December 2014, St Andrew’s extended its Consumer Credit Insurance distribution partnership with Bankwest for a minimum of three years.
Underwriting margins reduced 24% due mostly to a number of larger life insurance claims at or above the business single claims retention cap, following a period during the prior two years in which claims were below long-term trend levels. Changes in the portfolio mix, including an increase in regular premium policies and a shift to direct to consumer channels are evident in the sales results, but had little impact on the underwriting result in the current period with this impact to emerge over the life of the policies (approximately 3 years coverage). Gross Written Premiums reduced 15% due to lower volume of single premium policies, a trend set to continue in coming periods. Sales of regular premium policies continued to increase in line with the strategy to diversify product revenue streams with increased sales of term life, funeral and involuntary unemployment insurance. Overall this resulted in an increase in Net Earned Premiums of 3%, however this was mostly offset by an increase in commissions reflecting the changing mix of business.

18
BOQ Group – 2015 Half Year Results
• 3% annualised increase in underlying costs from the prior half • One-off impacts - $10m impairment of pilot CRm system & $6m of property expenses
3.6 OPERATING EXPENSES
To provide a view of underlying expenses, the following graph breaks out the impact of BOQ Specialist’s full half contribution and the one-off impacts of impairments and property transition costs. As previously flagged, the integration of BOQ Specialist into the Group result will rebase the Group Cost to Income ratio, with the business on target to achieve an underlying ratio of 45% in the second half of 2015.
$ million
Half Year PerformanceFeb 15 vs
Aug 14 Feb 15 vs
Feb 14Feb-15 Aug-14 Feb-14
General Expenses 54 42 44 29% 23%
IT Expenses 40 40 39 - 3%
Occupancy Expenses 24 22 17 9% 41%
Employee Expenses 94 96 86 (2%) 9%
Other Expenses 9 8 9 13% -
Total Operating Expenses (1) 221 208 195 6% 13%
BOQ Specialist 35 5 - n/a n/a
Total Operating Expenses 256 213 195 20% 31%
Cost to Income Ratio (including BOQ Specialist) 48.1% 43.9% 43.8% 420bps 430bps
Cost to Income Ratio (excluding BOQ Specialist, CRM and Property) 44.0% 42.4% 43.8% 160bps 20bps
Number of employees (FTE) (1) 1,859 1,903 1,491 (2%) 25%
(1) FTE numbers and Operating Expenses exclude VMA as the net result is included in Non-Interest Income.
Operating Expenses increased by $43 million to $256 million for the half, primarily due to the inclusion of BOQ Specialist for the entire period. The Cost to Income (CTI) ratio increased to 48.1%, however this included the recognition of one-off costs and a rebasing of the underlying cost to income due to the inclusion of BOQ Specialist.
The pilot CRM system was fully impaired with an impact of $10 million (included in General Expenses) this half. The transition of the Brisbane and Sydney head offices, which have now been finalised, have resulted in $6 million of anticipated and non-recurring one-off costs. The inclusion of BOQ Specialist for the full six months contributed $30 million to the increase from the prior half.
Excluding the impacts of the acquisition and the one-off costs, the expense growth on the last reported half would have been 3% annualised.
Underlying expense growth has been contained in line with expectation notwithstanding the current high level of transformation activity being undertaken as we pursue our ‘There’s Always a Better Way’ strategy.
Employee expense stabilised over the period and FTE reduced as the branch network was rebalanced. IT expenses have also benefitted from a number of strategic contracts being renegotiated to improve efficiency of IT services across the Group.
The above Operating Expenses exclude costs relating to VMA where the net result has been consolidated in Non-Interest Income for presentation of Cash Earnings. The total expenses for VMA were $8 million for the half. A reconciliation of Cash Earnings to Statutory Profit is set out in Section 6.2 (b).
(1) Annualised.
1H14 1H15
3% Underlying Cost Growth (1)
205
35
6
10
Underlying Pre-acquisition
Expenses
BOQ Specialist Property CRM Impairment
195
195
256
202
5
6
213
5% Underlying Cost Growth
2H14

BOQ Group – 2015 Half Year Results
19
3.7 LENDINGThe Group continues to gain traction with its ‘Customer in Charge’ strategy and annualised growth for the half of 7% is in line with APRA System (January). The Broker channel contributed 14% of settlements for the half, an increase from 2% for the February 2014 half and this was a key contributor to improving growth towards system levels. We continue to evolve our branch network which continues to show a rise in average footings per branch while managing down exposures in higher risk areas (eg line of credit). Further, BOQ Specialist in its first full half of contribution, grew its portfolio by $476 million over the six months to $3 billion whilst maintaining margins and credit quality across the portfolio. The business launched its new on-balance sheet mortgage product in August 2014 and this provided $352 million of growth through leveraging the existing client base and new customer acquisition. BOQ Business continues to grow above system through its targeted customer acquisition strategy.
$ million
As at
Feb-15 Aug-14 Feb-14 Feb 15 vs Aug 14 (1)
Feb 15 vs Feb 14
Housing Lending - APRA on-balance sheet 24,504 23,548 22,970 8% 7%
Housing Lending - APS 120 qualifying securitisation (2) 2,818 2,961 3,130 (10%) (10%)
27,322 26,509 26,100 6% 5%
Housing Lending - BOQ Specialist 501 160 - n/a n/a
Commercial Lending (2) (3) 8,041 7,656 5,370 10% 50%
Commercial Lending - BOQ Specialist 2,120 2,007 - 11% n/a
BOQ Finance 4,029 3,919 3,660 6% 10%
BOQ Finance - BOQ Specialist 217 204 - 13% n/a
Consumer 334 342 168 (5%) 99%
Consumer - BOQ Specialist 189 180 - 10% n/a
Gross Loans and Advances 39,726 38,426 35,298 7% 13%
Specific and Collective Provisions (275) (290) (285) (10%) (4%)
Net Loans and Advances 39,451 38,136 35,013 7% 13%(1) Percentages have been annualised.(2) Securitised loans subject to capital relief under APRA Prudential Standard APS120 Securitisation. (3) In the prior reporting period $2.5 billion for BOQ Specialist was reported in Commercial Lending, this has now been allocated across the relevant businesses.
1H14 1H15
472
341
BOQ BOQ Specialist
(49)
813
248
248
GROWTH IN GROSS LOANS & ADVANCES GROWTH IN HOUSING ($M)
2H14
Growth rate (1) (0.4%) 1.9% 6.2%
System growth (1) (2) 6.0% 6.6% 7.4%
Growth vs System (2) n/a 0.3x 0.8x(1) Percentages have been annualised.(2) 1H15 represents latest available APRA system growth annualised for 5 months to January 2015.

20
BOQ Group – 2015 Half Year Results
3.7. LENDING (CONTINUED)HOUSING LENDING
Housing lending grew at an annualised 6% to $27.3 billion over the February half. Growth of $0.8 billion was offset by further reduced concentration in the line of credit portfolio of $0.3 billion.
The BOQ brand housing book experienced increasing diversification with 57% of applications being originated outside of Queensland this half. This was largely driven by our expanding broker channel which contributed $420 million of loan growth and accounted for 18% of applications. This half saw our expansion into the Queensland market with 285 accredited brokers which is supported by our strong brand resonance in our home state. We have also increased our broker footprint across the country with a total of 1,932 brokers nationally and remain on target to accredit 2,500 brokers by the end of the financial year.
1H14 1H15
97
13
BOQ BOQ Specialist
110
GROWTH IN COMMERCIAL & BOQ FINANCE ($M)
2H14
272
113
385
BOQ FinanceCommercial
55
8 (1)63
279
14 (1)
293
BOQ FinanceCommercial2
56
BOQ FinanceCommercial
Commercial BOQ Finance Commercial BOQ Finance Commercial BOQ Finance
Growth rate 2.1% - 11.0% 0.9% 10.1% 5.7%
System growth (2) (3) 2.5% 0.2% 5.3% (0.4%) 8.1% (2.8%)
Growth vs System (3) 0.8x n/a 2.1x n/a 1.2x n/a
(1) Growth from Acquisition for the month of August 2014(2) Percentages have been annualised.(3) Represents latest available APRA system growth - January 2015.
BOQ BUSINESS
Commercial lending balances grew by an annualised 10% over the six months to $8 billion. The first half saw a continued focus on penetration into New South Wales, Victoria and Western Australia with a further reduction in Queensland geographic concentration.
The Corporate and Business Banking strategy is based on differentiation through deep customer relationships, accessibility and nimble decisioning. A dedicated Subject Matter Expert specialist team has also been established to support SME customers managed through the branch network and improve performance of that portfolio which has been relatively stagnant since risk appetite was changed in 2012.
The BOQ Finance portfolio grew by an annualised 6% over the six months to $4 billion which is a strong result against an industry backdrop of lower volumes with a slowdown in plant and equipment investment in the broader economy. A number of larger vendor programs have been introduced over the half across the Vendor and Dealer businesses that should support growth in future periods.
BOQ Specialist annualised growth in the commercial portfolio of the Professional Finance business was 11%, which is consistent with expectations, particularly given the business traditionally has higher growth in the second half due to a seasonal spike in June.

BOQ Group – 2015 Half Year Results
21
4. BUSINESS SETTINGS4.1 ASSET QUALITY
Half Year PerformanceFeb 15 vs
Aug 14Feb 15 vs
Feb 14Feb-15 Aug-14 Feb-14
Loan Impairment Expense (1) ($ million) 36 40 46 (10%) (22%)
Loan Impairment Expense / GLA (1) bps 18 22 26 (4bps) (8bps)
Impaired Assets ($ million) 259 293 298 (12%) (13%)
30dpd Arrears ($ million) 533 456 527 17% 1%
90dpd Arrears ($ million) 259 221 272 17% (5%)
Collective Provision & General Reserve for Credit Losses (“GRCL”) / RWA
bps 99 100 108 (1bps) (9bps)
(1) The prior period includes one month’s loan impairment expense for BOQ Specialist.
The table above summarises the Bank’s key credit indicators with comparison against August 2014 and February 2014:
• Loan impairment expense has continued to improve, reflecting the improved credit management practices, favourable realisations in the commercial portfolio and benefits from the continued low interest rate environment. The first half loan impairment expense of $36 million or 18bps/GLA was a $4 million (4bps) improvement on the second half of 2014.
• Impaired assets reduced by $34 million (12%) over the half through favourable realisations in the retail and commercial portfolios. The realisations in the first half included our two largest impaired exposures at August 2014 as full recovery was achieved on these assets. One exposure greater than $5 million transitioned to impaired status in the first half of 2015, which is the only exposure greater than $5 million in the portfolio.
• Past due performance within all portfolios increased over the half reflecting second quarter seasonality, although 90 day arrears are tracking favourably compared to the prior year comparative periods, particularly in Commercial Lending, with the 30 day arrears marginally unfavourable.
• Collective provisioning has slightly increased over the half and we have maintained collective provisioning levels (inclusive of GRCL) at a premium relative to peers.
LOAN IMPAIRMENT EXPENSE
$ million
Half Year PerformanceFeb 15 vs
Aug 14 Feb 15 vs
Feb 14Feb-15 Aug-14 Feb-14
Expense by Product
Retail Lending 12 16 17 (25%) (29%)
Commercial Lending 7 10 21 (30%) (67%)
BOQ Finance 13 13 8 - 63%
BOQ Specialist (1) 4 1 - 300% n/a
Total 36 40 46 (10%) (22%)
Loan Impairment Expense / GLA (1) 18bps 22bps 26bps (4bps) (8bps)
• Lower impairment expense (18bps/GLAs) on prior reporting periods• Impaired asset reduction (12% this half) demonstrating further improvement in the credit quality of portfolio
(1) The prior period includes one month’s loan impairment expense for BOQ Specialist.
22
BOQ Group – 2015 Half Year Results
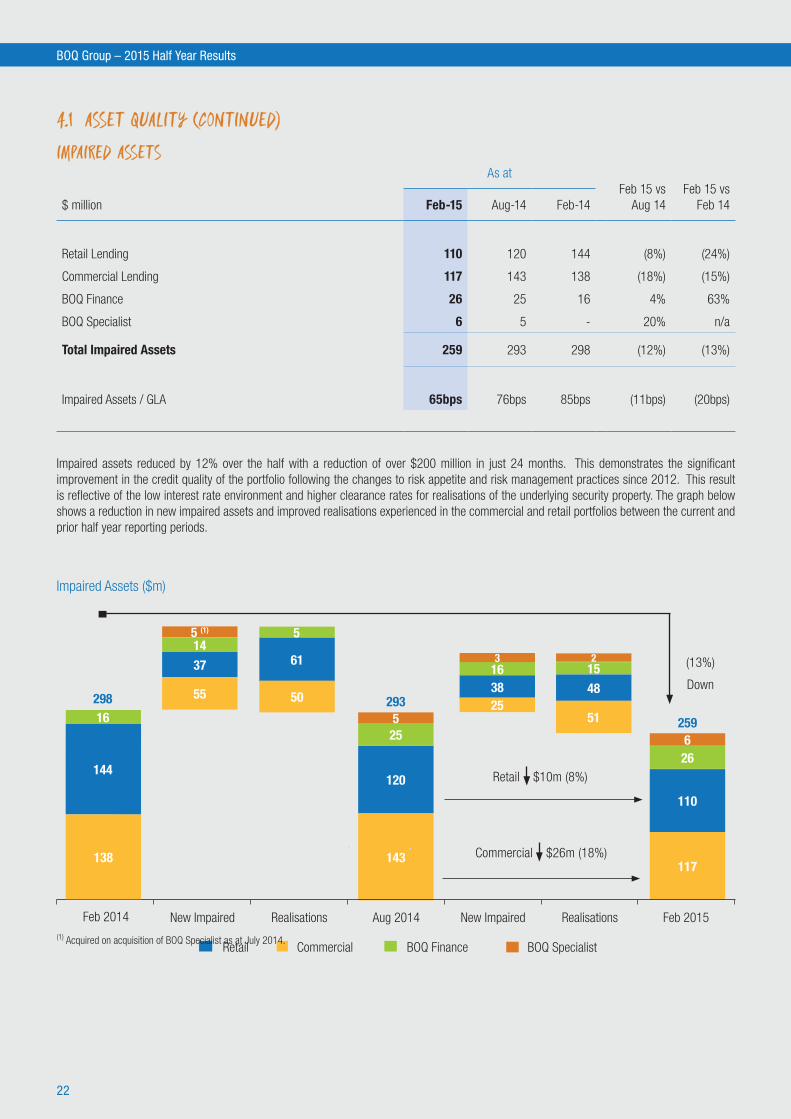
4.1 ASSET QUALITY (CONTINUED)
IMPAIRED ASSETS
$ million
As at Feb 15 vs
Aug 14
Feb 15 vs
Feb 14Feb-15 Aug-14 Feb-14
Retail Lending 110 120 144 (8%) (24%)
Commercial Lending 117 143 138 (18%) (15%)
BOQ Finance 26 25 16 4% 63%
BOQ Specialist 6 5 - 20% n/a
Total Impaired Assets 259 293 298 (12%) (13%)
Impaired Assets / GLA 65bps 76bps 85bps (11bps) (20bps)
Impaired assets reduced by 12% over the half with a reduction of over $200 million in just 24 months. This demonstrates the significant improvement in the credit quality of the portfolio following the changes to risk appetite and risk management practices since 2012. This result is reflective of the low interest rate environment and higher clearance rates for realisations of the underlying security property. The graph below shows a reduction in new impaired assets and improved realisations experienced in the commercial and retail portfolios between the current and prior half year reporting periods.
Impaired Assets ($m)
117
110
26
259
New Impaired Realisations Aug 2014 New Impaired Realisations Feb 2015
144
16298
143
120
25
293
Retail Commercial BOQ Finance
61
5
55
3714
15 (13%)
Down
Retail $10m (8%)
Feb 2014
5
BOQ Specialist
6
Commercial $26m (18%)
481638
3 2
5025
51
138
5 (1)
(1) Acquired on acquisition of BOQ Specialist as at July 2014.

BOQ Group – 2015 Half Year Results
23
4.1 ASSET QUALITY (CONTINUED)
COMMERCIAL IMPAIRED ASSETSThe commercial impaired portfolio reduced by $26 million or 18% over the half. Commercial impaired assets also benefitted this half due to the realisations of the two largest impaired assets at the end of 2014.
RETAIL IMPAIRED ASSETSRetail impaired assets reduced by $10 million or 8% over the half continuing the favourable trend over recent periods. This reflected improved security position across the delinquent portfolio, favourable property market conditions and record low interest rates. There continues to be higher asset clearance reflecting the improvement in residential prices across the country.
BOQ FINANCE IMPAIRED ASSETS BOQ Finance impaired assets experienced a marginal increase which is directly attributable to one large exposure of $4 million. Although there was a minimal increase, specific provisions have decreased which indicates better security held against the delinquent portfolio than what has previously been experienced over the prior periods.
IMPAIRED ASSETS / GLAs vs PEERSThe graph below shows the Bank’s level of collective provisions and GRCL to risk weighted assets against the current peer levels as published in their most recent financial reports. Coverage has dropped by 4bps over the half due to the inclusion of BOQ Specialist RWA’s following the acquisition on 31 July 2014. It should be noted that the majors utilise an advanced approach to RWA’s which increases their respective coverage ratio in comparison.
(1) This is the expected GRCL % upon finalisation of business combination acquisition accounting entries for BOQ Specialist that will be completed in the second half.
Collective Provision and GRCL/RWA v Peers
NAB CBA SUNBOQ Feb15 excl BOQS
BOQ
ANZ WBC BEN
0.58%
0.45%
1.03%
0.91% 0.85% 0.86% 0.85%
1.07%
0.74%
0.67%
0.24%
0.76%
0.09%
0.78%
0.08%
0.79%
0.41%
0.66%
0.13%
0.61%
0.06%0.45% (1)
0.54%
0.99%
BOQ Feb15 incl BOQS
Collective Provision to RWA General Reserve for Credit Losses to RWA

24
BOQ Group – 2015 Half Year Results
4.1 ASSET QUALITY (CONTINUED)
PROVISION COVERAGETotal provisions have reduced in line with the reduction in impaired assets. Specific provisions coverage of impaired assets remain at 52% emphasising our conservative approach to provisioning.
$ million
As at Feb 15 vs
Aug 14 Feb 15 vs
Feb 14Feb-15 Aug-14 Feb-14
Specific Provision 134 153 151 (12%) (11%)
Collective Provision 141 137 134 3% 5%
Total Provisions 275 290 285 (5%) (4%)
GRCL 70 70 70 - -
Specific Provisions to Impaired Assets 52% 52% 51% - 100bps
Total Provisions and GRCL to Impaired Assets (1) 145% 133% 129% 1200bps 1600bps
Total Provisions and GRCL to RWA (1) 1.4% 1.6% 1.8% (20bps) (40bps)
(1) GRCL gross of tax effect.
Specific Provisions ($m)
61
48
14
134
Feb 2014 New Specifics Realisations Aug 2014 New Specifics Realisations Feb 2015
85
54
12151
76
52
15
153
Commercial BOQ Finance
24
155
15
138
Retail
1011
BOQ Specialist
81262
23
167110 (1)
(1) Acquired on acquisition of BOQ Specialist as at July 2014.

BOQ Group – 2015 Half Year Results
25
4.1 ASSET QUALITY (CONTINUED)
ARREARSPortfolio
Balance $m As at Feb 15 vs
Aug 14
Feb 15 vs
Feb 14Feb-15 Feb-15 Aug-14 (1) Feb-14
By Product
30 days past due: GLAs (Housing) 23,991 1.27% 1.10% 1.17% 17bps 10bps
90 days past due: GLAs (Housing) 0.56% 0.48% 0.52% 8bps 4bps
30 days past due: GLAs (LOC) 3,331 2.18% 1.73% 2.15% 45bps 3bps
90 days past due: GLAs (LOC) 1.01% 0.88% 1.03% 13bps (2bps)
30 days past due: GLAs (Consumer) 334 1.61% 1.79% 3.04% (18bps) (143bps)
90 days past due: GLAs (Consumer) 0.74% 0.97% 1.61% (23bps) (87bps)
30 days past due: GLAs (Commercial) 8,041 1.41% 1.42% 2.84% (1bps) (143bps)
90 days past due: GLAs (Commercial) 1.04% 0.93% 2.02% 11bps (98bps)
30 days past due: GLAs (BOQ Finance) 4,029 0.89% 0.68% 0.72% 21bps 17bps
90 days past due: GLAs (BOQ Finance) 0.13% 0.11% 0.15% 2bps (2bps)
Total Lending
30 days past due ($ million) 39,726 533 456 527 17% 1%
90 days past due ($ million) 259 221 272 17% (5%)
30 days past due: GLAs 1.3% 1.2% 1.5% 10bps (20bps)
90 days past due: GLAs 0.7% 0.6% 0.8% 10bps (10bps)
(1) August 2014 numbers have been updated to include BOQ Specialist which were previously excluded from the Asset Quality section.
RETAIL ARREARS Retail arrears in 30+ and 90+ days past due both increased over the half. This increase is consistent with prior comparative periods seasonal trends and in line with our expectations. Improvement in the retail arrears is anticipated to occur in the March to June collections cycle as previously seen in 2014.
CONSUMER ARREARS Consumer arrears have significantly improved over the half due to BOQ Specialist increasing the consumer portfolio balance by $189 million which has had a dilutive effect on both ratios.
BOQ BUSINESS ARREARS Commercial arrears have deteriorated by 11bps in the 90+ arrears due predominantly to a couple of large commercial accounts dropping into the 90+ bucket. It is anticipated the 90+ arrears will improve in the coming months as workout strategies with these problematic accounts are implemented.
BOQ Finance arrears have increased over the half most notably in the 30+ delinquency bucket which increased by 21bps. This included two large accounts totalling $2 million which were cured in March, although mining and related services exposure represents a small part of the portfolio, signs of stress in this portfolio are evident in the arrears and loss experience.

26
BOQ Group – 2015 Half Year Results
4.2 FUNDING AND LIQUIDITY
We continue to strengthen the balance sheet, creating an economically sustainable funding profile that is able to support balance sheet growth and deliver internal capital generation, as evidenced by the recent long term credit rating upgrade by Fitch from (BBB+) to (A-). The rating upgrades, combined with improved access to long-term wholesale funding markets, have allowed us to actively shape the funding profile through further diversifying funding composition, increasing the duration and reducing the cost of funds. Pricing strategies have been implemented to reduce the reliance on price sensitive higher cost deposits and attract more sticky customer deposits, improving the overall portfolio stability and reducing funding costs as evidenced by the improvement in Net Interest Margin.
• The transition to Basel III Liquidity standards has materially changed the composition of our liquid assets• Fitch joined Standard and Poor’s and Moody’s by lifting BOQ’s long-term credit rating from (BBB+) to (A-) in November 2014• Proactive pricing and risk management strategies have resulted in a deposit profile that has yielded a better quality and
composition of deposits at reduced cost
$ million
As at
Feb-15 Aug-14 Feb-14 Feb 15 vs Aug 14 (1)
Feb 15 vs Feb 14
Retail Deposits 26,506 26,615 23,769 (1%) 12%
Wholesale Deposits (2) 7,511 7,491 7,010 1% 7%
Total Deposits 34,017 34,106 30,779 (1%) 11%
Borrowings (2) 9,378 8,364 7,944 24% 18%
Other Liabilities 1,102 1,094 826 1% 33%
Total Liabilities 44,497 43,564 39,549 4% 13%
Total Shareholders’ Equity 3,403 3,341 2,881 4% 18%
Total Liabilities and Equity 47,900 46,905 42,430 4% 13%
(1) Percentages have been annualised.(2) There has been a reclassification of Transferable Certificates of Deposits from Wholesale Deposits for August 2014 and February 2014 to Borrowings to better reflect the
underlying substance with contractual terms being on average greater than twelve months.
Assets Liabilities & Equity
Retail Lending 69%
Liquid Assets 18% (2)
Customer Deposits 67%
Long-Term Wholesale 24%
Short-Term Wholesale 19%
BALANCE SHEET COMPOSITION (1)
Equity 8%
ASSETS• 69% of lending is home loans• Cash and highly liquid securities held equate to 18% of all lending
Liabilities• 67% funding comes from customer deposits
• Lending is 99% funded by stable funding sources
• Short Term wholesale funding is primarily used to fund highly liquid assets and trading securities
(1) Balance Sheet calibrated to total lending assets(2) Represents the Bank’s total liquid assets available
Commercial and Lease Finance 31%
Stable funding coverage for 99% of Lending Balances
100%
BOQ Group – 2015 Half Year Results
27
4.2 FUNDING AND LIQUIDITY (CONTINUED)
As at Feb 15 vs
Aug 14
Feb 15 vs
Feb 14Feb-15 Aug-14 Feb-14
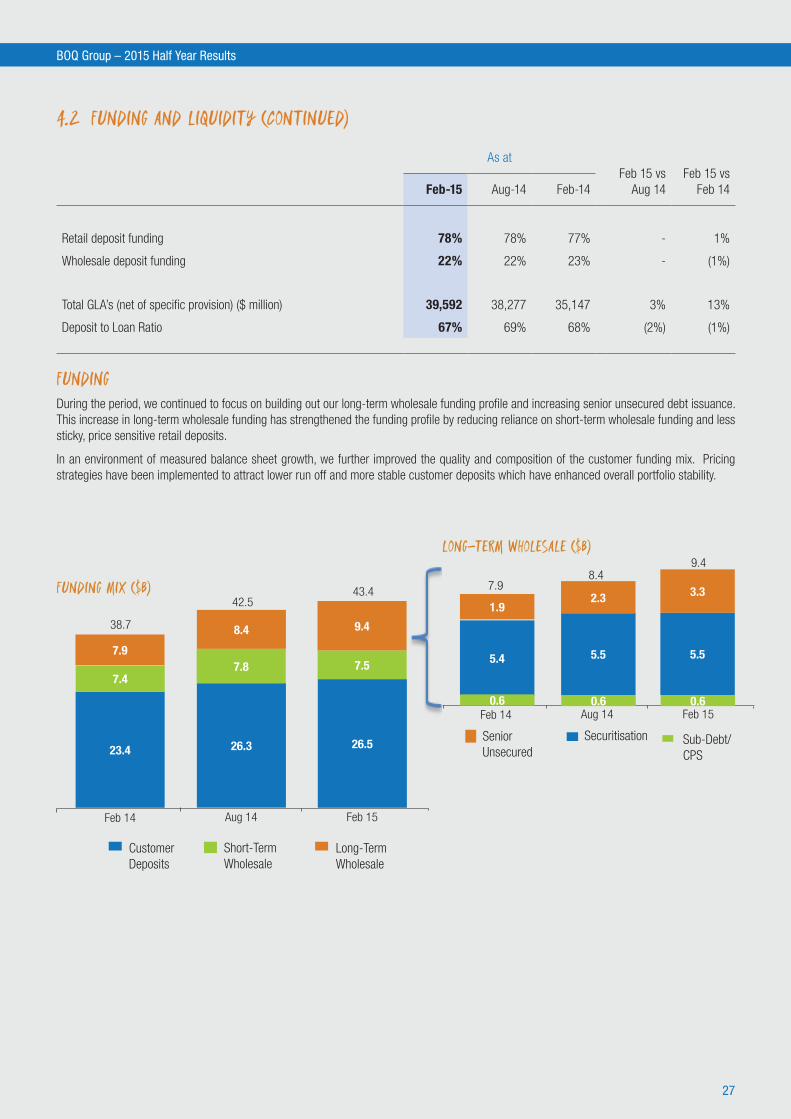
Retail deposit funding 78% 78% 77% - 1%
Wholesale deposit funding 22% 22% 23% - (1%)
Total GLA’s (net of specific provision) ($ million) 39,592 38,277 35,147 3% 13%
Deposit to Loan Ratio 67% 69% 68% (2%) (1%)
FUNDINGDuring the period, we continued to focus on building out our long-term wholesale funding profile and increasing senior unsecured debt issuance. This increase in long-term wholesale funding has strengthened the funding profile by reducing reliance on short-term wholesale funding and less sticky, price sensitive retail deposits.
In an environment of measured balance sheet growth, we further improved the quality and composition of the customer funding mix. Pricing strategies have been implemented to attract lower run off and more stable customer deposits which have enhanced overall portfolio stability.
Customer Deposits
Long-Term Wholesale
Short-Term Wholesale
Feb 14 Aug 14
23.4
7.9
7.4
Feb 15
26.3
8.4
7.8
26.5
9.4
7.5
FUNDING MIX ($b)
38.7
42.543.4
SecuritisationSenior Unsecured
Sub-Debt/CPS
Feb 14 Aug 14 Feb 15
LONG-TERM WHOLESALE ($b)
7.98.4
9.4
5.4
1.9
0.6
5.5
2.3
0.6
5.5
3.3
0.6

28
BOQ Group – 2015 Half Year Results
LIQUIDITYThe transition of the liquid asset portfolio for the new Basel III APS 210 Liquidity Standard has been completed and we continue to maintain a high quality, diversified liquid asset portfolio to support internal and regulatory requirements. The Bank was granted a Reserve Bank of Australia (“RBA”) Committed Liquidity Facility (“CLF”) sufficient to enable the Bank to meet its regulatory minimum of greater than 100% of the Liquidity Coverage Ratio from 1 January 2015.
Our total physical liquid holdings of $6.1 billion provides a material buffer in the event of a market dislocation. In addition, we have increased our internal securitisation capacity to $3.3 billion which is eligible for repurchase arrangements with the RBA as a source of contingent liquidity in the event of a crisis scenario. Significant further liquidity is also available with a material proportion of the Bank’s retail lending assets eligible to be placed as collateral into this structure.
4.2 FUNDING AND LIQUIDITY (CONTINUED)
MAJOR MATURITIES ($m) (1) (2)
Following recent upgrades and with the favourable credit market environment, BOQ took the opportunity to execute some senior issuance to term out the wholesale funding profile as shown below. This has strengthened the senior unsecured curve, providing more transparent market pricing for investors.
600
Jun-19 Sep-19 Dec-19Jun-15 Sep-15 Dec-15 Mar-16 Jun-16 Sep-16 Dec-160
200
400
600
800
500
Senior Unsecured
Sub Debt
BOQS Sub Debt
230
400
200
Mar-17 Jun-17 Sep-17 Dec-17 Mar-18 Jun-18 Sep-18 Dec-18 Mar-19
500 500
5050
(1) Maturities equal to or greater than $50 million shown (2) March 2015 included the maturity of the last tranches of the government guaranteed debt
Liquid Assets (2) Internal SecuritisationHQLA1 (1)
Feb 14 Aug 14
4.0
2.6
1.3Feb 15
7.9
4.2
2.5
2.4
9.1
4.0
3.3
2.1
9.4
LIQUIDITY COMPOSITION - BASEL III ($b)
(1) High Quality Liquid Assets (HQLA1) includes government and semi-government securities, cash held with RBA and notes & coins. (2) Liquid Assets include all unencumbered RBA repurchase eligible liquid assets able to be pledged as collateral to the RBA CLF.

BOQ Group – 2015 Half Year Results
29
4.3 CAPITAL MANAGEMENT
CAPITAL ADEQUACY
$ million
As at
Feb-15 Aug-14 Feb-14Feb 15 vs Aug 14 (1)
Feb 15 vs Feb 14
Common Equity Tier 1 2,298 2,161 1,920 13% 20%
Additional Tier 1 Capital 300 300 300 - -
Total Tier 2 536 548 474 (4%) 13%
Total Capital Base 3,134 3,009 2,694 8% 16%
Total RWA 26,057 25,032 21,717 8% 20%
Common Equity Tier 1 Ratio 8.82% 8.63% 8.84% 19bps (2bps)
Total Capital Adequacy Ratio 12.03% 12.02% 12.41% 1bps (38bps)
(1) Percentages have been annualised.
Common Equity Tier 1 has increased 19bps to 8.82% in the half. Underlying cash earnings in the half was more than enough to support loan growth of $1.3 billion in the half and a 2 cent increase in the interim dividend, generating 4bps of surplus capital as shown below.
(1) Cash net profit after tax adjusted for CRM system impairment.
(2) Other includes a reduction in deferred tax assets largely relating to the reduction in the product remediation provision, normalisation adjustments to determine cash earnings and
favourable market movements on liquid assets held in the banking book.
COMMON EQUITY TIER 1 CAPITAL
Aug14 Cash Earnings (1) Dividend net of DRPRWA Growth Capitalised Software Feb15
8.63%
0.72%
0.07%
0.37%
0.31%
8.82%
Other (2)
0.22%
Underlying Capital Generation
4.4 TAXATIONTax expense arising on Cash Earnings for the half amounted to $73 million. This represents an effective tax rate of 30.4%, which is above the corporate tax rate of 30% primarily due to non-deductibility of interest on the convertible preference shares issued in 2013.

30
BOQ Group – 2015 Half Year ResultsBOQ Group – 2015 Half Year Results
5. CONSOLIDATED INTERIM FINANCIAL REPORTDIRECTORS’ REPORT 31
LEAD AUDITOR’S INDEPENDENCE DECLARATION 33
CONSOLIDATED INCOME STATEMENT 34
CONSOLIDATED STATEMENT OF COMPREHENSIVE INCOME 35
CONSOLIDATED BALANCE SHEET 36
CONSOLIDATED STATEMENT OF CHANGES IN EQUITY 37
CONSOLIDATED STATEMENT OF CASH FLOWS 39
CONDENSED NOTES TO THE CONSOLIDATED INTERIM FINANCIAL STATEMENTS 40
SECTION 1. BASIS OF PREPARATION
1.1. REPORTING ENTITY 40
1.2. BASIS OF ACCOUNTING 40
1.3. SIGNIFICANT ACCOUNTING POLICIES 40
1.4. USE OF ESTIMATES AND JUDGEMENTS 41
SECTION 2. FINANCIAL PERFORMANCE
2.1. INCOME TAX EXPENSE 42
2.2. DIVIDENDS 42
2.3. OPERATING SEGMENTS 43
SECTION 3. CAPITAL AND BALANCE SHEET MANAGEMENT
3.1. CAPITAL MANAGEMENT 44
3.2. ISSUED CAPITAL 45
3.3. FINANCIAL INSTRUMENTS 45
3.4. PROVISIONS FOR IMPAIRMENT 47
3.5. DEBT ISSUES INCLUDING SUBORDINATED NOTES 48
SECTION 4. OTHER NOTES
4.1. INTANGIBLE ASSETS 49
4.2. RELATED PARTIES 49
4.3. CONTINGENT LIABILITIES 49
4.4. EVENTS SUBSEQUENT TO BALANCE DATE 49
DIRECTORS’ DECLARATION 50
INDEPENDENT AUDITOR’S REVIEW REPORT TO THE MEMBERS 51
Bank of Queensland Limited ABN 32 009 656 740

BOQ Group – 2015 Half Year Results
31
DIRECTORS’ REPORT Half-year ended 28 February 2015The Directors present their report together with the consolidated interim financial report for the half-year ended 28 February 2015 and the independent auditor’s review report thereon.
DirectorsThe Directors of the Bank of Queensland Limited (“the Bank”) at any time during or since the end of the half-year are:
Name Period of Directorship
Roger Davis Director since August 2008 / Chairman since May 2013
Jon Sutton Managing Director and Chief Executive Officer since 5 January 2015.
Carmel Gray Director since April 2006
Steve Crane Director since December 2008 - Resigned 22 January 2015
David Willis Director since February 2010
Michelle Tredenick Director since February 2011
Richard Haire Director since April 2012
Neil Berkett Director since July 2013
Margaret Seale Director since January 2014
Bruce Carter Director since February 2014
Principal activitiesThe principal activity of the Bank which comprises the Bank and its subsidiaries (together referred to as the “Consolidated Entity”), is the provision of financial services and insurance to the community. The Bank has an authority to carry on banking business under the Banking Act 1959 (Commonwealth) (as amended). There were no significant changes during the period in the nature of the activities of the Consolidated Entity.
Review of operations and financial resultsContinuing the strong trends witnessed in 2014, the Bank has recorded a statutory profit after tax of $154 million for the half-year ended 28 February 2015. This performance represents a $19 million or 14% improvement on the after tax statutory profit achieved for the 28 February 2014 half year. The February 2015 period represents the first full period of results to include BOQ Specialist following its acquisition in July 2014 and the business contributed $13 million to the statutory profit after tax. The Bank also continued to witness lower loan impairment expense, which is down 22% from the prior corresponding period.
Total operating income has increased by 20% to $537 million. This increase was driven largely by growth in net interest income which reflected the impact of the BOQ Specialist acquisition and improvement in Net Interest Margin, which increased by 20 basis points over the prior corresponding period, with 9bps of this increase reflecting the higher margins achieved in the BOQ Specialist portfolio. Further to this the Bank continues to manage its liability mix and reduce its reliance on higher cost, less stable segments of the retail deposit market.
Operating expenses increased by 35% on the prior comparative period to $276 million. The increase in expenses of $72 million is primarily attributable to the inclusion of BOQ Specialist combined with a number of one-off property transition and software impairment charges.
32
BOQ Group – 2015 Half Year Results
Review of Operations and Financial Results (continued)Statutory diluted earnings per share increased to 41.6 cents for the period ended 28 February 2015 (Feb 2014: 40.4 cents). In line with the strong performance this period, the Board has determined to pay an interim dividend of 36 cents per share fully franked, an increase of 4 cents per share over the prior corresponding period.
Further analysis of the Group’s operations and results for the 28 February 2015 period is detailed in the Highlights & Strategy, Group Performance Analysis and Business Settings sections.
Other mattersDirector and Management changesJon Sutton was officially appointed as Managing Director and Chief Executive Officer (CEO) on 5 January 2015 after being appointed to the role of acting CEO in August 2014. Steve Crane resigned from his position as a Non-Executive Director on 22 January 2015, while Brian Bissaker and Melissa Grundy ceased employment respectively from the positions of Chief Executive Officer of Virgin Money (Australia) and Company Secretary on 13 March 2015.
Subsequent eventsNo matters or circumstances have arisen since the end of the financial half year and up until the date of this report which significantly affects the operations of the Bank, the results of those operations, or the state of affairs of the Bank in subsequent years. The Bank has declared an interim dividend to be paid in May 2015. Further details with respect to the dividend amount per share, payment date and dividend re-investment plan can be obtained from Section 2.2.
Management attestationThe Board has been provided with a written statement from the Group’s Chief Executive Officer and Chief Financial Officer, confirming the accompanying financial statements and notes are in accordance with the Corporations Act 2001 and they present a true and fair view in all material respects of the Group’s financial position and performance as at and for the half-year ending 28 February 2015.
The Directors’ declaration can be found on page 50 of the financial statements.
Lead auditor’s independence declaration under section 307C of the Corporations Act 2001The lead auditor’s independence declaration is set out on page 33 and forms part of the Directors’ Report for the half-year ended 28 February 2015.
Rounding of amountsThe Bank is a company of a kind referred to in ASIC Class Order 98/100 dated 10 July 1998 (as amended by Class Order 04/667 dated 15 July 2004) and in accordance with that Class Order, amounts in this financial report and Director’s Report have been rounded off to the nearest million dollars, unless otherwise stated. This represents a change from previous reporting periods whereby amounts were rounded to the nearest hundred thousand dollars. This change is in accordance with Class Order 98/100 and has not had a material impact on the financial report.
Dated this twenty-fifth day of March 2015.
Signed in accordance with a resolution of the Directors:
Roger Davis Chairman
Jon Sutton Managing Director and CEO

BOQ Group – 2015 Half Year Results
33
Lead Auditor’s Independence Declaration under Section 307C of the Corporations Act 2001
To the directors of Bank of Queensland Limited
I declare that, to the best of my knowledge and belief, in relation to the review for the half-year ended 28 February 2015, there have been:
• no contraventions of the auditor independence requirements as set out in the Corporations Act 2001 in relation to the review; and
• no contraventions of any applicable code of professional conduct in relation to the review.
KPMG
Martin McGrath Partner
Sydney 25 March 2015
KPMG, an Australian partnership and a member firm of the KPMG network of independent member firms affiliated with KPMG International Cooperative (“KPMG International”), a Swiss entity. Liability limited by a scheme approved under Professional Standards Legislation.

34
BOQ Group – 2015 Half Year Results
CONSOLIDATED INCOME STATEMENT For the half-year ended 28 February 2015
Section28 February 2015
$m28 February 2014
$m
Interest income 1,141 1,040
Less: Interest expense 698 678
Net interest income 443 362
Other operating income 77 64
Net banking operating income 520 426
Premiums from insurance contracts 36 35
Investment revenue 2 3
Less: Claims and policyholder liability expense from insurance contracts (21) (17)
Net insurance operating income 17 21
Total operating income 537 447
Less: Expenses 276 204
Less: Impairment on loans and advances 36 46
Profit before income tax 225 197
Less: Income tax expense 2.1 71 62
Profit for the period 154 135
Profit attributable to: Equity holders of the parent 154 135
Basic earnings per share – Ordinary Shares (cents) 42.3 41.5
Diluted earnings per share – Ordinary Shares (cents) 41.6 40.4
The consolidated income statement should be read in conjunction with the accompanying notes.

BOQ Group – 2015 Half Year Results
35
CONSOLIDATED STATEMENT OF COMPREHENSIVE INCOME
For the half-year ended 28 February 2015
28 February 2015 $m
28 February 2014 $m
Profit for the period 154 135
Other comprehensive income, net of income tax
Items that may be reclassified subsequently to profit or loss
Cash flow hedges:
Net losses taken to equity (54) (4)
Net gains transferred to profit and loss 1 -
Change in fair value of assets available for sale 37 (2)
Other comprehensive expense for the period, net of income tax (16) (6)
Total comprehensive income for the period 138 129
Total comprehensive income attributable to:
Equity holders of the parent 138 129
The consolidated statement of comprehensive income should be read in conjunction with the accompanying notes.

36
BOQ Group – 2015 Half Year Results
CONSOLIDATED BALANCE SHEET As at 28 February 2015
Section28 February 2015
$m31 August 2014
$m
Assets
Cash and liquid assets 1,104 1,034
Due from other financial institutions 93 93
Financial assets available for sale 3.3 3,448 3,864
Financial assets held for trading 3.3 2,388 2,474
Derivative financial assets 3.3 292 160
Loans and advances at amortised cost 3.3 39,451 38,136
Other assets 113 130
Property, plant and equipment 67 54
Deferred tax assets 93 112
Intangible assets 832 827
Investments in joint arrangements 19 21
Total assets 47,900 46,905
Liabilities
Due to other financial institutions 174 207
Deposits 3.3 34,017 34,106
Derivative financial liabilities 3.3 361 249
Accounts payable and other liabilities 388 399
Current tax liabilities 28 72
Provisions 98 104
Insurance policy liabilities 53 63
Debt issues including subordinated notes 3.5 9,378 8,364
Total liabilities 44,497 43,564
Net assets 3,403 3,341
Equity
Issued capital 3,071 3,021
Reserves 96 114
Retained profits 236 206
Total equity 3,403 3,341
The consolidated balance sheet should be read in conjunction with the accompanying notes.

BOQ Group – 2015 Half Year Results
37
CONSOLIDATED STATEMENT OF CHANGES IN EQUITY For the half-year ended 28 February 2015
Ordinary shares
Employee benefits reserve
Equity reserve
for credit losses
Other reserves
Retained profits
Total equity
Half-year ended 28 February 2015 $m $m $m $m $m $m
Balance at beginning of the period 3,021 33 70 11 206 3,341
Total comprehensive income for the period
Profit - - - - 154 154
Other comprehensive income, net of income tax
Cash flow hedges:
- Net losses taken to equity - - - (54) - (54)
- Net gains transferred to profit and loss - - - 1 - 1
Change in fair value of assets available for sale - - - 37 - 37
Total other comprehensive expense - - - (16) - (16)
Total comprehensive income/(expense) for the period - - - (16) 154 138
Transactions with owners, recorded directly in equity Contributions by and distributions to owners
Issues of ordinary shares 11 - - - - 11
Dividend reinvestment plan 43 - - - - 43
Dividends to shareholders - - - - (124) (124)
Equity settled transactions - (2) - - - (2)
Treasury Shares (1) (4) - - - - (4)
Total contributions by and distributions to owners 50 (2) - - (124) (76)
Balance at the end of the period 3,071 31 70 (5) 236 3,403
(1) Treasury shares represent the value of shares in the Bank held by a subsidiary, that the Bank is required to include in the Consolidated Entity’s interim financial statements. No gain or loss is recognised in profit or loss on the purchase, sale, issue or cancellation of the Bank’s own equity instruments.
The consolidated statement of changes in equity should be read in conjunction with the accompanying notes.
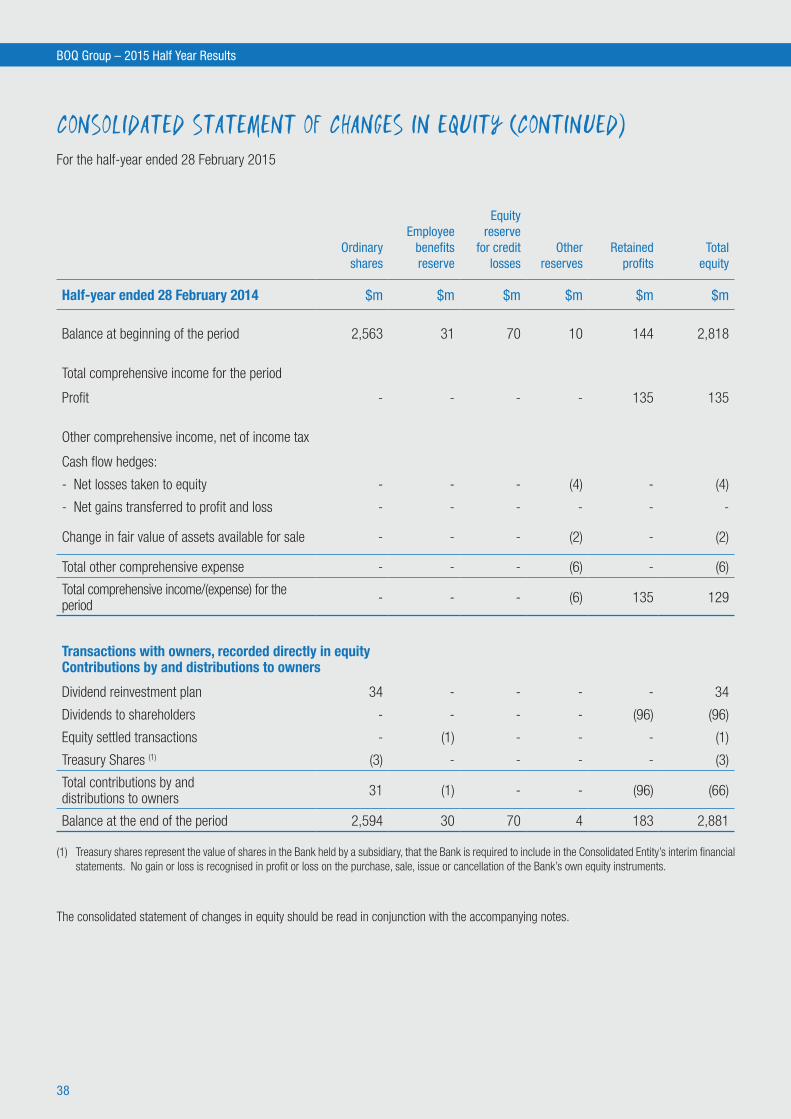
38
BOQ Group – 2015 Half Year Results
CONSOLIDATED STATEMENT OF CHANGES IN EQUITY (CONTINUED) For the half-year ended 28 February 2015
Ordinary shares
Employee benefits reserve
Equity reserve
for credit losses
Other reserves
Retained profits
Total equity
Half-year ended 28 February 2014 $m $m $m $m $m $m
Balance at beginning of the period 2,563 31 70 10 144 2,818
Total comprehensive income for the period
Profit - - - - 135 135
Other comprehensive income, net of income tax
Cash flow hedges:
- Net losses taken to equity - - - (4) - (4)
- Net gains transferred to profit and loss - - - - - -
Change in fair value of assets available for sale - - - (2) - (2)
Total other comprehensive expense - - - (6) - (6)
Total comprehensive income/(expense) for the period - - - (6) 135 129
Transactions with owners, recorded directly in equity Contributions by and distributions to owners
Dividend reinvestment plan 34 - - - - 34
Dividends to shareholders - - - - (96) (96)
Equity settled transactions - (1) - - - (1)
Treasury Shares (1) (3) - - - - (3)
Total contributions by and distributions to owners 31 (1) - - (96) (66)
Balance at the end of the period 2,594 30 70 4 183 2,881
(1) Treasury shares represent the value of shares in the Bank held by a subsidiary, that the Bank is required to include in the Consolidated Entity’s interim financial statements. No gain or loss is recognised in profit or loss on the purchase, sale, issue or cancellation of the Bank’s own equity instruments.
The consolidated statement of changes in equity should be read in conjunction with the accompanying notes.

BOQ Group – 2015 Half Year Results
39
CONSOLIDATED STATEMENT OF CASH FLOWS For the half-year ended 28 February 2015
28 February 2015 $m
28 February 2014 $m
Cash flows from operating activities
Interest received 1,145 1,057
Fees and other income received 77 93
Dividends received 2 1
Interest paid (731) (702)
Cash paid to suppliers and employees (240) (196)
Income tax paid (93) (34)
160 219
(Increase) / decrease in operating assets:
Loans and advances at amortised cost (1,351) (70)
Other financial assets 547 (5)
Increase / (decrease) in operating liabilities:
Deposits (99) 285
Securitisation liabilities (51) (413)
Net cash from operating activities (794) 16
Cash flows from investing activities
Payments for property, plant and equipment (29) (16)
Payments for intangible assets (28) (22)
Cash distribution received from equity accounted investments 2 -
Proceeds from sale of property, plant and equipment 3 1
Net cash from investing activities (52) (37)
Cash flows from financing activities
Proceeds from issue of ordinary shares 11 -
Proceeds from borrowings and foreign exchange instruments 1,288 433
Repayment of borrowings (291) (412)
Payments for treasury shares (11) (8)
Dividends paid (81) (62)
Net cash from financing activities 916 (49)
Net decrease in cash and cash equivalents 70 (70)
Cash and cash equivalents at beginning of year 1,034 873
Cash and cash equivalents at end of half-year 1,104 803
The consolidated statement of cash flows should be read in conjunction with the accompanying notes.

40
BOQ Group – 2015 Half Year Results
CONDENSED NOTES TO THE CONSOLIDATED INTERIM FINANCIAL STATEMENTS For the half-year ended 28 February 2015
SECTION 1. BASIS OF PREPARATION1.1. REPORTING ENTITYBank of Queensland Limited (“the Bank”) is a company domiciled in Australia. The consolidated interim financial report of the Bank as at and for the half-year ended 28 February 2015 comprises the Bank and its subsidiaries (together referred to as the “Consolidated Entity”) and the Consolidated Entity’s interest in equity accounted joint arrangements. The Bank is primarily involved in providing retail banking, commercial and leasing finance, and insurance products to its customers.
1.2. BASIS OF ACCOUNTINGThe consolidated interim financial report is a general purpose financial report which has been prepared in accordance with AASB 134: Interim Financial Reporting and the Corporations Act 2001. The consolidated interim financial report does not include all the information required for a full annual financial report, and should be read in conjunction with the consolidated annual financial report of the Consolidated Entity as at and for the year ended 31 August 2014, which is available upon request from the Bank’s registered office at Level 6, 100 Skyring Terrace, Newstead QLD 4006 or at www.boq.com.au.
The Consolidated Entity is of a kind referred to in ASIC Class Order 98/100 dated 10 July 1998 (as amended by ASIC Class Order 04/667) and in accordance with that Class Order, amounts contained in this report have been rounded off to the nearest million dollars, unless otherwise stated.
These consolidated interim financial statements are presented in Australian dollars which is the Consolidated Entity’s functional currency.
The consolidated interim financial report was approved by the Board of Directors on 25 March 2015.
1.3. SIGNIFICANT ACCOUNTING POLICIESExcept as described below, the accounting policies applied by the Consolidated Entity in this consolidated interim financial report are the same as those applied by the Consolidated Entity in its consolidated annual financial report as at and for the year ended 31 August 2014.
The following changes in accounting policies are also expected to be reflected in the Consolidated Entity’s financial statements as at and for the year ending 31 August 2015.
Changes in accounting policiesThe Consolidated Entity has reclassified its Transferable Certificates of Deposit to debt issues including subordinated notes. These balances were previously classified as deposits and further details in respect of the basis and financial effect of this reclassification have been provided in Section 3.5.
The Consolidated Entity has also adopted the following new standards and amendments to standards, including any consequential amendments to other standards, with a date of initial application of 1 September 2014.
• AASB 2012-3 Amendments to Australian Accounting Standards - Offsetting Financial Assets and Financial Liabilities (refer (a))
• AASB 2013-3 Amendments to AASB 136 - Recoverable Amount Disclosures for Non-financial Assets (refer (b))
• AASB 2013-4 Amendments to Australian Accounting Standards - Novation of Derivatives and Continuation of Hedge Accounting (refer (c))
• AASB 2013-7 Amendments to AASB 1038 arising from AASB 10 in relation to Consolidation and Interests of Policyholders (refer (d)).
• AASB 1031 Materiality (refer (e)).
BOQ Group – 2015 Half Year Results
41
CONDENSED NOTES TO THE CONSOLIDATED INTERIM FINANCIAL STATEMENTS For the half-year ended 28 February 2015
1.3. SIGNIFICANT ACCOUNTING POLICIES (CONTINUED)
The nature and effect of the changes are further explained below.
(a) Offsetting Financial Assets and financial liabilitiesThis amendment adds application guidance to AASB 132 Financial Instruments: Presentation to address inconsistencies identified in applying some of the offsetting criteria of AASB 132. The Bank has reviewed the amendment and the clarifications within and determined that no disclosure changes are required.
(b) Recoverable Amount Disclosures for Non-financial AssetsThis amendment includes additional disclosure requirements with respect to impaired assets measured based on their fair value less costs of disposal. The Group has recognised an impairment loss during the period in relation to internally generated software. Further details have been disclosed in Section 4.1.
(c) Novation of Derivatives and Continuation of Hedge AccountingThis amendment permits the continuation of hedge accounting in specified circumstances where a derivative, which has been designated as a hedging instrument, is novated from one counterparty to a central counterparty as a consequence of laws or regulations. There have been no derivatives novated by the Bank during the period and as such the introduction of this amendment has not impacted the Bank.
(d) Consolidation and interests of policyholdersThis amendment removes the specific requirements in relation to consolidation from AASB 1038, which leaves AASB 10 as the sole source for consolidation requirements applicable to life insurer entities. The Bank has reviewed the impact of this amendment on its consolidation requirements for St Andrews and determined there have been no changes.
(e) MaterialityThe revised AASB 1031 is an interim standard that cross-references to other standards and the Framework (issued December 2013) that contain guidance on materiality. AASB 1031 will be withdrawn when references to AASB 1031 in all standards and interpretations have been removed. These amendments are effective from 1 July 2014. This new standard did not have a material impact on the Consolidated Entity.
1.4. USE OF ESTIMATES AND JUDGEMENTSIn preparing the consolidated interim financial report, management has been required to make judgements, estimates and assumptions that affect the application of policies and reported amounts of assets, liabilities, income and expenses. These estimates and associated assumptions are based on historical experience and various other factors that are believed to be reasonable under the circumstances.
The significant judgements made by management in applying the Consolidated Entity’s accounting policies and key sources of estimation uncertainty were the same as those that applied to the consolidated annual financial report as at and for the year ended 31 August 2014, with the exception of the changes outlined in 1.3 (a) to (e) above.

42
BOQ Group – 2015 Half Year Results
SECTION 2. FINANCIAL PERFORMANCE2.1. INCOME TAX EXPENSE
The Consolidated Entity’s effective tax expense rate for the six months ended 28 February 2015 was 31.5% and for the six months ended 28 February 2014 was 31.5%. This is above the corporate tax rate of 30% and is primarily attributable to the non-deductibility of interest on the convertible preference shares (refer to Section 3.5 for details).
2.2. DIVIDENDS
Half-year ended
28 February 2015 28 February 2014
Cents per share $m Cents per share $m
Ordinary shares
Final 2014 dividend paid 27 November 2014 (2013: 4 December 2013) 34 124 30 96
Preference shares
Final CPS dividend paid on 15 October 2014 (2013: 15 October 2013) 275 8 286 9
Since the end of the period, the Directors’ have determined the following dividends:
Cents per share $m
- Interim CPS dividend 273 8
- Interim dividend 36 132
The interim dividend payment will be fully franked and paid on 12 May 2015 to owners of ordinary shares at the close of business on 20 April 2015 (record date). Shares will be quoted ex-dividend on 16 April 2015.
Dividend reinvestment planAs resolved by the Board, the Bank of Queensland Dividend Reinvestment Plan (“DRP”) provides shareholders with the opportunity to convert all or part of their entitlement to a dividend into new shares at a discount of 1.5%. The discount applied is 1.5% of the arithmetic average, rounded to four decimal places, of the daily volume weighted average price of:
• all shares sold in the ordinary course of trading on the Australian Securities Exchange automated trading system; and
• where shares are sold on trading platforms of Australian licensed financial markets operated by persons other than ASX, all shares sold in the ordinary course of trading on such of those trading platforms determined by the Board from time to time,
during the 10 trading day period commencing on the second trading day after the record date in respect of the relevant dividend.
Shares issued or transferred under the DRP will be fully-paid. If, after this calculation there is a residual balance, that balance will be carried forward (without interest) and added to the next dividend for the purpose of calculating the number of shares secured under the DRP at that time.
The last date for election to participate in the DRP for 2015 interim dividend is 21 April 2015.

BOQ Group – 2015 Half Year Results
43
2.3. OPERATING SEGMENTSThe Bank has determined and presented the following two segments based on information provided to the Chief Operating Decision Maker, being the Managing Director and CEO.
Banking Retail banking, commercial, personal, small business loans, equipment and debtor finance, treasury, savings and transaction accounts.
Insurance Customer credit insurance, life insurance, accidental death insurance, funeral insurance and motor vehicle gap insurance.
6 Months to 28 February 2015
Banking $m
Insurance $m
Consolidation adjustments
$mTotal Segments
$m
Revenue from outside the group 520 17 - 537
Inter-segment revenue 2 (1) (1) -
Total segment revenue 522 16 (1) 537
Expenses 272 4 - 276
Impairment on loans and advances 36 - - 36
Segment profit before income tax 214 12 (1) 225
Income tax expense 67 4 - 71
Segment profit after income tax 147 8 (1) 154
6 Months to 28 February 2014
Banking $m
Insurance $m
Consolidation adjustments
$mTotal Segments
$m
Revenue from outside the group 426 21 - 447
Inter-segment revenue 2 (2) - -
Total segment revenue 428 19 - 447
Expenses 200 4 - 204
Impairment on loans and advances 46 - - 46
Segment profit before income tax 182 15 - 197
Income tax expense 58 4 - 62
Segment profit after income tax 124 11 - 135
The Consolidated Entity’s business segments operate principally in Australia.

44
BOQ Group – 2015 Half Year Results
SECTION 3. CAPITAL AND BALANCE SHEET MANAGEMENT3.1. CAPITAL MANAGEMENT
The Bank and Consolidated Entity’s capital management strategy aims to ensure adequate capital levels are maintained to protect deposit holders and to maximise shareholder return. The Bank’s capital is measured and managed in line with Prudential Standards issued by Australian Prudential Regulation Authority (“APRA”). The capital management plan is updated annually and submitted to the Board for approval. The approval process is designed to ensure the plan is consistent with the overall business plan and for managing capital levels on an ongoing basis.
The Board has set the Common Equity Tier 1 capital target range to be between 8.0% and 9.0% of risk weighted assets and the total capital range to be between 11.5% and 12.5% of risk weighted assets.
Consolidated
Qualifying capital28 February 2015
$m31 August 2014
$m
Common equity tier 1 capital
Paid-up ordinary share capital 3,071 3,021
Reserves 54 58
Retained profits, including current year profits 229 207
Total common equity tier 1 capital 3,354 3,286
Regulatory adjustments
Goodwill and intangibles (830) (825)
Deferred expenditure (130) (122)
Other deductions (96) (177)
Total regulatory adjustments (1,056) (1,124)
Net common equity tier 1 capital 2,298 2,162
Additional tier 1 capital 300 300
Net tier 1 capital 2,598 2,462
Tier 2 capital
Tier 2 capital 325 340
General reserve for credit losses 211 207
Net tier 2 capital 536 547
Capital base 3,134 3,009
Risk weighted assets 26,057 25,032
Capital adequacy ratio 12.0% 12.0%

BOQ Group – 2015 Half Year Results
45
3.2. ISSUED CAPITAL
Consolidated
28 February 2015 Number
28 February 2014 Number
Movements during the period
Balance at the beginning of the period 362,516,835 319,810,294
Issues of ordinary shares (1) 900,000 -
Dividend reinvestment plan 3,565,212 2,756,588
Balance at the end of the period 366,982,047 322,566,882
Treasury shares (included in ordinary shares above)
Balance at the beginning of the period 297,579 162,371
Movements during the period 305,181 302,606
Balance at the end of the period 602,760 464,977
(1) On 24 October 2014, 900,000 ordinary shares were issued at $12.29 to the trustee of the BOQ Employee Share Plans Trust to satisfy the exercise of award rights and issue of shares under the Award Rights Plan and issue of shares under the BOQ Restricted Share Plan and BOQ Employee Share Plan.
3.3. FINANCIAL INSTRUMENTS
(a) Carrying amounts versus fair valuesThe table below discloses the fair value of financial instruments where their carrying value is not a reasonable approximation of their fair value:
28 February 2015 31 August 2014
Carrying Amount$m
Fair Value$m
Carrying Amount$m
Fair Value$m
Assets carried at amortised cost
Loans and advances at amortised cost 39,451 39,592 38,136 38,197
39,451 39,592 38,136 38,197
Liabilities carried at amortised cost
Deposits (34,017) (34,059) (34,106) (34,119)
Debt issues including subordinated notes (9,378) (9,399) (8,364) (8,370)
(43,395) (43,458) (42,470) (42,489)
(b) Master netting or similar arrangementsThe Consolidated Entity enters into derivative transactions under International Swaps and Derivatives Association (ISDA) master netting arrangements. Amounts owed by each counterparty are aggregated into a single net amount that is payable by one party to another. The Consolidated Entity normally settles on a net basis or realises the derivative assets and liabilities simultaneously. The Consolidated Entity has not offset these amounts in the Consolidated Balance Sheet.

46
BOQ Group – 2015 Half Year Results
3.3. FINANCIAL INSTRUMENTS (CONTINUED)
(c) Fair value hierarchyThe Consolidated Entity measures fair values using the following fair value hierarchy, which reflects the significance of the inputs used in making the measurements:
• Level 1: inputs that are quoted market prices (unadjusted) in active markets for identical instruments.• Level 2: inputs other than quoted prices included within level 1 that are observable either directly or indirectly.• Level 3: inputs that are unobservable i.e. there is no observable market data.
The table below analyses financial instruments carried at fair value, by valuation method. There were no material movements in financial instruments classified as Level 3 in the fair value hierarchy.
28 February 2015
Level 1 $m
Level 2 $m
Level 3 $m
Total $m
Instruments carried at fair value
Financial assets available for sale 1,228 2,210 10 3,448
Financial assets held for trading - 2,388 - 2,388
Derivative financial assets - 292 - 292
1,228 4,890 10 6,128
Derivative financial liabilities - (361) - (361)
1,228 4,529 10 5,767
31 August 2014
Level 1 $m
Level 2 $m
Level 3 $m
Total $m
Instruments carried at fair value
Financial assets available for sale 1,892 1,962 10 3,864
Financial assets held for trading - 2,474 - 2,474
Derivative financial assets - 160 - 160
1,892 4,596 10 6,498
Derivative financial liabilities - (249) - (249)
1,892 4,347 10 6,249
Valuation techniques used to derive level 2 and level 3 fair valuesThe fair value of financial instruments that are not traded in an active market (for example, over-the-counter derivatives) is determined using valuation techniques which maximise the use of observable market data where it is available and rely as little as possible on the entity specific estimates.
If all significant inputs required to fair value an instrument are observable, the instrument is included in level 2. If one or more of the significant inputs is not based on observable market data, the instrument is included in level 3. This is the case for unlisted equity securities. Specific valuation techniques used to value financial instruments include:
• The use of quoted market prices or dealer quotes for similar instruments.
• The fair value of interest rate swaps is calculated as the present value of the estimated future cash flows based on observable yield curves.
• Other techniques, such as discounted cash flow analysis, are used to determine fair value for the remaining financial instruments.

BOQ Group – 2015 Half Year Results
47
3.4. PROVISIONS FOR IMPAIRMENT
Consolidated
28 February 2015 $m
31 August 2014 $m(1)
Specific provision:
Balance at the beginning of the period 153 151
Add: Expensed during the period 31 45
Add: BOQ Specialist provisions acquired - 8
Less: Amounts written off against specific provision (47) (48)
Transfers from collective provision 1 1
Unwind of present value discount (4) (4)
Balance at the end of the period 134 153
Collective provision:
Balance at the beginning of the period 137 134
Additions/(Releases) during the period 5 (3)
Add: BOQ Specialist provisions acquired - 7
Transfers to specific provision (1) (1)
Balance at the end of the period 141 137
Total provisions for impairment 275 290
(1) Six months to 31 August 2014.

48
BOQ Group – 2015 Half Year Results
3.5. DEBT ISSUES INCLUDING SUBORDINATED NOTESThe Consolidated Entity recorded the following movements on debt issues including subordinated notes:
Securitisation liabilities (1) Debt issues (2)
Borrowings including
subordinated notes
Convertible Preference
Shares (3)
Syndicated Loan Total
$m $m $m $m $m $m
Half-year ended 28 February 2015
Balance at the beginning of the period 5,510 2,213 347 294 - 8,364
Proceeds from issues 1,252 1,284 - - - 2,536
Repayments (1,302) (269) (22) - - (1,593)
Deferred establishment costs (2) - - - - (2)
Amortisation of deferred costs 2 - - 1 - 3
Foreign exchange translation 30 40 - - - 70
Balance at the end of the period 5,490 3,268 325 295 - 9,378
Securitisation liabilities (1) Debt issues (2)
Borrowings including
subordinated notes
Convertible Preference
Shares (3)
Syndicated Loan Total
$m $m $m $m $m $m
Half-year ended 28 February 2014
Balance at the beginning of the period 5,824 1,587 270 293 223 8,197
Proceeds from issues 471 914 - - - 1,385
Repayments (883) (789) - - - (1,672)
Deferred establishment costs (2) - - - - (2)
Amortisation of deferred costs 4 - - - 1 5
Foreign exchange translation 28 3 - - - 31
Balance at the end of the period 5,442 1,715 270 293 224 7,944
(1) Securitisation liabilities are secured by a floating charge over securitised assets for amounts owing to noteholders and any other secured creditors of the securitisation vehicles.
(2) Debt issues consists of the Euro Medium Term Notes and European Commercial Paper programs along with the Group’s Transferable Certificates of Deposit (TCD’s). The Group has reclassified its TCD’s from deposits to debt issues in order to better reflect the underlying substance and nature of these balances, with contractual terms being on average greater than twelve months. The effect of this change for the current period is an increase to total debt issues including subordinated notes of $3.1 billion (Aug 2014: $1.8 billion) with a corresponding reduction in deposits. Further to this, proceeds from issues and repayments have increased by $1.3 billion (Aug 2014: $914 million) and $269 million (Aug 2014: $789 million) respectively, as the Bank took advantage of recent credit upgrades and favourable markets to term out its wholesale funding profile.
(3) On 24 December 2012 the Bank issued 3,000,000 Convertible Preference Shares (“CPS”). Each CPS is a fully-paid, perpetual, convertible, unguaranteed and unsecured preference share with preferred, discretionary, non-cumulative dividends. Subject to prior written approval of APRA the Bank is entitled to convert, redeem or transfer some or all of the CPS on the optional conversion / redemption date of 15 April 2018. This entitlement also arises on the occurrence of a regulatory or tax event, otherwise the CPS will mandatorily convert into ordinary shares on 15 April 2020. CPS rank for payment of capital ahead of ordinary shareholders but behind all depositors and other creditors.

BOQ Group – 2015 Half Year Results
49
SECTION 4. OTHER NOTES4.1. INTANGIBLE ASSETS
As part of the Bank’s periodic assessment of the carrying value of intangible assets, impairment indicators were identified with respect to specific internally generated software development projects. These projects focused on customer relationship management with the impairment indicators identified being the failure of the projects to meet operational and regulatory requirements and the Bank has raised an impairment of $10 million.
As a result, detailed reviews were conducted and the recoverable amounts ascertained were lower than the carrying amount. The subsequent impairment loss was recognised in the profit and loss in the current reporting period.
The Group has not identified any cash generating units for which the carrying amount of Goodwill exceeds the recoverable amount and as such there have been no impairments of Goodwill recognised for the period.
4.2. RELATED PARTIES
Arrangements for related parties are consistent with those disclosed in the 31 August 2014 Consolidated Annual Financial Report.
4.3. CONTINGENT LIABILITIES
The Group has no material contingent liabilities as at 28 February 2015.
As at 31 August 2014 the Group disclosed a contingent liability in respect of the ongoing Storm Financial proceedings. On 22 September 2014, the Bank announced an agreement to settle the outstanding Storm Financial proceedings which had been brought against the Group by the Australian Securities and Investment Commission (“ASIC”) and a class action on behalf of borrowers advised by Storm Financial. On 16 December 2014 the Federal Court approved the deed of settlement between the Bank and the lead applicants. This settlement concludes both of the outstanding Storm Financial proceedings against the Bank.
The financial effect of this was brought to account in the Consolidated Annual Financial Report for the year ended 31 August 2014.
4.4. EVENTS SUBSEQUENT TO BALANCE DATE
No matters or circumstances have arisen since the end of the financial half year and up until the date of this report which significantly affect the operations of the Bank, the results of those operations, or the state of affairs of the Bank in subsequent years. The Bank has declared an interim dividend to be paid in May 2015. Further details with respect to the dividend amount per share, payment date and dividend re-investment plan can be obtained from Section 2.2.

50
BOQ Group – 2015 Half Year Results
Directors’ Declaration
In the opinion of the Directors of Bank of Queensland Limited (“the Bank”):
(a) the consolidated interim financial statements and accompanying notes, set out on pages 34 to 49 are in accordance with the Corporations Act 2001, including:
(i) giving a true and fair view of the financial position of the Consolidated Entity as at 28 February 2015 and of its performance, for the half-year ended on that date; and
(ii) complying with Australian Accounting Standard AASB 134: Interim Financial Reporting and the Corporations Regulations 2001.
(b) there are reasonable grounds to believe that the Bank will be able to pay its debts as and when they become due and payable.
Dated this twenty-fifth day of March 2015.
Signed in accordance with a resolution of the Directors:
Roger Davis Chairman
Jon Sutton Managing Director and CEO

BOQ Group – 2015 Half Year Results
51
Independent auditor’s review report to the members of Bank of Queensland Limited
Report on the financial report
We have reviewed the accompanying consolidated interim financial report of Bank of Queensland Limited, which comprises the Consolidated Balance Sheet as at 28 February 2015, Consolidated Income Statement, Consolidated Statement of Comprehensive Income, Consolidated Statement of Changes in Equity and Consolidated Statement of Cash Flows for the half-year ended on that date, Condensed Notes to the Consolidated Interim Financial Statements (Section 1.1 to 4.4) comprising a summary of significant accounting policies and other explanatory information and the Directors’ Declaration of the Group, comprising the Bank of Queensland Limited and the entities it controlled at the half-year’s end or from time to time during the half-year.
Directors’ responsibility for the half-year financial report
The directors of the Bank of Queensland Limited are responsible for the preparation of the consolidated interim financial report that gives a true and fair view in accordance with Australian Accounting Standards and the Corporations Act 2001 and for such internal control as the directors determine is necessary to enable the preparation of the consolidated interim financial report that is free from material misstatement, whether due to fraud or error.
Auditor’s responsibility
Our responsibility is to express a conclusion on the consolidated interim financial report based on our review. We conducted our review in accordance with Australian Auditing Standards. These Auditing Standards require that we comply with relevant ethical requirements relating to audit engagements and plan and perform the audit to obtain reasonable assurance whether the consolidated interim financial report is free from material misstatement.
A review of a consolidated interim financial report consists of making enquiries, primarily of persons responsible for financial and accounting matters, and applying analytical and other review procedures. A review is substantially less in scope than an audit conducted in accordance with Australian Auditing Standards and consequently does not enable us to obtain assurance that we would become aware of all significant matters that might be identified in an audit. Accordingly, we do not express an audit opinion.
Independence
In conducting our review, we have complied with the independence requirements of the Corporations Act 2001.
Conclusion
Based on our review, which is not an audit, we have not become aware of any matter that makes us believe that the consolidated interim financial report of Bank of Queensland Limited is not in accordance with the Corporations Act 2001, including:
(a) giving a true and fair view of the Group’s financial position as at 28 February 2015 and of its performance for the half-year ended on that date; and
(b) complying with Australian Accounting Standard AASB 134 Interim Financial Reporting and the Corporations Regulations 2001.
KPMG
Martin McGrath
PartnerSydney
25 March 2015
KPMG, an Australian partnership and a member firm of the KPMG network of independent member firms affiliated with KPMG International Cooperative (“KPMG International”), a Swiss entity. Liability limited by a scheme approved under Professional Standards Legislation.

52
BOQ Group – 2015 Half Year Results
6. APPENDICES6.1 ASX APPENDIX 4DCross Reference Index Page
Details of reporting period and previous period (Rule 4.2A.3 Item No. 1) Inside front cover
Results for Announcement to the Market (Rule 4.2A.3 Item No. 2) Inside front cover
Net tangible assets per security (Rule 4.2A.3 Item No. 3) 52
Details of entities over which control has been gained or lost (Rule 4.2A.3 Item No. 4) 52
Dividends (Rule 4.2A.3 Item No. 5) Consolidated Interim Financial Report Page 42
Dividends dates (Rule 4.2A.3 Item No. 5) Consolidated Interim Financial Report Page 42
Dividend Reinvestment Plan (Rule 4.2A.3 Item No. 6) Consolidated Interim Financial Report Page 42
Details of associated and joint venture entities (Rule 4.2A.3 Item No. 7) 52
Foreign Entities (Rule 4.2A.3 Item No. 8) Not applicable
Details of entities over which control has been gained or lost (Rule 4.2A.3 Item No. 4). There were no entities over which the Bank gained or lost control during the period.
Details of associated and joint venture entities (Rule 4.2A.3 Item No. 7) (1) Ownership interest held (%)
Ocean Springs Pty Ltd 9.31%
Dalyellup Beach Pty Ltd 17.08%
Wanneroo North Pty Ltd 21.42%
East Busselton Estate Pty Ltd 25.00%
Coastview Nominees Pty Ltd 5.81%
Provence 2 Pty Ltd 25.00%
As at
Net tangible assets per security (Rule 4.2A.3 Item No. 3) Feb-15 Aug-14 Feb-14
Net tangible assets per ordinary share ($) (2) 7.01 6.93 7.06
(1) The principal activity of the joint venture entities is land subdivision, development and sale. These investments were acquired as part of the Home Building Society acquisition in 2007.
(2) Represents net assets excluding intangible assets, preference shares and other equity instruments divided by ordinary shares on issue at the end of the period.

BOQ Group – 2015 Half Year Results
53
6.2 RECONCILIATION OF STATUTORY PROFIT TO CASH EARNINGS
The Cash Earnings provided is used by Management to present a clear view of our underlying operating results. In alignment with industry practice, we exclude those items that introduce volatility and distort current period performance to allow for a more effective comparison of performance across reporting periods.
The key movement in the difference between the Bank’s Statutory Profit and its Cash Earnings reflects the 2014 provision for settlement of the outstanding Storm Financial proceedings included in the August 2014 half. Integration costs following the acquisition of BOQ Specialist continued to be incurred this half and are in line with market guidance provided on acquisition to this point of integration.
(a) Reconciliation of Cash Earnings to Statutory Net Profit after tax
$ million
Half Year PerformanceFeb 15 vs
Aug 14Feb 15 vs
Feb 14Feb-15 Aug-14 Feb-14
Cash Earnings after Tax 167 161 140 4% 19%
Amortisation of customer contracts (acquisition) (5) (4) (2) 25% 150%
Hedge ineffectiveness 1 (1) (1) n/a n/a
Government Guarantee break fee - - (1) - n/a
Integration / due diligence costs (8) (8) - - n/a
Legacy items (1) (22) (1) (95%) -
Statutory Net Profit after Tax 154 126 135 22% 14%
(b) Non-cash Earnings Reconciling items
$ million
Cash Earnings Feb-15 VMA
Amortisation of customer contracts
(acquisition)Hedge
ineffectiveness Integration Legacy items
Statutory Net Profit
Feb-15
Net Interest Income 448 - - - (5) - 443
Non-Interest Income 84 8 - 2 - - 94
Total Income 532 8 - 2 (5) - 537
Operating Expenses (256) (8) (5) - (6) (1) (276)
Underlying Profit 276 - (5) 2 (11) (1) 261
Loan Impairment Expense (36) - - - - - (36)
Profit before Tax 240 - (5) 2 (11) (1) 225
Income Tax Benefit/(Expense) (73) - - (1) 3 - (71)
Profit after Tax 167 - (5) 1 (8) (1) 154

54
BOQ Group – 2015 Half Year Results
6.2 RECONCILIATION OF STATUTORY PROFIT TO CASH EARNINGS (CONTINUED)
(c) Operating Cash Expenses (excluding BOQ Specialist)
Half Year PerformanceFeb 15 vs
Aug 14 Feb 15 vs
Feb 14Feb-15 Aug-14 Feb-14
General expenses
Advertising 6 7 5 (14%) 20%
Commissions to Owner Managed Branches 3 3 3 - -
Communications and postage 9 10 10 (10%) (10%)
Printing and stationery 2 2 2 - -
Non-lending losses 1 1 1 - -
Processing costs 13 13 13 - -
Other operating expenses 20 5 10 n/a 100%
54 42 44 29% 23%
Other expenses
Professional fees 5 5 5 - -
Directors’ fees 1 1 1 - -
Other 3 2 3 50% -
9 8 9 13% -
IT expenses
Data processing 31 32 31 (3%) -
Amortisation and impairment – computer software (intangible) 8 7 7 14% 14%
Depreciation – IT equipment 1 1 1 - -
40 40 39 - 3%
Occupancy expenses
Lease rental 18 16 12 13% 50%
Depreciation - plant, furniture, equipment and leasehold improvements
4 4 4 - -
Other 2 2 1 - 100%
24 22 17 9% 41%
Employee expenses
Salaries and wages 74 76 68 (3%) 9%
Superannuation contributions 8 7 6 14% 33%
Payroll tax 5 5 5 - -
Equity settled transactions 4 4 4 - -
Other 3 4 3 (25%) -
94 96 86 (2%) 9%
Total Operating Expenses 221 208 195 6% 13%

BOQ Group – 2015 Half Year Results
55
6.2 RECONCILIATION OF STATUTORY PROFIT TO CASH EARNINGS (CONTINUED)
(c) Operating Cash Expenses (excluding BOQ Specialist) General ExpensesThe increase from the prior period reflected impairment of the pilot CRM system for $10 million. Other operating expenses were lower last half due to receipts of indirect tax credits relating to prior years.
Other ExpensesProfessional and director fees have remained flat over the current and prior reported periods.
IT ExpensesExpenses reduced slightly from the prior half as savings from the new IT outsourcing agreement were realised, the full benefits should be seen in future reporting periods.
Occupancy ExpensesThe increase in property expenses includes the one-off impact for the consolidation of the Brisbane Support Centre this half, increased rental costs during the transition to the new premises at Newstead and onerous leases provisions.
Employee Expenses Salaries are consistent with prior half and reflect the investment in frontline capability across Business Banking, broker support and mobile teams last year.
6.3 CASH EPS CALCULATIONS
Half Year PerformanceFeb 15 vs
Aug 14Feb 15 vs
Feb 14Feb-15 Aug-14 Feb-14
Basic EPS (cents) 45.8 46.3 43.2 (1%) 6%
Diluted EPS (cents) 44.8 45.0 41.8 - 7%
Reconciliation of Cash Earnings for EPS
Cash Earnings available for ordinary shareholders ($ million) 167 161 140 4% 19%
Add: Convertible Preference Shares (“CPS”) Dividend ($ million) 8 8 8 - -
175 169 148 4% 18%
Weighted Average Number of Shares (“WANOS”)(1)
Basic WANOS ($ million) 365 348 324 5% 13%
Add: Effect of award rights ($ million) 3 3 3 - -
Add: Effect of CPS ($ million) 23 25 27 (8%) (15%)
Diluted WANOS ($ million) 391 376 354 4% 10%
(1) February 2014 basic earnings per share have been adjusted for the effect of the entitlement offer that occurred during the financial year and rounding adjustments.
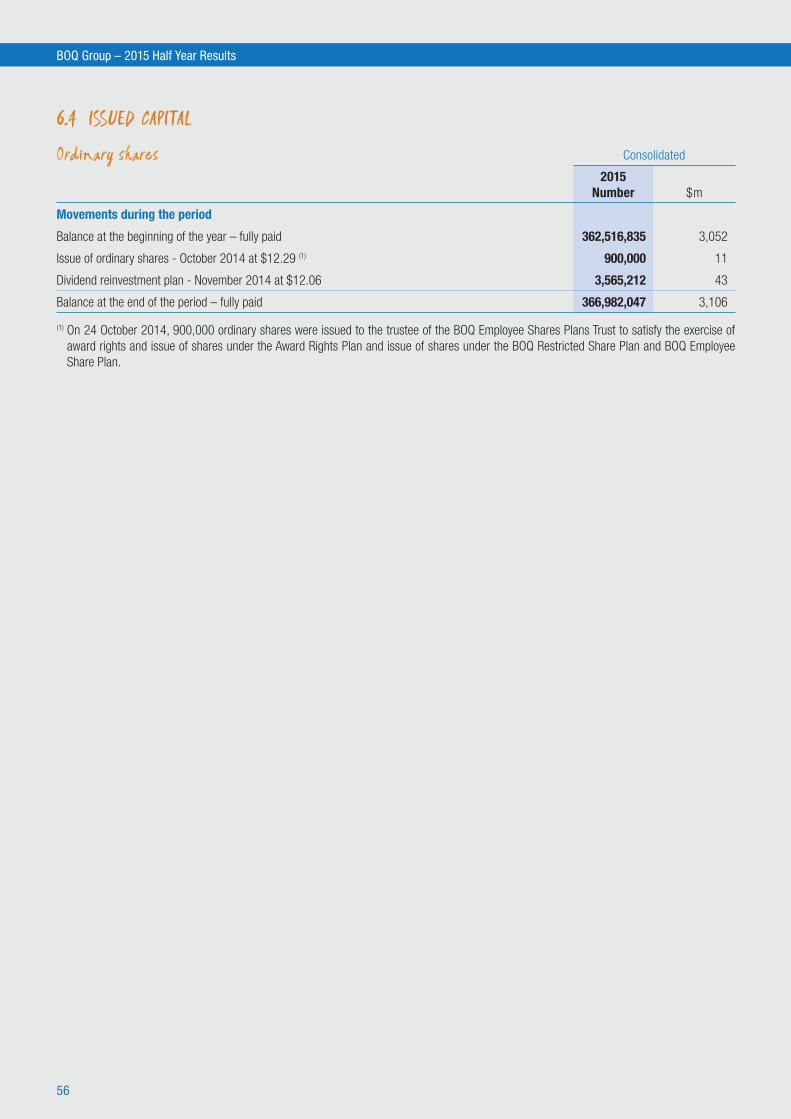
56
BOQ Group – 2015 Half Year Results
6.4 ISSUED CAPITAL
Ordinary shares Consolidated
2015 Number $m
Movements during the period
Balance at the beginning of the year – fully paid 362,516,835 3,052
Issue of ordinary shares - October 2014 at $12.29 (1) 900,000 11
Dividend reinvestment plan - November 2014 at $12.06 3,565,212 43
Balance at the end of the period – fully paid 366,982,047 3,106
(1) On 24 October 2014, 900,000 ordinary shares were issued to the trustee of the BOQ Employee Shares Plans Trust to satisfy the exercise of award rights and issue of shares under the Award Rights Plan and issue of shares under the BOQ Restricted Share Plan and BOQ Employee Share Plan.

BOQ Group – 2015 Half Year Results
57
6.5 AVERAGE BALANCE SHEET AND MARGIN ANALYSIS
February 2015 August 2014
Average Balance
$mInterest
$m
Average Rate %
Average Balance
$mInterest
$m
Average Rate %
Interest earning assets
Gross loans & advances at amortised cost 39,083 1,034 5.34 36,027 970 5.34
Investments & other securities 6,841 107 3.15 6,391 102 3.17
Total interest earning assets 45,924 1,141 5.01 42,418 1,072 5.01
Non-interest earnings assets
Property, plant & equipment 58 47
Other assets 1,580 1,376
Provision for impairment (286) (285)
Total non-interest earning assets 1,352 1,138
Total assets 47,276 43,556
Interest bearing liabilities
Retail deposits 26,343 383 2.93 24,219 379 3.10
Wholesale deposits & borrowings 16,674 310 3.75 15,445 294 3.78
Total interest bearing liabilities 43,017 693 3.25 39,664 673 3.37
Non-interest bearing liabilities 886 723
Total Liabilities 43,903 40,387
Shareholders’ funds 3,373 3,169
Total liabilities & shareholders’ funds 47,276 43,556
Interest margin & interest spread
Interest earning assets 45,924 1,141 5.01 42,418 1,072 5.01
Interest bearing liabilities 43,017 693 3.25 39,664 673 3.37
Net interest spread 1.76 1.64
Benefit of net interest-free assets, liabilities and equity 0.21 0.23
Net interest margin on average interest earning assets
45,924 448 1.97 42,418 399 1.87

58
BOQ Group – 2015 Half Year Results
6.6 DISTRIBUTION FOOTPRINTWe continue to optimise our ‘Customer in Charge’ strategy to respond to an evolving market place and allow customers to engage with us through
the medium of their choice. This includes face to face in our Owner Managed or Corporate branches, with mobile bankers and brokers, through
digital and mobile channels, via social media or on the telephone to our award winning Perth based customer service centre or our recently opened
Gold Coast customer service centre.
Branch numbers reduced by ten in the half which included a number of consolidations. Branch productivity continues to increase, rising 2.1% to
$194 million at February 2015.
Broker channel expansion further accelerated this period with another 746 brokers to take the total accredited to 1,932 brokers at February 2015.
The majority of these brokers are providing portfolio diversification outside of Queensland, however this half saw the addition of 262 brokers in
Queensland which should be supported by the strong brand appeal in our home state.
15
41
1
2
11
94
5
13 26
WA
NT
NSW & ACT
SA
TAS
VIC
QLD
transaction centres8
8 317 473
75 1991 253
733
2
839128
2 37
599
2,428 redi atm’s
boq branded ATM’s
corporate branches75
owner managed branches159
2473
554
brokers1,932
507 107
16
285
15
544
458

BOQ Group – 2015 Half Year Results
59
6.7 CREDIT RATINGThe Bank monitors rating agency developments closely. Entities in the Group are rated by Standard and Poor’s, Moody’s Investor Service (“Moody’s”) and Fitch Ratings.
Our current long-term debt ratings are shown below. During the period Fitch changed its long-term debt rating from BBB+ to A- and outlook from Positive to Stable.
Rating Agency Short Term Long Term Outlook
Standard & Poor’s A2 A- Stable
Fitch F2 A- Stable
Moody’s P2 A3 Stable
6.6 DISTRIBUTION FOOTPRINT (CONTINUED)As at Feb-15 QLD NSW / ACT VIC WA NT TAS SA Total
Corporate Branches 41 13 5 15 - - 1 75
Owner Managed branches 94 26 24 11 2 2 - 159
Transaction Centres 8 - - - - - - 8
143 39 29 26 2 2 1 242
As at Aug-14 QLD NSW / ACT VIC WA NT TAS SA Total
Corporate Branches 41 14 6 16 - - 1 78
Owner Managed branches 98 25 27 12 2 2 - 166
Transaction Centres 8 - - - - - - 8
147 39 33 28 2 2 1 252
78 75
166159
8 8
7 2 2 4
Aug-14 Corporate ClosuresOMBs to CorporateOMB Closures/Mergers
Feb-15Corporate to OMBs
Corporate OMBs Transaction Centres
Corporate, Owner Managed Branches (“OMB”) & Transaction centres
252
2421
New Corporate branch
Related Documents