Aalto University School of Science Master’s Programme in Computer, Communication and Information Sciences Teemu Lehtinen Bootstrapping Learning Analytics Case: Aalto Online Learning Master’s Thesis Espoo, November 22, 2017 Supervisor: Professor Lauri Malmi Advisor: Ari Korhonen D.Sc. (Tech.)

Welcome message from author
This document is posted to help you gain knowledge. Please leave a comment to let me know what you think about it! Share it to your friends and learn new things together.
Transcript
Aalto University
School of Science
Master’s Programme in Computer, Communication and Information Sciences
Teemu Lehtinen
Bootstrapping Learning Analytics
Case: Aalto Online Learning
Master’s ThesisEspoo, November 22, 2017
Supervisor: Professor Lauri Malmi
Advisor: Ari Korhonen D.Sc. (Tech.)
Aalto UniversitySchool of ScienceMaster’s Programme in Computer, Communication and In-formation Sciences
ABSTRACT OFMASTER’S THESIS
Author: Teemu Lehtinen
Title: Bootstrapping Learning Analytics
Case: Aalto Online Learning
Date: November 22, 2017 Pages: xii + 74
Major: Computer Science Code: SCI3042
Supervisor: Professor Lauri Malmi
Advisor: Ari Korhonen D.Sc. (Tech.)
The digital transformation of learning brings forth data having unprecedentedgranularity and coverage of learning activity. The research area of Learning An-alytics (LA) uses this data to understand and improve learning. The practiceof LA is a cyclic process where learning data is collected from different sourcesand analytics is developed according to stakeholder objectives. Finally, currentresults are delivered that lead into action which improves learning and producesnew data.
The goal of this thesis is to bootstrap LA in multiple courses that implementdifferent weekly online learning activities. The term bootstrap underlines the aimto support continuity, further development, and expansion of LA. The researchquestions were: what learning data the courses currently instrument, and whatLA objectives the course staff find most important.
This thesis conducts software engineering to construct an LA solution for the re-search case. Requirements are defined via examination of the case and interviewsof the course staff. The developed solution enables real time access to learningdata and possibility to integrate data from both Moodle and A-plus learningenvironments for joined analysis. Novel interactive visualizations are developedaccording to the user requirements.
The work in bootstrapping LA at course level lead to two general findings. First,the integration of learning data from multitude of sources is a common chal-lenge that requires design. Second, teachers’ initial LA objectives include aimsto monitor expected progress, improve allocation of learning material, identifyproblematic areas in learning material, and improve interaction with learners.
Keywords: Learning Analytics, Educational Data Mining, Data Science,Information Visualization
Language: English
ii
Aalto-yliopistoPerustieteiden korkeakouluTieto-, tietoliikenne-, ja informaatiotekniikan maisteriohjelma
DIPLOMITYONTIIVISTELMA
Tekija: Teemu Lehtinen
Tyon nimi: Oppimisanalytiikan kaynnistaminen
Tapaus: Aalto Online Learning
Paivays: 22. marraskuuta 2017 Sivumaara: xii + 74
Paaaine: Computer Science Koodi: SCI3042
Valvoja: Professori Lauri Malmi
Ohjaaja: Tohtori Ari Korhonen
Opetuksen digitaalinen murros synnyttaa ennennakemattoman tarkkaa ja katta-vaa tietoa oppimisaktiviteeteista. Oppimisanalytiikan (OA) tutkimusalue kayttaatata aineistoa oppimisen ymmartamiseen ja parantamiseen. OA:n soveltami-nen kaytantoon on toistuva prosessi, jossa oppimisaineistoa kerataan erilaisis-ta lahteista ja analytiikkaa kehitetaan omistajiensa tavoitteiden mukaisesti. Lo-puksi tuotetaan ajantasaisia tuloksia, jotka johtavat toimintaan, joka parantaaoppimista ja tuottaa uutta aineistoa.
Taman diplomityon tavoitteena on kaynnistaa OA usealla kurssilla, jotka toteut-tavat erilaisia viikoittaisia verkko-oppimisen ratkaisuja. Kaynnistaminen pyrkiielinvoimaiseen, kehittyvaan ja laajenevaan analytiikkaan. Tutkimuskysymyksetolivat, mita dataa kurssit talla hetkella keraavat ja mitka OA–tavoitteet ovatkurssihenkilokunnalle tarkeimpia.
Tyossa rakennetaan ohjelmistotuotannon keinoin OA–ratkaisu tutkittavalle ta-paukselle. Ratkaisun vaatimukset maaritellaan tarkastelemalla tapausta ja haas-tattelemalla kurssien henkilokuntaa. Kehitetyn ratkaisun avulla aineisto on saata-villa reaaliaikaisesti. Lisaksi ratkaisu mahdollistaa aineiston yhdistamisen Moodleja A-plus oppimisymparistoista yhteista analyysia varten. Tyossa suunnitellaanuusia interaktiivisia tiedon visualisointeja kayttajavaatimusten mukaisesti.
Tutkimus OA:n kaynnistamiseksi kurssitasolla tuotti kaksi yleista tulosta. En-siksi aineiston yhdistaminen eri lahteista on tyypillinen haaste, joka vaatii suun-nittelua. Toiseksi opettajien tavoitteita OA:ta aloittaessa ovat valvoa odotettuaedistymista, parantaa oppimateriaalin mitoitusta, tunnistaa ongelmakohtia oppi-materiaalissa ja parantaa vuorovaikutusta opiskelijoiden kanssa.
Asiasanat: Oppimisanalytiikka, Oppimisen tiedonlouhinta, Datatiede,Informaation visualisointi
Kieli: Englanti
iii
Acknowledgements
I am immensely grateful for the privilege of my journey to science. I wantto thank professor Lauri Malmi and senior university lecturer Ari Korhonenfor patient guidance and inspiring discussions. I have shared room and col-laborated with many colleagues of whom I name Otto, Lassi, Teemu, Aleksi,Juha, Samuel, Tapio, Kerttu, Petri, Matias, Jaakko, Timi, Markku, Daniel,Mario, Petteri, and Tommi. Thank you and the other great people in AaltoUniversity for your support.
I am also forever indebted, for the same years, to all my ex–neighborsat Vanajantie. My godchildren illuminate the future. I thank you and yourfamilies as well as other friends for inviting me in your lives.
My parents have enabled me, despite their odds, cost, worry, shame, andtime, to reach anything I could wish for in my life. I am proud of my bigbrother and little sister whose footsteps I follow. Lastly, I thank my dailylistening audience and feline overlords H. and H.
Espoo, November 22, 2017
Teemu Lehtinen
iv
Abbreviations and Acronyms
AA Academic Analytics. A research field that addressesinstitutional, national, and international goals to im-prove learning via analysis of data from educationalsources. The thesis considers AA as a field includedin LA.
A!OLE Aalto Online Learning. A development project atAalto University that seeks to pioneer online learningexperiences to improve learning results and to sharerelated knowledge and tools in the university.
API Application Programming Interface. A definition ofhow computer programs or parts of them communi-cate with each other. Another program may exchangedata with a service that defines an API to use it.
BI Business Intelligence. The practice of analyzing datato help businesses make more informed business deci-sions.
CSS Cascading Style Sheet. A language that describes pre-sentation, such as color, font, border, or position, ofelements in web documents.
CSV Comma Separated Values. A simplistic file format tostore tabular data.
DOM Document Object Model. A programming API to ac-cess and modify elements in web documents.
v
ECTS European Credit Transfer System. A standard creditunit of studies that was created to help internationalstudies in Europe. Depending on the course and thestudent 1 ECTS is estimated to take 25–30 studyhours.
EDM Educational Data Mining. A research field that em-ploys data mining methods to extract value from edu-cational data sources in order to understand and im-prove learning. The thesis considers EDM as a fieldincluded in LA.
GNU GNU’s Not Unix. A project started in 1983 to createa free open–source operating system. The name is arecursive acronym.
GPL GNU General Public License. A popular open–sourcesoftware license that requires derivate work to use thesame license.
HTTP Hypertext Transfer Protocol. The definition and rulesthat enables the internet media and communicationknown as World Wide Web.
JSON JavaScript Object Notation. A structured data for-mat that is written in a subset of the JavaScriptprogramming language. It is human readable andwritable while having comprehensive and efficient sup-port in different programming languages and environ-ments.
LA Learning Analytics. Research, development, andpractice related to collecting, analyzing, and present-ing data from educational sources in order to under-stand and improve learning.
LLAMA An animal related to camel or “la lumiere a Montagneanalytique”. The latter one is a visualization client forlearning analytics that this thesis contributes.
LMS Learning Management System. A software systemthat administrates and delivers educational resourcesand tools. Virtual Learning Environment (VLE) is asynonymous term.
vi
LRS Learning Record Store. A data warehouse that storesand retrieves learning activity statements using xAPIstandard.
MIT Massachusetts Institute of Technology. A universitymentioned in this thesis in context of MIT license thatis a permissive open–source software license. MIT li-censed software can be integrated into GPL softwarebut not vice versa.
MVC Model–View–Controller. A design pattern that sepa-rates program modules into a model that stores andaccesses data, a view that represents user interface,and a controller that includes application logic.
MOOC Massive Open Online Course. Educational coursesthat are available online and accept anyone as a stu-dent. Therefore, large number of students is expected.
ORM Object–Relational Mapping. A solution that mapsobjects defined in a programming language to a dif-ferent type of data, such as persistent records in arelational database.
SaaS Software–as–a–Service. The software vendor is re-sponsible for constantly delivering and maintainingthe software for the users. These requirements aresatisfied by offering the software using web technolo-gies via a web browser.
SQL Structured Query Language. A language to create,retrieve, update, and delete data from a database.
URL Uniform Resource Locator. A system to name or ad-dress unique resources in internet.
VLE Virtual Learning Environment. A software systemthat administrates and delivers educational resourcesand tools. Learning Management System (LMS) is asynonymous term.
xAPI Experience API. An API that defines how learningtool, such as LMS, communicates with LRS.
vii
Contents
Abbreviations and Acronyms iv
1 Introduction 1
1.1 Digital Transformation in Learning . . . . . . . . . . . . . . . 11.2 Online Learning in Aalto University . . . . . . . . . . . . . . . 21.3 Research Goals and Questions . . . . . . . . . . . . . . . . . . 31.4 Research Methods . . . . . . . . . . . . . . . . . . . . . . . . . 41.5 Thesis Structure . . . . . . . . . . . . . . . . . . . . . . . . . . 5
2 Learning Analytics 6
2.1 Definition . . . . . . . . . . . . . . . . . . . . . . . . . . . . . 62.2 Stakeholders . . . . . . . . . . . . . . . . . . . . . . . . . . . . 7
2.2.1 Learners . . . . . . . . . . . . . . . . . . . . . . . . . . 82.2.2 Educators . . . . . . . . . . . . . . . . . . . . . . . . . 92.2.3 Institutions . . . . . . . . . . . . . . . . . . . . . . . . 92.2.4 Researchers . . . . . . . . . . . . . . . . . . . . . . . . 102.2.5 Policy Makers . . . . . . . . . . . . . . . . . . . . . . . 10
2.3 Process . . . . . . . . . . . . . . . . . . . . . . . . . . . . . . . 102.3.1 Cycle . . . . . . . . . . . . . . . . . . . . . . . . . . . . 112.3.2 Recognize Stakeholders . . . . . . . . . . . . . . . . . . 122.3.3 Define Objectives . . . . . . . . . . . . . . . . . . . . . 132.3.4 Collect Data . . . . . . . . . . . . . . . . . . . . . . . . 152.3.5 Conduct Analysis . . . . . . . . . . . . . . . . . . . . . 162.3.6 Take Action . . . . . . . . . . . . . . . . . . . . . . . . 182.3.7 Evaluate Process . . . . . . . . . . . . . . . . . . . . . 19
2.4 Software and Standards . . . . . . . . . . . . . . . . . . . . . 202.4.1 Current Learning Analytics Features . . . . . . . . . . 202.4.2 General Analytics Software . . . . . . . . . . . . . . . 232.4.3 Development and Research . . . . . . . . . . . . . . . . 24
viii
3 Aalto Online Learning 27
3.1 The Case . . . . . . . . . . . . . . . . . . . . . . . . . . . . . 273.1.1 Project Goals . . . . . . . . . . . . . . . . . . . . . . . 273.1.2 Stakeholders . . . . . . . . . . . . . . . . . . . . . . . . 293.1.3 Pilot Courses . . . . . . . . . . . . . . . . . . . . . . . 30
3.2 Moodle . . . . . . . . . . . . . . . . . . . . . . . . . . . . . . . 313.2.1 Architecture . . . . . . . . . . . . . . . . . . . . . . . . 323.2.2 Activities and Gradebook . . . . . . . . . . . . . . . . 323.2.3 Events . . . . . . . . . . . . . . . . . . . . . . . . . . . 323.2.4 Reports . . . . . . . . . . . . . . . . . . . . . . . . . . 333.2.5 Analytics . . . . . . . . . . . . . . . . . . . . . . . . . 33
3.3 A-plus . . . . . . . . . . . . . . . . . . . . . . . . . . . . . . . 343.3.1 Architecture . . . . . . . . . . . . . . . . . . . . . . . . 343.3.2 Exercise and Submission . . . . . . . . . . . . . . . . . 353.3.3 Data Integration . . . . . . . . . . . . . . . . . . . . . 36
4 Teacher Interviews 37
4.1 Related Work . . . . . . . . . . . . . . . . . . . . . . . . . . . 374.2 Method . . . . . . . . . . . . . . . . . . . . . . . . . . . . . . 38
4.2.1 Interviewees . . . . . . . . . . . . . . . . . . . . . . . . 384.2.2 Script . . . . . . . . . . . . . . . . . . . . . . . . . . . 384.2.3 Analysis . . . . . . . . . . . . . . . . . . . . . . . . . . 40
4.3 Results . . . . . . . . . . . . . . . . . . . . . . . . . . . . . . . 414.3.1 Quotes . . . . . . . . . . . . . . . . . . . . . . . . . . . 414.3.2 Summary . . . . . . . . . . . . . . . . . . . . . . . . . 44
4.4 Trustworthiness . . . . . . . . . . . . . . . . . . . . . . . . . . 46
5 Solution 47
5.1 Architectural Design . . . . . . . . . . . . . . . . . . . . . . . 475.1.1 Real Time and Interactive Visualization . . . . . . . . 475.1.2 External Analytics Tools . . . . . . . . . . . . . . . . . 495.1.3 Data Integration . . . . . . . . . . . . . . . . . . . . . 505.1.4 Software Components . . . . . . . . . . . . . . . . . . . 51
5.2 Llama Client . . . . . . . . . . . . . . . . . . . . . . . . . . . 525.2.1 Internal Design . . . . . . . . . . . . . . . . . . . . . . 525.2.2 User Interface Design . . . . . . . . . . . . . . . . . . . 545.2.3 Collective Progress . . . . . . . . . . . . . . . . . . . . 555.2.4 Learning Trajectories . . . . . . . . . . . . . . . . . . . 565.2.5 Learner Beacon . . . . . . . . . . . . . . . . . . . . . . 57
5.3 Service APIs . . . . . . . . . . . . . . . . . . . . . . . . . . . . 585.4 xAPI hook . . . . . . . . . . . . . . . . . . . . . . . . . . . . . 59
ix
6 Evaluation 61
6.1 Access to Learning Data . . . . . . . . . . . . . . . . . . . . . 616.2 Learning Analytics Objectives . . . . . . . . . . . . . . . . . . 626.3 Maintainability and Extendability . . . . . . . . . . . . . . . . 64
7 Conclusions 65
7.1 Acquired Knowledge . . . . . . . . . . . . . . . . . . . . . . . 657.2 Future Work . . . . . . . . . . . . . . . . . . . . . . . . . . . . 66
References 67
A LA Feature Samples 72
B Service API for Llama Client 73
C A-plus Events to xAPI Statements 74
x
List of Tables
1.1 Research Questions. . . . . . . . . . . . . . . . . . . . . . . . . 31.2 Research Goals. . . . . . . . . . . . . . . . . . . . . . . . . . . 4
2.1 Learning Analytics Objective Categories. . . . . . . . . . . . . 142.2 Learning Analytics Dimensions. . . . . . . . . . . . . . . . . . 142.3 Learning Analytics Method Categories. . . . . . . . . . . . . . 172.4 Proposed Evaluation Questions. . . . . . . . . . . . . . . . . . 192.5 Examined Software. . . . . . . . . . . . . . . . . . . . . . . . . 212.6 Current LA Features. . . . . . . . . . . . . . . . . . . . . . . . 21
3.1 Primary Target Courses. . . . . . . . . . . . . . . . . . . . . . 31
4.1 The Interview Script. . . . . . . . . . . . . . . . . . . . . . . . 394.2 Quotes in (T2) Temporal Analytics. . . . . . . . . . . . . . . . 414.3 Quotes in (T3) Progress Analytics. . . . . . . . . . . . . . . . 424.4 Quotes in (T2 ∩ T3) Temporal and Progress Analytics. . . . . 424.5 Quotes in (T4) Learner State Analytics. . . . . . . . . . . . . 434.6 Quotes in (T5) Social Interaction Analytics. . . . . . . . . . . 434.7 Quotes in (T6) Progress Estimation. . . . . . . . . . . . . . . 444.8 Quotes in (T7) Delivery of Analytics Results. . . . . . . . . . 444.9 User Requirements. . . . . . . . . . . . . . . . . . . . . . . . . 45
5.1 Real Time Visualization Support. . . . . . . . . . . . . . . . . 485.2 External Analytics Tools Support. . . . . . . . . . . . . . . . . 50
6.1 Feature Upgrades for External Analytics Tools. . . . . . . . . 626.2 Feature Upgrades for Real Time Visualization. . . . . . . . . . 626.3 Features for Different User Requirements. . . . . . . . . . . . . 63
xi
List of Figures
2.1 Learning Analytics Stakeholders . . . . . . . . . . . . . . . . . 82.2 Proposed Steps of Learning Analytics Process. . . . . . . . . . 12
3.1 A-plus Separation of Concerns. . . . . . . . . . . . . . . . . . 35
5.1 Thesis Contributions. . . . . . . . . . . . . . . . . . . . . . . . 515.2 JavaScript Program Using d3Stream Library. . . . . . . . . . . 535.3 Llama: Collective Progress. . . . . . . . . . . . . . . . . . . . 555.4 Llama: Learning Trajectories. . . . . . . . . . . . . . . . . . . 565.5 Llama: Learner Beacon. . . . . . . . . . . . . . . . . . . . . . 575.6 Django Aggregation Queryset. . . . . . . . . . . . . . . . . . . 595.7 Llama: Data Link. . . . . . . . . . . . . . . . . . . . . . . . . 595.8 A-plus xAPI configuration. . . . . . . . . . . . . . . . . . . . . 60
xii
Chapter 1
Introduction
This thesis discusses Learning Analytics (LA) which concerns analysis of datacollected from activities where people are learning. The thesis contributesa novel software solution that is designed for the particular research case tostart the continuous practice and development of LA.
This chapter introduces the thesis to the reader. First, the current trendsof digital transformation in learning are discussed. Second, the state of on-line learning in Aalto university is summarized. Then, research goals andquestions of this thesis are introduced. Presentation of the applied researchmethod follows. Finally, an overview of the thesis structure ends the intro-duction.
1.1 Digital Transformation in Learning
Our societies are undergoing digital transformation. Computers and internethave become an essential part of our everyday life. People depend on net-worked mobile computers for communication but also for a growing numberof other applications, such as calendar, navigation, or entertainment. Di-rectly or indirectly, our purchases at shops, consuming media, or search forinformation is enabled via internet.
This digital transformation is a source of ongoing revolution on businessmodels and how we people work in our professions. Today, most professionsalready require some form of computing but the change is not over. Thetransformation advances and new ways to use the available computationalpower, networks, and recorded data emerge.
Education is an important part of society and it has not evaded the digitaltransformation. Study records and a lot of curriculum information is storedin databases. More interestingly, with or without guidance students adopt
1
CHAPTER 1. INTRODUCTION 2
digital tools to create content, solve problems, and interact with each other.Educators should enable students to use the new efficient tools in learning.Moreover, new technologies that are specifically designed for learning canfurther improve learning results. As an example, interactive learning mate-rial may provide more personal and timely feedback to a larger number ofstudents than a finite number of educators ever could.
Publishing and accepting learning material online can greatly improveaccess to educational resources and education itself. Many high profile uni-versities around the world have created courses that are completely onlineand are open for anyone to enroll. On platforms, such as Coursera1 or edX2,these massive open online courses (MOOC) can have thousands of students.
However, a less dramatic development is that educators introduce onlinecomponents to courses that retain all or some of their face-to-face learningsessions. This mixture of traditional and online learning is known as blendedlearning. Some disciplines and teaching methods are not as good fit for onlinelearning than others. For example, some disciplines, such as medicine, mayrequire a supervisor that is present to guide the student doing a task.
Today, it is commonplace that courses include online material and as-signments. When students open and interact with this material or submittheir responses these events are recorded. Such granularity and coverage oflearning activity data has not been available before the introduction of on-line learning. This data along with study records can be analyzed to identifypatterns of learning behavior. Such research is known as Learning Analytics(LA).
LA has potential to offer data–driven development to optimize education.Educators can evaluate and detect problems in their material or selection ofteaching methods. Institutions may evaluate challenges in study programs.Ideally, LA may improve the very understanding of learning, and give newinsight to both students and educators.
1.2 Online Learning in Aalto University
Every course in Aalto university has a representation in an institute con-trolled online learning management system (LMS). Effectively, every courseis enabled online to distribute learning material, collect student submissions,create questionnaires, arrange peer review, and manage discussion boards.However, not that many of the courses are actively using the online learning
1https://www.coursera.org2https://www.edx.org
CHAPTER 1. INTRODUCTION 3
components and most rely on traditional face-to-face lectures and labora-tory sessions. In contrast, also several Aalto courses have been arranged asMOOC. Some disciplines, such as computer science or mathematics, havemore tradition in online materials and exercises than others.
Aalto university has an ongoing development project known as AaltoOnline Learning (A!OLE) [Kauppinen and Malmi, 2017]. It seeks to pioneeronline learning experiences to improve learning results and to share relatedknowledge and tools in the university. The project involves a number ofpilot courses in different disciplines. This ensures that new online learningopportunities are currently created in the university.
The online learning activities in Aalto university have great variation.The types and the technical platforms of the activities routinely change fromcourse to course. Currently, access to the data generated in online learningrequires deep knowledge of the platforms. Also a common data format ismissing. Therefore, the past LA efforts in Aalto university have been indi-vidualistic and towards a single course or an exercise type.
1.3 Research Goals and Questions
The goal of this thesis is to bootstrap LA in multiple courses that implementdifferent weekly online learning activities. The term bootstrap underlinesthe aim to support continuity, further development, and expansion of LA.Thus, our research problem includes collection of data from different sources,development of analytics according to stakeholder objectives, and deliveryof current results that can lead into action and development to improvelearning. This thesis presents the first step into LA, that can be extended tonew courses and stakeholders in the future.
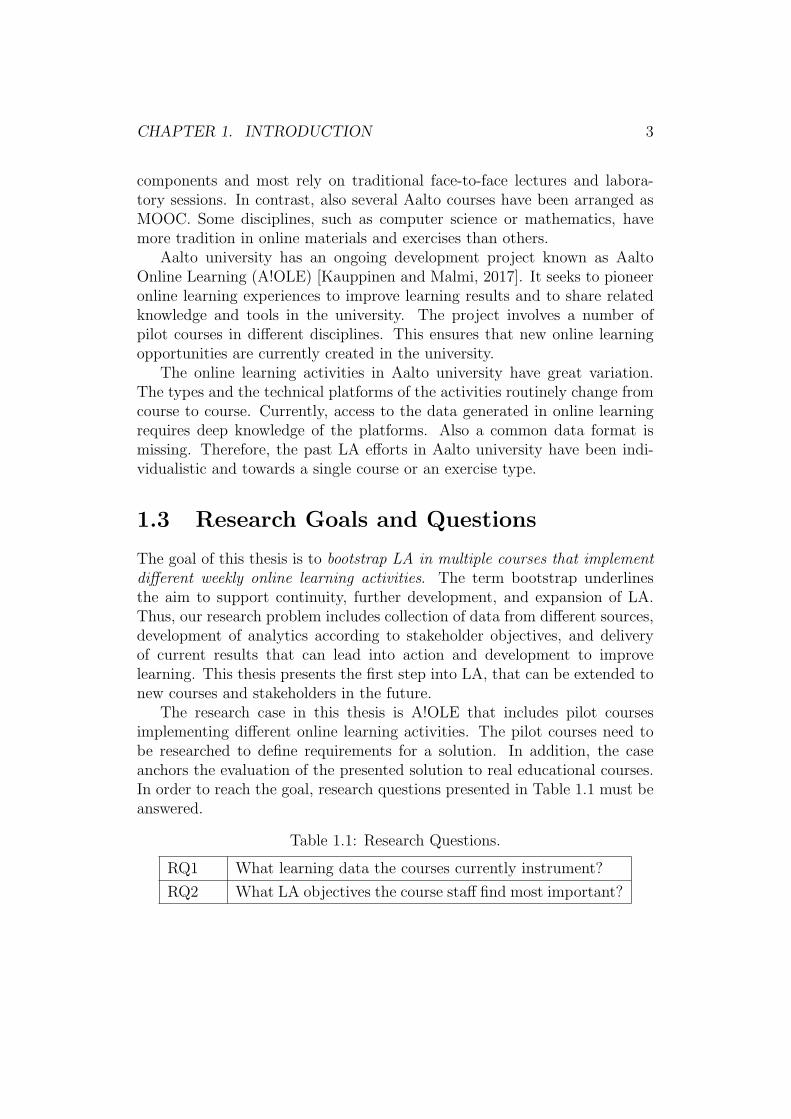
The research case in this thesis is A!OLE that includes pilot coursesimplementing different online learning activities. The pilot courses need tobe researched to define requirements for a solution. In addition, the caseanchors the evaluation of the presented solution to real educational courses.In order to reach the goal, research questions presented in Table 1.1 must beanswered.
Table 1.1: Research Questions.
RQ1 What learning data the courses currently instrument?
RQ2 What LA objectives the course staff find most important?
CHAPTER 1. INTRODUCTION 4
First (RQ1), we need to examine the pilot courses to identify online learn-ing activities and technical learning platforms that are relevant to our case.These produce the learning data that is currently instrumented. We focus onthe currently available data to produce immediate value that increases com-mitment. Differences on data structure and storage on the different platformsadd further requirements for the developed solution.
Second (RQ2), we want to identify the LA objectives that the course stafffind most important. LA has a number of stakeholders, such as learners, ed-ucators, administrators, and researchers [Korhonen and Multisilta, 2016].However, if the course staff does not have ownership in LA, it is likely thatthey neglect to systematically design instruments necessary to produce de-tailed data of learners in future. The objectives are discovered via qualitativeanalysis of staff interviews.
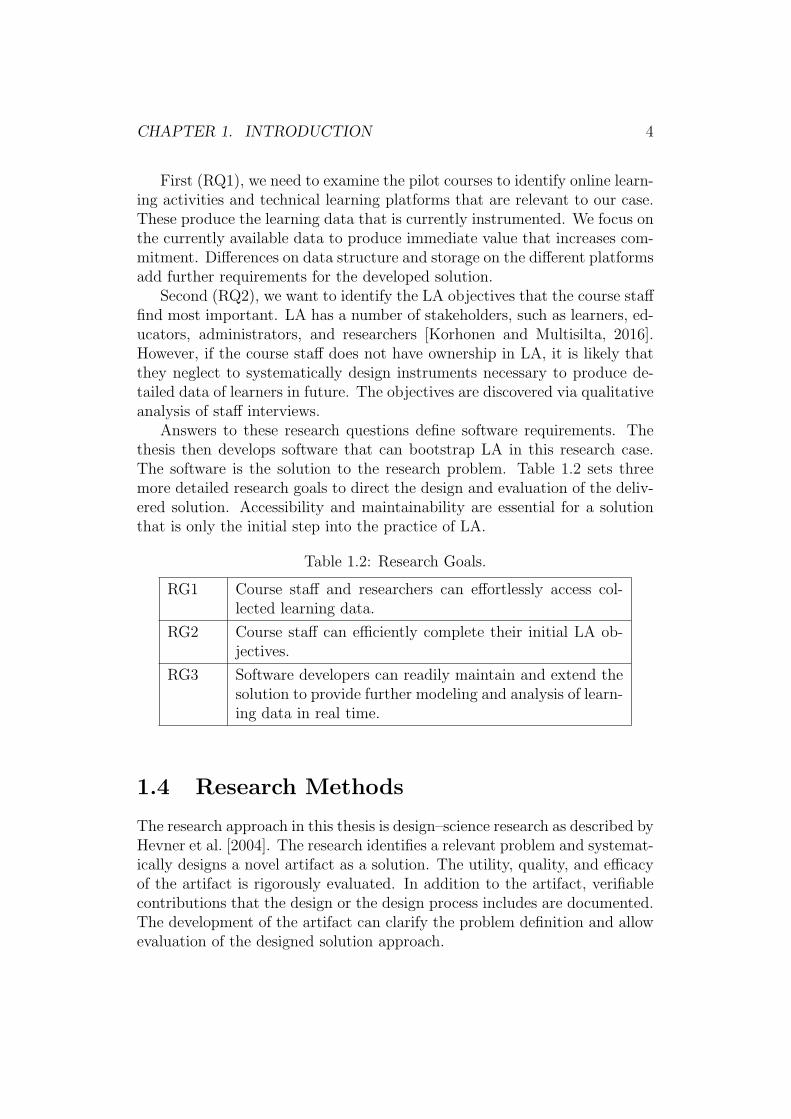
Answers to these research questions define software requirements. Thethesis then develops software that can bootstrap LA in this research case.The software is the solution to the research problem. Table 1.2 sets threemore detailed research goals to direct the design and evaluation of the deliv-ered solution. Accessibility and maintainability are essential for a solutionthat is only the initial step into the practice of LA.
Table 1.2: Research Goals.
RG1 Course staff and researchers can effortlessly access col-lected learning data.
RG2 Course staff can efficiently complete their initial LA ob-jectives.
RG3 Software developers can readily maintain and extend thesolution to provide further modeling and analysis of learn-ing data in real time.
1.4 Research Methods
The research approach in this thesis is design–science research as described byHevner et al. [2004]. The research identifies a relevant problem and systemat-ically designs a novel artifact as a solution. The utility, quality, and efficacyof the artifact is rigorously evaluated. In addition to the artifact, verifiablecontributions that the design or the design process includes are documented.The development of the artifact can clarify the problem definition and allowevaluation of the designed solution approach.
CHAPTER 1. INTRODUCTION 5
This thesis conducts software engineering to construct the LA solutionfor the research case. The software engineering process follows the waterfallmodel and includes requirements definition, architectural design, implemen-tation and unit testing, and finally validation [Sommerville, 2011]. As a partof the process, we research user requirements using semi-structured inter-views [Bernard, 2012]. The interview method is discussed in Chapter 4.
On large scale, we are solving a previously known problem of LA. How-ever, the bootstrapping goal brings forth a specific problem where charac-teristics of a good solution are not previously defined. The thesis designs anovel solution that improves from previously available solutions to the spe-cific problem which according to Hevner et al. [2004, p. 82] differentiatesdesign–science research from the practice of design.
The structure of the thesis follows the publication schema presented byGregor and Hevner [2013] with the exception that the research method is de-fined already here as a part of the introduction to the thesis. Conforming thepresentation of the research to an existing schema helps to communicate andestablish the contributions of the research. Next, we describe each chapterin this thesis.
1.5 Thesis Structure
This first chapter introduced the reader to the domain, goal, and method ofthe thesis. The second chapter defines LA and reviews related literature andexisting LA solutions. Potential benefits and challenges in the practice anddevelopment of LA are evaluated.
The next two chapters define software requirements for the solution. Thethird chapter explores the A!OLE project to answer the first research questionon collected data. Furthermore, it develops focus on the pilot courses wheredata is currently available. The fourth chapter reports application of userrequirements interviews to answer the second research question on analyticsobjectives.
Then, the fifth chapter presents architectural design and describes soft-ware components that comprise the solution to the problem. The designdecisions that fulfill the defined requirements are documented.
Finally, the sixth chapter evaluates that the solution is useful and animprovement over previously available alternatives. Completion of each re-search goal is evaluated. The thesis ends with conclusive discussion on thethesis work and consideration of contributions to domain knowledge.
Chapter 2
Learning Analytics
This chapter presents the related work. First, it defines Learning Analytics(LA). Discussion of different stakeholders who have interest in this domainfollows. Next, the complete process of LA is defined and the necessary stepsare researched in detail. Finally, the available LA solutions and standardsare examined.
2.1 Definition
Journal of Learning Analytics is dedicated to “research investigating thechallenges of collecting, analyzing, and reporting data with the specific intentto understand and improve learning” [Gasevic et al., 2014, p. 1]. Journalof Educational Data Mining declares that their research community seeks touse “large repositories of educational data” to “better understand learnersand learning, and to develop computational approaches that combine dataand theory to transform practice to benefit learners” [Baker and Yacef, 2009,p. 1]. The research areas of Learning Analytics (LA) and Educational DataMining (EDM) share the same goal of using educational data to understandand improve learning. However, there are different trends and focus betweenthe communities.
Siemens and Baker [2012, p. 253] identify two key differences in researchtrends. In many cases, EDM leverages human judgement to design auto-mated discovery that directly affects learning environment. In contrast, LAoften uses automated discovery to inform humans who make final judgement.The other difference is on holistic vs. reductionistic axis. LA tends to takemore holistic approach to understand systems as wholes while EDM oftenanalyses individual components and their relationships.
6
CHAPTER 2. LEARNING ANALYTICS 7
Ferguson [2012, p. 312] argues that LA and EDM are separate researchfields. LA focuses on the challenge of improving education while EDM fo-cuses on the challenge of extracting value from big educational data sets.Thirdly, Ferguson names Academic Analytics (AA) as closely related yetseparate research field. AA may use same analytics methods as LA but theformer addresses institutional, national, and international stakeholders while,according to the author, LA has focus on course and department level.
Chatti et al. [2012, pp. 321-324] state that “LA concepts and methods aredrawn from a variety of related research fields”. AA and EDM are included inthese related fields by reasoning that is aligned with Ferguson. The authorsview that LA builds upon and as a term encompasses the closely relatedfields.
This thesis uses the term Learning Analytics (LA) widely to refer allresearch, development, and practice related to collecting, analyzing, and pre-senting data from educational sources in order to understand and improvelearning. Similarly to Chatti et al. [2012, p. 324], EDM and AA researchfields are considered encompassed inside LA and are included in the relatedwork of the thesis.
2.2 Stakeholders
LA has a number of different stakeholder groups, including learners, educa-tors, institutions, policy makers, and researchers [Korhonen and Multisilta,2016; Romero and Ventura, 2013; Ferguson, 2012; Chatti et al., 2012; Clow,2012]. This chapter considers stakeholders to form an expectation of possibleLA objectives and challenges.
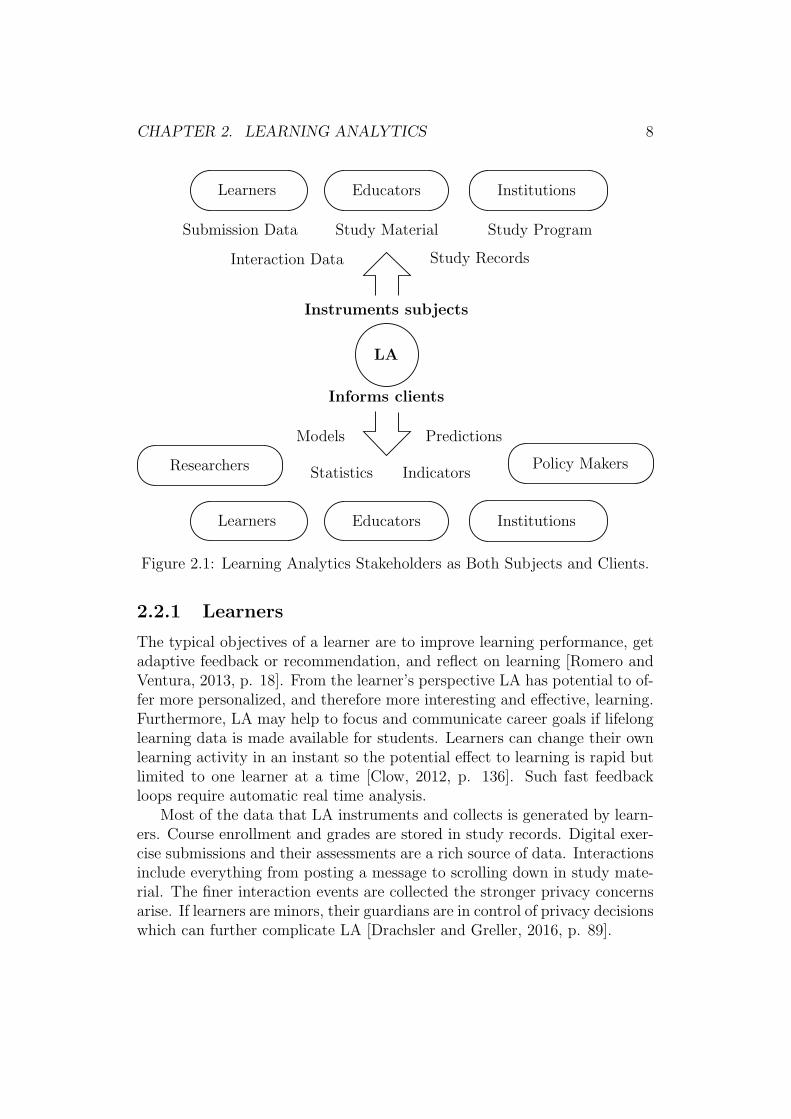
Figure 2.1 presents main stakeholder groups in two different possible re-lations to LA. Greller and Drachsler [2012, p. 45] present the terms subjectsand clients for stakeholders. First, LA may instrument actions and context ofstakeholder subjects to collect data. The subjects may have privacy concerns.They may not want to reveal personal information or they may worry thatincomplete instrumentation leads to wrong analysis on themselves. Second,LA may inform stakeholder clients using different types of results. Opti-mally, the clients have objectives that the LA results help to reach. Thesame stakeholder can also be a subject and a client at the same time.
In the following, we discuss the main stakeholder groups and their po-tential objectives. In addition, LA involves at least system developers. Thethesis assumes that these additional roles take one of the main stakeholderperspectives when they are involved in the LA process. It is also possible thatpersons move from stakeholder group to another when their role changes.
CHAPTER 2. LEARNING ANALYTICS 8
Submission Data
Study RecordsInteraction Data
Study Material Study Program
Instruments subjects
Informs clients
Policy MakersResearchers
LA
Models
Statistics Indicators
Predictions
EducatorsLearners Institutions
EducatorsLearners Institutions
Figure 2.1: Learning Analytics Stakeholders as Both Subjects and Clients.
2.2.1 Learners
The typical objectives of a learner are to improve learning performance, getadaptive feedback or recommendation, and reflect on learning [Romero andVentura, 2013, p. 18]. From the learner’s perspective LA has potential to of-fer more personalized, and therefore more interesting and effective, learning.Furthermore, LA may help to focus and communicate career goals if lifelonglearning data is made available for students. Learners can change their ownlearning activity in an instant so the potential effect to learning is rapid butlimited to one learner at a time [Clow, 2012, p. 136]. Such fast feedbackloops require automatic real time analysis.
Most of the data that LA instruments and collects is generated by learn-ers. Course enrollment and grades are stored in study records. Digital exer-cise submissions and their assessments are a rich source of data. Interactionsinclude everything from posting a message to scrolling down in study mate-rial. The finer interaction events are collected the stronger privacy concernsarise. If learners are minors, their guardians are in control of privacy decisionswhich can further complicate LA [Drachsler and Greller, 2016, p. 89].
CHAPTER 2. LEARNING ANALYTICS 9
Transparency of LA is also important. Learners may be willing to discloseprivate behaviors in order to improve teaching but are afraid the same datacould be used for assessment and grading instead [Chatti et al., 2012, p. 326].
2.2.2 Educators
Educators include teachers and teaching assistants. Also learners can taketemporary educator role, e.g. in seminar courses. Educators have objectivesto improve teaching performance, understand learning processes, and reflecton teaching [Romero and Ventura, 2013, p. 18]. LA can provide automationthat reduces administrative tasks and refines information to highlight thephenomena that educators find interesting in their context. The actions ofan educator may address a group of learners but the change in the actuallearning of a learner typically has a delay of days [Clow, 2012, p. 136].
Educators may also become LA subjects. Interaction events, such asanswers to questions and views of learner profiles, can be interesting forreflection or guidance of efforts. For example, efficiency of educators personalsupport to different students may be evaluated. Study material may providecontextual input about the course design that the educator is responsible for.
Similarly to learners, transparency is important. Educators are typicallyemployees and they should have right to know what data their employercollects and for what objectives [Chatti et al., 2012, p. 326]. For example, ifa teacher designs data collection to develop teaching, the institute must notevaluate the teacher’s performance from this data without mutual agreement.
2.2.3 Institutions
Two different institutional stakeholders, administrators and program lead-ers, have different objectives in focus. Administrative objectives include or-ganization of resources, improvement of student retention, improvement ofstudy progress, and development of student recruitment [Romero and Ven-tura, 2013; Chatti et al., 2012, p. 326]. Previous objectives have often effecton institutional finance and research of AA has provided tools similar tobusiness intelligence tools to help in decision making [Chatti et al., 2012, p.319]. Typical actions include staff training, adaptation of new technology,and services, such as healthcare, that support staff and students.
The focus of program leaders is more similar to educators than adminis-trators. They have responsibilities for learning goals and graduate attributesover all courses included in the program. The study program structure canalso be a direct contextual input to LA. Changes to resources or study pro-gram typically affect multiple educational courses and take semesters to have
CHAPTER 2. LEARNING ANALYTICS 10
effect in learning [Clow, 2012, p. 136].
2.2.4 Researchers
Researchers of education are interested in objectives of the other stakehold-ers in order to find best methods for different education tasks. Ideally, mod-els extracted by LA may help to understand learning and advance learningtheory. Researchers of LA have the objective to improve LA methods andprocess [Romero and Ventura, 2013, p. 18].
As an exception to the other stakeholders, method comparisons often re-quire A/B–test arrangements in data collection and analysis. Also anonymizedlearning data is beneficial for sharing research material and replicating stud-ies. It can solve the privacy issues which are emphasized in national orinternational research. Standard formats of educational data can further ac-celerate evaluating and adapting methods using large studies including mul-tiple courses and institutions. Research does not usually require real timeanalysis. Effect to learning is slow but can affect whole education discipline.
2.2.5 Policy Makers
Also policy makers on both municipal and national level make decisions thataffect education. New policies are best found on well proven research re-sults and align with research objectives. They can enable or accelerate thebest known education methods. New policies typically are a result of demo-cratic process. Policies have national or international effect but have yearsof delay [Clow, 2012, p. 136].
Policies are important to protect privacy and lay the legal framework toconduct LA. Currently, the legal systems are advancing to address privacy,copyright, intellectual property, and data ownership in digital environments.Student exchange may further complicate the legal issues when national lawsdiffer [Siemens, 2013, p. 1394].
2.3 Process
We understand LA as a continuous process where analytics are applied, eval-uated and developed to fulfill stakeholder objectives. Siemens [2013, p. 1391]argues that LA is not only a technical challenge:
The effective process and operation of learning analytics requireinstitutional change that does not just address the technical chal-
CHAPTER 2. LEARNING ANALYTICS 11
lenges linked to data mining, data models, server load, and com-putation but also addresses the social complexities of application,sensemaking, privacy, and ethics alongside the development of ashared organizational culture framed in analytics.
Organization starting LA needs to support the introduction, acceptance, andunderstanding of LA for the whole community including both educators andlearners. Greller and Drachsler [2012, p. 43] describe these social or culturalaspects as soft dimensions in contrast to fact-based hard dimensions. Tech-nically LA operations need to continuously adapt to new requirements, suchas new data sources, methods or tools.
First, the LA process is described in cyclic steps. Then, each step is inves-tigated in detail to consider relevance, options and potential challenges. Thischapter provides a high-level discussion to understand the required steps.Chapter 3 extends to the particular requirements of the case studied in thisthesis.
2.3.1 Cycle
The process of learning analytics is described as an iterative cycle [Romeroand Ventura, 2013; Chatti et al., 2012; Clow, 2012; Siemens, 2013, p. 1392].All the descriptions include the following three steps: data collection, anal-ysis, and action in this order. First, data is the target for analysis. Second,if analysis does not lead to action then learning cannot be improved whichis part of the accepted definition of LA. Finally, changes in learning arepotentially visible in new data which closes the cycle.
Two process descriptions also include a step for refinement and evaluationof the LA itself [Romero and Ventura, 2013; Chatti et al., 2012, p. 324].In this case, not only the data but also the methods of data collection andanalysis or the decided action may change for the next LA iteration.
Clow [2012] adds learners explicitly to the LA process cycle. The datais collected from learners and actions are directed at learners. The authorfinds similarities to learning theories and feedback loops they describe. Afast feedback loop, similar to discussion, would involve automatic analysisresults that are presented to learners in a digital learning environment. Atthe other end of the spectrum, feedback can be very slow and target othergroup of learners and content than where the analyzed data was collectedfrom. The latter would be true for e.g. changing government policies.
Chatti et al. [2012, pp. 324-331] propose a reference model for LA basedon four dimensions: What, Who, Why, and How. ‘What’ relates to thedata collection step, and ‘How’ relates to the analysis step. ‘Who’ is about
CHAPTER 2. LEARNING ANALYTICS 12
LA stakeholders that were discussed in Chapter 2.2. ‘Why’ is an interestingdimension that justifies the whole LA process. This concerns the objectivesthat are relevant to the stakeholders and that can improve learning.
The research fields of teacher inquiry into student learning and learningdesign have been linked with LA [Mor et al., 2015]. Teacher inquiry examinesteacher’s practice and it’s effects on student learning. Therefore, it producesobjectives that LA may be devised to answer. Mor et al. [2015, p. 224]argue that, “We need to be aware that the pedagogical decisions embedded inlearning designs affect both the learning analytics process and its outcomes.”These considerations highlight the importance of the two process steps thatdefine objectives for LA and evaluate LA results.
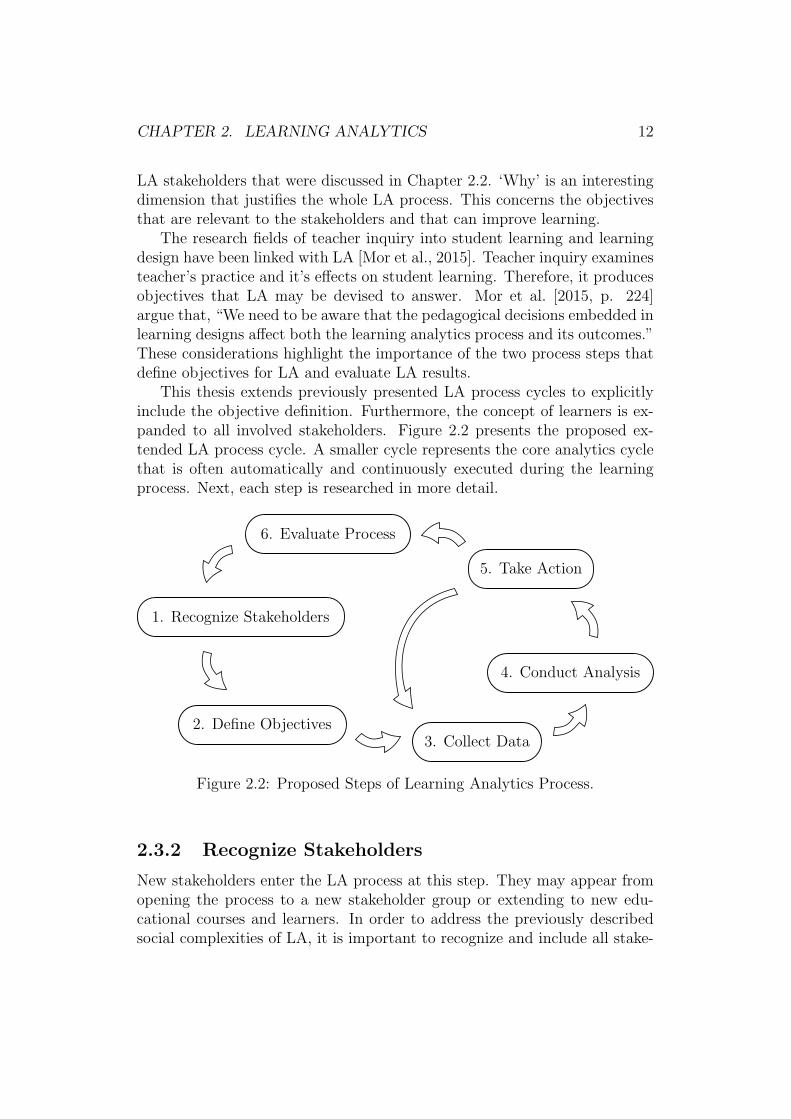
This thesis extends previously presented LA process cycles to explicitlyinclude the objective definition. Furthermore, the concept of learners is ex-panded to all involved stakeholders. Figure 2.2 presents the proposed ex-tended LA process cycle. A smaller cycle represents the core analytics cyclethat is often automatically and continuously executed during the learningprocess. Next, each step is researched in more detail.
1. Recognize Stakeholders
2. Define Objectives3. Collect Data
4. Conduct Analysis
5. Take Action
6. Evaluate Process
Figure 2.2: Proposed Steps of Learning Analytics Process.
2.3.2 Recognize Stakeholders
New stakeholders enter the LA process at this step. They may appear fromopening the process to a new stakeholder group or extending to new edu-cational courses and learners. In order to address the previously describedsocial complexities of LA, it is important to recognize and include all stake-
CHAPTER 2. LEARNING ANALYTICS 13
holders of the process. Chapter 2.2 describes both potential subjects andpotential clients of LA.
This step should include decision on how stakeholders are represented in‘Define Objectives’ and ‘Evaluate Process’. The owner of the LA processshould design communication towards the stakeholders to share understand-ing and add acceptance of LA. Siemens [2013, p. 1391] recommends organi-zations to take “stock of their capacity for analytics and willingness to haveanalytics have an impact on existing processes.” Oster et al. [2016] presentan instrument to evaluate learning analytics readiness of an institution. Inaddition to data management and analysis, the instrument measures cul-ture, communication, policy adaptation, and training. Sclater [2016] definesa comprehensive taxonomy of ethical, legal, and logistical issues.
2.3.3 Define Objectives
LA objectives should be relevant and feasible. The stakeholders can be in-volved to generate objectives that they are interested in. Additionally, LAresearch suggests objectives for different stakeholder groups and reports onthe required data collection and analysis methods to assess feasibility. Also,Teacher Inquiry research [Mor et al., 2015] or applying Action Researchmethod [Chatti et al., 2012, p. 320] can produce LA objectives, such astesting pedagogical decisions.
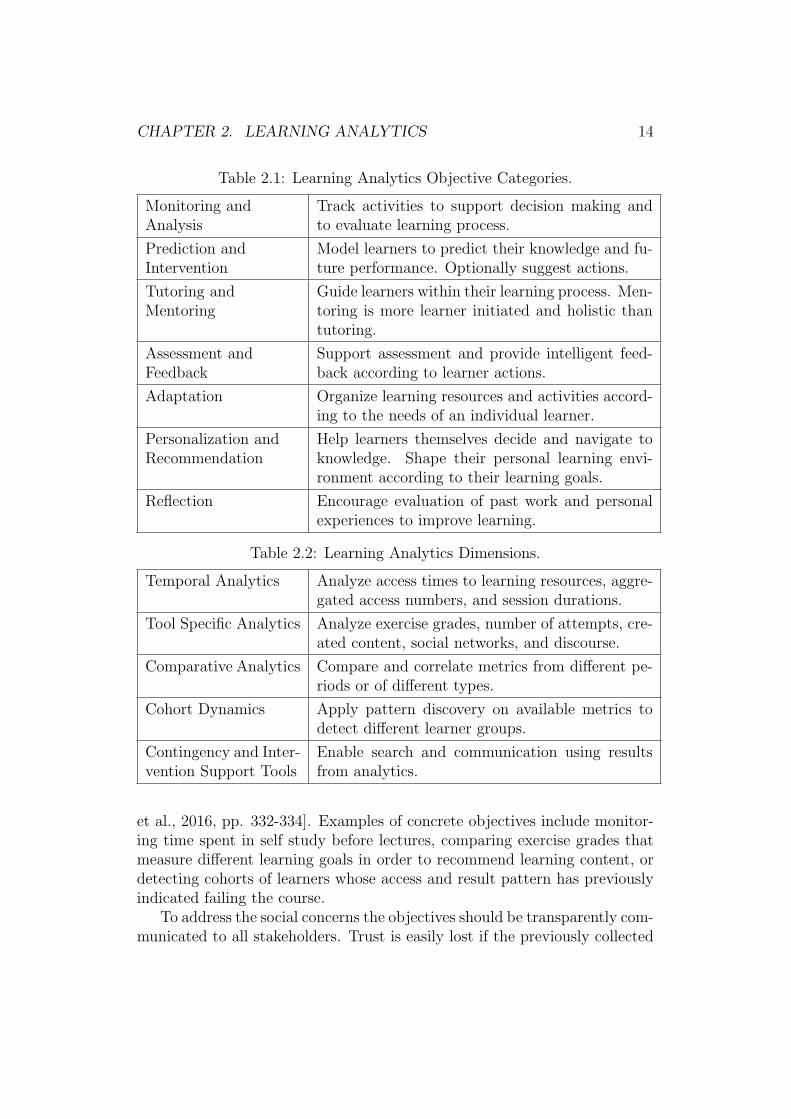
Papamitsiou and Economides [2014, pp. 54-56] systematically reviewLA articles to discover the basic research objectives of LA. They recognizesix categories of objectives: student/student behavior modeling, predictionof performance, increase (self-)reflection and (self-)awareness, prediction ofdropout and retention, improve feedback and assessment services, and recom-mendation of resources. Chatti et al. [2012, pp. 327-328] list seven possiblecategories of LA objectives: monitoring & analysis, prediction & intervention,tutoring & mentoring, assessment & feedback, adaptation, personalization &recommendation, and reflection. The latter categorization is more extensiveand can support the cases presented in the former study. Table 2.1 describesthese seven objective categories [Chatti et al., 2012, pp. 327-328].
Bakharia et al. [2016, pp. 332-334] approach LA from the point of viewof learning design. They develop a framework that includes a very differentcategorization of LA into five dimensions: temporal analytics, comparativeanalytics, cohort dynamics, tool specific analytics, and contingency & in-tervention support tools. In comparison to previous categorization, thesedimensions are more closely related to the data and method – ‘What’ and‘How’ in contrast to ‘Why’. However, we believe that the five dimensionspresented in Table 2.2 are helpful to form concrete LA objectives [Bakharia
CHAPTER 2. LEARNING ANALYTICS 14
Table 2.1: Learning Analytics Objective Categories.
Monitoring andAnalysis
Track activities to support decision making andto evaluate learning process.
Prediction andIntervention
Model learners to predict their knowledge and fu-ture performance. Optionally suggest actions.
Tutoring andMentoring
Guide learners within their learning process. Men-toring is more learner initiated and holistic thantutoring.
Assessment andFeedback
Support assessment and provide intelligent feed-back according to learner actions.
Adaptation Organize learning resources and activities accord-ing to the needs of an individual learner.
Personalization andRecommendation
Help learners themselves decide and navigate toknowledge. Shape their personal learning envi-ronment according to their learning goals.
Reflection Encourage evaluation of past work and personalexperiences to improve learning.
Table 2.2: Learning Analytics Dimensions.
Temporal Analytics Analyze access times to learning resources, aggre-gated access numbers, and session durations.
Tool Specific Analytics Analyze exercise grades, number of attempts, cre-ated content, social networks, and discourse.
Comparative Analytics Compare and correlate metrics from different pe-riods or of different types.
Cohort Dynamics Apply pattern discovery on available metrics todetect different learner groups.
Contingency and Inter-vention Support Tools
Enable search and communication using resultsfrom analytics.
et al., 2016, pp. 332-334]. Examples of concrete objectives include monitor-ing time spent in self study before lectures, comparing exercise grades thatmeasure different learning goals in order to recommend learning content, ordetecting cohorts of learners whose access and result pattern has previouslyindicated failing the course.
To address the social concerns the objectives should be transparently com-municated to all stakeholders. Trust is easily lost if the previously collected
CHAPTER 2. LEARNING ANALYTICS 15
data is used to decide action that was not part of the originally discussed ob-jectives [Chatti et al., 2012, p. 325]. Objectives are also technically criticalfor the design of the following three process steps: data collection, analy-sis, and action. Often, many of those three steps are automatized and theydecide the feasibility of the set LA objectives.
2.3.4 Collect Data
Online and digital learning environments, such as Learning Management Sys-tems (LMS), record or log many user activities. Therefore, a lot of data oftenexists that is valuable for LA. However, there are technical challenges to em-ploy the existing data in LA. These challenges are also described as datapreprocessing [Romero and Ventura, 2013, p. 20]. Different systems use dif-ferent data formats and extracting suitable variables to solve a particular LAcase may be laborious.
Moreover, ubiquitous online productivity tools and interoperable onlinematerial or plugins are commonly integrated into learning material. Thispresents a big challenge to aggregate and integrate data from multiple datasources with different formats and potentially different granularity [Siemens,2013; Chatti et al., 2012; Romero and Ventura, 2013, p. 20]. Furthermore,this distributed data set should represent learning process as a coherent wholebut in the worst case a single individual may act under different identities indifferent environments that store heterogenous data [Siemens, 2013, p. 1393].
The previous challenge often exists inside a single educational course.The challenge increases manyfold when we consider all studies in one degreeprogram. A lifelong learning path of a person involves different educationalinstitutions that may cross over national borders and legislation areas. Thesedifferent parties may have separate educational data that as complete wholewould have increased LA potential for the learner. Providing ownership andaccess to this lifelong data on education becomes a new challenge.
The described problems are largely analogous to the big data concept thatrevolves around capturing, storing, and analyzing large amounts of data gath-ered by numerous sources around the world [Swan, 2013]. Current availablesolutions to the data integration problem in LA are discussed in Chapter 2.4.
Apart from technical problems, giving meaning to numeric data, such asvisits or points, requires context [Romero and Ventura, 2013, p. 20]. For ex-ample, a particular exercise can be devised to measure a particular learninggoal. Without such context information the lack of accessing or master-ing the particular exercise has much more limited value. Furthermore, weneed to remember that data is just a sample that approximates actual learn-ing processes. While we pursue to quantify learning, e.g. with grades, the
CHAPTER 2. LEARNING ANALYTICS 16
actual learning and knowledge are deeply personal and qualitative proper-ties. Achieving sophisticated LA objectives may well require learning designthat includes appropriate and tested instruments that can provide suitabledata [Gasevic et al., 2015].
Increasing the scope of data capture is a recognized challenge in LA re-search [Siemens, 2013, p. 1392]. Presently, lecture activity or informal learn-ing are sparsely instrumented to data while those are important modes oflearning. Such instrumentation could employ RFID tags, mobile devices,new technologies, and new software support. When means to collect dataon new situations, such as physical presence at lectures, learning activity insocial media, or browsing external internet resources, appear then new levelof privacy issues arise. For some objectives anonymized data is adequate andthe anonymization can be seen as part of the preprocessing.
Normally, the data collection is an automatic step once it has been de-signed and developed. On rare occasion, manual input of data that addsvalue to analysis may be feasible. However, surveys, such as feedback, canalso be seen as distributed manual input which is in regular use.
2.3.5 Conduct Analysis
The analysis step seems to be understood as the core of LA. Large part of LAor EDM research investigates different methodology and attainable results.Therefore, the first option to answer an LA objective is to review literaturefor a presented method and evaluate the transferability to the particular case,including available data and context. Second, if the involved persons havethe necessary knowledge, any existing or new analysis methods can be testedto solve a given problem with available data. Next, we discuss the typicaland best known methods applied in LA.
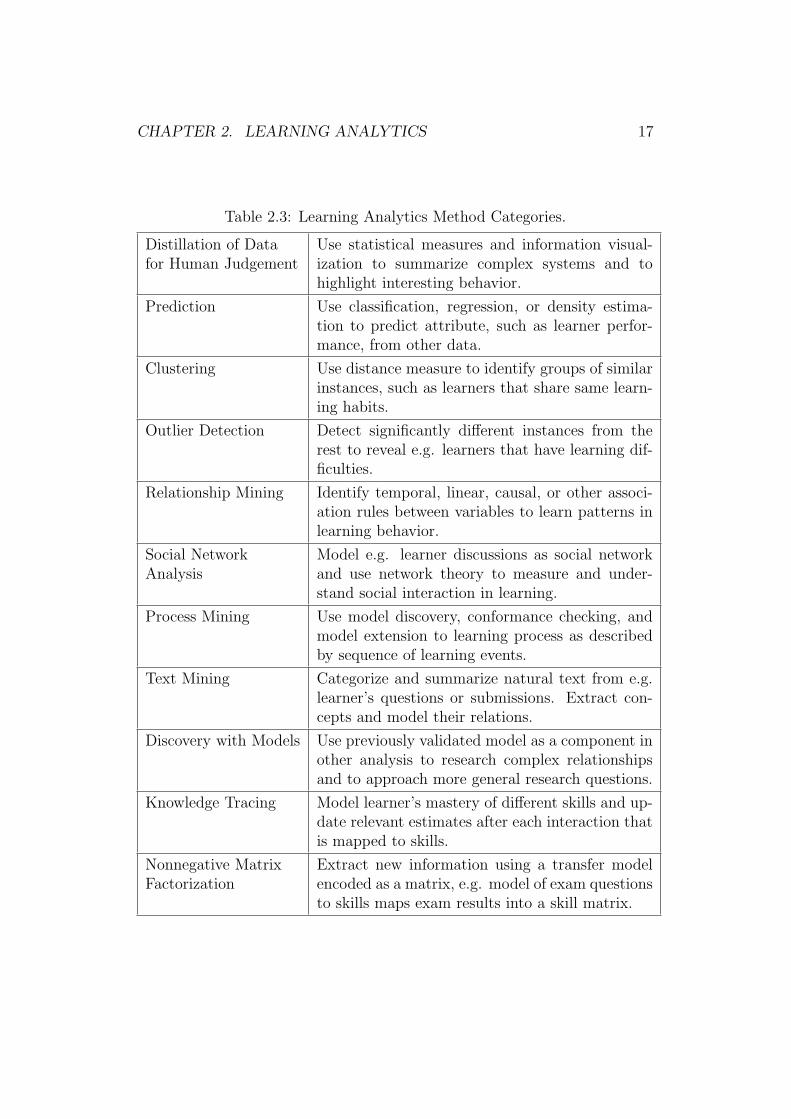
Chatti et al. [2012, pp. 137-140] identify four popular techniques in LAliterature: statistics, information visualization, data mining, and social net-work analysis. Romero and Ventura [2013, pp. 21-22] name eleven popularEDM methods: prediction, clustering, outlier detecting, relationship mining,social network analysis, process mining, text mining, distillation of data forhuman judgement, discovery with models, knowledge tracking, and nonneg-ative matrix factorization. Chatti et al. makes a higher level categorizationthat summarizes typical data mining methods to one category. The statis-tics and information visualization belong to distillation of data for humanjudgement in Romero and Ventura. Table 2.3 briefly describes the differentmethodology that has been typical in LA analysis [Romero and Ventura,2013, pp. 21-22].
CHAPTER 2. LEARNING ANALYTICS 17
Table 2.3: Learning Analytics Method Categories.
Distillation of Datafor Human Judgement
Use statistical measures and information visual-ization to summarize complex systems and tohighlight interesting behavior.
Prediction Use classification, regression, or density estima-tion to predict attribute, such as learner perfor-mance, from other data.
Clustering Use distance measure to identify groups of similarinstances, such as learners that share same learn-ing habits.
Outlier Detection Detect significantly different instances from therest to reveal e.g. learners that have learning dif-ficulties.
Relationship Mining Identify temporal, linear, causal, or other associ-ation rules between variables to learn patterns inlearning behavior.
Social NetworkAnalysis
Model e.g. learner discussions as social networkand use network theory to measure and under-stand social interaction in learning.
Process Mining Use model discovery, conformance checking, andmodel extension to learning process as describedby sequence of learning events.
Text Mining Categorize and summarize natural text from e.g.learner’s questions or submissions. Extract con-cepts and model their relations.
Discovery with Models Use previously validated model as a component inother analysis to research complex relationshipsand to approach more general research questions.
Knowledge Tracing Model learner’s mastery of different skills and up-date relevant estimates after each interaction thatis mapped to skills.
Nonnegative MatrixFactorization
Extract new information using a transfer modelencoded as a matrix, e.g. model of exam questionsto skills maps exam results into a skill matrix.
CHAPTER 2. LEARNING ANALYTICS 18
Korhonen and Multisilta [2016, pp. 305-306] categorize analysis into twogroups according to timing and type of the feedback loop. First, analysiscan be conducted automatically in real time using the latest data. In thisscenario, the general goal is to detect some phenomena and take early actionto improve learning. Second, analysis can be conducted postmortem usinghistorical data after the learning activities are finished. The reasons to usehistorical data include data collection limitations, that make real time datanon-feasible, and data completeness requirements, that arise from objectives,such as training models or testing hypothesis.
In the systematic review of LA articles, Papamitsiou and Economides[2014, pp. 60-61] conclude strengths, weaknesses, opportunities, and threatsof LA research. Considering the analysis methodology, reported strengthsare: ability to use previously refined and validated data mining methods,visualizations that support human interpretation, advancement in more pre-cise user models, ability to reveal critical moments and patterns of learning,and ability to gain insight to learning strategies and behaviors. Weaknessesinclude likelihood of human misinterpretation and lack of qualitative analysismethods. Reported analysis opportunities are: increased self-reflection andself-awareness, and integration to decision making systems and acceptancemodels. Threats include over-analysis, contradictory findings, and patternmisclassification. They cause lack of generality and trust issues.
In conclusion, there are big differences between courses and what datathey produce. Therefore, knowledge of the context and adjustment of anal-ysis is required regardless of existing solutions to a given objective. Further-more, transparent analysis methods that form understandable criteria andvisualization that supports human interpretation are helpful in the decisionto take action [Romero and Ventura, 2013, p. 20].
2.3.6 Take Action
A successful analysis step leads into action so that learning can be improved.Ultimately, any action should affect the learners. However, the directness ofaction in LA has large variation.
The most direct action is from the analysis to the learner. This typicallyinvolves real time analysis. A signal from the analysis may be automaticallycommunicated to the learner inside their digital learning environment orusing separate messaging services, such as e–mail or text messages. Alterna-tively, the results may be used to automatically adapt or personalize learningenvironments. Another direct approach is to present automatic visualizationsto the learner that may improve self-reflection and self-awareness [Auvinen,2015]. However, the consequences of these direct actions are hard to pre-
CHAPTER 2. LEARNING ANALYTICS 19
dict. Beheshitha et al. [2016, pp. 61-62] present that depending on learners’achievement goal orientations the same LA visualization may have positiveor negative effect on learning.
Indirect automatic actions often target educators who then practice hu-man judgement. Identically to previous description, signals or visualizationsmay be presented to the educator. The educator then decides how and whento take action in the learning process. Educators may filter personal signalsto learners in a more constructive fashion than automatic system could.
In addition, educators typically evaluate the learning process periodically,and LA can offer many tools to support both real time and postmortemevaluation or reflection. Extremely, LA may be designed to test a single newlearning material item or method. The effect to learners may materialize inthe next course module or the next course instance with new learners. Apossible effect may involve changes in factors, such as material, methods,schedule, grading, or experience of educators. Institutions could have similaractors as the educator described above but with target over several courses.
When researchers or policy makers take action as LA clients the effectto learning typically has years of delay. The actions include scientific pub-lication, media presence, and legislation. When the directness of LA actiondecreases the amount of human judgement increases. Ideally, this helps toavoid misinterpretation and ill consequence. However, the likelihood of LAleading to any action is reduced, and evaluation of results becomes more timeconsuming and challenging.
2.3.7 Evaluate Process
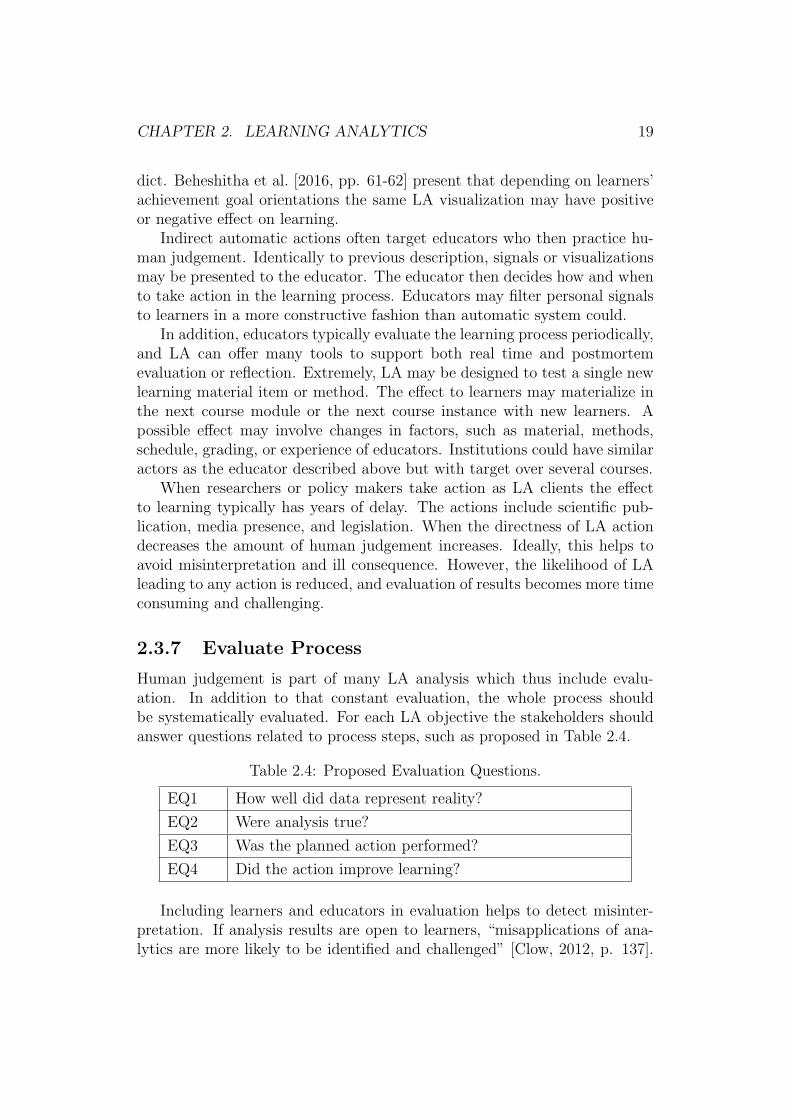
Human judgement is part of many LA analysis which thus include evalu-ation. In addition to that constant evaluation, the whole process shouldbe systematically evaluated. For each LA objective the stakeholders shouldanswer questions related to process steps, such as proposed in Table 2.4.
Table 2.4: Proposed Evaluation Questions.
EQ1 How well did data represent reality?
EQ2 Were analysis true?
EQ3 Was the planned action performed?
EQ4 Did the action improve learning?
Including learners and educators in evaluation helps to detect misinter-pretation. If analysis results are open to learners, “misapplications of ana-lytics are more likely to be identified and challenged” [Clow, 2012, p. 137].
CHAPTER 2. LEARNING ANALYTICS 20
Furthermore, Clow [2012, p. 137] makes an important remark: “All met-rics carry a danger that the system will optimise for the metric, rather thanwhat is actually valued.” Siemens [2013, p. 1395] warns about removingthe human and social processes that are essential in learning from the LA.Involvement of all stakeholders and openness seems to be critical. After theevaluation, it is logical to refine and select new objectives with potentiallynew stakeholders. The process cycle starts from the beginning.
2.4 Software and Standards
This chapter discusses software support for LA. First, features of selectedwell–known online learning software are examined. Then, applicability ofgeneral analytics software is considered. Finally, this chapter discusses soft-ware requirements set by LA research and future development.
Investment into LA software depends critically on the previous onlinelearning investments and non–LA features of the available software that haveto be considered case–by–case. Integration to existing platforms is a majorissue. In some cases, institutional or national policies may limit sharing ofthe learning data to external services. Therefore, this brief examination doesnot intend to evaluate the different software options but rather survey thecurrent state of LA in the mainstream products.
2.4.1 Current Learning Analytics Features
Currently, brand-name products in online learning include different learningenvironments of which we use the term Learning Management System (LMS).Virtual Learning Environment (VLE) is a synonymous term. These LMSspursue to provide complete learning experience for learners and required sup-port tools for educators. Some of the products are delivered commercially aslicensed software while some major LMS are results of open–source softwaredevelopment where people are free to read and contribute to the programsource code. Many products are available as Software–as–a–Service (SaaS)where the vendor delivers the application in internet and the acquirer is freefrom any installation or maintenance work.
Different LMSs typically have some LA features built–in or available asextensions. However, LA is a new addition compared to more traditionaleducational delivery features, and it requires specific development expertise,such as statistical analysis and machine learning. Therefore, the current LAfeatures in different LMSs may not satisfy all requirements. An option to
CHAPTER 2. LEARNING ANALYTICS 21
Table 2.5: Examined Software.
ID Product URL
1 Blackboard Learn https://www.blackboard.com/
2 Blackboard Moodlerooms https://www.moodlerooms.com/
3 Canvas https://www.canvaslms.com/
4 D2L Brightspace https://www.d2l.com/
5 Sakai https://www.sakaiproject.org/
6 Open edX https://open.edx.org/
7 Moodle https://moodle.org/
7 g Moodle Plugin: Gismo https://moodle.org/plugins/block gismo/
7 i Moodle Plugin: Inspire https://moodle.org/plugins/tool inspire/
8 Intelliboard https://intelliboard.net/
9 AspirEDU http://aspiredu.com/
Table 2.6: Current LA Features. The available features for each product aremarked with x and available features via plugins are marked with g and i asdenoted in the table above.
Feature 1 2 3 4 5 6 7 8 9
(LMS capability) x x x x x x x
Statistical Summaries x x x x x x g x
Learner vs. Average x x x x x
Learner Self-Reflection x x
Performance Prediction x x x i x
Intervention Tools x
Social Network Analysis x x
Text Mining x
the LA features are separate LA platforms that work on data that may becollected by an LMS.
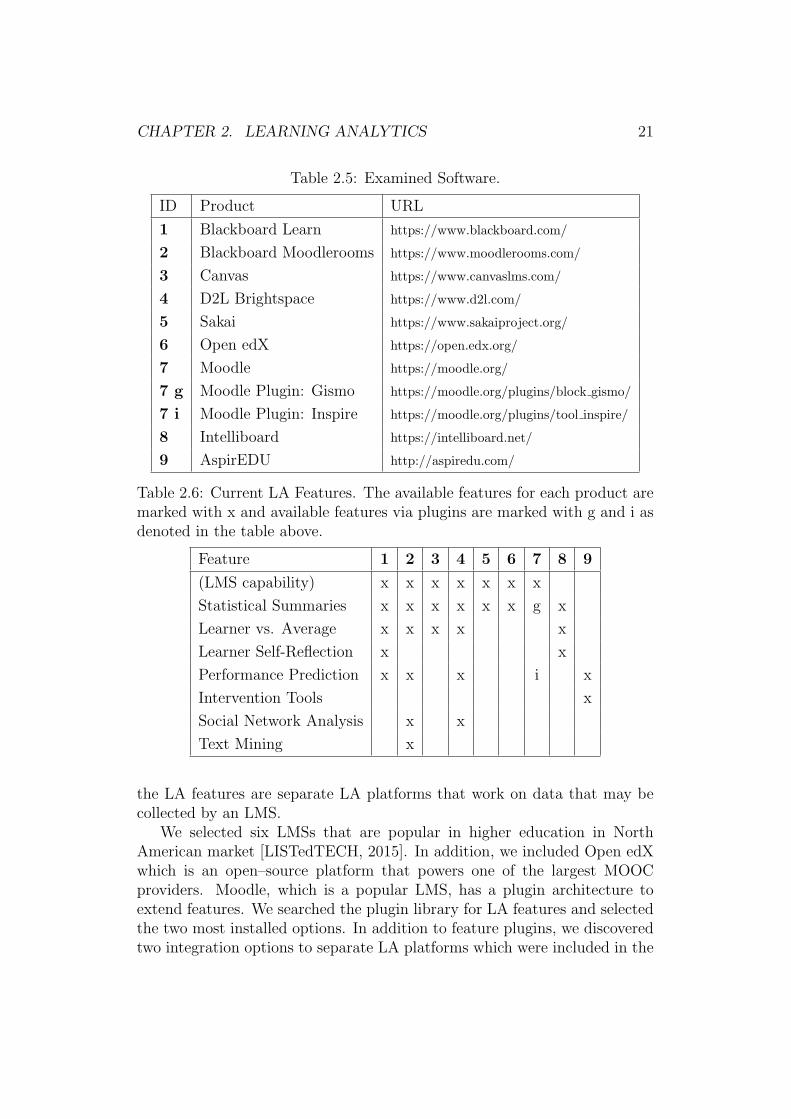
We selected six LMSs that are popular in higher education in NorthAmerican market [LISTedTECH, 2015]. In addition, we included Open edXwhich is an open–source platform that powers one of the largest MOOCproviders. Moodle, which is a popular LMS, has a plugin architecture toextend features. We searched the plugin library for LA features and selectedthe two most installed options. In addition to feature plugins, we discoveredtwo integration options to separate LA platforms which were included in the
CHAPTER 2. LEARNING ANALYTICS 22
examined products presented in Table 2.5. The LA features of the selectedproducts were examined using current marketing media, recent conferencevideos, and product trial periods.
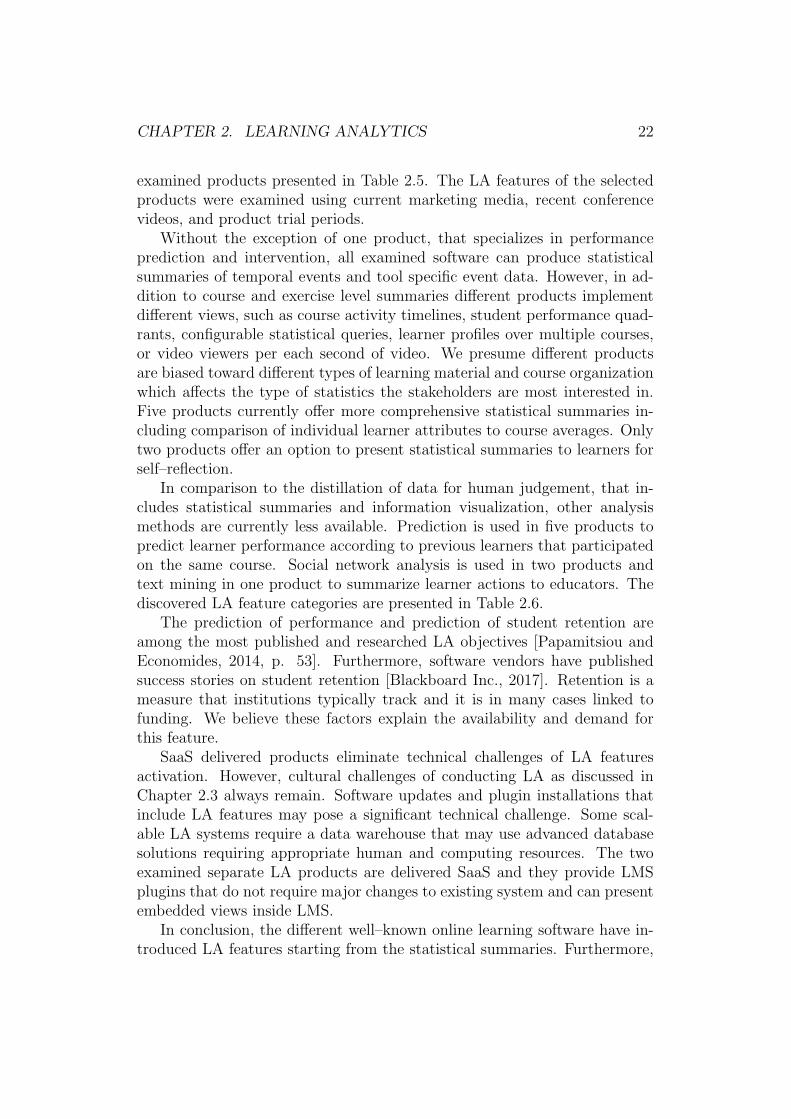
Without the exception of one product, that specializes in performanceprediction and intervention, all examined software can produce statisticalsummaries of temporal events and tool specific event data. However, in ad-dition to course and exercise level summaries different products implementdifferent views, such as course activity timelines, student performance quad-rants, configurable statistical queries, learner profiles over multiple courses,or video viewers per each second of video. We presume different productsare biased toward different types of learning material and course organizationwhich affects the type of statistics the stakeholders are most interested in.Five products currently offer more comprehensive statistical summaries in-cluding comparison of individual learner attributes to course averages. Onlytwo products offer an option to present statistical summaries to learners forself–reflection.
In comparison to the distillation of data for human judgement, that in-cludes statistical summaries and information visualization, other analysismethods are currently less available. Prediction is used in five products topredict learner performance according to previous learners that participatedon the same course. Social network analysis is used in two products andtext mining in one product to summarize learner actions to educators. Thediscovered LA feature categories are presented in Table 2.6.
The prediction of performance and prediction of student retention areamong the most published and researched LA objectives [Papamitsiou andEconomides, 2014, p. 53]. Furthermore, software vendors have publishedsuccess stories on student retention [Blackboard Inc., 2017]. Retention is ameasure that institutions typically track and it is in many cases linked tofunding. We believe these factors explain the availability and demand forthis feature.
SaaS delivered products eliminate technical challenges of LA featuresactivation. However, cultural challenges of conducting LA as discussed inChapter 2.3 always remain. Software updates and plugin installations thatinclude LA features may pose a significant technical challenge. Some scal-able LA systems require a data warehouse that may use advanced databasesolutions requiring appropriate human and computing resources. The twoexamined separate LA products are delivered SaaS and they provide LMSplugins that do not require major changes to existing system and can presentembedded views inside LMS.
In conclusion, the different well–known online learning software have in-troduced LA features starting from the statistical summaries. Furthermore,
CHAPTER 2. LEARNING ANALYTICS 23
we expect vendors to follow popular demand and develop LA features asresearch brings forth feasible objectives and new analysis methods mature.However, there is currently a market for separate LA products that can beatthe LMS providers in time to market or product quality. Furthermore, LA so-lutions that depend on one LMS can be problematic for some online courses.As discussed in Chapter 2.3.4, online courses typically integrate learning ma-terial from different sources and the activity data is scattered on differentplatforms.
2.4.2 General Analytics Software
Comprehensive analysis methods and visualizations are provided in generaldata analytics software. Analytics are available through mathematical soft-ware, such as R1 or MatLab2, and the various extension packages they sup-port. Other products, such as SAS3 or IBM SPSS4, are specifically designedfor data analytics. These powerful tools require good understanding of dataanalytics and are most useful to specialists in mathematical statistics andanalytics.
Business Intelligence (BI) is a research area that aims to support busi-nesses to make more informed decisions based on available data. BI hasproduced a branch of analytics software, such as Power BI5 or Qlik Sense6,that offer simplified interface to conduct data analytics and create visualiza-tions. In addition, traditional spreadsheet software, such as Microsoft Excel7
and the available extension packages, can support many forms of analytics.These tools may be an attractive alternative to the LA stakeholders thatare motivated to design new analytics and who lack the resources to use themost scientific statistical software. Indeed, we expect that BI software ven-dors may ship specific Academic Analytics (AA) and even LA packages infuture as LA market grows.
The major challenge with general analytics software is integration of datainto the analytics software and integration of analytics views back to thelearning environment, e.g. LMS. The data can be imported to these softwarefrom LMS data export or in some cases directly from LMS database. Aninteresting option is to connect analytics software to LMS web service API.
1https://www.r-project.org/2https://www.mathworks.com/3https://www.sas.com/4https://www.ibm.com/analytics/us/en/technology/spss/5https://powerbi.microsoft.com/6https://www.qlik.com/7https://www.office.com/
CHAPTER 2. LEARNING ANALYTICS 24
This would remove manual repetitive steps to export and import data. How-ever, it requires specific support from the both analytics software and LMS.It potentially introduces authorization issues including API access tokensand their management.
In addition to technical challenge of data integration, the lack of widelyaccepted standards for learning data results in custom interpretation. Under-standing the data inside the analytics software is a separate effort for everydifferent source of learning data. Furthermore, a deeper level of knowledgeon LA, including best methods and models, is required in comparison toapplying one of the predefined LA tools described in the previous chapter.
The integration of real time analytics views, that are produced in generalanalytics software, into LMS requires online cloud features from the analyticssoftware vendor. Similar requirements exist for generating automated reportdelivery, e.g. weekly email. However, post–mortem or ad hoc analytics maynot benefit from such automatic views or reports. It is possible to efficientlytest different analytics in external software and later implement the discov-ered every day analytics methods in the learning environment itself.
Amazon Web Services8 and Google Cloud Platform9 both include visual-ization and analysis tools in their online big data platforms. Their big datawarehouses are designed to handle continuous event streams that match thesize of the largest MOOC course providers. Furthermore, they include ma-chine learning services that can reduce the implementation effort of advancedanalytics methods, such as text mining, speech and image recognition, or rawneural networks. IBM Watson10 provides similar services and dialog supportwith artificial intelligence. The LA integration and development efforts forbig data platforms are considerable but they can offer unmatched computingservices. Cloud analytics can be an interesting approach to institutions thatproduce vast amounts of learning data and have team of software developersavailable.
Analytics of web traffic and navigation patterns is a special LA case.Professional products, such as Google Analytics11, are ready to produce validand interesting results when applied to web learning environment.
2.4.3 Development and Research
LA research requires access to the data and knowledge of the learning context.From the research point of view, different learning environments, such as
8https://aws.amazon.com/9https://cloud.google.com/
10https://www.ibm.com/watson/11https://analytics.google.com/
CHAPTER 2. LEARNING ANALYTICS 25
LMS, should include a data export feature or implement a web service APIto access data that is required for analysis. Post-mortem data sets, thatcan be exported after the researched course has finished, are often used todevelop data mining methods. However, in order to test early action withlearners, a frequent data access during learning is required.
Second challenge is that different systems use different data formats.Therefore, testing the same methods on different or larger data is laborious.This is also critical when a single course integrates materials from differ-ent platforms. A standard format to describe learning content and learningactions would help to solve this problem. Kauppinen et al. [2012] definea Teaching Core Vocabulary to encode course content using semantic webtechnologies. The vocabulary can be extended to include anonymized learn-ing actions. However, privacy concerns and overhead are high if institutionsautomatically publish actions, such as mouse clicks, in semantic web. Veera-machaneni et al. [2013] design a data base schema where learning actionsfrom different data sources can be collected and converted for standardizedanalytics access.
Another approach to the data collection challenge reverses the responsi-bilities. It introduces a concept of Learning Record Store (LRS) where thedifferent learning tools are responsible to transmit learner activities usingstandard API. In this model, the data for LA is not owned by a single LMSand LRS can integrate and combine data from different environments. Ke-van and Ryan [2016] describe the opportunities and challenges of ExperienceAPI (xAPI) that defines the LRS using web service standards. According tothem, learning software industry has quickly adopted support for xAPI.
IMS Caliper12 is a recent specification that describes a Sensor API thattakes the same role as LRS. Furthermore, the specification aims to definestandard metrics to be used in learning.
Learning Locker13 is an available open–source LRS. Few commercial LRSs,such as Wax14 or Watershed15, are available SaaS. The data model in LRSdepends on agreed ontology, that is currently kept in a registry16 controlledby the developers of the specification. It is extendable for the unseen fu-ture. Kitto et al. [2015] present a Connected Learning Analytics Toolkitthat harvests learner activities from informal environments, such as socialmedia services, and records those into LRS using xAPI.
From the analysis point of view, ability to efficiently implement and test
12http://www.imsglobal.org/activity/caliper13https://learninglocker.net/14http://www.saltbox.com/15https://www.watershedlrs.com/16https://registry.tincanapi.com/
CHAPTER 2. LEARNING ANALYTICS 26
new analysis methods and visualizations on current data accelerates LA re-search. Therefore, learning environments should be configurable and opti-mally have methods to include result views from external software, such asgeneral data analytics tools or central analytics services as discussed above.
In recent years, the LA research community has collaborated on conceptof open learning analytics. Chatti et al. [2017] present a summary of historyand goals of such open ecosystem. The ecosystem should support open learn-ing environments where activities are decentralized. It supports lifelong andinformal learning. The learning data, analysis methods and models are effec-tively shared for research. Software and standards are open and participationof all stakeholders is encouraged.
The open xAPI or IMS Caliper are potential solutions to connect dif-ferent tools and services in such open ecosystem. Currently, Apereo [2017]coordinates a Learning Analytics Initiative that is developing open softwareplatform which offers technology for open LA. Pardos and Kao [2015] presentan LA platform that supports the main goals of the open LA in the currenttechnological environment.
Chapter 3
Aalto Online Learning
This chapter addresses the RQ1 in this thesis: What learning data the coursescurrently instrument? In order to answer the question, we first examine theresearch case and develop further focus. Four pilot courses included in thiscase are selected as primary target.
Then, the two most popular LMSs among the pilot courses are studied.Existing functionalities, access to learning data, and structure of learningdata, all set requirements for the LA solution. Moodle and A-plus LMSs aredescribed and examined in that order.
3.1 The Case
One of the Aalto University strategic initiatives for 2016–2020 is known asAalto Online Learning (A!OLE). First, A!OLE goals are researched in rela-tion to this thesis. Second, the different stakeholders in the case are discussed.Finally, the involved pilot courses are inspected using three different criteriaand further focus is developed by selecting specific courses.
3.1.1 Project Goals
Kauppinen and Malmi [2017] define the goal of the A!OLE project as “todevelop, explore, and evaluate novel advanced technical solutions and peda-gogical models for online/blended learning.”. They consider digitalization ofeducation as means to improve learning and to support transformation to-wards more student–centered pedagogies. The project aims to produce newonline learning resources that can answer to new and diverse student require-ments. Kauppinen and Malmi [2017] see that demand for personalized andflexible distance learning increases and digital resources and tools become
27
CHAPTER 3. AALTO ONLINE LEARNING 28
new standards in our societies. According to them, pedagogies transformfrom old teacher–centered approaches, where students were often thoughtas passive recipients, to new student–centered approaches, where educatorssupport the active learners with novel methods, that require development.
Kauppinen and Malmi [2017] argue that such major change requiresrethinking of pedagogical and organizational practices in university. Thispresents challenge to the whole university staff. Therefore, the A!OLE projectaims to change the whole educational culture in Aalto University by build-ing communities and activities that support sound advancement of onlinelearning, including new pedagogies, at a grass root level.
The A!OLE project names LA as a tool they plan to use for providing ad-vanced personal feedback, identifying cases where educator should intervene,improving infrastructure, developing funding and leadership, and ensuringlong–term commitment [Kauppinen and Malmi, 2017]. Consequently, wededuct that LA is expected to take an essential role in A!OLE. This is inagreement with general LA and online learning expectations, such as pre-sented in Chapter 1.
Currently, A!OLE recognizes the importance of LA. However, sponsoreddevelopment projects have not yet included LA in their focus. Therefore,this thesis specifically considers the bootstrapping of LA which aims at acontinuous, systematic and developing process that can fulfill many currentand future LA objectives as knowledge is built and methods mature. Thus,we largely ignore the large scale and long–term LA vision that was discussedabove and focus on the course level objectives that motivate the course staffinto LA.
As discussed in Chapter 2.3, conducting systematic LA presents bothtechnical and cultural challenges. Culturally, the stakeholders need to as-similate how to apply and make sense of LA without ignoring privacy andethics. This thesis aims to ignite LA inside the cultural change that A!OLEis promoting. We support the grass root level approach by introducing LAsolution to a small number of educators whose immediate needs we can coverand thus create real value. A!OLE should then facilitate knowledge and ex-perience sharing from these selected educators and pilot courses to largercommunity.
Furthermore, we promote course staff to take ownership of LA. We believethat involved course staff who can extract value from LA have good reasonsto commit to LA development. However, if the course staff is not motivated,it is likely that they systematically neglect to design instruments that arenecessary to produce detailed data of the learners. Thus, the most directopportunity to improve learning via LA would be lost.
This thesis aims at a technical LA solution for online learning. This
CHAPTER 3. AALTO ONLINE LEARNING 29
is an integral part of the main A!OLE goal. Furthermore, we recognizethat change happens gradually and focus on introducing viable and evolvingsolution inside the A!OLE community. We start from the course level andpromote ownership of LA for the course staff to grow commitment.
3.1.2 Stakeholders
As discussed in the previous chapter, this thesis has focus on course levelLA and it places learners as subject and educators as client. However, thepreviously researched goals of A!OLE include program level interest for LA.Furthermore, Aalto University has study program leaders and other institu-tional stakeholders that are potential future LA clients.
Development of institutional level LA specifically requires aggregationand integration of data from multiple courses. In Aalto, such general dataconsists mostly of the official study records. Generally available course leveldata is sparse and likely incomparable as the use of online courseware isdiverse.
In other words, the institutional decision makers in Aalto take leadershipin LA that starts from the study records. We see this as a top–down approachto LA where low fidelity data is analyzed for large trends. In contrast, thisthesis advances a bottom–up approach that deals with high fidelity data andanalyses course level trends. Both approaches would benefit from havingthe full data range and at some point in the future we expect these twodevelopments to join at the middle. The top–down may link related largertrends to course level phenomena. The bottom–up advances instrumentationand standardized data access to course level real time data that can providemore accurate and timely picture of larger trends as well.
In addition to institutions and educators, LA research produces oppor-tunities to place learners themselves as LA clients. However, as discussedin Chapter 2.3.6, learners achievement goal orientations are a critical factorin the outcome. Therefore, implementations of LA using learners as clientrequires careful research and controlled tests.
Finally, Aalto University includes research groups in areas of learningtechnology, machine learning, statistical analysis, and data science. Thesegroups are seen as potential resources for further development of LA. Re-searchers require access to structured data and configurability of systems.
This thesis prepares for the expected future requirements of the otherstakeholders. However, the immediate value of the solution is aimed towardsthe educators of the courses in focus.
CHAPTER 3. AALTO ONLINE LEARNING 30
3.1.3 Pilot Courses
A!OLE has called for idea proposals twice a year from the whole Aalto Univer-sity to advance the online learning goals. The best ideas have been developedinto A!OLE pilots that implement their idea with A!OLE support. At thetime of writing, A!OLE has 52 pilots that together involve approximately 60educational courses or similar units of education that occur in the followingacademic year [Aalto Online Learning, 2017]. From the LA point of view, allthese courses are potential sources of learning data and application targets ofLA. However, it is impossible to solve the different technical challenges andcommunicate the cultural challenges to all of these courses at once. Next, thelimits of this thesis are further defined to maximize potential impact usingthe limited resources.
In their descriptions [Aalto Online Learning, 2017], 17 pilots include de-velopment of automatic assessment in their goals. These pilots involve, atminimum, 28 courses. 13 pilots describe different social activities in theirfocus. Approximately 10 courses are currently subject to these social pi-lots. Some remaining pilots concentrate on video production, self–learningresources, and guides related to online learning. This superficial analysisproduces limited understanding of the pilot courses which regularly combinedifferent learning activities that support each other. However, the automaticassessment courses are attractive for LA as they are already collecting fine–grain and regular data on student attendance and performance. The currentcommercially utilized LA methods for social learning are less mature and thevalue for the course staff is harder to estimate than for the structured datafrom automatic analysis.
Another criteria to categorize pilot courses is the number of students.Many introductory courses have more than 100 enrolled students. In con-trast, advanced courses may have as little as 10 enrolled students. On smallcourses, the educators are likely having discussions with individual learnerson weekly basis. This is impossible in large courses and they are likely togain more immediate value from LA that can summarize data and highlightinteresting cases that would else go unnoticed.
Technologically, 25 pilot courses are implemented for the Moodle Learn-ing Management System (LMS). 8 pilot courses are published on the A-plusLMS and 3 courses on the TIM LMS. The previous learning platforms aremaintained inside Aalto University. In addition, 8 different externally ad-ministrated online learning platforms are used. Furthermore, approximately10 courses are combining tools from different learning platforms and 7 pi-lots are developing custom learning applications. This confirms the expectedchallenge discussed in the Chapter 2.3.4. The learning data is fragmented to
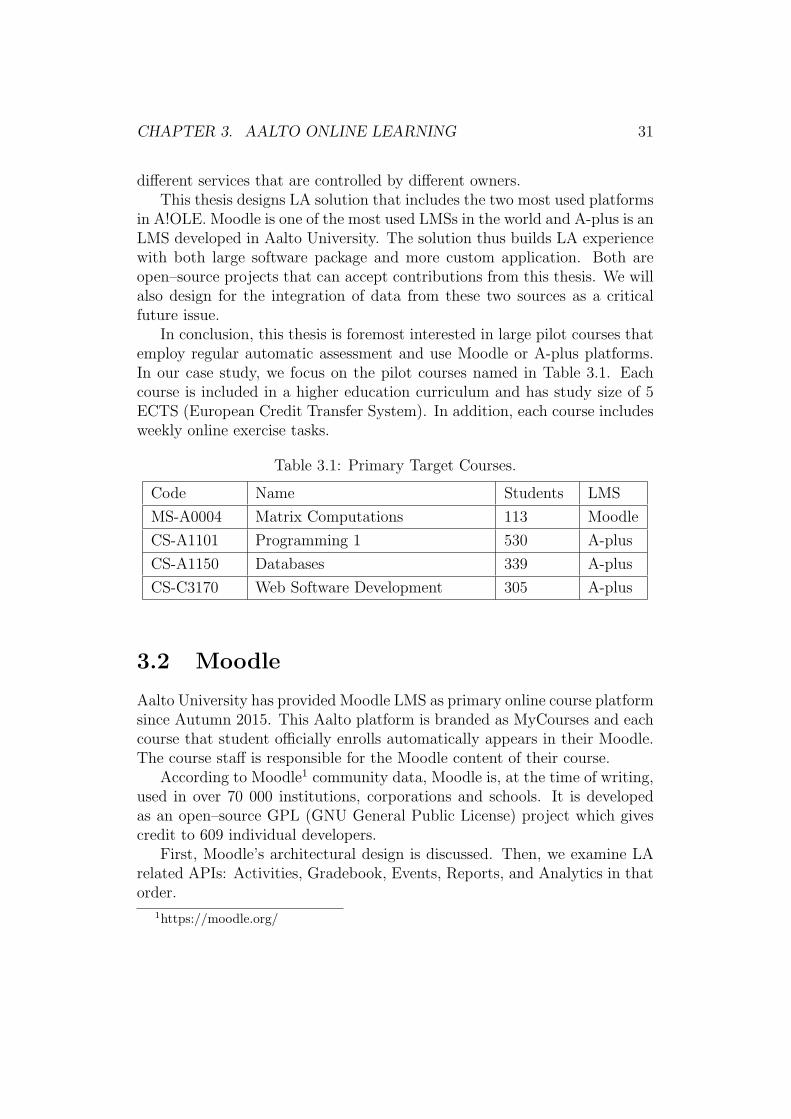
CHAPTER 3. AALTO ONLINE LEARNING 31
different services that are controlled by different owners.This thesis designs LA solution that includes the two most used platforms
in A!OLE. Moodle is one of the most used LMSs in the world and A-plus is anLMS developed in Aalto University. The solution thus builds LA experiencewith both large software package and more custom application. Both areopen–source projects that can accept contributions from this thesis. We willalso design for the integration of data from these two sources as a criticalfuture issue.
In conclusion, this thesis is foremost interested in large pilot courses thatemploy regular automatic assessment and use Moodle or A-plus platforms.In our case study, we focus on the pilot courses named in Table 3.1. Eachcourse is included in a higher education curriculum and has study size of 5ECTS (European Credit Transfer System). In addition, each course includesweekly online exercise tasks.
Table 3.1: Primary Target Courses.
Code Name Students LMS
MS-A0004 Matrix Computations 113 Moodle
CS-A1101 Programming 1 530 A-plus
CS-A1150 Databases 339 A-plus
CS-C3170 Web Software Development 305 A-plus
3.2 Moodle
Aalto University has provided Moodle LMS as primary online course platformsince Autumn 2015. This Aalto platform is branded as MyCourses and eachcourse that student officially enrolls automatically appears in their Moodle.The course staff is responsible for the Moodle content of their course.
According to Moodle1 community data, Moodle is, at the time of writing,used in over 70 000 institutions, corporations and schools. It is developedas an open–source GPL (GNU General Public License) project which givescredit to 609 individual developers.
First, Moodle’s architectural design is discussed. Then, we examine LArelated APIs: Activities, Gradebook, Events, Reports, and Analytics in thatorder.
1https://moodle.org/
CHAPTER 3. AALTO ONLINE LEARNING 32
3.2.1 Architecture
Moodle has a modular architecture where the application core exposes se-lection of APIs to service plugins that provide actual features on top of theminimum system. Moodle includes a plugin framework that supports 53different types of plugins that can be implemented in PHP programminglanguage and installed to the server running the software. The project man-ages a plugins directory that, at the time of writing, includes 1 406 pluginsthat are available to install.
Studying every available feature of Moodle is out of scope. Therefore,this thesis studies the features that the courses in focus apply. Particularinterest is on the data that these features produce. In addition, we study LAcapability and development in the Moodle project and plugins.
3.2.2 Activities and Gradebook
In the Moodle architecture, the components that are called Activities produceall of the detailed learning data. Such components or plugins implementfeatures, such as forums, wikis, quizzes, and assignments. These extendableactivities all define their own database tables where they store the generateddata in individual ways. Additionally, they can duplicate learning data aslog events that are discussed later.
A direct inspection of activity specific data, such as posted forum mes-sages or submitted quiz answers, requires custom code for each differentactivity type. Furthermore, Question API allows to extend the quizzes andcreates further variation on how the stored values can be interpreted. In ourfocus, the structured learning data is stored primarily from quizzes.
In addition to raw activities, Moodle offers Gradebook API that is ashared method to store and retrieve grades for individual activities of differenttypes. A number of attempts on a quizz or other aggregated interaction data,that is interesting for LA, would still need to be implemented separately foreach activity type that is going to be supported [Romero et al., 2008, p. 372].
3.2.3 Events
Moodle implements Events API to write log entries as events occur. Moo-dle generates many events, such as a learner viewing a resource, a learnerattempting to solve a quizz, or a teacher grading an assignment. An eventincludes a type, a time, and references to related users and database records.Therefore, the complete learning data of an event can be gathered via decora-tion of the log event with the related information, such as a submitted answer
CHAPTER 3. AALTO ONLINE LEARNING 33
or an awarded grade. However, querying log entries and related database ta-bles in real time for aggregate data is a heavy operation.
As events are generated, Moodle, by default, stores them in the localdatabase. This event logging design has been harnessed for LA in severalplugins. Logstore xAPI 2 can decorate and deliver Moodle events to an ex-ternal LRS that supports xAPI. The LRS solution and few data warehouseoptions were discussed in Chapter 2.4.3.
3.2.4 Reports
Moodle defines Reports and Quiz reports plugin types to support creation ofreport pages that are included in the navigation. By default Moodle includesa report that lists log events and can filter them by type. An example ofa visualization plugin is Events Graphic Report3 that provides high levelvisualizations of event data by user and type. The plugin is documented toexist as an alpha version.
Gismo4 is a plugin that visualizes student activities on a course. It canvisualize the number of accesses to each different course resource by eachindividual student. The collective numbers can be seen on time scale oralternatively per resource. In addition to accesses, the grade state of bothassignments and quizzes per student is available as a visualization matrix.
Technically, Gismo uses a JavaScript library for plotting visualizationsand a custom web API resource to feed numeric data to browser. As anightly task, It computes aggregated numbers of accesses from Moodle eventlogs. Gismo is available in the Aalto MyCourses installation.
3.2.5 Analytics
Moodle has integrated Analytics API, that was originally part of the In-spire plugin, to the core. This API supports definition of Analysers, thatextract data for analysis, Indicators, that calculate more abstract signals,and Targets, that define models which predict and notify teachers or learnerson results. The analytics component defines a new plugin type for machinelearning backends that can be selected for each analytics Target. However,also static models are supported. Such Targets only deduct instead of pre-dicting.
This API seeks to accelerate modular development of LA where differentdata and machine learning algorithms can be effortlessly integrated together.
2https://moodle.org/plugins/logstore xapi/3https://moodle.org/plugins/report graphic/4https://moodle.org/plugins/block gismo/
CHAPTER 3. AALTO ONLINE LEARNING 34
We expect that different LA predictions and signals become available inMoodle in future versions and plugins. Possibly, the Analysers’ output couldbe used for visualization in reports as it attempts to provide the customaccess code that is required for the different Activity types. However, thatwas not designed in the API.
3.3 A-plus
Computer science educators at Aalto University created an interoperable andextendable LMS that was first implemented by Koskinen [2012] and presentedby Karavirta et al. [2013]. The student centered user interface was designedby Krogius [2012]. The A-plus5 system is also known as A+. However thelatter form is problematic in identifiers, such as used in program code orURLs (Uniform Resource Locator), and therefore the former form A-plus isused of the project by itself.
Currently, 18 courses in Aalto University are serviced on A-plus and Tam-pere University of Technology has adopted it as well. A-plus is developed inopen–source under GPL and MIT licenses. The project accepts issues andpull-requests for source code changes.
First, architecture of A-plus is described. Next, we examine the LArelated data models: Exercise and Submission. Finally, data integrationto A-plus is discussed.
3.3.1 Architecture
The original design allowed to separate the concerns of user session andautomatic assessment into different services that communicate over HTTP(Hypertext Transfer Protocol). This idea is aligned with the current webtechnology trend that employs micro services that are orchestrated togetherinto actual applications [Dragoni et al., 2017]. The development and main-tenance of the individual micro parts having their individual responsibilitieshelps to develop robust, maintainable, and scalable systems. The idea alsosupports teams and companies to focus and excel in products that have morelimited responsibilities.
In the years following the introduction, A-plus design principles have in-cluded modular design over HTTP, low effort of implementing custom assess-ment programs, and controlling learning content via file system and versioncontrol software. Today several different services, that follow these design
5https://apluslms.github.io/
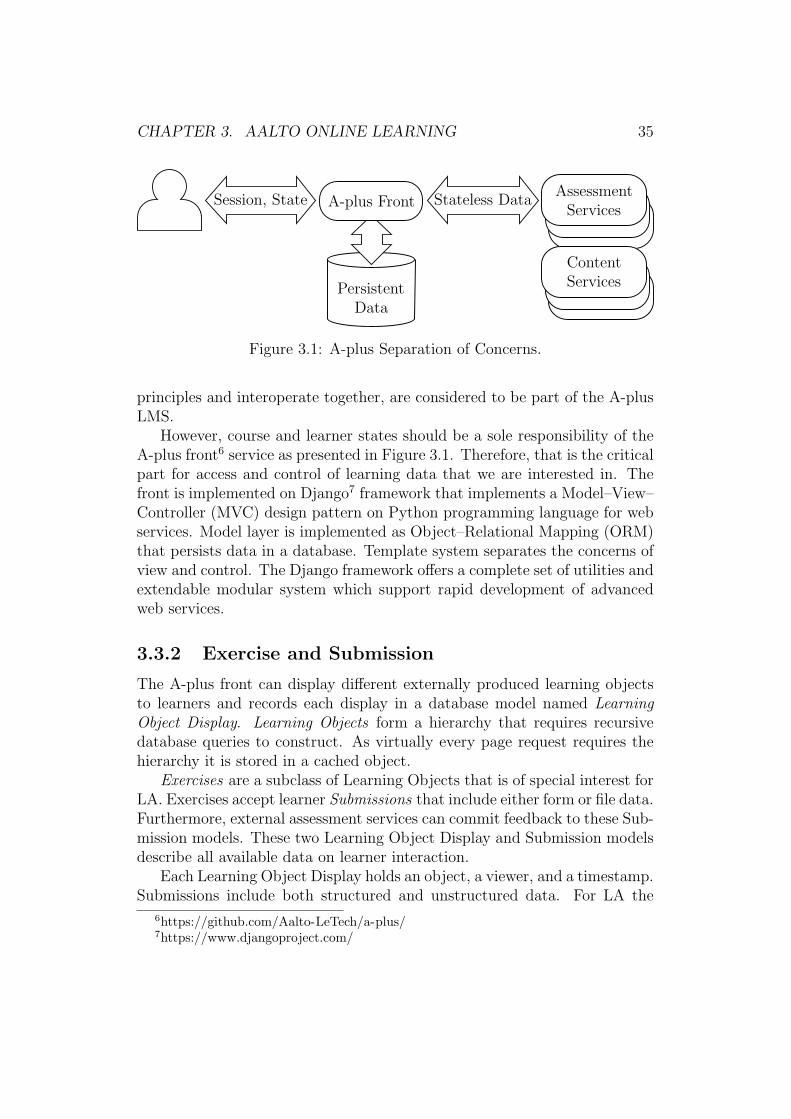
CHAPTER 3. AALTO ONLINE LEARNING 35
Session, State
Persistent
Stateless DataAssessment
A-plus Front
Data
Services
ContentServices
Figure 3.1: A-plus Separation of Concerns.
principles and interoperate together, are considered to be part of the A-plusLMS.
However, course and learner states should be a sole responsibility of theA-plus front6 service as presented in Figure 3.1. Therefore, that is the criticalpart for access and control of learning data that we are interested in. Thefront is implemented on Django7 framework that implements a Model–View–Controller (MVC) design pattern on Python programming language for webservices. Model layer is implemented as Object–Relational Mapping (ORM)that persists data in a database. Template system separates the concerns ofview and control. The Django framework offers a complete set of utilities andextendable modular system which support rapid development of advancedweb services.
3.3.2 Exercise and Submission
The A-plus front can display different externally produced learning objectsto learners and records each display in a database model named LearningObject Display. Learning Objects form a hierarchy that requires recursivedatabase queries to construct. As virtually every page request requires thehierarchy it is stored in a cached object.
Exercises are a subclass of Learning Objects that is of special interest forLA. Exercises accept learner Submissions that include either form or file data.Furthermore, external assessment services can commit feedback to these Sub-mission models. These two Learning Object Display and Submission modelsdescribe all available data on learner interaction.
Each Learning Object Display holds an object, a viewer, and a timestamp.Submissions include both structured and unstructured data. For LA the
6https://github.com/Aalto-LeTech/a-plus/7https://www.djangoproject.com/
CHAPTER 3. AALTO ONLINE LEARNING 36
most interesting structured fields are: exercise, submitters, submission time,status, and grade. The unstructured data includes submission and feedbackcontent. In the target courses, the different questionnaires store the namesof their fields into the exercise model. Thus, in these questionnaires, also thesubmission content can be interpreted in structured form.
The application of the A-plus exercises is not limited to graded assign-ments. On the target courses, the exercise–submission–feedback design isalso harnessed for collecting feedback from learners. A-plus is inclined to un-derstand all learner activities as a dialogue between submission and feedbackdata.
However, our target courses also connect third party services for discus-sions and service queue that store their interaction data in their separatedatabases. Integration of data from these third party services to A-plusis out of scope. We consider that the services should either reuse the A-plus exercise–submission–feedback model for storage or implement one ofthe emerging standard data APIs for LA, such as xAPI, to integrate learningdata at a higher level.
3.3.3 Data Integration
The A-plus front includes a web service API implemented using DjangoREST framework8. This API includes secure access to exercise and submis-sion data in JSON (JavaScript Object Notation) and partially CSV (CommaSeparated Values) formats. The access can be granted for the standard man-ually signed in user session or using an API token that is available in user’sprofile page.
A-plus also supports hooks that can request external web services atspecific events. Currently, only one type of hook event is supported. It istriggered after a submission is graded and it posts the identifier of the justgraded submission to the configured hook URL (Uniform Resource Locator).
Finally, Riekkinen [2017] developed Astra plugin to access learning con-tent supported by A-plus LMS inside Moodle. The solution bypasses theA-plus front service and replaces it with Moodle. Therefore, in this sce-nario, Moodle becomes responsible for storing data and conducting LA forthe A-plus activities.
8http://www.django-rest-framework.org/
Chapter 4
Teacher Interviews
This chapter addresses the RQ2 in this thesis: What LA objectives the coursestaff find most important? In order to answer the question in our specific case,we ask the staff of the courses in focus. We source their expert knowledge inuser requirements interviews. First, this chapter discusses related work andimportance of these interviews. Second, the employed interview method isdescribed. Then, the results are presented. Finally, trustworthiness of resultsis examined.
4.1 Related Work
Two related works interview teachers to discover their wants and needs ofLA visualization. Bakharia et al. [2016] create a high level conceptual frame-work of LA visualization for teachers. They describe LA dimensions thatwere presented in Table 2.2. In comparison to our focus courses, automaticassessment is rare among their interviewees and the reported results lackdetail of specific objectives for our purpose.
Xhakaj et al. [2016] interview only mathematics teachers from elementaryschool and they focus on particular mathematics learning environment. Theydescribe learning and applying LA in classroom to identify individual learnersthat need help. In contrast, this thesis focus on large courses in highereducation where assignments are typically separate from lectures.
Interviewing teachers from our focus group ensures proper coverage anddetail of the issues that are relevant in this specific case. Additional motivefor the interviews emerges from the software engineering perspective. Theteachers are the users of the software that this thesis develops. They area natural source of user requirements in this project. Furthermore, the in-volvement of the course staff is important to build commitment to LA, as
37
CHAPTER 4. TEACHER INTERVIEWS 38
previously noted in Chapter 3.1.1.While the previous interview results are not directly transferable to our
case they are used, with other related work, in design of interview themesand critical evaluation of our findings.
4.2 Method
We selected interview as a method that lets us conduct qualitative researchof epistemologically subjective knowledge. Maguire [2001, pp. 599–600] rec-ognizes semi–structured user requirements interview as a common techniquein human–centered design to gain information on needs or requirements for anew system. Bernard [2012] describes the semi–structured interview methodin detail. First, the selection of interviewees is reported. Second, we describethe interview script and how interviews were conducted. Finally, the analysismethod is presented.
4.2.1 Interviewees
We decided to interview the responsible teacher from each of the four focuscourses. The teacher is likely to have a holistic view of the course issues andif there would be a better person to interview on LA they could delegate.In our case, the teachers indeed were experts in possibilities to apply LAto their course. All of the teachers had entered A!OLE in order to developonline learning and many have previous understanding of LA.
The interviewees include one University Teacher and three Senior Univer-sity Lecturers. Each interviewee has at least 15 years of teaching experience.One represents department of Mathematics while the others are from Com-puter Science. The interviewees are above 35 and below 50 years of age. Oneinterviewee is female and the rest are male.
The interviewees are not randomly selected. The selection is determinedby the target courses where this thesis focused on. Those courses are selectedusing the criteria defined in Chapter 3.1.3 that aims to produce immediatevalue from course level LA. Therefore, these interviews are designed to pro-duce information for the particular research case defined in this thesis.
4.2.2 Script
A semi-structured interview script, that allows free discussion on the se-lected themes, was designed based on the related research and the currentLA software. The interviews were conducted and recorded in audio by single
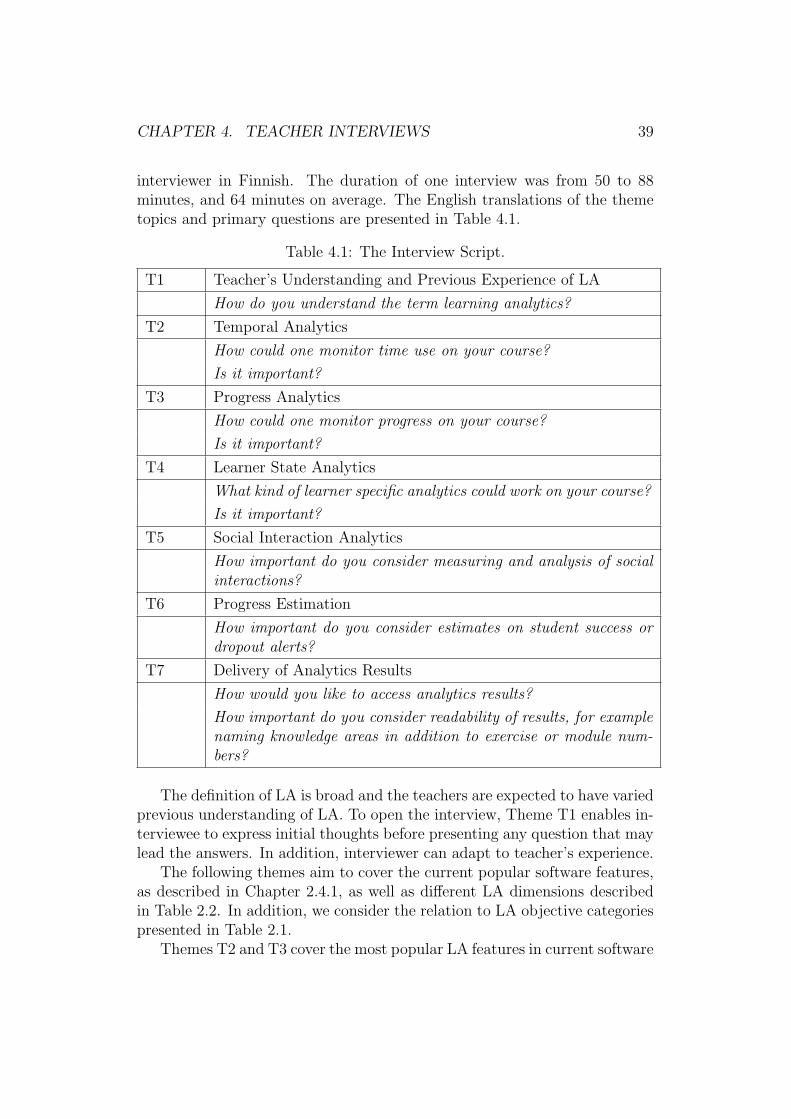
CHAPTER 4. TEACHER INTERVIEWS 39
interviewer in Finnish. The duration of one interview was from 50 to 88minutes, and 64 minutes on average. The English translations of the themetopics and primary questions are presented in Table 4.1.
Table 4.1: The Interview Script.
T1 Teacher’s Understanding and Previous Experience of LA
How do you understand the term learning analytics?
T2 Temporal Analytics
How could one monitor time use on your course?
Is it important?
T3 Progress Analytics
How could one monitor progress on your course?
Is it important?
T4 Learner State Analytics
What kind of learner specific analytics could work on your course?
Is it important?
T5 Social Interaction Analytics
How important do you consider measuring and analysis of socialinteractions?
T6 Progress Estimation
How important do you consider estimates on student success ordropout alerts?
T7 Delivery of Analytics Results
How would you like to access analytics results?
How important do you consider readability of results, for examplenaming knowledge areas in addition to exercise or module num-bers?
The definition of LA is broad and the teachers are expected to have variedprevious understanding of LA. To open the interview, Theme T1 enables in-terviewee to express initial thoughts before presenting any question that maylead the answers. In addition, interviewer can adapt to teacher’s experience.
The following themes aim to cover the current popular software features,as described in Chapter 2.4.1, as well as different LA dimensions describedin Table 2.2. In addition, we consider the relation to LA objective categoriespresented in Table 2.1.
Themes T2 and T3 cover the most popular LA features in current software
CHAPTER 4. TEACHER INTERVIEWS 40
which are statistical summaries of temporal events and tool specific eventdata respectively. In common features, the tool specific events are primarilyused to estimate progress in reaching the learning goals. Then, Theme T4refers to presenting a selected learner in relation to learning content and otherlearners. This provides opportunities to discuss more on the LA dimensionsof comparative analytics and cohort dynamics in comparison to the temporaland tool specific analytics. This may activate also the LA objective categoriesof tutoring and reflection in addition to the monitoring and analysis.
The next themes broaden the discussion to the outer reach of the currentLA features in software. Theme T5 analyzes tool specific data in socialinteraction context. Theme T6 explicitly moves the LA objective categoryfrom monitoring and analysis to prediction and intervention. This topic islikely to cross into contingency and intervention support tools which wouldcover the last remaining LA dimension. Finally, Theme T7 investigates theusability requirements of an LA solution.
Considering Themes T2–T5, the interviewer prepared to demonstratescreen captures of typical software features on the different themes. They in-cluded 16 captures from videos and web pages that are linked in Appendix A.Demonstration can stimulate discussion and suggest concrete visualizationmethods. However, that introduces a possibility of leading interviewees toconclusions.
The interview aim is to identify specific learning analytics objectives thatbecome requirements in our research case. The interviewer repeatedly en-couraged the teachers to think about their own course and name learninganalytics objectives they might consider.
4.2.3 Analysis
The interviewer did qualitative deductive content analysis of the recordedinterviews. The discussion themes represent our broad understanding ofpotential LA features and dimensions as discussed above. The interviews aimto discover relevance of the themes and specific needs in our research case.Therefore, we identify LA objectives that the teachers find most importantand thus, answer the research question.
First, any requests, objectives, or wishes that teachers could constructwere quoted individually and transcribed from the audio recordings. If thesame thought reappeared in the same interview only the most detailed for-mulation was quoted. Then, the quotes were translated into English forreporting.
Finally, the quotes were categorized into the discussion themes that thequotes in their context best belong to. This was not necessarily the discussion
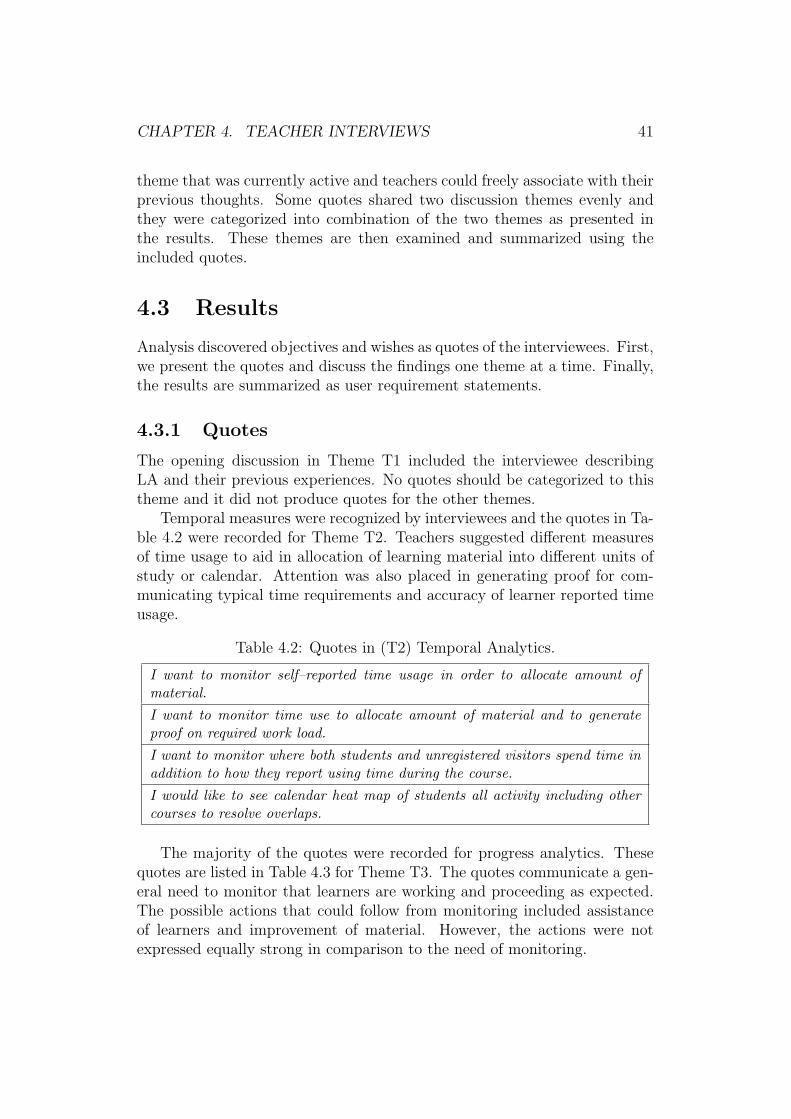
CHAPTER 4. TEACHER INTERVIEWS 41
theme that was currently active and teachers could freely associate with theirprevious thoughts. Some quotes shared two discussion themes evenly andthey were categorized into combination of the two themes as presented inthe results. These themes are then examined and summarized using theincluded quotes.
4.3 Results
Analysis discovered objectives and wishes as quotes of the interviewees. First,we present the quotes and discuss the findings one theme at a time. Finally,the results are summarized as user requirement statements.
4.3.1 Quotes
The opening discussion in Theme T1 included the interviewee describingLA and their previous experiences. No quotes should be categorized to thistheme and it did not produce quotes for the other themes.
Temporal measures were recognized by interviewees and the quotes in Ta-ble 4.2 were recorded for Theme T2. Teachers suggested different measuresof time usage to aid in allocation of learning material into different units ofstudy or calendar. Attention was also placed in generating proof for com-municating typical time requirements and accuracy of learner reported timeusage.
Table 4.2: Quotes in (T2) Temporal Analytics.
I want to monitor self–reported time usage in order to allocate amount ofmaterial.
I want to monitor time use to allocate amount of material and to generateproof on required work load.
I want to monitor where both students and unregistered visitors spend time inaddition to how they report using time during the course.
I would like to see calendar heat map of students all activity including othercourses to resolve overlaps.
The majority of the quotes were recorded for progress analytics. Thesequotes are listed in Table 4.3 for Theme T3. The quotes communicate a gen-eral need to monitor that learners are working and proceeding as expected.The possible actions that could follow from monitoring included assistanceof learners and improvement of material. However, the actions were notexpressed equally strong in comparison to the need of monitoring.
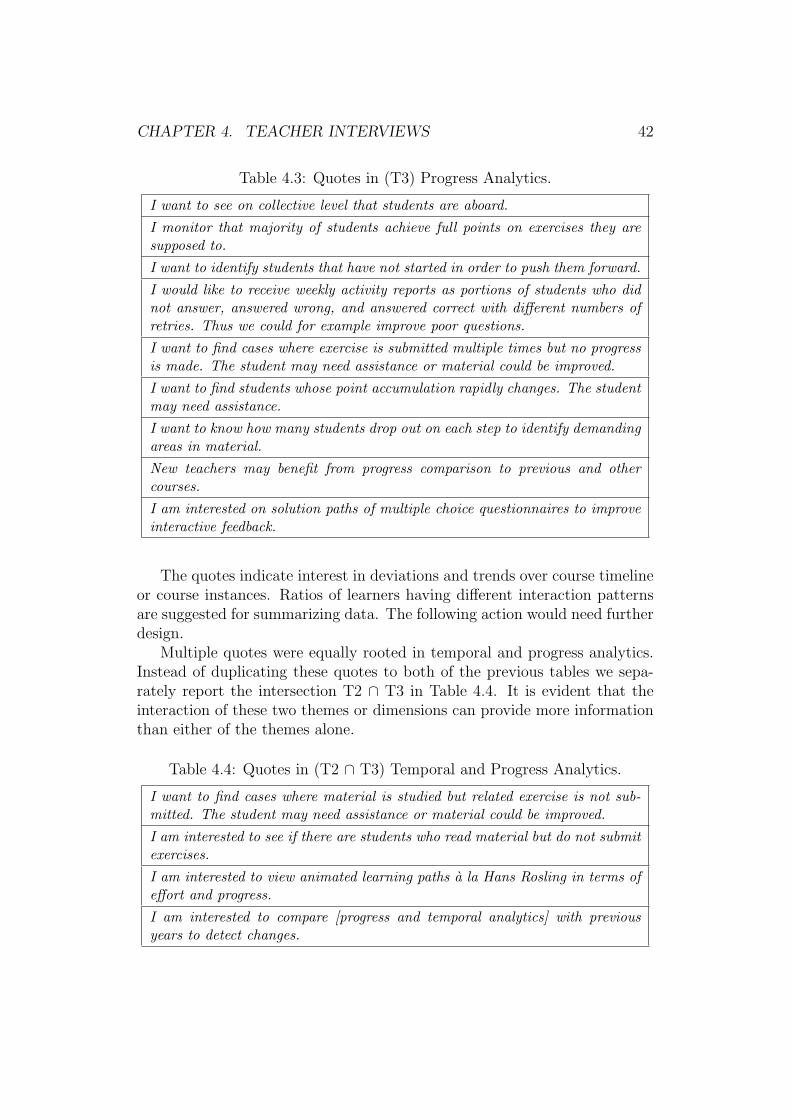
CHAPTER 4. TEACHER INTERVIEWS 42
Table 4.3: Quotes in (T3) Progress Analytics.
I want to see on collective level that students are aboard.
I monitor that majority of students achieve full points on exercises they aresupposed to.
I want to identify students that have not started in order to push them forward.
I would like to receive weekly activity reports as portions of students who didnot answer, answered wrong, and answered correct with different numbers ofretries. Thus we could for example improve poor questions.
I want to find cases where exercise is submitted multiple times but no progressis made. The student may need assistance or material could be improved.
I want to find students whose point accumulation rapidly changes. The studentmay need assistance.
I want to know how many students drop out on each step to identify demandingareas in material.
New teachers may benefit from progress comparison to previous and othercourses.
I am interested on solution paths of multiple choice questionnaires to improveinteractive feedback.
The quotes indicate interest in deviations and trends over course timelineor course instances. Ratios of learners having different interaction patternsare suggested for summarizing data. The following action would need furtherdesign.
Multiple quotes were equally rooted in temporal and progress analytics.Instead of duplicating these quotes to both of the previous tables we sepa-rately report the intersection T2 ∩ T3 in Table 4.4. It is evident that theinteraction of these two themes or dimensions can provide more informationthan either of the themes alone.
Table 4.4: Quotes in (T2 ∩ T3) Temporal and Progress Analytics.
I want to find cases where material is studied but related exercise is not sub-mitted. The student may need assistance or material could be improved.
I am interested to see if there are students who read material but do not submitexercises.
I am interested to view animated learning paths a la Hans Rosling in terms ofeffort and progress.
I am interested to compare [progress and temporal analytics] with previousyears to detect changes.
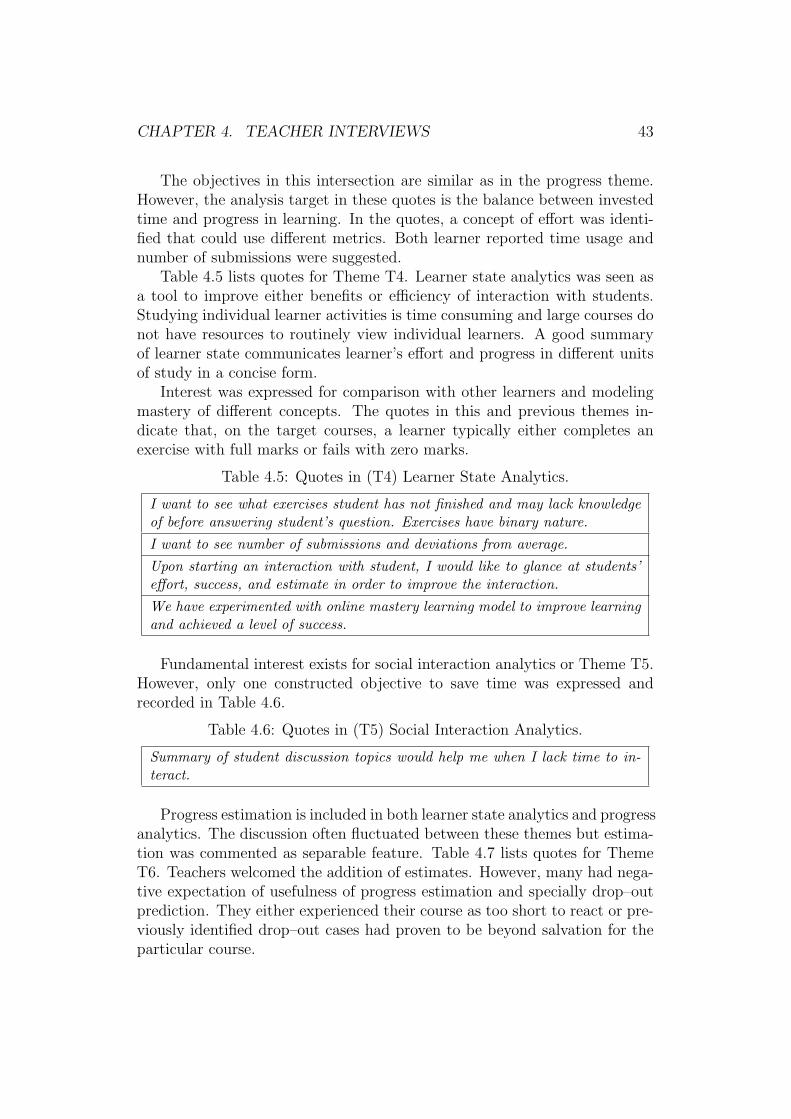
CHAPTER 4. TEACHER INTERVIEWS 43
The objectives in this intersection are similar as in the progress theme.However, the analysis target in these quotes is the balance between investedtime and progress in learning. In the quotes, a concept of effort was identi-fied that could use different metrics. Both learner reported time usage andnumber of submissions were suggested.
Table 4.5 lists quotes for Theme T4. Learner state analytics was seen asa tool to improve either benefits or efficiency of interaction with students.Studying individual learner activities is time consuming and large courses donot have resources to routinely view individual learners. A good summaryof learner state communicates learner’s effort and progress in different unitsof study in a concise form.
Interest was expressed for comparison with other learners and modelingmastery of different concepts. The quotes in this and previous themes in-dicate that, on the target courses, a learner typically either completes anexercise with full marks or fails with zero marks.
Table 4.5: Quotes in (T4) Learner State Analytics.
I want to see what exercises student has not finished and may lack knowledgeof before answering student’s question. Exercises have binary nature.
I want to see number of submissions and deviations from average.
Upon starting an interaction with student, I would like to glance at students’effort, success, and estimate in order to improve the interaction.
We have experimented with online mastery learning model to improve learningand achieved a level of success.
Fundamental interest exists for social interaction analytics or Theme T5.However, only one constructed objective to save time was expressed andrecorded in Table 4.6.
Table 4.6: Quotes in (T5) Social Interaction Analytics.
Summary of student discussion topics would help me when I lack time to in-teract.
Progress estimation is included in both learner state analytics and progressanalytics. The discussion often fluctuated between these themes but estima-tion was commented as separable feature. Table 4.7 lists quotes for ThemeT6. Teachers welcomed the addition of estimates. However, many had nega-tive expectation of usefulness of progress estimation and specially drop–outprediction. They either experienced their course as too short to react or pre-viously identified drop–out cases had proven to be beyond salvation for theparticular course.
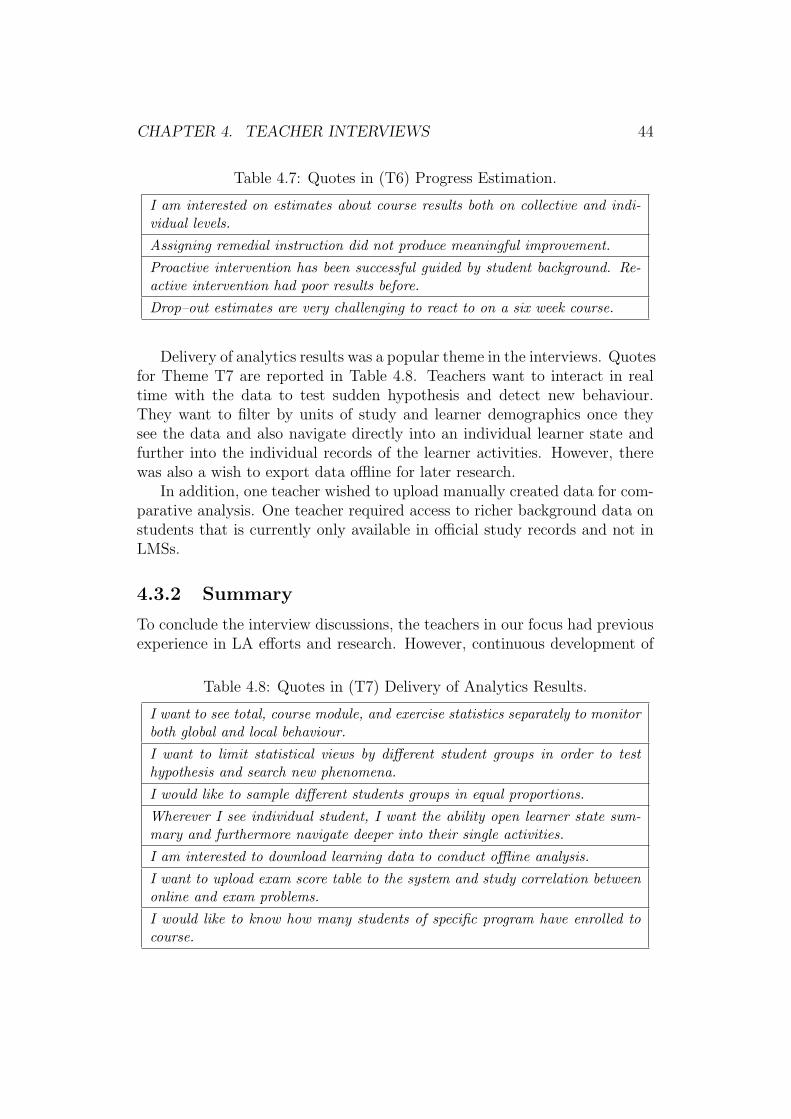
CHAPTER 4. TEACHER INTERVIEWS 44
Table 4.7: Quotes in (T6) Progress Estimation.
I am interested on estimates about course results both on collective and indi-vidual levels.
Assigning remedial instruction did not produce meaningful improvement.
Proactive intervention has been successful guided by student background. Re-active intervention had poor results before.
Drop–out estimates are very challenging to react to on a six week course.
Delivery of analytics results was a popular theme in the interviews. Quotesfor Theme T7 are reported in Table 4.8. Teachers want to interact in realtime with the data to test sudden hypothesis and detect new behaviour.They want to filter by units of study and learner demographics once theysee the data and also navigate directly into an individual learner state andfurther into the individual records of the learner activities. However, therewas also a wish to export data offline for later research.
In addition, one teacher wished to upload manually created data for com-parative analysis. One teacher required access to richer background data onstudents that is currently only available in official study records and not inLMSs.
4.3.2 Summary
To conclude the interview discussions, the teachers in our focus had previousexperience in LA efforts and research. However, continuous development of
Table 4.8: Quotes in (T7) Delivery of Analytics Results.
I want to see total, course module, and exercise statistics separately to monitorboth global and local behaviour.
I want to limit statistical views by different student groups in order to testhypothesis and search new phenomena.
I would like to sample different students groups in equal proportions.
Wherever I see individual student, I want the ability open learner state sum-mary and furthermore navigate deeper into their single activities.
I am interested to download learning data to conduct offline analysis.
I want to upload exam score table to the system and study correlation betweenonline and exam problems.
I would like to know how many students of specific program have enrolled tocourse.
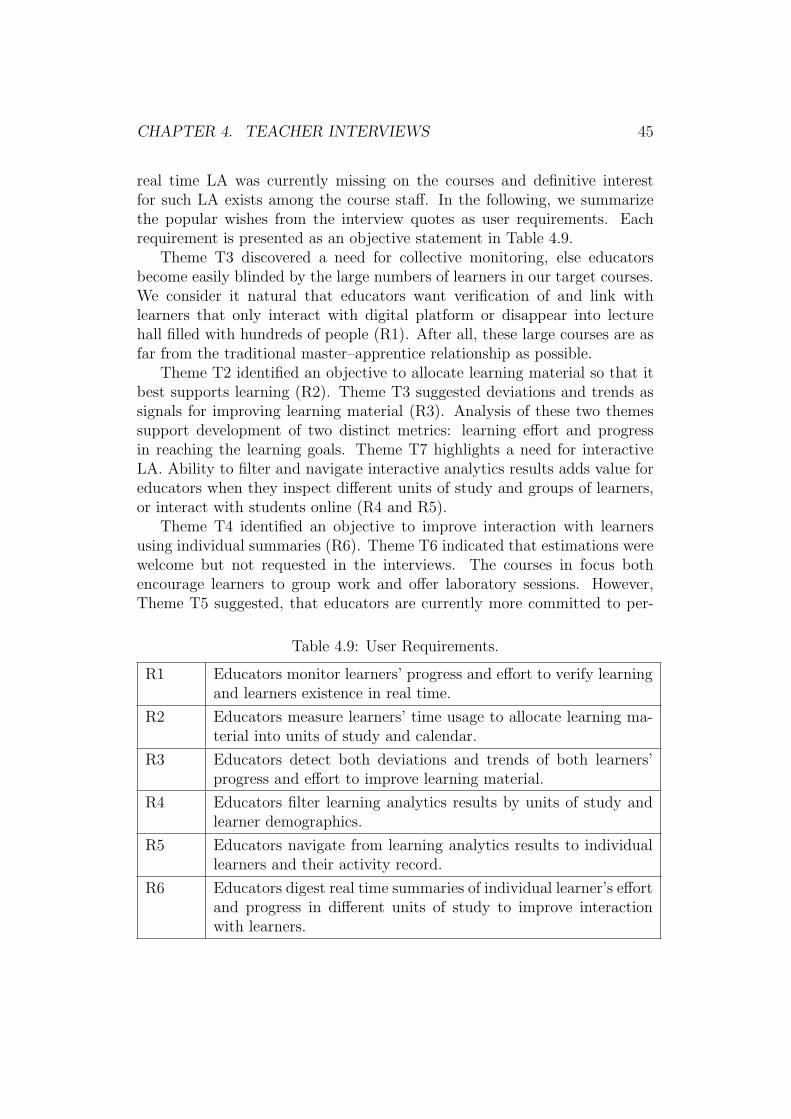
CHAPTER 4. TEACHER INTERVIEWS 45
real time LA was currently missing on the courses and definitive interestfor such LA exists among the course staff. In the following, we summarizethe popular wishes from the interview quotes as user requirements. Eachrequirement is presented as an objective statement in Table 4.9.
Theme T3 discovered a need for collective monitoring, else educatorsbecome easily blinded by the large numbers of learners in our target courses.We consider it natural that educators want verification of and link withlearners that only interact with digital platform or disappear into lecturehall filled with hundreds of people (R1). After all, these large courses are asfar from the traditional master–apprentice relationship as possible.
Theme T2 identified an objective to allocate learning material so that itbest supports learning (R2). Theme T3 suggested deviations and trends assignals for improving learning material (R3). Analysis of these two themessupport development of two distinct metrics: learning effort and progressin reaching the learning goals. Theme T7 highlights a need for interactiveLA. Ability to filter and navigate interactive analytics results adds value foreducators when they inspect different units of study and groups of learners,or interact with students online (R4 and R5).
Theme T4 identified an objective to improve interaction with learnersusing individual summaries (R6). Theme T6 indicated that estimations werewelcome but not requested in the interviews. The courses in focus bothencourage learners to group work and offer laboratory sessions. However,Theme T5 suggested, that educators are currently more committed to per-
Table 4.9: User Requirements.
R1 Educators monitor learners’ progress and effort to verify learningand learners existence in real time.
R2 Educators measure learners’ time usage to allocate learning ma-terial into units of study and calendar.
R3 Educators detect both deviations and trends of both learners’progress and effort to improve learning material.
R4 Educators filter learning analytics results by units of study andlearner demographics.
R5 Educators navigate from learning analytics results to individuallearners and their activity record.
R6 Educators digest real time summaries of individual learner’s effortand progress in different units of study to improve interactionwith learners.
CHAPTER 4. TEACHER INTERVIEWS 46
haps simpler data sources that are available to them.
4.4 Trustworthiness
The trustworthiness of the interview results is evaluated using concepts ofcredibility, transferability, dependability, and confirmability as described byLincoln and Guba [1985]. The confirmability is achieved by describing theinterview methods and the complete process in Chapter 4. Next, we discusscredibility.
The majority of the communicated objectives were modest and feasible.In part, the modest objectives are explained with the experience of the in-terviewed teachers. They knew what is feasible with the available data andoff-the-shelf methodology. In addition, the themes and demonstrations mayhave lead the teachers to modest ideas.
The interview did not introduce all LA possibilities. A more completecoverage could be achieved with themes that introduce all LA method cate-gories, as described in Table 2.3, in contrast to LA dimensions and currentsoftware as in our case. This would place more focus on the advanced meth-ods and possibly produce more ambitious objectives. Therefore, the interviewscript is biased towards currently available LA features. The interviews havecredibility inside the introduced LA space. However, the interviews can notbe used to argue about LA topics that are not included in the interviewscript.
When considering the transferability of these results, we note that all theinterviewed teachers were from courses that have implemented weekly onlinelearning activities and have not yet started systematic LA. Furthermore, theinterviewed teachers were part of online learning pilots and had interest andexperience in online learning.
To improve dependability, we kept the interpretation of teachers’ wordsto minimum in analysis. However, some interpretation occurs in selectionof quotes, transcribing, and translation. During the interviews, we clearedopinions so that they would leave no room for misunderstanding. Anotherdependability issue is the small number of interviewees. There were only fourinterviews. However, the analysis of individual interviews revealed similarityin quotes and focus.
Finally, each teacher in our focus has expressed feasible objectives andinterest to LA solution that could deliver such value. This allows to designa viable LA solution that can produce immediate value in this research case.
Chapter 5
Solution
This chapter presents software that can bootstrap LA in this research case.This is a solution to the research problem. The design decisions are arguedto compliment the technical and organizational environment as describedin Chapter 3 and the initial objectives of the course staff as discovered inChapter 4. Furthermore, the work is considered to align with the consensusof LA research that is discussed in Chapter 2.
First, this chapter develops architectural design that divides responsi-bilities to different components that together comprise the solution. Then,design decisions of each novel software component are documented.
5.1 Architectural Design
The existing technical environment includes two LMSs that implement dif-ferent features and data storages. This thesis does not deliver one softwareapplication but selection of software components that extend or interact withthe LMSs. In following, we argue the need of three different components us-ing previously defined software requirements and our review of related work.
First, real time visualization is considered. Second, steps and benefitsof using external analytics tools are discussed. Third, integration of learn-ing data from different sources is examined. Finally, the designed softwarecomponents and their relations to each other and their environment are pre-sented.
5.1.1 Real Time and Interactive Visualization
Interviews identified user requirements presented in Table 4.9. They includethe requirements R1 and R6 to monitor learners’ progress and effort in real
47
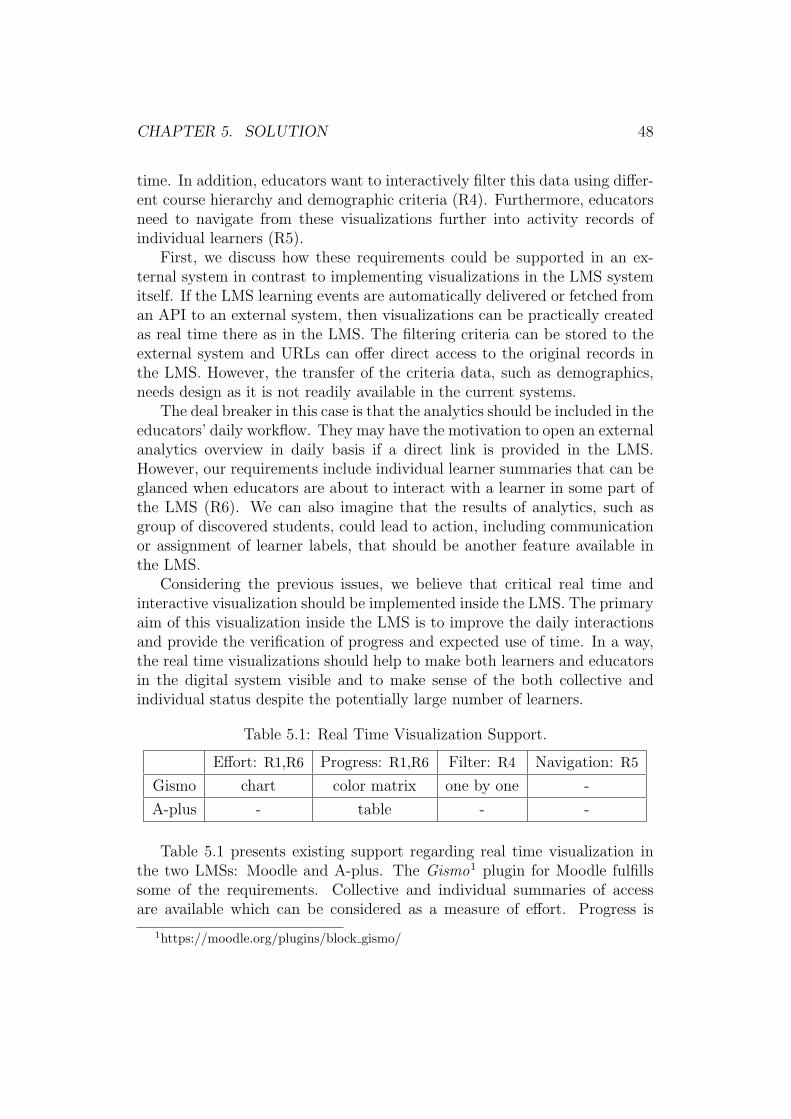
CHAPTER 5. SOLUTION 48
time. In addition, educators want to interactively filter this data using differ-ent course hierarchy and demographic criteria (R4). Furthermore, educatorsneed to navigate from these visualizations further into activity records ofindividual learners (R5).
First, we discuss how these requirements could be supported in an ex-ternal system in contrast to implementing visualizations in the LMS systemitself. If the LMS learning events are automatically delivered or fetched froman API to an external system, then visualizations can be practically createdas real time there as in the LMS. The filtering criteria can be stored to theexternal system and URLs can offer direct access to the original records inthe LMS. However, the transfer of the criteria data, such as demographics,needs design as it is not readily available in the current systems.
The deal breaker in this case is that the analytics should be included in theeducators’ daily workflow. They may have the motivation to open an externalanalytics overview in daily basis if a direct link is provided in the LMS.However, our requirements include individual learner summaries that can beglanced when educators are about to interact with a learner in some part ofthe LMS (R6). We can also imagine that the results of analytics, such asgroup of discovered students, could lead to action, including communicationor assignment of learner labels, that should be another feature available inthe LMS.
Considering the previous issues, we believe that critical real time andinteractive visualization should be implemented inside the LMS. The primaryaim of this visualization inside the LMS is to improve the daily interactionsand provide the verification of progress and expected use of time. In a way,the real time visualizations should help to make both learners and educatorsin the digital system visible and to make sense of the both collective andindividual status despite the potentially large number of learners.
Table 5.1: Real Time Visualization Support.
Effort: R1,R6 Progress: R1,R6 Filter: R4 Navigation: R5
Gismo chart color matrix one by one -
A-plus - table - -
Table 5.1 presents existing support regarding real time visualization inthe two LMSs: Moodle and A-plus. The Gismo1 plugin for Moodle fulfillssome of the requirements. Collective and individual summaries of accessare available which can be considered as a measure of effort. Progress is
1https://moodle.org/plugins/block gismo/
CHAPTER 5. SOLUTION 49
visualized as a matrix of achieved grades by learner and activity. The matrixcan not provide a collective view on a large course. Data can be filtered byexercise or learner by selecting individual items. The items are not navigable.
A-plus only offers a tabular view of course grades by learner and activity.While this is real time data the lack of summaries makes monitoring progressor effort impossible. Both visualization and interaction are missing.
5.1.2 External Analytics Tools
In Table 4.9, the interviews identified the requirements R2 and R3 that aimto, respectively, allocate and develop learning material. This is not as timecritical objective as the previous considerations about real time requirements.Furthermore, Chapter 2 presents LA as a cyclic and developing process. Weexcept that once LA experience on courses grows there will be many newobjectives that are less time critical and can manifest in weekly reports orpost–mortem analysis.
The previous arguments of including LA inside LMS are not strong inthese scenarios. The effort and cost of implementing custom analytics areseveral times higher in comparison to applying an existing LA tool. Further-more, general analytics tools offer higher flexibility and rapid experimenta-tion capability. Finding software developers that have required programmingskills, knowledge of LMS architecture, and understanding of analytics is noteasy.
Aalto University personnel are licensed to use Microsoft Power BI 2 thathas a low entry barrier to start experimenting with statistics and visual-izations. Educators could potentially construct their own dashboards andreports or a resource could be hired to help the different stakeholders toconstruct analytics and interpret results.
To enable use of external tools this thesis can develop support to fetchdata from LMSs into an external analytics software. Power BI can readdownloaded CSV, JSON, or Excel files. Furthermore, it can store URLsthat provide data in these formats and automatically update the data onceanalytics are accessed. However, this requires that the access to the URLcan be authorized e.g. using a web service API token.
On large courses, downloading all possible data is a heavy operation andconducting simple analysis may require many steps. It would be also usefulto have access to aggregate numbers, such as achieved grade by learner andactivity, or number of attempts by learner and activity.
Table 5.2 presents existing support for external analytics tools. Moodle by
2https://powerbi.microsoft.com/
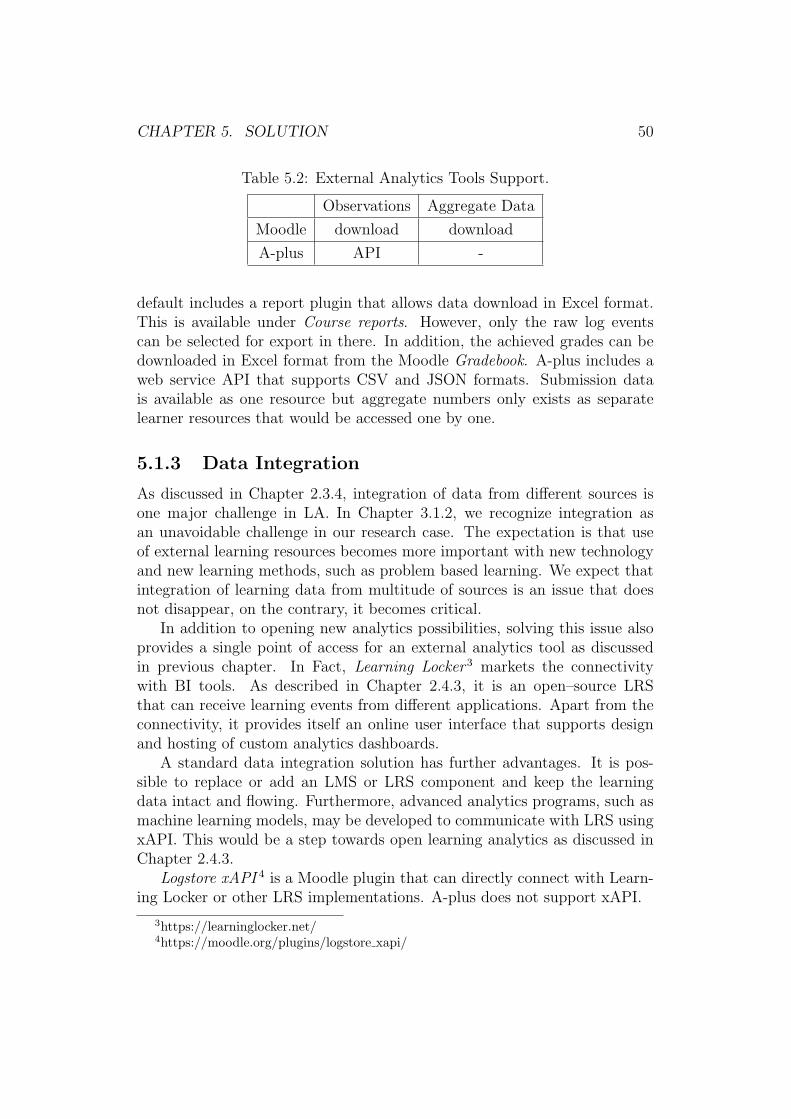
CHAPTER 5. SOLUTION 50
Table 5.2: External Analytics Tools Support.
Observations Aggregate Data
Moodle download download
A-plus API -
default includes a report plugin that allows data download in Excel format.This is available under Course reports. However, only the raw log eventscan be selected for export in there. In addition, the achieved grades can bedownloaded in Excel format from the Moodle Gradebook. A-plus includes aweb service API that supports CSV and JSON formats. Submission datais available as one resource but aggregate numbers only exists as separatelearner resources that would be accessed one by one.
5.1.3 Data Integration
As discussed in Chapter 2.3.4, integration of data from different sources isone major challenge in LA. In Chapter 3.1.2, we recognize integration asan unavoidable challenge in our research case. The expectation is that useof external learning resources becomes more important with new technologyand new learning methods, such as problem based learning. We expect thatintegration of learning data from multitude of sources is an issue that doesnot disappear, on the contrary, it becomes critical.
In addition to opening new analytics possibilities, solving this issue alsoprovides a single point of access for an external analytics tool as discussedin previous chapter. In Fact, Learning Locker 3 markets the connectivitywith BI tools. As described in Chapter 2.4.3, it is an open–source LRSthat can receive learning events from different applications. Apart from theconnectivity, it provides itself an online user interface that supports designand hosting of custom analytics dashboards.
A standard data integration solution has further advantages. It is pos-sible to replace or add an LMS or LRS component and keep the learningdata intact and flowing. Furthermore, advanced analytics programs, such asmachine learning models, may be developed to communicate with LRS usingxAPI. This would be a step towards open learning analytics as discussed inChapter 2.4.3.
Logstore xAPI 4 is a Moodle plugin that can directly connect with Learn-ing Locker or other LRS implementations. A-plus does not support xAPI.
3https://learninglocker.net/4https://moodle.org/plugins/logstore xapi/
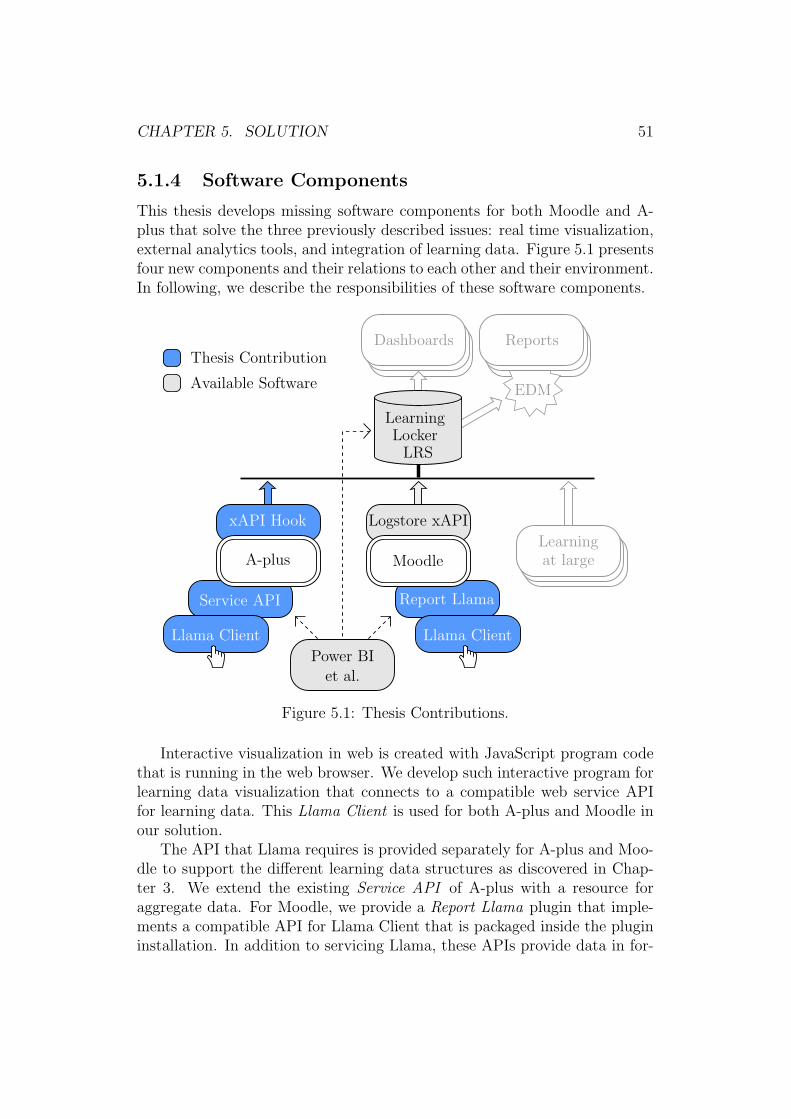
CHAPTER 5. SOLUTION 51
5.1.4 Software Components
This thesis develops missing software components for both Moodle and A-plus that solve the three previously described issues: real time visualization,external analytics tools, and integration of learning data. Figure 5.1 presentsfour new components and their relations to each other and their environment.In following, we describe the responsibilities of these software components.
Power BIet al.
Dashboards
EDM
Learningat large
Reports
Report Llama
Moodle
Service API
A-plus
xAPI Hook Logstore xAPI
Llama Client
Available Software
Thesis Contribution
LearningLockerLRS
Llama Client
Figure 5.1: Thesis Contributions.
Interactive visualization in web is created with JavaScript program codethat is running in the web browser. We develop such interactive program forlearning data visualization that connects to a compatible web service APIfor learning data. This Llama Client is used for both A-plus and Moodle inour solution.
The API that Llama requires is provided separately for A-plus and Moo-dle to support the different learning data structures as discovered in Chap-ter 3. We extend the existing Service API of A-plus with a resource foraggregate data. For Moodle, we provide a Report Llama plugin that imple-ments a compatible API for Llama Client that is packaged inside the plugininstallation. In addition to servicing Llama, these APIs provide data in for-
CHAPTER 5. SOLUTION 52
mat that can be used in external analytics tools.Finally, we propose that Aalto University would start an LRS where
Moodle, A-plus, and other potential learning solutions can deliver learningdata. As described in Chapter 5.1.3, this would open up new and excitingpossibilities to develop LA at Aalto. In preparation, we extend A-plus designof hook URLs with xAPI Hook that supports integration to LRSs. Moodlehas an existing plugin for the same purpose.
5.2 Llama Client
This interactive program for learning data visualization can be configured tofetch data from different web service APIs on different LMSs or other learningtools. This adds value to our solution as it is potentially easy to integrateto different platforms where courses may share similar analytics needs. Thisprogram is known as Llama Client. In addition to sympathetic pack animal,Llama is an abbreviation of “la lumiere a Montagne analytique”.
We start by describing the principles of system and user interface de-sign. Then, we argument how different views fulfill previously identified userrequirements.
5.2.1 Internal Design
From the different visualization libraries D3.js5 is one of the most flexibleand supports visualization that is reactive to changes in data. Our solutionincludes filters and selections of data that affect the visualization in realtime. In addition, D3.js supports reading data in different formats, such asJSON and CSV, and uses Ajax technologies that allow transferring data fromserver to client without reloading the web page. It is a good match for ourpurpose and it creates vector visualizations that are accessible and reactiveto different screen sizes.
To separate concerns and to support modular structure we created aD3.js support library called d3Stream which encapsulates the asynchronousrequirements of data transfer and provides chaining of higher order functionsfor data transformation as well as visualization methods. The implementedtransformations include functions, such as map, filter, reduce, cross, repeat,group, and cumulate.
The transformation chain can be split into several displays that will reap-ply their own transformations if the original data stream is filtered or else
5https://d3js.org/
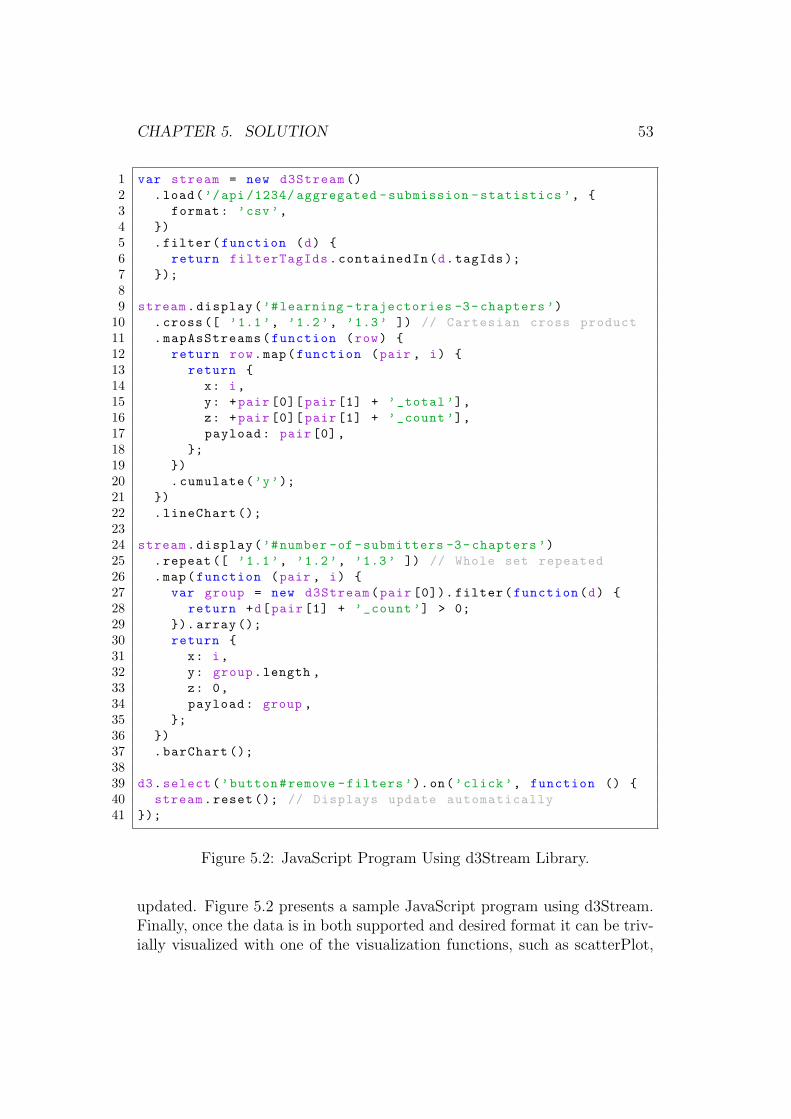
CHAPTER 5. SOLUTION 53
1 var stream = new d3Stream ()
2 .load(’/api /1234/ aggregated -submission -statistics ’, {
3 format: ’csv’,
4 })
5 .filter(function (d) {
6 return filterTagIds.containedIn(d.tagIds );
7 });
89 stream.display(’#learning -trajectories -3-chapters ’)
10 .cross ([ ’1.1’, ’1.2’, ’1.3’ ]) // Cartesian cross product
11 .mapAsStreams(function (row) {
12 return row.map(function (pair , i) {
13 return {
14 x: i,
15 y: +pair [0][ pair [1] + ’_total ’],
16 z: +pair [0][ pair [1] + ’_count ’],
17 payload: pair[0],
18 };
19 })
20 .cumulate(’y’);
21 })
22 .lineChart ();
2324 stream.display(’#number -of -submitters -3-chapters ’)
25 .repeat ([ ’1.1’, ’1.2’, ’1.3’ ]) // Whole set repeated
26 .map(function (pair , i) {
27 var group = new d3Stream(pair [0]). filter(function(d) {
28 return +d[pair [1] + ’_count ’] > 0;
29 }). array ();
30 return {
31 x: i,
32 y: group.length ,
33 z: 0,
34 payload: group ,
35 };
36 })
37 .barChart ();
3839 d3.select(’button#remove -filters ’).on(’click’, function () {
40 stream.reset (); // Displays update automatically
41 });
Figure 5.2: JavaScript Program Using d3Stream Library.
updated. Figure 5.2 presents a sample JavaScript program using d3Stream.Finally, once the data is in both supported and desired format it can be triv-ially visualized with one of the visualization functions, such as scatterPlot,
CHAPTER 5. SOLUTION 54
lineChart, barChart, stackedBarChart, or groupedBarChart. Using defaultoptions d3Stream creates clean, ascetic visualization whose appearance isprimarily controlled via CSS (Cascading Style Sheet).
The library helps to keep actual application logic cleaner and to avoidthe unstructured spaghetti code that event driven JavaScript programs canquickly generate [Mikkonen and Taivalsaari, 2008]. The design is similarto different reactive libraries that use the observer and functional program-ming patterns to contain asynchronous or user interface processes [Kambonaet al., 2013]. We believe the resulting code is, in addition to shorter, morecomprehensible than when directly using D3.js library.
On top of the D3.js and d3Stream layer, Llama Client implements con-figuration of API data sources, filters and visualizations. It employs callbackfunctions supported by d3Stream to implement interactive data selections.We employ jQuery6 JavaScript library to support the event processing andDOM (Document Object Model) modification that the user interface re-quires. The jQuery is included in both A-plus and Moodle by default.
Finally, the JavaScript code on both d3Stream and Llama is broken intosmall files that resemble classes of object oriented programming. This ispurely to support development and maintenance of the project code. Toolconfiguration is included to bundle, test, and minimize the JavaScript li-braries as single deployment files for the browsers. Browserify7 is used forthe bundling.
Both of the contributed JavaScript libraries d3Stream8 and Llama Client9
are developed in GitHub. They are open–source under MIT license. However,the Llama alone does not finish our task. It has to be complimented withan service API and packaging for the two LMSs at hand. Before discussingthat, we present the user interface of Llama.
5.2.2 User Interface Design
In data visualization design this thesis follows a model that Munzner [2014]has presented for visualization design and validation. We have already dis-cussed the visualization domain that is the courses in our research case andtheir staff who expressed requirements in the interviews.
Next, we consider the ‘What’ and ‘Why’ as Munzner’s model proceeds.For each visualization we discuss what data is used and why it is viewed. Theexpected action and target of the viewer leads the selection of visualization
6https://jquery.com/7http://browserify.org/8https://github.com/debyte/d3Stream/9https://github.com/Aalto-LeTech/llama-client/
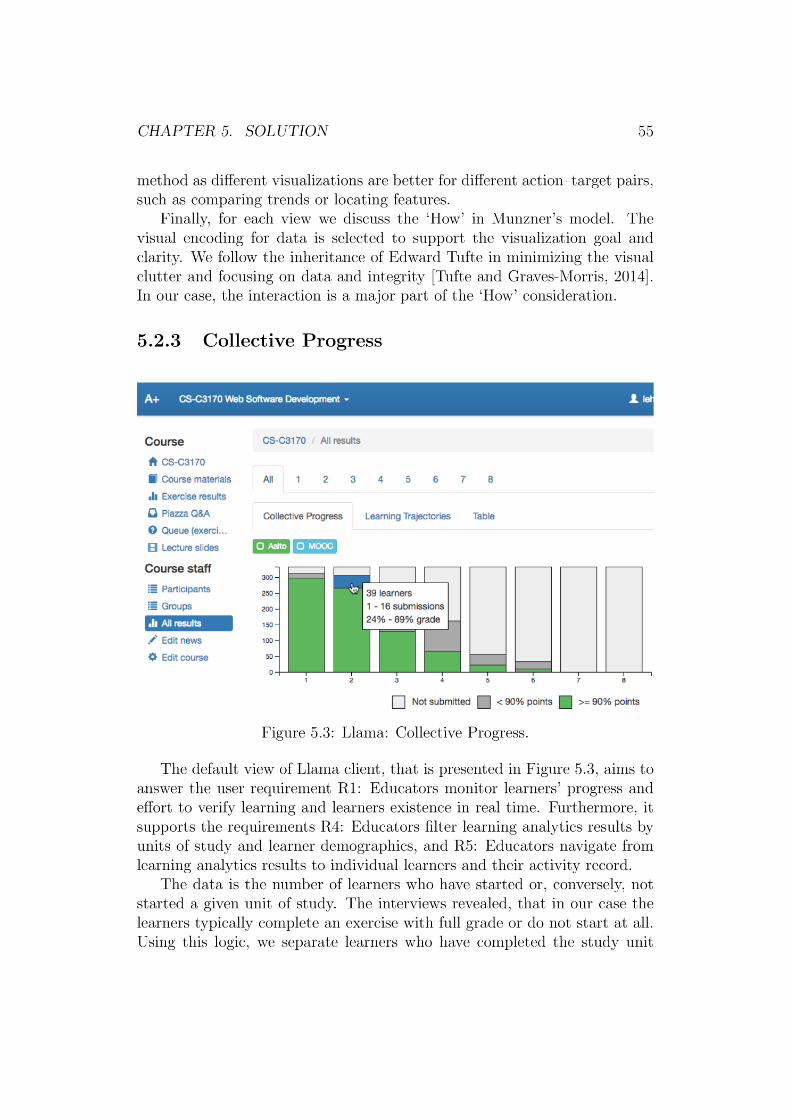
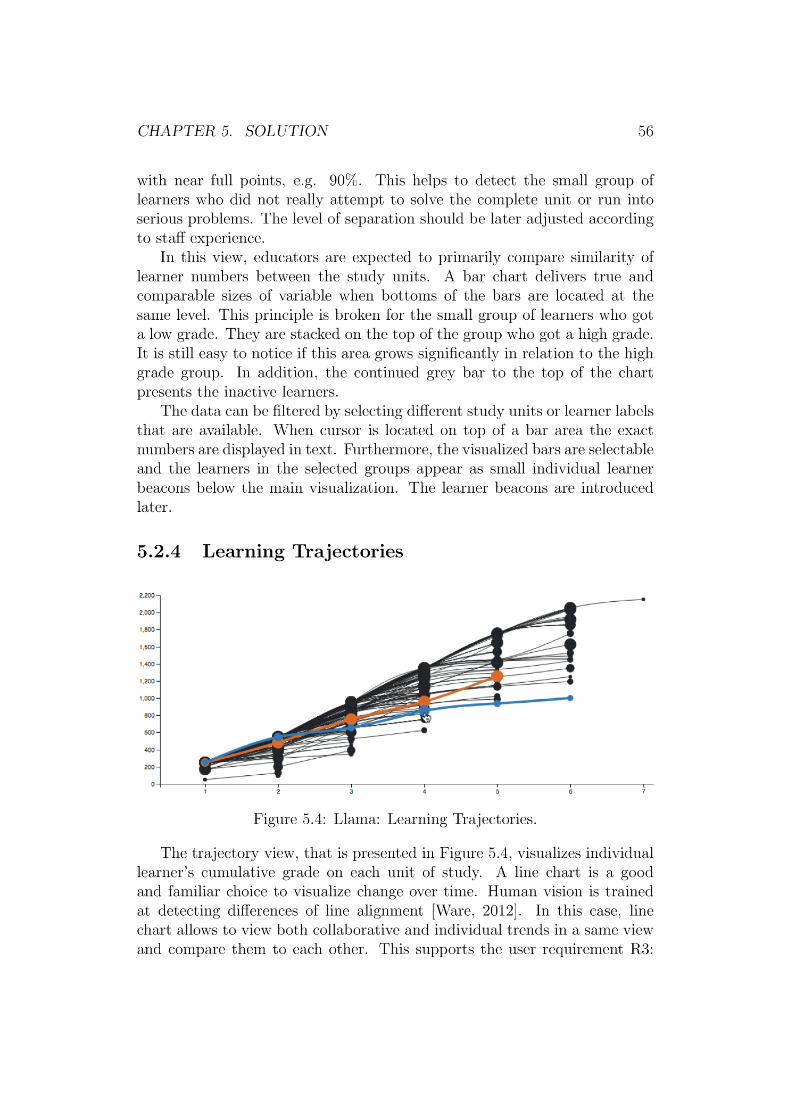
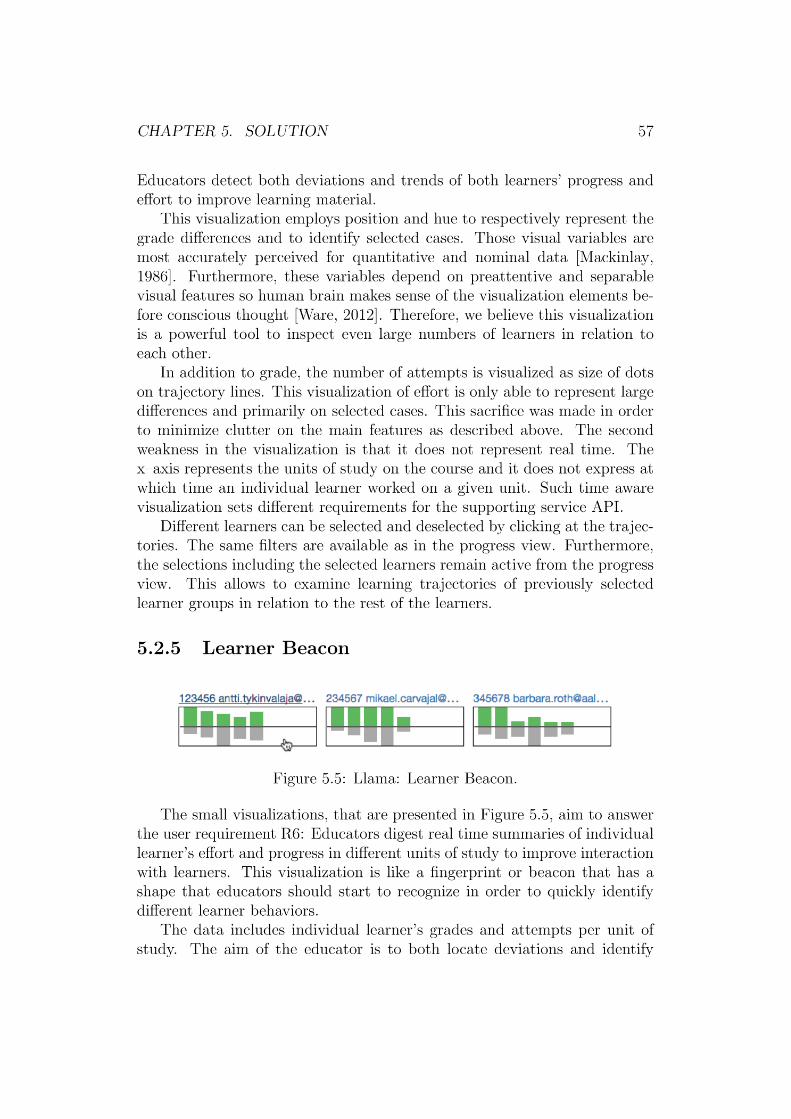

CHAPTER 5. SOLUTION 58
trend. The data includes two variables that change over the units of studyon the course. A line chart would be the preferred choice of visualization asin the trajectory view. However, the visualization should be so small thatit can be integrated into different views where learners are referenced. Twovariables in a line chart would become incomprehensible in a small size andwhen the variables share a similar trend.
As a solution, the variables are presented as two bar charts where grades,or progress, is presented upwards and attempts, or effort, is presented down-wards from the base line. The deviations, ultimately a missing bar, are easyto spot even in a small view. This visualization can show interesting imbal-ances where great effort yields little progress or, conversely, great progressis displayed with minimal effort. The weakness of this visualization is thattrend becomes hard to identify if the view is too small.
5.3 Service APIs
Llama Client connects to a web service API that is responsible for providingthe data to interactively visualize. Next, we discuss the challenges involvedin developing and operating such real time service.
In this case, the largest course has 644 learners. Furthermore, it has 351different units of study, if we consider exercises, chapters, and modules. Oneinstance of the course includes more than 100 000 submissions. The full dataincludes all of these timestamped events which potentially takes minutes toquery from database and format for transfer in the API.
To solve this problem, we decided to service aggregate data in API. How-ever, if 3 columns are created for each of the 351 study units, there are morethan 1 000 columns in a data sheet. That exceeds for example the maximumnumber of columns that Excel supports. More importantly, just calculatingand rendering such table in CSV takes at least similar time to rendering allthe individual submissions. Therefore, the study unit filters are critical toimplement so that they limit the size of the database queries and maximumnumber of columns to render. As a result, we define a web service API inAppendix B that is required to support Llama Client.
In implementation for both A-plus and Moodle, we follow closely thestandards enforced in these systems. There are no novel ideas. At the timeof writing, the implemented API in Moodle supports Quizz and AssignmentActivities. Technically, the load of calculating real time aggregates falls ondatabase systems in these LMS installations. Figure 5.6 presents sample codethat makes the Django ORM use aggregate functions at the database level.
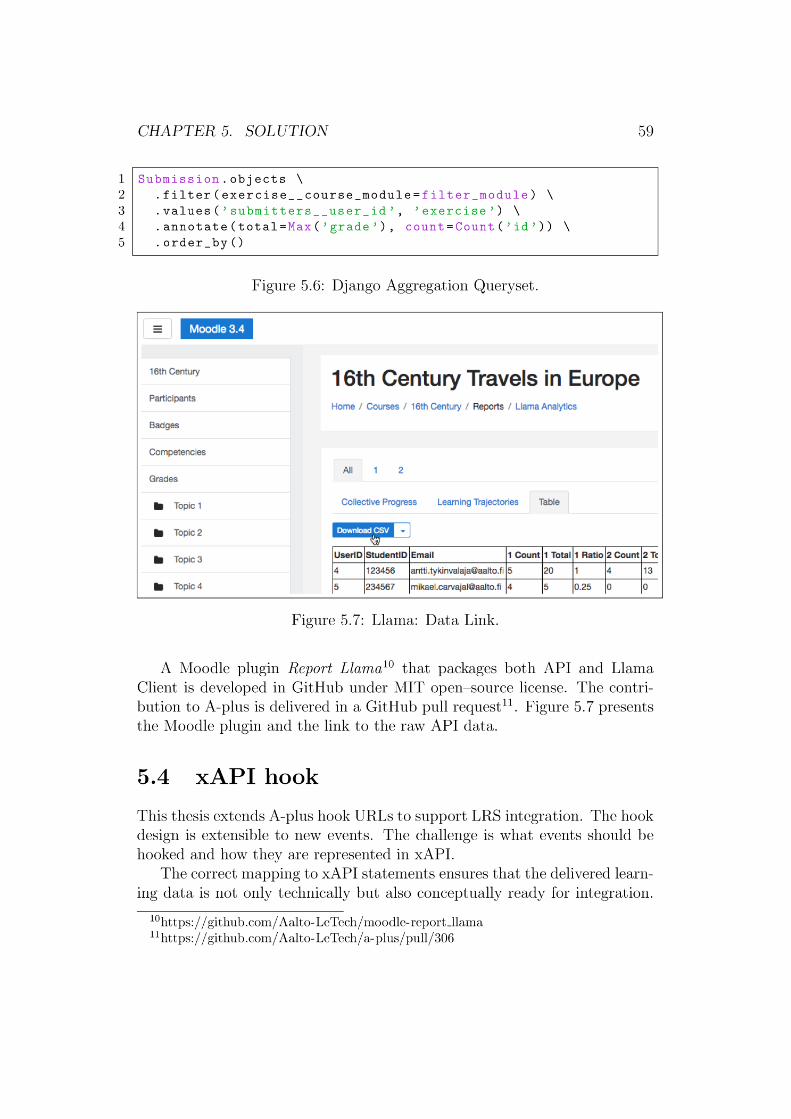
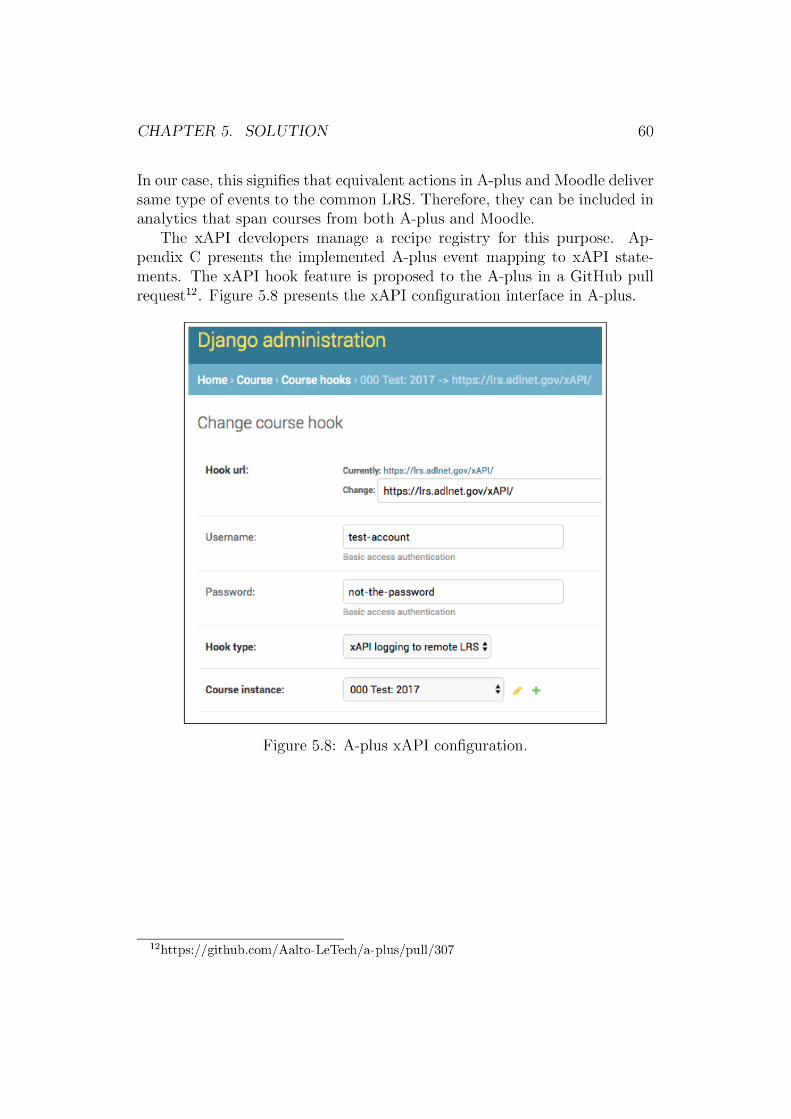
Chapter 6
Evaluation
This chapter critically evaluates that the solution is useful and an improve-ment over previously available alternatives. Completion of each researchgoal, that were set in Table 1.2, is evaluated. First, the access to learningdata is considered. Second, the support for the identified learning analyticsobjectives is evaluated. Third, the maintainability and extendability of thesolution is examined.
6.1 Access to Learning Data
In order to practice, develop, and research LA, access to learning data isa minimum and critical requirement. This issue is enclosed in the first re-search goal, RG1: Course staff and researchers can effortlessly access col-lected learning data. This goal describes two stakeholder groups, course staffand researchers, which have different access requirements. We examine thisaccess goal from their different points of view.
The course staff has expressed requirement of interactive analytics thatare part of their daily workflow. This thesis designs a real time and interactivevisualization tool, Llama Client, to fulfill this purpose. It is available onboth LMSs in this research case and thus course staff has effortless access tolearning data. The more specific objectives for that tool are evaluated laterin LA objectives.
Developers and researches of LA require access to raw learning data. Thisthesis considers use of an external analytics tool and includes a service APIin the solution that supports this purpose. This API can provide both down-load of data files and programmatic data access. Table 6.1 presents the im-provements this solution provides. It adds a novel aggregate data resource forA-plus and Moodle. The programmatic access is mainly a potential improve-
61
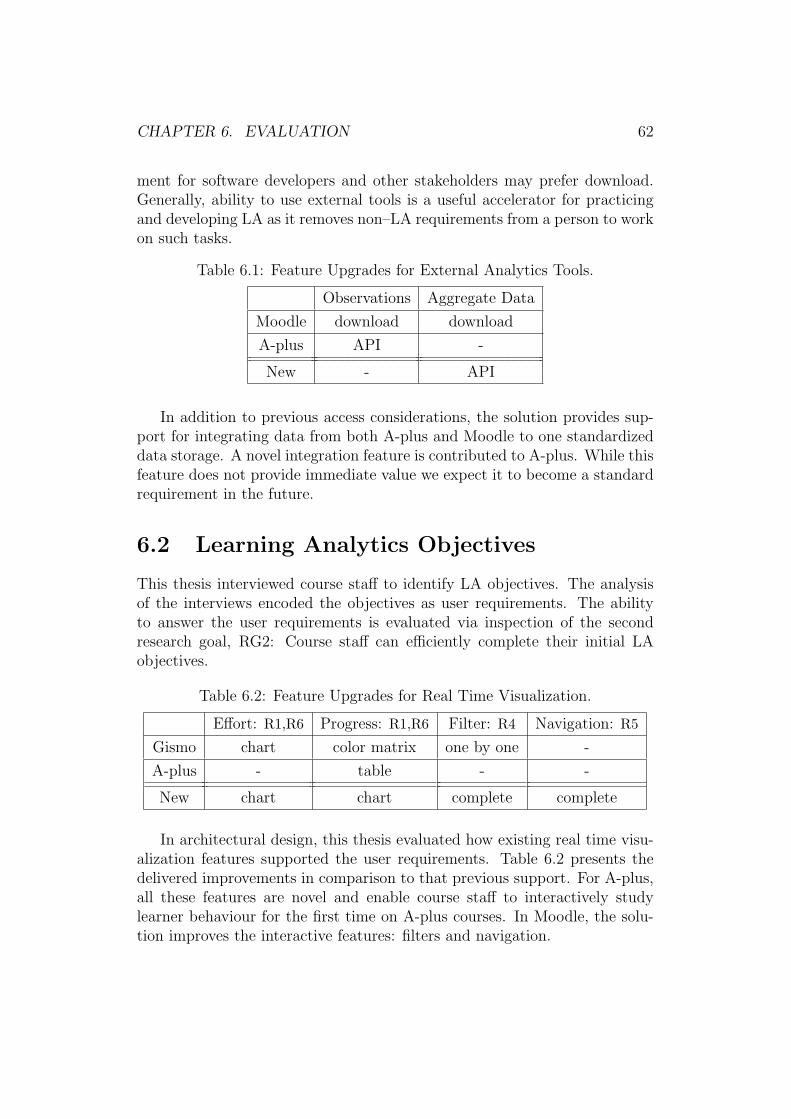
CHAPTER 6. EVALUATION 62
ment for software developers and other stakeholders may prefer download.Generally, ability to use external tools is a useful accelerator for practicingand developing LA as it removes non–LA requirements from a person to workon such tasks.
Table 6.1: Feature Upgrades for External Analytics Tools.
Observations Aggregate Data
Moodle download download
A-plus API -
New - API
In addition to previous access considerations, the solution provides sup-port for integrating data from both A-plus and Moodle to one standardizeddata storage. A novel integration feature is contributed to A-plus. While thisfeature does not provide immediate value we expect it to become a standardrequirement in the future.
6.2 Learning Analytics Objectives
This thesis interviewed course staff to identify LA objectives. The analysisof the interviews encoded the objectives as user requirements. The abilityto answer the user requirements is evaluated via inspection of the secondresearch goal, RG2: Course staff can efficiently complete their initial LAobjectives.
Table 6.2: Feature Upgrades for Real Time Visualization.
Effort: R1,R6 Progress: R1,R6 Filter: R4 Navigation: R5
Gismo chart color matrix one by one -
A-plus - table - -
New chart chart complete complete
In architectural design, this thesis evaluated how existing real time visu-alization features supported the user requirements. Table 6.2 presents thedelivered improvements in comparison to that previous support. For A-plus,all these features are novel and enable course staff to interactively studylearner behaviour for the first time on A-plus courses. In Moodle, the solu-tion improves the interactive features: filters and navigation.
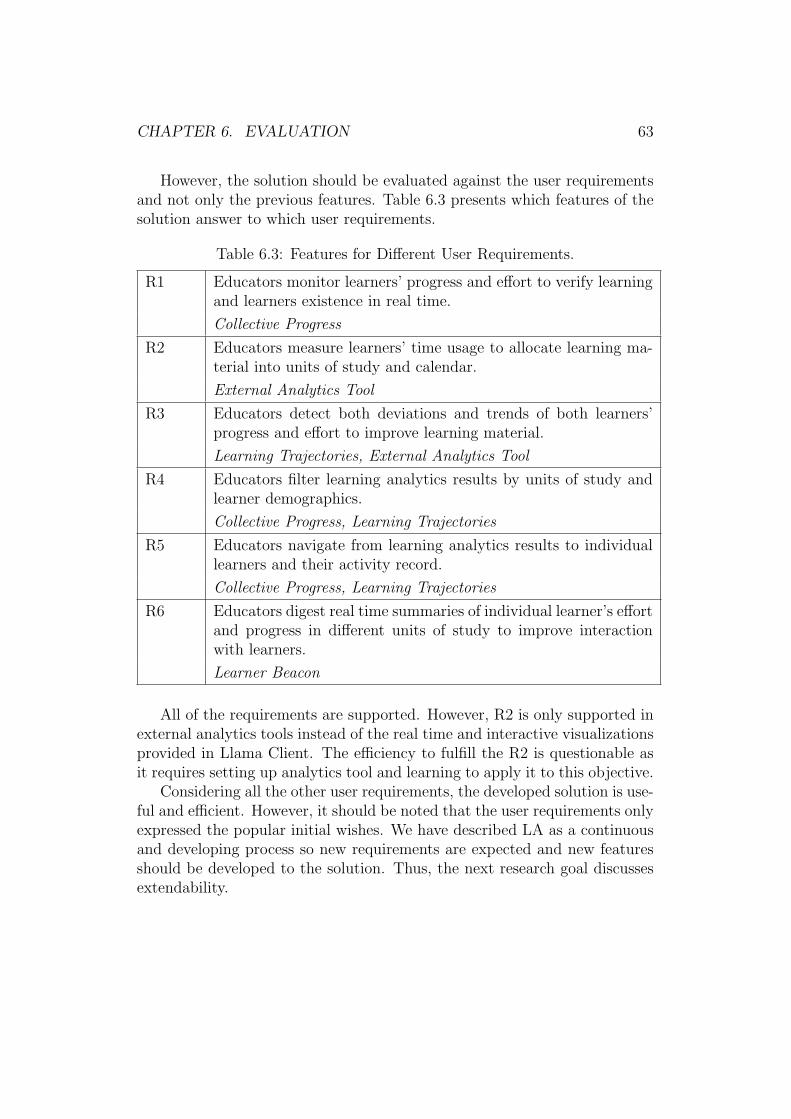
CHAPTER 6. EVALUATION 63
However, the solution should be evaluated against the user requirementsand not only the previous features. Table 6.3 presents which features of thesolution answer to which user requirements.
Table 6.3: Features for Different User Requirements.
R1 Educators monitor learners’ progress and effort to verify learningand learners existence in real time.
Collective Progress
R2 Educators measure learners’ time usage to allocate learning ma-terial into units of study and calendar.
External Analytics Tool
R3 Educators detect both deviations and trends of both learners’progress and effort to improve learning material.
Learning Trajectories, External Analytics Tool
R4 Educators filter learning analytics results by units of study andlearner demographics.
Collective Progress, Learning Trajectories
R5 Educators navigate from learning analytics results to individuallearners and their activity record.
Collective Progress, Learning Trajectories
R6 Educators digest real time summaries of individual learner’s effortand progress in different units of study to improve interactionwith learners.
Learner Beacon
All of the requirements are supported. However, R2 is only supported inexternal analytics tools instead of the real time and interactive visualizationsprovided in Llama Client. The efficiency to fulfill the R2 is questionable asit requires setting up analytics tool and learning to apply it to this objective.
Considering all the other user requirements, the developed solution is use-ful and efficient. However, it should be noted that the user requirements onlyexpressed the popular initial wishes. We have described LA as a continuousand developing process so new requirements are expected and new featuresshould be developed to the solution. Thus, the next research goal discussesextendability.
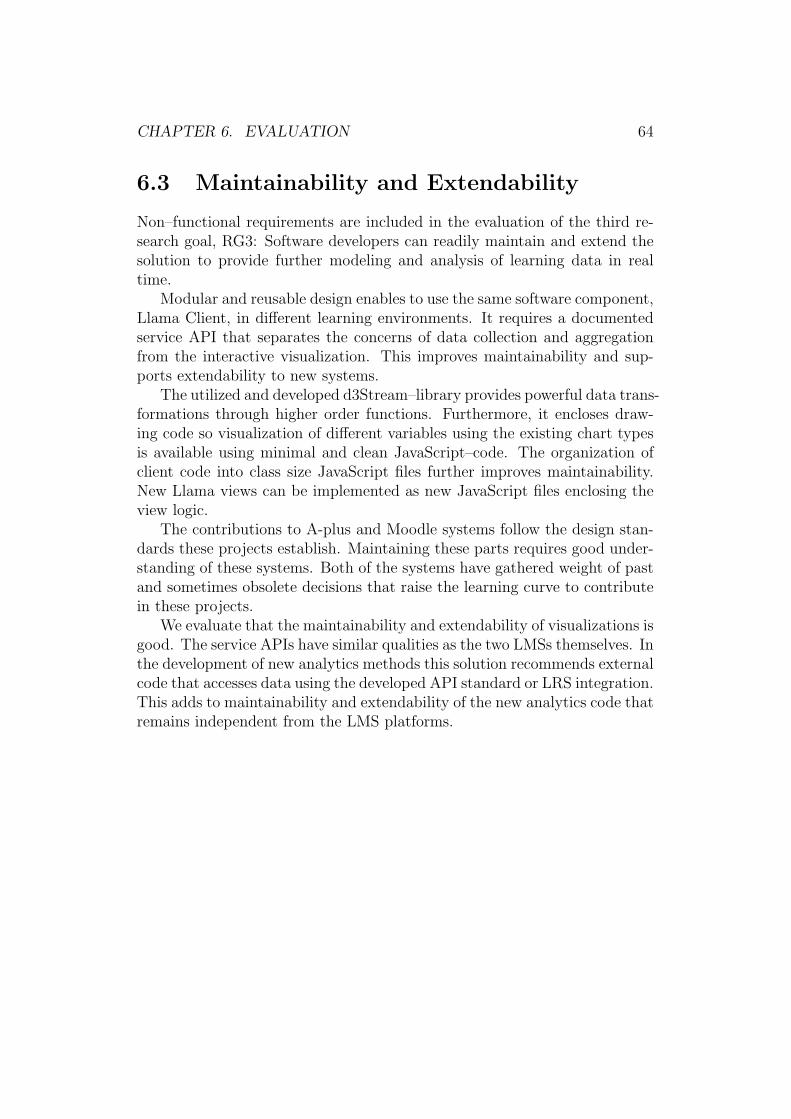
CHAPTER 6. EVALUATION 64
6.3 Maintainability and Extendability
Non–functional requirements are included in the evaluation of the third re-search goal, RG3: Software developers can readily maintain and extend thesolution to provide further modeling and analysis of learning data in realtime.
Modular and reusable design enables to use the same software component,Llama Client, in different learning environments. It requires a documentedservice API that separates the concerns of data collection and aggregationfrom the interactive visualization. This improves maintainability and sup-ports extendability to new systems.
The utilized and developed d3Stream–library provides powerful data trans-formations through higher order functions. Furthermore, it encloses draw-ing code so visualization of different variables using the existing chart typesis available using minimal and clean JavaScript–code. The organization ofclient code into class size JavaScript files further improves maintainability.New Llama views can be implemented as new JavaScript files enclosing theview logic.
The contributions to A-plus and Moodle systems follow the design stan-dards these projects establish. Maintaining these parts requires good under-standing of these systems. Both of the systems have gathered weight of pastand sometimes obsolete decisions that raise the learning curve to contributein these projects.
We evaluate that the maintainability and extendability of visualizations isgood. The service APIs have similar qualities as the two LMSs themselves. Inthe development of new analytics methods this solution recommends externalcode that accesses data using the developed API standard or LRS integration.This adds to maintainability and extendability of the new analytics code thatremains independent from the LMS platforms.
Chapter 7
Conclusions
This chapter concludes the thesis work. First, knowledge acquired in thisresearch case and contribution to the domain knowledge are considered. Fi-nally, future work is discussed.
7.1 Acquired Knowledge
In design–science research, knowledge on the research problem and the solu-tion is extracted in the creation of an artifact, which is the software solutionin this thesis. First, interesting findings in this research case are presented.Then, we discuss the transferability to other cases.
In this case, learning data as stored in the two different LMSs raiseddifferent and unique technical requirements. In comparison, the interviewsof different teachers found similar objectives that were then derived into userrequirements. We believe the following two findings in this thesis are relevantfor domain knowledge.
• The integration of learning data from multitude of sources is a commonchallenge that needs design.
• Teachers’ initial LA objectives include aims to monitor expected progress,improve allocation of learning material, identify problematic areas inlearning material, and improve interaction with learners.
Retrospectively, these were the guiding principles to the partly noveland partly improved solution in this research case. We bootstrapped LAin four courses that implement different weekly online learning activities.The courses had large number of students and they embraced automatic
65
CHAPTER 7. CONCLUSIONS 66
assessment. Transferability of this knowledge to other cases should be care-fully evaluated. However, when starting the practice of LA or developing LAfeatures it is, at minimum, useful to consider these findings.
7.2 Future Work
The goal of this thesis was to bootstrap LA with expectation of future work.We consider LA as a cyclic process that should develop itself on each iteration.Therefore, the LA task is far from finished. However, the future work shouldbe designed with the accumulated experience in each iteration. Ali et al.[2012] used qualitative evaluation to design and confirm improvements on anLA tool.
First, the solution should be evaluated in practice. When the pilot coursesstart they should use the provided solution and the course staff should reporttheir experience for the next iteration of the LA process. Such iterativeprocess can answer to the expected usability improvement ideas as well ascompletely new LA objectives.
Some useful work could not be completed in the scope of this thesis. Theuser requirement to measure learners’ time usage was not met in the realtime visualizations. In addition, an option to use self reported time as ameasure of effort instead of the number of attempts would be useful. Theseare likely improvement requirements in the future.
Additionally, the interviews included some lonely quotes that were notincluded in the user requirements. They involved calendar heat maps, com-parison to previous course instances, solution paths of multiple choice ques-tionnaires, animated learning paths, summary of discussion topics, estimates,sampling of student groups, uploading grade data, and integration of exter-nal study records. These provide possible ideas for future LA developmentand research.
Alternatively, the presented novel visualization elements, such as theLearner Beacon, can be researched further. Different evaluations with teach-ers and interactions in LMS can be designed. This allows systematic devel-opment of a chosen element. Finally, the LA interviews can be extended tonew stakeholders, new methods, and larger populations to improve under-standing of LA requirements at different stages of investing into the practiceof LA.
References
Aalto Online Learning. A!ole pilots. https://onlinelearning.aalto.fi/pilots/,2017. Accessed: 2017-09-27.
Liaqat Ali, Marek Hatala, Dragan Gasevic, and Jelena Jovanovic. A qual-itative evaluation of evolution of a learning analytics tool. Computers &Education, 58(1):470–489, 2012.
Apereo. Learning analytics initiative. https://www.apereo.org/communities/learning-analytics-initiative, 2017. Accessed: 2017-08-28.
Tapio Auvinen. Educational technologies for supporting self-regulated learn-ing in online learning environments. PhD thesis, Aalto University, Schoolof Science, 2015.
Ryan SJd Baker and Kalina Yacef. Editorial welcome. JEDM-Journal ofEducational Data Mining, 1(1):1–3, 2009.
Aneesha Bakharia, Linda Corrin, Paula de Barba, Gregor Kennedy, DraganGasevic, Raoul Mulder, David Williams, Shane Dawson, and Lori Lockyer.A conceptual framework linking learning design with learning analytics. InProceedings of the Sixth International Conference on Learning Analytics &Knowledge, pages 329–338. ACM, 2016.
Sanam Shirazi Beheshitha, Marek Hatala, Dragan Gasevic, and Srecko Jok-simovic. The role of achievement goal orientations when studying effect oflearning analytics visualizations. In Proceedings of the Sixth InternationalConference on Learning Analytics & Knowledge, pages 54–63. ACM, 2016.
Harvey Russell Bernard. Social research methods: Qualitative and quantita-tive approaches. Sage, 2012.
Blackboard Inc. Case study: Lewis & clark community college – analytics forstudent retention. http://bbbb.blackboard.com/LCCCCaseStudy, 2017.Accessed: 2017-08-27.
67
REFERENCES 68
Mohamed Amine Chatti, Anna Lea Dyckhoff, Ulrik Schroeder, and HendrikThus. A reference model for learning analytics. International Journal ofTechnology Enhanced Learning, 4(5-6):318–331, 2012.
Mohamed Amine Chatti, Arham Muslim, and Ulrik Schroeder. Toward anopen learning analytics ecosystem. In Big Data and Learning Analytics inHigher Education, pages 195–219. Springer, 2017.
Doug Clow. The learning analytics cycle: closing the loop effectively. InProceedings of the 2nd international conference on learning analytics andknowledge, pages 134–138. ACM, 2012.
Hendrik Drachsler and Wolfgang Greller. Privacy and analytics: it’s a deli-cate issue a checklist for trusted learning analytics. In Proceedings of thesixth international conference on learning analytics & knowledge, pages89–98. ACM, 2016.
Nicola Dragoni, Saverio Giallorenzo, Alberto Lluch Lafuente, Manuel Maz-zara, Fabrizio Montesi, Ruslan Mustafin, and Larisa Safina. Microservices:yesterday, today, and tomorrow. In Present and Ulterior Software Engi-neering, pages 195–216. Springer, 2017.
Rebecca Ferguson. Learning analytics: drivers, developments and challenges.International Journal of Technology Enhanced Learning, 4(5-6):304–317,2012.
Dragan Gasevic, Negin Mirriahi, Phillip D Long, and Shane Dawson.Editorial–inaugural issue of the journal of learning analytics. Journal ofLearning Analytics, 1(1):1–2, 2014.
Dragan Gasevic, Shane Dawson, and George Siemens. Let’s not forget:Learning analytics are about learning. TechTrends, 59(1):64–71, 2015.
Shirley Gregor and Alan R Hevner. Positioning and presenting design scienceresearch for maximum impact. MIS quarterly, 37(2), 2013.
Wolfgang Greller and Hendrik Drachsler. Translating learning into num-bers: A generic framework for learning analytics. Educational technology& society, 15(3):42–57, 2012.
Alan R Hevner, Salvatore T March, Jinsoo Park, and Sudha Ram. Designscience in information systems research. MIS quarterly, 28(1):75–105, 2004.
REFERENCES 69
Kennedy Kambona, Elisa Gonzalez Boix, and Wolfgang De Meuter. Anevaluation of reactive programming and promises for structuring collabo-rative web applications. In Proceedings of the 7th Workshop on DynamicLanguages and Applications, page 3. ACM, 2013.
Ville Karavirta, Petri Ihantola, and Teemu Koskinen. Service-oriented ap-proach to improve interoperability of e-learning systems. In AdvancedLearning Technologies (ICALT), 2013 IEEE 13th International Confer-ence on, pages 341–345. IEEE, 2013.
Tomi Kauppinen and Lauri Malmi. Aalto online learning-a pathway to re-forming education at the aalto university. In Proceedings of EUNIS 2017– Shaping the future of universities. Munster, June, 2017.
Tomi Kauppinen, Johannes Trame, and A Westermann. Teaching core vo-cabulary specification. LinkedScience. org, Tech. Rep, 2012.
Jonathan M Kevan and Paul R Ryan. Experience api: Flexible, decentralizedand activity-centric data collection. Technology, Knowledge and Learning,21(1):143–149, 2016.
Kirsty Kitto, Sebastian Cross, Zak Waters, and Mandy Lupton. Learninganalytics beyond the lms: the connected learning analytics toolkit. InProceedings of the Fifth International Conference on Learning AnalyticsAnd Knowledge, pages 11–15. ACM, 2015.
Ari Korhonen and Jari Multisilta. Learning analytics. In New Ways to Teachand Learn in China and Finland: Crossing Boundaries with Technology,pages 301–310. Peter Lang – Frankfurt am Main · Bren · Bruxelles · NewYork · Oxford · Warszawa · Wien, 2016.
Teemu Koskinen. Improving interoperability of e-learning systems by usinga service-oriented approach. Master’s thesis, Aalto University, School ofScience, 2012.
Sonja Krogius. A+-palvelu. kohti prosessiorientoitunutta ja opiskeli-jakeskeista ohjelmoinnin opetusta. Master’s thesis, Aalto University,School of Arts, 2012.
Yvonna S Lincoln and Egon G Guba. Naturalistic inquiry, volume 75. Sage,1985.
LISTedTECH. Lms overview of market share. http://listedtech.com/historical-lms-overview/, 2015. Accessed: 2017-08-27.
REFERENCES 70
Jock Mackinlay. Automating the design of graphical presentations of rela-tional information. Acm Transactions On Graphics (Tog), 5(2):110–141,1986.
Martin Maguire. Methods to support human-centred design. Internationaljournal of human-computer studies, 55(4):587–634, 2001.
Tommi Mikkonen and Antero Taivalsaari. Web applications: Spaghetti codefor the 21st century. In Proc. 6th ACIS International Conference on Soft-ware Engineering Research, Management, and Applications (SERA’08),pages 319–328. IEEE Computer Society Press, 2008.
Yishay Mor, Rebecca Ferguson, and Barbara Wasson. Editorial: Learningdesign, teacher inquiry into student learning and learning analytics: Acall for action. British Journal of Educational Technology, 46(2):221–229,2015.
Tamara Munzner. Visualization analysis and design. CRC press, 2014.
Meghan Oster, Steven Lonn, Matthew D Pistilli, and Michael G Brown.The learning analytics readiness instrument. In Proceedings of the SixthInternational Conference on Learning Analytics & Knowledge, pages 173–182. ACM, 2016.
Zacharoula K Papamitsiou and Anastasios A Economides. Learning analyticsand educational data mining in practice: A systematic literature review ofempirical evidence. Educational Technology & Society, 17(4):49–64, 2014.
Zachary A Pardos and Kevin Kao. moocrp: An open-source analytics plat-form. In Proceedings of the Second (2015) ACM conference on learning@scale, pages 103–110. ACM, 2015.
Markku Riekkinen. Integrating stratum and a+ functionalities in moodle:Architecture and evaluation. Master’s thesis, Aalto University, School ofScience, Finland, 2017.
Cristobal Romero and Sebastian Ventura. Data mining in education. WileyInterdisciplinary Reviews: Data Mining and Knowledge Discovery, 3(1):12–27, 2013.
Cristobal Romero, Sebastian Ventura, and Enrique Garcıa. Data mining incourse management systems: Moodle case study and tutorial. Computers& Education, 51(1):368–384, 2008.
REFERENCES 71
Niall Sclater. Developing a code of practice for learning analytics. Journalof Learning Analytics, 3(1):16–42, 2016.
George Siemens. Learning analytics: The emergence of a discipline. AmericanBehavioral Scientist, 57(10):1380–1400, 2013.
George Siemens and Ryan SJd Baker. Learning analytics and educationaldata mining: towards communication and collaboration. In Proceedingsof the 2nd international conference on learning analytics and knowledge,pages 252–254. ACM, 2012.
Ian Sommerville. Software Engineering: Ninth Edition. Pearson EducationLimited, 2011.
Melanie Swan. The quantified self: Fundamental disruption in big datascience and biological discovery. Big Data, 1(2):85–99, 2013.
Edward Tufte and P Graves-Morris. The visual display of quantitative in-formation.; 1983, 2014.
Kalyan Veeramachaneni, Franck Dernoncourt, Colin Taylor, Zachary Pardos,and Una-May O’Reilly. Moocdb: Developing data standards for mooc datascience. In AIED 2013 Workshops Proceedings Volume, page 17, 2013.
Colin Ware. Information visualization: perception for design. Elsevier, 2012.
Franceska Xhakaj, Vincent Aleven, and Bruce M McLaren. How teachersuse data to help students learn: Contextual inquiry for the design of adashboard. In European Conference on Technology Enhanced Learning,pages 340–354. Springer, 2016.
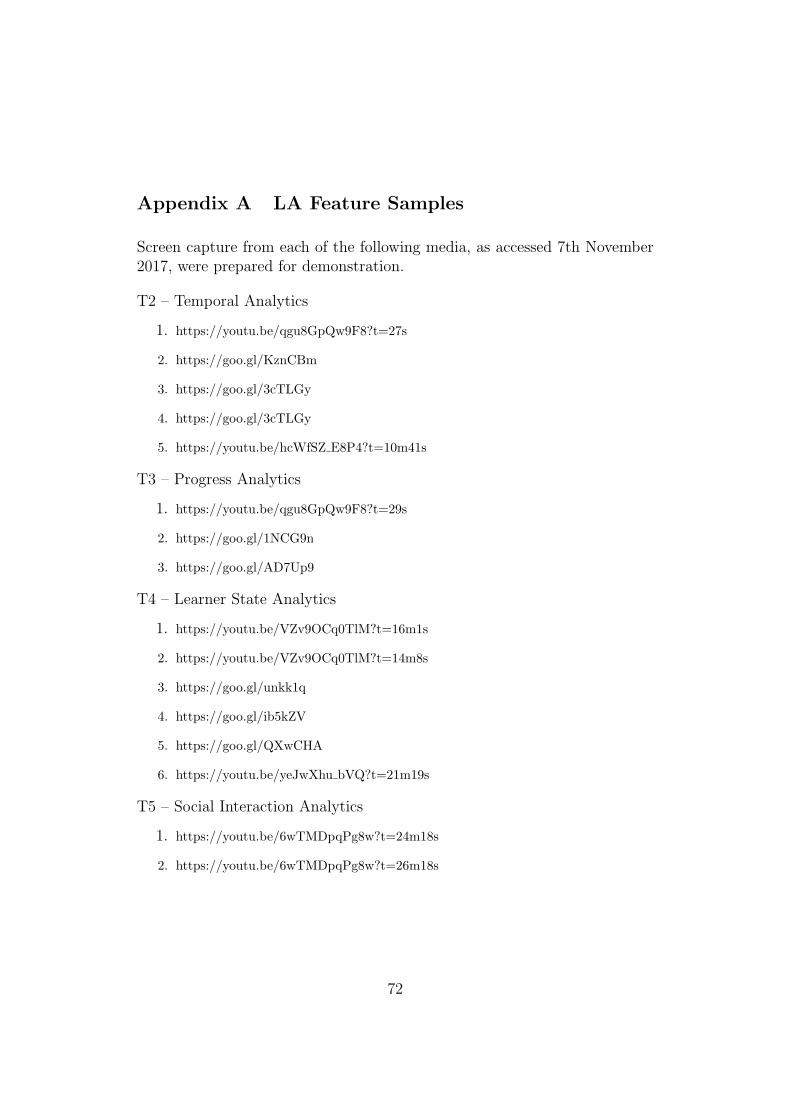
Appendix A LA Feature Samples
Screen capture from each of the following media, as accessed 7th November2017, were prepared for demonstration.
T2 – Temporal Analytics
1. https://youtu.be/qgu8GpQw9F8?t=27s
2. https://goo.gl/KznCBm
3. https://goo.gl/3cTLGy
4. https://goo.gl/3cTLGy
5. https://youtu.be/hcWfSZ E8P4?t=10m41s
T3 – Progress Analytics
1. https://youtu.be/qgu8GpQw9F8?t=29s
2. https://goo.gl/1NCG9n
3. https://goo.gl/AD7Up9
T4 – Learner State Analytics
1. https://youtu.be/VZv9OCq0TlM?t=16m1s
2. https://youtu.be/VZv9OCq0TlM?t=14m8s
3. https://goo.gl/unkk1q
4. https://goo.gl/ib5kZV
5. https://goo.gl/QXwCHA
6. https://youtu.be/yeJwXhu bVQ?t=21m19s
T5 – Social Interaction Analytics
1. https://youtu.be/6wTMDpqPg8w?t=24m18s
2. https://youtu.be/6wTMDpqPg8w?t=26m18s
72
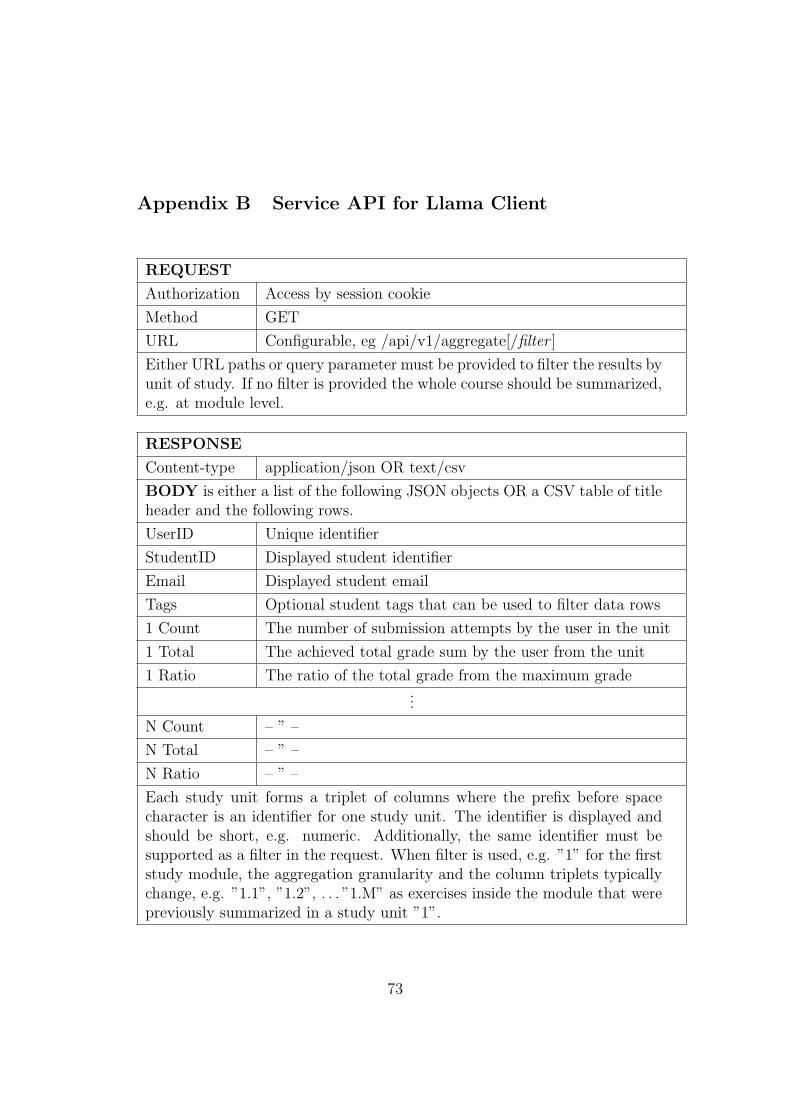
Appendix B Service API for Llama Client
REQUEST
Authorization Access by session cookie
Method GET
URL Configurable, eg /api/v1/aggregate[/filter ]
Either URL paths or query parameter must be provided to filter the results byunit of study. If no filter is provided the whole course should be summarized,e.g. at module level.
RESPONSE
Content-type application/json OR text/csv
BODY is either a list of the following JSON objects OR a CSV table of titleheader and the following rows.
UserID Unique identifier
StudentID Displayed student identifier
Email Displayed student email
Tags Optional student tags that can be used to filter data rows
1 Count The number of submission attempts by the user in the unit
1 Total The achieved total grade sum by the user from the unit
1 Ratio The ratio of the total grade from the maximum grade...
N Count – ” –
N Total – ” –
N Ratio – ” –
Each study unit forms a triplet of columns where the prefix before spacecharacter is an identifier for one study unit. The identifier is displayed andshould be short, e.g. numeric. Additionally, the same identifier must besupported as a filter in the request. When filter is used, e.g. ”1” for the firststudy module, the aggregation granularity and the column triplets typicallychange, e.g. ”1.1”, ”1.2”, . . . ”1.M” as exercises inside the module that werepreviously summarized in a study unit ”1”.
73
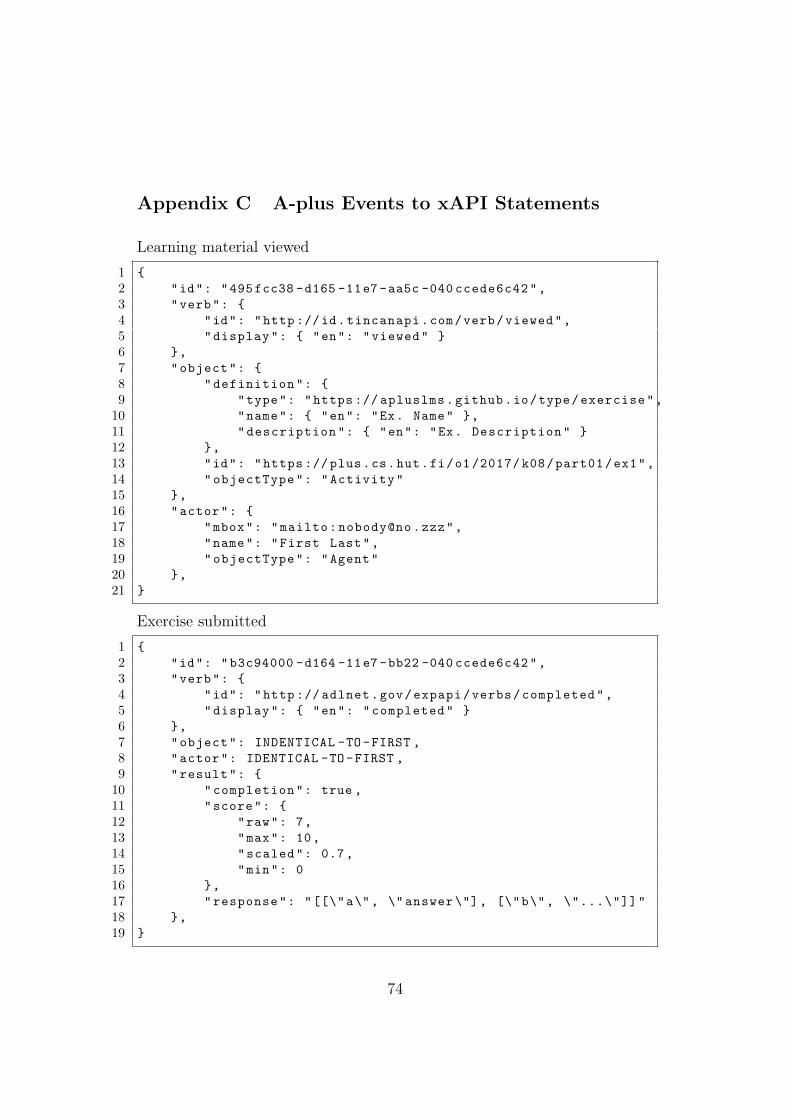
Appendix C A-plus Events to xAPI Statements
Learning material viewed
1 {
2 "id": "495fcc38 -d165 -11e7-aa5c -040 ccede6c42",
3 "verb": {
4 "id": "http ://id.tincanapi.com/verb/viewed",
5 "display": { "en": "viewed" }
6 },
7 "object": {
8 "definition": {
9 "type": "https :// apluslms.github.io/type/exercise",
10 "name": { "en": "Ex. Name" },
11 "description": { "en": "Ex. Description" }
12 },
13 "id": "https :// plus.cs.hut.fi/o1 /2017/ k08/part01/ex1",
14 "objectType": "Activity"
15 },
16 "actor": {
17 "mbox": "mailto:[email protected]",
18 "name": "First Last",
19 "objectType": "Agent"
20 },
21 }
Exercise submitted
1 {
2 "id": "b3c94000 -d164 -11e7-bb22 -040 ccede6c42",
3 "verb": {
4 "id": "http :// adlnet.gov/expapi/verbs/completed",
5 "display": { "en": "completed" }
6 },
7 "object": INDENTICAL -TO-FIRST ,
8 "actor": IDENTICAL -TO-FIRST ,
9 "result": {
10 "completion": true ,
11 "score": {
12 "raw": 7,
13 "max": 10,
14 "scaled": 0.7,
15 "min": 0
16 },
17 "response": "[[\"a\", \" answer \"], [\"b\", \"...\"]]"
18 },
19 }
74
Related Documents