Boosting Information Spread: An Algorithmic Approach Yishi Lin (The Chinese University of Hong Kong) Wei Chen (Microsoft Research) John C.S. Lui (The Chinese University of Hong Kong)

Welcome message from author
This document is posted to help you gain knowledge. Please leave a comment to let me know what you think about it! Share it to your friends and learn new things together.
Transcript

Boosting Information Spread:An Algorithmic Approach
Yishi Lin (The Chinese University of Hong Kong)Wei Chen (Microsoft Research)John C.S. Lui (The Chinese University of Hong Kong)

Background: Viral Marketing➢Assumption: the word-of-mouth effect
2
Whom to give free samples to maximize the purchase of the product ?
Influence MaximizationSelect 𝑘 seed nodes so to maximize the expected spread of influence.

Motivation
Some marketing strategies boost customers so that they are ◦ More likely to be influenced by friends, or
◦ More likely to influence their friends
Examples◦ Customer incentive programs
◦ Social media advertising
◦ Referral marketing
3

Motivation: Complement the Classical IM
Boosting a user vs. Turning a user into an initial adopter
4
(e.g., coupon) (e.g., free products)
Our study: How to select users to “boost”?
IM studies: How to identify influential initial adopters?
Companies have more flexibility in determining where to allocate their marketing budgets
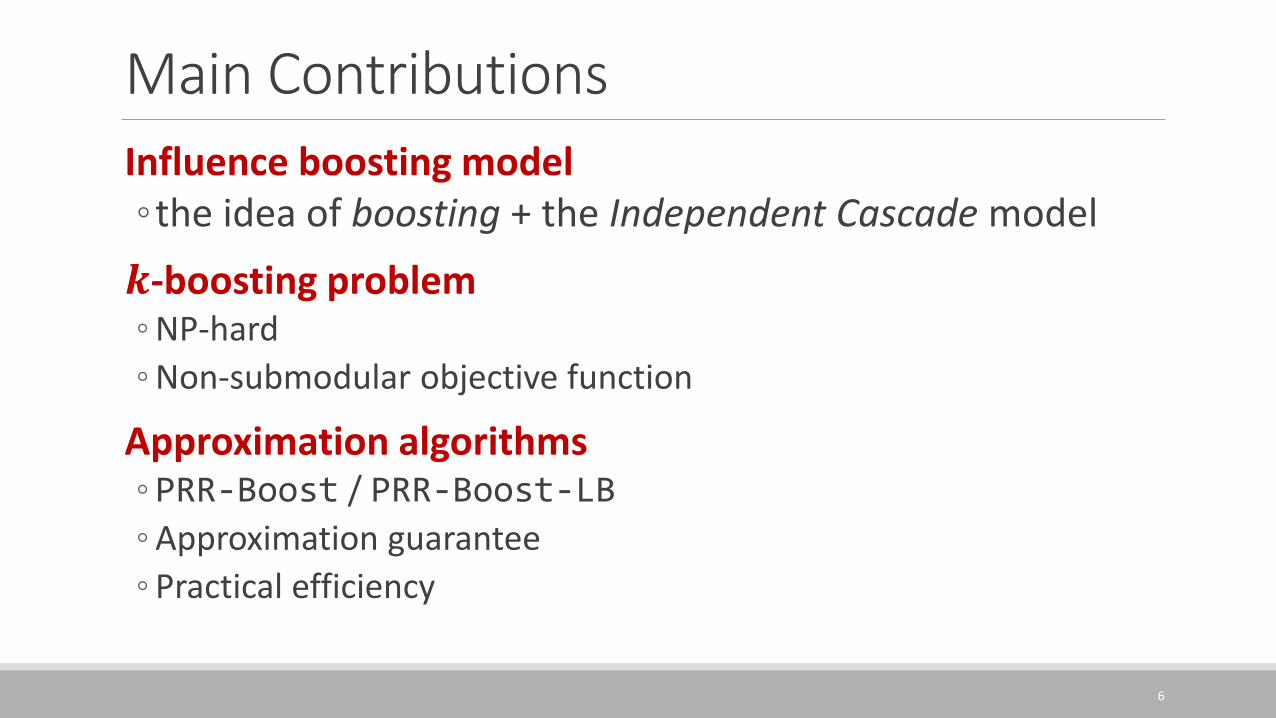
Main Contributions
Influence boosting model◦the idea of boosting + the Independent Cascade model
𝒌-boosting problem◦ NP-hard
◦ Non-submodular objective function
Approximation algorithms◦PRR-Boost / PRR-Boost-LB
◦ Approximation guarantee
◦ Practical efficiency
6
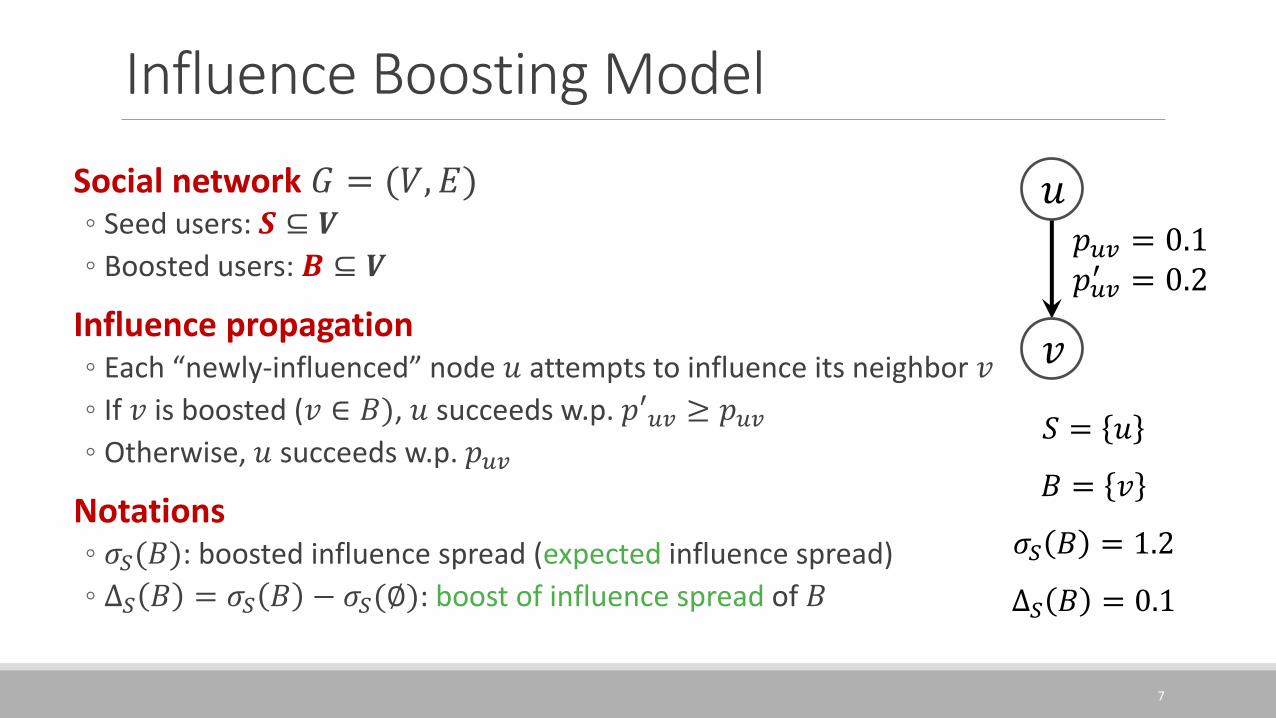
Influence Boosting Model
Social network 𝐺 = (𝑉, 𝐸)◦ Seed users: 𝑺 ⊆ 𝑽
◦ Boosted users: 𝑩 ⊆ 𝑽
Influence propagation◦ Each “newly-influenced” node 𝑢 attempts to influence its neighbor 𝑣
◦ If 𝑣 is boosted (𝑣 ∈ 𝐵), 𝑢 succeeds w.p. 𝑝′𝑢𝑣 ≥ 𝑝𝑢𝑣
◦ Otherwise, 𝑢 succeeds w.p. 𝑝𝑢𝑣
Notations◦ 𝜎𝑆(𝐵): boosted influence spread (expected influence spread)
◦ Δ𝑆 𝐵 = 𝜎𝑆 𝐵 − 𝜎𝑆(∅): boost of influence spread of 𝐵
7
𝑝𝑢𝑣 = 0.1𝑝𝑢𝑣
′ = 0.2
𝑆 = 𝑢
𝐵 = 𝑣
𝜎𝑆 𝐵 = 1.2
Δ𝑆 𝐵 = 0.1
𝑢
𝑣

𝑘-Boosting Problem
Problem ◦ Given graph 𝐺, budget 𝑘, seeds 𝑆
◦ Select a set 𝐵 of 𝑘 nodes so that the boost of influence spread of is maximized.
8
The 𝑘-boosting problem is NP hard. Computing Δ𝑆(𝐵) is #P hard.
The boost of influence Δ𝑆(𝐵) is neither submodular nor supermodular!
𝑝𝑢𝑣 = 0.1𝑝𝑢𝑣
′ = 0.2
𝑆 = 𝑢 , 𝑘 = 1
𝐵 =?
𝑢
𝑣

Our Solution: PRR-Boost/PRR-Boost-LB
Potentially Reverse Reachable Graphs (PRR-graphs)◦ Estimate the boost of influence spread and its lower bound (for SA)
Sandwich Approximation (SA) strategy [1]
◦ Provides approximation guarantee
◦ Deals with the non-submodularity of objective function
State-of-the-art IM techniques [2][3]
◦ Sample PRR-graphs
9
[1] W. Lu, W. Chen, and L. V. S. Lakshmanan, “From competition to complementarity: Comparative influence diffusion and maximization,” VLDB Endow., vol. 9, no. 2, 2015.[2] Y. Tang, X. Xiao, and Y. Shi, “Influence maximization in near-linear time: A martingale approach,” in SIGMOD, 2015. [3] H. T. Nguyen, T. N. Dinh, and M. T. Thai, “Stop-and-stare: Optimal sampling algorithms for viral marketing in billion-scale networks,” in SIGMOD, 2016.
PRR-Boost: Estimating the boost of influence
QuestionHow to estimate the boost of influence (the objective function)?
10

Potentially Reverse Reachable Graph (PRR-Graph)◦ Random target node 𝑟
◦ Random “edge status”
◦ Seed nodes
◦ Non-blocked paths from seeds to 𝑟
11
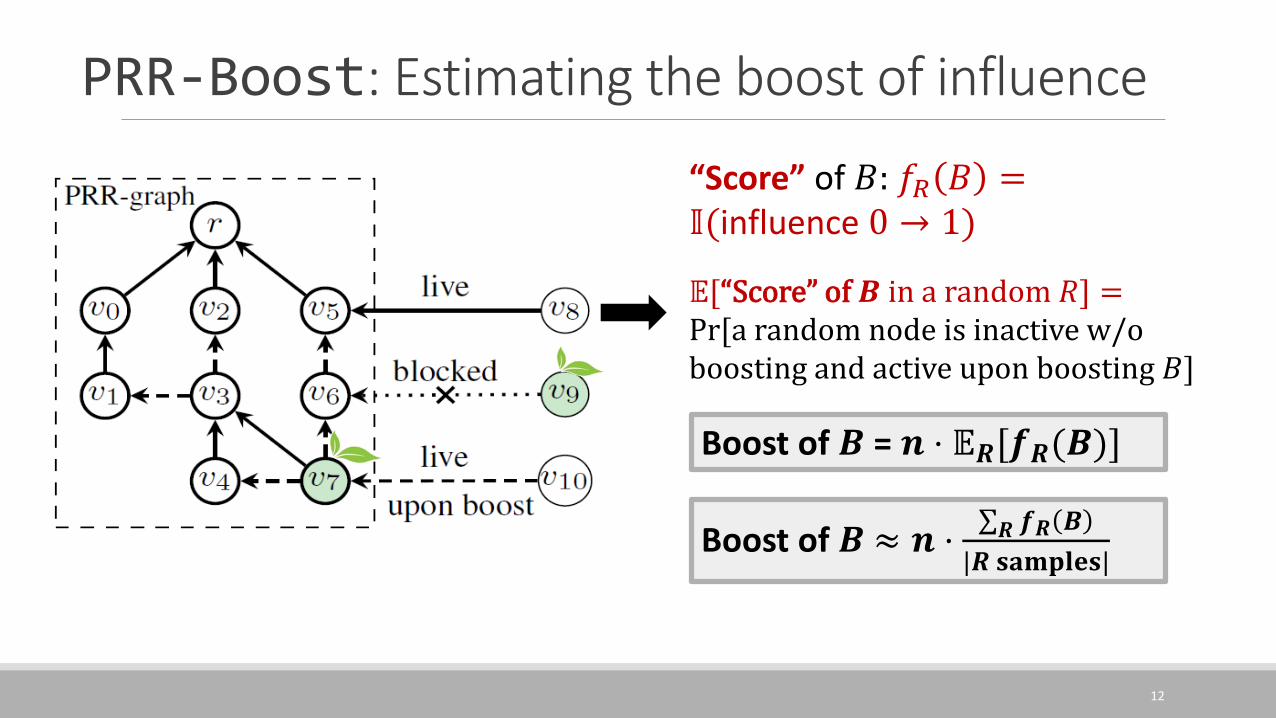
PRR-Boost: Estimating the boost of influence
A sampled influence propagation process
12
Boost of 𝑩 = 𝒏 ⋅ 𝔼𝑹[𝒇𝑹(𝑩)]
𝔼[“Score” of 𝑩 in a random 𝑅] =Pr[a random node is inactive w/o boosting and active upon boosting 𝐵]
“Score” of 𝐵: 𝑓𝑅 𝐵 =𝕀(influence 0 → 1)
PRR-Boost: Estimating the boost of influence
Boost of 𝑩 ≈ 𝒏 ⋅σ𝑹 𝒇𝑹 𝑩
|𝑹 𝐬𝐚𝐦𝐩𝐥𝐞𝐬|

PRR-Boost (𝑮, 𝑺, 𝒌, 𝝐, ℓ)
1. ℓ′ ← ℓ ⋅ 1 + 𝑙𝑜𝑔 3 / 𝑙𝑜𝑔 𝑛2. ℛ ← SamplingLB 𝐺, 𝑆, 𝑘, 𝜖, ℓ′ // sampling PRR-graphs
3. 𝐵𝜇 ← NodeSelectionLB ℛ, 𝑘 // maximize the lower bound of boost
4. 𝐵𝛥 ← NodeSelection ℛ, 𝑘 // maximize the boost of influence5. 𝐵𝑠𝑎 ← argmax𝐵∈ 𝐵𝛥,𝐵𝜇
Estimation of 𝛥𝑆 𝐵 //
6. Return 𝐵𝑠𝑎
PRR-Boost-LB returns 𝑩𝝁
PRR-Boost/PRR-Boost-LB: Algorithm Design
13
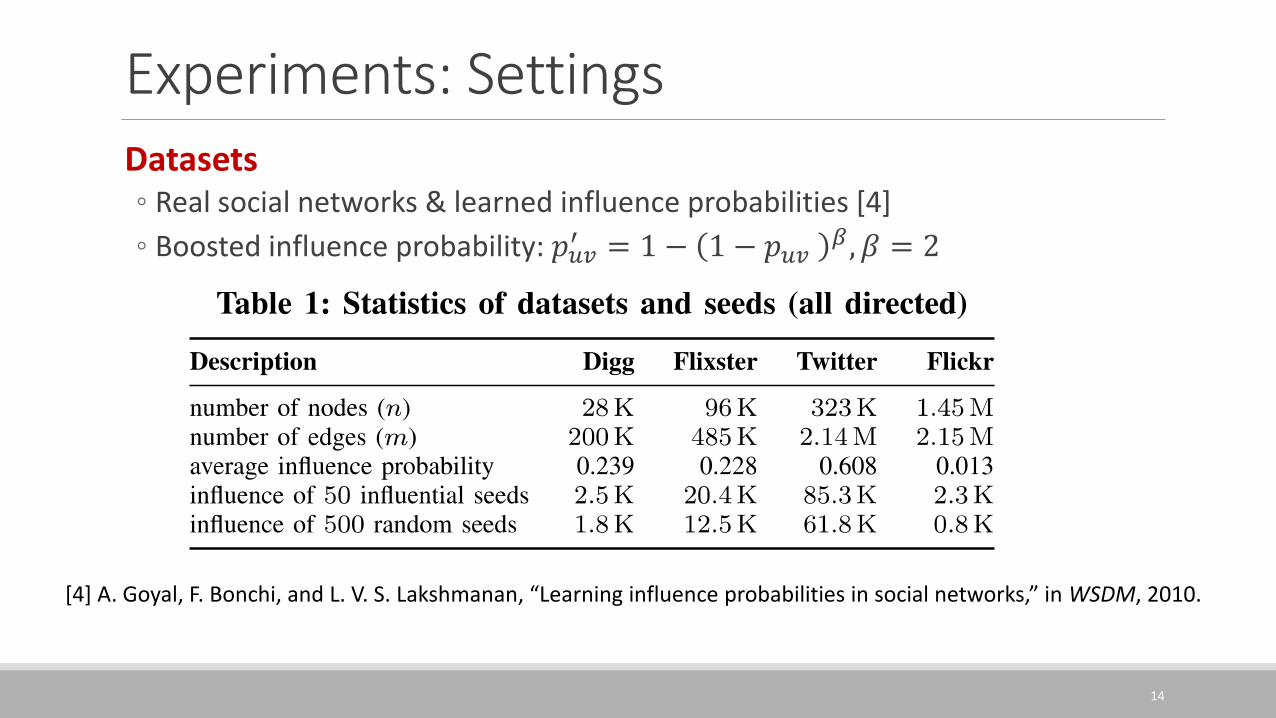
Experiments: SettingsDatasets◦ Real social networks & learned influence probabilities [4]
◦ Boosted influence probability: 𝑝𝑢𝑣′ = 1 − 1 − 𝑝𝑢𝑣
𝛽, 𝛽 = 2
14
[4] A. Goyal, F. Bonchi, and L. V. S. Lakshmanan, “Learning influence probabilities in social networks,” in WSDM, 2010.

Experiments: Settings• Datasets• Real social networks & learned influence probabilities [4]
• Boosted influence: 𝑝𝑢𝑣′ = 1 − 1 − 𝑝𝑢𝑣
𝛽, 𝛽 = 2
• Settings• Parallelization with OpenMP and executed using 8 threads
• A Linux machine with an Intel Xeon [email protected] CPU and 30GB memory
15
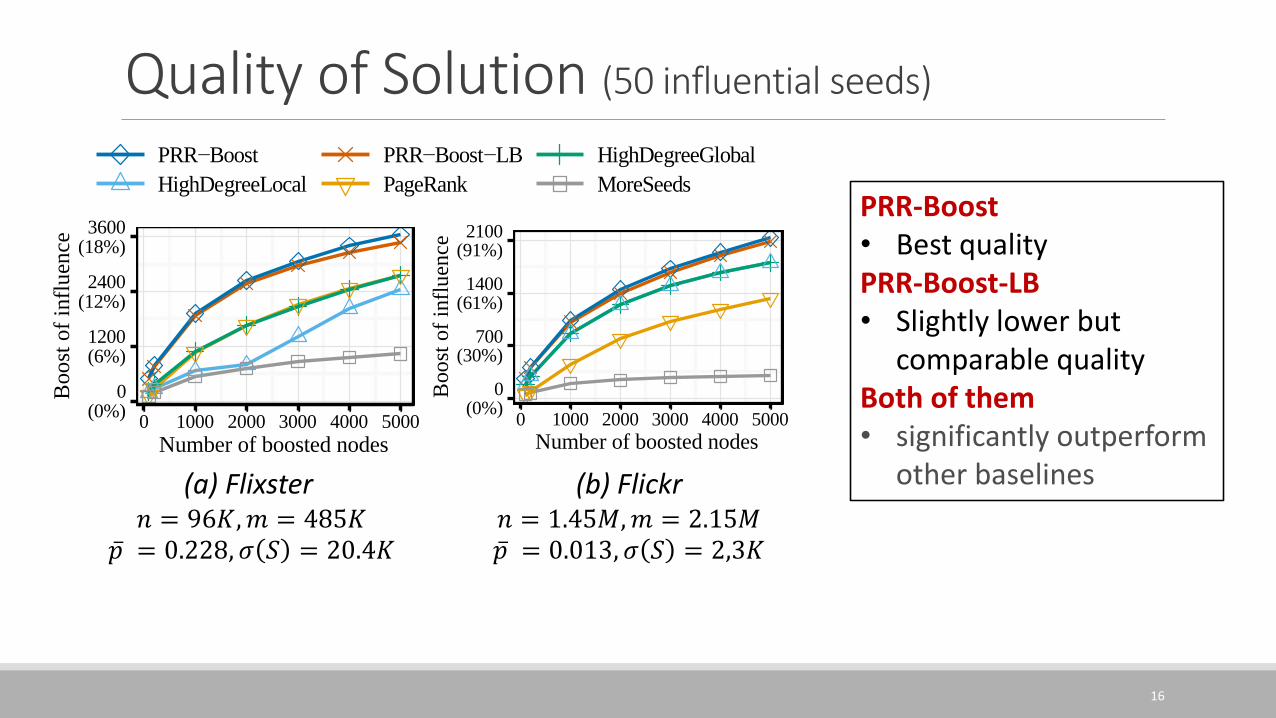
Quality of Solution (50 influential seeds)
16
0(0%)
700(30%)
1400(61%)
2100(91%)
0 1000 2000 3000 4000 5000
Number of boosted nodesB
oo
st o
f in
flu
ence
0(0%)
1200(6%)
2400(12%)
3600(18%)
0 1000 2000 3000 4000 5000
Number of boosted nodes
Boo
st o
f in
flu
ence
PRR−Boost PRR−Boost−LB HighDegreeGlobal
HighDegreeLocal PageRank MoreSeeds
(a) Flixster𝑛 = 96𝐾, 𝑚 = 485𝐾
ҧ𝑝 = 0.228, 𝜎 𝑆 = 20.4𝐾
(b) Flickr𝑛 = 1.45𝑀, 𝑚 = 2.15𝑀ҧ𝑝 = 0.013, 𝜎 𝑆 = 2,3𝐾
PRR-Boost• Best qualityPRR-Boost-LB• Slightly lower but
comparable qualityBoth of them• significantly outperform
other baselines

Running Time (50 influential seeds)we do not compare the running time of our algorithms withheuristic methods to avoid cluttering the results.
k=100 k=1000 k=5000
0.1
1
10
100
1000
Digg Flixster Twitter Flickr
Ru
nn
ing
tim
e (s
)
(a) PRR-Boost
2.2
x
2.1
x 2.0
x
3.6
x
3.7
x 3.2
x
1.9
x
1.9
x 1.9
x
1.7
x
1.8
x 1.8
x
0.1
1
10
100
1000
Digg Flixster Twitter Flickr
Ru
nn
ing
tim
e (s
)
(b) PRR-Boost-LB
Fig. 5: Running time (influential seeds).
Effectiveness of the compression phase. Table 2 shows the“compression ratio” of PRR-graphs and memory usages ofPRR-Boost and PRR-Boost-LB, demonstrating the impor-tance of compressing PRR-graphs. The compression ratio isthe ratio between the average number of uncompressed edgesand average number of edges after compression in boostablePRR-graphs. Besides the total memory usage, we also showin parenthesis the memory usage for storing boostable PRR-graphs, which is measured as the additional memory usagestarting from the generation of the first PRR-graph. For ex-ample, for the Digg dataset and k = 100, for boostable PRR-graphs, the average number of uncompressed edges is 1810.32,the average number of compressed edges is 2.41, and thecompression ratio is 751.59. Moreover, the total memory usageof PRR-Boost is 0.07GB with around 0.01GB being used tostoring “boostable” PRR-graphs. The compression ratio is highfor two reasons. First, in practice, many nodes visited in thefirst phasecannot bereached by seed nodes. Second, among theremaining nodes, many of them can be merged into the super-seed node, and most non-super-seed nodes will be removed be-cause they are not on any paths to the root node without goingthrough the super-seed node. The high compression ratio andthe memory used for storing compressed PRR-graphs showthat the compression phase is an indispensable constituent ofthe generation of random PRR-graphs. For PRR-Boost-LB,the memory usage is much lower compared with PRR-Boost,because we only store “critical nodes” of boostable PRR-graphs. In our experiments with β = 2, on average, eachboostable PRR-graph only has a few critical nodes, whichexplains the low memory usage of PRR-Boost-LB. If one isindifferent about the slightly difference between the qualityof solutions returned by PRR-Boost-LB and PRR-Boost, wesuggest to use PRR-Boost-LB because of its lower runningtime and lower memory usage.
Approximation factors in the Sandwich Approxima-tion. Recall that the approximate ratio of PRR-Boost and
PRR-Boost-LB depends on the ratioµ (B ⇤)
∆ S (B ⇤). The closer to
one the ratio is, the better the approximation guarantee is. WithB ⇤ being unknown due to the NP-hardness of the problem,we show the ratio when the boost is relatively large. To obtaindifferent boost sets with relatively large boosts, we generate300 sets of k boosted nodes. The sets are constructed byreplacing a random number of nodes in Bsa by other non-seed nodes, where Bsa is the solution returned by PRR-Boost.For a given B , we use PRR-graphs generated for finding Bsa
Table 2: Memory usage and compression ratio (influentialseeds). Numbers in parentheses are additional memoryusage for boostable PRR-graphs.
k DatasetPRR-Boost PRR-Boost-LB
Compression Ratio Memory (GB) Memory (GB)
100
Digg 1810.32 / 2.41 = 751.79 0.07 (0.01) 0.06 (0.00)Flixster 3254.91 / 3.67 = 886.90 0.23 (0.05) 0.19 (0.01)Twitter 14343.31 / 4.62 = 3104.61 0.74 (0.07) 0.69 (0.02)Flickr 189.61 / 6.86 = 27.66 0.54 (0.07) 0.48 (0.01)
5000
Digg 1821.21 / 2.41 = 755.06 0.09 (0.03) 0.07 (0.01)Flixster 3255.42 / 3.67 = 886.07 0.32 (0.14) 0.21 (0.03)Twitter 14420.47 / 4.61 = 3125.37 0.89 (0.22) 0.73 (0.06)Flickr 189.08 / 6.84 = 27.64 0.65 (0.18) 0.50 (0.03)
Digg Flixster Twitter Flickr
●●●●●●●●●●●●●●●●●●●●●●●●●●●●●●●●●●●●●●●●●●●●●●●●●●●●●●●●●●●●●●●●●●●●●●●●●●●●●●●●●●●●●●●●●●●●●●●●●●●●●●●●●●●●●●●●●●●●●●●●●●●●●●●●●●●●●●●●●●●●●●●●●●●●●●●
●●●●●●●●●●●●●●●●●●●●●●●●●●●●●●●●●●●●●●●●●●●●●●●●●●●●●●●●●●●●●●●●●●●●●●●●●●●●●●●●●●●●●●●●●●●●●●●●●●●●●●●●●●●●●●●●●●●●●●●●●●●●●●●●●●●●●●●●●●●●●●●●●●
●●●●●●●●●●●●●●●●●●●●●●●●●●●●●●●●●●●●●●●●●●●●●●●●●●●●●●●●●●●●●●●●●●●●●●●●●●●●●●●●●●●●●●●●●●●●●●●●●●●●●●●●●●●●●●●●●●●●●●●●●●●●●●●●●●●●●●●●●●●●●●●●●●
●●●●●●●●●●●●●●●●●●●●●●●●●●●●●●●●●●●●●●●●●●●●●●●●●●●●●●●●●●●●●●●●●●●●●●●●●●●●●●●●●●●●●●●●●●●●●●●●●●●●●●●●●●●●●●●●●●●●●●●●●●●●●●●●●●●●●●●●●●●●●●●●●●●●●●●●●●●●
0.7
0.8
0.9
1.0
0.7
0.8
0.9
1.0
0.7
0.8
0.9
1.0
k=
10
0k=
10
00
k=
500
0
250500
7501000
10002000
30004000
20004000
6000500
10001500
2000
Boost of the influence spreadR
atio
Fig. 6: Sandwich Approximation:µ (B )
∆ S (B )(influential seeds).
to estimateµ (B )
∆ S (B ). Figure 6 shows the ratios for generated
sets B as a function of ∆ S (B ) for k 2 { 100, 1000, 5000} .Because we intend to show the ratio when the boost ofinfluence is large, we do not show points corresponding tosets whose boost of influence is less than 50% of ∆ S (Bsa ).For all four datasets, the ratio is above 0.94, 0.83 and 0.74for k = 100, 1000, 5000, respectively. For every dataset, weobserve that the ratio is closer to one when k is smaller, andwe now explain this. In practice, most boostable PRR-graphshave “critical nodes”. When k is small, say 100, to utilize thelimited budget k efficiently, PRR-Boost and PRR-Boost-LB
tend to return node sets B so that every node in B is a criticalnode in many boostable PRR-graphs. For example, for Twitter ,when k = 100, among PRR-graphs that havecritical nodes andare activated upon boosting Bsa , above 98% of them havetheir critical nodes boosted (i.e., in Bsa). Meanwhile, manyroot node r of PRR-graphs without critical nodes may stayinactive. For a given PRR-graph R, if B contains critical nodesof R or if the root node of R stays inactive upon boosting B ,f −
R (B ) does not underestimate f R (B ). Therefore, when k is
smaller, the ratio ofµ (B )
∆ S (B )=
E[f −R (B ) ]
E[f R (B ) ]tends to be closer to
one. When k increases, we can boost more nodes, and rootnodes of PRR-graphs without critical nodes may be activated,thus the approximation ratio tends to decrease. For example,for Twitter , when k increases from 100 to 5000, among PRR-graphs whose root nodes are activated upon boosting Bsa , thefraction of them having critical nodes decreases from around98% to 88%. Accordingly, the ratio of µ(Bsa)/ ∆ S (Bsa )decreased by around 9% when k increases from 100 to 5000.
Effects of the boosted influence probabilities. In our experi-ments, we use the boosting parameter β to control the boostedinfluence probabilities on edges. The larger β is, the larger the
17
Time increases with 𝒌• # of PRR-graphs ↑PRR-Boost• EfficientPRR-Boost-LB• Faster• Effective & Efficient
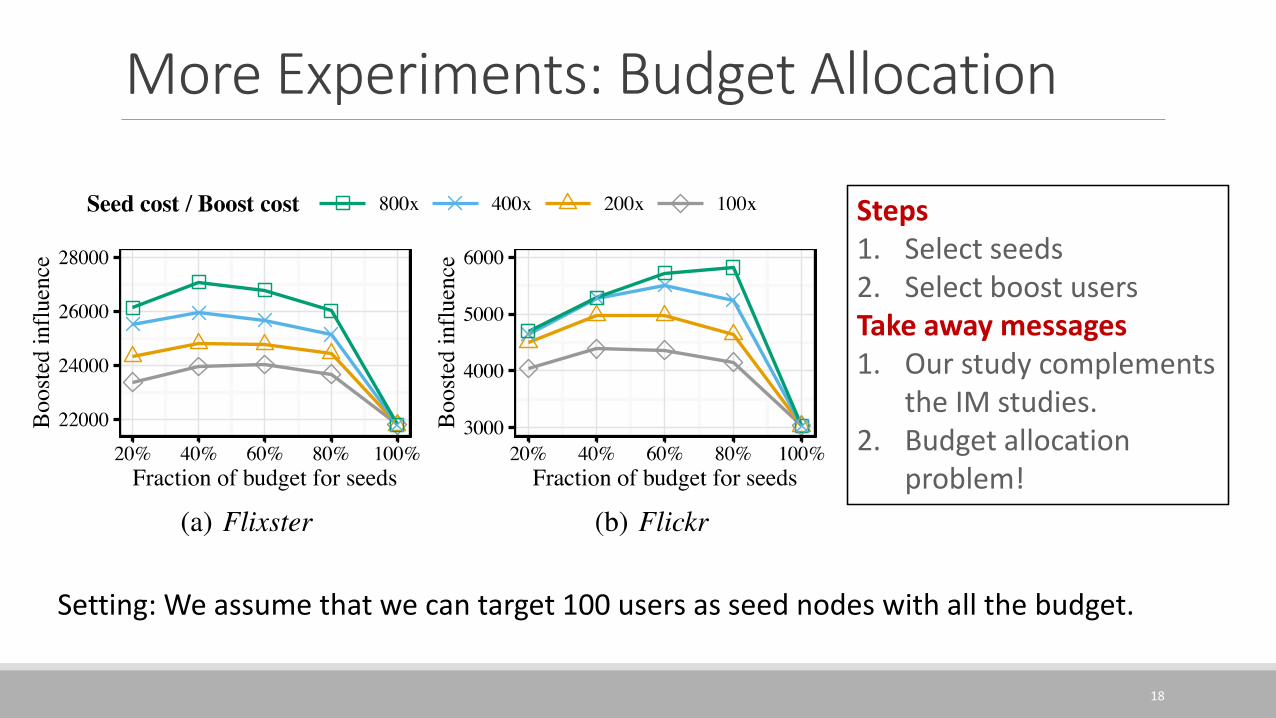
More Experiments: Budget Allocation
18
Steps1. Select seeds2. Select boost usersTake away messages1. Our study complements
the IM studies.2. Budget allocation
problem!
Setting: We assume that we can target 100 users as seed nodes with all the budget.

ConclusionThe 𝒌-boosting problem◦ Influence boosting model◦ NP-hard & non-submodular objective function
Approximation Algorithm◦ PRR-Boost/PRR-Boost-LB = PRR-graphs + other techniques
◦ Approximation ratio: 𝟏 − 𝟏/𝒆 − 𝝐 ⋅𝝁 𝑩𝑶𝑷𝑻
𝚫𝑺 𝑩𝑶𝑷𝑻
◦ Practical efficiency:
◦ PRR-Boost: 𝑂𝐸𝑃𝑇
𝑂𝑃𝑇𝜇⋅ 𝑘 ⋅ 𝑘 + ℓ ⋅ 𝑛 + 𝑚 log 𝑛 ⋅ 𝜖−2
◦ PRR-Boos-LB: 𝑂𝐸𝑃𝑇
𝑂𝑃𝑇𝜇⋅ 𝑘 + ℓ ⋅ 𝑛 + 𝑚 log 𝑛 ⋅ 𝜖−2
4/27/2017 INFLUENCE MAXIMIZATION PROBLEMS 19

20
Thank you!

Motivation
21
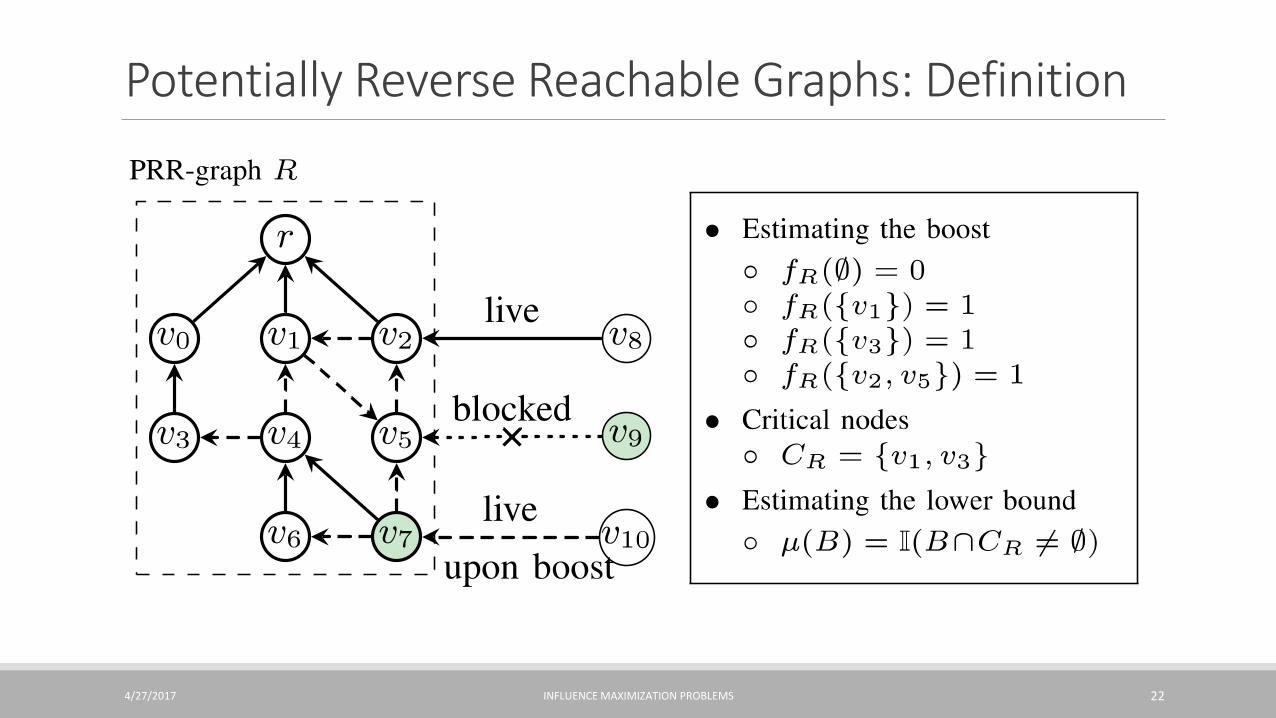
Potentially Reverse Reachable Graphs: Definition
4/27/2017 INFLUENCE MAXIMIZATION PROBLEMS 22

Potentially Reverse Reachable Graphs: Generation
4/27/2017 INFLUENCE MAXIMIZATION PROBLEMS 23

PRR-Boost: Sandwich Approximation
Goal: to tackle the non-submodularity of Δ𝑆 ⋅
Sandwich Approximation (SA) strategy
4/27/2017 INFLUENCE MAXIMIZATION PROBLEMS 24
Submodular UB: 𝜇 𝐵Δ𝑆 𝐵
Submodular LB: 𝜈 𝐵
◦ Theoretical guarantee:
Δ𝑆 𝐵𝑠𝑎 ≥ maxΔ𝑆 𝐵𝜈
𝜈 𝐵𝜈,
𝜇 𝐵𝑂𝑃𝑇
Δ𝑆 𝐵𝑂𝑃𝑇⋅ 1 −
1
𝑒− 𝜖 ⋅ 𝑂𝑃𝑇
Remarks◦ Proposed by Lu, Wei et al. in “From competition to complementarity: comparative influence
diffusion and maximization.” (VLDB’15)
𝐵𝜇
𝐵Δ
𝐵𝜈
greedy 𝐵𝑠𝑎 =argmax𝐵∈{𝐵Δ,𝐵𝜇,𝐵𝜈}Δ𝑆(𝐵)

PRR-Boost: Main ResultsPRR-Boost:
Practical performance guarantee
◦ Δ𝑆 𝐵𝑠𝑎 ≥ 1 −1
𝑒− 𝜖 ⋅
𝜇 𝐵𝑂𝑃𝑇
Δ𝑆 𝐵𝑂𝑃𝑇 ⋅ 𝑂𝑃𝑇, w.p. at least 1 − n−ℓ
◦ The approximate ratio is good if the lower bound is tight
◦ Experiments show that the lower bound is tight
Practical efficiency
◦ 𝑂𝐸𝑃𝑇
𝑂𝑃𝑇𝜇⋅ 𝑘 ⋅ 𝑘 + ℓ ⋅ 𝑛 + 𝑚 log 𝑛 ⋅ 𝜖−2
◦ 𝐸𝑃𝑇: the expected time to construct a PRR-graph
◦ 𝑂𝑃𝑇𝜇: the optimum solution for maximizing 𝜇
25
PRR-Boost-LB: same bound, much faster

Experiments: Compression Ratiowe do not compare the running time of our algorithms withheuristic methods to avoid cluttering the results.
k=100 k=1000 k=5000
0.1
1
10
100
1000
Digg Flixster Twitter Flickr
Ru
nn
ing
tim
e (s
)
(a) PRR-Boost
2.2
x
2.1
x 2.0
x
3.6
x
3.7
x 3.2
x
1.9
x
1.9
x 1.9
x
1.7
x
1.8
x 1.8
x
0.1
1
10
100
1000
Digg Flixster Twitter Flickr
Ru
nn
ing
tim
e (s
)
(b) PRR-Boost-LB
Fig. 5: Running time (influential seeds).
Effectiveness of the compression phase. Table 2 shows the“compression ratio” of PRR-graphs and memory usages ofPRR-Boost and PRR-Boost-LB, demonstrating the impor-tance of compressing PRR-graphs. The compression ratio isthe ratio between the average number of uncompressed edgesand average number of edges after compression in boostablePRR-graphs. Besides the total memory usage, we also showin parenthesis the memory usage for storing boostable PRR-graphs, which is measured as the additional memory usagestarting from the generation of the first PRR-graph. For ex-ample, for the Digg dataset and k = 100, for boostable PRR-graphs, the average number of uncompressed edges is 1810.32,the average number of compressed edges is 2.41, and thecompression ratio is 751.59. Moreover, the total memory usageof PRR-Boost is 0.07GB with around 0.01GB being used tostoring “boostable” PRR-graphs. The compression ratio is highfor two reasons. First, in practice, many nodes visited in thefirst phasecannot bereached by seed nodes. Second, among theremaining nodes, many of them can be merged into the super-seed node, and most non-super-seed nodes will be removed be-cause they are not on any paths to the root node without goingthrough the super-seed node. The high compression ratio andthe memory used for storing compressed PRR-graphs showthat the compression phase is an indispensable constituent ofthe generation of random PRR-graphs. For PRR-Boost-LB,the memory usage is much lower compared with PRR-Boost,because we only store “critical nodes” of boostable PRR-graphs. In our experiments with β = 2, on average, eachboostable PRR-graph only has a few critical nodes, whichexplains the low memory usage of PRR-Boost-LB. If one isindifferent about the slightly difference between the qualityof solutions returned by PRR-Boost-LB and PRR-Boost, wesuggest to use PRR-Boost-LB because of its lower runningtime and lower memory usage.
Approximation factors in the Sandwich Approxima-tion. Recall that the approximate ratio of PRR-Boost and
PRR-Boost-LB depends on the ratioµ (B ⇤)
∆ S (B ⇤). The closer to
one the ratio is, the better the approximation guarantee is. WithB ⇤ being unknown due to the NP-hardness of the problem,we show the ratio when the boost is relatively large. To obtaindifferent boost sets with relatively large boosts, we generate300 sets of k boosted nodes. The sets are constructed byreplacing a random number of nodes in Bsa by other non-seed nodes, where Bsa is the solution returned by PRR-Boost.For a given B , we use PRR-graphs generated for finding Bsa
Table 2: Memory usage and compression ratio (influentialseeds). Numbers in parentheses are additional memoryusage for boostable PRR-graphs.
k DatasetPRR-Boost PRR-Boost-LB
Compression Ratio Memory (GB) Memory (GB)
100
Digg 1810.32 / 2.41 = 751.79 0.07 (0.01) 0.06 (0.00)Flixster 3254.91 / 3.67 = 886.90 0.23 (0.05) 0.19 (0.01)Twitter 14343.31 / 4.62 = 3104.61 0.74 (0.07) 0.69 (0.02)Flickr 189.61 / 6.86 = 27.66 0.54 (0.07) 0.48 (0.01)
5000
Digg 1821.21 / 2.41 = 755.06 0.09 (0.03) 0.07 (0.01)Flixster 3255.42 / 3.67 = 886.07 0.32 (0.14) 0.21 (0.03)Twitter 14420.47 / 4.61 = 3125.37 0.89 (0.22) 0.73 (0.06)Flickr 189.08 / 6.84 = 27.64 0.65 (0.18) 0.50 (0.03)
Digg Flixster Twitter Flickr
●●●●●●●●●●●●●●●●●●●●●●●●●●●●●●●●●●●●●●●●●●●●●●●●●●●●●●●●●●●●●●●●●●●●●●●●●●●●●●●●●●●●●●●●●●●●●●●●●●●●●●●●●●●●●●●●●●●●●●●●●●●●●●●●●●●●●●●●●●●●●●●●●●●●●●●
●●●●●●●●●●●●●●●●●●●●●●●●●●●●●●●●●●●●●●●●●●●●●●●●●●●●●●●●●●●●●●●●●●●●●●●●●●●●●●●●●●●●●●●●●●●●●●●●●●●●●●●●●●●●●●●●●●●●●●●●●●●●●●●●●●●●●●●●●●●●●●●●●●
●●●●●●●●●●●●●●●●●●●●●●●●●●●●●●●●●●●●●●●●●●●●●●●●●●●●●●●●●●●●●●●●●●●●●●●●●●●●●●●●●●●●●●●●●●●●●●●●●●●●●●●●●●●●●●●●●●●●●●●●●●●●●●●●●●●●●●●●●●●●●●●●●● ●●●●●●●●●●●●●●●●●●●
●●●●●●●●●●●●●●●●●●●●●●●●●●●●●●●●●●●●●●●●●●●●●●●●●●●●●●●●●●●●●●●●●●●●●●●●●●●●●●●●●●●●●●●●●●●●●●●●●●●●●●●●●●●●●●●●●●●●●●●●●●●●●●●●●●●●●●●●●
0.7
0.8
0.9
1.0
0.7
0.8
0.9
1.0
0.7
0.8
0.9
1.0
k=
10
0k=
100
0k=
500
0
250500
7501000
10002000
30004000
20004000
6000500
10001500
2000
Boost of the influence spread
Rat
io
Fig. 6: Sandwich Approximation:µ (B )
∆ S (B )(influential seeds).
to estimateµ (B )
∆ S (B ). Figure 6 shows the ratios for generated
sets B as a function of ∆ S (B ) for k 2 { 100, 1000, 5000} .Because we intend to show the ratio when the boost ofinfluence is large, we do not show points corresponding tosets whose boost of influence is less than 50% of ∆ S (Bsa ).For all four datasets, the ratio is above 0.94, 0.83 and 0.74for k = 100, 1000, 5000, respectively. For every dataset, weobserve that the ratio is closer to one when k is smaller, andwe now explain this. In practice, most boostable PRR-graphshave “critical nodes”. When k is small, say 100, to utilize thelimited budget k efficiently, PRR-Boost and PRR-Boost-LB
tend to return node sets B so that every node in B is a criticalnode in many boostable PRR-graphs. For example, for Twitter ,when k = 100, among PRR-graphs that have critical nodes andare activated upon boosting Bsa , above 98% of them havetheir critical nodes boosted (i.e., in Bsa ). Meanwhile, manyroot node r of PRR-graphs without critical nodes may stayinactive. For a given PRR-graph R, if B contains critical nodesof R or if the root node of R stays inactive upon boosting B ,f −
R (B ) does not underestimate f R (B ). Therefore, when k is
smaller, the ratio ofµ (B )
∆ S (B )=
E[f −R
(B ) ]
E[f R (B ) ]tends to be closer to
one. When k increases, we can boost more nodes, and rootnodes of PRR-graphs without critical nodes may be activated,thus the approximation ratio tends to decrease. For example,for Twitter , when k increases from 100 to 5000, among PRR-graphs whose root nodes are activated upon boosting Bsa , thefraction of them having critical nodes decreases from around98% to 88%. Accordingly, the ratio of µ(Bsa)/ ∆ S (Bsa)decreased by around 9% when k increases from 100 to 5000.
Effects of the boosted influence probabilities. In our experi-ments, we use the boosting parameter β to control the boostedinfluence probabilities on edges. The larger β is, the larger the
26

Experiments: Effects of the Boosting Parameter
PRR−Boost (Twitter) PRR−Boost (Flixster) PRR−Boost (Flickr)
PRR−Boost−LB (Twitter) PRR−Boost−LB (Flixster) PRR−Boost−LB (Flickr)
2000
4000
6000
8000
2 3 4 5 6
Boosting parameter
Boo
st o
f in
fluen
ce
(a) Boost of influence
0
50
100
150
200
250
2 3 4 5 6
Boosting parameter
Run
nin
g t
ime
(s)
(b) Running time
Fig. 7: Effects of the boosting parameter (influential seeds,k = 1000).
Digg Flixster Twitter Flickr
●●●●●●●●●●●●●●●
●●●●●●●●●●●●●●●●●●●●●●●●●●●●●
●●●●●●●●●●●●●●●●●●●●●●●●●●
●●●●●●●●●●●●●●●●●●●●●●●●
●● ●●●●●●●●●●●●●●●●●●●●●●●●●●●●●●●●●●●●●●●●●●●●●●●●●●●●●●●●
●●●●●●●●●●●●●●●●●●●●●●●●●●●●●●●●●●●●●●●●●●●●●●●●●●●●●●●●●●●●●●●●●●●●●●●●●●
●●●●●●●●●●●●●●●●●●●●●●●●●●●●●
●●●●●●●●●●●●●●●●●●●●●●●●●●●●●●●●●●●●●●●●●●●●●●●●●●●●●●●●●●●
●●●●●●●●●●●●●●●●
●●●●●●●●●●●●●●●●●●
●●●●●●●●● ●●●●●●●●●●●●●
●●●●●●●●●
●●●●●●●●●●●●●●●●●●●●●●
●●●●●●●●●●●●●●●●●●●●●●
●●●●●●●●●●●●●●●●●●●●●●●●●●●●●●●●●●●●●●●●●●●●●●●●●●
●●●●●●●●●●●●●●●●●●●●●●●●●●●●●●●●●●●●●●●●●●●●●●●●●●●●●●●●●●●●●●●●●●●●●●●●●●●●●●●●●●●●●●●●●●●●●●●●●●●●●●●●●●●●●●●●●●●●●●●●●●●●●●●●●●●●●●●●●●●●●●●●●●●●●●●●●●●
0.7
0.8
0.9
1.0
0.7
0.8
0.9
1.0
0.7
0.8
0.9
1.0
b=
4b
=5
b=
6
400600
8001000
20002500
30003500
40004000
50006000
70001200
16002000
Boost of the influence spread
Rat
io
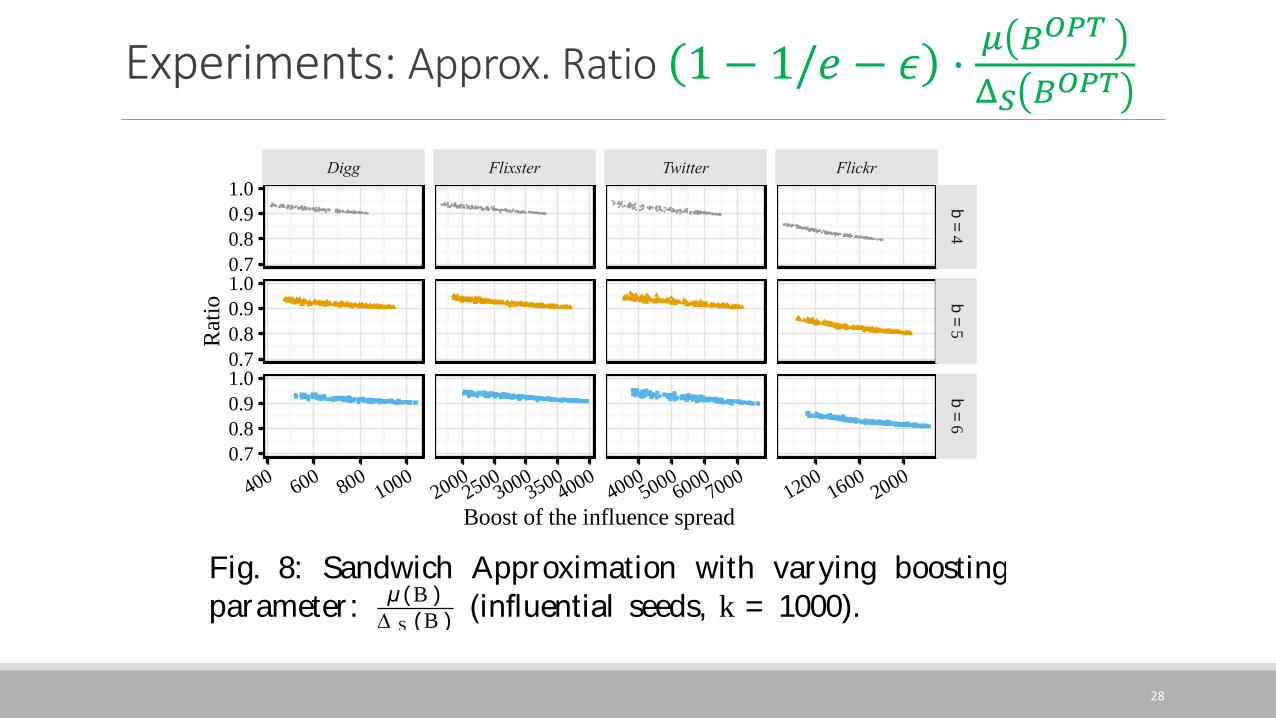
Fig. 8: Sandwich Approximation with varying boosting
parameter :µ (B )
∆ S (B )(influential seeds, k = 1000).
boosted influence probabilities on edges are. Figure 7 showsthe effects of β on the boost of influence and the running time,when k = 1000. For other values of k, the results are similar.In Figure 7a, the optimal boost increases when β increases.When β increases, for Flixster and Flickr, PRR-Boost-LBreturns solution with quality comparable to those returnedby PRR-Boost. For Twitter , we consider the slightly de-generated performance of PRR-Boost-LB acceptable becausePRR-Boost-LB runs significantly faster. Figure 7b showsthe running time for PRR-Boost and PRR-Boost-LB. Whenβ increases, the running time of PRR-Boost increases ac-cordingly, but the running time of PRR-Boost-LB remainsalmost unchanged. Therefore, compared with PRR-Boost,PRR-Boost-LB is more scalable to larger boosted influenceprobabilities on edges. In fact, when β increases, a randomPRR-graph tends to include more nodes and edges. The run-ning time of PRR-Boost increases mainly because the cost forPRR-graph generation increases. However, when β increases,we observe that the cost for obtaining “critical nodes” for arandom PRR-graph does not change much, thus the runningtime of PRR-Boost-LB remains almost unchanged. Figure 8shows the approximation ratio of the sandwich approximationstrategy with varying boosting parameters. Weobserve that, forevery dataset, when we increase the boosting parameter, the
ratio ofµ (B )
∆ S (B )for large∆ S (B ) remains almost the same. This
suggests that both our proposed algorithms remain effectivewhen we increase the boosted influence probabilities on edges.
B. Random seeds
In this part, we select five sets of 500 random nodes asseeds for each dataset. The setting here maps to the real
PRR−Boost PRR−Boost−LB HighDegreeGlobal
HighDegreeLocal PageRank MoreSeeds
0(0%)
220(12%)
440(24%)
660(36%)
0 1000 2000 3000 4000 5000
Number of boosted nodes
Bo
ost
of
infl
uen
ce
(a) Digg
0(0%)
2200(18%)
4400(35%)
6600(53%)
0 1000 2000 3000 4000 5000
Number of boosted nodes
Bo
ost
of
infl
uen
ce
(b) Flixster
0(0%)
3300(5%)
6600(11%)
9900(16%)
0 1000 2000 3000 4000 5000
Number of boosted nodes
Boo
st o
f in
fluen
ce
(c) Twitter
0(0%)
400(49%)
800(99%)
1200(148%)
0 1000 2000 3000 4000 5000
Number of boosted nodes
Boo
st o
f in
fluen
ce
(d) Flickr
Fig. 9: Boost of the influence versus k (random seeds).
k=100 k=1000 k=5000
0.1
1
10
100
1000
Digg Flixster Twitter Flickr
Ru
nn
ing t
ime
(s)
(a) PRR-Boost
1.9
x
2.0
x 1.9
x
3.1
x
3.0
x
3.1
x 1.7
x
1.7
x
1.7
x
2.1
x
2.1
x
2.0
x
0.1
1
10
100
1000
Digg Flixster Twitter Flickr
Ru
nn
ing t
ime
(s)
(b) PRR-Boost-LB
Fig. 10: Running time (random seeds).
situation where some users become seeds spontaneously. Allexperiments are conducted on five sets of random seeds, andwe report the average results.
Quality of solution. We select up to 5000 nodes and compareour algorithms with baselines. From Figure 9, we can drawconclusions similar to those drawn from Figure 4 where theseeds are highly influential users. Both PRR-Boost andPRR-Boost-LB outperform all baselines.
Running time. Figure 10 shows the running time ofPRR-Boost and PRR-Boost-LB, and the speedup ofPRR-Boost-LB compared with PRR-Boost. Figure 10b showsthat PRR-Boost-LB runs up to three times faster thanPRR-Boost. Together with Figure 9, PRR-Boost-LB is in factboth efficient and effective given randomly selected seeds.
Effectiveness of the compression phase. Table 3 showsthe compression ratio of PRR-Boost, and the memory usageof both proposed algorithms. Given randomly selected seednodes, the compression step of PRR-graphs is also veryeffective. Together with Table 2, we can conclude that thecompression phase is an indispensable step for both caseswhere the seeds are highly influence users or random users.
Approximation factors in the Sandwich Approximation. Theapproximate ratio of PRR-Boost and PRR-Boost-LB depends
on the ratioµ (B ⇤)
∆ S (B ⇤). We use the same method to generate
27
Experiments: Approx. Ratio 1 − 1/𝑒 − 𝜖 ⋅𝜇 𝐵𝑂𝑃𝑇
Δ𝑆 𝐵𝑂𝑃𝑇
PRR−Boost (Twitter) PRR−Boost (Flixster) PRR−Boost (Flickr)
PRR−Boost−LB (Twitter) PRR−Boost−LB (Flixster) PRR−Boost−LB (Flickr)
2000
4000
6000
8000
2 3 4 5 6
Boosting parameter
Bo
ost
of
infl
uen
ce
(a) Boost of influence
0
50
100
150
200
250
2 3 4 5 6
Boosting parameter
Ru
nn
ing
tim
e (s
)
(b) Running time
Fig. 7: Effects of the boosting parameter (influential seeds,k = 1000).
Digg Flixster Twitter Flickr
●●●●●●●●●●●●●●●●●●●●
●●●●●●●●●●●●●●●●●●●●●●●●
●●●●●●●●●●●●●●●●●●●●●●●●●●
●●●●●●●●●●●●●●●●●●●●●
●●●●● ●●●●●●●●●●●●●●●●●●●●●●●●●●●●●●●●●●●●●●●●●●●●●●●●●●●●●●●●
●●●●●●●●●●●●●●●●●●●●●●●●●●●●●●●●●●●●●●●●●●●●●●●●●●●●●●●●●●●●●●●●●●●●●●●●●●
●●●●●●●●●●●●●●●●●●●●●●●●●●
●●●●●●●●●●●●●●●●●●●●●●●●●●●●●●●●●●●●●●●●●●●●●●●●●●●●●●●●●●●●●●
●●●●●●●●●●●●●●●●
●●●●●●●●●●●●●●●●●●
●●●●●●●●● ●●●●●●●●●●●●●
●●●●●●●●●●●●●●●●●●●●●●●●●●
●●●●●●●●●●●●●
●●●●●●●●●●●●●●●●●●●●●●●●●●●●●●●●●●●●●●●●●●●●●●●●●●●●●●●●●●●●●●●●
●●●●●●●●●●●●●●●●●●●●●●●●●●●●●●●●●●●●●●●●●●●●●●●●●●●●●●●●●●●●●●●●●●●●●●●●●●●●●●●●●●●●●●●●●●●●●●●●●●●●●●●●●●●●●●●●●●●●●●●●●●●●●●●●●●●●●●●●●●●●●●●●●●●●●●●●●●●
0.7
0.8
0.9
1.0
0.7
0.8
0.9
1.0
0.7
0.8
0.9
1.0
b=
4b
=5
b=
6
400600
8001000
20002500
30003500
40004000
50006000
70001200
16002000
Boost of the influence spread
Rat
io
Fig. 8: Sandwich Approximation with varying boosting
parameter :µ (B )
∆ S (B )(influential seeds, k = 1000).
boosted influence probabilities on edges are. Figure 7 showsthe effects of β on the boost of influence and the running time,when k = 1000. For other values of k, the results are similar.In Figure 7a, the optimal boost increases when β increases.When β increases, for Flixster and Flickr, PRR-Boost-LBreturns solution with quality comparable to those returnedby PRR-Boost. For Twitter , we consider the slightly de-generated performance of PRR-Boost-LB acceptable becausePRR-Boost-LB runs significantly faster. Figure 7b showsthe running time for PRR-Boost and PRR-Boost-LB. Whenβ increases, the running time of PRR-Boost increases ac-cordingly, but the running time of PRR-Boost-LB remainsalmost unchanged. Therefore, compared with PRR-Boost,PRR-Boost-LB is more scalable to larger boosted influenceprobabilities on edges. In fact, when β increases, a randomPRR-graph tends to include more nodes and edges. The run-ning time of PRR-Boost increases mainly because the cost forPRR-graph generation increases. However, when β increases,we observe that the cost for obtaining “critical nodes” for arandom PRR-graph does not change much, thus the runningtime of PRR-Boost-LB remains almost unchanged. Figure 8shows the approximation ratio of the sandwich approximationstrategy with varying boosting parameters. Weobserve that, forevery dataset, when we increase the boosting parameter, the
ratio ofµ (B )
∆ S (B )for large∆ S (B ) remains almost the same. This
suggests that both our proposed algorithms remain effectivewhen we increase the boosted influence probabilities on edges.
B. Random seeds
In this part, we select five sets of 500 random nodes asseeds for each dataset. The setting here maps to the real
PRR−Boost PRR−Boost−LB HighDegreeGlobal
HighDegreeLocal PageRank MoreSeeds
0(0%)
220(12%)
440(24%)
660(36%)
0 1000 2000 3000 4000 5000
Number of boosted nodes
Bo
ost
of
infl
uen
ce
(a) Digg
0(0%)
2200(18%)
4400(35%)
6600(53%)
0 1000 2000 3000 4000 5000
Number of boosted nodes
Bo
ost
of
infl
uen
ce
(b) Flixster
0(0%)
3300(5%)
6600(11%)
9900(16%)
0 1000 2000 3000 4000 5000
Number of boosted nodes
Bo
ost
of
infl
uen
ce
(c) Twitter
0(0%)
400(49%)
800(99%)
1200(148%)
0 1000 2000 3000 4000 5000
Number of boosted nodes
Bo
ost
of
infl
uen
ce
(d) Flickr
Fig. 9: Boost of the influence versus k (random seeds).
k=100 k=1000 k=5000
0.1
1
10
100
1000
Digg Flixster Twitter Flickr
Runnin
g t
ime
(s)
(a) PRR-Boost
1.9
x
2.0
x 1.9
x
3.1
x
3.0
x
3.1
x 1.7
x
1.7
x
1.7
x
2.1
x
2.1
x
2.0
x
0.1
1
10
100
1000
Digg Flixster Twitter Flickr
Runnin
g t
ime
(s)
(b) PRR-Boost-LB
Fig. 10: Running time (random seeds).
situation where some users become seeds spontaneously. Allexperiments are conducted on five sets of random seeds, andwe report the average results.
Quality of solution. We select up to 5000 nodes and compareour algorithms with baselines. From Figure 9, we can drawconclusions similar to those drawn from Figure 4 where theseeds are highly influential users. Both PRR-Boost andPRR-Boost-LB outperform all baselines.
Running time. Figure 10 shows the running time ofPRR-Boost and PRR-Boost-LB, and the speedup ofPRR-Boost-LB compared with PRR-Boost. Figure 10b showsthat PRR-Boost-LB runs up to three times faster thanPRR-Boost. Together with Figure 9, PRR-Boost-LB is in factboth efficient and effective given randomly selected seeds.
Effectiveness of the compression phase. Table 3 showsthe compression ratio of PRR-Boost, and the memory usageof both proposed algorithms. Given randomly selected seednodes, the compression step of PRR-graphs is also veryeffective. Together with Table 2, we can conclude that thecompression phase is an indispensable step for both caseswhere the seeds are highly influence users or random users.
Approximation factors in the Sandwich Approximation. Theapproximate ratio of PRR-Boost and PRR-Boost-LB depends
on the ratioµ (B ⇤)
∆ S (B ⇤). We use the same method to generate
28
Related Documents