RESEARCH EGYPT BOOK 2012 BROKERAGE - ASSET MANAGEMENT - INVESTMENT BANKING - RESEARCH

Welcome message from author
This document is posted to help you gain knowledge. Please leave a comment to let me know what you think about it! Share it to your friends and learn new things together.
Transcript
RESEARCH
EGYPTBOOK
2012
B R O K E R A G E - A S S E T M A N A G E M E N T - I N V E S T M E N T B A N K I N G - R E S E A R C H
1. Executive Summary 3 Strategy & Market Review
9. Hydrocarbons & Related Services 1642. Economy 36 9.1. Maridive 171
3. Banking 63 10. Mills 173
3.1. Commercial International Bank 69 10.1. Alexandria Mills 1793.2. Credit Agricole 71 10.2. Central Egypt Mills 1813.3. Housing & Development Bank 73 10.3. East Delta Mills 1833.4. National Societe General Bank 75 10.4. North Cairo Mills 185
10.5. South Cairo & Giza Mills 1874. Building Materials 10.6. Upper Egypt Mills 189
4.1. Cement 77 10.7. Middle & West Delta Mills 1914.1.1. Misr Beni Suef Cement 844.1.2. Misr Cement (Qena) 86 11. Pharmaceuticals 1934.1.3. Sinai Cement 88 11.1. EIPICO 196
4.2. Steel 90 12. Telecom Services 198
4.2.1. Ezz Steel 97 12.1. Mobinil 2104.2.2. Ezz Aldekheila Steel – Alexandria 99 12.2. Orascom Telecom 212
12.3. Telecom Egypt 2145. Consumer Goods 101
5.1 Flooring & Tiles 13. Transport & Logistics 2165.1.1. Lecico Egypt 110 13.1. Alexandria Containers Handling 2225.1.2. Oriental Weavers Carpets 112 13.2. Egytrans 224
5.2 Other Research Team 2265.2.1. Al-Arafa for Investments & Consultancies 114 Disclaimer5.2.2. GB Auto 1165.2.3. Raya Holding 118
6. Fertilisers & Industries 120
6.1. Egyptian Financial & Industrial Co. 1296.2. Orascom Construction Industries 1316.3. El Sew edy Electric 133
7. Food & Beverages 135
7.1. Eastern Company 1427.2. Delta Sugar 144
8. Housing & Touristic Real Estate 146
8.1. Egyptian Resorts Company 1548.2. Heliopolis Housing & Development 1568.3. Nasr City Housing & Development 1588.4. Palm Hills Developments 1608.5. TMG Holding 162
Table of Contents
Page | 3
Page | 3
For more information on CICR, please visit our website at http://research.cicr.com.eg/register.php or contact us at [email protected]. Disclosures and details pertaining to stock ratings on last page.
January 26, 2012
Executive Summary In this section:
Stock Market Review 2011 Key Macro Themes 2012 CI Capital Universe Market Dashboard
One Year On: Egypt at a Crossroads Political instability hits investor confidence with EGX amongst worst
performing indices globally in 2011. Heavy selling activity sees large caps underperform small caps - EGX 20
down +45% YoY vs. EGX 70’s 41% reduction. Earnings to rise in 2012 despite continued macro concerns.
Stock picking the key as volatility remains high.
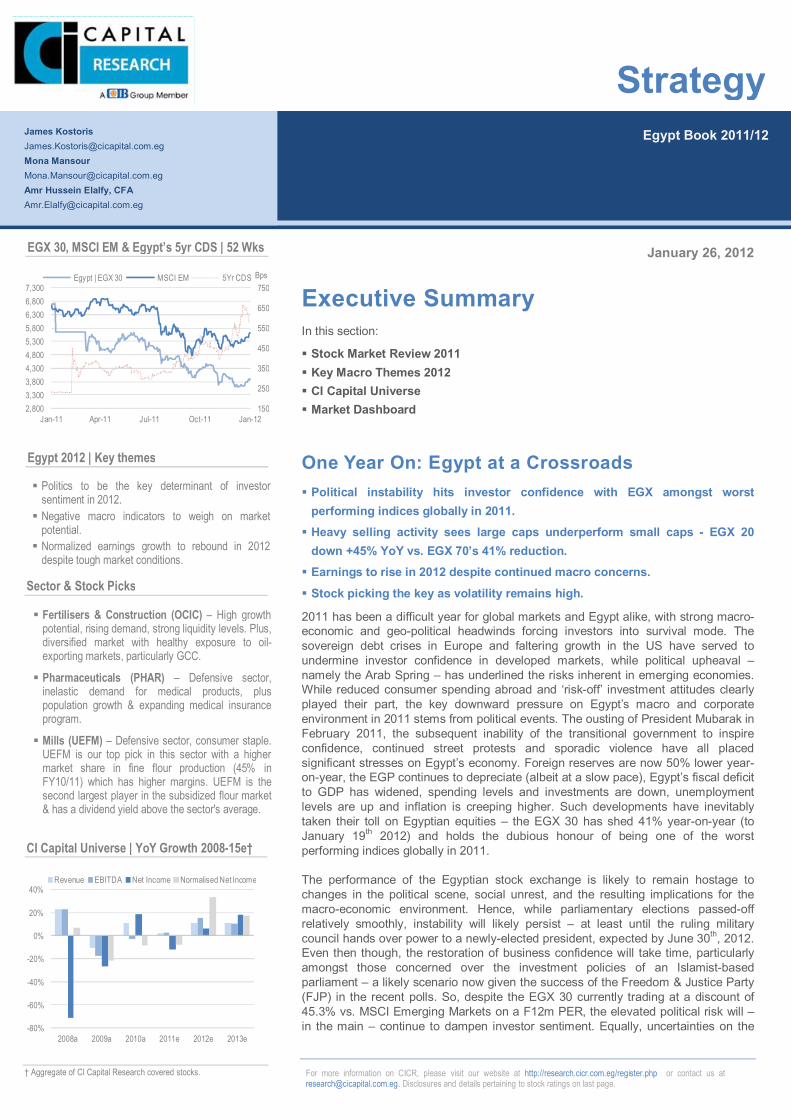
2011 has been a difficult year for global markets and Egypt alike, with strong macro-economic and geo-political headwinds forcing investors into survival mode. The sovereign debt crises in Europe and faltering growth in the US have served to undermine investor confidence in developed markets, while political upheaval – namely the Arab Spring – has underlined the risks inherent in emerging economies. While reduced consumer spending abroad and ‘risk-off’ investment attitudes clearly played their part, the key downward pressure on Egypt’s macro and corporate environment in 2011 stems from political events. The ousting of President Mubarak in February 2011, the subsequent inability of the transitional government to inspire confidence, continued street protests and sporadic violence have all placed significant stresses on Egypt’s economy. Foreign reserves are now 50% lower year-on-year, the EGP continues to depreciate (albeit at a slow pace), Egypt’s fiscal deficit to GDP has widened, spending levels and investments are down, unemployment levels are up and inflation is creeping higher. Such developments have inevitably taken their toll on Egyptian equities – the EGX 30 has shed 41% year-on-year (to January 19th 2012) and holds the dubious honour of being one of the worst performing indices globally in 2011. The performance of the Egyptian stock exchange is likely to remain hostage to changes in the political scene, social unrest, and the resulting implications for the macro-economic environment. Hence, while parliamentary elections passed-off relatively smoothly, instability will likely persist – at least until the ruling military council hands over power to a newly-elected president, expected by June 30th, 2012. Even then though, the restoration of business confidence will take time, particularly amongst those concerned over the investment policies of an Islamist-based parliament – a likely scenario now given the success of the Freedom & Justice Party (FJP) in the recent polls. So, despite the EGX 30 currently trading at a discount of 45.3% vs. MSCI Emerging Markets on a F12m PER, the elevated political risk will – in the main – continue to dampen investor sentiment. Equally, uncertainties on the
Egypt Book 2011/12
Strategy
James Kostoris [email protected] Mona Mansour [email protected] Amr Hussein Elalfy, CFA [email protected]
† Aggregate of CI Capital Research covered stocks.
Politics to be the key determinant of investor sentiment in 2012. Negative macro indicators to weigh on market
potential. Normalized earnings growth to rebound in 2012
despite tough market conditions.
Fertilisers & Construction (OCIC) – High growth potential, rising demand, strong liquidity levels. Plus, diversified market with healthy exposure to oil-exporting markets, particularly GCC.
Pharmaceuticals (PHAR) – Defensive sector, inelastic demand for medical products, plus population growth & expanding medical insurance program.
Mills (UEFM) – Defensive sector, consumer staple. UEFM is our top pick in this sector with a higher market share in fine flour production (45% in FY10/11) which has higher margins. UEFM is the second largest player in the subsidized flour market & has a dividend yield above the sector's average.
EGX 30, MSCI EM & Egypt’s 5yr CDS | 52 Wks
150
250
350
450
550
650
750
2,8003,3003,8004,3004,8005,3005,8006,3006,8007,300
Jan-11 Apr-11 Jul-11 Oct-11 Jan-12
BpsEgypt | EGX 30 MSCI EM 5Yr CDS
Egypt 2012 | Key themes
Sector & Stock Picks
-80%
-60%
-40%
-20%
0%
20%
40%
2008a 2009a 2010a 2011e 2012e 2013e
Revenue EBITDA Net Income Normalised Net Income
CI Capital Universe | YoY Growth 2008-15e†
Page | 4
Egypt Book 2011/12
January 26, 2012
Strategy & Market Update
Xxx
domestic front and the prospects of weaker global economic recovery mean that market volatility is likely to remain high as well. However, despite the weak current data, Egypt still represents a genuine investment opportunity. With a sizable population, demand fundamentals remain solid. This inherent long-term investment story allied to Egypt edging closer to civil democratic rule with an “investment-prop” approach, means those who tap the market with a long-term vision will be the real winners.
Key 2012 themes
Politics to be the key determinant of investor sentiment in 2012. Negative macro indicators to weigh on market. Structural problems in US & Europe coupled with weakening global
economies will weigh on foreign investment sentiment and will depress export.
Falling asset values and high unemployment will dampen spending level – reflecting negatively on equities.
CBE shift to a tightening policy & high yield treasuries to pressure equities.
Earnings growth in negative territory in 2011 but due to rise in 2012. Pharmaceuticals, Fertilizers & Construction our top sectors (see p.16) Orascom Construction (OCIC), EIPICO (PHAR) and Upper Egypt Mills
(UEFM) our top picks.
CI Capital Research Universe
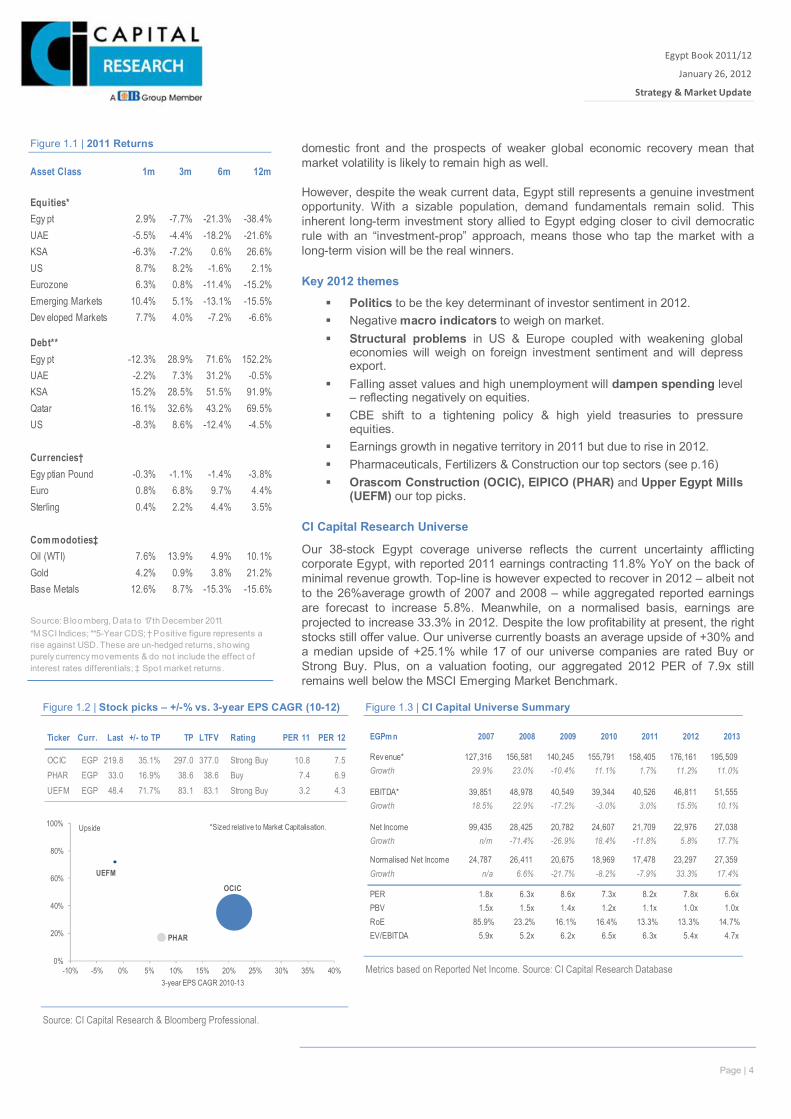
Our 38-stock Egypt coverage universe reflects the current uncertainty afflicting corporate Egypt, with reported 2011 earnings contracting 11.8% YoY on the back of minimal revenue growth. Top-line is however expected to recover in 2012 – albeit not to the 26%average growth of 2007 and 2008 – while aggregated reported earnings are forecast to increase 5.8%. Meanwhile, on a normalised basis, earnings are projected to increase 33.3% in 2012. Despite the low profitability at present, the right stocks still offer value. Our universe currently boasts an average upside of +30% and a median upside of +25.1% while 17 of our universe companies are rated Buy or Strong Buy. Plus, on a valuation footing, our aggregated 2012 PER of 7.9x still remains well below the MSCI Emerging Market Benchmark.
Asset Class 1m 3m 6m 12m
Equities*Egy pt 2.9% -7.7% -21.3% -38.4%UAE -5.5% -4.4% -18.2% -21.6%KSA -6.3% -7.2% 0.6% 26.6%US 8.7% 8.2% -1.6% 2.1%Eurozone 6.3% 0.8% -11.4% -15.2%Emerging Markets 10.4% 5.1% -13.1% -15.5%Dev eloped Markets 7.7% 4.0% -7.2% -6.6%
Debt**Egy pt -12.3% 28.9% 71.6% 152.2%UAE -2.2% 7.3% 31.2% -0.5%KSA 15.2% 28.5% 51.5% 91.9%Qatar 16.1% 32.6% 43.2% 69.5%US -8.3% 8.6% -12.4% -4.5%
Currencies†Egy ptian Pound -0.3% -1.1% -1.4% -3.8%Euro 0.8% 6.8% 9.7% 4.4%Sterling 0.4% 2.2% 4.4% 3.5%
Commodoties‡Oil (WTI) 7.6% 13.9% 4.9% 10.1%Gold 4.2% 0.9% 3.8% 21.2%Base Metals 12.6% 8.7% -15.3% -15.6%
Source: Bloo mberg, Data to 17th December 2011. *M SCI Indices; **5-Year CDS; † Positive figure represents a rise against USD. These are un-hedged returns, showing purely currency movements & do not include the effect of interest rates differentials; ‡ Spot market returns.
Figure 1.1 | 2011 Returns
Source: CI Capital Research & Bloomberg Professional.
Metrics based on Reported Net Income. Source: CI Capital Research Database
Ticker Curr. Last +/- to TP TP LTFV Rating PER 11 PER 12
OCIC EGP 219.8 35.1% 297.0 377.0 Strong Buy 10.8 7.5PHAR EGP 33.0 16.9% 38.6 38.6 Buy 7.4 6.9UEFM EGP 48.4 71.7% 83.1 83.1 Strong Buy 3.2 4.3
EGPm n 2007 2008 2009 2010 2011 2012 2013
Rev enue* 127,316 156,581 140,245 155,791 158,405 176,161 195,509Growth 29.9% 23.0% -10.4% 11.1% 1.7% 11.2% 11.0%
EBITDA* 39,851 48,978 40,549 39,344 40,526 46,811 51,555Growth 18.5% 22.9% -17.2% -3.0% 3.0% 15.5% 10.1%
Net Income 99,435 28,425 20,782 24,607 21,709 22,976 27,038Growth n/m -71.4% -26.9% 18.4% -11.8% 5.8% 17.7%
Normalised Net Income 24,787 26,411 20,675 18,969 17,478 23,297 27,359Growth n/a 6.6% -21.7% -8.2% -7.9% 33.3% 17.4%
PER 1.8x 6.3x 8.6x 7.3x 8.2x 7.8x 6.6xPBV 1.5x 1.5x 1.4x 1.2x 1.1x 1.0x 1.0xRoE 85.9% 23.2% 16.1% 16.4% 13.3% 13.3% 14.7%EV/EBITDA 5.9x 5.2x 6.2x 6.5x 6.3x 5.4x 4.7x
Figure 1.2 | Stock picks – +/-% vs. 3-year EPS CAGR (10-12) Figure 1.3 | CI Capital Universe Summary
OCIC
PHAR
UEFM
0%
20%
40%
60%
80%
100%
-10% -5% 0% 5% 10% 15% 20% 25% 30% 35% 40%
Upside
3-year EPS CAGR 2010-13
*Sized relative to Market Capitalisation.
Page | 5
Egypt Book 2011/12
January 26, 2012
Strategy & Market Update
Xxx
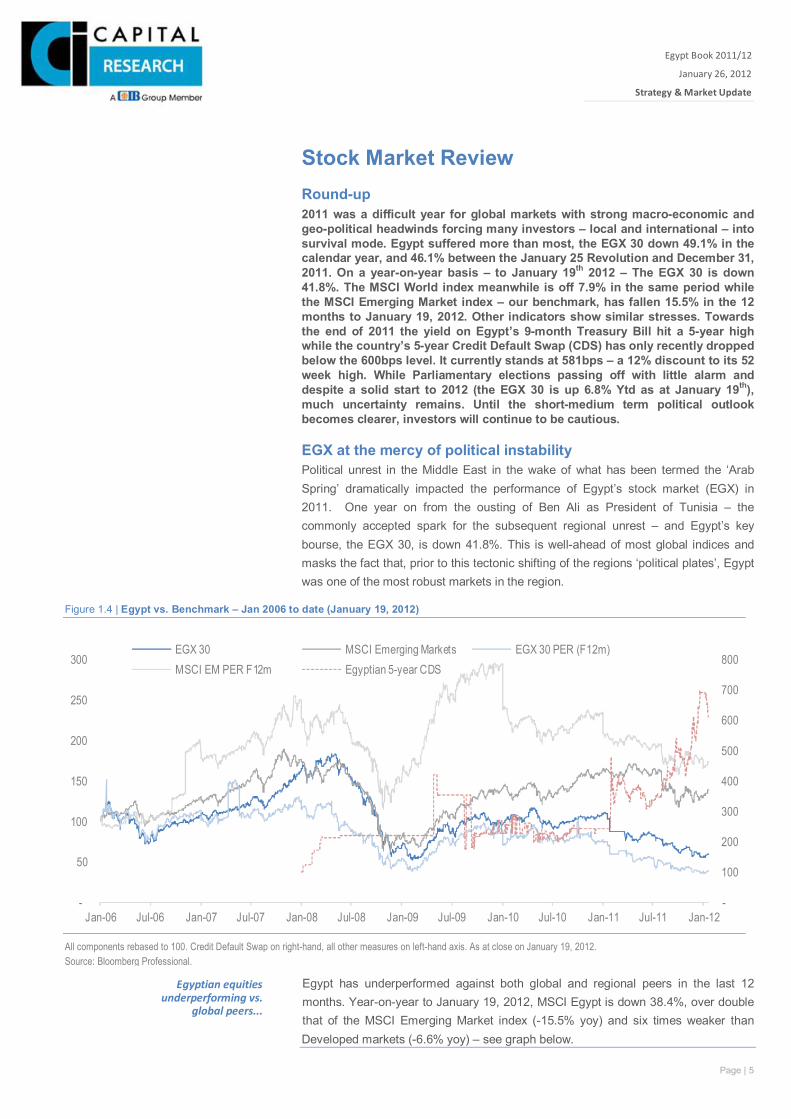
Stock Market Review Round-up 2011 was a difficult year for global markets with strong macro-economic and geo-political headwinds forcing many investors – local and international – into survival mode. Egypt suffered more than most, the EGX 30 down 49.1% in the calendar year, and 46.1% between the January 25 Revolution and December 31, 2011. On a year-on-year basis – to January 19th 2012 – The EGX 30 is down 41.8%. The MSCI World index meanwhile is off 7.9% in the same period while the MSCI Emerging Market index – our benchmark, has fallen 15.5% in the 12 months to January 19, 2012. Other indicators show similar stresses. Towards the end of 2011 the yield on Egypt’s 9-month Treasury Bill hit a 5-year high while the country’s 5-year Credit Default Swap (CDS) has only recently dropped below the 600bps level. It currently stands at 581bps – a 12% discount to its 52 week high. While Parliamentary elections passing off with little alarm and despite a solid start to 2012 (the EGX 30 is up 6.8% Ytd as at January 19th), much uncertainty remains. Until the short-medium term political outlook becomes clearer, investors will continue to be cautious.
EGX at the mercy of political instability Political unrest in the Middle East in the wake of what has been termed the ‘Arab Spring’ dramatically impacted the performance of Egypt’s stock market (EGX) in 2011. One year on from the ousting of Ben Ali as President of Tunisia – the commonly accepted spark for the subsequent regional unrest – and Egypt’s key bourse, the EGX 30, is down 41.8%. This is well-ahead of most global indices and masks the fact that, prior to this tectonic shifting of the regions ‘political plates’, Egypt was one of the most robust markets in the region.
Egypt has underperformed against both global and regional peers in the last 12 months. Year-on-year to January 19, 2012, MSCI Egypt is down 38.4%, over double that of the MSCI Emerging Market index (-15.5% yoy) and six times weaker than Developed markets (-6.6% yoy) – see graph below.
Egyptian equities underperforming vs.
global peers...
-
100
200
300
400
500
600
700
800
-
50
100
150
200
250
300
Jan-06 Jul-06 Jan-07 Jul-07 Jan-08 Jul-08 Jan-09 Jul-09 Jan-10 Jul-10 Jan-11 Jul-11 Jan-12
EGX 30 MSCI Emerging Markets EGX 30 PER (F12m)MSCI EM PER F12m Egyptian 5-year CDS
All components rebased to 100. Credit Default Swap on right-hand, all other measures on left-hand axis. As at close on January 19, 2012. Source: Bloomberg Professional.
Figure 1.4 | Egypt vs. Benchmark – Jan 2006 to date (January 19, 2012)
Page | 6
Egypt Book 2011/12
January 26, 2012
Strategy & Market Update
Xxx
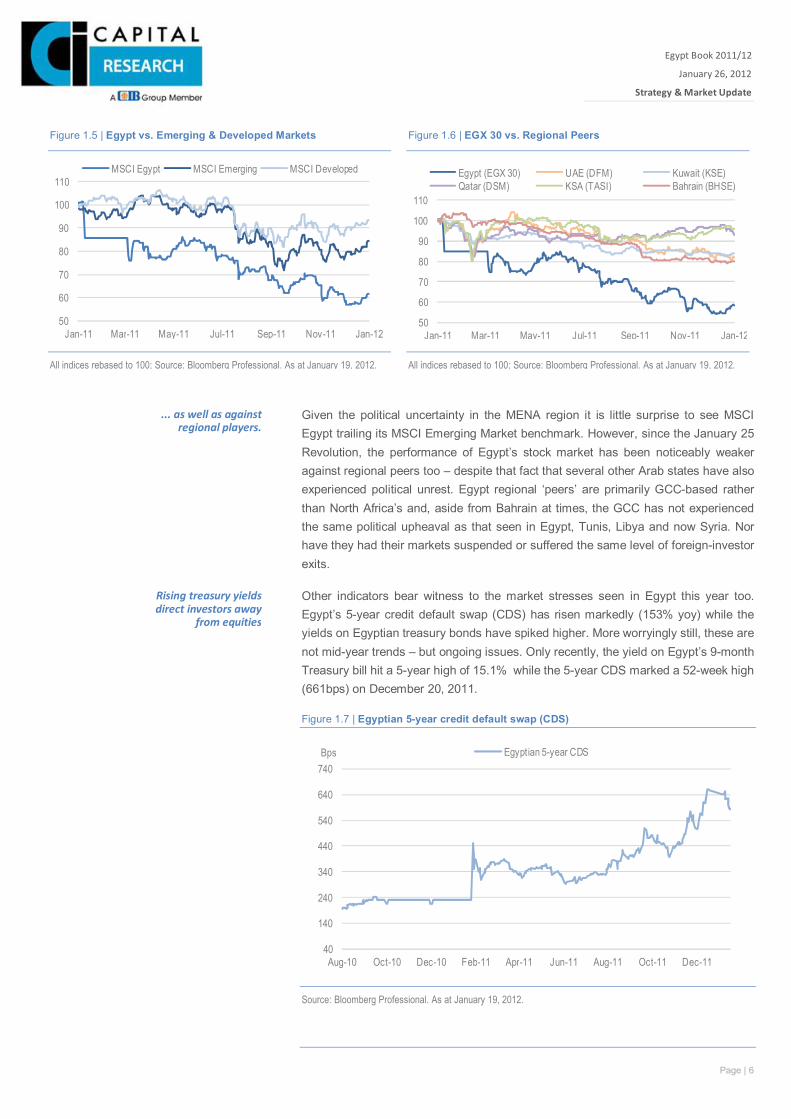
Given the political uncertainty in the MENA region it is little surprise to see MSCI Egypt trailing its MSCI Emerging Market benchmark. However, since the January 25 Revolution, the performance of Egypt’s stock market has been noticeably weaker against regional peers too – despite that fact that several other Arab states have also experienced political unrest. Egypt regional ‘peers’ are primarily GCC-based rather than North Africa’s and, aside from Bahrain at times, the GCC has not experienced the same political upheaval as that seen in Egypt, Tunis, Libya and now Syria. Nor have they had their markets suspended or suffered the same level of foreign-investor exits.
Other indicators bear witness to the market stresses seen in Egypt this year too. Egypt’s 5-year credit default swap (CDS) has risen markedly (153% yoy) while the yields on Egyptian treasury bonds have spiked higher. More worryingly still, these are not mid-year trends – but ongoing issues. Only recently, the yield on Egypt’s 9-month Treasury bill hit a 5-year high of 15.1% while the 5-year CDS marked a 52-week high (661bps) on December 20, 2011.
Figure 1.7 | Egyptian 5-year credit default swap (CDS)
Source: Bloomberg Professional. As at January 19, 2012.
40
140
240
340
440
540
640
740
Aug-10 Oct-10 Dec-10 Feb-11 Apr-11 Jun-11 Aug-11 Oct-11 Dec-11
Bps Egyptian 5-year CDS
... as well as against regional players.
Rising treasury yields direct investors away
from equities
Figure 1.5 | Egypt vs. Emerging & Developed Markets Figure 1.6 | EGX 30 vs. Regional Peers
50
60
70
80
90
100
110
Jan-11 Mar-11 May-11 Jul-11 Sep-11 Nov-11 Jan-12
MSCI Egypt MSCI Emerging MSCI Developed
50
60
70
80
90
100
110
Jan-11 Mar-11 May-11 Jul-11 Sep-11 Nov-11 Jan-12
Egypt (EGX 30) UAE (DFM) Kuwait (KSE)Qatar (DSM) KSA (TASI) Bahrain (BHSE)
All indices rebased to 100; Source: Bloomberg Professional. As at January 19, 2012. All indices rebased to 100; Source: Bloomberg Professional. As at January 19, 2012.
Page | 7
Egypt Book 2011/12
January 26, 2012
Strategy & Market Update
Xxx
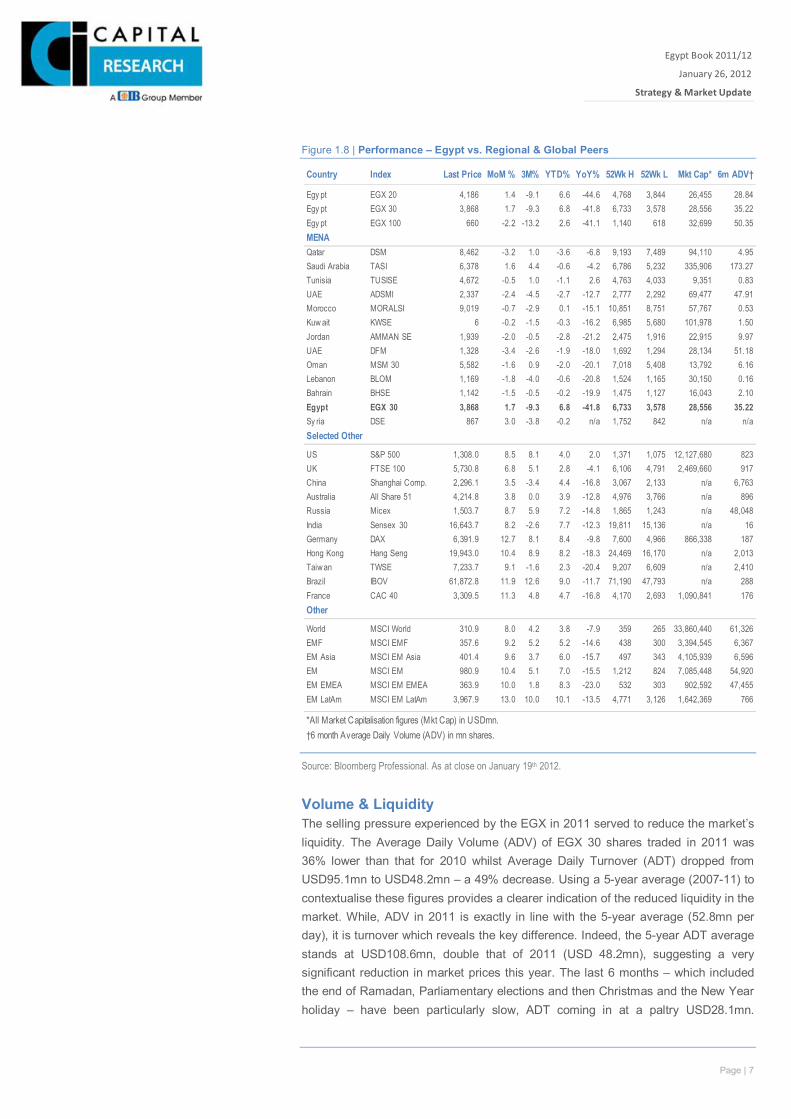
Figure 1.8 | Performance – Egypt vs. Regional & Global Peers
Source: Bloomberg Professional. As at close on January 19th 2012.
Volume & Liquidity The selling pressure experienced by the EGX in 2011 served to reduce the market’s liquidity. The Average Daily Volume (ADV) of EGX 30 shares traded in 2011 was 36% lower than that for 2010 whilst Average Daily Turnover (ADT) dropped from USD95.1mn to USD48.2mn – a 49% decrease. Using a 5-year average (2007-11) to contextualise these figures provides a clearer indication of the reduced liquidity in the market. While, ADV in 2011 is exactly in line with the 5-year average (52.8mn per day), it is turnover which reveals the key difference. Indeed, the 5-year ADT average stands at USD108.6mn, double that of 2011 (USD 48.2mn), suggesting a very significant reduction in market prices this year. The last 6 months – which included the end of Ramadan, Parliamentary elections and then Christmas and the New Year holiday – have been particularly slow, ADT coming in at a paltry USD28.1mn.
Country Index Last Price MoM % 3M% YTD% YoY% 52Wk H 52Wk L Mkt Cap* 6m ADV†
Egy pt EGX 20 4,186 1.4 -9.1 6.6 -44.6 4,768 3,844 26,455 28.84Egy pt EGX 30 3,868 1.7 -9.3 6.8 -41.8 6,733 3,578 28,556 35.22Egy pt EGX 100 660 -2.2 -13.2 2.6 -41.1 1,140 618 32,699 50.35MENAQatar DSM 8,462 -3.2 1.0 -3.6 -6.8 9,193 7,489 94,110 4.95Saudi Arabia TASI 6,378 1.6 4.4 -0.6 -4.2 6,786 5,232 335,906 173.27Tunisia TUSISE 4,672 -0.5 1.0 -1.1 2.6 4,763 4,033 9,351 0.83UAE ADSMI 2,337 -2.4 -4.5 -2.7 -12.7 2,777 2,292 69,477 47.91Morocco MORALSI 9,019 -0.7 -2.9 0.1 -15.1 10,851 8,751 57,767 0.53Kuw ait KWSE 6 -0.2 -1.5 -0.3 -16.2 6,985 5,680 101,978 1.50Jordan AMMAN SE 1,939 -2.0 -0.5 -2.8 -21.2 2,475 1,916 22,915 9.97UAE DFM 1,328 -3.4 -2.6 -1.9 -18.0 1,692 1,294 28,134 51.18Oman MSM 30 5,582 -1.6 0.9 -2.0 -20.1 7,018 5,408 13,792 6.16Lebanon BLOM 1,169 -1.8 -4.0 -0.6 -20.8 1,524 1,165 30,150 0.16Bahrain BHSE 1,142 -1.5 -0.5 -0.2 -19.9 1,475 1,127 16,043 2.10Egypt EGX 30 3,868 1.7 -9.3 6.8 -41.8 6,733 3,578 28,556 35.22Sy ria DSE 867 3.0 -3.8 -0.2 n/a 1,752 842 n/a n/aSelected Other
US S&P 500 1,308.0 8.5 8.1 4.0 2.0 1,371 1,075 12,127,680 823UK FTSE 100 5,730.8 6.8 5.1 2.8 -4.1 6,106 4,791 2,469,660 917China Shanghai Comp. 2,296.1 3.5 -3.4 4.4 -16.8 3,067 2,133 n/a 6,763Australia All Share 51 4,214.8 3.8 0.0 3.9 -12.8 4,976 3,766 n/a 896Russia Micex 1,503.7 8.7 5.9 7.2 -14.8 1,865 1,243 n/a 48,048India Sensex 30 16,643.7 8.2 -2.6 7.7 -12.3 19,811 15,136 n/a 16Germany DAX 6,391.9 12.7 8.1 8.4 -9.8 7,600 4,966 866,338 187Hong Kong Hang Seng 19,943.0 10.4 8.9 8.2 -18.3 24,469 16,170 n/a 2,013Taiwan TWSE 7,233.7 9.1 -1.6 2.3 -20.4 9,207 6,609 n/a 2,410Brazil IBOV 61,872.8 11.9 12.6 9.0 -11.7 71,190 47,793 n/a 288France CAC 40 3,309.5 11.3 4.8 4.7 -16.8 4,170 2,693 1,090,841 176Other
World MSCI World 310.9 8.0 4.2 3.8 -7.9 359 265 33,860,440 61,326EMF MSCI EMF 357.6 9.2 5.2 5.2 -14.6 438 300 3,394,545 6,367EM Asia MSCI EM Asia 401.4 9.6 3.7 6.0 -15.7 497 343 4,105,939 6,596EM MSCI EM 980.9 10.4 5.1 7.0 -15.5 1,212 824 7,085,448 54,920EM EMEA MSCI EM EMEA 363.9 10.0 1.8 8.3 -23.0 532 303 902,592 47,455EM LatAm MSCI EM LatAm 3,967.9 13.0 10.0 10.1 -13.5 4,771 3,126 1,642,369 766
*All Market Capitalisation figures (Mkt Cap) in USDmn.†6 month Average Daily Volume (ADV) in mn shares.
Page | 8
Egypt Book 2011/12
January 26, 2012
Strategy & Market Update
Xxx
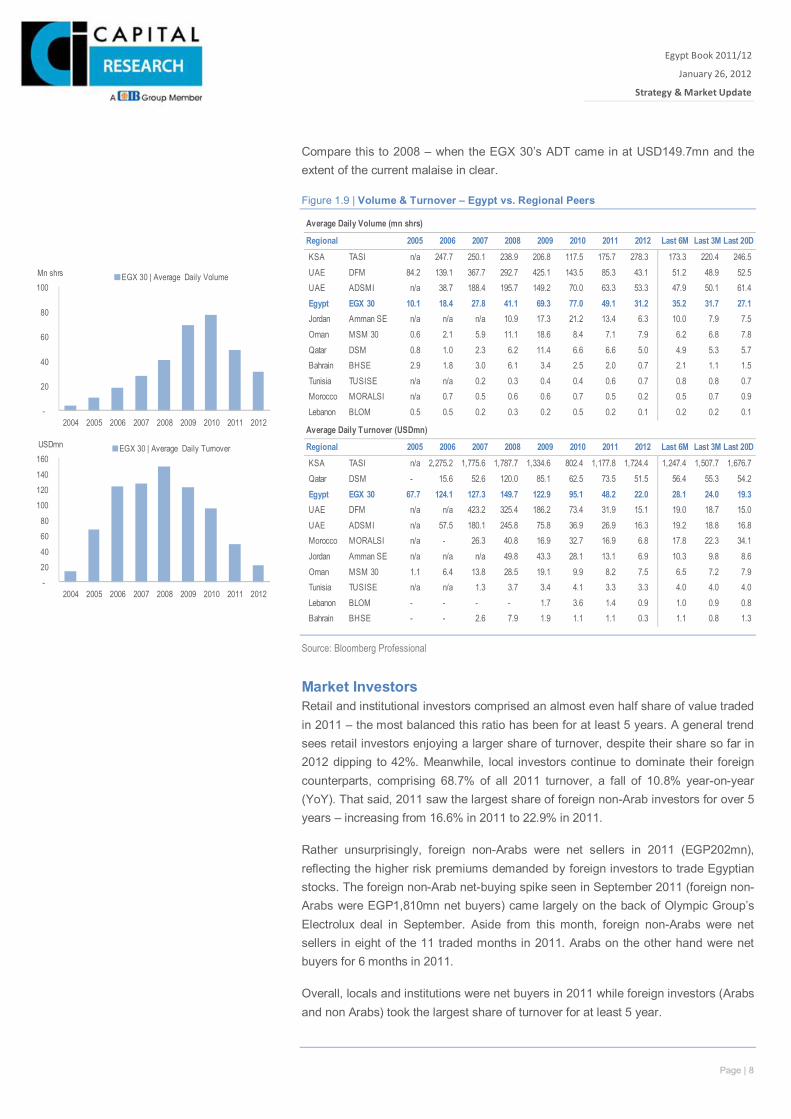
Compare this to 2008 – when the EGX 30’s ADT came in at USD149.7mn and the extent of the current malaise in clear.
Figure 1.9 | Volume & Turnover – Egypt vs. Regional Peers
Source: Bloomberg Professional
Market Investors Retail and institutional investors comprised an almost even half share of value traded in 2011 – the most balanced this ratio has been for at least 5 years. A general trend sees retail investors enjoying a larger share of turnover, despite their share so far in 2012 dipping to 42%. Meanwhile, local investors continue to dominate their foreign counterparts, comprising 68.7% of all 2011 turnover, a fall of 10.8% year-on-year (YoY). That said, 2011 saw the largest share of foreign non-Arab investors for over 5 years – increasing from 16.6% in 2011 to 22.9% in 2011.
Rather unsurprisingly, foreign non-Arabs were net sellers in 2011 (EGP202mn), reflecting the higher risk premiums demanded by foreign investors to trade Egyptian stocks. The foreign non-Arab net-buying spike seen in September 2011 (foreign non-Arabs were EGP1,810mn net buyers) came largely on the back of Olympic Group’s Electrolux deal in September. Aside from this month, foreign non-Arabs were net sellers in eight of the 11 traded months in 2011. Arabs on the other hand were net buyers for 6 months in 2011.
Overall, locals and institutions were net buyers in 2011 while foreign investors (Arabs and non Arabs) took the largest share of turnover for at least 5 year.
Average Daily Volume (mn shrs)
Regional 2005 2006 2007 2008 2009 2010 2011 2012 Last 6M Last 3M Last 20DKSA TASI n/a 247.7 250.1 238.9 206.8 117.5 175.7 278.3 173.3 220.4 246.5 UAE DFM 84.2 139.1 367.7 292.7 425.1 143.5 85.3 43.1 51.2 48.9 52.5 UAE ADSMI n/a 38.7 188.4 195.7 149.2 70.0 63.3 53.3 47.9 50.1 61.4 Egypt EGX 30 10.1 18.4 27.8 41.1 69.3 77.0 49.1 31.2 35.2 31.7 27.1 Jordan Amman SE n/a n/a n/a 10.9 17.3 21.2 13.4 6.3 10.0 7.9 7.5 Oman MSM 30 0.6 2.1 5.9 11.1 18.6 8.4 7.1 7.9 6.2 6.8 7.8 Qatar DSM 0.8 1.0 2.3 6.2 11.4 6.6 6.6 5.0 4.9 5.3 5.7 Bahrain BHSE 2.9 1.8 3.0 6.1 3.4 2.5 2.0 0.7 2.1 1.1 1.5 Tunisia TUSISE n/a n/a 0.2 0.3 0.4 0.4 0.6 0.7 0.8 0.8 0.7 Morocco MORALSI n/a 0.7 0.5 0.6 0.6 0.7 0.5 0.2 0.5 0.7 0.9 Lebanon BLOM 0.5 0.5 0.2 0.3 0.2 0.5 0.2 0.1 0.2 0.2 0.1
Average Daily Turnover (USDmn)
Regional 2005 2006 2007 2008 2009 2010 2011 2012 Last 6M Last 3M Last 20DKSA TASI n/a 2,275.2 1,775.6 1,787.7 1,334.6 802.4 1,177.8 1,724.4 1,247.4 1,507.7 1,676.7 Qatar DSM - 15.6 52.6 120.0 85.1 62.5 73.5 51.5 56.4 55.3 54.2 Egypt EGX 30 67.7 124.1 127.3 149.7 122.9 95.1 48.2 22.0 28.1 24.0 19.3 UAE DFM n/a n/a 423.2 325.4 186.2 73.4 31.9 15.1 19.0 18.7 15.0 UAE ADSMI n/a 57.5 180.1 245.8 75.8 36.9 26.9 16.3 19.2 18.8 16.8 Morocco MORALSI n/a - 26.3 40.8 16.9 32.7 16.9 6.8 17.8 22.3 34.1 Jordan Amman SE n/a n/a n/a 49.8 43.3 28.1 13.1 6.9 10.3 9.8 8.6 Oman MSM 30 1.1 6.4 13.8 28.5 19.1 9.9 8.2 7.5 6.5 7.2 7.9 Tunisia TUSISE n/a n/a 1.3 3.7 3.4 4.1 3.3 3.3 4.0 4.0 4.0 Lebanon BLOM - - - - 1.7 3.6 1.4 0.9 1.0 0.9 0.8 Bahrain BHSE - - 2.6 7.9 1.9 1.1 1.1 0.3 1.1 0.8 1.3
-
20
40
60
80
100
2004 2005 2006 2007 2008 2009 2010 2011 2012
Mn shrs EGX 30 | Average Daily Volume
-20 40
60 80
100 120 140
160
2004 2005 2006 2007 2008 2009 2010 2011 2012
USDmn EGX 30 | Average Daily Turnover
Page | 9
Egypt Book 2011/12
January 26, 2012
Strategy & Market Update
Xxx
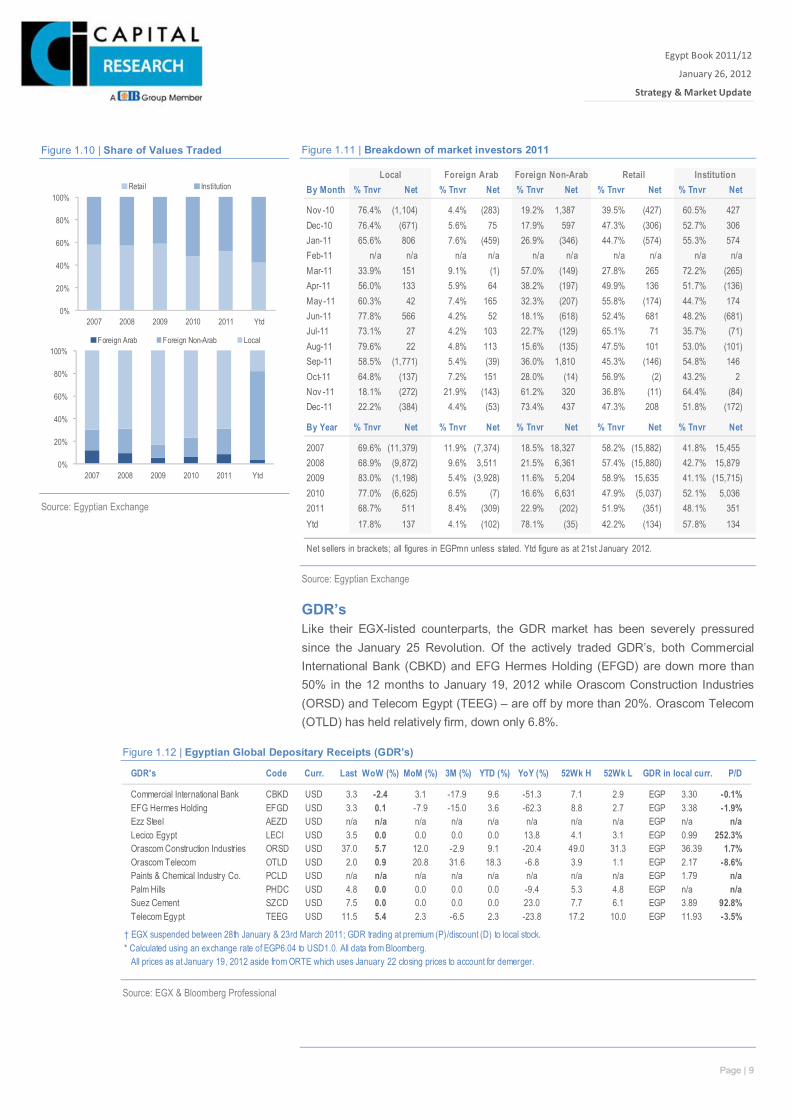
Figure 1.11 | Breakdown of market investors 2011
Source: Egyptian Exchange
GDR’s Like their EGX-listed counterparts, the GDR market has been severely pressured since the January 25 Revolution. Of the actively traded GDR’s, both Commercial International Bank (CBKD) and EFG Hermes Holding (EFGD) are down more than 50% in the 12 months to January 19, 2012 while Orascom Construction Industries (ORSD) and Telecom Egypt (TEEG) – are off by more than 20%. Orascom Telecom (OTLD) has held relatively firm, down only 6.8%.
Figure 1.12 | Egyptian Global Depositary Receipts (GDR’s)
Source: EGX & Bloomberg Professional
By Month % Tnvr Net % Tnvr Net % Tnvr Net % Tnvr Net % Tnvr Net
Nov -10 76.4% (1,104) 4.4% (283) 19.2% 1,387 39.5% (427) 60.5% 427Dec-10 76.4% (671) 5.6% 75 17.9% 597 47.3% (306) 52.7% 306Jan-11 65.6% 806 7.6% (459) 26.9% (346) 44.7% (574) 55.3% 574Feb-11 n/a n/a n/a n/a n/a n/a n/a n/a n/a n/aMar-11 33.9% 151 9.1% (1) 57.0% (149) 27.8% 265 72.2% (265)Apr-11 56.0% 133 5.9% 64 38.2% (197) 49.9% 136 51.7% (136)May -11 60.3% 42 7.4% 165 32.3% (207) 55.8% (174) 44.7% 174Jun-11 77.8% 566 4.2% 52 18.1% (618) 52.4% 681 48.2% (681)Jul-11 73.1% 27 4.2% 103 22.7% (129) 65.1% 71 35.7% (71)Aug-11 79.6% 22 4.8% 113 15.6% (135) 47.5% 101 53.0% (101)Sep-11 58.5% (1,771) 5.4% (39) 36.0% 1,810 45.3% (146) 54.8% 146Oct-11 64.8% (137) 7.2% 151 28.0% (14) 56.9% (2) 43.2% 2Nov -11 18.1% (272) 21.9% (143) 61.2% 320 36.8% (11) 64.4% (84)Dec-11 22.2% (384) 4.4% (53) 73.4% 437 47.3% 208 51.8% (172)
By Year % Tnvr Net % Tnvr Net % Tnvr Net % Tnvr Net % Tnvr Net
2007 69.6% (11,379) 11.9% (7,374) 18.5% 18,327 58.2% (15,882) 41.8% 15,4552008 68.9% (9,872) 9.6% 3,511 21.5% 6,361 57.4% (15,880) 42.7% 15,8792009 83.0% (1,198) 5.4% (3,928) 11.6% 5,204 58.9% 15,635 41.1% (15,715)2010 77.0% (6,625) 6.5% (7) 16.6% 6,631 47.9% (5,037) 52.1% 5,0362011 68.7% 511 8.4% (309) 22.9% (202) 51.9% (351) 48.1% 351Ytd 17.8% 137 4.1% (102) 78.1% (35) 42.2% (134) 57.8% 134
Net sellers in brackets; all figures in EGPmn unless stated. Ytd figure as at 21st January 2012.
Local Foreign Arab Foreign Non-Arab Retail Institution
Figure 1.10 | Share of Values Traded
0%
20%
40%
60%
80%
100%
2007 2008 2009 2010 2011 Ytd
Retail Institution
0%
20%
40%
60%
80%
100%
2007 2008 2009 2010 2011 Ytd
Foreign Arab Foreign Non-Arab Local
Source: Egyptian Exchange
GDR's Code Curr. Last WoW (%) MoM (%) 3M (%) YTD (%) YoY (%) 52Wk H 52Wk L GDR in local curr. P/D
Commercial International Bank CBKD USD 3.3 -2.4 3.1 -17.9 9.6 -51.3 7.1 2.9 EGP 3.30 -0.1%EFG Hermes Holding EFGD USD 3.3 0.1 -7.9 -15.0 3.6 -62.3 8.8 2.7 EGP 3.38 -1.9%Ezz Steel AEZD USD n/a n/a n/a n/a n/a n/a n/a n/a EGP n/a n/aLecico Egypt LECI USD 3.5 0.0 0.0 0.0 0.0 13.8 4.1 3.1 EGP 0.99 252.3%Orascom Construction Industries ORSD USD 37.0 5.7 12.0 -2.9 9.1 -20.4 49.0 31.3 EGP 36.39 1.7%Orascom Telecom OTLD USD 2.0 0.9 20.8 31.6 18.3 -6.8 3.9 1.1 EGP 2.17 -8.6%Paints & Chemical Industry Co. PCLD USD n/a n/a n/a n/a n/a n/a n/a n/a EGP 1.79 n/aPalm Hills PHDC USD 4.8 0.0 0.0 0.0 0.0 -9.4 5.3 4.8 EGP n/a n/aSuez Cement SZCD USD 7.5 0.0 0.0 0.0 0.0 23.0 7.7 6.1 EGP 3.89 92.8%Telecom Egypt TEEG USD 11.5 5.4 2.3 -6.5 2.3 -23.8 17.2 10.0 EGP 11.93 -3.5%
† EGX suspended between 28th January & 23rd March 2011; GDR trading at premium (P)/discount (D) to local stock.* Calculated using an exchange rate of EGP6.04 to USD1.0. All data from Bloomberg.
All prices as at January 19, 2012 aside from ORTE which uses January 22 closing prices to account for demerger.
Page | 10
Egypt Book 2011/12
January 26, 2012
Strategy & Market Update
Xxx
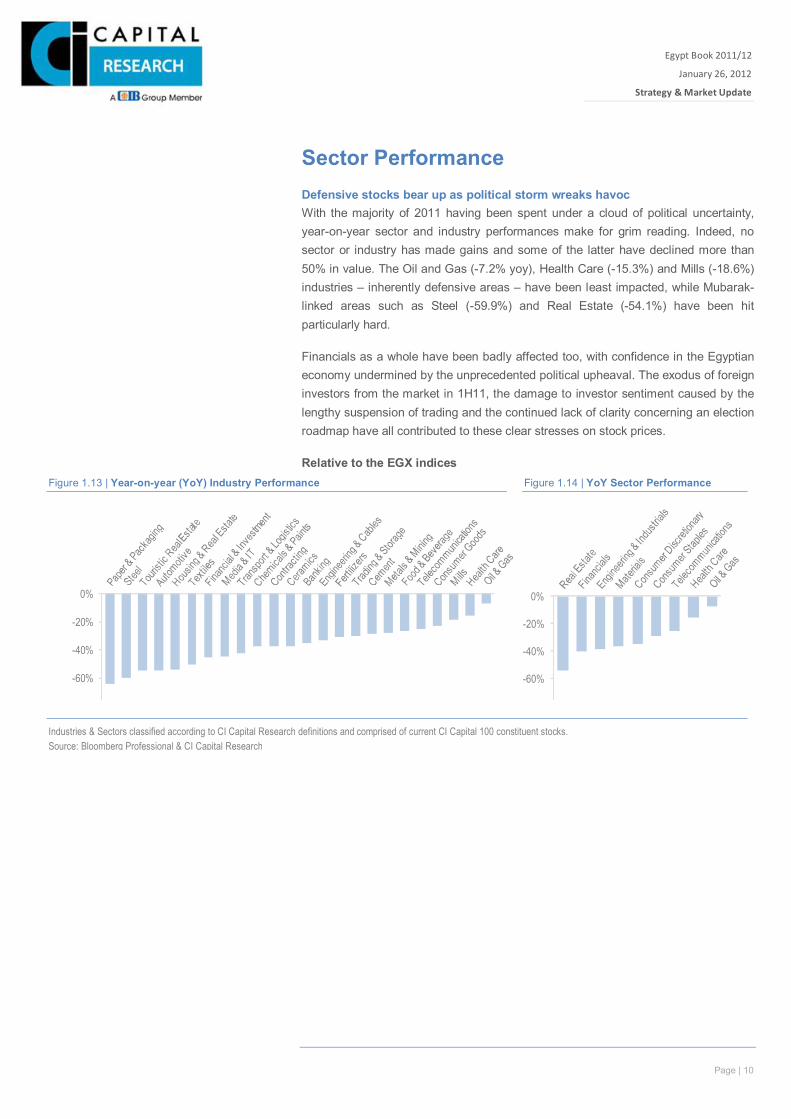
Sector Performance Defensive stocks bear up as political storm wreaks havoc With the majority of 2011 having been spent under a cloud of political uncertainty, year-on-year sector and industry performances make for grim reading. Indeed, no sector or industry has made gains and some of the latter have declined more than 50% in value. The Oil and Gas (-7.2% yoy), Health Care (-15.3%) and Mills (-18.6%) industries – inherently defensive areas – have been least impacted, while Mubarak-linked areas such as Steel (-59.9%) and Real Estate (-54.1%) have been hit particularly hard.
Financials as a whole have been badly affected too, with confidence in the Egyptian economy undermined by the unprecedented political upheaval. The exodus of foreign investors from the market in 1H11, the damage to investor sentiment caused by the lengthy suspension of trading and the continued lack of clarity concerning an election roadmap have all contributed to these clear stresses on stock prices.
Relative to the EGX indices
Industries & Sectors classified according to CI Capital Research definitions and comprised of current CI Capital 100 constituent stocks. Source: Bloomberg Professional & CI Capital Research
-80%
-60%
-40%
-20%
0%
-80%
-60%
-40%
-20%
0%
Figure 1.14 | YoY Sector Performance Figure 1.13 | Year-on-year (YoY) Industry Performance
Page | 11
Egypt Book 2011/12
January 26, 2012
Strategy & Market Update
Xxx
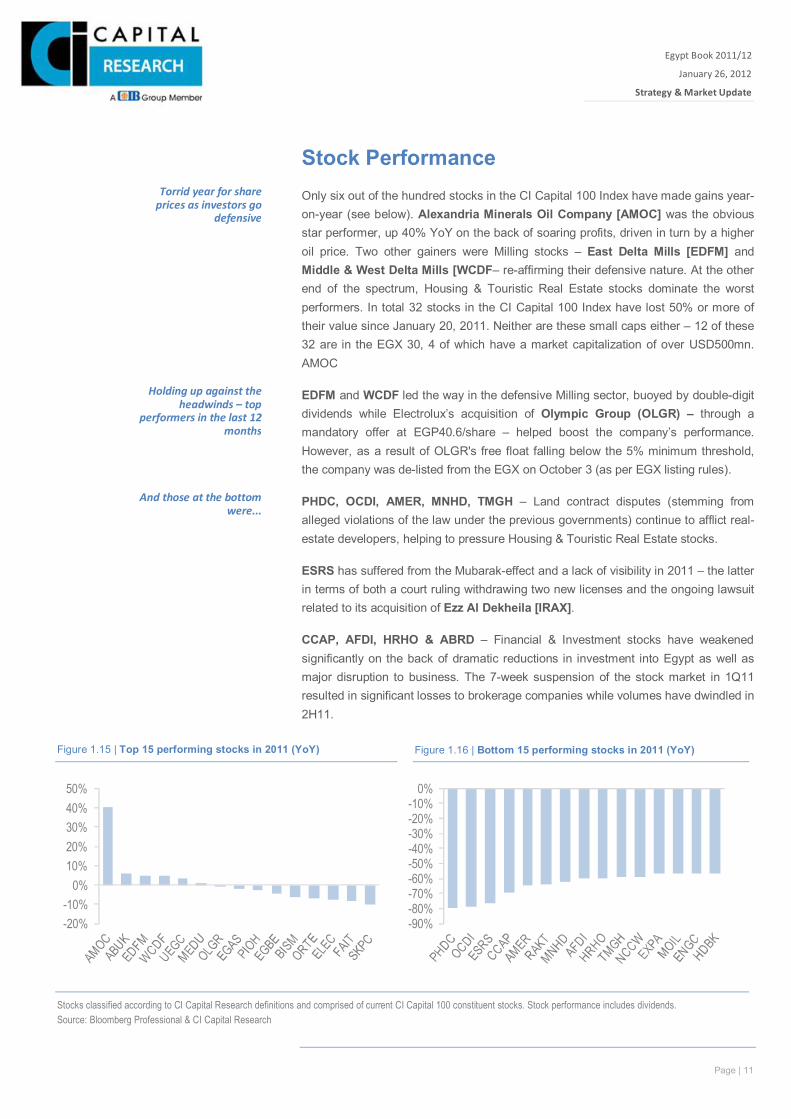
Stock Performance Only six out of the hundred stocks in the CI Capital 100 Index have made gains year-on-year (see below). Alexandria Minerals Oil Company [AMOC] was the obvious star performer, up 40% YoY on the back of soaring profits, driven in turn by a higher oil price. Two other gainers were Milling stocks – East Delta Mills [EDFM] and Middle & West Delta Mills [WCDF– re-affirming their defensive nature. At the other end of the spectrum, Housing & Touristic Real Estate stocks dominate the worst performers. In total 32 stocks in the CI Capital 100 Index have lost 50% or more of their value since January 20, 2011. Neither are these small caps either – 12 of these 32 are in the EGX 30, 4 of which have a market capitalization of over USD500mn. AMOC
EDFM and WCDF led the way in the defensive Milling sector, buoyed by double-digit dividends while Electrolux’s acquisition of Olympic Group (OLGR) – through a mandatory offer at EGP40.6/share – helped boost the company’s performance. However, as a result of OLGR's free float falling below the 5% minimum threshold, the company was de-listed from the EGX on October 3 (as per EGX listing rules).
PHDC, OCDI, AMER, MNHD, TMGH – Land contract disputes (stemming from alleged violations of the law under the previous governments) continue to afflict real-estate developers, helping to pressure Housing & Touristic Real Estate stocks.
ESRS has suffered from the Mubarak-effect and a lack of visibility in 2011 – the latter in terms of both a court ruling withdrawing two new licenses and the ongoing lawsuit related to its acquisition of Ezz Al Dekheila [IRAX].
CCAP, AFDI, HRHO & ABRD – Financial & Investment stocks have weakened significantly on the back of dramatic reductions in investment into Egypt as well as major disruption to business. The 7-week suspension of the stock market in 1Q11 resulted in significant losses to brokerage companies while volumes have dwindled in 2H11.
Torrid year for share prices as investors go
defensive
Holding up against the headwinds – top
performers in the last 12 months
And those at the bottom were...
-20%-10%
0%10%20%30%40%50%
-90%-80%-70%-60%-50%-40%-30%-20%-10%
0%
Figure 1.15 | Top 15 performing stocks in 2011 (YoY)
Stocks classified according to CI Capital Research definitions and comprised of current CI Capital 100 constituent stocks. Stock performance includes dividends. Source: Bloomberg Professional & CI Capital Research
Figure 1.16 | Bottom 15 performing stocks in 2011 (YoY)
Page | 12
Egypt Book 2011/12
January 26, 2012
Strategy & Market Update
Xxx
Valuation
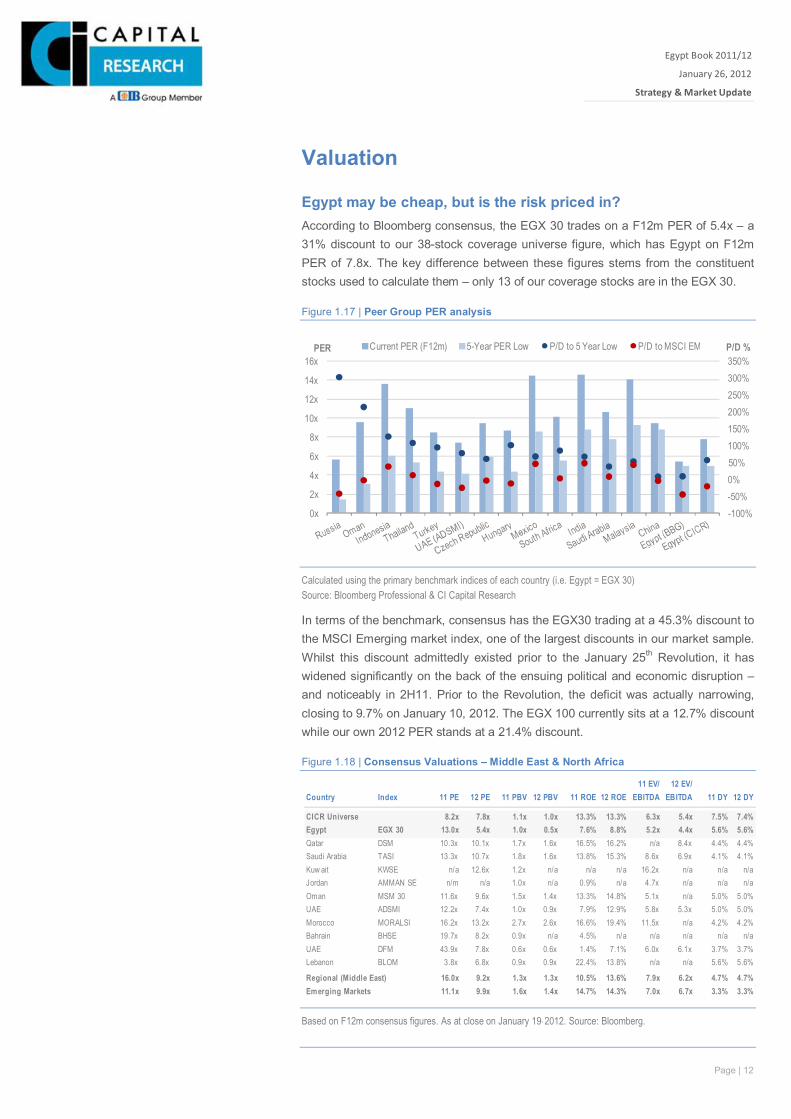
Egypt may be cheap, but is the risk priced in? According to Bloomberg consensus, the EGX 30 trades on a F12m PER of 5.4x – a 31% discount to our 38-stock coverage universe figure, which has Egypt on F12m PER of 7.8x. The key difference between these figures stems from the constituent stocks used to calculate them – only 13 of our coverage stocks are in the EGX 30.
Figure 1.17 | Peer Group PER analysis
Calculated using the primary benchmark indices of each country (i.e. Egypt = EGX 30) Source: Bloomberg Professional & CI Capital Research
In terms of the benchmark, consensus has the EGX30 trading at a 45.3% discount to the MSCI Emerging market index, one of the largest discounts in our market sample. Whilst this discount admittedly existed prior to the January 25th Revolution, it has widened significantly on the back of the ensuing political and economic disruption – and noticeably in 2H11. Prior to the Revolution, the deficit was actually narrowing, closing to 9.7% on January 10, 2012. The EGX 100 currently sits at a 12.7% discount while our own 2012 PER stands at a 21.4% discount.
Figure 1.18 | Consensus Valuations – Middle East & North Africa
Based on F12m consensus figures. As at close on January 19, 2012. Source: Bloomberg.
-100%-50%0%50%100%150%200%250%300%350%
0x
2x
4x
6x
8x
10x
12x
14x
16xP/D %PER Current PER (F12m) 5-Year PER Low P/D to 5 Year Low P/D to MSCI EM
11 EV/ 12 EV/Country Index 11 PE 12 PE 11 PBV 12 PBV 11 ROE 12 ROE EBITDA EBITDA 11 DY 12 DY
CICR Universe 8.2x 7.8x 1.1x 1.0x 13.3% 13.3% 6.3x 5.4x 7.5% 7.4%Egypt EGX 30 13.0x 5.4x 1.0x 0.5x 7.6% 8.8% 5.2x 4.4x 5.6% 5.6%Qatar DSM 10.3x 10.1x 1.7x 1.6x 16.5% 16.2% n/a 8.4x 4.4% 4.4%Saudi Arabia TASI 13.3x 10.7x 1.8x 1.6x 13.8% 15.3% 8.6x 6.9x 4.1% 4.1%Kuw ait KWSE n/a 12.6x 1.2x n/a n/a n/a 16.2x n/a n/a n/aJordan AMMAN SE n/m n/a 1.0x n/a 0.9% n/a 4.7x n/a n/a n/aOman MSM 30 11.6x 9.6x 1.5x 1.4x 13.3% 14.8% 5.1x n/a 5.0% 5.0%UAE ADSMI 12.2x 7.4x 1.0x 0.9x 7.9% 12.9% 5.8x 5.3x 5.0% 5.0%Morocco MORALSI 16.2x 13.2x 2.7x 2.6x 16.6% 19.4% 11.5x n/a 4.2% 4.2%Bahrain BHSE 19.7x 8.2x 0.9x n/a 4.5% n/a n/a n/a n/a n/aUAE DFM 43.9x 7.8x 0.6x 0.6x 1.4% 7.1% 6.0x 6.1x 3.7% 3.7%Lebanon BLOM 3.8x 6.8x 0.9x 0.9x 22.4% 13.8% n/a n/a 5.6% 5.6%
Regional (Middle East) 16.0x 9.2x 1.3x 1.3x 10.5% 13.6% 7.9x 6.2x 4.7% 4.7%Emerging Markets 11.1x 9.9x 1.6x 1.4x 14.7% 14.3% 7.0x 6.7x 3.3% 3.3%
Page | 13
Egypt Book 2011/12
January 26, 2012
Strategy & Market Update
Xxx
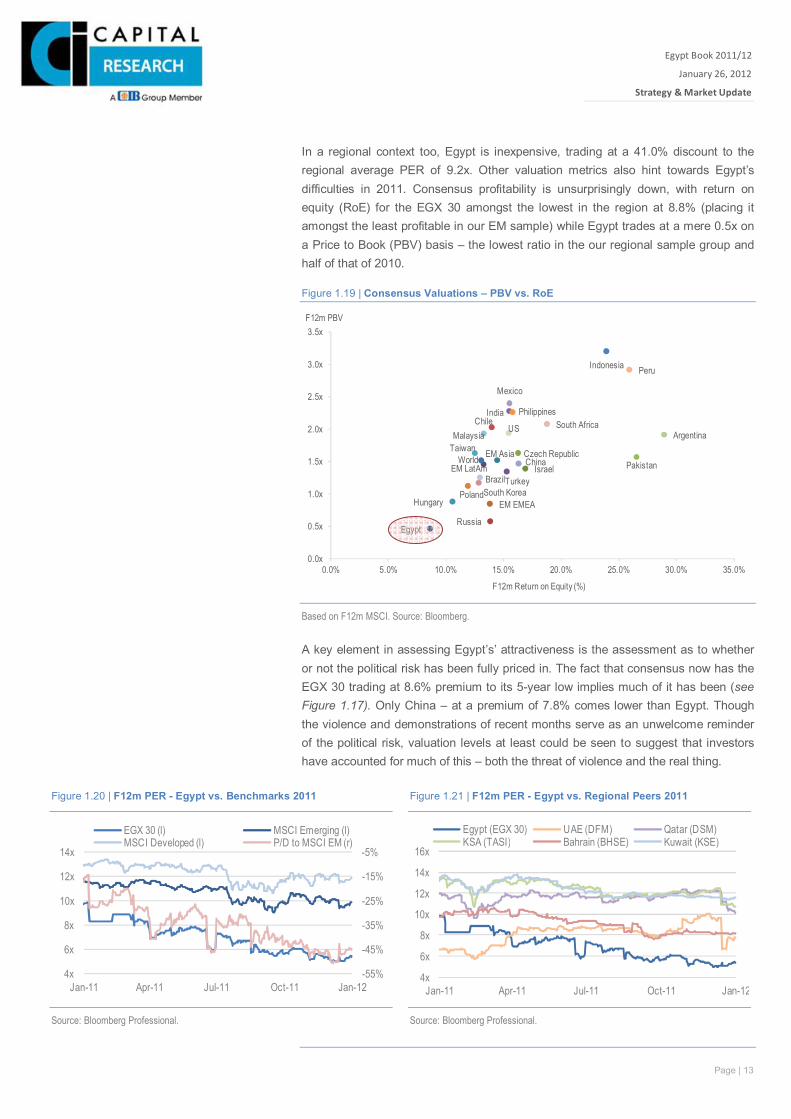
In a regional context too, Egypt is inexpensive, trading at a 41.0% discount to the regional average PER of 9.2x. Other valuation metrics also hint towards Egypt’s difficulties in 2011. Consensus profitability is unsurprisingly down, with return on equity (RoE) for the EGX 30 amongst the lowest in the region at 8.8% (placing it amongst the least profitable in our EM sample) while Egypt trades at a mere 0.5x on a Price to Book (PBV) basis – the lowest ratio in the our regional sample group and half of that of 2010.
Figure 1.19 | Consensus Valuations – PBV vs. RoE
Based on F12m MSCI. Source: Bloomberg. A key element in assessing Egypt’s’ attractiveness is the assessment as to whether or not the political risk has been fully priced in. The fact that consensus now has the EGX 30 trading at 8.6% premium to its 5-year low implies much of it has been (see Figure 1.17). Only China – at a premium of 7.8% comes lower than Egypt. Though the violence and demonstrations of recent months serve as an unwelcome reminder of the political risk, valuation levels at least could be seen to suggest that investors have accounted for much of this – both the threat of violence and the real thing.
Egypt
IsraelEM LatAmEM Asia
EM EMEA
World
Russia
Czech Republic
Turkey
HungaryPoland
Indonesia
Malaysia
Pakistan
Philippines
Taiwan
India
China
South Korea
Argentina
Mexico
Chile
Peru
Brazil
South AfricaUS
0.0x
0.5x
1.0x
1.5x
2.0x
2.5x
3.0x
3.5x
0.0% 5.0% 10.0% 15.0% 20.0% 25.0% 30.0% 35.0%
F12m PBV
F12m Return on Equity (%)
Figure 1.20 | F12m PER - Egypt vs. Benchmarks 2011 Figure 1.21 | F12m PER - Egypt vs. Regional Peers 2011
-55%
-45%
-35%
-25%
-15%
-5%
4x
6x
8x
10x
12x
14x
Jan-11 Apr-11 Jul-11 Oct-11 Jan-12
EGX 30 (l) MSCI Emerging (l)MSCI Developed (l) P/D to MSCI EM (r)
4x
6x
8x
10x
12x
14x
16x
Jan-11 Apr-11 Jul-11 Oct-11 Jan-12
Egypt (EGX 30) UAE (DFM) Qatar (DSM)KSA (TASI) Bahrain (BHSE) Kuwait (KSE)
Source: Bloomberg Professional. Source: Bloomberg Professional.
Page | 14
Egypt Book 2011/12
January 26, 2012
Strategy & Market Update
Xxx
Key Macro Themes 2012 1. Politics to continue to dictate market momentum. 2. Negative macro-economic picture to dampen
sentiment. 3. Tightening monetary policy. 4. Depreciating EGP raises FX risk & pressures
earnings. 5. Falling asset values & high unemployment dampens
spending. 6. Fiscal measures bear differing impact on earnings. 7. Weakening global economies to subdue inflationary
pressure, yet unrest will pose upside risk to inflation. 8. Increased liquidity could ease market strain and drive
commodities prices higher.
1. Politics to continue to dominate
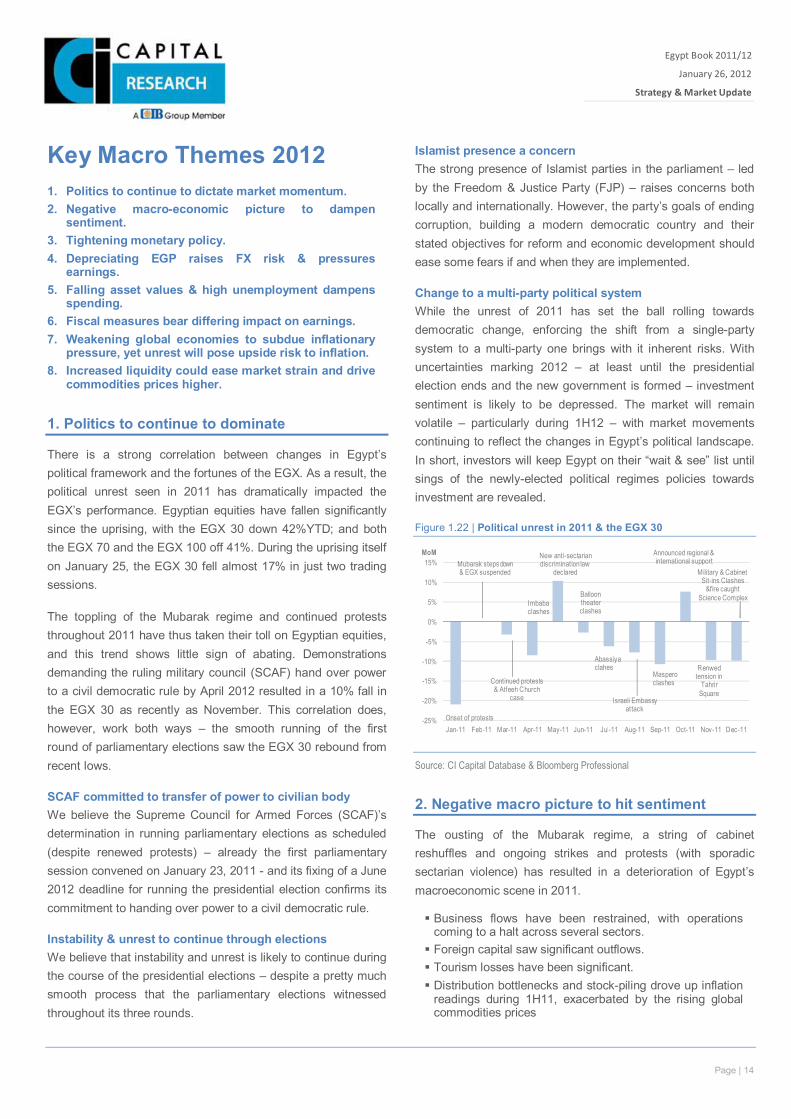
There is a strong correlation between changes in Egypt’s political framework and the fortunes of the EGX. As a result, the political unrest seen in 2011 has dramatically impacted the EGX’s performance. Egyptian equities have fallen significantly since the uprising, with the EGX 30 down 42%YTD; and both the EGX 70 and the EGX 100 off 41%. During the uprising itself on January 25, the EGX 30 fell almost 17% in just two trading sessions.
The toppling of the Mubarak regime and continued protests throughout 2011 have thus taken their toll on Egyptian equities, and this trend shows little sign of abating. Demonstrations demanding the ruling military council (SCAF) hand over power to a civil democratic rule by April 2012 resulted in a 10% fall in the EGX 30 as recently as November. This correlation does, however, work both ways – the smooth running of the first round of parliamentary elections saw the EGX 30 rebound from recent lows.
SCAF committed to transfer of power to civilian body We believe the Supreme Council for Armed Forces (SCAF)’s determination in running parliamentary elections as scheduled (despite renewed protests) – already the first parliamentary session convened on January 23, 2011 - and its fixing of a June 2012 deadline for running the presidential election confirms its commitment to handing over power to a civil democratic rule.
Instability & unrest to continue through elections We believe that instability and unrest is likely to continue during the course of the presidential elections – despite a pretty much smooth process that the parliamentary elections witnessed throughout its three rounds.
Islamist presence a concern The strong presence of Islamist parties in the parliament – led by the Freedom & Justice Party (FJP) – raises concerns both locally and internationally. However, the party’s goals of ending corruption, building a modern democratic country and their stated objectives for reform and economic development should ease some fears if and when they are implemented.
Change to a multi-party political system While the unrest of 2011 has set the ball rolling towards democratic change, enforcing the shift from a single-party system to a multi-party one brings with it inherent risks. With uncertainties marking 2012 – at least until the presidential election ends and the new government is formed – investment sentiment is likely to be depressed. The market will remain volatile – particularly during 1H12 – with market movements continuing to reflect the changes in Egypt’s political landscape. In short, investors will keep Egypt on their “wait & see” list until sings of the newly-elected political regimes policies towards investment are revealed.
Figure 1.22 | Political unrest in 2011 & the EGX 30
Source: CI Capital Database & Bloomberg Professional
2. Negative macro picture to hit sentiment
The ousting of the Mubarak regime, a string of cabinet reshuffles and ongoing strikes and protests (with sporadic sectarian violence) has resulted in a deterioration of Egypt’s macroeconomic scene in 2011.
Business flows have been restrained, with operations coming to a halt across several sectors. Foreign capital saw significant outflows. Tourism losses have been significant. Distribution bottlenecks and stock-piling drove up inflation
readings during 1H11, exacerbated by the rising global commodities prices
-25%
-20%
-15%
-10%
-5%
0%
5%
10%
15%
Jan-11 Feb-11 Mar-11 Apr-11 May-11 Jun-11 Jul-11 Aug-11 Sep-11 Oct-11 Nov-11 Dec-11
MoM
Onset of protests
Mubarak steps down & EGX suspended
Continued protests & Atfeeh Church
case
Imbaba clashes
New anti-sectarian discrimination law
declared
Balloontheater clashes
Abassiya clahes
Israeli Embassy attack
Maspero clashes
Announced regional & international support
Renwed tension in
Tahrir Square
Military & Cabinet Sit-ins Clashes
&fire caught Science Complex
Page | 15
Egypt Book 2011/12
January 26, 2012
Strategy & Market Update
Xxx
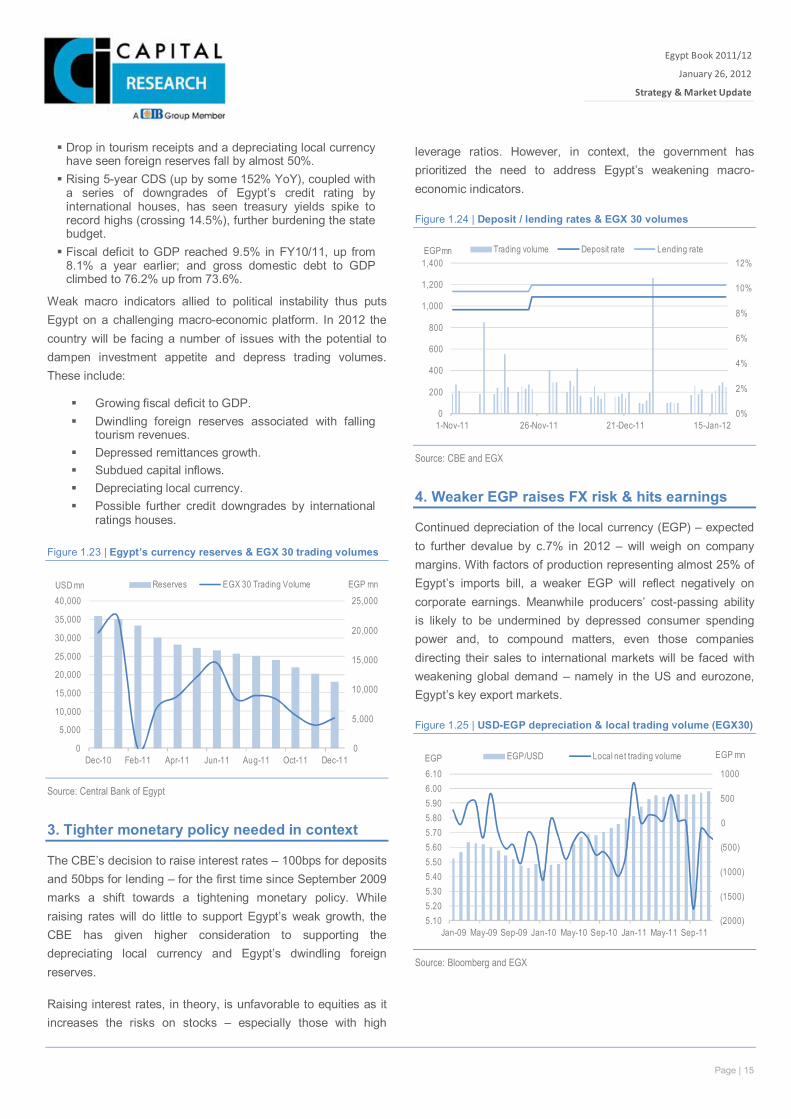
Drop in tourism receipts and a depreciating local currency have seen foreign reserves fall by almost 50%. Rising 5-year CDS (up by some 152% YoY), coupled with
a series of downgrades of Egypt’s credit rating by international houses, has seen treasury yields spike to record highs (crossing 14.5%), further burdening the state budget. Fiscal deficit to GDP reached 9.5% in FY10/11, up from
8.1% a year earlier; and gross domestic debt to GDP climbed to 76.2% up from 73.6%.
Weak macro indicators allied to political instability thus puts Egypt on a challenging macro-economic platform. In 2012 the country will be facing a number of issues with the potential to dampen investment appetite and depress trading volumes. These include:
Growing fiscal deficit to GDP. Dwindling foreign reserves associated with falling
tourism revenues. Depressed remittances growth. Subdued capital inflows. Depreciating local currency. Possible further credit downgrades by international
ratings houses.
Figure 1.23 | Egypt’s currency reserves & EGX 30 trading volumes
Source: Central Bank of Egypt
3. Tighter monetary policy needed in context
The CBE’s decision to raise interest rates – 100bps for deposits and 50bps for lending – for the first time since September 2009 marks a shift towards a tightening monetary policy. While raising rates will do little to support Egypt’s weak growth, the CBE has given higher consideration to supporting the depreciating local currency and Egypt’s dwindling foreign reserves.
Raising interest rates, in theory, is unfavorable to equities as it increases the risks on stocks – especially those with high
leverage ratios. However, in context, the government has prioritized the need to address Egypt’s weakening macro-economic indicators.
Figure 1.24 | Deposit / lending rates & EGX 30 volumes
Source: CBE and EGX
4. Weaker EGP raises FX risk & hits earnings
Continued depreciation of the local currency (EGP) – expected to further devalue by c.7% in 2012 – will weigh on company margins. With factors of production representing almost 25% of Egypt’s imports bill, a weaker EGP will reflect negatively on corporate earnings. Meanwhile producers’ cost-passing ability is likely to be undermined by depressed consumer spending power and, to compound matters, even those companies directing their sales to international markets will be faced with weakening global demand – namely in the US and eurozone, Egypt’s key export markets.
Figure 1.25 | USD-EGP depreciation & local trading volume (EGX30)
Source: Bloomberg and EGX
0
5,000
10,000
15,000
20,000
25,000
0
5,000
10,000
15,000
20,000
25,000
30,000
35,000
40,000
Dec-10 Feb-11 Apr-11 Jun-11 Aug-11 Oct-11 Dec-11
EGP mnUSD mn Reserves EGX 30 Trading Volume
0%
2%
4%
6%
8%
10%
12%
0
200
400
600
800
1,000
1,200
1,400
1-Nov-11 26-Nov-11 21-Dec-11 15-Jan-12
EGPmn Trading volume Deposit rate Lending rate
(2000)
(1500)
(1000)
(500)
0
500
1000
5.105.205.305.405.505.605.705.805.906.006.10
Jan-09 May-09 Sep-09 Jan-10 May-10 Sep-10 Jan-11 May-11 Sep-11
EGP mnEGP EGP/USD Local net trading volume
Page | 16
Egypt Book 2011/12
January 26, 2012
Strategy & Market Update
Xxx
Figure 1.26 | USD-EGP & aggregate earnings growth (CI Capital Research universe)
Source: CI Capital Research Database & Bloomberg
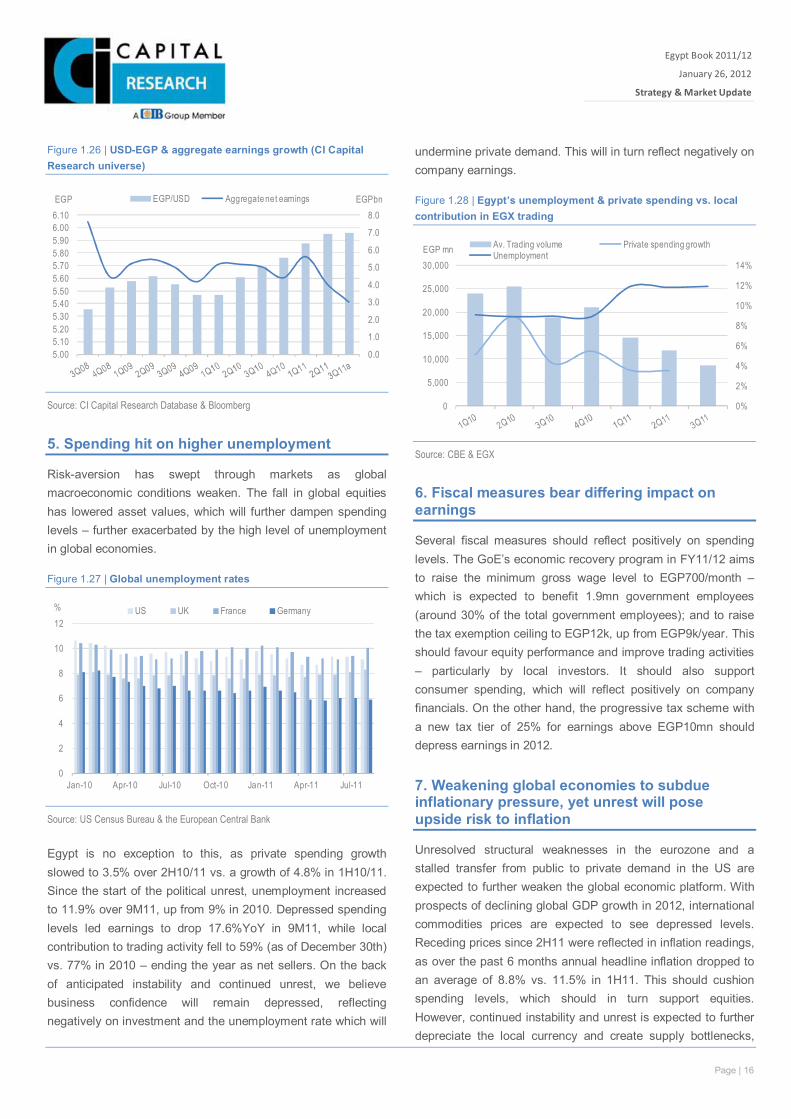
5. Spending hit on higher unemployment
Risk-aversion has swept through markets as global macroeconomic conditions weaken. The fall in global equities has lowered asset values, which will further dampen spending levels – further exacerbated by the high level of unemployment in global economies.
Figure 1.27 | Global unemployment rates
Source: US Census Bureau & the European Central Bank
Egypt is no exception to this, as private spending growth slowed to 3.5% over 2H10/11 vs. a growth of 4.8% in 1H10/11. Since the start of the political unrest, unemployment increased to 11.9% over 9M11, up from 9% in 2010. Depressed spending levels led earnings to drop 17.6%YoY in 9M11, while local contribution to trading activity fell to 59% (as of December 30th) vs. 77% in 2010 – ending the year as net sellers. On the back of anticipated instability and continued unrest, we believe business confidence will remain depressed, reflecting negatively on investment and the unemployment rate which will
undermine private demand. This will in turn reflect negatively on company earnings.
Figure 1.28 | Egypt’s unemployment & private spending vs. local contribution in EGX trading
Source: CBE & EGX
6. Fiscal measures bear differing impact on earnings
Several fiscal measures should reflect positively on spending levels. The GoE’s economic recovery program in FY11/12 aims to raise the minimum gross wage level to EGP700/month – which is expected to benefit 1.9mn government employees (around 30% of the total government employees); and to raise the tax exemption ceiling to EGP12k, up from EGP9k/year. This should favour equity performance and improve trading activities – particularly by local investors. It should also support consumer spending, which will reflect positively on company financials. On the other hand, the progressive tax scheme with a new tax tier of 25% for earnings above EGP10mn should depress earnings in 2012.
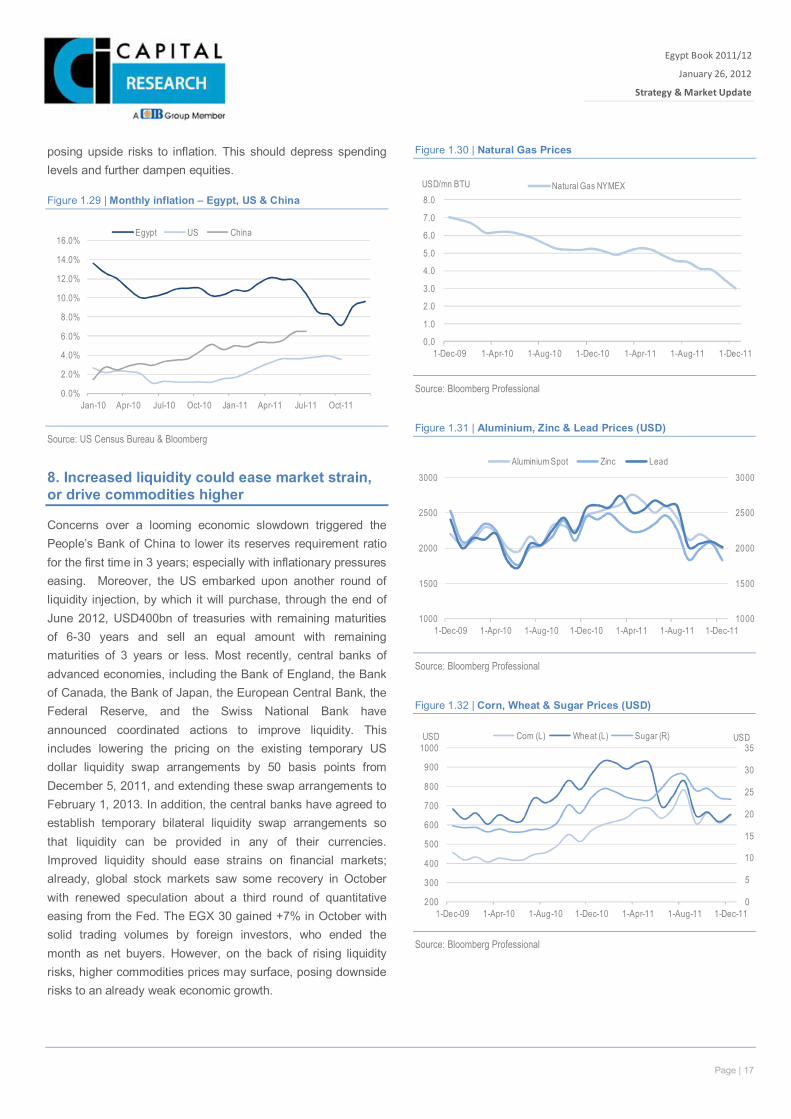
7. Weakening global economies to subdue inflationary pressure, yet unrest will pose upside risk to inflation
Unresolved structural weaknesses in the eurozone and a stalled transfer from public to private demand in the US are expected to further weaken the global economic platform. With prospects of declining global GDP growth in 2012, international commodities prices are expected to see depressed levels. Receding prices since 2H11 were reflected in inflation readings, as over the past 6 months annual headline inflation dropped to an average of 8.8% vs. 11.5% in 1H11. This should cushion spending levels, which should in turn support equities. However, continued instability and unrest is expected to further depreciate the local currency and create supply bottlenecks,
0.0
1.0
2.0
3.0
4.0
5.0
6.0
7.0
8.0
5.005.105.205.305.405.505.605.705.805.906.006.10
EGPbnEGP EGP/USD Aggregate net earnings
0
2
4
6
8
10
12
Jan-10 Apr-10 Jul-10 Oct-10 Jan-11 Apr-11 Jul-11
% US UK France Germany
0%
2%
4%
6%
8%
10%
12%
14%
0
5,000
10,000
15,000
20,000
25,000
30,000EGP mn Av. Trading volume Private spending growth
Unemployment
Page | 17
Egypt Book 2011/12
January 26, 2012
Strategy & Market Update
Xxx
posing upside risks to inflation. This should depress spending levels and further dampen equities.
Figure 1.29 | Monthly inflation – Egypt, US & China
Source: US Census Bureau & Bloomberg
8. Increased liquidity could ease market strain, or drive commodities higher
Concerns over a looming economic slowdown triggered the People’s Bank of China to lower its reserves requirement ratio for the first time in 3 years; especially with inflationary pressures easing. Moreover, the US embarked upon another round of liquidity injection, by which it will purchase, through the end of June 2012, USD400bn of treasuries with remaining maturities of 6-30 years and sell an equal amount with remaining maturities of 3 years or less. Most recently, central banks of advanced economies, including the Bank of England, the Bank of Canada, the Bank of Japan, the European Central Bank, the Federal Reserve, and the Swiss National Bank have announced coordinated actions to improve liquidity. This includes lowering the pricing on the existing temporary US dollar liquidity swap arrangements by 50 basis points from December 5, 2011, and extending these swap arrangements to February 1, 2013. In addition, the central banks have agreed to establish temporary bilateral liquidity swap arrangements so that liquidity can be provided in any of their currencies. Improved liquidity should ease strains on financial markets; already, global stock markets saw some recovery in October with renewed speculation about a third round of quantitative easing from the Fed. The EGX 30 gained +7% in October with solid trading volumes by foreign investors, who ended the month as net buyers. However, on the back of rising liquidity risks, higher commodities prices may surface, posing downside risks to an already weak economic growth.
Figure 1.30 | Natural Gas Prices
Source: Bloomberg Professional
Figure 1.31 | Aluminium, Zinc & Lead Prices (USD)
Source: Bloomberg Professional
Figure 1.32 | Corn, Wheat & Sugar Prices (USD)
Source: Bloomberg Professional
0.0%
2.0%
4.0%
6.0%
8.0%
10.0%
12.0%
14.0%
16.0%
Jan-10 Apr-10 Jul-10 Oct-10 Jan-11 Apr-11 Jul-11 Oct-11
Egypt US China
0.0
1.0
2.0
3.0
4.0
5.0
6.0
7.0
8.0
1-Dec-09 1-Apr-10 1-Aug-10 1-Dec-10 1-Apr-11 1-Aug-11 1-Dec-11
USD/mn BTU Natural Gas NYMEX
1000
1500
2000
2500
3000
1000
1500
2000
2500
3000
1-Dec-09 1-Apr-10 1-Aug-10 1-Dec-10 1-Apr-11 1-Aug-11 1-Dec-11
Aluminium Spot Zinc Lead
0
5
10
15
20
25
30
35
200
300
400
500
600
700
800
900
1000
1-Dec-09 1-Apr-10 1-Aug-10 1-Dec-10 1-Apr-11 1-Aug-11 1-Dec-11
USDUSD Corn (L) Wheat (L) Sugar (R)
Page | 18
Egypt Book 2011/12
January 26, 2012
Strategy & Market Update
Xxx
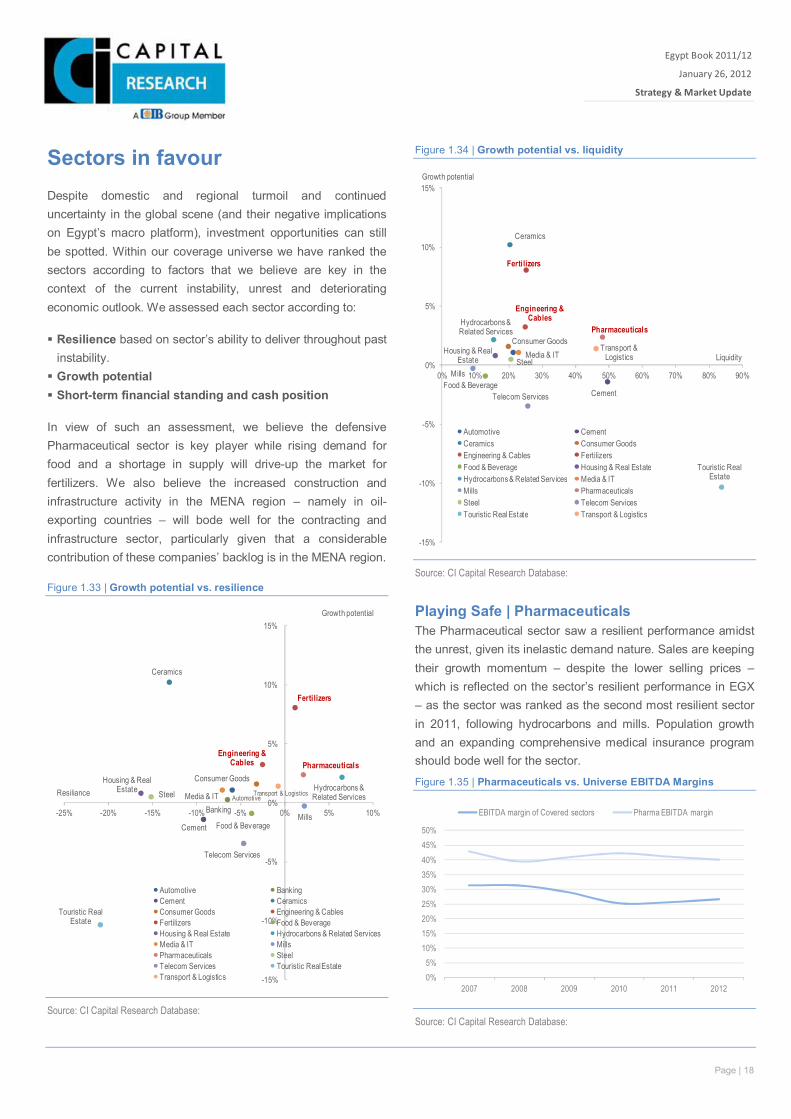
Sectors in favour Despite domestic and regional turmoil and continued uncertainty in the global scene (and their negative implications on Egypt’s macro platform), investment opportunities can still be spotted. Within our coverage universe we have ranked the sectors according to factors that we believe are key in the context of the current instability, unrest and deteriorating economic outlook. We assessed each sector according to:
Resilience based on sector’s ability to deliver throughout past instability. Growth potential Short-term financial standing and cash position
In view of such an assessment, we believe the defensive Pharmaceutical sector is key player while rising demand for food and a shortage in supply will drive-up the market for fertilizers. We also believe the increased construction and infrastructure activity in the MENA region – namely in oil-exporting countries – will bode well for the contracting and infrastructure sector, particularly given that a considerable contribution of these companies’ backlog is in the MENA region.
Figure 1.33 | Growth potential vs. resilience
Source: CI Capital Research Database:
Figure 1.34 | Growth potential vs. liquidity
Source: CI Capital Research Database:
Playing Safe | Pharmaceuticals The Pharmaceutical sector saw a resilient performance amidst the unrest, given its inelastic demand nature. Sales are keeping their growth momentum – despite the lower selling prices – which is reflected on the sector’s resilient performance in EGX – as the sector was ranked as the second most resilient sector in 2011, following hydrocarbons and mills. Population growth and an expanding comprehensive medical insurance program should bode well for the sector.
Figure 1.35 | Pharmaceuticals vs. Universe EBITDA Margins
Source: CI Capital Research Database:
Automotive
Banking
Cement
Ceramics
Consumer Goods
Engineering & Cables
Fertilizers
Food & Beverage
Housing & Real Estate Hydrocarbons &
Related ServicesMedia & IT
Mills
Pharmaceuticals
Steel
Telecom Services
Touristic Real Estate
Transport & Logistics
-15%
-10%
-5%
0%
5%
10%
15%
-25% -20% -15% -10% -5% 0% 5% 10%
Growth potential
Resiliance
Automotive BankingCement CeramicsConsumer Goods Engineering & CablesFertilizers Food & BeverageHousing & Real Estate Hydrocarbons & Related ServicesMedia & IT MillsPharmaceuticals SteelTelecom Services Touristic Real EstateTransport & Logistics
Cement
Ceramics
Consumer Goods
Engineering & Cables
Fertilizers
Food & Beverage
Housing & Real Estate
Hydrocarbons & Related Services
Media & IT
Mills
Pharmaceuticals
Steel
Telecom Services
Touristic Real Estate
Transport & Logistics
-15%
-10%
-5%
0%
5%
10%
15%
0% 10% 20% 30% 40% 50% 60% 70% 80% 90%
Growth potential
Liquidity
Automotive CementCeramics Consumer GoodsEngineering & Cables FertilizersFood & Beverage Housing & Real EstateHydrocarbons & Related Services Media & ITMills PharmaceuticalsSteel Telecom ServicesTouristic Real Estate Transport & Logistics
0%5%
10%15%20%25%30%35%40%45%50%
2007 2008 2009 2010 2011 2012
EBITDA margin of Covered sectors Pharma EBITDA margin
Page | 19
Egypt Book 2011/12
January 26, 2012
Strategy & Market Update
Xxx
Despite pressured earnings given a depreciated local currency, and the newly imposed higher effective tax rate of 25%, the sector will maintain its positive growth in 2012. Adding to this is the sector’s strong cash position, its low risk, and higher EBITDA margin vs. the average margins of CI Capital Research universe.
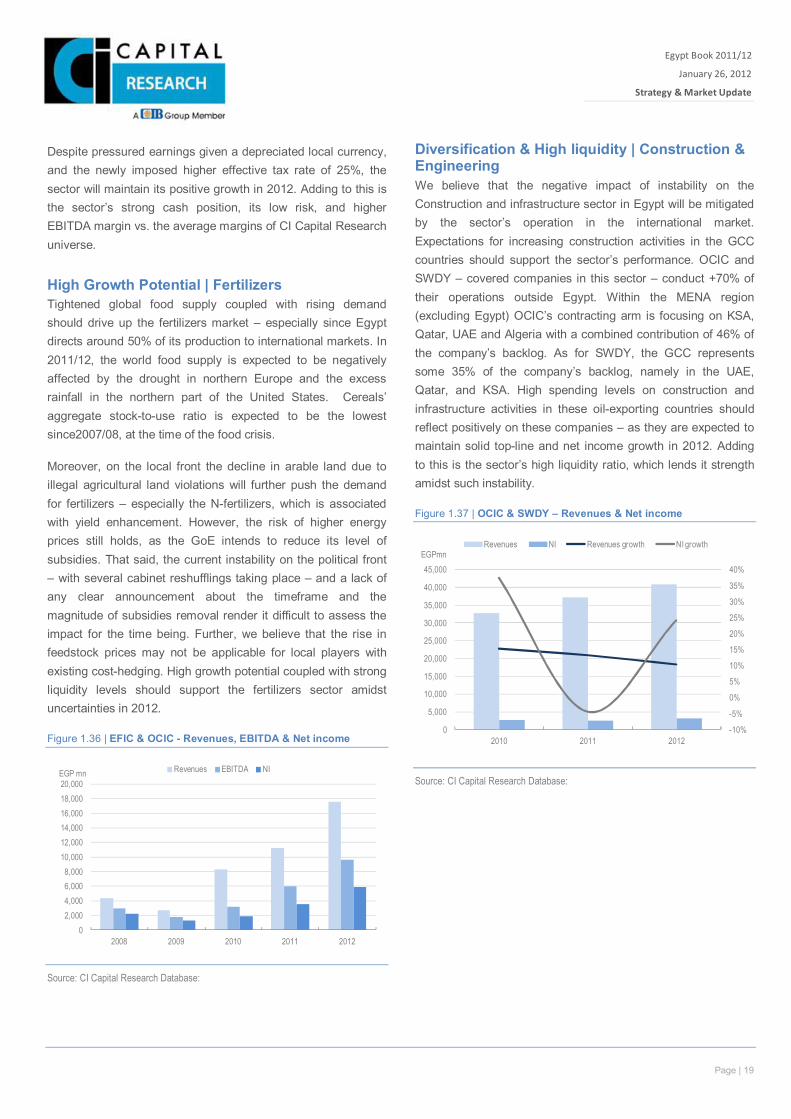
High Growth Potential | Fertilizers Tightened global food supply coupled with rising demand should drive up the fertilizers market – especially since Egypt directs around 50% of its production to international markets. In 2011/12, the world food supply is expected to be negatively affected by the drought in northern Europe and the excess rainfall in the northern part of the United States. Cereals’ aggregate stock-to-use ratio is expected to be the lowest since2007/08, at the time of the food crisis.
Moreover, on the local front the decline in arable land due to illegal agricultural land violations will further push the demand for fertilizers – especially the N-fertilizers, which is associated with yield enhancement. However, the risk of higher energy prices still holds, as the GoE intends to reduce its level of subsidies. That said, the current instability on the political front – with several cabinet reshufflings taking place – and a lack of any clear announcement about the timeframe and the magnitude of subsidies removal render it difficult to assess the impact for the time being. Further, we believe that the rise in feedstock prices may not be applicable for local players with existing cost-hedging. High growth potential coupled with strong liquidity levels should support the fertilizers sector amidst uncertainties in 2012.
Figure 1.36 | EFIC & OCIC - Revenues, EBITDA & Net income
Source: CI Capital Research Database:
Diversification & High liquidity | Construction & Engineering We believe that the negative impact of instability on the Construction and infrastructure sector in Egypt will be mitigated by the sector’s operation in the international market. Expectations for increasing construction activities in the GCC countries should support the sector’s performance. OCIC and SWDY – covered companies in this sector – conduct +70% of their operations outside Egypt. Within the MENA region (excluding Egypt) OCIC’s contracting arm is focusing on KSA, Qatar, UAE and Algeria with a combined contribution of 46% of the company’s backlog. As for SWDY, the GCC represents some 35% of the company’s backlog, namely in the UAE, Qatar, and KSA. High spending levels on construction and infrastructure activities in these oil-exporting countries should reflect positively on these companies – as they are expected to maintain solid top-line and net income growth in 2012. Adding to this is the sector’s high liquidity ratio, which lends it strength amidst such instability.
Figure 1.37 | OCIC & SWDY – Revenues & Net income
Source: CI Capital Research Database:
02,0004,0006,0008,000
10,00012,00014,00016,00018,00020,000
2008 2009 2010 2011 2012
EGP mn Revenues EBITDA NI
-10%
-5%
0%
5%
10%
15%
20%
25%
30%
35%
40%
0
5,000
10,000
15,000
20,000
25,000
30,000
35,000
40,000
45,000
2010 2011 2012
EGPmnRevenues NI Revenues growth NI growth
Page | 20
Page | 20
Egypt Book 2011/12
January 26, 2012
Strategy & Market Update
Xxx
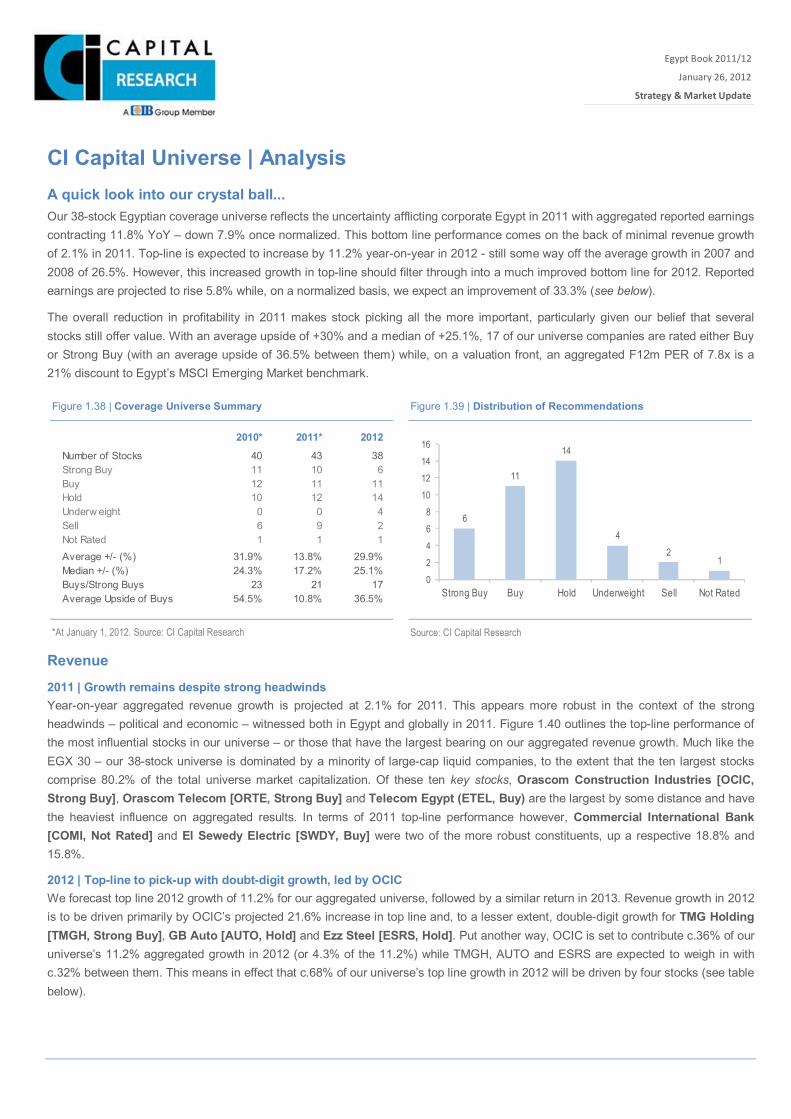
CI Capital Universe | Analysis A quick look into our crystal ball... Our 38-stock Egyptian coverage universe reflects the uncertainty afflicting corporate Egypt in 2011 with aggregated reported earnings contracting 11.8% YoY – down 7.9% once normalized. This bottom line performance comes on the back of minimal revenue growth of 2.1% in 2011. Top-line is expected to increase by 11.2% year-on-year in 2012 - still some way off the average growth in 2007 and 2008 of 26.5%. However, this increased growth in top-line should filter through into a much improved bottom line for 2012. Reported earnings are projected to rise 5.8% while, on a normalized basis, we expect an improvement of 33.3% (see below).
The overall reduction in profitability in 2011 makes stock picking all the more important, particularly given our belief that several stocks still offer value. With an average upside of +30% and a median of +25.1%, 17 of our universe companies are rated either Buy or Strong Buy (with an average upside of 36.5% between them) while, on a valuation front, an aggregated F12m PER of 7.8x is a 21% discount to Egypt’s MSCI Emerging Market benchmark.
Revenue
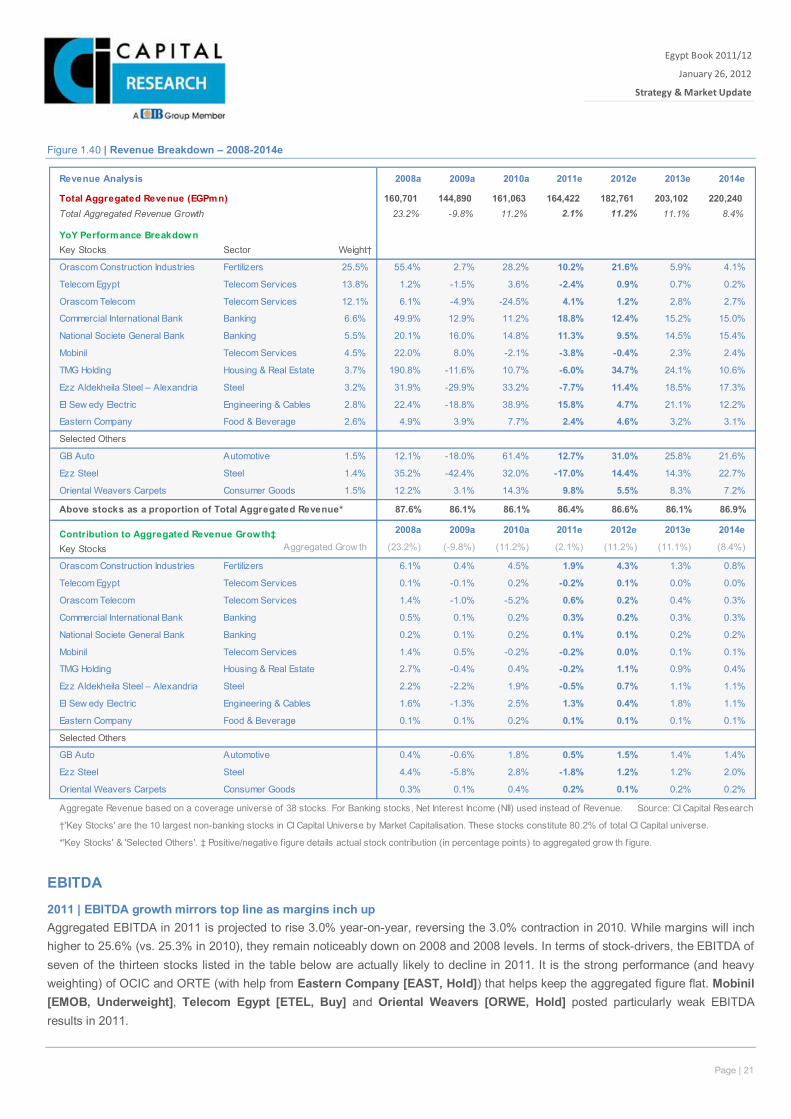
2011 | Growth remains despite strong headwinds Year-on-year aggregated revenue growth is projected at 2.1% for 2011. This appears more robust in the context of the strong headwinds – political and economic – witnessed both in Egypt and globally in 2011. Figure 1.40 outlines the top-line performance of the most influential stocks in our universe – or those that have the largest bearing on our aggregated revenue growth. Much like the EGX 30 – our 38-stock universe is dominated by a minority of large-cap liquid companies, to the extent that the ten largest stocks comprise 80.2% of the total universe market capitalization. Of these ten key stocks, Orascom Construction Industries [OCIC, Strong Buy], Orascom Telecom [ORTE, Strong Buy] and Telecom Egypt (ETEL, Buy) are the largest by some distance and have the heaviest influence on aggregated results. In terms of 2011 top-line performance however, Commercial International Bank [COMI, Not Rated] and El Sewedy Electric [SWDY, Buy] were two of the more robust constituents, up a respective 18.8% and 15.8%.
2012 | Top-line to pick-up with doubt-digit growth, led by OCIC We forecast top line 2012 growth of 11.2% for our aggregated universe, followed by a similar return in 2013. Revenue growth in 2012 is to be driven primarily by OCIC’s projected 21.6% increase in top line and, to a lesser extent, double-digit growth for TMG Holding [TMGH, Strong Buy], GB Auto [AUTO, Hold] and Ezz Steel [ESRS, Hold]. Put another way, OCIC is set to contribute c.36% of our universe’s 11.2% aggregated growth in 2012 (or 4.3% of the 11.2%) while TMGH, AUTO and ESRS are expected to weigh in with c.32% between them. This means in effect that c.68% of our universe’s top line growth in 2012 will be driven by four stocks (see table below).
*At January 1, 2012. Source: CI Capital Research Source: CI Capital Research
Figure 1.38 | Coverage Universe Summary Figure 1.39 | Distribution of Recommendations
2010* 2011* 2012
Number of Stocks 40 43 38Strong Buy 11 10 6Buy 12 11 11Hold 10 12 14Underw eight 0 0 4Sell 6 9 2Not Rated 1 1 1Average +/- (%) 31.9% 13.8% 29.9%Median +/- (%) 24.3% 17.2% 25.1%Buys/Strong Buys 23 21 17Average Upside of Buys 54.5% 10.8% 36.5%
6
11
14
42
1
02468
10121416
Strong Buy Buy Hold Underweight Sell Not Rated
Page | 21
Egypt Book 2011/12
January 26, 2012
Strategy & Market Update
Xxx
Figure 1.40 | Revenue Breakdown – 2008-2014e
EBITDA
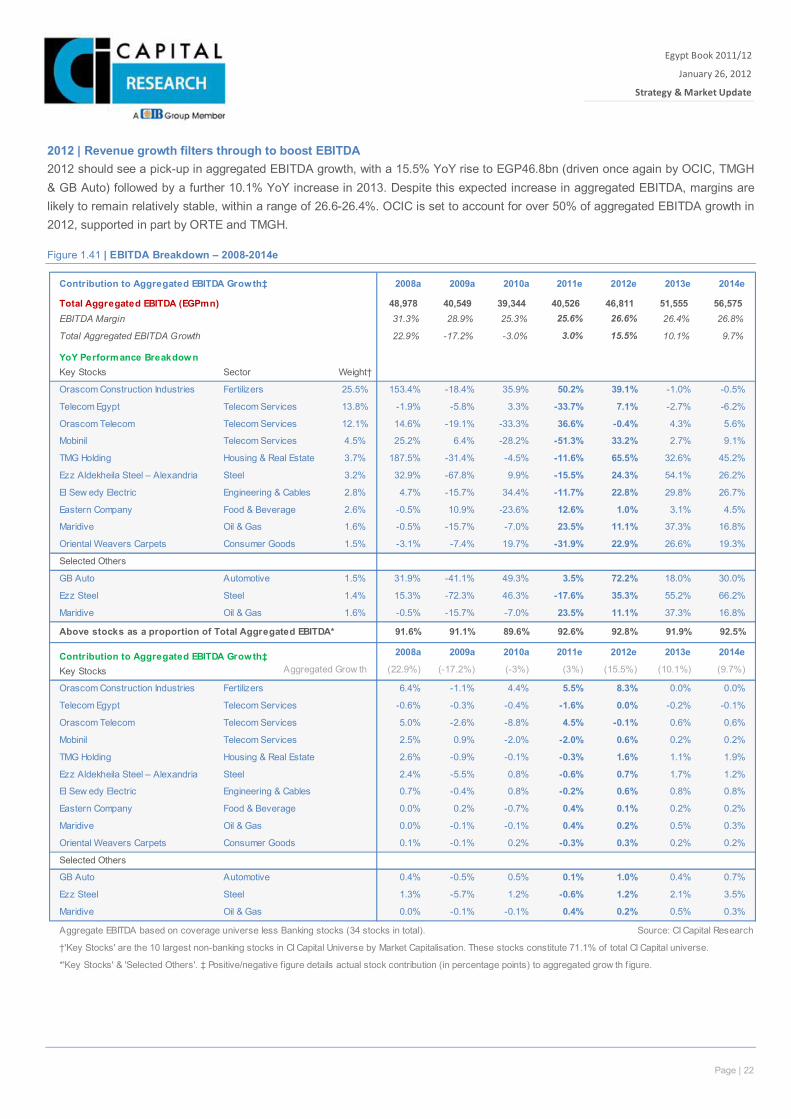
2011 | EBITDA growth mirrors top line as margins inch up Aggregated EBITDA in 2011 is projected to rise 3.0% year-on-year, reversing the 3.0% contraction in 2010. While margins will inch higher to 25.6% (vs. 25.3% in 2010), they remain noticeably down on 2008 and 2008 levels. In terms of stock-drivers, the EBITDA of seven of the thirteen stocks listed in the table below are actually likely to decline in 2011. It is the strong performance (and heavy weighting) of OCIC and ORTE (with help from Eastern Company [EAST, Hold]) that helps keep the aggregated figure flat. Mobinil [EMOB, Underweight], Telecom Egypt [ETEL, Buy] and Oriental Weavers [ORWE, Hold] posted particularly weak EBITDA results in 2011.
Revenue Analysis 2008a 2009a 2010a 2011e 2012e 2013e 2014e
Total Aggregated Revenue (EGPmn) 160,701 144,890 161,063 164,422 182,761 203,102 220,240Total Aggregated Revenue Growth 23.2% -9.8% 11.2% 2.1% 11.2% 11.1% 8.4%
YoY Performance BreakdownKey Stocks Sector Weight†
Orascom Construction Industries Fertilizers 25.5% 55.4% 2.7% 28.2% 10.2% 21.6% 5.9% 4.1%
Telecom Egypt Telecom Services 13.8% 1.2% -1.5% 3.6% -2.4% 0.9% 0.7% 0.2%
Orascom Telecom Telecom Services 12.1% 6.1% -4.9% -24.5% 4.1% 1.2% 2.8% 2.7%
Commercial International Bank Banking 6.6% 49.9% 12.9% 11.2% 18.8% 12.4% 15.2% 15.0%
National Societe General Bank Banking 5.5% 20.1% 16.0% 14.8% 11.3% 9.5% 14.5% 15.4%
Mobinil Telecom Services 4.5% 22.0% 8.0% -2.1% -3.8% -0.4% 2.3% 2.4%
TMG Holding Housing & Real Estate 3.7% 190.8% -11.6% 10.7% -6.0% 34.7% 24.1% 10.6%
Ezz Aldekheila Steel – Alexandria Steel 3.2% 31.9% -29.9% 33.2% -7.7% 11.4% 18.5% 17.3%
El Sew edy Electric Engineering & Cables 2.8% 22.4% -18.8% 38.9% 15.8% 4.7% 21.1% 12.2%
Eastern Company Food & Beverage 2.6% 4.9% 3.9% 7.7% 2.4% 4.6% 3.2% 3.1%
Selected Others
GB Auto Automotive 1.5% 12.1% -18.0% 61.4% 12.7% 31.0% 25.8% 21.6%
Ezz Steel Steel 1.4% 35.2% -42.4% 32.0% -17.0% 14.4% 14.3% 22.7%
Oriental Weavers Carpets Consumer Goods 1.5% 12.2% 3.1% 14.3% 9.8% 5.5% 8.3% 7.2%
Above stocks as a proportion of Total Aggregated Revenue* 87.6% 86.1% 86.1% 86.4% 86.6% 86.1% 86.9%
Contribution to Aggregated Revenue Growth‡ 2008a 2009a 2010a 2011e 2012e 2013e 2014e
Key Stocks Aggregated Grow th (23.2%) (-9.8%) (11.2%) (2.1%) (11.2%) (11.1%) (8.4%)
Orascom Construction Industries Fertilizers 6.1% 0.4% 4.5% 1.9% 4.3% 1.3% 0.8%
Telecom Egypt Telecom Services 0.1% -0.1% 0.2% -0.2% 0.1% 0.0% 0.0%
Orascom Telecom Telecom Services 1.4% -1.0% -5.2% 0.6% 0.2% 0.4% 0.3%
Commercial International Bank Banking 0.5% 0.1% 0.2% 0.3% 0.2% 0.3% 0.3%
National Societe General Bank Banking 0.2% 0.1% 0.2% 0.1% 0.1% 0.2% 0.2%
Mobinil Telecom Services 1.4% 0.5% -0.2% -0.2% 0.0% 0.1% 0.1%
TMG Holding Housing & Real Estate 2.7% -0.4% 0.4% -0.2% 1.1% 0.9% 0.4%
Ezz Aldekheila Steel – Alexandria Steel 2.2% -2.2% 1.9% -0.5% 0.7% 1.1% 1.1%
El Sew edy Electric Engineering & Cables 1.6% -1.3% 2.5% 1.3% 0.4% 1.8% 1.1%
Eastern Company Food & Beverage 0.1% 0.1% 0.2% 0.1% 0.1% 0.1% 0.1%
Selected Others
GB Auto Automotive 0.4% -0.6% 1.8% 0.5% 1.5% 1.4% 1.4%
Ezz Steel Steel 4.4% -5.8% 2.8% -1.8% 1.2% 1.2% 2.0%
Oriental Weavers Carpets Consumer Goods 0.3% 0.1% 0.4% 0.2% 0.1% 0.2% 0.2%
Aggregate Revenue based on a coverage universe of 38 stocks. For Banking stocks, Net Interest Income (NII) used instead of Revenue. Source: CI Capital Research
†'Key Stocks' are the 10 largest non-banking stocks in CI Capital Universe by Market Capitalisation. These stocks constitute 80.2% of total CI Capital universe.
*'Key Stocks' & 'Selected Others'. ‡ Positive/negative figure details actual stock contribution (in percentage points) to aggregated grow th f igure.
Page | 22
Egypt Book 2011/12
January 26, 2012
Strategy & Market Update
Xxx
2012 | Revenue growth filters through to boost EBITDA 2012 should see a pick-up in aggregated EBITDA growth, with a 15.5% YoY rise to EGP46.8bn (driven once again by OCIC, TMGH & GB Auto) followed by a further 10.1% YoY increase in 2013. Despite this expected increase in aggregated EBITDA, margins are likely to remain relatively stable, within a range of 26.6-26.4%. OCIC is set to account for over 50% of aggregated EBITDA growth in 2012, supported in part by ORTE and TMGH.
Figure 1.41 | EBITDA Breakdown – 2008-2014e
Contribution to Aggregated EBITDA Growth‡ 2008a 2009a 2010a 2011e 2012e 2013e 2014e
Total Aggregated EBITDA (EGPmn) 48,978 40,549 39,344 40,526 46,811 51,555 56,575EBITDA Margin 31.3% 28.9% 25.3% 25.6% 26.6% 26.4% 26.8%
Total Aggregated EBITDA Growth 22.9% -17.2% -3.0% 3.0% 15.5% 10.1% 9.7%
YoY Performance BreakdownKey Stocks Sector Weight†
Orascom Construction Industries Fertilizers 25.5% 153.4% -18.4% 35.9% 50.2% 39.1% -1.0% -0.5%
Telecom Egypt Telecom Services 13.8% -1.9% -5.8% 3.3% -33.7% 7.1% -2.7% -6.2%
Orascom Telecom Telecom Services 12.1% 14.6% -19.1% -33.3% 36.6% -0.4% 4.3% 5.6%
Mobinil Telecom Services 4.5% 25.2% 6.4% -28.2% -51.3% 33.2% 2.7% 9.1%
TMG Holding Housing & Real Estate 3.7% 187.5% -31.4% -4.5% -11.6% 65.5% 32.6% 45.2%
Ezz Aldekheila Steel – Alexandria Steel 3.2% 32.9% -67.8% 9.9% -15.5% 24.3% 54.1% 26.2%
El Sew edy Electric Engineering & Cables 2.8% 4.7% -15.7% 34.4% -11.7% 22.8% 29.8% 26.7%
Eastern Company Food & Beverage 2.6% -0.5% 10.9% -23.6% 12.6% 1.0% 3.1% 4.5%
Maridive Oil & Gas 1.6% -0.5% -15.7% -7.0% 23.5% 11.1% 37.3% 16.8%
Oriental Weavers Carpets Consumer Goods 1.5% -3.1% -7.4% 19.7% -31.9% 22.9% 26.6% 19.3%
Selected Others
GB Auto Automotive 1.5% 31.9% -41.1% 49.3% 3.5% 72.2% 18.0% 30.0%
Ezz Steel Steel 1.4% 15.3% -72.3% 46.3% -17.6% 35.3% 55.2% 66.2%
Maridive Oil & Gas 1.6% -0.5% -15.7% -7.0% 23.5% 11.1% 37.3% 16.8%
Above stocks as a proportion of Total Aggregated EBITDA* 91.6% 91.1% 89.6% 92.6% 92.8% 91.9% 92.5%
Contribution to Aggregated EBITDA Growth‡ 2008a 2009a 2010a 2011e 2012e 2013e 2014e
Key Stocks Aggregated Grow th (22.9%) (-17.2%) (-3%) (3%) (15.5%) (10.1%) (9.7%)
Orascom Construction Industries Fertilizers 6.4% -1.1% 4.4% 5.5% 8.3% 0.0% 0.0%
Telecom Egypt Telecom Services -0.6% -0.3% -0.4% -1.6% 0.0% -0.2% -0.1%
Orascom Telecom Telecom Services 5.0% -2.6% -8.8% 4.5% -0.1% 0.6% 0.6%
Mobinil Telecom Services 2.5% 0.9% -2.0% -2.0% 0.6% 0.2% 0.2%
TMG Holding Housing & Real Estate 2.6% -0.9% -0.1% -0.3% 1.6% 1.1% 1.9%
Ezz Aldekheila Steel – Alexandria Steel 2.4% -5.5% 0.8% -0.6% 0.7% 1.7% 1.2%
El Sew edy Electric Engineering & Cables 0.7% -0.4% 0.8% -0.2% 0.6% 0.8% 0.8%
Eastern Company Food & Beverage 0.0% 0.2% -0.7% 0.4% 0.1% 0.2% 0.2%
Maridive Oil & Gas 0.0% -0.1% -0.1% 0.4% 0.2% 0.5% 0.3%
Oriental Weavers Carpets Consumer Goods 0.1% -0.1% 0.2% -0.3% 0.3% 0.2% 0.2%
Selected Others
GB Auto Automotive 0.4% -0.5% 0.5% 0.1% 1.0% 0.4% 0.7%
Ezz Steel Steel 1.3% -5.7% 1.2% -0.6% 1.2% 2.1% 3.5%
Maridive Oil & Gas 0.0% -0.1% -0.1% 0.4% 0.2% 0.5% 0.3%
Aggregate EBITDA based on coverage universe less Banking stocks (34 stocks in total). Source: CI Capital Research
†'Key Stocks' are the 10 largest non-banking stocks in CI Capital Universe by Market Capitalisation. These stocks constitute 71.1% of total CI Capital universe.
*'Key Stocks' & 'Selected Others'. ‡ Positive/negative figure details actual stock contribution (in percentage points) to aggregated grow th f igure.
Page | 23
Egypt Book 2011/12
January 26, 2012
Strategy & Market Update
Xxx
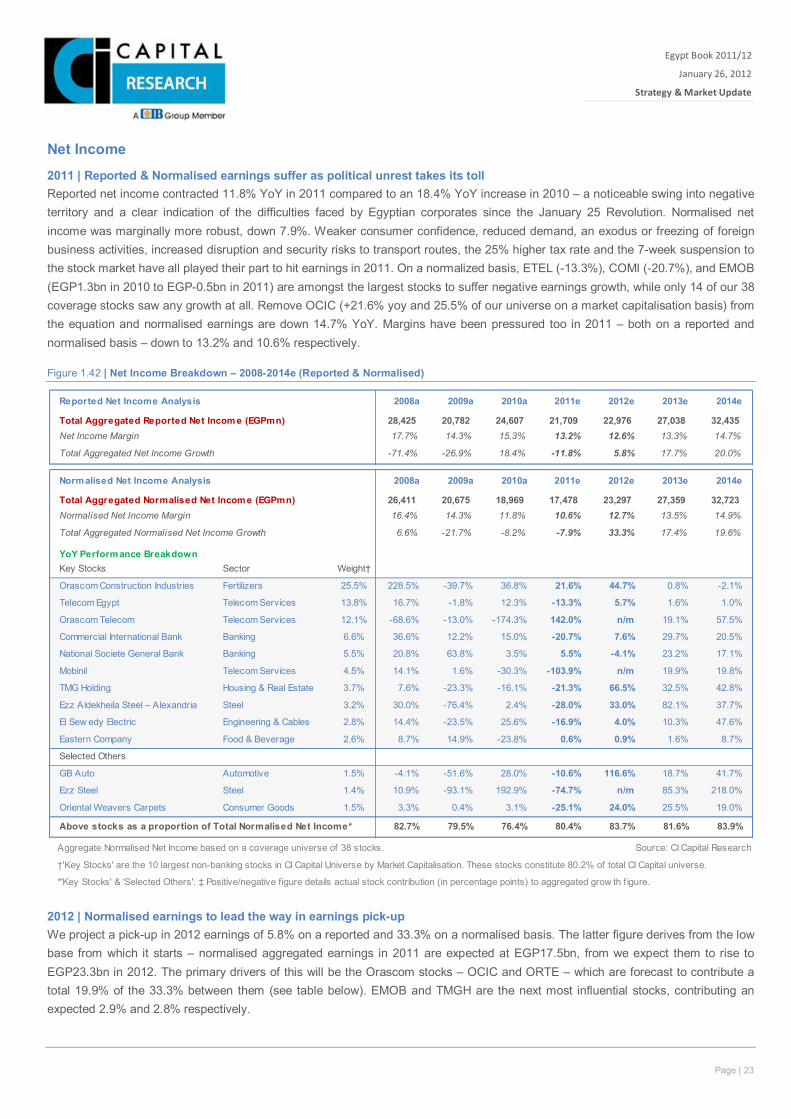
Net Income 2011 | Reported & Normalised earnings suffer as political unrest takes its toll Reported net income contracted 11.8% YoY in 2011 compared to an 18.4% YoY increase in 2010 – a noticeable swing into negative territory and a clear indication of the difficulties faced by Egyptian corporates since the January 25 Revolution. Normalised net income was marginally more robust, down 7.9%. Weaker consumer confidence, reduced demand, an exodus or freezing of foreign business activities, increased disruption and security risks to transport routes, the 25% higher tax rate and the 7-week suspension to the stock market have all played their part to hit earnings in 2011. On a normalized basis, ETEL (-13.3%), COMI (-20.7%), and EMOB (EGP1.3bn in 2010 to EGP-0.5bn in 2011) are amongst the largest stocks to suffer negative earnings growth, while only 14 of our 38 coverage stocks saw any growth at all. Remove OCIC (+21.6% yoy and 25.5% of our universe on a market capitalisation basis) from the equation and normalised earnings are down 14.7% YoY. Margins have been pressured too in 2011 – both on a reported and normalised basis – down to 13.2% and 10.6% respectively.
Figure 1.42 | Net Income Breakdown – 2008-2014e (Reported & Normalised)
2012 | Normalised earnings to lead the way in earnings pick-up We project a pick-up in 2012 earnings of 5.8% on a reported and 33.3% on a normalised basis. The latter figure derives from the low base from which it starts – normalised aggregated earnings in 2011 are expected at EGP17.5bn, from we expect them to rise to EGP23.3bn in 2012. The primary drivers of this will be the Orascom stocks – OCIC and ORTE – which are forecast to contribute a total 19.9% of the 33.3% between them (see table below). EMOB and TMGH are the next most influential stocks, contributing an expected 2.9% and 2.8% respectively.
Reported Net Income Analysis 2008a 2009a 2010a 2011e 2012e 2013e 2014e
Total Aggregated Reported Net Income (EGPmn) 28,425 20,782 24,607 21,709 22,976 27,038 32,435Net Income Margin 17.7% 14.3% 15.3% 13.2% 12.6% 13.3% 14.7%
Total Aggregated Net Income Growth -71.4% -26.9% 18.4% -11.8% 5.8% 17.7% 20.0%
Normalised Net Income Analysis 2008a 2009a 2010a 2011e 2012e 2013e 2014e
Total Aggregated Normalised Net Income (EGPmn) 26,411 20,675 18,969 17,478 23,297 27,359 32,723Normalised Net Income Margin 16.4% 14.3% 11.8% 10.6% 12.7% 13.5% 14.9%
Total Aggregated Normalised Net Income Growth 6.6% -21.7% -8.2% -7.9% 33.3% 17.4% 19.6%
YoY Performance BreakdownKey Stocks Sector Weight†
Orascom Construction Industries Fertilizers 25.5% 228.5% -39.7% 36.8% 21.6% 44.7% 0.8% -2.1%
Telecom Egypt Telecom Services 13.8% 16.7% -1.8% 12.3% -13.3% 5.7% 1.6% 1.0%
Orascom Telecom Telecom Services 12.1% -68.6% -13.0% -174.3% 142.0% n/m 19.1% 57.5%
Commercial International Bank Banking 6.6% 36.6% 12.2% 15.0% -20.7% 7.6% 29.7% 20.5%
National Societe General Bank Banking 5.5% 20.8% 63.8% 3.5% 5.5% -4.1% 23.2% 17.1%
Mobinil Telecom Services 4.5% 14.1% 1.6% -30.3% -103.9% n/m 19.9% 19.8%
TMG Holding Housing & Real Estate 3.7% 7.6% -23.3% -16.1% -21.3% 66.5% 32.5% 42.8%
Ezz Aldekheila Steel – Alexandria Steel 3.2% 30.0% -76.4% 2.4% -28.0% 33.0% 82.1% 37.7%
El Sew edy Electric Engineering & Cables 2.8% 14.4% -23.5% 25.6% -16.9% 4.0% 10.3% 47.6%
Eastern Company Food & Beverage 2.6% 8.7% 14.9% -23.8% 0.6% 0.9% 1.6% 8.7%
Selected Others
GB Auto Automotive 1.5% -4.1% -51.6% 28.0% -10.6% 116.6% 18.7% 41.7%
Ezz Steel Steel 1.4% 10.9% -93.1% 192.9% -74.7% n/m 85.3% 218.0%
Oriental Weavers Carpets Consumer Goods 1.5% 3.3% 0.4% 3.1% -25.1% 24.0% 25.5% 19.0%
Above stocks as a proportion of Total Normalised Net Income* 82.7% 79.5% 76.4% 80.4% 83.7% 81.6% 83.9%
Aggregate Normalised Net Income based on a coverage universe of 38 stocks. Source: CI Capital Research
†'Key Stocks' are the 10 largest non-banking stocks in CI Capital Universe by Market Capitalisation. These stocks constitute 80.2% of total CI Capital universe.
*'Key Stocks' & 'Selected Others'. ‡ Positive/negative figure details actual stock contribution (in percentage points) to aggregated grow th f igure.
Page | 24
Egypt Book 2011/12
January 26, 2012
Strategy & Market Update
Xxx
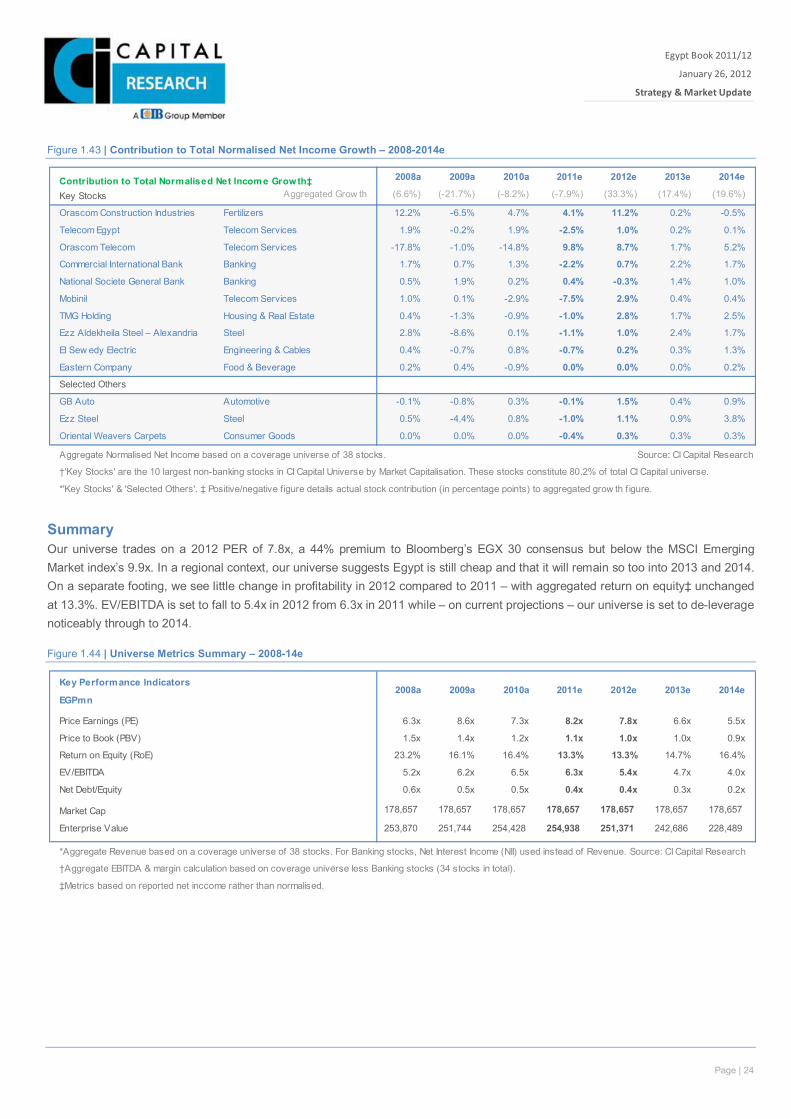
Figure 1.43 | Contribution to Total Normalised Net Income Growth – 2008-2014e
Summary Our universe trades on a 2012 PER of 7.8x, a 44% premium to Bloomberg’s EGX 30 consensus but below the MSCI Emerging Market index’s 9.9x. In a regional context, our universe suggests Egypt is still cheap and that it will remain so too into 2013 and 2014. On a separate footing, we see little change in profitability in 2012 compared to 2011 – with aggregated return on equity‡ unchanged at 13.3%. EV/EBITDA is set to fall to 5.4x in 2012 from 6.3x in 2011 while – on current projections – our universe is set to de-leverage noticeably through to 2014.
Figure 1.44 | Universe Metrics Summary – 2008-14e
Contribution to Total Normalised Net Income Growth‡ 2008a 2009a 2010a 2011e 2012e 2013e 2014e
Key Stocks Aggregated Grow th (6.6%) (-21.7%) (-8.2%) (-7.9%) (33.3%) (17.4%) (19.6%)
Orascom Construction Industries Fertilizers 12.2% -6.5% 4.7% 4.1% 11.2% 0.2% -0.5%
Telecom Egypt Telecom Services 1.9% -0.2% 1.9% -2.5% 1.0% 0.2% 0.1%
Orascom Telecom Telecom Services -17.8% -1.0% -14.8% 9.8% 8.7% 1.7% 5.2%
Commercial International Bank Banking 1.7% 0.7% 1.3% -2.2% 0.7% 2.2% 1.7%
National Societe General Bank Banking 0.5% 1.9% 0.2% 0.4% -0.3% 1.4% 1.0%
Mobinil Telecom Services 1.0% 0.1% -2.9% -7.5% 2.9% 0.4% 0.4%
TMG Holding Housing & Real Estate 0.4% -1.3% -0.9% -1.0% 2.8% 1.7% 2.5%
Ezz Aldekheila Steel – Alexandria Steel 2.8% -8.6% 0.1% -1.1% 1.0% 2.4% 1.7%
El Sew edy Electric Engineering & Cables 0.4% -0.7% 0.8% -0.7% 0.2% 0.3% 1.3%
Eastern Company Food & Beverage 0.2% 0.4% -0.9% 0.0% 0.0% 0.0% 0.2%
Selected Others
GB Auto Automotive -0.1% -0.8% 0.3% -0.1% 1.5% 0.4% 0.9%
Ezz Steel Steel 0.5% -4.4% 0.8% -1.0% 1.1% 0.9% 3.8%
Oriental Weavers Carpets Consumer Goods 0.0% 0.0% 0.0% -0.4% 0.3% 0.3% 0.3%
Aggregate Normalised Net Income based on a coverage universe of 38 stocks. Source: CI Capital Research
†'Key Stocks' are the 10 largest non-banking stocks in CI Capital Universe by Market Capitalisation. These stocks constitute 80.2% of total CI Capital universe.
*'Key Stocks' & 'Selected Others'. ‡ Positive/negative figure details actual stock contribution (in percentage points) to aggregated grow th f igure.
Key Performance Indicators
EGPmn
Price Earnings (PE) 6.3x 8.6x 7.3x 8.2x 7.8x 6.6x 5.5x
Price to Book (PBV) 1.5x 1.4x 1.2x 1.1x 1.0x 1.0x 0.9x
Return on Equity (RoE) 23.2% 16.1% 16.4% 13.3% 13.3% 14.7% 16.4%
EV/EBITDA 5.2x 6.2x 6.5x 6.3x 5.4x 4.7x 4.0x
Net Debt/Equity 0.6x 0.5x 0.5x 0.4x 0.4x 0.3x 0.2x
Market Cap 178,657 178,657 178,657 178,657 178,657 178,657 178,657
Enterprise Value 253,870 251,744 254,428 254,938 251,371 242,686 228,489
*Aggregate Revenue based on a coverage universe of 38 stocks. For Banking stocks, Net Interest Income (NII) used instead of Revenue. Source: CI Capital Research
†Aggregate EBITDA & margin calculation based on coverage universe less Banking stocks (34 stocks in total).
‡Metrics based on reported net inccome rather than normalised.
2013e 2014e2008a 2009a 2010a 2011e 2012e
Page | 25
Egypt Book 2011/12
January 26, 2012
Strategy & Market Update
Xxx
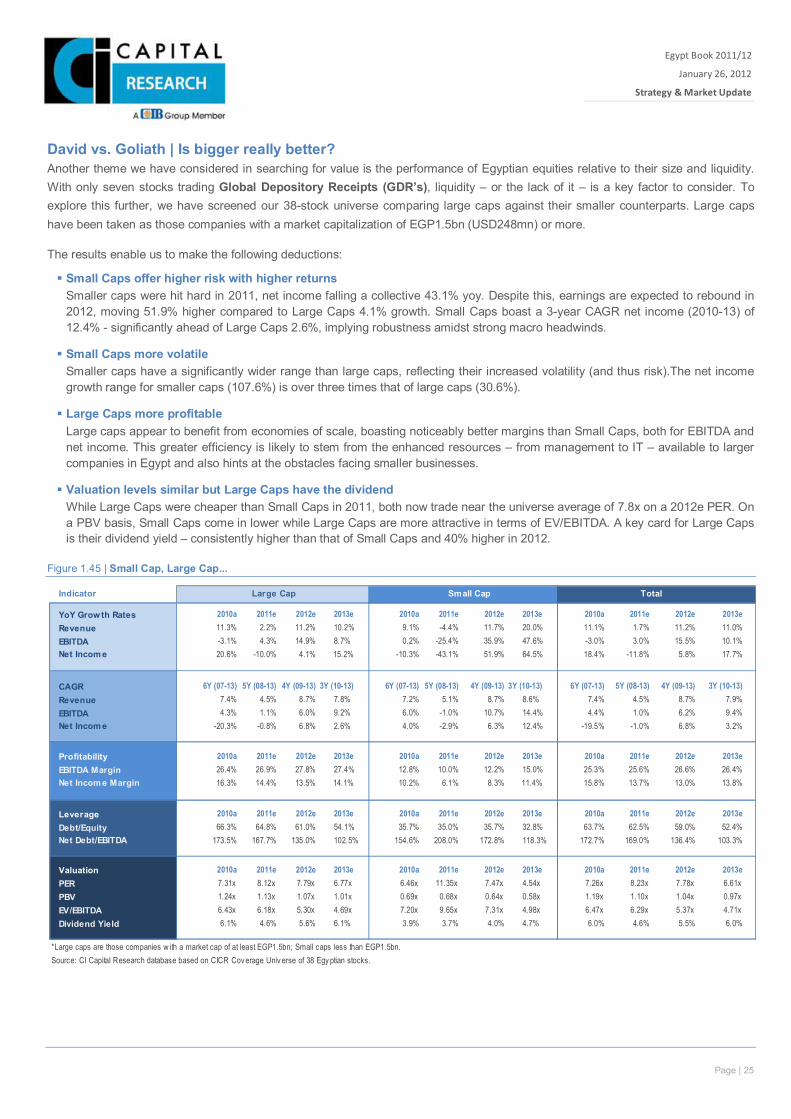
David vs. Goliath | Is bigger really better? Another theme we have considered in searching for value is the performance of Egyptian equities relative to their size and liquidity. With only seven stocks trading Global Depository Receipts (GDR’s), liquidity – or the lack of it – is a key factor to consider. To explore this further, we have screened our 38-stock universe comparing large caps against their smaller counterparts. Large caps have been taken as those companies with a market capitalization of EGP1.5bn (USD248mn) or more.
The results enable us to make the following deductions:
Small Caps offer higher risk with higher returns Smaller caps were hit hard in 2011, net income falling a collective 43.1% yoy. Despite this, earnings are expected to rebound in 2012, moving 51.9% higher compared to Large Caps 4.1% growth. Small Caps boast a 3-year CAGR net income (2010-13) of 12.4% - significantly ahead of Large Caps 2.6%, implying robustness amidst strong macro headwinds.
Small Caps more volatile Smaller caps have a significantly wider range than large caps, reflecting their increased volatility (and thus risk).The net income growth range for smaller caps (107.6%) is over three times that of large caps (30.6%).
Large Caps more profitable Large caps appear to benefit from economies of scale, boasting noticeably better margins than Small Caps, both for EBITDA and net income. This greater efficiency is likely to stem from the enhanced resources – from management to IT – available to larger companies in Egypt and also hints at the obstacles facing smaller businesses.
Valuation levels similar but Large Caps have the dividend While Large Caps were cheaper than Small Caps in 2011, both now trade near the universe average of 7.8x on a 2012e PER. On a PBV basis, Small Caps come in lower while Large Caps are more attractive in terms of EV/EBITDA. A key card for Large Caps is their dividend yield – consistently higher than that of Small Caps and 40% higher in 2012.
Figure 1.45 | Small Cap, Large Cap...
Indicator
YoY Grow th Rates 2010a 2011e 2012e 2013e 2010a 2011e 2012e 2013e 2010a 2011e 2012e 2013eRevenue 11.3% 2.2% 11.2% 10.2% 9.1% -4.4% 11.7% 20.0% 11.1% 1.7% 11.2% 11.0%EBITDA -3.1% 4.3% 14.9% 8.7% 0.2% -25.4% 35.9% 47.6% -3.0% 3.0% 15.5% 10.1%Net Incom e 20.6% -10.0% 4.1% 15.2% -10.3% -43.1% 51.9% 64.5% 18.4% -11.8% 5.8% 17.7%
CAGR 6Y (07-13) 5Y (08-13) 4Y (09-13) 3Y (10-13) 6Y (07-13) 5Y (08-13) 4Y (09-13) 3Y (10-13) 6Y (07-13) 5Y (08-13) 4Y (09-13) 3Y (10-13)Revenue 7.4% 4.5% 8.7% 7.8% 7.2% 5.1% 8.7% 8.6% 7.4% 4.5% 8.7% 7.9%EBITDA 4.3% 1.1% 6.0% 9.2% 6.0% -1.0% 10.7% 14.4% 4.4% 1.0% 6.2% 9.4%Net Incom e -20.3% -0.8% 6.8% 2.6% 4.0% -2.9% 6.3% 12.4% -19.5% -1.0% 6.8% 3.2%
Profitability 2010a 2011e 2012e 2013e 2010a 2011e 2012e 2013e 2010a 2011e 2012e 2013eEBITDA Margin 26.4% 26.9% 27.8% 27.4% 12.8% 10.0% 12.2% 15.0% 25.3% 25.6% 26.6% 26.4%Net Incom e Margin 16.3% 14.4% 13.5% 14.1% 10.2% 6.1% 8.3% 11.4% 15.8% 13.7% 13.0% 13.8%
Leverage 2010a 2011e 2012e 2013e 2010a 2011e 2012e 2013e 2010a 2011e 2012e 2013eDebt/Equity 66.3% 64.8% 61.0% 54.1% 35.7% 35.0% 35.7% 32.8% 63.7% 62.5% 59.0% 52.4%Net Debt/EBITDA 173.5% 167.7% 135.0% 102.5% 154.6% 208.0% 172.8% 118.3% 172.7% 169.0% 136.4% 103.3%
Valuation 2010a 2011e 2012e 2013e 2010a 2011e 2012e 2013e 2010a 2011e 2012e 2013ePER 7.31x 8.12x 7.79x 6.77x 6.46x 11.35x 7.47x 4.54x 7.26x 8.23x 7.78x 6.61xPBV 1.24x 1.13x 1.07x 1.01x 0.69x 0.68x 0.64x 0.58x 1.19x 1.10x 1.04x 0.97xEV/EBITDA 6.43x 6.18x 5.30x 4.69x 7.20x 9.65x 7.31x 4.98x 6.47x 6.29x 5.37x 4.71xDividend Yield 6.1% 4.6% 5.6% 6.1% 3.9% 3.7% 4.0% 4.7% 6.0% 4.6% 5.5% 6.0%
*Large caps are those companies w ith a market cap of at least EGP1.5bn; Small caps less than EGP1.5bn.Source: CI Capital Research database based on CICR Coverage Univ erse of 38 Egy ptian stocks.
Large Cap Small Cap Total
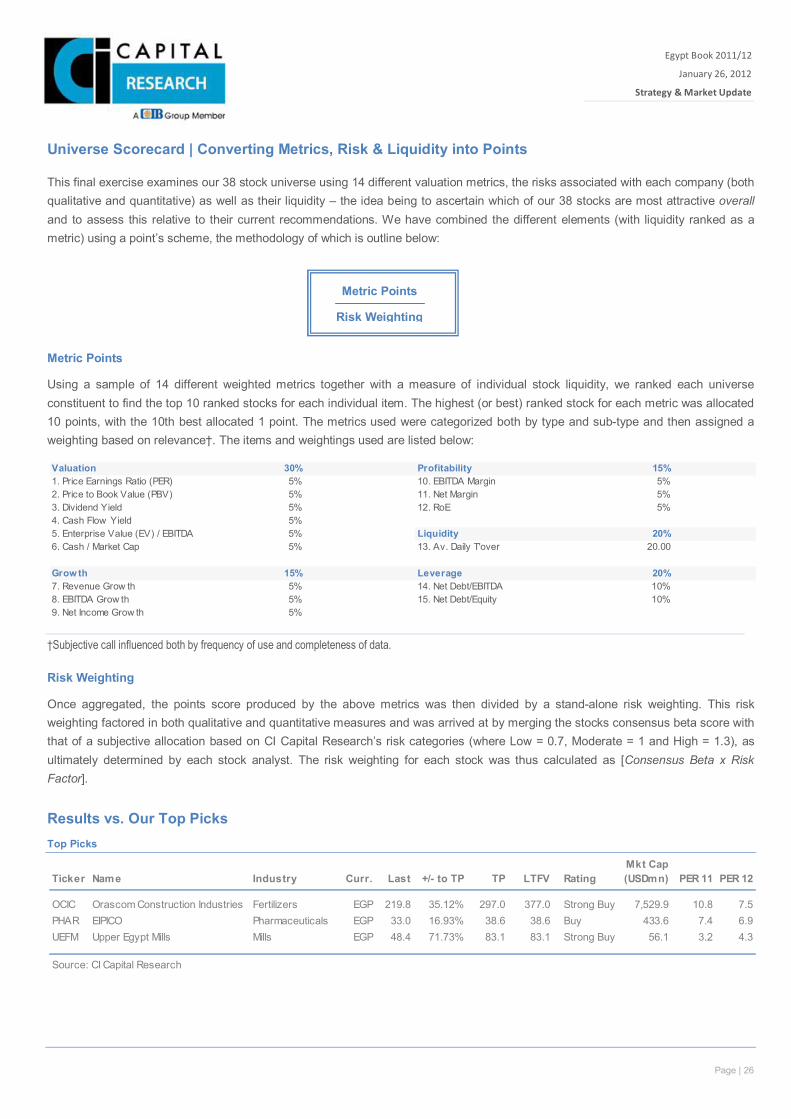
Page | 26
Egypt Book 2011/12
January 26, 2012
Strategy & Market Update
Xxx
Universe Scorecard | Converting Metrics, Risk & Liquidity into Points This final exercise examines our 38 stock universe using 14 different valuation metrics, the risks associated with each company (both qualitative and quantitative) as well as their liquidity – the idea being to ascertain which of our 38 stocks are most attractive overall and to assess this relative to their current recommendations. We have combined the different elements (with liquidity ranked as a metric) using a point’s scheme, the methodology of which is outline below:
Metric Points
Using a sample of 14 different weighted metrics together with a measure of individual stock liquidity, we ranked each universe constituent to find the top 10 ranked stocks for each individual item. The highest (or best) ranked stock for each metric was allocated 10 points, with the 10th best allocated 1 point. The metrics used were categorized both by type and sub-type and then assigned a weighting based on relevance†. The items and weightings used are listed below:
†Subjective call influenced both by frequency of use and completeness of data.
Risk Weighting
Once aggregated, the points score produced by the above metrics was then divided by a stand-alone risk weighting. This risk weighting factored in both qualitative and quantitative measures and was arrived at by merging the stocks consensus beta score with that of a subjective allocation based on CI Capital Research’s risk categories (where Low = 0.7, Moderate = 1 and High = 1.3), as ultimately determined by each stock analyst. The risk weighting for each stock was thus calculated as [Consensus Beta x Risk Factor].
Results vs. Our Top Picks Top Picks
Valuation 30% Profitability 15%1. Price Earnings Ratio (PER) 5% 10. EBITDA Margin 5%2. Price to Book Value (PBV) 5% 11. Net Margin 5%3. Dividend Yield 5% 12. RoE 5%4. Cash Flow Yield 5%5. Enterprise Value (EV) / EBITDA 5% Liquidity 20%6. Cash / Market Cap 5% 13. Av. Daily T'over 20.00
Grow th 15% Leverage 20%7. Revenue Grow th 5% 14. Net Debt/EBITDA 10%8. EBITDA Grow th 5% 15. Net Debt/Equity 10%9. Net Income Grow th 5%
Ticker Name Industry Curr. Last +/- to TP TP LTFV RatingMkt Cap (USDmn) PER 11 PER 12
OCIC Orascom Construction Industries Fertilizers EGP 219.8 35.12% 297.0 377.0 Strong Buy 7,529.9 10.8 7.5PHAR EIPICO Pharmaceuticals EGP 33.0 16.93% 38.6 38.6 Buy 433.6 7.4 6.9UEFM Upper Egypt Mills Mills EGP 48.4 71.73% 83.1 83.1 Strong Buy 56.1 3.2 4.3
Source: CI Capital Research
Metric Points
Risk Weighting
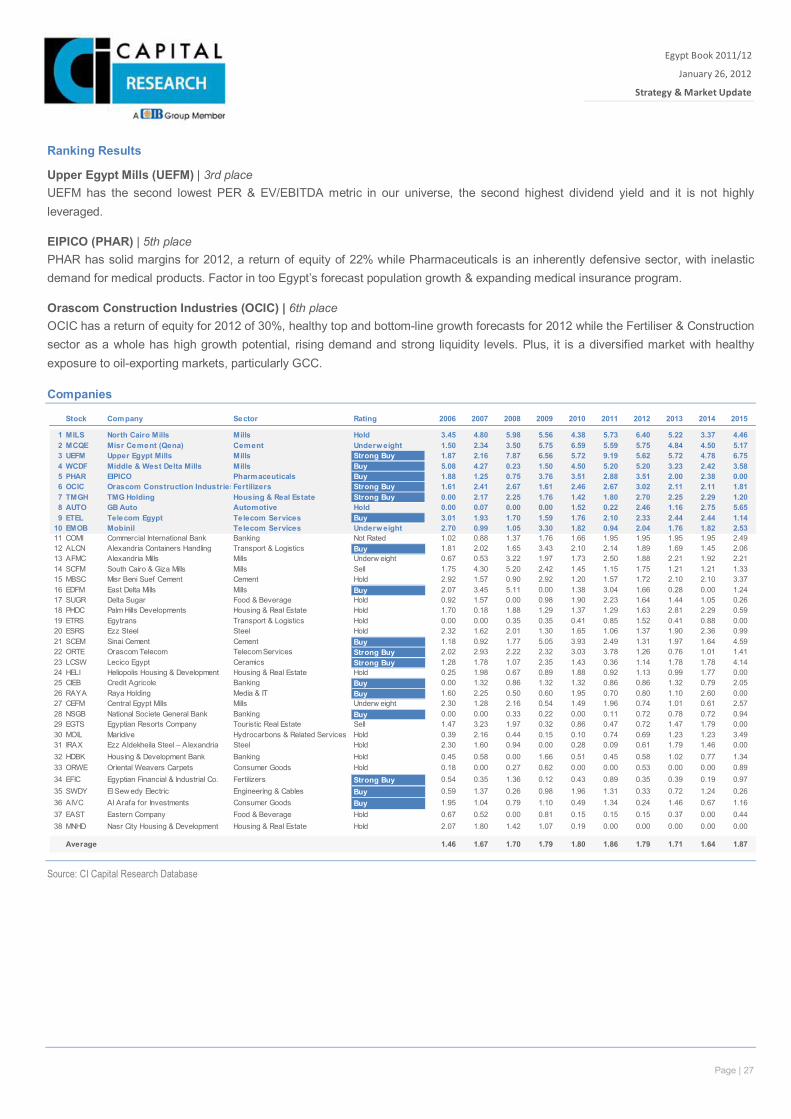
Page | 27
Egypt Book 2011/12
January 26, 2012
Strategy & Market Update
Xxx
Ranking Results
Upper Egypt Mills (UEFM) | 3rd place UEFM has the second lowest PER & EV/EBITDA metric in our universe, the second highest dividend yield and it is not highly leveraged.
EIPICO (PHAR) | 5th place PHAR has solid margins for 2012, a return of equity of 22% while Pharmaceuticals is an inherently defensive sector, with inelastic demand for medical products. Factor in too Egypt’s forecast population growth & expanding medical insurance program.
Orascom Construction Industries (OCIC) | 6th place OCIC has a return of equity for 2012 of 30%, healthy top and bottom-line growth forecasts for 2012 while the Fertiliser & Construction sector as a whole has high growth potential, rising demand and strong liquidity levels. Plus, it is a diversified market with healthy exposure to oil-exporting markets, particularly GCC.
Companies
Source: CI Capital Research Database
Stock Company Sector Rating 2006 2007 2008 2009 2010 2011 2012 2013 2014 2015
1 MILS North Cairo Mills Mills Hold 3.45 4.80 5.98 5.56 4.38 5.73 6.40 5.22 3.37 4.462 MCQE Misr Cement (Qena) Cement Underw eight 1.50 2.34 3.50 5.75 6.59 5.59 5.75 4.84 4.50 5.173 UEFM Upper Egypt Mills Mills Strong Buy 1.87 2.16 7.87 6.56 5.72 9.19 5.62 5.72 4.78 6.754 WCDF Middle & West Delta Mills Mills Buy 5.08 4.27 0.23 1.50 4.50 5.20 5.20 3.23 2.42 3.585 PHAR EIPICO Pharmaceuticals Buy 1.88 1.25 0.75 3.76 3.51 2.88 3.51 2.00 2.38 0.006 OCIC Orascom Construction IndustriesFertilizers Strong Buy 1.61 2.41 2.67 1.61 2.46 2.67 3.02 2.11 2.11 1.817 TMGH TMG Holding Housing & Real Estate Strong Buy 0.00 2.17 2.25 1.76 1.42 1.80 2.70 2.25 2.29 1.208 AUTO GB Auto Automotive Hold 0.00 0.07 0.00 0.00 1.52 0.22 2.46 1.16 2.75 5.659 ETEL Telecom Egypt Telecom Services Buy 3.01 1.93 1.70 1.59 1.76 2.10 2.33 2.44 2.44 1.14
10 EMOB Mobinil Telecom Services Underw eight 2.70 0.99 1.05 3.30 1.82 0.94 2.04 1.76 1.82 2.5311 COMI Commercial International Bank Banking Not Rated 1.02 0.88 1.37 1.76 1.66 1.95 1.95 1.95 1.95 2.4912 ALCN Alexandria Containers Handling Transport & Logistics Buy 1.81 2.02 1.65 3.43 2.10 2.14 1.89 1.69 1.45 2.0613 AFMC Alexandria Mills Mills Underw eight 0.67 0.53 3.22 1.97 1.73 2.50 1.88 2.21 1.92 2.2114 SCFM South Cairo & Giza Mills Mills Sell 1.75 4.30 5.20 2.42 1.45 1.15 1.75 1.21 1.21 1.3315 MBSC Misr Beni Suef Cement Cement Hold 2.92 1.57 0.90 2.92 1.20 1.57 1.72 2.10 2.10 3.3716 EDFM East Delta Mills Mills Buy 2.07 3.45 5.11 0.00 1.38 3.04 1.66 0.28 0.00 1.2417 SUGR Delta Sugar Food & Beverage Hold 0.92 1.57 0.00 0.98 1.90 2.23 1.64 1.44 1.05 0.2618 PHDC Palm Hills Developments Housing & Real Estate Hold 1.70 0.18 1.88 1.29 1.37 1.29 1.63 2.81 2.29 0.5919 ETRS Egytrans Transport & Logistics Hold 0.00 0.00 0.35 0.35 0.41 0.85 1.52 0.41 0.88 0.0020 ESRS Ezz Steel Steel Hold 2.32 1.62 2.01 1.30 1.65 1.06 1.37 1.90 2.36 0.9921 SCEM Sinai Cement Cement Buy 1.18 0.92 1.77 5.05 3.93 2.49 1.31 1.97 1.64 4.5922 ORTE Orascom Telecom Telecom Services Strong Buy 2.02 2.93 2.22 2.32 3.03 3.78 1.26 0.76 1.01 1.4123 LCSW Lecico Egypt Ceramics Strong Buy 1.28 1.78 1.07 2.35 1.43 0.36 1.14 1.78 1.78 4.1424 HELI Heliopolis Housing & Development Housing & Real Estate Hold 0.25 1.98 0.67 0.89 1.88 0.92 1.13 0.99 1.77 0.0025 CIEB Credit Agricole Banking Buy 0.00 1.32 0.86 1.32 1.32 0.86 0.86 1.32 0.79 2.0526 RAYA Raya Holding Media & IT Buy 1.60 2.25 0.50 0.60 1.95 0.70 0.80 1.10 2.60 0.0027 CEFM Central Egypt Mills Mills Underw eight 2.30 1.28 2.16 0.54 1.49 1.96 0.74 1.01 0.61 2.5728 NSGB National Societe General Bank Banking Buy 0.00 0.00 0.33 0.22 0.00 0.11 0.72 0.78 0.72 0.9429 EGTS Egyptian Resorts Company Touristic Real Estate Sell 1.47 3.23 1.97 0.32 0.86 0.47 0.72 1.47 1.79 0.0030 MOIL Maridive Hydrocarbons & Related Services Hold 0.39 2.16 0.44 0.15 0.10 0.74 0.69 1.23 1.23 3.4931 IRAX Ezz Aldekheila Steel – Alexandria Steel Hold 2.30 1.60 0.94 0.00 0.28 0.09 0.61 1.79 1.46 0.0032 HDBK Housing & Development Bank Banking Hold 0.45 0.58 0.00 1.66 0.51 0.45 0.58 1.02 0.77 1.3433 ORWE Oriental Weavers Carpets Consumer Goods Hold 0.18 0.00 0.27 0.62 0.00 0.00 0.53 0.00 0.00 0.8934 EFIC Egyptian Financial & Industrial Co. Fertilizers Strong Buy 0.54 0.35 1.36 0.12 0.43 0.89 0.35 0.39 0.19 0.9735 SWDY El Sew edy Electric Engineering & Cables Buy 0.59 1.37 0.26 0.98 1.96 1.31 0.33 0.72 1.24 0.2636 AIVC Al Arafa for Investments Consumer Goods Buy 1.95 1.04 0.79 1.10 0.49 1.34 0.24 1.46 0.67 1.1637 EAST Eastern Company Food & Beverage Hold 0.67 0.52 0.00 0.81 0.15 0.15 0.15 0.37 0.00 0.4438 MNHD Nasr City Housing & Development Housing & Real Estate Hold 2.07 1.80 1.42 1.07 0.19 0.00 0.00 0.00 0.00 0.00
Average 1.46 1.67 1.70 1.79 1.80 1.86 1.79 1.71 1.64 1.87
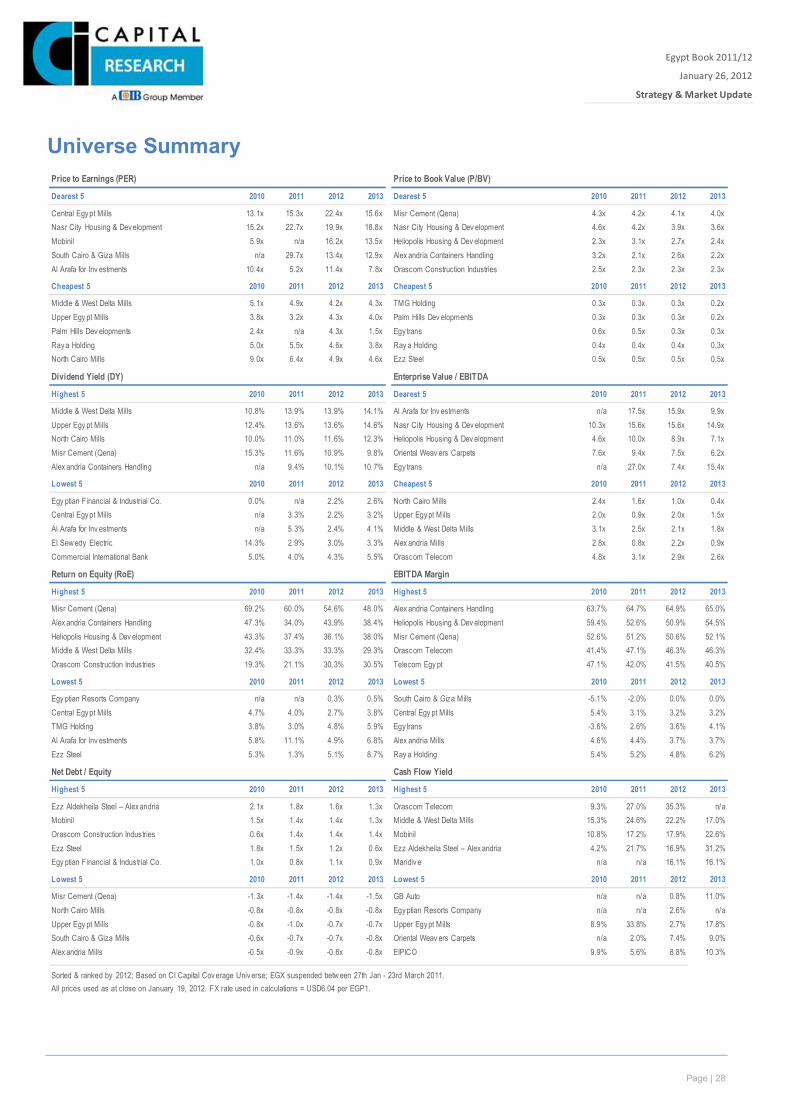
Page | 28
Egypt Book 2011/12
January 26, 2012
Strategy & Market Update
Xxx
Universe Summary
Price to Earnings (PER) Price to Book Value (P/BV)
Dearest 5 2010 2011 2012 2013 Dearest 5 2010 2011 2012 2013
Central Egypt Mills 13.1x 15.3x 22.4x 15.6x Misr Cement (Qena) 4.3x 4.2x 4.1x 4.0xNasr City Housing & Development 15.2x 22.7x 19.9x 18.8x Nasr City Housing & Dev elopment 4.6x 4.2x 3.9x 3.6xMobinil 5.9x n/a 16.2x 13.5x Heliopolis Housing & Dev elopment 2.3x 3.1x 2.7x 2.4xSouth Cairo & Giza Mills n/a 29.7x 13.4x 12.9x Alex andria Containers Handling 3.2x 2.1x 2.6x 2.2xAl Arafa for Inv estments 10.4x 5.2x 11.4x 7.8x Orascom Construction Industries 2.5x 2.3x 2.3x 2.3x
Cheapest 5 2010 2011 2012 2013 Cheapest 5 2010 2011 2012 2013
Middle & West Delta Mills 5.1x 4.9x 4.2x 4.3x TMG Holding 0.3x 0.3x 0.3x 0.2xUpper Egy pt Mills 3.8x 3.2x 4.3x 4.0x Palm Hills Dev elopments 0.3x 0.3x 0.3x 0.2xPalm Hills Dev elopments 2.4x n/a 4.3x 1.5x Egy trans 0.6x 0.5x 0.3x 0.3xRaya Holding 5.0x 5.5x 4.6x 3.8x Ray a Holding 0.4x 0.4x 0.4x 0.3xNorth Cairo Mills 9.0x 6.4x 4.9x 4.6x Ezz Steel 0.5x 0.5x 0.5x 0.5x
Dividend Yield (DY) Enterprise Value / EBITDA
Highest 5 2010 2011 2012 2013 Dearest 5 2010 2011 2012 2013
Middle & West Delta Mills 10.8% 13.9% 13.9% 14.1% Al Arafa for Inv estments n/a 17.5x 15.9x 9.9xUpper Egy pt Mills 12.4% 13.6% 13.6% 14.6% Nasr City Housing & Dev elopment 10.3x 15.6x 15.6x 14.9xNorth Cairo Mills 10.0% 11.0% 11.6% 12.3% Heliopolis Housing & Dev elopment 4.6x 10.0x 8.9x 7.1xMisr Cement (Qena) 15.3% 11.6% 10.9% 9.8% Oriental Weav ers Carpets 7.6x 9.4x 7.5x 6.2xAlex andria Containers Handling n/a 9.4% 10.1% 10.7% Egy trans n/a 27.0x 7.4x 15.4x
Lowest 5 2010 2011 2012 2013 Cheapest 5 2010 2011 2012 2013
Egy ptian Financial & Industrial Co. 0.0% n/a 2.2% 2.6% North Cairo Mills 2.4x 1.6x 1.0x 0.4xCentral Egypt Mills n/a 3.3% 2.2% 3.2% Upper Egypt Mills 2.0x 0.9x 2.0x 1.5xAl Arafa for Inv estments n/a 5.3% 2.4% 4.1% Middle & West Delta Mills 3.1x 2.5x 2.1x 1.8xEl Sew edy Electric 14.3% 2.9% 3.0% 3.3% Alex andria Mills 2.8x 0.8x 2.2x 0.9xCommercial International Bank 5.0% 4.0% 4.3% 5.5% Orascom Telecom 4.8x 3.1x 2.9x 2.6x
Return on Equity (RoE) EBITDA Margin
Highest 5 2010 2011 2012 2013 Highest 5 2010 2011 2012 2013
Misr Cement (Qena) 69.2% 60.0% 54.6% 48.0% Alex andria Containers Handling 63.7% 64.7% 64.9% 65.0%Alex andria Containers Handling 47.3% 34.0% 43.9% 38.4% Heliopolis Housing & Dev elopment 59.4% 52.6% 50.9% 54.5%Heliopolis Housing & Dev elopment 43.3% 37.4% 36.1% 38.0% Misr Cement (Qena) 52.6% 51.2% 50.6% 52.1%Middle & West Delta Mills 32.4% 33.3% 33.3% 29.3% Orascom Telecom 41.4% 47.1% 46.3% 46.3%Orascom Construction Industries 19.3% 21.1% 30.3% 30.5% Telecom Egy pt 47.1% 42.0% 41.5% 40.5%
Lowest 5 2010 2011 2012 2013 Lowest 5 2010 2011 2012 2013
Egy ptian Resorts Company n/a n/a 0.3% 0.5% South Cairo & Giza Mills -5.1% -2.0% 0.0% 0.0%Central Egypt Mills 4.7% 4.0% 2.7% 3.8% Central Egy pt Mills 5.4% 3.1% 3.2% 3.2%TMG Holding 3.8% 3.0% 4.8% 5.9% Egy trans -3.6% 2.6% 3.6% 4.1%Al Arafa for Inv estments 5.8% 11.1% 4.9% 6.8% Alex andria Mills 4.6% 4.4% 3.7% 3.7%Ezz Steel 5.3% 1.3% 5.1% 8.7% Ray a Holding 5.4% 5.2% 4.8% 6.2%
Net Debt / Equity Cash Flow Yield
Highest 5 2010 2011 2012 2013 Highest 5 2010 2011 2012 2013
Ezz Aldekheila Steel – Alexandria 2.1x 1.8x 1.6x 1.3x Orascom Telecom 9.3% 27.0% 35.3% n/aMobinil 1.5x 1.4x 1.4x 1.3x Middle & West Delta Mills 15.3% 24.6% 22.2% 17.0%Orascom Construction Industries 0.6x 1.4x 1.4x 1.4x Mobinil 10.8% 17.2% 17.9% 22.6%Ezz Steel 1.8x 1.5x 1.2x 0.6x Ezz Aldekheila Steel – Alex andria 4.2% 21.7% 16.9% 31.2%Egy ptian Financial & Industrial Co. 1.0x 0.8x 1.1x 0.9x Maridive n/a n/a 16.1% 16.1%
Lowest 5 2010 2011 2012 2013 Lowest 5 2010 2011 2012 2013
Misr Cement (Qena) -1.3x -1.4x -1.4x -1.5x GB Auto n/a n/a 0.8% 11.0%North Cairo Mills -0.8x -0.8x -0.8x -0.8x Egyptian Resorts Company n/a n/a 2.6% n/aUpper Egy pt Mills -0.8x -1.0x -0.7x -0.7x Upper Egypt Mills 8.9% 33.8% 2.7% 17.8%South Cairo & Giza Mills -0.6x -0.7x -0.7x -0.8x Oriental Weav ers Carpets n/a 2.0% 7.4% 9.0%Alex andria Mills -0.5x -0.9x -0.6x -0.8x EIPICO 9.9% 5.6% 8.8% 10.3%
Sorted & ranked by 2012; Based on CI Capital Coverage Universe; EGX suspended betw een 27th Jan - 23rd March 2011.All prices used as at close on January 19, 2012. FX rate used in calculations = USD6.04 per EGP1.
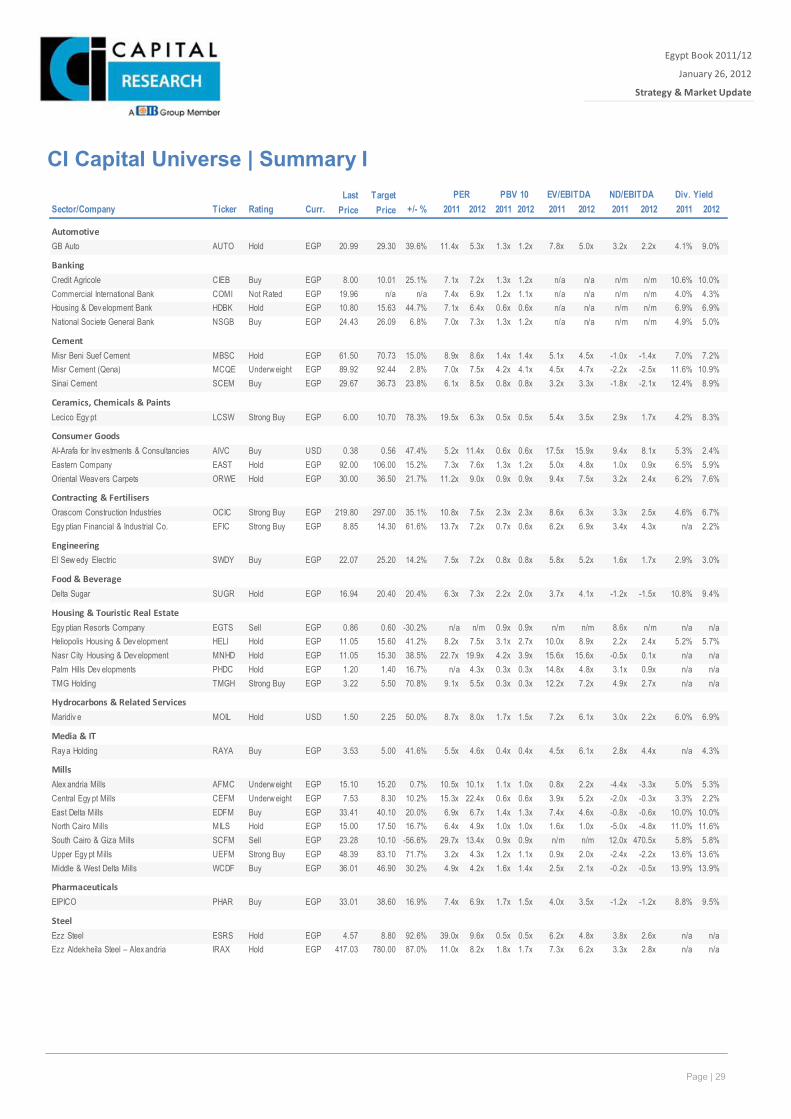
Page | 29
Egypt Book 2011/12
January 26, 2012
Strategy & Market Update
Xxx
CI Capital Universe | Summary I
Sector/Company Ticker Rating Curr. +/- % 2011 2012 2011 2012 2011 2012 2011 2012 2011 2012
AutomotiveGB Auto AUTO Hold EGP 20.99 29.30 39.6% 11.4x 5.3x 1.3x 1.2x 7.8x 5.0x 3.2x 2.2x 4.1% 9.0%
BankingCredit Agricole CIEB Buy EGP 8.00 10.01 25.1% 7.1x 7.2x 1.3x 1.2x n/a n/a n/m n/m 10.6% 10.0%Commercial International Bank COMI Not Rated EGP 19.96 n/a n/a 7.4x 6.9x 1.2x 1.1x n/a n/a n/m n/m 4.0% 4.3%Housing & Dev elopment Bank HDBK Hold EGP 10.80 15.63 44.7% 7.1x 6.4x 0.6x 0.6x n/a n/a n/m n/m 6.9% 6.9%National Societe General Bank NSGB Buy EGP 24.43 26.09 6.8% 7.0x 7.3x 1.3x 1.2x n/a n/a n/m n/m 4.9% 5.0%
CementMisr Beni Suef Cement MBSC Hold EGP 61.50 70.73 15.0% 8.9x 8.6x 1.4x 1.4x 5.1x 4.5x -1.0x -1.4x 7.0% 7.2%Misr Cement (Qena) MCQE Underweight EGP 89.92 92.44 2.8% 7.0x 7.5x 4.2x 4.1x 4.5x 4.7x -2.2x -2.5x 11.6% 10.9%Sinai Cement SCEM Buy EGP 29.67 36.73 23.8% 6.1x 8.5x 0.8x 0.8x 3.2x 3.3x -1.8x -2.1x 12.4% 8.9%
Ceramics, Chemicals & PaintsLecico Egy pt LCSW Strong Buy EGP 6.00 10.70 78.3% 19.5x 6.3x 0.5x 0.5x 5.4x 3.5x 2.9x 1.7x 4.2% 8.3%
Consumer GoodsAl-Arafa for Inv estments & Consultancies AIVC Buy USD 0.38 0.56 47.4% 5.2x 11.4x 0.6x 0.6x 17.5x 15.9x 9.4x 8.1x 5.3% 2.4%Eastern Company EAST Hold EGP 92.00 106.00 15.2% 7.3x 7.6x 1.3x 1.2x 5.0x 4.8x 1.0x 0.9x 6.5% 5.9%Oriental Weav ers Carpets ORWE Hold EGP 30.00 36.50 21.7% 11.2x 9.0x 0.9x 0.9x 9.4x 7.5x 3.2x 2.4x 6.2% 7.6%
Contracting & FertilisersOrascom Construction Industries OCIC Strong Buy EGP 219.80 297.00 35.1% 10.8x 7.5x 2.3x 2.3x 8.6x 6.3x 3.3x 2.5x 4.6% 6.7%Egy ptian Financial & Industrial Co. EFIC Strong Buy EGP 8.85 14.30 61.6% 13.7x 7.2x 0.7x 0.6x 6.2x 6.9x 3.4x 4.3x n/a 2.2%
EngineeringEl Sew edy Electric SWDY Buy EGP 22.07 25.20 14.2% 7.5x 7.2x 0.8x 0.8x 5.8x 5.2x 1.6x 1.7x 2.9% 3.0%
Food & BeverageDelta Sugar SUGR Hold EGP 16.94 20.40 20.4% 6.3x 7.3x 2.2x 2.0x 3.7x 4.1x -1.2x -1.5x 10.8% 9.4%
Housing & Touristic Real EstateEgy ptian Resorts Company EGTS Sell EGP 0.86 0.60 -30.2% n/a n/m 0.9x 0.9x n/m n/m 8.6x n/m n/a n/aHeliopolis Housing & Dev elopment HELI Hold EGP 11.05 15.60 41.2% 8.2x 7.5x 3.1x 2.7x 10.0x 8.9x 2.2x 2.4x 5.2% 5.7%Nasr City Housing & Dev elopment MNHD Hold EGP 11.05 15.30 38.5% 22.7x 19.9x 4.2x 3.9x 15.6x 15.6x -0.5x 0.1x n/a n/aPalm Hills Dev elopments PHDC Hold EGP 1.20 1.40 16.7% n/a 4.3x 0.3x 0.3x 14.8x 4.8x 3.1x 0.9x n/a n/aTMG Holding TMGH Strong Buy EGP 3.22 5.50 70.8% 9.1x 5.5x 0.3x 0.3x 12.2x 7.2x 4.9x 2.7x n/a n/a
Hydrocarbons & Related ServicesMaridiv e MOIL Hold USD 1.50 2.25 50.0% 8.7x 8.0x 1.7x 1.5x 7.2x 6.1x 3.0x 2.2x 6.0% 6.9%
Media & ITRay a Holding RAYA Buy EGP 3.53 5.00 41.6% 5.5x 4.6x 0.4x 0.4x 4.5x 6.1x 2.8x 4.4x n/a 4.3%
MillsAlex andria Mills AFMC Underweight EGP 15.10 15.20 0.7% 10.5x 10.1x 1.1x 1.0x 0.8x 2.2x -4.4x -3.3x 5.0% 5.3%Central Egy pt Mills CEFM Underweight EGP 7.53 8.30 10.2% 15.3x 22.4x 0.6x 0.6x 3.9x 5.2x -2.0x -0.3x 3.3% 2.2%East Delta Mills EDFM Buy EGP 33.41 40.10 20.0% 6.9x 6.7x 1.4x 1.3x 7.4x 4.6x -0.8x -0.6x 10.0% 10.0%North Cairo Mills MILS Hold EGP 15.00 17.50 16.7% 6.4x 4.9x 1.0x 1.0x 1.6x 1.0x -5.0x -4.8x 11.0% 11.6%South Cairo & Giza Mills SCFM Sell EGP 23.28 10.10 -56.6% 29.7x 13.4x 0.9x 0.9x n/m n/m 12.0x 470.5x 5.8% 5.8%Upper Egy pt Mills UEFM Strong Buy EGP 48.39 83.10 71.7% 3.2x 4.3x 1.2x 1.1x 0.9x 2.0x -2.4x -2.2x 13.6% 13.6%Middle & West Delta Mills WCDF Buy EGP 36.01 46.90 30.2% 4.9x 4.2x 1.6x 1.4x 2.5x 2.1x -0.2x -0.5x 13.9% 13.9%
PharmaceuticalsEIPICO PHAR Buy EGP 33.01 38.60 16.9% 7.4x 6.9x 1.7x 1.5x 4.0x 3.5x -1.2x -1.2x 8.8% 9.5%
SteelEzz Steel ESRS Hold EGP 4.57 8.80 92.6% 39.0x 9.6x 0.5x 0.5x 6.2x 4.8x 3.8x 2.6x n/a n/aEzz Aldekheila Steel – Alex andria IRAX Hold EGP 417.03 780.00 87.0% 11.0x 8.2x 1.8x 1.7x 7.3x 6.2x 3.3x 2.8x n/a n/a
Last Price
Target Price
PER PBV 10 EV/EBITDA ND/EBITDA Div. Yield
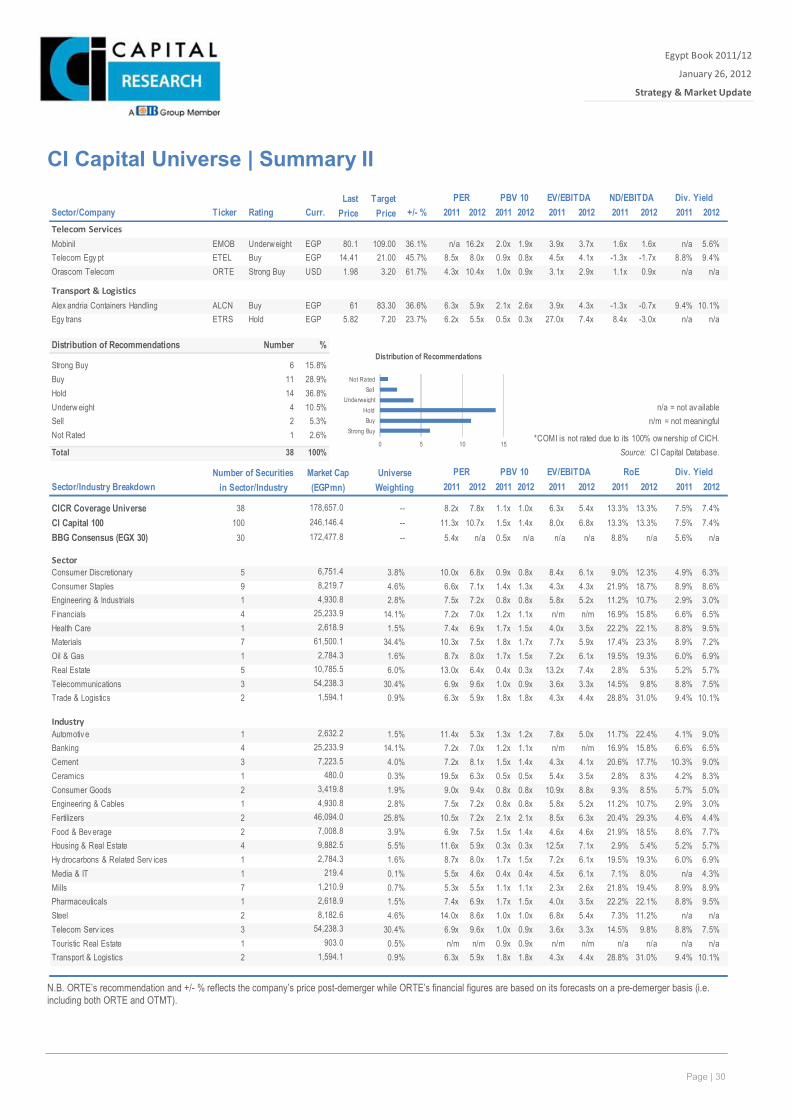
Page | 30
Egypt Book 2011/12
January 26, 2012
Strategy & Market Update
Xxx
CI Capital Universe | Summary II
N.B. ORTE’s recommendation and +/- % reflects the company’s price post-demerger while ORTE’s financial figures are based on its forecasts on a pre-demerger basis (i.e. including both ORTE and OTMT).
Sector/Company Ticker Rating Curr. +/- % 2011 2012 2011 2012 2011 2012 2011 2012 2011 2012Telecom ServicesMobinil EMOB Underweight EGP 80.1 109.00 36.1% n/a 16.2x 2.0x 1.9x 3.9x 3.7x 1.6x 1.6x n/a 5.6%Telecom Egy pt ETEL Buy EGP 14.41 21.00 45.7% 8.5x 8.0x 0.9x 0.8x 4.5x 4.1x -1.3x -1.7x 8.8% 9.4%Orascom Telecom ORTE Strong Buy USD 1.98 3.20 61.7% 4.3x 10.4x 1.0x 0.9x 3.1x 2.9x 1.1x 0.9x n/a n/a
Transport & LogisticsAlex andria Containers Handling ALCN Buy EGP 61 83.30 36.6% 6.3x 5.9x 2.1x 2.6x 3.9x 4.3x -1.3x -0.7x 9.4% 10.1%Egy trans ETRS Hold EGP 5.82 7.20 23.7% 6.2x 5.5x 0.5x 0.3x 27.0x 7.4x 8.4x -3.0x n/a n/a
Distribution of Recommendations Number %
Strong Buy 6 15.8%Buy 11 28.9%Hold 14 36.8%Underw eight 4 10.5% n/a = not av ailableSell 2 5.3% n/m = not meaningfulNot Rated 1 2.6% *COMI is not rated due to its 100% ownership of CICH.Total 38 100% Source: CI Capital Database.
Sector/Industry Breakdown 2011 2012 2011 2012 2011 2012 2011 2012 2011 2012
CICR Coverage Universe 38 8.2x 7.8x 1.1x 1.0x 6.3x 5.4x 13.3% 13.3% 7.5% 7.4%CI Capital 100 100 11.3x 10.7x 1.5x 1.4x 8.0x 6.8x 13.3% 13.3% 7.5% 7.4%BBG Consensus (EGX 30) 30 5.4x n/a 0.5x n/a n/a n/a 8.8% n/a 5.6% n/a
SectorConsumer Discretionary 5 10.0x 6.8x 0.9x 0.8x 8.4x 6.1x 9.0% 12.3% 4.9% 6.3%Consumer Staples 9 6.6x 7.1x 1.4x 1.3x 4.3x 4.3x 21.9% 18.7% 8.9% 8.6%Engineering & Industrials 1 7.5x 7.2x 0.8x 0.8x 5.8x 5.2x 11.2% 10.7% 2.9% 3.0%Financials 4 7.2x 7.0x 1.2x 1.1x n/m n/m 16.9% 15.8% 6.6% 6.5%Health Care 1 7.4x 6.9x 1.7x 1.5x 4.0x 3.5x 22.2% 22.1% 8.8% 9.5%Materials 7 10.3x 7.5x 1.8x 1.7x 7.7x 5.9x 17.4% 23.3% 8.9% 7.2%Oil & Gas 1 8.7x 8.0x 1.7x 1.5x 7.2x 6.1x 19.5% 19.3% 6.0% 6.9%Real Estate 5 13.0x 6.4x 0.4x 0.3x 13.2x 7.4x 2.8% 5.3% 5.2% 5.7%Telecommunications 3 6.9x 9.6x 1.0x 0.9x 3.6x 3.3x 14.5% 9.8% 8.8% 7.5%Trade & Logistics 2 6.3x 5.9x 1.8x 1.8x 4.3x 4.4x 28.8% 31.0% 9.4% 10.1%
IndustryAutomotiv e 1 11.4x 5.3x 1.3x 1.2x 7.8x 5.0x 11.7% 22.4% 4.1% 9.0%Banking 4 7.2x 7.0x 1.2x 1.1x n/m n/m 16.9% 15.8% 6.6% 6.5%Cement 3 7.2x 8.1x 1.5x 1.4x 4.3x 4.1x 20.6% 17.7% 10.3% 9.0%Ceramics 1 19.5x 6.3x 0.5x 0.5x 5.4x 3.5x 2.8% 8.3% 4.2% 8.3%Consumer Goods 2 9.0x 9.4x 0.8x 0.8x 10.9x 8.8x 9.3% 8.5% 5.7% 5.0%Engineering & Cables 1 7.5x 7.2x 0.8x 0.8x 5.8x 5.2x 11.2% 10.7% 2.9% 3.0%Fertilizers 2 10.5x 7.2x 2.1x 2.1x 8.5x 6.3x 20.4% 29.3% 4.6% 4.4%Food & Bev erage 2 6.9x 7.5x 1.5x 1.4x 4.6x 4.6x 21.9% 18.5% 8.6% 7.7%Housing & Real Estate 4 11.6x 5.9x 0.3x 0.3x 12.5x 7.1x 2.9% 5.4% 5.2% 5.7%Hy drocarbons & Related Serv ices 1 8.7x 8.0x 1.7x 1.5x 7.2x 6.1x 19.5% 19.3% 6.0% 6.9%Media & IT 1 5.5x 4.6x 0.4x 0.4x 4.5x 6.1x 7.1% 8.0% n/a 4.3%Mills 7 5.3x 5.5x 1.1x 1.1x 2.3x 2.6x 21.8% 19.4% 8.9% 8.9%Pharmaceuticals 1 7.4x 6.9x 1.7x 1.5x 4.0x 3.5x 22.2% 22.1% 8.8% 9.5%Steel 2 14.0x 8.6x 1.0x 1.0x 6.8x 5.4x 7.3% 11.2% n/a n/aTelecom Serv ices 3 6.9x 9.6x 1.0x 0.9x 3.6x 3.3x 14.5% 9.8% 8.8% 7.5%Touristic Real Estate 1 n/m n/m 0.9x 0.9x n/m n/m n/a n/a n/a n/aTransport & Logistics 2 6.3x 5.9x 1.8x 1.8x 4.3x 4.4x 28.8% 31.0% 9.4% 10.1%
Universe Weighting
Market Cap (EGPmn)
EV/EBITDA RoE Div. YieldPER PBV 10
Last Price
Target Price
PER PBV 10 EV/EBITDA ND/EBITDA Div. Yield
Number of Securities in Sector/Industry
6,751.48,219.74,930.8
25,233.92,618.9
61,500.12,784.3
10,785.554,238.3
1,594.1
2,632.225,233.9
7,223.5480.0
54,238.3903.0
1,594.1
178,657.0246,146.4172,477.8
2,784.3219.4
1,210.92,618.98,182.6
3,419.84,930.8
46,094.07,008.89,882.5
0.9%
1.5%14.1%4.0%0.3%1.9%2.8%
25.8%3.9%5.5%1.6%0.1%0.7%1.5%4.6%
30.4%
--
----
0.5%
0.9%
3.8%4.6%2.8%
14.1%1.5%
34.4%1.6%6.0%
30.4%
0 5 10 15
Strong BuyBuy
HoldUnderweight
SellNot Rated
Distribution of Recommendations
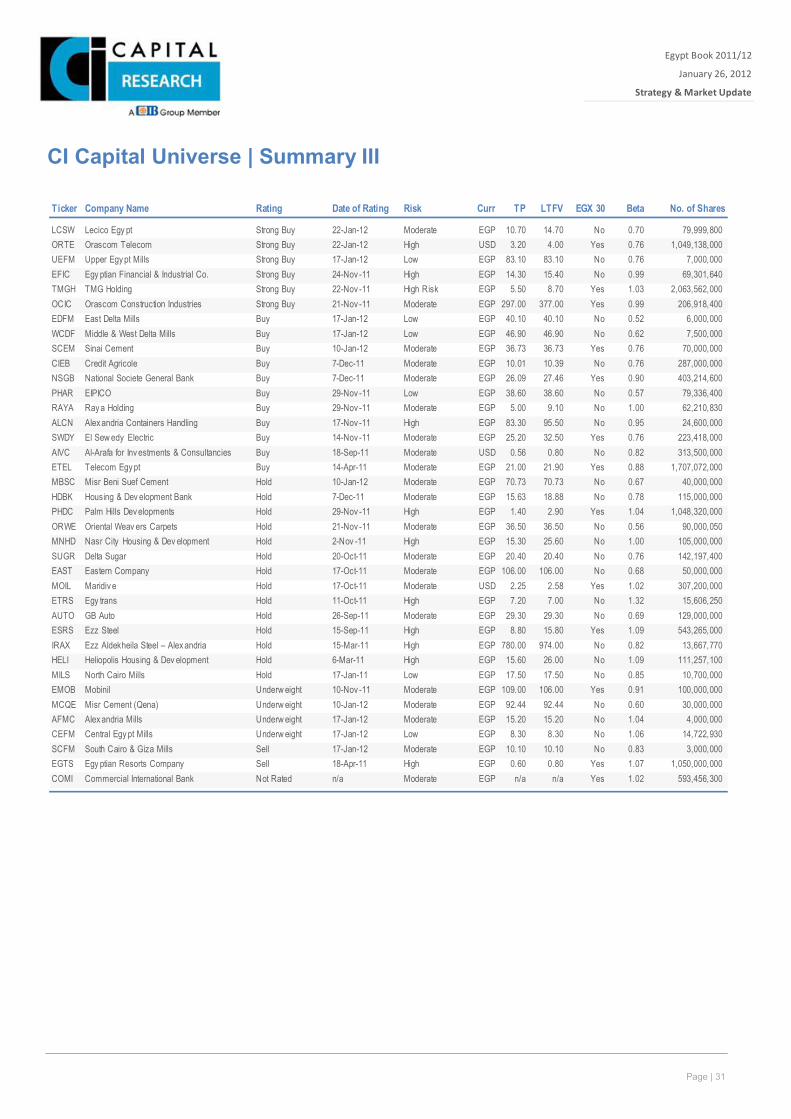
Page | 31
Egypt Book 2011/12
January 26, 2012
Strategy & Market Update
Xxx
CI Capital Universe | Summary III
Ticker Company Name Rating Date of Rating Risk Curr TP LTFV EGX 30 Beta No. of Shares
LCSW Lecico Egy pt Strong Buy 22-Jan-12 Moderate EGP 10.70 14.70 No 0.70 79,999,800 ORTE Orascom Telecom Strong Buy 22-Jan-12 High USD 3.20 4.00 Yes 0.76 1,049,138,000 UEFM Upper Egy pt Mills Strong Buy 17-Jan-12 Low EGP 83.10 83.10 No 0.76 7,000,000 EFIC Egy ptian Financial & Industrial Co. Strong Buy 24-Nov -11 High EGP 14.30 15.40 No 0.99 69,301,640 TMGH TMG Holding Strong Buy 22-Nov -11 High Risk EGP 5.50 8.70 Yes 1.03 2,063,562,000 OCIC Orascom Construction Industries Strong Buy 21-Nov -11 Moderate EGP 297.00 377.00 Yes 0.99 206,918,400 EDFM East Delta Mills Buy 17-Jan-12 Low EGP 40.10 40.10 No 0.52 6,000,000 WCDF Middle & West Delta Mills Buy 17-Jan-12 Low EGP 46.90 46.90 No 0.62 7,500,000 SCEM Sinai Cement Buy 10-Jan-12 Moderate EGP 36.73 36.73 Yes 0.76 70,000,000 CIEB Credit Agricole Buy 7-Dec-11 Moderate EGP 10.01 10.39 No 0.76 287,000,000 NSGB National Societe General Bank Buy 7-Dec-11 Moderate EGP 26.09 27.46 Yes 0.90 403,214,600 PHAR EIPICO Buy 29-Nov -11 Low EGP 38.60 38.60 No 0.57 79,336,400 RAYA Ray a Holding Buy 29-Nov -11 Moderate EGP 5.00 9.10 No 1.00 62,210,830 ALCN Alex andria Containers Handling Buy 17-Nov -11 High EGP 83.30 95.50 No 0.95 24,600,000 SWDY El Sew edy Electric Buy 14-Nov -11 Moderate EGP 25.20 32.50 Yes 0.76 223,418,000 AIVC Al-Arafa for Inv estments & Consultancies Buy 18-Sep-11 Moderate USD 0.56 0.80 No 0.82 313,500,000 ETEL Telecom Egy pt Buy 14-Apr-11 Moderate EGP 21.00 21.90 Yes 0.88 1,707,072,000 MBSC Misr Beni Suef Cement Hold 10-Jan-12 Moderate EGP 70.73 70.73 No 0.67 40,000,000 HDBK Housing & Dev elopment Bank Hold 7-Dec-11 Moderate EGP 15.63 18.88 No 0.78 115,000,000 PHDC Palm Hills Dev elopments Hold 29-Nov -11 High EGP 1.40 2.90 Yes 1.04 1,048,320,000 ORWE Oriental Weav ers Carpets Hold 21-Nov -11 Moderate EGP 36.50 36.50 No 0.56 90,000,050 MNHD Nasr City Housing & Dev elopment Hold 2-Nov -11 High EGP 15.30 25.60 No 1.00 105,000,000 SUGR Delta Sugar Hold 20-Oct-11 Moderate EGP 20.40 20.40 No 0.76 142,197,400 EAST Eastern Company Hold 17-Oct-11 Moderate EGP 106.00 106.00 No 0.68 50,000,000 MOIL Maridiv e Hold 17-Oct-11 Moderate USD 2.25 2.58 Yes 1.02 307,200,000 ETRS Egy trans Hold 11-Oct-11 High EGP 7.20 7.00 No 1.32 15,606,250 AUTO GB Auto Hold 26-Sep-11 Moderate EGP 29.30 29.30 No 0.69 129,000,000 ESRS Ezz Steel Hold 15-Sep-11 High EGP 8.80 15.80 Yes 1.09 543,265,000 IRAX Ezz Aldekheila Steel – Alex andria Hold 15-Mar-11 High EGP 780.00 974.00 No 0.82 13,667,770 HELI Heliopolis Housing & Dev elopment Hold 6-Mar-11 High EGP 15.60 26.00 No 1.09 111,257,100 MILS North Cairo Mills Hold 17-Jan-11 Low EGP 17.50 17.50 No 0.85 10,700,000 EMOB Mobinil Underw eight 10-Nov -11 Moderate EGP 109.00 106.00 Yes 0.91 100,000,000 MCQE Misr Cement (Qena) Underw eight 10-Jan-12 Moderate EGP 92.44 92.44 No 0.60 30,000,000 AFMC Alex andria Mills Underw eight 17-Jan-12 Moderate EGP 15.20 15.20 No 1.04 4,000,000 CEFM Central Egy pt Mills Underw eight 17-Jan-12 Low EGP 8.30 8.30 No 1.06 14,722,930 SCFM South Cairo & Giza Mills Sell 17-Jan-12 Moderate EGP 10.10 10.10 No 0.83 3,000,000 EGTS Egy ptian Resorts Company Sell 18-Apr-11 High EGP 0.60 0.80 Yes 1.07 1,050,000,000 COMI Commercial International Bank Not Rated n/a Moderate EGP n/a n/a Yes 1.02 593,456,300
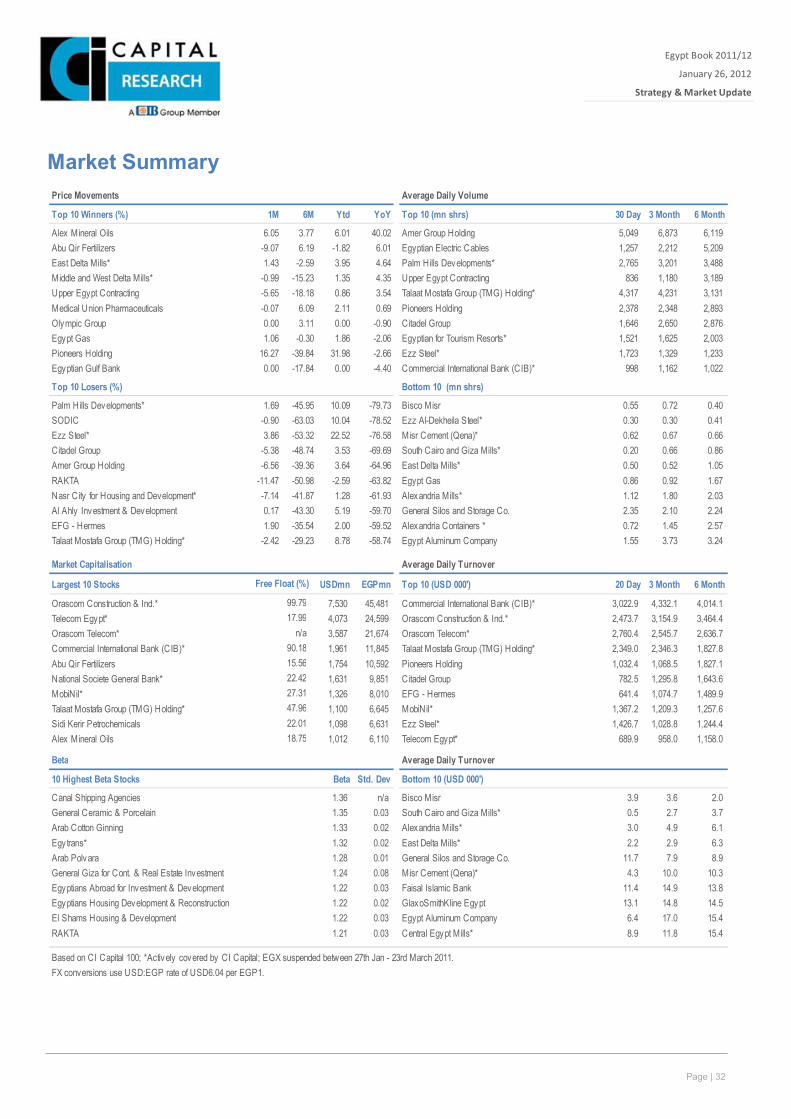
Page | 32
Egypt Book 2011/12
January 26, 2012
Strategy & Market Update
Xxx
Market Summary
Price Movements Average Daily Volume
Top 10 Winners (%) 1M 6M Ytd YoY Top 10 (mn shrs) 30 Day 3 Month 6 Month
Alex Mineral Oils 6.05 3.77 6.01 40.02 Amer Group Holding 5,049 6,873 6,119 Abu Qir Fertilizers -9.07 6.19 -1.82 6.01 Egyptian Electric Cables 1,257 2,212 5,209 East Delta Mills* 1.43 -2.59 3.95 4.64 Palm Hills Developments* 2,765 3,201 3,488 Middle and West Delta Mills* -0.99 -15.23 1.35 4.35 Upper Egypt Contracting 836 1,180 3,189 Upper Egypt Contracting -5.65 -18.18 0.86 3.54 Talaat Mostafa Group (TMG) Holding* 4,317 4,231 3,131 Medical Union Pharmaceuticals -0.07 6.09 2.11 0.69 Pioneers Holding 2,378 2,348 2,893 Olympic Group 0.00 3.11 0.00 -0.90 Citadel Group 1,646 2,650 2,876 Egypt Gas 1.06 -0.30 1.86 -2.06 Egyptian for Tourism Resorts* 1,521 1,625 2,003 Pioneers Holding 16.27 -39.84 31.98 -2.66 Ezz Steel* 1,723 1,329 1,233 Egyptian Gulf Bank 0.00 -17.84 0.00 -4.40 Commercial International Bank (CIB)* 998 1,162 1,022
Top 10 Losers (%) Bottom 10 (mn shrs)
Palm Hills Developments* 1.69 -45.95 10.09 -79.73 Bisco Misr 0.55 0.72 0.40 SODIC -0.90 -63.03 10.04 -78.52 Ezz Al-Dekheila Steel* 0.30 0.30 0.41 Ezz Steel* 3.86 -53.32 22.52 -76.58 Misr Cement (Qena)* 0.62 0.67 0.66 Citadel Group -5.38 -48.74 3.53 -69.69 South Cairo and Giza Mills* 0.20 0.66 0.86 Amer Group Holding -6.56 -39.36 3.64 -64.96 East Delta Mills* 0.50 0.52 1.05 RAKTA -11.47 -50.98 -2.59 -63.82 Egypt Gas 0.86 0.92 1.67 Nasr City for Housing and Development* -7.14 -41.87 1.28 -61.93 Alexandria Mills* 1.12 1.80 2.03 Al Ahly Investment & Development 0.17 -43.30 5.19 -59.70 General Silos and Storage Co. 2.35 2.10 2.24 EFG - Hermes 1.90 -35.54 2.00 -59.52 Alexandria Containers * 0.72 1.45 2.57 Talaat Mostafa Group (TMG) Holding* -2.42 -29.23 8.78 -58.74 Egypt Aluminum Company 1.55 3.73 3.24
Market Capitalisation Average Daily Turnover
Largest 10 Stocks USDmn EGPmn Top 10 (USD 000') 20 Day 3 Month 6 Month
Orascom Construction & Ind.* 7,530 45,481 Commercial International Bank (CIB)* 3,022.9 4,332.1 4,014.1 Telecom Egypt* 4,073 24,599 Orascom Construction & Ind.* 2,473.7 3,154.9 3,464.4 Orascom Telecom* 3,587 21,674 Orascom Telecom* 2,760.4 2,545.7 2,636.7 Commercial International Bank (CIB)* 1,961 11,845 Talaat Mostafa Group (TMG) Holding* 2,349.0 2,346.3 1,827.8 Abu Qir Fertilizers 1,754 10,592 Pioneers Holding 1,032.4 1,068.5 1,827.1 National Societe General Bank* 1,631 9,851 Citadel Group 782.5 1,295.8 1,643.6 MobiNil* 1,326 8,010 EFG - Hermes 641.4 1,074.7 1,489.9 Talaat Mostafa Group (TMG) Holding* 1,100 6,645 MobiNil* 1,367.2 1,209.3 1,257.6 Sidi Kerir Petrochemicals 1,098 6,631 Ezz Steel* 1,426.7 1,028.8 1,244.4 Alex Mineral Oils 1,012 6,110 Telecom Egypt* 689.9 958.0 1,158.0
Beta Average Daily Turnover
10 Highest Beta Stocks Beta Std. Dev Bottom 10 (USD 000')
Canal Shipping Agencies 1.36 n/a Bisco Misr 3.9 3.6 2.0 General Ceramic & Porcelain 1.35 0.03 South Cairo and Giza Mills* 0.5 2.7 3.7 Arab Cotton Ginning 1.33 0.02 Alexandria Mills* 3.0 4.9 6.1 Egy trans* 1.32 0.02 East Delta Mills* 2.2 2.9 6.3 Arab Polvara 1.28 0.01 General Silos and Storage Co. 11.7 7.9 8.9 General Giza for Cont. & Real Estate Investment 1.24 0.08 Misr Cement (Qena)* 4.3 10.0 10.3 Egyptians Abroad for Investment & Development 1.22 0.03 Faisal Islamic Bank 11.4 14.9 13.8 Egyptians Housing Development & Reconstruction 1.22 0.02 GlaxoSmithKline Egypt 13.1 14.8 14.5 El Shams Housing & Development 1.22 0.03 Egypt Aluminum Company 6.4 17.0 15.4 RAKTA 1.21 0.03 Central Egypt Mills* 8.9 11.8 15.4
Based on CI Capital 100; *Actively covered by CI Capital; EGX suspended between 27th Jan - 23rd March 2011.FX conversions use USD:EGP rate of USD6.04 per EGP1.
22.4227.3147.9622.0118.75
15.56
Free Float (%)
99.7917.99
n/a90.18
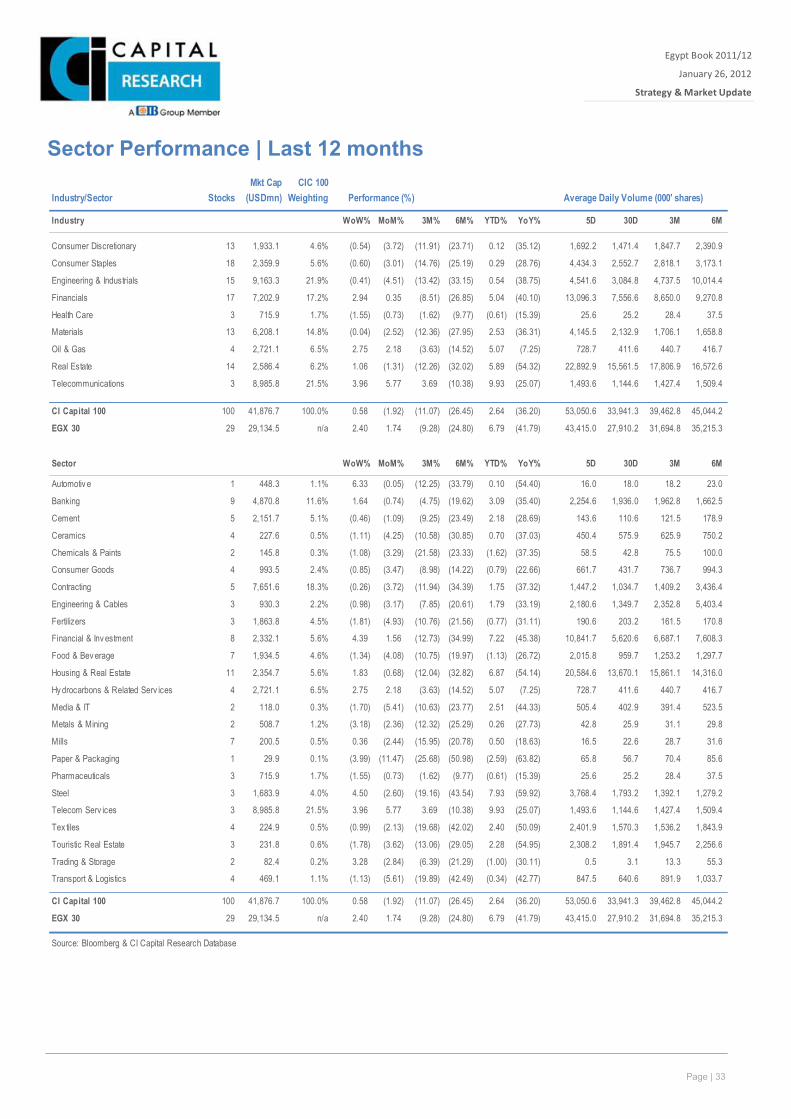
Page | 33
Egypt Book 2011/12
January 26, 2012
Strategy & Market Update
Xxx
Sector Performance | Last 12 months
Industry/Sector StocksMkt Cap
(USDmn)CIC 100
Weighting Performance (%) Average Daily Volume (000' shares)
Industry WoW% MoM% 3M% 6M% YTD% YoY% 5D 30D 3M 6M
Consumer Discretionary 13 1,933.1 4.6% (0.54) (3.72) (11.91) (23.71) 0.12 (35.12) 1,692.2 1,471.4 1,847.7 2,390.9
Consumer Staples 18 2,359.9 5.6% (0.60) (3.01) (14.76) (25.19) 0.29 (28.76) 4,434.3 2,552.7 2,818.1 3,173.1
Engineering & Industrials 15 9,163.3 21.9% (0.41) (4.51) (13.42) (33.15) 0.54 (38.75) 4,541.6 3,084.8 4,737.5 10,014.4
Financials 17 7,202.9 17.2% 2.94 0.35 (8.51) (26.85) 5.04 (40.10) 13,096.3 7,556.6 8,650.0 9,270.8
Health Care 3 715.9 1.7% (1.55) (0.73) (1.62) (9.77) (0.61) (15.39) 25.6 25.2 28.4 37.5
Materials 13 6,208.1 14.8% (0.04) (2.52) (12.36) (27.95) 2.53 (36.31) 4,145.5 2,132.9 1,706.1 1,658.8
Oil & Gas 4 2,721.1 6.5% 2.75 2.18 (3.63) (14.52) 5.07 (7.25) 728.7 411.6 440.7 416.7
Real Estate 14 2,586.4 6.2% 1.06 (1.31) (12.26) (32.02) 5.89 (54.32) 22,892.9 15,561.5 17,806.9 16,572.6
Telecommunications 3 8,985.8 21.5% 3.96 5.77 3.69 (10.38) 9.93 (25.07) 1,493.6 1,144.6 1,427.4 1,509.4
CI Capital 100 100 41,876.7 100.0% 0.58 (1.92) (11.07) (26.45) 2.64 (36.20) 53,050.6 33,941.3 39,462.8 45,044.2
EGX 30 29 29,134.5 n/a 2.40 1.74 (9.28) (24.80) 6.79 (41.79) 43,415.0 27,910.2 31,694.8 35,215.3
Sector WoW% MoM% 3M% 6M% YTD% YoY% 5D 30D 3M 6M
Automotiv e 1 448.3 1.1% 6.33 (0.05) (12.25) (33.79) 0.10 (54.40) 16.0 18.0 18.2 23.0
Banking 9 4,870.8 11.6% 1.64 (0.74) (4.75) (19.62) 3.09 (35.40) 2,254.6 1,936.0 1,962.8 1,662.5
Cement 5 2,151.7 5.1% (0.46) (1.09) (9.25) (23.49) 2.18 (28.69) 143.6 110.6 121.5 178.9
Ceramics 4 227.6 0.5% (1.11) (4.25) (10.58) (30.85) 0.70 (37.03) 450.4 575.9 625.9 750.2
Chemicals & Paints 2 145.8 0.3% (1.08) (3.29) (21.58) (23.33) (1.62) (37.35) 58.5 42.8 75.5 100.0
Consumer Goods 4 993.5 2.4% (0.85) (3.47) (8.98) (14.22) (0.79) (22.66) 661.7 431.7 736.7 994.3
Contracting 5 7,651.6 18.3% (0.26) (3.72) (11.94) (34.39) 1.75 (37.32) 1,447.2 1,034.7 1,409.2 3,436.4
Engineering & Cables 3 930.3 2.2% (0.98) (3.17) (7.85) (20.61) 1.79 (33.19) 2,180.6 1,349.7 2,352.8 5,403.4
Fertilizers 3 1,863.8 4.5% (1.81) (4.93) (10.76) (21.56) (0.77) (31.11) 190.6 203.2 161.5 170.8
Financial & Inv estment 8 2,332.1 5.6% 4.39 1.56 (12.73) (34.99) 7.22 (45.38) 10,841.7 5,620.6 6,687.1 7,608.3
Food & Bev erage 7 1,934.5 4.6% (1.34) (4.08) (10.75) (19.97) (1.13) (26.72) 2,015.8 959.7 1,253.2 1,297.7
Housing & Real Estate 11 2,354.7 5.6% 1.83 (0.68) (12.04) (32.82) 6.87 (54.14) 20,584.6 13,670.1 15,861.1 14,316.0
Hy drocarbons & Related Serv ices 4 2,721.1 6.5% 2.75 2.18 (3.63) (14.52) 5.07 (7.25) 728.7 411.6 440.7 416.7
Media & IT 2 118.0 0.3% (1.70) (5.41) (10.63) (23.77) 2.51 (44.33) 505.4 402.9 391.4 523.5
Metals & Mining 2 508.7 1.2% (3.18) (2.36) (12.32) (25.29) 0.26 (27.73) 42.8 25.9 31.1 29.8
Mills 7 200.5 0.5% 0.36 (2.44) (15.95) (20.78) 0.50 (18.63) 16.5 22.6 28.7 31.6
Paper & Packaging 1 29.9 0.1% (3.99) (11.47) (25.68) (50.98) (2.59) (63.82) 65.8 56.7 70.4 85.6
Pharmaceuticals 3 715.9 1.7% (1.55) (0.73) (1.62) (9.77) (0.61) (15.39) 25.6 25.2 28.4 37.5
Steel 3 1,683.9 4.0% 4.50 (2.60) (19.16) (43.54) 7.93 (59.92) 3,768.4 1,793.2 1,392.1 1,279.2
Telecom Serv ices 3 8,985.8 21.5% 3.96 5.77 3.69 (10.38) 9.93 (25.07) 1,493.6 1,144.6 1,427.4 1,509.4
Tex tiles 4 224.9 0.5% (0.99) (2.13) (19.68) (42.02) 2.40 (50.09) 2,401.9 1,570.3 1,536.2 1,843.9
Touristic Real Estate 3 231.8 0.6% (1.78) (3.62) (13.06) (29.05) 2.28 (54.95) 2,308.2 1,891.4 1,945.7 2,256.6
Trading & Storage 2 82.4 0.2% 3.28 (2.84) (6.39) (21.29) (1.00) (30.11) 0.5 3.1 13.3 55.3
Transport & Logistics 4 469.1 1.1% (1.13) (5.61) (19.89) (42.49) (0.34) (42.77) 847.5 640.6 891.9 1,033.7
CI Capital 100 100 41,876.7 100.0% 0.58 (1.92) (11.07) (26.45) 2.64 (36.20) 53,050.6 33,941.3 39,462.8 45,044.2
EGX 30 29 29,134.5 n/a 2.40 1.74 (9.28) (24.80) 6.79 (41.79) 43,415.0 27,910.2 31,694.8 35,215.3
Source: Bloomberg & CI Capital Research Database
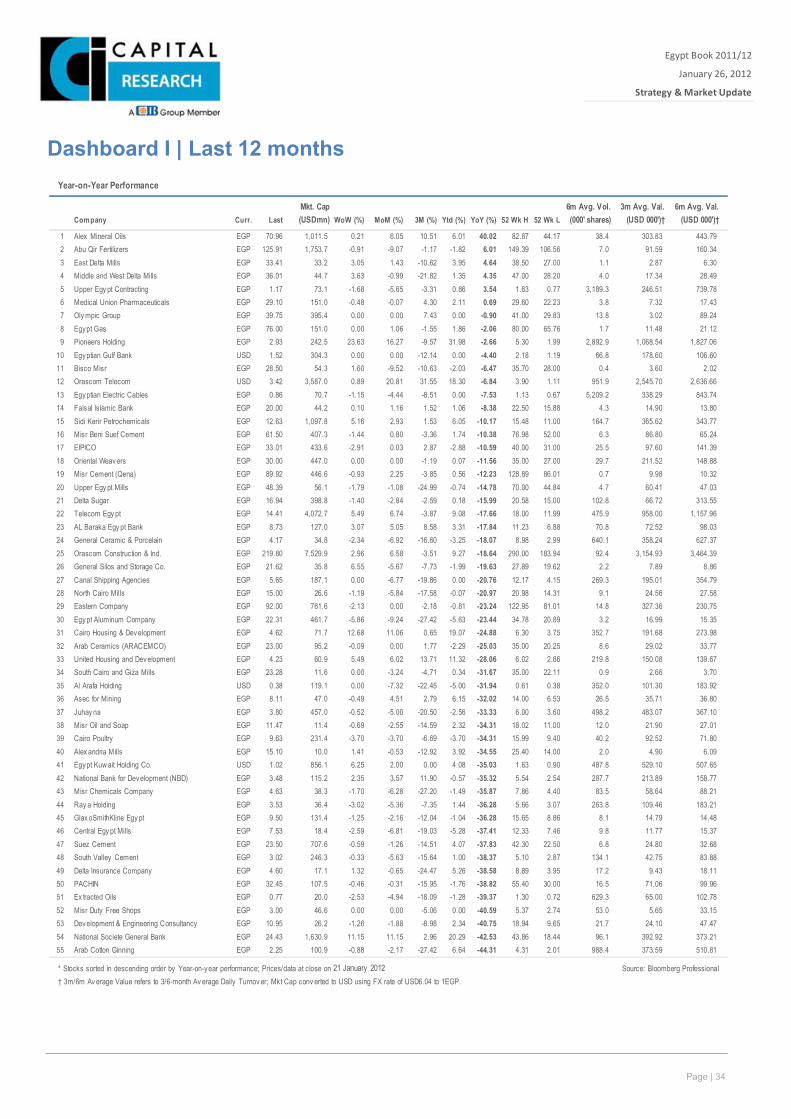
Page | 34
Egypt Book 2011/12
January 26, 2012
Strategy & Market Update
Xxx
Dashboard I | Last 12 months
Year-on-Year Performance
Company Curr. LastMkt. Cap (USDmn) WoW (%) MoM (%) 3M (%) Ytd (%) YoY (%) 52 Wk H 52 Wk L
6m Avg. Vol. (000' shares)
3m Avg. Val. (USD 000')†
6m Avg. Val. (USD 000')†(000' shares)
1 Alex Mineral Oils EGP 70.96 1,011.5 0.21 6.05 10.51 6.01 40.02 82.87 44.17 38.4 303.83 443.79 2 Abu Qir Fertilizers EGP 125.91 1,753.7 -0.91 -9.07 -1.17 -1.82 6.01 149.39 106.56 7.0 91.59 160.34 3 East Delta Mills EGP 33.41 33.2 3.05 1.43 -10.62 3.95 4.64 38.50 27.00 1.1 2.87 6.30 4 Middle and West Delta Mills EGP 36.01 44.7 3.63 -0.99 -21.82 1.35 4.35 47.00 28.20 4.0 17.34 28.49 5 Upper Egy pt Contracting EGP 1.17 73.1 -1.68 -5.65 -3.31 0.86 3.54 1.63 0.77 3,189.3 246.51 739.78 6 Medical Union Pharmaceuticals EGP 29.10 151.0 -0.48 -0.07 4.30 2.11 0.69 29.60 22.23 3.8 7.32 17.43 7 Oly mpic Group EGP 39.75 395.4 0.00 0.00 7.43 0.00 -0.90 41.00 29.83 13.8 3.02 89.24 8 Egypt Gas EGP 76.00 151.0 0.00 1.06 -1.55 1.86 -2.06 80.00 65.76 1.7 11.48 21.12 9 Pioneers Holding EGP 2.93 242.5 23.63 16.27 -9.57 31.98 -2.66 5.30 1.99 2,892.9 1,068.54 1,827.06
10 Egyptian Gulf Bank USD 1.52 304.3 0.00 0.00 -12.14 0.00 -4.40 2.18 1.19 66.8 178.60 106.60 11 Bisco Misr EGP 28.50 54.3 1.60 -9.52 -10.63 -2.03 -6.47 35.70 28.00 0.4 3.60 2.02 12 Orascom Telecom USD 3.42 3,587.0 0.89 20.81 31.55 18.30 -6.84 3.90 1.11 951.9 2,545.70 2,636.66 13 Egyptian Electric Cables EGP 0.86 70.7 -1.15 -4.44 -8.51 0.00 -7.53 1.13 0.67 5,209.2 338.29 843.74 14 Faisal Islamic Bank EGP 20.00 44.2 0.10 1.16 1.52 1.06 -8.38 22.50 15.88 4.3 14.90 13.80 15 Sidi Kerir Petrochemicals EGP 12.63 1,097.8 5.16 2.93 1.53 6.05 -10.17 15.48 11.00 164.7 365.62 343.77 16 Misr Beni Suef Cement EGP 61.50 407.3 -1.44 0.80 -3.36 1.74 -10.38 76.98 52.00 6.3 86.80 65.24 17 EIPICO EGP 33.01 433.6 -2.91 0.03 2.87 -2.88 -10.59 40.00 31.00 25.5 97.60 141.39 18 Oriental Weav ers EGP 30.00 447.0 0.00 0.00 -1.19 0.07 -11.56 35.00 27.00 29.7 211.52 148.88 19 Misr Cement (Qena) EGP 89.92 446.6 -0.93 2.25 -3.85 0.56 -12.23 128.89 86.01 0.7 9.98 10.32 20 Upper Egy pt Mills EGP 48.39 56.1 -1.79 -1.08 -24.99 -0.74 -14.78 70.00 44.84 4.7 60.41 47.03 21 Delta Sugar EGP 16.94 398.8 -1.40 -2.84 -2.59 0.18 -15.99 20.58 15.00 102.8 66.72 313.55 22 Telecom Egy pt EGP 14.41 4,072.7 5.49 6.74 -3.87 9.08 -17.66 18.00 11.99 475.9 958.00 1,157.96 23 AL Baraka Egy pt Bank EGP 8.73 127.0 3.07 5.05 8.58 3.31 -17.84 11.23 6.88 70.8 72.52 98.03 24 General Ceramic & Porcelain EGP 4.17 34.8 -2.34 -6.92 -16.60 -3.25 -18.07 8.98 2.99 640.1 358.24 627.37 25 Orascom Construction & Ind. EGP 219.80 7,529.9 2.96 6.58 -3.51 9.27 -18.64 290.00 183.94 92.4 3,154.93 3,464.39 26 General Silos and Storage Co. EGP 21.62 35.8 6.55 -5.67 -7.73 -1.99 -19.63 27.89 19.62 2.2 7.89 8.86 27 Canal Shipping Agencies EGP 5.65 187.1 0.00 -6.77 -19.86 0.00 -20.76 12.17 4.15 269.3 195.01 354.79 28 North Cairo Mills EGP 15.00 26.6 -1.19 -5.84 -17.58 -0.07 -20.97 20.98 14.31 9.1 24.56 27.58 29 Eastern Company EGP 92.00 761.6 -2.13 0.00 -2.18 -0.81 -23.24 122.95 81.01 14.8 327.36 230.75 30 Egypt Aluminum Company EGP 22.31 461.7 -5.86 -9.24 -27.42 -5.63 -23.44 34.78 20.89 3.2 16.99 15.35 31 Cairo Housing & Development EGP 4.62 71.7 12.68 11.06 0.65 19.07 -24.88 6.30 3.75 352.7 191.68 273.98 32 Arab Ceramics (ARACEMCO) EGP 23.00 95.2 -0.09 0.00 1.77 -2.29 -25.03 35.00 20.25 8.6 29.02 33.77 33 United Housing and Development EGP 4.23 60.9 5.49 6.02 13.71 11.32 -28.06 6.02 2.86 219.8 150.08 139.67 34 South Cairo and Giza Mills EGP 23.28 11.6 0.00 -3.24 -4.71 0.34 -31.67 35.00 22.11 0.9 2.66 3.70 35 Al Arafa Holding USD 0.38 119.1 0.00 -7.32 -22.45 -5.00 -31.94 0.61 0.38 352.0 101.30 183.92 36 Asec for Mining EGP 8.11 47.0 -0.49 4.51 2.79 6.15 -32.02 14.00 6.53 26.5 35.71 36.80 37 Juhay na EGP 3.80 457.0 -0.52 -5.00 -20.50 -2.56 -33.33 6.00 3.60 498.2 483.07 367.10 38 Misr Oil and Soap EGP 11.47 11.4 -0.69 -2.55 -14.59 2.32 -34.31 18.02 11.00 12.0 21.90 27.01 39 Cairo Poultry EGP 9.63 231.4 -3.70 -3.70 -6.69 -3.70 -34.31 15.99 9.40 40.2 92.52 71.80 40 Alex andria Mills EGP 15.10 10.0 1.41 -0.53 -12.92 3.92 -34.55 25.40 14.00 2.0 4.90 6.09 41 Egypt Kuw ait Holding Co. USD 1.02 856.1 6.25 2.00 0.00 4.08 -35.03 1.63 0.90 487.8 529.10 507.65 42 National Bank for Development (NBD) EGP 3.48 115.2 2.35 3.57 11.90 -0.57 -35.32 5.54 2.54 287.7 213.89 158.77 43 Misr Chemicals Company EGP 4.63 38.3 -1.70 -6.28 -27.20 -1.49 -35.87 7.86 4.40 83.5 58.64 88.21 44 Ray a Holding EGP 3.53 36.4 -3.02 -5.36 -7.35 1.44 -36.28 5.66 3.07 263.8 109.46 183.21 45 Glax oSmithKline Egy pt EGP 9.50 131.4 -1.25 -2.16 -12.04 -1.04 -36.28 15.65 8.86 8.1 14.79 14.48 46 Central Egy pt Mills EGP 7.53 18.4 -2.59 -6.81 -19.03 -5.28 -37.41 12.33 7.46 9.8 11.77 15.37 47 Suez Cement EGP 23.50 707.6 -0.59 -1.26 -14.51 4.07 -37.83 42.30 22.50 6.8 24.80 32.68 48 South Valley Cement EGP 3.02 246.3 -0.33 -5.63 -15.64 1.00 -38.37 5.10 2.87 134.1 42.75 83.88 49 Delta Insurance Company EGP 4.60 17.1 1.32 -0.65 -24.47 5.26 -38.58 8.89 3.95 17.2 9.43 18.11 50 PACHIN EGP 32.45 107.5 -0.46 -0.31 -15.95 -1.76 -38.82 55.40 30.00 16.5 71.06 99.96 51 Ex tracted Oils EGP 0.77 20.0 -2.53 -4.94 -18.09 -1.28 -39.37 1.30 0.72 629.3 65.00 102.78 52 Misr Duty Free Shops EGP 3.00 46.6 0.00 0.00 -5.06 0.00 -40.59 5.37 2.74 53.0 5.65 33.15 53 Development & Engineering Consultancy EGP 10.95 26.2 -1.26 -1.88 -8.98 2.34 -40.75 18.94 9.65 21.7 24.10 47.47 54 National Societe General Bank EGP 24.43 1,630.9 11.15 11.15 2.96 20.29 -42.53 43.86 18.44 96.1 392.92 373.21 55 Arab Cotton Ginning EGP 2.25 100.9 -0.88 -2.17 -27.42 6.64 -44.31 4.31 2.01 988.4 373.59 510.81
* Stocks sorted in descending order by Year-on-year performance; Prices/data at close on: Source: Bloomberg Professional† 3m/6m Av erage Value refers to 3/6-month Av erage Daily Turnov er; Mkt Cap conv erted to USD using FX rate of USD6.04 to 1EGP.
21 January 2012
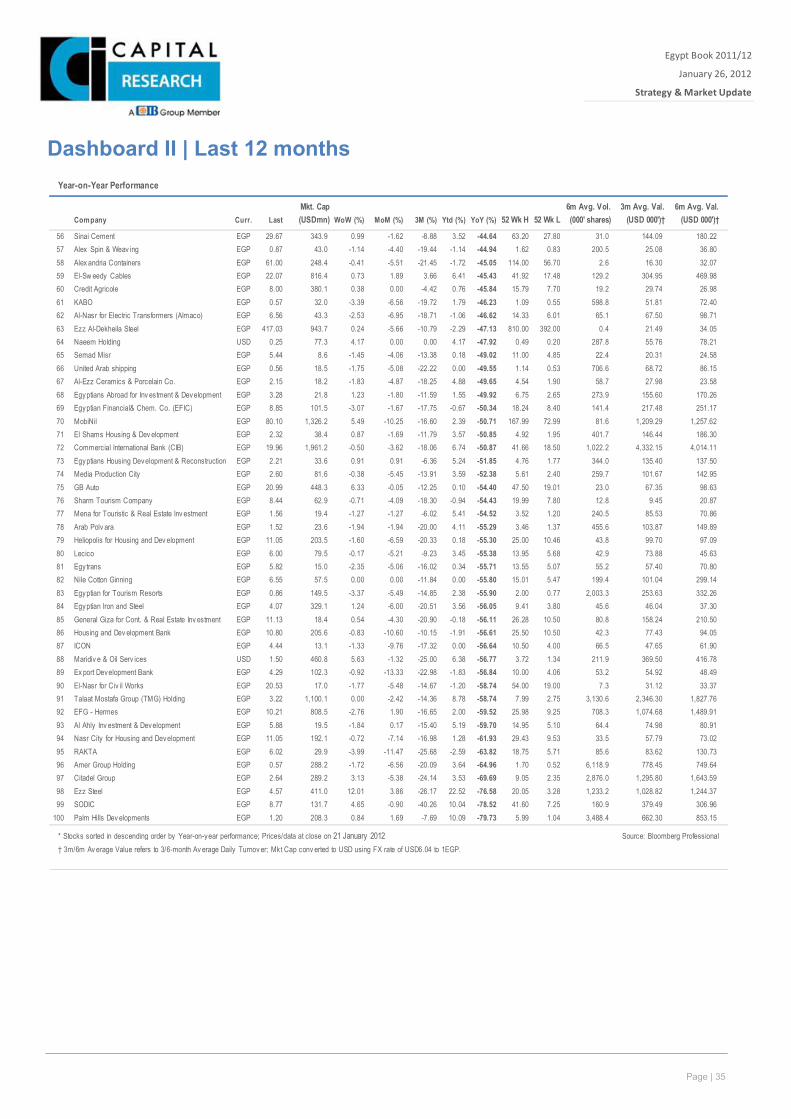
Page | 35
Egypt Book 2011/12
January 26, 2012
Strategy & Market Update
Xxx
Dashboard II | Last 12 months
Year-on-Year Performance
Company Curr. LastMkt. Cap (USDmn) WoW (%) MoM (%) 3M (%) Ytd (%) YoY (%) 52 Wk H 52 Wk L
6m Avg. Vol. (000' shares)
3m Avg. Val. (USD 000')†
6m Avg. Val. (USD 000')†(000' shares)
56 Sinai Cement EGP 29.67 343.9 0.99 -1.62 -8.88 3.52 -44.64 63.20 27.80 31.0 144.09 180.22 57 Alex Spin & Weav ing EGP 0.87 43.0 -1.14 -4.40 -19.44 -1.14 -44.94 1.62 0.83 200.5 25.08 36.80 58 Alex andria Containers EGP 61.00 248.4 -0.41 -5.51 -21.45 -1.72 -45.05 114.00 56.70 2.6 16.30 32.07 59 El-Sw eedy Cables EGP 22.07 816.4 0.73 1.89 3.66 6.41 -45.43 41.92 17.48 129.2 304.95 469.98 60 Credit Agricole EGP 8.00 380.1 0.38 0.00 -4.42 0.76 -45.84 15.79 7.70 19.2 29.74 26.98 61 KABO EGP 0.57 32.0 -3.39 -6.56 -19.72 1.79 -46.23 1.09 0.55 598.8 51.81 72.40 62 Al-Nasr for Electric Transformers (Almaco) EGP 6.56 43.3 -2.53 -6.95 -18.71 -1.06 -46.62 14.33 6.01 65.1 67.50 98.71 63 Ezz Al-Dekheila Steel EGP 417.03 943.7 0.24 -5.66 -10.79 -2.29 -47.13 810.00 392.00 0.4 21.49 34.05 64 Naeem Holding USD 0.25 77.3 4.17 0.00 0.00 4.17 -47.92 0.49 0.20 287.8 55.76 78.21 65 Semad Misr EGP 5.44 8.6 -1.45 -4.06 -13.38 0.18 -49.02 11.00 4.85 22.4 20.31 24.58 66 United Arab shipping EGP 0.56 18.5 -1.75 -5.08 -22.22 0.00 -49.55 1.14 0.53 706.6 68.72 86.15 67 Al-Ezz Ceramics & Porcelain Co. EGP 2.15 18.2 -1.83 -4.87 -18.25 4.88 -49.65 4.54 1.90 58.7 27.98 23.58 68 Egyptians Abroad for Inv estment & Development EGP 3.28 21.8 1.23 -1.80 -11.59 1.55 -49.92 6.75 2.65 273.9 155.60 170.26 69 Egyptian Financial& Chem. Co. (EFIC) EGP 8.85 101.5 -3.07 -1.67 -17.75 -0.67 -50.34 18.24 8.40 141.4 217.48 251.17 70 MobiNil EGP 80.10 1,326.2 5.49 -10.25 -16.60 2.39 -50.71 167.99 72.99 81.6 1,209.29 1,257.62 71 El Shams Housing & Dev elopment EGP 2.32 38.4 0.87 -1.69 -11.79 3.57 -50.85 4.92 1.95 401.7 146.44 186.30 72 Commercial International Bank (CIB) EGP 19.96 1,961.2 -0.50 -3.62 -18.06 6.74 -50.87 41.66 18.50 1,022.2 4,332.15 4,014.11 73 Egyptians Housing Development & Reconstruction EGP 2.21 33.6 0.91 0.91 -6.36 5.24 -51.85 4.76 1.77 344.0 135.40 137.50 74 Media Production City EGP 2.60 81.6 -0.38 -5.45 -13.91 3.59 -52.38 5.61 2.40 259.7 101.67 142.95 75 GB Auto EGP 20.99 448.3 6.33 -0.05 -12.25 0.10 -54.40 47.50 19.01 23.0 67.35 98.63 76 Sharm Tourism Company EGP 8.44 62.9 -0.71 -4.09 -18.30 -0.94 -54.43 19.99 7.80 12.8 9.45 20.87 77 Mena for Touristic & Real Estate Inv estment EGP 1.56 19.4 -1.27 -1.27 -6.02 5.41 -54.52 3.52 1.20 240.5 85.53 70.86 78 Arab Polv ara EGP 1.52 23.6 -1.94 -1.94 -20.00 4.11 -55.29 3.46 1.37 455.6 103.87 149.89 79 Heliopolis for Housing and Dev elopment EGP 11.05 203.5 -1.60 -6.59 -20.33 0.18 -55.30 25.00 10.46 43.8 99.70 97.09 80 Lecico EGP 6.00 79.5 -0.17 -5.21 -9.23 3.45 -55.38 13.95 5.68 42.9 73.88 45.63 81 Egy trans EGP 5.82 15.0 -2.35 -5.06 -16.02 0.34 -55.71 13.55 5.07 55.2 57.40 70.80 82 Nile Cotton Ginning EGP 6.55 57.5 0.00 0.00 -11.84 0.00 -55.80 15.01 5.47 199.4 101.04 299.14 83 Egyptian for Tourism Resorts EGP 0.86 149.5 -3.37 -5.49 -14.85 2.38 -55.90 2.00 0.77 2,003.3 253.63 332.26 84 Egyptian Iron and Steel EGP 4.07 329.1 1.24 -6.00 -20.51 3.56 -56.05 9.41 3.80 45.6 46.04 37.30 85 General Giza for Cont. & Real Estate Inv estment EGP 11.13 18.4 0.54 -4.30 -20.90 -0.18 -56.11 26.28 10.50 80.8 158.24 210.50 86 Housing and Dev elopment Bank EGP 10.80 205.6 -0.83 -10.60 -10.15 -1.91 -56.61 25.50 10.50 42.3 77.43 94.05 87 ICON EGP 4.44 13.1 -1.33 -9.76 -17.32 0.00 -56.64 10.50 4.00 66.5 47.65 61.90 88 Maridiv e & Oil Serv ices USD 1.50 460.8 5.63 -1.32 -25.00 6.38 -56.77 3.72 1.34 211.9 369.50 416.78 89 Ex port Development Bank EGP 4.29 102.3 -0.92 -13.33 -22.98 -1.83 -56.84 10.00 4.06 53.2 54.92 48.49 90 El-Nasr for Civ il Works EGP 20.53 17.0 -1.77 -5.48 -14.67 -1.20 -58.74 54.00 19.00 7.3 31.12 33.37 91 Talaat Mostafa Group (TMG) Holding EGP 3.22 1,100.1 0.00 -2.42 -14.36 8.78 -58.74 7.99 2.75 3,130.6 2,346.30 1,827.76 92 EFG - Hermes EGP 10.21 808.5 -2.76 1.90 -16.65 2.00 -59.52 25.98 9.25 708.3 1,074.68 1,489.91 93 Al Ahly Inv estment & Development EGP 5.88 19.5 -1.84 0.17 -15.40 5.19 -59.70 14.95 5.10 64.4 74.98 80.91 94 Nasr City for Housing and Development EGP 11.05 192.1 -0.72 -7.14 -16.98 1.28 -61.93 29.43 9.53 33.5 57.79 73.02 95 RAKTA EGP 6.02 29.9 -3.99 -11.47 -25.68 -2.59 -63.82 18.75 5.71 85.6 83.62 130.73 96 Amer Group Holding EGP 0.57 288.2 -1.72 -6.56 -20.09 3.64 -64.96 1.70 0.52 6,118.9 778.45 749.64 97 Citadel Group EGP 2.64 289.2 3.13 -5.38 -24.14 3.53 -69.69 9.05 2.35 2,876.0 1,295.80 1,643.59 98 Ezz Steel EGP 4.57 411.0 12.01 3.86 -26.17 22.52 -76.58 20.05 3.28 1,233.2 1,028.82 1,244.37 99 SODIC EGP 8.77 131.7 4.65 -0.90 -40.26 10.04 -78.52 41.60 7.25 160.9 379.49 306.96
100 Palm Hills Dev elopments EGP 1.20 208.3 0.84 1.69 -7.69 10.09 -79.73 5.99 1.04 3,488.4 662.30 853.15
* Stocks sorted in descending order by Year-on-year performance; Prices/data at close on: Source: Bloomberg Professional† 3m/6m Av erage Value refers to 3/6-month Av erage Daily Turnov er; Mkt Cap conv erted to USD using FX rate of USD6.04 to 1EGP.
21 January 2012
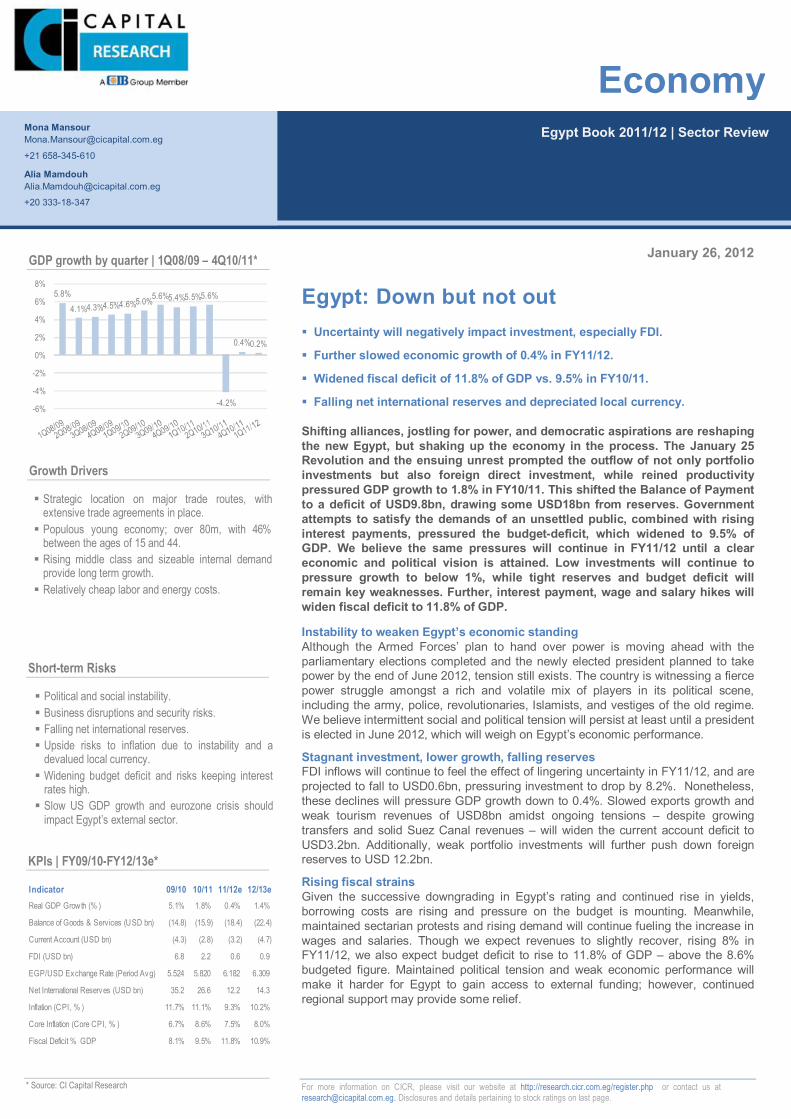
Page | 36
Page | 36
For more information on CICR, please visit our website at http://research.cicr.com.eg/register.php or contact us at [email protected]. Disclosures and details pertaining to stock ratings on last page.
January 26, 2012
Egypt: Down but not out Uncertainty will negatively impact investment, especially FDI.
Further slowed economic growth of 0.4% in FY11/12.
Widened fiscal deficit of 11.8% of GDP vs. 9.5% in FY10/11.
Falling net international reserves and depreciated local currency.
Shifting alliances, jostling for power, and democratic aspirations are reshaping the new Egypt, but shaking up the economy in the process. The January 25 Revolution and the ensuing unrest prompted the outflow of not only portfolio investments but also foreign direct investment, while reined productivity pressured GDP growth to 1.8% in FY10/11. This shifted the Balance of Payment to a deficit of USD9.8bn, drawing some USD18bn from reserves. Government attempts to satisfy the demands of an unsettled public, combined with rising interest payments, pressured the budget-deficit, which widened to 9.5% of GDP. We believe the same pressures will continue in FY11/12 until a clear economic and political vision is attained. Low investments will continue to pressure growth to below 1%, while tight reserves and budget deficit will remain key weaknesses. Further, interest payment, wage and salary hikes will widen fiscal deficit to 11.8% of GDP.
Instability to weaken Egypt’s economic standing Although the Armed Forces’ plan to hand over power is moving ahead with the parliamentary elections completed and the newly elected president planned to take power by the end of June 2012, tension still exists. The country is witnessing a fierce power struggle amongst a rich and volatile mix of players in its political scene, including the army, police, revolutionaries, Islamists, and vestiges of the old regime. We believe intermittent social and political tension will persist at least until a president is elected in June 2012, which will weigh on Egypt’s economic performance.
Stagnant investment, lower growth, falling reserves FDI inflows will continue to feel the effect of lingering uncertainty in FY11/12, and are projected to fall to USD0.6bn, pressuring investment to drop by 8.2%. Nonetheless, these declines will pressure GDP growth down to 0.4%. Slowed exports growth and weak tourism revenues of USD8bn amidst ongoing tensions – despite growing transfers and solid Suez Canal revenues – will widen the current account deficit to USD3.2bn. Additionally, weak portfolio investments will further push down foreign reserves to USD 12.2bn.
Rising fiscal strains Given the successive downgrading in Egypt’s rating and continued rise in yields, borrowing costs are rising and pressure on the budget is mounting. Meanwhile, maintained sectarian protests and rising demand will continue fueling the increase in wages and salaries. Though we expect revenues to slightly recover, rising 8% in FY11/12, we also expect budget deficit to rise to 11.8% of GDP – above the 8.6% budgeted figure. Maintained political tension and weak economic performance will make it harder for Egypt to gain access to external funding; however, continued regional support may provide some relief.
Egypt Book 2011/12 | Sector Review
Economy
Mona Mansour [email protected]
+21 658-345-610
Alia Mamdouh [email protected]
+20 333-18-347
Strategic location on major trade routes, with extensive trade agreements in place. Populous young economy; over 80m, with 46%
between the ages of 15 and 44. Rising middle class and sizeable internal demand
provide long term growth. Relatively cheap labor and energy costs.
Political and social instability. Business disruptions and security risks. Falling net international reserves. Upside risks to inflation due to instability and a
devalued local currency. Widening budget deficit and risks keeping interest
rates high. Slow US GDP growth and eurozone crisis should
impact Egypt’s external sector.
GDP growth by quarter | 1Q08/09 – 4Q10/11*
5.8%4.1%4.3%4.5%4.6%5.0%5.6%5.4%5.5%5.6%
-4.2%
0.4%0.2%
-6%
-4%
-2%
0%
2%
4%
6%
8%
Growth Drivers
Short-term Risks
Indicator 09/10 10/11 11/12e 12/13eReal GDP Growth (% ) 5.1% 1.8% 0.4% 1.4%
Balance of Goods & Services (USD bn) (14.8) (15.9) (18.4) (22.4)
Current Account (USD bn) (4.3) (2.8) (3.2) (4.7)
FDI (USD bn) 6.8 2.2 0.6 0.9
EGP/USD Exchange Rate (Period Avg) 5.524 5.820 6.182 6.309
Net International Reserves (USD bn) 35.2 26.6 12.2 14.3
Inflation (CPI, % ) 11.7% 11.1% 9.3% 10.2%
Core Inflation (Core CPI, % ) 6.7% 8.6% 7.5% 8.0%
Fiscal Deficit % GDP 8.1% 9.5% 11.8% 10.9%
KPIs | FY09/10-FY12/13e*
* Source: CI Capital Research
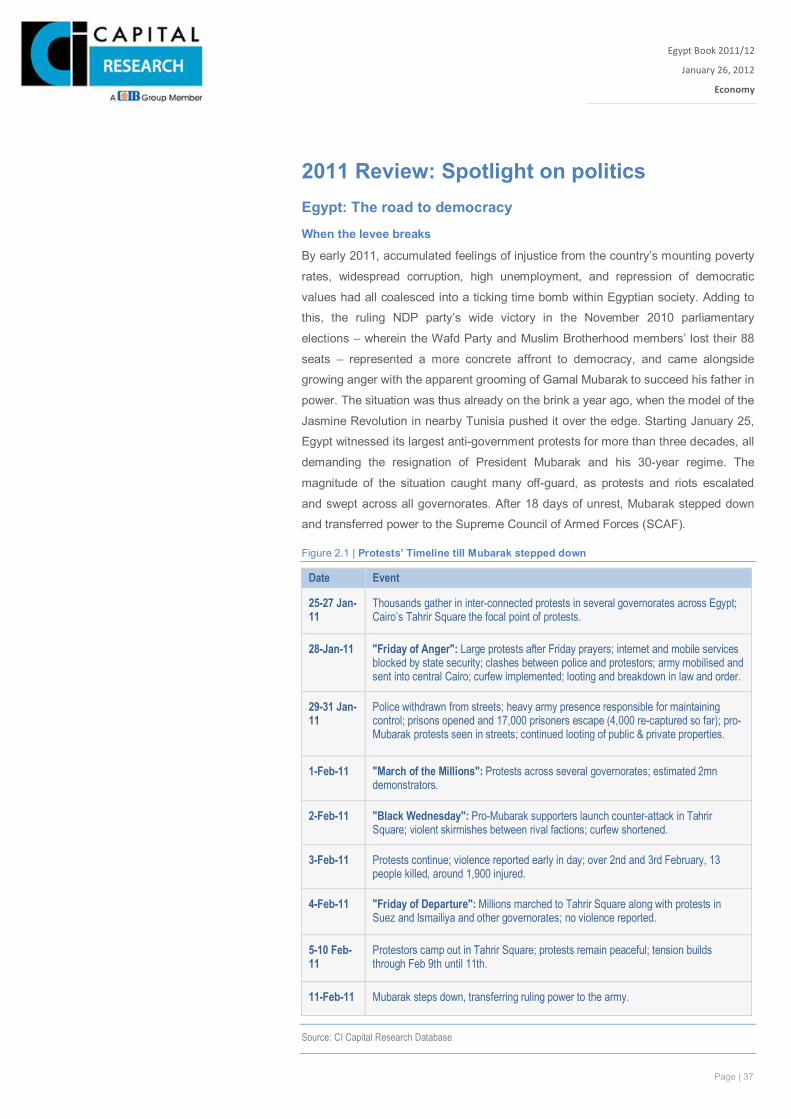
Page | 37
Egypt Book 2011/12
January 26, 2012
Economy
Xxx
2011 Review: Spotlight on politics Egypt: The road to democracy
When the levee breaks
By early 2011, accumulated feelings of injustice from the country’s mounting poverty
rates, widespread corruption, high unemployment, and repression of democratic
values had all coalesced into a ticking time bomb within Egyptian society. Adding to
this, the ruling NDP party’s wide victory in the November 2010 parliamentary
elections – wherein the Wafd Party and Muslim Brotherhood members’ lost their 88
seats – represented a more concrete affront to democracy, and came alongside
growing anger with the apparent grooming of Gamal Mubarak to succeed his father in
power. The situation was thus already on the brink a year ago, when the model of the
Jasmine Revolution in nearby Tunisia pushed it over the edge. Starting January 25,
Egypt witnessed its largest anti-government protests for more than three decades, all
demanding the resignation of President Mubarak and his 30-year regime. The
magnitude of the situation caught many off-guard, as protests and riots escalated
and swept across all governorates. After 18 days of unrest, Mubarak stepped down
and transferred power to the Supreme Council of Armed Forces (SCAF).
Figure 2.1 | Protests’ Timeline till Mubarak stepped down
Source: CI Capital Research Database
Date Event
25-27 Jan-11
Thousands gather in inter-connected protests in several governorates across Egypt; Cairo’s Tahrir Square the focal point of protests.
28-Jan-11 "Friday of Anger": Large protests after Friday prayers; internet and mobile services blocked by state security; clashes between police and protestors; army mobilised and sent into central Cairo; curfew implemented; looting and breakdown in law and order.
29-31 Jan-11
Police withdrawn from streets; heavy army presence responsible for maintaining control; prisons opened and 17,000 prisoners escape (4,000 re-captured so far); pro-Mubarak protests seen in streets; continued looting of public & private properties.
1-Feb-11 "March of the Millions": Protests across several governorates; estimated 2mn demonstrators.
2-Feb-11 "Black Wednesday": Pro-Mubarak supporters launch counter-attack in Tahrir Square; violent skirmishes between rival factions; curfew shortened.
3-Feb-11 Protests continue; violence reported early in day; over 2nd and 3rd February, 13 people killed, around 1,900 injured.
4-Feb-11 "Friday of Departure": Millions marched to Tahrir Square along with protests in Suez and Ismailiya and other governorates; no violence reported.
5-10 Feb-11
Protestors camp out in Tahrir Square; protests remain peaceful; tension builds through Feb 9th until 11th.
11-Feb-11 Mubarak steps down, transferring ruling power to the army.
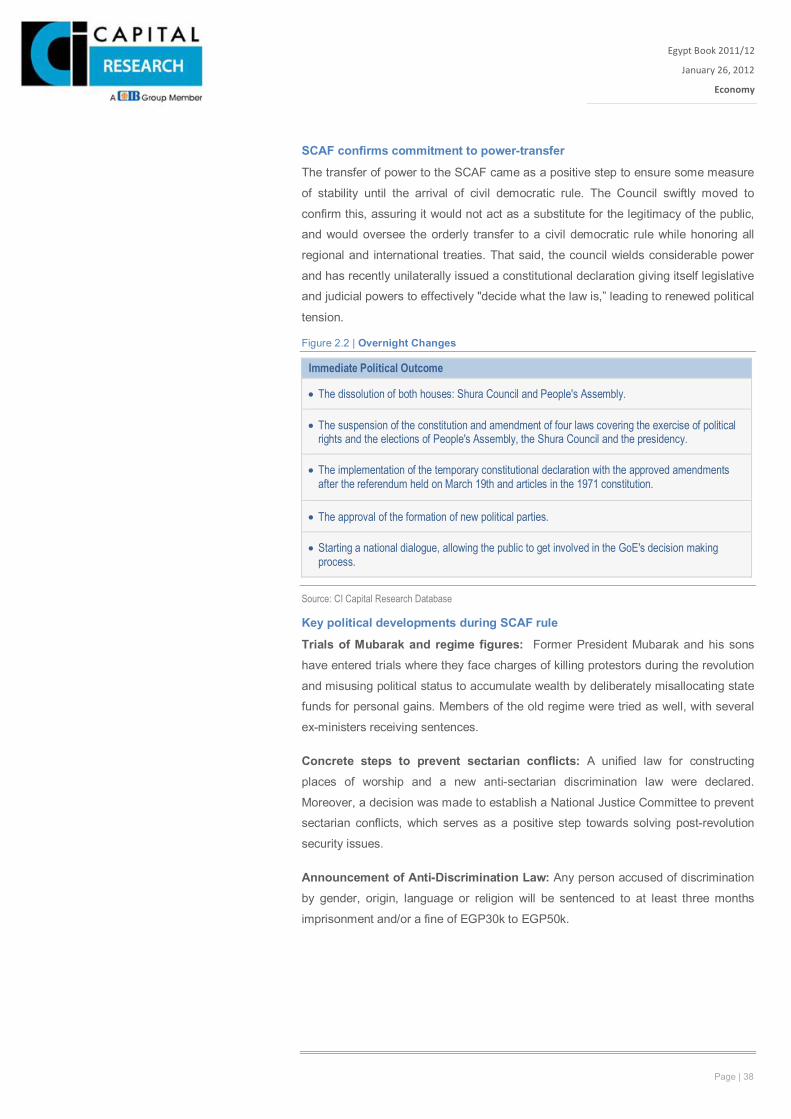
Page | 38
Egypt Book 2011/12
January 26, 2012
Economy
Xxx
SCAF confirms commitment to power-transfer
The transfer of power to the SCAF came as a positive step to ensure some measure
of stability until the arrival of civil democratic rule. The Council swiftly moved to
confirm this, assuring it would not act as a substitute for the legitimacy of the public,
and would oversee the orderly transfer to a civil democratic rule while honoring all
regional and international treaties. That said, the council wields considerable power
and has recently unilaterally issued a constitutional declaration giving itself legislative
and judicial powers to effectively "decide what the law is,” leading to renewed political
tension.
Figure 2.2 | Overnight Changes
Source: CI Capital Research Database
Key political developments during SCAF rule
Trials of Mubarak and regime figures: Former President Mubarak and his sons
have entered trials where they face charges of killing protestors during the revolution
and misusing political status to accumulate wealth by deliberately misallocating state
funds for personal gains. Members of the old regime were tried as well, with several
ex-ministers receiving sentences.
Concrete steps to prevent sectarian conflicts: A unified law for constructing
places of worship and a new anti-sectarian discrimination law were declared.
Moreover, a decision was made to establish a National Justice Committee to prevent
sectarian conflicts, which serves as a positive step towards solving post-revolution
security issues.
Announcement of Anti-Discrimination Law: Any person accused of discrimination
by gender, origin, language or religion will be sentenced to at least three months
imprisonment and/or a fine of EGP30k to EGP50k.
Immediate Political Outcome
The dissolution of both houses: Shura Council and People's Assembly.
The suspension of the constitution and amendment of four laws covering the exercise of political rights and the elections of People's Assembly, the Shura Council and the presidency.
The implementation of the temporary constitutional declaration with the approved amendments after the referendum held on March 19th and articles in the 1971 constitution.
The approval of the formation of new political parties.
Starting a national dialogue, allowing the public to get involved in the GoE's decision making process.
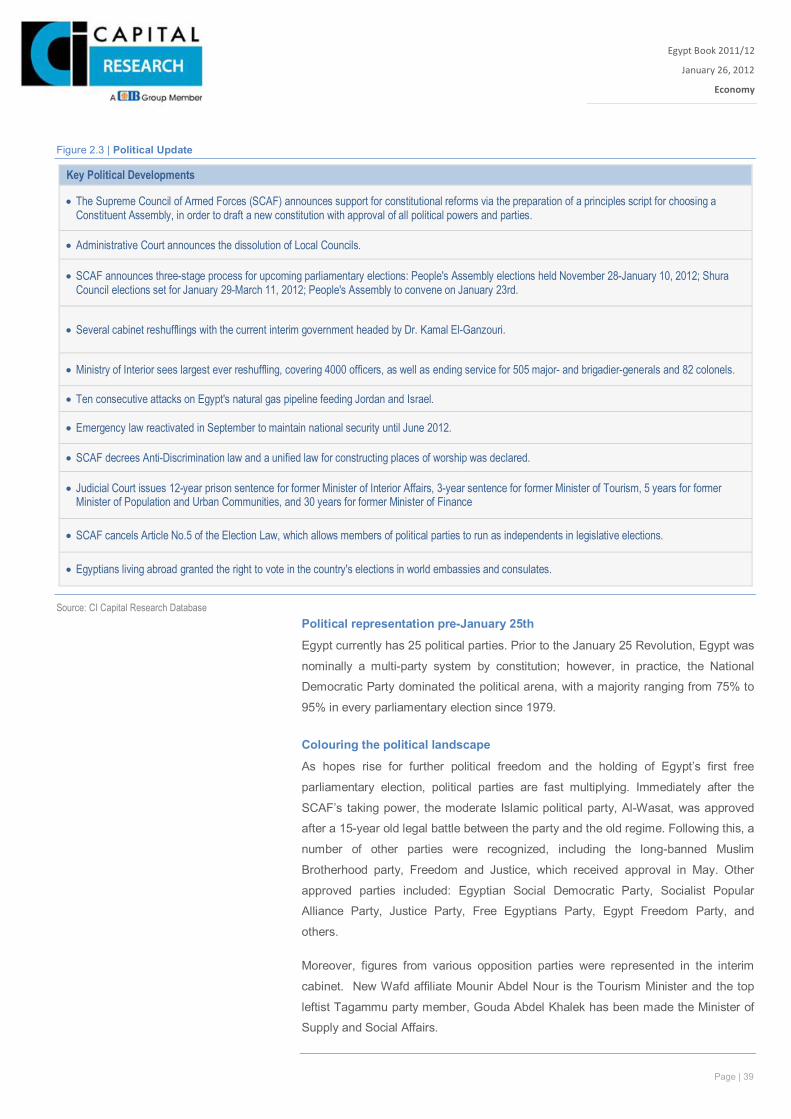
Page | 39
Egypt Book 2011/12
January 26, 2012
Economy
Xxx
Figure 2.3 | Political Update
Source: CI Capital Research Database Political representation pre-January 25th
Egypt currently has 25 political parties. Prior to the January 25 Revolution, Egypt was
nominally a multi-party system by constitution; however, in practice, the National
Democratic Party dominated the political arena, with a majority ranging from 75% to
95% in every parliamentary election since 1979.
Colouring the political landscape
As hopes rise for further political freedom and the holding of Egypt’s first free
parliamentary election, political parties are fast multiplying. Immediately after the
SCAF’s taking power, the moderate Islamic political party, Al-Wasat, was approved
after a 15-year old legal battle between the party and the old regime. Following this, a
number of other parties were recognized, including the long-banned Muslim
Brotherhood party, Freedom and Justice, which received approval in May. Other
approved parties included: Egyptian Social Democratic Party, Socialist Popular
Alliance Party, Justice Party, Free Egyptians Party, Egypt Freedom Party, and
others.
Moreover, figures from various opposition parties were represented in the interim
cabinet. New Wafd affiliate Mounir Abdel Nour is the Tourism Minister and the top
leftist Tagammu party member, Gouda Abdel Khalek has been made the Minister of
Supply and Social Affairs.
Key Political Developments
The Supreme Council of Armed Forces (SCAF) announces support for constitutional reforms via the preparation of a principles script for choosing a Constituent Assembly, in order to draft a new constitution with approval of all political powers and parties.
Administrative Court announces the dissolution of Local Councils.
SCAF announces three-stage process for upcoming parliamentary elections: People's Assembly elections held November 28-January 10, 2012; Shura Council elections set for January 29-March 11, 2012; People's Assembly to convene on January 23rd.
Several cabinet reshufflings with the current interim government headed by Dr. Kamal El-Ganzouri.
Ministry of Interior sees largest ever reshuffling, covering 4000 officers, as well as ending service for 505 major- and brigadier-generals and 82 colonels.
Ten consecutive attacks on Egypt's natural gas pipeline feeding Jordan and Israel.
Emergency law reactivated in September to maintain national security until June 2012.
SCAF decrees Anti-Discrimination law and a unified law for constructing places of worship was declared.
Judicial Court issues 12-year prison sentence for former Minister of Interior Affairs, 3-year sentence for former Minister of Tourism, 5 years for former Minister of Population and Urban Communities, and 30 years for former Minister of Finance
SCAF cancels Article No.5 of the Election Law, which allows members of political parties to run as independents in legislative elections.
Egyptians living abroad granted the right to vote in the country's elections in world embassies and consulates.
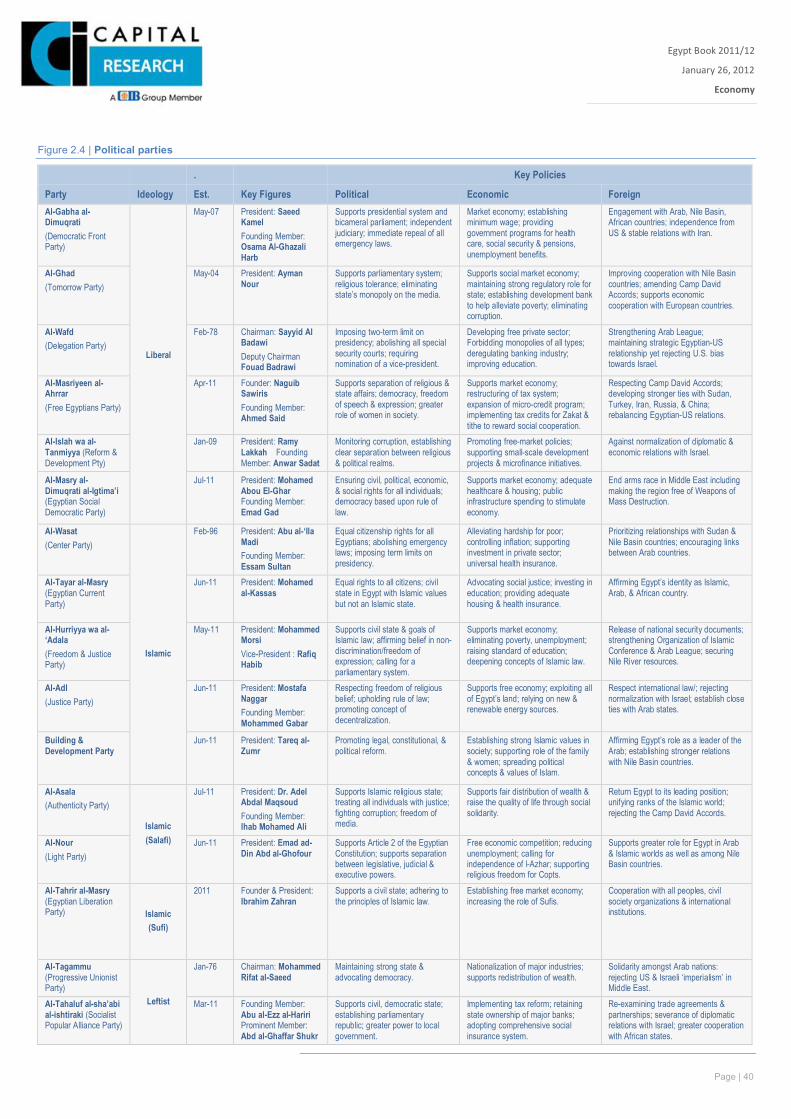
Page | 40
Egypt Book 2011/12
January 26, 2012
Economy
Xxx
Figure 2.4 | Political parties
. Key Policies
Party Ideology Est. Key Figures Political Economic Foreign Al-Gabha al-Dimuqrati (Democratic Front Party)
Liberal
May-07 President: Saeed Kamel Founding Member: Osama Al-Ghazali Harb
Supports presidential system and bicameral parliament; independent judiciary; immediate repeal of all emergency laws.
Market economy; establishing minimum wage; providing government programs for health care, social security & pensions, unemployment benefits.
Engagement with Arab, Nile Basin, African countries; independence from US & stable relations with Iran.
Al-Ghad (Tomorrow Party)
May-04 President: Ayman Nour
Supports parliamentary system; religious tolerance; eliminating state’s monopoly on the media.
Supports social market economy; maintaining strong regulatory role for state; establishing development bank to help alleviate poverty; eliminating corruption.
Improving cooperation with Nile Basin countries; amending Camp David Accords; supports economic cooperation with European countries.
Al-Wafd (Delegation Party)
Feb-78 Chairman: Sayyid Al Badawi Deputy Chairman Fouad Badrawi
Imposing two-term limit on presidency; abolishing all special security courts; requiring nomination of a vice-president.
Developing free private sector; Forbidding monopolies of all types; deregulating banking industry; improving education.
Strengthening Arab League; maintaining strategic Egyptian-US relationship yet rejecting U.S. bias towards Israel.
Al-Masriyeen al-Ahrrar (Free Egyptians Party)
Apr-11 Founder: Naguib Sawiris Founding Member: Ahmed Said
Supports separation of religious & state affairs; democracy, freedom of speech & expression; greater role of women in society.
Supports market economy; restructuring of tax system; expansion of micro-credit program; implementing tax credits for Zakat & tithe to reward social cooperation.
Respecting Camp David Accords; developing stronger ties with Sudan, Turkey, Iran, Russia, & China; rebalancing Egyptian-US relations.
Al-Islah wa al-Tanmiyya (Reform & Development Pty)
Jan-09 President: Ramy Lakkah Founding Member: Anwar Sadat
Monitoring corruption, establishing clear separation between religious & political realms.
Promoting free-market policies; supporting small-scale development projects & microfinance initiatives.
Against normalization of diplomatic & economic relations with Israel.
Al-Masry al-Dimuqrati al-Igtima’i (Egyptian Social Democratic Party)
Jul-11 President: Mohamed Abou El-Ghar Founding Member: Emad Gad
Ensuring civil, political, economic, & social rights for all individuals; democracy based upon rule of law.
Supports market economy; adequate healthcare & housing; public infrastructure spending to stimulate economy.
End arms race in Middle East including making the region free of Weapons of Mass Destruction.
Al-Wasat (Center Party)
Islamic
Feb-96 President: Abu al-‘Ila Madi Founding Member: Essam Sultan
Equal citizenship rights for all Egyptians; abolishing emergency laws; imposing term limits on presidency.
Alleviating hardship for poor; controlling inflation; supporting investment in private sector; universal health insurance.
Prioritizing relationships with Sudan & Nile Basin countries; encouraging links between Arab countries.
Al-Tayar al-Masry (Egyptian Current Party)
Jun-11 President: Mohamed al-Kassas
Equal rights to all citizens; civil state in Egypt with Islamic values but not an Islamic state.
Advocating social justice; investing in education; providing adequate housing & health insurance.
Affirming Egypt’s identity as Islamic, Arab, & African country.
Al-Hurriyya wa al-‘Adala (Freedom & Justice Party)
May-11 President: Mohammed Morsi Vice-President : Rafiq Habib
Supports civil state & goals of Islamic law; affirming belief in non-discrimination/freedom of expression; calling for a parliamentary system.
Supports market economy; eliminating poverty, unemployment; raising standard of education; deepening concepts of Islamic law.
Release of national security documents; strengthening Organization of Islamic Conference & Arab League; securing Nile River resources.
Al-Adl (Justice Party)
Jun-11 President: Mostafa Naggar Founding Member: Mohammed Gabar
Respecting freedom of religious belief; upholding rule of law; promoting concept of decentralization.
Supports free economy; exploiting all of Egypt’s land; relying on new & renewable energy sources.
Respect international law/; rejecting normalization with Israel; establish close ties with Arab states.
Building & Development Party
Jun-11 President: Tareq al-Zumr
Promoting legal, constitutional, & political reform.
Establishing strong Islamic values in society; supporting role of the family & women; spreading political concepts & values of Islam.
Affirming Egypt’s role as a leader of the Arab; establishing stronger relations with Nile Basin countries.
Al-Asala (Authenticity Party)
Islamic (Salafi)
Jul-11 President: Dr. Adel Abdal Maqsoud Founding Member: Ihab Mohamed Ali
Supports Islamic religious state; treating all individuals with justice; fighting corruption; freedom of media.
Supports fair distribution of wealth & raise the quality of life through social solidarity.
Return Egypt to its leading position; unifying ranks of the Islamic world; rejecting the Camp David Accords.
Al-Nour (Light Party)
Jun-11 President: Emad ad-Din Abd al-Ghofour
Supports Article 2 of the Egyptian Constitution; supports separation between legislative, judicial & executive powers.
Free economic competition; reducing unemployment; calling for independence of l-Azhar; supporting religious freedom for Copts.
Supports greater role for Egypt in Arab & Islamic worlds as well as among Nile Basin countries.
Al-Tahrir al-Masry (Egyptian Liberation Party) Islamic
(Sufi)
2011 Founder & President: Ibrahim Zahran
Supports a civil state; adhering to the principles of Islamic law.
Establishing free market economy; increasing the role of Sufis.
Cooperation with all peoples, civil society organizations & international institutions.
Al-Tagammu (Progressive Unionist Party)
Leftist
Jan-76 Chairman: Mohammed Rifat al-Saeed
Maintaining strong state & advocating democracy.
Nationalization of major industries; supports redistribution of wealth.
Solidarity amongst Arab nations: rejecting US & Israeli ‘imperialism’ in Middle East.
Al-Tahaluf al-sha’abi al-ishtiraki (Socialist Popular Alliance Party)
Mar-11 Founding Member: Abu al-Ezz al-Hariri Prominent Member: Abd al-Ghaffar Shukr
Supports civil, democratic state; establishing parliamentary republic; greater power to local government.
Implementing tax reform; retaining state ownership of major banks; adopting comprehensive social insurance system.
Re-examining trade agreements & partnerships; severance of diplomatic relations with Israel; greater cooperation with African states.
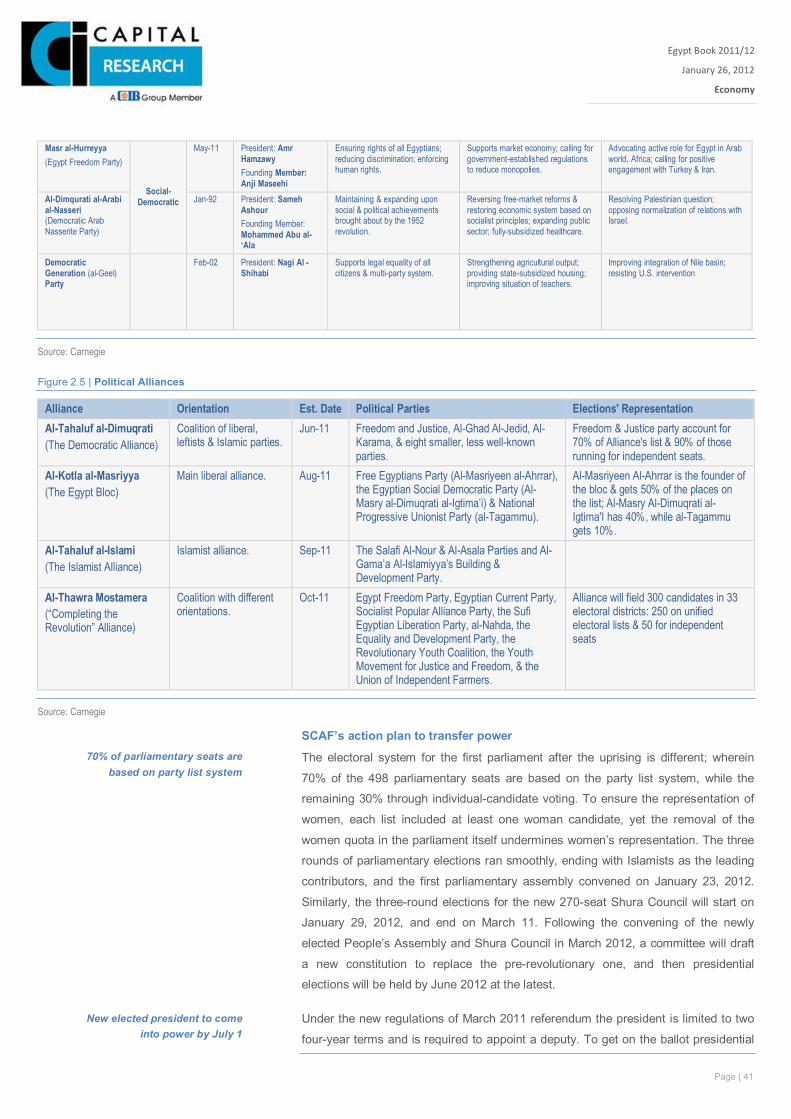
Page | 41
Egypt Book 2011/12
January 26, 2012
Economy
Xxx
Source: Carnegie
Figure 2.5 | Political Alliances
Alliance Orientation Est. Date Political Parties Elections' Representation Al-Tahaluf al-Dimuqrati (The Democratic Alliance)
Coalition of liberal, leftists & Islamic parties.
Jun-11 Freedom and Justice, Al-Ghad Al-Jedid, Al-Karama, & eight smaller, less well-known parties.
Freedom & Justice party account for 70% of Alliance's list & 90% of those running for independent seats.
Al-Kotla al-Masriyya (The Egypt Bloc)
Main liberal alliance. Aug-11 Free Egyptians Party (Al-Masriyeen al-Ahrrar), the Egyptian Social Democratic Party (Al-Masry al-Dimuqrati al-Igtima’i) & National Progressive Unionist Party (al-Tagammu).
Al-Masriyeen Al-Ahrrar is the founder of the bloc & gets 50% of the places on the list; Al-Masry Al-Dimuqrati al-Igtima'I has 40%, while al-Tagammu gets 10%.
Al-Tahaluf al-Islami (The Islamist Alliance)
Islamist alliance. Sep-11 The Salafi Al-Nour & Al-Asala Parties and Al-Gama’a Al-Islamiyya’s Building & Development Party.
Al-Thawra Mostamera (“Completing the Revolution” Alliance)
Coalition with different orientations.
Oct-11 Egypt Freedom Party, Egyptian Current Party, Socialist Popular Alliance Party, the Sufi Egyptian Liberation Party, al-Nahda, the Equality and Development Party, the Revolutionary Youth Coalition, the Youth Movement for Justice and Freedom, & the Union of Independent Farmers.
Alliance will field 300 candidates in 33 electoral districts: 250 on unified electoral lists & 50 for independent seats
Source: Carnegie
SCAF’s action plan to transfer power
The electoral system for the first parliament after the uprising is different; wherein
70% of the 498 parliamentary seats are based on the party list system, while the
remaining 30% through individual-candidate voting. To ensure the representation of
women, each list included at least one woman candidate, yet the removal of the
women quota in the parliament itself undermines women’s representation. The three
rounds of parliamentary elections ran smoothly, ending with Islamists as the leading
contributors, and the first parliamentary assembly convened on January 23, 2012.
Similarly, the three-round elections for the new 270-seat Shura Council will start on
January 29, 2012, and end on March 11. Following the convening of the newly
elected People’s Assembly and Shura Council in March 2012, a committee will draft
a new constitution to replace the pre-revolutionary one, and then presidential
elections will be held by June 2012 at the latest.
Under the new regulations of March 2011 referendum the president is limited to two
four-year terms and is required to appoint a deputy. To get on the ballot presidential
Masr al-Hurreyya (Egypt Freedom Party)
Social-Democratic
May-11 President: Amr Hamzawy Founding Member: Anji Maseehi
Ensuring rights of all Egyptians; reducing discrimination; enforcing human rights.
Supports market economy; calling for government-established regulations to reduce monopolies.
Advocating active role for Egypt in Arab world, Africa; calling for positive engagement with Turkey & Iran.
Al-Dimqurati al-Arabi al-Nasseri (Democratic Arab Nasserite Party)
Jan-92 President: Sameh Ashour Founding Member: Mohammed Abu al-‘Ala
Maintaining & expanding upon social & political achievements brought about by the 1952 revolution.
Reversing free-market reforms & restoring economic system based on socialist principles; expanding public sector; fully-subsidized healthcare.
Resolving Palestinian question; opposing normalization of relations with Israel.
Democratic Generation (al-Geel) Party
Feb-02 President: Nagi Al - Shihabi
Supports legal equality of all citizens & multi-party system.
Strengthening agricultural output; providing state-subsidized housing; improving situation of teachers.
Improving integration of Nile basin; resisting U.S. intervention
70% of parliamentary seats are based on party list system
New elected president to come into power by July 1
Page | 42
Egypt Book 2011/12
January 26, 2012
Economy
Xxx
candidates will be required to provide 30,000 signatures from at least 15 provinces,
30 members of a chamber of the legislature, or nomination by a party holding at least
one seat in the legislature.
Islamists lead in polls after several rounds of voting
The success of Egypt's Islamic parties could give them a key role in shaping the
country's future. The Muslim Brotherhood could have a strong influence over how the
next constitution is devised. But with the ruling Military Council planning to stay put
until June, it remains unclear exactly what powers any new parliament will wield. The
Brotherhood has a history of political pragmatism, as even though the group was
legally banned, many of its members served in parliament under Mubarak as
independents. Leaders of the Brotherhood’s Freedom & Justice Party say their
current priorities include rebuilding state institutions and promoting a free-enterprise
economy as well as the role of the private sector, while not banning alcohol or
regulating women’s dress.
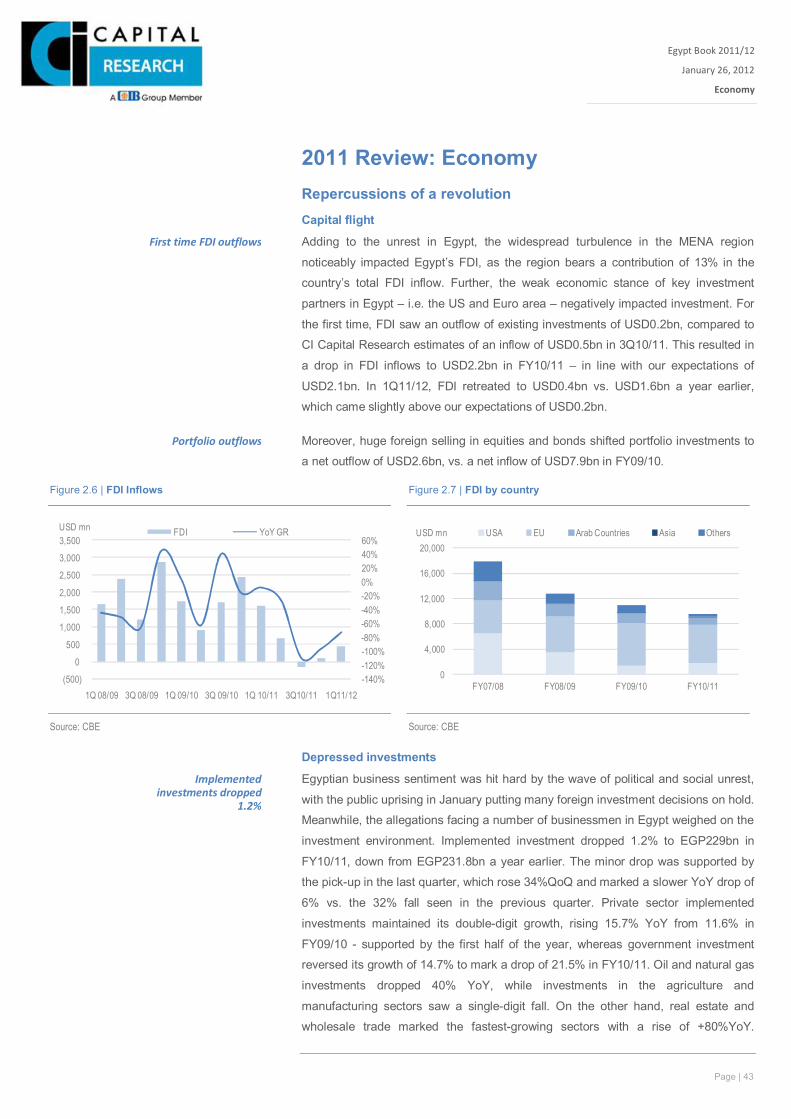
Page | 43
Egypt Book 2011/12
January 26, 2012
Economy
Xxx
2011 Review: Economy Repercussions of a revolution Capital flight
Adding to the unrest in Egypt, the widespread turbulence in the MENA region
noticeably impacted Egypt’s FDI, as the region bears a contribution of 13% in the
country’s total FDI inflow. Further, the weak economic stance of key investment
partners in Egypt – i.e. the US and Euro area – negatively impacted investment. For
the first time, FDI saw an outflow of existing investments of USD0.2bn, compared to
CI Capital Research estimates of an inflow of USD0.5bn in 3Q10/11. This resulted in
a drop in FDI inflows to USD2.2bn in FY10/11 – in line with our expectations of
USD2.1bn. In 1Q11/12, FDI retreated to USD0.4bn vs. USD1.6bn a year earlier,
which came slightly above our expectations of USD0.2bn.
Moreover, huge foreign selling in equities and bonds shifted portfolio investments to
a net outflow of USD2.6bn, vs. a net inflow of USD7.9bn in FY09/10.
Depressed investments
Egyptian business sentiment was hit hard by the wave of political and social unrest,
with the public uprising in January putting many foreign investment decisions on hold.
Meanwhile, the allegations facing a number of businessmen in Egypt weighed on the
investment environment. Implemented investment dropped 1.2% to EGP229bn in
FY10/11, down from EGP231.8bn a year earlier. The minor drop was supported by
the pick-up in the last quarter, which rose 34%QoQ and marked a slower YoY drop of
6% vs. the 32% fall seen in the previous quarter. Private sector implemented
investments maintained its double-digit growth, rising 15.7% YoY from 11.6% in
FY09/10 - supported by the first half of the year, whereas government investment
reversed its growth of 14.7% to mark a drop of 21.5% in FY10/11. Oil and natural gas
investments dropped 40% YoY, while investments in the agriculture and
manufacturing sectors saw a single-digit fall. On the other hand, real estate and
wholesale trade marked the fastest-growing sectors with a rise of +80%YoY.
First time FDI outflows
Portfolio outflows
Implemented investments dropped
1.2%
Figure 2.6 | FDI Inflows Figure 2.7 | FDI by country
-140%-120%-100%-80%-60%-40%-20%0%20%40%60%
(500)
0
500
1,000
1,500
2,000
2,500
3,000
3,500
1Q 08/09 3Q 08/09 1Q 09/10 3Q 09/10 1Q 10/11 3Q10/11 1Q11/12
USD mn FDI YoY GR
0
4,000
8,000
12,000
16,000
20,000
FY07/08 FY08/09 FY09/10 FY10/11
USD mn USA EU Arab Countries Asia Others
Source: CBE
Source: CBE
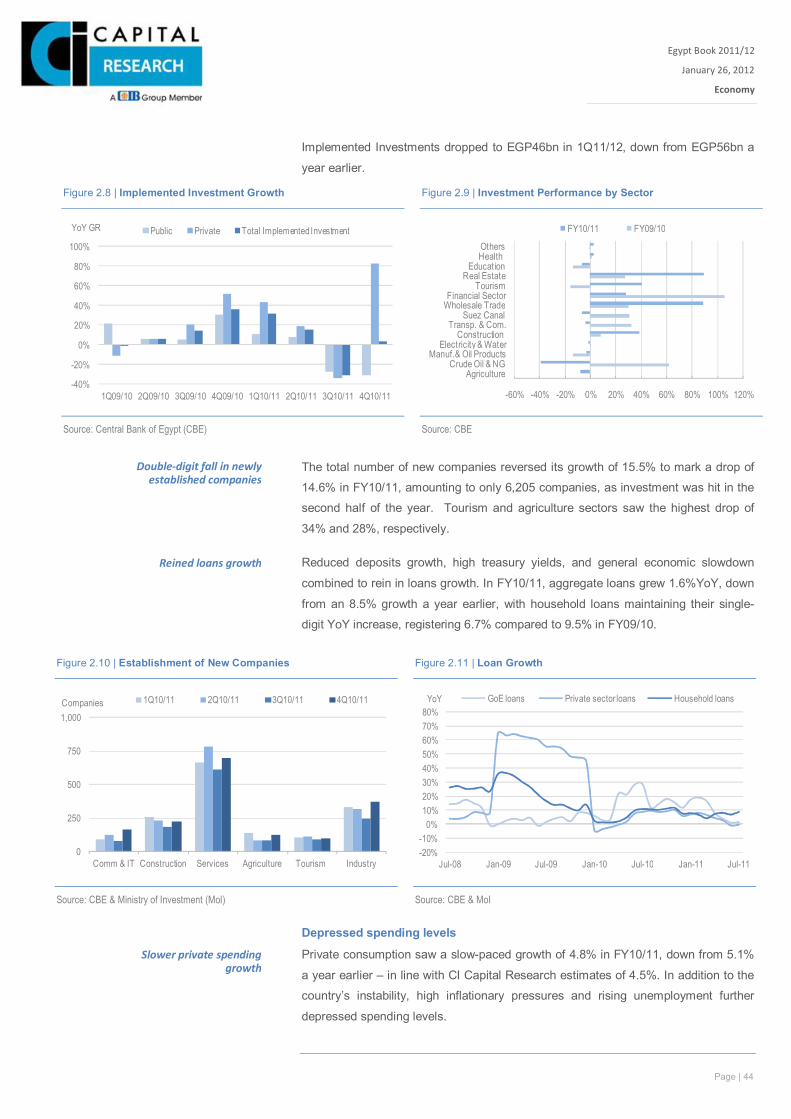
Page | 44
Egypt Book 2011/12
January 26, 2012
Economy
Xxx
Implemented Investments dropped to EGP46bn in 1Q11/12, down from EGP56bn a
year earlier.
The total number of new companies reversed its growth of 15.5% to mark a drop of
14.6% in FY10/11, amounting to only 6,205 companies, as investment was hit in the
second half of the year. Tourism and agriculture sectors saw the highest drop of
34% and 28%, respectively.
Reduced deposits growth, high treasury yields, and general economic slowdown
combined to rein in loans growth. In FY10/11, aggregate loans grew 1.6%YoY, down
from an 8.5% growth a year earlier, with household loans maintaining their single-
digit YoY increase, registering 6.7% compared to 9.5% in FY09/10.
Depressed spending levels
Private consumption saw a slow-paced growth of 4.8% in FY10/11, down from 5.1%
a year earlier – in line with CI Capital Research estimates of 4.5%. In addition to the
country’s instability, high inflationary pressures and rising unemployment further
depressed spending levels.
Double-digit fall in newly established companies
Reined loans growth
Slower private spending growth
Figure 2.8 | Implemented Investment Growth Figure 2.9 | Investment Performance by Sector
-40%
-20%
0%
20%
40%
60%
80%
100%
1Q09/10 2Q09/10 3Q09/10 4Q09/10 1Q10/11 2Q10/11 3Q10/11 4Q10/11
YoY GR Public Private Total Implemented Investment
-60% -40% -20% 0% 20% 40% 60% 80% 100% 120%
AgricultureCrude Oil & NG
Manuf.& Oil ProductsElectricity & Water
Construction Transp. & Com.
Suez CanalWholesale TradeFinancial Sector
TourismReal Estate
EducationHealth Others
FY10/11 FY09/10
Source: Central Bank of Egypt (CBE)
Source: CBE
Figure 2.10 | Establishment of New Companies Figure 2.11 | Loan Growth
0
250
500
750
1,000
Comm & IT Construction Services Agriculture Tourism Industry
Companies 1Q10/11 2Q10/11 3Q10/11 4Q10/11
-20%-10%
0%10%20%30%40%50%60%70%80%
Jul-08 Jan-09 Jul-09 Jan-10 Jul-10 Jan-11 Jul-11
YoY GoE loans Private sector loans Household loans
Source: CBE & Ministry of Investment (MoI)
Source: CBE & MoI
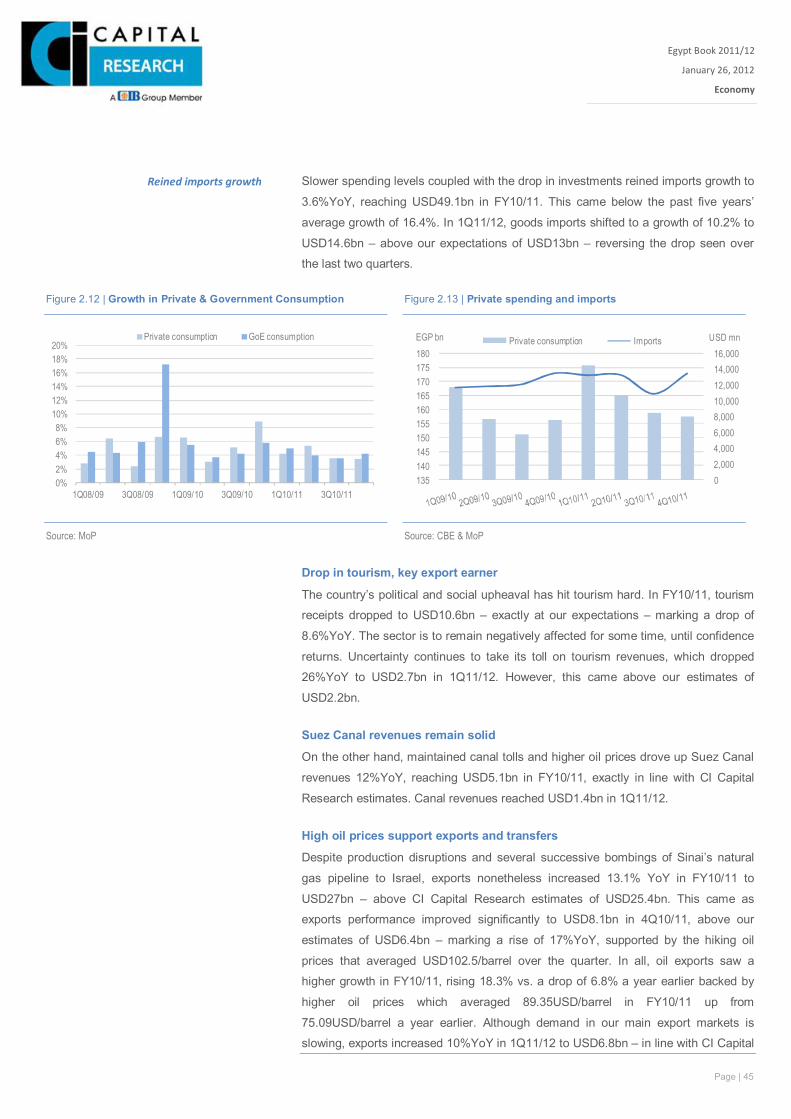
Page | 45
Egypt Book 2011/12
January 26, 2012
Economy
Xxx
Slower spending levels coupled with the drop in investments reined imports growth to
3.6%YoY, reaching USD49.1bn in FY10/11. This came below the past five years’
average growth of 16.4%. In 1Q11/12, goods imports shifted to a growth of 10.2% to
USD14.6bn – above our expectations of USD13bn – reversing the drop seen over
the last two quarters.
Drop in tourism, key export earner
The country’s political and social upheaval has hit tourism hard. In FY10/11, tourism
receipts dropped to USD10.6bn – exactly at our expectations – marking a drop of
8.6%YoY. The sector is to remain negatively affected for some time, until confidence
returns. Uncertainty continues to take its toll on tourism revenues, which dropped
26%YoY to USD2.7bn in 1Q11/12. However, this came above our estimates of
USD2.2bn.
Suez Canal revenues remain solid
On the other hand, maintained canal tolls and higher oil prices drove up Suez Canal
revenues 12%YoY, reaching USD5.1bn in FY10/11, exactly in line with CI Capital
Research estimates. Canal revenues reached USD1.4bn in 1Q11/12.
High oil prices support exports and transfers
Despite production disruptions and several successive bombings of Sinai’s natural
gas pipeline to Israel, exports nonetheless increased 13.1% YoY in FY10/11 to
USD27bn – above CI Capital Research estimates of USD25.4bn. This came as
exports performance improved significantly to USD8.1bn in 4Q10/11, above our
estimates of USD6.4bn – marking a rise of 17%YoY, supported by the hiking oil
prices that averaged USD102.5/barrel over the quarter. In all, oil exports saw a
higher growth in FY10/11, rising 18.3% vs. a drop of 6.8% a year earlier backed by
higher oil prices which averaged 89.35USD/barrel in FY10/11 up from
75.09USD/barrel a year earlier. Although demand in our main export markets is
slowing, exports increased 10%YoY in 1Q11/12 to USD6.8bn – in line with CI Capital
Reined imports growth
Figure 2.12 | Growth in Private & Government Consumption Figure 2.13 | Private spending and imports
0%2%4%6%8%
10%12%14%16%18%20%
1Q08/09 3Q08/09 1Q09/10 3Q09/10 1Q10/11 3Q10/11
Private consumption GoE consumption
02,0004,0006,0008,00010,00012,00014,00016,000
135140145150155160165170175180
USD mnEGP bn Private consumption Imports
Source: MoP
Source: CBE & MoP
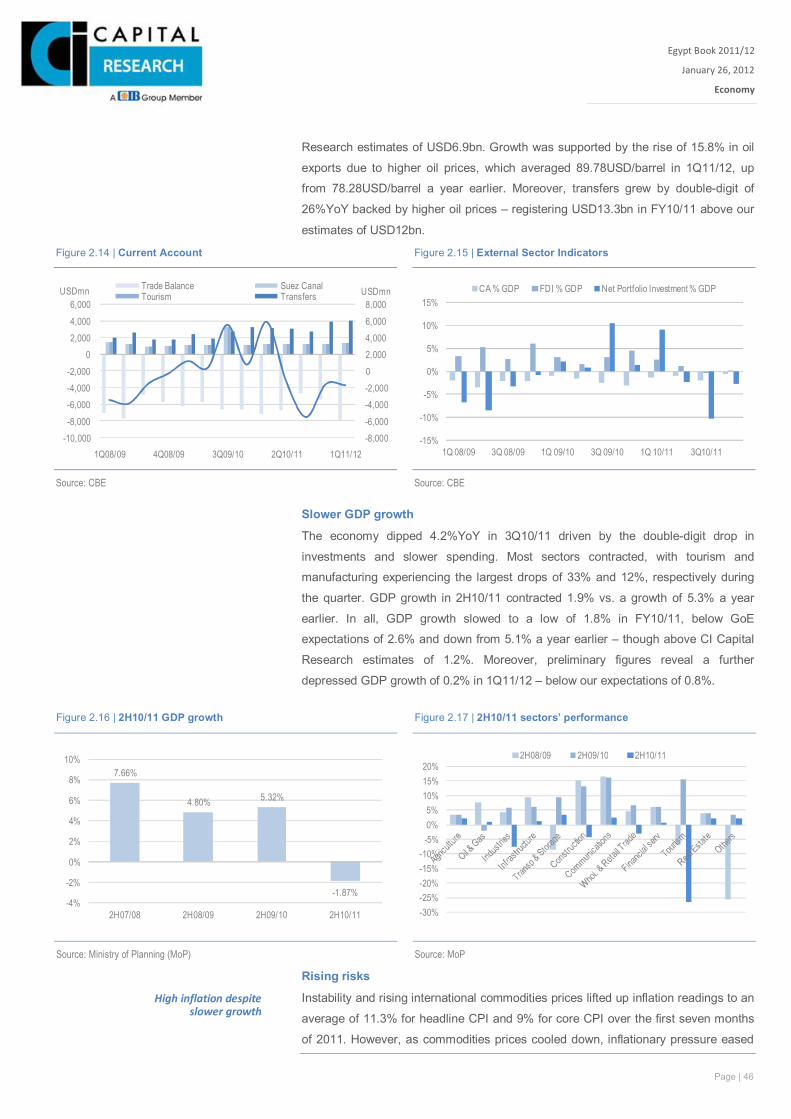
Page | 46
Egypt Book 2011/12
January 26, 2012
Economy
Xxx
Research estimates of USD6.9bn. Growth was supported by the rise of 15.8% in oil
exports due to higher oil prices, which averaged 89.78USD/barrel in 1Q11/12, up
from 78.28USD/barrel a year earlier. Moreover, transfers grew by double-digit of
26%YoY backed by higher oil prices – registering USD13.3bn in FY10/11 above our
estimates of USD12bn.
Slower GDP growth
The economy dipped 4.2%YoY in 3Q10/11 driven by the double-digit drop in
investments and slower spending. Most sectors contracted, with tourism and
manufacturing experiencing the largest drops of 33% and 12%, respectively during
the quarter. GDP growth in 2H10/11 contracted 1.9% vs. a growth of 5.3% a year
earlier. In all, GDP growth slowed to a low of 1.8% in FY10/11, below GoE
expectations of 2.6% and down from 5.1% a year earlier – though above CI Capital
Research estimates of 1.2%. Moreover, preliminary figures reveal a further
depressed GDP growth of 0.2% in 1Q11/12 – below our expectations of 0.8%.
Rising risks
Instability and rising international commodities prices lifted up inflation readings to an
average of 11.3% for headline CPI and 9% for core CPI over the first seven months
of 2011. However, as commodities prices cooled down, inflationary pressure eased
High inflation despite slower growth
Figure 2.16 | 2H10/11 GDP growth Figure 2.17 | 2H10/11 sectors’ performance
7.66%
4.80% 5.32%
-1.87%-4%
-2%
0%
2%
4%
6%
8%
10%
2H07/08 2H08/09 2H09/10 2H10/11
-30%-25%-20%-15%-10%
-5%0%5%
10%15%20%
2H08/09 2H09/10 2H10/11
Source: Ministry of Planning (MoP)
Source: MoP
Figure 2.14 | Current Account Figure 2.15 | External Sector Indicators
-8,000-6,000-4,000-2,00002,0004,0006,0008,000
-10,000-8,000-6,000-4,000-2,000
02,0004,0006,000
1Q08/09 4Q08/09 3Q09/10 2Q10/11 1Q11/12
USDmnUSDmn Trade Balance Suez CanalTourism Transfers
-15%
-10%
-5%
0%
5%
10%
15%
1Q 08/09 3Q 08/09 1Q 09/10 3Q 09/10 1Q 10/11 3Q10/11
CA % GDP FDI % GDP Net Portfolio Investment % GDP
Source: CBE
Source: CBE
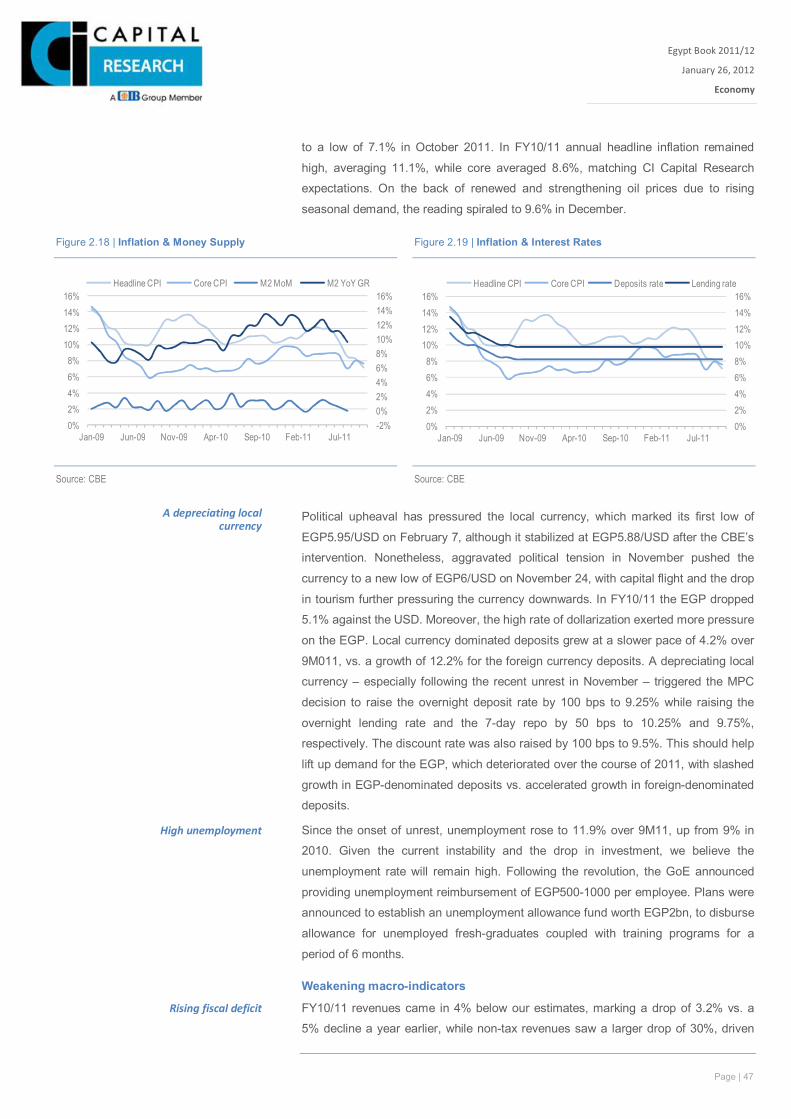
Page | 47
Egypt Book 2011/12
January 26, 2012
Economy
Xxx
to a low of 7.1% in October 2011. In FY10/11 annual headline inflation remained
high, averaging 11.1%, while core averaged 8.6%, matching CI Capital Research
expectations. On the back of renewed and strengthening oil prices due to rising
seasonal demand, the reading spiraled to 9.6% in December.
Political upheaval has pressured the local currency, which marked its first low of
EGP5.95/USD on February 7, although it stabilized at EGP5.88/USD after the CBE’s
intervention. Nonetheless, aggravated political tension in November pushed the
currency to a new low of EGP6/USD on November 24, with capital flight and the drop
in tourism further pressuring the currency downwards. In FY10/11 the EGP dropped
5.1% against the USD. Moreover, the high rate of dollarization exerted more pressure
on the EGP. Local currency dominated deposits grew at a slower pace of 4.2% over
9M011, vs. a growth of 12.2% for the foreign currency deposits. A depreciating local
currency – especially following the recent unrest in November – triggered the MPC
decision to raise the overnight deposit rate by 100 bps to 9.25% while raising the
overnight lending rate and the 7-day repo by 50 bps to 10.25% and 9.75%,
respectively. The discount rate was also raised by 100 bps to 9.5%. This should help
lift up demand for the EGP, which deteriorated over the course of 2011, with slashed
growth in EGP-denominated deposits vs. accelerated growth in foreign-denominated
deposits.
Since the onset of unrest, unemployment rose to 11.9% over 9M11, up from 9% in
2010. Given the current instability and the drop in investment, we believe the
unemployment rate will remain high. Following the revolution, the GoE announced
providing unemployment reimbursement of EGP500-1000 per employee. Plans were
announced to establish an unemployment allowance fund worth EGP2bn, to disburse
allowance for unemployed fresh-graduates coupled with training programs for a
period of 6 months.
Weakening macro-indicators
FY10/11 revenues came in 4% below our estimates, marking a drop of 3.2% vs. a
5% decline a year earlier, while non-tax revenues saw a larger drop of 30%, driven
A depreciating local currency
High unemployment
Rising fiscal deficit
Figure 2.18 | Inflation & Money Supply Figure 2.19 | Inflation & Interest Rates
-2%0%2%4%6%8%10%12%14%16%
0%2%4%6%8%
10%12%14%16%
Jan-09 Jun-09 Nov-09 Apr-10 Sep-10 Feb-11 Jul-11
Headline CPI Core CPI M2 MoM M2 YoY GR
0%2%4%6%8%10%12%14%16%
0%2%4%6%8%
10%12%14%16%
Jan-09 Jun-09 Nov-09 Apr-10 Sep-10 Feb-11 Jul-11
Headline CPI Core CPI Deposits rate Lending rate
Source: CBE
Source: CBE
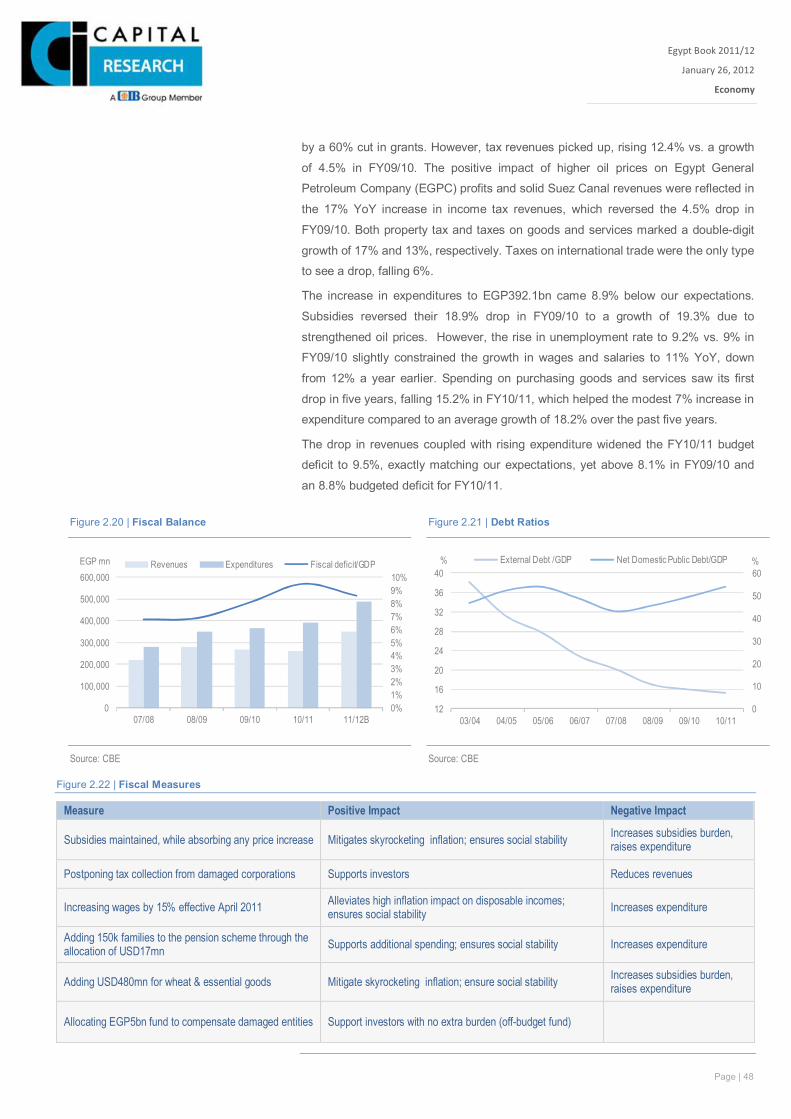
Page | 48
Egypt Book 2011/12
January 26, 2012
Economy
Xxx
by a 60% cut in grants. However, tax revenues picked up, rising 12.4% vs. a growth
of 4.5% in FY09/10. The positive impact of higher oil prices on Egypt General
Petroleum Company (EGPC) profits and solid Suez Canal revenues were reflected in
the 17% YoY increase in income tax revenues, which reversed the 4.5% drop in
FY09/10. Both property tax and taxes on goods and services marked a double-digit
growth of 17% and 13%, respectively. Taxes on international trade were the only type
to see a drop, falling 6%.
The increase in expenditures to EGP392.1bn came 8.9% below our expectations.
Subsidies reversed their 18.9% drop in FY09/10 to a growth of 19.3% due to
strengthened oil prices. However, the rise in unemployment rate to 9.2% vs. 9% in
FY09/10 slightly constrained the growth in wages and salaries to 11% YoY, down
from 12% a year earlier. Spending on purchasing goods and services saw its first
drop in five years, falling 15.2% in FY10/11, which helped the modest 7% increase in
expenditure compared to an average growth of 18.2% over the past five years.
The drop in revenues coupled with rising expenditure widened the FY10/11 budget
deficit to 9.5%, exactly matching our expectations, yet above 8.1% in FY09/10 and
an 8.8% budgeted deficit for FY10/11.
Figure 2.22 | Fiscal Measures
Measure Positive Impact Negative Impact
Subsidies maintained, while absorbing any price increase Mitigates skyrocketing inflation; ensures social stability Increases subsidies burden, raises expenditure
Postponing tax collection from damaged corporations Supports investors Reduces revenues
Increasing wages by 15% effective April 2011 Alleviates high inflation impact on disposable incomes; ensures social stability Increases expenditure
Adding 150k families to the pension scheme through the allocation of USD17mn Supports additional spending; ensures social stability Increases expenditure
Adding USD480mn for wheat & essential goods Mitigate skyrocketing inflation; ensure social stability Increases subsidies burden, raises expenditure
Allocating EGP5bn fund to compensate damaged entities Support investors with no extra burden (off-budget fund)
Figure 2.20 | Fiscal Balance Figure 2.21 | Debt Ratios
0%1%2%3%4%5%6%7%8%9%10%
0
100,000
200,000
300,000
400,000
500,000
600,000
07/08 08/09 09/10 10/11 11/12B
EGP mn Revenues Expenditures Fiscal deficit/GDP
0
10
20
30
40
50
60
12
16
20
24
28
32
36
40
03/04 04/05 05/06 06/07 07/08 08/09 09/10 10/11
%% External Debt /GDP Net Domestic Public Debt/GDP
Source: CBE
Source: CBE
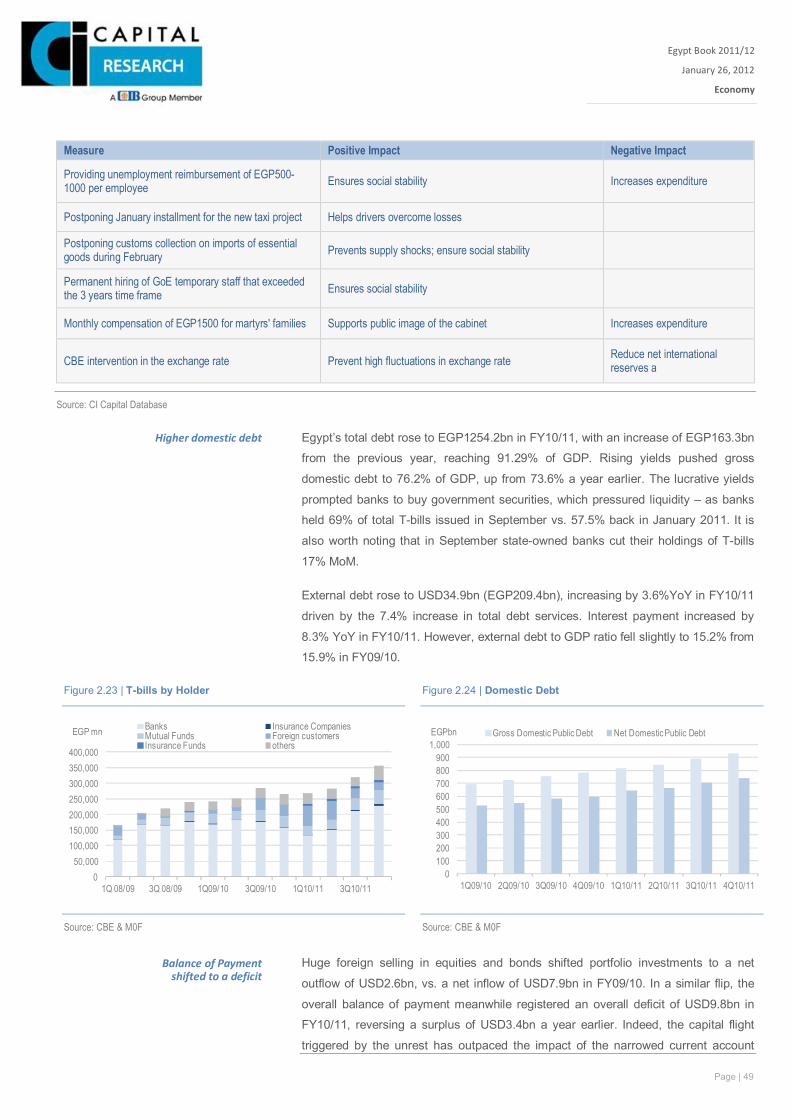
Page | 49
Egypt Book 2011/12
January 26, 2012
Economy
Xxx
Measure Positive Impact Negative Impact
Providing unemployment reimbursement of EGP500-1000 per employee Ensures social stability Increases expenditure
Postponing January installment for the new taxi project Helps drivers overcome losses
Postponing customs collection on imports of essential goods during February Prevents supply shocks; ensure social stability
Permanent hiring of GoE temporary staff that exceeded the 3 years time frame Ensures social stability
Monthly compensation of EGP1500 for martyrs' families Supports public image of the cabinet Increases expenditure
CBE intervention in the exchange rate Prevent high fluctuations in exchange rate Reduce net international reserves a
Source: CI Capital Database
Egypt’s total debt rose to EGP1254.2bn in FY10/11, with an increase of EGP163.3bn
from the previous year, reaching 91.29% of GDP. Rising yields pushed gross
domestic debt to 76.2% of GDP, up from 73.6% a year earlier. The lucrative yields
prompted banks to buy government securities, which pressured liquidity – as banks
held 69% of total T-bills issued in September vs. 57.5% back in January 2011. It is
also worth noting that in September state-owned banks cut their holdings of T-bills
17% MoM.
External debt rose to USD34.9bn (EGP209.4bn), increasing by 3.6%YoY in FY10/11
driven by the 7.4% increase in total debt services. Interest payment increased by
8.3% YoY in FY10/11. However, external debt to GDP ratio fell slightly to 15.2% from
15.9% in FY09/10.
Huge foreign selling in equities and bonds shifted portfolio investments to a net
outflow of USD2.6bn, vs. a net inflow of USD7.9bn in FY09/10. In a similar flip, the
overall balance of payment meanwhile registered an overall deficit of USD9.8bn in
FY10/11, reversing a surplus of USD3.4bn a year earlier. Indeed, the capital flight
triggered by the unrest has outpaced the impact of the narrowed current account
Higher domestic debt
Balance of Payment shifted to a deficit
Figure 2.23 | T-bills by Holder Figure 2.24 | Domestic Debt
050,000
100,000150,000200,000250,000300,000350,000400,000
1Q 08/09 3Q 08/09 1Q09/10 3Q09/10 1Q10/11 3Q10/11
EGP mn Banks Insurance CompaniesMutual Funds Foreign customersInsurance Funds others
0100200300400500600700800900
1,000
1Q09/10 2Q09/10 3Q09/10 4Q09/10 1Q10/11 2Q10/11 3Q10/11 4Q10/11
EGPbn Gross Domestic Public Debt Net Domestic Public Debt
Source: CBE & M0F
Source: CBE & M0F
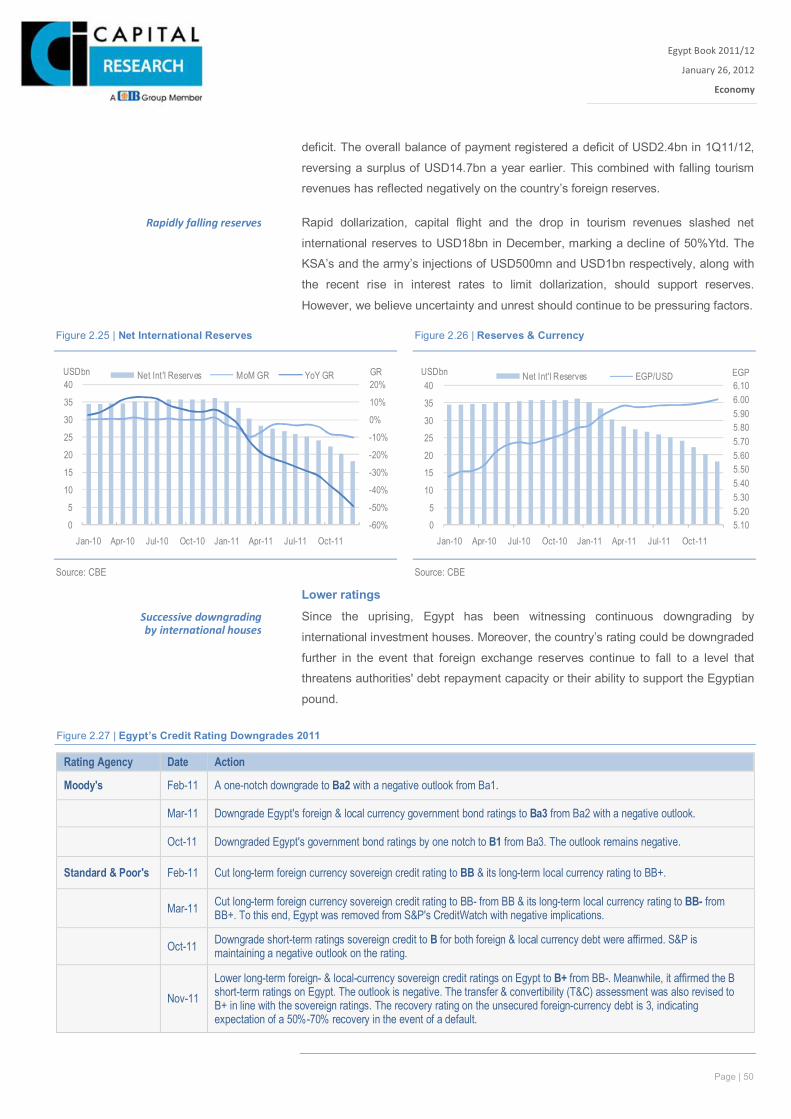
Page | 50
Egypt Book 2011/12
January 26, 2012
Economy
Xxx
deficit. The overall balance of payment registered a deficit of USD2.4bn in 1Q11/12,
reversing a surplus of USD14.7bn a year earlier. This combined with falling tourism
revenues has reflected negatively on the country’s foreign reserves.
Rapid dollarization, capital flight and the drop in tourism revenues slashed net
international reserves to USD18bn in December, marking a decline of 50%Ytd. The
KSA’s and the army’s injections of USD500mn and USD1bn respectively, along with
the recent rise in interest rates to limit dollarization, should support reserves.
However, we believe uncertainty and unrest should continue to be pressuring factors.
Lower ratings Since the uprising, Egypt has been witnessing continuous downgrading by
international investment houses. Moreover, the country’s rating could be downgraded
further in the event that foreign exchange reserves continue to fall to a level that
threatens authorities' debt repayment capacity or their ability to support the Egyptian
pound.
Figure 2.27 | Egypt’s Credit Rating Downgrades 2011
Rating Agency Date Action
Moody's Feb-11 A one-notch downgrade to Ba2 with a negative outlook from Ba1.
Mar-11 Downgrade Egypt's foreign & local currency government bond ratings to Ba3 from Ba2 with a negative outlook.
Oct-11 Downgraded Egypt's government bond ratings by one notch to B1 from Ba3. The outlook remains negative.
Standard & Poor's Feb-11 Cut long-term foreign currency sovereign credit rating to BB & its long-term local currency rating to BB+.
Mar-11 Cut long-term foreign currency sovereign credit rating to BB- from BB & its long-term local currency rating to BB- from BB+. To this end, Egypt was removed from S&P's CreditWatch with negative implications.
Oct-11 Downgrade short-term ratings sovereign credit to B for both foreign & local currency debt were affirmed. S&P is maintaining a negative outlook on the rating.
Nov-11 Lower long-term foreign- & local-currency sovereign credit ratings on Egypt to B+ from BB-. Meanwhile, it affirmed the B short-term ratings on Egypt. The outlook is negative. The transfer & convertibility (T&C) assessment was also revised to B+ in line with the sovereign ratings. The recovery rating on the unsecured foreign-currency debt is 3, indicating expectation of a 50%-70% recovery in the event of a default.
Rapidly falling reserves
Successive downgrading by international houses
Figure 2.25 | Net International Reserves Figure 2.26 | Reserves & Currency
-60%
-50%
-40%
-30%
-20%
-10%
0%
10%
20%
0
5
10
15
20
25
30
35
40
Jan-10 Apr-10 Jul-10 Oct-10 Jan-11 Apr-11 Jul-11 Oct-11
GRUSDbn Net Int'l Reserves MoM GR YoY GR
5.105.205.305.405.505.605.705.805.906.006.10
0
5
10
15
20
25
30
35
40
Jan-10 Apr-10 Jul-10 Oct-10 Jan-11 Apr-11 Jul-11 Oct-11
EGPUSDbn Net Int'l Reserves EGP/USD
Source: CBE
Source: CBE
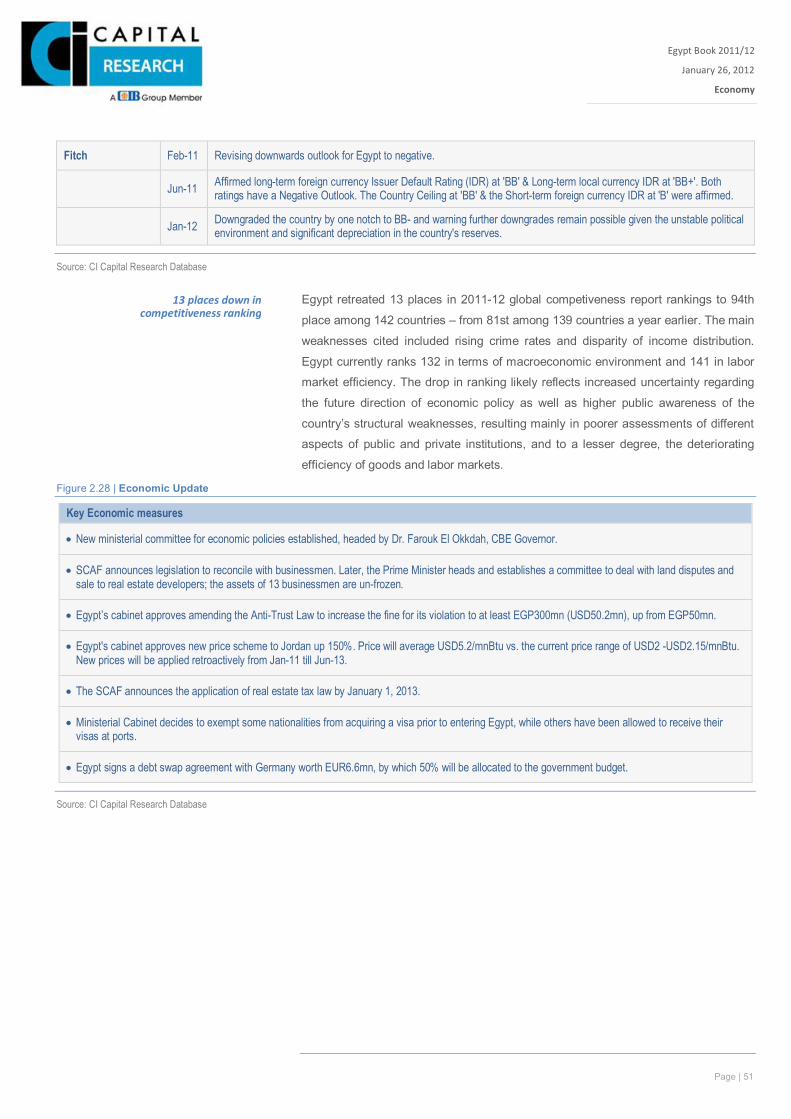
Page | 51
Egypt Book 2011/12
January 26, 2012
Economy
Xxx
Fitch Feb-11 Revising downwards outlook for Egypt to negative.
Jun-11 Affirmed long-term foreign currency Issuer Default Rating (IDR) at 'BB' & Long-term local currency IDR at 'BB+'. Both ratings have a Negative Outlook. The Country Ceiling at 'BB' & the Short-term foreign currency IDR at 'B' were affirmed.
Jan-12 Downgraded the country by one notch to BB- and warning further downgrades remain possible given the unstable political environment and significant depreciation in the country's reserves.
Source: CI Capital Research Database
Egypt retreated 13 places in 2011-12 global competiveness report rankings to 94th
place among 142 countries – from 81st among 139 countries a year earlier. The main
weaknesses cited included rising crime rates and disparity of income distribution.
Egypt currently ranks 132 in terms of macroeconomic environment and 141 in labor
market efficiency. The drop in ranking likely reflects increased uncertainty regarding
the future direction of economic policy as well as higher public awareness of the
country’s structural weaknesses, resulting mainly in poorer assessments of different
aspects of public and private institutions, and to a lesser degree, the deteriorating
efficiency of goods and labor markets.
Figure 2.28 | Economic Update
Source: CI Capital Research Database
13 places down in competitiveness ranking
Key Economic measures
New ministerial committee for economic policies established, headed by Dr. Farouk El Okkdah, CBE Governor.
SCAF announces legislation to reconcile with businessmen. Later, the Prime Minister heads and establishes a committee to deal with land disputes and sale to real estate developers; the assets of 13 businessmen are un-frozen.
Egypt’s cabinet approves amending the Anti-Trust Law to increase the fine for its violation to at least EGP300mn (USD50.2mn), up from EGP50mn.
Egypt's cabinet approves new price scheme to Jordan up 150%. Price will average USD5.2/mnBtu vs. the current price range of USD2 -USD2.15/mnBtu. New prices will be applied retroactively from Jan-11 till Jun-13.
The SCAF announces the application of real estate tax law by January 1, 2013.
Ministerial Cabinet decides to exempt some nationalities from acquiring a visa prior to entering Egypt, while others have been allowed to receive their visas at ports.
Egypt signs a debt swap agreement with Germany worth EUR6.6mn, by which 50% will be allocated to the government budget.
Page | 52
Egypt Book 2011/12
January 26, 2012
Economy
Xxx
2012 Preview: “The Challenge” Kicking off the year with weak economic indicators amidst upcoming political changes
and instability puts Egypt on challenging macro-economic footing to say the least – a
bottleneck subject to large downside risk. Growing fiscal deficit to GDP, dwindling
foreign reserves associated with falling tourism revenues, subdued capital inflows,
and possible credit downgrades by international houses will weigh on Egypt’s
economic standing. Based on the central political assumption that presidential
elections will run as scheduled and taking into consideration the associated unrest,
we expect economic performance to remain depressed, as real GDP growth is
expected to reach 0.4% in FY11/12 down from 1.8% a year earlier.
Assumptions to our forecast Further local currency devaluation: Slashed tourism revenues, outflow of foreign
funds, and maintained dollarization trend will continue pressuring down the local
currency. We expect the EGP to average EGP6.182/USD in FY11/12. Over the
course of 2012 the local currency is expected to further devalue to an average of
EGP6.376/USD, from an estimated average of EGP5.959 in 2011 – marking a 7%
depreciation.
Maintained inflationary pressure: Continued unrest along with the further
expected depreciation of the local currency should create an upside risk to inflation,
despite the eased commodities prices. Renewed instability in November raised
annual headline reading to 9.1%, up from 7.1% a month earlier. Inflation reading is
expected to be higher in 2H11/12, although the year will average 9.3% in terms of
headline CPI vs. 11.1% in FY10/11. This is still considered high compared to the
low GDP growth of 0.4%.
Higher interest rates to support the local currency: On November 24, the
Monetary Policy Committee (MPC) decided to raise interest rates for the first time
in two years. The overnight deposit rate was raised by 100 bps to 9.25%, while the
overnight lending and 7-day repo rates were raised by 50 bps to 10.25% and
9.75%, respectively. Discount rate was also raised by 100 bps to 9.5%. Although
raising interest rates will do little to support Egypt’s weak growth, higher
consideration is now being given to supporting the depreciating local currency –
especially with the falling international reserves and strong dollarization rate.
Nonetheless, we expect another 75bps to be added in the year to come.
Weakening global demand: The world economy is suffering from the surge in
fiscal and financial uncertainty in the eurozone on one hand and the softening in
US growth on the other, driven by a political impasse over fiscal consolidation, a
weak housing market, and deteriorating financial conditions. Adding to this is the
wave of unrest in some oil-producing countries. Growth in Egypt’s main trading
partners is to remain weak; the eurozone is expected to fall into mild recession with
the economy contracting by 0.5%, while the US is expected to maintain its slow
growth of 1.8%, as in 2011.
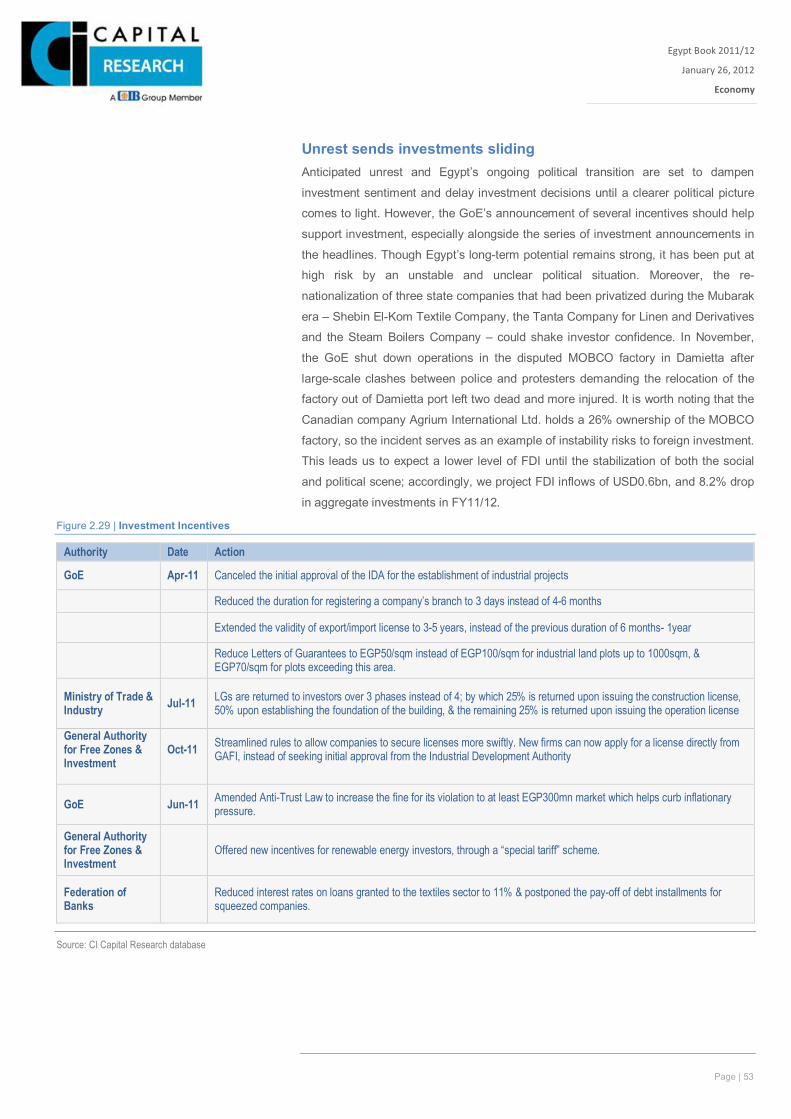
Page | 53
Egypt Book 2011/12
January 26, 2012
Economy
Xxx
Unrest sends investments sliding Anticipated unrest and Egypt’s ongoing political transition are set to dampen
investment sentiment and delay investment decisions until a clearer political picture
comes to light. However, the GoE’s announcement of several incentives should help
support investment, especially alongside the series of investment announcements in
the headlines. Though Egypt’s long-term potential remains strong, it has been put at
high risk by an unstable and unclear political situation. Moreover, the re-
nationalization of three state companies that had been privatized during the Mubarak
era – Shebin El-Kom Textile Company, the Tanta Company for Linen and Derivatives
and the Steam Boilers Company – could shake investor confidence. In November,
the GoE shut down operations in the disputed MOBCO factory in Damietta after
large-scale clashes between police and protesters demanding the relocation of the
factory out of Damietta port left two dead and more injured. It is worth noting that the
Canadian company Agrium International Ltd. holds a 26% ownership of the MOBCO
factory, so the incident serves as an example of instability risks to foreign investment.
This leads us to expect a lower level of FDI until the stabilization of both the social
and political scene; accordingly, we project FDI inflows of USD0.6bn, and 8.2% drop
in aggregate investments in FY11/12.
Figure 2.29 | Investment Incentives
Authority Date Action
GoE Apr-11 Canceled the initial approval of the IDA for the establishment of industrial projects
Reduced the duration for registering a company’s branch to 3 days instead of 4-6 months
Extended the validity of export/import license to 3-5 years, instead of the previous duration of 6 months- 1year
Reduce Letters of Guarantees to EGP50/sqm instead of EGP100/sqm for industrial land plots up to 1000sqm, & EGP70/sqm for plots exceeding this area.
Ministry of Trade & Industry Jul-11 LGs are returned to investors over 3 phases instead of 4; by which 25% is returned upon issuing the construction license,
50% upon establishing the foundation of the building, & the remaining 25% is returned upon issuing the operation license
General Authority for Free Zones & Investment
Oct-11
Streamlined rules to allow companies to secure licenses more swiftly. New firms can now apply for a license directly from GAFI, instead of seeking initial approval from the Industrial Development Authority
GoE Jun-11 Amended Anti-Trust Law to increase the fine for its violation to at least EGP300mn market which helps curb inflationary pressure.
General Authority for Free Zones & Investment
Offered new incentives for renewable energy investors, through a “special tariff” scheme.
Federation of Banks Reduced interest rates on loans granted to the textiles sector to 11% & postponed the pay-off of debt installments for
squeezed companies.
Source: CI Capital Research database
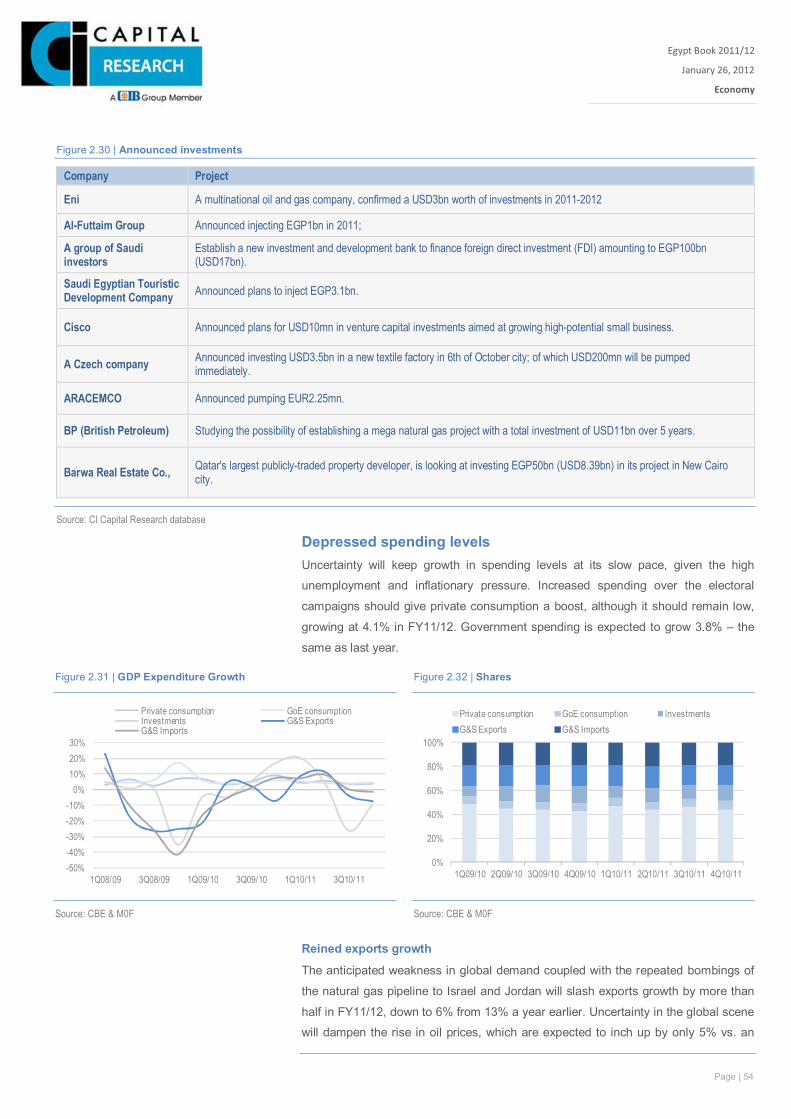
Page | 54
Egypt Book 2011/12
January 26, 2012
Economy
Xxx
Figure 2.30 | Announced investments
Company Project
Eni A multinational oil and gas company, confirmed a USD3bn worth of investments in 2011-2012
Al-Futtaim Group Announced injecting EGP1bn in 2011;
A group of Saudi investors
Establish a new investment and development bank to finance foreign direct investment (FDI) amounting to EGP100bn (USD17bn).
Saudi Egyptian Touristic Development Company Announced plans to inject EGP3.1bn.
Cisco Announced plans for USD10mn in venture capital investments aimed at growing high-potential small business.
A Czech company Announced investing USD3.5bn in a new textile factory in 6th of October city; of which USD200mn will be pumped immediately.
ARACEMCO Announced pumping EUR2.25mn.
BP (British Petroleum) Studying the possibility of establishing a mega natural gas project with a total investment of USD11bn over 5 years.
Barwa Real Estate Co., Qatar's largest publicly-traded property developer, is looking at investing EGP50bn (USD8.39bn) in its project in New Cairo city.
Source: CI Capital Research database
Depressed spending levels Uncertainty will keep growth in spending levels at its slow pace, given the high
unemployment and inflationary pressure. Increased spending over the electoral
campaigns should give private consumption a boost, although it should remain low,
growing at 4.1% in FY11/12. Government spending is expected to grow 3.8% – the
same as last year.
External sector to remain weak
Reined exports growth
The anticipated weakness in global demand coupled with the repeated bombings of
the natural gas pipeline to Israel and Jordan will slash exports growth by more than
half in FY11/12, down to 6% from 13% a year earlier. Uncertainty in the global scene
will dampen the rise in oil prices, which are expected to inch up by only 5% vs. an
Figure 2.31 | GDP Expenditure Growth Figure 2.32 | Shares
-50%-40%-30%-20%-10%
0%10%20%30%
1Q08/09 3Q08/09 1Q09/10 3Q09/10 1Q10/11 3Q10/11
Private consumption GoE consumptionInvestments G&S ExportsG&S Imports
0%
20%
40%
60%
80%
100%
1Q09/10 2Q09/10 3Q09/10 4Q09/10 1Q10/11 2Q10/11 3Q10/11 4Q10/11
Private consumption GoE consumption InvestmentsG&S Exports G&S Imports
Source: CBE & M0F
Source: CBE & M0F
Page | 55
Egypt Book 2011/12
January 26, 2012
Economy
Xxx
increase of 19% a year earlier – barring an escalation in the situation in Iran.
Moreover, the halt of natural gas exports to Jordan and Israel due to the repeated
pipeline bombings will offset the increase in gas export prices to Jordan by c.150% to
USD5.2/mnBtu – which should be implemented starting January 2011, retroactively.
Weak tourism revenues
Tourism will continue to struggle until confidence in the country’s stability returns. We
believe the social unrest will slash tourists’ arrivals to 9.97mn tourists over FY11/12
vs. an inflow of 11.9mn tourists a year earlier. We thus expect tourism revenues to
drop 25% in FY11/12 to USD8bn. However, should the unrest be contained and
stability maintained, the industry will soon return to its positive growth levels.
Suez Canal to remain resilient
Given its resilience over 2011, we expect the Suez Canal’s revenues to remain solid,
rising 12.5% in FY11/12 to USD5.7bn, and supported by the higher fees of 3%
effective March 2012. Canal revenues reached USD1.36bn in 1Q11/12, increasing
8.6% YoY.
Instability to depress transfers growth
The mere 5% increase in oil prices, unclear political situation and escalating social
unrest will pressure remittances growth. We believe this should lead transfers to
register a growth of 15.4% in FY11/12 vs. a growth of 25.6% a year earlier.
Slight imports growth
Continued drop in investments and depressed spending levels should rein imports
growth, keeping it in the single-digit range of 3.3% in FY11/12 vs. 3.6% a year earlier.
Current account deficit to widen
The widened balance of goods and services deficit should negatively reflect on the
current account provided the depressed growth in transfers. We believe the current
account deficit will widen to USD3.2bn in FY11/12 compared to USD2.8bn a year
earlier.
Falling international reserves
The SCAF expects to see international reserves of USD15bn by January 2012, since
USD5bn is already committed in payments to foreign investors or other obligations.
We expect reserves to mark another low of USD12.2bn in FY11/12, which will cover
only 3 months of imports, down from 9 months in FY09/10.
Higher fiscal deficit Higher taxes and non-tax revenues will increase revenues
Although the anticipated sluggish increase in oil prices could depress EGPC
profitability, the GoE’s introduction of a progressive tax scheme (with a new tax tier of
25%) and the additional 10% imposed on cigarettes sales should reflect positively on
tax revenues. Further, Suez Canal performance is to remain resilient, which should
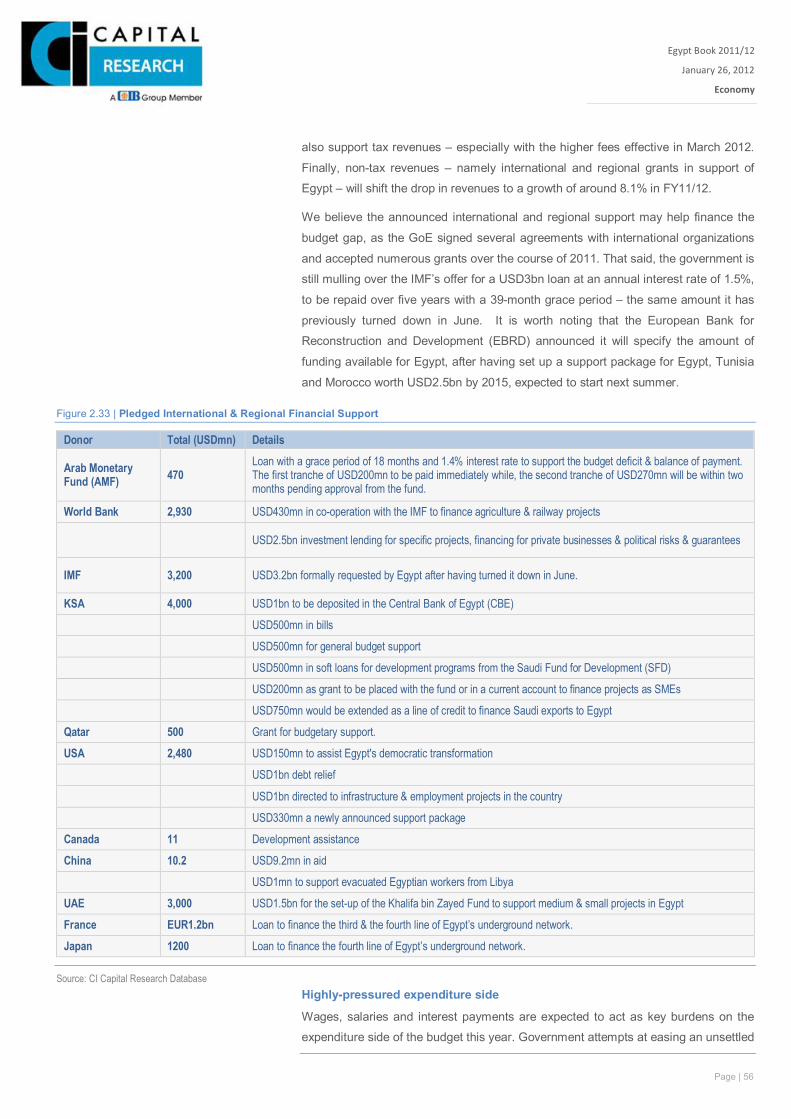
Page | 56
Egypt Book 2011/12
January 26, 2012
Economy
Xxx
also support tax revenues – especially with the higher fees effective in March 2012.
Finally, non-tax revenues – namely international and regional grants in support of
Egypt – will shift the drop in revenues to a growth of around 8.1% in FY11/12.
We believe the announced international and regional support may help finance the
budget gap, as the GoE signed several agreements with international organizations
and accepted numerous grants over the course of 2011. That said, the government is
still mulling over the IMF’s offer for a USD3bn loan at an annual interest rate of 1.5%,
to be repaid over five years with a 39-month grace period – the same amount it has
previously turned down in June. It is worth noting that the European Bank for
Reconstruction and Development (EBRD) announced it will specify the amount of
funding available for Egypt, after having set up a support package for Egypt, Tunisia
and Morocco worth USD2.5bn by 2015, expected to start next summer.
Figure 2.33 | Pledged International & Regional Financial Support
Donor Total (USDmn) Details
Arab Monetary Fund (AMF) 470
Loan with a grace period of 18 months and 1.4% interest rate to support the budget deficit & balance of payment. The first tranche of USD200mn to be paid immediately while, the second tranche of USD270mn will be within two months pending approval from the fund.
World Bank 2,930 USD430mn in co-operation with the IMF to finance agriculture & railway projects
USD2.5bn investment lending for specific projects, financing for private businesses & political risks & guarantees
IMF 3,200 USD3.2bn formally requested by Egypt after having turned it down in June.
KSA 4,000 USD1bn to be deposited in the Central Bank of Egypt (CBE) USD500mn in bills USD500mn for general budget support USD500mn in soft loans for development programs from the Saudi Fund for Development (SFD) USD200mn as grant to be placed with the fund or in a current account to finance projects as SMEs USD750mn would be extended as a line of credit to finance Saudi exports to Egypt
Qatar 500 Grant for budgetary support.
USA 2,480 USD150mn to assist Egypt's democratic transformation USD1bn debt relief USD1bn directed to infrastructure & employment projects in the country USD330mn a newly announced support package
Canada 11 Development assistance
China 10.2 USD9.2mn in aid USD1mn to support evacuated Egyptian workers from Libya
UAE 3,000 USD1.5bn for the set-up of the Khalifa bin Zayed Fund to support medium & small projects in Egypt
France EUR1.2bn Loan to finance the third & the fourth line of Egypt’s underground network.
Japan 1200 Loan to finance the fourth line of Egypt’s underground network.
Source: CI Capital Research Database Highly-pressured expenditure side
Wages, salaries and interest payments are expected to act as key burdens on the
expenditure side of the budget this year. Government attempts at easing an unsettled
Page | 57
Egypt Book 2011/12
January 26, 2012
Economy
Xxx
public will drive up wages and salaries in FY11/12, while the high interest payment –
due to high yields – will further pressure the budget. On the other hand, the moderate
rise in oil and commodities prices will, in a way, alleviate rising expenditure. We
expect that expenditure will reach EGP437.2bn in FY11/12 – below the budgeted
figure of EGP490.6bn.
The government has partially lifted energy subsidies for natural gas (having taken
effect January 1, 2012) for energy-intensive industries – cement, fertilizers, ceramics
and steel – implying a 33% increase from USD3/mmbtu to USD4/mmbtu. As natural
gas subsidies account for 10.2% of total energy subsidies, of which energy-intensive
industries consume around 60%, we do not expect the increase in prices to have a
strong impact. We expect the rise to save EGP522mn, especially since it will be
implemented in the second half of the fiscal year.
A wider fiscal deficit of 11.8% to GDP
The new fiscal policy displays a consideration and support for the demands of the
revolution. Although raising the minimum wage level should drive up spending, it will
also serve to pressure expenditures. Adding to this is the higher interest payment. On
the revenues side, applying the new tax scheme will allow for a greater flow of
revenues to the budget; EGP1.2bn is expected to be generated from the 10%
increase in cigarettes sales tax, while EGP1bn will be gained from the newly added
tax tier of 25%. We expect fiscal deficit to rise to EGP164bn – a deficit to GDP of
11.8%, up from 9.5% a year earlier.
In 5M11/12 Egypt’s budget revenues increased 16.9%YoY to EGP 77.4bn, up from
EGP 66.2bn, while expenditures increased 11.4%YoY. The increase in revenues was
driven by the 72%YoY rise in non-tax revenues as grants hiked to EGP5.9bn, up
from EGP45mn over the same period a year ago. Meanwhile, tax revenues increased
a mere 2.8% backed by the 26% increase in property taxes. On the expenditures
side, subsidies rose 31%YoY, while interest payment and wages and salaries
maintained double-digit growths of 22% and 24%, respectively. This brought fiscal
deficit to GDP down to 3.7% in 5M11/12 vs. 4% a year earlier.
GoE to adopt austerity policy in FY12/13
The current cabinet announced its intention to reduce the fiscal deficit by
implementing an austerity policy in the coming fiscal year. As part of this, the Minister
of Finance issued a decree detailing the expense rationalizing plan for the
administrative arm of the government, which includes cutting bonuses for
government employees by 10% and governmental operating expenses by 3%. That
said, the ministry has not revealed what exact savings it expects to make from these
measures. The Minister added that he had officially asked for support from the
special funds – which are excluded from the general budget – to serve as loans to be
repaid in three years without interest.
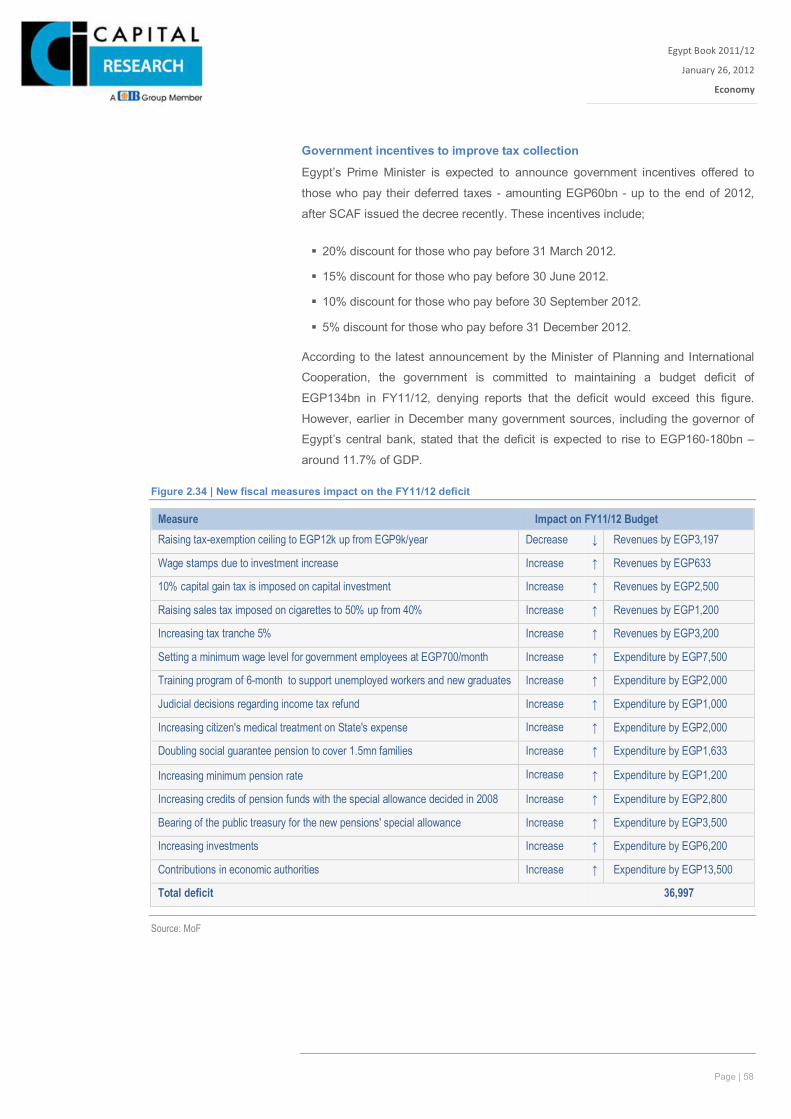
Page | 58
Egypt Book 2011/12
January 26, 2012
Economy
Xxx
Government incentives to improve tax collection
Egypt’s Prime Minister is expected to announce government incentives offered to
those who pay their deferred taxes - amounting EGP60bn - up to the end of 2012,
after SCAF issued the decree recently. These incentives include;
20% discount for those who pay before 31 March 2012.
15% discount for those who pay before 30 June 2012.
10% discount for those who pay before 30 September 2012.
5% discount for those who pay before 31 December 2012.
According to the latest announcement by the Minister of Planning and International
Cooperation, the government is committed to maintaining a budget deficit of
EGP134bn in FY11/12, denying reports that the deficit would exceed this figure.
However, earlier in December many government sources, including the governor of
Egypt’s central bank, stated that the deficit is expected to rise to EGP160-180bn –
around 11.7% of GDP.
Figure 2.34 | New fiscal measures impact on the FY11/12 deficit
Measure Impact on FY11/12 Budget Raising tax-exemption ceiling to EGP12k up from EGP9k/year Decrease ↓ Revenues by EGP3,197
Wage stamps due to investment increase Increase ↑ Revenues by EGP633
10% capital gain tax is imposed on capital investment Increase ↑ Revenues by EGP2,500
Raising sales tax imposed on cigarettes to 50% up from 40% Increase ↑ Revenues by EGP1,200
Increasing tax tranche 5% Increase ↑ Revenues by EGP3,200
Setting a minimum wage level for government employees at EGP700/month Increase ↑ Expenditure by EGP7,500
Training program of 6-month to support unemployed workers and new graduates Increase ↑ Expenditure by EGP2,000
Judicial decisions regarding income tax refund Increase ↑ Expenditure by EGP1,000
Increasing citizen's medical treatment on State's expense Increase ↑ Expenditure by EGP2,000
Doubling social guarantee pension to cover 1.5mn families Increase ↑ Expenditure by EGP1,633
Increasing minimum pension rate Increase ↑ Expenditure by EGP1,200
Increasing credits of pension funds with the special allowance decided in 2008 Increase ↑ Expenditure by EGP2,800
Bearing of the public treasury for the new pensions' special allowance Increase ↑ Expenditure by EGP3,500
Increasing investments Increase ↑ Expenditure by EGP6,200
Contributions in economic authorities Increase ↑ Expenditure by EGP13,500
Total deficit 36,997
Source: MoF
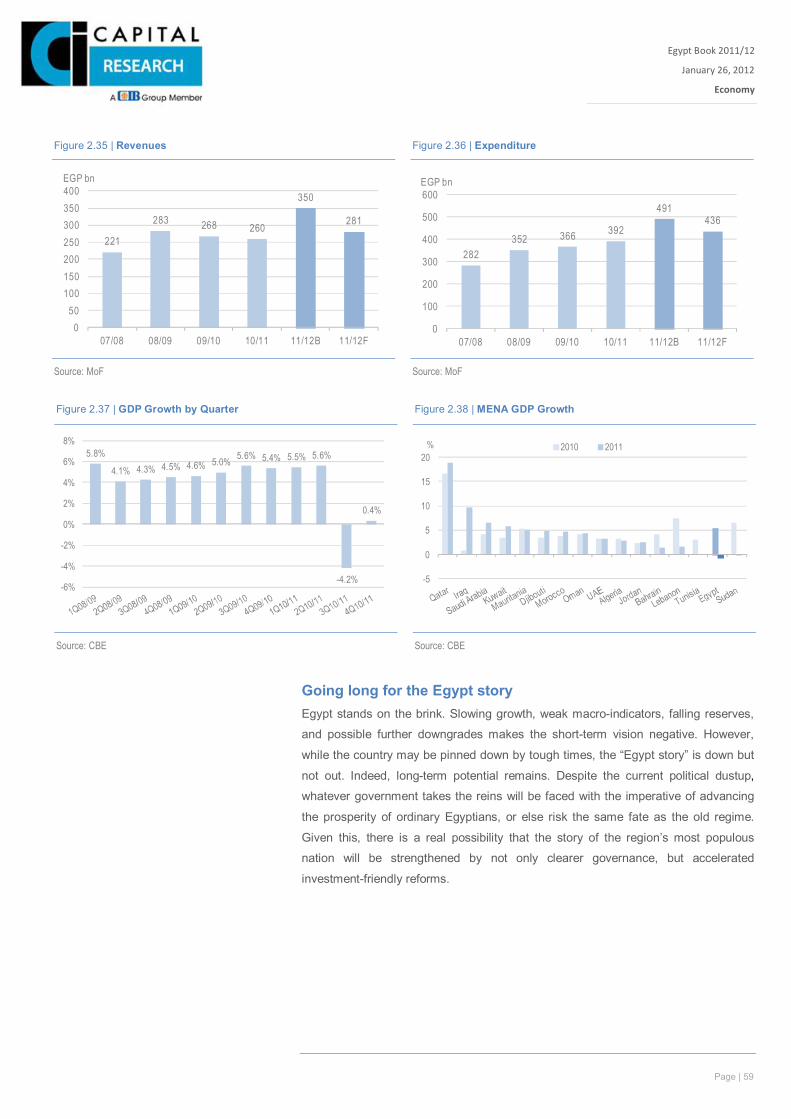
Page | 59
Egypt Book 2011/12
January 26, 2012
Economy
Xxx
Going long for the Egypt story Egypt stands on the brink. Slowing growth, weak macro-indicators, falling reserves,
and possible further downgrades makes the short-term vision negative. However,
while the country may be pinned down by tough times, the “Egypt story” is down but
not out. Indeed, long-term potential remains. Despite the current political dustup,
whatever government takes the reins will be faced with the imperative of advancing
the prosperity of ordinary Egyptians, or else risk the same fate as the old regime.
Given this, there is a real possibility that the story of the region’s most populous
nation will be strengthened by not only clearer governance, but accelerated
investment-friendly reforms.
Figure 2.35 | Revenues Figure 2.36 | Expenditure
221
283 268 260
350
281
050
100150200250300350400
07/08 08/09 09/10 10/11 11/12B 11/12F
EGP bn
282352 366 392
491436
0
100
200
300
400
500
600
07/08 08/09 09/10 10/11 11/12B 11/12F
EGP bn
Source: MoF
Source: MoF
Figure 2.37 | GDP Growth by Quarter Figure 2.38 | MENA GDP Growth
5.8%
4.1% 4.3% 4.5% 4.6% 5.0% 5.6% 5.4% 5.5% 5.6%
-4.2%
0.4%
-6%
-4%
-2%
0%
2%
4%
6%
8%
-5
0
5
10
15
20% 2010 2011
Source: CBE
Source: CBE
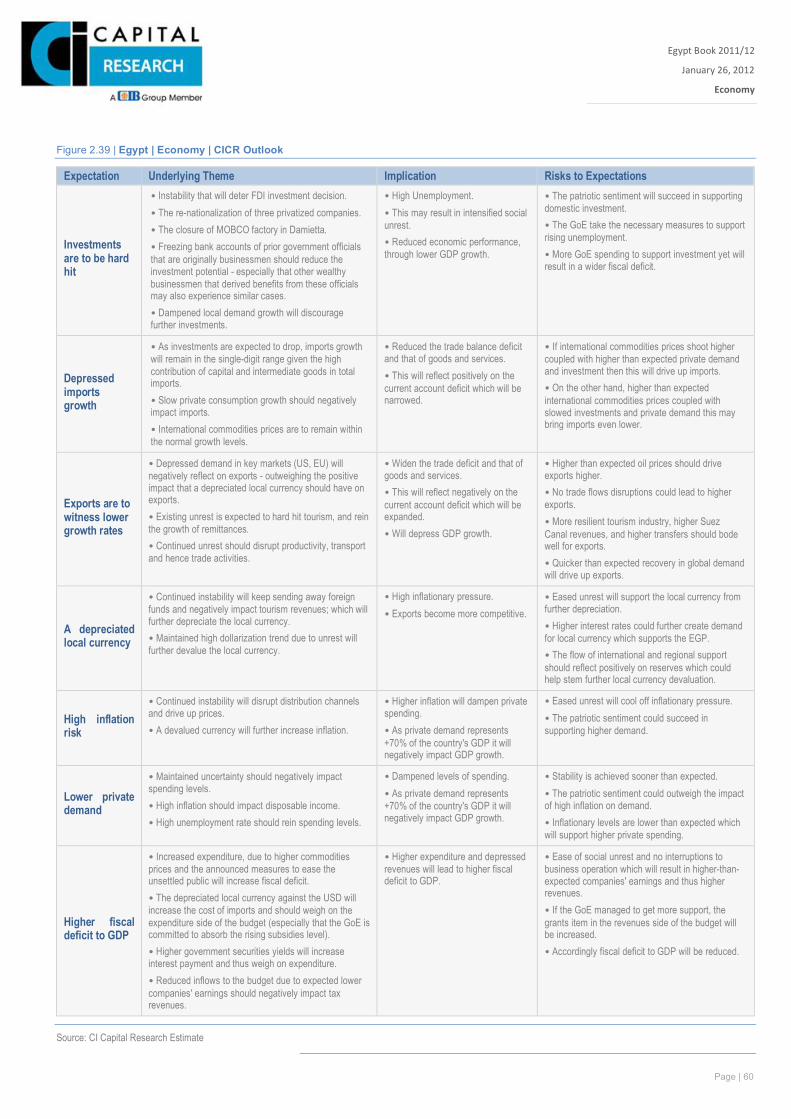
Page | 60
Egypt Book 2011/12
January 26, 2012
Economy
Xxx
Figure 2.39 | Egypt | Economy | CICR Outlook
Expectation Underlying Theme Implication Risks to Expectations
Investments are to be hard hit
• Instability that will deter FDI investment decision. • The re-nationalization of three privatized companies. • The closure of MOBCO factory in Damietta. • Freezing bank accounts of prior government officials that are originally businessmen should reduce the investment potential - especially that other wealthy businessmen that derived benefits from these officials may also experience similar cases. • Dampened local demand growth will discourage further investments.
• High Unemployment. • This may result in intensified social unrest. • Reduced economic performance, through lower GDP growth.
• The patriotic sentiment will succeed in supporting domestic investment. • The GoE take the necessary measures to support rising unemployment. • More GoE spending to support investment yet will result in a wider fiscal deficit.
Depressed imports growth
• As investments are expected to drop, imports growth will remain in the single-digit range given the high contribution of capital and intermediate goods in total imports. • Slow private consumption growth should negatively impact imports. • International commodities prices are to remain within the normal growth levels.
• Reduced the trade balance deficit and that of goods and services. • This will reflect positively on the current account deficit which will be narrowed.
• If international commodities prices shoot higher coupled with higher than expected private demand and investment then this will drive up imports. • On the other hand, higher than expected international commodities prices coupled with slowed investments and private demand this may bring imports even lower.
Exports are to witness lower growth rates
• Depressed demand in key markets (US, EU) will negatively reflect on exports - outweighing the positive impact that a depreciated local currency should have on exports. • Existing unrest is expected to hard hit tourism, and rein the growth of remittances. • Continued unrest should disrupt productivity, transport and hence trade activities.
• Widen the trade deficit and that of goods and services. • This will reflect negatively on the current account deficit which will be expanded. • Will depress GDP growth.
• Higher than expected oil prices should drive exports higher. • No trade flows disruptions could lead to higher exports. • More resilient tourism industry, higher Suez Canal revenues, and higher transfers should bode well for exports. • Quicker than expected recovery in global demand will drive up exports.
A depreciated local currency
• Continued instability will keep sending away foreign funds and negatively impact tourism revenues; which will further depreciate the local currency. • Maintained high dollarization trend due to unrest will further devalue the local currency.
• High inflationary pressure. • Exports become more competitive.
• Eased unrest will support the local currency from further depreciation. • Higher interest rates could further create demand for local currency which supports the EGP. • The flow of international and regional support should reflect positively on reserves which could help stem further local currency devaluation.
High inflation risk
• Continued instability will disrupt distribution channels and drive up prices. • A devalued currency will further increase inflation.
• Higher inflation will dampen private spending. • As private demand represents +70% of the country's GDP it will negatively impact GDP growth.
• Eased unrest will cool off inflationary pressure. • The patriotic sentiment could succeed in supporting higher demand.
Lower private demand
• Maintained uncertainty should negatively impact spending levels. • High inflation should impact disposable income. • High unemployment rate should rein spending levels.
• Dampened levels of spending. • As private demand represents +70% of the country's GDP it will negatively impact GDP growth.
• Stability is achieved sooner than expected. • The patriotic sentiment could outweigh the impact of high inflation on demand. • Inflationary levels are lower than expected which will support higher private spending.
Higher fiscal deficit to GDP
• Increased expenditure, due to higher commodities prices and the announced measures to ease the unsettled public will increase fiscal deficit. • The depreciated local currency against the USD will increase the cost of imports and should weigh on the expenditure side of the budget (especially that the GoE is committed to absorb the rising subsidies level). • Higher government securities yields will increase interest payment and thus weigh on expenditure. • Reduced inflows to the budget due to expected lower companies' earnings should negatively impact tax revenues.
• Higher expenditure and depressed revenues will lead to higher fiscal deficit to GDP.
• Ease of social unrest and no interruptions to business operation which will result in higher-than-expected companies' earnings and thus higher revenues. • If the GoE managed to get more support, the grants item in the revenues side of the budget will be increased. • Accordingly fiscal deficit to GDP will be reduced.
Source: CI Capital Research Estimate
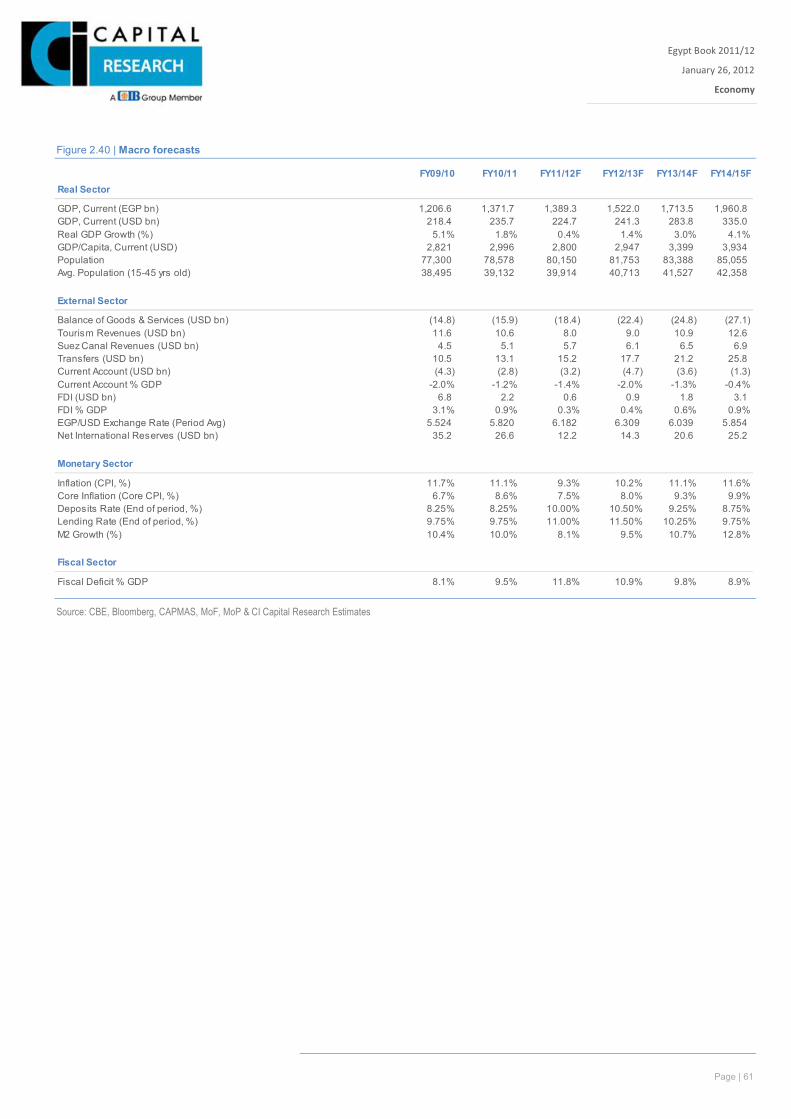
Page | 61
Egypt Book 2011/12
January 26, 2012
Economy
Xxx
Figure 2.40 | Macro forecasts
Source: CBE, Bloomberg, CAPMAS, MoF, MoP & CI Capital Research Estimates
FY09/10 FY10/11 FY11/12F FY12/13F FY13/14F FY14/15FReal Sector
GDP, Current (EGP bn) 1,206.6 1,371.7 1,389.3 1,522.0 1,713.5 1,960.8 GDP, Current (USD bn) 218.4 235.7 224.7 241.3 283.8 335.0 Real GDP Growth (%) 5.1% 1.8% 0.4% 1.4% 3.0% 4.1%GDP/Capita, Current (USD) 2,821 2,996 2,800 2,947 3,399 3,934 Population 77,300 78,578 80,150 81,753 83,388 85,055 Avg. Population (15-45 yrs old) 38,495 39,132 39,914 40,713 41,527 42,358
External Sector
Balance of Goods & Services (USD bn) (14.8) (15.9) (18.4) (22.4) (24.8) (27.1) Tourism Revenues (USD bn) 11.6 10.6 8.0 9.0 10.9 12.6 Suez Canal Revenues (USD bn) 4.5 5.1 5.7 6.1 6.5 6.9 Transfers (USD bn) 10.5 13.1 15.2 17.7 21.2 25.8 Current Account (USD bn) (4.3) (2.8) (3.2) (4.7) (3.6) (1.3) Current Account % GDP -2.0% -1.2% -1.4% -2.0% -1.3% -0.4%FDI (USD bn) 6.8 2.2 0.6 0.9 1.8 3.1 FDI % GDP 3.1% 0.9% 0.3% 0.4% 0.6% 0.9%EGP/USD Exchange Rate (Period Avg) 5.524 5.820 6.182 6.309 6.039 5.854 Net International Reserves (USD bn) 35.2 26.6 12.2 14.3 20.6 25.2
Monetary Sector
Inflation (CPI, %) 11.7% 11.1% 9.3% 10.2% 11.1% 11.6%Core Inflation (Core CPI, %) 6.7% 8.6% 7.5% 8.0% 9.3% 9.9%Deposits Rate (End of period, %) 8.25% 8.25% 10.00% 10.50% 9.25% 8.75%Lending Rate (End of period, %) 9.75% 9.75% 11.00% 11.50% 10.25% 9.75%M2 Growth (%) 10.4% 10.0% 8.1% 9.5% 10.7% 12.8%
Fiscal Sector
Fiscal Deficit % GDP 8.1% 9.5% 11.8% 10.9% 9.8% 8.9%

Page | 62
THIS PAGE LEFT INTENTIONALLY BLANK
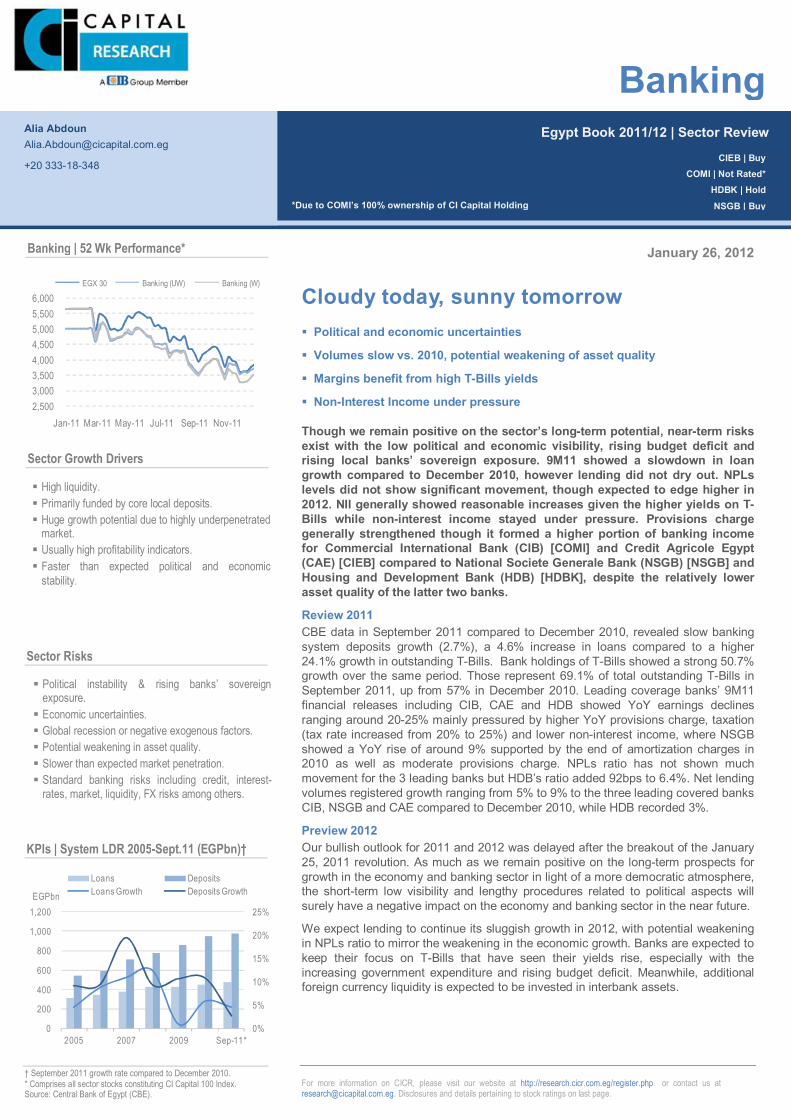
Page | 63
Page | 63
For more information on CICR, please visit our website at http://research.cicr.com.eg/register.php or contact us at [email protected]. Disclosures and details pertaining to stock ratings on last page.
January 26, 2012
Cloudy today, sunny tomorrow Political and economic uncertainties
Volumes slow vs. 2010, potential weakening of asset quality
Margins benefit from high T-Bills yields
Non-Interest Income under pressure
Though we remain positive on the sector’s long-term potential, near-term risks exist with the low political and economic visibility, rising budget deficit and rising local banks’ sovereign exposure. 9M11 showed a slowdown in loan growth compared to December 2010, however lending did not dry out. NPLs levels did not show significant movement, though expected to edge higher in 2012. NII generally showed reasonable increases given the higher yields on T-Bills while non-interest income stayed under pressure. Provisions charge generally strengthened though it formed a higher portion of banking income for Commercial International Bank (CIB) [COMI] and Credit Agricole Egypt (CAE) [CIEB] compared to National Societe Generale Bank (NSGB) [NSGB] and Housing and Development Bank (HDB) [HDBK], despite the relatively lower asset quality of the latter two banks.
Review 2011 CBE data in September 2011 compared to December 2010, revealed slow banking system deposits growth (2.7%), a 4.6% increase in loans compared to a higher 24.1% growth in outstanding T-Bills. Bank holdings of T-Bills showed a strong 50.7% growth over the same period. Those represent 69.1% of total outstanding T-Bills in September 2011, up from 57% in December 2010. Leading coverage banks’ 9M11 financial releases including CIB, CAE and HDB showed YoY earnings declines ranging around 20-25% mainly pressured by higher YoY provisions charge, taxation (tax rate increased from 20% to 25%) and lower non-interest income, where NSGB showed a YoY rise of around 9% supported by the end of amortization charges in 2010 as well as moderate provisions charge. NPLs ratio has not shown much movement for the 3 leading banks but HDB’s ratio added 92bps to 6.4%. Net lending volumes registered growth ranging from 5% to 9% to the three leading covered banks CIB, NSGB and CAE compared to December 2010, while HDB recorded 3%.
Preview 2012 Our bullish outlook for 2011 and 2012 was delayed after the breakout of the January 25, 2011 revolution. As much as we remain positive on the long-term prospects for growth in the economy and banking sector in light of a more democratic atmosphere, the short-term low visibility and lengthy procedures related to political aspects will surely have a negative impact on the economy and banking sector in the near future.
We expect lending to continue its sluggish growth in 2012, with potential weakening in NPLs ratio to mirror the weakening in the economic growth. Banks are expected to keep their focus on T-Bills that have seen their yields rise, especially with the increasing government expenditure and rising budget deficit. Meanwhile, additional foreign currency liquidity is expected to be invested in interbank assets.
Egypt Book 2011/12 | Sector Review
Banking
CIEB | Buy COMI | Not Rated*
HDBK | Hold
NSGB | Buy
Alia Abdoun [email protected]
+20 333-18-348
High liquidity. Primarily funded by core local deposits. Huge growth potential due to highly underpenetrated
market. Usually high profitability indicators. Faster than expected political and economic
stability.
Political instability & rising banks’ sovereign exposure. Economic uncertainties. Global recession or negative exogenous factors. Potential weakening in asset quality. Slower than expected market penetration. Standard banking risks including credit, interest-
rates, market, liquidity, FX risks among others.
Banking | 52 Wk Performance*
2,500 3,000 3,500 4,000 4,500 5,000 5,500 6,000
Jan-11 Mar-11 May-11 Jul-11 Sep-11 Nov-11
EGX 30 Banking (UW) Banking (W)
Sector Growth Drivers
Sector Risks
0%
5%
10%
15%
20%
25%
0
200
400
600
800
1,000
1,200
2005 2007 2009 Sep-11*
EGPbn
Loans DepositsLoans Growth Deposits Growth
KPIs | System LDR 2005-Sept.11 (EGPbn)†
† September 2011 growth rate compared to December 2010. * Comprises all sector stocks constituting CI Capital 100 Index. Source: Central Bank of Egypt (CBE).
*Due to COMI’s 100% ownership of CI Capital Holding
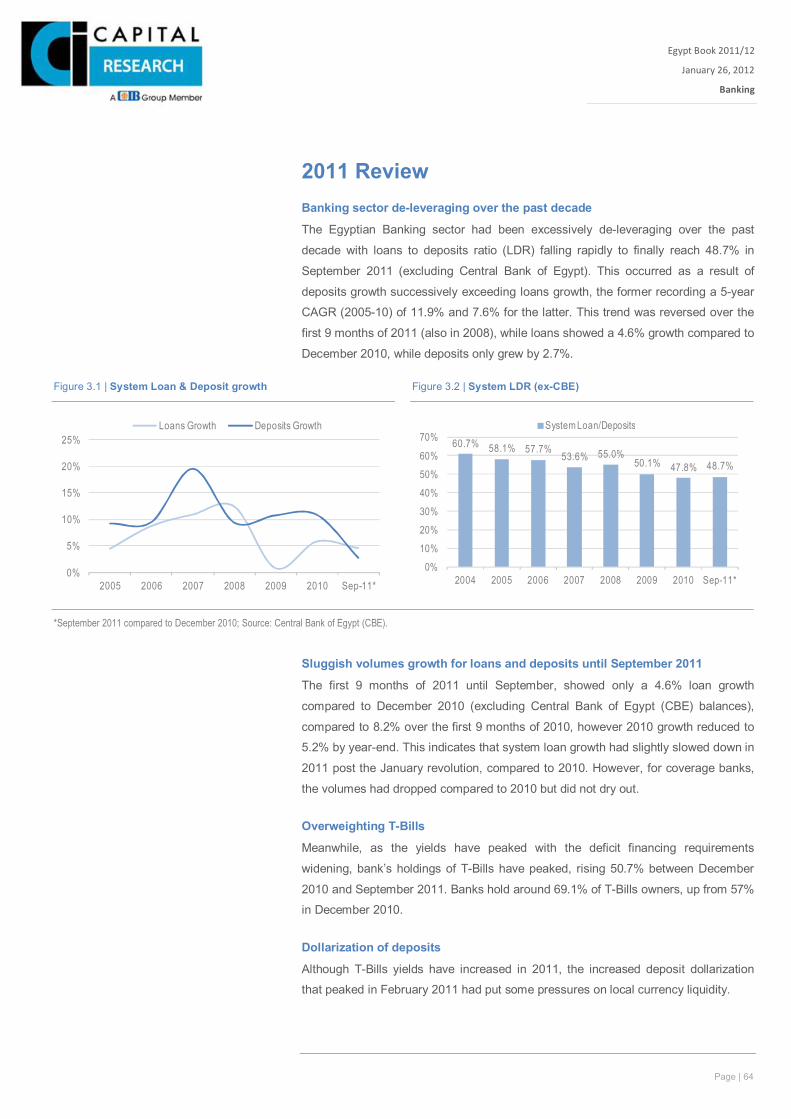
Page | 64
Egypt Book 2011/12
January 26, 2012
Banking
Xxx
2011 Review Banking sector de-leveraging over the past decade
The Egyptian Banking sector had been excessively de-leveraging over the past
decade with loans to deposits ratio (LDR) falling rapidly to finally reach 48.7% in
September 2011 (excluding Central Bank of Egypt). This occurred as a result of
deposits growth successively exceeding loans growth, the former recording a 5-year
CAGR (2005-10) of 11.9% and 7.6% for the latter. This trend was reversed over the
first 9 months of 2011 (also in 2008), while loans showed a 4.6% growth compared to
December 2010, while deposits only grew by 2.7%.
Sluggish volumes growth for loans and deposits until September 2011
The first 9 months of 2011 until September, showed only a 4.6% loan growth
compared to December 2010 (excluding Central Bank of Egypt (CBE) balances),
compared to 8.2% over the first 9 months of 2010, however 2010 growth reduced to
5.2% by year-end. This indicates that system loan growth had slightly slowed down in
2011 post the January revolution, compared to 2010. However, for coverage banks,
the volumes had dropped compared to 2010 but did not dry out.
Overweighting T-Bills
Meanwhile, as the yields have peaked with the deficit financing requirements
widening, bank’s holdings of T-Bills have peaked, rising 50.7% between December
2010 and September 2011. Banks hold around 69.1% of T-Bills owners, up from 57%
in December 2010.
Dollarization of deposits
Although T-Bills yields have increased in 2011, the increased deposit dollarization
that peaked in February 2011 had put some pressures on local currency liquidity.
0%
5%
10%
15%
20%
25%
2005 2006 2007 2008 2009 2010 Sep-11*
Loans Growth Deposits Growth
60.7% 58.1% 57.7%53.6% 55.0%
50.1% 47.8% 48.7%
0%10%20%30%40%50%60%
70%
2004 2005 2006 2007 2008 2009 2010 Sep-11*
System Loan/Deposits
Figure 3.1 | System Loan & Deposit growth Figure 3.2 | System LDR (ex-CBE)
*September 2011 compared to December 2010; Source: Central Bank of Egypt (CBE).
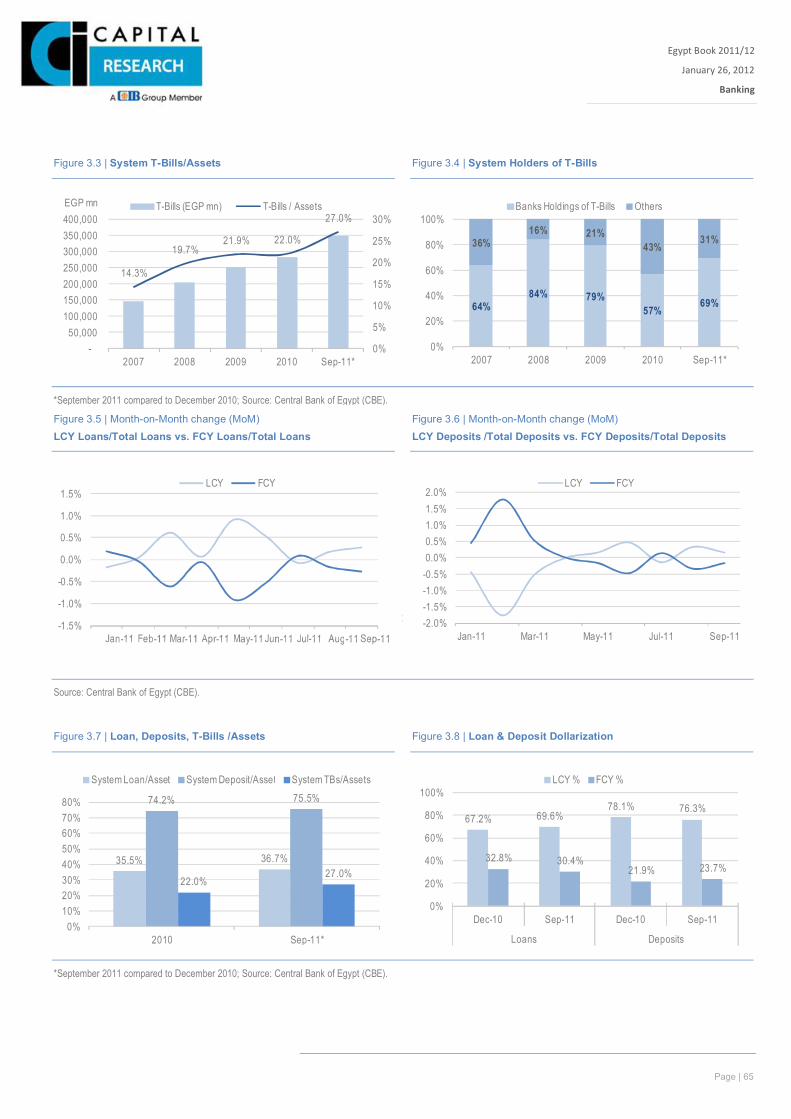
Page | 65
Egypt Book 2011/12
January 26, 2012
Banking
Xxx
Vehicle sales hit by political instability in a tough year for sector
14.3%
19.7%21.9% 22.0%
27.0%
0%
5%
10%
15%
20%
25%
30%
-50,000
100,000 150,000 200,000 250,000 300,000 350,000 400,000
2007 2008 2009 2010 Sep-11*
T-Bills (EGP mn) T-Bills / AssetsEGP mn
64%84% 79%
57%69%
36%16% 21%
43%31%
0%
20%
40%
60%
80%
100%
2007 2008 2009 2010 Sep-11*
Banks Holdings of T-Bills Others
Figure 3.3 | System T-Bills/Assets Figure 3.4 | System Holders of T-Bills
*September 2011 compared to December 2010; Source: Central Bank of Egypt (CBE).
-1.5%
-1.0%
-0.5%
0.0%
0.5%
1.0%
1.5%LCY FCY
-2.0%-1.5%-1.0%-0.5%0.0%0.5%1.0%1.5%2.0%
Jan-11 Mar-11 May-11 Jul-11 Sep-11
LCY FCY
Source: Central Bank of Egypt (CBE).
Figure 3.5 | Month-on-Month change (MoM)
LCY Loans/Total Loans vs. FCY Loans/Total Loans Figure 3.6 | Month-on-Month change (MoM)
LCY Deposits /Total Deposits vs. FCY Deposits/Total Deposits
35.5% 36.7%
74.2% 75.5%
22.0%27.0%
0%10%20%30%40%50%60%70%80%
2010 Sep-11*
System Loan/Asset System Deposit/Asset System TBs/Assets
67.2% 69.6%78.1% 76.3%
32.8% 30.4%21.9% 23.7%
0%
20%
40%
60%
80%
100%
Dec-10 Sep-11 Dec-10 Sep-11
Loans Deposits
LCY % FCY %
Figure 3.7 | Loan, Deposits, T-Bills /Assets Figure 3.8 | Loan & Deposit Dollarization
*September 2011 compared to December 2010; Source: Central Bank of Egypt (CBE).
Page | 66
Egypt Book 2011/12
January 26, 2012
Banking
Xxx
NII healthy but non-interest income under pressure
NII revealed resilience showing an average YoY rise of 13% in the 9M11 for covered
banks, as NIMs have remained healthy following the peak in T-Bills yields.
Meanwhile, a weaker economy and market impacted non-interest income (including
trading income, investment income and gains on selling investments) to close either
almost flat or decline.
Higher tax rate
Due to the change in tax regime that had occurred during 2011, from a flat rate of
20% to 25% on the income above EGP10mn (and 20% will be levied on the first
EGP10mn). This had with no doubt affected NPAT for banks.
NPLs not much movement but potential weakening, provision charges on the rise for some
This far through 2011 (9M11) NPLs ratio had not showed much movement for our
covered banks (+/- 20bps averaging 2.9%) with the exception of HDB, which added a
quicker 92bps to its ratio reaching 6.4%. Provisions charge formed 8% and 11% of
banking income for CIB and CAE in 9M11, respectively, and was lower at 4% for
NSGB. Meanwhile, HDB’s net charge was almost nil.
2012 Preview Loan and deposit volumes to slow in 2012
We expect loan and deposit volumes to slow in 2012 compared to 2011 for all our
Egyptian coverage. Throughout forecast, we expect a range of 5-year CAGR (2010-
15) of 14-17% for loans and 12-16% for deposits.
NIMs to hold up, non-interest income under pressure
Overall, NII is expected to remain healthy as we do not expect T-Bills yields to fall in
2012, despite some expected pressures from the cost of funding, especially after the
two leading public banks had raised interest rates by 150-200bps on two types of
saving certificates and the Central Bank of Egypt (CBE) raised corridor rates
(+100bps for deposits rate, +50bps for lending). Meanwhile, slow balance sheet in
2012 will likely affect fee income. A weaker markets backdrop is expected to weigh
on trading income, dividend income and other income, including gains on investment
sales.
Provisions to continue to be high
Though we expect NPLs ratio to edge higher, we estimate it to add around 56-58bps
cumulatively over 2011 and 2012 for the 3 leading coverage banks, while HDB is
estimated to add around 146bps of which the bulk had been already registered in the
9M11 period vs. December 2010. We expect provisions charges to remain high in
2012
Page | 67
Egypt Book 2011/12
January 26, 2012
Banking
Xxx
Even if the YoY provisions charge eases for part of our coverage, we expect the
charges to remain at high historical averages relative to total banking income.
Furthermore, we expect banks to book higher YoY bank risk reserve allocations from
their year-end profits distribution. Costs are projected to follow their same trend into
2012, with not much higher than normal investment in branch expansions during
2012.
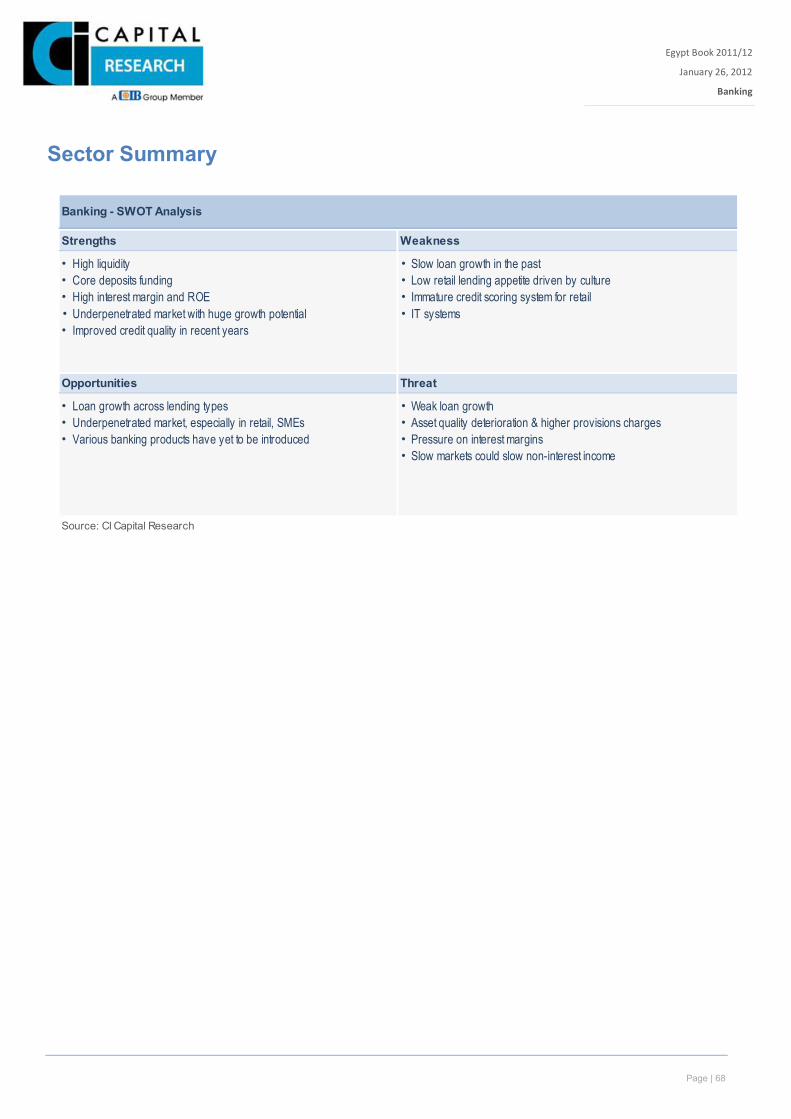
Page | 68
Egypt Book 2011/12
January 26, 2012
Banking
Xxx
Sector Summary
Banking - SWOT Analysis
Strengths Weakness
• High liquidity • Slow loan growth in the past• Core deposits funding • Low retail lending appetite driven by culture• High interest margin and ROE • Immature credit scoring system for retail• Underpenetrated market with huge growth potential • IT systems• Improved credit quality in recent years
Opportunities Threat
• Loan growth across lending types • Weak loan growth• Underpenetrated market, especially in retail, SMEs • Asset quality deterioration & higher provisions charges• Various banking products have yet to be introduced • Pressure on interest margins
• Slow markets could slow non-interest income
Source: CI Capital Research

Page | 69
Egypt Book 2011/12 | Banking
For more information on CICR, please visit our website at http://research.cicr.com.eg/register.php or contact us at [email protected]. Disclosures and details pertaining to stock ratings on last page.
January 26, 2012
The careful builder Maintaining corporate leadership, and building retail.
Maintaining strict risk controls.
Increasing cross-selling activities.
CIB remains a strong brand with a leading market share. The bank generates one of the highest RoEs in the sector and has successfully maintained the growth of its core interest income generation. Along with its corporate-lending leadership, the bank has accelerated its retail segment to 11% of the total loan book. Finally, CIB maintains one of the strictest risk controls and efficiency standards amongst peers.
2011 Review CIB’s ambition to grow its retail loans and enhance its corporate banking leadership was unfazed by this year’s political events, recording growth in both areas. That said, growth has slowed and could have reached the double digits registered in 2010 were it not for the unrest. Asset quality remained at comfortable levels while the bank enhanced its loan provision cushion by heavy charges— especially in 1Q11 and 3Q11— to ensure the maintenance of its strict risk control policy. CAR remained well above the CBE requirement, while higher yields for government bills supported interest margins, especially given CIB’s strong local currency liquidity. However, the non-interest income has been impacted by the weak market. Deeming its current 154 branches adequate, the bank has stalled further expansions, thereby relieving some stress from its cost/income ratio; however, any additional impairment charges related to its fully owned investment banking subsidiary would see this pressure maintained.
2012 Preview We think 2012 volume growth may slow further and NPLs ratio may slightly weaken given an expected slower GDP growth. Loan provisions should remain high, although lower than 2011. Non-interest income will likely remain distressed given uncertainty in the market. Fortunately, NII is expected to maintain its resilience since interest margin is projected to remain flat. All considered, we expect the bank to record YoY earnings growth in 2012, given NII resilience and expected slower YoY provisions.
Valuation & Recommendation Owing to CIB’s 100% ownership of CI Capital Holding, we do not issue a target price or recommendation on the stock.
Alia Abdoun [email protected]
+20 333-18-348
Not Rated
Commercial International Bank
Stock Details As at: 21-Jan-12
CICR Rating/RiskTarget Price/LTFV (EGP)
Last Price (EGP)52 Week High52 Week Low6M Av. Daily Vol. (000' shrs)% Chg: M oM / 6M / YoY
No. o f Shares (mn)M kt. Cap (EGPmn)M kt. Cap (USDmn)*Free Float (%)Paid in Capital (EGPmn)
Reuters / B loombergISIN
GDR DataLast Price (USD)52 Week High52 Week Low
Company Profile
Ow nership StructureActis 9.3%Free Float 90.7%
Source: B loomberg / CICR
n/a
19.96
Not Rated/M oderate
5,934.40
11,845.39
3.37.08
90.70
EGS60121C018
2.90
*USD:EGP FX: 6.04
Commercial International Bank (CIB) [COM I] was foundedby National Bank of Egypt (NBE) and Chase M anhattanBank (CM B) in 1975 under the Open Door Policy. COM Ihas since become Egypt’s leading private-sector bank,providing diversified services to multinationals along withprivate-sector industrial companies. Since its successfulIPO in September 1993, the bank has been one of theEgyptian stock market’ s blue chips.
CIB offers a high quality exposure to a full-f ledged businessvarying among corporate and retail banking, investmentbanking, securities brokerage, mutual funds, assetmanagement, research and insurance.
CIB presence amounted to 154 branches and 488 ATM s.
41.6618.50
593.46
1,022.19
COM I.CA / COM I Ey Equity
1,961.16
-3.6 / -26.1 / -50.9
-
5.0
10.0
15.0
20.0
25.0
30.0
-
10.0
20.0
30.0
40.0
50.0
Jan-11 Mar-11 May-11 Jul-11 Sep-11 Nov-11
mn shrsCurr.Volume COMIEGX 30 (rebased)
52 week Share Performance
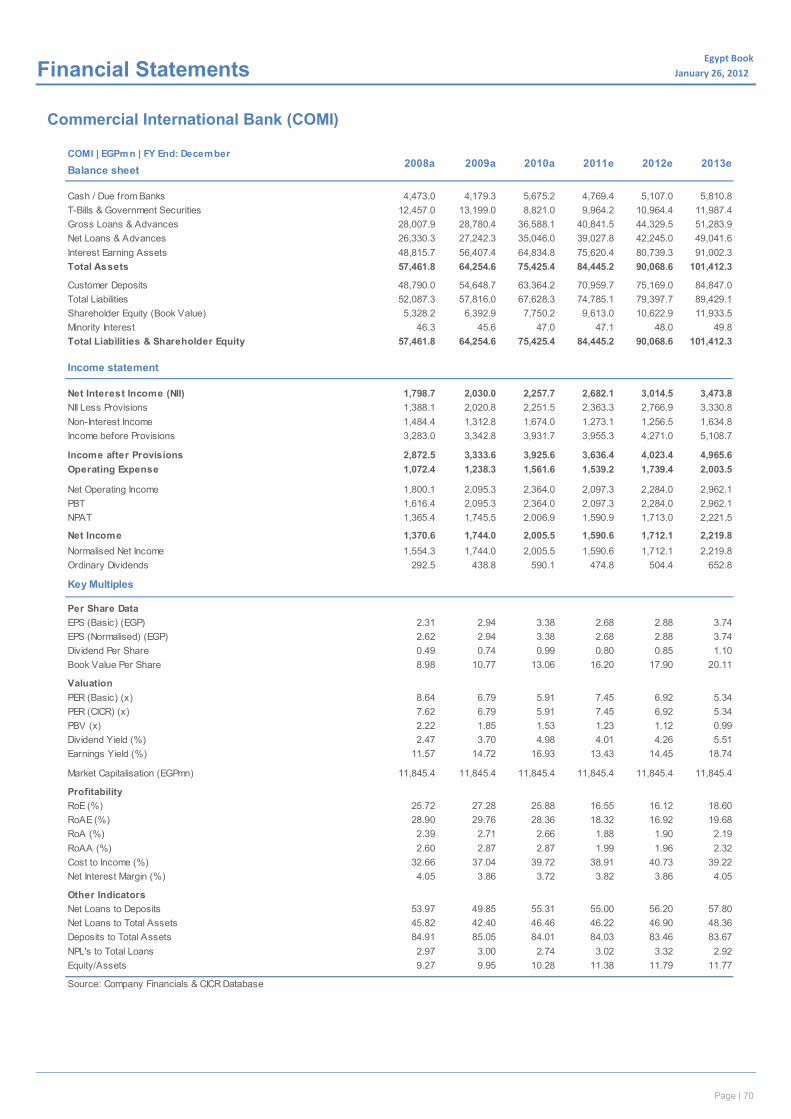
Page | 70
Egypt Book January 26, 2012x Financial Statements
Commercial International Bank (COMI)
COMI | EGPmn | FY End: December
Balance sheet
Cash / Due from Banks 4,473.0 4,179.3 5,675.2 4,769.4 5,107.0 5,810.8T-Bills & Government Securities 12,457.0 13,199.0 8,821.0 9,964.2 10,964.4 11,987.4Gross Loans & Advances 28,007.9 28,780.4 36,588.1 40,841.5 44,329.5 51,283.9Net Loans & Advances 26,330.3 27,242.3 35,046.0 39,027.8 42,245.0 49,041.6Interest Earning Assets 48,815.7 56,407.4 64,834.8 75,620.4 80,739.3 91,002.3Total Assets 57,461.8 64,254.6 75,425.4 84,445.2 90,068.6 101,412.3
Customer Deposits 48,790.0 54,648.7 63,364.2 70,959.7 75,169.0 84,847.0Total Liabilities 52,087.3 57,816.0 67,628.3 74,785.1 79,397.7 89,429.1Shareholder Equity (Book Value) 5,328.2 6,392.9 7,750.2 9,613.0 10,622.9 11,933.5Minority Interest 46.3 45.6 47.0 47.1 48.0 49.8Total Liabilities & Shareholder Equity 57,461.8 64,254.6 75,425.4 84,445.2 90,068.6 101,412.3
Income statement
Net Interest Income (NII) 1,798.7 2,030.0 2,257.7 2,682.1 3,014.5 3,473.8NII Less Provisions 1,388.1 2,020.8 2,251.5 2,363.3 2,766.9 3,330.8Non-Interest Income 1,484.4 1,312.8 1,674.0 1,273.1 1,256.5 1,634.8Income before Provisions 3,283.0 3,342.8 3,931.7 3,955.3 4,271.0 5,108.7
Income after Provisions 2,872.5 3,333.6 3,925.6 3,636.4 4,023.4 4,965.6Operating Expense 1,072.4 1,238.3 1,561.6 1,539.2 1,739.4 2,003.5
Net Operating Income 1,800.1 2,095.3 2,364.0 2,097.3 2,284.0 2,962.1PBT 1,616.4 2,095.3 2,364.0 2,097.3 2,284.0 2,962.1NPAT 1,365.4 1,745.5 2,006.9 1,590.9 1,713.0 2,221.5
Net Income 1,370.6 1,744.0 2,005.5 1,590.6 1,712.1 2,219.8Normalised Net Income 1,554.3 1,744.0 2,005.5 1,590.6 1,712.1 2,219.8Ordinary Dividends 292.5 438.8 590.1 474.8 504.4 652.8
Key Multiples
Per Share DataEPS (Basic) (EGP) 2.31 2.94 3.38 2.68 2.88 3.74EPS (Normalised) (EGP) 2.62 2.94 3.38 2.68 2.88 3.74Dividend Per Share 0.49 0.74 0.99 0.80 0.85 1.10Book Value Per Share 8.98 10.77 13.06 16.20 17.90 20.11
ValuationPER (Basic) (x) 8.64 6.79 5.91 7.45 6.92 5.34PER (CICR) (x) 7.62 6.79 5.91 7.45 6.92 5.34PBV (x) 2.22 1.85 1.53 1.23 1.12 0.99Dividend Yield (%) 2.47 3.70 4.98 4.01 4.26 5.51Earnings Yield (%) 11.57 14.72 16.93 13.43 14.45 18.74
Market Capitalisation (EGPmn) 11,845.4 11,845.4 11,845.4 11,845.4 11,845.4 11,845.4
ProfitabilityRoE (%) 25.72 27.28 25.88 16.55 16.12 18.60RoAE (%) 28.90 29.76 28.36 18.32 16.92 19.68RoA (%) 2.39 2.71 2.66 1.88 1.90 2.19RoAA (%) 2.60 2.87 2.87 1.99 1.96 2.32Cost to Income (%) 32.66 37.04 39.72 38.91 40.73 39.22Net Interest Margin (%) 4.05 3.86 3.72 3.82 3.86 4.05
Other IndicatorsNet Loans to Deposits 53.97 49.85 55.31 55.00 56.20 57.80Net Loans to Total Assets 45.82 42.40 46.46 46.22 46.90 48.36Deposits to Total Assets 84.91 85.05 84.01 84.03 83.46 83.67NPL's to Total Loans 2.97 3.00 2.74 3.02 3.32 2.92Equity/Assets 9.27 9.95 10.28 11.38 11.79 11.77
Source: Company Financials & CICR Database
2008a 2009a 2010a 2011e 2012e 2013e
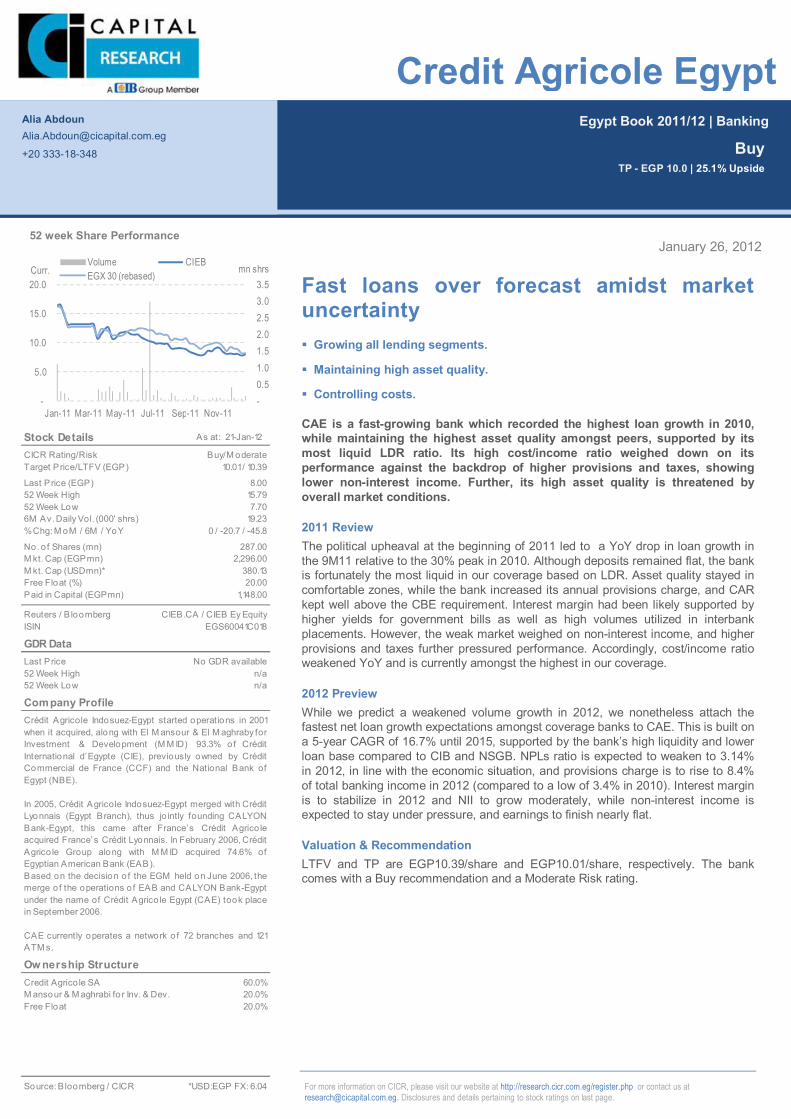
Page | 71
Egypt Book 2011/12 | Banking
For more information on CICR, please visit our website at http://research.cicr.com.eg/register.php or contact us at [email protected]. Disclosures and details pertaining to stock ratings on last page.
January 26, 2012
Fast loans over forecast amidst market uncertainty Growing all lending segments.
Maintaining high asset quality.
Controlling costs.
CAE is a fast-growing bank which recorded the highest loan growth in 2010, while maintaining the highest asset quality amongst peers, supported by its most liquid LDR ratio. Its high cost/income ratio weighed down on its performance against the backdrop of higher provisions and taxes, showing lower non-interest income. Further, its high asset quality is threatened by overall market conditions.
2011 Review The political upheaval at the beginning of 2011 led to a YoY drop in loan growth in the 9M11 relative to the 30% peak in 2010. Although deposits remained flat, the bank is fortunately the most liquid in our coverage based on LDR. Asset quality stayed in comfortable zones, while the bank increased its annual provisions charge, and CAR kept well above the CBE requirement. Interest margin had been likely supported by higher yields for government bills as well as high volumes utilized in interbank placements. However, the weak market weighed on non-interest income, and higher provisions and taxes further pressured performance. Accordingly, cost/income ratio weakened YoY and is currently amongst the highest in our coverage.
2012 Preview While we predict a weakened volume growth in 2012, we nonetheless attach the fastest net loan growth expectations amongst coverage banks to CAE. This is built on a 5-year CAGR of 16.7% until 2015, supported by the bank’s high liquidity and lower loan base compared to CIB and NSGB. NPLs ratio is expected to weaken to 3.14% in 2012, in line with the economic situation, and provisions charge is to rise to 8.4% of total banking income in 2012 (compared to a low of 3.4% in 2010). Interest margin is to stabilize in 2012 and NII to grow moderately, while non-interest income is expected to stay under pressure, and earnings to finish nearly flat.
Valuation & Recommendation LTFV and TP are EGP10.39/share and EGP10.01/share, respectively. The bank comes with a Buy recommendation and a Moderate Risk rating.
Alia Abdoun [email protected]
+20 333-18-348
Buy TP - EGP 10.0 | 25.1% Upside
Credit Agricole Egypt
Stock Details As at: 21-Jan-12
CICR Rating/RiskTarget Price/LTFV (EGP)
Last Price (EGP)52 Week High52 Week Low6M Av. Daily Vol. (000' shrs)% Chg: M oM / 6M / YoY
No. o f Shares (mn)M kt. Cap (EGPmn)M kt. Cap (USDmn)*Free Float (%)Paid in Capital (EGPmn)
Reuters / B loombergISIN
GDR DataLast Price52 Week High52 Week Low
Company Profile
Ow nership StructureCredit Agrico le SA 60.0%M ansour & M aghrabi fo r Inv. & Dev. 20.0%Free Float 20.0%
Source: B loomberg / CICR
10.01 / 10.39
8.00
Buy/M oderate
1,148.00
2,296.00
No GDR availablen/a
20.00
EGS60041C018
n/a
*USD:EGP FX: 6.04
Crédit Agricole Indosuez-Egypt started operations in 2001when it acquired, along with El M ansour & El M aghraby forInvestment & Development (M M ID) 93.3% of CréditInternational d’Egypte (CIE), previously owned by CréditCommercial de France (CCF) and the National Bank ofEgypt (NBE).
In 2005, Crédit Agricole Indosuez-Egypt merged with CréditLyonnais (Egypt Branch), thus jo intly founding CALYONBank-Egypt, this came after France’s Crédit Agrico leacquired France’ s Crédit Lyonnais. In February 2006, CréditAgrico le Group along with M M ID acquired 74.6% ofEgyptian American Bank (EAB). Based on the decision of the EGM held on June 2006, themerge of the operations of EAB and CALYON Bank-Egyptunder the name of Crédit Agrico le Egypt (CAE) took placein September 2006.
CAE currently operates a network o f 72 branches and 121ATM s.
15.797.70
287.00
19.23
CIEB.CA / CIEB Ey Equity
380.13
0 / -20.7 / -45.8
-0.5 1.0 1.5 2.0 2.5 3.0 3.5
-
5.0
10.0
15.0
20.0
Jan-11 Mar-11 May-11 Jul-11 Sep-11 Nov-11
mn shrsCurr.Volume CIEBEGX 30 (rebased)
52 week Share Performance
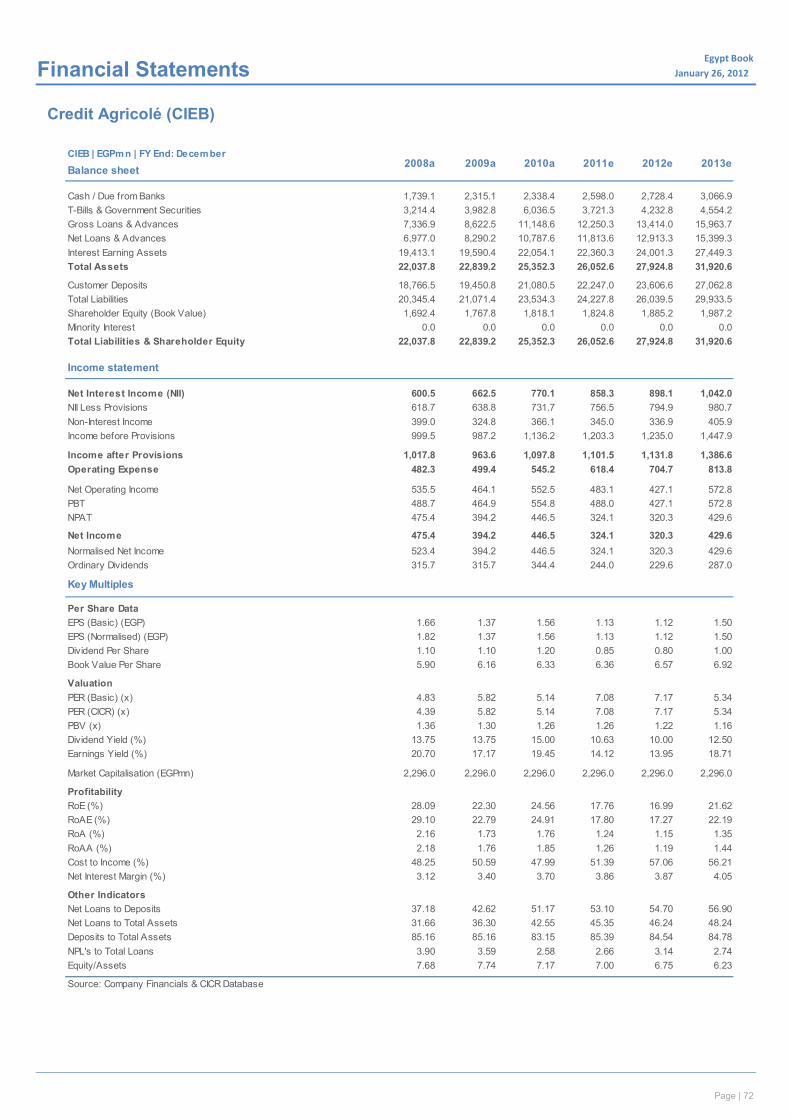
Page | 72
Egypt Book January 26, 2012x Financial Statements
Credit Agricolé (CIEB)
CIEB | EGPmn | FY End: December
Balance sheet
Cash / Due from Banks 1,739.1 2,315.1 2,338.4 2,598.0 2,728.4 3,066.9T-Bills & Government Securities 3,214.4 3,982.8 6,036.5 3,721.3 4,232.8 4,554.2Gross Loans & Advances 7,336.9 8,622.5 11,148.6 12,250.3 13,414.0 15,963.7Net Loans & Advances 6,977.0 8,290.2 10,787.6 11,813.6 12,913.3 15,399.3Interest Earning Assets 19,413.1 19,590.4 22,054.1 22,360.3 24,001.3 27,449.3Total Assets 22,037.8 22,839.2 25,352.3 26,052.6 27,924.8 31,920.6
Customer Deposits 18,766.5 19,450.8 21,080.5 22,247.0 23,606.6 27,062.8Total Liabilities 20,345.4 21,071.4 23,534.3 24,227.8 26,039.5 29,933.5Shareholder Equity (Book Value) 1,692.4 1,767.8 1,818.1 1,824.8 1,885.2 1,987.2Minority Interest 0.0 0.0 0.0 0.0 0.0 0.0Total Liabilities & Shareholder Equity 22,037.8 22,839.2 25,352.3 26,052.6 27,924.8 31,920.6
Income statement
Net Interest Income (NII) 600.5 662.5 770.1 858.3 898.1 1,042.0NII Less Provisions 618.7 638.8 731.7 756.5 794.9 980.7Non-Interest Income 399.0 324.8 366.1 345.0 336.9 405.9Income before Provisions 999.5 987.2 1,136.2 1,203.3 1,235.0 1,447.9
Income after Provisions 1,017.8 963.6 1,097.8 1,101.5 1,131.8 1,386.6Operating Expense 482.3 499.4 545.2 618.4 704.7 813.8
Net Operating Income 535.5 464.1 552.5 483.1 427.1 572.8PBT 488.7 464.9 554.8 488.0 427.1 572.8NPAT 475.4 394.2 446.5 324.1 320.3 429.6
Net Income 475.4 394.2 446.5 324.1 320.3 429.6Normalised Net Income 523.4 394.2 446.5 324.1 320.3 429.6Ordinary Dividends 315.7 315.7 344.4 244.0 229.6 287.0
Key Multiples
Per Share DataEPS (Basic) (EGP) 1.66 1.37 1.56 1.13 1.12 1.50EPS (Normalised) (EGP) 1.82 1.37 1.56 1.13 1.12 1.50Dividend Per Share 1.10 1.10 1.20 0.85 0.80 1.00Book Value Per Share 5.90 6.16 6.33 6.36 6.57 6.92
ValuationPER (Basic) (x) 4.83 5.82 5.14 7.08 7.17 5.34PER (CICR) (x) 4.39 5.82 5.14 7.08 7.17 5.34PBV (x) 1.36 1.30 1.26 1.26 1.22 1.16Dividend Yield (%) 13.75 13.75 15.00 10.63 10.00 12.50Earnings Yield (%) 20.70 17.17 19.45 14.12 13.95 18.71
Market Capitalisation (EGPmn) 2,296.0 2,296.0 2,296.0 2,296.0 2,296.0 2,296.0
ProfitabilityRoE (%) 28.09 22.30 24.56 17.76 16.99 21.62RoAE (%) 29.10 22.79 24.91 17.80 17.27 22.19RoA (%) 2.16 1.73 1.76 1.24 1.15 1.35RoAA (%) 2.18 1.76 1.85 1.26 1.19 1.44Cost to Income (%) 48.25 50.59 47.99 51.39 57.06 56.21Net Interest Margin (%) 3.12 3.40 3.70 3.86 3.87 4.05
Other IndicatorsNet Loans to Deposits 37.18 42.62 51.17 53.10 54.70 56.90Net Loans to Total Assets 31.66 36.30 42.55 45.35 46.24 48.24Deposits to Total Assets 85.16 85.16 83.15 85.39 84.54 84.78NPL's to Total Loans 3.90 3.59 2.58 2.66 3.14 2.74Equity/Assets 7.68 7.74 7.17 7.00 6.75 6.23
Source: Company Financials & CICR Database
2008a 2009a 2010a 2011e 2012e 2013e

Page | 73
Egypt Book 2011/12 | Banking
For more information on CICR, please visit our website at http://research.cicr.com.eg/register.php or contact us at [email protected]. Disclosures and details pertaining to stock ratings on last page.
January 26, 2012
Gains delayed amidst a foggy backdrop Growing in all lending segments.
Growth in housing income.
Controlling costs and asset quality.
As a player in two sectors, banking and real-estate, HDB’s growth plans have been delayed due to a foggy market backdrop. As a result, lending growth slowed vs. 2010, and is projected to remain sluggish in 2012, but should gain momentum throughout 5-year forecast period. Lower-than-average asset quality compared to leading coverage peers coupled with further expected weakening might hinder performance. In addition, the real-estate segment showed dampened deliveries. Despite expected slow balance sheet volumes, 2012 earnings should reveal some improvement supported by a number of expected real-estate deliveries. Similarly positive, at 24%, CAR remained well above the CBE requirement (10%).
2011 Review Loan growth slowed to 3% over the 9M11, while deposits remained broadly flat. NPLs ratio showed some weakening to 6.4%, higher than coverage peers (which averaged 2.9%). Meanwhile, Net Interest Income (NII) showed some resilience during the year, although the non-interest income caption was hurt by the weak market and lower real-estate income, and higher taxes further weighed on performance. Accordingly, cost/income ratio weakened YoY and is currently amongst the highest in our coverage.
2012 Preview NII is expected to show weak growth of 3% YoY in 2012, due to low expected volumes. However, while non-interest income is expected to finish 2011 with a slight 1.4% reduction, it should rebound in 2012 to grow by 25%, supported by the expected delivery of a large administrative building in Kattameya. NPLs levels might slightly weaken to 6.9%, so estimates for provisions charge have been increased. 2012 earnings are expected to slightly grow YoY on expected higher investment income and real-estate income.
Valuation & Recommendation LTFV stands at EGP18.88/share and TP at EGP15.63/share. Our recommendation is Hold with a Moderate Risk rating
Alia Abdoun [email protected]
+20 333-18-348
Hold TP - EGP 15.6 | 44.7% Upside
Housing & Development Bank
Stock Details As at: 21-Jan-12
CICR Rating/RiskTarget Price/LTFV (EGP)
Last Price (EGP)52 Week High52 Week Low6M Av. Daily Vo l. (000' shrs)% Chg: M oM / 6M / YoY
No. of Shares (mn)M kt. Cap (EGPmn)M kt. Cap (USDmn)*Free Float (%)Paid in Capital (EGPmn)
Reuters / B loombergISIN
GDR DataLast Price52 Week High52 Week Low
Company Profile
Ow nership StructureNew Urban Communities Authority 29.8%M isr Insurance 14.9%Egyptian fo r Endowment Authority 11.4%Housing Finance Fund 7.4%Employee Associated & Insurance 3.0%Free Float 33.5%
Source: Bloomberg / CICR
15.63 / 18.88
10.80
Hold/M oderate
1,150.00
1,242.00
No GDR availablen/a
33.50
EGS60301C016
n/a
*USD:EGP FX: 6.04
Housing & Development Bank [HDBK] was established asan Egyptian jo int-stock company operating under theinvestment law and registered as an investment andcommercial bank. HDBK was originally envisioned as aspecialized entity to finance real estate development, fundnational housing projects and provide investment trusteeservices. HDBK’s commercial banking operation includessyndications, structured lending, SM E lending and tradefinance whilst its retail business features personal loans,housing finance loans, mortgage loans, credit/debt cardsand other retail services. The bank also operates in realestate development, and is well-known for its solid trackrecord with pro jects along the North Coast, includingM arina, M arakia and M arabella. HDBK conducts most realestate ventures through its subsidiaries. HDBK has grownrapidly in recent years through expansion into retail activities (c.50% of its lending portfolio ), capitalizing on a network of58 branches and co llection offices and aims to expand itsnetwork to 100 branches over the next few years. HDBK’scurrent management team took over in 2003.
25.5010.50
115.00
42.32
HDBK.CA / HDBK Ey Equity
205.63
-10.6 / -32.5 / -56.6
-
2.0
4.0
6.0
8.0
10.0
-
5.0
10.0
15.0
20.0
25.0
30.0
Jan-11 Mar-11 May-11 Jul-11 Sep-11 Nov-11
mn shrsCurr.Volume HDBKEGX 30 (rebased)
52 week Share Performance
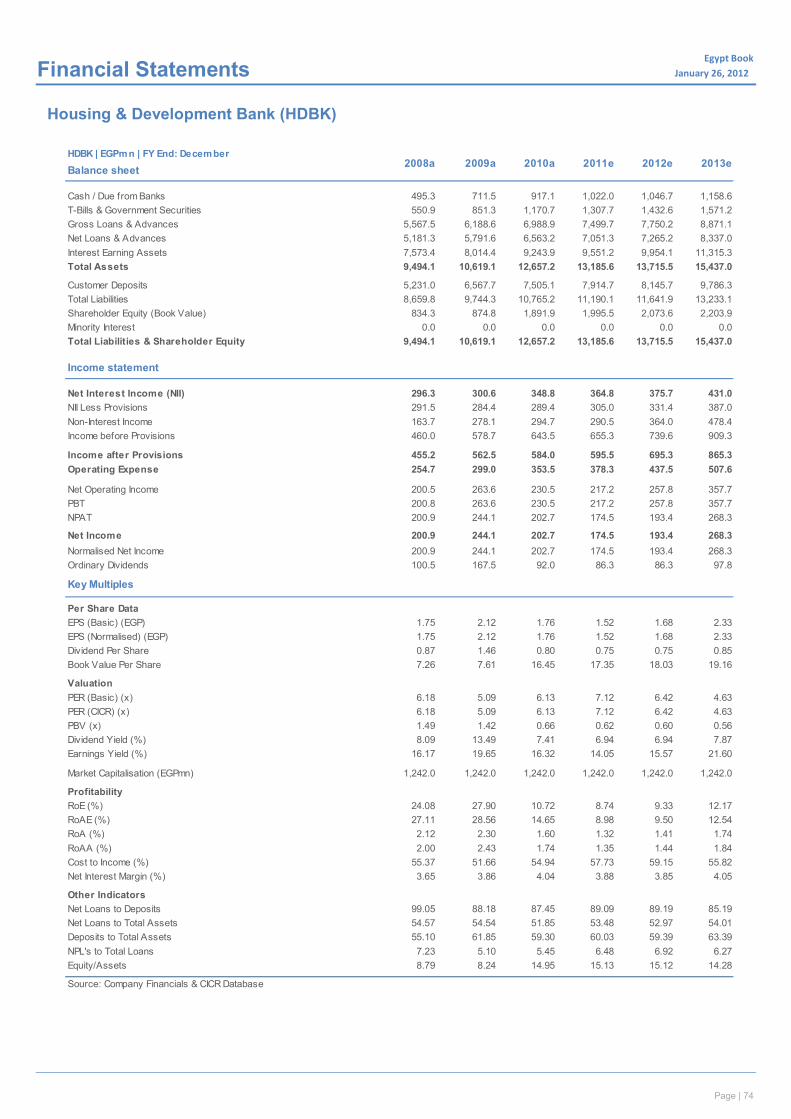
Page | 74
Egypt Book January 26, 2012x Financial Statements
Housing & Development Bank (HDBK)
HDBK | EGPmn | FY End: December
Balance sheet
Cash / Due from Banks 495.3 711.5 917.1 1,022.0 1,046.7 1,158.6T-Bills & Government Securities 550.9 851.3 1,170.7 1,307.7 1,432.6 1,571.2Gross Loans & Advances 5,567.5 6,188.6 6,988.9 7,499.7 7,750.2 8,871.1Net Loans & Advances 5,181.3 5,791.6 6,563.2 7,051.3 7,265.2 8,337.0Interest Earning Assets 7,573.4 8,014.4 9,243.9 9,551.2 9,954.1 11,315.3Total Assets 9,494.1 10,619.1 12,657.2 13,185.6 13,715.5 15,437.0
Customer Deposits 5,231.0 6,567.7 7,505.1 7,914.7 8,145.7 9,786.3Total Liabilities 8,659.8 9,744.3 10,765.2 11,190.1 11,641.9 13,233.1Shareholder Equity (Book Value) 834.3 874.8 1,891.9 1,995.5 2,073.6 2,203.9Minority Interest 0.0 0.0 0.0 0.0 0.0 0.0Total Liabilities & Shareholder Equity 9,494.1 10,619.1 12,657.2 13,185.6 13,715.5 15,437.0
Income statement
Net Interest Income (NII) 296.3 300.6 348.8 364.8 375.7 431.0NII Less Provisions 291.5 284.4 289.4 305.0 331.4 387.0Non-Interest Income 163.7 278.1 294.7 290.5 364.0 478.4Income before Provisions 460.0 578.7 643.5 655.3 739.6 909.3
Income after Provisions 455.2 562.5 584.0 595.5 695.3 865.3Operating Expense 254.7 299.0 353.5 378.3 437.5 507.6
Net Operating Income 200.5 263.6 230.5 217.2 257.8 357.7PBT 200.8 263.6 230.5 217.2 257.8 357.7NPAT 200.9 244.1 202.7 174.5 193.4 268.3
Net Income 200.9 244.1 202.7 174.5 193.4 268.3Normalised Net Income 200.9 244.1 202.7 174.5 193.4 268.3Ordinary Dividends 100.5 167.5 92.0 86.3 86.3 97.8
Key Multiples
Per Share DataEPS (Basic) (EGP) 1.75 2.12 1.76 1.52 1.68 2.33EPS (Normalised) (EGP) 1.75 2.12 1.76 1.52 1.68 2.33Dividend Per Share 0.87 1.46 0.80 0.75 0.75 0.85Book Value Per Share 7.26 7.61 16.45 17.35 18.03 19.16
ValuationPER (Basic) (x) 6.18 5.09 6.13 7.12 6.42 4.63PER (CICR) (x) 6.18 5.09 6.13 7.12 6.42 4.63PBV (x) 1.49 1.42 0.66 0.62 0.60 0.56Dividend Yield (%) 8.09 13.49 7.41 6.94 6.94 7.87Earnings Yield (%) 16.17 19.65 16.32 14.05 15.57 21.60
Market Capitalisation (EGPmn) 1,242.0 1,242.0 1,242.0 1,242.0 1,242.0 1,242.0
ProfitabilityRoE (%) 24.08 27.90 10.72 8.74 9.33 12.17RoAE (%) 27.11 28.56 14.65 8.98 9.50 12.54RoA (%) 2.12 2.30 1.60 1.32 1.41 1.74RoAA (%) 2.00 2.43 1.74 1.35 1.44 1.84Cost to Income (%) 55.37 51.66 54.94 57.73 59.15 55.82Net Interest Margin (%) 3.65 3.86 4.04 3.88 3.85 4.05
Other IndicatorsNet Loans to Deposits 99.05 88.18 87.45 89.09 89.19 85.19Net Loans to Total Assets 54.57 54.54 51.85 53.48 52.97 54.01Deposits to Total Assets 55.10 61.85 59.30 60.03 59.39 63.39NPL's to Total Loans 7.23 5.10 5.45 6.48 6.92 6.27Equity/Assets 8.79 8.24 14.95 15.13 15.12 14.28
Source: Company Financials & CICR Database
2008a 2009a 2010a 2011e 2012e 2013e
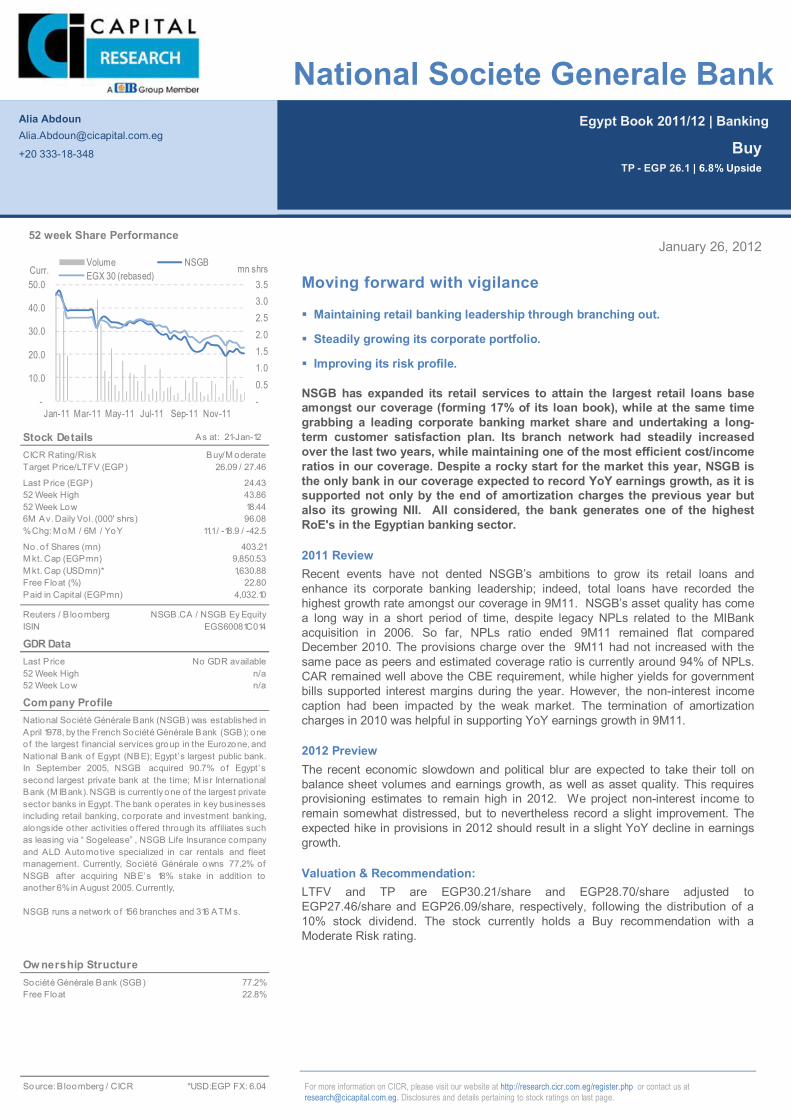
Page | 75
Egypt Book 2011/12 | Banking
For more information on CICR, please visit our website at http://research.cicr.com.eg/register.php or contact us at [email protected]. Disclosures and details pertaining to stock ratings on last page.
January 26, 2012
Moving forward with vigilance
Maintaining retail banking leadership through branching out.
Steadily growing its corporate portfolio.
Improving its risk profile.
NSGB has expanded its retail services to attain the largest retail loans base amongst our coverage (forming 17% of its loan book), while at the same time grabbing a leading corporate banking market share and undertaking a long-term customer satisfaction plan. Its branch network had steadily increased over the last two years, while maintaining one of the most efficient cost/income ratios in our coverage. Despite a rocky start for the market this year, NSGB is the only bank in our coverage expected to record YoY earnings growth, as it is supported not only by the end of amortization charges the previous year but also its growing NII. All considered, the bank generates one of the highest RoE's in the Egyptian banking sector.
2011 Review Recent events have not dented NSGB’s ambitions to grow its retail loans and enhance its corporate banking leadership; indeed, total loans have recorded the highest growth rate amongst our coverage in 9M11. NSGB’s asset quality has come a long way in a short period of time, despite legacy NPLs related to the MIBank acquisition in 2006. So far, NPLs ratio ended 9M11 remained flat compared December 2010. The provisions charge over the 9M11 had not increased with the same pace as peers and estimated coverage ratio is currently around 94% of NPLs. CAR remained well above the CBE requirement, while higher yields for government bills supported interest margins during the year. However, the non-interest income caption had been impacted by the weak market. The termination of amortization charges in 2010 was helpful in supporting YoY earnings growth in 9M11.
2012 Preview The recent economic slowdown and political blur are expected to take their toll on balance sheet volumes and earnings growth, as well as asset quality. This requires provisioning estimates to remain high in 2012. We project non-interest income to remain somewhat distressed, but to nevertheless record a slight improvement. The expected hike in provisions in 2012 should result in a slight YoY decline in earnings growth.
Valuation & Recommendation: LTFV and TP are EGP30.21/share and EGP28.70/share adjusted to EGP27.46/share and EGP26.09/share, respectively, following the distribution of a 10% stock dividend. The stock currently holds a Buy recommendation with a Moderate Risk rating.
Alia Abdoun [email protected]
+20 333-18-348
Buy TP - EGP 26.1 | 6.8% Upside
National Societe Generale Bank
Stock Details As at: 21-Jan-12
CICR Rating/RiskTarget Price/LTFV (EGP)
Last Price (EGP)52 Week High52 Week Low6M Av. Daily Vol. (000' shrs)% Chg: M oM / 6M / YoY
No. o f Shares (mn)M kt. Cap (EGPmn)M kt. Cap (USDmn)*Free Float (%)Paid in Capital (EGPmn)
Reuters / B loombergISIN
GDR DataLast Price52 Week High52 Week Low
Company Profile
Ow nership StructureSociété Générale Bank (SGB) 77.2%Free Float 22.8%
Source: B loomberg / CICR
26.09 / 27.46
24.43
Buy/M oderate
4,032.10
9,850.53
No GDR availablen/a
22.80
EGS60081C014
n/a
*USD:EGP FX: 6.04
National Société Générale Bank (NSGB) was established inApril 1978, by the French Société Générale Bank (SGB); oneof the largest financial services group in the Eurozone, andNational Bank of Egypt (NBE); Egypt’s largest public bank.In September 2005, NSGB acquired 90.7% of Egypt’ssecond largest private bank at the time; M isr InternationalBank (M IBank). NSGB is currently one of the largest private sector banks in Egypt. The bank operates in key businessesincluding retail banking, corporate and investment banking,alongside other activit ies o ffered through its affiliates suchas leasing via “ Sogelease” , NSGB Life Insurance companyand ALD Automotive specialized in car rentals and fleetmanagement. Currently, Société Générale owns 77.2% ofNSGB after acquiring NBE’s 18% stake in addition toanother 6% in August 2005. Currently,
NSGB runs a network o f 156 branches and 316 ATM s.
43.8618.44
403.21
96.08
NSGB.CA / NSGB Ey Equity
1,630.88
11.1 / -18.9 / -42.5
-0.5 1.0 1.5 2.0 2.5 3.0 3.5
-
10.0
20.0
30.0
40.0
50.0
Jan-11 Mar-11 May-11 Jul-11 Sep-11 Nov-11
mn shrsCurr.Volume NSGBEGX 30 (rebased)
52 week Share Performance

Page | 76
Egypt Book January 26, 2012x Financial Statements
National Societe Generale Bank (NSGB)
NSGB | EGPmn | FY End: December
Balance sheet
Cash / Due from Banks 3,229.0 4,072.9 5,154.3 5,319.7 5,477.1 6,071.2T-Bills & Government Securities 2,976.4 9,095.9 12,348.7 13,000.5 13,680.6 14,463.4Gross Loans & Advances 27,109.1 27,993.2 32,499.5 36,464.8 39,485.0 45,725.7Net Loans & Advances 25,011.2 26,569.1 31,345.3 35,218.7 38,121.8 44,255.1Interest Earning Assets 40,670.2 47,120.8 53,940.2 57,876.1 61,792.6 69,759.2Total Assets 46,046.8 53,219.6 60,884.9 65,241.1 69,585.6 78,471.4
Customer Deposits 36,889.2 43,715.5 50,083.6 53,568.8 56,945.2 64,563.8Total Liabilities 41,733.8 47,963.8 54,830.4 57,903.1 61,495.8 69,461.7Shareholder Equity (Book Value) 4,313.0 5,255.8 6,054.5 7,338.0 8,089.8 9,009.7Minority Interest 0.0 0.0 0.0 0.0 0.0 0.0Total Liabilities & Shareholder Equity 46,046.8 53,219.6 60,884.9 65,241.1 69,585.6 78,471.4
Income statement
Net Interest Income (NII) 1,424.0 1,651.6 1,896.1 2,111.2 2,311.7 2,646.8NII Less Provisions 1,210.6 1,932.6 1,967.4 1,970.9 2,123.4 2,564.6Non-Interest Income 823.4 801.0 906.6 863.2 895.6 1,055.2Income before Provisions 2,247.4 2,452.6 2,802.7 2,974.4 3,207.3 3,702.0
Income after Provisions 2,034.0 2,733.6 2,874.0 2,834.1 3,019.0 3,619.8Operating Expense 1,085.0 1,207.8 1,283.2 1,062.2 1,214.0 1,395.3
Net Operating Income 949.0 1,525.8 1,590.9 1,771.9 1,805.1 2,224.5PBT 1,297.0 1,525.8 1,590.9 1,771.9 1,805.1 2,224.5NPAT 1,136.9 1,293.2 1,337.8 1,411.2 1,353.8 1,668.4
Net Income 1,136.9 1,293.2 1,337.8 1,411.2 1,353.8 1,668.4Normalised Net Income 789.3 1,293.2 1,337.8 1,411.2 1,353.8 1,668.4Ordinary Dividends 378.7 416.5 458.2 483.9 491.9 612.9
Key Multiples
Per Share DataEPS (Basic) (EGP) 2.82 3.21 3.32 3.50 3.36 4.14EPS (Normalised) (EGP) 1.96 3.21 3.32 3.50 3.36 4.14Dividend Per Share 0.94 1.03 1.14 1.20 1.22 1.52Book Value Per Share 10.70 13.03 15.02 18.20 20.06 22.34
ValuationPER (Basic) (x) 8.66 7.62 7.36 6.98 7.28 5.90PER (CICR) (x) 12.48 7.62 7.36 6.98 7.28 5.90PBV (x) 2.28 1.87 1.63 1.34 1.22 1.09Dividend Yield (%) 3.84 4.23 4.65 4.91 4.99 6.22Earnings Yield (%) 11.54 13.13 13.58 14.33 13.74 16.94
Market Capitalisation (EGPmn) 9,850.5 9,850.5 9,850.5 9,850.5 9,850.5 9,850.5
ProfitabilityRoE (%) 26.36 24.60 22.10 19.23 16.73 18.52RoAE (%) 28.47 27.03 23.66 21.08 17.55 19.51RoA (%) 2.47 2.43 2.20 2.16 1.95 2.13RoAA (%) 2.43 2.61 2.34 2.24 2.01 2.25Cost to Income (%) 48.28 49.25 45.78 35.71 37.85 37.69Net Interest Margin (%) 3.47 3.76 3.75 3.78 3.86 4.02
Other IndicatorsNet Loans to Deposits 67.80 60.78 62.59 65.74 66.94 68.54Net Loans to Total Assets 54.32 49.92 51.48 53.98 54.78 56.40Deposits to Total Assets 80.11 82.14 82.26 82.11 81.83 82.28NPL's to Total Loans 7.00 4.77 3.42 3.49 3.97 3.51Equity/Assets 9.37 9.88 9.94 11.25 11.63 11.48
Source: Company Financials & CICR Database
2008a 2009a 2010a 2011e 2012e 2013e
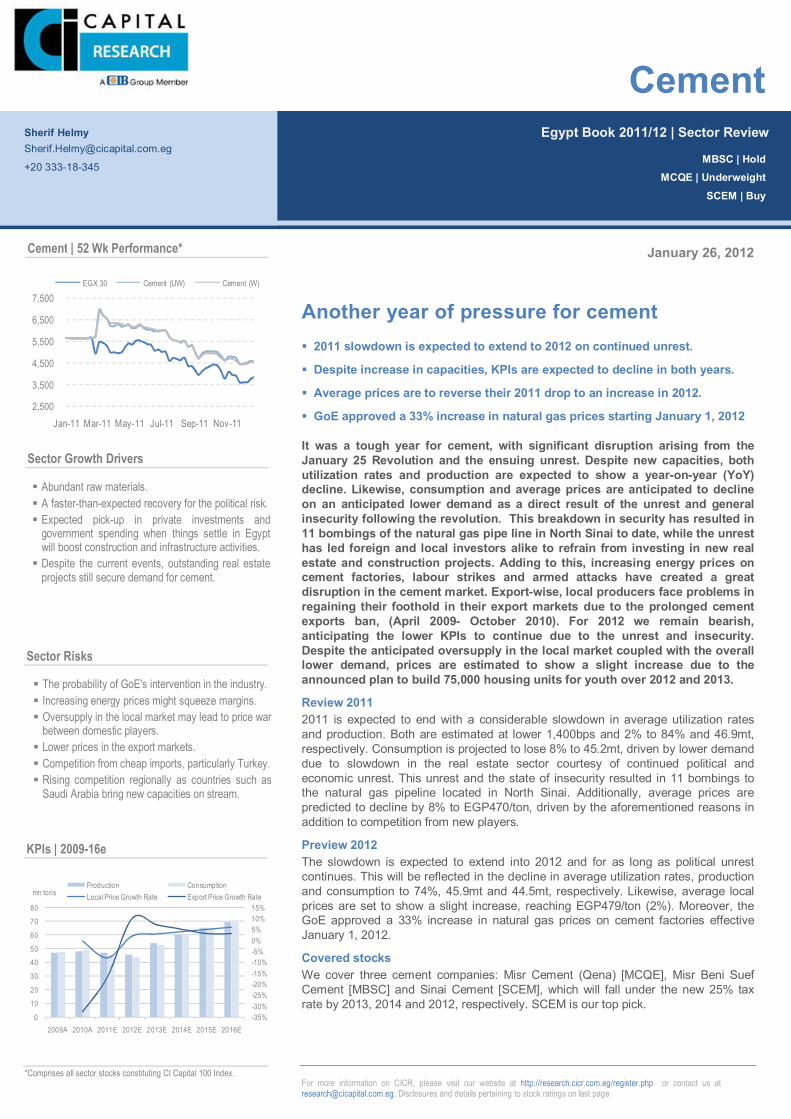
Page | 77
Page | 77
For more information on CICR, please visit our website at http://research.cicr.com.eg/register.php or contact us at [email protected]. Disclosures and details pertaining to stock ratings on last page.
January 26, 2012
Another year of pressure for cement 2011 slowdown is expected to extend to 2012 on continued unrest.
Despite increase in capacities, KPIs are expected to decline in both years.
Average prices are to reverse their 2011 drop to an increase in 2012.
GoE approved a 33% increase in natural gas prices starting January 1, 2012
It was a tough year for cement, with significant disruption arising from the January 25 Revolution and the ensuing unrest. Despite new capacities, both utilization rates and production are expected to show a year-on-year (YoY) decline. Likewise, consumption and average prices are anticipated to decline on an anticipated lower demand as a direct result of the unrest and general insecurity following the revolution. This breakdown in security has resulted in 11 bombings of the natural gas pipe line in North Sinai to date, while the unrest has led foreign and local investors alike to refrain from investing in new real estate and construction projects. Adding to this, increasing energy prices on cement factories, labour strikes and armed attacks have created a great disruption in the cement market. Export-wise, local producers face problems in regaining their foothold in their export markets due to the prolonged cement exports ban, (April 2009- October 2010). For 2012 we remain bearish, anticipating the lower KPIs to continue due to the unrest and insecurity. Despite the anticipated oversupply in the local market coupled with the overall lower demand, prices are estimated to show a slight increase due to the announced plan to build 75,000 housing units for youth over 2012 and 2013.
Review 2011 2011 is expected to end with a considerable slowdown in average utilization rates and production. Both are estimated at lower 1,400bps and 2% to 84% and 46.9mt, respectively. Consumption is projected to lose 8% to 45.2mt, driven by lower demand due to slowdown in the real estate sector courtesy of continued political and economic unrest. This unrest and the state of insecurity resulted in 11 bombings to the natural gas pipeline located in North Sinai. Additionally, average prices are predicted to decline by 8% to EGP470/ton, driven by the aforementioned reasons in addition to competition from new players.
Preview 2012 The slowdown is expected to extend into 2012 and for as long as political unrest continues. This will be reflected in the decline in average utilization rates, production and consumption to 74%, 45.9mt and 44.5mt, respectively. Likewise, average local prices are set to show a slight increase, reaching EGP479/ton (2%). Moreover, the GoE approved a 33% increase in natural gas prices on cement factories effective January 1, 2012.
Covered stocks We cover three cement companies: Misr Cement (Qena) [MCQE], Misr Beni Suef Cement [MBSC] and Sinai Cement [SCEM], which will fall under the new 25% tax rate by 2013, 2014 and 2012, respectively. SCEM is our top pick.
Egypt Book 2011/12 | Sector Review
Cement
MBSC | Hold MCQE | Underweight
SCEM | Buy
Sherif Helmy [email protected]
+20 333-18-345
Abundant raw materials. A faster-than-expected recovery for the political risk. Expected pick-up in private investments and
government spending when things settle in Egypt will boost construction and infrastructure activities. Despite the current events, outstanding real estate
projects still secure demand for cement.
The probability of GoE's intervention in the industry. Increasing energy prices might squeeze margins. Oversupply in the local market may lead to price war
between domestic players. Lower prices in the export markets. Competition from cheap imports, particularly Turkey. Rising competition regionally as countries such as
Saudi Arabia bring new capacities on stream.
Cement | 52 Wk Performance*
2,500
3,500
4,500
5,500
6,500
7,500
Jan-11 Mar-11 May-11 Jul-11 Sep-11 Nov-11
EGX 30 Cement (UW) Cement (W)
Sector Growth Drivers
Sector Risks
-35%-30%-25%-20%-15%-10%-5%0%5%10%15%
0
10
20
30
4050
60
70
80
2009A 2010A 2011E 2012E 2013E 2014E 2015E 2016E
Production ConsumptionLocal Price Growth Rate Export Price Growth Ratemn tons
KPIs | 2009-16e
*Comprises all sector stocks constituting CI Capital 100 Index.
Page | 78
Egypt Book 2011/12
January 26, 2012
Cement
Xxx
Review 2011 Despite the initial rush to take advantage of unrest and the lawlessness by building
on agricultural land and slums without government approvals, the construction and
real-estate sectors were amongst the hardest hit by the political upheaval in Egypt.
Indeed, it appears most consumers prefer to keep their assets liquid rather than
investing in or building new homes. As for real-estate developers, while many are
rushing to finish existing projects, few show any intention of investing in any new
projects in the near future, particularly since some of them are facing lawsuits over
land sales.
Key Recent Developments El-Sewedy Cement begins cement production
El-Sewedy Cement began cement production in March 2011 in Suez governorate,
and captured a market share of c.2% of local cement sales over the same month,
with 0.83mt sold. El-Sewedy Cement was one of the seven Greenfield licenses'
winners offered in October 2007, with a total capacity of 1.5mt, paying EGP201mn for
the license.
MBSC’s second grinder starts operations
MBSC’s second grinder started operations in January 2011, raising company’s
capacity to 3mtpa from 1.5mtpa.
IDA postpones launching 12 new cement licenses
After the uprising, the IDA announced that it will postpone the issuing of 12 new
cement licenses from the current year until further notice. The postponement reflects
the fact that most investors, be they local or foreign, will likely be less willing to invest
large amounts of money until things stabilize in the country.
Judiciary halts IDA decision over North Sinai Cement
On May 10, 2011, the Judiciary halted the IDA’s decision to withdraw the license
acquired by North Sinai Cement, after the company presented proof that it had made
agreements with a Chinese bank for financing and a Chinese company to supply it
with the machinery and equipment needed for its new factory.
GoE approved natural gas increase
In late December 2011, the Government of Egypt (GoE) approved increasing energy
prices for energy-intensive industries, including cement, aluminium, glass and
ceramics. By virtue of this decision, natural gas prices will increase to USD4/MMbtu
from the current USD3/MMbtu. Meanwhile, cement companies using mazut in their
production will not be affected by this increase, as mazut already trades according to
international prices.
Page | 79
Egypt Book 2011/12
January 26, 2012
Cement
Xxx
Natural gas pipeline in North Sinai bombed
The natural gas pipeline in North Sinai governorate, which delivers natural gas to
Jordan and Israel was bombed – the 11th time since April 2011. This reflects the
insecurity in North Sinai governorate and represents a risk to all factories that use
natural gas as a fuel, forcing them to use the more expensive mazut in their
production.
Supply Capacities are estimated to add approx. 6.4mtpa in 2011 (+13% over 2010),
compared with a 7% YoY growth in 2010 over 2009. This increase is stimulated by
the added capacities for Misr Beni Suef, Arabian, Wadi El Nil, El Sewedy and El
Arish. Production is predicted to slow down by 2% to 46.9mt in 2011 versus the 0.2%
YoY increase in 2010. This decline is mainly attributable to the lower demand during
2011 as a result of political and economic unrest. Utilization rates are expected to
average at 84% in 2011, as opposed to 98% in 2010.
Cement exports were hard hit in 2010, selling a mere 0.05mn tons as a result of the
cement export banning imposed by GoE, which extended from April 2009 and lifted in
October 2010. This ban saw cement companies lose their export markets. However,
exports are expected to rebound in 2011 to reflect the effect of the ban's removal.
Exports are estimated to reach 0.9mt in 2011.
Demand Consumption in 2011 is estimated to decline 8%, scoring 45.2mt, compared with a
growth of 3% in 2010 (48.9mt). This drop in consumption came on the back of lower
demand for real estate and construction activities. Imports meanwhile are expected
to increase by 14% during 2011 to 0.7mt due to cheaper imported cement, especially
from Turkey. The market is set to reverse its deficit recorded in 2010 (0.9mt). In
2011, we expect a surplus of 1.8mt resulted from the estimated lower demand
coupled with new added capacities.
Prices Local cement average ex-factory prices – announced by the Ministry of Trade &
Industry (MoTI) – are estimated to ease down by 8% in 2011 to EGP470/ton,
compared with an average price of EGP510/ton in 2010. This estimated drop in
prices is a direct result of the lower demand as well as the competition from the
cheaply imported cement i.e. USD60/ton (EGP360/ton). Exports prices are estimated
to register an average of USD45/ton in 2011 (vs. average of USD54/ton in 2010) in
order to compete and regain market shares in the export markets.
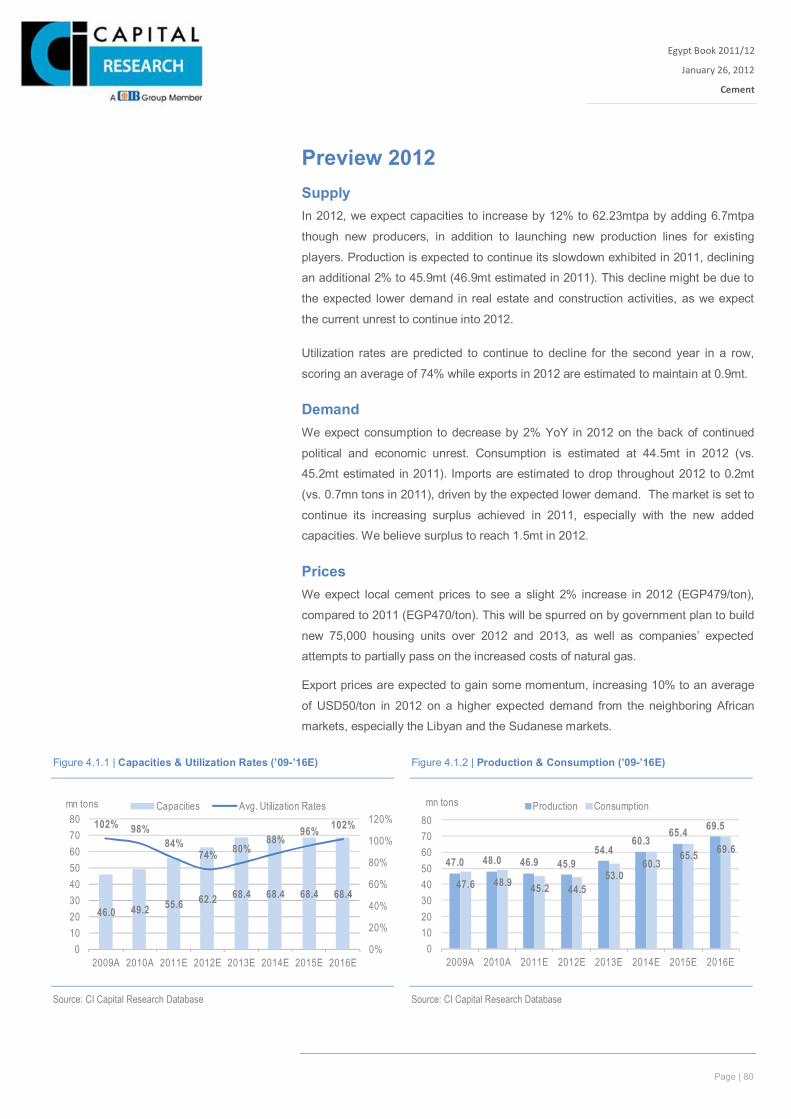
Page | 80
Egypt Book 2011/12
January 26, 2012
Cement
Xxx
Preview 2012 Supply In 2012, we expect capacities to increase by 12% to 62.23mtpa by adding 6.7mtpa
though new producers, in addition to launching new production lines for existing
players. Production is expected to continue its slowdown exhibited in 2011, declining
an additional 2% to 45.9mt (46.9mt estimated in 2011). This decline might be due to
the expected lower demand in real estate and construction activities, as we expect
the current unrest to continue into 2012.
Utilization rates are predicted to continue to decline for the second year in a row,
scoring an average of 74% while exports in 2012 are estimated to maintain at 0.9mt.
Demand We expect consumption to decrease by 2% YoY in 2012 on the back of continued
political and economic unrest. Consumption is estimated at 44.5mt in 2012 (vs.
45.2mt estimated in 2011). Imports are estimated to drop throughout 2012 to 0.2mt
(vs. 0.7mn tons in 2011), driven by the expected lower demand. The market is set to
continue its increasing surplus achieved in 2011, especially with the new added
capacities. We believe surplus to reach 1.5mt in 2012.
Prices We expect local cement prices to see a slight 2% increase in 2012 (EGP479/ton),
compared to 2011 (EGP470/ton). This will be spurred on by government plan to build
new 75,000 housing units over 2012 and 2013, as well as companies’ expected
attempts to partially pass on the increased costs of natural gas.
Export prices are expected to gain some momentum, increasing 10% to an average
of USD50/ton in 2012 on a higher expected demand from the neighboring African
markets, especially the Libyan and the Sudanese markets.
Figure 4.1.1 | Capacities & Utilization Rates (’09-’16E) Figure 4.1.2 | Production & Consumption (’09-’16E)
46.0 49.2 55.6 62.2 68.4 68.4 68.4 68.4
102% 98%84%
74% 80%88%
96% 102%
0%
20%
40%
60%
80%
100%
120%
01020304050607080
2009A 2010A 2011E 2012E 2013E 2014E 2015E 2016E
Capacities Avg. Utilization Ratesmn tons
47.0 48.0 46.9 45.954.4
60.365.4 69.5
47.6 48.9 45.2 44.553.0
60.365.5 69.6
01020304050607080
2009A 2010A 2011E 2012E 2013E 2014E 2015E 2016E
Production Consumptionmn tons
Source: CI Capital Research Database
Source: CI Capital Research Database
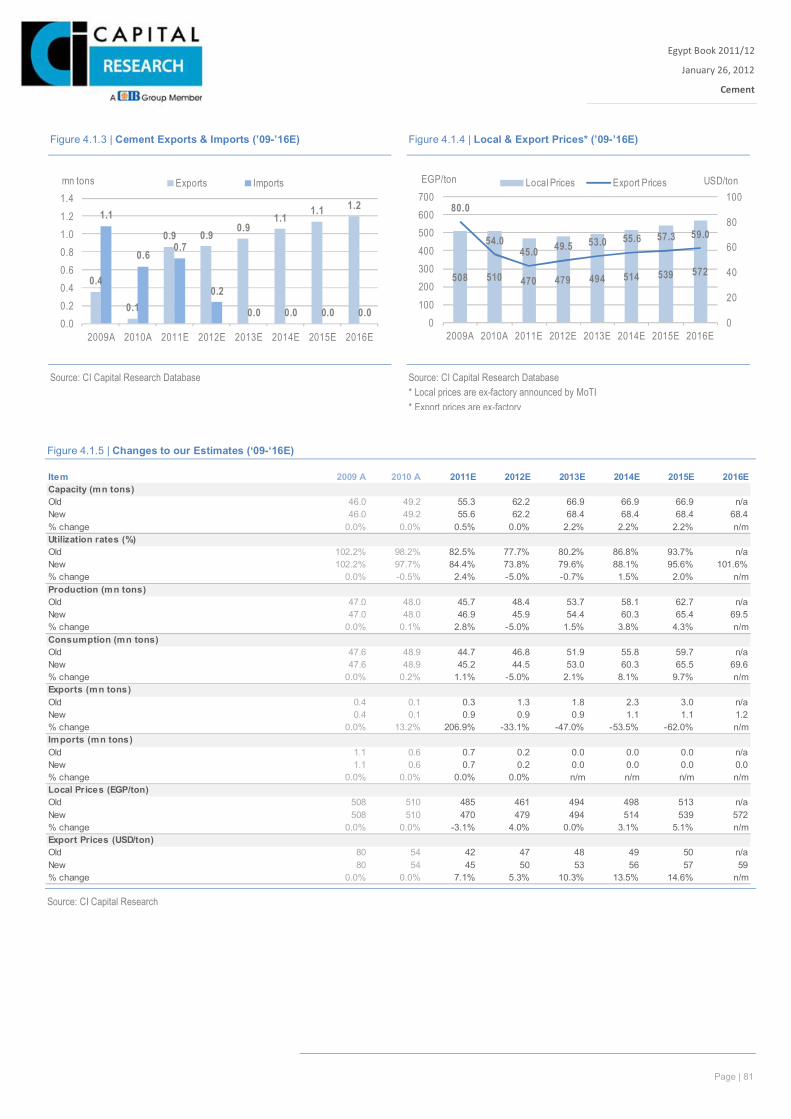
Page | 81
Egypt Book 2011/12
January 26, 2012
Cement
Xxx
Figure 4.1.5 | Changes to our Estimates (‘09-‘16E)
Source: CI Capital Research
Figure 4.1.3 | Cement Exports & Imports (’09-’16E) Figure 4.1.4 | Local & Export Prices* (’09-’16E)
Source: CI Capital Research Database
Source: CI Capital Research Database * Local prices are ex-factory announced by MoTI * Export prices are ex-factory
0.4
0.1
0.9 0.9 0.91.1 1.1 1.2
1.1
0.60.7
0.2
0.0 0.0 0.0 0.00.00.20.40.60.81.01.21.4
2009A 2010A 2011E 2012E 2013E 2014E 2015E 2016E
Exports Importsmn tons
508 510 470 479 494 514 539 572
80.0
54.045.0 49.5 53.0 55.6 57.3 59.0
0
20
40
60
80
100
0100200300400500600700
2009A 2010A 2011E 2012E 2013E 2014E 2015E 2016E
Local Prices Export Prices USD/tonEGP/ton
Item 2009 A 2010 A 2011E 2012E 2013E 2014E 2015E 2016ECapacity (mn tons)Old 46.0 49.2 55.3 62.2 66.9 66.9 66.9 n/aNew 46.0 49.2 55.6 62.2 68.4 68.4 68.4 68.4% change 0.0% 0.0% 0.5% 0.0% 2.2% 2.2% 2.2% n/mUtilization rates (%)Old 102.2% 98.2% 82.5% 77.7% 80.2% 86.8% 93.7% n/aNew 102.2% 97.7% 84.4% 73.8% 79.6% 88.1% 95.6% 101.6%% change 0.0% -0.5% 2.4% -5.0% -0.7% 1.5% 2.0% n/mProduction (mn tons)Old 47.0 48.0 45.7 48.4 53.7 58.1 62.7 n/aNew 47.0 48.0 46.9 45.9 54.4 60.3 65.4 69.5% change 0.0% 0.1% 2.8% -5.0% 1.5% 3.8% 4.3% n/mConsumption (mn tons)Old 47.6 48.9 44.7 46.8 51.9 55.8 59.7 n/aNew 47.6 48.9 45.2 44.5 53.0 60.3 65.5 69.6% change 0.0% 0.2% 1.1% -5.0% 2.1% 8.1% 9.7% n/mExports (mn tons)Old 0.4 0.1 0.3 1.3 1.8 2.3 3.0 n/aNew 0.4 0.1 0.9 0.9 0.9 1.1 1.1 1.2% change 0.0% 13.2% 206.9% -33.1% -47.0% -53.5% -62.0% n/mImports (mn tons)Old 1.1 0.6 0.7 0.2 0.0 0.0 0.0 n/aNew 1.1 0.6 0.7 0.2 0.0 0.0 0.0 0.0% change 0.0% 0.0% 0.0% 0.0% n/m n/m n/m n/mLocal Prices (EGP/ton)Old 508 510 485 461 494 498 513 n/aNew 508 510 470 479 494 514 539 572% change 0.0% 0.0% -3.1% 4.0% 0.0% 3.1% 5.1% n/mExport Prices (USD/ton)Old 80 54 42 47 48 49 50 n/aNew 80 54 45 50 53 56 57 59% change 0.0% 0.0% 7.1% 5.3% 10.3% 13.5% 14.6% n/m
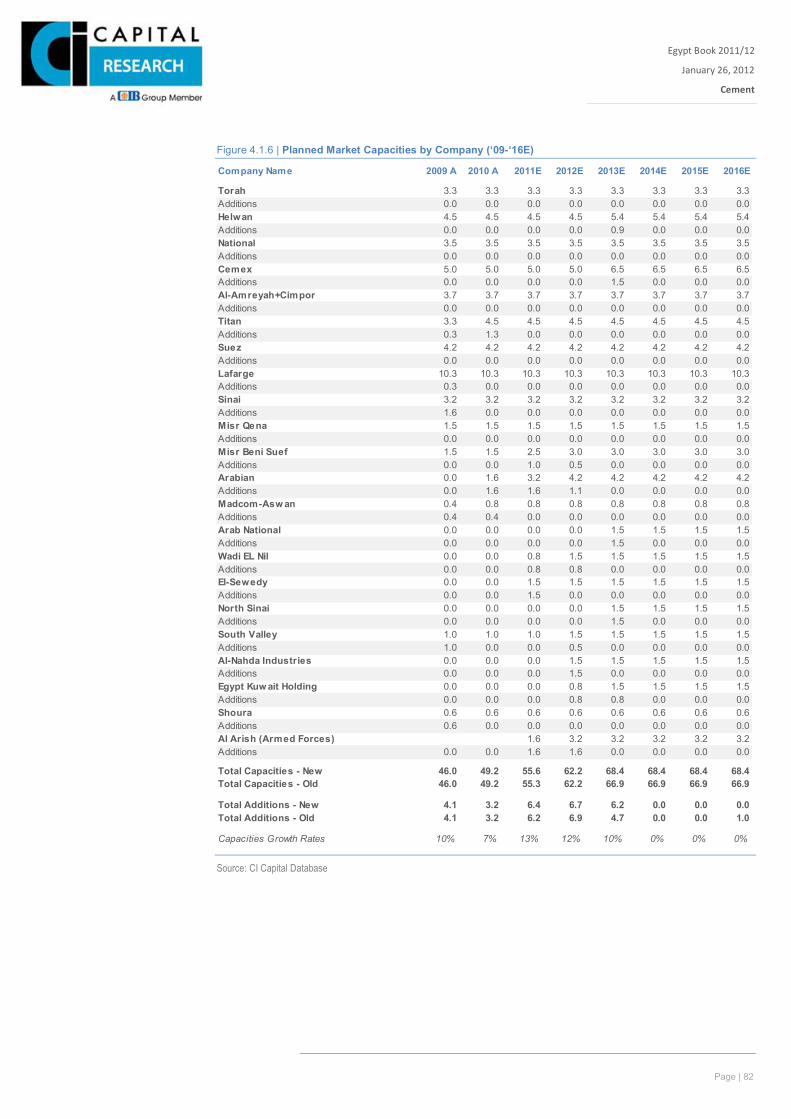
Page | 82
Egypt Book 2011/12
January 26, 2012
Cement
Xxx
Figure 4.1.6 | Planned Market Capacities by Company (‘09-‘16E)
Source: CI Capital Database
Company Name 2009 A 2010 A 2011E 2012E 2013E 2014E 2015E 2016E
Torah 3.3 3.3 3.3 3.3 3.3 3.3 3.3 3.3Additions 0.0 0.0 0.0 0.0 0.0 0.0 0.0 0.0Helwan 4.5 4.5 4.5 4.5 5.4 5.4 5.4 5.4Additions 0.0 0.0 0.0 0.0 0.9 0.0 0.0 0.0National 3.5 3.5 3.5 3.5 3.5 3.5 3.5 3.5Additions 0.0 0.0 0.0 0.0 0.0 0.0 0.0 0.0Cemex 5.0 5.0 5.0 5.0 6.5 6.5 6.5 6.5Additions 0.0 0.0 0.0 0.0 1.5 0.0 0.0 0.0Al-Amreyah+Cimpor 3.7 3.7 3.7 3.7 3.7 3.7 3.7 3.7Additions 0.0 0.0 0.0 0.0 0.0 0.0 0.0 0.0Titan 3.3 4.5 4.5 4.5 4.5 4.5 4.5 4.5Additions 0.3 1.3 0.0 0.0 0.0 0.0 0.0 0.0Suez 4.2 4.2 4.2 4.2 4.2 4.2 4.2 4.2Additions 0.0 0.0 0.0 0.0 0.0 0.0 0.0 0.0Lafarge 10.3 10.3 10.3 10.3 10.3 10.3 10.3 10.3Additions 0.3 0.0 0.0 0.0 0.0 0.0 0.0 0.0Sinai 3.2 3.2 3.2 3.2 3.2 3.2 3.2 3.2Additions 1.6 0.0 0.0 0.0 0.0 0.0 0.0 0.0Misr Qena 1.5 1.5 1.5 1.5 1.5 1.5 1.5 1.5Additions 0.0 0.0 0.0 0.0 0.0 0.0 0.0 0.0Misr Beni Suef 1.5 1.5 2.5 3.0 3.0 3.0 3.0 3.0Additions 0.0 0.0 1.0 0.5 0.0 0.0 0.0 0.0Arabian 0.0 1.6 3.2 4.2 4.2 4.2 4.2 4.2Additions 0.0 1.6 1.6 1.1 0.0 0.0 0.0 0.0Madcom-Asw an 0.4 0.8 0.8 0.8 0.8 0.8 0.8 0.8Additions 0.4 0.4 0.0 0.0 0.0 0.0 0.0 0.0Arab National 0.0 0.0 0.0 0.0 1.5 1.5 1.5 1.5Additions 0.0 0.0 0.0 0.0 1.5 0.0 0.0 0.0Wadi EL Nil 0.0 0.0 0.8 1.5 1.5 1.5 1.5 1.5Additions 0.0 0.0 0.8 0.8 0.0 0.0 0.0 0.0El-Sewedy 0.0 0.0 1.5 1.5 1.5 1.5 1.5 1.5Additions 0.0 0.0 1.5 0.0 0.0 0.0 0.0 0.0North Sinai 0.0 0.0 0.0 0.0 1.5 1.5 1.5 1.5Additions 0.0 0.0 0.0 0.0 1.5 0.0 0.0 0.0South Valley 1.0 1.0 1.0 1.5 1.5 1.5 1.5 1.5Additions 1.0 0.0 0.0 0.5 0.0 0.0 0.0 0.0Al-Nahda Industries 0.0 0.0 0.0 1.5 1.5 1.5 1.5 1.5Additions 0.0 0.0 0.0 1.5 0.0 0.0 0.0 0.0Egypt Kuw ait Holding 0.0 0.0 0.0 0.8 1.5 1.5 1.5 1.5Additions 0.0 0.0 0.0 0.8 0.8 0.0 0.0 0.0Shoura 0.6 0.6 0.6 0.6 0.6 0.6 0.6 0.6Additions 0.6 0.0 0.0 0.0 0.0 0.0 0.0 0.0Al Arish (Armed Forces) 1.6 3.2 3.2 3.2 3.2 3.2Additions 0.0 0.0 1.6 1.6 0.0 0.0 0.0 0.0
Total Capacities - New 46.0 49.2 55.6 62.2 68.4 68.4 68.4 68.4Total Capacities - Old 46.0 49.2 55.3 62.2 66.9 66.9 66.9 66.9
Total Additions - New 4.1 3.2 6.4 6.7 6.2 0.0 0.0 0.0Total Additions - Old 4.1 3.2 6.2 6.9 4.7 0.0 0.0 1.0
Capacities Growth Rates 10% 7% 13% 12% 10% 0% 0% 0%
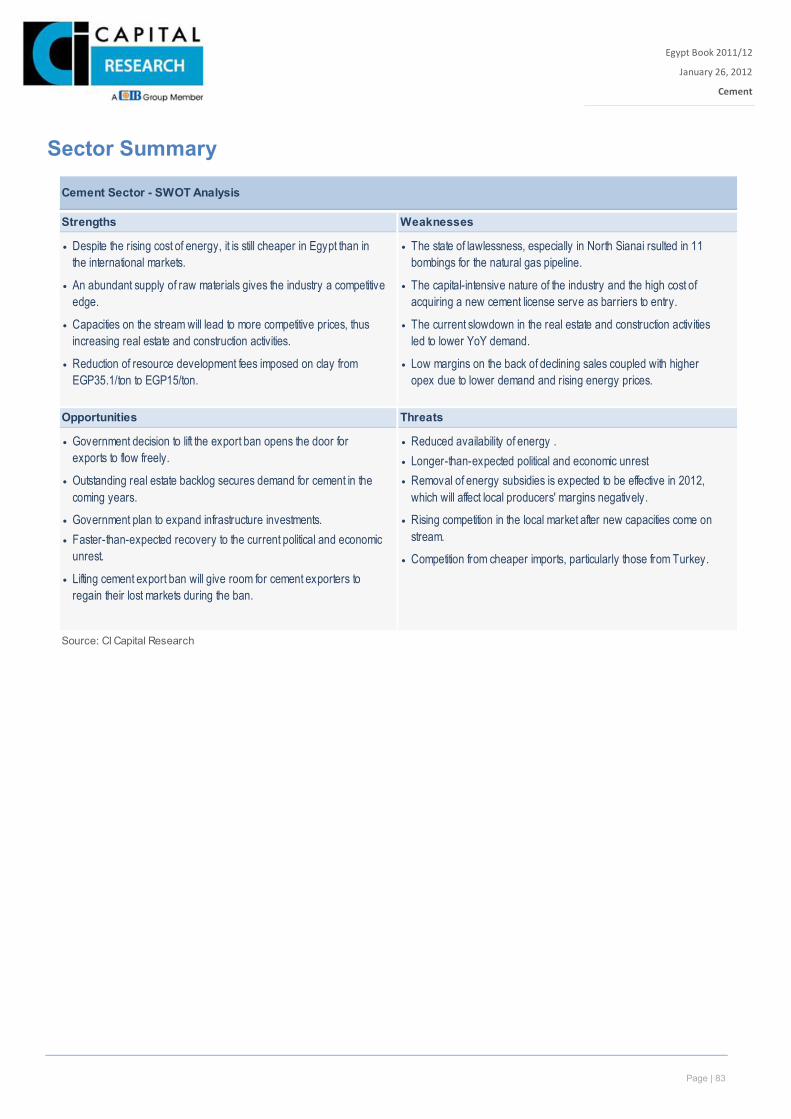
Page | 83
Egypt Book 2011/12
January 26, 2012
Cement
Xxx
Sector Summary
Cement Sector - SWOT Analysis
Strengths Weaknesses
• •
• •
• •
• •
Opportunities Threats
• • Reduced availability of energy .• Longer-than-expected political and economic unrest
• •
• Government plan to expand infrastructure investments. ••
••
Source: CI Capital Research
Competition from cheaper imports, particularly those from Turkey.
Reduction of resource development fees imposed on clay from EGP35.1/ton to EGP15/ton.
The state of lawlessness, especially in North Sianai rsulted in 11 bombings for the natural gas pipeline.
The capital-intensive nature of the industry and the high cost of acquiring a new cement license serve as barriers to entry.
The current slowdown in the real estate and construction activities led to lower YoY demand.
Low margins on the back of declining sales coupled with higher opex due to lower demand and rising energy prices.
Despite the rising cost of energy, it is still cheaper in Egypt than in the international markets.
An abundant supply of raw materials gives the industry a competitive edge.
Capacities on the stream will lead to more competitive prices, thus increasing real estate and construction activities.
Lifting cement export ban will give room for cement exporters to regain their lost markets during the ban.
Removal of energy subsidies is expected to be effective in 2012, which will affect local producers' margins negatively.
Rising competition in the local market after new capacities come on stream.
Government decision to lift the export ban opens the door for exports to flow freely.
Outstanding real estate backlog secures demand for cement in the coming years.
Faster-than-expected recovery to the current political and economic unrest.
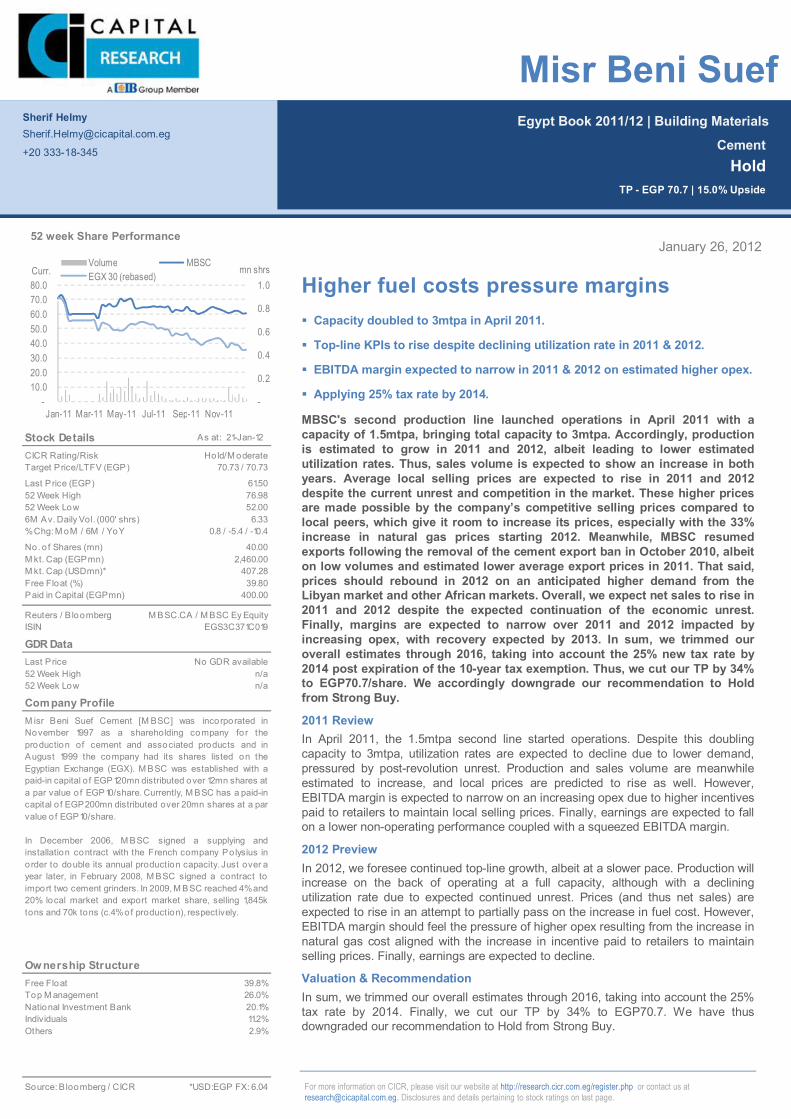
Page | 23
Egypt Book 2011/12 | Building Materials
For more information on CICR, please visit our website at http://research.cicr.com.eg/register.php or contact us at [email protected]. Disclosures and details pertaining to stock ratings on last page.
January 26, 2012
Higher fuel costs pressure margins Capacity doubled to 3mtpa in April 2011.
Top-line KPIs to rise despite declining utilization rate in 2011 & 2012.
EBITDA margin expected to narrow in 2011 & 2012 on estimated higher opex.
Applying 25% tax rate by 2014.
MBSC's second production line launched operations in April 2011 with a capacity of 1.5mtpa, bringing total capacity to 3mtpa. Accordingly, production is estimated to grow in 2011 and 2012, albeit leading to lower estimated utilization rates. Thus, sales volume is expected to show an increase in both years. Average local selling prices are expected to rise in 2011 and 2012 despite the current unrest and competition in the market. These higher prices are made possible by the company’s competitive selling prices compared to local peers, which give it room to increase its prices, especially with the 33% increase in natural gas prices starting 2012. Meanwhile, MBSC resumed exports following the removal of the cement export ban in October 2010, albeit on low volumes and estimated lower average export prices in 2011. That said, prices should rebound in 2012 on an anticipated higher demand from the Libyan market and other African markets. Overall, we expect net sales to rise in 2011 and 2012 despite the expected continuation of the economic unrest. Finally, margins are expected to narrow over 2011 and 2012 impacted by increasing opex, with recovery expected by 2013. In sum, we trimmed our overall estimates through 2016, taking into account the 25% new tax rate by 2014 post expiration of the 10-year tax exemption. Thus, we cut our TP by 34% to EGP70.7/share. We accordingly downgrade our recommendation to Hold from Strong Buy.
2011 Review In April 2011, the 1.5mtpa second line started operations. Despite this doubling capacity to 3mtpa, utilization rates are expected to decline due to lower demand, pressured by post-revolution unrest. Production and sales volume are meanwhile estimated to increase, and local prices are predicted to rise as well. However, EBITDA margin is expected to narrow on an increasing opex due to higher incentives paid to retailers to maintain local selling prices. Finally, earnings are expected to fall on a lower non-operating performance coupled with a squeezed EBITDA margin.
2012 Preview In 2012, we foresee continued top-line growth, albeit at a slower pace. Production will increase on the back of operating at a full capacity, although with a declining utilization rate due to expected continued unrest. Prices (and thus net sales) are expected to rise in an attempt to partially pass on the increase in fuel cost. However, EBITDA margin should feel the pressure of higher opex resulting from the increase in natural gas cost aligned with the increase in incentive paid to retailers to maintain selling prices. Finally, earnings are expected to decline.
Valuation & Recommendation In sum, we trimmed our overall estimates through 2016, taking into account the 25% tax rate by 2014. Finally, we cut our TP by 34% to EGP70.7. We have thus downgraded our recommendation to Hold from Strong Buy.
Sherif Helmy [email protected]
+20 333-18-345
Cement Hold
TP - EGP 70.7 | 15.0% Upside
Misr Beni Suef
Stock Details As at: 21-Jan-12
CICR Rating/RiskTarget Price/LTFV (EGP)
Last Price (EGP)52 Week High52 Week Low6M Av. Daily Vol. (000' shrs)% Chg: M oM / 6M / YoY
No. o f Shares (mn)M kt. Cap (EGPmn)M kt. Cap (USDmn)*Free Float (%)Paid in Capital (EGPmn)
Reuters / B loombergISIN
GDR DataLast Price52 Week High52 Week Low
Company Profile
Ow nership StructureFree Float 39.8%Top M anagement 26.0%National Investment Bank 20.1%Individuals 11.2%Others 2.9%
Source: B loomberg / CICR
70.73 / 70.73
61.50
Hold/M oderate
400.00
2,460.00
No GDR availablen/a
39.80
EGS3C371C019
n/a
*USD:EGP FX: 6.04
M isr Beni Suef Cement [M BSC] was incorporated inNovember 1997 as a shareholding company for theproduction of cement and associated products and inAugust 1999 the company had its shares listed on theEgyptian Exchange (EGX). M BSC was established with apaid-in capital o f EGP120mn distributed over 12mn shares at a par value of EGP10/share. Currently, M BSC has a paid-incapital o f EGP200mn distributed over 20mn shares at a parvalue o f EGP10/share.
In December 2006, M BSC signed a supplying andinstallation contract with the French company Polysius inorder to double its annual production capacity. Just over ayear later, in February 2008, M BSC signed a contract toimport two cement grinders. In 2009, M BSC reached 4% and 20% local market and export market share, selling 1,845ktons and 70k tons (c.4% o f production), respectively.
76.9852.00
40.00
6.33
M BSC.CA / M BSC Ey Equity
407.28
0.8 / -5.4 / -10.4
-
0.2
0.4
0.6
0.8
1.0
-10.0 20.0 30.0 40.0 50.0 60.0 70.0 80.0
Jan-11 Mar-11 May-11 Jul-11 Sep-11 Nov-11
mn shrsCurr.Volume MBSCEGX 30 (rebased)
52 week Share Performance

Page | 85
Egypt Book January 26, 2012x Financial Statements
Misr Beni Suef Cement (MBSC)
MBSC | EGPmn | FY End: December
Balance sheet
Cash & Cash Equivalent 227.9 332.9 331.8 408.2 595.8 833.1Current Assets 256.8 362.9 458.5 585.5 771.3 985.6Total Assets 1,553.0 1,985.8 2,179.0 2,266.1 2,384.7 2,522.1Current Liabilities 166.2 246.4 217.7 222.8 256.1 285.1Total Debt 51.7 63.4 21.2 22.0 15.3 10.8Net Debt -176.2 -269.5 -310.6 -386.2 -580.5 -822.3Total Liabilities 196.9 297.3 238.9 238.7 266.7 290.4Shr Equity (Book Value) 840.8 1,431.4 1,614.4 1,697.3 1,782.7 1,890.5Minority Interest 0.0 0.0 0.0 0.0 0.0 0.0Provisions 515.3 230.4 232.3 236.8 241.9 247.9Total Liabilities & Equity 1,553.0 1,985.8 2,179.0 2,266.1 2,384.7 2,522.1
Income statement
Revenue 660.0 835.6 749.0 897.2 1,054.5 1,241.6COGS -218.4 -320.4 -252.9 -436.5 -558.7 -655.1Gross Profit 441.5 515.2 496.2 460.7 495.8 586.5EBITDA 421.0 497.1 477.3 402.8 416.1 497.4EBIT 357.7 433.6 346.8 257.0 265.0 339.7Int. Income 14.6 16.6 28.2 22.4 25.3 27.3Int. Expense 0.0 0.0 -0.3 -0.7 -0.6 -0.7PBT 233.3 389.3 370.5 278.1 288.4 364.2NPAT 202.4 390.6 303.9 276.3 284.9 359.0Net Income 202.4 390.6 303.9 276.3 284.9 359.0Normalised Net Income 192.1 380.3 481.1 447.6 461.6 581.7Ordinary Dividends 80.0 120.0 191.2 171.3 176.7 222.7
Cash Flow Summary
COPAT 356.9 499.5 405.0 401.0 412.5 492.2FCFF -168.7 217.2 97.3 248.6 370.1 467.6Change in Cash -1.2 39.3 253.4 88.9 151.4 163.6
Key Multiples
Per Share DataEPS (Basic) (EGP) 5.06 9.76 7.60 6.91 7.12 8.98EPS (Normalised) (EGP) 4.80 9.51 12.03 11.19 11.54 14.54Dividend Per Share 2.00 3.00 4.78 4.28 4.42 5.57Book Value Per Share 21.02 35.78 40.36 42.43 44.57 47.26
ValuationPER (Basic) (x) 12.15 6.30 8.10 8.90 8.63 6.85PER (CICR) (x) 12.81 6.47 5.11 5.50 5.33 4.23PBV (x) 2.93 1.72 1.52 1.45 1.38 1.30Dividend Yield (%) 3.25 4.88 7.77 6.96 7.18 9.05Earnings Yield (%) 8.23 15.88 12.35 11.23 11.58 14.60EV/Revenue (x) 3.46 2.62 2.87 2.31 1.78 1.32EV/EBITDA (x) 5.42 4.41 4.50 5.15 4.52 3.29
Market Capitalisation (EGPmn) 2,460.0 2,460.0 2,460.0 2,460.0 2,460.0 2,460.0Enterprise Value (EGPmn) 2,283.8 2,190.5 2,149.4 2,073.8 1,879.5 1,637.7
ProfitabilityROE (%) 24.07 27.29 18.82 16.28 15.98 18.99ROA (%) 13.03 19.67 13.95 12.19 11.95 14.24Asset Turnover (x) 0.42 0.42 0.34 0.40 0.44 0.49EBITDA Margin (%) 63.80 59.49 63.72 44.90 39.45 40.06
LiquidityND/Equity (x) -0.21 -0.19 -0.19 -0.23 -0.33 -0.43ND/EBITDA (x) -0.42 -0.54 -0.65 -0.96 -1.40 -1.65
Source: Company Financials & CICR Database
2008a 2009a 2010a 2011e 2012e 2013e
Page | 85
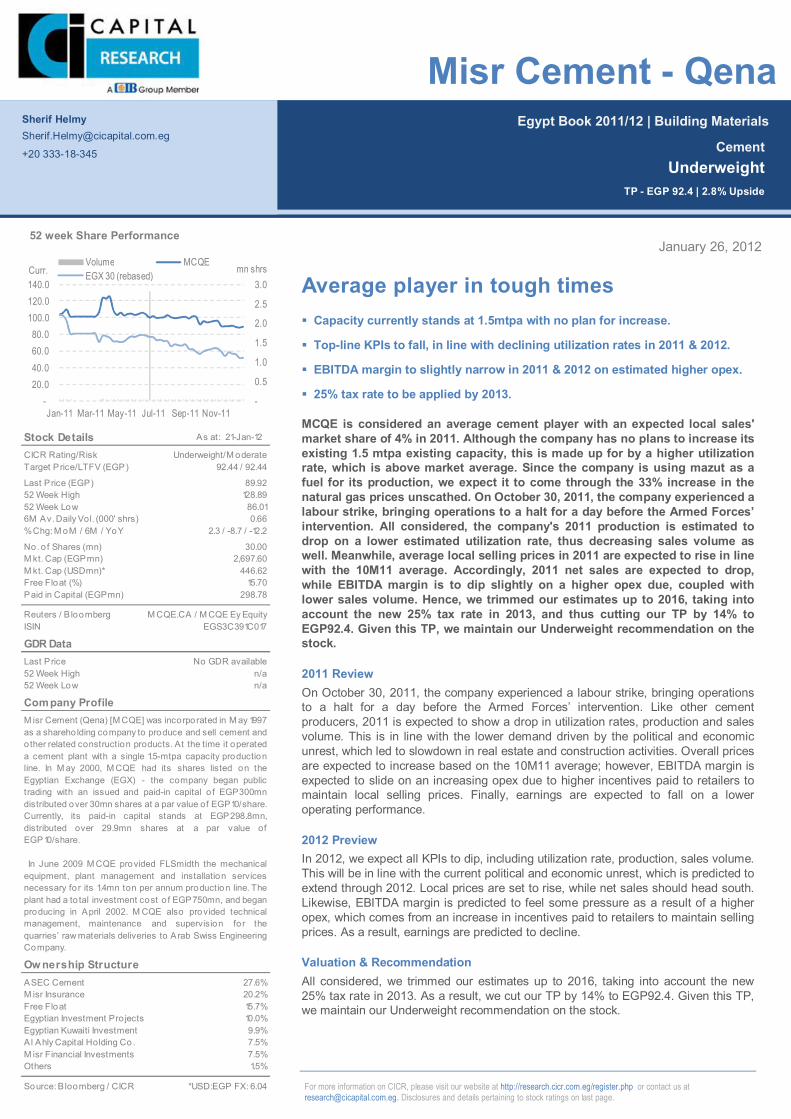
Page | 25
Egypt Book 2011/12 | Building Materials
For more information on CICR, please visit our website at http://research.cicr.com.eg/register.php or contact us at [email protected]. Disclosures and details pertaining to stock ratings on last page.
January 26, 2012
Average player in tough times Capacity currently stands at 1.5mtpa with no plan for increase.
Top-line KPIs to fall, in line with declining utilization rates in 2011 & 2012.
EBITDA margin to slightly narrow in 2011 & 2012 on estimated higher opex.
25% tax rate to be applied by 2013.
MCQE is considered an average cement player with an expected local sales' market share of 4% in 2011. Although the company has no plans to increase its existing 1.5 mtpa existing capacity, this is made up for by a higher utilization rate, which is above market average. Since the company is using mazut as a fuel for its production, we expect it to come through the 33% increase in the natural gas prices unscathed. On October 30, 2011, the company experienced a labour strike, bringing operations to a halt for a day before the Armed Forces’ intervention. All considered, the company's 2011 production is estimated to drop on a lower estimated utilization rate, thus decreasing sales volume as well. Meanwhile, average local selling prices in 2011 are expected to rise in line with the 10M11 average. Accordingly, 2011 net sales are expected to drop, while EBITDA margin is to dip slightly on a higher opex due, coupled with lower sales volume. Hence, we trimmed our estimates up to 2016, taking into account the new 25% tax rate in 2013, and thus cutting our TP by 14% to EGP92.4. Given this TP, we maintain our Underweight recommendation on the stock.
2011 Review On October 30, 2011, the company experienced a labour strike, bringing operations to a halt for a day before the Armed Forces’ intervention. Like other cement producers, 2011 is expected to show a drop in utilization rates, production and sales volume. This is in line with the lower demand driven by the political and economic unrest, which led to slowdown in real estate and construction activities. Overall prices are expected to increase based on the 10M11 average; however, EBITDA margin is expected to slide on an increasing opex due to higher incentives paid to retailers to maintain local selling prices. Finally, earnings are expected to fall on a lower operating performance.
2012 Preview In 2012, we expect all KPIs to dip, including utilization rate, production, sales volume. This will be in line with the current political and economic unrest, which is predicted to extend through 2012. Local prices are set to rise, while net sales should head south. Likewise, EBITDA margin is predicted to feel some pressure as a result of a higher opex, which comes from an increase in incentives paid to retailers to maintain selling prices. As a result, earnings are predicted to decline.
Valuation & Recommendation All considered, we trimmed our estimates up to 2016, taking into account the new 25% tax rate in 2013. As a result, we cut our TP by 14% to EGP92.4. Given this TP, we maintain our Underweight recommendation on the stock.
Sherif Helmy [email protected]
+20 333-18-345
Cement Underweight
TP - EGP 92.4 | 2.8% Upside
Misr Cement - Qena
Stock Details As at: 21-Jan-12
CICR Rating/RiskTarget Price/LTFV (EGP)
Last Price (EGP)52 Week High52 Week Low6M Av. Daily Vol. (000' shrs)% Chg: M oM / 6M / YoY
No. o f Shares (mn)M kt. Cap (EGPmn)M kt. Cap (USDmn)*Free Float (%)Paid in Capital (EGPmn)
Reuters / B loombergISIN
GDR DataLast Price52 Week High52 Week Low
Company Profile
Ow nership StructureASEC Cement 27.6%M isr Insurance 20.2%Free Float 15.7%Egyptian Investment Pro jects 10.0%Egyptian Kuwaiti Investment 9.9%Al Ahly Capital Holding Co. 7.5%M isr Financial Investments 7.5%Others 1.5%
Source: B loomberg / CICR
92.44 / 92.44
89.92
Underweight/M oderate
298.78
2,697.60
No GDR availablen/a
15.70
EGS3C391C017
n/a
*USD:EGP FX: 6.04
M isr Cement (Qena) [M CQE] was incorporated in M ay 1997as a shareho lding company to produce and sell cement andother related construction products. At the time it operateda cement plant with a single 1.5-mtpa capacity productionline. In M ay 2000, M CQE had its shares listed on theEgyptian Exchange (EGX) - the company began publictrading with an issued and paid-in capital o f EGP300mndistributed over 30mn shares at a par value of EGP10/share. Currently, its paid-in capital stands at EGP298.8mn,distributed over 29.9mn shares at a par value ofEGP10/share.
In June 2009 M CQE provided FLSmidth the mechanicalequipment, plant management and installation servicesnecessary fo r its 1.4mn ton per annum production line. Theplant had a to tal investment cost o f EGP750mn, and beganproducing in April 2002. M CQE also provided technicalmanagement, maintenance and supervision for thequarries’ raw materials deliveries to Arab Swiss EngineeringCompany.
128.8986.01
30.00
0.66
M CQE.CA / M CQE Ey Equity
446.62
2.3 / -8.7 / -12.2
-
0.5
1.0
1.5
2.0
2.5
3.0
-20.0 40.0 60.0 80.0
100.0 120.0 140.0
Jan-11 Mar-11 May-11 Jul-11 Sep-11 Nov-11
mn shrsCurr.Volume MCQEEGX 30 (rebased)
52 week Share Performance
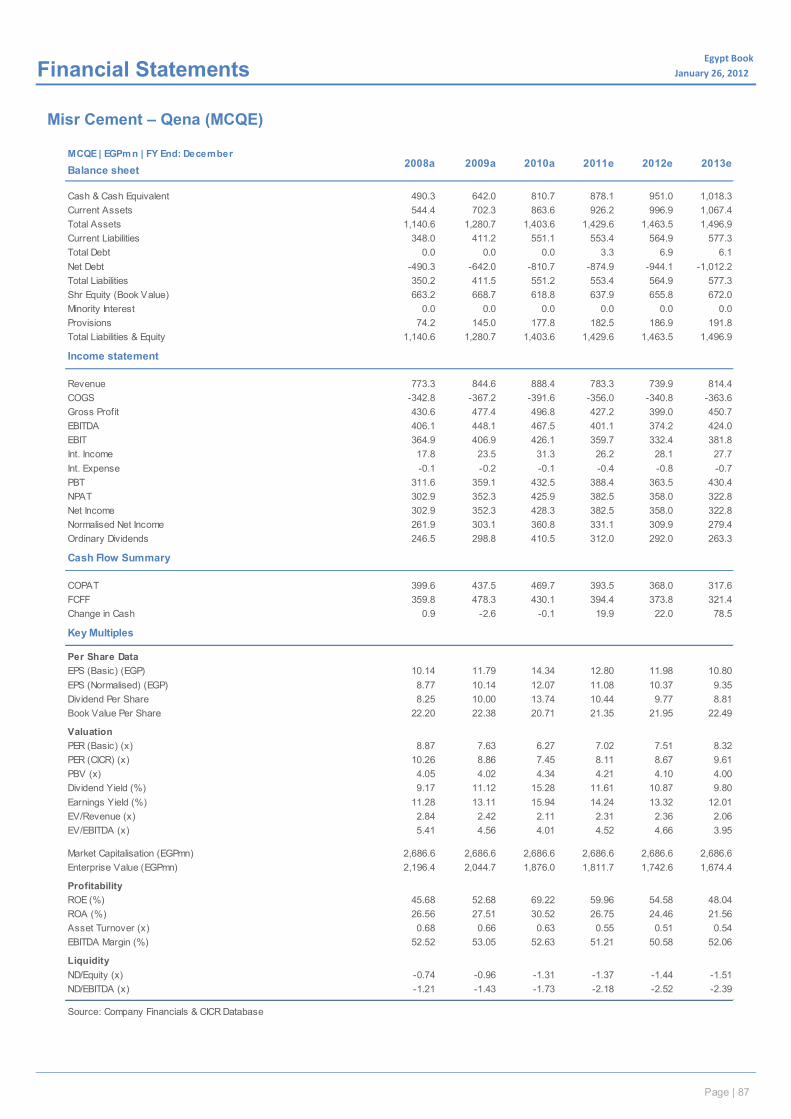
Page | 85
Egypt Book January 26, 2012x Financial Statements
Misr Cement – Qena (MCQE)
MCQE | EGPmn | FY End: December
Balance sheet
Cash & Cash Equivalent 490.3 642.0 810.7 878.1 951.0 1,018.3Current Assets 544.4 702.3 863.6 926.2 996.9 1,067.4Total Assets 1,140.6 1,280.7 1,403.6 1,429.6 1,463.5 1,496.9Current Liabilities 348.0 411.2 551.1 553.4 564.9 577.3Total Debt 0.0 0.0 0.0 3.3 6.9 6.1Net Debt -490.3 -642.0 -810.7 -874.9 -944.1 -1,012.2Total Liabilities 350.2 411.5 551.2 553.4 564.9 577.3Shr Equity (Book Value) 663.2 668.7 618.8 637.9 655.8 672.0Minority Interest 0.0 0.0 0.0 0.0 0.0 0.0Provisions 74.2 145.0 177.8 182.5 186.9 191.8Total Liabilities & Equity 1,140.6 1,280.7 1,403.6 1,429.6 1,463.5 1,496.9
Income statement
Revenue 773.3 844.6 888.4 783.3 739.9 814.4COGS -342.8 -367.2 -391.6 -356.0 -340.8 -363.6Gross Profit 430.6 477.4 496.8 427.2 399.0 450.7EBITDA 406.1 448.1 467.5 401.1 374.2 424.0EBIT 364.9 406.9 426.1 359.7 332.4 381.8Int. Income 17.8 23.5 31.3 26.2 28.1 27.7Int. Expense -0.1 -0.2 -0.1 -0.4 -0.8 -0.7PBT 311.6 359.1 432.5 388.4 363.5 430.4NPAT 302.9 352.3 425.9 382.5 358.0 322.8Net Income 302.9 352.3 428.3 382.5 358.0 322.8Normalised Net Income 261.9 303.1 360.8 331.1 309.9 279.4Ordinary Dividends 246.5 298.8 410.5 312.0 292.0 263.3
Cash Flow Summary
COPAT 399.6 437.5 469.7 393.5 368.0 317.6FCFF 359.8 478.3 430.1 394.4 373.8 321.4Change in Cash 0.9 -2.6 -0.1 19.9 22.0 78.5
Key Multiples
Per Share DataEPS (Basic) (EGP) 10.14 11.79 14.34 12.80 11.98 10.80EPS (Normalised) (EGP) 8.77 10.14 12.07 11.08 10.37 9.35Dividend Per Share 8.25 10.00 13.74 10.44 9.77 8.81Book Value Per Share 22.20 22.38 20.71 21.35 21.95 22.49
ValuationPER (Basic) (x) 8.87 7.63 6.27 7.02 7.51 8.32PER (CICR) (x) 10.26 8.86 7.45 8.11 8.67 9.61PBV (x) 4.05 4.02 4.34 4.21 4.10 4.00Dividend Yield (%) 9.17 11.12 15.28 11.61 10.87 9.80Earnings Yield (%) 11.28 13.11 15.94 14.24 13.32 12.01EV/Revenue (x) 2.84 2.42 2.11 2.31 2.36 2.06EV/EBITDA (x) 5.41 4.56 4.01 4.52 4.66 3.95
Market Capitalisation (EGPmn) 2,686.6 2,686.6 2,686.6 2,686.6 2,686.6 2,686.6Enterprise Value (EGPmn) 2,196.4 2,044.7 1,876.0 1,811.7 1,742.6 1,674.4
ProfitabilityROE (%) 45.68 52.68 69.22 59.96 54.58 48.04ROA (%) 26.56 27.51 30.52 26.75 24.46 21.56Asset Turnover (x) 0.68 0.66 0.63 0.55 0.51 0.54EBITDA Margin (%) 52.52 53.05 52.63 51.21 50.58 52.06
LiquidityND/Equity (x) -0.74 -0.96 -1.31 -1.37 -1.44 -1.51ND/EBITDA (x) -1.21 -1.43 -1.73 -2.18 -2.52 -2.39
Source: Company Financials & CICR Database
2008a 2009a 2010a 2011e 2012e 2013e
Page | 87
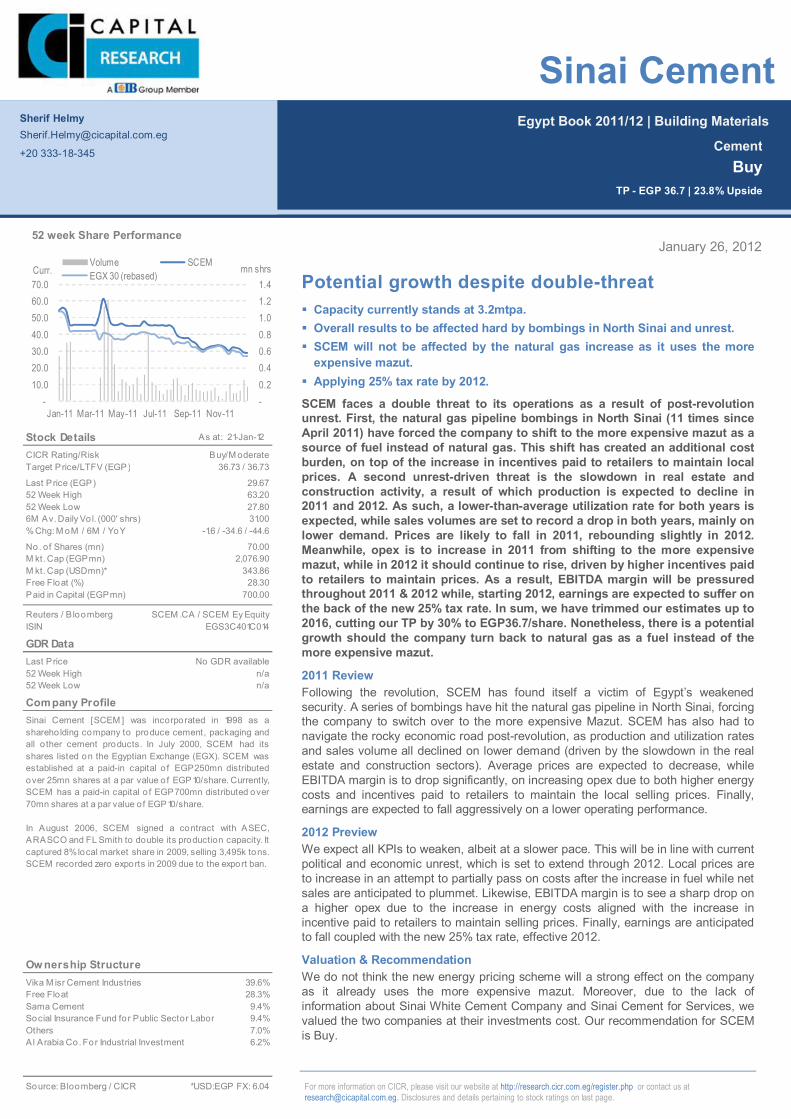
Page | 27
Egypt Book 2011/12 | Building Materials
For more information on CICR, please visit our website at http://research.cicr.com.eg/register.php or contact us at [email protected]. Disclosures and details pertaining to stock ratings on last page.
January 26, 2012
Potential growth despite double-threat
Capacity currently stands at 3.2mtpa. Overall results to be affected hard by bombings in North Sinai and unrest. SCEM will not be affected by the natural gas increase as it uses the more
expensive mazut. Applying 25% tax rate by 2012.
SCEM faces a double threat to its operations as a result of post-revolution unrest. First, the natural gas pipeline bombings in North Sinai (11 times since April 2011) have forced the company to shift to the more expensive mazut as a source of fuel instead of natural gas. This shift has created an additional cost burden, on top of the increase in incentives paid to retailers to maintain local prices. A second unrest-driven threat is the slowdown in real estate and construction activity, a result of which production is expected to decline in 2011 and 2012. As such, a lower-than-average utilization rate for both years is expected, while sales volumes are set to record a drop in both years, mainly on lower demand. Prices are likely to fall in 2011, rebounding slightly in 2012. Meanwhile, opex is to increase in 2011 from shifting to the more expensive mazut, while in 2012 it should continue to rise, driven by higher incentives paid to retailers to maintain prices. As a result, EBITDA margin will be pressured throughout 2011 & 2012 while, starting 2012, earnings are expected to suffer on the back of the new 25% tax rate. In sum, we have trimmed our estimates up to 2016, cutting our TP by 30% to EGP36.7/share. Nonetheless, there is a potential growth should the company turn back to natural gas as a fuel instead of the more expensive mazut.
2011 Review Following the revolution, SCEM has found itself a victim of Egypt’s weakened security. A series of bombings have hit the natural gas pipeline in North Sinai, forcing the company to switch over to the more expensive Mazut. SCEM has also had to navigate the rocky economic road post-revolution, as production and utilization rates and sales volume all declined on lower demand (driven by the slowdown in the real estate and construction sectors). Average prices are expected to decrease, while EBITDA margin is to drop significantly, on increasing opex due to both higher energy costs and incentives paid to retailers to maintain the local selling prices. Finally, earnings are expected to fall aggressively on a lower operating performance.
2012 Preview We expect all KPIs to weaken, albeit at a slower pace. This will be in line with current political and economic unrest, which is set to extend through 2012. Local prices are to increase in an attempt to partially pass on costs after the increase in fuel while net sales are anticipated to plummet. Likewise, EBITDA margin is to see a sharp drop on a higher opex due to the increase in energy costs aligned with the increase in incentive paid to retailers to maintain selling prices. Finally, earnings are anticipated to fall coupled with the new 25% tax rate, effective 2012.
Valuation & Recommendation We do not think the new energy pricing scheme will a strong effect on the company as it already uses the more expensive mazut. Moreover, due to the lack of information about Sinai White Cement Company and Sinai Cement for Services, we valued the two companies at their investments cost. Our recommendation for SCEM is Buy.
Sherif Helmy [email protected]
+20 333-18-345
Cement Buy
TP - EGP 36.7 | 23.8% Upside
Sinai Cement
Stock Details As at: 21-Jan-12
CICR Rating/RiskTarget Price/LTFV (EGP)
Last Price (EGP)52 Week High52 Week Low6M Av. Daily Vo l. (000' shrs)% Chg: M oM / 6M / YoY
No. of Shares (mn)M kt. Cap (EGPmn)M kt. Cap (USDmn)*Free Float (%)Paid in Capital (EGPmn)
Reuters / B loombergISIN
GDR DataLast Price52 Week High52 Week Low
Company Profile
Ow nership StructureVika M isr Cement Industries 39.6%Free Float 28.3%Sama Cement 9.4%Social Insurance Fund fo r Public Sector Labor 9.4%Others 7.0%Al Arabia Co. For Industrial Investment 6.2%
Source: Bloomberg / CICR
36.73 / 36.73
29.67
Buy/M oderate
700.00
2,076.90
No GDR availablen/a
28.30
EGS3C401C014
n/a
*USD:EGP FX: 6.04
Sinai Cement [SCEM ] was incorporated in 1998 as ashareho lding company to produce cement, packaging andall o ther cement products. In July 2000, SCEM had itsshares listed on the Egyptian Exchange (EGX). SCEM wasestablished at a paid-in capital o f EGP250mn distributedover 25mn shares at a par value of EGP10/share. Currently,SCEM has a paid-in capital o f EGP700mn distributed over70mn shares at a par value o f EGP10/share.
In August 2006, SCEM signed a contract with ASEC,ARASCO and FL Smith to double its production capacity. Itcaptured 8%local market share in 2009, selling 3,495k tons.SCEM recorded zero exports in 2009 due to the export ban.
63.2027.80
70.00
31.00
SCEM .CA / SCEM Ey Equity
343.86
-1.6 / -34.6 / -44.6
-0.2 0.4 0.6 0.8 1.0 1.2 1.4
-10.0 20.0 30.0 40.0 50.0 60.0 70.0
Jan-11 Mar-11 May-11 Jul-11 Sep-11 Nov-11
mn shrsCurr.Volume SCEMEGX 30 (rebased)
52 week Share Performance

Page | 85
Egypt Book January 26, 2012x Financial Statements
Sinai Cement (SCEM)
SCEM | EGPmn | FY End: December
Balance sheet
Cash & Cash Equivalent 117.5 288.4 694.1 742.0 819.7 914.4Current Assets 238.9 461.9 879.2 961.3 1,034.9 1,125.0Total Assets 1,759.6 2,010.0 2,704.3 2,781.3 2,816.7 2,893.3Current Liabilities 183.1 133.0 125.6 140.1 132.4 148.7Total Debt 0.0 0.0 0.0 5.3 4.9 4.0Net Debt -117.5 -288.4 -694.1 -736.7 -814.8 -910.4Total Liabilities 194.1 133.0 212.4 216.8 199.0 205.2Shr Equity (Book Value) 1,548.0 1,855.2 2,454.4 2,522.5 2,571.3 2,636.5Minority Interest 0.0 0.0 0.0 0.0 0.0 0.0Provisions 17.6 21.8 37.5 42.0 46.3 51.6Total Liabilities & Equity 1,759.6 2,010.0 2,704.3 2,781.3 2,816.7 2,893.3
Income statement
Revenue 906.3 1,513.1 1,627.6 1,219.2 1,156.8 1,399.0COGS -362.0 -670.0 -706.5 -688.5 -657.8 -772.0Gross Profit 544.4 843.1 921.0 530.7 499.0 627.0EBITDA 475.5 749.2 795.7 413.4 388.0 495.6EBIT 437.6 677.0 717.7 331.7 302.7 406.9Int. Income 1.6 12.8 27.3 23.5 26.7 32.3Int. Expense 0.0 0.0 0.0 -0.7 -0.6 -0.5PBT 435.9 681.2 732.8 344.8 325.3 434.7NPAT 435.6 678.6 727.4 340.2 244.0 326.0Net Income 414.1 677.6 728.1 340.2 244.0 326.0Normalised Net Income 393.7 652.7 691.5 325.2 233.2 311.6Ordinary Dividends 350.0 280.0 628.4 257.2 184.4 246.4
Cash Flow Summary
COPAT 462.3 749.4 826.9 433.5 306.7 387.0FCFF 183.3 560.7 636.8 314.4 256.5 333.5Change in Cash -5.9 -6.1 50.9 206.6 102.4 1.4
Key Multiples
Per Share DataEPS (Basic) (EGP) 5.92 9.68 10.40 4.86 3.49 4.66EPS (Normalised) (EGP) 5.62 9.32 9.88 4.65 3.33 4.45Dividend Per Share 5.00 4.00 8.98 3.67 2.63 3.52Book Value Per Share 22.11 26.50 35.06 36.04 36.73 37.66
ValuationPER (Basic) (x) 5.02 3.07 2.85 6.11 8.51 6.37PER (CICR) (x) 5.27 3.18 3.00 6.39 8.90 6.66PBV (x) 1.34 1.12 0.85 0.82 0.81 0.79Dividend Yield (%) 16.85 13.48 30.26 12.38 8.88 11.87Earnings Yield (%) 19.94 32.62 35.06 16.38 11.75 15.70EV/Revenue (x) 2.16 1.18 0.85 1.10 1.09 0.83EV/EBITDA (x) 4.12 2.39 1.74 3.24 3.25 2.35
Market Capitalisation (EGPmn) 2,076.9 2,076.9 2,076.9 2,076.9 2,076.9 2,076.9Enterprise Value (EGPmn) 1,959.4 1,788.5 1,382.8 1,340.2 1,262.1 1,166.5
ProfitabilityROE (%) 26.75 36.52 29.66 13.49 9.49 12.37ROA (%) 23.54 33.71 26.92 12.23 8.66 11.27Asset Turnover (x) 0.52 0.75 0.60 0.44 0.41 0.48EBITDA Margin (%) 52.46 49.52 48.89 33.91 33.54 35.43
LiquidityND/Equity (x) -0.08 -0.16 -0.28 -0.29 -0.32 -0.35ND/EBITDA (x) -0.25 -0.38 -0.87 -1.78 -2.10 -1.84
Source: Company Financials & CICR Database
2008a 2009a 2010a 2011e 2012e 2013e
Page | 89
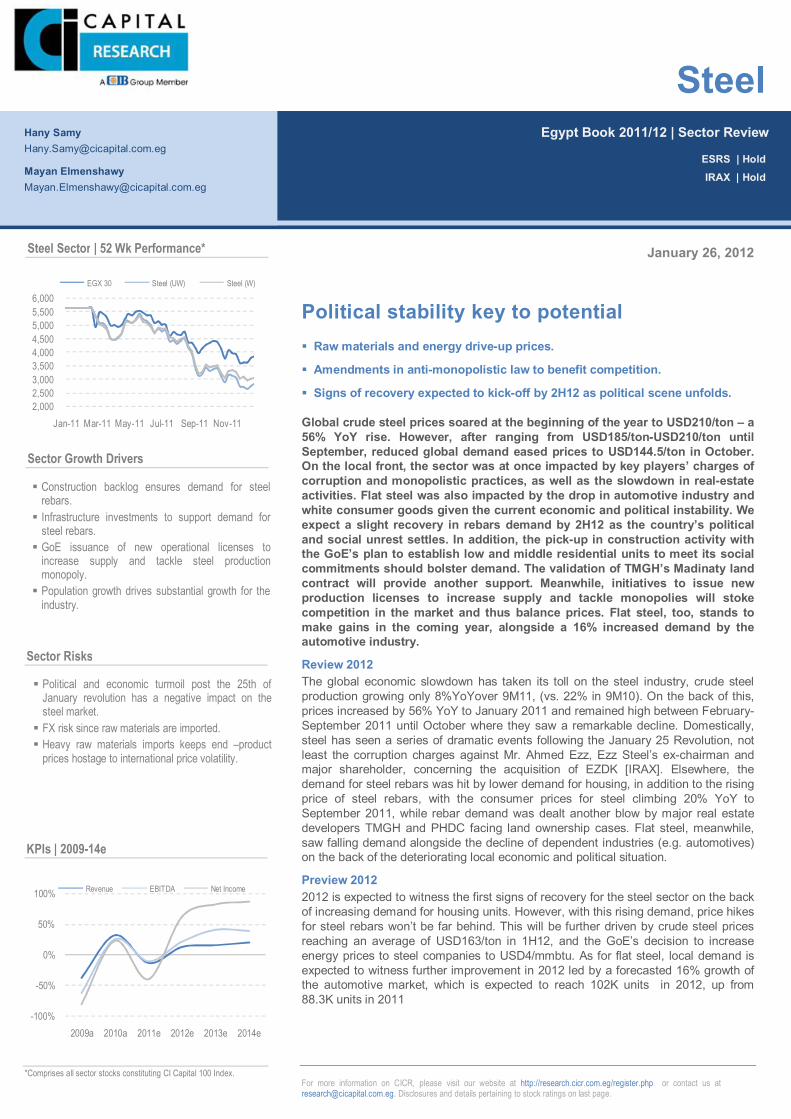
Page | 90
Page | 90
For more information on CICR, please visit our website at http://research.cicr.com.eg/register.php or contact us at [email protected]. Disclosures and details pertaining to stock ratings on last page.
January 26, 2012
Political stability key to potential Raw materials and energy drive-up prices.
Amendments in anti-monopolistic law to benefit competition.
Signs of recovery expected to kick-off by 2H12 as political scene unfolds.
Global crude steel prices soared at the beginning of the year to USD210/ton – a 56% YoY rise. However, after ranging from USD185/ton-USD210/ton until September, reduced global demand eased prices to USD144.5/ton in October. On the local front, the sector was at once impacted by key players’ charges of corruption and monopolistic practices, as well as the slowdown in real-estate activities. Flat steel was also impacted by the drop in automotive industry and white consumer goods given the current economic and political instability. We expect a slight recovery in rebars demand by 2H12 as the country’s political and social unrest settles. In addition, the pick-up in construction activity with the GoE’s plan to establish low and middle residential units to meet its social commitments should bolster demand. The validation of TMGH’s Madinaty land contract will provide another support. Meanwhile, initiatives to issue new production licenses to increase supply and tackle monopolies will stoke competition in the market and thus balance prices. Flat steel, too, stands to make gains in the coming year, alongside a 16% increased demand by the automotive industry.
Review 2012 The global economic slowdown has taken its toll on the steel industry, crude steel production growing only 8%YoYover 9M11, (vs. 22% in 9M10). On the back of this, prices increased by 56% YoY to January 2011 and remained high between February-September 2011 until October where they saw a remarkable decline. Domestically, steel has seen a series of dramatic events following the January 25 Revolution, not least the corruption charges against Mr. Ahmed Ezz, Ezz Steel’s ex-chairman and major shareholder, concerning the acquisition of EZDK [IRAX]. Elsewhere, the demand for steel rebars was hit by lower demand for housing, in addition to the rising price of steel rebars, with the consumer prices for steel climbing 20% YoY to September 2011, while rebar demand was dealt another blow by major real estate developers TMGH and PHDC facing land ownership cases. Flat steel, meanwhile, saw falling demand alongside the decline of dependent industries (e.g. automotives) on the back of the deteriorating local economic and political situation.
Preview 2012 2012 is expected to witness the first signs of recovery for the steel sector on the back of increasing demand for housing units. However, with this rising demand, price hikes for steel rebars won’t be far behind. This will be further driven by crude steel prices reaching an average of USD163/ton in 1H12, and the GoE’s decision to increase energy prices to steel companies to USD4/mmbtu. As for flat steel, local demand is expected to witness further improvement in 2012 led by a forecasted 16% growth of the automotive market, which is expected to reach 102K units in 2012, up from 88.3K units in 2011
Egypt Book 2011/12 | Sector Review
Steel
ESRS | Hold IRAX | Hold
Hany Samy [email protected]
Mayan Elmenshawy [email protected]
Construction backlog ensures demand for steel rebars. Infrastructure investments to support demand for
steel rebars. GoE issuance of new operational licenses to
increase supply and tackle steel production monopoly. Population growth drives substantial growth for the
industry.
Political and economic turmoil post the 25th of January revolution has a negative impact on the steel market. FX risk since raw materials are imported. Heavy raw materials imports keeps end –product
prices hostage to international price volatility.
Steel Sector | 52 Wk Performance*
2,000 2,500 3,000 3,500 4,000 4,500 5,000 5,500 6,000
Jan-11 Mar-11 May-11 Jul-11 Sep-11 Nov-11
EGX 30 Steel (UW) Steel (W)
Sector Growth Drivers
Sector Risks
-100%
-50%
0%
50%
100%
2009a 2010a 2011e 2012e 2013e 2014e
Revenue EBITDA Net Income
KPIs | 2009-14e
*Comprises all sector stocks constituting CI Capital 100 Index.
Page | 91
Egypt Book 2011/12
January 26, 2012
Steel
Xxx
2011 Review In 2011, the steel industry was a victim of the global economic slowdown, as the
production of crude steel, reaching 1.1bn tons during 9M11, witnessed a mere 8%
YoY growth compared to 22% in 2010. On a monthly basis, global crude steel
production grew by an average of 1% during 9M11. European countries boasted the
fastest growth of crude steel production, with Turkey showing a 19% growth to reach
25mn tons in 9M11, up from 21mn tons during the same period in 2010. That said,
Asia still maintained its dominance, with production reaching 728.7mn tons in 9M11
and a 12% YoY growth. Global crude steel production was led by China, churning out
527.5mn tons in 9M11, representing 72% of Asia and 46% of the world total. Global
demand for crude steel, however, is expected to grow only slightly by 1% in 2011 to
reach 1.4bn tons – compared to a 14% growth in 2010 – due to the global economic
slowdown. In addition to its production dominance, Asia proved to be the major
consumer of crude steel as well, reaching 906mn tons, equivalent to 65% of the
world’s total consumption in 2011. Crude steel prices reached their peak at
USD210/ton starting in January 2011, representing a YoY increase of 56% compared
to USD135/ton in 2010. Prices remained relatively high, ranging from USD185/ton –
USD210/ton during the period from February-September 2011, until October 2011, in
which the global slowdown dented the price of crude steel to USD144.5/ton,
representing a 31% decline compared to January 2011 and even a YoY drop of 16%.
Domestically, 2011 was a turning point for Egypt’s economy, and hardly a welcome
one. When the January 25 Revolution swept a regime from power, it also brought
host of new challenges, many of which felt by the steel sector. Following the
revolution, Mr. Ahmed Ezz, ESRS’s ex-chairman and major shareholder, was
accused of corruption and monopolistic practices related to the acquisition of EZDK
by ESRS. Mr. Ezz faced a litany of charges, including: gaining control of EZDK via
nominal share swap in violation of the Capital Market Law; committing criminal acts
against public property; controlling over 67% of EZDK's steel production; the
Figure 4.2.1 | World Production by region Figure 4.2.2 | World estimated consumption by region
Source: World Steel Association
Source: World Steel Association
234
84 33 14 12
662
6 248 90 37 15 10
729
6 -
100 200 300 400 500 600 700 800
Europe North America
South America
Middle East
Africa Asia Oceania
mn tons 9M10 9M11
247129
49 30 47
876
8
244121
48 21 50
906
80
200
400
600
800
1000
Europe North America
South America
Africa Middle East
Asia Oceania
mn tons 2010 2011
Page | 92
Egypt Book 2011/12
January 26, 2012
Steel
Xxx
modification of [then] ANSDK’s logo to “Ezz Al Dekheila” in order to market and sell
his company’s [ESR’s] products as if they were products of the same company;
reducing EZDK’s production in order to boost his own company’s sales; selling
EZDK’s billets production to his company at preferential prices; and failure to repay
EZDK’s bank loans. Cairo Criminal court sentenced Mr. Ahmed Ezz and Eng. Amr
Assal, former IDA chairman to 10 years in prison along with fining them EGP660mn
for wasting public funds, and ordering the withdrawal of illegal production licenses
granted to ESRS and other four major producers Beshay Steel, Taybah Steel, Al-
Garhy Steel and National Steel.
The GoE reached a number of verdicts that will affect steel sector, including the
decision to have steel producers pay the value of previously illegally granted licenses
in order to retain them, at an amount of EGP350mn each on five year installments
with a 15% of the value as down payment. Thanks to this allowance, companies
should be able to maintain their expansion plans. In addition, the GoE approved
amendments to the anti-monopolistic law and raised the fine to a minimum of
EGP300mn, subject to increase based on the severity of the transgression.
Elsewhere, the GoE set out to commence a new energy pricing scheme in FY11/12,
with Egypt’s cabinet announcing the new pricing scheme for medium- and high-
intensive energy consumption industries, for which it plans to phase-out energy
subsidies. According to government officials, Egypt’s steel and cement industries will
see a 33% increase in natural gas charges to USD4/mmbtu, which is expected to
drive up the price of steel products.
Moreover, the demand for steel rebars has been hit by the lower demand for housing,
further dampened as major real estate developers Talaat Mostafa Group (TMGH)
and Palm Hills Development Company (PHDC) have been facing legal obstacles
concerned with the validity of land ownership contracts. The court ruled to halt the
sale of 33mn sqm to TMGH (66% of TMGH’s total land bank) for its mixed-use
Madinaty project, deeming the land acquisition agreement between TMGH and the
New Urban Communities Authority (NUCA) to be invalid, as it was not closed in
auction form. However, TMGH appealed the decision and in November 2011, the
court decided the validity of Madinaty contracts with the GoE, thus assuring the
company’s right to retain and develop it. Meanwhile, The New Urban Communities
(NUCA) cancelled its contract with Palm Hills Development over a land plot
amounting 190 feddans (equivalent to 798K sqm) in 6th of October city, which will
affect the company’s construction plans and therefore its demand for steel rebars.
Page | 93
Egypt Book 2011/12
January 26, 2012
Steel
Xxx
Figure 4.2.3 | Key events affecting steel market in 2011
Date Event
22-Nov-11 The Egyptian Administrative Court rules that Talaat Moustafa Group Holding’s[TMGH] Madinaty land bank contract with the GoE is valid, thereby assuring TMGH the right to maintain it.
09-Nov-11 The GoE and steel-producing companies (including ESRS) compromise to pay the value of withdrawn licenses, amounting to EGP1.2bn for all licenses, with a 15% down payment and a 1.5 year grace period, followed by equal installments over five years.
27-Sep-11 The GoE approves anti-monopoly law amendments and raises the fine to a minimum of EGP300mn. The fine is subject to increase based on the severity of the transgression.
15-Sep-11 The court decision regarding irregularities in the granting of steel licenses to Ezz Steel [ESRS] results in the withdrawal of all illegally-granted licenses to steel producers including ESRS, Beshay Steel, Taybah Steel, Al-Garhy Steel and National Steel. Mr. Ahmed Ezz, former chairman of ESRS, and Eng. AmrAssal, former chairman of IDA are sentenced to 10 years in prison and fined together an amount of EGP660mn for wasting public funds. Eng. Rashid Mohammed Rashid, former Minister of Trade & Industry is sentenced to 15 years in prison and charged with EGP1.414bn fine for wasting public funds.
07-Apr-11 The New Urban Communities Authority (NUCA) decided to cancel its land contract with Palm Hills Development Company (PHD) for a land plot amounting 190 feddans, equivalent to 798K sqm in 6th of October city.
Source: CICR Database
Rebars Steel rebars production witnessed an estimated YoY decline of 8.2% in 2011,
reaching 6mn tons, down from 6.5mn tons in 2010. This decline was due to the
slowdown of construction activity amidst the unrest following the January 25
Revolution. Construction permits declined by 35% YoY in 1H11 to reach 27.4K, down
from 42K permits in 2010. Although official construction permits showed this drastic
decline, a number of construction activities went on illegally, as the lack of land
regulations during early 2011 lead to numerous agricultural land violations in a
throughout rural governorates of the Delta area, especially in Dakahleya. Some
farmers took advantage of the instability to build housing units on agricultural land,
which in one way or another increased the demand on steel rebars
According to Egyptian Information Portal (EIP), demand for steel rebars dropped by
8.4% YoY in 2011. The reason for this decline is twofold – with the current slowdown
in economic activity harming demand, and the increase in steel prices further
dampening it. Domestic retail prices grew by 20% YoY, reaching EGP4,804/ton in
September 2011, up from EGP4,017/ton in September 2010, as a result of the
growing price of raw materials – namely, crude steel, which witnessed a 17%YoY
growth, reaching USD190.5/ton in September 2011. As a result of the declining price
of global crude steel in October (falling to USD144.5/ton), and the declining demand
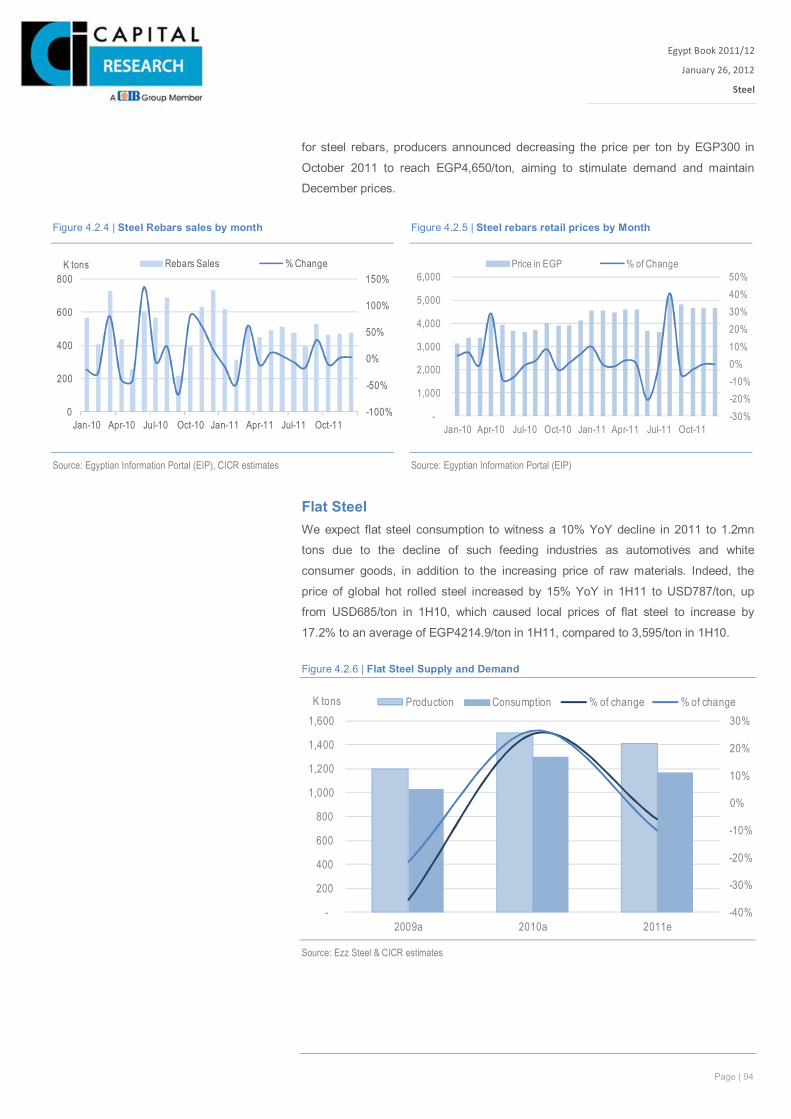
Page | 94
Egypt Book 2011/12
January 26, 2012
Steel
Xxx
for steel rebars, producers announced decreasing the price per ton by EGP300 in
October 2011 to reach EGP4,650/ton, aiming to stimulate demand and maintain
December prices.
Flat Steel We expect flat steel consumption to witness a 10% YoY decline in 2011 to 1.2mn
tons due to the decline of such feeding industries as automotives and white
consumer goods, in addition to the increasing price of raw materials. Indeed, the
price of global hot rolled steel increased by 15% YoY in 1H11 to USD787/ton, up
from USD685/ton in 1H10, which caused local prices of flat steel to increase by
17.2% to an average of EGP4214.9/ton in 1H11, compared to 3,595/ton in 1H10.
Figure 4.2.6 | Flat Steel Supply and Demand
Source: Ezz Steel & CICR estimates
-40%
-30%
-20%
-10%
0%
10%
20%
30%
-
200
400
600
800
1,000
1,200
1,400
1,600
2009a 2010a 2011e
K tons Production Consumption % of change % of change
Figure 4.2.4 | Steel Rebars sales by month Figure 4.2.5 | Steel rebars retail prices by Month
Source: Egyptian Information Portal (EIP), CICR estimates
Source: Egyptian Information Portal (EIP)
-100%
-50%
0%
50%
100%
150%
0
200
400
600
800
Jan-10 Apr-10 Jul-10 Oct-10 Jan-11 Apr-11 Jul-11 Oct-11
K tons Rebars Sales % Change
-30%-20%-10%0%10%20%30%40%50%
-
1,000
2,000
3,000
4,000
5,000
6,000
Jan-10 Apr-10 Jul-10 Oct-10 Jan-11 Apr-11 Jul-11 Oct-11
Price in EGP % of Change
Page | 95
Egypt Book 2011/12
January 26, 2012
Steel
Xxx
2012 Preview Demand for steel rebars is expected to take its first steps towards recovery late 2012
with the expected improvement in the local economic and political situation, and the
breaking-ground on a number of new construction activities, including the GoE plan
to establish new residential units for low and middle income citizens as part of its
social housing plan.
Elsewhere, Talaat Moustafa Group Holding’s [TMGH] Madinaty land bank contract
validity with the Government of Egypt will enable the company to complete the
project, which will increase the demand for steel rebars for construction.
Moreover, the GoE plan to invest in infrastructure is expected to raise the demand for
steel products, as it announced issuing four PPP projects over the short-term with
investment cost of EGP13.8bn in the health, transport and drainage services.
Local demand for flat steel is expected to witness further improvement in 2012 led by
a forecasted 16% growth of automotives market, which is expected to reach 102K
units in 2012 up from 88.3K units in 2011
Regarding steel prices, we expect changes from 2011 figures given the minimal
growth in demand during the 1H12. However, prices could rise in 2H12 with the
expected increase in local demand for steel alongside an improved macro picture, in
addition to the increase of crude steel price by an average of USD165/ton, up from
USDR163/ton in 1H12, and the increase in energy prices to EGP4/mmbtu.
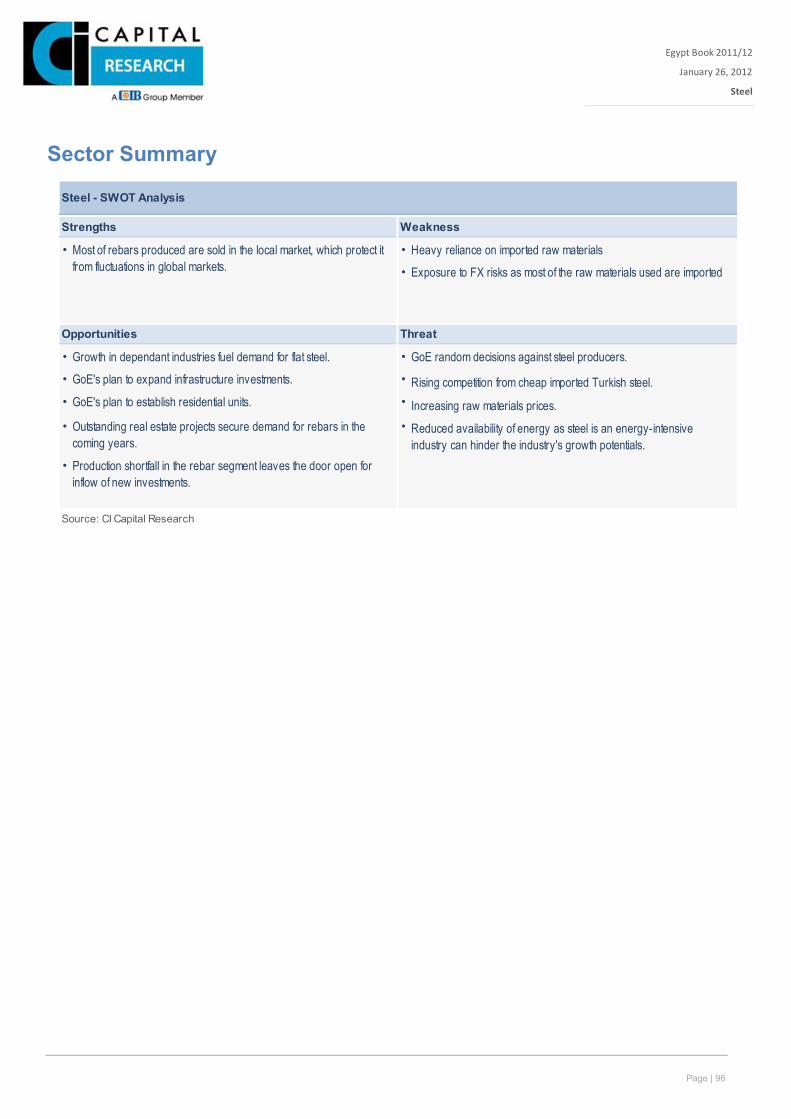
Page | 96
Egypt Book 2011/12
January 26, 2012
Steel
Xxx
Sector Summary
Steel - SWOT Analysis
Strengths Weakness
• • Heavy reliance on imported raw materials• Exposure to FX risks as most of the raw materials used are imported
Opportunities Threat
• Growth in dependant industries fuel demand for flat steel. • GoE random decisions against steel producers.• GoE's plan to expand infrastructure investments. • Rising competition from cheap imported Turkish steel.• GoE's plan to establish residential units. • Increasing raw materials prices.• •
• Production shortfall in the rebar segment leaves the door open for inflow of new investments.
Source: CI Capital Research
Outstanding real estate projects secure demand for rebars in the coming years.
Reduced availability of energy as steel is an energy-intensive industry can hinder the industry's growth potentials.
Most of rebars produced are sold in the local market, which protect it from fluctuations in global markets.
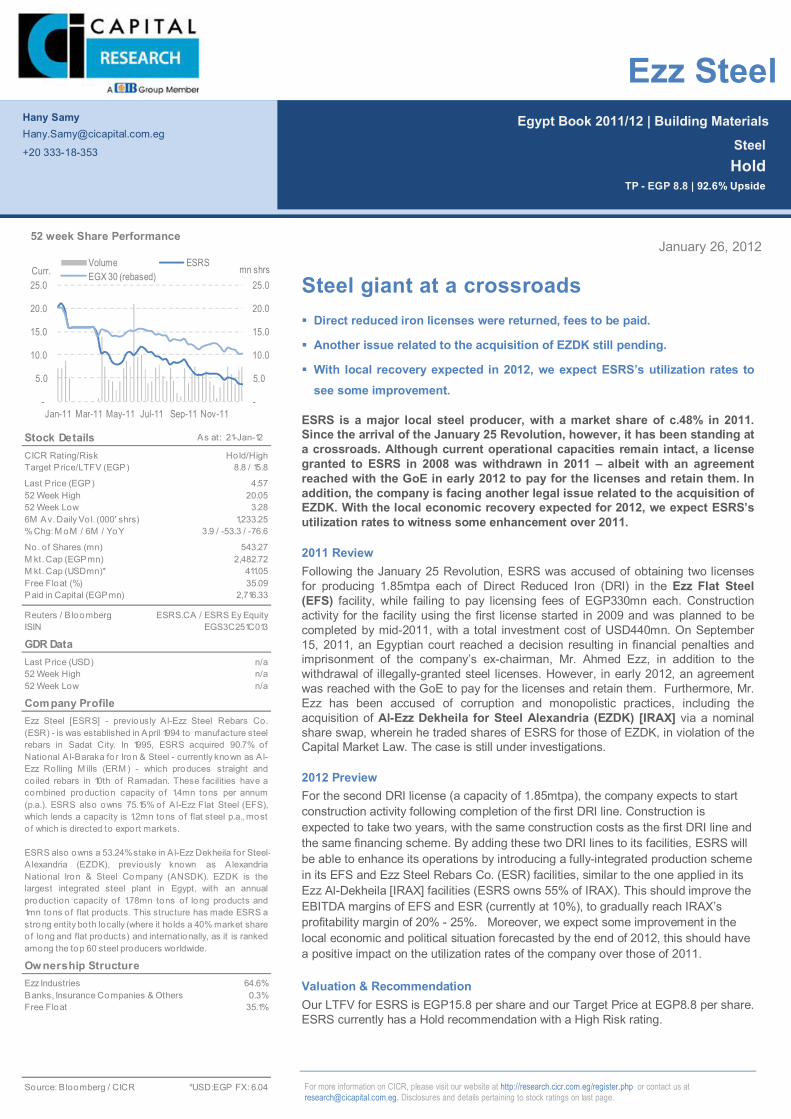
Page | 89
Egypt Book 2011/12 | Building Materials
For more information on CICR, please visit our website at http://research.cicr.com.eg/register.php or contact us at [email protected]. Disclosures and details pertaining to stock ratings on last page.
January 26, 2012
Steel giant at a crossroads Direct reduced iron licenses were returned, fees to be paid.
Another issue related to the acquisition of EZDK still pending.
With local recovery expected in 2012, we expect ESRS’s utilization rates to see some improvement.
ESRS is a major local steel producer, with a market share of c.48% in 2011. Since the arrival of the January 25 Revolution, however, it has been standing at a crossroads. Although current operational capacities remain intact, a license granted to ESRS in 2008 was withdrawn in 2011 – albeit with an agreement reached with the GoE in early 2012 to pay for the licenses and retain them. In addition, the company is facing another legal issue related to the acquisition of EZDK. With the local economic recovery expected for 2012, we expect ESRS’s utilization rates to witness some enhancement over 2011.
2011 Review Following the January 25 Revolution, ESRS was accused of obtaining two licenses for producing 1.85mtpa each of Direct Reduced Iron (DRI) in the Ezz Flat Steel (EFS) facility, while failing to pay licensing fees of EGP330mn each. Construction activity for the facility using the first license started in 2009 and was planned to be completed by mid-2011, with a total investment cost of USD440mn. On September 15, 2011, an Egyptian court reached a decision resulting in financial penalties and imprisonment of the company’s ex-chairman, Mr. Ahmed Ezz, in addition to the withdrawal of illegally-granted steel licenses. However, in early 2012, an agreement was reached with the GoE to pay for the licenses and retain them. Furthermore, Mr. Ezz has been accused of corruption and monopolistic practices, including the acquisition of Al-Ezz Dekheila for Steel Alexandria (EZDK) [IRAX] via a nominal share swap, wherein he traded shares of ESRS for those of EZDK, in violation of the Capital Market Law. The case is still under investigations.
2012 Preview For the second DRI license (a capacity of 1.85mtpa), the company expects to start construction activity following completion of the first DRI line. Construction is expected to take two years, with the same construction costs as the first DRI line and the same financing scheme. By adding these two DRI lines to its facilities, ESRS will be able to enhance its operations by introducing a fully-integrated production scheme in its EFS and Ezz Steel Rebars Co. (ESR) facilities, similar to the one applied in its Ezz Al-Dekheila [IRAX] facilities (ESRS owns 55% of IRAX). This should improve the EBITDA margins of EFS and ESR (currently at 10%), to gradually reach IRAX’s profitability margin of 20% - 25%. Moreover, we expect some improvement in the local economic and political situation forecasted by the end of 2012, this should have a positive impact on the utilization rates of the company over those of 2011.
Valuation & Recommendation Our LTFV for ESRS is EGP15.8 per share and our Target Price at EGP8.8 per share. ESRS currently has a Hold recommendation with a High Risk rating.
Hany Samy [email protected]
+20 333-18-353
Steel Hold
TP - EGP 8.8 | 92.6% Upside
Ezz Steel
Stock Details As at: 21-Jan-12
CICR Rating/RiskTarget Price/LTFV (EGP)
Last Price (EGP)52 Week High52 Week Low6M Av. Daily Vo l. (000' shrs)% Chg: M oM / 6M / YoY
No. of Shares (mn)M kt. Cap (EGPmn)M kt. Cap (USDmn)*Free Float (%)Paid in Capital (EGPmn)
Reuters / B loombergISIN
GDR DataLast Price (USD)52 Week High52 Week Low
Company Profile
Ow nership StructureEzz Industries 64.6%Banks, Insurance Companies & Others 0.3%Free Float 35.1%
Source: Bloomberg / CICR *USD:EGP FX: 6.04
Ezz Steel [ESRS] - previously Al-Ezz Steel Rebars Co.(ESR) - is was established in April 1994 to manufacture steelrebars in Sadat City. In 1995, ESRS acquired 90.7% ofNational A l-Baraka for Iron & Steel - currently known as Al-Ezz Rolling M ills (ERM ) - which produces straight andco iled rebars in 10th of Ramadan. These facilities have acombined production capacity o f 1.4mn tons per annum(p.a.). ESRS also owns 75.15% of Al-Ezz Flat Steel (EFS),which lends a capacity is 1.2mn tons of flat steel p.a., mosto f which is directed to export markets.
ESRS also owns a 53.24% stake in A l-Ezz Dekheila for Steel- A lexandria (EZDK), previously known as AlexandriaNational Iron & Steel Company (ANSDK). EZDK is thelargest integrated steel plant in Egypt, with an annualproduction capacity o f 1.78mn tons of long products and1mn tons of flat products. This structure has made ESRS astrong entity both locally (where it ho lds a 40% market shareof long and flat products) and internationally, as it is rankedamong the top 60 steel producers worldwide.
20.053.28
543.27
1,233.25
ESRS.CA / ESRS Ey Equity
411.05
3.9 / -53.3 / -76.6
2,716.33
2,482.72
n/an/a
35.09
EGS3C251C013
n/a
8.8 / 15.8
4.57
Hold/High
-
5.0
10.0
15.0
20.0
25.0
-
5.0
10.0
15.0
20.0
25.0
Jan-11 Mar-11 May-11 Jul-11 Sep-11 Nov-11
mn shrsCurr.Volume ESRSEGX 30 (rebased)
52 week Share Performance
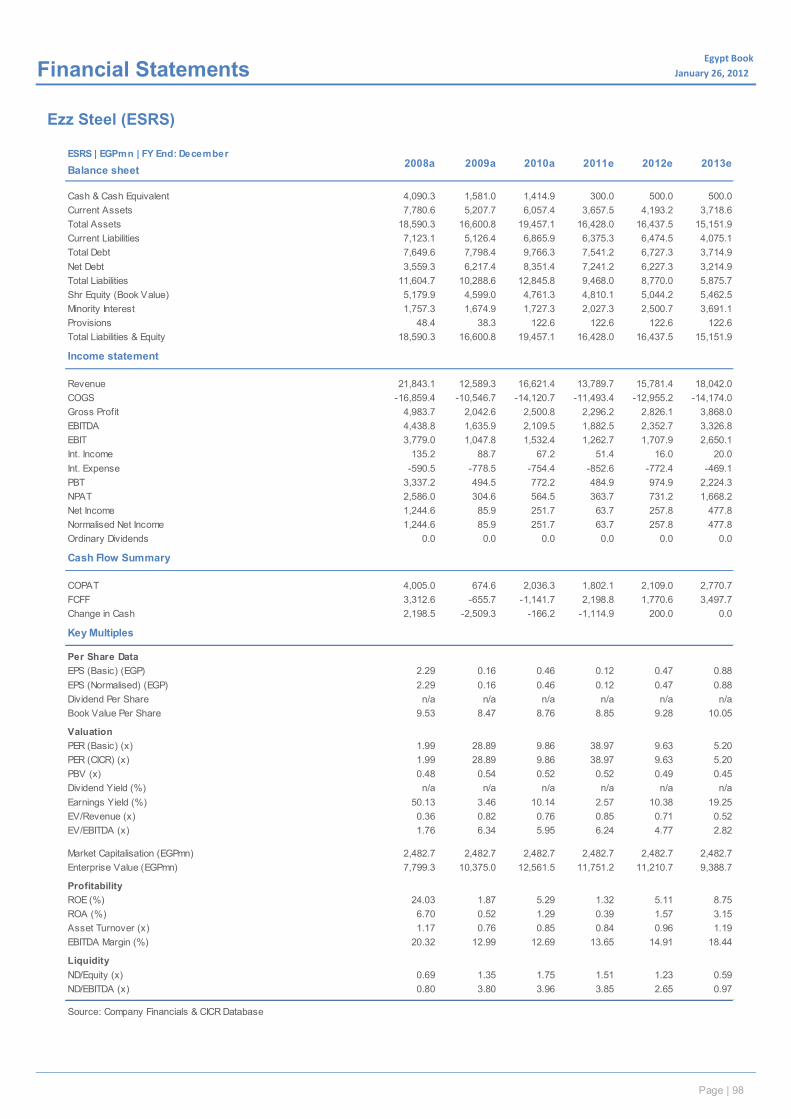
Page | 90
Egypt Book January 26, 2012x Financial Statements
Ezz Steel (ESRS)
ESRS | EGPmn | FY End: December
Balance sheet
Cash & Cash Equivalent 4,090.3 1,581.0 1,414.9 300.0 500.0 500.0Current Assets 7,780.6 5,207.7 6,057.4 3,657.5 4,193.2 3,718.6Total Assets 18,590.3 16,600.8 19,457.1 16,428.0 16,437.5 15,151.9Current Liabilities 7,123.1 5,126.4 6,865.9 6,375.3 6,474.5 4,075.1Total Debt 7,649.6 7,798.4 9,766.3 7,541.2 6,727.3 3,714.9Net Debt 3,559.3 6,217.4 8,351.4 7,241.2 6,227.3 3,214.9Total Liabilities 11,604.7 10,288.6 12,845.8 9,468.0 8,770.0 5,875.7Shr Equity (Book Value) 5,179.9 4,599.0 4,761.3 4,810.1 5,044.2 5,462.5Minority Interest 1,757.3 1,674.9 1,727.3 2,027.3 2,500.7 3,691.1Provisions 48.4 38.3 122.6 122.6 122.6 122.6Total Liabilities & Equity 18,590.3 16,600.8 19,457.1 16,428.0 16,437.5 15,151.9
Income statement
Revenue 21,843.1 12,589.3 16,621.4 13,789.7 15,781.4 18,042.0COGS -16,859.4 -10,546.7 -14,120.7 -11,493.4 -12,955.2 -14,174.0Gross Profit 4,983.7 2,042.6 2,500.8 2,296.2 2,826.1 3,868.0EBITDA 4,438.8 1,635.9 2,109.5 1,882.5 2,352.7 3,326.8EBIT 3,779.0 1,047.8 1,532.4 1,262.7 1,707.9 2,650.1Int. Income 135.2 88.7 67.2 51.4 16.0 20.0Int. Expense -590.5 -778.5 -754.4 -852.6 -772.4 -469.1PBT 3,337.2 494.5 772.2 484.9 974.9 2,224.3NPAT 2,586.0 304.6 564.5 363.7 731.2 1,668.2Net Income 1,244.6 85.9 251.7 63.7 257.8 477.8Normalised Net Income 1,244.6 85.9 251.7 63.7 257.8 477.8Ordinary Dividends 0.0 0.0 0.0 0.0 0.0 0.0
Cash Flow Summary
COPAT 4,005.0 674.6 2,036.3 1,802.1 2,109.0 2,770.7FCFF 3,312.6 -655.7 -1,141.7 2,198.8 1,770.6 3,497.7Change in Cash 2,198.5 -2,509.3 -166.2 -1,114.9 200.0 0.0
Key Multiples
Per Share DataEPS (Basic) (EGP) 2.29 0.16 0.46 0.12 0.47 0.88EPS (Normalised) (EGP) 2.29 0.16 0.46 0.12 0.47 0.88Dividend Per Share n/a n/a n/a n/a n/a n/aBook Value Per Share 9.53 8.47 8.76 8.85 9.28 10.05
ValuationPER (Basic) (x) 1.99 28.89 9.86 38.97 9.63 5.20PER (CICR) (x) 1.99 28.89 9.86 38.97 9.63 5.20PBV (x) 0.48 0.54 0.52 0.52 0.49 0.45Dividend Yield (%) n/a n/a n/a n/a n/a n/aEarnings Yield (%) 50.13 3.46 10.14 2.57 10.38 19.25EV/Revenue (x) 0.36 0.82 0.76 0.85 0.71 0.52EV/EBITDA (x) 1.76 6.34 5.95 6.24 4.77 2.82
Market Capitalisation (EGPmn) 2,482.7 2,482.7 2,482.7 2,482.7 2,482.7 2,482.7Enterprise Value (EGPmn) 7,799.3 10,375.0 12,561.5 11,751.2 11,210.7 9,388.7
ProfitabilityROE (%) 24.03 1.87 5.29 1.32 5.11 8.75ROA (%) 6.70 0.52 1.29 0.39 1.57 3.15Asset Turnover (x) 1.17 0.76 0.85 0.84 0.96 1.19EBITDA Margin (%) 20.32 12.99 12.69 13.65 14.91 18.44
LiquidityND/Equity (x) 0.69 1.35 1.75 1.51 1.23 0.59ND/EBITDA (x) 0.80 3.80 3.96 3.85 2.65 0.97
Source: Company Financials & CICR Database
2008a 2009a 2010a 2011e 2012e 2013e
Page | 98
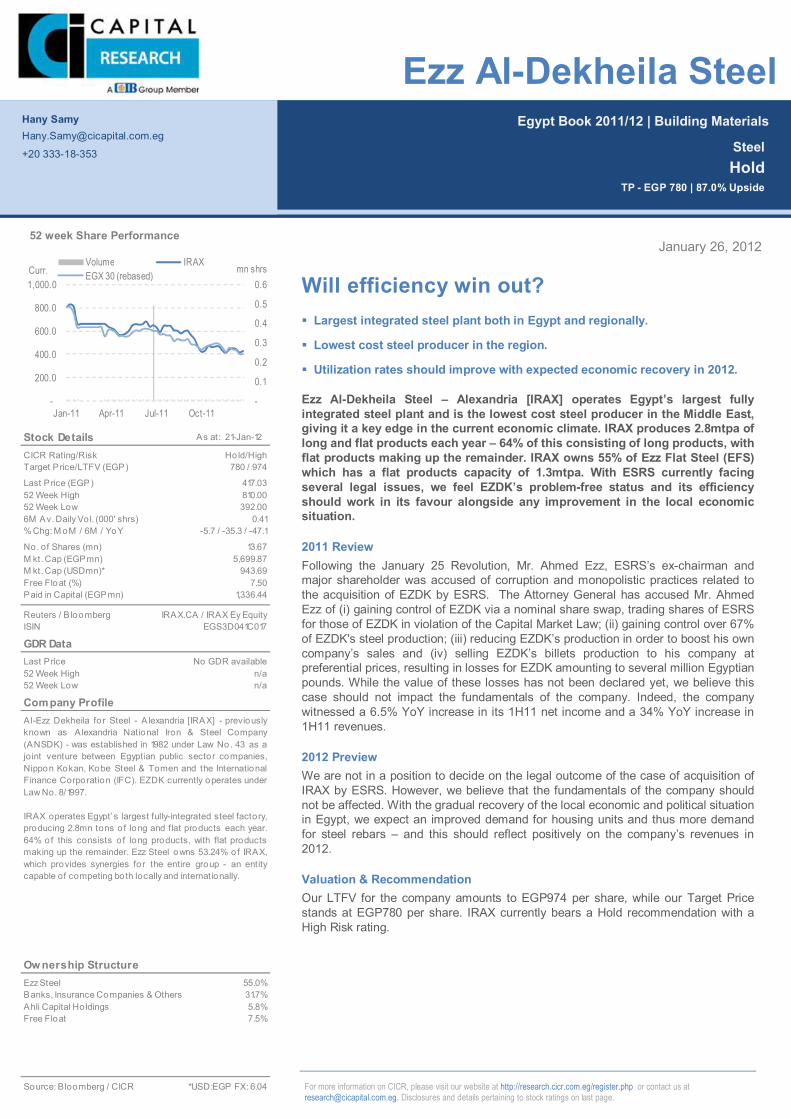
Page | 91
Egypt Book 2011/12 | Building Materials
For more information on CICR, please visit our website at http://research.cicr.com.eg/register.php or contact us at [email protected]. Disclosures and details pertaining to stock ratings on last page.
January 26, 2012
Will efficiency win out? Largest integrated steel plant both in Egypt and regionally.
Lowest cost steel producer in the region.
Utilization rates should improve with expected economic recovery in 2012.
Ezz Al-Dekheila Steel – Alexandria [IRAX] operates Egypt’s largest fully integrated steel plant and is the lowest cost steel producer in the Middle East, giving it a key edge in the current economic climate. IRAX produces 2.8mtpa of long and flat products each year – 64% of this consisting of long products, with flat products making up the remainder. IRAX owns 55% of Ezz Flat Steel (EFS) which has a flat products capacity of 1.3mtpa. With ESRS currently facing several legal issues, we feel EZDK’s problem-free status and its efficiency should work in its favour alongside any improvement in the local economic situation.
2011 Review Following the January 25 Revolution, Mr. Ahmed Ezz, ESRS’s ex-chairman and major shareholder was accused of corruption and monopolistic practices related to the acquisition of EZDK by ESRS. The Attorney General has accused Mr. Ahmed Ezz of (i) gaining control of EZDK via a nominal share swap, trading shares of ESRS for those of EZDK in violation of the Capital Market Law; (ii) gaining control over 67% of EZDK's steel production; (iii) reducing EZDK’s production in order to boost his own company’s sales and (iv) selling EZDK’s billets production to his company at preferential prices, resulting in losses for EZDK amounting to several million Egyptian pounds. While the value of these losses has not been declared yet, we believe this case should not impact the fundamentals of the company. Indeed, the company witnessed a 6.5% YoY increase in its 1H11 net income and a 34% YoY increase in 1H11 revenues.
2012 Preview We are not in a position to decide on the legal outcome of the case of acquisition of IRAX by ESRS. However, we believe that the fundamentals of the company should not be affected. With the gradual recovery of the local economic and political situation in Egypt, we expect an improved demand for housing units and thus more demand for steel rebars – and this should reflect positively on the company’s revenues in 2012.
Valuation & Recommendation Our LTFV for the company amounts to EGP974 per share, while our Target Price stands at EGP780 per share. IRAX currently bears a Hold recommendation with a High Risk rating.
Hany Samy [email protected]
+20 333-18-353
Steel Hold
TP - EGP 780 | 87.0% Upside
Ezz Al-Dekheila Steel
Stock Details As at: 21-Jan-12
CICR Rating/RiskTarget Price/LTFV (EGP)
Last Price (EGP)52 Week High52 Week Low6M Av. Daily Vo l. (000' shrs)% Chg: M oM / 6M / YoY
No. of Shares (mn)M kt. Cap (EGPmn)M kt. Cap (USDmn)*Free Float (%)Paid in Capital (EGPmn)
Reuters / B loombergISIN
GDR DataLast Price52 Week High52 Week Low
Company Profile
Ow nership StructureEzz Steel 55.0%Banks, Insurance Companies & Others 31.7%Ahli Capital Ho ldings 5.8%Free Float 7.5%
Source: Bloomberg / CICR *USD:EGP FX: 6.04
Al-Ezz Dekheila fo r Steel - A lexandria [IRAX] - previouslyknown as Alexandria National Iron & Steel Company(ANSDK) - was established in 1982 under Law No. 43 as ajoint venture between Egyptian public sector companies,Nippon Kokan, Kobe Steel & Tomen and the InternationalFinance Corporation (IFC). EZDK currently operates underLaw No. 8/1997.
IRAX operates Egypt’ s largest fully-integrated steel factory,producing 2.8mn tons of long and flat products each year.64% of this consists o f long products, with flat productsmaking up the remainder. Ezz Steel owns 53.24% of IRAX,which provides synergies for the entire group - an entitycapable of competing bo th locally and internationally.
810.00392.00
13.67
0.41
IRAX.CA / IRAX Ey Equity
943.69
-5.7 / -35.3 / -47.1
1,336.44
5,699.87
No GDR availablen/a
7.50
EGS3D041C017
n/a
780 / 974
417.03
Hold/High
-
0.1
0.2
0.3
0.4
0.5
0.6
-
200.0
400.0
600.0
800.0
1,000.0
Jan-11 Apr-11 Jul-11 Oct-11
mn shrsCurr.Volume IRAXEGX 30 (rebased)
52 week Share Performance
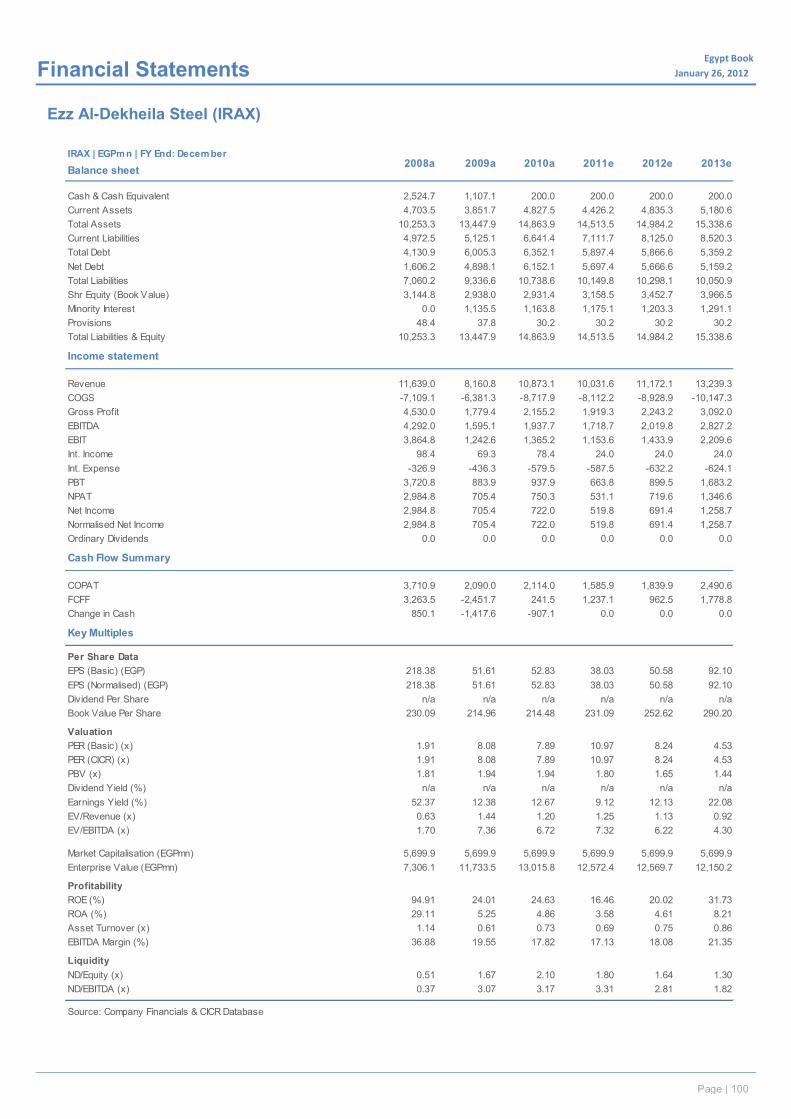
Page | 92
Egypt Book January 26, 2012x Financial Statements
Ezz Al-Dekheila Steel (IRAX)
IRAX | EGPmn | FY End: December
Balance sheet
Cash & Cash Equivalent 2,524.7 1,107.1 200.0 200.0 200.0 200.0Current Assets 4,703.5 3,851.7 4,827.5 4,426.2 4,835.3 5,180.6Total Assets 10,253.3 13,447.9 14,863.9 14,513.5 14,984.2 15,338.6Current Liabilities 4,972.5 5,125.1 6,641.4 7,111.7 8,125.0 8,520.3Total Debt 4,130.9 6,005.3 6,352.1 5,897.4 5,866.6 5,359.2Net Debt 1,606.2 4,898.1 6,152.1 5,697.4 5,666.6 5,159.2Total Liabilities 7,060.2 9,336.6 10,738.6 10,149.8 10,298.1 10,050.9Shr Equity (Book Value) 3,144.8 2,938.0 2,931.4 3,158.5 3,452.7 3,966.5Minority Interest 0.0 1,135.5 1,163.8 1,175.1 1,203.3 1,291.1Provisions 48.4 37.8 30.2 30.2 30.2 30.2Total Liabilities & Equity 10,253.3 13,447.9 14,863.9 14,513.5 14,984.2 15,338.6
Income statement
Revenue 11,639.0 8,160.8 10,873.1 10,031.6 11,172.1 13,239.3COGS -7,109.1 -6,381.3 -8,717.9 -8,112.2 -8,928.9 -10,147.3Gross Profit 4,530.0 1,779.4 2,155.2 1,919.3 2,243.2 3,092.0EBITDA 4,292.0 1,595.1 1,937.7 1,718.7 2,019.8 2,827.2EBIT 3,864.8 1,242.6 1,365.2 1,153.6 1,433.9 2,209.6Int. Income 98.4 69.3 78.4 24.0 24.0 24.0Int. Expense -326.9 -436.3 -579.5 -587.5 -632.2 -624.1PBT 3,720.8 883.9 937.9 663.8 899.5 1,683.2NPAT 2,984.8 705.4 750.3 531.1 719.6 1,346.6Net Income 2,984.8 705.4 722.0 519.8 691.4 1,258.7Normalised Net Income 2,984.8 705.4 722.0 519.8 691.4 1,258.7Ordinary Dividends 0.0 0.0 0.0 0.0 0.0 0.0
Cash Flow Summary
COPAT 3,710.9 2,090.0 2,114.0 1,585.9 1,839.9 2,490.6FCFF 3,263.5 -2,451.7 241.5 1,237.1 962.5 1,778.8Change in Cash 850.1 -1,417.6 -907.1 0.0 0.0 0.0
Key Multiples
Per Share DataEPS (Basic) (EGP) 218.38 51.61 52.83 38.03 50.58 92.10EPS (Normalised) (EGP) 218.38 51.61 52.83 38.03 50.58 92.10Dividend Per Share n/a n/a n/a n/a n/a n/aBook Value Per Share 230.09 214.96 214.48 231.09 252.62 290.20
ValuationPER (Basic) (x) 1.91 8.08 7.89 10.97 8.24 4.53PER (CICR) (x) 1.91 8.08 7.89 10.97 8.24 4.53PBV (x) 1.81 1.94 1.94 1.80 1.65 1.44Dividend Yield (%) n/a n/a n/a n/a n/a n/aEarnings Yield (%) 52.37 12.38 12.67 9.12 12.13 22.08EV/Revenue (x) 0.63 1.44 1.20 1.25 1.13 0.92EV/EBITDA (x) 1.70 7.36 6.72 7.32 6.22 4.30
Market Capitalisation (EGPmn) 5,699.9 5,699.9 5,699.9 5,699.9 5,699.9 5,699.9Enterprise Value (EGPmn) 7,306.1 11,733.5 13,015.8 12,572.4 12,569.7 12,150.2
ProfitabilityROE (%) 94.91 24.01 24.63 16.46 20.02 31.73ROA (%) 29.11 5.25 4.86 3.58 4.61 8.21Asset Turnover (x) 1.14 0.61 0.73 0.69 0.75 0.86EBITDA Margin (%) 36.88 19.55 17.82 17.13 18.08 21.35
LiquidityND/Equity (x) 0.51 1.67 2.10 1.80 1.64 1.30ND/EBITDA (x) 0.37 3.07 3.17 3.31 2.81 1.82
Source: Company Financials & CICR Database
2008a 2009a 2010a 2011e 2012e 2013e
Page | 100
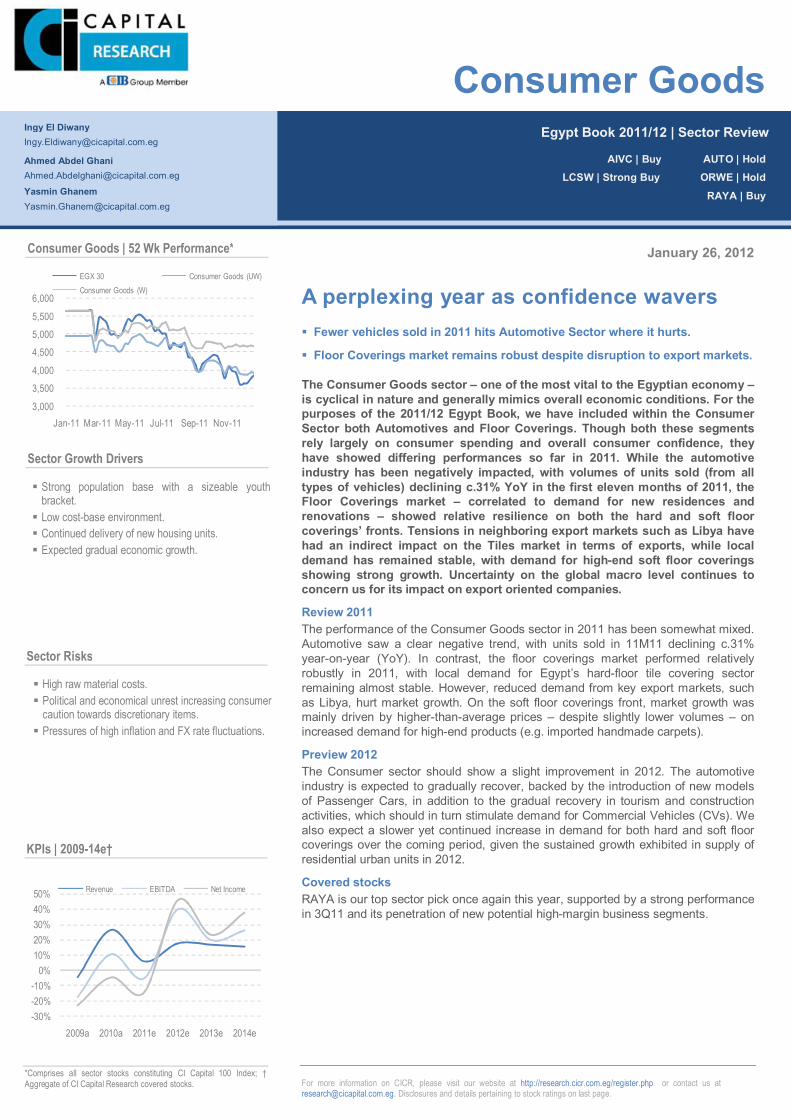
Page | 101
Page | 101
For more information on CICR, please visit our website at http://research.cicr.com.eg/register.php or contact us at [email protected]. Disclosures and details pertaining to stock ratings on last page.
January 26, 2012
A perplexing year as confidence wavers Fewer vehicles sold in 2011 hits Automotive Sector where it hurts.
Floor Coverings market remains robust despite disruption to export markets.
The Consumer Goods sector – one of the most vital to the Egyptian economy – is cyclical in nature and generally mimics overall economic conditions. For the purposes of the 2011/12 Egypt Book, we have included within the Consumer Sector both Automotives and Floor Coverings. Though both these segments rely largely on consumer spending and overall consumer confidence, they have showed differing performances so far in 2011. While the automotive industry has been negatively impacted, with volumes of units sold (from all types of vehicles) declining c.31% YoY in the first eleven months of 2011, the Floor Coverings market – correlated to demand for new residences and renovations – showed relative resilience on both the hard and soft floor coverings’ fronts. Tensions in neighboring export markets such as Libya have had an indirect impact on the Tiles market in terms of exports, while local demand has remained stable, with demand for high-end soft floor coverings showing strong growth. Uncertainty on the global macro level continues to concern us for its impact on export oriented companies.
Review 2011 The performance of the Consumer Goods sector in 2011 has been somewhat mixed. Automotive saw a clear negative trend, with units sold in 11M11 declining c.31% year-on-year (YoY). In contrast, the floor coverings market performed relatively robustly in 2011, with local demand for Egypt’s hard-floor tile covering sector remaining almost stable. However, reduced demand from key export markets, such as Libya, hurt market growth. On the soft floor coverings front, market growth was mainly driven by higher-than-average prices – despite slightly lower volumes – on increased demand for high-end products (e.g. imported handmade carpets).
Preview 2012 The Consumer sector should show a slight improvement in 2012. The automotive industry is expected to gradually recover, backed by the introduction of new models of Passenger Cars, in addition to the gradual recovery in tourism and construction activities, which should in turn stimulate demand for Commercial Vehicles (CVs). We also expect a slower yet continued increase in demand for both hard and soft floor coverings over the coming period, given the sustained growth exhibited in supply of residential urban units in 2012.
Covered stocks RAYA is our top sector pick once again this year, supported by a strong performance in 3Q11 and its penetration of new potential high-margin business segments.
Egypt Book 2011/12 | Sector Review
Consumer Goods
AIVC | Buy AUTO | Hold LCSW | Strong Buy ORWE | Hold
RAYA | Buy
Ingy El Diwany [email protected]
Ahmed Abdel Ghani [email protected]
Yasmin Ghanem [email protected]
Strong population base with a sizeable youth bracket. Low cost-base environment. Continued delivery of new housing units. Expected gradual economic growth.
High raw material costs. Political and economical unrest increasing consumer
caution towards discretionary items. Pressures of high inflation and FX rate fluctuations.
Consumer Goods | 52 Wk Performance*
3,000
3,500 4,000
4,500 5,000 5,500
6,000
Jan-11 Mar-11 May-11 Jul-11 Sep-11 Nov-11
EGX 30 Consumer Goods (UW)Consumer Goods (W)
Sector Growth Drivers
Sector Risks
-30%-20%-10%
0%10%20%30%40%50%
2009a 2010a 2011e 2012e 2013e 2014e
Revenue EBITDA Net Income
KPIs | 2009-14e†
*Comprises all sector stocks constituting CI Capital 100 Index; † Aggregate of CI Capital Research covered stocks.
Page | 102
Egypt Book 2011/12
January 26, 2012
Consumer Goods
Xxx
Automotive Vehicle sales hit by political instability in a tough year for sector
Egypt’s automotive sector has experienced a turbulent environment this year in the
wake of the January 25 Revolution. Though vehicles sales posted a drop of
c.31%YoY to November 2011 – the sharpest decline came in February (a drop of
73%), with the following months seeing softer declines, albeit still in double-digits.
Political instability caused depressed growth in private spending, as demand for big
tickets was undermined. Tight lending conditions; rising inflation – namely in the first
7 months of 2011; high unemployment; and the massive loss of wealth from the
decline in the stock market hit the automotive market. On the back of an expected
gradual improved economic performance towards the end of 2012, in addition to the
launching of new models, we forecast total aggregate automotive market sales units
to increase YoY over our 2011e forecast by 16.5% to 228,247 units, driven mainly by
expected 18% YoY increase in Passenger Cars (PCs).
2011 Review The first eleven months of 2011 sales witnessed a strong decline of c.31% Year-on-
year (YoY) down to 158,446 units from all vehicles due to the effect of the political
unrest events in Egypt. PCs witnessed a 32% YoY decline to 119,490 units whilst
total commercial vehicles (buses and trucks) witnessed a 25% YoY decline to 38,956
units. We estimate that PCs sales in 2011 will reach 158,135 units compared to
192,848 units in 2010 – an 18% decline, while CV will reach 37,861 units, posting a
decline of 32.5%YoY in 2011.
Figure 5.1 | Automotive – Key Developments 2011
Date Event Impact
January Reduced custom duties In accordance with Egyptian-European and Egyptian-Turkish Trade Agreements, the Egyptian Customs Authority (ECA) decreases customs duties on vehicles of European and Turkish origin by 10% each. This marks the second phase in decreasing European vehicles customs (to reach nil by 2019), and the first phase in decreasing the Turkish vehicles customs (to reach nil by 2020).
These reductions in customs duties should have no effect on our covered stock, GB Auto, as Turkish and the European vehicles represent a small portion from the automotive sales market in Egypt. European vehicle demand remains limited by its high prices.
February Drawbar license extended Ex-Prime Minister Dr. Ahmed Shafik extends the drawbar license for an additional year.
This marks the second extension of the drawbar license following parliament decisions in June 2010 to extend the license for two years until August 2012. Many automotive companies have protested the cancelation of this project due to their high levels of investment in it.
Relevant trade agreements. Low labor cost holds the key to a growing industry. Expected improved economic performance towards
the end of 2012.
Automotive Sector | Growth Drivers
New UNECE safety regulations will require adjustments to production plans. Pressures of high inflation and FX rate
fluctuations. Political and economic unrest increasing
consumer caution towards big purchases. High customs’ tariffs compared to other regional
countries.
Automotive Sector | Risks
Page | 103
Egypt Book 2011/12
January 26, 2012
Consumer Goods
Xxx
March Automotive incentives strategy postponed The Ministry of Trade and Industry (MTI) decides to postpone the GoE’s automotive incentives strategy due to changed budgetary priorities post-revolution. The strategy would support local automotive manufacturing by raising Egypt’s production share of the locally manufactured vehicles over 45%; it had been planned to start in February 2011, with total incentives expected to reach EGP1.5bn.
This should have a negative effect on the auto-feeding industry, as the strategy was intended to partially offset the gradual elimination of custom duties on imported completely built up (CBU) vehicles.
September CPA proposes new component committee The Consumer Protection Agency (CPA) suggests establishing a committee from the Ministry of Trade & Industry (MTI), Ministry of Finance (MoF) and Ministry of Foreign Affairs (MFA) to apply 45 new international automotive component specifications (out of 126 components that are included in the UNECE Agreement).
This should have a positive effect on the global automotive industry, and the Egyptian economy in particular, as the Egyptian automotive industry lacks international safety regulations for vehicles. It should also facilitate trade between signatory parties in the agreement.
2012 Preview In 2012, we expect the market to remain depressed. However, an improved
performance will be seen towards the second half of the year – with political stability
expected to return. Passenger Cars (PCs) total sales volume is expected to increase
YoY over 2011e by 18% to reach 186,600 units whilst total commercial vehicles
(buses and trucks) are expected to see a 10% increase over 2011e to reach 41,647
units. According to the Egyptian-European Trade Agreement, the third phase for
reducing the customs' duties on the European PC took place in January 2012 – with
10% reduction. This will have its impact on European cars only (on vehicles till
1600cc) which represents a minimal contribution to the market - as we believe the full
potential of such reductions will not be felt before 2015. However, this agreement
could jeopardize the future development of the local assembly industry for PCs in
Egypt.
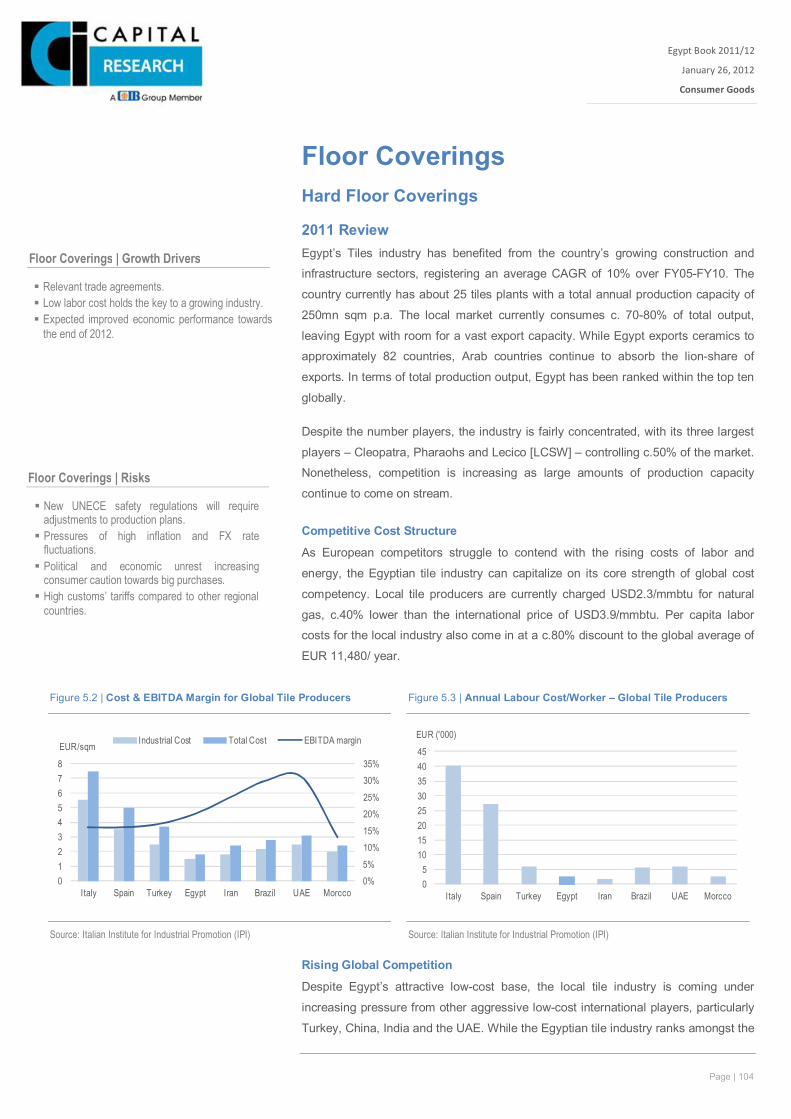
Page | 104
Egypt Book 2011/12
January 26, 2012
Consumer Goods
Xxx
Floor Coverings Hard Floor Coverings
2011 Review Egypt’s Tiles industry has benefited from the country’s growing construction and
infrastructure sectors, registering an average CAGR of 10% over FY05-FY10. The
country currently has about 25 tiles plants with a total annual production capacity of
250mn sqm p.a. The local market currently consumes c. 70-80% of total output,
leaving Egypt with room for a vast export capacity. While Egypt exports ceramics to
approximately 82 countries, Arab countries continue to absorb the lion-share of
exports. In terms of total production output, Egypt has been ranked within the top ten
globally.
Despite the number players, the industry is fairly concentrated, with its three largest
players – Cleopatra, Pharaohs and Lecico [LCSW] – controlling c.50% of the market.
Nonetheless, competition is increasing as large amounts of production capacity
continue to come on stream.
Competitive Cost Structure
As European competitors struggle to contend with the rising costs of labor and
energy, the Egyptian tile industry can capitalize on its core strength of global cost
competency. Local tile producers are currently charged USD2.3/mmbtu for natural
gas, c.40% lower than the international price of USD3.9/mmbtu. Per capita labor
costs for the local industry also come in at a c.80% discount to the global average of
EUR 11,480/ year.
Rising Global Competition
Despite Egypt’s attractive low-cost base, the local tile industry is coming under
increasing pressure from other aggressive low-cost international players, particularly
Turkey, China, India and the UAE. While the Egyptian tile industry ranks amongst the
Figure 5.2 | Cost & EBITDA Margin for Global Tile Producers Figure 5.3 | Annual Labour Cost/Worker – Global Tile Producers
0%5%10%15%20%25%30%35%
012345678
Italy Spain Turkey Egypt Iran Brazil UAE Morcco
Industrial Cost Total Cost EBITDA marginEUR/sqm
05
1015202530354045
Italy Spain Turkey Egypt Iran Brazil UAE Morcco
EUR ('000)
Source: Italian Institute for Industrial Promotion (IPI)
Source: Italian Institute for Industrial Promotion (IPI)
Relevant trade agreements. Low labor cost holds the key to a growing industry. Expected improved economic performance towards
the end of 2012.
Floor Coverings | Growth Drivers
New UNECE safety regulations will require adjustments to production plans. Pressures of high inflation and FX rate
fluctuations. Political and economic unrest increasing
consumer caution towards big purchases. High customs’ tariffs compared to other regional
countries.
Floor Coverings | Risks
Page | 105
Egypt Book 2011/12
January 26, 2012
Consumer Goods
Xxx
best performers in terms of production capacity, capacity utilization and cost, it
continues to underperform in terms of quality, technology-used, productivity, raw
materials availability and quality management.
Figure 5.4 | Egyptian Tile Sector Performance vs. Regional Competition
In 2011, the down-turn in regional real estate markets along with depressed
consumer spending following the Arab Spring led to lower demand for Egyptian
ceramics both locally (c.75% of demand-though fairly resilient) and in key export
markets. In Egypt, ceramic demand decline, due to faltering real-estate and
construction sector growth, was somewhat steadied owing to the boom in informal
housing construction (without permits) which took place amidst and immediately after
the uprising. However, over 2011, ceramic exports to Libya— which have historically
consumed c.6% of total production and accounts for c.30% of the total ceramic
export value— have come to a near stand-still since the start of their uprising on
February 15 (down c. 90%YoY). Other primary markets which also experienced
uprisings and demand disruption are Jordan and Syria. Both individually consume
c.15% of exported ceramic volume and account for a c.10% share (USD17mn) of
Egypt’s total ceramics export value.
Figure 5.5 | Hard Floor Coverings – Key Developments 2011
Date Event Impact
March Jordan removes the USD1.1/sqm protection duty the country had levied on Egyptian ceramic imports back in October 2010. The duty had resulted in a c.30% increase in the price of imported Egyptian ceramics within Jordan.
The removal of the protection duty should re-stimulate demand for Egyptian export in the Jordanian market- at a time when local is expected to be weak following the revolution. Egyptian tile exports fulfill c.35% of Jordan’s tile need
Production Area Egyptian Performance Regional Position
Production Capacity 250mn/sqm/year High
Production Utilization 60-70% At Par
Productivity 6500sqm/year/w orker Low
Technology Used Red Body/w et process Low
Quality Low -Medium LowLow perceived quality
Costs EUR1.8/sqm Best
Raw materials Availability of raw materials (red body) LowPoor quality management
Marketing / Trading Area Egyptian Performance Regional Position
Exports 20% of total Production Low
Access to foreign markets Low integration Low
Prices EUR2.2/sqm Best
Profitability c.20% At Par
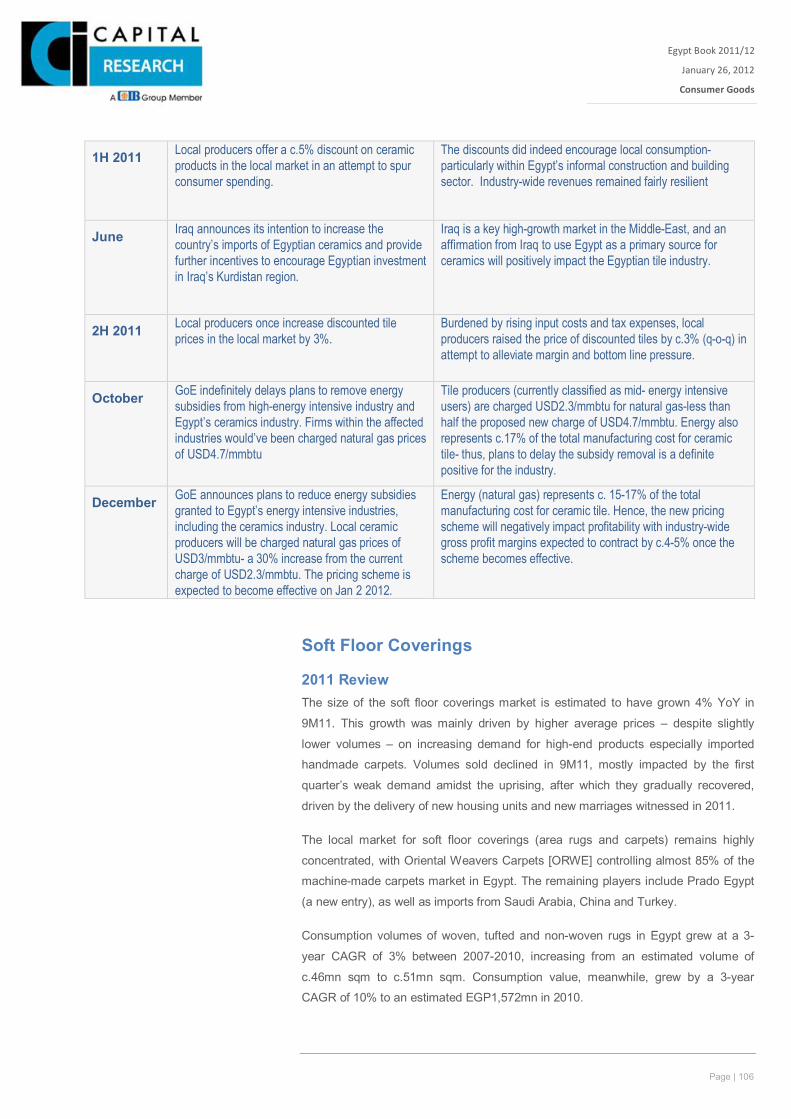
Page | 106
Egypt Book 2011/12
January 26, 2012
Consumer Goods
Xxx
1H 2011 Local producers offer a c.5% discount on ceramic products in the local market in an attempt to spur consumer spending.
The discounts did indeed encourage local consumption-particularly within Egypt’s informal construction and building sector. Industry-wide revenues remained fairly resilient
June Iraq announces its intention to increase the country’s imports of Egyptian ceramics and provide further incentives to encourage Egyptian investment in Iraq’s Kurdistan region.
Iraq is a key high-growth market in the Middle-East, and an affirmation from Iraq to use Egypt as a primary source for ceramics will positively impact the Egyptian tile industry.
2H 2011 Local producers once increase discounted tile prices in the local market by 3%.
Burdened by rising input costs and tax expenses, local producers raised the price of discounted tiles by c.3% (q-o-q) in attempt to alleviate margin and bottom line pressure.
October GoE indefinitely delays plans to remove energy subsidies from high-energy intensive industry and Egypt’s ceramics industry. Firms within the affected industries would’ve been charged natural gas prices of USD4.7/mmbtu
Tile producers (currently classified as mid- energy intensive users) are charged USD2.3/mmbtu for natural gas-less than half the proposed new charge of USD4.7/mmbtu. Energy also represents c.17% of the total manufacturing cost for ceramic tile- thus, plans to delay the subsidy removal is a definite positive for the industry.
December GoE announces plans to reduce energy subsidies granted to Egypt’s energy intensive industries, including the ceramics industry. Local ceramic producers will be charged natural gas prices of USD3/mmbtu- a 30% increase from the current charge of USD2.3/mmbtu. The pricing scheme is expected to become effective on Jan 2 2012.
Energy (natural gas) represents c. 15-17% of the total manufacturing cost for ceramic tile. Hence, the new pricing scheme will negatively impact profitability with industry-wide gross profit margins expected to contract by c.4-5% once the scheme becomes effective.
Soft Floor Coverings
2011 Review The size of the soft floor coverings market is estimated to have grown 4% YoY in
9M11. This growth was mainly driven by higher average prices – despite slightly
lower volumes – on increasing demand for high-end products especially imported
handmade carpets. Volumes sold declined in 9M11, mostly impacted by the first
quarter’s weak demand amidst the uprising, after which they gradually recovered,
driven by the delivery of new housing units and new marriages witnessed in 2011.
The local market for soft floor coverings (area rugs and carpets) remains highly
concentrated, with Oriental Weavers Carpets [ORWE] controlling almost 85% of the
machine-made carpets market in Egypt. The remaining players include Prado Egypt
(a new entry), as well as imports from Saudi Arabia, China and Turkey.
Consumption volumes of woven, tufted and non-woven rugs in Egypt grew at a 3-
year CAGR of 3% between 2007-2010, increasing from an estimated volume of
c.46mn sqm to c.51mn sqm. Consumption value, meanwhile, grew by a 3-year
CAGR of 10% to an estimated EGP1,572mn in 2010.
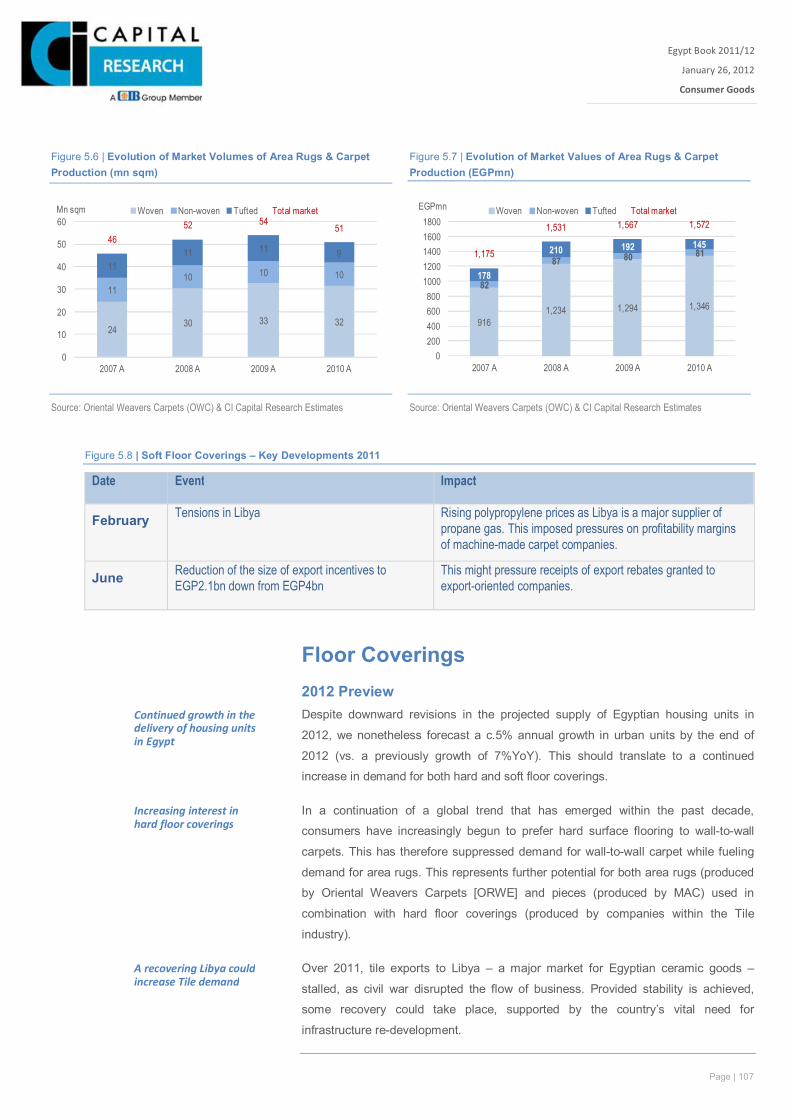
Page | 107
Egypt Book 2011/12
January 26, 2012
Consumer Goods
Xxx
Figure 5.8 | Soft Floor Coverings – Key Developments 2011
Date Event Impact
February Tensions in Libya Rising polypropylene prices as Libya is a major supplier of propane gas. This imposed pressures on profitability margins of machine-made carpet companies.
June Reduction of the size of export incentives to EGP2.1bn down from EGP4bn
This might pressure receipts of export rebates granted to export-oriented companies.
Floor Coverings 2012 Preview Despite downward revisions in the projected supply of Egyptian housing units in
2012, we nonetheless forecast a c.5% annual growth in urban units by the end of
2012 (vs. a previously growth of 7%YoY). This should translate to a continued
increase in demand for both hard and soft floor coverings.
In a continuation of a global trend that has emerged within the past decade,
consumers have increasingly begun to prefer hard surface flooring to wall-to-wall
carpets. This has therefore suppressed demand for wall-to-wall carpet while fueling
demand for area rugs. This represents further potential for both area rugs (produced
by Oriental Weavers Carpets [ORWE] and pieces (produced by MAC) used in
combination with hard floor coverings (produced by companies within the Tile
industry).
Over 2011, tile exports to Libya – a major market for Egyptian ceramic goods –
stalled, as civil war disrupted the flow of business. Provided stability is achieved,
some recovery could take place, supported by the country’s vital need for
infrastructure re-development.
Continued growth in the delivery of housing units in Egypt
Increasing interest in hard floor coverings
A recovering Libya could increase Tile demand
24 30 33 32
1110 10 10
1111 11 9
4652 54
51
0
10
20
30
40
50
60
2007 A 2008 A 2009 A 2010 A
Mn sqm Woven Non-woven Tufted Total market
9161,234 1,294 1,346
82
87 80 81
178
210 192 1451,175
1,531 1,567 1,572
0200400600800
10001200140016001800
2007 A 2008 A 2009 A 2010 A
EGPmn Woven Non-woven Tufted Total market
Figure 5.6 | Evolution of Market Volumes of Area Rugs & Carpet Production (mn sqm)
Figure 5.7 | Evolution of Market Values of Area Rugs & Carpet Production (EGPmn)
Source: Oriental Weavers Carpets (OWC) & CI Capital Research Estimates Source: Oriental Weavers Carpets (OWC) & CI Capital Research Estimates
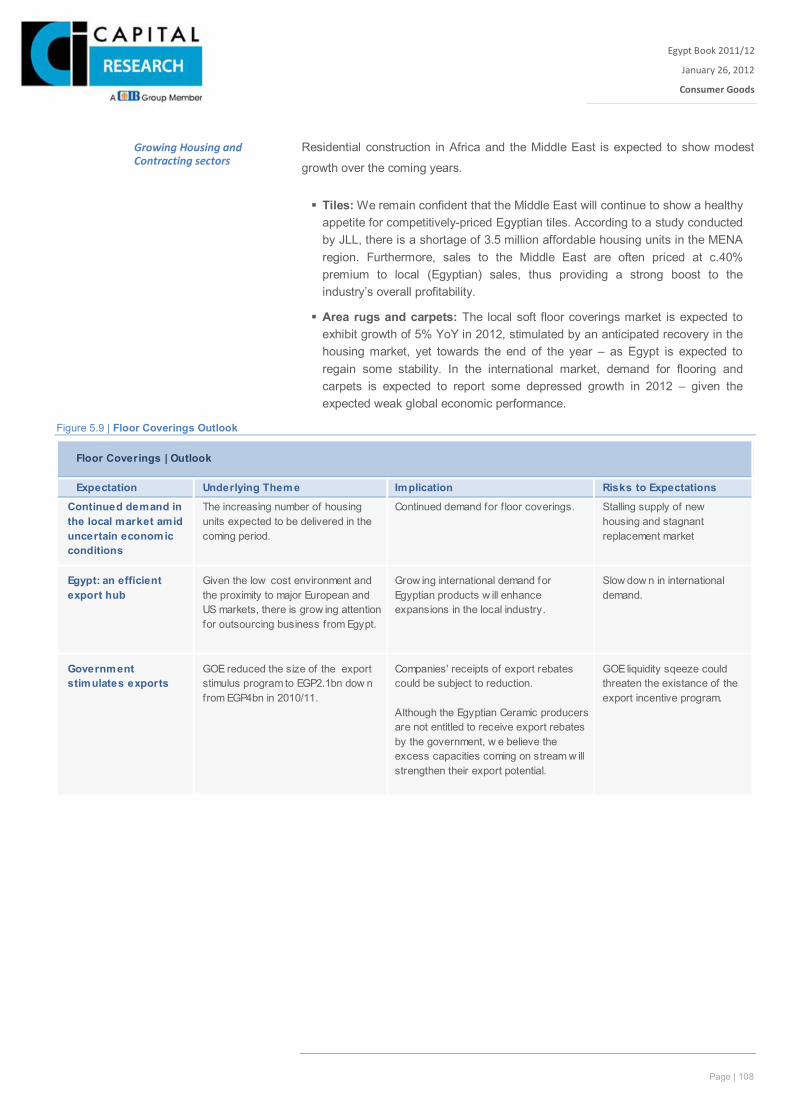
Page | 108
Egypt Book 2011/12
January 26, 2012
Consumer Goods
Xxx
Residential construction in Africa and the Middle East is expected to show modest
growth over the coming years.
Tiles: We remain confident that the Middle East will continue to show a healthy appetite for competitively-priced Egyptian tiles. According to a study conducted by JLL, there is a shortage of 3.5 million affordable housing units in the MENA region. Furthermore, sales to the Middle East are often priced at c.40% premium to local (Egyptian) sales, thus providing a strong boost to the industry’s overall profitability.
Area rugs and carpets: The local soft floor coverings market is expected to exhibit growth of 5% YoY in 2012, stimulated by an anticipated recovery in the housing market, yet towards the end of the year – as Egypt is expected to regain some stability. In the international market, demand for flooring and carpets is expected to report some depressed growth in 2012 – given the expected weak global economic performance.
Figure 5.9 | Floor Coverings Outlook
Growing Housing and Contracting sectors
Floor Coverings | Outlook
Expectation Underlying Theme Implication Risks to Expectations
Continued demand in the local market amid uncertain economic conditions
The increasing number of housing units expected to be delivered in the coming period.
Continued demand for f loor coverings. Stalling supply of new housing and stagnant replacement market
Egypt: an efficient export hub
Given the low cost environment and the proximity to major European and US markets, there is grow ing attention for outsourcing business from Egypt.
Grow ing international demand for Egyptian products w ill enhance expansions in the local industry.
Slow dow n in international demand.
Government stimulates exports
GOE reduced the size of the export stimulus program to EGP2.1bn dow n from EGP4bn in 2010/11.
Companies' receipts of export rebates could be subject to reduction.
Although the Egyptian Ceramic producers are not entitled to receive export rebates by the government, w e believe the excess capacities coming on stream w ill strengthen their export potential.
GOE liquidity sqeeze could threaten the existance of the export incentive program.
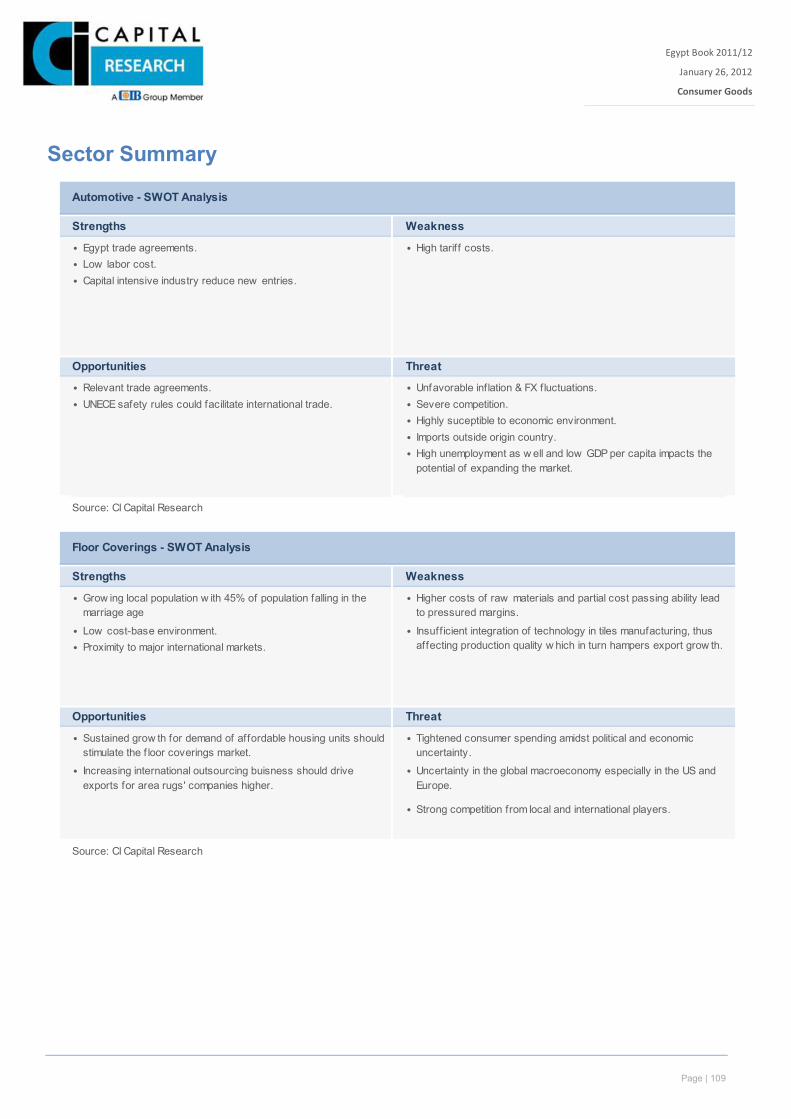
Page | 109
Egypt Book 2011/12
January 26, 2012
Consumer Goods
Xxx
Sector Summary
Automotive - SWOT Analysis
Strengths Weakness
• Egypt trade agreements. • High tariff costs.• Low labor cost.
• Capital intensive industry reduce new entries.
Opportunities Threat
• Relevant trade agreements. • Unfavorable inflation & FX fluctuations.
• UNECE safety rules could facilitate international trade. • Severe competition.• Highly suceptible to economic environment.
• Imports outside origin country.•
Source: CI Capital Research
High unemployment as w ell and low GDP per capita impacts the potential of expanding the market.
Floor Coverings - SWOT Analysis
Strengths Weakness
• •
• Low cost-base environment. •• Proximity to major international markets.
Opportunities Threat
• •
• Increasing international outsourcing buisness should drive exports for area rugs' companies higher.
• Uncertainty in the global macroeconomy especially in the US and Europe.
• Strong competition from local and international players.
Source: CI Capital Research
Grow ing local population w ith 45% of population falling in the marriage age
Sustained grow th for demand of affordable housing units should stimulate the f loor coverings market.
Higher costs of raw materials and partial cost passing ability lead to pressured margins.
Insufficient integration of technology in tiles manufacturing, thus affecting production quality w hich in turn hampers export grow th.
Tightened consumer spending amidst political and economic uncertainty.
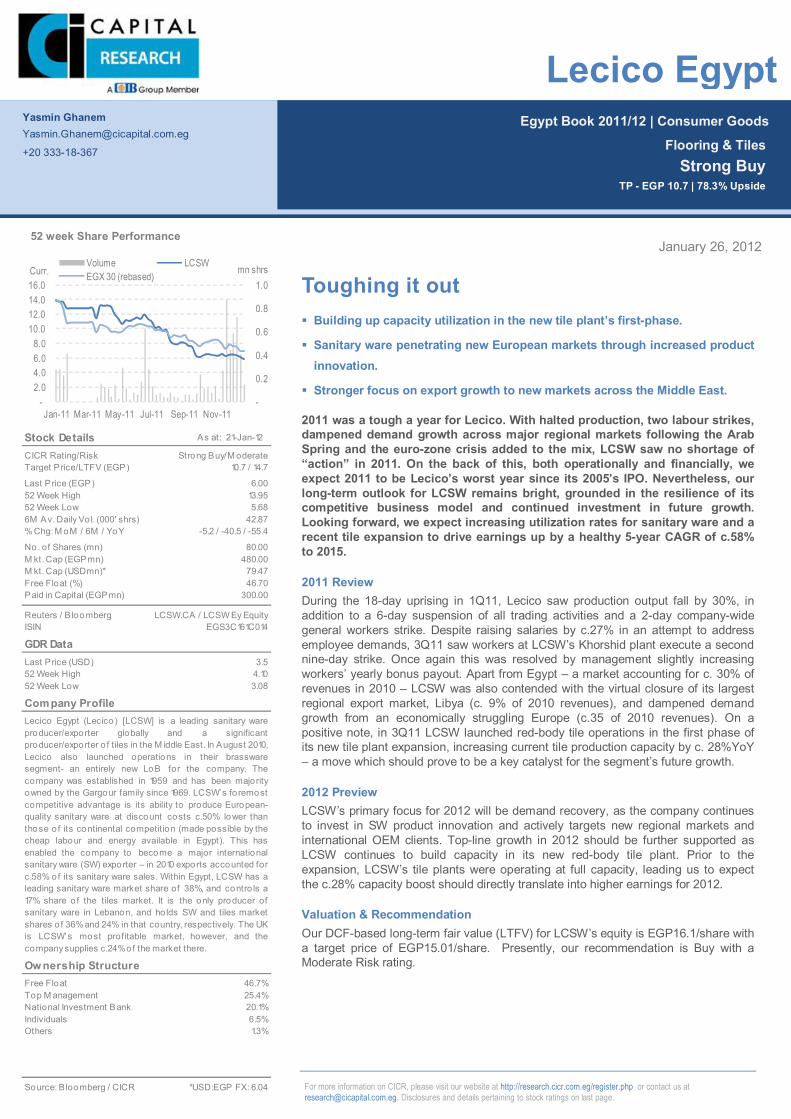
Page | 23
Egypt Book 2011/12 | Consumer Goods
For more information on CICR, please visit our website at http://research.cicr.com.eg/register.php or contact us at [email protected]. Disclosures and details pertaining to stock ratings on last page.
January 26, 2012
Toughing it out Building up capacity utilization in the new tile plant’s first-phase.
Sanitary ware penetrating new European markets through increased product innovation.
Stronger focus on export growth to new markets across the Middle East.
2011 was a tough a year for Lecico. With halted production, two labour strikes, dampened demand growth across major regional markets following the Arab Spring and the euro-zone crisis added to the mix, LCSW saw no shortage of “action” in 2011. On the back of this, both operationally and financially, we expect 2011 to be Lecico’s worst year since its 2005’s IPO. Nevertheless, our long-term outlook for LCSW remains bright, grounded in the resilience of its competitive business model and continued investment in future growth. Looking forward, we expect increasing utilization rates for sanitary ware and a recent tile expansion to drive earnings up by a healthy 5-year CAGR of c.58% to 2015.
2011 Review During the 18-day uprising in 1Q11, Lecico saw production output fall by 30%, in addition to a 6-day suspension of all trading activities and a 2-day company-wide general workers strike. Despite raising salaries by c.27% in an attempt to address employee demands, 3Q11 saw workers at LCSW’s Khorshid plant execute a second nine-day strike. Once again this was resolved by management slightly increasing workers’ yearly bonus payout. Apart from Egypt – a market accounting for c. 30% of revenues in 2010 – LCSW was also contended with the virtual closure of its largest regional export market, Libya (c. 9% of 2010 revenues), and dampened demand growth from an economically struggling Europe (c.35 of 2010 revenues). On a positive note, in 3Q11 LCSW launched red-body tile operations in the first phase of its new tile plant expansion, increasing current tile production capacity by c. 28%YoY – a move which should prove to be a key catalyst for the segment’s future growth.
2012 Preview LCSW’s primary focus for 2012 will be demand recovery, as the company continues to invest in SW product innovation and actively targets new regional markets and international OEM clients. Top-line growth in 2012 should be further supported as LCSW continues to build capacity in its new red-body tile plant. Prior to the expansion, LCSW’s tile plants were operating at full capacity, leading us to expect the c.28% capacity boost should directly translate into higher earnings for 2012.
Valuation & Recommendation Our DCF-based long-term fair value (LTFV) for LCSW’s equity is EGP16.1/share with a target price of EGP15.01/share. Presently, our recommendation is Buy with a Moderate Risk rating.
Yasmin Ghanem [email protected]
+20 333-18-367
Flooring & Tiles Strong Buy
TP - EGP 10.7 | 78.3% Upside
Lecico Egypt
Stock Details As at: 21-Jan-12
CICR Rating/RiskTarget Price/LTFV (EGP)
Last Price (EGP)52 Week High52 Week Low6M Av. Daily Vo l. (000' shrs)% Chg: M oM / 6M / YoY
No. of Shares (mn)M kt. Cap (EGPmn)M kt. Cap (USDmn)*Free Float (%)Paid in Capital (EGPmn)
Reuters / B loombergISIN
GDR DataLast Price (USD)52 Week High52 Week Low
Company Profile
Ow nership StructureFree Float 46.7%Top M anagement 25.4%National Investment Bank 20.1%Individuals 6.5%Others 1.3%
Source: Bloomberg / CICR *USD:EGP FX: 6.04
Lecico Egypt (Lecico) [LCSW] is a leading sanitary wareproducer/exporter globally and a significantproducer/exporter o f tiles in the M iddle East. In August 2010, Lecico also launched operations in their brasswaresegment- an entirely new LoB for the company. Thecompany was established in 1959 and has been majorityowned by the Gargour family since 1969. LCSW’s foremostcompetitive advantage is its ability to produce European-quality sanitary ware at discount costs c.50% lower thanthose of its continental competition (made possible by thecheap labour and energy available in Egypt). This hasenabled the company to become a major internationalsanitary ware (SW) exporter – in 2010 exports accounted forc.58% of its sanitary ware sales. Within Egypt, LCSW has aleading sanitary ware market share of 38%, and contro ls a17% share of the tiles market. It is the only producer ofsanitary ware in Lebanon, and ho lds SW and tiles marketshares of 36%and 24% in that country, respectively. The UKis LCSW’s most profitable market, however, and thecompany supplies c.24% of the market there.
13.955.68
80.00
42.87
LCSW.CA / LCSW Ey Equity
79.47
-5.2 / -40.5 / -55.4
300.00
480.00
3.54.10
46.70
EGS3C161C014
3.08
10.7 / 14.7
6.00
Strong Buy/M oderate
-
0.2
0.4
0.6
0.8
1.0
-2.0 4.0 6.0 8.0
10.0 12.0 14.0 16.0
Jan-11 Mar-11 May-11 Jul-11 Sep-11 Nov-11
mn shrsCurr.Volume LCSWEGX 30 (rebased)
52 week Share Performance
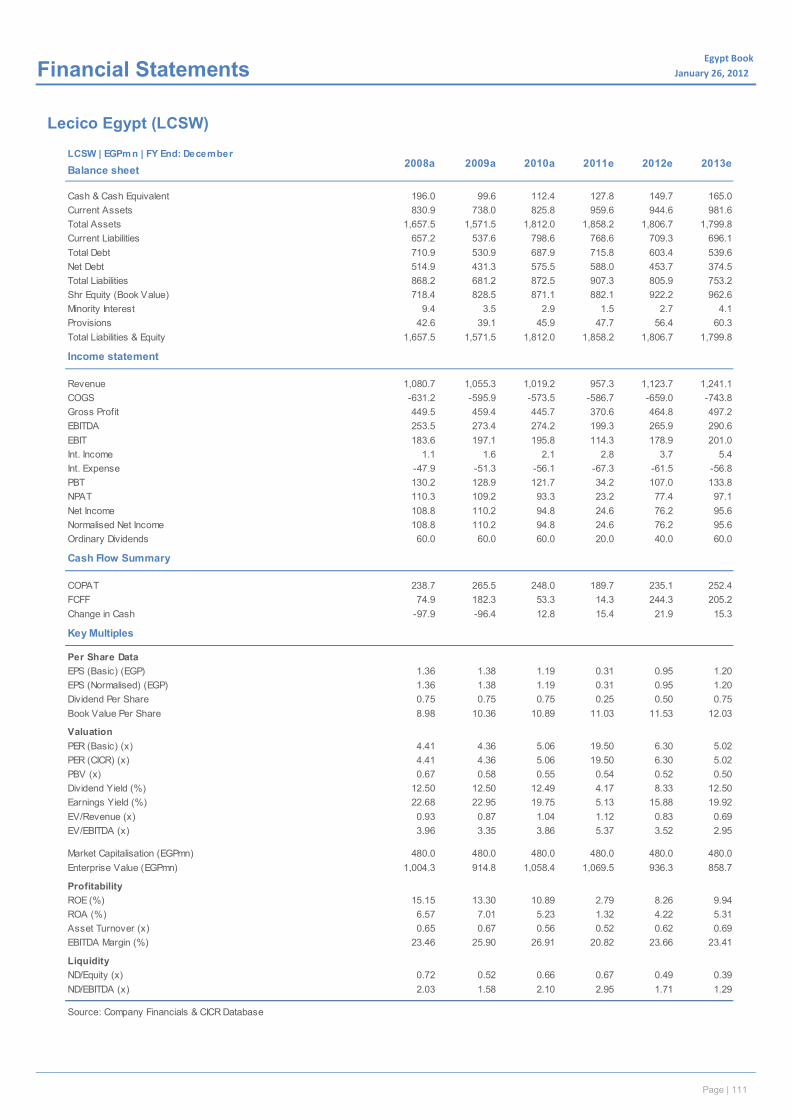
Page | 24
Egypt Book January 26, 2012x Financial Statements
Lecico Egypt (LCSW)
cLCSW | EGPmn | FY End: December
Balance sheet
Cash & Cash Equivalent 196.0 99.6 112.4 127.8 149.7 165.0Current Assets 830.9 738.0 825.8 959.6 944.6 981.6Total Assets 1,657.5 1,571.5 1,812.0 1,858.2 1,806.7 1,799.8Current Liabilities 657.2 537.6 798.6 768.6 709.3 696.1Total Debt 710.9 530.9 687.9 715.8 603.4 539.6Net Debt 514.9 431.3 575.5 588.0 453.7 374.5Total Liabilities 868.2 681.2 872.5 907.3 805.9 753.2Shr Equity (Book Value) 718.4 828.5 871.1 882.1 922.2 962.6Minority Interest 9.4 3.5 2.9 1.5 2.7 4.1Provisions 42.6 39.1 45.9 47.7 56.4 60.3Total Liabilities & Equity 1,657.5 1,571.5 1,812.0 1,858.2 1,806.7 1,799.8
Income statement
Revenue 1,080.7 1,055.3 1,019.2 957.3 1,123.7 1,241.1COGS -631.2 -595.9 -573.5 -586.7 -659.0 -743.8Gross Profit 449.5 459.4 445.7 370.6 464.8 497.2EBITDA 253.5 273.4 274.2 199.3 265.9 290.6EBIT 183.6 197.1 195.8 114.3 178.9 201.0Int. Income 1.1 1.6 2.1 2.8 3.7 5.4Int. Expense -47.9 -51.3 -56.1 -67.3 -61.5 -56.8PBT 130.2 128.9 121.7 34.2 107.0 133.8NPAT 110.3 109.2 93.3 23.2 77.4 97.1Net Income 108.8 110.2 94.8 24.6 76.2 95.6Normalised Net Income 108.8 110.2 94.8 24.6 76.2 95.6Ordinary Dividends 60.0 60.0 60.0 20.0 40.0 60.0
Cash Flow Summary
COPAT 238.7 265.5 248.0 189.7 235.1 252.4FCFF 74.9 182.3 53.3 14.3 244.3 205.2Change in Cash -97.9 -96.4 12.8 15.4 21.9 15.3
Key Multiples
Per Share DataEPS (Basic) (EGP) 1.36 1.38 1.19 0.31 0.95 1.20EPS (Normalised) (EGP) 1.36 1.38 1.19 0.31 0.95 1.20Dividend Per Share 0.75 0.75 0.75 0.25 0.50 0.75Book Value Per Share 8.98 10.36 10.89 11.03 11.53 12.03
ValuationPER (Basic) (x) 4.41 4.36 5.06 19.50 6.30 5.02PER (CICR) (x) 4.41 4.36 5.06 19.50 6.30 5.02PBV (x) 0.67 0.58 0.55 0.54 0.52 0.50Dividend Yield (%) 12.50 12.50 12.49 4.17 8.33 12.50Earnings Yield (%) 22.68 22.95 19.75 5.13 15.88 19.92EV/Revenue (x) 0.93 0.87 1.04 1.12 0.83 0.69EV/EBITDA (x) 3.96 3.35 3.86 5.37 3.52 2.95
Market Capitalisation (EGPmn) 480.0 480.0 480.0 480.0 480.0 480.0Enterprise Value (EGPmn) 1,004.3 914.8 1,058.4 1,069.5 936.3 858.7
ProfitabilityROE (%) 15.15 13.30 10.89 2.79 8.26 9.94ROA (%) 6.57 7.01 5.23 1.32 4.22 5.31Asset Turnover (x) 0.65 0.67 0.56 0.52 0.62 0.69EBITDA Margin (%) 23.46 25.90 26.91 20.82 23.66 23.41
LiquidityND/Equity (x) 0.72 0.52 0.66 0.67 0.49 0.39ND/EBITDA (x) 2.03 1.58 2.10 2.95 1.71 1.29
Source: Company Financials & CICR Database
2008a 2009a 2010a 2011e 2012e 2013e
Page | 111

Page | 25
Egypt Book 2011/12 | Consumer Goods
For more information on CICR, please visit our website at http://research.cicr.com.eg/register.php or contact us at [email protected]. Disclosures and details pertaining to stock ratings on last page.
January 26, 2012
Maintaining markets is the key 85% share of local market, 25% in the US and 20% in Europe.
A vertically-integrated business model.
Rising polypropylene prices the primary concern.
Despite instability in local and international markets, Oriental Weavers Carpets [ORWE] has delivered a remarkable top-line growth in 2011 so far. Owing to a successful strategy, the company has managed to maintain its solid position in its primary markets. In addition, it is expanding its commission-weaving business by supplying one of its US competitors. Moreover, order backlogs still range from 6-8 weeks, which ORWE has filled by adding new capacities to its woven and tufted segments. However, elevated polypropylene prices — which reached an all-time high in 2Q11 alongside tensions in Libya — weighed down on the company’s margins. We foresee lower top-line growth in 2012, on rising uncertainties in the global macro scene. The stock currently trades at a 2012 PER of 9.0x, compared to 17.6x peers’ average.
2011 Review ORWE recorded an almost 12% growth in its 9M11 revenues, backed by strong local and export sales. Said growth was driven in large part by high average prices of woven and tufted carpets (rather than volumes), and growing local sales of fibers and handmade carpets. However, soaring polypropylene prices, which increased 26% ytd reaching an average of USD1,708/ton, drove EBITDA margin down 430bps YoY to 10%.
2012 Preview We forecast ORWE’s top line to show a reasonable growth of 5.5% YoY in 2012 in light of hampered exports growth given the uncertainties surrounding the global macro picture. Furthermore, on the local front, we further expect modest sales growth stimulated by an anticipated recovery in the housing market, yet towards the end of the year, when Egypt is expected to regain some stability. Polypropylene prices are expected to be subdued eventually on an expected easing in oil and gas prices due to expected lower global economic growth compared to 2011. This should level off pressure on EBITDA margin, and in turn, drive bottom line profits higher.
Valuation & Recommendation Thanks to its strong position in the local and global markets, ORWE will likely find support for its top line, with high polypropylene prices to remain the primary concern. Meanwhile, we believe that a reduction in export rebates – which constitute almost a third of pretax earnings for the company – is more likely in the coming period, given unstable local economic conditions coupled with the reduced government allocation for the export incentive program in the 2011/12 budget. The amount has been cut to only EGP2.1bn, down from EGP4bn last year. However, we still view the stock as a stable long-term investment despite its poor trading liquidity. With an LTFV and TP of EGP36.5/share, ORWE is a Hold.
Ingy El Diwany
+20 333-18-354
Flooring & Tiles Hold
TP - EGP 36.5 | 21.7% Upside
Oriental Weavers Carpets
Stock Details As at: 21-Jan-12
CICR Rating/RiskTarget Price/LTFV (EGP)
Last Price (EGP)52 Week High52 Week Low6M Av. Daily Vo l. (000' shrs)% Chg: M oM / 6M / YoY
No. of Shares (mn)M kt. Cap (EGPmn)M kt. Cap (USDmn)*Free Float (%)Paid in Capital (EGPmn)
Reuters / B loombergISIN
GDR DataLast Price52 Week High52 Week Low
Company Profile
Ow nership StructureM oh. Farid Khamis & Family 57.2%Retail 33.4%Fitaihi Holding Group Co. 4.9%M isr Insurance 4.5%
Source: Bloomberg / CICR *USD:EGP FX: 6.04
Oriental Weavers Carpets [ORWE] is the leading Egyptiancarpet manufacturer, with a market share of 85%. Thecompany also has a 25% market share in the US. M AC,ORWE’s 53%-owned subsidiary, captures about a third ofthe world’ s jet-printed rug market. Exports contributed 61%of ORWE's top line in 9M 11, with sales to the US and Europecontributing almost 53% to total sales.ORWE adopts the vertical integration method in itsmanufacturing, processing its own po lypropylene fiber,which is converted into yarn, and also manufacturing anddistributing finished products. The company sources itspo lypropylene needs from Egyptian Propylene andPolypropylene Company in addition to importing them froma regional supplier. Total fiber requirements are suppliedthrough its subsidiaries OWF and EFCO. Carpets and rugsproduction processes are carried out through OrientalWeavers Carpets (OWC), Oriental Weavers International(OWI), M AC, and OW China.
35.0027.00
90.00
29.70
ORWE.CA / ORWE Ey Equity
447.02
0 / 2.5 / -11.6
450.00
2,700.00
No GDR availablen/a
27.94
EGS33041C012
n/a
36.5 / 36.5
30.00
Hold/M oderate
-
1.0
2.0
3.0
4.0
5.0
-5.0
10.0 15.0 20.0 25.0 30.0 35.0 40.0
Jan-11 Mar-11 May-11 Jul-11 Sep-11 Nov-11
mn shrsCurr.Volume ORWEEGX 30 (rebased)
52 week Share Performance
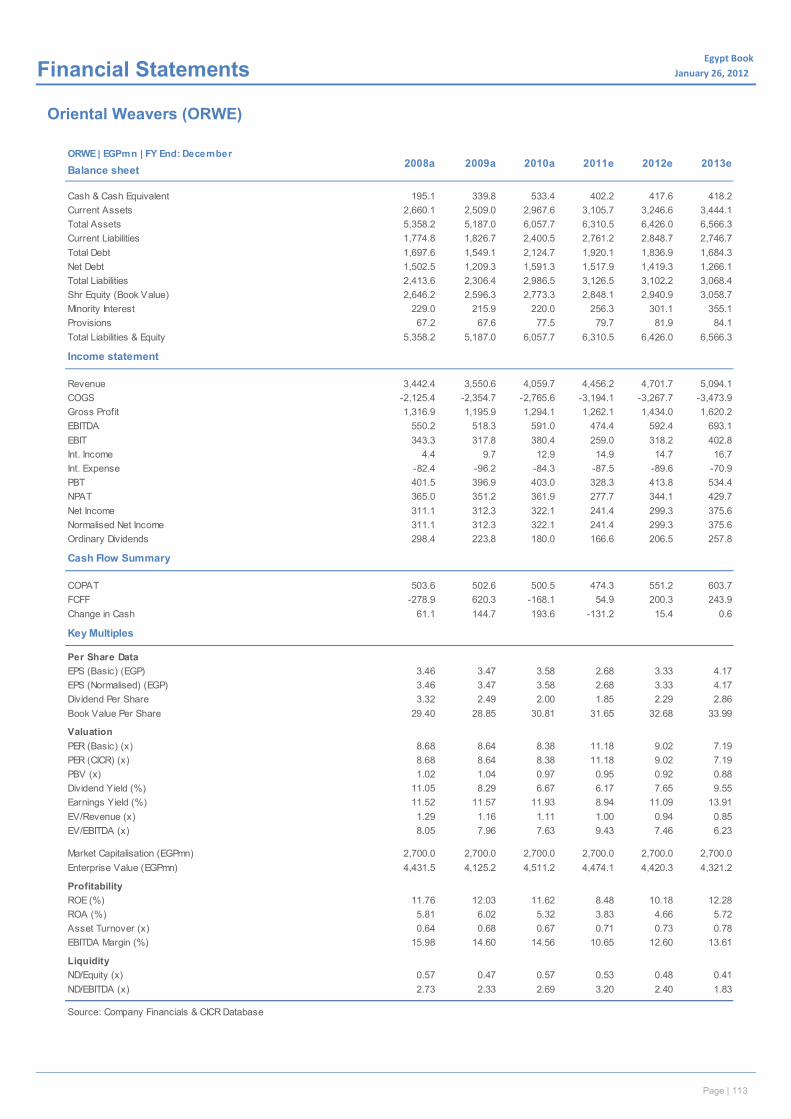
Page | 26
Egypt Book January 26, 2012x Financial Statements
Oriental Weavers (ORWE)
cORWE | EGPmn | FY End: December
Balance sheet
Cash & Cash Equivalent 195.1 339.8 533.4 402.2 417.6 418.2Current Assets 2,660.1 2,509.0 2,967.6 3,105.7 3,246.6 3,444.1Total Assets 5,358.2 5,187.0 6,057.7 6,310.5 6,426.0 6,566.3Current Liabilities 1,774.8 1,826.7 2,400.5 2,761.2 2,848.7 2,746.7Total Debt 1,697.6 1,549.1 2,124.7 1,920.1 1,836.9 1,684.3Net Debt 1,502.5 1,209.3 1,591.3 1,517.9 1,419.3 1,266.1Total Liabilities 2,413.6 2,306.4 2,986.5 3,126.5 3,102.2 3,068.4Shr Equity (Book Value) 2,646.2 2,596.3 2,773.3 2,848.1 2,940.9 3,058.7Minority Interest 229.0 215.9 220.0 256.3 301.1 355.1Provisions 67.2 67.6 77.5 79.7 81.9 84.1Total Liabilities & Equity 5,358.2 5,187.0 6,057.7 6,310.5 6,426.0 6,566.3
Income statement
Revenue 3,442.4 3,550.6 4,059.7 4,456.2 4,701.7 5,094.1COGS -2,125.4 -2,354.7 -2,765.6 -3,194.1 -3,267.7 -3,473.9Gross Profit 1,316.9 1,195.9 1,294.1 1,262.1 1,434.0 1,620.2EBITDA 550.2 518.3 591.0 474.4 592.4 693.1EBIT 343.3 317.8 380.4 259.0 318.2 402.8Int. Income 4.4 9.7 12.9 14.9 14.7 16.7Int. Expense -82.4 -96.2 -84.3 -87.5 -89.6 -70.9PBT 401.5 396.9 403.0 328.3 413.8 534.4NPAT 365.0 351.2 361.9 277.7 344.1 429.7Net Income 311.1 312.3 322.1 241.4 299.3 375.6Normalised Net Income 311.1 312.3 322.1 241.4 299.3 375.6Ordinary Dividends 298.4 223.8 180.0 166.6 206.5 257.8
Cash Flow Summary
COPAT 503.6 502.6 500.5 474.3 551.2 603.7FCFF -278.9 620.3 -168.1 54.9 200.3 243.9Change in Cash 61.1 144.7 193.6 -131.2 15.4 0.6
Key Multiples
Per Share DataEPS (Basic) (EGP) 3.46 3.47 3.58 2.68 3.33 4.17EPS (Normalised) (EGP) 3.46 3.47 3.58 2.68 3.33 4.17Dividend Per Share 3.32 2.49 2.00 1.85 2.29 2.86Book Value Per Share 29.40 28.85 30.81 31.65 32.68 33.99
ValuationPER (Basic) (x) 8.68 8.64 8.38 11.18 9.02 7.19PER (CICR) (x) 8.68 8.64 8.38 11.18 9.02 7.19PBV (x) 1.02 1.04 0.97 0.95 0.92 0.88Dividend Yield (%) 11.05 8.29 6.67 6.17 7.65 9.55Earnings Yield (%) 11.52 11.57 11.93 8.94 11.09 13.91EV/Revenue (x) 1.29 1.16 1.11 1.00 0.94 0.85EV/EBITDA (x) 8.05 7.96 7.63 9.43 7.46 6.23
Market Capitalisation (EGPmn) 2,700.0 2,700.0 2,700.0 2,700.0 2,700.0 2,700.0Enterprise Value (EGPmn) 4,431.5 4,125.2 4,511.2 4,474.1 4,420.3 4,321.2
ProfitabilityROE (%) 11.76 12.03 11.62 8.48 10.18 12.28ROA (%) 5.81 6.02 5.32 3.83 4.66 5.72Asset Turnover (x) 0.64 0.68 0.67 0.71 0.73 0.78EBITDA Margin (%) 15.98 14.60 14.56 10.65 12.60 13.61
LiquidityND/Equity (x) 0.57 0.47 0.57 0.53 0.48 0.41ND/EBITDA (x) 2.73 2.33 2.69 3.20 2.40 1.83
Source: Company Financials & CICR Database
2008a 2009a 2010a 2011e 2012e 2013e
Page | 113
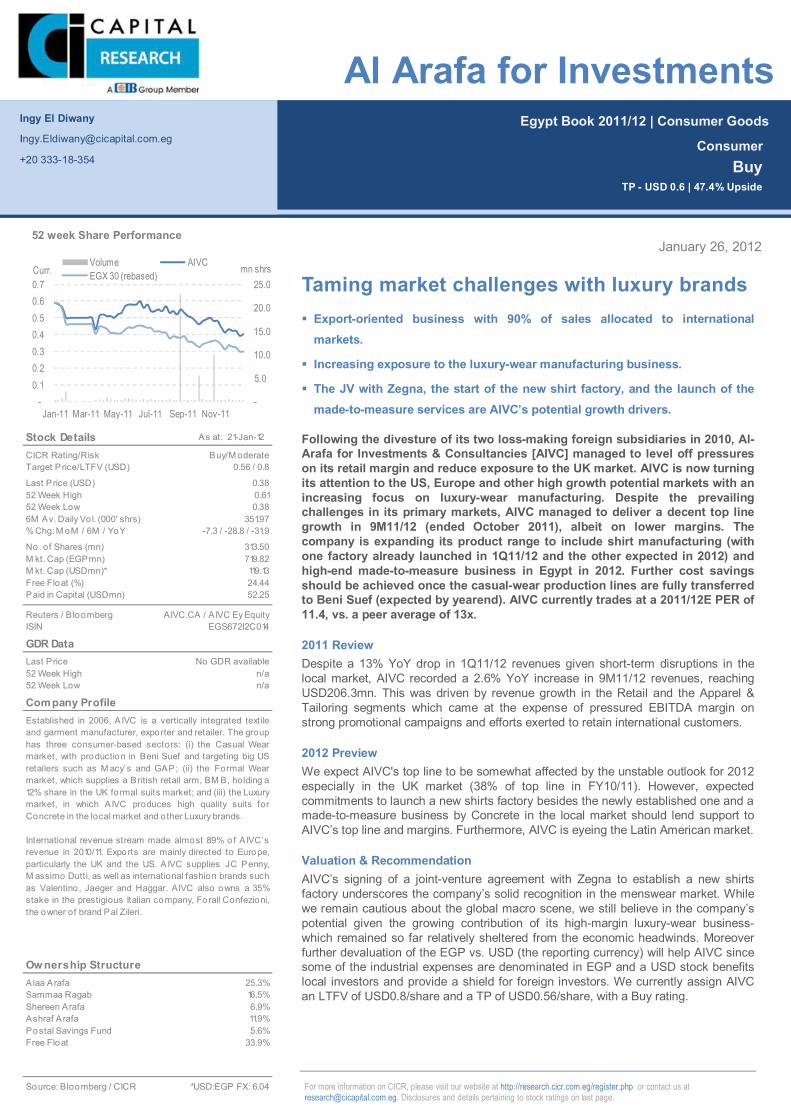
Page | 27
Egypt Book 2011/12 | Consumer Goods
For more information on CICR, please visit our website at http://research.cicr.com.eg/register.php or contact us at [email protected]. Disclosures and details pertaining to stock ratings on last page.
January 26, 2012
Taming market challenges with luxury brands Export-oriented business with 90% of sales allocated to international
markets.
Increasing exposure to the luxury-wear manufacturing business.
The JV with Zegna, the start of the new shirt factory, and the launch of the made-to-measure services are AIVC’s potential growth drivers.
Following the divesture of its two loss-making foreign subsidiaries in 2010, Al-Arafa for Investments & Consultancies [AIVC] managed to level off pressures on its retail margin and reduce exposure to the UK market. AIVC is now turning its attention to the US, Europe and other high growth potential markets with an increasing focus on luxury-wear manufacturing. Despite the prevailing challenges in its primary markets, AIVC managed to deliver a decent top line growth in 9M11/12 (ended October 2011), albeit on lower margins. The company is expanding its product range to include shirt manufacturing (with one factory already launched in 1Q11/12 and the other expected in 2012) and high-end made-to-measure business in Egypt in 2012. Further cost savings should be achieved once the casual-wear production lines are fully transferred to Beni Suef (expected by yearend). AIVC currently trades at a 2011/12E PER of 11.4, vs. a peer average of 13x.
2011 Review Despite a 13% YoY drop in 1Q11/12 revenues given short-term disruptions in the local market, AIVC recorded a 2.6% YoY increase in 9M11/12 revenues, reaching USD206.3mn. This was driven by revenue growth in the Retail and the Apparel & Tailoring segments which came at the expense of pressured EBITDA margin on strong promotional campaigns and efforts exerted to retain international customers.
2012 Preview We expect AIVC's top line to be somewhat affected by the unstable outlook for 2012 especially in the UK market (38% of top line in FY10/11). However, expected commitments to launch a new shirts factory besides the newly established one and a made-to-measure business by Concrete in the local market should lend support to AIVC’s top line and margins. Furthermore, AIVC is eyeing the Latin American market.
Valuation & Recommendation AIVC’s signing of a joint-venture agreement with Zegna to establish a new shirts factory underscores the company’s solid recognition in the menswear market. While we remain cautious about the global macro scene, we still believe in the company’s potential given the growing contribution of its high-margin luxury-wear business- which remained so far relatively sheltered from the economic headwinds. Moreover further devaluation of the EGP vs. USD (the reporting currency) will help AIVC since some of the industrial expenses are denominated in EGP and a USD stock benefits local investors and provide a shield for foreign investors. We currently assign AIVC an LTFV of USD0.8/share and a TP of USD0.56/share, with a Buy rating.
Ingy El Diwany
+20 333-18-354
Consumer Buy
TP - USD 0.6 | 47.4% Upside
Al Arafa for Investments
Stock Details As at: 21-Jan-12
CICR Rating/RiskTarget Price/LTFV (USD)
Last Price (USD)52 Week High52 Week Low6M Av. Daily Vo l. (000' shrs)% Chg: M oM / 6M / YoY
No. of Shares (mn)M kt. Cap (EGPmn)M kt. Cap (USDmn)*Free Float (%)Paid in Capital (USDmn)
Reuters / B loombergISIN
GDR DataLast Price52 Week High52 Week Low
Company Profile
Ow nership StructureAlaa Arafa 25.3%Sammaa Ragab 16.5%Shereen Arafa 6.9%Ashraf Arafa 11.9%Postal Savings Fund 5.6%Free Float 33.9%
Source: Bloomberg / CICR *USD:EGP FX: 6.04
Established in 2006, AIVC is a vertically integrated textileand garment manufacturer, exporter and retailer. The grouphas three consumer-based sectors: (i) the Casual Wearmarket, with production in Beni Suef and targeting big USretailers such as M acy’s and GAP; (ii) the Formal Wearmarket, which supplies a British retail arm, BM B, holding a12% share in the UK formal suits market; and (iii) the Luxurymarket, in which AIVC produces high quality suits forConcrete in the local market and o ther Luxury brands.
International revenue stream made almost 89% of AIVC’srevenue in 2010/11. Exports are mainly directed to Europe,particularly the UK and the US. AIVC supplies JC Penny,M assimo Dutti, as well as international fashion brands suchas Valentino , Jaeger and Haggar. AIVC also owns a 35%stake in the prestigious Italian company, Forall Confezioni,the owner of brand Pal Zileri.
0.610.38
313.50
351.97
AIVC.CA / AIVC Ey Equity
119.13
-7.3 / -28.8 / -31.9
52.25
719.82
No GDR availablen/a
24.44
EGS672I2C014
n/a
0.56 / 0.8
0.38
Buy/M oderate
-
5.0
10.0
15.0
20.0
25.0
-0.1 0.2 0.3 0.4 0.5 0.6 0.7
Jan-11 Mar-11 May-11 Jul-11 Sep-11 Nov-11
mn shrsCurr.Volume AIVCEGX 30 (rebased)
52 week Share Performance
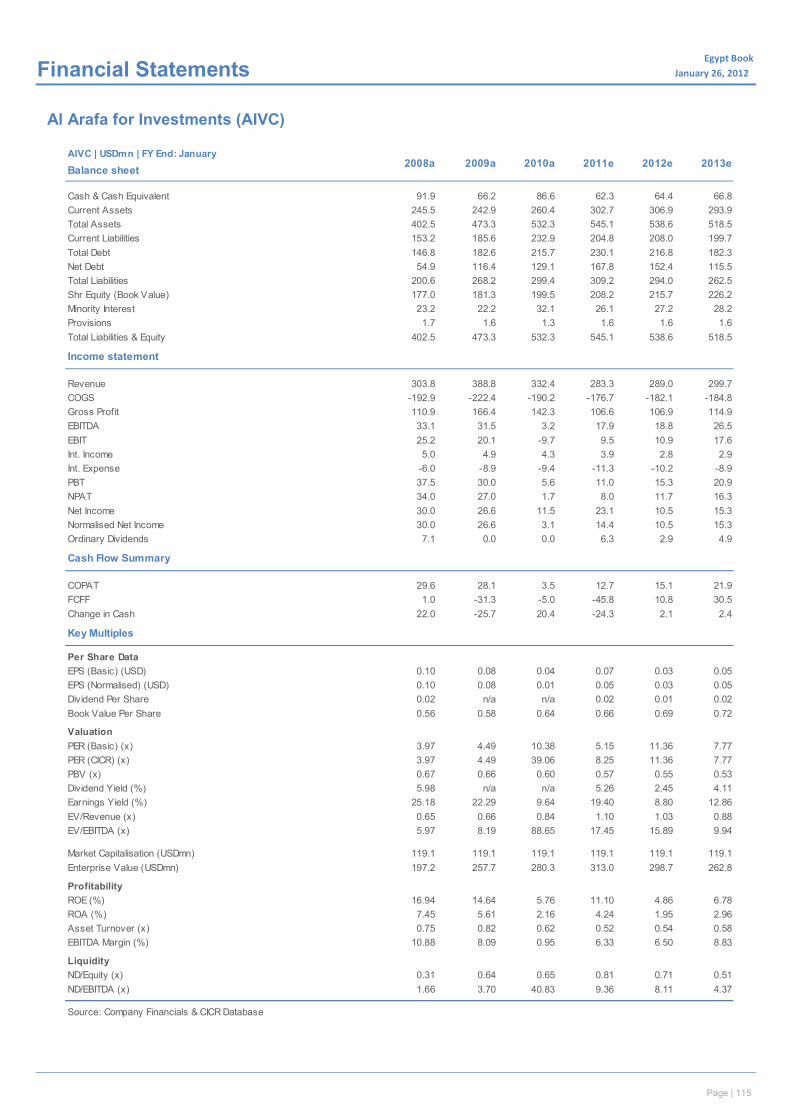
Page | 28
Egypt Book January 26, 2012x Financial Statements
Al Arafa for Investments (AIVC)
cAIVC | USDmn | FY End: January
Balance sheet
Cash & Cash Equivalent 91.9 66.2 86.6 62.3 64.4 66.8Current Assets 245.5 242.9 260.4 302.7 306.9 293.9Total Assets 402.5 473.3 532.3 545.1 538.6 518.5Current Liabilities 153.2 185.6 232.9 204.8 208.0 199.7Total Debt 146.8 182.6 215.7 230.1 216.8 182.3Net Debt 54.9 116.4 129.1 167.8 152.4 115.5Total Liabilities 200.6 268.2 299.4 309.2 294.0 262.5Shr Equity (Book Value) 177.0 181.3 199.5 208.2 215.7 226.2Minority Interest 23.2 22.2 32.1 26.1 27.2 28.2Provisions 1.7 1.6 1.3 1.6 1.6 1.6Total Liabilities & Equity 402.5 473.3 532.3 545.1 538.6 518.5
Income statement
Revenue 303.8 388.8 332.4 283.3 289.0 299.7COGS -192.9 -222.4 -190.2 -176.7 -182.1 -184.8Gross Profit 110.9 166.4 142.3 106.6 106.9 114.9EBITDA 33.1 31.5 3.2 17.9 18.8 26.5EBIT 25.2 20.1 -9.7 9.5 10.9 17.6Int. Income 5.0 4.9 4.3 3.9 2.8 2.9Int. Expense -6.0 -8.9 -9.4 -11.3 -10.2 -8.9PBT 37.5 30.0 5.6 11.0 15.3 20.9NPAT 34.0 27.0 1.7 8.0 11.7 16.3Net Income 30.0 26.6 11.5 23.1 10.5 15.3Normalised Net Income 30.0 26.6 3.1 14.4 10.5 15.3Ordinary Dividends 7.1 0.0 0.0 6.3 2.9 4.9
Cash Flow Summary
COPAT 29.6 28.1 3.5 12.7 15.1 21.9FCFF 1.0 -31.3 -5.0 -45.8 10.8 30.5Change in Cash 22.0 -25.7 20.4 -24.3 2.1 2.4
Key Multiples
Per Share DataEPS (Basic) (USD) 0.10 0.08 0.04 0.07 0.03 0.05EPS (Normalised) (USD) 0.10 0.08 0.01 0.05 0.03 0.05Dividend Per Share 0.02 n/a n/a 0.02 0.01 0.02Book Value Per Share 0.56 0.58 0.64 0.66 0.69 0.72
ValuationPER (Basic) (x) 3.97 4.49 10.38 5.15 11.36 7.77PER (CICR) (x) 3.97 4.49 39.06 8.25 11.36 7.77PBV (x) 0.67 0.66 0.60 0.57 0.55 0.53Dividend Yield (%) 5.98 n/a n/a 5.26 2.45 4.11Earnings Yield (%) 25.18 22.29 9.64 19.40 8.80 12.86EV/Revenue (x) 0.65 0.66 0.84 1.10 1.03 0.88EV/EBITDA (x) 5.97 8.19 88.65 17.45 15.89 9.94
Market Capitalisation (USDmn) 119.1 119.1 119.1 119.1 119.1 119.1Enterprise Value (USDmn) 197.2 257.7 280.3 313.0 298.7 262.8
ProfitabilityROE (%) 16.94 14.64 5.76 11.10 4.86 6.78ROA (%) 7.45 5.61 2.16 4.24 1.95 2.96Asset Turnover (x) 0.75 0.82 0.62 0.52 0.54 0.58EBITDA Margin (%) 10.88 8.09 0.95 6.33 6.50 8.83
LiquidityND/Equity (x) 0.31 0.64 0.65 0.81 0.71 0.51ND/EBITDA (x) 1.66 3.70 40.83 9.36 8.11 4.37
Source: Company Financials & CICR Database
2008a 2009a 2010a 2011e 2012e 2013e
Page | 115
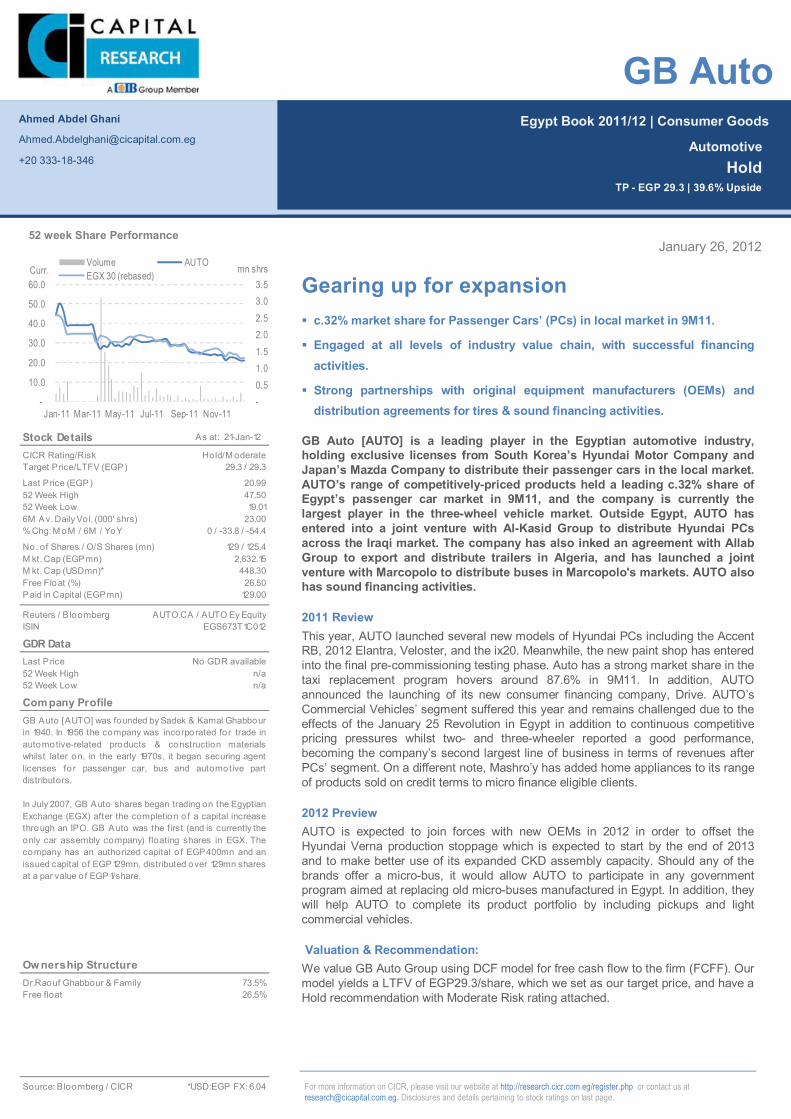
Page | 29
Egypt Book 2011/12 | Consumer Goods
For more information on CICR, please visit our website at http://research.cicr.com.eg/register.php or contact us at [email protected]. Disclosures and details pertaining to stock ratings on last page.
January 26, 2012
Gearing up for expansion c.32% market share for Passenger Cars’ (PCs) in local market in 9M11.
Engaged at all levels of industry value chain, with successful financing activities.
Strong partnerships with original equipment manufacturers (OEMs) and distribution agreements for tires & sound financing activities.
GB Auto [AUTO] is a leading player in the Egyptian automotive industry, holding exclusive licenses from South Korea’s Hyundai Motor Company and Japan’s Mazda Company to distribute their passenger cars in the local market. AUTO’s range of competitively-priced products held a leading c.32% share of Egypt’s passenger car market in 9M11, and the company is currently the largest player in the three-wheel vehicle market. Outside Egypt, AUTO has entered into a joint venture with Al-Kasid Group to distribute Hyundai PCs across the Iraqi market. The company has also inked an agreement with Allab Group to export and distribute trailers in Algeria, and has launched a joint venture with Marcopolo to distribute buses in Marcopolo's markets. AUTO also has sound financing activities.
2011 Review This year, AUTO launched several new models of Hyundai PCs including the Accent RB, 2012 Elantra, Veloster, and the ix20. Meanwhile, the new paint shop has entered into the final pre-commissioning testing phase. Auto has a strong market share in the taxi replacement program hovers around 87.6% in 9M11. In addition, AUTO announced the launching of its new consumer financing company, Drive. AUTO’s Commercial Vehicles’ segment suffered this year and remains challenged due to the effects of the January 25 Revolution in Egypt in addition to continuous competitive pricing pressures whilst two- and three-wheeler reported a good performance, becoming the company’s second largest line of business in terms of revenues after PCs’ segment. On a different note, Mashro’y has added home appliances to its range of products sold on credit terms to micro finance eligible clients.
2012 Preview AUTO is expected to join forces with new OEMs in 2012 in order to offset the Hyundai Verna production stoppage which is expected to start by the end of 2013 and to make better use of its expanded CKD assembly capacity. Should any of the brands offer a micro-bus, it would allow AUTO to participate in any government program aimed at replacing old micro-buses manufactured in Egypt. In addition, they will help AUTO to complete its product portfolio by including pickups and light commercial vehicles.
Valuation & Recommendation: We value GB Auto Group using DCF model for free cash flow to the firm (FCFF). Our model yields a LTFV of EGP29.3/share, which we set as our target price, and have a Hold recommendation with Moderate Risk rating attached.
Ahmed Abdel Ghani
+20 333-18-346
Automotive Hold
TP - EGP 29.3 | 39.6% Upside
GB Auto
Stock Details As at: 21-Jan-12
CICR Rating/RiskTarget Price/LTFV (EGP)
Last Price (EGP)52 Week High52 Week Low6M Av. Daily Vo l. (000' shrs)% Chg: M oM / 6M / YoY
No. of Shares / O/S Shares (mn)M kt. Cap (EGPmn)M kt. Cap (USDmn)*Free Float (%)Paid in Capital (EGPmn)
Reuters / B loombergISIN
GDR DataLast Price52 Week High52 Week Low
Company Profile
Ow nership StructureDr.Raouf Ghabbour & Family 73.5%Free float 26.5%
Source: Bloomberg / CICR *USD:EGP FX: 6.04
GB Auto [AUTO] was founded by Sadek & Kamal Ghabbourin 1940. In 1956 the company was incorporated for trade inautomotive-related products & construction materialswhilst later on, in the early 1970s, it began securing agentlicenses for passenger car, bus and automotive partdistributors.
In July 2007, GB Auto shares began trading on the EgyptianExchange (EGX) after the completion of a capital increasethrough an IPO. GB Auto was the first (and is currently theonly car assembly company) floating shares in EGX. Thecompany has an authorized capital o f EGP400mn and anissued capital of EGP129mn, distributed over 129mn sharesat a par value o f EGP1/share.
47.5019.01
129 / 125.4
23.00
AUTO.CA / AUTO Ey Equity
448.30
0 / -33.8 / -54.4
129.00
2,632.15
No GDR availablen/a
26.50
EGS673T1C012
n/a
29.3 / 29.3
20.99
Hold/M oderate
-0.5 1.0 1.5 2.0 2.5 3.0 3.5
-
10.0
20.0
30.0
40.0
50.0
60.0
Jan-11 Mar-11 May-11 Jul-11 Sep-11 Nov-11
mn shrsCurr.Volume AUTOEGX 30 (rebased)
52 week Share Performance
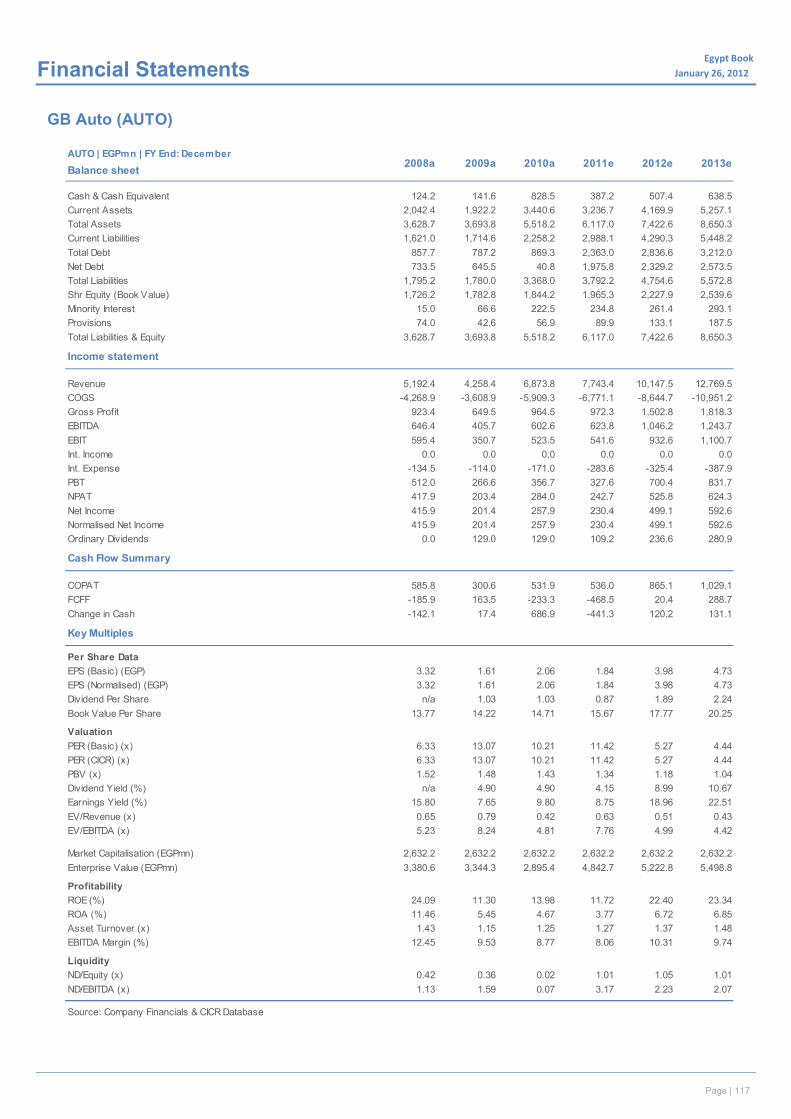
Page | 30
Egypt Book January 26, 2012x Financial Statements
GB Auto (AUTO)
cAUTO | EGPmn | FY End: December
Balance sheet
Cash & Cash Equivalent 124.2 141.6 828.5 387.2 507.4 638.5Current Assets 2,042.4 1,922.2 3,440.6 3,236.7 4,169.9 5,257.1Total Assets 3,628.7 3,693.8 5,518.2 6,117.0 7,422.6 8,650.3Current Liabilities 1,621.0 1,714.6 2,258.2 2,988.1 4,290.3 5,448.2Total Debt 857.7 787.2 869.3 2,363.0 2,836.6 3,212.0Net Debt 733.5 645.5 40.8 1,975.8 2,329.2 2,573.5Total Liabilities 1,795.2 1,780.0 3,368.0 3,792.2 4,754.6 5,572.8Shr Equity (Book Value) 1,726.2 1,782.8 1,844.2 1,965.3 2,227.9 2,539.6Minority Interest 15.0 66.6 222.5 234.8 261.4 293.1Provisions 74.0 42.6 56.9 89.9 133.1 187.5Total Liabilities & Equity 3,628.7 3,693.8 5,518.2 6,117.0 7,422.6 8,650.3
Income statement
Revenue 5,192.4 4,258.4 6,873.8 7,743.4 10,147.5 12,769.5COGS -4,268.9 -3,608.9 -5,909.3 -6,771.1 -8,644.7 -10,951.2Gross Profit 923.4 649.5 964.5 972.3 1,502.8 1,818.3EBITDA 646.4 405.7 602.6 623.8 1,046.2 1,243.7EBIT 595.4 350.7 523.5 541.6 932.6 1,100.7Int. Income 0.0 0.0 0.0 0.0 0.0 0.0Int. Expense -134.5 -114.0 -171.0 -283.6 -325.4 -387.9PBT 512.0 266.6 356.7 327.6 700.4 831.7NPAT 417.9 203.4 284.0 242.7 525.8 624.3Net Income 415.9 201.4 257.9 230.4 499.1 592.6Normalised Net Income 415.9 201.4 257.9 230.4 499.1 592.6Ordinary Dividends 0.0 129.0 129.0 109.2 236.6 280.9
Cash Flow Summary
COPAT 585.8 300.6 531.9 536.0 865.1 1,029.1FCFF -185.9 163.5 -233.3 -468.5 20.4 288.7Change in Cash -142.1 17.4 686.9 -441.3 120.2 131.1
Key Multiples
Per Share DataEPS (Basic) (EGP) 3.32 1.61 2.06 1.84 3.98 4.73EPS (Normalised) (EGP) 3.32 1.61 2.06 1.84 3.98 4.73Dividend Per Share n/a 1.03 1.03 0.87 1.89 2.24Book Value Per Share 13.77 14.22 14.71 15.67 17.77 20.25
ValuationPER (Basic) (x) 6.33 13.07 10.21 11.42 5.27 4.44PER (CICR) (x) 6.33 13.07 10.21 11.42 5.27 4.44PBV (x) 1.52 1.48 1.43 1.34 1.18 1.04Dividend Yield (%) n/a 4.90 4.90 4.15 8.99 10.67Earnings Yield (%) 15.80 7.65 9.80 8.75 18.96 22.51EV/Revenue (x) 0.65 0.79 0.42 0.63 0.51 0.43EV/EBITDA (x) 5.23 8.24 4.81 7.76 4.99 4.42
Market Capitalisation (EGPmn) 2,632.2 2,632.2 2,632.2 2,632.2 2,632.2 2,632.2Enterprise Value (EGPmn) 3,380.6 3,344.3 2,895.4 4,842.7 5,222.8 5,498.8
ProfitabilityROE (%) 24.09 11.30 13.98 11.72 22.40 23.34ROA (%) 11.46 5.45 4.67 3.77 6.72 6.85Asset Turnover (x) 1.43 1.15 1.25 1.27 1.37 1.48EBITDA Margin (%) 12.45 9.53 8.77 8.06 10.31 9.74
LiquidityND/Equity (x) 0.42 0.36 0.02 1.01 1.05 1.01ND/EBITDA (x) 1.13 1.59 0.07 3.17 2.23 2.07
Source: Company Financials & CICR Database
2008a 2009a 2010a 2011e 2012e 2013e
Page | 117
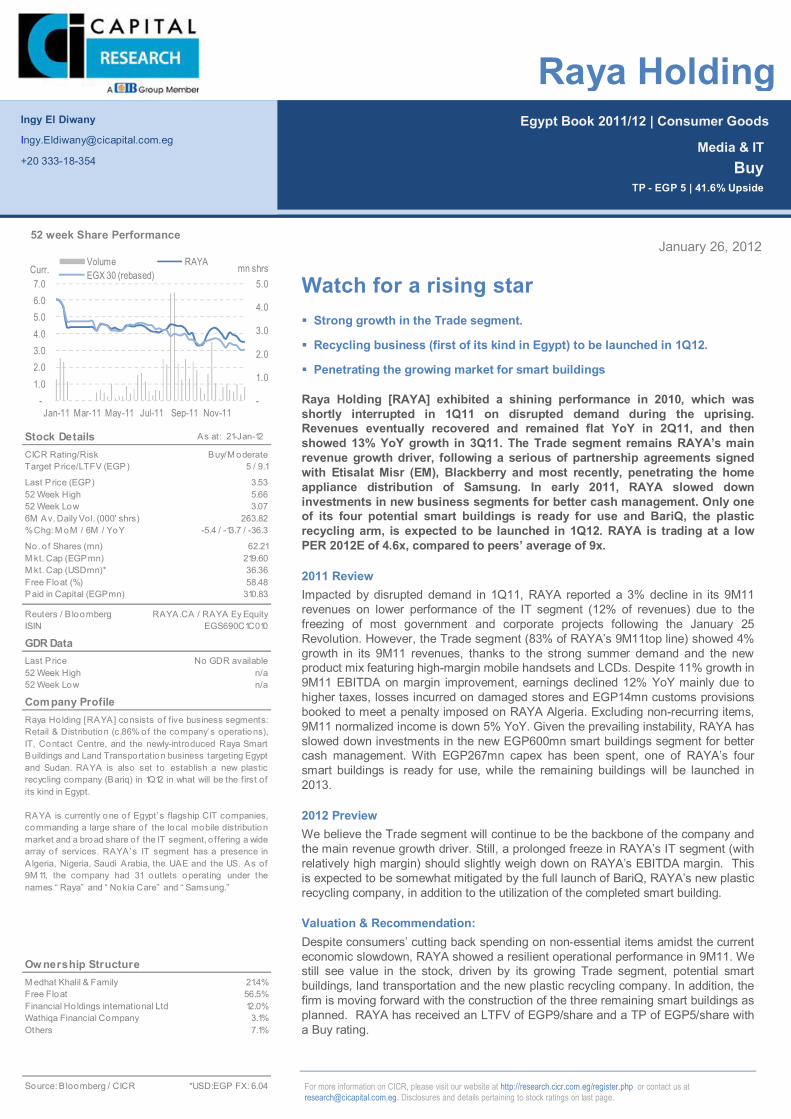
Page | 31
Egypt Book 2011/12 | Consumer Goods
For more information on CICR, please visit our website at http://research.cicr.com.eg/register.php or contact us at [email protected]. Disclosures and details pertaining to stock ratings on last page.
January 26, 2012
Watch for a rising star Strong growth in the Trade segment.
Recycling business (first of its kind in Egypt) to be launched in 1Q12.
Penetrating the growing market for smart buildings
Raya Holding [RAYA] exhibited a shining performance in 2010, which was shortly interrupted in 1Q11 on disrupted demand during the uprising. Revenues eventually recovered and remained flat YoY in 2Q11, and then showed 13% YoY growth in 3Q11. The Trade segment remains RAYA’s main revenue growth driver, following a serious of partnership agreements signed with Etisalat Misr (EM), Blackberry and most recently, penetrating the home appliance distribution of Samsung. In early 2011, RAYA slowed down investments in new business segments for better cash management. Only one of its four potential smart buildings is ready for use and BariQ, the plastic recycling arm, is expected to be launched in 1Q12. RAYA is trading at a low PER 2012E of 4.6x, compared to peers’ average of 9x.
2011 Review Impacted by disrupted demand in 1Q11, RAYA reported a 3% decline in its 9M11 revenues on lower performance of the IT segment (12% of revenues) due to the freezing of most government and corporate projects following the January 25 Revolution. However, the Trade segment (83% of RAYA’s 9M11top line) showed 4% growth in its 9M11 revenues, thanks to the strong summer demand and the new product mix featuring high-margin mobile handsets and LCDs. Despite 11% growth in 9M11 EBITDA on margin improvement, earnings declined 12% YoY mainly due to higher taxes, losses incurred on damaged stores and EGP14mn customs provisions booked to meet a penalty imposed on RAYA Algeria. Excluding non-recurring items, 9M11 normalized income is down 5% YoY. Given the prevailing instability, RAYA has slowed down investments in the new EGP600mn smart buildings segment for better cash management. With EGP267mn capex has been spent, one of RAYA’s four smart buildings is ready for use, while the remaining buildings will be launched in 2013.
2012 Preview We believe the Trade segment will continue to be the backbone of the company and the main revenue growth driver. Still, a prolonged freeze in RAYA’s IT segment (with relatively high margin) should slightly weigh down on RAYA’s EBITDA margin. This is expected to be somewhat mitigated by the full launch of BariQ, RAYA’s new plastic recycling company, in addition to the utilization of the completed smart building.
Valuation & Recommendation: Despite consumers’ cutting back spending on non-essential items amidst the current economic slowdown, RAYA showed a resilient operational performance in 9M11. We still see value in the stock, driven by its growing Trade segment, potential smart buildings, land transportation and the new plastic recycling company. In addition, the firm is moving forward with the construction of the three remaining smart buildings as planned. RAYA has received an LTFV of EGP9/share and a TP of EGP5/share with a Buy rating.
Ingy El Diwany
+20 333-18-354
Media & IT Buy
TP - EGP 5 | 41.6% Upside
Raya Holding
Stock Details As at: 21-Jan-12
CICR Rating/RiskTarget Price/LTFV (EGP)
Last Price (EGP)52 Week High52 Week Low6M Av. Daily Vol. (000' shrs)% Chg: M oM / 6M / YoY
No. o f Shares (mn)M kt. Cap (EGPmn)M kt. Cap (USDmn)*Free Float (%)Paid in Capital (EGPmn)
Reuters / B loombergISIN
GDR DataLast Price52 Week High52 Week Low
Company Profile
Ow nership StructureM edhat Khalil & Family 21.4%Free Float 56.5%Financial Ho ldings international Ltd 12.0%Wathiqa Financial Company 3.1%Others 7.1%
Source: B loomberg / CICR *USD:EGP FX: 6.04
Raya Holding [RAYA] consists o f five business segments:Retail & Distribution (c.86% of the company’ s operations),IT, Contact Centre, and the newly-introduced Raya SmartBuildings and Land Transportation business targeting Egyptand Sudan. RAYA is also set to establish a new plasticrecycling company (Bariq) in 1Q12 in what will be the first ofits kind in Egypt.
RAYA is currently one of Egypt’ s flagship CIT companies,commanding a large share of the local mobile distributionmarket and a broad share of the IT segment, o ffering a widearray o f services. RAYA’s IT segment has a presence inAlgeria, Nigeria, Saudi Arabia, the UAE and the US. As of9M 11, the company had 31 outlets operating under thenames “ Raya” and “ Nokia Care” and “ Samsung.”
5.663.07
62.21
263.82
RAYA.CA / RAYA Ey Equity
36.36
-5.4 / -13.7 / -36.3
310.83
219.60
No GDR availablen/a
58.48
EGS690C1C010
n/a
5 / 9.1
3.53
Buy/M oderate
-
1.0
2.0
3.0
4.0
5.0
-1.0 2.0 3.0 4.0 5.0 6.0 7.0
Jan-11 Mar-11 May-11 Jul-11 Sep-11 Nov-11
mn shrsCurr.Volume RAYAEGX 30 (rebased)
52 week Share Performance

Page | 32
Egypt Book January 26, 2012x Financial Statements
Raya Holding (RAYA)
cRAYA | EGPmn | FY End: December
Balance sheet
Cash & Cash Equivalent 58.5 115.7 113.0 92.3 104.3 124.9Current Assets 698.7 579.4 654.0 728.2 1,002.7 1,237.3Total Assets 1,240.1 1,252.3 1,354.4 1,518.9 1,809.0 2,023.3Current Liabilities 655.0 643.3 704.8 738.1 849.3 960.4Total Debt 432.9 311.7 357.7 466.6 691.6 842.1Net Debt 374.4 196.1 244.7 374.2 587.3 717.2Total Liabilities 725.7 705.8 798.8 910.2 1,156.8 1,320.7Shr Equity (Book Value) 473.0 494.8 515.6 555.2 593.6 636.9Minority Interest -1.8 -1.8 2.6 1.3 0.4 1.5Provisions 43.1 53.5 37.4 52.2 58.2 64.2Total Liabilities & Equity 1,240.1 1,252.3 1,354.4 1,518.9 1,809.0 2,023.3
Income statement
Revenue 2,176.1 1,869.7 2,553.9 2,564.9 2,750.7 2,956.6COGS -1,848.3 -1,587.7 -2,191.9 -2,228.3 -2,398.1 -2,523.8Gross Profit 327.7 282.1 362.0 336.6 352.6 432.8EBITDA 137.7 86.2 138.4 132.6 132.5 184.5EBIT 105.9 48.0 99.9 91.7 87.0 127.8Int. Income 0.9 1.0 2.4 2.3 2.0 2.1Int. Expense -35.8 -24.9 -10.0 -22.8 -27.2 -52.1PBT 74.1 49.0 59.9 55.3 63.9 80.2NPAT 53.4 41.3 42.3 38.2 46.9 59.2Net Income 54.0 41.6 43.6 39.6 47.7 58.1Normalised Net Income 54.0 28.9 74.3 54.4 47.7 58.1Ordinary Dividends 12.0 14.2 12.4 0.0 9.4 14.8
Cash Flow Summary
COPAT 101.8 61.6 168.4 115.6 115.5 163.4FCFF -115.9 340.4 80.7 -43.6 -188.8 -71.0Change in Cash -65.3 57.1 -2.7 -20.6 12.0 20.6
Key Multiples
Per Share DataEPS (Basic) (EGP) 0.87 0.67 0.70 0.64 0.77 0.93EPS (Normalised) (EGP) 0.87 0.47 1.19 0.88 0.77 0.93Dividend Per Share 0.19 0.23 0.20 n/a 0.15 0.24Book Value Per Share 7.61 7.96 8.29 8.93 9.55 10.25
ValuationPER (Basic) (x) 4.07 5.27 5.03 5.54 4.60 3.78PER (CICR) (x) 4.07 7.58 2.95 4.03 4.60 3.78PBV (x) 0.46 0.44 0.43 0.40 0.37 0.34Dividend Yield (%) 5.45 6.49 5.67 n/a 4.28 6.74Earnings Yield (%) 24.60 18.96 19.88 18.04 21.76 26.49EV/Revenue (x) 0.27 0.22 0.18 0.23 0.29 0.32EV/EBITDA (x) 4.30 4.80 3.37 4.49 6.09 5.09
Market Capitalisation (EGPmn) 219.4 219.4 219.4 219.4 219.4 219.4Enterprise Value (EGPmn) 592.1 413.8 466.8 594.9 807.2 938.1
ProfitabilityROE (%) 11.41 8.41 8.46 7.13 8.04 9.13ROA (%) 4.35 3.32 3.22 2.61 2.64 2.87Asset Turnover (x) 1.75 1.49 1.89 1.69 1.52 1.46EBITDA Margin (%) 6.33 4.61 5.42 5.17 4.82 6.24
LiquidityND/Equity (x) 0.79 0.40 0.47 0.67 0.99 1.13ND/EBITDA (x) 2.72 2.27 1.77 2.82 4.43 3.89
Source: Company Financials & CICR Database
2008a 2009a 2010a 2011e 2012e 2013e
Page | 119
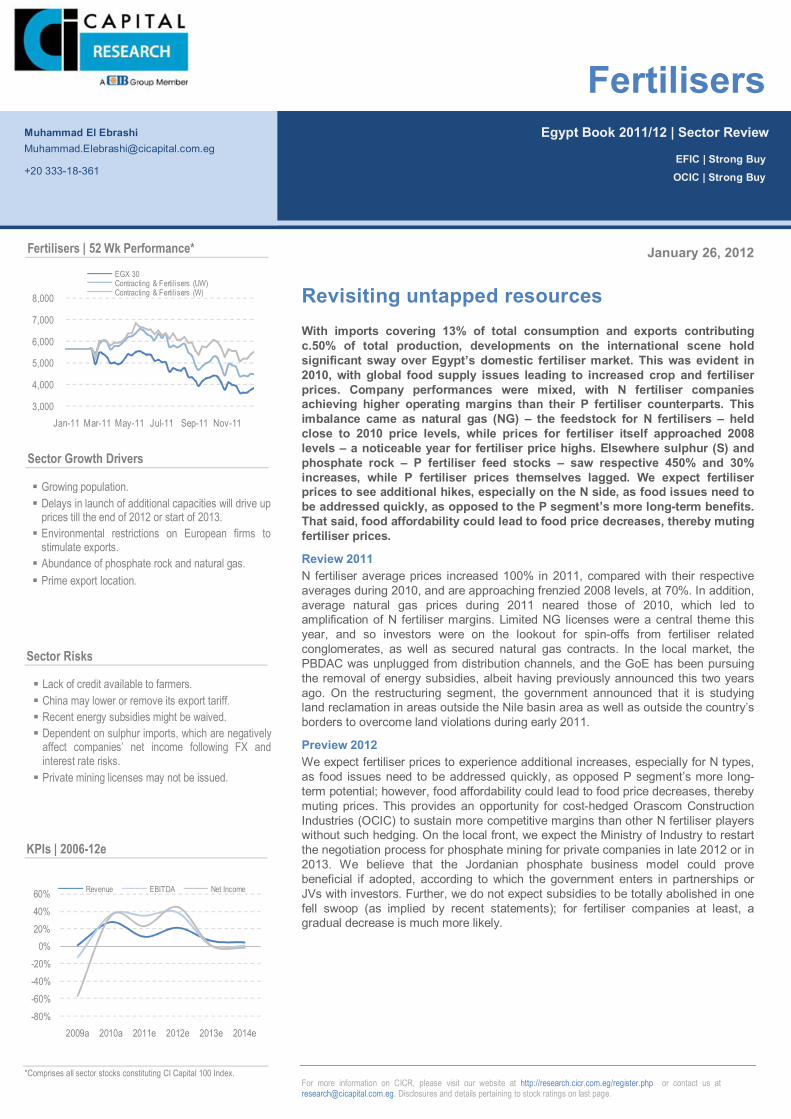
Page | 120
Page | 120
For more information on CICR, please visit our website at http://research.cicr.com.eg/register.php or contact us at [email protected]. Disclosures and details pertaining to stock ratings on last page.
January 26, 2012
Revisiting untapped resources With imports covering 13% of total consumption and exports contributing c.50% of total production, developments on the international scene hold significant sway over Egypt’s domestic fertiliser market. This was evident in 2010, with global food supply issues leading to increased crop and fertiliser prices. Company performances were mixed, with N fertiliser companies achieving higher operating margins than their P fertiliser counterparts. This imbalance came as natural gas (NG) – the feedstock for N fertilisers – held close to 2010 price levels, while prices for fertiliser itself approached 2008 levels – a noticeable year for fertiliser price highs. Elsewhere sulphur (S) and phosphate rock – P fertiliser feed stocks – saw respective 450% and 30% increases, while P fertiliser prices themselves lagged. We expect fertiliser prices to see additional hikes, especially on the N side, as food issues need to be addressed quickly, as opposed to the P segment’s more long-term benefits. That said, food affordability could lead to food price decreases, thereby muting fertiliser prices.
Review 2011 N fertiliser average prices increased 100% in 2011, compared with their respective averages during 2010, and are approaching frenzied 2008 levels, at 70%. In addition, average natural gas prices during 2011 neared those of 2010, which led to amplification of N fertiliser margins. Limited NG licenses were a central theme this year, and so investors were on the lookout for spin-offs from fertiliser related conglomerates, as well as secured natural gas contracts. In the local market, the PBDAC was unplugged from distribution channels, and the GoE has been pursuing the removal of energy subsidies, albeit having previously announced this two years ago. On the restructuring segment, the government announced that it is studying land reclamation in areas outside the Nile basin area as well as outside the country’s borders to overcome land violations during early 2011.
Preview 2012 We expect fertiliser prices to experience additional increases, especially for N types, as food issues need to be addressed quickly, as opposed P segment’s more long-term potential; however, food affordability could lead to food price decreases, thereby muting prices. This provides an opportunity for cost-hedged Orascom Construction Industries (OCIC) to sustain more competitive margins than other N fertiliser players without such hedging. On the local front, we expect the Ministry of Industry to restart the negotiation process for phosphate mining for private companies in late 2012 or in 2013. We believe that the Jordanian phosphate business model could prove beneficial if adopted, according to which the government enters in partnerships or JVs with investors. Further, we do not expect subsidies to be totally abolished in one fell swoop (as implied by recent statements); for fertiliser companies at least, a gradual decrease is much more likely.
Egypt Book 2011/12 | Sector Review
Fertilisers
EFIC | Strong Buy OCIC | Strong Buy
Muhammad El Ebrashi [email protected]
+20 333-18-361
Growing population. Delays in launch of additional capacities will drive up
prices till the end of 2012 or start of 2013. Environmental restrictions on European firms to
stimulate exports. Abundance of phosphate rock and natural gas. Prime export location.
Lack of credit available to farmers. China may lower or remove its export tariff. Recent energy subsidies might be waived. Dependent on sulphur imports, which are negatively
affect companies’ net income following FX and interest rate risks. Private mining licenses may not be issued.
Fertilisers | 52 Wk Performance*
3,000
4,000
5,000
6,000
7,000
8,000
Jan-11 Mar-11 May-11 Jul-11 Sep-11 Nov-11
EGX 30Contracting & Fertilisers (UW)Contracting & Fertilisers (W)
Sector Growth Drivers
Sector Risks
-80%-60%-40%-20%
0%20%40%60%
2009a 2010a 2011e 2012e 2013e 2014e
Revenue EBITDA Net Income
KPIs | 2006-12e
*Comprises all sector stocks constituting CI Capital 100 Index.
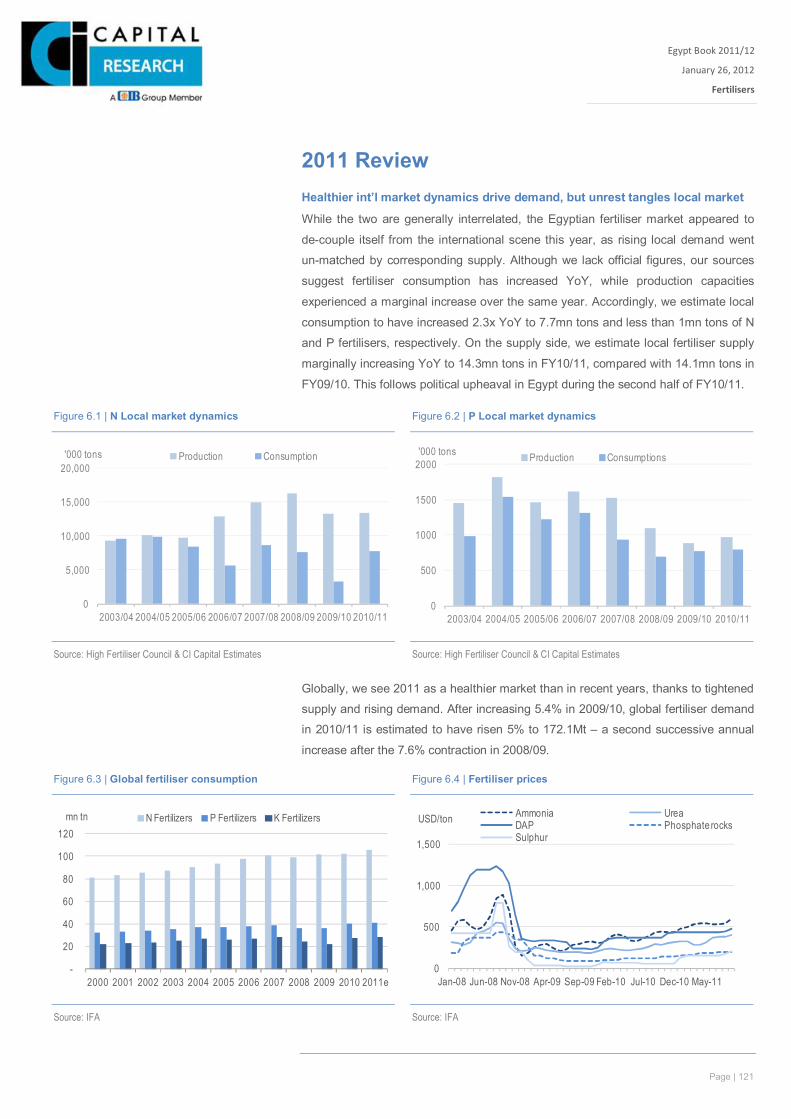
Page | 121
Egypt Book 2011/12
January 26, 2012
Fertilisers
Xxx
2011 Review Healthier int’l market dynamics drive demand, but unrest tangles local market
While the two are generally interrelated, the Egyptian fertiliser market appeared to
de-couple itself from the international scene this year, as rising local demand went
un-matched by corresponding supply. Although we lack official figures, our sources
suggest fertiliser consumption has increased YoY, while production capacities
experienced a marginal increase over the same year. Accordingly, we estimate local
consumption to have increased 2.3x YoY to 7.7mn tons and less than 1mn tons of N
and P fertilisers, respectively. On the supply side, we estimate local fertiliser supply
marginally increasing YoY to 14.3mn tons in FY10/11, compared with 14.1mn tons in
FY09/10. This follows political upheaval in Egypt during the second half of FY10/11.
Globally, we see 2011 as a healthier market than in recent years, thanks to tightened
supply and rising demand. After increasing 5.4% in 2009/10, global fertiliser demand
in 2010/11 is estimated to have risen 5% to 172.1Mt – a second successive annual
increase after the 7.6% contraction in 2008/09.
Figure 6.3 | Global fertiliser consumption Figure 6.4 | Fertiliser prices
Source: IFA
Source: IFA
-
20
40
60
80
100
120
2000 2001 2002 2003 2004 2005 2006 2007 2008 2009 2010 2011e
mn tn N Fertilizers P Fertilizers K Fertilizers
0
500
1,000
1,500
Jan-08 Jun-08 Nov-08 Apr-09 Sep-09 Feb-10 Jul-10 Dec-10 May-11
USD/ton Ammonia UreaDAP Phosphate rocksSulphur
Figure 6.1 | N Local market dynamics Figure 6.2 | P Local market dynamics
Source: High Fertiliser Council & CI Capital Estimates
Source: High Fertiliser Council & CI Capital Estimates
0
5,000
10,000
15,000
20,000
2003/04 2004/05 2005/06 2006/07 2007/08 2008/09 2009/10 2010/11
'000 tons Production Consumption
0
500
1000
1500
2000
2003/04 2004/05 2005/06 2006/07 2007/08 2008/09 2009/10 2010/11
'000 tons Production Consumptions
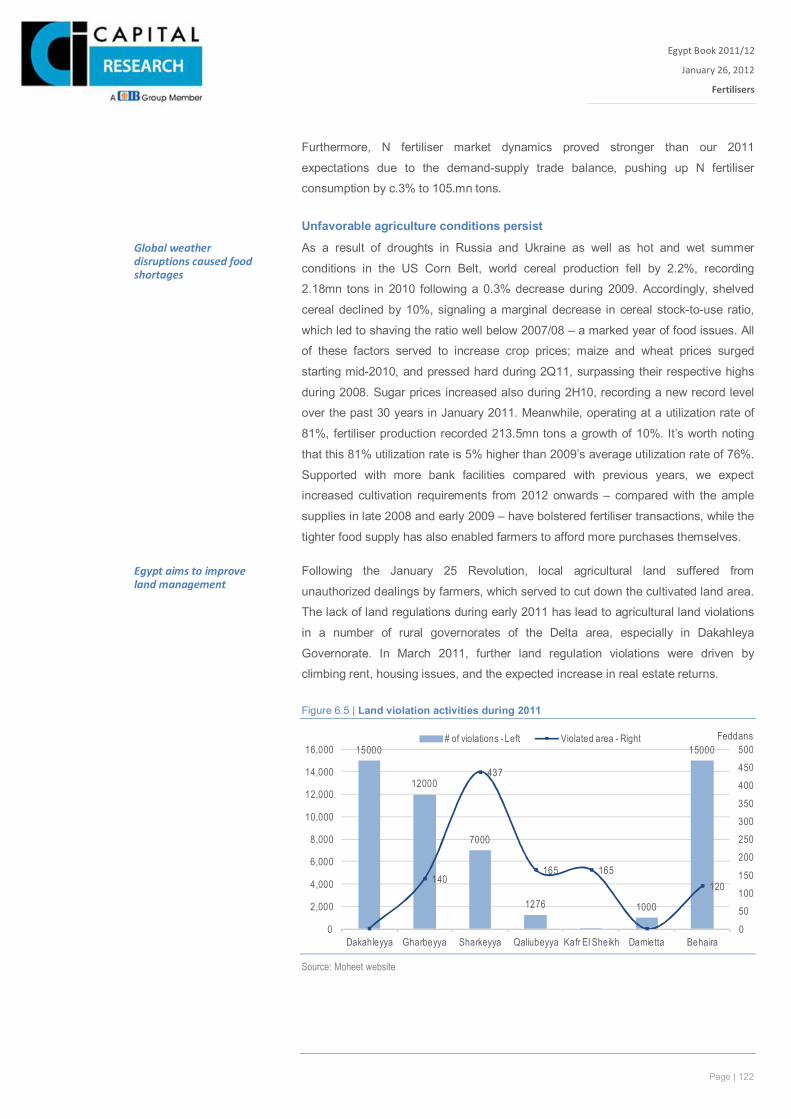
Page | 122
Egypt Book 2011/12
January 26, 2012
Fertilisers
Xxx
Furthermore, N fertiliser market dynamics proved stronger than our 2011
expectations due to the demand-supply trade balance, pushing up N fertiliser
consumption by c.3% to 105.mn tons.
Unfavorable agriculture conditions persist
As a result of droughts in Russia and Ukraine as well as hot and wet summer
conditions in the US Corn Belt, world cereal production fell by 2.2%, recording
2.18mn tons in 2010 following a 0.3% decrease during 2009. Accordingly, shelved
cereal declined by 10%, signaling a marginal decrease in cereal stock-to-use ratio,
which led to shaving the ratio well below 2007/08 – a marked year of food issues. All
of these factors served to increase crop prices; maize and wheat prices surged
starting mid-2010, and pressed hard during 2Q11, surpassing their respective highs
during 2008. Sugar prices increased also during 2H10, recording a new record level
over the past 30 years in January 2011. Meanwhile, operating at a utilization rate of
81%, fertiliser production recorded 213.5mn tons a growth of 10%. It’s worth noting
that this 81% utilization rate is 5% higher than 2009’s average utilization rate of 76%.
Supported with more bank facilities compared with previous years, we expect
increased cultivation requirements from 2012 onwards – compared with the ample
supplies in late 2008 and early 2009 – have bolstered fertiliser transactions, while the
tighter food supply has also enabled farmers to afford more purchases themselves.
Following the January 25 Revolution, local agricultural land suffered from
unauthorized dealings by farmers, which served to cut down the cultivated land area.
The lack of land regulations during early 2011 has lead to agricultural land violations
in a number of rural governorates of the Delta area, especially in Dakahleya
Governorate. In March 2011, further land regulation violations were driven by
climbing rent, housing issues, and the expected increase in real estate returns.
Figure 6.5 | Land violation activities during 2011
Source: Moheet website
15000
12000
7000
1276 1000
15000
140
437
165 165120
050100150200250300350400450500
0
2,000
4,000
6,000
8,000
10,000
12,000
14,000
16,000
Dakahleyya Gharbeyya Sharkeyya Qaliubeyya Kafr El Sheikh Damietta Behaira
Feddans# of violations - Left Violated area - Right
Global weather disruptions caused food shortages
Egypt aims to improve land management
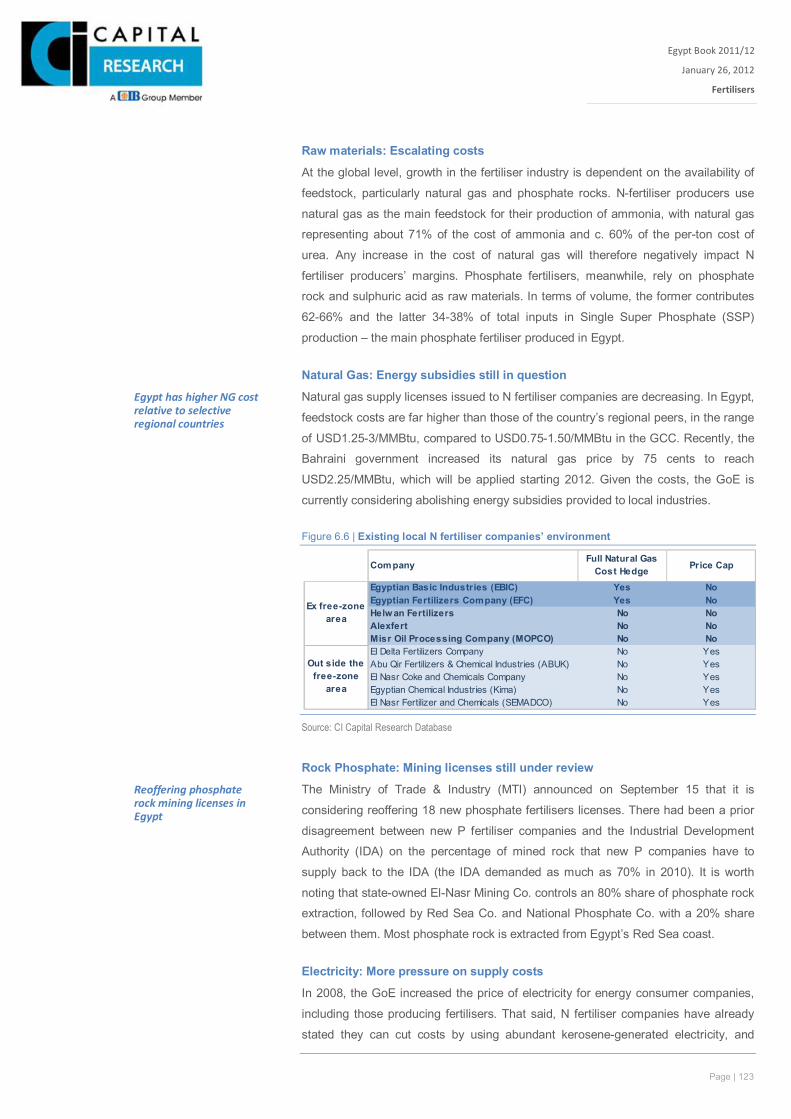
Page | 123
Egypt Book 2011/12
January 26, 2012
Fertilisers
Xxx
Raw materials: Escalating costs
At the global level, growth in the fertiliser industry is dependent on the availability of
feedstock, particularly natural gas and phosphate rocks. N-fertiliser producers use
natural gas as the main feedstock for their production of ammonia, with natural gas
representing about 71% of the cost of ammonia and c. 60% of the per-ton cost of
urea. Any increase in the cost of natural gas will therefore negatively impact N
fertiliser producers’ margins. Phosphate fertilisers, meanwhile, rely on phosphate
rock and sulphuric acid as raw materials. In terms of volume, the former contributes
62-66% and the latter 34-38% of total inputs in Single Super Phosphate (SSP)
production – the main phosphate fertiliser produced in Egypt.
Natural Gas: Energy subsidies still in question
Natural gas supply licenses issued to N fertiliser companies are decreasing. In Egypt,
feedstock costs are far higher than those of the country’s regional peers, in the range
of USD1.25-3/MMBtu, compared to USD0.75-1.50/MMBtu in the GCC. Recently, the
Bahraini government increased its natural gas price by 75 cents to reach
USD2.25/MMBtu, which will be applied starting 2012. Given the costs, the GoE is
currently considering abolishing energy subsidies provided to local industries.
Figure 6.6 | Existing local N fertiliser companies’ environment
Source: CI Capital Research Database
Rock Phosphate: Mining licenses still under review
The Ministry of Trade & Industry (MTI) announced on September 15 that it is
considering reoffering 18 new phosphate fertilisers licenses. There had been a prior
disagreement between new P fertiliser companies and the Industrial Development
Authority (IDA) on the percentage of mined rock that new P companies have to
supply back to the IDA (the IDA demanded as much as 70% in 2010). It is worth
noting that state-owned El-Nasr Mining Co. controls an 80% share of phosphate rock
extraction, followed by Red Sea Co. and National Phosphate Co. with a 20% share
between them. Most phosphate rock is extracted from Egypt’s Red Sea coast.
Electricity: More pressure on supply costs
In 2008, the GoE increased the price of electricity for energy consumer companies,
including those producing fertilisers. That said, N fertiliser companies have already
stated they can cut costs by using abundant kerosene-generated electricity, and
CompanyFull Natural Gas
Cost Hedge Price Cap
Egyptian Basic Industries (EBIC) Yes NoEgyptian Fertilizers Company (EFC) Yes NoHelw an Fertilizers No NoAlexfert No NoMisr Oil Processing Company (MOPCO) No NoEl Delta Fertilizers Company No YesAbu Qir Fertilizers & Chemical Industries (ABUK) No YesEl Nasr Coke and Chemicals Company No YesEgyptian Chemical Industries (Kima) No YesEl Nasr Fertilizer and Chemicals (SEMADCO) No Yes
Ex free-zone area
Out side the free-zone
area
Egypt has higher NG cost relative to selective regional countries
Reoffering phosphate rock mining licenses in Egypt
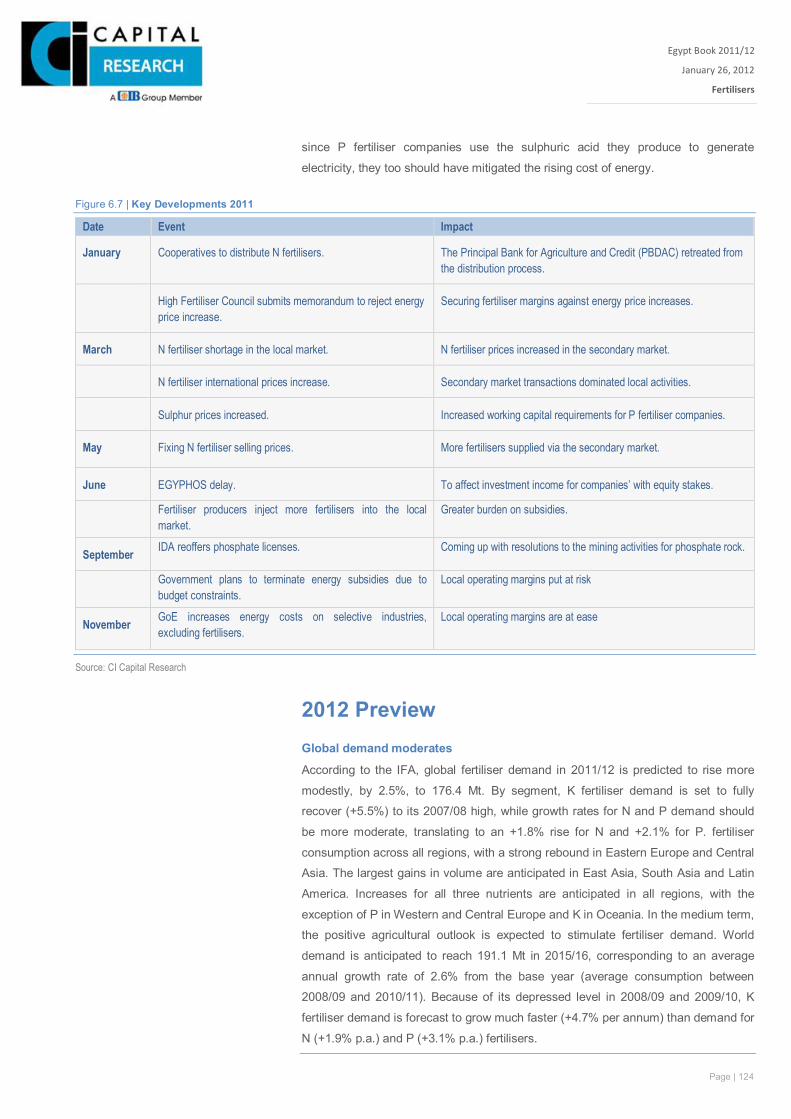
Page | 124
Egypt Book 2011/12
January 26, 2012
Fertilisers
Xxx
since P fertiliser companies use the sulphuric acid they produce to generate
electricity, they too should have mitigated the rising cost of energy.
Figure 6.7 | Key Developments 2011
Date Event Impact
January Cooperatives to distribute N fertilisers. The Principal Bank for Agriculture and Credit (PBDAC) retreated from the distribution process.
High Fertiliser Council submits memorandum to reject energy price increase.
Securing fertiliser margins against energy price increases.
March N fertiliser shortage in the local market. N fertiliser prices increased in the secondary market.
N fertiliser international prices increase. Secondary market transactions dominated local activities.
Sulphur prices increased. Increased working capital requirements for P fertiliser companies.
May Fixing N fertiliser selling prices. More fertilisers supplied via the secondary market.
June EGYPHOS delay. To affect investment income for companies’ with equity stakes.
Fertiliser producers inject more fertilisers into the local market.
Greater burden on subsidies.
September IDA reoffers phosphate licenses. Coming up with resolutions to the mining activities for phosphate rock.
Government plans to terminate energy subsidies due to budget constraints.
Local operating margins put at risk
November GoE increases energy costs on selective industries, excluding fertilisers.
Local operating margins are at ease
Source: CI Capital Research
2012 Preview Global demand moderates
According to the IFA, global fertiliser demand in 2011/12 is predicted to rise more
modestly, by 2.5%, to 176.4 Mt. By segment, K fertiliser demand is set to fully
recover (+5.5%) to its 2007/08 high, while growth rates for N and P demand should
be more moderate, translating to an +1.8% rise for N and +2.1% for P. fertiliser
consumption across all regions, with a strong rebound in Eastern Europe and Central
Asia. The largest gains in volume are anticipated in East Asia, South Asia and Latin
America. Increases for all three nutrients are anticipated in all regions, with the
exception of P in Western and Central Europe and K in Oceania. In the medium term,
the positive agricultural outlook is expected to stimulate fertiliser demand. World
demand is anticipated to reach 191.1 Mt in 2015/16, corresponding to an average
annual growth rate of 2.6% from the base year (average consumption between
2008/09 and 2010/11). Because of its depressed level in 2008/09 and 2009/10, K
fertiliser demand is forecast to grow much faster (+4.7% per annum) than demand for
N (+1.9% p.a.) and P (+3.1% p.a.) fertilisers.
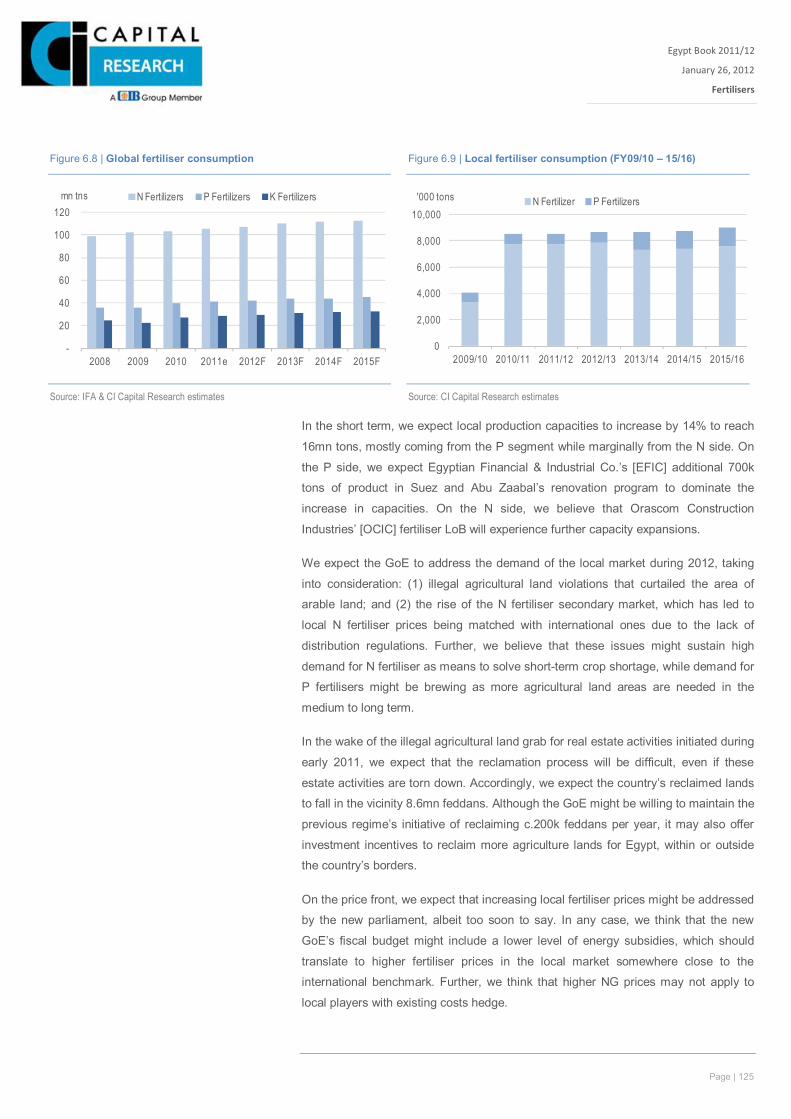
Page | 125
Egypt Book 2011/12
January 26, 2012
Fertilisers
Xxx
In the short term, we expect local production capacities to increase by 14% to reach
16mn tons, mostly coming from the P segment while marginally from the N side. On
the P side, we expect Egyptian Financial & Industrial Co.’s [EFIC] additional 700k
tons of product in Suez and Abu Zaabal’s renovation program to dominate the
increase in capacities. On the N side, we believe that Orascom Construction
Industries’ [OCIC] fertiliser LoB will experience further capacity expansions.
We expect the GoE to address the demand of the local market during 2012, taking
into consideration: (1) illegal agricultural land violations that curtailed the area of
arable land; and (2) the rise of the N fertiliser secondary market, which has led to
local N fertiliser prices being matched with international ones due to the lack of
distribution regulations. Further, we believe that these issues might sustain high
demand for N fertiliser as means to solve short-term crop shortage, while demand for
P fertilisers might be brewing as more agricultural land areas are needed in the
medium to long term.
In the wake of the illegal agricultural land grab for real estate activities initiated during
early 2011, we expect that the reclamation process will be difficult, even if these
estate activities are torn down. Accordingly, we expect the country’s reclaimed lands
to fall in the vicinity 8.6mn feddans. Although the GoE might be willing to maintain the
previous regime’s initiative of reclaiming c.200k feddans per year, it may also offer
investment incentives to reclaim more agriculture lands for Egypt, within or outside
the country’s borders.
On the price front, we expect that increasing local fertiliser prices might be addressed
by the new parliament, albeit too soon to say. In any case, we think that the new
GoE’s fiscal budget might include a lower level of energy subsidies, which should
translate to higher fertiliser prices in the local market somewhere close to the
international benchmark. Further, we think that higher NG prices may not apply to
local players with existing costs hedge.
Figure 6.8 | Global fertiliser consumption Figure 6.9 | Local fertiliser consumption (FY09/10 – 15/16)
Source: IFA & CI Capital Research estimates
Source: CI Capital Research estimates
-
20
40
60
80
100
120
2008 2009 2010 2011e 2012F 2013F 2014F 2015F
mn tns N Fertilizers P Fertilizers K Fertilizers
0
2,000
4,000
6,000
8,000
10,000
2009/10 2010/11 2011/12 2012/13 2013/14 2014/15 2015/16
'000 tons N Fertilizer P Fertilizers
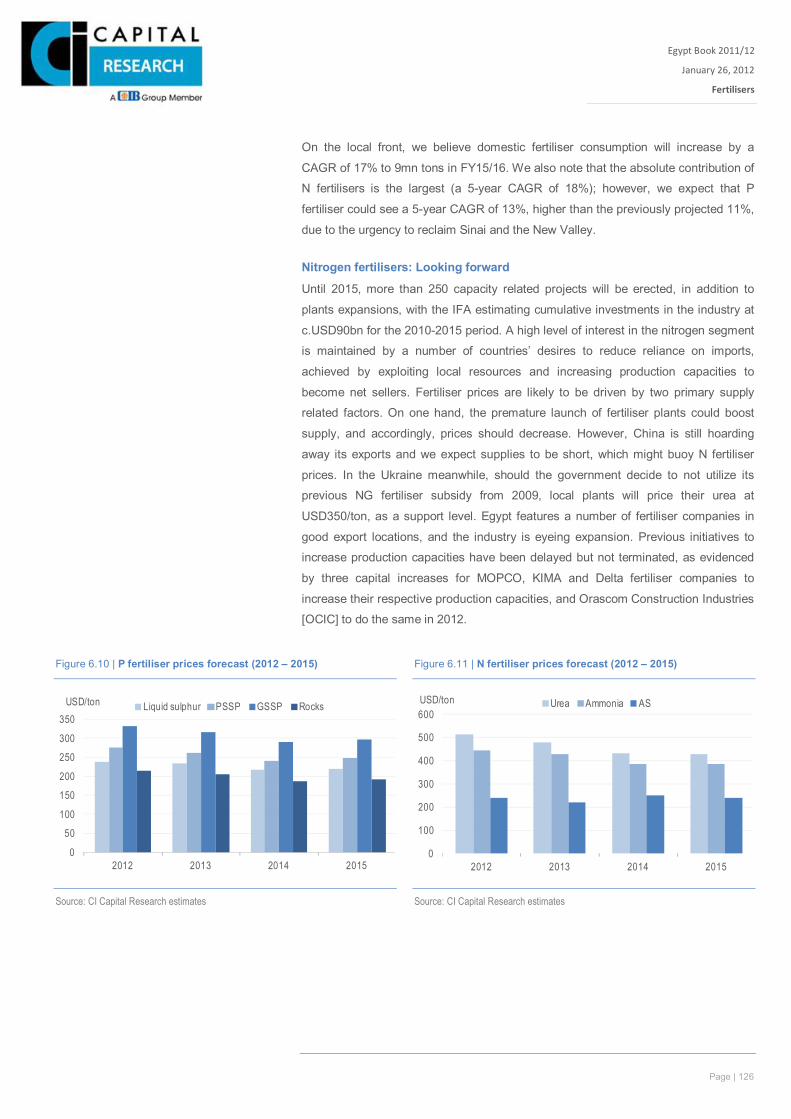
Page | 126
Egypt Book 2011/12
January 26, 2012
Fertilisers
Xxx
On the local front, we believe domestic fertiliser consumption will increase by a
CAGR of 17% to 9mn tons in FY15/16. We also note that the absolute contribution of
N fertilisers is the largest (a 5-year CAGR of 18%); however, we expect that P
fertiliser could see a 5-year CAGR of 13%, higher than the previously projected 11%,
due to the urgency to reclaim Sinai and the New Valley.
Nitrogen fertilisers: Looking forward
Until 2015, more than 250 capacity related projects will be erected, in addition to
plants expansions, with the IFA estimating cumulative investments in the industry at
c.USD90bn for the 2010-2015 period. A high level of interest in the nitrogen segment
is maintained by a number of countries’ desires to reduce reliance on imports,
achieved by exploiting local resources and increasing production capacities to
become net sellers. Fertiliser prices are likely to be driven by two primary supply
related factors. On one hand, the premature launch of fertiliser plants could boost
supply, and accordingly, prices should decrease. However, China is still hoarding
away its exports and we expect supplies to be short, which might buoy N fertiliser
prices. In the Ukraine meanwhile, should the government decide to not utilize its
previous NG fertiliser subsidy from 2009, local plants will price their urea at
USD350/ton, as a support level. Egypt features a number of fertiliser companies in
good export locations, and the industry is eyeing expansion. Previous initiatives to
increase production capacities have been delayed but not terminated, as evidenced
by three capital increases for MOPCO, KIMA and Delta fertiliser companies to
increase their respective production capacities, and Orascom Construction Industries
[OCIC] to do the same in 2012.
Figure 6.10 | P fertiliser prices forecast (2012 – 2015) Figure 6.11 | N fertiliser prices forecast (2012 – 2015)
Source: CI Capital Research estimates
Source: CI Capital Research estimates
0
50
100
150
200
250
300
350
2012 2013 2014 2015
USD/ton Liquid sulphur PSSP GSSP Rocks
0
100
200
300
400
500
600
2012 2013 2014 2015
USD/ton Urea Ammonia AS
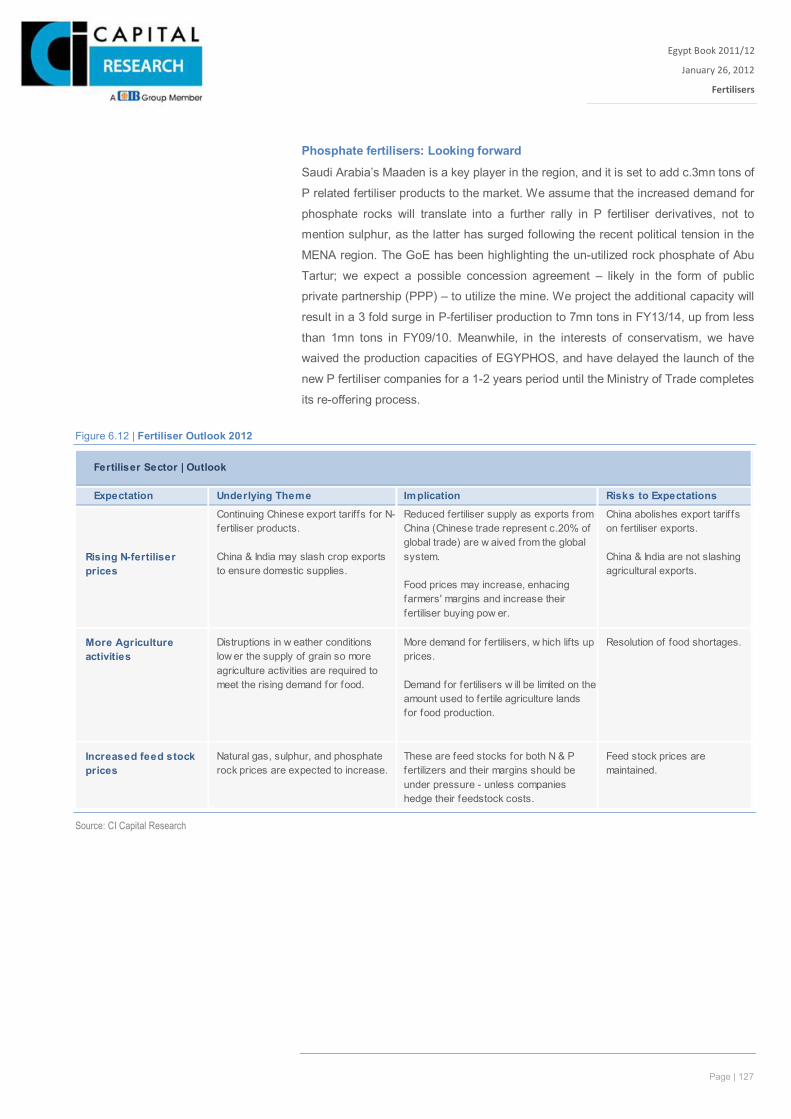
Page | 127
Egypt Book 2011/12
January 26, 2012
Fertilisers
Xxx
Phosphate fertilisers: Looking forward
Saudi Arabia’s Maaden is a key player in the region, and it is set to add c.3mn tons of
P related fertiliser products to the market. We assume that the increased demand for
phosphate rocks will translate into a further rally in P fertiliser derivatives, not to
mention sulphur, as the latter has surged following the recent political tension in the
MENA region. The GoE has been highlighting the un-utilized rock phosphate of Abu
Tartur; we expect a possible concession agreement – likely in the form of public
private partnership (PPP) – to utilize the mine. We project the additional capacity will
result in a 3 fold surge in P-fertiliser production to 7mn tons in FY13/14, up from less
than 1mn tons in FY09/10. Meanwhile, in the interests of conservatism, we have
waived the production capacities of EGYPHOS, and have delayed the launch of the
new P fertiliser companies for a 1-2 years period until the Ministry of Trade completes
its re-offering process.
Figure 6.12 | Fertiliser Outlook 2012
Source: CI Capital Research
Fertiliser Sector | Outlook
Expectation Underlying Theme Implication Risks to Expectations
Rising N-fertiliser prices
Continuing Chinese export tariffs for N-fertiliser products.
China & India may slash crop exports to ensure domestic supplies.
Reduced fertiliser supply as exports from China (Chinese trade represent c.20% of global trade) are w aived from the global system.
Food prices may increase, enhacing farmers' margins and increase their fertiliser buying pow er.
China abolishes export tarif fs on fertiliser exports.
China & India are not slashing agricultural exports.
More Agriculture activities
Distruptions in w eather conditions low er the supply of grain so more agriculture activities are required to meet the rising demand for food.
More demand for fertilisers, w hich lifts up prices.
Demand for fertilisers w ill be limited on the amount used to fertile agriculture lands for food production.
Resolution of food shortages.
Increased feed stock prices
Natural gas, sulphur, and phosphate rock prices are expected to increase.
These are feed stocks for both N & P fertilizers and their margins should be under pressure - unless companies hedge their feedstock costs.
Feed stock prices are maintained.
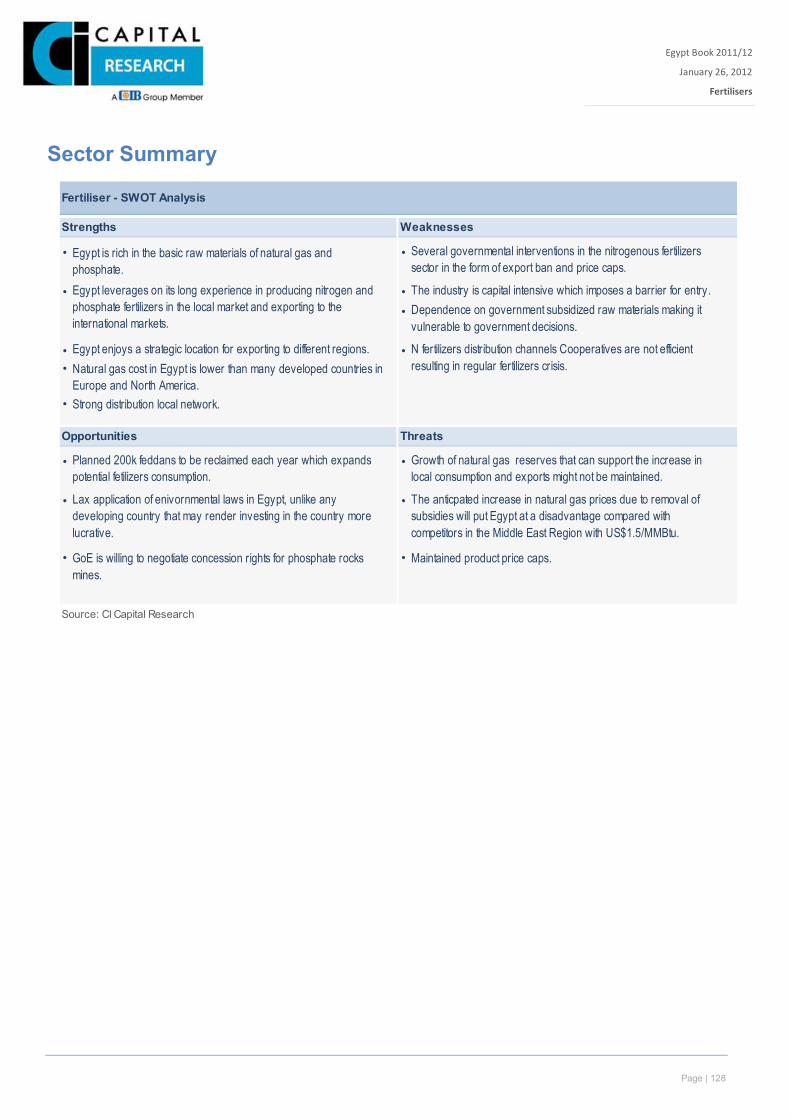
Page | 128
Egypt Book 2011/12
January 26, 2012
Fertilisers
Xxx
Sector Summary
Fertiliser - SWOT Analysis
Strengths Weaknesses
• •
• • The industry is capital intensive which imposes a barrier for entry.•
• Egypt enjoys a strategic location for exporting to different regions. •• Natural gas cost in Egypt is lower than many developed countries in
Europe and North America.• Strong distribution local network.
Opportunities Threats
• •
• •
• GoE is willing to negotiate concession rights for phosphate rocks mines.
• Maintained product price caps.
Source: CI Capital Research
Planned 200k feddans to be reclaimed each year which expands potential fetilizers consumption.
Lax application of enivornmental laws in Egypt, unlike any developing country that may render investing in the country more lucrative.
Growth of natural gas reserves that can support the increase in local consumption and exports might not be maintained.
The anticpated increase in natural gas prices due to removal of subsidies will put Egypt at a disadvantage compared with competitors in the Middle East Region with US$1.5/MMBtu.
Egypt is rich in the basic raw materials of natural gas and phosphate.Egypt leverages on its long experience in producing nitrogen and phosphate fertilizers in the local market and exporting to the international markets.
Several governmental interventions in the nitrogenous fertilizers sector in the form of export ban and price caps.
Dependence on government subsidized raw materials making it vulnerable to government decisions.
N fertilizers distribution channels Cooperatives are not efficient resulting in regular fertilizers crisis.
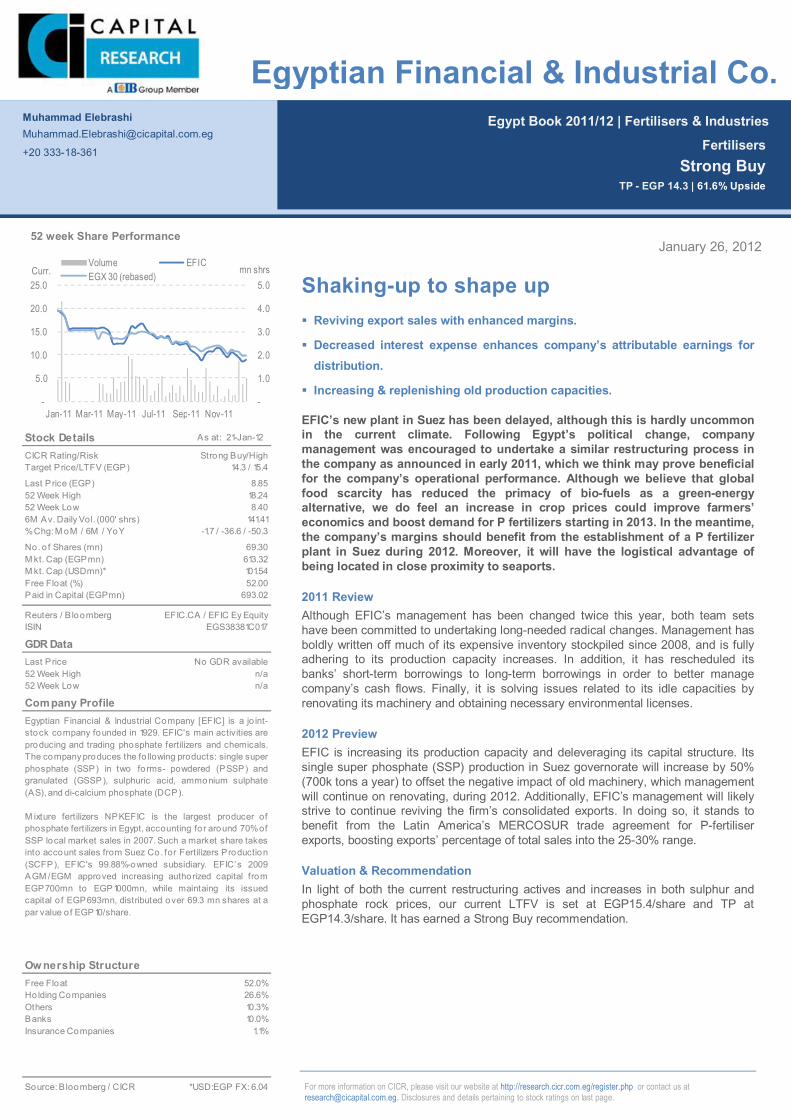
Page | 129
Egypt Book 2011/12 | Fertilisers & Industries
For more information on CICR, please visit our website at http://research.cicr.com.eg/register.php or contact us at [email protected]. Disclosures and details pertaining to stock ratings on last page.
January 26, 2012
Shaking-up to shape up Reviving export sales with enhanced margins.
Decreased interest expense enhances company’s attributable earnings for distribution.
Increasing & replenishing old production capacities.
EFIC’s new plant in Suez has been delayed, although this is hardly uncommon in the current climate. Following Egypt’s political change, company management was encouraged to undertake a similar restructuring process in the company as announced in early 2011, which we think may prove beneficial for the company’s operational performance. Although we believe that global food scarcity has reduced the primacy of bio-fuels as a green-energy alternative, we do feel an increase in crop prices could improve farmers’ economics and boost demand for P fertilizers starting in 2013. In the meantime, the company’s margins should benefit from the establishment of a P fertilizer plant in Suez during 2012. Moreover, it will have the logistical advantage of being located in close proximity to seaports.
2011 Review Although EFIC’s management has been changed twice this year, both team sets have been committed to undertaking long-needed radical changes. Management has boldly written off much of its expensive inventory stockpiled since 2008, and is fully adhering to its production capacity increases. In addition, it has rescheduled its banks’ short-term borrowings to long-term borrowings in order to better manage company’s cash flows. Finally, it is solving issues related to its idle capacities by renovating its machinery and obtaining necessary environmental licenses.
2012 Preview EFIC is increasing its production capacity and deleveraging its capital structure. Its single super phosphate (SSP) production in Suez governorate will increase by 50% (700k tons a year) to offset the negative impact of old machinery, which management will continue on renovating, during 2012. Additionally, EFIC’s management will likely strive to continue reviving the firm’s consolidated exports. In doing so, it stands to benefit from the Latin America’s MERCOSUR trade agreement for P-fertiliser exports, boosting exports’ percentage of total sales into the 25-30% range.
Valuation & Recommendation In light of both the current restructuring actives and increases in both sulphur and phosphate rock prices, our current LTFV is set at EGP15.4/share and TP at EGP14.3/share. It has earned a Strong Buy recommendation.
Muhammad Elebrashi [email protected]
+20 333-18-361
Fertilisers Strong Buy
TP - EGP 14.3 | 61.6% Upside
Egyptian Financial & Industrial Co.
Stock Details As at: 21-Jan-12
CICR Rating/RiskTarget Price/LTFV (EGP)
Last Price (EGP)52 Week High52 Week Low6M Av. Daily Vol. (000' shrs)% Chg: M oM / 6M / YoY
No. o f Shares (mn)M kt. Cap (EGPmn)M kt. Cap (USDmn)*Free Float (%)Paid in Capital (EGPmn)
Reuters / B loombergISIN
GDR DataLast Price52 Week High52 Week Low
Company Profile
Ow nership StructureFree Float 52.0%Holding Companies 26.6%Others 10.3%Banks 10.0%Insurance Companies 1.1%
Source: B loomberg / CICR *USD:EGP FX: 6.04
Egyptian Financial & Industrial Company [EFIC] is a jo int-stock company founded in 1929. EFIC's main activities areproducing and trading phosphate fertilizers and chemicals.The company produces the fo llowing products: single superphosphate (SSP) in two forms- powdered (PSSP) andgranulated (GSSP), sulphuric acid, ammonium sulphate(AS), and di-calcium phosphate (DCP).
M ixture fertilizers NPKEFIC is the largest producer ofphosphate fertilizers in Egypt, accounting for around 70%ofSSP local market sales in 2007. Such a market share takesinto account sales from Suez Co. for Fertilizers Production(SCFP), EFIC's 99.88%-owned subsidiary. EFIC’s 2009AGM /EGM approved increasing authorized capital fromEGP700mn to EGP1000mn, while maintaing its issuedcapital o f EGP693mn, distributed over 69.3 mn shares at apar value o f EGP10/share.
18.248.40
69.30
141.41
EFIC.CA / EFIC Ey Equity
101.54
-1.7 / -36.6 / -50.3
693.02
613.32
No GDR availablen/a
52.00
EGS38381C017
n/a
14.3 / 15.4
8.85
Strong Buy/High
-
1.0
2.0
3.0
4.0
5.0
-
5.0
10.0
15.0
20.0
25.0
Jan-11 Mar-11 May-11 Jul-11 Sep-11 Nov-11
mn shrsCurr.Volume EFICEGX 30 (rebased)
52 week Share Performance
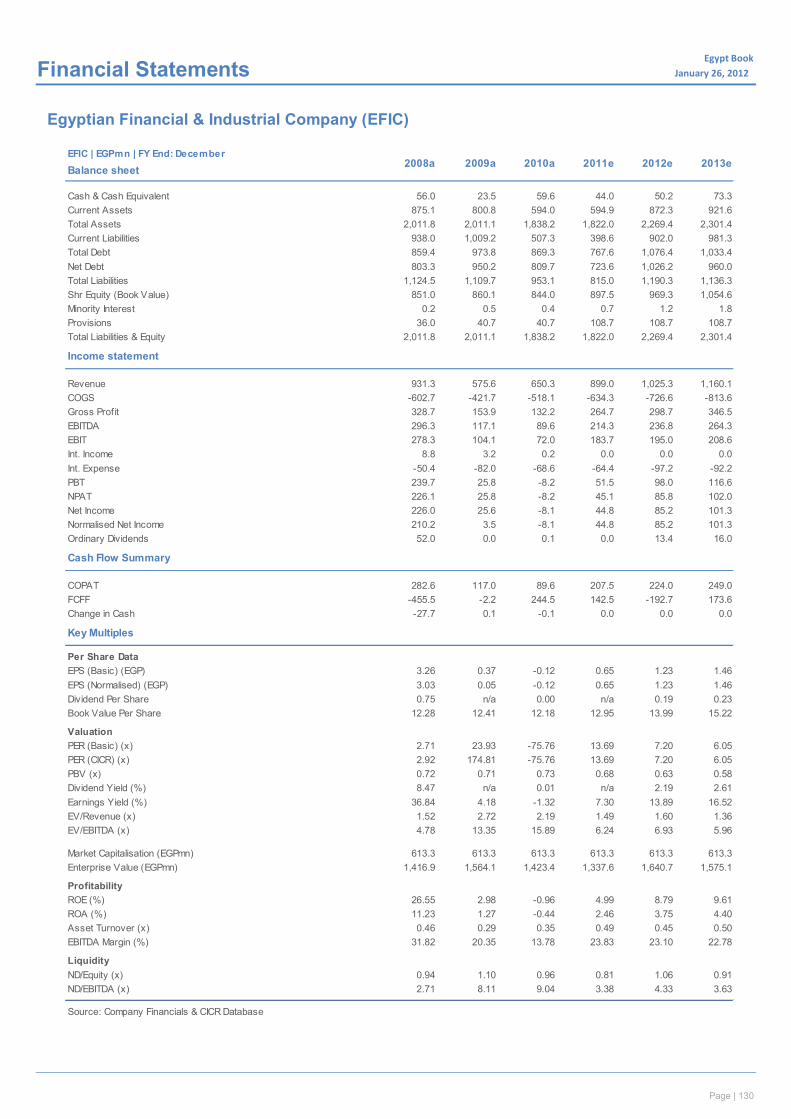
Page | 130
Egypt Book January 26, 2012x Financial Statements
Egyptian Financial & Industrial Company (EFIC)
EFIC | EGPmn | FY End: December
Balance sheet
Cash & Cash Equivalent 56.0 23.5 59.6 44.0 50.2 73.3Current Assets 875.1 800.8 594.0 594.9 872.3 921.6Total Assets 2,011.8 2,011.1 1,838.2 1,822.0 2,269.4 2,301.4Current Liabilities 938.0 1,009.2 507.3 398.6 902.0 981.3Total Debt 859.4 973.8 869.3 767.6 1,076.4 1,033.4Net Debt 803.3 950.2 809.7 723.6 1,026.2 960.0Total Liabilities 1,124.5 1,109.7 953.1 815.0 1,190.3 1,136.3Shr Equity (Book Value) 851.0 860.1 844.0 897.5 969.3 1,054.6Minority Interest 0.2 0.5 0.4 0.7 1.2 1.8Provisions 36.0 40.7 40.7 108.7 108.7 108.7Total Liabilities & Equity 2,011.8 2,011.1 1,838.2 1,822.0 2,269.4 2,301.4
Income statement
Revenue 931.3 575.6 650.3 899.0 1,025.3 1,160.1COGS -602.7 -421.7 -518.1 -634.3 -726.6 -813.6Gross Profit 328.7 153.9 132.2 264.7 298.7 346.5EBITDA 296.3 117.1 89.6 214.3 236.8 264.3EBIT 278.3 104.1 72.0 183.7 195.0 208.6Int. Income 8.8 3.2 0.2 0.0 0.0 0.0Int. Expense -50.4 -82.0 -68.6 -64.4 -97.2 -92.2PBT 239.7 25.8 -8.2 51.5 98.0 116.6NPAT 226.1 25.8 -8.2 45.1 85.8 102.0Net Income 226.0 25.6 -8.1 44.8 85.2 101.3Normalised Net Income 210.2 3.5 -8.1 44.8 85.2 101.3Ordinary Dividends 52.0 0.0 0.1 0.0 13.4 16.0
Cash Flow Summary
COPAT 282.6 117.0 89.6 207.5 224.0 249.0FCFF -455.5 -2.2 244.5 142.5 -192.7 173.6Change in Cash -27.7 0.1 -0.1 0.0 0.0 0.0
Key Multiples
Per Share DataEPS (Basic) (EGP) 3.26 0.37 -0.12 0.65 1.23 1.46EPS (Normalised) (EGP) 3.03 0.05 -0.12 0.65 1.23 1.46Dividend Per Share 0.75 n/a 0.00 n/a 0.19 0.23Book Value Per Share 12.28 12.41 12.18 12.95 13.99 15.22
ValuationPER (Basic) (x) 2.71 23.93 -75.76 13.69 7.20 6.05PER (CICR) (x) 2.92 174.81 -75.76 13.69 7.20 6.05PBV (x) 0.72 0.71 0.73 0.68 0.63 0.58Dividend Yield (%) 8.47 n/a 0.01 n/a 2.19 2.61Earnings Yield (%) 36.84 4.18 -1.32 7.30 13.89 16.52EV/Revenue (x) 1.52 2.72 2.19 1.49 1.60 1.36EV/EBITDA (x) 4.78 13.35 15.89 6.24 6.93 5.96
Market Capitalisation (EGPmn) 613.3 613.3 613.3 613.3 613.3 613.3Enterprise Value (EGPmn) 1,416.9 1,564.1 1,423.4 1,337.6 1,640.7 1,575.1
ProfitabilityROE (%) 26.55 2.98 -0.96 4.99 8.79 9.61ROA (%) 11.23 1.27 -0.44 2.46 3.75 4.40Asset Turnover (x) 0.46 0.29 0.35 0.49 0.45 0.50EBITDA Margin (%) 31.82 20.35 13.78 23.83 23.10 22.78
LiquidityND/Equity (x) 0.94 1.10 0.96 0.81 1.06 0.91ND/EBITDA (x) 2.71 8.11 9.04 3.38 4.33 3.63
Source: Company Financials & CICR Database
2008a 2009a 2010a 2011e 2012e 2013e

Page | 131
Egypt Book 2011/12 | Fertilisers & Industries
For more information on CICR, please visit our website at http://research.cicr.com.eg/register.php or contact us at [email protected]. Disclosures and details pertaining to stock ratings on last page.
January 26, 2012
Leveraging a wide reach Firm fertilizer prices reflecting positively on fertilizer LoB
Contracting business may rebound alongside MENA rebuilding plans.
Possible M&As facilitated by strong cash position
The fertilizer line of business (LoB) showed outstanding performance throughout 2011, and we expect that it will continue its strong showing in 2012 following our expectations for a marginal increase in fertilizer prices. Meanwhile, the contracting LoB may start to gear up alongside infrastructure rebuilding plans throughout the MENA region. This is signalled by the boost in the company’s backlog in 3Q11, its secondincrease after six consequtive quarters of declining balances. Further, the company had a cash balance of c.USD1.6bn at the end of September 2011, facilitating any potential M&A process.
2011 Review The fertilizers LoB was a high-performer in 2011, and the contracting LoB started to pick up, as evident in the company’s backlog, which increased twice during 2011, to record c.USD6bn. Fertilizers prices followed our YoY increased expectations, while the contracting LoB’s backlog started building mid-2011 after having dropped over the previous six quarters from 4Q09 to 1Q11. Building on 2010 acquisitions, OCI acquired a US manufacturing fertilizer company, in a deal through OCI Nitrogen, a 100% owned subsidiary of OCI. The firm currently conducts operations in Europe, North Africa, Far East Asia, and most recently, the US. After sealing successful loan deals, OCI had a cash balance of c.USD1.6bn at end of 3Q11.
2012 Preview OCI looks to be holding steady for the coming year. We believe rising nitrogen fertilizer prices bode well for OCI’s performance in 2012 – especially in light of its fixed natural gas costs and growing global manufacturing and distribution network. Moreover, the growing numbers of infrastructure projects in the MEA region and Eastern Asia should add to the firm’s backlog, which is expected to grow by an 8% CAGR over 2011-15. OCI’s large cash position should facilitate any potential acquisitions, and the company’s investment income, which is generated from its ownership in a number of fertilizer and contracting companies, may make an increasing contribution to its consolidated net income over the coming period.
Valuation & Recommendation OCI’s management is likely to leverage its geographically-diverse business model in order to tap global opportunities for both the fertilizer and contracting segments. Our current rating is Strong Buy with a LTFV of EGP377/share and a TP of EGP294/share.
Muhammad Elebrashi [email protected]
+20 333-18-361
Contracting Strong Buy
TP - EGP 297 | 35.1% Upside
Orascom Construction Industries
Stock Details As at: 21-Jan-12
CICR Rating/RiskTarget Price/LTFV (EGP)
Last Price (EGP)52 Week High52 Week Low6M Av. Daily Vol. (000' shrs)% Chg: M oM / 6M / YoY
No. o f Shares (mn)M kt. Cap (EGPmn)M kt. Cap (USDmn)*Free Float (%)Paid in Capital (EGPmn)
Reuters / B loombergISIN
GDR DataLast Price (USD)52 Week High52 Week Low
Company Profile
Ow nership StructureSawiris Family 56.0%Free Float 44.0%
Source: B loomberg / CICR *USD:EGP FX: 6.04
Orascom Construction Industries [OCIC] was incorporatedunder Law No. 159/1981 in April 1998 as a shareholdingcompany, to undertake contracting business and otherrelated activities. OCIC's operations include constructionand fertilisers (nitrogen) and, in 1999 when it was listed onthe EGX, it entered the cement business. In January 2008,OCIC divested its cement segment to Lafarge S.A. in a dealworth EUR8.8bn (USD12.9bn) and assumed USD2bn in debt.
2008 also marked OCIC’s first venture into the fertiliserindustry through its USD1.59 merger with Egyptian FertilizersCompany (EFC). Through EFC, OCIC owns a 20% stake inNotore Fertilizers, a Nigerian company. In addition, OCICowns 60% of Egyptian Basic Industries Company (EBIC),another Egyptian fertiliser manufacturer. A third fertiliserplant, Sorfert, is underway in Algeria, to be launched in 2H10,whilst OCIC has also acquired a 20%stake in Gavilon, a USfertiliser distribution company. OCIC is reported to alsohave considered a DAP/M AP (phosphate fertilisers)pro ject in either A lgeria o r M orocco.
290.00183.94
206.92
92.45
OCIC.CA / OCIC Ey Equity
7,529.91
6.6 / -17.5 / -18.6
1,044.70
45,480.66
37.0648.99
56.00
EGS65901C018
31.27
297 / 377
219.80
Strong Buy/M oderate
-
0.5
1.0
1.5
2.0
2.5
-50.0
100.0 150.0 200.0 250.0 300.0 350.0
Jan-11 Mar-11 May-11 Jul-11 Sep-11 Nov-11
mn shrsCurr.Volume OCICEGX 30 (rebased)
52 week Share Performance
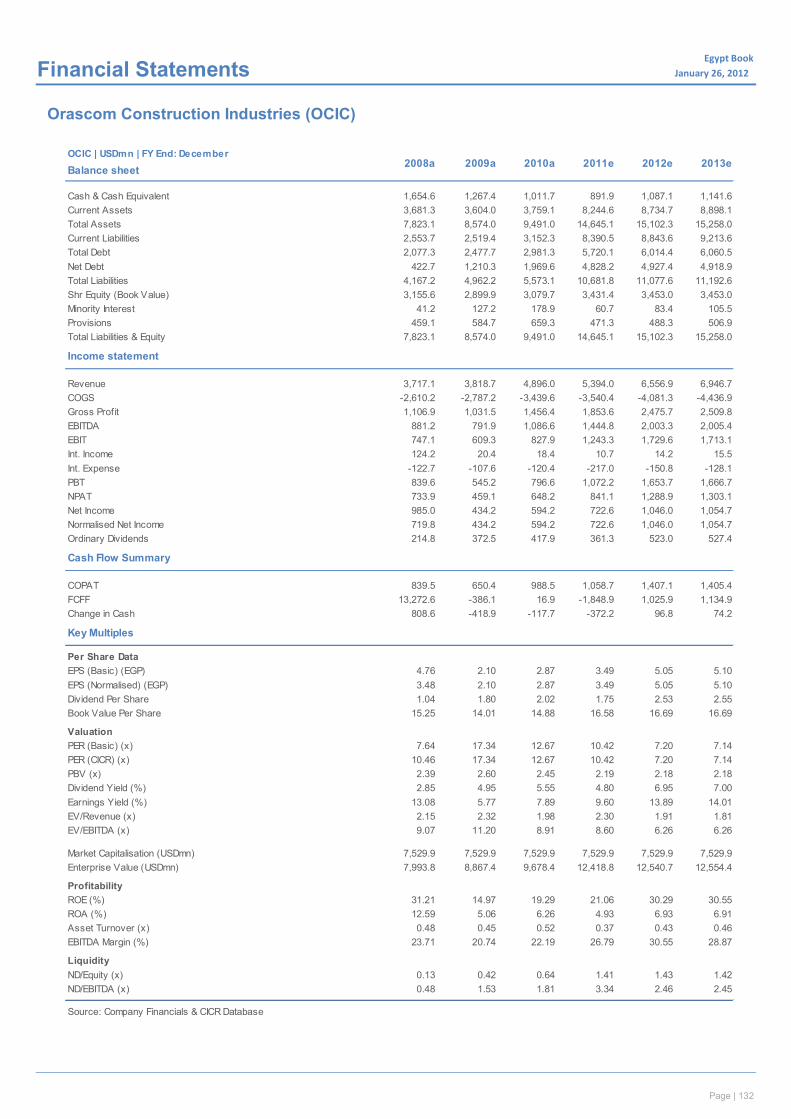
Page | 132
Egypt Book January 26, 2012x Financial Statements
Orascom Construction Industries (OCIC)
OCIC | USDmn | FY End: December
Balance sheet
Cash & Cash Equivalent 1,654.6 1,267.4 1,011.7 891.9 1,087.1 1,141.6Current Assets 3,681.3 3,604.0 3,759.1 8,244.6 8,734.7 8,898.1Total Assets 7,823.1 8,574.0 9,491.0 14,645.1 15,102.3 15,258.0Current Liabilities 2,553.7 2,519.4 3,152.3 8,390.5 8,843.6 9,213.6Total Debt 2,077.3 2,477.7 2,981.3 5,720.1 6,014.4 6,060.5Net Debt 422.7 1,210.3 1,969.6 4,828.2 4,927.4 4,918.9Total Liabilities 4,167.2 4,962.2 5,573.1 10,681.8 11,077.6 11,192.6Shr Equity (Book Value) 3,155.6 2,899.9 3,079.7 3,431.4 3,453.0 3,453.0Minority Interest 41.2 127.2 178.9 60.7 83.4 105.5Provisions 459.1 584.7 659.3 471.3 488.3 506.9Total Liabilities & Equity 7,823.1 8,574.0 9,491.0 14,645.1 15,102.3 15,258.0
Income statement
Revenue 3,717.1 3,818.7 4,896.0 5,394.0 6,556.9 6,946.7COGS -2,610.2 -2,787.2 -3,439.6 -3,540.4 -4,081.3 -4,436.9Gross Profit 1,106.9 1,031.5 1,456.4 1,853.6 2,475.7 2,509.8EBITDA 881.2 791.9 1,086.6 1,444.8 2,003.3 2,005.4EBIT 747.1 609.3 827.9 1,243.3 1,729.6 1,713.1Int. Income 124.2 20.4 18.4 10.7 14.2 15.5Int. Expense -122.7 -107.6 -120.4 -217.0 -150.8 -128.1PBT 839.6 545.2 796.6 1,072.2 1,653.7 1,666.7NPAT 733.9 459.1 648.2 841.1 1,288.9 1,303.1Net Income 985.0 434.2 594.2 722.6 1,046.0 1,054.7Normalised Net Income 719.8 434.2 594.2 722.6 1,046.0 1,054.7Ordinary Dividends 214.8 372.5 417.9 361.3 523.0 527.4
Cash Flow Summary
COPAT 839.5 650.4 988.5 1,058.7 1,407.1 1,405.4FCFF 13,272.6 -386.1 16.9 -1,848.9 1,025.9 1,134.9Change in Cash 808.6 -418.9 -117.7 -372.2 96.8 74.2
Key Multiples
Per Share DataEPS (Basic) (EGP) 4.76 2.10 2.87 3.49 5.05 5.10EPS (Normalised) (EGP) 3.48 2.10 2.87 3.49 5.05 5.10Dividend Per Share 1.04 1.80 2.02 1.75 2.53 2.55Book Value Per Share 15.25 14.01 14.88 16.58 16.69 16.69
ValuationPER (Basic) (x) 7.64 17.34 12.67 10.42 7.20 7.14PER (CICR) (x) 10.46 17.34 12.67 10.42 7.20 7.14PBV (x) 2.39 2.60 2.45 2.19 2.18 2.18Dividend Yield (%) 2.85 4.95 5.55 4.80 6.95 7.00Earnings Yield (%) 13.08 5.77 7.89 9.60 13.89 14.01EV/Revenue (x) 2.15 2.32 1.98 2.30 1.91 1.81EV/EBITDA (x) 9.07 11.20 8.91 8.60 6.26 6.26
Market Capitalisation (USDmn) 7,529.9 7,529.9 7,529.9 7,529.9 7,529.9 7,529.9Enterprise Value (USDmn) 7,993.8 8,867.4 9,678.4 12,418.8 12,540.7 12,554.4
ProfitabilityROE (%) 31.21 14.97 19.29 21.06 30.29 30.55ROA (%) 12.59 5.06 6.26 4.93 6.93 6.91Asset Turnover (x) 0.48 0.45 0.52 0.37 0.43 0.46EBITDA Margin (%) 23.71 20.74 22.19 26.79 30.55 28.87
LiquidityND/Equity (x) 0.13 0.42 0.64 1.41 1.43 1.42ND/EBITDA (x) 0.48 1.53 1.81 3.34 2.46 2.45
Source: Company Financials & CICR Database
2008a 2009a 2010a 2011e 2012e 2013e

Page | 133
Egypt Book 2011/12 | Fertilisers & Industries
For more information on CICR, please visit our website at http://research.cicr.com.eg/register.php or contact us at [email protected]. Disclosures and details pertaining to stock ratings on last page.
January 26, 2012
Business opportunities amidst Arab Spring Management reviewing business model to meet demands of politically-
reshaped MENA region while securing operating assets.
Looking for wind energy business opportunities in the MEA region.
With EGP1bn cash position as of Sep 30, M&A activity is possible.
SWDY’s business model is under review as management searches for ways to dodge the negative side-effects of the Arab Spring. Recent expansions outside the Arab region may benefit company’s operations, especially on the wire & cable front, while the company’s turnkey LoB may turn out to be the black horse, with a number of contracting projects in the pipeline for the MEA region. Finally, wind energy should see significant attention from management in the pursuit of new projects.
2011 Review SWDY’s operations in 2011 depended heavily on its turnkey and wire & cable lines of business (LoB).On the core operations front, the wire & cables LoB was positively affected by the decrease in copper prices, which also positively affected interest expense following the decline in segment’s working capital requirements. During the Arab Spring, the firm’s management is flexing its business model to address the ever-changing demands of the regional unrest. Early in 2011, SWDY put its Libyan investments on indefinite hold and pulled out of Yemen, while maintaining its Syrian presence to date. In the wind LoB, the company has made proposals to several governments, including Ethiopia, to invest in wind farms. Investment tickets were in the vicinity of USD200-300mn; however, they are still under review.
2012 Preview We believe that SWDY’s operations might continue to focus on the existing activities of the turnkey and wire & cables LoBs over the short term, with possible prospects for the wind segment. We also expect North African countries to undertake reconstruction plans, which could hold a number of opportunities, building the backlog for the turnkey LoB. On the GCC front, we expect that the company’s Qatari subsidiary might pave the way for SWDY’s wire & cable LoB. Also, African countries have made several alternative energy arrangements, including several offerings to supply wind tools and manage wind operations, which could benefit SWDY’s wind energy LoB initiative there. Meanwhile, we trust the company’s management will continue to restructure its electrical devices segment.
Valuation & Recommendation We believe that company’s management is setting a high level strategy to deal with the Arab Spring. Further, the company’s segmental nature provides with with a logistical advantage and may enable it to leverage on its extensive footprint within the MEA region. We remain confident in SWDY’s business model, and our current LTFV is EGP32.5/share and TP of EGP25.2/share, while our current rating is Buy.
Muhammad Elebrashi [email protected]
+20 333-18-361
Industries Buy
TP - EGP 25.2 | 14.2% Upside
El Sewedy Electric
Stock Details As at: 21-Jan-12
CICR Rating/RiskTarget Price/LTFV (EGP)
Last Price (EGP)52 Week High52 Week Low6M Av. Daily Vol. (000' shrs)% Chg: M oM / 6M / YoY
No. o f Shares (mn)M kt. Cap (EGPmn)M kt. Cap (USDmn)*Free Float (%)Paid in Capital (EGPmn)
Reuters / B loombergISIN
GDR DataLast Price52 Week High52 Week Low
Company Profile
Ow nership StructureEl Sewedy Family 72.7%Free Float 25.0%Hassan A Sallam 2.3%
Source: B loomberg / CICR *USD:EGP FX: 6.04
El Sewedy Electric [SWDY] – formerly El-Sewedy Cables – isan Egyptian jo int stock company, established underInvestment Incentives & Guarantees Law No. 8/1997. ElSewedy was listed in the Commercial Register in June 2005.Its business model has evo lved to encompass 4 segments:wire & cables, electrical devices, turnkey projects, windenergy.
These 4 business lines offer customers a host of energy-related products and services. SWDY’s wire & cablessegment o ffers power cables, overhead conductors andoptical ground wires, supported by a raw materials sub-segment that ensures feedstock availability and enhancespro fit margins. The electrical device line of business hastwo sub-segments: measuring devices and transformers.The turnkey pro jects segment, meanwhile, is involved inpro ject design and management and provides a one-stopshop service for electricity-related pro jects. SWDY hasrecently ventured into wind energy in order to capitalize onthe increase in global demand for green energy.
41.9217.48
223.42
129.18
SWDY.CA / SWDY Ey Equity
816.36
1.9 / -18 / -45.4
1,718.60
4,930.84
No GDR availablen/a
25.00
EGS3G0Z1C014
n/a
25.2 / 32.5
22.07
Buy/M oderate
-0.5 1.0 1.5 2.0 2.5 3.0 3.5 4.0
-
10.0
20.0
30.0
40.0
50.0
Jan-11 Mar-11 May-11 Jul-11 Sep-11 Nov-11
mn shrsCurr.Volume SWDYEGX 30 (rebased)
52 week Share Performance
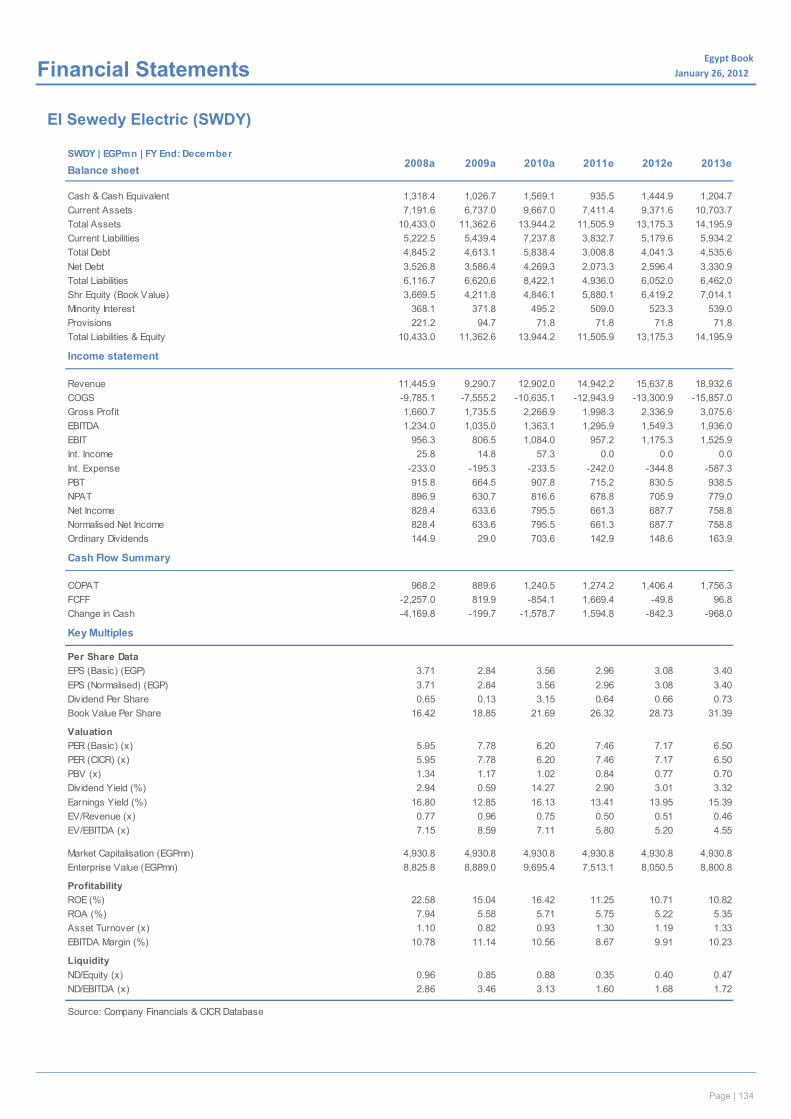
Page | 134
Egypt Book January 26, 2012x Financial Statements
El Sewedy Electric (SWDY)
SWDY | EGPmn | FY End: December
Balance sheet
Cash & Cash Equivalent 1,318.4 1,026.7 1,569.1 935.5 1,444.9 1,204.7Current Assets 7,191.6 6,737.0 9,667.0 7,411.4 9,371.6 10,703.7Total Assets 10,433.0 11,362.6 13,944.2 11,505.9 13,175.3 14,195.9Current Liabilities 5,222.5 5,439.4 7,237.8 3,832.7 5,179.6 5,934.2Total Debt 4,845.2 4,613.1 5,838.4 3,008.8 4,041.3 4,535.6Net Debt 3,526.8 3,586.4 4,269.3 2,073.3 2,596.4 3,330.9Total Liabilities 6,116.7 6,620.6 8,422.1 4,936.0 6,052.0 6,462.0Shr Equity (Book Value) 3,669.5 4,211.8 4,846.1 5,880.1 6,419.2 7,014.1Minority Interest 368.1 371.8 495.2 509.0 523.3 539.0Provisions 221.2 94.7 71.8 71.8 71.8 71.8Total Liabilities & Equity 10,433.0 11,362.6 13,944.2 11,505.9 13,175.3 14,195.9
Income statement
Revenue 11,445.9 9,290.7 12,902.0 14,942.2 15,637.8 18,932.6COGS -9,785.1 -7,555.2 -10,635.1 -12,943.9 -13,300.9 -15,857.0Gross Profit 1,660.7 1,735.5 2,266.9 1,998.3 2,336.9 3,075.6EBITDA 1,234.0 1,035.0 1,363.1 1,295.9 1,549.3 1,936.0EBIT 956.3 806.5 1,084.0 957.2 1,175.3 1,525.9Int. Income 25.8 14.8 57.3 0.0 0.0 0.0Int. Expense -233.0 -195.3 -233.5 -242.0 -344.8 -587.3PBT 915.8 664.5 907.8 715.2 830.5 938.5NPAT 896.9 630.7 816.6 678.8 705.9 779.0Net Income 828.4 633.6 795.5 661.3 687.7 758.8Normalised Net Income 828.4 633.6 795.5 661.3 687.7 758.8Ordinary Dividends 144.9 29.0 703.6 142.9 148.6 163.9
Cash Flow Summary
COPAT 968.2 889.6 1,240.5 1,274.2 1,406.4 1,756.3FCFF -2,257.0 819.9 -854.1 1,669.4 -49.8 96.8Change in Cash -4,169.8 -199.7 -1,578.7 1,594.8 -842.3 -968.0
Key Multiples
Per Share DataEPS (Basic) (EGP) 3.71 2.84 3.56 2.96 3.08 3.40EPS (Normalised) (EGP) 3.71 2.84 3.56 2.96 3.08 3.40Dividend Per Share 0.65 0.13 3.15 0.64 0.66 0.73Book Value Per Share 16.42 18.85 21.69 26.32 28.73 31.39
ValuationPER (Basic) (x) 5.95 7.78 6.20 7.46 7.17 6.50PER (CICR) (x) 5.95 7.78 6.20 7.46 7.17 6.50PBV (x) 1.34 1.17 1.02 0.84 0.77 0.70Dividend Yield (%) 2.94 0.59 14.27 2.90 3.01 3.32Earnings Yield (%) 16.80 12.85 16.13 13.41 13.95 15.39EV/Revenue (x) 0.77 0.96 0.75 0.50 0.51 0.46EV/EBITDA (x) 7.15 8.59 7.11 5.80 5.20 4.55
Market Capitalisation (EGPmn) 4,930.8 4,930.8 4,930.8 4,930.8 4,930.8 4,930.8Enterprise Value (EGPmn) 8,825.8 8,889.0 9,695.4 7,513.1 8,050.5 8,800.8
ProfitabilityROE (%) 22.58 15.04 16.42 11.25 10.71 10.82ROA (%) 7.94 5.58 5.71 5.75 5.22 5.35Asset Turnover (x) 1.10 0.82 0.93 1.30 1.19 1.33EBITDA Margin (%) 10.78 11.14 10.56 8.67 9.91 10.23
LiquidityND/Equity (x) 0.96 0.85 0.88 0.35 0.40 0.47ND/EBITDA (x) 2.86 3.46 3.13 1.60 1.68 1.72
Source: Company Financials & CICR Database
2008a 2009a 2010a 2011e 2012e 2013e
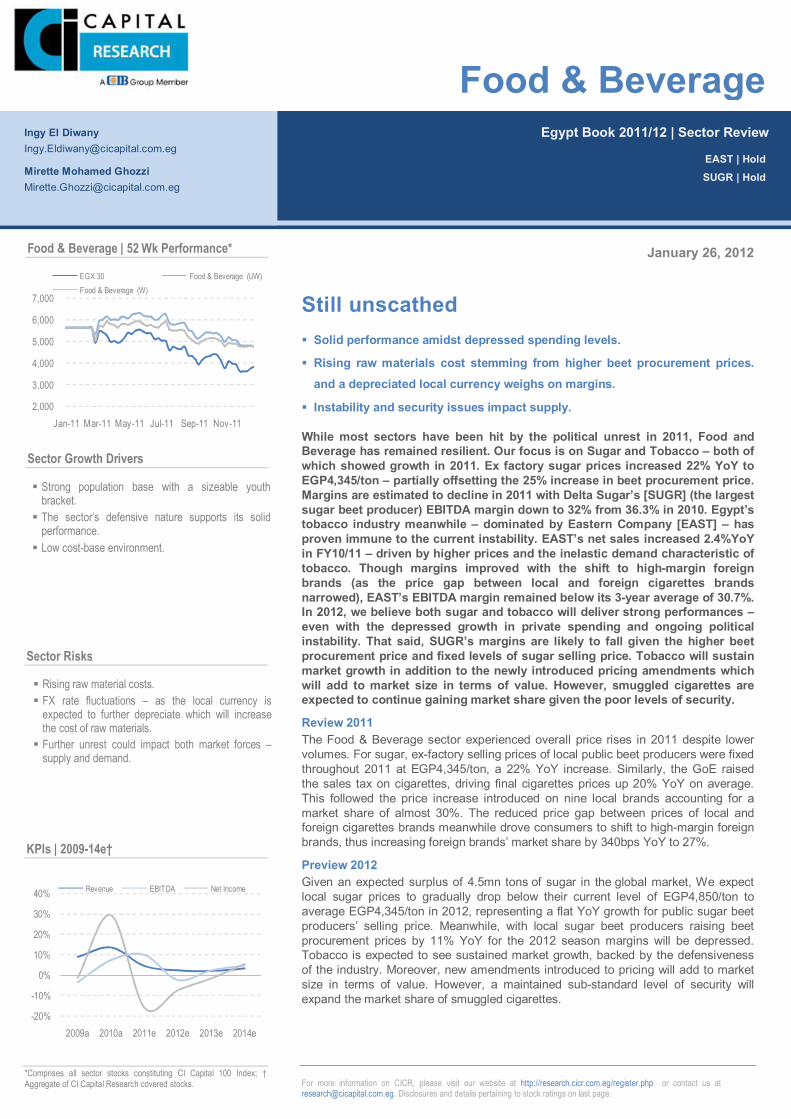
Page | 135
Page | 135
For more information on CICR, please visit our website at http://research.cicr.com.eg/register.php or contact us at [email protected]. Disclosures and details pertaining to stock ratings on last page.
January 26, 2012
Still unscathed Solid performance amidst depressed spending levels.
Rising raw materials cost stemming from higher beet procurement prices. and a depreciated local currency weighs on margins.
Instability and security issues impact supply.
While most sectors have been hit by the political unrest in 2011, Food and Beverage has remained resilient. Our focus is on Sugar and Tobacco – both of which showed growth in 2011. Ex factory sugar prices increased 22% YoY to EGP4,345/ton – partially offsetting the 25% increase in beet procurement price. Margins are estimated to decline in 2011 with Delta Sugar’s [SUGR] (the largest sugar beet producer) EBITDA margin down to 32% from 36.3% in 2010. Egypt’s tobacco industry meanwhile – dominated by Eastern Company [EAST] – has proven immune to the current instability. EAST’s net sales increased 2.4%YoY in FY10/11 – driven by higher prices and the inelastic demand characteristic of tobacco. Though margins improved with the shift to high-margin foreign brands (as the price gap between local and foreign cigarettes brands narrowed), EAST’s EBITDA margin remained below its 3-year average of 30.7%. In 2012, we believe both sugar and tobacco will deliver strong performances – even with the depressed growth in private spending and ongoing political instability. That said, SUGR’s margins are likely to fall given the higher beet procurement price and fixed levels of sugar selling price. Tobacco will sustain market growth in addition to the newly introduced pricing amendments which will add to market size in terms of value. However, smuggled cigarettes are expected to continue gaining market share given the poor levels of security.
Review 2011 The Food & Beverage sector experienced overall price rises in 2011 despite lower volumes. For sugar, ex-factory selling prices of local public beet producers were fixed throughout 2011 at EGP4,345/ton, a 22% YoY increase. Similarly, the GoE raised the sales tax on cigarettes, driving final cigarettes prices up 20% YoY on average. This followed the price increase introduced on nine local brands accounting for a market share of almost 30%. The reduced price gap between prices of local and foreign cigarettes brands meanwhile drove consumers to shift to high-margin foreign brands, thus increasing foreign brands’ market share by 340bps YoY to 27%.
Preview 2012 Given an expected surplus of 4.5mn tons of sugar in the global market, We expect local sugar prices to gradually drop below their current level of EGP4,850/ton to average EGP4,345/ton in 2012, representing a flat YoY growth for public sugar beet producers’ selling price. Meanwhile, with local sugar beet producers raising beet procurement prices by 11% YoY for the 2012 season margins will be depressed. Tobacco is expected to see sustained market growth, backed by the defensiveness of the industry. Moreover, new amendments introduced to pricing will add to market size in terms of value. However, a maintained sub-standard level of security will expand the market share of smuggled cigarettes.
Egypt Book 2011/12 | Sector Review
Food & Beverage
EAST | Hold SUGR | Hold
Ingy El Diwany [email protected]
Mirette Mohamed Ghozzi [email protected]
Strong population base with a sizeable youth bracket. The sector’s defensive nature supports its solid
performance. Low cost-base environment.
Rising raw material costs. FX rate fluctuations – as the local currency is
expected to further depreciate which will increase the cost of raw materials. Further unrest could impact both market forces –
supply and demand.
Food & Beverage | 52 Wk Performance*
2,000
3,000
4,000
5,000
6,000
7,000
Jan-11 Mar-11 May-11 Jul-11 Sep-11 Nov-11
EGX 30 Food & Beverage (UW)Food & Beverage (W)
Sector Growth Drivers
Sector Risks
-20%
-10%
0%
10%
20%
30%
40%
2009a 2010a 2011e 2012e 2013e 2014e
Revenue EBITDA Net Income
KPIs | 2009-14e†
*Comprises all sector stocks constituting CI Capital 100 Index; † Aggregate of CI Capital Research covered stocks.
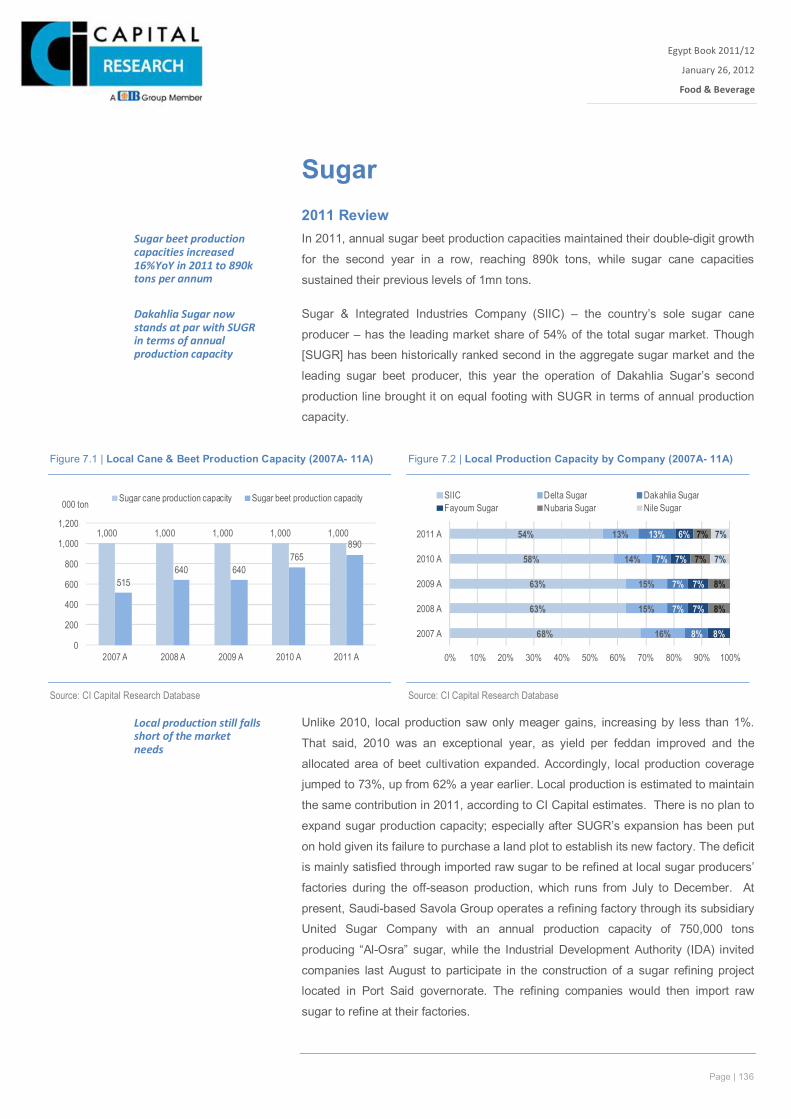
Page | 136
Egypt Book 2011/12
January 26, 2012
Food & Beverage
Xxx
Sugar 2011 Review In 2011, annual sugar beet production capacities maintained their double-digit growth
for the second year in a row, reaching 890k tons, while sugar cane capacities
sustained their previous levels of 1mn tons.
Sugar & Integrated Industries Company (SIIC) – the country’s sole sugar cane
producer – has the leading market share of 54% of the total sugar market. Though
[SUGR] has been historically ranked second in the aggregate sugar market and the
leading sugar beet producer, this year the operation of Dakahlia Sugar’s second
production line brought it on equal footing with SUGR in terms of annual production
capacity.
Unlike 2010, local production saw only meager gains, increasing by less than 1%.
That said, 2010 was an exceptional year, as yield per feddan improved and the
allocated area of beet cultivation expanded. Accordingly, local production coverage
jumped to 73%, up from 62% a year earlier. Local production is estimated to maintain
the same contribution in 2011, according to CI Capital estimates. There is no plan to
expand sugar production capacity; especially after SUGR’s expansion has been put
on hold given its failure to purchase a land plot to establish its new factory. The deficit
is mainly satisfied through imported raw sugar to be refined at local sugar producers’
factories during the off-season production, which runs from July to December. At
present, Saudi-based Savola Group operates a refining factory through its subsidiary
United Sugar Company with an annual production capacity of 750,000 tons
producing “Al-Osra” sugar, while the Industrial Development Authority (IDA) invited
companies last August to participate in the construction of a sugar refining project
located in Port Said governorate. The refining companies would then import raw
sugar to refine at their factories.
Sugar beet production capacities increased 16%YoY in 2011 to 890k tons per annum
Dakahlia Sugar now stands at par with SUGR in terms of annual production capacity
Local production still falls short of the market needs
Figure 7.1 | Local Cane & Beet Production Capacity (2007A- 11A) Figure 7.2 | Local Production Capacity by Company (2007A- 11A)
1,000 1,000 1,000 1,000 1,000
515640 640
765890
0
200
400
600
800
1,000
1,200
2007 A 2008 A 2009 A 2010 A 2011 A
Sugar cane production capacity Sugar beet production capacity000 ton
68%
63%
63%
58%
54%
16%
15%
15%
14%
13%
8%
7%
7%
7%
13%
8%
7%
7%
7%
6%
8%
8%
7%
7%
7%
7%
0% 10% 20% 30% 40% 50% 60% 70% 80% 90% 100%
2007 A
2008 A
2009 A
2010 A
2011 A
SIIC Delta Sugar Dakahlia SugarFayoum Sugar Nubaria Sugar Nile Sugar
Source: CI Capital Research Database
Source: CI Capital Research Database
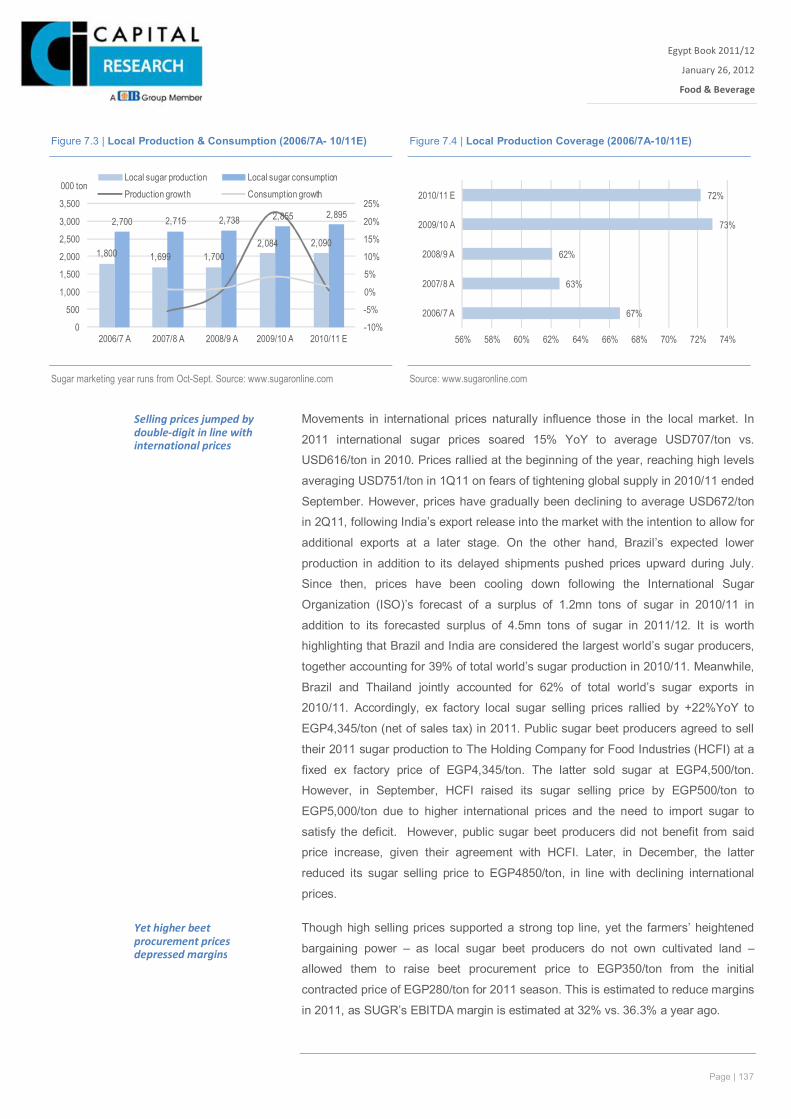
Page | 137
Egypt Book 2011/12
January 26, 2012
Food & Beverage
Xxx
Movements in international prices naturally influence those in the local market. In
2011 international sugar prices soared 15% YoY to average USD707/ton vs.
USD616/ton in 2010. Prices rallied at the beginning of the year, reaching high levels
averaging USD751/ton in 1Q11 on fears of tightening global supply in 2010/11 ended
September. However, prices have gradually been declining to average USD672/ton
in 2Q11, following India’s export release into the market with the intention to allow for
additional exports at a later stage. On the other hand, Brazil’s expected lower
production in addition to its delayed shipments pushed prices upward during July.
Since then, prices have been cooling down following the International Sugar
Organization (ISO)’s forecast of a surplus of 1.2mn tons of sugar in 2010/11 in
addition to its forecasted surplus of 4.5mn tons of sugar in 2011/12. It is worth
highlighting that Brazil and India are considered the largest world’s sugar producers,
together accounting for 39% of total world’s sugar production in 2010/11. Meanwhile,
Brazil and Thailand jointly accounted for 62% of total world’s sugar exports in
2010/11. Accordingly, ex factory local sugar selling prices rallied by +22%YoY to
EGP4,345/ton (net of sales tax) in 2011. Public sugar beet producers agreed to sell
their 2011 sugar production to The Holding Company for Food Industries (HCFI) at a
fixed ex factory price of EGP4,345/ton. The latter sold sugar at EGP4,500/ton.
However, in September, HCFI raised its sugar selling price by EGP500/ton to
EGP5,000/ton due to higher international prices and the need to import sugar to
satisfy the deficit. However, public sugar beet producers did not benefit from said
price increase, given their agreement with HCFI. Later, in December, the latter
reduced its sugar selling price to EGP4850/ton, in line with declining international
prices.
Though high selling prices supported a strong top line, yet the farmers’ heightened
bargaining power – as local sugar beet producers do not own cultivated land –
allowed them to raise beet procurement price to EGP350/ton from the initial
contracted price of EGP280/ton for 2011 season. This is estimated to reduce margins
in 2011, as SUGR’s EBITDA margin is estimated at 32% vs. 36.3% a year ago.
Selling prices jumped by double-digit in line with international prices
Yet higher beet procurement prices depressed margins
Figure 7.3 | Local Production & Consumption (2006/7A- 10/11E) Figure 7.4 | Local Production Coverage (2006/7A-10/11E)
1,800 1,699 1,7002,084 2,090
2,700 2,715 2,738 2,855 2,895
-10%
-5%
0%
5%
10%
15%
20%
25%
0
500
1,000
1,500
2,000
2,500
3,000
3,500
2006/7 A 2007/8 A 2008/9 A 2009/10 A 2010/11 E
Local sugar production Local sugar consumptionProduction growth Consumption growth
000 ton
67%
63%
62%
73%
72%
56% 58% 60% 62% 64% 66% 68% 70% 72% 74%
2006/7 A
2007/8 A
2008/9 A
2009/10 A
2010/11 E
Sugar marketing year runs from Oct-Sept. Source: www.sugaronline.com
Source: www.sugaronline.com
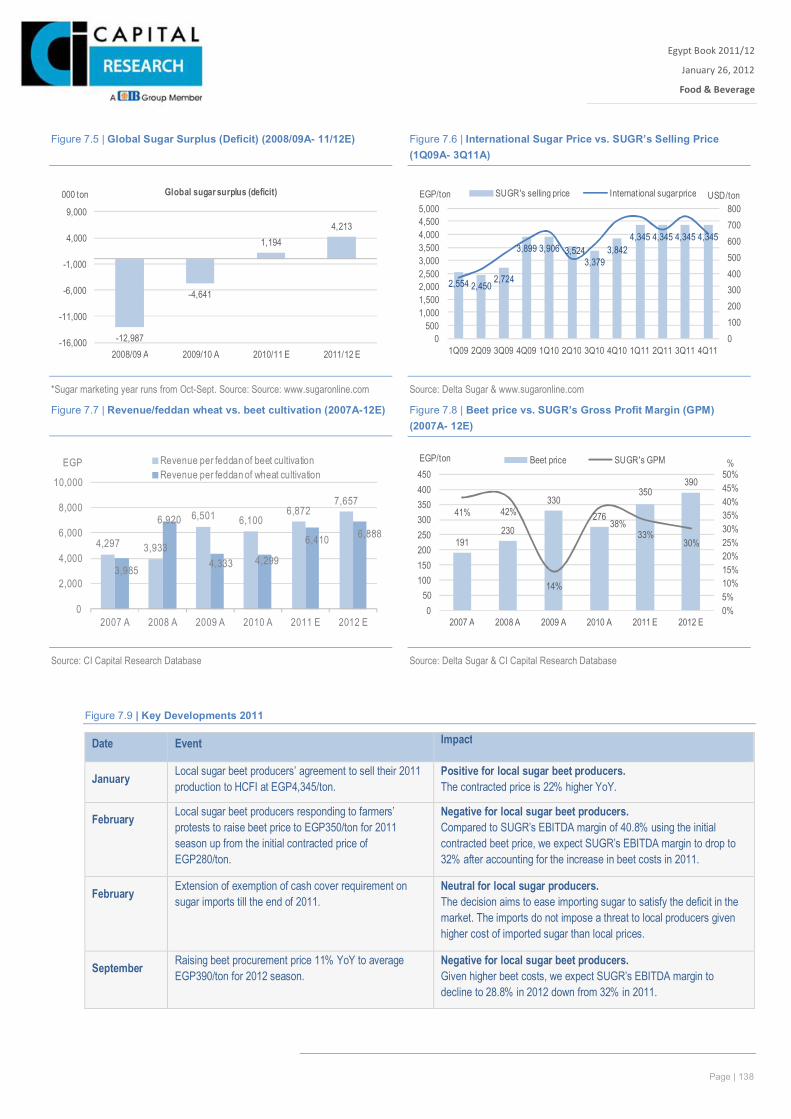
Page | 138
Egypt Book 2011/12
January 26, 2012
Food & Beverage
Xxx
Figure 7.9 | Key Developments 2011
Date Event Impact
January Local sugar beet producers’ agreement to sell their 2011 production to HCFI at EGP4,345/ton.
Positive for local sugar beet producers. The contracted price is 22% higher YoY.
February Local sugar beet producers responding to farmers’ protests to raise beet price to EGP350/ton for 2011 season up from the initial contracted price of EGP280/ton.
Negative for local sugar beet producers. Compared to SUGR’s EBITDA margin of 40.8% using the initial contracted beet price, we expect SUGR’s EBITDA margin to drop to 32% after accounting for the increase in beet costs in 2011.
February Extension of exemption of cash cover requirement on sugar imports till the end of 2011.
Neutral for local sugar producers. The decision aims to ease importing sugar to satisfy the deficit in the market. The imports do not impose a threat to local producers given higher cost of imported sugar than local prices.
September Raising beet procurement price 11% YoY to average EGP390/ton for 2012 season.
Negative for local sugar beet producers. Given higher beet costs, we expect SUGR’s EBITDA margin to decline to 28.8% in 2012 down from 32% in 2011.
4,297 3,933
6,501 6,1006,872
7,657
3,985
6,920
4,333 4,299
6,410 6,888
0
2,000
4,000
6,000
8,000
10,000
2007 A 2008 A 2009 A 2010 A 2011 E 2012 E
Revenue per feddan of beet cultivationRevenue per feddan of wheat cultivation
EGP
191230
330276
350390
41% 42%
14%
38%33%
30%
0%5%10%15%20%25%30%35%40%45%50%
050
100150200250300350400450
2007 A 2008 A 2009 A 2010 A 2011 E 2012 E
Beet price SUGR's GPMEGP/ton %
Figure 7.7 | Revenue/feddan wheat vs. beet cultivation (2007A-12E)
Figure 7.8 | Beet price vs. SUGR’s Gross Profit Margin (GPM) (2007A- 12E)
Source: CI Capital Research Database Source: Delta Sugar & CI Capital Research Database
-12,987
-4,641
1,1944,213
-16,000
-11,000
-6,000
-1,000
4,000
9,000
2008/09 A 2009/10 A 2010/11 E 2011/12 E
Global sugar surplus (deficit)000 ton
2,554 2,4502,724
3,899 3,906 3,5243,379
3,8424,345 4,345 4,345 4,345
0100200300400500600700800
0500
1,0001,5002,0002,5003,0003,5004,0004,5005,000
1Q09 2Q09 3Q09 4Q09 1Q10 2Q10 3Q10 4Q10 1Q11 2Q11 3Q11 4Q11
SUGR's selling price International sugar priceEGP/ton USD/ton
Figure 7.5 | Global Sugar Surplus (Deficit) (2008/09A- 11/12E) Figure 7.6 | International Sugar Price vs. SUGR’s Selling Price (1Q09A- 3Q11A)
*Sugar marketing year runs from Oct-Sept. Source: Source: www.sugaronline.com Source: Delta Sugar & www.sugaronline.com
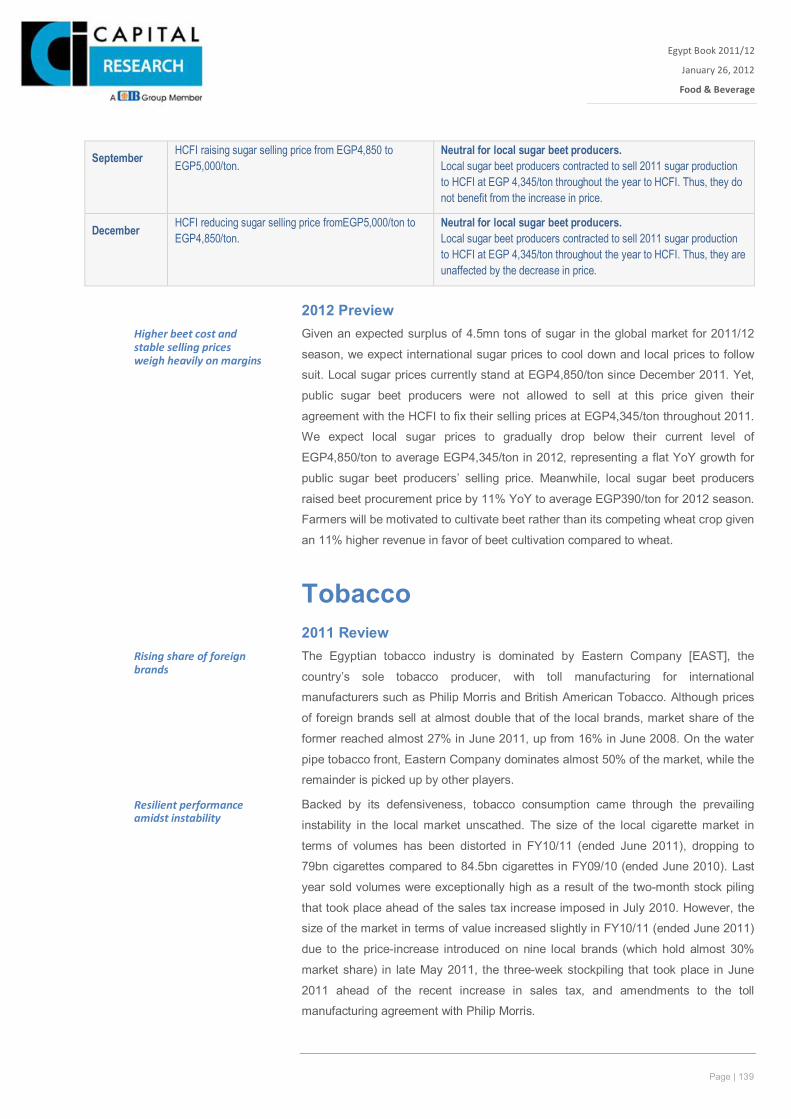
Page | 139
Egypt Book 2011/12
January 26, 2012
Food & Beverage
Xxx
September HCFI raising sugar selling price from EGP4,850 to EGP5,000/ton.
Neutral for local sugar beet producers. Local sugar beet producers contracted to sell 2011 sugar production to HCFI at EGP 4,345/ton throughout the year to HCFI. Thus, they do not benefit from the increase in price.
December HCFI reducing sugar selling price fromEGP5,000/ton to EGP4,850/ton.
Neutral for local sugar beet producers. Local sugar beet producers contracted to sell 2011 sugar production to HCFI at EGP 4,345/ton throughout the year to HCFI. Thus, they are unaffected by the decrease in price.
2012 Preview Given an expected surplus of 4.5mn tons of sugar in the global market for 2011/12
season, we expect international sugar prices to cool down and local prices to follow
suit. Local sugar prices currently stand at EGP4,850/ton since December 2011. Yet,
public sugar beet producers were not allowed to sell at this price given their
agreement with the HCFI to fix their selling prices at EGP4,345/ton throughout 2011.
We expect local sugar prices to gradually drop below their current level of
EGP4,850/ton to average EGP4,345/ton in 2012, representing a flat YoY growth for
public sugar beet producers’ selling price. Meanwhile, local sugar beet producers
raised beet procurement price by 11% YoY to average EGP390/ton for 2012 season.
Farmers will be motivated to cultivate beet rather than its competing wheat crop given
an 11% higher revenue in favor of beet cultivation compared to wheat.
Tobacco 2011 Review The Egyptian tobacco industry is dominated by Eastern Company [EAST], the
country’s sole tobacco producer, with toll manufacturing for international
manufacturers such as Philip Morris and British American Tobacco. Although prices
of foreign brands sell at almost double that of the local brands, market share of the
former reached almost 27% in June 2011, up from 16% in June 2008. On the water
pipe tobacco front, Eastern Company dominates almost 50% of the market, while the
remainder is picked up by other players.
Backed by its defensiveness, tobacco consumption came through the prevailing
instability in the local market unscathed. The size of the local cigarette market in
terms of volumes has been distorted in FY10/11 (ended June 2011), dropping to
79bn cigarettes compared to 84.5bn cigarettes in FY09/10 (ended June 2010). Last
year sold volumes were exceptionally high as a result of the two-month stock piling
that took place ahead of the sales tax increase imposed in July 2010. However, the
size of the market in terms of value increased slightly in FY10/11 (ended June 2011)
due to the price-increase introduced on nine local brands (which hold almost 30%
market share) in late May 2011, the three-week stockpiling that took place in June
2011 ahead of the recent increase in sales tax, and amendments to the toll
manufacturing agreement with Philip Morris.
Higher beet cost and stable selling prices weigh heavily on margins
Rising share of foreign brands
Resilient performance amidst instability
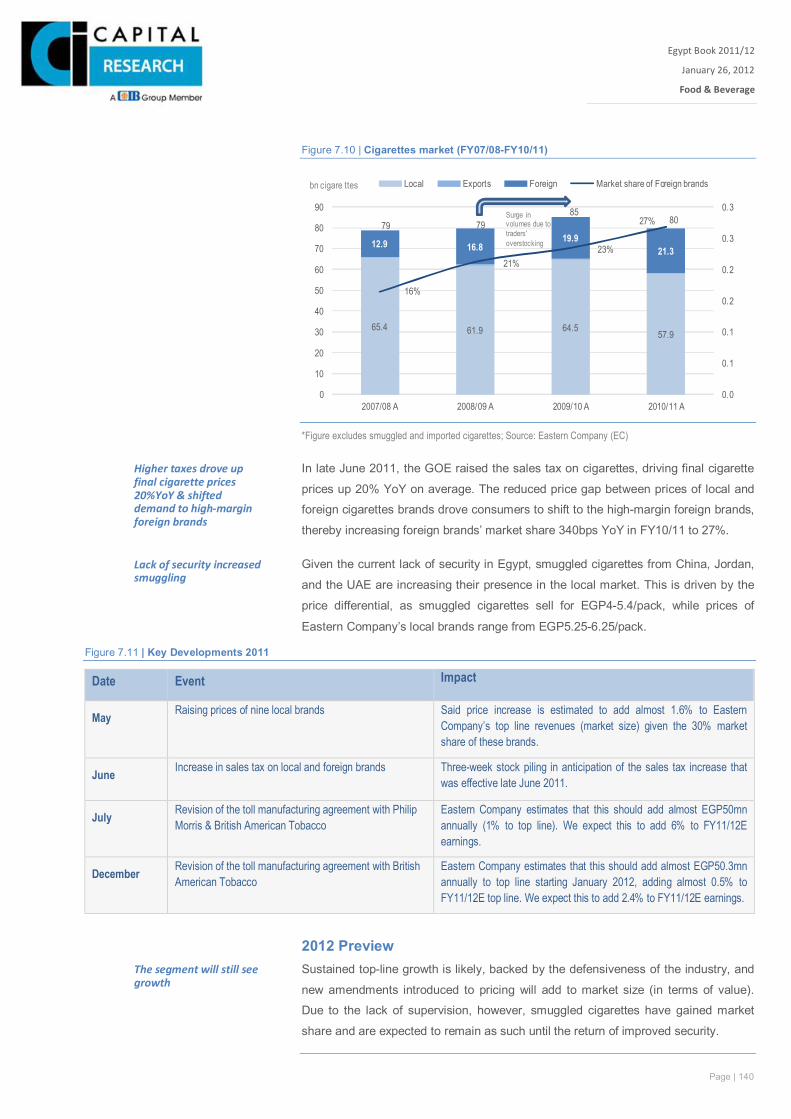
Page | 140
Egypt Book 2011/12
January 26, 2012
Food & Beverage
Xxx
Figure 7.10 | Cigarettes market (FY07/08-FY10/11)
*Figure excludes smuggled and imported cigarettes; Source: Eastern Company (EC)
In late June 2011, the GOE raised the sales tax on cigarettes, driving final cigarette
prices up 20% YoY on average. The reduced price gap between prices of local and
foreign cigarettes brands drove consumers to shift to the high-margin foreign brands,
thereby increasing foreign brands’ market share 340bps YoY in FY10/11 to 27%.
Given the current lack of security in Egypt, smuggled cigarettes from China, Jordan,
and the UAE are increasing their presence in the local market. This is driven by the
price differential, as smuggled cigarettes sell for EGP4-5.4/pack, while prices of
Eastern Company’s local brands range from EGP5.25-6.25/pack.
Figure 7.11 | Key Developments 2011
Date Event Impact
May Raising prices of nine local brands Said price increase is estimated to add almost 1.6% to Eastern Company’s top line revenues (market size) given the 30% market share of these brands.
June Increase in sales tax on local and foreign brands Three-week stock piling in anticipation of the sales tax increase that was effective late June 2011.
July Revision of the toll manufacturing agreement with Philip Morris & British American Tobacco
Eastern Company estimates that this should add almost EGP50mn annually (1% to top line). We expect this to add 6% to FY11/12E earnings.
December Revision of the toll manufacturing agreement with British American Tobacco
Eastern Company estimates that this should add almost EGP50.3mn annually to top line starting January 2012, adding almost 0.5% to FY11/12E top line. We expect this to add 2.4% to FY11/12E earnings.
2012 Preview Sustained top-line growth is likely, backed by the defensiveness of the industry, and
new amendments introduced to pricing will add to market size (in terms of value).
Due to the lack of supervision, however, smuggled cigarettes have gained market
share and are expected to remain as such until the return of improved security.
65.4 61.9 64.5 57.9
12.9 16.819.9
21.3
79 7985
80
16%
21%23%
27%
0.0
0.1
0.1
0.2
0.2
0.3
0.3
0
10
20
30
40
50
60
70
80
90
2007/08 A 2008/09 A 2009/10 A 2010/11 A
bn cigare ttes Local Exports Foreign Market share of Foreign brands
Surge in volumes due to traders' overstocking
Higher taxes drove up final cigarette prices 20%YoY & shifted demand to high-margin foreign brands
Lack of security increased smuggling
The segment will still see growth

Page | 141
Egypt Book 2011/12
January 26, 2012
Food & Beverage
Xxx
Sector Summary
Food & Beverage - SWOT Analysis
Strengths Weakness
• Defensive sector with inelastic demand. •
••
Opportunities Threat
• Annual population growth by 2% fueling demand for sugar. ••
• Low health awareness stimulating tobacco demand. • Anti smoking campaigns in Egypt.•
Source: CI Capital Research
•
Depreciation of the local currency will further increase the cost of imports.
Sizeable population base with wide tranche of youth population (45% of population below the age of 45).
Sugar supply/demand gap in the domestic market encouraging expansion of industry production capacities.
Farmers’ strong bargaining power in raising beet price weighs on beet producers margins.Higher costs of tobacco leaves amid rigid prices lead to pressured margins
Continuous struggle between beet and wheat playing a key role to determine cultivated areas in any given season and thus production volume.
Egyptians spend c.39% of their household spending on Food and Beverage.
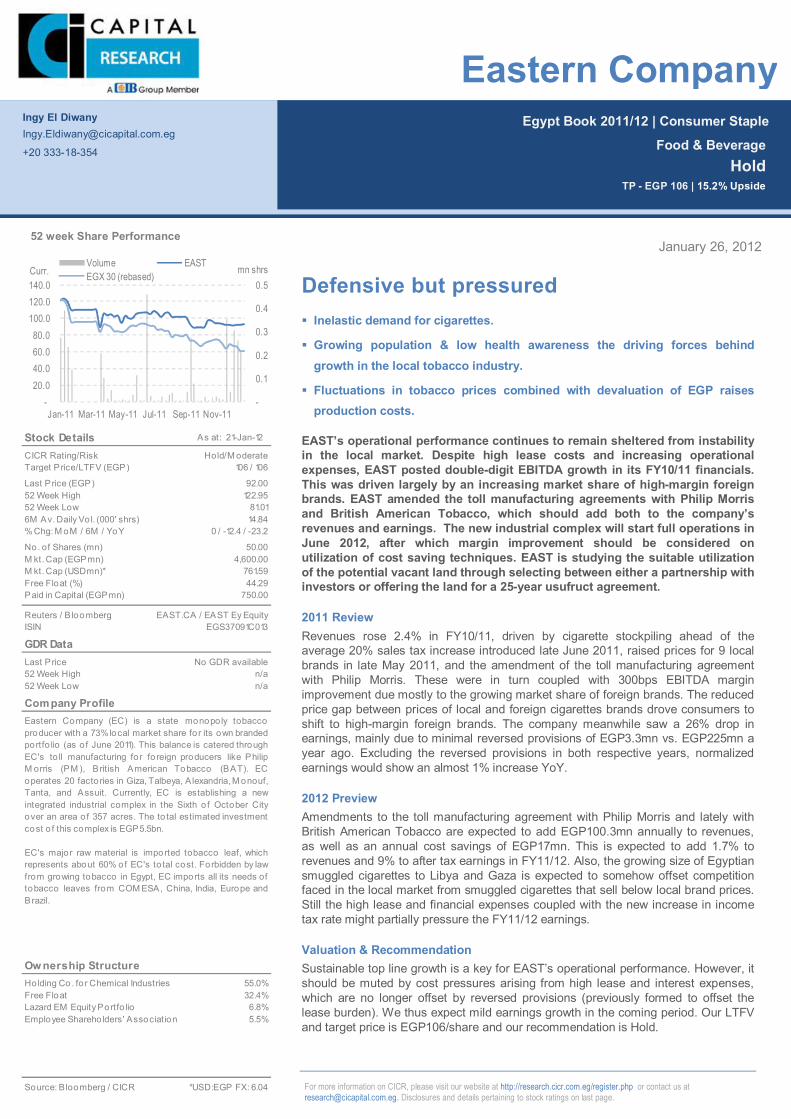
Page | 23
Egypt Book 2011/12 | Consumer Staple
For more information on CICR, please visit our website at http://research.cicr.com.eg/register.php or contact us at [email protected]. Disclosures and details pertaining to stock ratings on last page.
January 26, 2012
Defensive but pressured Inelastic demand for cigarettes.
Growing population & low health awareness the driving forces behind growth in the local tobacco industry.
Fluctuations in tobacco prices combined with devaluation of EGP raises production costs.
EAST’s operational performance continues to remain sheltered from instability in the local market. Despite high lease costs and increasing operational expenses, EAST posted double-digit EBITDA growth in its FY10/11 financials. This was driven largely by an increasing market share of high-margin foreign brands. EAST amended the toll manufacturing agreements with Philip Morris and British American Tobacco, which should add both to the company’s revenues and earnings. The new industrial complex will start full operations in June 2012, after which margin improvement should be considered on utilization of cost saving techniques. EAST is studying the suitable utilization of the potential vacant land through selecting between either a partnership with investors or offering the land for a 25-year usufruct agreement.
2011 Review Revenues rose 2.4% in FY10/11, driven by cigarette stockpiling ahead of the average 20% sales tax increase introduced late June 2011, raised prices for 9 local brands in late May 2011, and the amendment of the toll manufacturing agreement with Philip Morris. These were in turn coupled with 300bps EBITDA margin improvement due mostly to the growing market share of foreign brands. The reduced price gap between prices of local and foreign cigarettes brands drove consumers to shift to high-margin foreign brands. The company meanwhile saw a 26% drop in earnings, mainly due to minimal reversed provisions of EGP3.3mn vs. EGP225mn a year ago. Excluding the reversed provisions in both respective years, normalized earnings would show an almost 1% increase YoY.
2012 Preview Amendments to the toll manufacturing agreement with Philip Morris and lately with British American Tobacco are expected to add EGP100.3mn annually to revenues, as well as an annual cost savings of EGP17mn. This is expected to add 1.7% to revenues and 9% to after tax earnings in FY11/12. Also, the growing size of Egyptian smuggled cigarettes to Libya and Gaza is expected to somehow offset competition faced in the local market from smuggled cigarettes that sell below local brand prices. Still the high lease and financial expenses coupled with the new increase in income tax rate might partially pressure the FY11/12 earnings.
Valuation & Recommendation Sustainable top line growth is a key for EAST’s operational performance. However, it should be muted by cost pressures arising from high lease and interest expenses, which are no longer offset by reversed provisions (previously formed to offset the lease burden). We thus expect mild earnings growth in the coming period. Our LTFV and target price is EGP106/share and our recommendation is Hold.
Ingy El Diwany [email protected]
+20 333-18-354
Food & Beverage Hold
TP - EGP 106 | 15.2% Upside
Eastern Company
Stock Details As at: 21-Jan-12
CICR Rating/RiskTarget Price/LTFV (EGP)
Last Price (EGP)52 Week High52 Week Low6M Av. Daily Vo l. (000' shrs)% Chg: M oM / 6M / YoY
No. of Shares (mn)M kt. Cap (EGPmn)M kt. Cap (USDmn)*Free Float (%)Paid in Capital (EGPmn)
Reuters / B loombergISIN
GDR DataLast Price52 Week High52 Week Low
Company Profile
Ow nership StructureHolding Co. fo r Chemical Industries 55.0%Free Float 32.4%Lazard EM Equity Portfo lio 6.8%Employee Shareho lders' Association 5.5%
Source: Bloomberg / CICR *USD:EGP FX: 6.04
Eastern Company (EC) is a state monopo ly tobaccoproducer with a 73%local market share for its own brandedportfo lio (as of June 2011). This balance is catered throughEC's to ll manufacturing for fo reign producers like PhilipM orris (PM ), British American Tobacco (BAT). ECoperates 20 factories in Giza, Talbeya, A lexandria, M onouf,Tanta, and Assuit. Currently, EC is establishing a newintegrated industrial complex in the Sixth o f October Cityover an area of 357 acres. The to tal estimated investmentcost o f this complex is EGP5.5bn.
EC's major raw material is imported tobacco leaf, whichrepresents about 60% of EC's to tal cost. Forbidden by lawfrom growing tobacco in Egypt, EC imports all its needs oftobacco leaves from COM ESA, China, India, Europe andBrazil.
122.9581.01
50.00
14.84
EAST.CA / EAST Ey Equity
761.59
0 / -12.4 / -23.2
750.00
4,600.00
No GDR availablen/a
44.29
EGS37091C013
n/a
106 / 106
92.00
Hold/M oderate
-
0.1
0.2
0.3
0.4
0.5
-20.0 40.0 60.0 80.0
100.0 120.0 140.0
Jan-11 Mar-11 May-11 Jul-11 Sep-11 Nov-11
mn shrsCurr.Volume EASTEGX 30 (rebased)
52 week Share Performance

| 24
Egypt Book January 26, 2012x Financial Statements
Eastern Company (EAST)
cEAST | EGPmn | FY End: June
Balance sheet
Cash & Cash Equivalent 224.1 419.6 528.5 459.1 347.0 492.8Current Assets 2,303.7 2,886.4 3,283.4 3,642.2 3,403.9 3,431.4Total Assets 5,693.6 6,811.7 8,420.5 9,385.6 9,441.6 9,468.6Current Liabilities 2,422.9 2,361.0 2,775.0 3,949.5 3,952.7 3,995.6Total Debt 538.4 672.2 1,575.7 1,605.4 1,390.8 1,110.5Net Debt 314.2 252.6 1,047.2 1,146.3 1,043.8 617.7Total Liabilities 2,422.9 3,068.9 4,315.2 5,413.2 5,135.1 4,897.8Shr Equity (Book Value) 2,667.2 3,079.9 3,667.1 3,537.4 3,871.4 4,210.7Minority Interest 0.0 0.0 0.0 0.0 0.0 0.0Provisions 603.5 662.9 438.2 435.1 435.1 360.1Total Liabilities & Equity 5,693.6 6,811.7 8,420.5 9,385.6 9,441.6 9,468.6
Income statement
Revenue 3,818.9 3,967.0 4,274.1 4,374.9 4,575.4 4,721.5COGS -2,633.1 -2,658.7 -3,211.0 -3,141.3 -3,320.5 -3,393.5Gross Profit 1,185.8 1,308.3 1,063.1 1,233.6 1,254.9 1,328.0EBITDA 1,130.3 1,252.5 985.2 1,140.7 1,167.0 1,237.3EBIT 949.4 1,052.8 804.1 905.0 914.1 942.7Int. Income 12.6 2.9 1.2 1.0 0.1 0.1Int. Expense -28.2 -6.5 -32.3 -99.8 -122.5 -138.2PBT 932.4 1,018.5 994.6 782.8 809.1 821.9NPAT 751.3 830.4 850.4 631.9 607.3 616.9Net Income 751.3 830.4 850.4 631.9 607.3 616.9Normalised Net Income 683.6 785.2 598.4 601.8 607.3 616.9Ordinary Dividends 350.0 225.0 275.0 300.0 273.3 277.6
Cash Flow Summary
COPAT 1,494.9 1,042.3 984.5 1,691.8 965.3 1,032.4FCFF -264.0 401.9 -500.0 404.6 605.7 897.6Change in Cash -155.6 195.5 108.9 -69.4 -112.0 145.8
Key Multiples
Per Share DataEPS (Basic) (EGP) 15.03 16.61 17.01 12.64 12.15 12.34EPS (Normalised) (EGP) 13.67 15.70 11.97 12.04 12.15 12.34Dividend Per Share 7.00 4.50 5.50 6.00 5.47 5.55Book Value Per Share 53.34 61.60 73.34 70.75 77.43 84.21
ValuationPER (Basic) (x) 6.12 5.54 5.41 7.28 7.57 7.46PER (CICR) (x) 6.73 5.86 7.69 7.64 7.57 7.46PBV (x) 1.72 1.49 1.25 1.30 1.19 1.09Dividend Yield (%) 7.61 4.89 5.98 6.52 5.94 6.03Earnings Yield (%) 16.33 18.05 18.49 13.74 13.20 13.41EV/Revenue (x) 1.29 1.22 1.32 1.31 1.23 1.11EV/EBITDA (x) 4.35 3.87 5.73 5.04 4.84 4.22
Market Capitalisation (EGPmn) 4,600.0 4,600.0 4,600.0 4,600.0 4,600.0 4,600.0Enterprise Value (EGPmn) 4,914.2 4,852.6 5,647.2 5,746.3 5,643.8 5,217.7
ProfitabilityROE (%) 28.17 26.96 23.19 17.86 15.69 14.65ROA (%) 13.20 12.19 10.10 6.73 6.43 6.52Asset Turnover (x) 0.67 0.58 0.51 0.47 0.48 0.50EBITDA Margin (%) 29.60 31.57 23.05 26.07 25.51 26.21
LiquidityND/Equity (x) 0.12 0.08 0.29 0.32 0.27 0.15ND/EBITDA (x) 0.28 0.20 1.06 1.00 0.89 0.50
Source: Company Financials & CICR Database
2008a 2009a 2010a 2011e 2012e 2013e
Page | 143
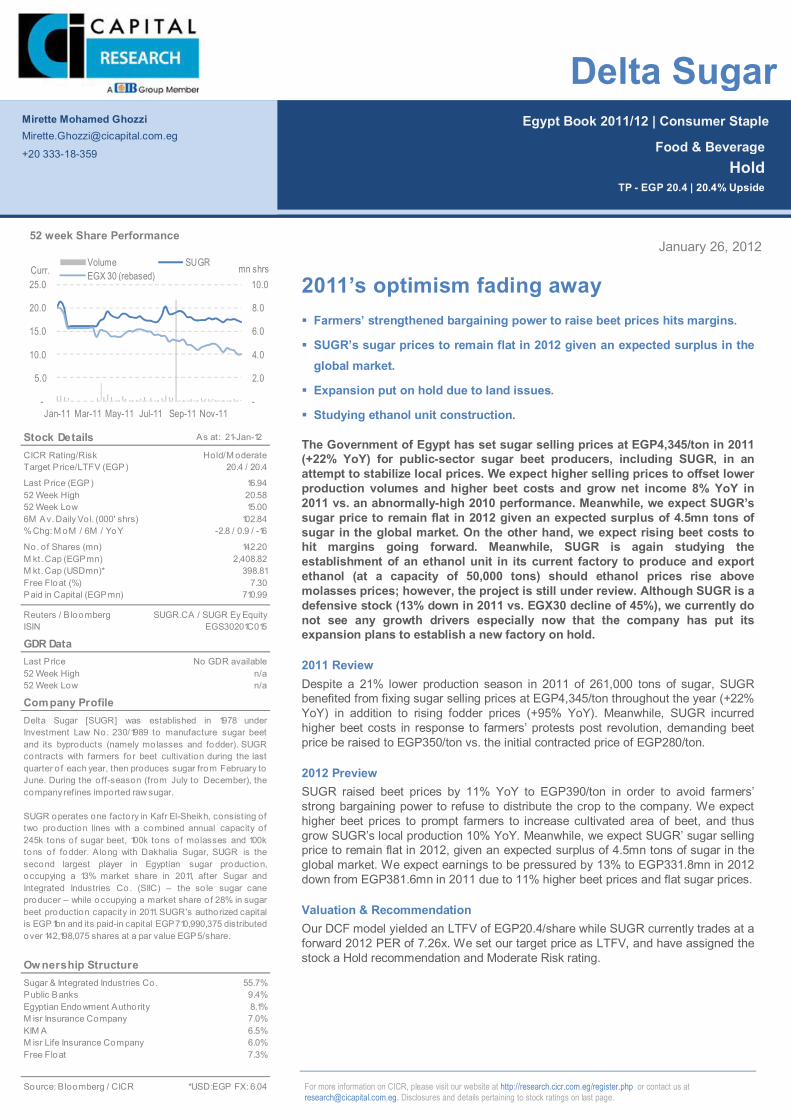
Page | 25
Egypt Book 2011/12 | Consumer Staple
For more information on CICR, please visit our website at http://research.cicr.com.eg/register.php or contact us at [email protected]. Disclosures and details pertaining to stock ratings on last page.
January 26, 2012
2011’s optimism fading away Farmers’ strengthened bargaining power to raise beet prices hits margins.
SUGR’s sugar prices to remain flat in 2012 given an expected surplus in the global market.
Expansion put on hold due to land issues.
Studying ethanol unit construction.
The Government of Egypt has set sugar selling prices at EGP4,345/ton in 2011 (+22% YoY) for public-sector sugar beet producers, including SUGR, in an attempt to stabilize local prices. We expect higher selling prices to offset lower production volumes and higher beet costs and grow net income 8% YoY in 2011 vs. an abnormally-high 2010 performance. Meanwhile, we expect SUGR’s sugar price to remain flat in 2012 given an expected surplus of 4.5mn tons of sugar in the global market. On the other hand, we expect rising beet costs to hit margins going forward. Meanwhile, SUGR is again studying the establishment of an ethanol unit in its current factory to produce and export ethanol (at a capacity of 50,000 tons) should ethanol prices rise above molasses prices; however, the project is still under review. Although SUGR is a defensive stock (13% down in 2011 vs. EGX30 decline of 45%), we currently do not see any growth drivers especially now that the company has put its expansion plans to establish a new factory on hold.
2011 Review Despite a 21% lower production season in 2011 of 261,000 tons of sugar, SUGR benefited from fixing sugar selling prices at EGP4,345/ton throughout the year (+22% YoY) in addition to rising fodder prices (+95% YoY). Meanwhile, SUGR incurred higher beet costs in response to farmers’ protests post revolution, demanding beet price be raised to EGP350/ton vs. the initial contracted price of EGP280/ton.
2012 Preview SUGR raised beet prices by 11% YoY to EGP390/ton in order to avoid farmers’ strong bargaining power to refuse to distribute the crop to the company. We expect higher beet prices to prompt farmers to increase cultivated area of beet, and thus grow SUGR’s local production 10% YoY. Meanwhile, we expect SUGR’ sugar selling price to remain flat in 2012, given an expected surplus of 4.5mn tons of sugar in the global market. We expect earnings to be pressured by 13% to EGP331.8mn in 2012 down from EGP381.6mn in 2011 due to 11% higher beet prices and flat sugar prices.
Valuation & Recommendation Our DCF model yielded an LTFV of EGP20.4/share while SUGR currently trades at a forward 2012 PER of 7.26x. We set our target price as LTFV, and have assigned the stock a Hold recommendation and Moderate Risk rating.
Mirette Mohamed Ghozzi [email protected]
+20 333-18-359
Food & Beverage Hold
TP - EGP 20.4 | 20.4% Upside
Delta Sugar
Stock Details As at: 21-Jan-12
CICR Rating/RiskTarget Price/LTFV (EGP)
Last Price (EGP)52 Week High52 Week Low6M Av. Daily Vo l. (000' shrs)% Chg: M oM / 6M / YoY
No. of Shares (mn)M kt. Cap (EGPmn)M kt. Cap (USDmn)*Free Float (%)Paid in Capital (EGPmn)
Reuters / B loombergISIN
GDR DataLast Price52 Week High52 Week Low
Company Profile
Ow nership StructureSugar & Integrated Industries Co. 55.7%Public Banks 9.4%Egyptian Endowment Authority 8.1%M isr Insurance Company 7.0%KIM A 6.5%M isr Life Insurance Company 6.0%Free Float 7.3%
Source: Bloomberg / CICR *USD:EGP FX: 6.04
Delta Sugar [SUGR] was established in 1978 underInvestment Law No. 230/1989 to manufacture sugar beetand its byproducts (namely molasses and fodder). SUGRcontracts with farmers for beet cultivation during the lastquarter o f each year, then produces sugar from February toJune. During the off-season (from July to December), thecompany refines imported raw sugar.
SUGR operates one factory in Kafr El-Sheikh, consisting oftwo production lines with a combined annual capacity of245k tons of sugar beet, 100k tons of molasses and 100ktons of fodder. A long with Dakhalia Sugar, SUGR is thesecond largest player in Egyptian sugar production,occupying a 13% market share in 2011, after Sugar andIntegrated Industries Co. (SIIC) – the so le sugar caneproducer – while occupying a market share of 28% in sugarbeet production capacity in 2011. SUGR's authorized capitalis EGP1bn and its paid-in capital EGP710,990,375 distributedover 142,198,075 shares at a par value EGP5/share.
20.5815.00
142.20
102.84
SUGR.CA / SUGR Ey Equity
398.81
-2.8 / 0.9 / -16
710.99
2,408.82
No GDR availablen/a
7.30
EGS30201C015
n/a
20.4 / 20.4
16.94
Hold/M oderate
-
2.0
4.0
6.0
8.0
10.0
-
5.0
10.0
15.0
20.0
25.0
Jan-11 Mar-11 May-11 Jul-11 Sep-11 Nov-11
mn shrsCurr.Volume SUGREGX 30 (rebased)
52 week Share Performance
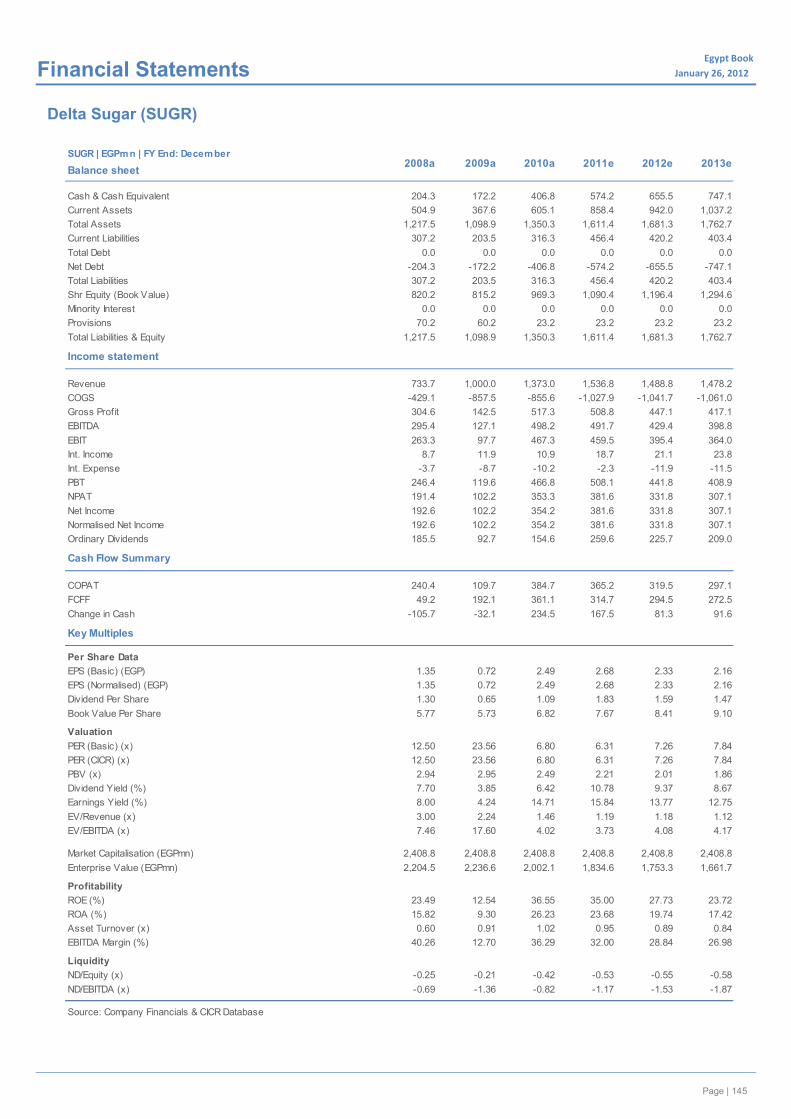
| 26
Egypt Book January 26, 2012x Financial Statements
Delta Sugar (SUGR)
SUGR | EGPmn | FY End: December
Balance sheet
Cash & Cash Equivalent 204.3 172.2 406.8 574.2 655.5 747.1Current Assets 504.9 367.6 605.1 858.4 942.0 1,037.2Total Assets 1,217.5 1,098.9 1,350.3 1,611.4 1,681.3 1,762.7Current Liabilities 307.2 203.5 316.3 456.4 420.2 403.4Total Debt 0.0 0.0 0.0 0.0 0.0 0.0Net Debt -204.3 -172.2 -406.8 -574.2 -655.5 -747.1Total Liabilities 307.2 203.5 316.3 456.4 420.2 403.4Shr Equity (Book Value) 820.2 815.2 969.3 1,090.4 1,196.4 1,294.6Minority Interest 0.0 0.0 0.0 0.0 0.0 0.0Provisions 70.2 60.2 23.2 23.2 23.2 23.2Total Liabilities & Equity 1,217.5 1,098.9 1,350.3 1,611.4 1,681.3 1,762.7
Income statement
Revenue 733.7 1,000.0 1,373.0 1,536.8 1,488.8 1,478.2COGS -429.1 -857.5 -855.6 -1,027.9 -1,041.7 -1,061.0Gross Profit 304.6 142.5 517.3 508.8 447.1 417.1EBITDA 295.4 127.1 498.2 491.7 429.4 398.8EBIT 263.3 97.7 467.3 459.5 395.4 364.0Int. Income 8.7 11.9 10.9 18.7 21.1 23.8Int. Expense -3.7 -8.7 -10.2 -2.3 -11.9 -11.5PBT 246.4 119.6 466.8 508.1 441.8 408.9NPAT 191.4 102.2 353.3 381.6 331.8 307.1Net Income 192.6 102.2 354.2 381.6 331.8 307.1Normalised Net Income 192.6 102.2 354.2 381.6 331.8 307.1Ordinary Dividends 185.5 92.7 154.6 259.6 225.7 209.0
Cash Flow Summary
COPAT 240.4 109.7 384.7 365.2 319.5 297.1FCFF 49.2 192.1 361.1 314.7 294.5 272.5Change in Cash -105.7 -32.1 234.5 167.5 81.3 91.6
Key Multiples
Per Share DataEPS (Basic) (EGP) 1.35 0.72 2.49 2.68 2.33 2.16EPS (Normalised) (EGP) 1.35 0.72 2.49 2.68 2.33 2.16Dividend Per Share 1.30 0.65 1.09 1.83 1.59 1.47Book Value Per Share 5.77 5.73 6.82 7.67 8.41 9.10
ValuationPER (Basic) (x) 12.50 23.56 6.80 6.31 7.26 7.84PER (CICR) (x) 12.50 23.56 6.80 6.31 7.26 7.84PBV (x) 2.94 2.95 2.49 2.21 2.01 1.86Dividend Yield (%) 7.70 3.85 6.42 10.78 9.37 8.67Earnings Yield (%) 8.00 4.24 14.71 15.84 13.77 12.75EV/Revenue (x) 3.00 2.24 1.46 1.19 1.18 1.12EV/EBITDA (x) 7.46 17.60 4.02 3.73 4.08 4.17
Market Capitalisation (EGPmn) 2,408.8 2,408.8 2,408.8 2,408.8 2,408.8 2,408.8Enterprise Value (EGPmn) 2,204.5 2,236.6 2,002.1 1,834.6 1,753.3 1,661.7
ProfitabilityROE (%) 23.49 12.54 36.55 35.00 27.73 23.72ROA (%) 15.82 9.30 26.23 23.68 19.74 17.42Asset Turnover (x) 0.60 0.91 1.02 0.95 0.89 0.84EBITDA Margin (%) 40.26 12.70 36.29 32.00 28.84 26.98
LiquidityND/Equity (x) -0.25 -0.21 -0.42 -0.53 -0.55 -0.58ND/EBITDA (x) -0.69 -1.36 -0.82 -1.17 -1.53 -1.87
Source: Company Financials & CICR Database
2008a 2009a 2010a 2011e 2012e 2013e
Page | 145
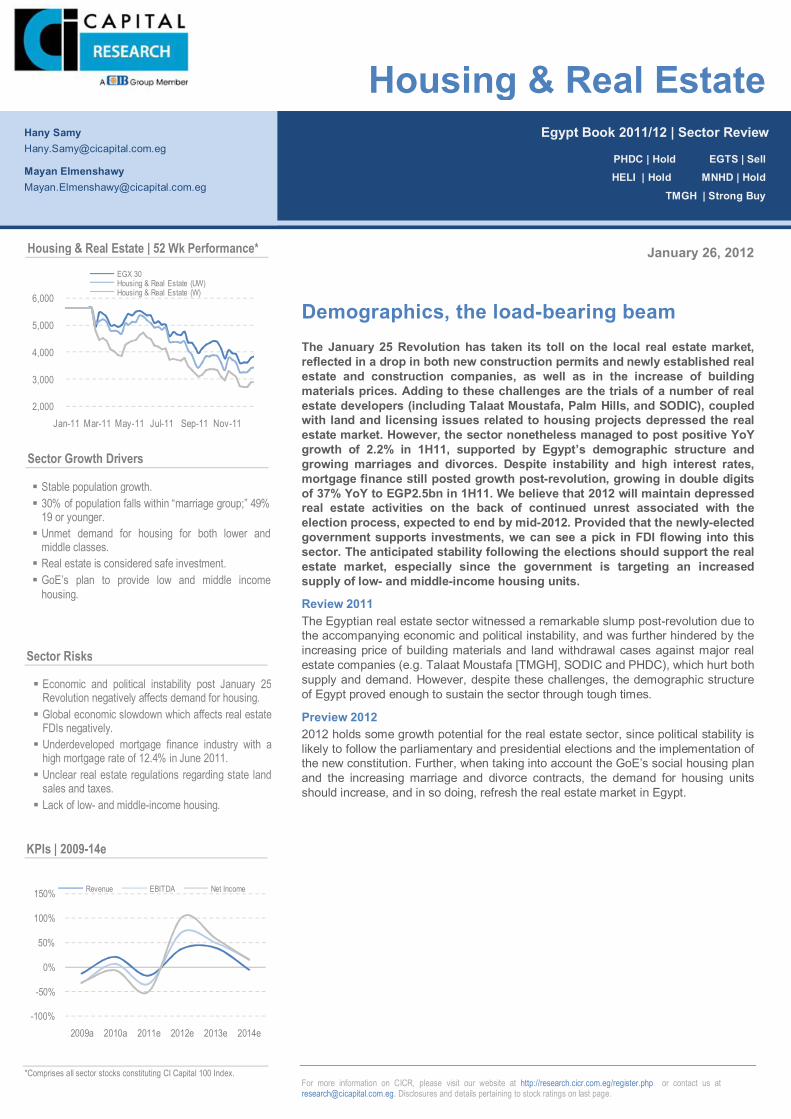
Page | 146
Page | 146
For more information on CICR, please visit our website at http://research.cicr.com.eg/register.php or contact us at [email protected]. Disclosures and details pertaining to stock ratings on last page.
January 26, 2012
Demographics, the load-bearing beam The January 25 Revolution has taken its toll on the local real estate market, reflected in a drop in both new construction permits and newly established real estate and construction companies, as well as in the increase of building materials prices. Adding to these challenges are the trials of a number of real estate developers (including Talaat Moustafa, Palm Hills, and SODIC), coupled with land and licensing issues related to housing projects depressed the real estate market. However, the sector nonetheless managed to post positive YoY growth of 2.2% in 1H11, supported by Egypt’s demographic structure and growing marriages and divorces. Despite instability and high interest rates, mortgage finance still posted growth post-revolution, growing in double digits of 37% YoY to EGP2.5bn in 1H11. We believe that 2012 will maintain depressed real estate activities on the back of continued unrest associated with the election process, expected to end by mid-2012. Provided that the newly-elected government supports investments, we can see a pick in FDI flowing into this sector. The anticipated stability following the elections should support the real estate market, especially since the government is targeting an increased supply of low- and middle-income housing units.
Review 2011 The Egyptian real estate sector witnessed a remarkable slump post-revolution due to the accompanying economic and political instability, and was further hindered by the increasing price of building materials and land withdrawal cases against major real estate companies (e.g. Talaat Moustafa [TMGH], SODIC and PHDC), which hurt both supply and demand. However, despite these challenges, the demographic structure of Egypt proved enough to sustain the sector through tough times.
Preview 2012 2012 holds some growth potential for the real estate sector, since political stability is likely to follow the parliamentary and presidential elections and the implementation of the new constitution. Further, when taking into account the GoE’s social housing plan and the increasing marriage and divorce contracts, the demand for housing units should increase, and in so doing, refresh the real estate market in Egypt.
Egypt Book 2011/12 | Sector Review
Housing & Real Estate
PHDC | Hold EGTS | Sell HELI | Hold MNHD | Hold
TMGH | Strong Buy
Hany Samy [email protected]
Mayan Elmenshawy [email protected]
Stable population growth. 30% of population falls within “marriage group;” 49%
19 or younger. Unmet demand for housing for both lower and
middle classes. Real estate is considered safe investment. GoE’s plan to provide low and middle income
housing.
Economic and political instability post January 25 Revolution negatively affects demand for housing. Global economic slowdown which affects real estate
FDIs negatively. Underdeveloped mortgage finance industry with a
high mortgage rate of 12.4% in June 2011. Unclear real estate regulations regarding state land
sales and taxes. Lack of low- and middle-income housing.
Housing & Real Estate | 52 Wk Performance*
2,000
3,000
4,000
5,000
6,000
Jan-11 Mar-11 May-11 Jul-11 Sep-11 Nov-11
EGX 30Housing & Real Estate (UW)Housing & Real Estate (W)
Sector Growth Drivers
Sector Risks
-100%
-50%
0%
50%
100%
150%
2009a 2010a 2011e 2012e 2013e 2014e
Revenue EBITDA Net Income
KPIs | 2009-14e
*Comprises all sector stocks constituting CI Capital 100 Index.
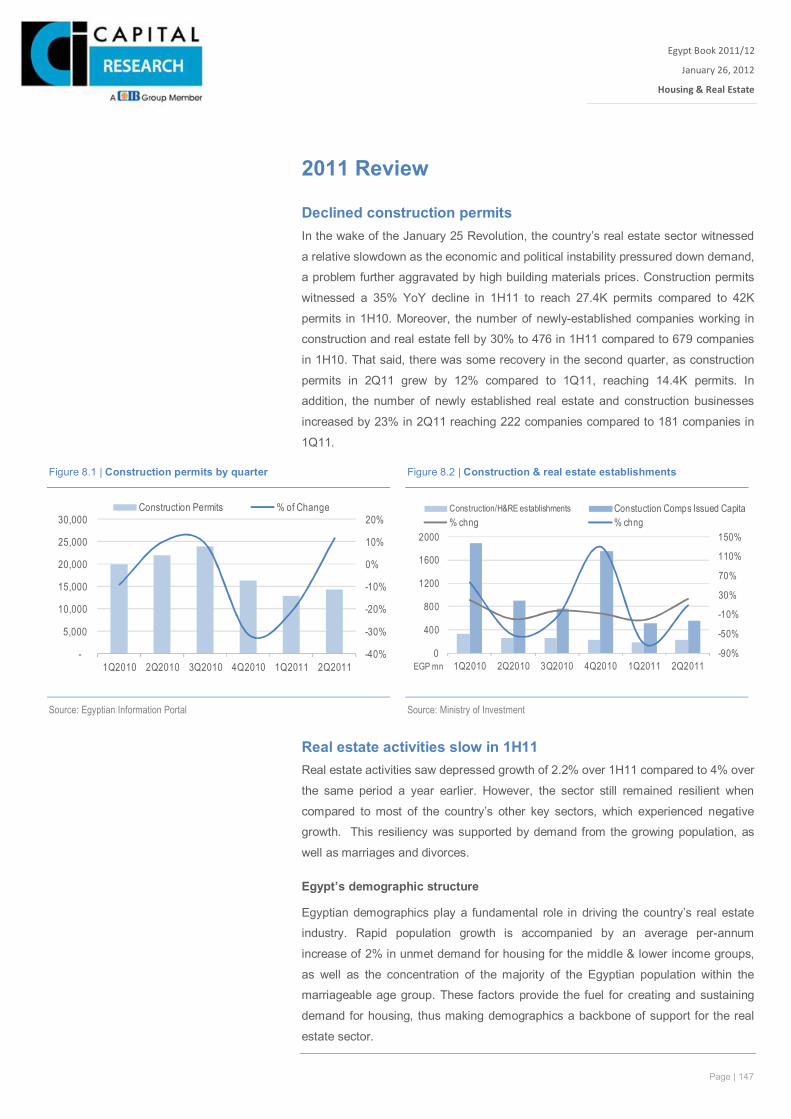
Page | 147
Egypt Book 2011/12
January 26, 2012
Housing & Real Estate
Xxx
2011 Review
Declined construction permits In the wake of the January 25 Revolution, the country’s real estate sector witnessed
a relative slowdown as the economic and political instability pressured down demand,
a problem further aggravated by high building materials prices. Construction permits
witnessed a 35% YoY decline in 1H11 to reach 27.4K permits compared to 42K
permits in 1H10. Moreover, the number of newly-established companies working in
construction and real estate fell by 30% to 476 in 1H11 compared to 679 companies
in 1H10. That said, there was some recovery in the second quarter, as construction
permits in 2Q11 grew by 12% compared to 1Q11, reaching 14.4K permits. In
addition, the number of newly established real estate and construction businesses
increased by 23% in 2Q11 reaching 222 companies compared to 181 companies in
1Q11.
Real estate activities slow in 1H11 Real estate activities saw depressed growth of 2.2% over 1H11 compared to 4% over
the same period a year earlier. However, the sector still remained resilient when
compared to most of the country’s other key sectors, which experienced negative
growth. This resiliency was supported by demand from the growing population, as
well as marriages and divorces.
Egypt’s demographic structure
Egyptian demographics play a fundamental role in driving the country’s real estate
industry. Rapid population growth is accompanied by an average per-annum
increase of 2% in unmet demand for housing for the middle & lower income groups,
as well as the concentration of the majority of the Egyptian population within the
marriageable age group. These factors provide the fuel for creating and sustaining
demand for housing, thus making demographics a backbone of support for the real
estate sector.
Figure 8.1 | Construction permits by quarter Figure 8.2 | Construction & real estate establishments
Source: Egyptian Information Portal
Source: Ministry of Investment
-40%
-30%
-20%
-10%
0%
10%
20%
-
5,000
10,000
15,000
20,000
25,000
30,000
1Q2010 2Q2010 3Q2010 4Q2010 1Q2011 2Q2011
Construction Permits % of Change
-90%
-50%
-10%
30%
70%
110%
150%
0
400
800
1200
1600
2000
1Q2010 2Q2010 3Q2010 4Q2010 1Q2011 2Q2011EGP mn
Construction/H&RE establishments Constuction Comps Issued Capital% chng % chng
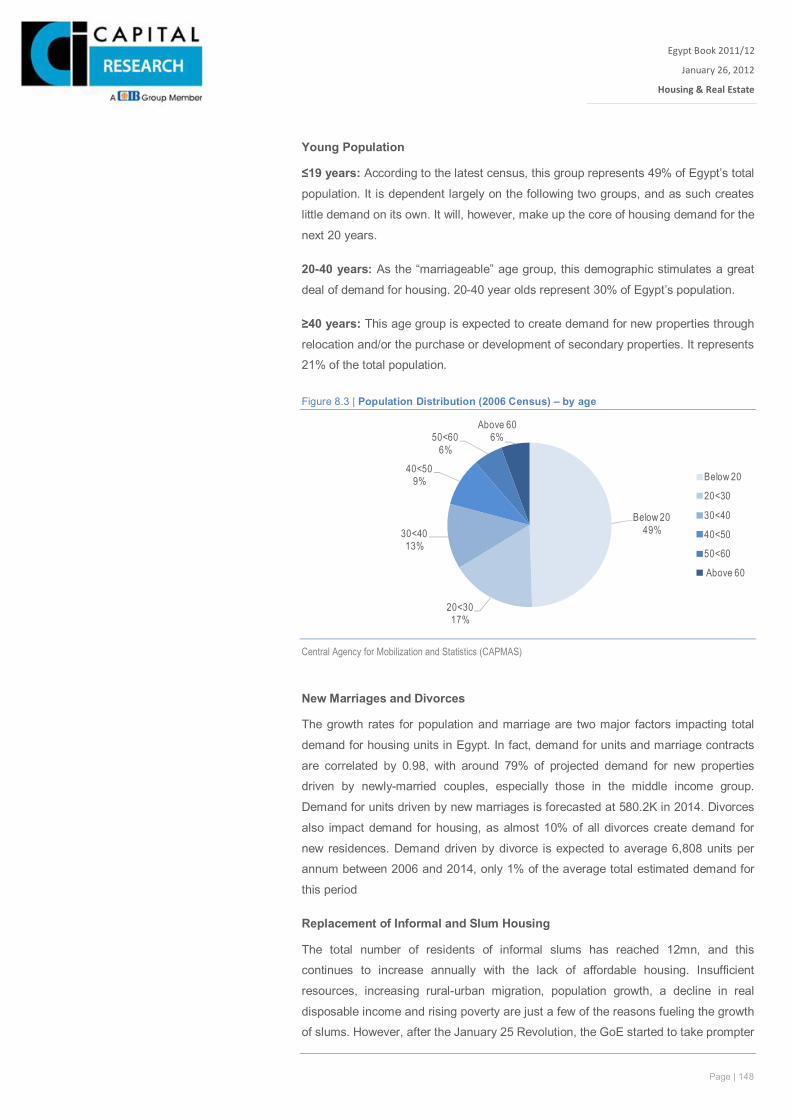
Page | 148
Egypt Book 2011/12
January 26, 2012
Housing & Real Estate
Xxx
Young Population
≤19 years: According to the latest census, this group represents 49% of Egypt’s total
population. It is dependent largely on the following two groups, and as such creates
little demand on its own. It will, however, make up the core of housing demand for the
next 20 years.
20-40 years: As the “marriageable” age group, this demographic stimulates a great
deal of demand for housing. 20-40 year olds represent 30% of Egypt’s population.
≥40 years: This age group is expected to create demand for new properties through
relocation and/or the purchase or development of secondary properties. It represents
21% of the total population.
Figure 8.3 | Population Distribution (2006 Census) – by age
Central Agency for Mobilization and Statistics (CAPMAS)
New Marriages and Divorces
The growth rates for population and marriage are two major factors impacting total
demand for housing units in Egypt. In fact, demand for units and marriage contracts
are correlated by 0.98, with around 79% of projected demand for new properties
driven by newly-married couples, especially those in the middle income group.
Demand for units driven by new marriages is forecasted at 580.2K in 2014. Divorces
also impact demand for housing, as almost 10% of all divorces create demand for
new residences. Demand driven by divorce is expected to average 6,808 units per
annum between 2006 and 2014, only 1% of the average total estimated demand for
this period
Replacement of Informal and Slum Housing
The total number of residents of informal slums has reached 12mn, and this
continues to increase annually with the lack of affordable housing. Insufficient
resources, increasing rural-urban migration, population growth, a decline in real
disposable income and rising poverty are just a few of the reasons fueling the growth
of slums. However, after the January 25 Revolution, the GoE started to take prompter
Below 2049%
20<3017%
30<4013%
40<509%
50<606%
Above 606%
Below 20
20<30
30<40
40<50
50<60
Above 60
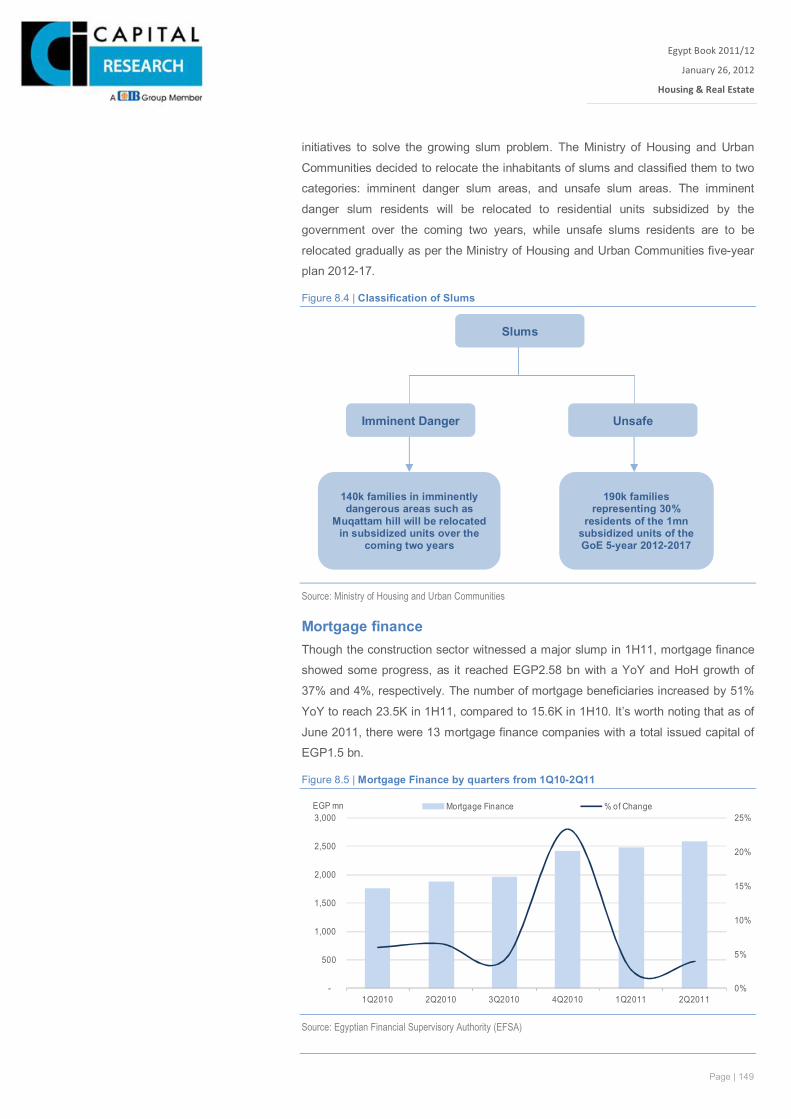
Page | 149
Egypt Book 2011/12
January 26, 2012
Housing & Real Estate
Xxx
initiatives to solve the growing slum problem. The Ministry of Housing and Urban
Communities decided to relocate the inhabitants of slums and classified them to two
categories: imminent danger slum areas, and unsafe slum areas. The imminent
danger slum residents will be relocated to residential units subsidized by the
government over the coming two years, while unsafe slums residents are to be
relocated gradually as per the Ministry of Housing and Urban Communities five-year
plan 2012-17.
Figure 8.4 | Classification of Slums
Source: Ministry of Housing and Urban Communities
Mortgage finance Though the construction sector witnessed a major slump in 1H11, mortgage finance
showed some progress, as it reached EGP2.58 bn with a YoY and HoH growth of
37% and 4%, respectively. The number of mortgage beneficiaries increased by 51%
YoY to reach 23.5K in 1H11, compared to 15.6K in 1H10. It’s worth noting that as of
June 2011, there were 13 mortgage finance companies with a total issued capital of
EGP1.5 bn.
Figure 8.5 | Mortgage Finance by quarters from 1Q10-2Q11
Source: Egyptian Financial Supervisory Authority (EFSA)
0%
5%
10%
15%
20%
25%
-
500
1,000
1,500
2,000
2,500
3,000
1Q2010 2Q2010 3Q2010 4Q2010 1Q2011 2Q2011
EGP mn Mortgage Finance % of Change
Slums
Imminent Danger Unsafe
140k families in imminently dangerous areas such as
Muqattam hill will be relocated in subsidized units over the
coming two years
190k families representing 30%
residents of the 1mn subsidized units of the GoE 5-year 2012-2017
Page | 150
Egypt Book 2011/12
January 26, 2012
Housing & Real Estate
Xxx
In the wake of the revolution, numerous corruption files were revealed and major real
estate developers and government officials faced charges, including Talaat Mostafa
Group (TMGH) and Palm Hills Development Company (PHDC). Both groups have
since been facing legal obstacles concerned with the validation of land ownership
contracts. Egyptian court first ruled to halt the sale of 33mn sqm to TMGH (66% of
TMGH’s total land bank) for its mixed-use Madinaty project, citing that the land
acquisition agreement between TMGH and the New Urban Communities Authority
(NUCA) was invalid as it was not closed in auction form. However, TMGH appealed
to the court decision, and in November, 2011, the court decided the validity of
Madinaty contracts with the GoE and thus assured TMGH’s right to retain it. Palm
Hills was not so lucky, however, as the New Urban Communities (NUCA) cancelled
its contract with PHDC over a land plot amounting 190 feddans (equivalent to 798K
sqm) in 6th of October city, which will affect the company’s construction plans.
Meanwhile, Sixth of October Development and Investment Company (SODIC)
chairman Magdi Rasekh and the former Minister of Housing and Urban Communities
were accused of violating laws regulating tenders and auctions and acquiring state
land at fire-sale prices, wasting EGP970mn.
Furthermore, former Minister of Housing and Urban Communities Ahmed El
Maghrabi was sentenced to five years in prison for involvement in an illegal land deal,
wasting public funds, and helping a businessman buy 70K sqm of state land at
below-market prices. The businessman, Mounir Ghabbour, received a one-year
suspended sentence for his role in the same case.
Preview 2012 During 2012, we expect the real estate industry to witness minimal growth, with some
recovery anticipated towards the end of the year as the political situation clears up.
In the meantime, the sector will still be supported by the growing population (with
49% aged 19 and older), as well as new marriages and divorces. Moreover, given the
rising awareness of social responsibility post-revolution, we expect the GoE to start
supplying low- and middle-income groups with appropriate housing units.
According to the Ministry of Housing, GoE has a preliminary social housing five-year
plan, yet to be implemented. The social housing projects will target new cities in most
of Egypt’s governorates, starting with Cairo and Giza. The Ministry of Housing and
Urban Development has allocated EGP10bn for use next year. These allocations will
run for a six-month period in 1H12, of which EGP7bn will be allocated from the state
budget and EGP3bn from other development partners. The plan has is built on a
“Subsidize, Assist and Provide” strategy.
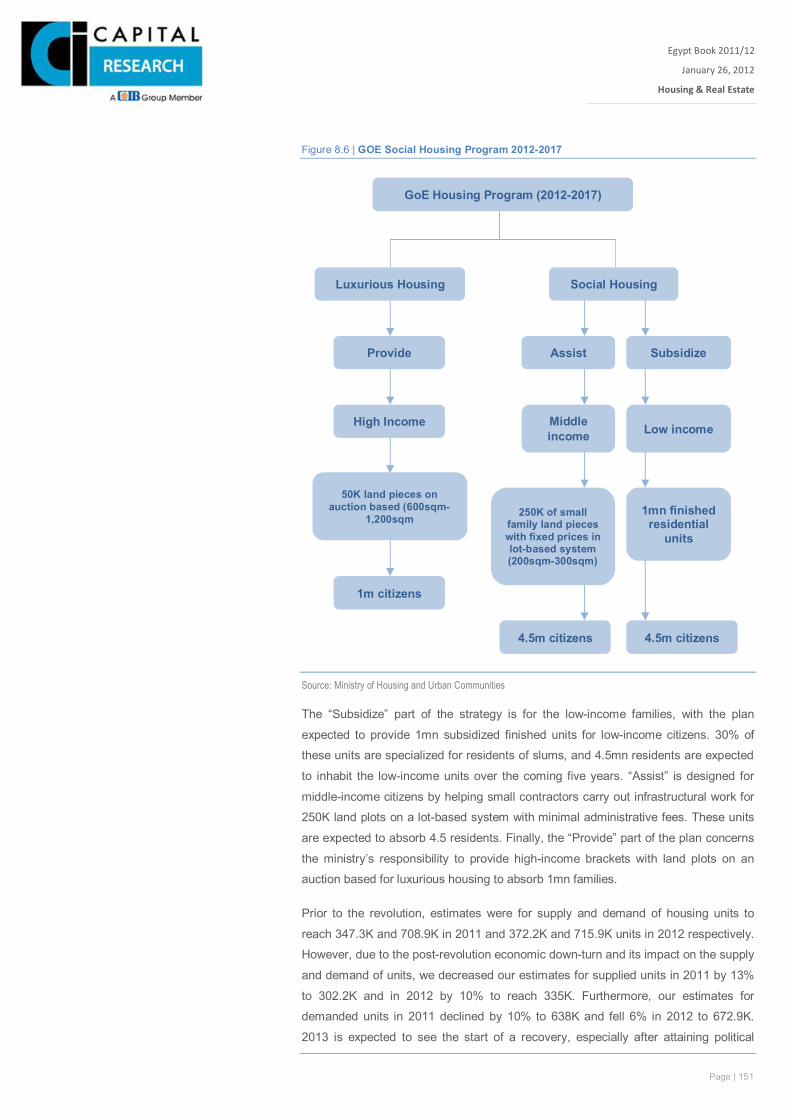
Page | 151
Egypt Book 2011/12
January 26, 2012
Housing & Real Estate
Xxx
Figure 8.6 | GOE Social Housing Program 2012-2017
Source: Ministry of Housing and Urban Communities The “Subsidize” part of the strategy is for the low-income families, with the plan
expected to provide 1mn subsidized finished units for low-income citizens. 30% of
these units are specialized for residents of slums, and 4.5mn residents are expected
to inhabit the low-income units over the coming five years. “Assist” is designed for
middle-income citizens by helping small contractors carry out infrastructural work for
250K land plots on a lot-based system with minimal administrative fees. These units
are expected to absorb 4.5 residents. Finally, the “Provide” part of the plan concerns
the ministry’s responsibility to provide high-income brackets with land plots on an
auction based for luxurious housing to absorb 1mn families.
Prior to the revolution, estimates were for supply and demand of housing units to
reach 347.3K and 708.9K in 2011 and 372.2K and 715.9K units in 2012 respectively.
However, due to the post-revolution economic down-turn and its impact on the supply
and demand of units, we decreased our estimates for supplied units in 2011 by 13%
to 302.2K and in 2012 by 10% to reach 335K. Furthermore, our estimates for
demanded units in 2011 declined by 10% to 638K and fell 6% in 2012 to 672.9K.
2013 is expected to see the start of a recovery, especially after attaining political
GoE Housing Program (2012-2017)
Luxurious Housing Social Housing
50K land pieces on auction based (600sqm-
1,200sqm 250K of small family land pieces with fixed prices in lot-based system (200sqm-300sqm)
Provide
High Income
1m citizens
Middle income Low income
Assist Subsidize
1mn finished residential
units
4.5m citizens 4.5m citizens
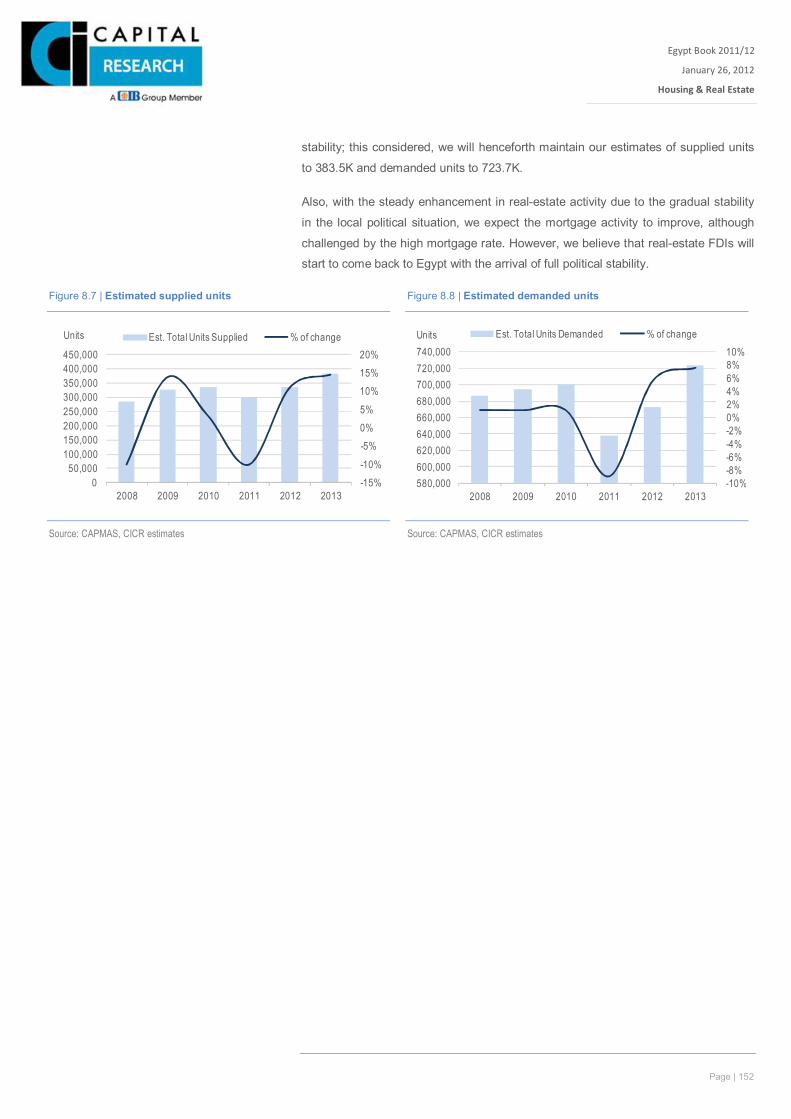
Page | 152
Egypt Book 2011/12
January 26, 2012
Housing & Real Estate
Xxx
stability; this considered, we will henceforth maintain our estimates of supplied units
to 383.5K and demanded units to 723.7K.
Also, with the steady enhancement in real-estate activity due to the gradual stability
in the local political situation, we expect the mortgage activity to improve, although
challenged by the high mortgage rate. However, we believe that real-estate FDIs will
start to come back to Egypt with the arrival of full political stability.
Figure 8.7 | Estimated supplied units Figure 8.8 | Estimated demanded units
Source: CAPMAS, CICR estimates
Source: CAPMAS, CICR estimates
-15%-10%-5%0%5%10%15%20%
050,000
100,000150,000200,000250,000300,000350,000400,000450,000
2008 2009 2010 2011 2012 2013
Units Est. Total Units Supplied % of change
-10%-8%-6%-4%-2%0%2%4%6%8%10%
580,000600,000620,000640,000660,000680,000700,000720,000740,000
2008 2009 2010 2011 2012 2013
Units Est. Total Units Demanded % of change
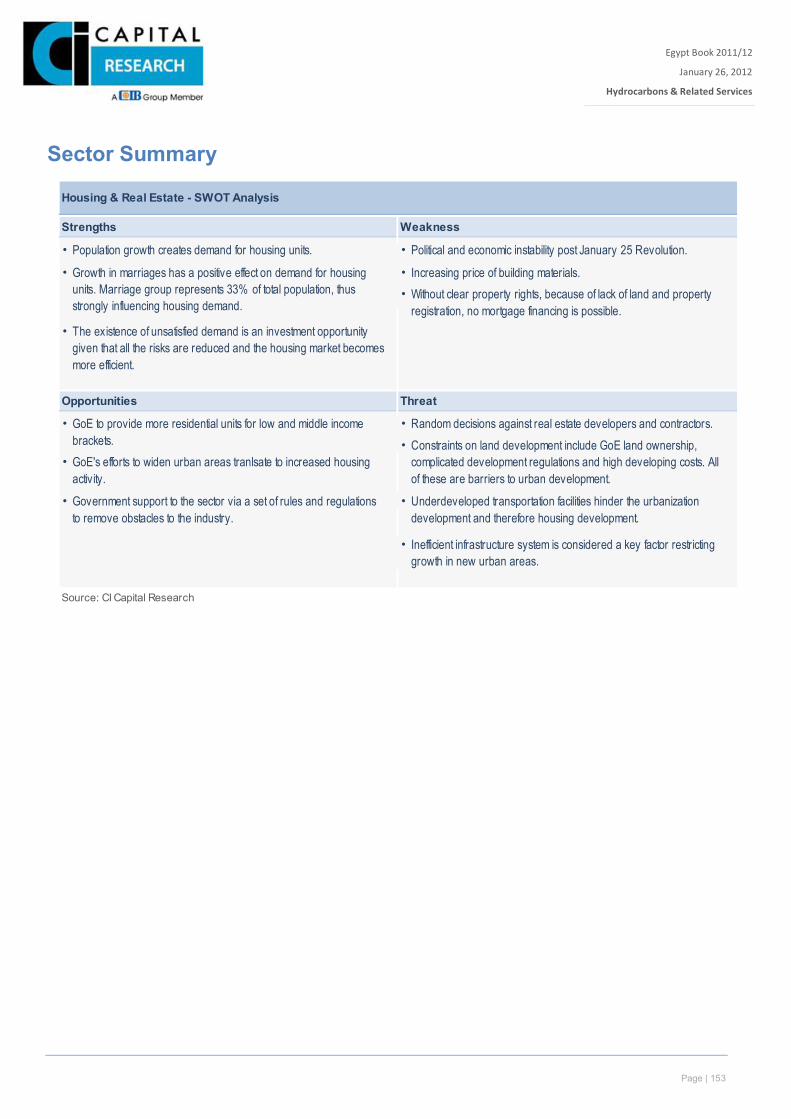
Page | 153
Egypt Book 2011/12
January 26, 2012
Hydrocarbons & Related Services
Xxx
Sector Summary
Housing & Real Estate - SWOT Analysis
Strengths Weakness
• Population growth creates demand for housing units. • Political and economic instability post January 25 Revolution.
• • Increasing price of building materials.•
•
Opportunities Threat
• • Random decisions against real estate developers and contractors.•
•
• •
• Inefficient infrastructure system is considered a key factor restricting growth in new urban areas.
Source: CI Capital Research
Government support to the sector via a set of rules and regulations to remove obstacles to the industry.
Constraints on land development include GoE land ownership, complicated development regulations and high developing costs. All of these are barriers to urban development.
Underdeveloped transportation facilities hinder the urbanization development and therefore housing development.
Without clear property rights, because of lack of land and property registration, no mortgage financing is possible.
Growth in marriages has a positive effect on demand for housing units. Marriage group represents 33% of total population, thus strongly influencing housing demand.
The existence of unsatisfied demand is an investment opportunity given that all the risks are reduced and the housing market becomes more efficient.
GoE to provide more residential units for low and middle income brackets.GoE's efforts to widen urban areas tranlsate to increased housing activity.
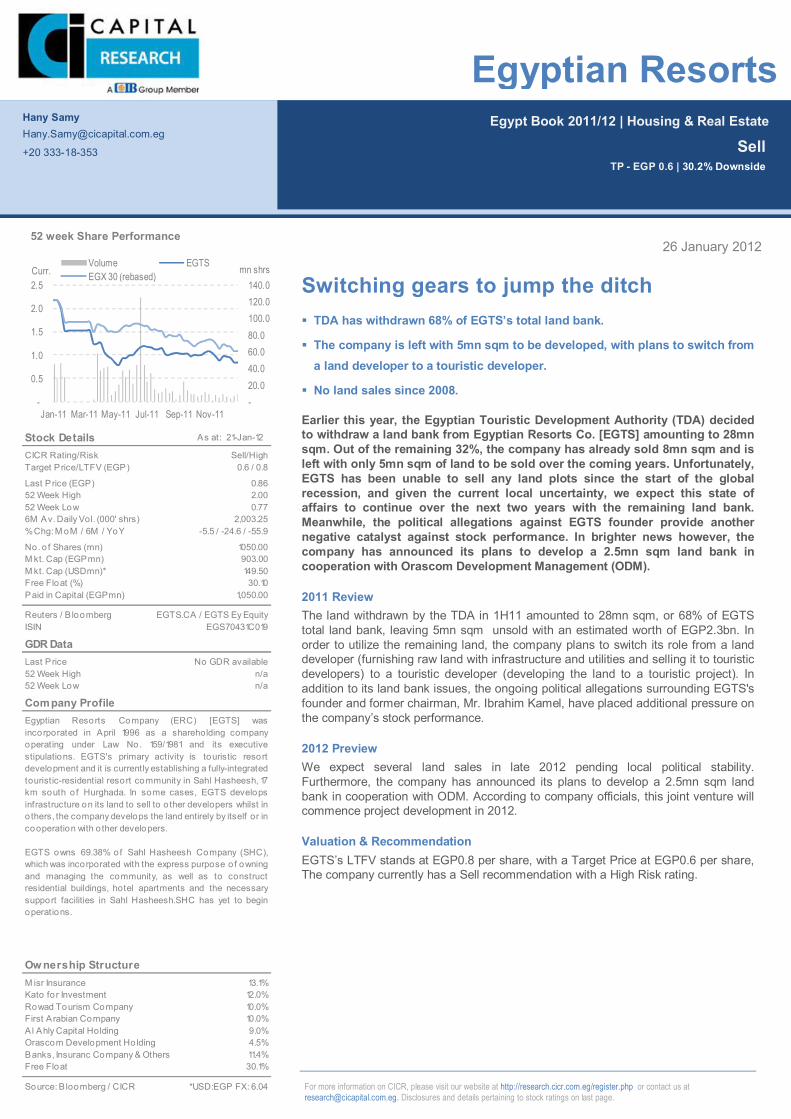
Page | 23
Egypt Book 2011/12 | Housing & Real Estate
For more information on CICR, please visit our website at http://research.cicr.com.eg/register.php or contact us at [email protected]. Disclosures and details pertaining to stock ratings on last page.
26 January 2012
Switching gears to jump the ditch TDA has withdrawn 68% of EGTS’s total land bank.
The company is left with 5mn sqm to be developed, with plans to switch from a land developer to a touristic developer.
No land sales since 2008.
Earlier this year, the Egyptian Touristic Development Authority (TDA) decided to withdraw a land bank from Egyptian Resorts Co. [EGTS] amounting to 28mn sqm. Out of the remaining 32%, the company has already sold 8mn sqm and is left with only 5mn sqm of land to be sold over the coming years. Unfortunately, EGTS has been unable to sell any land plots since the start of the global recession, and given the current local uncertainty, we expect this state of affairs to continue over the next two years with the remaining land bank. Meanwhile, the political allegations against EGTS founder provide another negative catalyst against stock performance. In brighter news however, the company has announced its plans to develop a 2.5mn sqm land bank in cooperation with Orascom Development Management (ODM).
2011 Review The land withdrawn by the TDA in 1H11 amounted to 28mn sqm, or 68% of EGTS total land bank, leaving 5mn sqm unsold with an estimated worth of EGP2.3bn. In order to utilize the remaining land, the company plans to switch its role from a land developer (furnishing raw land with infrastructure and utilities and selling it to touristic developers) to a touristic developer (developing the land to a touristic project). In addition to its land bank issues, the ongoing political allegations surrounding EGTS's founder and former chairman, Mr. Ibrahim Kamel, have placed additional pressure on the company’s stock performance.
2012 Preview We expect several land sales in late 2012 pending local political stability. Furthermore, the company has announced its plans to develop a 2.5mn sqm land bank in cooperation with ODM. According to company officials, this joint venture will commence project development in 2012.
Valuation & Recommendation EGTS’s LTFV stands at EGP0.8 per share, with a Target Price at EGP0.6 per share, The company currently has a Sell recommendation with a High Risk rating.
Hany Samy [email protected]
+20 333-18-353
Sell TP - EGP 0.6 | 30.2% Downside
Egyptian Resorts
Stock Details As at: 21-Jan-12
CICR Rating/RiskTarget Price/LTFV (EGP)
Last Price (EGP)52 Week High52 Week Low6M Av. Daily Vol. (000' shrs)% Chg: M oM / 6M / YoY
No. o f Shares (mn)M kt. Cap (EGPmn)M kt. Cap (USDmn)*Free Float (%)Paid in Capital (EGPmn)
Reuters / B loombergISIN
GDR DataLast Price52 Week High52 Week Low
Company Profile
Ow nership StructureM isr Insurance 13.1%Kato fo r Investment 12.0%Rowad Tourism Company 10.0%First Arabian Company 10.0%Al Ahly Capital Holding 9.0%Orascom Development Ho lding 4.5%Banks, Insuranc Company & Others 11.4%Free Float 30.1%
Source: B loomberg / CICR *USD:EGP FX: 6.04
Egyptian Resorts Company (ERC) [EGTS] wasincorporated in April 1996 as a shareholding companyoperating under Law No. 159/1981 and its executivestipulations. EGTS's primary activity is touristic resortdevelopment and it is currently establishing a fully-integrated touristic-residential resort community in Sahl Hasheesh, 17km south of Hurghada. In some cases, EGTS developsinfrastructure on its land to sell to o ther developers whilst ino thers, the company develops the land entirely by itself or incooperation with o ther developers.
EGTS owns 69.38% of Sahl Hasheesh Company (SHC),which was incorporated with the express purpose of owningand managing the community, as well as to constructresidential buildings, hotel apartments and the necessarysupport facilities in Sahl Hasheesh.SHC has yet to beginoperations.
2.000.77
1050.00
2,003.25
EGTS.CA / EGTS Ey Equity
149.50
-5.5 / -24.6 / -55.9
1,050.00
903.00
No GDR availablen/a
30.10
EGS70431C019
n/a
0.6 / 0.8
0.86
Sell/High
-20.0 40.0 60.0 80.0 100.0 120.0 140.0
-
0.5
1.0
1.5
2.0
2.5
Jan-11 Mar-11 May-11 Jul-11 Sep-11 Nov-11
mn shrsCurr.Volume EGTSEGX 30 (rebased)
52 week Share Performance
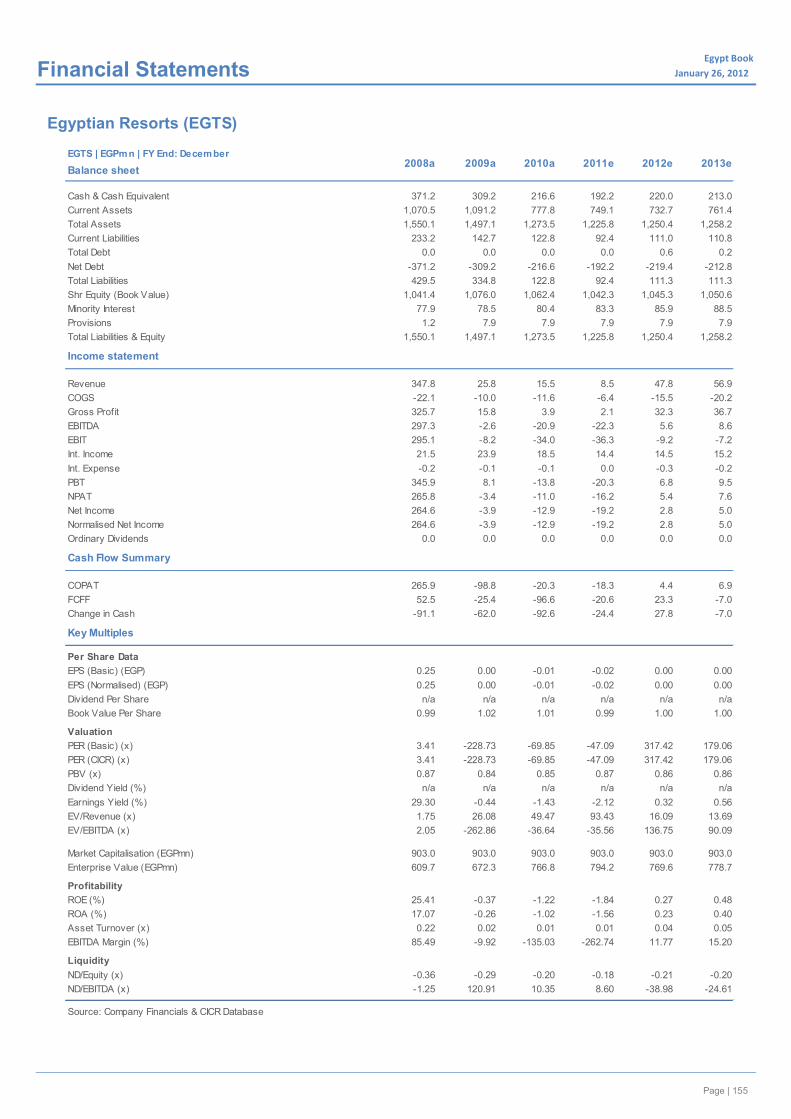
Page | 24
Egypt Book January 26, 2012x Financial Statements
Egyptian Resorts (EGTS)
EGTS | EGPmn | FY End: December
Balance sheet
Cash & Cash Equivalent 371.2 309.2 216.6 192.2 220.0 213.0Current Assets 1,070.5 1,091.2 777.8 749.1 732.7 761.4Total Assets 1,550.1 1,497.1 1,273.5 1,225.8 1,250.4 1,258.2Current Liabilities 233.2 142.7 122.8 92.4 111.0 110.8Total Debt 0.0 0.0 0.0 0.0 0.6 0.2Net Debt -371.2 -309.2 -216.6 -192.2 -219.4 -212.8Total Liabilities 429.5 334.8 122.8 92.4 111.3 111.3Shr Equity (Book Value) 1,041.4 1,076.0 1,062.4 1,042.3 1,045.3 1,050.6Minority Interest 77.9 78.5 80.4 83.3 85.9 88.5Provisions 1.2 7.9 7.9 7.9 7.9 7.9Total Liabilities & Equity 1,550.1 1,497.1 1,273.5 1,225.8 1,250.4 1,258.2
Income statement
Revenue 347.8 25.8 15.5 8.5 47.8 56.9COGS -22.1 -10.0 -11.6 -6.4 -15.5 -20.2Gross Profit 325.7 15.8 3.9 2.1 32.3 36.7EBITDA 297.3 -2.6 -20.9 -22.3 5.6 8.6EBIT 295.1 -8.2 -34.0 -36.3 -9.2 -7.2Int. Income 21.5 23.9 18.5 14.4 14.5 15.2Int. Expense -0.2 -0.1 -0.1 0.0 -0.3 -0.2PBT 345.9 8.1 -13.8 -20.3 6.8 9.5NPAT 265.8 -3.4 -11.0 -16.2 5.4 7.6Net Income 264.6 -3.9 -12.9 -19.2 2.8 5.0Normalised Net Income 264.6 -3.9 -12.9 -19.2 2.8 5.0Ordinary Dividends 0.0 0.0 0.0 0.0 0.0 0.0
Cash Flow Summary
COPAT 265.9 -98.8 -20.3 -18.3 4.4 6.9FCFF 52.5 -25.4 -96.6 -20.6 23.3 -7.0Change in Cash -91.1 -62.0 -92.6 -24.4 27.8 -7.0
Key Multiples
Per Share DataEPS (Basic) (EGP) 0.25 0.00 -0.01 -0.02 0.00 0.00EPS (Normalised) (EGP) 0.25 0.00 -0.01 -0.02 0.00 0.00Dividend Per Share n/a n/a n/a n/a n/a n/aBook Value Per Share 0.99 1.02 1.01 0.99 1.00 1.00
ValuationPER (Basic) (x) 3.41 -228.73 -69.85 -47.09 317.42 179.06PER (CICR) (x) 3.41 -228.73 -69.85 -47.09 317.42 179.06PBV (x) 0.87 0.84 0.85 0.87 0.86 0.86Dividend Yield (%) n/a n/a n/a n/a n/a n/aEarnings Yield (%) 29.30 -0.44 -1.43 -2.12 0.32 0.56EV/Revenue (x) 1.75 26.08 49.47 93.43 16.09 13.69EV/EBITDA (x) 2.05 -262.86 -36.64 -35.56 136.75 90.09
Market Capitalisation (EGPmn) 903.0 903.0 903.0 903.0 903.0 903.0Enterprise Value (EGPmn) 609.7 672.3 766.8 794.2 769.6 778.7
ProfitabilityROE (%) 25.41 -0.37 -1.22 -1.84 0.27 0.48ROA (%) 17.07 -0.26 -1.02 -1.56 0.23 0.40Asset Turnover (x) 0.22 0.02 0.01 0.01 0.04 0.05EBITDA Margin (%) 85.49 -9.92 -135.03 -262.74 11.77 15.20
LiquidityND/Equity (x) -0.36 -0.29 -0.20 -0.18 -0.21 -0.20ND/EBITDA (x) -1.25 120.91 10.35 8.60 -38.98 -24.61
Source: Company Financials & CICR Database
2008a 2009a 2010a 2011e 2012e 2013e
Page | 155
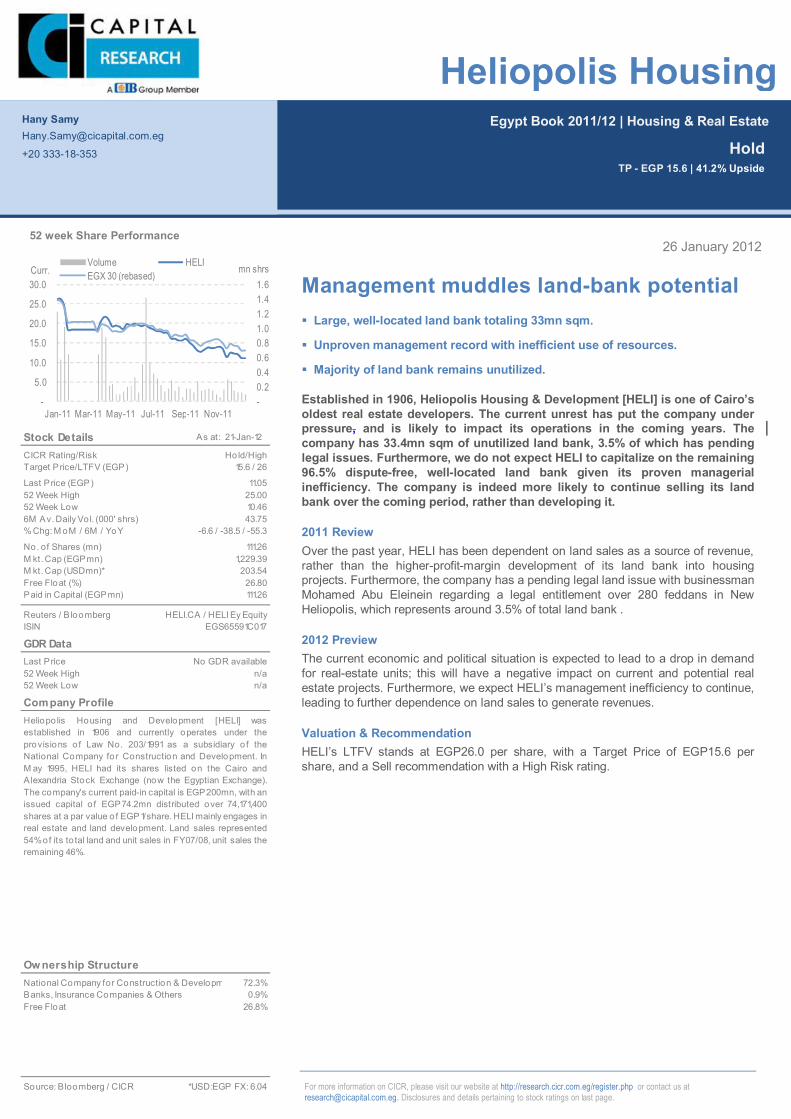
Page | 25
Egypt Book 2011/12 | Housing & Real Estate
For more information on CICR, please visit our website at http://research.cicr.com.eg/register.php or contact us at [email protected]. Disclosures and details pertaining to stock ratings on last page.
26 January 2012
Management muddles land-bank potential Large, well-located land bank totaling 33mn sqm.
Unproven management record with inefficient use of resources.
Majority of land bank remains unutilized.
Established in 1906, Heliopolis Housing & Development [HELI] is one of Cairo’s oldest real estate developers. The current unrest has put the company under pressure, and is likely to impact its operations in the coming years. The company has 33.4mn sqm of unutilized land bank, 3.5% of which has pending legal issues. Furthermore, we do not expect HELI to capitalize on the remaining 96.5% dispute-free, well-located land bank given its proven managerial inefficiency. The company is indeed more likely to continue selling its land bank over the coming period, rather than developing it.
2011 Review Over the past year, HELI has been dependent on land sales as a source of revenue, rather than the higher-profit-margin development of its land bank into housing projects. Furthermore, the company has a pending legal land issue with businessman Mohamed Abu Eleinein regarding a legal entitlement over 280 feddans in New Heliopolis, which represents around 3.5% of total land bank .
2012 Preview The current economic and political situation is expected to lead to a drop in demand for real-estate units; this will have a negative impact on current and potential real estate projects. Furthermore, we expect HELI’s management inefficiency to continue, leading to further dependence on land sales to generate revenues.
Valuation & Recommendation HELI’s LTFV stands at EGP26.0 per share, with a Target Price of EGP15.6 per share, and a Sell recommendation with a High Risk rating.
Hany Samy [email protected]
+20 333-18-353
Hold TP - EGP 15.6 | 41.2% Upside
Heliopolis Housing
Stock Details As at: 21-Jan-12
CICR Rating/RiskTarget Price/LTFV (EGP)
Last Price (EGP)52 Week High52 Week Low6M Av. Daily Vo l. (000' shrs)% Chg: M oM / 6M / YoY
No. of Shares (mn)M kt. Cap (EGPmn)M kt. Cap (USDmn)*Free Float (%)Paid in Capital (EGPmn)
Reuters / B loombergISIN
GDR DataLast Price52 Week High52 Week Low
Company Profile
Ow nership StructureNational Company for Construction & Development 72.3%Banks, Insurance Companies & Others 0.9%Free Float 26.8%
Source: Bloomberg / CICR *USD:EGP FX: 6.04
Heliopo lis Housing and Development [HELI] wasestablished in 1906 and currently operates under theprovisions of Law No. 203/1991 as a subsidiary o f theNational Company for Construction and Development. InM ay 1995, HELI had its shares listed on the Cairo andAlexandria Stock Exchange (now the Egyptian Exchange).The company's current paid-in capital is EGP200mn, with anissued capital o f EGP74.2mn distributed over 74,171,400shares at a par value o f EGP1/share. HELI mainly engages in real estate and land development. Land sales represented54%of its to tal land and unit sales in FY07/08, unit sales theremaining 46%.
25.0010.46
111.26
43.75
HELI.CA / HELI Ey Equity
203.54
-6.6 / -38.5 / -55.3
111.26
1,229.39
No GDR availablen/a
26.80
EGS65591C017
n/a
15.6 / 26
11.05
Hold/High
-0.2 0.4 0.6 0.8 1.0 1.2 1.4 1.6
-
5.0
10.0
15.0
20.0
25.0
30.0
Jan-11 Mar-11 May-11 Jul-11 Sep-11 Nov-11
mn shrsCurr.Volume HELIEGX 30 (rebased)
52 week Share Performance

Page | 26
Egypt Book January 26, 2012x Financial Statements
Heliopolis Housing (HELI)
HELI | EGPmn | FY End: June
Balance sheet
Cash & Cash Equivalent 53.2 16.0 16.1 12.9 7.9 3.9Current Assets 1,207.5 1,236.3 1,441.8 1,473.1 1,526.3 1,549.6Total Assets 1,221.6 1,253.8 1,460.4 1,491.3 1,544.4 1,567.6Current Liabilities 748.5 793.7 943.3 1,056.5 1,067.8 1,049.2Total Debt 3.3 59.6 80.6 242.9 315.6 322.7Net Debt -49.8 43.6 64.5 230.0 307.7 318.8Total Liabilities 828.5 942.2 1,071.0 1,183.8 1,201.2 1,189.0Shr Equity (Book Value) 341.0 277.4 350.3 268.5 304.1 339.5Minority Interest 0.0 0.0 0.0 0.0 0.0 0.0Provisions 52.1 34.1 39.0 39.0 39.0 39.0Total Liabilities & Equity 1,221.6 1,253.8 1,460.4 1,491.3 1,544.4 1,567.6
Income statement
Revenue 280.1 143.4 321.0 200.1 250.3 292.7COGS -94.8 -27.9 -104.2 -78.5 -102.6 -109.2Gross Profit 185.3 115.4 216.8 121.6 147.7 183.5EBITDA 164.8 92.3 190.6 105.2 127.3 159.6EBIT 164.3 91.5 189.8 104.4 126.4 158.7Int. Income 34.4 41.5 41.6 38.5 32.5 25.1Int. Expense -0.2 -0.2 -0.2 -14.6 -18.9 -19.3PBT 174.5 126.7 198.4 125.5 137.1 161.3NPAT 134.6 100.1 151.5 100.4 109.7 129.1Net Income 133.2 99.4 151.5 100.4 109.7 129.1Normalised Net Income 133.2 99.4 151.5 100.4 109.7 129.1Ordinary Dividends 74.2 92.7 64.6 42.8 46.8 55.0
Cash Flow Summary
COPAT 166.1 65.7 144.1 79.8 99.9 127.3FCFF 586.1 -29.6 84.2 19.2 -20.5 73.4Change in Cash 2.7 -5.7 0.1 0.0 0.0 0.0
Key Multiples
Per Share DataEPS (Basic) (EGP) 1.80 1.34 2.04 1.35 1.48 1.74EPS (Normalised) (EGP) 1.80 1.34 2.04 1.35 1.48 1.74Dividend Per Share 1.00 1.25 0.87 0.58 0.63 0.74Book Value Per Share 4.60 3.74 4.72 3.62 4.10 4.58
ValuationPER (Basic) (x) 6.15 8.24 5.41 8.16 7.47 6.35PER (CICR) (x) 6.15 8.24 5.41 8.16 7.47 6.35PBV (x) 2.40 2.95 2.34 3.05 2.70 2.41Dividend Yield (%) 9.05 11.31 7.88 5.22 5.71 6.72Earnings Yield (%) 16.26 12.13 18.49 12.25 13.38 15.75EV/Revenue (x) 2.75 6.02 2.75 5.25 4.50 3.89EV/EBITDA (x) 4.67 9.36 4.64 9.97 8.85 7.13
Market Capitalisation (EGPmn) 819.6 819.6 819.6 819.6 819.6 819.6Enterprise Value (EGPmn) 769.7 863.2 884.1 1,049.6 1,127.3 1,138.4
ProfitabilityROE (%) 39.08 35.83 43.26 37.40 36.07 38.02ROA (%) 10.91 7.93 10.38 6.73 7.10 8.23Asset Turnover (x) 0.23 0.11 0.22 0.13 0.16 0.19EBITDA Margin (%) 58.84 64.35 59.38 52.61 50.86 54.53
LiquidityND/Equity (x) -0.15 0.16 0.18 0.86 1.01 0.94ND/EBITDA (x) -0.30 0.47 0.34 2.19 2.42 2.00
Source: Company Financials & CICR Database
2008a 2009a 2010a 2011e 2012e 2013e
Page | 157
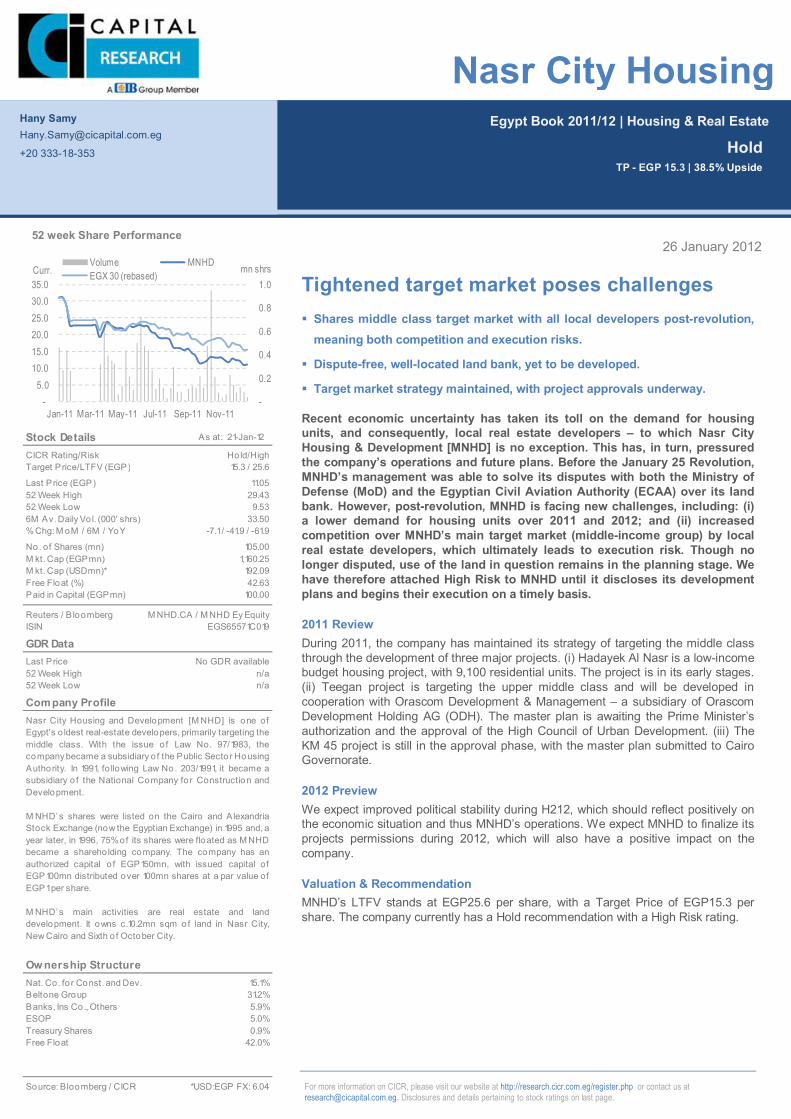
Page | 27
Egypt Book 2011/12 | Housing & Real Estate
For more information on CICR, please visit our website at http://research.cicr.com.eg/register.php or contact us at [email protected]. Disclosures and details pertaining to stock ratings on last page.
26 January 2012
Tightened target market poses challenges Shares middle class target market with all local developers post-revolution,
meaning both competition and execution risks.
Dispute-free, well-located land bank, yet to be developed.
Target market strategy maintained, with project approvals underway.
Recent economic uncertainty has taken its toll on the demand for housing units, and consequently, local real estate developers – to which Nasr City Housing & Development [MNHD] is no exception. This has, in turn, pressured the company’s operations and future plans. Before the January 25 Revolution, MNHD’s management was able to solve its disputes with both the Ministry of Defense (MoD) and the Egyptian Civil Aviation Authority (ECAA) over its land bank. However, post-revolution, MNHD is facing new challenges, including: (i) a lower demand for housing units over 2011 and 2012; and (ii) increased competition over MNHD’s main target market (middle-income group) by local real estate developers, which ultimately leads to execution risk. Though no longer disputed, use of the land in question remains in the planning stage. We have therefore attached High Risk to MNHD until it discloses its development plans and begins their execution on a timely basis.
2011 Review During 2011, the company has maintained its strategy of targeting the middle class through the development of three major projects. (i) Hadayek Al Nasr is a low-income budget housing project, with 9,100 residential units. The project is in its early stages. (ii) Teegan project is targeting the upper middle class and will be developed in cooperation with Orascom Development & Management – a subsidiary of Orascom Development Holding AG (ODH). The master plan is awaiting the Prime Minister’s authorization and the approval of the High Council of Urban Development. (iii) The KM 45 project is still in the approval phase, with the master plan submitted to Cairo Governorate.
2012 Preview We expect improved political stability during H212, which should reflect positively on the economic situation and thus MNHD’s operations. We expect MNHD to finalize its projects permissions during 2012, which will also have a positive impact on the company.
Valuation & Recommendation MNHD’s LTFV stands at EGP25.6 per share, with a Target Price of EGP15.3 per share. The company currently has a Hold recommendation with a High Risk rating.
Hany Samy [email protected]
+20 333-18-353
Hold TP - EGP 15.3 | 38.5% Upside
Nasr City Housing
Stock Details As at: 21-Jan-12
CICR Rating/RiskTarget Price/LTFV (EGP)
Last Price (EGP)52 Week High52 Week Low6M Av. Daily Vo l. (000' shrs)% Chg: M oM / 6M / YoY
No. of Shares (mn)M kt. Cap (EGPmn)M kt. Cap (USDmn)*Free Float (%)Paid in Capital (EGPmn)
Reuters / B loombergISIN
GDR DataLast Price52 Week High52 Week Low
Company Profile
Ow nership StructureNat. Co. fo r Const. and Dev. 15.1%Beltone Group 31.2%Banks, Ins Co., Others 5.9%ESOP 5.0%Treasury Shares 0.9%Free Float 42.0%
Source: Bloomberg / CICR *USD:EGP FX: 6.04
Nasr City Housing and Development [M NHD] is one ofEgypt's o ldest real-estate developers, primarily targeting themiddle class. With the issue of Law No. 97/1983, thecompany became a subsidiary o f the Public Sector Housing Authority. In 1991, fo llowing Law No. 203/1991, it became asubsidiary o f the National Company for Construction andDevelopment.
M NHD’s shares were listed on the Cairo and AlexandriaStock Exchange (now the Egyptian Exchange) in 1995 and, ayear later, in 1996, 75%of its shares were floated as M NHDbecame a shareho lding company. The company has anauthorized capital o f EGP150mn, with issued capital ofEGP100mn distributed over 100mn shares at a par value ofEGP1 per share.
M NHD’s main activities are real estate and landdevelopment. It owns c.10.2mn sqm of land in Nasr City,New Cairo and Sixth o f October City.
29.439.53
105.00
33.50
M NHD.CA / M NHD Ey Equity
192.09
-7.1 / -41.9 / -61.9
100.00
1,160.25
No GDR availablen/a
42.63
EGS65571C019
n/a
15.3 / 25.6
11.05
Hold/High
-
0.2
0.4
0.6
0.8
1.0
-5.0
10.0 15.0 20.0 25.0 30.0 35.0
Jan-11 Mar-11 May-11 Jul-11 Sep-11 Nov-11
mn shrsCurr.Volume MNHDEGX 30 (rebased)
52 week Share Performance
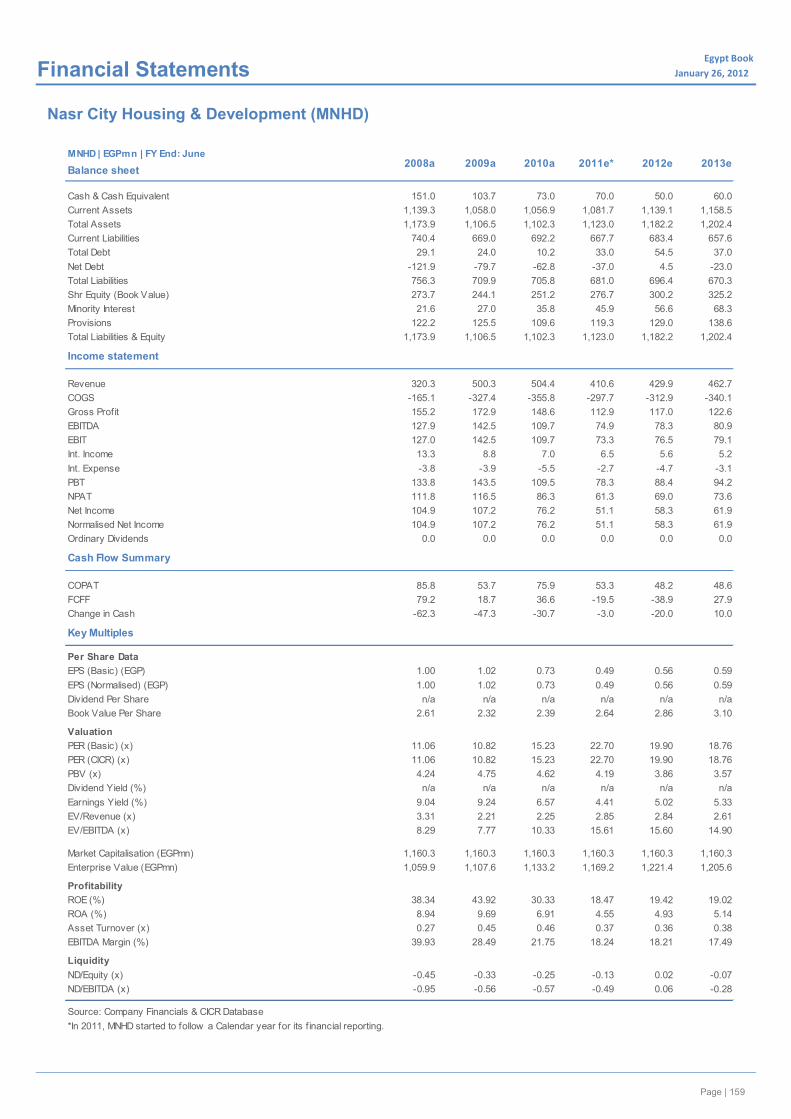
Page | 28
Egypt Book January 26, 2012x Financial Statements
Nasr City Housing & Development (MNHD)
MNHD | EGPmn | FY End: June
Balance sheet
Cash & Cash Equivalent 151.0 103.7 73.0 70.0 50.0 60.0Current Assets 1,139.3 1,058.0 1,056.9 1,081.7 1,139.1 1,158.5Total Assets 1,173.9 1,106.5 1,102.3 1,123.0 1,182.2 1,202.4Current Liabilities 740.4 669.0 692.2 667.7 683.4 657.6Total Debt 29.1 24.0 10.2 33.0 54.5 37.0Net Debt -121.9 -79.7 -62.8 -37.0 4.5 -23.0Total Liabilities 756.3 709.9 705.8 681.0 696.4 670.3Shr Equity (Book Value) 273.7 244.1 251.2 276.7 300.2 325.2Minority Interest 21.6 27.0 35.8 45.9 56.6 68.3Provisions 122.2 125.5 109.6 119.3 129.0 138.6Total Liabilities & Equity 1,173.9 1,106.5 1,102.3 1,123.0 1,182.2 1,202.4
Income statement
Revenue 320.3 500.3 504.4 410.6 429.9 462.7COGS -165.1 -327.4 -355.8 -297.7 -312.9 -340.1Gross Profit 155.2 172.9 148.6 112.9 117.0 122.6EBITDA 127.9 142.5 109.7 74.9 78.3 80.9EBIT 127.0 142.5 109.7 73.3 76.5 79.1Int. Income 13.3 8.8 7.0 6.5 5.6 5.2Int. Expense -3.8 -3.9 -5.5 -2.7 -4.7 -3.1PBT 133.8 143.5 109.5 78.3 88.4 94.2NPAT 111.8 116.5 86.3 61.3 69.0 73.6Net Income 104.9 107.2 76.2 51.1 58.3 61.9Normalised Net Income 104.9 107.2 76.2 51.1 58.3 61.9Ordinary Dividends 0.0 0.0 0.0 0.0 0.0 0.0
Cash Flow Summary
COPAT 85.8 53.7 75.9 53.3 48.2 48.6FCFF 79.2 18.7 36.6 -19.5 -38.9 27.9Change in Cash -62.3 -47.3 -30.7 -3.0 -20.0 10.0
Key Multiples
Per Share DataEPS (Basic) (EGP) 1.00 1.02 0.73 0.49 0.56 0.59EPS (Normalised) (EGP) 1.00 1.02 0.73 0.49 0.56 0.59Dividend Per Share n/a n/a n/a n/a n/a n/aBook Value Per Share 2.61 2.32 2.39 2.64 2.86 3.10
ValuationPER (Basic) (x) 11.06 10.82 15.23 22.70 19.90 18.76PER (CICR) (x) 11.06 10.82 15.23 22.70 19.90 18.76PBV (x) 4.24 4.75 4.62 4.19 3.86 3.57Dividend Yield (%) n/a n/a n/a n/a n/a n/aEarnings Yield (%) 9.04 9.24 6.57 4.41 5.02 5.33EV/Revenue (x) 3.31 2.21 2.25 2.85 2.84 2.61EV/EBITDA (x) 8.29 7.77 10.33 15.61 15.60 14.90
Market Capitalisation (EGPmn) 1,160.3 1,160.3 1,160.3 1,160.3 1,160.3 1,160.3Enterprise Value (EGPmn) 1,059.9 1,107.6 1,133.2 1,169.2 1,221.4 1,205.6
ProfitabilityROE (%) 38.34 43.92 30.33 18.47 19.42 19.02ROA (%) 8.94 9.69 6.91 4.55 4.93 5.14Asset Turnover (x) 0.27 0.45 0.46 0.37 0.36 0.38EBITDA Margin (%) 39.93 28.49 21.75 18.24 18.21 17.49
LiquidityND/Equity (x) -0.45 -0.33 -0.25 -0.13 0.02 -0.07ND/EBITDA (x) -0.95 -0.56 -0.57 -0.49 0.06 -0.28
Source: Company Financials & CICR Database*In 2011, MNHD started to follow a Calendar year for its f inancial reporting.
2008a 2009a 2010a 2011e* 2012e 2013e
Page | 159
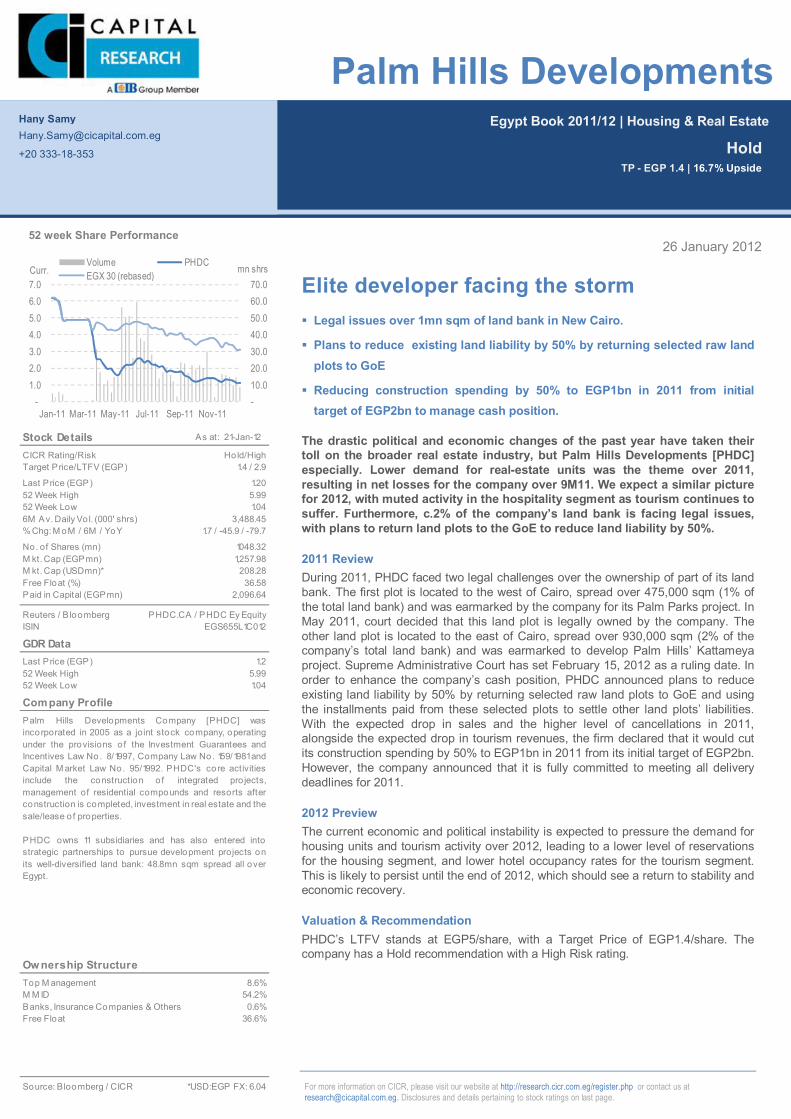
Page | 29
Egypt Book 2011/12 | Housing & Real Estate
For more information on CICR, please visit our website at http://research.cicr.com.eg/register.php or contact us at [email protected]. Disclosures and details pertaining to stock ratings on last page.
26 January 2012
Elite developer facing the storm Legal issues over 1mn sqm of land bank in New Cairo.
Plans to reduce existing land liability by 50% by returning selected raw land plots to GoE
Reducing construction spending by 50% to EGP1bn in 2011 from initial target of EGP2bn to manage cash position.
The drastic political and economic changes of the past year have taken their toll on the broader real estate industry, but Palm Hills Developments [PHDC] especially. Lower demand for real-estate units was the theme over 2011, resulting in net losses for the company over 9M11. We expect a similar picture for 2012, with muted activity in the hospitality segment as tourism continues to suffer. Furthermore, c.2% of the company’s land bank is facing legal issues, with plans to return land plots to the GoE to reduce land liability by 50%.
2011 Review During 2011, PHDC faced two legal challenges over the ownership of part of its land bank. The first plot is located to the west of Cairo, spread over 475,000 sqm (1% of the total land bank) and was earmarked by the company for its Palm Parks project. In May 2011, court decided that this land plot is legally owned by the company. The other land plot is located to the east of Cairo, spread over 930,000 sqm (2% of the company’s total land bank) and was earmarked to develop Palm Hills’ Kattameya project. Supreme Administrative Court has set February 15, 2012 as a ruling date. In order to enhance the company’s cash position, PHDC announced plans to reduce existing land liability by 50% by returning selected raw land plots to GoE and using the installments paid from these selected plots to settle other land plots’ liabilities. With the expected drop in sales and the higher level of cancellations in 2011, alongside the expected drop in tourism revenues, the firm declared that it would cut its construction spending by 50% to EGP1bn in 2011 from its initial target of EGP2bn. However, the company announced that it is fully committed to meeting all delivery deadlines for 2011.
2012 Preview The current economic and political instability is expected to pressure the demand for housing units and tourism activity over 2012, leading to a lower level of reservations for the housing segment, and lower hotel occupancy rates for the tourism segment. This is likely to persist until the end of 2012, which should see a return to stability and economic recovery.
Valuation & Recommendation PHDC’s LTFV stands at EGP5/share, with a Target Price of EGP1.4/share. The company has a Hold recommendation with a High Risk rating.
Hany Samy [email protected]
+20 333-18-353
Hold TP - EGP 1.4 | 16.7% Upside
Palm Hills Developments
Stock Details As at: 21-Jan-12
CICR Rating/RiskTarget Price/LTFV (EGP)
Last Price (EGP)52 Week High52 Week Low6M Av. Daily Vo l. (000' shrs)% Chg: M oM / 6M / YoY
No. of Shares (mn)M kt. Cap (EGPmn)M kt. Cap (USDmn)*Free Float (%)Paid in Capital (EGPmn)
Reuters / B loombergISIN
GDR DataLast Price (EGP)52 Week High52 Week Low
Company Profile
Ow nership StructureTop M anagement 8.6%M M ID 54.2%Banks, Insurance Companies & Others 0.6%Free Float 36.6%
Source: Bloomberg / CICR *USD:EGP FX: 6.04
Palm Hills Developments Company [PHDC] wasincorporated in 2005 as a joint stock company, operatingunder the provisions of the Investment Guarantees andIncentives Law No. 8/1997, Company Law No. 159/1981andCapital M arket Law No. 95/1992. PHDC's core activitiesinclude the construction of integrated pro jects,management of residential compounds and resorts afterconstruction is completed, investment in real estate and the sale/lease o f properties.
PHDC owns 11 subsidiaries and has also entered intostrategic partnerships to pursue development projects onits well-diversified land bank: 48.8mn sqm spread all overEgypt.
5.991.04
1048.32
3,488.45
PHDC.CA / PHDC Ey Equity
208.28
1.7 / -45.9 / -79.7
2,096.64
1,257.98
1.25.99
36.58
EGS655L1C012
1.04
1.4 / 2.9
1.20
Hold/High
-10.0 20.0 30.0 40.0 50.0 60.0 70.0
-1.0 2.0 3.0 4.0 5.0 6.0 7.0
Jan-11 Mar-11 May-11 Jul-11 Sep-11 Nov-11
mn shrsCurr.Volume PHDCEGX 30 (rebased)
52 week Share Performance
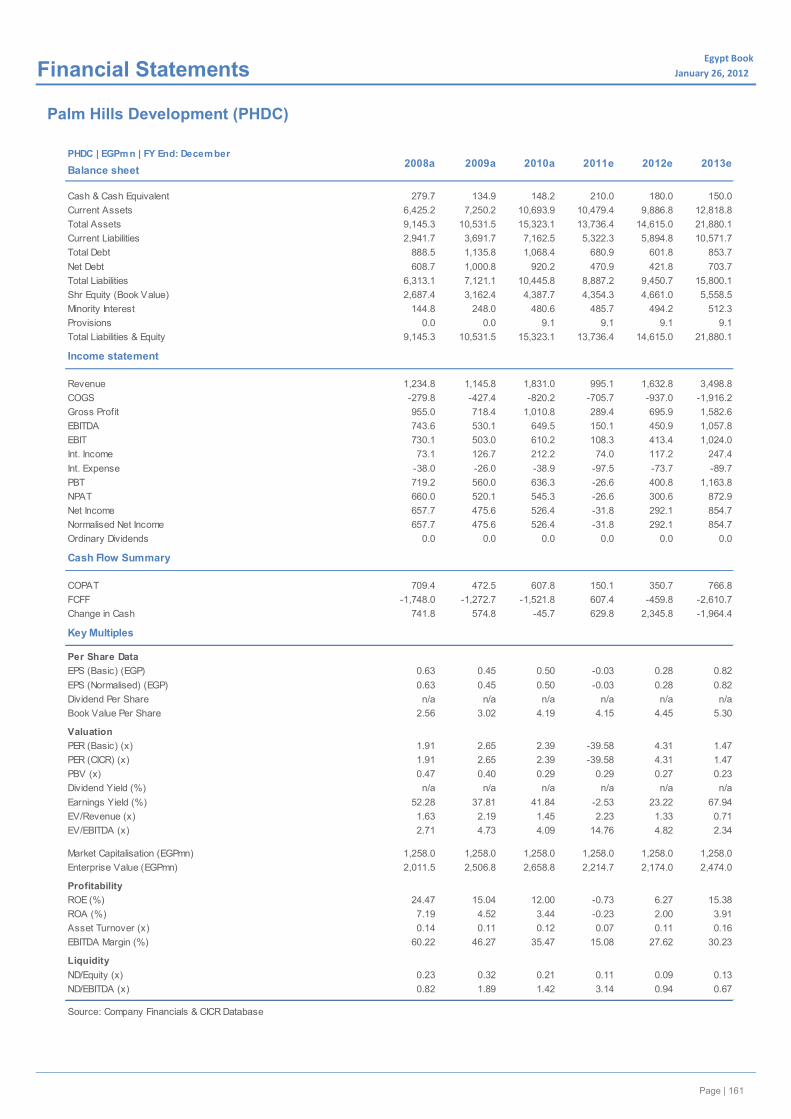
Page | 30
Egypt Book January 26, 2012x Financial Statements
Palm Hills Development (PHDC)
PHDC | EGPmn | FY End: December
Balance sheet
Cash & Cash Equivalent 279.7 134.9 148.2 210.0 180.0 150.0Current Assets 6,425.2 7,250.2 10,693.9 10,479.4 9,886.8 12,818.8Total Assets 9,145.3 10,531.5 15,323.1 13,736.4 14,615.0 21,880.1Current Liabilities 2,941.7 3,691.7 7,162.5 5,322.3 5,894.8 10,571.7Total Debt 888.5 1,135.8 1,068.4 680.9 601.8 853.7Net Debt 608.7 1,000.8 920.2 470.9 421.8 703.7Total Liabilities 6,313.1 7,121.1 10,445.8 8,887.2 9,450.7 15,800.1Shr Equity (Book Value) 2,687.4 3,162.4 4,387.7 4,354.3 4,661.0 5,558.5Minority Interest 144.8 248.0 480.6 485.7 494.2 512.3Provisions 0.0 0.0 9.1 9.1 9.1 9.1Total Liabilities & Equity 9,145.3 10,531.5 15,323.1 13,736.4 14,615.0 21,880.1
Income statement
Revenue 1,234.8 1,145.8 1,831.0 995.1 1,632.8 3,498.8COGS -279.8 -427.4 -820.2 -705.7 -937.0 -1,916.2Gross Profit 955.0 718.4 1,010.8 289.4 695.9 1,582.6EBITDA 743.6 530.1 649.5 150.1 450.9 1,057.8EBIT 730.1 503.0 610.2 108.3 413.4 1,024.0Int. Income 73.1 126.7 212.2 74.0 117.2 247.4Int. Expense -38.0 -26.0 -38.9 -97.5 -73.7 -89.7PBT 719.2 560.0 636.3 -26.6 400.8 1,163.8NPAT 660.0 520.1 545.3 -26.6 300.6 872.9Net Income 657.7 475.6 526.4 -31.8 292.1 854.7Normalised Net Income 657.7 475.6 526.4 -31.8 292.1 854.7Ordinary Dividends 0.0 0.0 0.0 0.0 0.0 0.0
Cash Flow Summary
COPAT 709.4 472.5 607.8 150.1 350.7 766.8FCFF -1,748.0 -1,272.7 -1,521.8 607.4 -459.8 -2,610.7Change in Cash 741.8 574.8 -45.7 629.8 2,345.8 -1,964.4
Key Multiples
Per Share DataEPS (Basic) (EGP) 0.63 0.45 0.50 -0.03 0.28 0.82EPS (Normalised) (EGP) 0.63 0.45 0.50 -0.03 0.28 0.82Dividend Per Share n/a n/a n/a n/a n/a n/aBook Value Per Share 2.56 3.02 4.19 4.15 4.45 5.30
ValuationPER (Basic) (x) 1.91 2.65 2.39 -39.58 4.31 1.47PER (CICR) (x) 1.91 2.65 2.39 -39.58 4.31 1.47PBV (x) 0.47 0.40 0.29 0.29 0.27 0.23Dividend Yield (%) n/a n/a n/a n/a n/a n/aEarnings Yield (%) 52.28 37.81 41.84 -2.53 23.22 67.94EV/Revenue (x) 1.63 2.19 1.45 2.23 1.33 0.71EV/EBITDA (x) 2.71 4.73 4.09 14.76 4.82 2.34
Market Capitalisation (EGPmn) 1,258.0 1,258.0 1,258.0 1,258.0 1,258.0 1,258.0Enterprise Value (EGPmn) 2,011.5 2,506.8 2,658.8 2,214.7 2,174.0 2,474.0
ProfitabilityROE (%) 24.47 15.04 12.00 -0.73 6.27 15.38ROA (%) 7.19 4.52 3.44 -0.23 2.00 3.91Asset Turnover (x) 0.14 0.11 0.12 0.07 0.11 0.16EBITDA Margin (%) 60.22 46.27 35.47 15.08 27.62 30.23
LiquidityND/Equity (x) 0.23 0.32 0.21 0.11 0.09 0.13ND/EBITDA (x) 0.82 1.89 1.42 3.14 0.94 0.67
Source: Company Financials & CICR Database
2008a 2009a 2010a 2011e 2012e 2013e
Page | 161
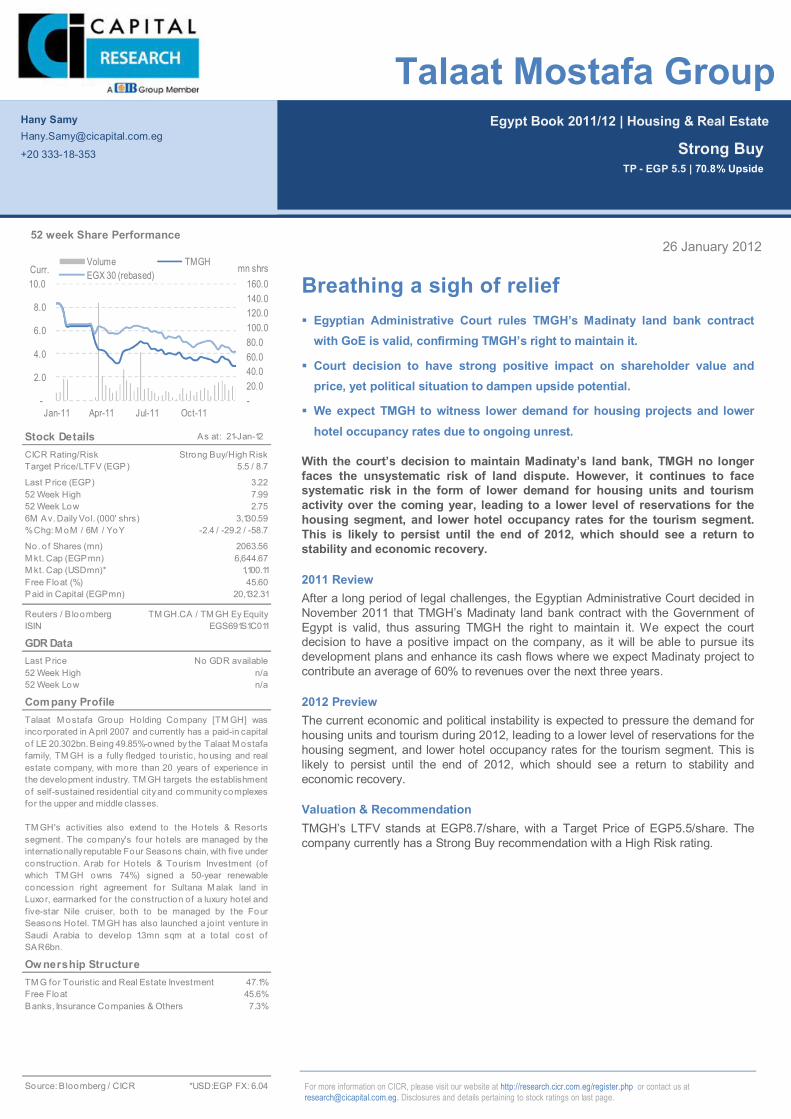
Page | 31
Egypt Book 2011/12 | Housing & Real Estate
For more information on CICR, please visit our website at http://research.cicr.com.eg/register.php or contact us at [email protected]. Disclosures and details pertaining to stock ratings on last page.
26 January 2012
Breathing a sigh of relief Egyptian Administrative Court rules TMGH’s Madinaty land bank contract
with GoE is valid, confirming TMGH’s right to maintain it.
Court decision to have strong positive impact on shareholder value and price, yet political situation to dampen upside potential.
We expect TMGH to witness lower demand for housing projects and lower hotel occupancy rates due to ongoing unrest.
With the court’s decision to maintain Madinaty’s land bank, TMGH no longer faces the unsystematic risk of land dispute. However, it continues to face systematic risk in the form of lower demand for housing units and tourism activity over the coming year, leading to a lower level of reservations for the housing segment, and lower hotel occupancy rates for the tourism segment. This is likely to persist until the end of 2012, which should see a return to stability and economic recovery.
2011 Review After a long period of legal challenges, the Egyptian Administrative Court decided in November 2011 that TMGH’s Madinaty land bank contract with the Government of Egypt is valid, thus assuring TMGH the right to maintain it. We expect the court decision to have a positive impact on the company, as it will be able to pursue its development plans and enhance its cash flows where we expect Madinaty project to contribute an average of 60% to revenues over the next three years.
2012 Preview The current economic and political instability is expected to pressure the demand for housing units and tourism during 2012, leading to a lower level of reservations for the housing segment, and lower hotel occupancy rates for the tourism segment. This is likely to persist until the end of 2012, which should see a return to stability and economic recovery.
Valuation & Recommendation TMGH’s LTFV stands at EGP8.7/share, with a Target Price of EGP5.5/share. The company currently has a Strong Buy recommendation with a High Risk rating.
Hany Samy [email protected]
+20 333-18-353
Strong Buy TP - EGP 5.5 | 70.8% Upside
Talaat Mostafa Group
Stock Details As at: 21-Jan-12
CICR Rating/RiskTarget Price/LTFV (EGP)
Last Price (EGP)52 Week High52 Week Low6M Av. Daily Vol. (000' shrs)% Chg: M oM / 6M / YoY
No. o f Shares (mn)M kt. Cap (EGPmn)M kt. Cap (USDmn)*Free Float (%)Paid in Capital (EGPmn)
Reuters / B loombergISIN
GDR DataLast Price52 Week High52 Week Low
Company Profile
Ow nership StructureTM G for Touristic and Real Estate Investment 47.1%Free Float 45.6%Banks, Insurance Companies & Others 7.3%
Source: B loomberg / CICR *USD:EGP FX: 6.04
Talaat M ostafa Group Holding Company [TM GH] wasincorporated in April 2007 and currently has a paid-in capitalo f LE 20.302bn. Being 49.85%-owned by the Talaat M ostafafamily, TM GH is a fully fledged touristic, housing and realestate company, with more than 20 years of experience inthe development industry. TM GH targets the establishmento f self-sustained residential city and community complexesfor the upper and middle classes.
TM GH's activities also extend to the Hotels & Resortssegment. The company's four hotels are managed by theinternationally reputable Four Seasons chain, with five under construction. Arab for Hotels & Tourism Investment (ofwhich TM GH owns 74%) signed a 50-year renewableconcession right agreement fo r Sultana M alak land inLuxor, earmarked for the construction of a luxury hotel andfive-star Nile cruiser, bo th to be managed by the FourSeasons Hotel. TM GH has also launched a joint venture inSaudi Arabia to develop 1.3mn sqm at a to tal cost ofSAR6bn.
7.992.75
2063.56
3,130.59
TM GH.CA / TM GH Ey Equity
1,100.11
-2.4 / -29.2 / -58.7
20,132.31
6,644.67
No GDR availablen/a
45.60
EGS691S1C011
n/a
5.5 / 8.7
3.22
Strong Buy/High Risk
-20.0 40.0 60.0 80.0 100.0 120.0 140.0 160.0
-
2.0
4.0
6.0
8.0
10.0
Jan-11 Apr-11 Jul-11 Oct-11
mn shrsCurr.Volume TMGHEGX 30 (rebased)
52 week Share Performance
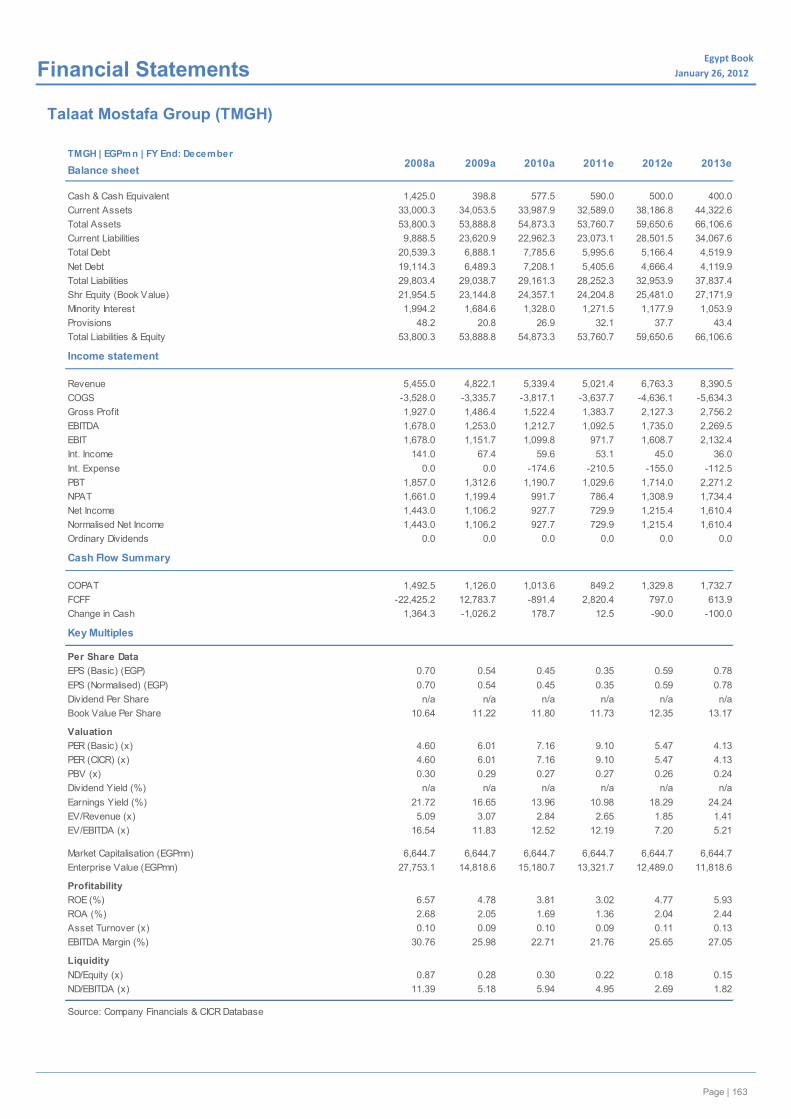
Page | 32
Egypt Book January 26, 2012x Financial Statements
Talaat Mostafa Group (TMGH)
TMGH | EGPmn | FY End: December
Balance sheet
Cash & Cash Equivalent 1,425.0 398.8 577.5 590.0 500.0 400.0Current Assets 33,000.3 34,053.5 33,987.9 32,589.0 38,186.8 44,322.6Total Assets 53,800.3 53,888.8 54,873.3 53,760.7 59,650.6 66,106.6Current Liabilities 9,888.5 23,620.9 22,962.3 23,073.1 28,501.5 34,067.6Total Debt 20,539.3 6,888.1 7,785.6 5,995.6 5,166.4 4,519.9Net Debt 19,114.3 6,489.3 7,208.1 5,405.6 4,666.4 4,119.9Total Liabilities 29,803.4 29,038.7 29,161.3 28,252.3 32,953.9 37,837.4Shr Equity (Book Value) 21,954.5 23,144.8 24,357.1 24,204.8 25,481.0 27,171.9Minority Interest 1,994.2 1,684.6 1,328.0 1,271.5 1,177.9 1,053.9Provisions 48.2 20.8 26.9 32.1 37.7 43.4Total Liabilities & Equity 53,800.3 53,888.8 54,873.3 53,760.7 59,650.6 66,106.6
Income statement
Revenue 5,455.0 4,822.1 5,339.4 5,021.4 6,763.3 8,390.5COGS -3,528.0 -3,335.7 -3,817.1 -3,637.7 -4,636.1 -5,634.3Gross Profit 1,927.0 1,486.4 1,522.4 1,383.7 2,127.3 2,756.2EBITDA 1,678.0 1,253.0 1,212.7 1,092.5 1,735.0 2,269.5EBIT 1,678.0 1,151.7 1,099.8 971.7 1,608.7 2,132.4Int. Income 141.0 67.4 59.6 53.1 45.0 36.0Int. Expense 0.0 0.0 -174.6 -210.5 -155.0 -112.5PBT 1,857.0 1,312.6 1,190.7 1,029.6 1,714.0 2,271.2NPAT 1,661.0 1,199.4 991.7 786.4 1,308.9 1,734.4Net Income 1,443.0 1,106.2 927.7 729.9 1,215.4 1,610.4Normalised Net Income 1,443.0 1,106.2 927.7 729.9 1,215.4 1,610.4Ordinary Dividends 0.0 0.0 0.0 0.0 0.0 0.0
Cash Flow Summary
COPAT 1,492.5 1,126.0 1,013.6 849.2 1,329.8 1,732.7FCFF -22,425.2 12,783.7 -891.4 2,820.4 797.0 613.9Change in Cash 1,364.3 -1,026.2 178.7 12.5 -90.0 -100.0
Key Multiples
Per Share DataEPS (Basic) (EGP) 0.70 0.54 0.45 0.35 0.59 0.78EPS (Normalised) (EGP) 0.70 0.54 0.45 0.35 0.59 0.78Dividend Per Share n/a n/a n/a n/a n/a n/aBook Value Per Share 10.64 11.22 11.80 11.73 12.35 13.17
ValuationPER (Basic) (x) 4.60 6.01 7.16 9.10 5.47 4.13PER (CICR) (x) 4.60 6.01 7.16 9.10 5.47 4.13PBV (x) 0.30 0.29 0.27 0.27 0.26 0.24Dividend Yield (%) n/a n/a n/a n/a n/a n/aEarnings Yield (%) 21.72 16.65 13.96 10.98 18.29 24.24EV/Revenue (x) 5.09 3.07 2.84 2.65 1.85 1.41EV/EBITDA (x) 16.54 11.83 12.52 12.19 7.20 5.21
Market Capitalisation (EGPmn) 6,644.7 6,644.7 6,644.7 6,644.7 6,644.7 6,644.7Enterprise Value (EGPmn) 27,753.1 14,818.6 15,180.7 13,321.7 12,489.0 11,818.6
ProfitabilityROE (%) 6.57 4.78 3.81 3.02 4.77 5.93ROA (%) 2.68 2.05 1.69 1.36 2.04 2.44Asset Turnover (x) 0.10 0.09 0.10 0.09 0.11 0.13EBITDA Margin (%) 30.76 25.98 22.71 21.76 25.65 27.05
LiquidityND/Equity (x) 0.87 0.28 0.30 0.22 0.18 0.15ND/EBITDA (x) 11.39 5.18 5.94 4.95 2.69 1.82
Source: Company Financials & CICR Database
2008a 2009a 2010a 2011e 2012e 2013e
Page | 163
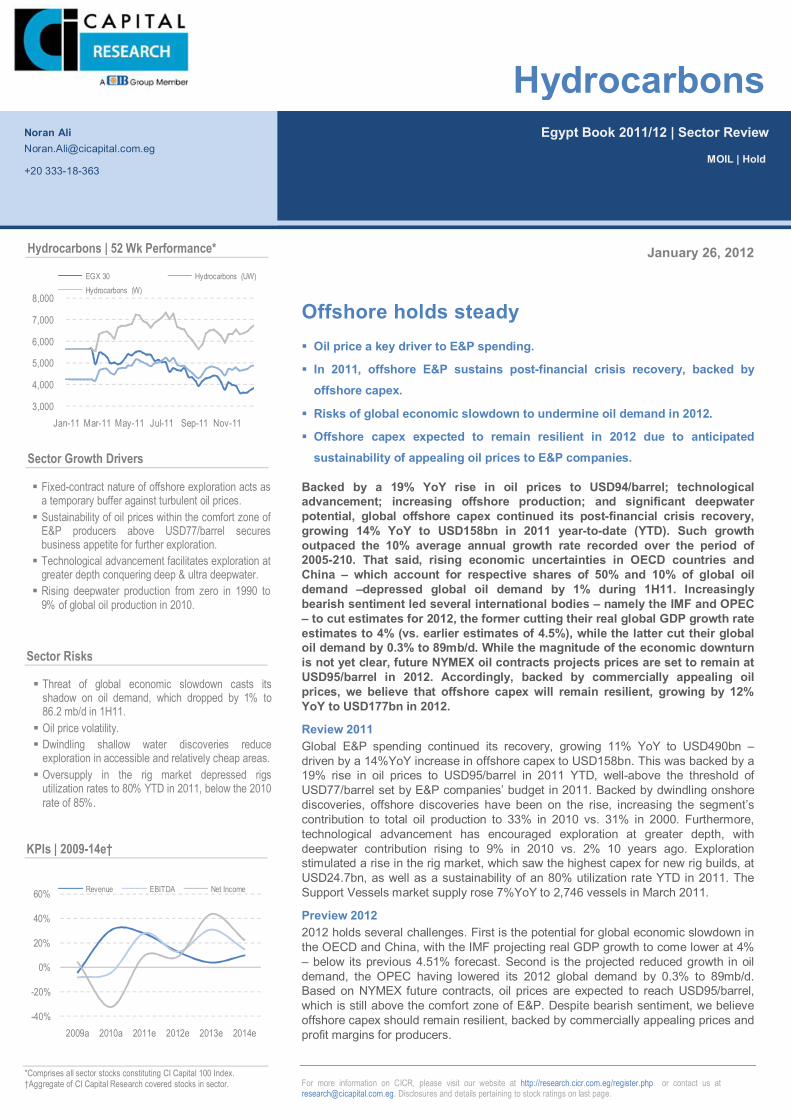
Page | 164
Page | 164
For more information on CICR, please visit our website at http://research.cicr.com.eg/register.php or contact us at [email protected]. Disclosures and details pertaining to stock ratings on last page.
January 26, 2012
Offshore holds steady Oil price a key driver to E&P spending.
In 2011, offshore E&P sustains post-financial crisis recovery, backed by offshore capex.
Risks of global economic slowdown to undermine oil demand in 2012.
Offshore capex expected to remain resilient in 2012 due to anticipated sustainability of appealing oil prices to E&P companies.
Backed by a 19% YoY rise in oil prices to USD94/barrel; technological advancement; increasing offshore production; and significant deepwater potential, global offshore capex continued its post-financial crisis recovery, growing 14% YoY to USD158bn in 2011 year-to-date (YTD). Such growth outpaced the 10% average annual growth rate recorded over the period of 2005-210. That said, rising economic uncertainties in OECD countries and China – which account for respective shares of 50% and 10% of global oil demand –depressed global oil demand by 1% during 1H11. Increasingly bearish sentiment led several international bodies – namely the IMF and OPEC – to cut estimates for 2012, the former cutting their real global GDP growth rate estimates to 4% (vs. earlier estimates of 4.5%), while the latter cut their global oil demand by 0.3% to 89mb/d. While the magnitude of the economic downturn is not yet clear, future NYMEX oil contracts projects prices are set to remain at USD95/barrel in 2012. Accordingly, backed by commercially appealing oil prices, we believe that offshore capex will remain resilient, growing by 12% YoY to USD177bn in 2012.
Review 2011 Global E&P spending continued its recovery, growing 11% YoY to USD490bn – driven by a 14%YoY increase in offshore capex to USD158bn. This was backed by a 19% rise in oil prices to USD95/barrel in 2011 YTD, well-above the threshold of USD77/barrel set by E&P companies’ budget in 2011. Backed by dwindling onshore discoveries, offshore discoveries have been on the rise, increasing the segment’s contribution to total oil production to 33% in 2010 vs. 31% in 2000. Furthermore, technological advancement has encouraged exploration at greater depth, with deepwater contribution rising to 9% in 2010 vs. 2% 10 years ago. Exploration stimulated a rise in the rig market, which saw the highest capex for new rig builds, at USD24.7bn, as well as a sustainability of an 80% utilization rate YTD in 2011. The Support Vessels market supply rose 7%YoY to 2,746 vessels in March 2011.
Preview 2012 2012 holds several challenges. First is the potential for global economic slowdown in the OECD and China, with the IMF projecting real GDP growth to come lower at 4% – below its previous 4.51% forecast. Second is the projected reduced growth in oil demand, the OPEC having lowered its 2012 global demand by 0.3% to 89mb/d. Based on NYMEX future contracts, oil prices are expected to reach USD95/barrel, which is still above the comfort zone of E&P. Despite bearish sentiment, we believe offshore capex should remain resilient, backed by commercially appealing prices and profit margins for producers.
Egypt Book 2011/12 | Sector Review
Hydrocarbons
MOIL | Hold
Noran Ali [email protected]
+20 333-18-363
Fixed-contract nature of offshore exploration acts as a temporary buffer against turbulent oil prices. Sustainability of oil prices within the comfort zone of
E&P producers above USD77/barrel secures business appetite for further exploration. Technological advancement facilitates exploration at
greater depth conquering deep & ultra deepwater. Rising deepwater production from zero in 1990 to
9% of global oil production in 2010.
Threat of global economic slowdown casts its shadow on oil demand, which dropped by 1% to 86.2 mb/d in 1H11. Oil price volatility. Dwindling shallow water discoveries reduce
exploration in accessible and relatively cheap areas. Oversupply in the rig market depressed rigs
utilization rates to 80% YTD in 2011, below the 2010 rate of 85%.
Hydrocarbons | 52 Wk Performance*
3,000
4,000
5,000
6,000
7,000
8,000
Jan-11 Mar-11 May-11 Jul-11 Sep-11 Nov-11
EGX 30 Hydrocarbons (UW)Hydrocarbons (W)
Sector Growth Drivers
Sector Risks
-40%
-20%
0%
20%
40%
60%
2009a 2010a 2011e 2012e 2013e 2014e
Revenue EBITDA Net Income
KPIs | 2009-14e†
*Comprises all sector stocks constituting CI Capital 100 Index. †Aggregate of CI Capital Research covered stocks in sector.
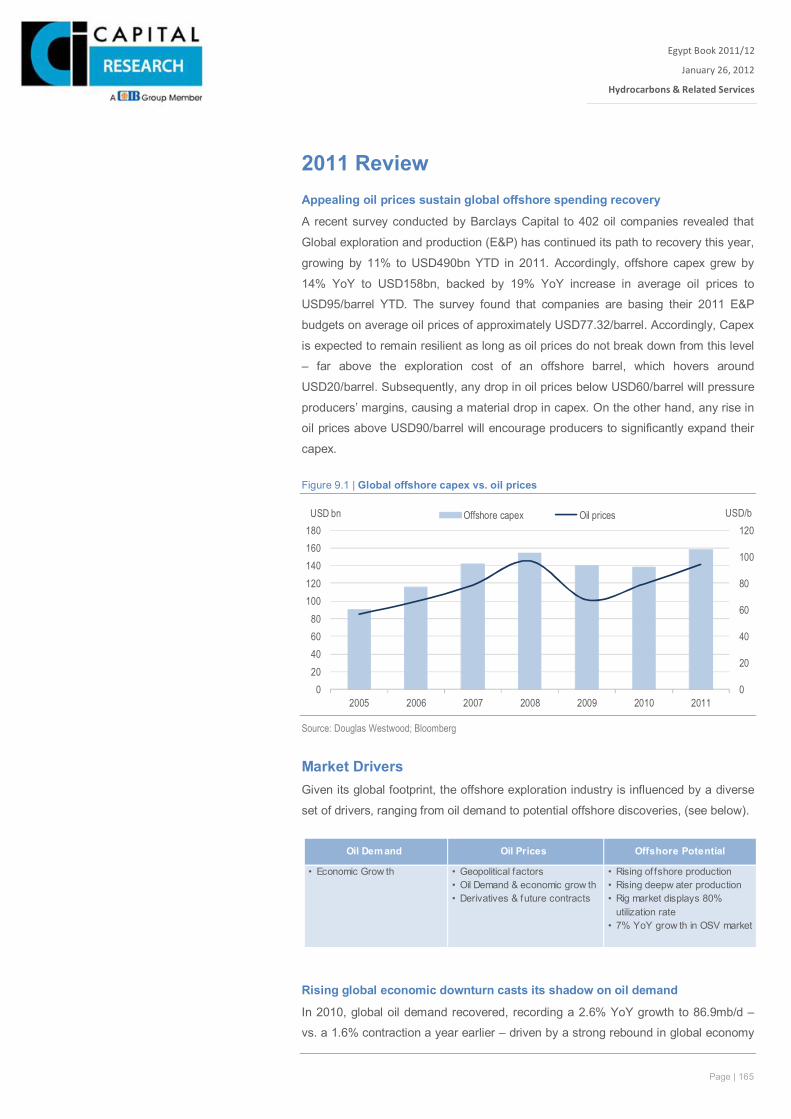
Page | 165
Egypt Book 2011/12
January 26, 2012
Hydrocarbons & Related Services
Xxx
2011 Review Appealing oil prices sustain global offshore spending recovery
A recent survey conducted by Barclays Capital to 402 oil companies revealed that
Global exploration and production (E&P) has continued its path to recovery this year,
growing by 11% to USD490bn YTD in 2011. Accordingly, offshore capex grew by
14% YoY to USD158bn, backed by 19% YoY increase in average oil prices to
USD95/barrel YTD. The survey found that companies are basing their 2011 E&P
budgets on average oil prices of approximately USD77.32/barrel. Accordingly, Capex
is expected to remain resilient as long as oil prices do not break down from this level
– far above the exploration cost of an offshore barrel, which hovers around
USD20/barrel. Subsequently, any drop in oil prices below USD60/barrel will pressure
producers’ margins, causing a material drop in capex. On the other hand, any rise in
oil prices above USD90/barrel will encourage producers to significantly expand their
capex.
Figure 9.1 | Global offshore capex vs. oil prices
Source: Douglas Westwood; Bloomberg
Market Drivers Given its global footprint, the offshore exploration industry is influenced by a diverse
set of drivers, ranging from oil demand to potential offshore discoveries, (see below).
Rising global economic downturn casts its shadow on oil demand
In 2010, global oil demand recovered, recording a 2.6% YoY growth to 86.9mb/d –
vs. a 1.6% contraction a year earlier – driven by a strong rebound in global economy
0
20
40
60
80
100
120
020406080
100120140160180
2005 2006 2007 2008 2009 2010 2011
USD/bUSD bn Offshore capex Oil prices
• Economic Grow th • Geopolitical factors • Rising of fshore production• Oil Demand & economic grow th • Rising deepw ater production• Derivatives & future contracts •
• 7% YoY grow th in OSV market
Rig market displays 80% utilization rate
Oil Dem and Oil Prices Offshore Potential
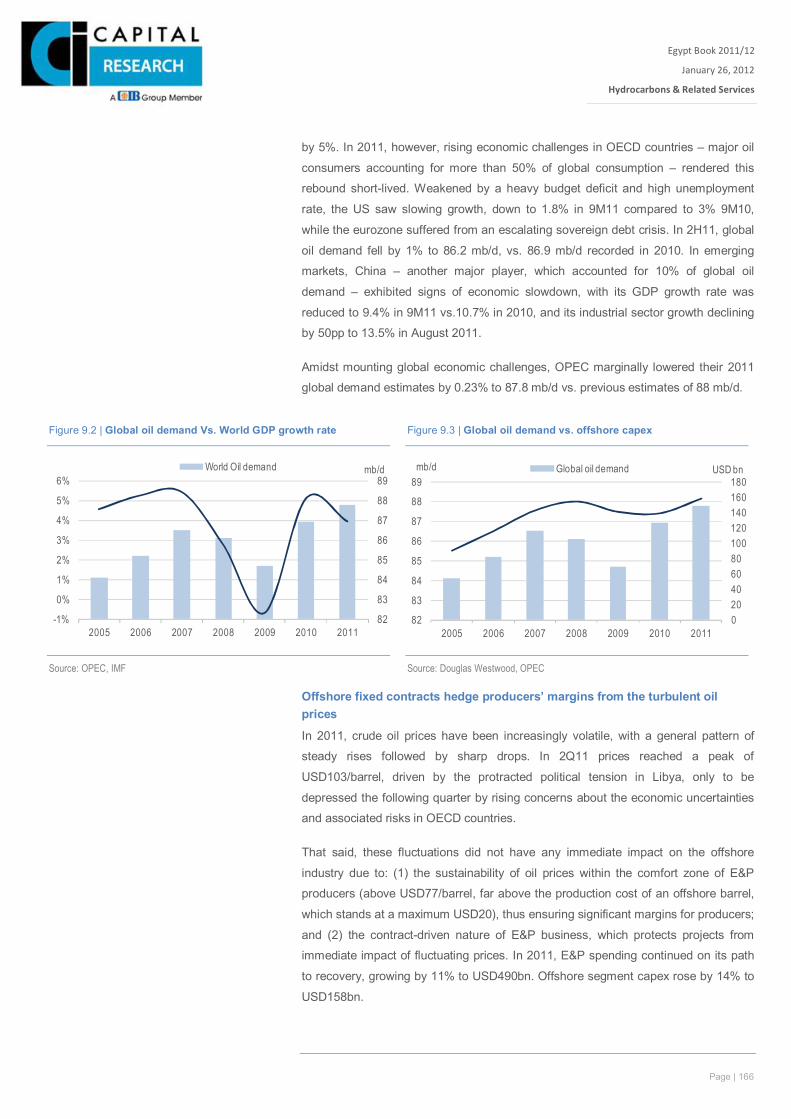
Page | 166
Egypt Book 2011/12
January 26, 2012
Hydrocarbons & Related Services
Xxx
by 5%. In 2011, however, rising economic challenges in OECD countries – major oil
consumers accounting for more than 50% of global consumption – rendered this
rebound short-lived. Weakened by a heavy budget deficit and high unemployment
rate, the US saw slowing growth, down to 1.8% in 9M11 compared to 3% 9M10,
while the eurozone suffered from an escalating sovereign debt crisis. In 2H11, global
oil demand fell by 1% to 86.2 mb/d, vs. 86.9 mb/d recorded in 2010. In emerging
markets, China – another major player, which accounted for 10% of global oil
demand – exhibited signs of economic slowdown, with its GDP growth rate was
reduced to 9.4% in 9M11 vs.10.7% in 2010, and its industrial sector growth declining
by 50pp to 13.5% in August 2011.
Amidst mounting global economic challenges, OPEC marginally lowered their 2011
global demand estimates by 0.23% to 87.8 mb/d vs. previous estimates of 88 mb/d.
Offshore fixed contracts hedge producers’ margins from the turbulent oil prices
In 2011, crude oil prices have been increasingly volatile, with a general pattern of
steady rises followed by sharp drops. In 2Q11 prices reached a peak of
USD103/barrel, driven by the protracted political tension in Libya, only to be
depressed the following quarter by rising concerns about the economic uncertainties
and associated risks in OECD countries.
That said, these fluctuations did not have any immediate impact on the offshore
industry due to: (1) the sustainability of oil prices within the comfort zone of E&P
producers (above USD77/barrel, far above the production cost of an offshore barrel,
which stands at a maximum USD20), thus ensuring significant margins for producers;
and (2) the contract-driven nature of E&P business, which protects projects from
immediate impact of fluctuating prices. In 2011, E&P spending continued on its path
to recovery, growing by 11% to USD490bn. Offshore segment capex rose by 14% to
USD158bn.
Figure 9.2 | Global oil demand Vs. World GDP growth rate Figure 9.3 | Global oil demand vs. offshore capex
Source: OPEC, IMF
Source: Douglas Westwood, OPEC
82
83
84
85
86
87
88
89
-1%
0%
1%
2%
3%
4%
5%
6%
2005 2006 2007 2008 2009 2010 2011
mb/dWorld Oil demand
020406080100120140160180
82
83
84
85
86
87
88
89
2005 2006 2007 2008 2009 2010 2011
USD bnmb/d Global oil demand
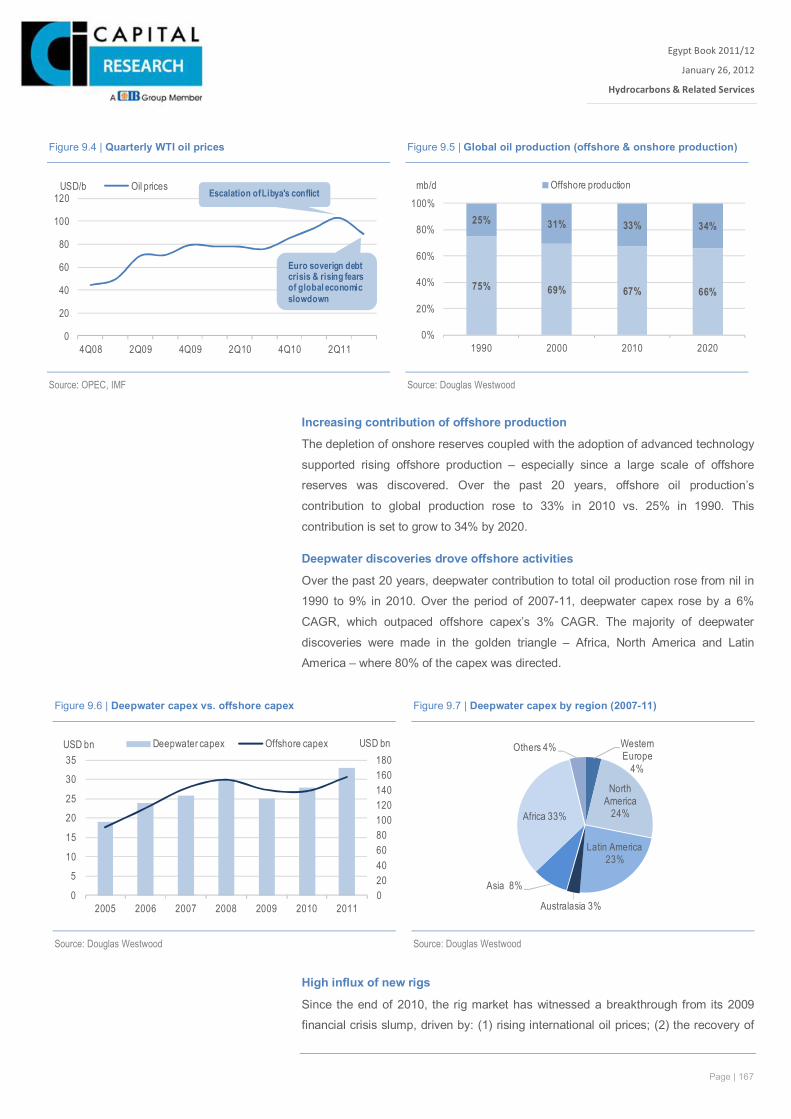
Page | 167
Egypt Book 2011/12
January 26, 2012
Hydrocarbons & Related Services
Xxx
Increasing contribution of offshore production
The depletion of onshore reserves coupled with the adoption of advanced technology
supported rising offshore production – especially since a large scale of offshore
reserves was discovered. Over the past 20 years, offshore oil production’s
contribution to global production rose to 33% in 2010 vs. 25% in 1990. This
contribution is set to grow to 34% by 2020.
Deepwater discoveries drove offshore activities
Over the past 20 years, deepwater contribution to total oil production rose from nil in
1990 to 9% in 2010. Over the period of 2007-11, deepwater capex rose by a 6%
CAGR, which outpaced offshore capex’s 3% CAGR. The majority of deepwater
discoveries were made in the golden triangle – Africa, North America and Latin
America – where 80% of the capex was directed.
High influx of new rigs
Since the end of 2010, the rig market has witnessed a breakthrough from its 2009
financial crisis slump, driven by: (1) rising international oil prices; (2) the recovery of
Figure 9.4 | Quarterly WTI oil prices Figure 9.5 | Global oil production (offshore & onshore production)
Source: OPEC, IMF
Source: Douglas Westwood
0
20
40
60
80
100
120
4Q08 2Q09 4Q09 2Q10 4Q10 2Q11
USD/b Oil prices
Euro soverign debt crisis & rising fears of global economic slowdown
Escalation of Libya's conflict
75% 69% 67% 66%
25% 31% 33% 34%
0%
20%
40%
60%
80%
100%
1990 2000 2010 2020
mb/d Offshore production
Figure 9.6 | Deepwater capex vs. offshore capex Figure 9.7 | Deepwater capex by region (2007-11)
Source: Douglas Westwood
Source: Douglas Westwood
020406080100120140160180
0
5
10
15
20
25
30
35
2005 2006 2007 2008 2009 2010 2011
USD bnUSD bn Deepwater capex Offshore capex
Western Europe
4%
North America
24%
Latin America 23%
Australasia 3%
Asia 8%
Africa 33%
Others 4%
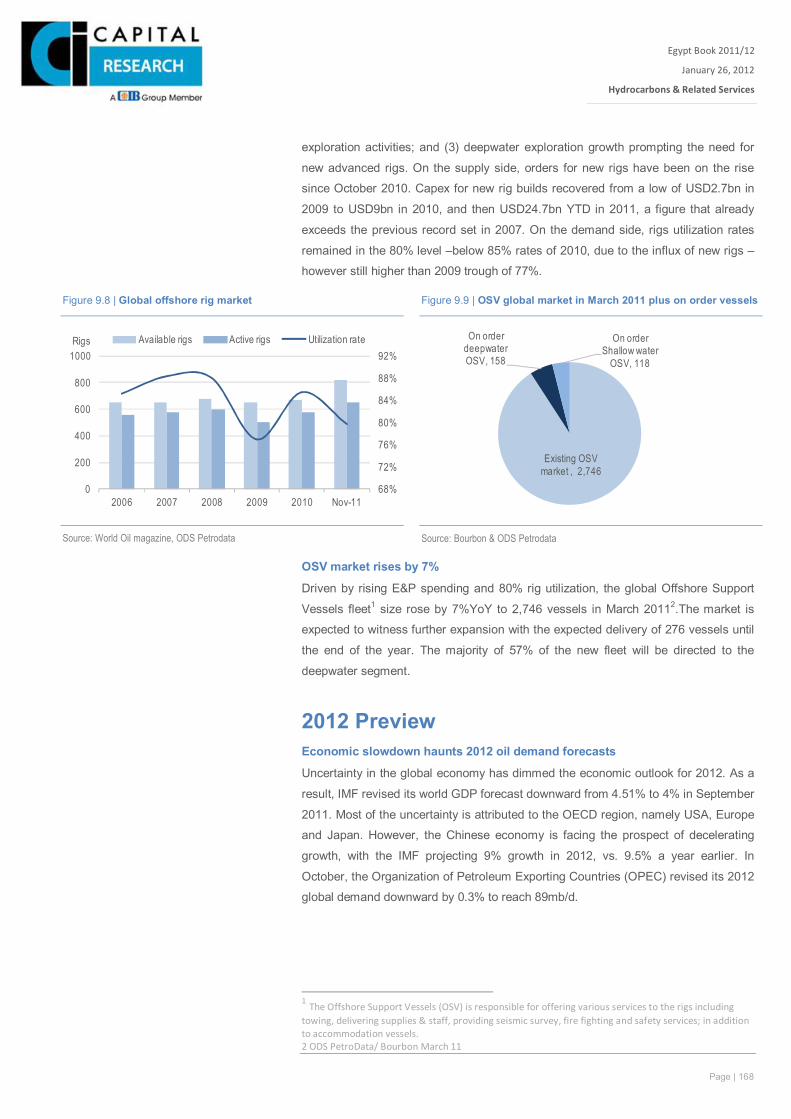
Page | 168
Egypt Book 2011/12
January 26, 2012
Hydrocarbons & Related Services
Xxx
exploration activities; and (3) deepwater exploration growth prompting the need for
new advanced rigs. On the supply side, orders for new rigs have been on the rise
since October 2010. Capex for new rig builds recovered from a low of USD2.7bn in
2009 to USD9bn in 2010, and then USD24.7bn YTD in 2011, a figure that already
exceeds the previous record set in 2007. On the demand side, rigs utilization rates
remained in the 80% level –below 85% rates of 2010, due to the influx of new rigs –
however still higher than 2009 trough of 77%.
OSV market rises by 7%
Driven by rising E&P spending and 80% rig utilization, the global Offshore Support
Vessels fleet1 size rose by 7%YoY to 2,746 vessels in March 20112.The market is
expected to witness further expansion with the expected delivery of 276 vessels until
the end of the year. The majority of 57% of the new fleet will be directed to the
deepwater segment.
2012 Preview Economic slowdown haunts 2012 oil demand forecasts
Uncertainty in the global economy has dimmed the economic outlook for 2012. As a
result, IMF revised its world GDP forecast downward from 4.51% to 4% in September
2011. Most of the uncertainty is attributed to the OECD region, namely USA, Europe
and Japan. However, the Chinese economy is facing the prospect of decelerating
growth, with the IMF projecting 9% growth in 2012, vs. 9.5% a year earlier. In
October, the Organization of Petroleum Exporting Countries (OPEC) revised its 2012
global demand downward by 0.3% to reach 89mb/d.
1 The Offshore Support Vessels (OSV) is responsible for offering various services to the rigs including towing, delivering supplies & staff, providing seismic survey, fire fighting and safety services; in addition to accommodation vessels. 2 ODS PetroData/ Bourbon March 11
Figure 9.8 | Global offshore rig market Figure 9.9 | OSV global market in March 2011 plus on order vessels
Source: World Oil magazine, ODS Petrodata
Source: Bourbon & ODS Petrodata
68%
72%
76%
80%
84%
88%
92%
0
200
400
600
800
1000
2006 2007 2008 2009 2010 Nov-11
Rigs Available rigs Active rigs Utilization rate
Existing OSV market , 2,746
On order deepwater OSV, 158
On order Shallow water
OSV, 118
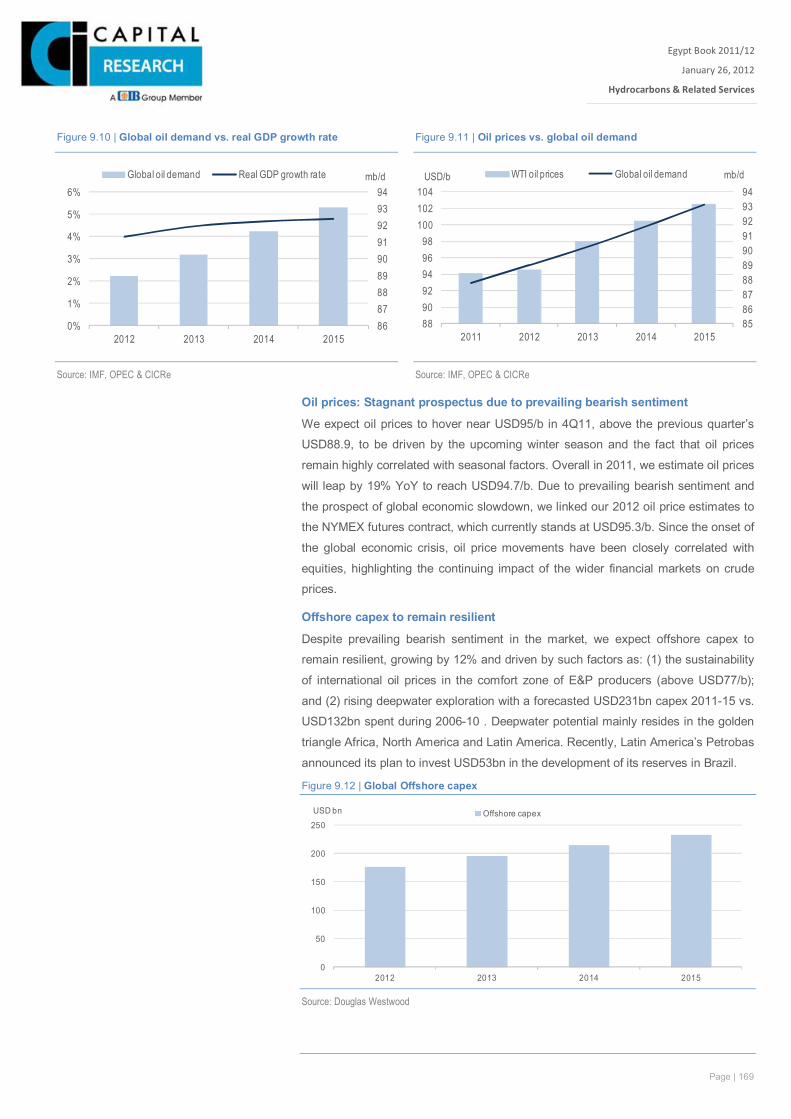
Page | 169
Egypt Book 2011/12
January 26, 2012
Hydrocarbons & Related Services
Xxx
Oil prices: Stagnant prospectus due to prevailing bearish sentiment
We expect oil prices to hover near USD95/b in 4Q11, above the previous quarter’s
USD88.9, to be driven by the upcoming winter season and the fact that oil prices
remain highly correlated with seasonal factors. Overall in 2011, we estimate oil prices
will leap by 19% YoY to reach USD94.7/b. Due to prevailing bearish sentiment and
the prospect of global economic slowdown, we linked our 2012 oil price estimates to
the NYMEX futures contract, which currently stands at USD95.3/b. Since the onset of
the global economic crisis, oil price movements have been closely correlated with
equities, highlighting the continuing impact of the wider financial markets on crude
prices.
Offshore capex to remain resilient
Despite prevailing bearish sentiment in the market, we expect offshore capex to
remain resilient, growing by 12% and driven by such factors as: (1) the sustainability
of international oil prices in the comfort zone of E&P producers (above USD77/b);
and (2) rising deepwater exploration with a forecasted USD231bn capex 2011-15 vs.
USD132bn spent during 2006-10 . Deepwater potential mainly resides in the golden
triangle Africa, North America and Latin America. Recently, Latin America’s Petrobas
announced its plan to invest USD53bn in the development of its reserves in Brazil.
Figure 9.12 | Global Offshore capex
Source: Douglas Westwood
0
50
100
150
200
250
2012 2013 2014 2015
USD bn Offshore capex
Figure 9.10 | Global oil demand vs. real GDP growth rate Figure 9.11 | Oil prices vs. global oil demand
Source: IMF, OPEC & CICRe
Source: IMF, OPEC & CICRe
868788899091929394
0%
1%
2%
3%
4%
5%
6%
2012 2013 2014 2015
mb/dGlobal oil demand Real GDP growth rate
85868788899091929394
889092949698
100102104
2011 2012 2013 2014 2015
mb/dUSD/b WTI oil prices Global oil demand
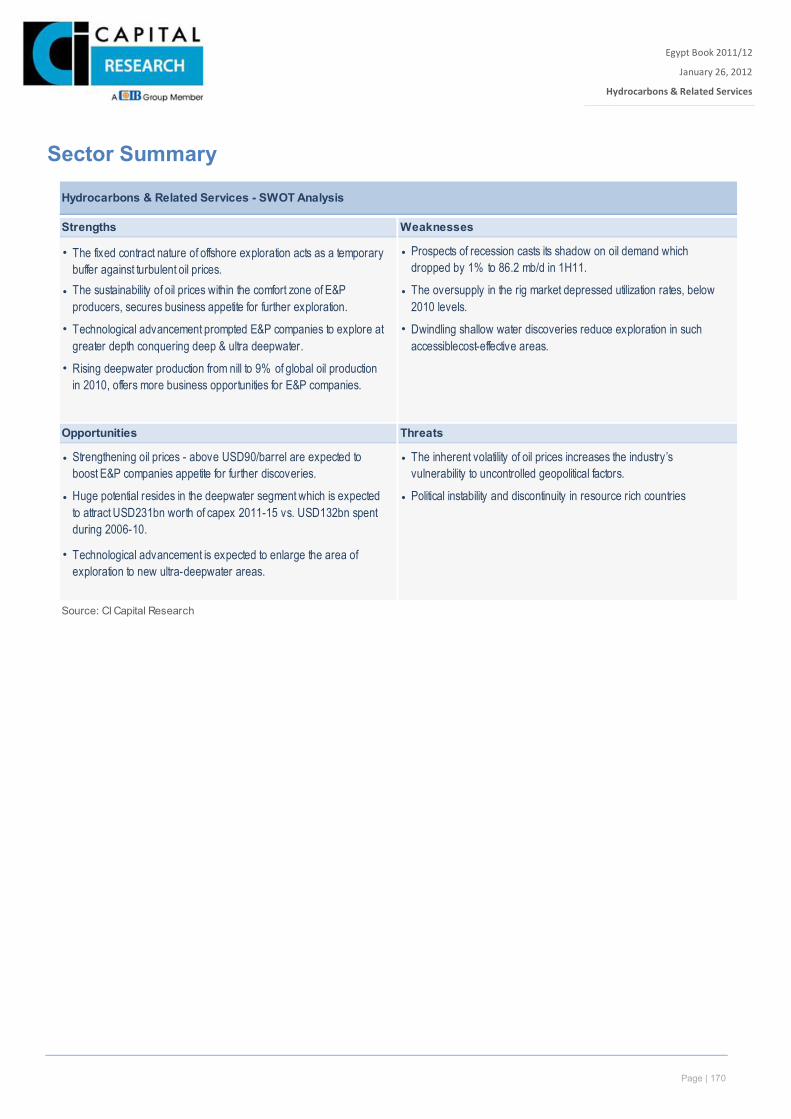
Page | 170
Egypt Book 2011/12
January 26, 2012
Hydrocarbons & Related Services
Xxx
Sector Summary
Hydrocarbons & Related Services - SWOT Analysis
Strengths Weaknesses
• •
• •
• Technological advancement prompted E&P companies to explore at greater depth conquering deep & ultra deepwater.
• Dwindling shallow water discoveries reduce exploration in such accessiblecost-effective areas.
• Rising deepwater production from nill to 9% of global oil production in 2010, offers more business opportunities for E&P companies.
Opportunities Threats
• •
• •
• Technological advancement is expected to enlarge the area of exploration to new ultra-deepwater areas.
Source: CI Capital Research
Strengthening oil prices - above USD90/barrel are expected to boost E&P companies appetite for further discoveries.
Huge potential resides in the deepwater segment which is expected to attract USD231bn worth of capex 2011-15 vs. USD132bn spent during 2006-10.
The inherent volatility of oil prices increases the industry’s vulnerability to uncontrolled geopolitical factors.
Political instability and discontinuity in resource rich countries
The fixed contract nature of offshore exploration acts as a temporary buffer against turbulent oil prices.
Prospects of recession casts its shadow on oil demand which dropped by 1% to 86.2 mb/d in 1H11.
The sustainability of oil prices within the comfort zone of E&P producers, secures business appetite for further exploration.
The oversupply in the rig market depressed utilization rates, below 2010 levels.

Page | 23
Egypt Book 2011/12 | Hydrocarbons & Related Services
For more information on CICR, please visit our website at http://research.cicr.com.eg/register.php or contact us at [email protected]. Disclosures and details pertaining to stock ratings on last page.
January 26, 2012
Low contract visibility dampens potential 2011 E&P spending continued its recovery, rising by 11% YoY to USD490bn.
In 9M11, MOIL witnessed the entry of five new vessels and new markets, namely Brazil; yet earnings contracted by 21%.
2012 poses a challenge for MOIL to secure sizable contracts.
2011 witnessed a sustainable recovery of global E&P spending, which rose by 11%YoY to USD490bn. In the early half of 2011, MOIL exhibited positive results, recording a 31% leap in net profit rose; while revenues rose by 45%. The company also witnessed the entry of 5 new vessels — including several high HP vessels (above 10,000HP). However, in 9M11, depressed gross profit – which reached 34% vs. 41% a year ago, due to new fleet’s mobilization cost – cut earnings by 21% to USD30.308mn. In 2012, the rising threat of global economic slowdown and the associated bearish sentiment in the oil market may undermine MOIL’s chances to secure new sizable contracts. MOIL’s current backlog stands at USD558mn, 7% lower than the USD601mn backlog attained a year earlier.
2011 Review In 2011, MOIL witnessed: (1) the securing of new OSV contracts in Brazil and Tunisia; (2) the engagement in two mega OCS projects in Saudi Arabia and India; (3) 7% contraction in its backlog reaching USD558mn (2011-2014) vs. USD601mn a year ago, due to the company’s inability to secure new sizable OCS contracts; and (4) the entry of new 5 new vessels with higher horse power of (10,000HP and above). In 9M11, MOIL’s revenues rose by 21% YoY; gross profit dropped to 34% vs. 41% a year ago, due to higher mobilization cost of the new fleet. Accordingly, earnings contracted by 21% to USD30.3mn.
2012 Preview In 2012, MOIL could face several challenges in securing new significant and profitable contracts. First, there is the fear of a protracted global economic pick-up, which induced the IMF to revise downward its world GDP forecast from 4.51% to 4% in September 2011. Second, the Organization of Petroleum Exporting Countries (OPEC) revised its 2012 global demand downward by 0.3% to reach 89mb/d. Finally, the company’s lackluster record in securing sizeable contracts in 2011 (despite prevailing bullish sentiment in industry) manifested in a 7% contraction in backlog, which currently stands at USD558mn vs. USD601mn, a year earlier.
Valuation & Recommendation Our updated DCF model yielded an LTFV of USD2.58/share. We calculated our TP by assigning equal weights to (i) the relative value of USD2.23 based on an estimated international peers' average 2011e PER of 13x; (ii) the relative value of USD1.94/share based on international peers' average 2011e EV/EBITDA of 7.8x; and (iii) our LTFV of USD2.58/share. We set our TP at USD2.25, lending MOIL a Hold recommendation.
Noran Ali [email protected]
+20 333-18-363
Hold TP – USD2.3 | 50% Upside
Maridive Oil Services
Stock Details As at: 21-Jan-12
CICR Rating/RiskTarget Price/LTFV (USD)
Last Price (USD)52 Week High52 Week Low6M Av. Daily Vo l. (000' shrs)% Chg: M oM / 6M / YoY
No. of Shares (mn)M kt. Cap (EGPmn)M kt. Cap (USDmn)*Free Float (%)Paid in Capital (USDmn)
Reuters / B loombergISIN
GDR DataLast Price52 Week High52 Week Low
Company Profile
Ow nership StructureFree Float 30.0%Offshore Oil Pro jects 21.0%Eleish Family 14.0%Zeid Family 14.0%Nadim Family 13.0%CIB 4.0%EFG Private Equity 4.0%
Source: Bloomberg / CICR *USD:EGP FX: 6.04
M aridive & Oil Services Company [M OIL] is a free-zonejoint stock company established in 1978. Based in Port Saidwith o ffices in Cairo , A lexandria, and Abu Dhabi, M aridive'sprimary function is to provide Offshore Support Vessels(M arine services) and Offshore Construction Services(Pro ject services) to o il exploration and productioncompanies. The company's operations are executed viaboth the ho lding company and its subsidiaries: M aritideOffshore Oil Services (M OS), Valentine M aritime, andM aridve Offshore Pro jects (M OP).
M aridive is a highly-integrated marine and offshore o ilservice company. With over 30 years’ experience, M OS isEgypt's largest marine and offshore oil services companyand a leading regional player in terms of fleet size, with 71marine units. It also continues to win international contractsfrom the Gulf to Gabon, East Asia and M exico .
3.721.34
307.20
211.93
M OIL.CA / M OIL Ey Equity
460.80
-1.3 / -52.2 / -56.8
122.88
2,784.29
No GDR availablen/a
30.00
EGS44012C010
n/a
2.25 / 2.58
1.50
Hold/M oderate
-2.0 4.0 6.0 8.0 10.0 12.0 14.0
-0.5 1.0 1.5 2.0 2.5 3.0 3.5 4.0
Jan-11 Mar-11 May-11 Jul-11 Sep-11 Nov-11
mn shrsCurr.Volume MOILEGX 30 (rebased)
52 week Share Performance

Page | 172
Egypt Book January 26, 2012x Financial Statements
Maridive Oil Services (MOIL)
MOIL | USDmn | FY End: December
Balance sheet
Cash & Cash Equivalent 78.9 21.5 10.0 8.9 10.0 10.4Current Assets 169.4 152.8 151.6 183.2 206.1 211.3Total Assets 496.7 558.1 648.7 866.5 881.1 895.9Current Liabilities 155.4 123.7 200.7 414.5 424.4 398.5Total Debt 132.9 168.3 240.8 371.6 320.0 257.8Net Debt 54.0 146.8 230.8 362.7 310.0 247.3Total Liabilities 256.6 257.2 363.8 536.1 503.1 454.6Shr Equity (Book Value) 211.4 271.9 247.5 272.7 298.7 329.9Minority Interest 26.1 25.9 33.8 54.0 75.8 107.8Provisions 2.5 3.1 3.6 3.6 3.6 3.6Total Liabilities & Equity 496.7 558.1 648.7 866.5 881.1 895.9
Income statement
Revenue 257.7 247.0 322.3 411.6 464.1 482.3COGS -125.2 -122.1 -198.6 -253.4 -286.2 -264.5Gross Profit 132.5 124.9 123.7 158.2 177.9 217.8EBITDA 109.5 100.4 96.0 122.6 137.9 179.8EBIT 95.9 80.8 75.1 92.8 103.1 141.5Int. Income 0.0 0.2 0.1 0.1 0.1 0.1Int. Expense -4.6 -3.8 -7.1 -13.7 -12.8 -10.9PBT 83.6 81.7 65.2 83.3 90.4 130.7NPAT 82.2 80.2 60.2 73.3 79.5 115.1Net Income 69.0 71.9 48.5 53.1 57.8 83.0Normalised Net Income 69.0 71.9 48.5 53.1 57.8 83.0Ordinary Dividends 58.1 42.1 18.4 27.9 31.8 51.8
Cash Flow Summary
COPAT 96.7 92.7 78.3 92.3 105.3 132.1FCFF -6.5 -13.7 -21.3 -123.2 74.2 74.1Change in Cash 68.1 -57.4 -11.5 -1.1 1.1 0.4
Key Multiples
Per Share DataEPS (Basic) (USD) 0.22 0.23 0.16 0.17 0.19 0.27EPS (Normalised) (USD) 0.22 0.23 0.16 0.17 0.19 0.27Dividend Per Share 0.19 0.14 0.06 0.09 0.10 0.17Book Value Per Share 0.69 0.89 0.81 0.89 0.97 1.07
ValuationPER (Basic) (x) 6.68 6.41 9.50 8.67 7.98 5.55PER (CICR) (x) 6.68 6.41 9.50 8.67 7.98 5.55PBV (x) 2.18 1.69 1.86 1.69 1.54 1.40Dividend Yield (%) 12.61 9.14 4.00 6.05 6.90 11.24Earnings Yield (%) 14.97 15.61 10.52 11.53 12.54 18.01EV/Revenue (x) 2.10 2.56 2.25 2.13 1.82 1.69EV/EBITDA (x) 4.94 6.31 7.55 7.16 6.14 4.54
Market Capitalisation (USDmn) 460.8 460.8 460.8 460.8 460.8 460.8Enterprise Value (USDmn) 540.9 633.5 725.4 877.5 846.5 815.9
ProfitabilityROE (%) 32.64 26.46 19.60 19.48 19.34 25.16ROA (%) 13.89 12.89 7.48 6.13 6.56 9.27Asset Turnover (x) 0.52 0.44 0.50 0.47 0.53 0.54EBITDA Margin (%) 42.47 40.65 29.80 29.78 29.70 37.28
LiquidityND/Equity (x) 0.26 0.54 0.93 1.33 1.04 0.75ND/EBITDA (x) 0.49 1.46 2.40 2.96 2.25 1.38
Source: Company Financials & CICR Database
2008a 2009a 2010a 2011e 2012e 2013e
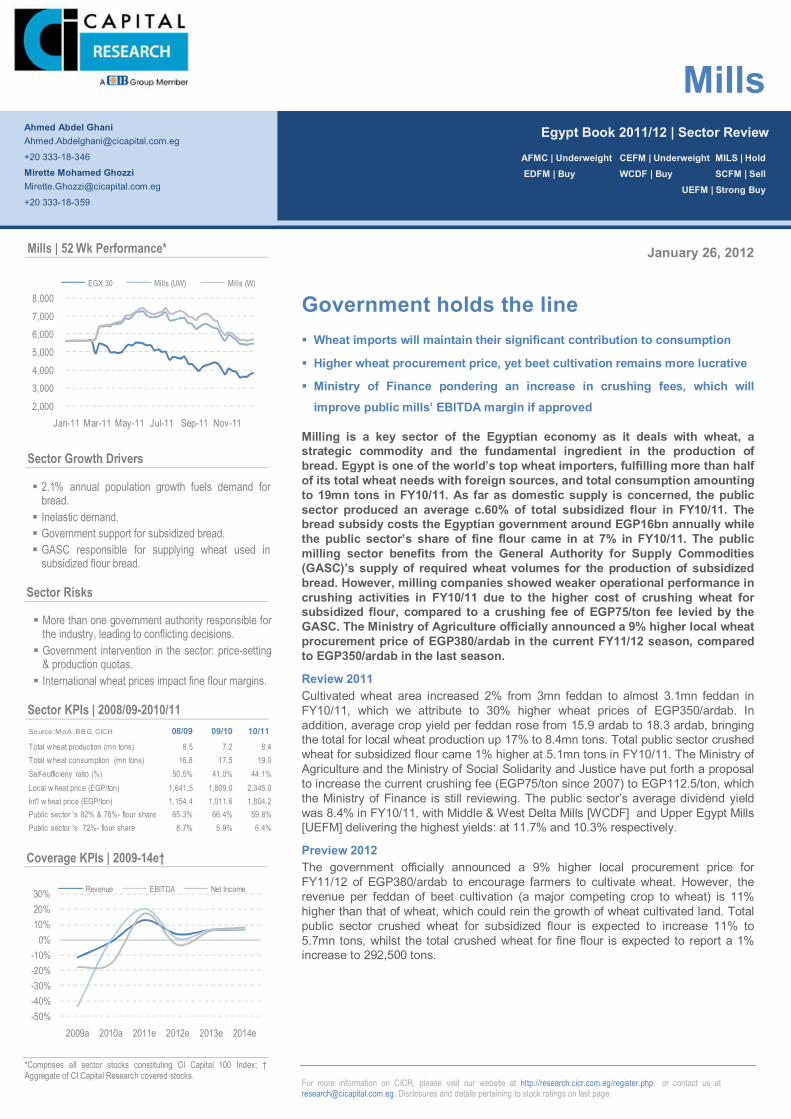
Page | 173
Page | 173
For more information on CICR, please visit our website at http://research.cicr.com.eg/register.php or contact us at [email protected]. Disclosures and details pertaining to stock ratings on last page.
January 26, 2012
Government holds the line Wheat imports will maintain their significant contribution to consumption
Higher wheat procurement price, yet beet cultivation remains more lucrative
Ministry of Finance pondering an increase in crushing fees, which will improve public mills’ EBITDA margin if approved
Milling is a key sector of the Egyptian economy as it deals with wheat, a strategic commodity and the fundamental ingredient in the production of bread. Egypt is one of the world’s top wheat importers, fulfilling more than half of its total wheat needs with foreign sources, and total consumption amounting to 19mn tons in FY10/11. As far as domestic supply is concerned, the public sector produced an average c.60% of total subsidized flour in FY10/11. The bread subsidy costs the Egyptian government around EGP16bn annually while the public sector’s share of fine flour came in at 7% in FY10/11. The public milling sector benefits from the General Authority for Supply Commodities (GASC)’s supply of required wheat volumes for the production of subsidized bread. However, milling companies showed weaker operational performance in crushing activities in FY10/11 due to the higher cost of crushing wheat for subsidized flour, compared to a crushing fee of EGP75/ton fee levied by the GASC. The Ministry of Agriculture officially announced a 9% higher local wheat procurement price of EGP380/ardab in the current FY11/12 season, compared to EGP350/ardab in the last season.
Review 2011 Cultivated wheat area increased 2% from 3mn feddan to almost 3.1mn feddan in FY10/11, which we attribute to 30% higher wheat prices of EGP350/ardab. In addition, average crop yield per feddan rose from 15.9 ardab to 18.3 ardab, bringing the total for local wheat production up 17% to 8.4mn tons. Total public sector crushed wheat for subsidized flour came 1% higher at 5.1mn tons in FY10/11. The Ministry of Agriculture and the Ministry of Social Solidarity and Justice have put forth a proposal to increase the current crushing fee (EGP75/ton since 2007) to EGP112.5/ton, which the Ministry of Finance is still reviewing. The public sector’s average dividend yield was 8.4% in FY10/11, with Middle & West Delta Mills [WCDF] and Upper Egypt Mills [UEFM] delivering the highest yields: at 11.7% and 10.3% respectively.
Preview 2012 The government officially announced a 9% higher local procurement price for FY11/12 of EGP380/ardab to encourage farmers to cultivate wheat. However, the revenue per feddan of beet cultivation (a major competing crop to wheat) is 11% higher than that of wheat, which could rein the growth of wheat cultivated land. Total public sector crushed wheat for subsidized flour is expected to increase 11% to 5.7mn tons, whilst the total crushed wheat for fine flour is expected to report a 1% increase to 292,500 tons.
Egypt Book 2011/12 | Sector Review
Mills
AFMC | Underweight CEFM | Underweight MILS | Hold EDFM | Buy WCDF | Buy SCFM | Sell
UEFM | Strong Buy
Ahmed Abdel Ghani [email protected]
+20 333-18-346
Mirette Mohamed Ghozzi [email protected]
+20 333-18-359
-50%-40%-30%-20%-10%
0%10%20%30%
2009a 2010a 2011e 2012e 2013e 2014e
Revenue EBITDA Net Income
Source: M oA, BBG, CICH 08/09 09/10 10/11
Total wheat production (mn tons) 8.5 7.2 8.4Total wheat consumption (mn tons) 16.8 17.5 19.0Self-sufficieny ratio (%) 50.5% 41.0% 44.1%Local w heat price (EGP/ton) 1,641.5 1,809.0 2,345.0Int'l w heat price (EGP/ton) 1,154.4 1,011.6 1,804.2Public sector 's 82% & 76%- flour share 65.3% 66.4% 59.8%Public sector 's 72%- flour share 8.7% 5.9% 6.4%
2.1% annual population growth fuels demand for bread. Inelastic demand. Government support for subsidized bread. GASC responsible for supplying wheat used in
subsidized flour bread.
Mills | 52 Wk Performance*
2,000
3,000 4,000
5,000 6,000 7,000
8,000
Jan-11 Mar-11 May-11 Jul-11 Sep-11 Nov-11
EGX 30 Mills (UW) Mills (W)
Sector Growth Drivers
More than one government authority responsible for the industry, leading to conflicting decisions. Government intervention in the sector: price-setting
& production quotas. International wheat prices impact fine flour margins.
Sector Risks
Coverage KPIs | 2009-14e†
Sector KPIs | 2008/09-2010/11
*Comprises all sector stocks constituting CI Capital 100 Index; † Aggregate of CI Capital Research covered stocks.
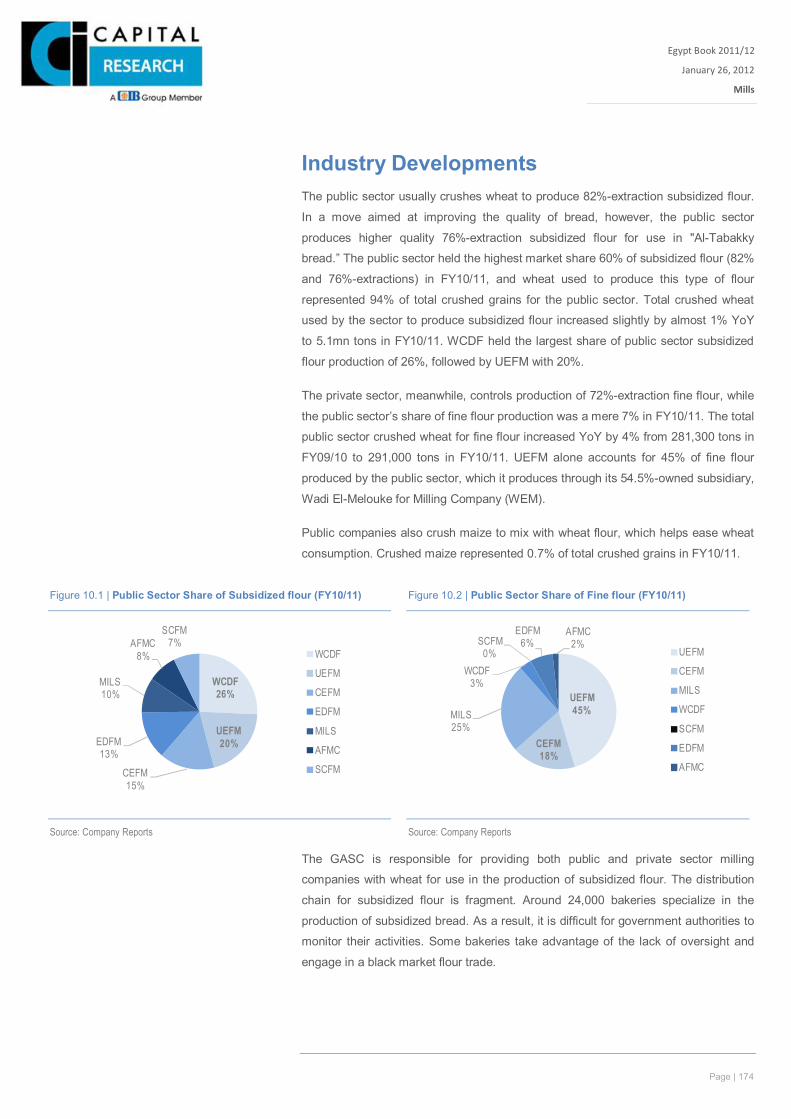
Page | 174
Egypt Book 2011/12
January 26, 2012
Mills
Xxx
Industry Developments The public sector usually crushes wheat to produce 82%-extraction subsidized flour.
In a move aimed at improving the quality of bread, however, the public sector
produces higher quality 76%-extraction subsidized flour for use in "Al-Tabakky
bread.” The public sector held the highest market share 60% of subsidized flour (82%
and 76%-extractions) in FY10/11, and wheat used to produce this type of flour
represented 94% of total crushed grains for the public sector. Total crushed wheat
used by the sector to produce subsidized flour increased slightly by almost 1% YoY
to 5.1mn tons in FY10/11. WCDF held the largest share of public sector subsidized
flour production of 26%, followed by UEFM with 20%.
The private sector, meanwhile, controls production of 72%-extraction fine flour, while
the public sector’s share of fine flour production was a mere 7% in FY10/11. The total
public sector crushed wheat for fine flour increased YoY by 4% from 281,300 tons in
FY09/10 to 291,000 tons in FY10/11. UEFM alone accounts for 45% of fine flour
produced by the public sector, which it produces through its 54.5%-owned subsidiary,
Wadi El-Melouke for Milling Company (WEM).
Public companies also crush maize to mix with wheat flour, which helps ease wheat
consumption. Crushed maize represented 0.7% of total crushed grains in FY10/11.
The GASC is responsible for providing both public and private sector milling
companies with wheat for use in the production of subsidized flour. The distribution
chain for subsidized flour is fragment. Around 24,000 bakeries specialize in the
production of subsidized bread. As a result, it is difficult for government authorities to
monitor their activities. Some bakeries take advantage of the lack of oversight and
engage in a black market flour trade.
Figure 10.1 | Public Sector Share of Subsidized flour (FY10/11) Figure 10.2 | Public Sector Share of Fine flour (FY10/11)
WCDF26%
UEFM20%
CEFM15%
EDFM13%
MILS10%
AFMC8%
SCFM7%
WCDF
UEFM
CEFM
EDFM
MILS
AFMC
SCFM
UEFM45%
CEFM18%
MILS25%
WCDF3%
SCFM0%
EDFM6%
AFMC2%
UEFM
CEFM
MILS
WCDF
SCFM
EDFM
AFMC
Source: Company Reports
Source: Company Reports
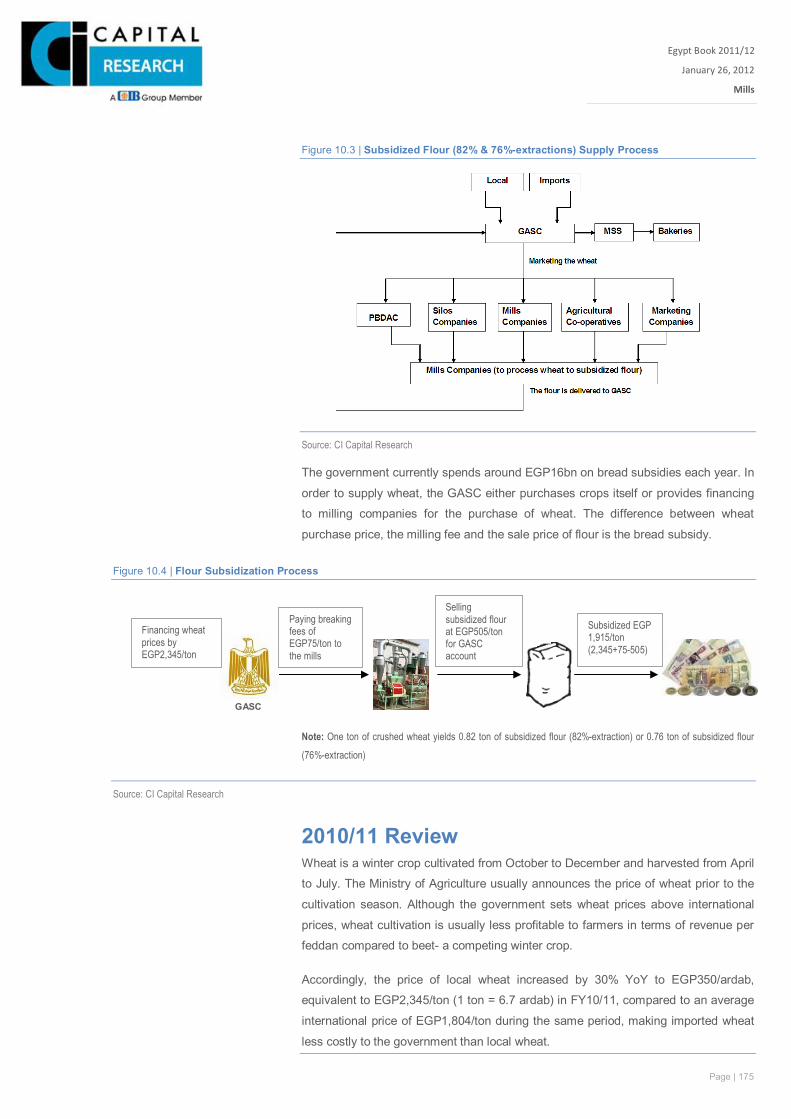
Page | 175
Egypt Book 2011/12
January 26, 2012
Mills
Xxx
Figure 10.3 | Subsidized Flour (82% & 76%-extractions) Supply Process
Source: CI Capital Research The government currently spends around EGP16bn on bread subsidies each year. In
order to supply wheat, the GASC either purchases crops itself or provides financing
to milling companies for the purchase of wheat. The difference between wheat
purchase price, the milling fee and the sale price of flour is the bread subsidy.
Figure 10.4 | Flour Subsidization Process
Note: One ton of crushed wheat yields 0.82 ton of subsidized flour (82%-extraction) or 0.76 ton of subsidized flour
(76%-extraction)
Source: CI Capital Research
2010/11 Review Wheat is a winter crop cultivated from October to December and harvested from April
to July. The Ministry of Agriculture usually announces the price of wheat prior to the
cultivation season. Although the government sets wheat prices above international
prices, wheat cultivation is usually less profitable to farmers in terms of revenue per
feddan compared to beet- a competing winter crop.
Accordingly, the price of local wheat increased by 30% YoY to EGP350/ardab,
equivalent to EGP2,345/ton (1 ton = 6.7 ardab) in FY10/11, compared to an average
international price of EGP1,804/ton during the same period, making imported wheat
less costly to the government than local wheat.
Paying breaking fees of EGP75/ton to the mills
Financing wheat prices by EGP2,345/ton
Selling subsidized flour at EGP505/ton for GASC account
Subsidized EGP 1,915/ton (2,345+75-505)
GASC
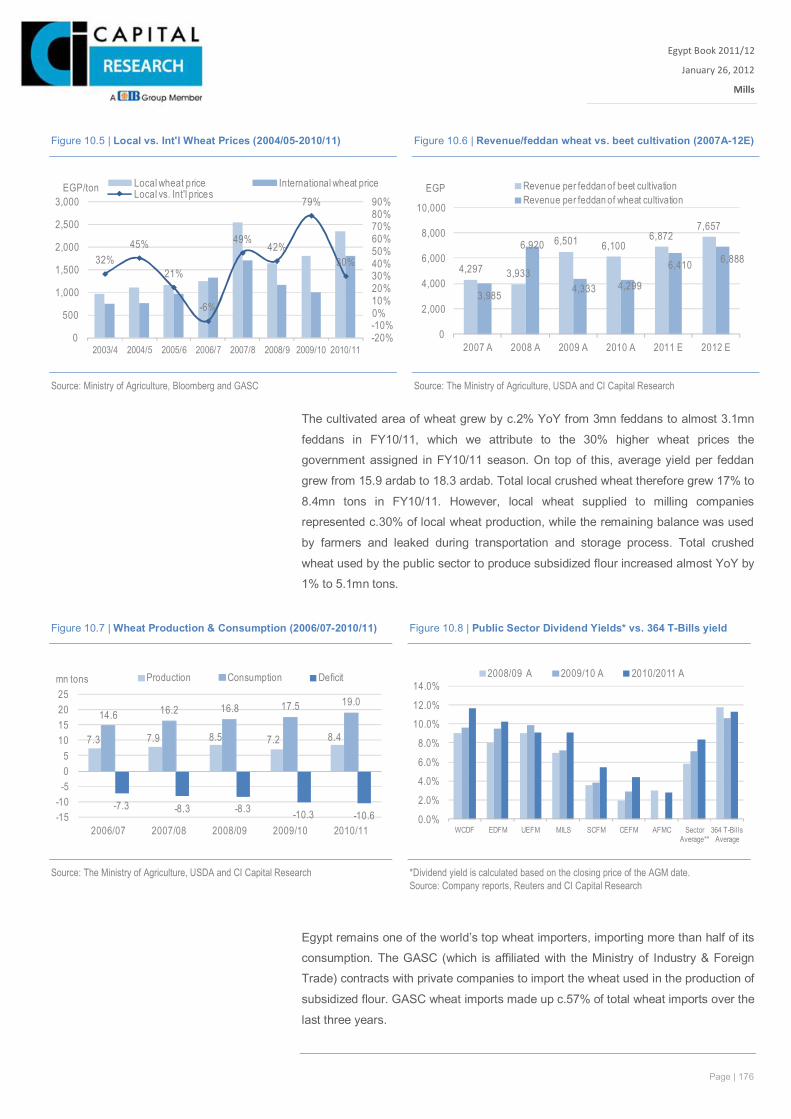
Page | 176
Egypt Book 2011/12
January 26, 2012
Mills
Xxx
The cultivated area of wheat grew by c.2% YoY from 3mn feddans to almost 3.1mn
feddans in FY10/11, which we attribute to the 30% higher wheat prices the
government assigned in FY10/11 season. On top of this, average yield per feddan
grew from 15.9 ardab to 18.3 ardab. Total local crushed wheat therefore grew 17% to
8.4mn tons in FY10/11. However, local wheat supplied to milling companies
represented c.30% of local wheat production, while the remaining balance was used
by farmers and leaked during transportation and storage process. Total crushed
wheat used by the public sector to produce subsidized flour increased almost YoY by
1% to 5.1mn tons.
.
Egypt remains one of the world’s top wheat importers, importing more than half of its
consumption. The GASC (which is affiliated with the Ministry of Industry & Foreign
Trade) contracts with private companies to import the wheat used in the production of
subsidized flour. GASC wheat imports made up c.57% of total wheat imports over the
last three years.
32%45%
21%
-6%
49%42%
79%
30%
-20%-10%0%10%20%30%40%50%60%70%80%90%
0
500
1,000
1,500
2,000
2,500
3,000
2003/4 2004/5 2005/6 2006/7 2007/8 2008/9 2009/10 2010/11
Local wheat price International wheat priceLocal vs. Int'l pricesEGP/ton
4,297 3,933
6,501 6,1006,872
7,657
3,985
6,920
4,333 4,299
6,410 6,888
0
2,000
4,000
6,000
8,000
10,000
2007 A 2008 A 2009 A 2010 A 2011 E 2012 E
Revenue per feddan of beet cultivationRevenue per feddan of wheat cultivation
EGP
Source: Ministry of Agriculture, Bloomberg and GASC Source: The Ministry of Agriculture, USDA and CI Capital Research
Figure 10.5 | Local vs. Int'l Wheat Prices (2004/05-2010/11) Figure 10.6 | Revenue/feddan wheat vs. beet cultivation (2007A-12E)
7.3 7.9 8.5 7.2 8.4
14.6 16.2 16.8 17.5 19.0
-7.3 -8.3 -8.3 -10.3 -10.6-15-10
-505
10152025
2006/07 2007/08 2008/09 2009/10 2010/11
mn tons Production Consumption Deficit
0.0%
2.0%
4.0%
6.0%
8.0%
10.0%
12.0%
14.0%
WCDF EDFM UEFM MILS SCFM CEFM AFMC Sector Average**
364 T-Bills Average
2008/09 A 2009/10 A 2010/2011 A
Figure 10.7 | Wheat Production & Consumption (2006/07-2010/11) Figure 10.8 | Public Sector Dividend Yields* vs. 364 T-Bills yield
Source: The Ministry of Agriculture, USDA and CI Capital Research *Dividend yield is calculated based on the closing price of the AGM date. Source: Company reports, Reuters and CI Capital Research
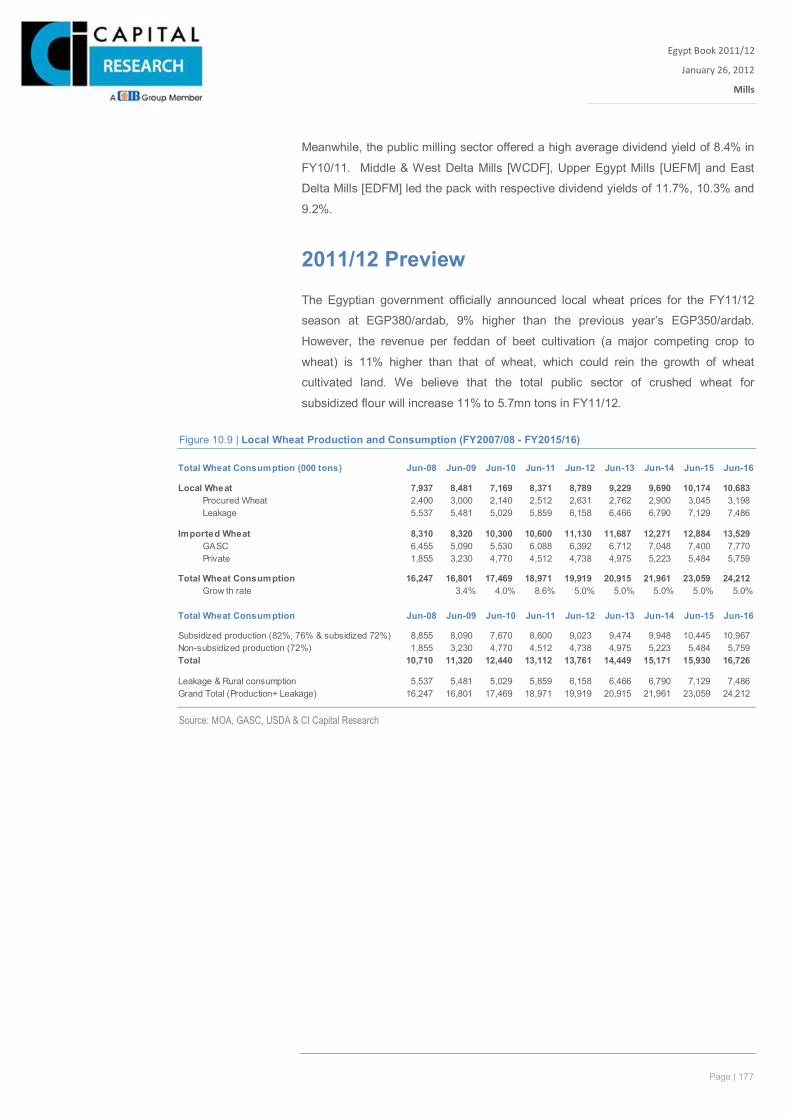
Page | 177
Egypt Book 2011/12
January 26, 2012
Mills
Xxx
Meanwhile, the public milling sector offered a high average dividend yield of 8.4% in
FY10/11. Middle & West Delta Mills [WCDF], Upper Egypt Mills [UEFM] and East
Delta Mills [EDFM] led the pack with respective dividend yields of 11.7%, 10.3% and
9.2%.
2011/12 Preview The Egyptian government officially announced local wheat prices for the FY11/12
season at EGP380/ardab, 9% higher than the previous year’s EGP350/ardab.
However, the revenue per feddan of beet cultivation (a major competing crop to
wheat) is 11% higher than that of wheat, which could rein the growth of wheat
cultivated land. We believe that the total public sector of crushed wheat for
subsidized flour will increase 11% to 5.7mn tons in FY11/12.
Figure 10.9 | Local Wheat Production and Consumption (FY2007/08 - FY2015/16)
Source: MOA, GASC, USDA & CI Capital Research
Total Wheat Consumption (000 tons) Jun-08 Jun-09 Jun-10 Jun-11 Jun-12 Jun-13 Jun-14 Jun-15 Jun-16
Local Wheat 7,937 8,481 7,169 8,371 8,789 9,229 9,690 10,174 10,683 Procured Wheat 2,400 3,000 2,140 2,512 2,631 2,762 2,900 3,045 3,198 Leakage 5,537 5,481 5,029 5,859 6,158 6,466 6,790 7,129 7,486
Imported Wheat 8,310 8,320 10,300 10,600 11,130 11,687 12,271 12,884 13,529 GASC 6,455 5,090 5,530 6,088 6,392 6,712 7,048 7,400 7,770 Private 1,855 3,230 4,770 4,512 4,738 4,975 5,223 5,484 5,759
Total Wheat Consumption 16,247 16,801 17,469 18,971 19,919 20,915 21,961 23,059 24,212 Grow th rate 3.4% 4.0% 8.6% 5.0% 5.0% 5.0% 5.0% 5.0%
Total Wheat Consumption Jun-08 Jun-09 Jun-10 Jun-11 Jun-12 Jun-13 Jun-14 Jun-15 Jun-16
Subsidized production (82%, 76% & subsidized 72%) 8,855 8,090 7,670 8,600 9,023 9,474 9,948 10,445 10,967 Non-subsidized production (72%) 1,855 3,230 4,770 4,512 4,738 4,975 5,223 5,484 5,759 Total 10,710 11,320 12,440 13,112 13,761 14,449 15,171 15,930 16,726
Leakage & Rural consumption 5,537 5,481 5,029 5,859 6,158 6,466 6,790 7,129 7,486 Grand Total (Production+ Leakage) 16,247 16,801 17,469 18,971 19,919 20,915 21,961 23,059 24,212
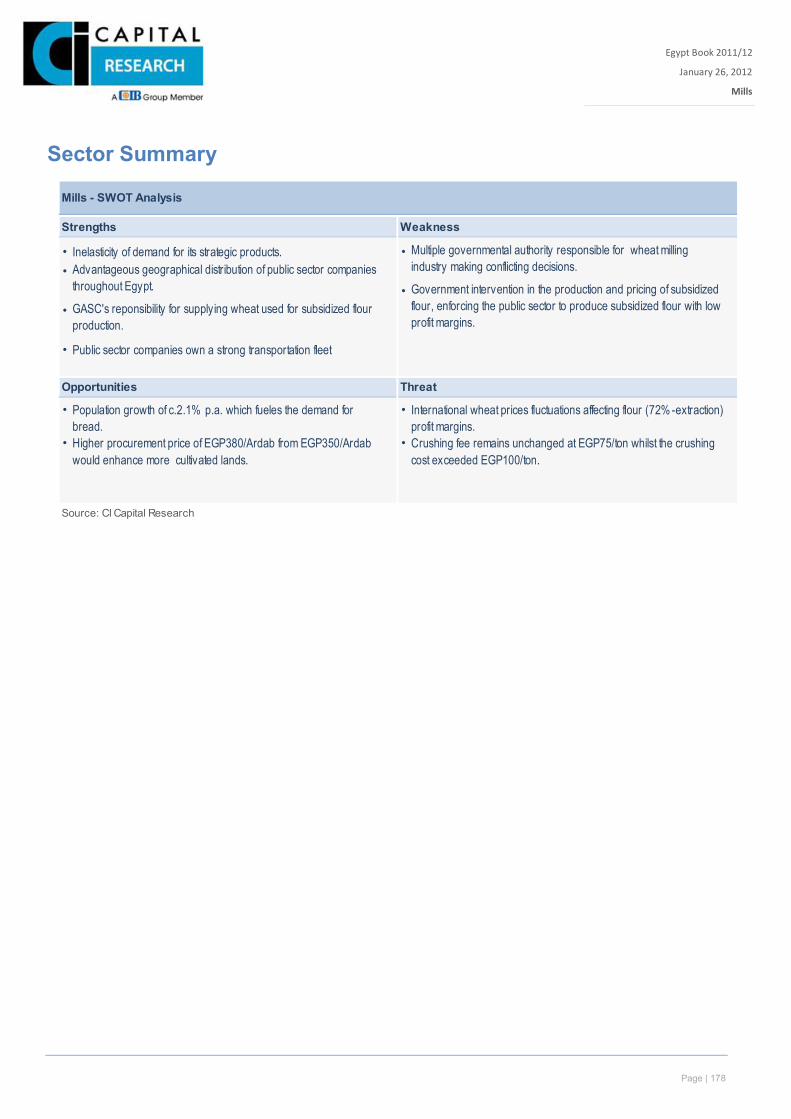
Page | 178
Egypt Book 2011/12
January 26, 2012
Mills
Xxx
Sector Summary
Mills - SWOT Analysis
Strengths Weakness
• Inelasticity of demand for its strategic products. ••
••
• Public sector companies own a strong transportation fleet
Opportunities Threat
• •
• Higher procurement price of EGP380/Ardab from EGP350/Ardab would enhance more cultivated lands.
• Crushing fee remains unchanged at EGP75/ton whilst the crushing cost exceeded EGP100/ton.
Source: CI Capital Research
Advantageous geographical distribution of public sector companies throughout Egypt.
Multiple governmental authority responsible for wheat milling industry making conflicting decisions.
GASC's reponsibility for supplying wheat used for subsidized flour production.
Population growth of c.2.1% p.a. which fueles the demand for bread.
Government intervention in the production and pricing of subsidized flour, enforcing the public sector to produce subsidized flour with low profit margins.
International wheat prices fluctuations affecting flour (72% -extraction) profit margins.

Page | 179
Egypt Book 2011/12 | Consumer Staples
For more information on CICR, please visit our website at http://research.cicr.com.eg/register.php or contact us at [email protected]. Disclosures and details pertaining to stock ratings on last page.
January 26, 2012
Small player, low dividend yield Small player in subsidized flour production with FY10/11 market share of 8%.
Small player in fine flour production market with FY10/11 share of 2%.
Low dividend yield stock of 4.5% in FY10/11 below sector average of 8.4%
Alexandria Mills [AFMC] held an 8% share of subsidized flour production in FY10/11, a small figure compared to its local peers. The firm is also a small player in the fine flour market, controlling a mere 2% market share, and offers a low FY10/11 dividend yield of 4.5% at AGM date (a 3.1% average over the last three years), well below the sector’s 8.4% average.
2011 Review AFMC’s FY10/11 earnings decreased 15% YoY to EGP5.7mn on the back of 23bps decline in EBITDA margin to 4.4% vs. 4.6% a year ago in addition to provisions of EGP1.8mn in FY10/11 vs. EGP0.2mn a year ago. AFMC’s volume of crushed wheat declined 4% YoY to 420,000 tons to produce subsidized flour due to the company’s adherence to the Ministry of Social Solidarity and Justice’s decision of specified quotas of crushed wheat in addition to halting four mills (representing 36% of the company’s total mills) for development. This lead to a drop of AFMC’s market share to 8% in FY10/11, down from 9% a year ago. Meanwhile, although COGS/sales declined to 87.8% vs. 89.5% a year ago, SG&A/sales increased to 7.7%, up from 5.9% a year ago, leading to a drop in margins. AFMC distributed a DPS of EGP0.75, implying a payout ratio of 52% in FY10/11. This implies a dividend yield of 4.5% - well below the sector’s 8.4% average.
2012 Preview We forecast AFMC’s net income to grow by 4% to EGP6mn in FY11/12. Given that the Government has not yet approved an increase in the current milling fee of EGP75/ton, we expect margins to be pressured given higher crushing costs due to higher wages and electricity costs. We expect EBITDA margin to fall to 3.7%, down from 4.4% a year ago. Finally, AFMC approved an EGP15mn Capex plan in FY11/12, mainly for replacement and renewal of a mill and transportation fleet.
Valuation & Recommendation Our DCF model yielded an LTFV of EGP15.2/share, and we set our target price to match it. AFMC currently trades at a forward FY11/12 P/ER of 10x (above the sector average of 5.4x). We assigned an Underweight recommendation on the stock with a Moderate Risk rating.
Ahmed Abdel Ghani [email protected]
Mirette Mohamed Ghozzi [email protected]
Mills Underweight
TP - EGP 15.2 | 0.7% Upside
Alexandria Mills
Stock Details As at: 21-Jan-12
CICR Rating/RiskTarget Price/LTFV (EGP)
Last Price (EGP)52 Week High52 Week Low6M Av. Daily Vol. (000' shrs)% Chg: M oM / 6M / YoY
No. o f Shares (mn)M kt. Cap (EGPmn)M kt. Cap (USDmn)*Free Float (%)Paid in Capital (EGPmn)
Reuters / B loombergISIN
GDR DataLast Price52 Week High52 Week Low
Company Profile
Ow nership StructureHolding Company fo r Food Industries 60.0%M r.Ahmed Diaa El-Din 10.0%Employee Association 10.0%Others 2.1%Free float 17.9%
Source: B loomberg / CICR *USD:EGP FX: 6.04
Alexandria M ills [AFM C] was established in 1965 underPresidential Decree No. 2475 and 2483/1965. It was later re-established under Law No. 203/1991as a subsidiary of theHolding Company for Food Industries. AFM C's purpose isto manufacture, import and distribute flour, cereals and theirrelated products. The company operates 11 mills with anannual production capacity of 571k tons in addition to 5bakeries and 3 macaroni factories.
AFM C held a market share of 9% in the production ofsubsidized flour and 3% in the production of fine flour inFY08/09. The company currently ho lds an authorized capitalo f EGP100mn and a paid-in capital o f EGP40mn, distributedover 4mn shares at a par value of EGP10/share.
25.4014.00
4.00
2.03
AFM C.CA / AFM C Ey Equity
10.00
-0.5 / -27.3 / -34.5
40.00
60.40
No GDR availablen/a
17.90
EGS30471C014
n/a
15.2 / 15.2
15.10
Underweight/M oderate
-
0.1
0.1
0.2
0.2
-
5.0
10.0
15.0
20.0
25.0
30.0
Jan-11 Mar-11 May-11 Jul-11 Sep-11 Nov-11
mn shrsCurr.Volume AFMCEGX 30 (rebased)
52 week Share Performance
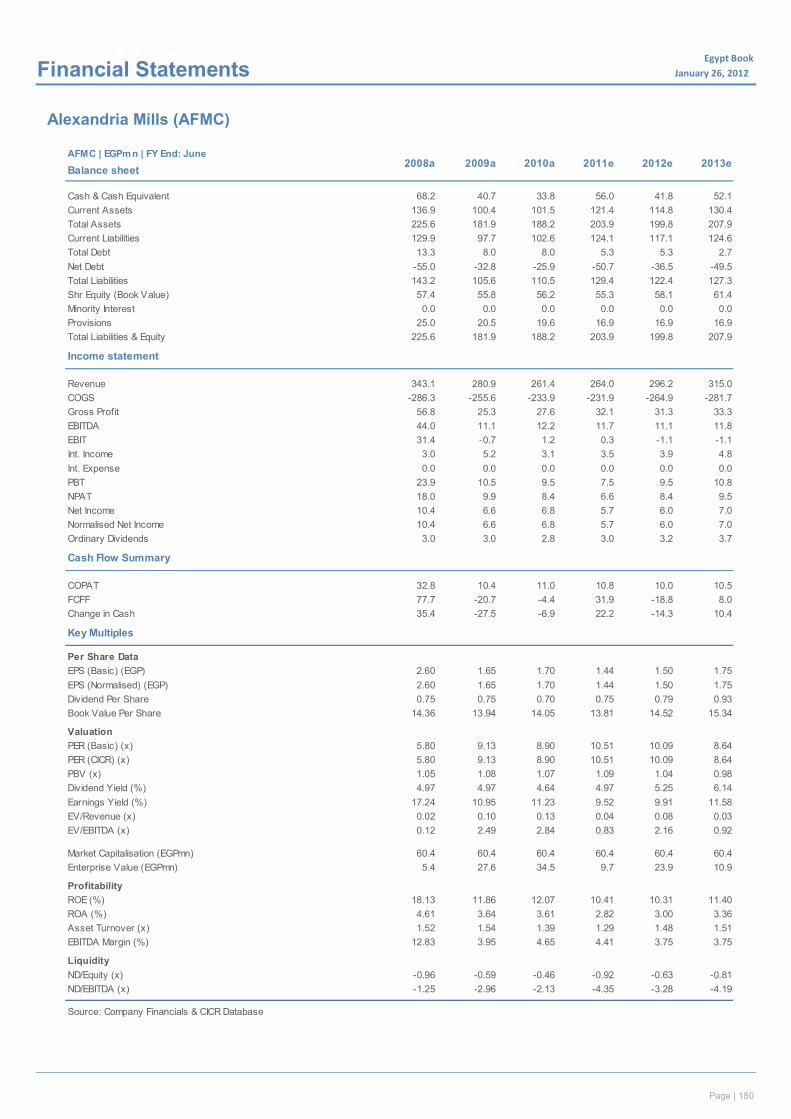
Page | 180
Egypt Book January 26, 2012x Financial Statements
Alexandria Mills (AFMC)
AFMC | EGPmn | FY End: June
Balance sheet
Cash & Cash Equivalent 68.2 40.7 33.8 56.0 41.8 52.1Current Assets 136.9 100.4 101.5 121.4 114.8 130.4Total Assets 225.6 181.9 188.2 203.9 199.8 207.9Current Liabilities 129.9 97.7 102.6 124.1 117.1 124.6Total Debt 13.3 8.0 8.0 5.3 5.3 2.7Net Debt -55.0 -32.8 -25.9 -50.7 -36.5 -49.5Total Liabilities 143.2 105.6 110.5 129.4 122.4 127.3Shr Equity (Book Value) 57.4 55.8 56.2 55.3 58.1 61.4Minority Interest 0.0 0.0 0.0 0.0 0.0 0.0Provisions 25.0 20.5 19.6 16.9 16.9 16.9Total Liabilities & Equity 225.6 181.9 188.2 203.9 199.8 207.9
Income statement
Revenue 343.1 280.9 261.4 264.0 296.2 315.0COGS -286.3 -255.6 -233.9 -231.9 -264.9 -281.7Gross Profit 56.8 25.3 27.6 32.1 31.3 33.3EBITDA 44.0 11.1 12.2 11.7 11.1 11.8EBIT 31.4 -0.7 1.2 0.3 -1.1 -1.1Int. Income 3.0 5.2 3.1 3.5 3.9 4.8Int. Expense 0.0 0.0 0.0 0.0 0.0 0.0PBT 23.9 10.5 9.5 7.5 9.5 10.8NPAT 18.0 9.9 8.4 6.6 8.4 9.5Net Income 10.4 6.6 6.8 5.7 6.0 7.0Normalised Net Income 10.4 6.6 6.8 5.7 6.0 7.0Ordinary Dividends 3.0 3.0 2.8 3.0 3.2 3.7
Cash Flow Summary
COPAT 32.8 10.4 11.0 10.8 10.0 10.5FCFF 77.7 -20.7 -4.4 31.9 -18.8 8.0Change in Cash 35.4 -27.5 -6.9 22.2 -14.3 10.4
Key Multiples
Per Share DataEPS (Basic) (EGP) 2.60 1.65 1.70 1.44 1.50 1.75EPS (Normalised) (EGP) 2.60 1.65 1.70 1.44 1.50 1.75Dividend Per Share 0.75 0.75 0.70 0.75 0.79 0.93Book Value Per Share 14.36 13.94 14.05 13.81 14.52 15.34
ValuationPER (Basic) (x) 5.80 9.13 8.90 10.51 10.09 8.64PER (CICR) (x) 5.80 9.13 8.90 10.51 10.09 8.64PBV (x) 1.05 1.08 1.07 1.09 1.04 0.98Dividend Yield (%) 4.97 4.97 4.64 4.97 5.25 6.14Earnings Yield (%) 17.24 10.95 11.23 9.52 9.91 11.58EV/Revenue (x) 0.02 0.10 0.13 0.04 0.08 0.03EV/EBITDA (x) 0.12 2.49 2.84 0.83 2.16 0.92
Market Capitalisation (EGPmn) 60.4 60.4 60.4 60.4 60.4 60.4Enterprise Value (EGPmn) 5.4 27.6 34.5 9.7 23.9 10.9
ProfitabilityROE (%) 18.13 11.86 12.07 10.41 10.31 11.40ROA (%) 4.61 3.64 3.61 2.82 3.00 3.36Asset Turnover (x) 1.52 1.54 1.39 1.29 1.48 1.51EBITDA Margin (%) 12.83 3.95 4.65 4.41 3.75 3.75
LiquidityND/Equity (x) -0.96 -0.59 -0.46 -0.92 -0.63 -0.81ND/EBITDA (x) -1.25 -2.96 -2.13 -4.35 -3.28 -4.19
Source: Company Financials & CICR Database
2008a 2009a 2010a 2011e 2012e 2013e
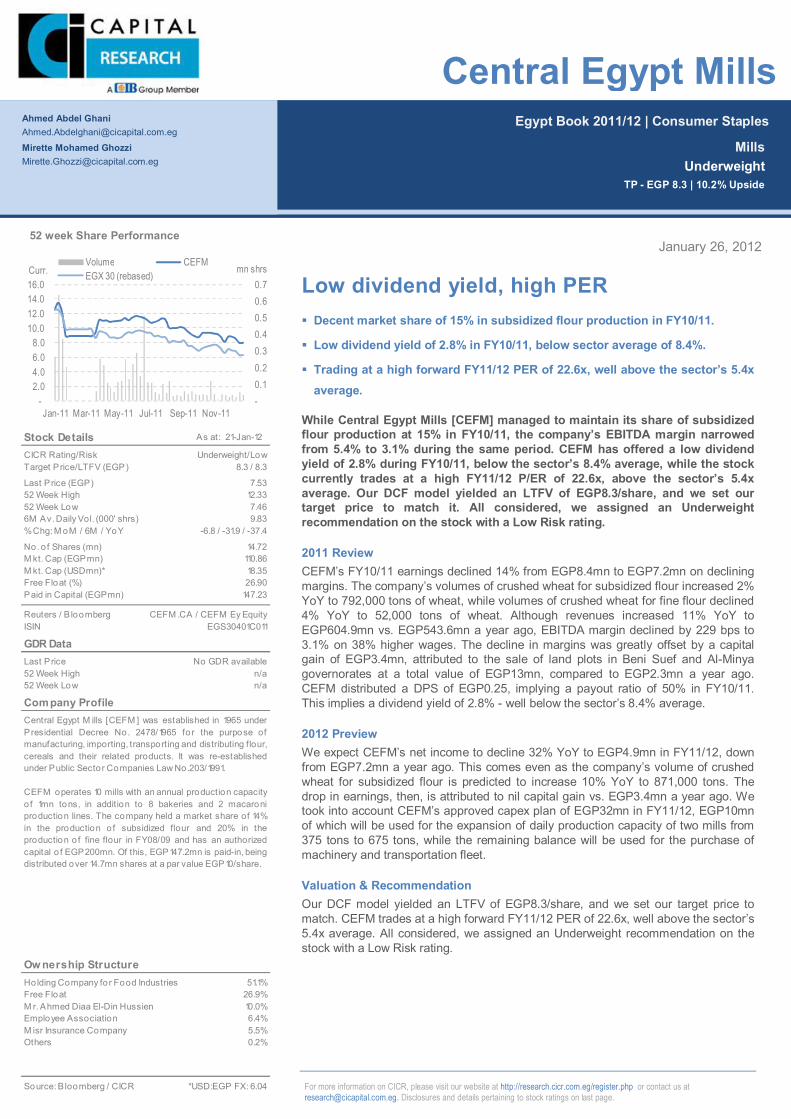
Page | 181
Egypt Book 2011/12 | Consumer Staples
For more information on CICR, please visit our website at http://research.cicr.com.eg/register.php or contact us at [email protected]. Disclosures and details pertaining to stock ratings on last page.
January 26, 2012
Low dividend yield, high PER Decent market share of 15% in subsidized flour production in FY10/11.
Low dividend yield of 2.8% in FY10/11, below sector average of 8.4%.
Trading at a high forward FY11/12 PER of 22.6x, well above the sector’s 5.4x average.
While Central Egypt Mills [CEFM] managed to maintain its share of subsidized flour production at 15% in FY10/11, the company’s EBITDA margin narrowed from 5.4% to 3.1% during the same period. CEFM has offered a low dividend yield of 2.8% during FY10/11, below the sector’s 8.4% average, while the stock currently trades at a high FY11/12 P/ER of 22.6x, above the sector’s 5.4x average. Our DCF model yielded an LTFV of EGP8.3/share, and we set our target price to match it. All considered, we assigned an Underweight recommendation on the stock with a Low Risk rating.
2011 Review CEFM’s FY10/11 earnings declined 14% from EGP8.4mn to EGP7.2mn on declining margins. The company’s volumes of crushed wheat for subsidized flour increased 2% YoY to 792,000 tons of wheat, while volumes of crushed wheat for fine flour declined 4% YoY to 52,000 tons of wheat. Although revenues increased 11% YoY to EGP604.9mn vs. EGP543.6mn a year ago, EBITDA margin declined by 229 bps to 3.1% on 38% higher wages. The decline in margins was greatly offset by a capital gain of EGP3.4mn, attributed to the sale of land plots in Beni Suef and Al-Minya governorates at a total value of EGP13mn, compared to EGP2.3mn a year ago. CEFM distributed a DPS of EGP0.25, implying a payout ratio of 50% in FY10/11. This implies a dividend yield of 2.8% - well below the sector’s 8.4% average.
2012 Preview We expect CEFM’s net income to decline 32% YoY to EGP4.9mn in FY11/12, down from EGP7.2mn a year ago. This comes even as the company’s volume of crushed wheat for subsidized flour is predicted to increase 10% YoY to 871,000 tons. The drop in earnings, then, is attributed to nil capital gain vs. EGP3.4mn a year ago. We took into account CEFM’s approved capex plan of EGP32mn in FY11/12, EGP10mn of which will be used for the expansion of daily production capacity of two mills from 375 tons to 675 tons, while the remaining balance will be used for the purchase of machinery and transportation fleet.
Valuation & Recommendation Our DCF model yielded an LTFV of EGP8.3/share, and we set our target price to match. CEFM trades at a high forward FY11/12 PER of 22.6x, well above the sector’s 5.4x average. All considered, we assigned an Underweight recommendation on the stock with a Low Risk rating.
Ahmed Abdel Ghani [email protected]
Mirette Mohamed Ghozzi [email protected]
Mills Underweight
TP - EGP 8.3 | 10.2% Upside
Central Egypt Mills
Stock Details As at: 21-Jan-12
CICR Rating/RiskTarget Price/LTFV (EGP)
Last Price (EGP)52 Week High52 Week Low6M Av. Daily Vol. (000' shrs)% Chg: M oM / 6M / YoY
No. o f Shares (mn)M kt. Cap (EGPmn)M kt. Cap (USDmn)*Free Float (%)Paid in Capital (EGPmn)
Reuters / B loombergISIN
GDR DataLast Price52 Week High52 Week Low
Company Profile
Ow nership StructureHolding Company fo r Food Industries 51.1%Free Float 26.9%M r. Ahmed Diaa El-Din Hussien 10.0%Employee Association 6.4%M isr Insurance Company 5.5%Others 0.2%
Source: B loomberg / CICR *USD:EGP FX: 6.04
Central Egypt M ills [CEFM ] was established in 1965 underPresidential Decree No. 2478/1965 for the purpose ofmanufacturing, importing, transporting and distributing flour,cereals and their related products. It was re-establishedunder Public Sector Companies Law No.203/1991.
CEFM operates 10 mills with an annual production capacityo f 1mn tons, in addition to 8 bakeries and 2 macaroniproduction lines. The company held a market share of 14%in the production of subsidized flour and 20% in theproduction of fine flour in FY08/09 and has an authorizedcapital o f EGP200mn. Of this, EGP147.2mn is paid-in, beingdistributed over 14.7mn shares at a par value EGP10/share.
12.337.46
14.72
9.83
CEFM .CA / CEFM Ey Equity
18.35
-6.8 / -31.9 / -37.4
147.23
110.86
No GDR availablen/a
26.90
EGS30401C011
n/a
8.3 / 8.3
7.53
Underweight/Low
-0.1 0.2 0.3 0.4 0.5 0.6 0.7
-2.0 4.0 6.0 8.0
10.0 12.0 14.0 16.0
Jan-11 Mar-11 May-11 Jul-11 Sep-11 Nov-11
mn shrsCurr.Volume CEFMEGX 30 (rebased)
52 week Share Performance
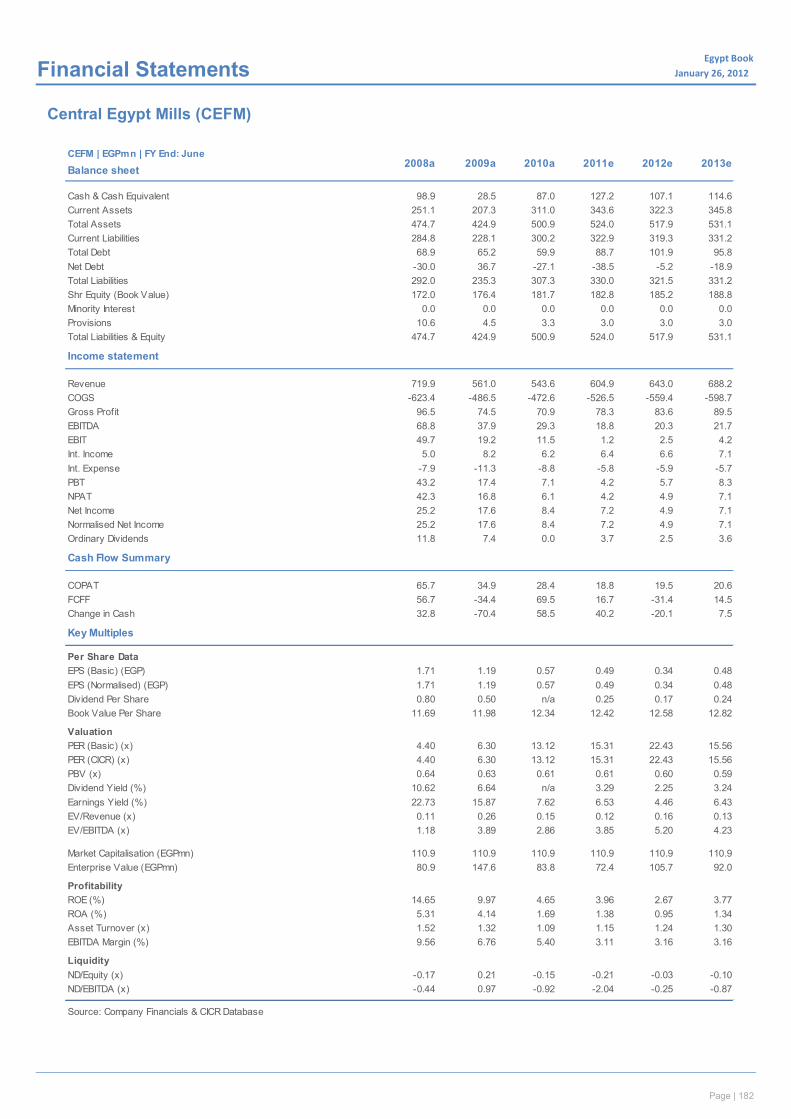
Page | 182
Egypt Book January 26, 2012x Financial Statements
Central Egypt Mills (CEFM)
CEFM | EGPmn | FY End: June
Balance sheet
Cash & Cash Equivalent 98.9 28.5 87.0 127.2 107.1 114.6Current Assets 251.1 207.3 311.0 343.6 322.3 345.8Total Assets 474.7 424.9 500.9 524.0 517.9 531.1Current Liabilities 284.8 228.1 300.2 322.9 319.3 331.2Total Debt 68.9 65.2 59.9 88.7 101.9 95.8Net Debt -30.0 36.7 -27.1 -38.5 -5.2 -18.9Total Liabilities 292.0 235.3 307.3 330.0 321.5 331.2Shr Equity (Book Value) 172.0 176.4 181.7 182.8 185.2 188.8Minority Interest 0.0 0.0 0.0 0.0 0.0 0.0Provisions 10.6 4.5 3.3 3.0 3.0 3.0Total Liabilities & Equity 474.7 424.9 500.9 524.0 517.9 531.1
Income statement
Revenue 719.9 561.0 543.6 604.9 643.0 688.2COGS -623.4 -486.5 -472.6 -526.5 -559.4 -598.7Gross Profit 96.5 74.5 70.9 78.3 83.6 89.5EBITDA 68.8 37.9 29.3 18.8 20.3 21.7EBIT 49.7 19.2 11.5 1.2 2.5 4.2Int. Income 5.0 8.2 6.2 6.4 6.6 7.1Int. Expense -7.9 -11.3 -8.8 -5.8 -5.9 -5.7PBT 43.2 17.4 7.1 4.2 5.7 8.3NPAT 42.3 16.8 6.1 4.2 4.9 7.1Net Income 25.2 17.6 8.4 7.2 4.9 7.1Normalised Net Income 25.2 17.6 8.4 7.2 4.9 7.1Ordinary Dividends 11.8 7.4 0.0 3.7 2.5 3.6
Cash Flow Summary
COPAT 65.7 34.9 28.4 18.8 19.5 20.6FCFF 56.7 -34.4 69.5 16.7 -31.4 14.5Change in Cash 32.8 -70.4 58.5 40.2 -20.1 7.5
Key Multiples
Per Share DataEPS (Basic) (EGP) 1.71 1.19 0.57 0.49 0.34 0.48EPS (Normalised) (EGP) 1.71 1.19 0.57 0.49 0.34 0.48Dividend Per Share 0.80 0.50 n/a 0.25 0.17 0.24Book Value Per Share 11.69 11.98 12.34 12.42 12.58 12.82
ValuationPER (Basic) (x) 4.40 6.30 13.12 15.31 22.43 15.56PER (CICR) (x) 4.40 6.30 13.12 15.31 22.43 15.56PBV (x) 0.64 0.63 0.61 0.61 0.60 0.59Dividend Yield (%) 10.62 6.64 n/a 3.29 2.25 3.24Earnings Yield (%) 22.73 15.87 7.62 6.53 4.46 6.43EV/Revenue (x) 0.11 0.26 0.15 0.12 0.16 0.13EV/EBITDA (x) 1.18 3.89 2.86 3.85 5.20 4.23
Market Capitalisation (EGPmn) 110.9 110.9 110.9 110.9 110.9 110.9Enterprise Value (EGPmn) 80.9 147.6 83.8 72.4 105.7 92.0
ProfitabilityROE (%) 14.65 9.97 4.65 3.96 2.67 3.77ROA (%) 5.31 4.14 1.69 1.38 0.95 1.34Asset Turnover (x) 1.52 1.32 1.09 1.15 1.24 1.30EBITDA Margin (%) 9.56 6.76 5.40 3.11 3.16 3.16
LiquidityND/Equity (x) -0.17 0.21 -0.15 -0.21 -0.03 -0.10ND/EBITDA (x) -0.44 0.97 -0.92 -2.04 -0.25 -0.87
Source: Company Financials & CICR Database
2008a 2009a 2010a 2011e 2012e 2013e
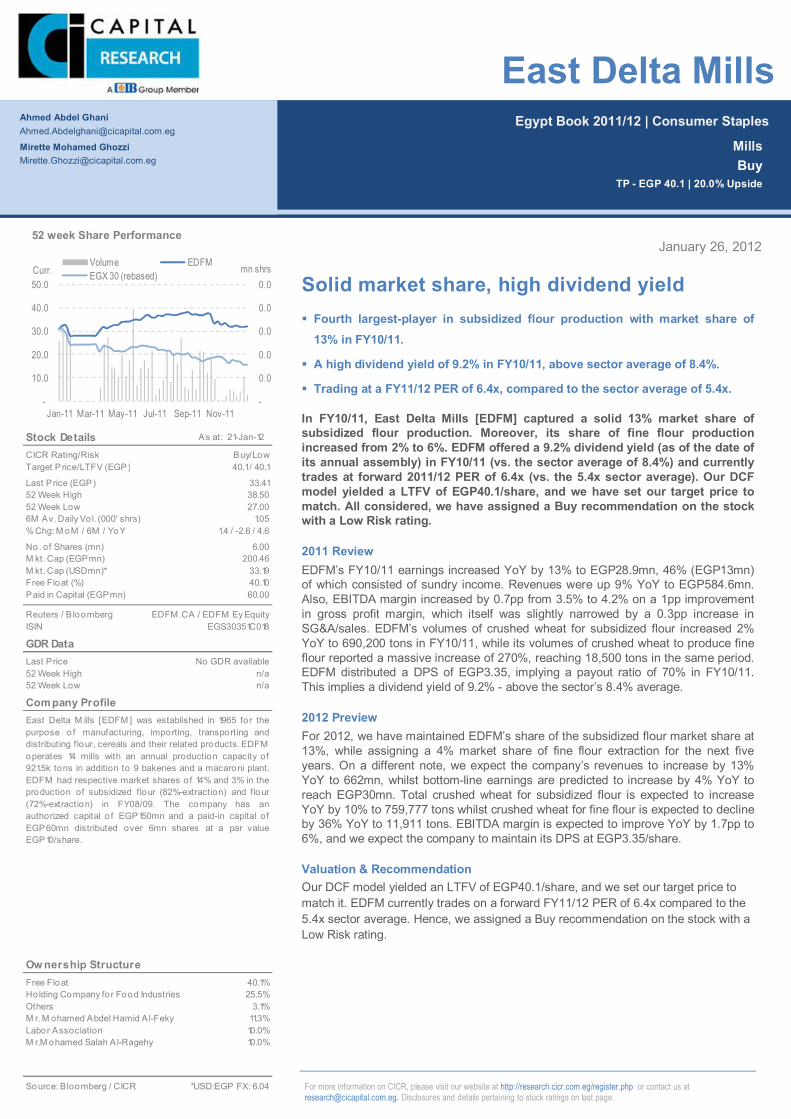
Page | 183
Egypt Book 2011/12 | Consumer Staples
For more information on CICR, please visit our website at http://research.cicr.com.eg/register.php or contact us at [email protected]. Disclosures and details pertaining to stock ratings on last page.
January 26, 2012
Solid market share, high dividend yield Fourth largest-player in subsidized flour production with market share of
13% in FY10/11.
A high dividend yield of 9.2% in FY10/11, above sector average of 8.4%.
Trading at a FY11/12 PER of 6.4x, compared to the sector average of 5.4x.
In FY10/11, East Delta Mills [EDFM] captured a solid 13% market share of subsidized flour production. Moreover, its share of fine flour production increased from 2% to 6%. EDFM offered a 9.2% dividend yield (as of the date of its annual assembly) in FY10/11 (vs. the sector average of 8.4%) and currently trades at forward 2011/12 PER of 6.4x (vs. the 5.4x sector average). Our DCF model yielded a LTFV of EGP40.1/share, and we have set our target price to match. All considered, we have assigned a Buy recommendation on the stock with a Low Risk rating.
2011 Review EDFM’s FY10/11 earnings increased YoY by 13% to EGP28.9mn, 46% (EGP13mn) of which consisted of sundry income. Revenues were up 9% YoY to EGP584.6mn. Also, EBITDA margin increased by 0.7pp from 3.5% to 4.2% on a 1pp improvement in gross profit margin, which itself was slightly narrowed by a 0.3pp increase in SG&A/sales. EDFM’s volumes of crushed wheat for subsidized flour increased 2% YoY to 690,200 tons in FY10/11, while its volumes of crushed wheat to produce fine flour reported a massive increase of 270%, reaching 18,500 tons in the same period. EDFM distributed a DPS of EGP3.35, implying a payout ratio of 70% in FY10/11. This implies a dividend yield of 9.2% - above the sector’s 8.4% average.
2012 Preview For 2012, we have maintained EDFM’s share of the subsidized flour market share at 13%, while assigning a 4% market share of fine flour extraction for the next five years. On a different note, we expect the company’s revenues to increase by 13% YoY to 662mn, whilst bottom-line earnings are predicted to increase by 4% YoY to reach EGP30mn. Total crushed wheat for subsidized flour is expected to increase YoY by 10% to 759,777 tons whilst crushed wheat for fine flour is expected to decline by 36% YoY to 11,911 tons. EBITDA margin is expected to improve YoY by 1.7pp to 6%, and we expect the company to maintain its DPS at EGP3.35/share.
Valuation & Recommendation Our DCF model yielded an LTFV of EGP40.1/share, and we set our target price to match it. EDFM currently trades on a forward FY11/12 PER of 6.4x compared to the 5.4x sector average. Hence, we assigned a Buy recommendation on the stock with a Low Risk rating.
Ahmed Abdel Ghani [email protected]
Mirette Mohamed Ghozzi [email protected]
Mills Buy
TP - EGP 40.1 | 20.0% Upside
East Delta Mills
Stock Details As at: 21-Jan-12
CICR Rating/RiskTarget Price/LTFV (EGP)
Last Price (EGP)52 Week High52 Week Low6M Av. Daily Vo l. (000' shrs)% Chg: M oM / 6M / YoY
No. of Shares (mn)M kt. Cap (EGPmn)M kt. Cap (USDmn)*Free Float (%)Paid in Capital (EGPmn)
Reuters / B loombergISIN
GDR DataLast Price52 Week High52 Week Low
Company Profile
Ow nership StructureFree Float 40.1%Holding Company fo r Food Industries 25.5%Others 3.1%M r. M ohamed Abdel Hamid A l-Feky 11.3%Labor Association 10.0%M r.M ohamed Salah A l-Ragehy 10.0%
Source: Bloomberg / CICR *USD:EGP FX: 6.04
East Delta M ills [EDFM ] was established in 1965 for thepurpose of manufacturing, importing, transporting anddistributing flour, cereals and their related products. EDFMoperates 14 mills with an annual production capacity of921.5k tons in addition to 9 bakeries and a macaroni plant.EDFM had respective market shares of 14% and 3% in theproduction of subsidized flour (82%-extraction) and flour(72%-extraction) in FY08/09. The company has anauthorized capital o f EGP150mn and a paid-in capital ofEGP60mn distributed over 6mn shares at a par valueEGP10/share.
38.5027.00
6.00
1.05
EDFM .CA / EDFM Ey Equity
33.19
1.4 / -2.6 / 4.6
60.00
200.46
No GDR availablen/a
40.10
EGS30351C018
n/a
40.1 / 40.1
33.41
Buy/Low
-
0.0
0.0
0.0
0.0
0.0
-
10.0
20.0
30.0
40.0
50.0
Jan-11 Mar-11 May-11 Jul-11 Sep-11 Nov-11
mn shrsCurr.Volume EDFMEGX 30 (rebased)
52 week Share Performance
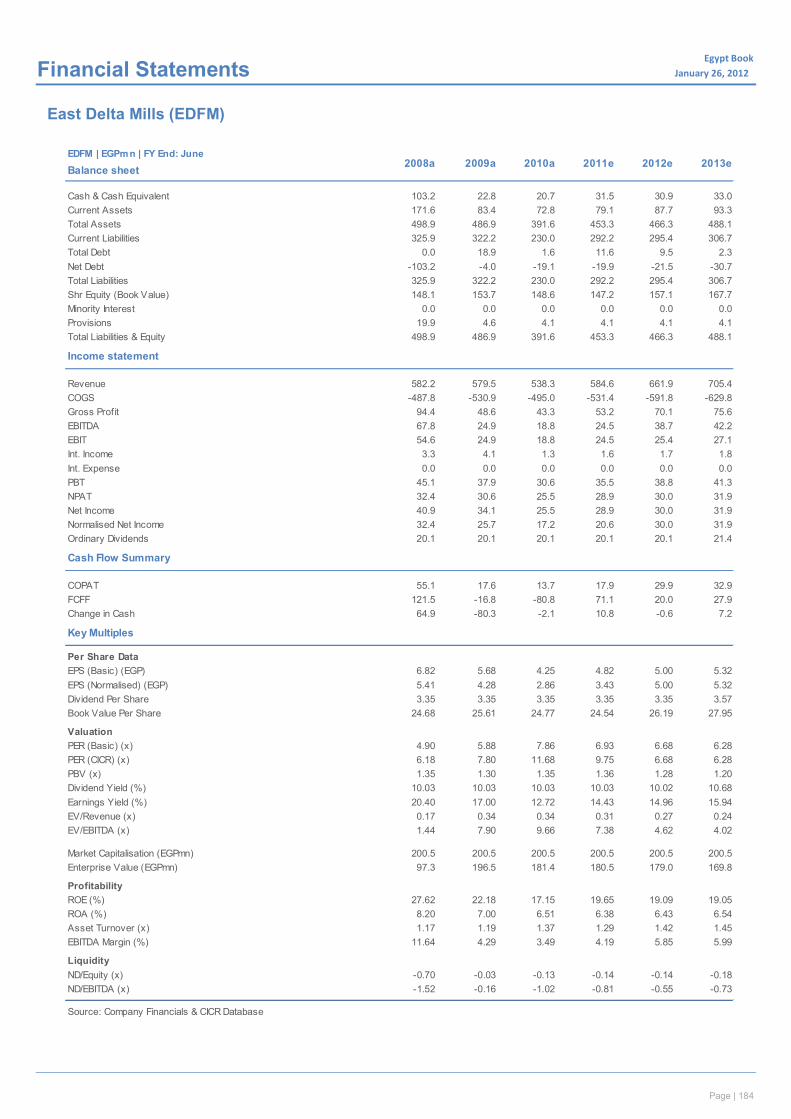
Page | 184
Egypt Book January 26, 2012x Financial Statements
East Delta Mills (EDFM)
EDFM | EGPmn | FY End: June
Balance sheet
Cash & Cash Equivalent 103.2 22.8 20.7 31.5 30.9 33.0Current Assets 171.6 83.4 72.8 79.1 87.7 93.3Total Assets 498.9 486.9 391.6 453.3 466.3 488.1Current Liabilities 325.9 322.2 230.0 292.2 295.4 306.7Total Debt 0.0 18.9 1.6 11.6 9.5 2.3Net Debt -103.2 -4.0 -19.1 -19.9 -21.5 -30.7Total Liabilities 325.9 322.2 230.0 292.2 295.4 306.7Shr Equity (Book Value) 148.1 153.7 148.6 147.2 157.1 167.7Minority Interest 0.0 0.0 0.0 0.0 0.0 0.0Provisions 19.9 4.6 4.1 4.1 4.1 4.1Total Liabilities & Equity 498.9 486.9 391.6 453.3 466.3 488.1
Income statement
Revenue 582.2 579.5 538.3 584.6 661.9 705.4COGS -487.8 -530.9 -495.0 -531.4 -591.8 -629.8Gross Profit 94.4 48.6 43.3 53.2 70.1 75.6EBITDA 67.8 24.9 18.8 24.5 38.7 42.2EBIT 54.6 24.9 18.8 24.5 25.4 27.1Int. Income 3.3 4.1 1.3 1.6 1.7 1.8Int. Expense 0.0 0.0 0.0 0.0 0.0 0.0PBT 45.1 37.9 30.6 35.5 38.8 41.3NPAT 32.4 30.6 25.5 28.9 30.0 31.9Net Income 40.9 34.1 25.5 28.9 30.0 31.9Normalised Net Income 32.4 25.7 17.2 20.6 30.0 31.9Ordinary Dividends 20.1 20.1 20.1 20.1 20.1 21.4
Cash Flow Summary
COPAT 55.1 17.6 13.7 17.9 29.9 32.9FCFF 121.5 -16.8 -80.8 71.1 20.0 27.9Change in Cash 64.9 -80.3 -2.1 10.8 -0.6 7.2
Key Multiples
Per Share DataEPS (Basic) (EGP) 6.82 5.68 4.25 4.82 5.00 5.32EPS (Normalised) (EGP) 5.41 4.28 2.86 3.43 5.00 5.32Dividend Per Share 3.35 3.35 3.35 3.35 3.35 3.57Book Value Per Share 24.68 25.61 24.77 24.54 26.19 27.95
ValuationPER (Basic) (x) 4.90 5.88 7.86 6.93 6.68 6.28PER (CICR) (x) 6.18 7.80 11.68 9.75 6.68 6.28PBV (x) 1.35 1.30 1.35 1.36 1.28 1.20Dividend Yield (%) 10.03 10.03 10.03 10.03 10.02 10.68Earnings Yield (%) 20.40 17.00 12.72 14.43 14.96 15.94EV/Revenue (x) 0.17 0.34 0.34 0.31 0.27 0.24EV/EBITDA (x) 1.44 7.90 9.66 7.38 4.62 4.02
Market Capitalisation (EGPmn) 200.5 200.5 200.5 200.5 200.5 200.5Enterprise Value (EGPmn) 97.3 196.5 181.4 180.5 179.0 169.8
ProfitabilityROE (%) 27.62 22.18 17.15 19.65 19.09 19.05ROA (%) 8.20 7.00 6.51 6.38 6.43 6.54Asset Turnover (x) 1.17 1.19 1.37 1.29 1.42 1.45EBITDA Margin (%) 11.64 4.29 3.49 4.19 5.85 5.99
LiquidityND/Equity (x) -0.70 -0.03 -0.13 -0.14 -0.14 -0.18ND/EBITDA (x) -1.52 -0.16 -1.02 -0.81 -0.55 -0.73
Source: Company Financials & CICR Database
2008a 2009a 2010a 2011e 2012e 2013e

Page | 185
Egypt Book 2011/12 | Consumer Staples
For more information on CICR, please visit our website at http://research.cicr.com.eg/register.php or contact us at [email protected]. Disclosures and details pertaining to stock ratings on last page.
January 26, 2012
A knack for fine flour and a decent yield Second largest player in fine flour production with a market share of 25% in
FY10/11.
Dividend yield of 9.1% in FY10/11, above sector average of 8.4%.
Flat c.10% share of subsidized flour production over the last two years.
North Cairo Mills [MILS] is the second-largest player in the production of fine flour, having held a 25% market share in FY10/11 vs. 19% a year ago. MILS also enjoys a flat 10% share of subsidized flour production over the last two years. The firm had a decent dividend yield of 9.1% in FY10/11 (on its AGM date)- above the sector average of 8.4%, and currently trades on a forward FY11/12 PER of 5x, below the sector’s 5.4x average, and its PER average of 7.7x in FY09/10 and FY10/11. Our DCF model yielded an LTFV of EGP17.5/share, and set our target price to match. All considered, we assigned a Hold recommendation on the stock with a Low Risk rating.
2011 Review
MILS’s FY10/11 earnings increased 40% YoY to EGP25.2mn, 37% (EGP9mn) of which consisted of sundry income, which itself increased YoY by 22%. Revenues were up 8% YoY to EGP399.3mn. Though EBITDA margin increased by 1.2pp YoY from 5% to 6.2% on a 2.8pp improvement in gross profit margin, which was partially offset by 1.6pp increase in SG&A/sales. MILS’s volumes of crushed wheat to produce subsidized flour decreased 1% YoY to 500,600 tons in FY10/11, while its volumes of crushed wheat to produce fine flour reported an increase of 39% reaching 72,900 tons in the same period. MILS distributed a DPS of EGP1.65, implying a payout ratio of 70% in FY10/11, implying a dividend yield of 9.1% - above the sector’s 8.4% average.
2012 Preview
We forecast MILS’s net income to increase YoY by 30% to EGP32.7mn. We assigned MILS a 22% share of the fine-flour market over the coming five years while we maintain a c.10% market share for subsidized flour during the same period. On a different note, we expect the company’s revenues to grow 25% YoY to EGP500.4mn. Finally, we expect the company to increase its DPS YoY by 5% to EGP1.73 vs. EGP1.65 a year ago.
Valuation & Recommendation: Our DCF model yielded an LTFV of EGP17.5/share, and we set out target price to match it. MILS currently trades on a FY11/12 PER of 5x, below the sector’s 5.4x average. All considered, we assigned a Hold recommendation on the stock with a Low Risk rating.
Ahmed Abdel Ghani [email protected]
Mirette Mohamed Ghozzi [email protected]
Mills Hold
TP - EGP 17.5 | 16.7% Upside
North Cairo Mills
Stock Details As at: 21-Jan-12
CICR Rating/RiskTarget Price/LTFV (EGP)
Last Price (EGP)52 Week High52 Week Low6M Av. Daily Vol. (000' shrs)% Chg: M oM / 6M / YoY
No. o f Shares (mn)M kt. Cap (EGPmn)M kt. Cap (USDmn)*Free Float (%)Paid in Capital (EGPmn)
Reuters / B loombergISIN
GDR DataLast Price52 Week High52 Week Low
Company Profile
Ow nership StructureHolding Company fo r Food Industries 51.0%Free Float 39.5%Employees Association 5.6%M isr Insurance Company 2.3%Others 1.6%
Source: B loomberg / CICR *USD:EGP FX: 6.04
North Cairo M ills [M ILS] was established in 1967 as a jointstock company operating under Law No. 203. The companyspecializes in the production of flour, bread and macaroni.M ILS operates 13 mills with a to tal annual productioncapacity o f 1.2mn tons. A ll these mills specialise in theproduction of subsidised flour (82%-extraction) with theexception of one, which specialises in fine flour (72%-extraction) production. M ILS also operates bakeries and amacaroni facto ry.
The company ho lds a market share of 11%in the productionof subsidized flour (82%-extraction) and was the fourthmarket player in the production of flour (72%-extraction),with a strong market share of 18% in FY08/09. M ILS has anauthorized capital of EGP150mn and an issued and paid-incapital o f EGP107mn distributed over 10.7mn shares at a par value EGP10/share.
20.9814.31
10.70
9.07
M ILS.CA / M ILS Ey Equity
26.57
-5.8 / -24.1 / -21
107.00
160.50
No GDR availablen/a
39.50
EGS30361C017
n/a
17.5 / 17.5
15.00
Hold/Low
-
0.1
0.2
0.3
0.4
0.5
0.6
-
5.0
10.0
15.0
20.0
25.0
Jan-11 Mar-11 May-11 Jul-11 Sep-11 Nov-11
mn shrsCurr.Volume MILSEGX 30 (rebased)
52 week Share Performance
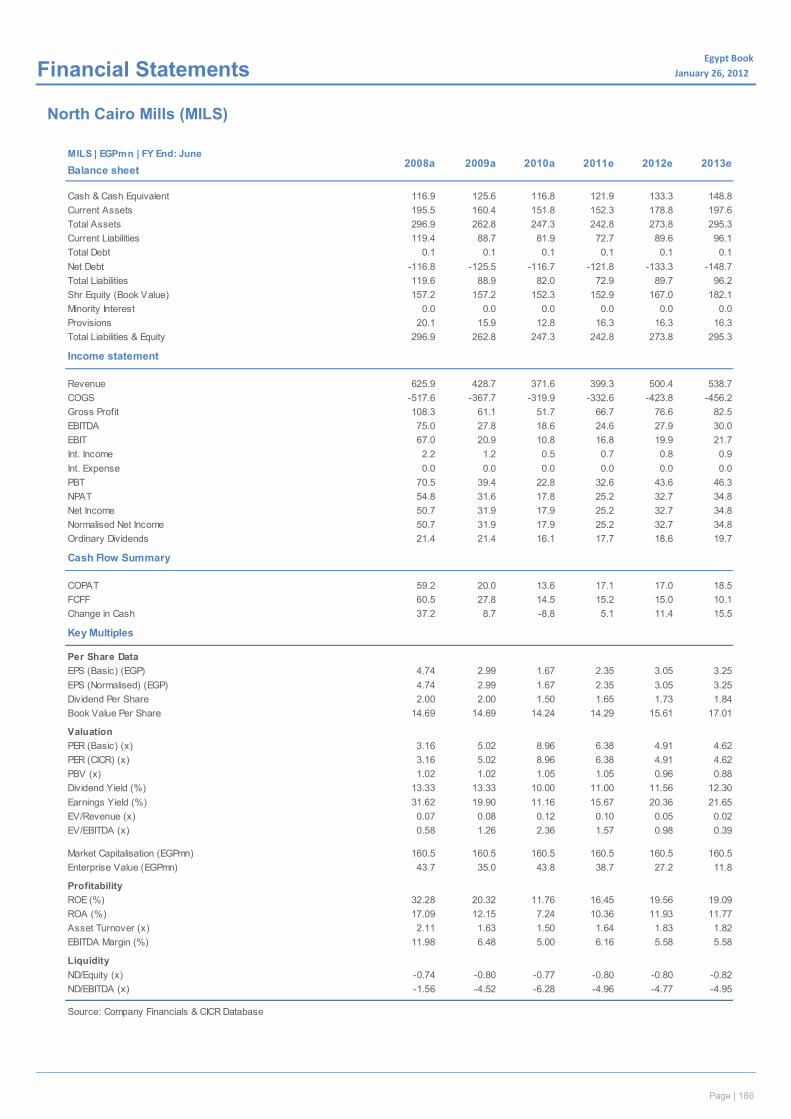
Page | 186
Egypt Book January 26, 2012x Financial Statements
North Cairo Mills (MILS)
MILS | EGPmn | FY End: June
Balance sheet
Cash & Cash Equivalent 116.9 125.6 116.8 121.9 133.3 148.8Current Assets 195.5 160.4 151.8 152.3 178.8 197.6Total Assets 296.9 262.8 247.3 242.8 273.8 295.3Current Liabilities 119.4 88.7 81.9 72.7 89.6 96.1Total Debt 0.1 0.1 0.1 0.1 0.1 0.1Net Debt -116.8 -125.5 -116.7 -121.8 -133.3 -148.7Total Liabilities 119.6 88.9 82.0 72.9 89.7 96.2Shr Equity (Book Value) 157.2 157.2 152.3 152.9 167.0 182.1Minority Interest 0.0 0.0 0.0 0.0 0.0 0.0Provisions 20.1 15.9 12.8 16.3 16.3 16.3Total Liabilities & Equity 296.9 262.8 247.3 242.8 273.8 295.3
Income statement
Revenue 625.9 428.7 371.6 399.3 500.4 538.7COGS -517.6 -367.7 -319.9 -332.6 -423.8 -456.2Gross Profit 108.3 61.1 51.7 66.7 76.6 82.5EBITDA 75.0 27.8 18.6 24.6 27.9 30.0EBIT 67.0 20.9 10.8 16.8 19.9 21.7Int. Income 2.2 1.2 0.5 0.7 0.8 0.9Int. Expense 0.0 0.0 0.0 0.0 0.0 0.0PBT 70.5 39.4 22.8 32.6 43.6 46.3NPAT 54.8 31.6 17.8 25.2 32.7 34.8Net Income 50.7 31.9 17.9 25.2 32.7 34.8Normalised Net Income 50.7 31.9 17.9 25.2 32.7 34.8Ordinary Dividends 21.4 21.4 16.1 17.7 18.6 19.7
Cash Flow Summary
COPAT 59.2 20.0 13.6 17.1 17.0 18.5FCFF 60.5 27.8 14.5 15.2 15.0 10.1Change in Cash 37.2 8.7 -8.8 5.1 11.4 15.5
Key Multiples
Per Share DataEPS (Basic) (EGP) 4.74 2.99 1.67 2.35 3.05 3.25EPS (Normalised) (EGP) 4.74 2.99 1.67 2.35 3.05 3.25Dividend Per Share 2.00 2.00 1.50 1.65 1.73 1.84Book Value Per Share 14.69 14.69 14.24 14.29 15.61 17.01
ValuationPER (Basic) (x) 3.16 5.02 8.96 6.38 4.91 4.62PER (CICR) (x) 3.16 5.02 8.96 6.38 4.91 4.62PBV (x) 1.02 1.02 1.05 1.05 0.96 0.88Dividend Yield (%) 13.33 13.33 10.00 11.00 11.56 12.30Earnings Yield (%) 31.62 19.90 11.16 15.67 20.36 21.65EV/Revenue (x) 0.07 0.08 0.12 0.10 0.05 0.02EV/EBITDA (x) 0.58 1.26 2.36 1.57 0.98 0.39
Market Capitalisation (EGPmn) 160.5 160.5 160.5 160.5 160.5 160.5Enterprise Value (EGPmn) 43.7 35.0 43.8 38.7 27.2 11.8
ProfitabilityROE (%) 32.28 20.32 11.76 16.45 19.56 19.09ROA (%) 17.09 12.15 7.24 10.36 11.93 11.77Asset Turnover (x) 2.11 1.63 1.50 1.64 1.83 1.82EBITDA Margin (%) 11.98 6.48 5.00 6.16 5.58 5.58
LiquidityND/Equity (x) -0.74 -0.80 -0.77 -0.80 -0.80 -0.82ND/EBITDA (x) -1.56 -4.52 -6.28 -4.96 -4.77 -4.95
Source: Company Financials & CICR Database
2008a 2009a 2010a 2011e 2012e 2013e

Page | 187
Egypt Book 2011/12 | Consumer Staples
For more information on CICR, please visit our website at http://research.cicr.com.eg/register.php or contact us at [email protected]. Disclosures and details pertaining to stock ratings on last page.
January 26, 2012
Cash-rich, yet inefficient operations Smallest player in subsidized flour production; 7% market share in FY10/11
Inefficient operational performance realizing losses in last two years
Low dividend yield stock of 5.5% in FY10/11 below sector average of 8.4%
South Cairo & Giza Mills [SCFM] is the smallest player in the production of subsidized flour, with a market share of 7% in FY10/11. The company has seen losses in its operations over the last two years, and we expect it to record a negative net operating profit after tax (NOPAT) during our forecast period from FY11/12 to FY15/16. However, SCFM enjoys a decent cash balance of EGP67.3mn (after reducing a total dividend of EGP4.1mn from the company’s cash balance as of September 30, 2011), representing 97% of the company’s market cap, reversing the company’s negative corporate value to a positive shareholders’ value of EGP25.5mn. SCFM’s dividend yield was 5.5% in FY10/11 – below the 8.4% sector average, while the stock currently trades at a high FY11/12 PER of 13.4x, above the sector’s 5.4x average.
2011 Review SCFM remained the smallest player in subsidized flour production, with a market share of 7% in FY10/11, and did not crush any wheat to produce fine flour during the year. And while the company showed a net profit of EGP2.3mn in FY10/11 in contrast to a net loss of EGP3.6mn a year ago, it continues to see losses in its operations, generating a negative EBITDA margin of 2% in FY10/11, compared to a negative EBITDA margin of 5.1% a year ago. SCFM maintained its DPS at EGP1.35/share in FY10/11, distributed from its FY10/11 earnings in addition to reserves recording a payout ratio of 173%. This implies a dividend yield of 5.5%, still below the sector average of 8.4%.
2012 Preview
We expect SCFM to remain the smallest producer of subsidized flour, with its crushed wheat for subsidized flour expected to grow by 10% YoY to 413,000 tons of wheat vs. 377,000 tons a year ago. However, due to the company’s large fluctuations in EBITDA margin, we took a conservative approach in our forecast, as we expect SCFM to nearly break even in its operational performance. This will generate nil EBITDA margin in FY11/12, compared to a negative EBITDA margin of 2% and 5.1% in FY10/11 and FY09/10, respectively, and a positive EBITDA margin of 1.3% in FY08/09. We expect SCFM to generate profits from non-operational items, mainly interest income of EGP5.4mn and sundry income of EGP9.9mn, resulting in a bottom line of EGP5.2mn in FY11/12. We took into account SCFM’ capex plan of EGP20mn in FY11/12, mainly directed toward the capacity expansion of a mill.
Valuation & Recommendation: Our DCF model yielded an LTFV of EGP10.1/share, and we set our target price to match it. SCFM trades on a forward FY11/12 PER of 13.4x (vs. the sector average of 5.4x). All considered, we assigned a Sell recommendation on the stock with a Moderate Risk Rating.
Ahmed Abdel Ghani [email protected]
Mirette Mohamed Ghozzi [email protected]
Mills Sell
TP - EGP 10.1 | 56.6% Downside
South Cairo & Giza Mills
Stock Details As at: 21-Jan-12
CICR Rating/RiskTarget Price/LTFV (EGP)
Last Price (EGP)52 Week High52 Week Low6M Av. Daily Vol. (000' shrs)% Chg: M oM / 6M / YoY
No. o f Shares (mn)M kt. Cap (EGPmn)M kt. Cap (USDmn)*Free Float (%)Paid in Capital (EGPmn)
Reuters / B loombergISIN
GDR DataLast Price52 Week High52 Week Low
Company Profile
Ow nership StructureHolding Company fo r Food Industries 51.0%M r. M ahmoud A li Abou Seif 10.3%Employee Association 10.0%Others 0.2%Free Float 28.5%
Source: B loomberg / CICR *USD:EGP FX: 6.04
South Cairo & Giza M ills [SCFM ] was established in 1965under Presidential Decree No. 2472/1965, fo r the purpose of manufacturing, importing, transporting and distributing flour,cereals and their related products. According to PrimeM inister’ s Decree No. 4313/1999, SCFM became asubsidiary o f the Holding Company for Food Industries,operating under Law No. 203/1991.
SCFM operates 11mills with an annual production capacityo f 680k tons in addition to 4 bakeries. The company held amarket share of 8% in the production of both subsidizedflour fine flour in FY08/09 and has an authorized and paid-incapital o f EGP30mn, distributed over 3mn shares at a parvalue o f EGP10/share.
35.0022.11
3.00
0.86
SCFM .CA / SCFM Ey Equity
11.56
-3.2 / -21.2 / -31.7
30.00
69.84
No GDR availablen/a
38.63
EGS30411C010
n/a
10.1 / 10.1
23.28
Sell/M oderate
-0.0 0.0 0.0 0.0 0.1 0.1 0.1 0.1
-5.0
10.0 15.0 20.0 25.0 30.0 35.0 40.0
Jan-11 Mar-11 May-11 Jul-11 Sep-11 Nov-11
mn shrsCurr.Volume SCFMEGX 30 (rebased)
52 week Share Performance
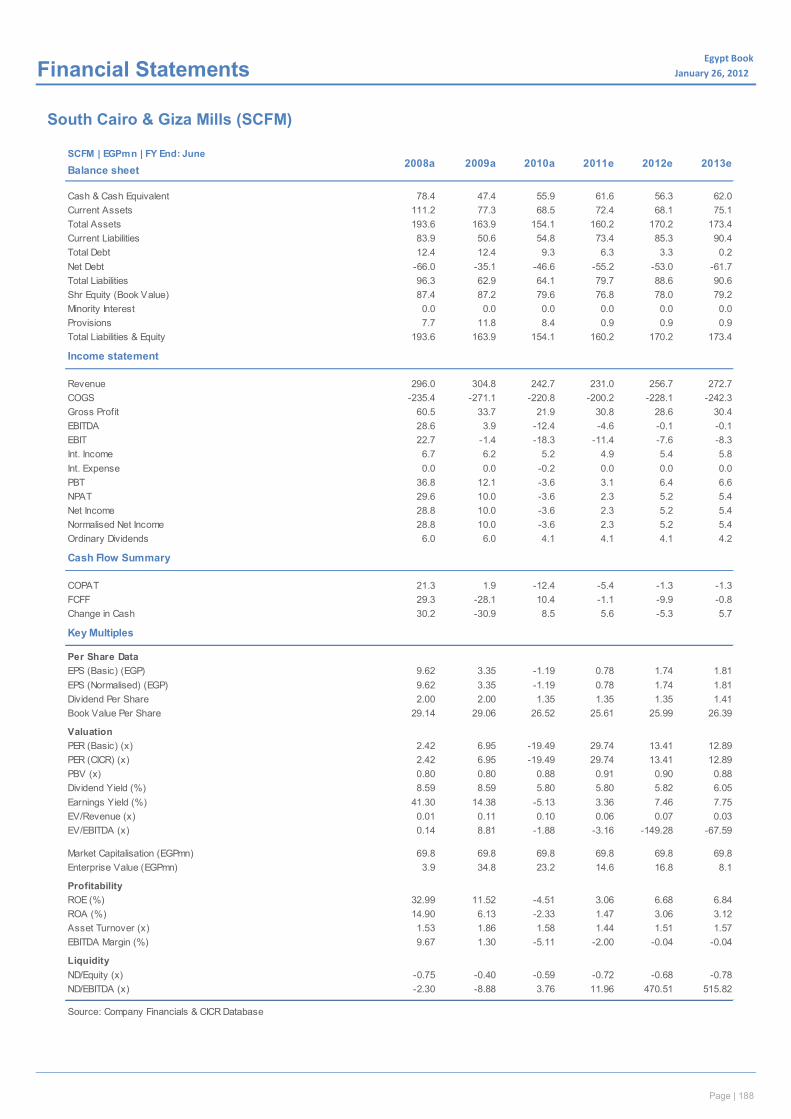
Page | 188
Egypt Book January 26, 2012x Financial Statements
South Cairo & Giza Mills (SCFM)
cSCFM | EGPmn | FY End: June
Balance sheet
Cash & Cash Equivalent 78.4 47.4 55.9 61.6 56.3 62.0Current Assets 111.2 77.3 68.5 72.4 68.1 75.1Total Assets 193.6 163.9 154.1 160.2 170.2 173.4Current Liabilities 83.9 50.6 54.8 73.4 85.3 90.4Total Debt 12.4 12.4 9.3 6.3 3.3 0.2Net Debt -66.0 -35.1 -46.6 -55.2 -53.0 -61.7Total Liabilities 96.3 62.9 64.1 79.7 88.6 90.6Shr Equity (Book Value) 87.4 87.2 79.6 76.8 78.0 79.2Minority Interest 0.0 0.0 0.0 0.0 0.0 0.0Provisions 7.7 11.8 8.4 0.9 0.9 0.9Total Liabilities & Equity 193.6 163.9 154.1 160.2 170.2 173.4
Income statement
Revenue 296.0 304.8 242.7 231.0 256.7 272.7COGS -235.4 -271.1 -220.8 -200.2 -228.1 -242.3Gross Profit 60.5 33.7 21.9 30.8 28.6 30.4EBITDA 28.6 3.9 -12.4 -4.6 -0.1 -0.1EBIT 22.7 -1.4 -18.3 -11.4 -7.6 -8.3Int. Income 6.7 6.2 5.2 4.9 5.4 5.8Int. Expense 0.0 0.0 -0.2 0.0 0.0 0.0PBT 36.8 12.1 -3.6 3.1 6.4 6.6NPAT 29.6 10.0 -3.6 2.3 5.2 5.4Net Income 28.8 10.0 -3.6 2.3 5.2 5.4Normalised Net Income 28.8 10.0 -3.6 2.3 5.2 5.4Ordinary Dividends 6.0 6.0 4.1 4.1 4.1 4.2
Cash Flow Summary
COPAT 21.3 1.9 -12.4 -5.4 -1.3 -1.3FCFF 29.3 -28.1 10.4 -1.1 -9.9 -0.8Change in Cash 30.2 -30.9 8.5 5.6 -5.3 5.7
Key Multiples
Per Share DataEPS (Basic) (EGP) 9.62 3.35 -1.19 0.78 1.74 1.81EPS (Normalised) (EGP) 9.62 3.35 -1.19 0.78 1.74 1.81Dividend Per Share 2.00 2.00 1.35 1.35 1.35 1.41Book Value Per Share 29.14 29.06 26.52 25.61 25.99 26.39
ValuationPER (Basic) (x) 2.42 6.95 -19.49 29.74 13.41 12.89PER (CICR) (x) 2.42 6.95 -19.49 29.74 13.41 12.89PBV (x) 0.80 0.80 0.88 0.91 0.90 0.88Dividend Yield (%) 8.59 8.59 5.80 5.80 5.82 6.05Earnings Yield (%) 41.30 14.38 -5.13 3.36 7.46 7.75EV/Revenue (x) 0.01 0.11 0.10 0.06 0.07 0.03EV/EBITDA (x) 0.14 8.81 -1.88 -3.16 -149.28 -67.59
Market Capitalisation (EGPmn) 69.8 69.8 69.8 69.8 69.8 69.8Enterprise Value (EGPmn) 3.9 34.8 23.2 14.6 16.8 8.1
ProfitabilityROE (%) 32.99 11.52 -4.51 3.06 6.68 6.84ROA (%) 14.90 6.13 -2.33 1.47 3.06 3.12Asset Turnover (x) 1.53 1.86 1.58 1.44 1.51 1.57EBITDA Margin (%) 9.67 1.30 -5.11 -2.00 -0.04 -0.04
LiquidityND/Equity (x) -0.75 -0.40 -0.59 -0.72 -0.68 -0.78ND/EBITDA (x) -2.30 -8.88 3.76 11.96 470.51 515.82
Source: Company Financials & CICR Database
2008a 2009a 2010a 2011e 2012e 2013e
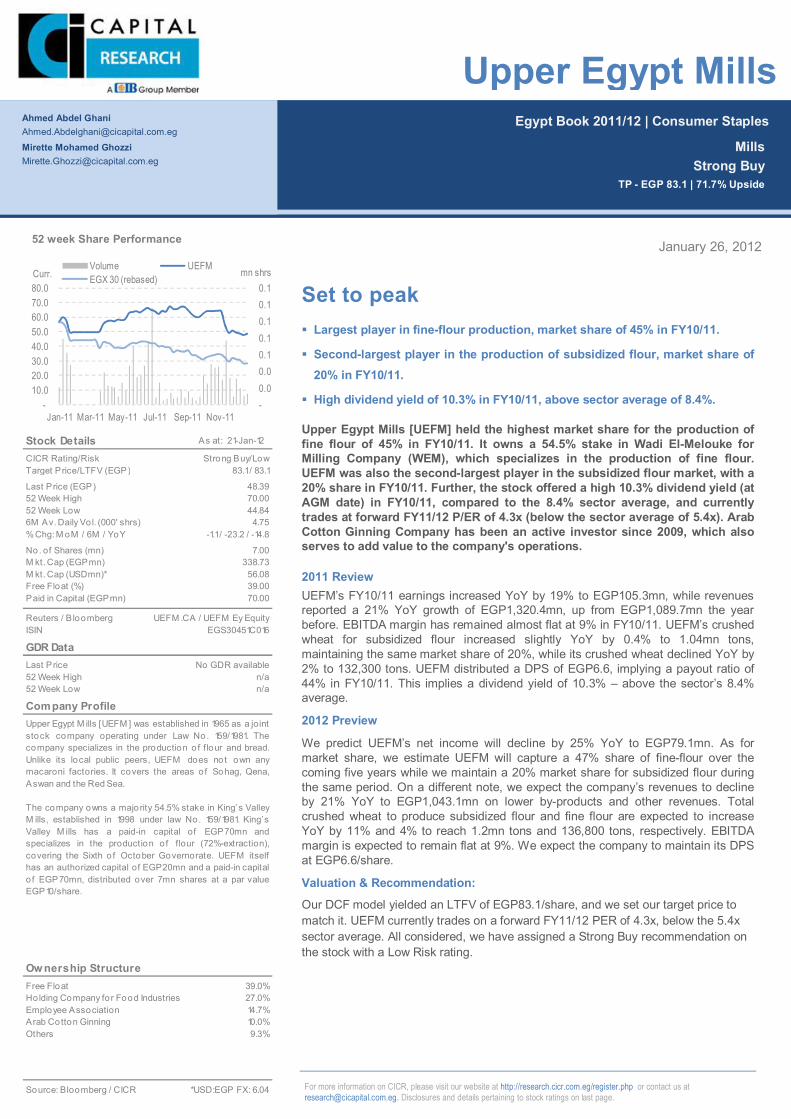
Page | 189
Egypt Book 2011/12 | Consumer Staples
For more information on CICR, please visit our website at http://research.cicr.com.eg/register.php or contact us at [email protected]. Disclosures and details pertaining to stock ratings on last page.
January 26, 2012
Set to peak Largest player in fine-flour production, market share of 45% in FY10/11.
Second-largest player in the production of subsidized flour, market share of 20% in FY10/11.
High dividend yield of 10.3% in FY10/11, above sector average of 8.4%.
Upper Egypt Mills [UEFM] held the highest market share for the production of fine flour of 45% in FY10/11. It owns a 54.5% stake in Wadi El-Melouke for Milling Company (WEM), which specializes in the production of fine flour. UEFM was also the second-largest player in the subsidized flour market, with a 20% share in FY10/11. Further, the stock offered a high 10.3% dividend yield (at AGM date) in FY10/11, compared to the 8.4% sector average, and currently trades at forward FY11/12 P/ER of 4.3x (below the sector average of 5.4x). Arab Cotton Ginning Company has been an active investor since 2009, which also serves to add value to the company's operations.
2011 Review UEFM’s FY10/11 earnings increased YoY by 19% to EGP105.3mn, while revenues reported a 21% YoY growth of EGP1,320.4mn, up from EGP1,089.7mn the year before. EBITDA margin has remained almost flat at 9% in FY10/11. UEFM’s crushed wheat for subsidized flour increased slightly YoY by 0.4% to 1.04mn tons, maintaining the same market share of 20%, while its crushed wheat declined YoY by 2% to 132,300 tons. UEFM distributed a DPS of EGP6.6, implying a payout ratio of 44% in FY10/11. This implies a dividend yield of 10.3% – above the sector’s 8.4% average.
2012 Preview
We predict UEFM’s net income will decline by 25% YoY to EGP79.1mn. As for market share, we estimate UEFM will capture a 47% share of fine-flour over the coming five years while we maintain a 20% market share for subsidized flour during the same period. On a different note, we expect the company’s revenues to decline by 21% YoY to EGP1,043.1mn on lower by-products and other revenues. Total crushed wheat to produce subsidized flour and fine flour are expected to increase YoY by 11% and 4% to reach 1.2mn tons and 136,800 tons, respectively. EBITDA margin is expected to remain flat at 9%. We expect the company to maintain its DPS at EGP6.6/share.
Valuation & Recommendation:
Our DCF model yielded an LTFV of EGP83.1/share, and we set our target price to match it. UEFM currently trades on a forward FY11/12 PER of 4.3x, below the 5.4x sector average. All considered, we have assigned a Strong Buy recommendation on the stock with a Low Risk rating.
Ahmed Abdel Ghani [email protected]
Mirette Mohamed Ghozzi [email protected]
Mills Strong Buy
TP - EGP 83.1 | 71.7% Upside
Upper Egypt Mills
Stock Details As at: 21-Jan-12
CICR Rating/RiskTarget Price/LTFV (EGP)
Last Price (EGP)52 Week High52 Week Low6M Av. Daily Vo l. (000' shrs)% Chg: M oM / 6M / YoY
No. of Shares (mn)M kt. Cap (EGPmn)M kt. Cap (USDmn)*Free Float (%)Paid in Capital (EGPmn)
Reuters / B loombergISIN
GDR DataLast Price52 Week High52 Week Low
Company Profile
Ow nership StructureFree Float 39.0%Holding Company fo r Food Industries 27.0%Employee Association 14.7%Arab Cotton Ginning 10.0%Others 9.3%
Source: Bloomberg / CICR *USD:EGP FX: 6.04
Upper Egypt M ills [UEFM ] was established in 1965 as a jointstock company operating under Law No. 159/1981. Thecompany specializes in the production of flour and bread.Unlike its local public peers, UEFM does not own anymacaroni factories. It covers the areas of Sohag, Qena,Aswan and the Red Sea.
The company owns a majority 54.5% stake in King’ s ValleyM ills, established in 1998 under law No. 159/1981. King’sValley M ills has a paid-in capital of EGP70mn andspecializes in the production of flour (72%-extraction),covering the Sixth o f October Governorate. UEFM itselfhas an authorized capital of EGP20mn and a paid-in capitalo f EGP70mn, distributed over 7mn shares at a par valueEGP10/share.
70.0044.84
7.00
4.75
UEFM .CA / UEFM Ey Equity
56.08
-1.1 / -23.2 / -14.8
70.00
338.73
No GDR availablen/a
39.00
EGS30451C016
n/a
83.1 / 83.1
48.39
Strong Buy/Low
-0.0 0.0 0.1 0.1 0.1 0.1 0.1
-10.0 20.0 30.0 40.0 50.0 60.0 70.0 80.0
Jan-11 Mar-11 May-11 Jul-11 Sep-11 Nov-11
mn shrsCurr.Volume UEFMEGX 30 (rebased)
52 week Share Performance
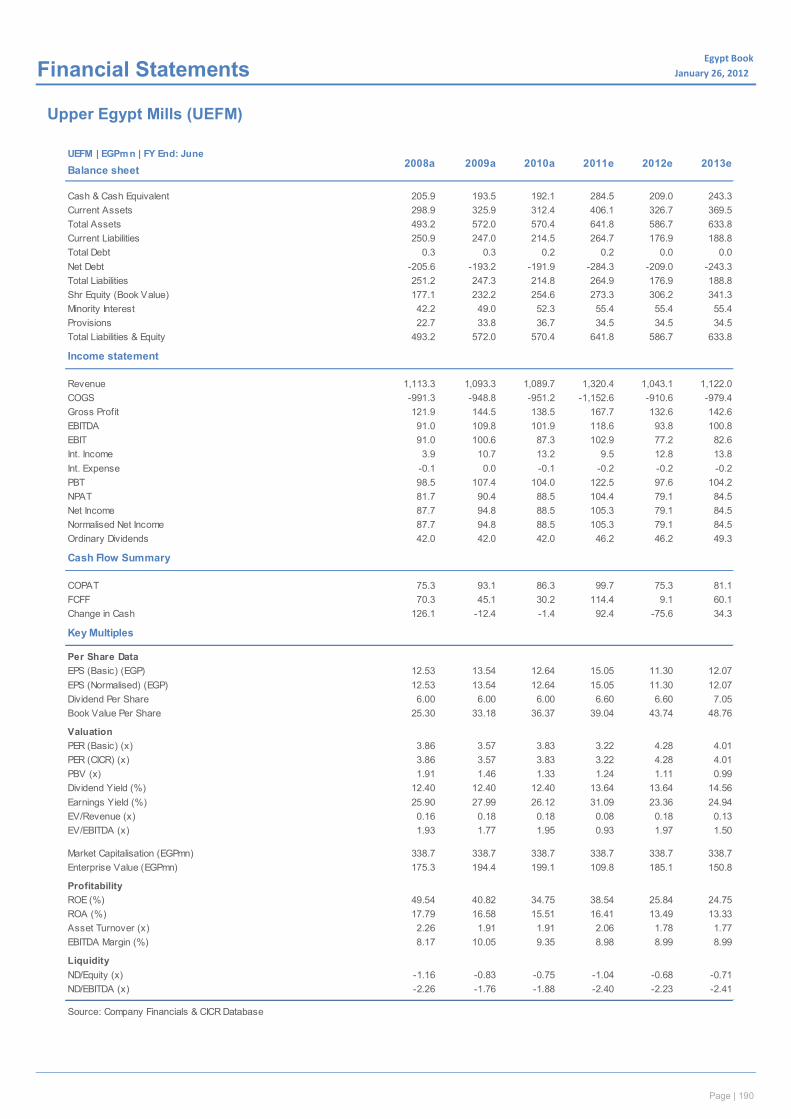
Page | 190
Egypt Book January 26, 2012x Financial Statements
Upper Egypt Mills (UEFM)
cUEFM | EGPmn | FY End: June
Balance sheet
Cash & Cash Equivalent 205.9 193.5 192.1 284.5 209.0 243.3Current Assets 298.9 325.9 312.4 406.1 326.7 369.5Total Assets 493.2 572.0 570.4 641.8 586.7 633.8Current Liabilities 250.9 247.0 214.5 264.7 176.9 188.8Total Debt 0.3 0.3 0.2 0.2 0.0 0.0Net Debt -205.6 -193.2 -191.9 -284.3 -209.0 -243.3Total Liabilities 251.2 247.3 214.8 264.9 176.9 188.8Shr Equity (Book Value) 177.1 232.2 254.6 273.3 306.2 341.3Minority Interest 42.2 49.0 52.3 55.4 55.4 55.4Provisions 22.7 33.8 36.7 34.5 34.5 34.5Total Liabilities & Equity 493.2 572.0 570.4 641.8 586.7 633.8
Income statement
Revenue 1,113.3 1,093.3 1,089.7 1,320.4 1,043.1 1,122.0COGS -991.3 -948.8 -951.2 -1,152.6 -910.6 -979.4Gross Profit 121.9 144.5 138.5 167.7 132.6 142.6EBITDA 91.0 109.8 101.9 118.6 93.8 100.8EBIT 91.0 100.6 87.3 102.9 77.2 82.6Int. Income 3.9 10.7 13.2 9.5 12.8 13.8Int. Expense -0.1 0.0 -0.1 -0.2 -0.2 -0.2PBT 98.5 107.4 104.0 122.5 97.6 104.2NPAT 81.7 90.4 88.5 104.4 79.1 84.5Net Income 87.7 94.8 88.5 105.3 79.1 84.5Normalised Net Income 87.7 94.8 88.5 105.3 79.1 84.5Ordinary Dividends 42.0 42.0 42.0 46.2 46.2 49.3
Cash Flow Summary
COPAT 75.3 93.1 86.3 99.7 75.3 81.1FCFF 70.3 45.1 30.2 114.4 9.1 60.1Change in Cash 126.1 -12.4 -1.4 92.4 -75.6 34.3
Key Multiples
Per Share DataEPS (Basic) (EGP) 12.53 13.54 12.64 15.05 11.30 12.07EPS (Normalised) (EGP) 12.53 13.54 12.64 15.05 11.30 12.07Dividend Per Share 6.00 6.00 6.00 6.60 6.60 7.05Book Value Per Share 25.30 33.18 36.37 39.04 43.74 48.76
ValuationPER (Basic) (x) 3.86 3.57 3.83 3.22 4.28 4.01PER (CICR) (x) 3.86 3.57 3.83 3.22 4.28 4.01PBV (x) 1.91 1.46 1.33 1.24 1.11 0.99Dividend Yield (%) 12.40 12.40 12.40 13.64 13.64 14.56Earnings Yield (%) 25.90 27.99 26.12 31.09 23.36 24.94EV/Revenue (x) 0.16 0.18 0.18 0.08 0.18 0.13EV/EBITDA (x) 1.93 1.77 1.95 0.93 1.97 1.50
Market Capitalisation (EGPmn) 338.7 338.7 338.7 338.7 338.7 338.7Enterprise Value (EGPmn) 175.3 194.4 199.1 109.8 185.1 150.8
ProfitabilityROE (%) 49.54 40.82 34.75 38.54 25.84 24.75ROA (%) 17.79 16.58 15.51 16.41 13.49 13.33Asset Turnover (x) 2.26 1.91 1.91 2.06 1.78 1.77EBITDA Margin (%) 8.17 10.05 9.35 8.98 8.99 8.99
LiquidityND/Equity (x) -1.16 -0.83 -0.75 -1.04 -0.68 -0.71ND/EBITDA (x) -2.26 -1.76 -1.88 -2.40 -2.23 -2.41
Source: Company Financials & CICR Database
2008a 2009a 2010a 2011e 2012e 2013e

Page | 191
Egypt Book 2011/12 | Consumer Staples
For more information on CICR, please visit our website at http://research.cicr.com.eg/register.php or contact us at [email protected]. Disclosures and details pertaining to stock ratings on last page.
January 26, 2012
Low multiples + high dividend yield = value Largest player in subsidized flour production with a market share of 26% in
FY10/11
Low FY11/12 PER multiple of 4.1x, below sector average of 5.4x
Highest dividend yield stock of 11.7% in FY10/11 above sector average of 8.4%
Middle & West Delta Mills [WCDF] is the largest player in the production of subsidized flour. It held a 26% market share in FY10/11. The stock offered a high 11.7% dividend yield in FY10/11- significantly above the sector’s 8.4% average, and an average dividend yield of 10.1% over the past three years. The company trades at a forward FY11/12 PER of 4.3x, well below the sector’s 5.4x average.
2011 Review
WCDF’s FY10/11 earnings increased 4% YoY to EGP54.9mn. Despite higher costs incurred by public-sector milling companies, WCDF (the largest public-sector player in subsidized flour production) managed to improve its EBITDA margin to 8.1% in FY10/11 vs. 7.1% a year ago. However, the improvement in operational performace was partially hit by a provision amounting to EGP11.1mn vs. EGP6.2mn a year ago. WCDF increased its DPS by 28% YoY to EGP5/share in FY10/11 vs. EGP3.9/share a year ago, marking the highest dividend yield of 11.7% compared to a sector average of 8.4%. This implies a payout ratio of 68%.
2012 Preview We forecast WCDF’s net income to grow 16% YoY to EGP63.6mn in FY11/12. On the operational level, the firm’s volume of crushed wheat to produce subsidized flour is expected to increase by 10% to 1.5mn tons. The growth in earnings is expected to be the result of a provisions decline to EGP7.4mn, compared to EGP11.1mn a year ago.
Valuation & Recommendation: Our DCF model yielded an LTFV of EGP46.9/share, and we set our target price to match it. WCDF trades at a low FY11/12 PER of 4.3x, below the 5.4x sector average. This implies 29% upside potential from its market price of EGP36.3/share. Hence, we assigned a Buy recommendation on the stock with a Low Risk rating.
Ahmed Abdel Ghani [email protected]
Mirette Mohamed Ghozzi [email protected]
Mills Buy
TP - EGP 46.9 | 30.2%Upside
Middle & West Delta Mills
Stock Details As at: 21-Jan-12
CICR Rating/RiskTarget Price/LTFV (EGP)
Last Price (EGP)52 Week High52 Week Low6M Av. Daily Vo l. (000' shrs)% Chg: M oM / 6M / YoY
No. of Shares (mn)M kt. Cap (EGPmn)M kt. Cap (USDmn)*Free Float (%)Paid in Capital (EGPmn)
Reuters / B loombergISIN
GDR DataLast Price52 Week High52 Week Low
Company Profile
Ow nership StructureFree Float 36.5%Holding Company fo r Food Industries 27.0%M r. M ohemd Al-Feky 11.6%Employee Association 10.0%M s. Fatma Nasr. 6.8%Others 8.1%
Source: Bloomberg / CICR *USD:EGP FX: 6.04
M iddle & West Delta M ills [WCDF] was established in 1967and is operating under Law No.159/1981. The companyspecializes in the production of flour, bread andmacaroni.WCDF operates 12 mills with a combined annualproduction capacity o f 1.5mn tons, in addition to bakeriesand a macaroni factory.
The company is the market leader among the public sectorfo r the production of subsidized flour, with a market shareof 24% as of FY08/09. It is the second largest producer offine flour, with a market share of 22%. WCDF has anauthorized capital o f EGP200mn and an issued and paid-incapital o f EGP75mn distributed over 7.5mn shares at a parvalue EGP10/share.
47.0028.20
7.50
4.00
WCDF.CA / WCDF Ey Equity
44.71
-1 / -15.2 / 4.3
75.00
270.08
No GDR availablen/a
36.50
EGS30421C019
n/a
46.9 / 46.9
36.01
Buy/Low
-
0.1
0.1
0.2
0.2
0.3
-
10.0
20.0
30.0
40.0
50.0
Jan-11 Mar-11 May-11 Jul-11 Sep-11 Nov-11
mn shrsCurr.Volume WCDFEGX 30 (rebased)
52 week Share Performance
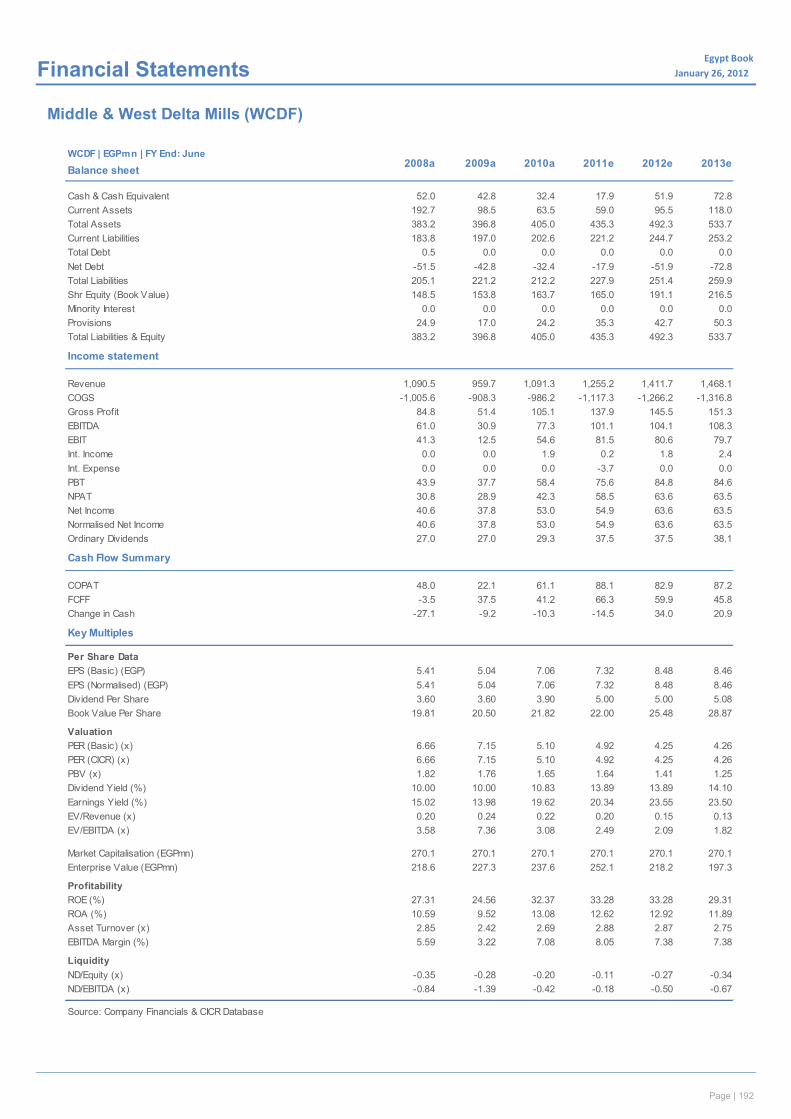
Page | 192
Egypt Book January 26, 2012x Financial Statements
Middle & West Delta Mills (WCDF)
cWCDF | EGPmn | FY End: June
Balance sheet
Cash & Cash Equivalent 52.0 42.8 32.4 17.9 51.9 72.8Current Assets 192.7 98.5 63.5 59.0 95.5 118.0Total Assets 383.2 396.8 405.0 435.3 492.3 533.7Current Liabilities 183.8 197.0 202.6 221.2 244.7 253.2Total Debt 0.5 0.0 0.0 0.0 0.0 0.0Net Debt -51.5 -42.8 -32.4 -17.9 -51.9 -72.8Total Liabilities 205.1 221.2 212.2 227.9 251.4 259.9Shr Equity (Book Value) 148.5 153.8 163.7 165.0 191.1 216.5Minority Interest 0.0 0.0 0.0 0.0 0.0 0.0Provisions 24.9 17.0 24.2 35.3 42.7 50.3Total Liabilities & Equity 383.2 396.8 405.0 435.3 492.3 533.7
Income statement
Revenue 1,090.5 959.7 1,091.3 1,255.2 1,411.7 1,468.1COGS -1,005.6 -908.3 -986.2 -1,117.3 -1,266.2 -1,316.8Gross Profit 84.8 51.4 105.1 137.9 145.5 151.3EBITDA 61.0 30.9 77.3 101.1 104.1 108.3EBIT 41.3 12.5 54.6 81.5 80.6 79.7Int. Income 0.0 0.0 1.9 0.2 1.8 2.4Int. Expense 0.0 0.0 0.0 -3.7 0.0 0.0PBT 43.9 37.7 58.4 75.6 84.8 84.6NPAT 30.8 28.9 42.3 58.5 63.6 63.5Net Income 40.6 37.8 53.0 54.9 63.6 63.5Normalised Net Income 40.6 37.8 53.0 54.9 63.6 63.5Ordinary Dividends 27.0 27.0 29.3 37.5 37.5 38.1
Cash Flow Summary
COPAT 48.0 22.1 61.1 88.1 82.9 87.2FCFF -3.5 37.5 41.2 66.3 59.9 45.8Change in Cash -27.1 -9.2 -10.3 -14.5 34.0 20.9
Key Multiples
Per Share DataEPS (Basic) (EGP) 5.41 5.04 7.06 7.32 8.48 8.46EPS (Normalised) (EGP) 5.41 5.04 7.06 7.32 8.48 8.46Dividend Per Share 3.60 3.60 3.90 5.00 5.00 5.08Book Value Per Share 19.81 20.50 21.82 22.00 25.48 28.87
ValuationPER (Basic) (x) 6.66 7.15 5.10 4.92 4.25 4.26PER (CICR) (x) 6.66 7.15 5.10 4.92 4.25 4.26PBV (x) 1.82 1.76 1.65 1.64 1.41 1.25Dividend Yield (%) 10.00 10.00 10.83 13.89 13.89 14.10Earnings Yield (%) 15.02 13.98 19.62 20.34 23.55 23.50EV/Revenue (x) 0.20 0.24 0.22 0.20 0.15 0.13EV/EBITDA (x) 3.58 7.36 3.08 2.49 2.09 1.82
Market Capitalisation (EGPmn) 270.1 270.1 270.1 270.1 270.1 270.1Enterprise Value (EGPmn) 218.6 227.3 237.6 252.1 218.2 197.3
ProfitabilityROE (%) 27.31 24.56 32.37 33.28 33.28 29.31ROA (%) 10.59 9.52 13.08 12.62 12.92 11.89Asset Turnover (x) 2.85 2.42 2.69 2.88 2.87 2.75EBITDA Margin (%) 5.59 3.22 7.08 8.05 7.38 7.38
LiquidityND/Equity (x) -0.35 -0.28 -0.20 -0.11 -0.27 -0.34ND/EBITDA (x) -0.84 -1.39 -0.42 -0.18 -0.50 -0.67
Source: Company Financials & CICR Database
2008a 2009a 2010a 2011e 2012e 2013e
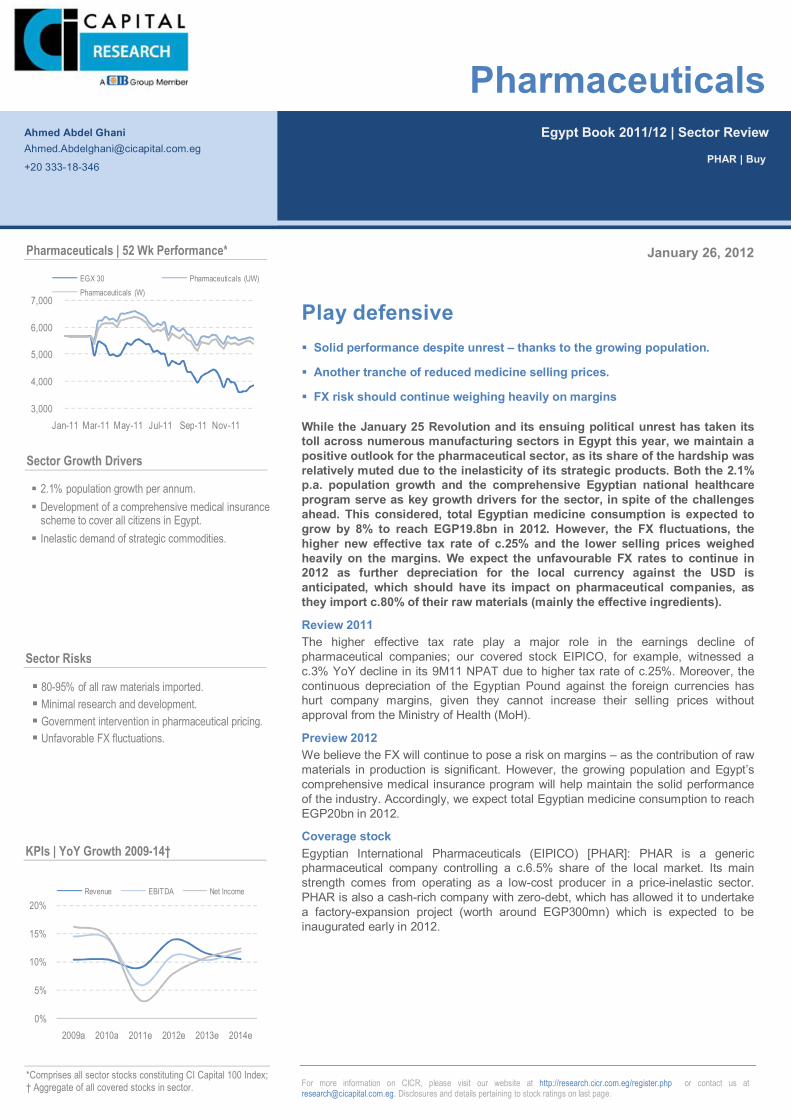
Page | 193
Page | 193
For more information on CICR, please visit our website at http://research.cicr.com.eg/register.php or contact us at [email protected]. Disclosures and details pertaining to stock ratings on last page.
January 26, 2012
Play defensive Solid performance despite unrest – thanks to the growing population.
Another tranche of reduced medicine selling prices.
FX risk should continue weighing heavily on margins
While the January 25 Revolution and its ensuing political unrest has taken its toll across numerous manufacturing sectors in Egypt this year, we maintain a positive outlook for the pharmaceutical sector, as its share of the hardship was relatively muted due to the inelasticity of its strategic products. Both the 2.1% p.a. population growth and the comprehensive Egyptian national healthcare program serve as key growth drivers for the sector, in spite of the challenges ahead. This considered, total Egyptian medicine consumption is expected to grow by 8% to reach EGP19.8bn in 2012. However, the FX fluctuations, the higher new effective tax rate of c.25% and the lower selling prices weighed heavily on the margins. We expect the unfavourable FX rates to continue in 2012 as further depreciation for the local currency against the USD is anticipated, which should have its impact on pharmaceutical companies, as they import c.80% of their raw materials (mainly the effective ingredients).
Review 2011 The higher effective tax rate play a major role in the earnings decline of pharmaceutical companies; our covered stock EIPICO, for example, witnessed a c.3% YoY decline in its 9M11 NPAT due to higher tax rate of c.25%. Moreover, the continuous depreciation of the Egyptian Pound against the foreign currencies has hurt company margins, given they cannot increase their selling prices without approval from the Ministry of Health (MoH).
Preview 2012 We believe the FX will continue to pose a risk on margins – as the contribution of raw materials in production is significant. However, the growing population and Egypt’s comprehensive medical insurance program will help maintain the solid performance of the industry. Accordingly, we expect total Egyptian medicine consumption to reach EGP20bn in 2012.
Coverage stock Egyptian International Pharmaceuticals (EIPICO) [PHAR]: PHAR is a generic pharmaceutical company controlling a c.6.5% share of the local market. Its main strength comes from operating as a low-cost producer in a price-inelastic sector. PHAR is also a cash-rich company with zero-debt, which has allowed it to undertake a factory-expansion project (worth around EGP300mn) which is expected to be inaugurated early in 2012.
Egypt Book 2011/12 | Sector Review
Pharmaceuticals
PHAR | Buy
Ahmed Abdel Ghani [email protected]
+20 333-18-346
2.1% population growth per annum. Development of a comprehensive medical insurance
scheme to cover all citizens in Egypt. Inelastic demand of strategic commodities.
80-95% of all raw materials imported. Minimal research and development. Government intervention in pharmaceutical pricing. Unfavorable FX fluctuations.
Pharmaceuticals | 52 Wk Performance*
3,000
4,000
5,000
6,000
7,000
Jan-11 Mar-11 May-11 Jul-11 Sep-11 Nov-11
EGX 30 Pharmaceuticals (UW)Pharmaceuticals (W)
Sector Growth Drivers
Sector Risks
0%
5%
10%
15%
20%
2009a 2010a 2011e 2012e 2013e 2014e
Revenue EBITDA Net Income
KPIs | YoY Growth 2009-14†
*Comprises all sector stocks constituting CI Capital 100 Index; † Aggregate of all covered stocks in sector.
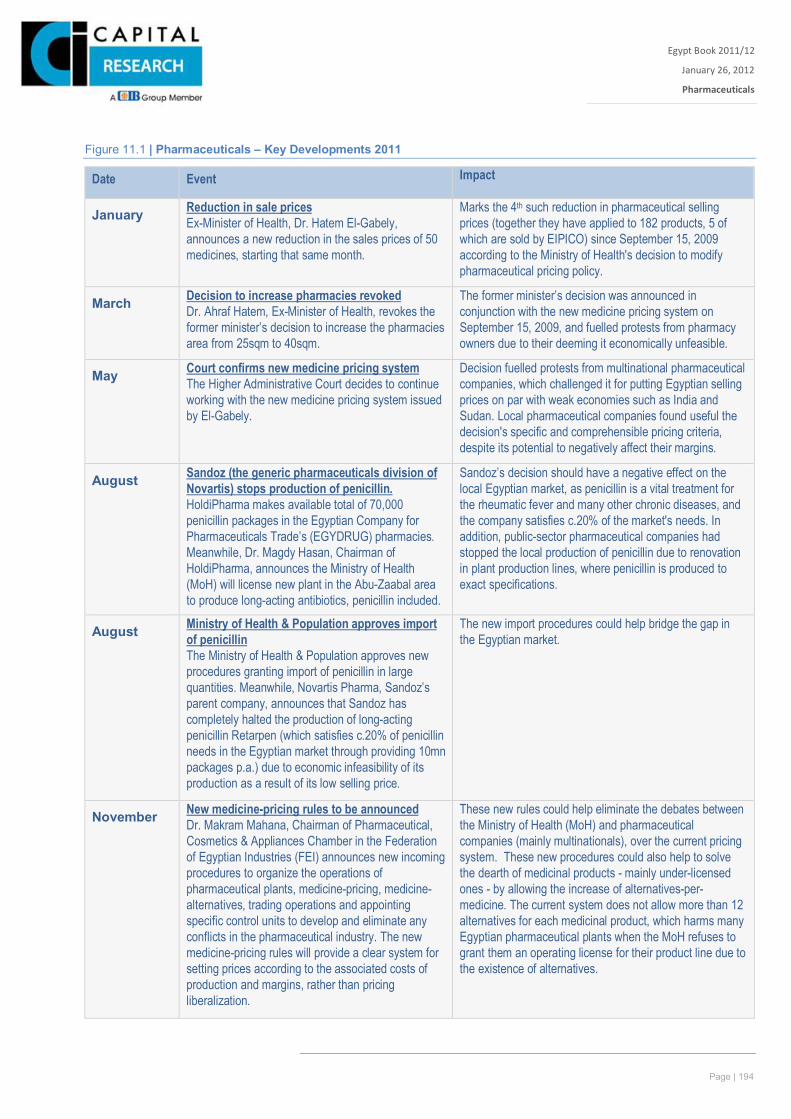
Page | 194
Egypt Book 2011/12
January 26, 2012
Pharmaceuticals
Xxx
Figure 11.1 | Pharmaceuticals – Key Developments 2011
Date Event Impact
January Reduction in sale prices Ex-Minister of Health, Dr. Hatem El-Gabely, announces a new reduction in the sales prices of 50 medicines, starting that same month.
Marks the 4th such reduction in pharmaceutical selling prices (together they have applied to 182 products, 5 of which are sold by EIPICO) since September 15, 2009 according to the Ministry of Health's decision to modify pharmaceutical pricing policy.
March Decision to increase pharmacies revoked Dr. Ahraf Hatem, Ex-Minister of Health, revokes the former minister’s decision to increase the pharmacies area from 25sqm to 40sqm.
The former minister’s decision was announced in conjunction with the new medicine pricing system on September 15, 2009, and fuelled protests from pharmacy owners due to their deeming it economically unfeasible.
May Court confirms new medicine pricing system The Higher Administrative Court decides to continue working with the new medicine pricing system issued by El-Gabely.
Decision fuelled protests from multinational pharmaceutical companies, which challenged it for putting Egyptian selling prices on par with weak economies such as India and Sudan. Local pharmaceutical companies found useful the decision's specific and comprehensible pricing criteria, despite its potential to negatively affect their margins.
August Sandoz (the generic pharmaceuticals division of Novartis) stops production of penicillin. HoldiPharma makes available total of 70,000 penicillin packages in the Egyptian Company for Pharmaceuticals Trade’s (EGYDRUG) pharmacies. Meanwhile, Dr. Magdy Hasan, Chairman of HoldiPharma, announces the Ministry of Health (MoH) will license new plant in the Abu-Zaabal area to produce long-acting antibiotics, penicillin included.
Sandoz’s decision should have a negative effect on the local Egyptian market, as penicillin is a vital treatment for the rheumatic fever and many other chronic diseases, and the company satisfies c.20% of the market's needs. In addition, public-sector pharmaceutical companies had stopped the local production of penicillin due to renovation in plant production lines, where penicillin is produced to exact specifications.
August Ministry of Health & Population approves import of penicillin The Ministry of Health & Population approves new procedures granting import of penicillin in large quantities. Meanwhile, Novartis Pharma, Sandoz’s parent company, announces that Sandoz has completely halted the production of long-acting penicillin Retarpen (which satisfies c.20% of penicillin needs in the Egyptian market through providing 10mn packages p.a.) due to economic infeasibility of its production as a result of its low selling price.
The new import procedures could help bridge the gap in the Egyptian market.
November New medicine-pricing rules to be announced Dr. Makram Mahana, Chairman of Pharmaceutical, Cosmetics & Appliances Chamber in the Federation of Egyptian Industries (FEI) announces new incoming procedures to organize the operations of pharmaceutical plants, medicine-pricing, medicine-alternatives, trading operations and appointing specific control units to develop and eliminate any conflicts in the pharmaceutical industry. The new medicine-pricing rules will provide a clear system for setting prices according to the associated costs of production and margins, rather than pricing liberalization.
These new rules could help eliminate the debates between the Ministry of Health (MoH) and pharmaceutical companies (mainly multinationals), over the current pricing system. These new procedures could also help to solve the dearth of medicinal products - mainly under-licensed ones - by allowing the increase of alternatives-per-medicine. The current system does not allow more than 12 alternatives for each medicinal product, which harms many Egyptian pharmaceutical plants when the MoH refuses to grant them an operating license for their product line due to the existence of alternatives.
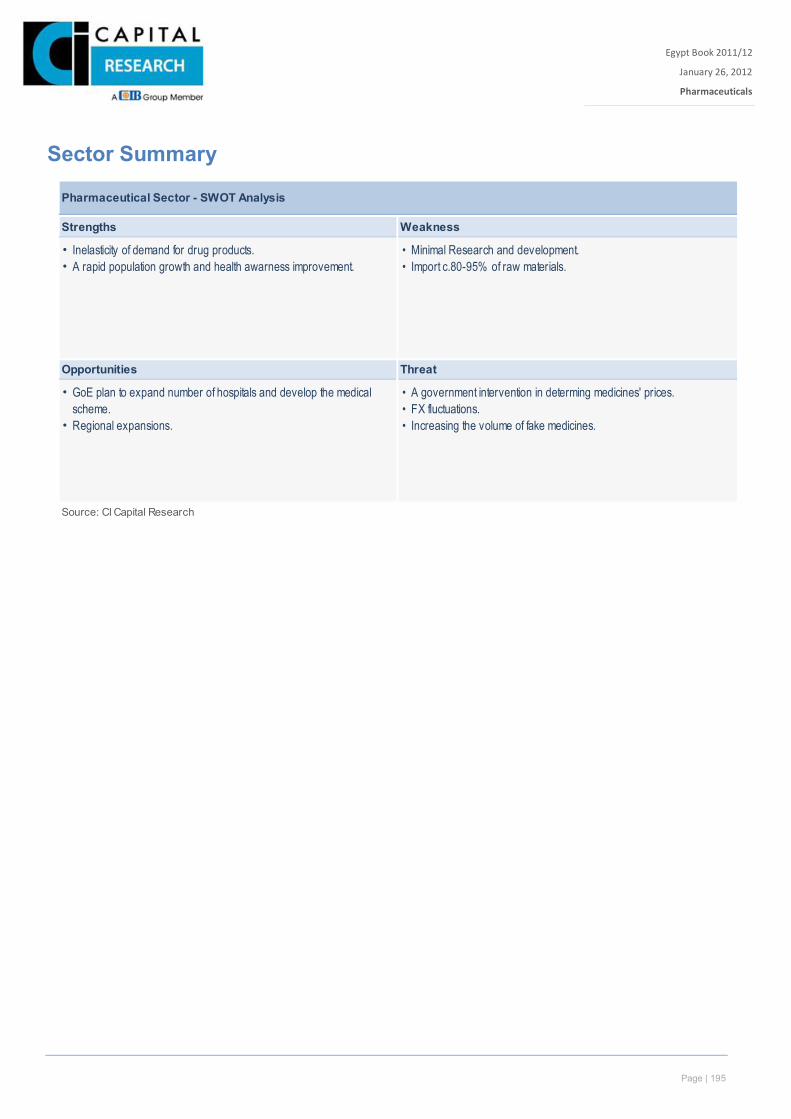
Page | 195
Egypt Book 2011/12
January 26, 2012
Pharmaceuticals
Xxx
Sector Summary
Pharmaceutical Sector - SWOT Analysis
Strengths Weakness
• Inelasticity of demand for drug products. • Minimal Research and development.• A rapid population growth and health awarness improvement. • Import c.80-95% of raw materials.
Opportunities Threat
• GoE plan to expand number of hospitals and develop the medical • A government intervention in determing medicines' prices.scheme. • FX fluctuations.
• Regional expansions. • Increasing the volume of fake medicines.
Source: CI Capital Research
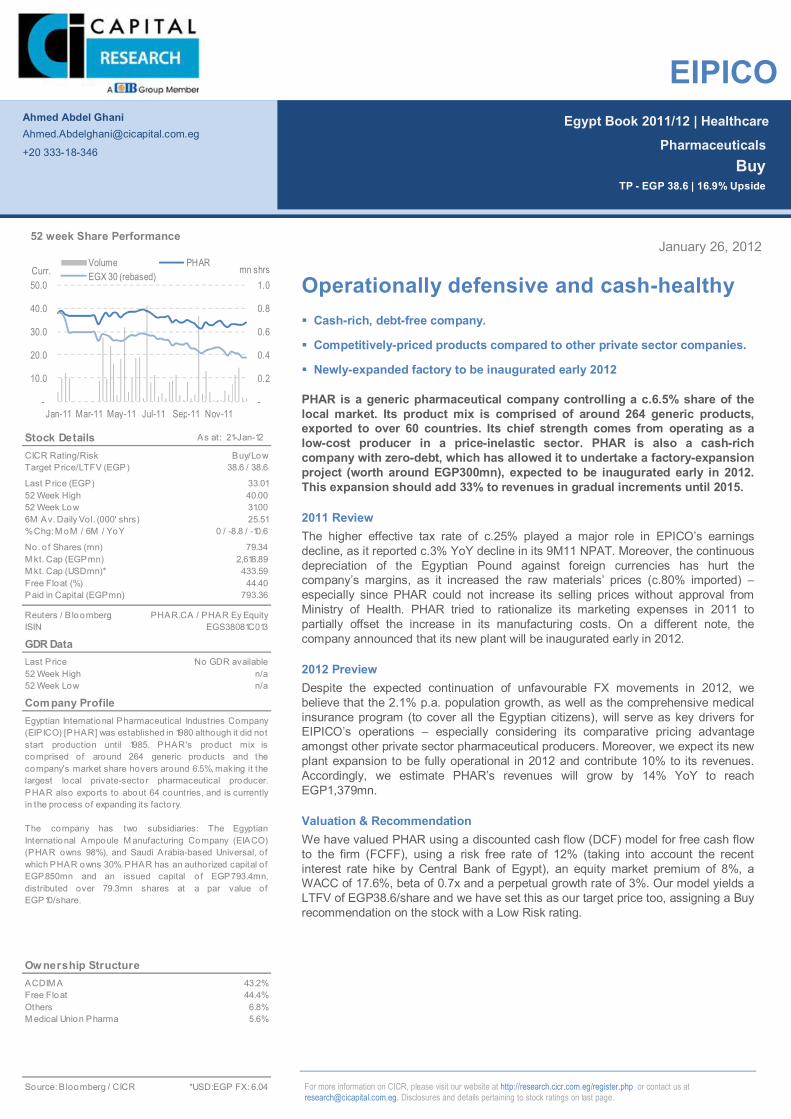
Page | 197
Egypt Book 2011/12 | Healthcare
For more information on CICR, please visit our website at http://research.cicr.com.eg/register.php or contact us at [email protected]. Disclosures and details pertaining to stock ratings on last page.
January 26, 2012
Operationally defensive and cash-healthy Cash-rich, debt-free company.
Competitively-priced products compared to other private sector companies.
Newly-expanded factory to be inaugurated early 2012
PHAR is a generic pharmaceutical company controlling a c.6.5% share of the local market. Its product mix is comprised of around 264 generic products, exported to over 60 countries. Its chief strength comes from operating as a low-cost producer in a price-inelastic sector. PHAR is also a cash-rich company with zero-debt, which has allowed it to undertake a factory-expansion project (worth around EGP300mn), expected to be inaugurated early in 2012. This expansion should add 33% to revenues in gradual increments until 2015.
2011 Review The higher effective tax rate of c.25% played a major role in EPICO’s earnings decline, as it reported c.3% YoY decline in its 9M11 NPAT. Moreover, the continuous depreciation of the Egyptian Pound against foreign currencies has hurt the company’s margins, as it increased the raw materials’ prices (c.80% imported) – especially since PHAR could not increase its selling prices without approval from Ministry of Health. PHAR tried to rationalize its marketing expenses in 2011 to partially offset the increase in its manufacturing costs. On a different note, the company announced that its new plant will be inaugurated early in 2012.
2012 Preview Despite the expected continuation of unfavourable FX movements in 2012, we believe that the 2.1% p.a. population growth, as well as the comprehensive medical insurance program (to cover all the Egyptian citizens), will serve as key drivers for EIPICO’s operations – especially considering its comparative pricing advantage amongst other private sector pharmaceutical producers. Moreover, we expect its new plant expansion to be fully operational in 2012 and contribute 10% to its revenues. Accordingly, we estimate PHAR’s revenues will grow by 14% YoY to reach EGP1,379mn.
Valuation & Recommendation We have valued PHAR using a discounted cash flow (DCF) model for free cash flow to the firm (FCFF), using a risk free rate of 12% (taking into account the recent interest rate hike by Central Bank of Egypt), an equity market premium of 8%, a WACC of 17.6%, beta of 0.7x and a perpetual growth rate of 3%. Our model yields a LTFV of EGP38.6/share and we have set this as our target price too, assigning a Buy recommendation on the stock with a Low Risk rating.
Ahmed Abdel Ghani [email protected]
+20 333-18-346
Pharmaceuticals Buy
TP - EGP 38.6 | 16.9% Upside
EIPICO
Stock Details As at: 21-Jan-12
CICR Rating/RiskTarget Price/LTFV (EGP)
Last Price (EGP)52 Week High52 Week Low6M Av. Daily Vol. (000' shrs)% Chg: M oM / 6M / YoY
No. o f Shares (mn)M kt. Cap (EGPmn)M kt. Cap (USDmn)*Free Float (%)Paid in Capital (EGPmn)
Reuters / B loombergISIN
GDR DataLast Price52 Week High52 Week Low
Company Profile
Ow nership StructureACDIM A 43.2%Free Float 44.4%Others 6.8%M edical Union Pharma 5.6%
Source: B loomberg / CICR *USD:EGP FX: 6.04
Egyptian International Pharmaceutical Industries Company(EIPICO) [PHAR] was established in 1980 although it did not start production until 1985. PHAR's product mix iscomprised of around 264 generic products and thecompany's market share hovers around 6.5%, making it thelargest local private-sector pharmaceutical producer.PHAR also exports to about 64 countries, and is currentlyin the process of expanding its facto ry.
The company has two subsidiaries: The EgyptianInternational Ampoule M anufacturing Company (EIACO)(PHAR owns 98%), and Saudi Arabia-based Universal, ofwhich PHAR owns 30%. PHAR has an authorized capital ofEGP850mn and an issued capital o f EGP793.4mn,distributed over 79.3mn shares at a par value ofEGP10/share.
40.0031.00
79.34
25.51
PHAR.CA / PHAR Ey Equity
433.59
0 / -8.8 / -10.6
793.36
2,618.89
No GDR availablen/a
44.40
EGS38081C013
n/a
38.6 / 38.6
33.01
Buy/Low
-
0.2
0.4
0.6
0.8
1.0
-
10.0
20.0
30.0
40.0
50.0
Jan-11 Mar-11 May-11 Jul-11 Sep-11 Nov-11
mn shrsCurr.Volume PHAREGX 30 (rebased)
52 week Share Performance
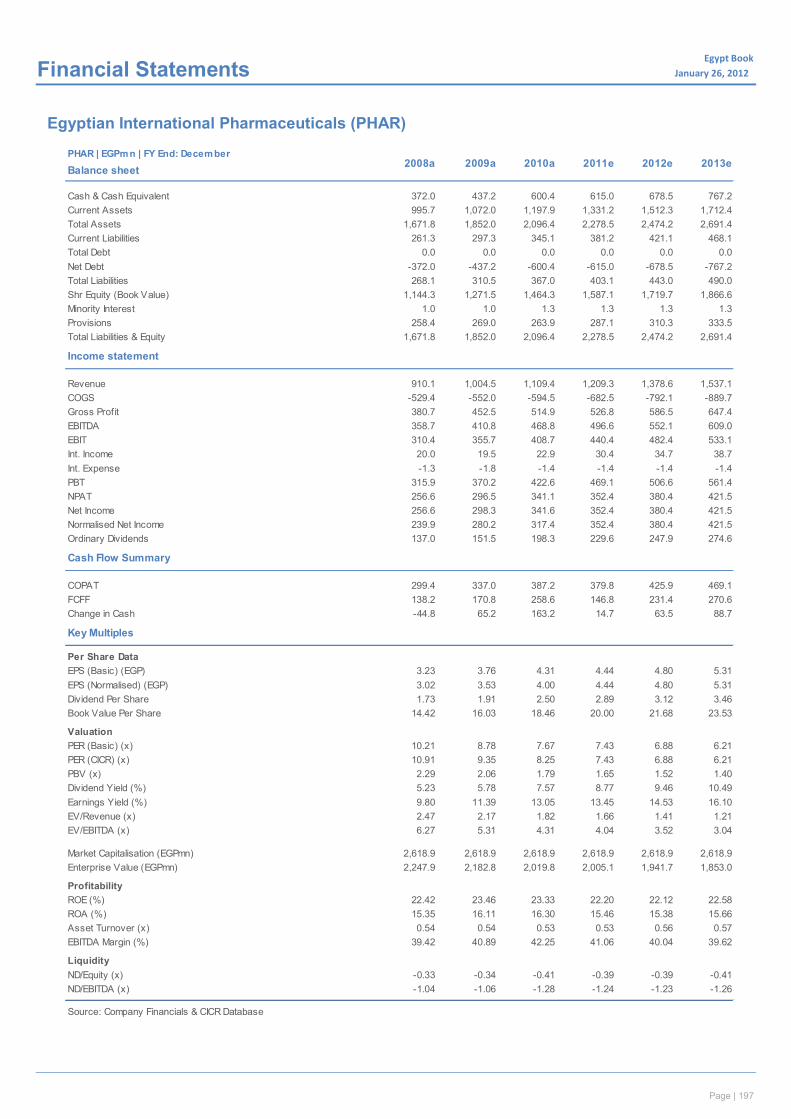
Page | 197
Egypt Book January 26, 2012x Financial Statements
Egyptian International Pharmaceuticals (PHAR)
cPHAR | EGPmn | FY End: December
Balance sheet
Cash & Cash Equivalent 372.0 437.2 600.4 615.0 678.5 767.2Current Assets 995.7 1,072.0 1,197.9 1,331.2 1,512.3 1,712.4Total Assets 1,671.8 1,852.0 2,096.4 2,278.5 2,474.2 2,691.4Current Liabilities 261.3 297.3 345.1 381.2 421.1 468.1Total Debt 0.0 0.0 0.0 0.0 0.0 0.0Net Debt -372.0 -437.2 -600.4 -615.0 -678.5 -767.2Total Liabilities 268.1 310.5 367.0 403.1 443.0 490.0Shr Equity (Book Value) 1,144.3 1,271.5 1,464.3 1,587.1 1,719.7 1,866.6Minority Interest 1.0 1.0 1.3 1.3 1.3 1.3Provisions 258.4 269.0 263.9 287.1 310.3 333.5Total Liabilities & Equity 1,671.8 1,852.0 2,096.4 2,278.5 2,474.2 2,691.4
Income statement
Revenue 910.1 1,004.5 1,109.4 1,209.3 1,378.6 1,537.1COGS -529.4 -552.0 -594.5 -682.5 -792.1 -889.7Gross Profit 380.7 452.5 514.9 526.8 586.5 647.4EBITDA 358.7 410.8 468.8 496.6 552.1 609.0EBIT 310.4 355.7 408.7 440.4 482.4 533.1Int. Income 20.0 19.5 22.9 30.4 34.7 38.7Int. Expense -1.3 -1.8 -1.4 -1.4 -1.4 -1.4PBT 315.9 370.2 422.6 469.1 506.6 561.4NPAT 256.6 296.5 341.1 352.4 380.4 421.5Net Income 256.6 298.3 341.6 352.4 380.4 421.5Normalised Net Income 239.9 280.2 317.4 352.4 380.4 421.5Ordinary Dividends 137.0 151.5 198.3 229.6 247.9 274.6
Cash Flow Summary
COPAT 299.4 337.0 387.2 379.8 425.9 469.1FCFF 138.2 170.8 258.6 146.8 231.4 270.6Change in Cash -44.8 65.2 163.2 14.7 63.5 88.7
Key Multiples
Per Share DataEPS (Basic) (EGP) 3.23 3.76 4.31 4.44 4.80 5.31EPS (Normalised) (EGP) 3.02 3.53 4.00 4.44 4.80 5.31Dividend Per Share 1.73 1.91 2.50 2.89 3.12 3.46Book Value Per Share 14.42 16.03 18.46 20.00 21.68 23.53
ValuationPER (Basic) (x) 10.21 8.78 7.67 7.43 6.88 6.21PER (CICR) (x) 10.91 9.35 8.25 7.43 6.88 6.21PBV (x) 2.29 2.06 1.79 1.65 1.52 1.40Dividend Yield (%) 5.23 5.78 7.57 8.77 9.46 10.49Earnings Yield (%) 9.80 11.39 13.05 13.45 14.53 16.10EV/Revenue (x) 2.47 2.17 1.82 1.66 1.41 1.21EV/EBITDA (x) 6.27 5.31 4.31 4.04 3.52 3.04
Market Capitalisation (EGPmn) 2,618.9 2,618.9 2,618.9 2,618.9 2,618.9 2,618.9Enterprise Value (EGPmn) 2,247.9 2,182.8 2,019.8 2,005.1 1,941.7 1,853.0
ProfitabilityROE (%) 22.42 23.46 23.33 22.20 22.12 22.58ROA (%) 15.35 16.11 16.30 15.46 15.38 15.66Asset Turnover (x) 0.54 0.54 0.53 0.53 0.56 0.57EBITDA Margin (%) 39.42 40.89 42.25 41.06 40.04 39.62
LiquidityND/Equity (x) -0.33 -0.34 -0.41 -0.39 -0.39 -0.41ND/EBITDA (x) -1.04 -1.06 -1.28 -1.24 -1.23 -1.26
Source: Company Financials & CICR Database
2008a 2009a 2010a 2011e 2012e 2013e
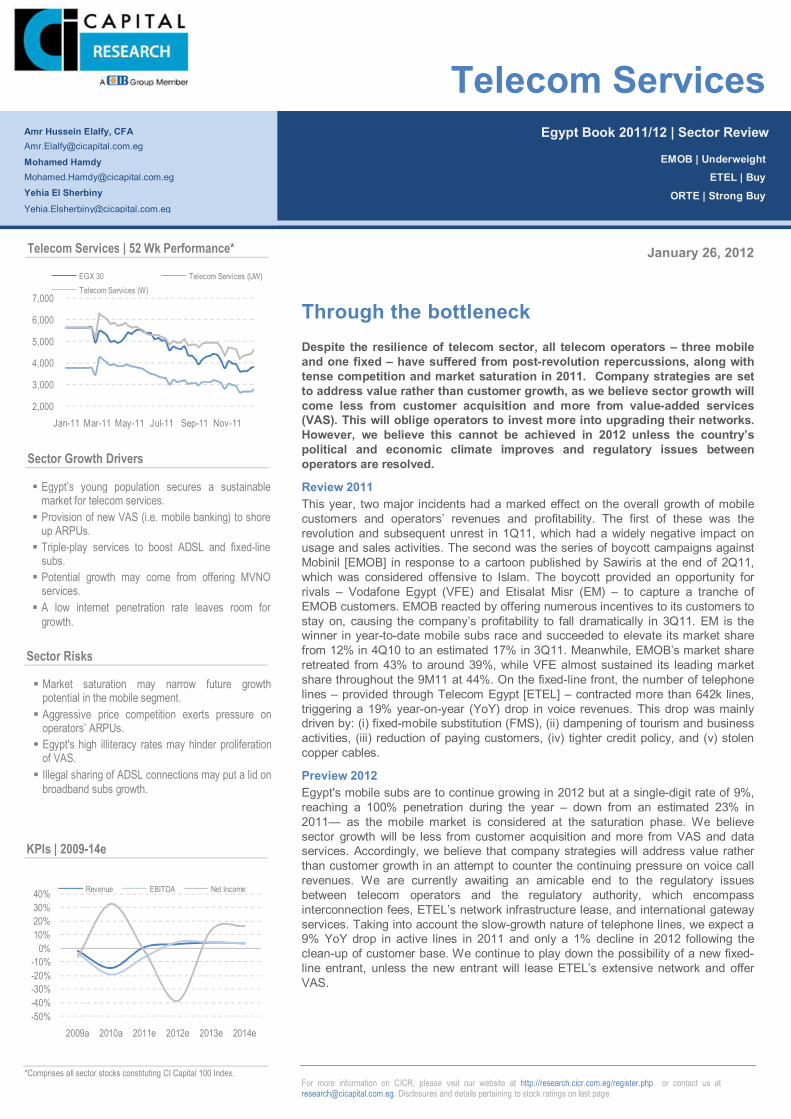
Page | 198
Page | 198
For more information on CICR, please visit our website at http://research.cicr.com.eg/register.php or contact us at [email protected]. Disclosures and details pertaining to stock ratings on last page.
January 26, 2012
Through the bottleneck Despite the resilience of telecom sector, all telecom operators – three mobile and one fixed – have suffered from post-revolution repercussions, along with tense competition and market saturation in 2011. Company strategies are set to address value rather than customer growth, as we believe sector growth will come less from customer acquisition and more from value-added services (VAS). This will oblige operators to invest more into upgrading their networks. However, we believe this cannot be achieved in 2012 unless the country’s political and economic climate improves and regulatory issues between operators are resolved.
Review 2011 This year, two major incidents had a marked effect on the overall growth of mobile customers and operators’ revenues and profitability. The first of these was the revolution and subsequent unrest in 1Q11, which had a widely negative impact on usage and sales activities. The second was the series of boycott campaigns against Mobinil [EMOB] in response to a cartoon published by Sawiris at the end of 2Q11, which was considered offensive to Islam. The boycott provided an opportunity for rivals – Vodafone Egypt (VFE) and Etisalat Misr (EM) – to capture a tranche of EMOB customers. EMOB reacted by offering numerous incentives to its customers to stay on, causing the company’s profitability to fall dramatically in 3Q11. EM is the winner in year-to-date mobile subs race and succeeded to elevate its market share from 12% in 4Q10 to an estimated 17% in 3Q11. Meanwhile, EMOB’s market share retreated from 43% to around 39%, while VFE almost sustained its leading market share throughout the 9M11 at 44%. On the fixed-line front, the number of telephone lines – provided through Telecom Egypt [ETEL] – contracted more than 642k lines, triggering a 19% year-on-year (YoY) drop in voice revenues. This drop was mainly driven by: (i) fixed-mobile substitution (FMS), (ii) dampening of tourism and business activities, (iii) reduction of paying customers, (iv) tighter credit policy, and (v) stolen copper cables.
Preview 2012 Egypt's mobile subs are to continue growing in 2012 but at a single-digit rate of 9%, reaching a 100% penetration during the year – down from an estimated 23% in 2011— as the mobile market is considered at the saturation phase. We believe sector growth will be less from customer acquisition and more from VAS and data services. Accordingly, we believe that company strategies will address value rather than customer growth in an attempt to counter the continuing pressure on voice call revenues. We are currently awaiting an amicable end to the regulatory issues between telecom operators and the regulatory authority, which encompass interconnection fees, ETEL’s network infrastructure lease, and international gateway services. Taking into account the slow-growth nature of telephone lines, we expect a 9% YoY drop in active lines in 2011 and only a 1% decline in 2012 following the clean-up of customer base. We continue to play down the possibility of a new fixed-line entrant, unless the new entrant will lease ETEL’s extensive network and offer VAS.
Egypt Book 2011/12 | Sector Review
Telecom Services
EMOB | Underweight ETEL | Buy
ORTE | Strong Buy
Amr Hussein Elalfy, CFA [email protected]
Mohamed Hamdy [email protected]
Yehia El Sherbiny
Egypt’s young population secures a sustainable market for telecom services. Provision of new VAS (i.e. mobile banking) to shore
up ARPUs. Triple-play services to boost ADSL and fixed-line
subs. Potential growth may come from offering MVNO
services. A low internet penetration rate leaves room for
growth.
Market saturation may narrow future growth potential in the mobile segment. Aggressive price competition exerts pressure on
operators’ ARPUs. Egypt's high illiteracy rates may hinder proliferation
of VAS. Illegal sharing of ADSL connections may put a lid on
broadband subs growth.
Telecom Services | 52 Wk Performance*
2,000
3,000
4,000
5,000
6,000
7,000
Jan-11 Mar-11 May-11 Jul-11 Sep-11 Nov-11
EGX 30 Telecom Services (UW)Telecom Services (W)
Sector Growth Drivers
Sector Risks
-50%-40%-30%-20%-10%
0%10%20%30%40%
2009a 2010a 2011e 2012e 2013e 2014e
Revenue EBITDA Net Income
KPIs | 2009-14e
*Comprises all sector stocks constituting CI Capital 100 Index.
Page | 199
Egypt Book 2011/12
January 26, 2012
Telecom Services
Xxx
Mobile 2011 Review
Major Events
Boycott campaigns against Mobinil
A number of EMOB customers have canceled their contracts with the company
following boycott campaigns launched on both Twitter and Facebook in response to a
cartoon published by Eng. Naguib Sawiris on his Twitter account in June 2011, which
was considered as offensive to Islam. The Minister of Communication and
Information Technology (MCIT) reported 101,000 net disconnections in EMOB subs
in July 2011, while EMOB management did not quantify the number of customer
disconnections but stated that in July and August “some hundred thousands” of
customers had submitted requests to EMOB to opt out to other opcos through Mobile
Number Portability (MNP). Management reacted to such a large number of requests
by offering incentives to stay on, such as free minutes, which would put further
pressure on ARPU. The company’s chairman, Alex Shalaby was quoted as saying
“The number of "porting out" requests by subscribers reached around 20,000 a day
at the peak of the boycott, compared to 1,000 or less per day before the incident.
[Now], we are way below that figure.”
New numbering plan
On the regulatory front, Egypt’s National Telecom Regulatory Authority (NTRA)
announced a new numbering plan, starting October 6, 2011, in an attempt to
accommodate a growing number of mobile phone users. The new numbering plan
complies with international standards in order to maintain market stability. Mobile
operators will have four months to fully comply with the decision, during which time
users will be able to call using either the old number or the new one.
Figure 12.1 | New numbers by each mobile operator
Source: CI Capital Research
Operators receive a “go ahead” for mobile banking
Mobile Banking (MB) is considered a value-added service and a potential revenue
growth-driver down the road, which would help mobile operators curb ARPU erosion
in view of continuous tariff cuts in voice call rates. In June 2011, EMOB and
Vodafone Egypt (VFE) had received NTRA approval to provide mobile-phone money
transfer once security in Egypt improves. The NTRA expects to introduce the service
over three stages, as agreed with the Central Bank of Egypt (CBE):
Old New Old New Old New012 - - - - - - - 0122 - - - - - - - 011 - - - - - - - 0111 - - - - - - - 010 - - - - - - - 0100 - - - - - - - 017 - - - - - - - 0127 - - - - - - - 014 - - - - - - - 0114 - - - - - - - 016 - - - - - - - 0106 - - - - - - - 018 - - - - - - - 0128 - - - - - - - 0152 - - - - - - - 0112 - - - - - - - 019 - - - - - - - 0109 - - - - - - - 0150 - - - - - - - 0120 - - - - - - - 0151 - - - - - - - 0101 - - - - - - -
Mobinil Etisalat Vodafone Egypt
Page | 200
Egypt Book 2011/12
January 26, 2012
Telecom Services
Xxx
The first stage will include the transfer of funds between subs of a single operator.
The second stage will include transfers between subs of the three operators. The final stage will include transfers to international markets.
Financial performance The Revolution took its toll on 1Q11 results
EMOB reported weaker-than-expected results for the "exceptional" 1Q11. Net
earnings fell dramatically to EGP23mn vs. EGP357mn in 1Q10, coming far below
consensus estimates of EGP243mn due to lower-than-expected revenues and
EBITDA margin. Management attributed the weak results to:
Forced shutdown of the mobile network on January 28. Disconnection of SMS for 8 days and data services for 5 days. Compensation for customers for unavailability of service. Low security and economic slowdown following January 28, leading to slow
sales activity. Reduction of tourism activity and lower usage of the corporate segment.
While EMOB’s 1Q11 revenues declined by 4.5% YoY to reach EGP2.4bn, Vodafone
Egypt (VFE)’s 4Q10/11 ending March 2011 saw revenues decrease by only 1.6%
YoY at EGP2.8bn. Meanwhile, VFE’s net earnings fell 16% YoY to EGP487mn.
According to the MCIT’s figures, Etisalat Misr (EM) added 2.9mn customer in 1Q11,
representing a massive share of net adds of 89%, while VFE added only 0.4mn subs,
a 12% share of net add. Meanwhile, EMOB lost 36,600 subs during the quarter to
further widen the gap between its subs base and VFE’s to 2mn in favor of the latter
vs. 1.5mn in favor of EMOB in 1Q10.
New tax regime hit profitability in 2Q11
Although 2Q11 revenues showed a recovery in business environment compared to
1Q11, EMOB’s performance has proven disappointing, mainly because of the low
margins. The company reported a net loss of EGP108.5mn in 2Q11, largely impacted
by a new tax regime. Net income for the mobile segment was hit by one-time income
taxes of EGP190mn:
EGP174mn of which was related to the increase in deferred taxes (subject to the new corporate tax rate) based on a stock of deferred taxes of around EGP700mn.
EGP16mn resulted from higher income taxes due to the increase in corporate tax rate.
Before applying the new tax regime, EMOB reported net earnings after-tax of
EGP80mn, compared to consensus estimates of EGP240mn. Total revenues came
close to estimates, reaching EGP2.6bn (+3.5% YoY) - helped by the robust growth in
broadband revenues. However, the earnings variance emanated mainly from lower-
than-expected EBITDA margin, higher-than-expected depreciation & amortization
(D&A) expenses, and higher-than-expected non-operating expenses.
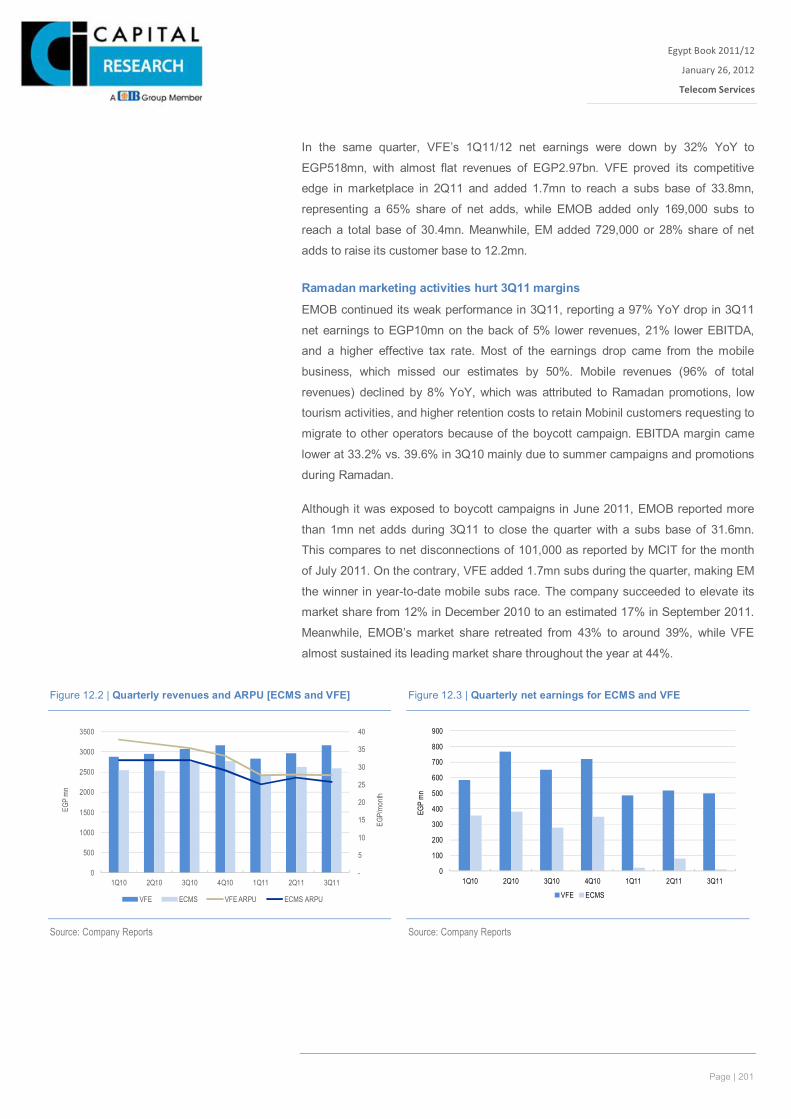
Page | 201
Egypt Book 2011/12
January 26, 2012
Telecom Services
Xxx
In the same quarter, VFE’s 1Q11/12 net earnings were down by 32% YoY to
EGP518mn, with almost flat revenues of EGP2.97bn. VFE proved its competitive
edge in marketplace in 2Q11 and added 1.7mn to reach a subs base of 33.8mn,
representing a 65% share of net adds, while EMOB added only 169,000 subs to
reach a total base of 30.4mn. Meanwhile, EM added 729,000 or 28% share of net
adds to raise its customer base to 12.2mn.
Ramadan marketing activities hurt 3Q11 margins
EMOB continued its weak performance in 3Q11, reporting a 97% YoY drop in 3Q11
net earnings to EGP10mn on the back of 5% lower revenues, 21% lower EBITDA,
and a higher effective tax rate. Most of the earnings drop came from the mobile
business, which missed our estimates by 50%. Mobile revenues (96% of total
revenues) declined by 8% YoY, which was attributed to Ramadan promotions, low
tourism activities, and higher retention costs to retain Mobinil customers requesting to
migrate to other operators because of the boycott campaign. EBITDA margin came
lower at 33.2% vs. 39.6% in 3Q10 mainly due to summer campaigns and promotions
during Ramadan.
Although it was exposed to boycott campaigns in June 2011, EMOB reported more
than 1mn net adds during 3Q11 to close the quarter with a subs base of 31.6mn.
This compares to net disconnections of 101,000 as reported by MCIT for the month
of July 2011. On the contrary, VFE added 1.7mn subs during the quarter, making EM
the winner in year-to-date mobile subs race. The company succeeded to elevate its
market share from 12% in December 2010 to an estimated 17% in September 2011.
Meanwhile, EMOB’s market share retreated from 43% to around 39%, while VFE
almost sustained its leading market share throughout the year at 44%.
Figure 12.2 | Quarterly revenues and ARPU [ECMS and VFE] Figure 12.3 | Quarterly net earnings for ECMS and VFE
Source: Company Reports
Source: Company Reports
-
5
10
15
20
25
30
35
40
0
500
1000
1500
2000
2500
3000
3500
1Q10 2Q10 3Q10 4Q10 1Q11 2Q11 3Q11
EGP/
month
EGP
mn
VFE ECMS VFE ARPU ECMS ARPU
0
100
200
300
400
500
600
700
800
900
1Q10 2Q10 3Q10 4Q10 1Q11 2Q11 3Q11
EGP
mn
VFE ECMS
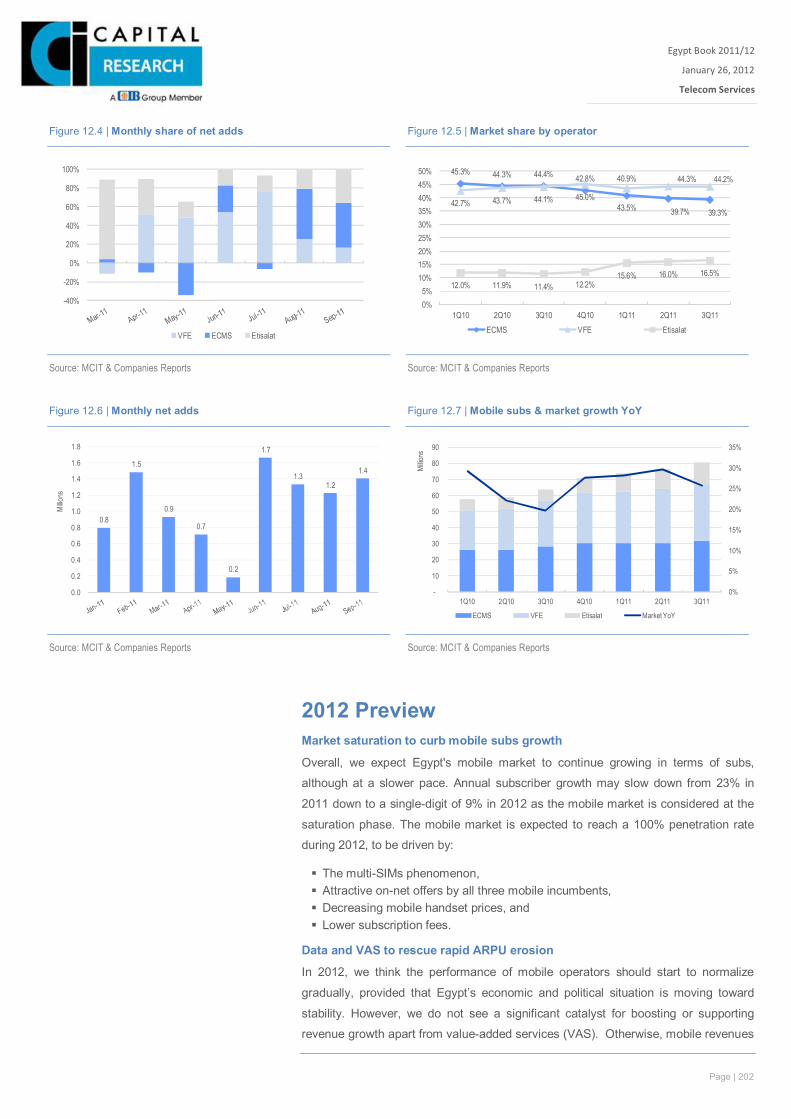
Page | 202
Egypt Book 2011/12
January 26, 2012
Telecom Services
Xxx
2012 Preview Market saturation to curb mobile subs growth
Overall, we expect Egypt's mobile market to continue growing in terms of subs,
although at a slower pace. Annual subscriber growth may slow down from 23% in
2011 down to a single-digit of 9% in 2012 as the mobile market is considered at the
saturation phase. The mobile market is expected to reach a 100% penetration rate
during 2012, to be driven by:
The multi-SIMs phenomenon, Attractive on-net offers by all three mobile incumbents, Decreasing mobile handset prices, and Lower subscription fees.
Data and VAS to rescue rapid ARPU erosion
In 2012, we think the performance of mobile operators should start to normalize
gradually, provided that Egypt’s economic and political situation is moving toward
stability. However, we do not see a significant catalyst for boosting or supporting
revenue growth apart from value-added services (VAS). Otherwise, mobile revenues
Figure 12.4 | Monthly share of net adds Figure 12.5 | Market share by operator
Source: MCIT & Companies Reports
Source: MCIT & Companies Reports
-40%
-20%
0%
20%
40%
60%
80%
100%
VFE ECMS Etisalat
45.3% 44.3% 44.4% 42.8% 40.9%
39.7% 39.3%42.7% 43.7% 44.1% 45.0%
43.5%
44.3% 44.2%
12.0% 11.9% 11.4% 12.2%15.6% 16.0% 16.5%
0%5%
10%15%20%25%30%35%40%45%50%
1Q10 2Q10 3Q10 4Q10 1Q11 2Q11 3Q11ECMS VFE Etisalat
Figure 12.6 | Monthly net adds Figure 12.7 | Mobile subs & market growth YoY
Source: MCIT & Companies Reports
Source: MCIT & Companies Reports
0.8
1.5
0.9
0.7
0.2
1.7
1.31.2
1.4
0.0
0.2
0.4
0.6
0.8
1.0
1.2
1.4
1.6
1.8
Millio
ns
0%
5%
10%
15%
20%
25%
30%
35%
-
10
20
30
40
50
60
70
80
90
1Q10 2Q10 3Q10 4Q10 1Q11 2Q11 3Q11
Millio
ns
ECMS VFE Etisalat Market YoY
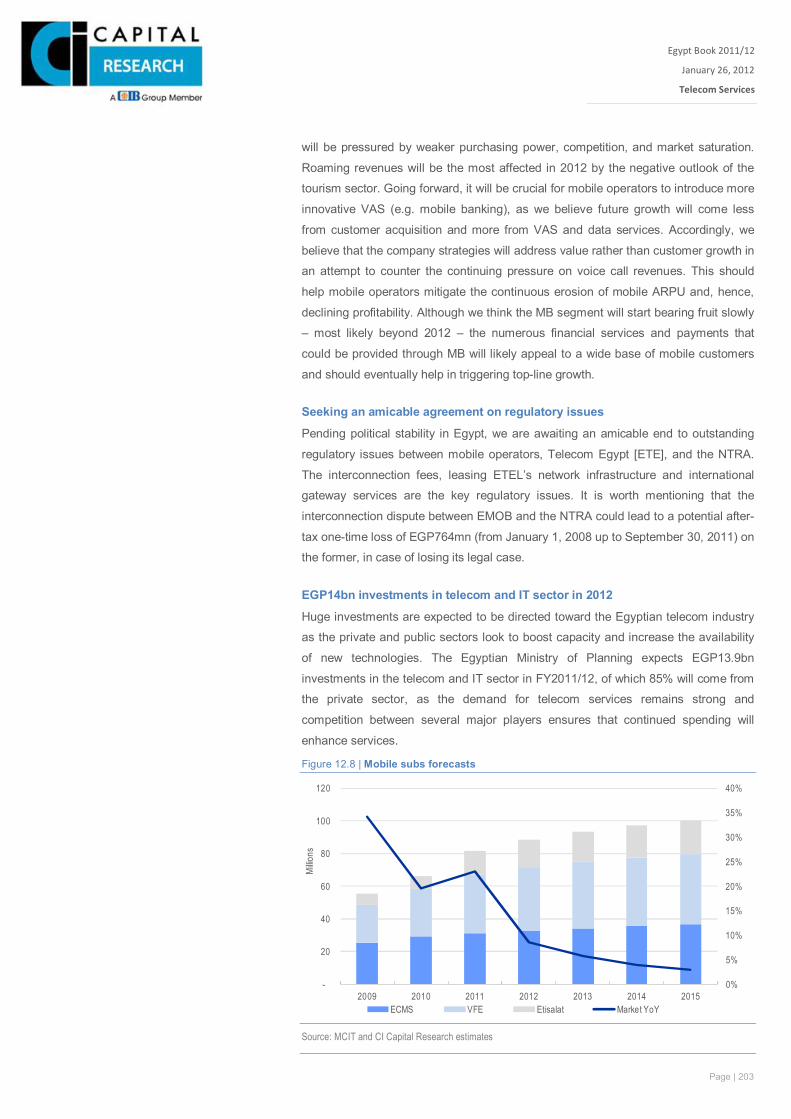
Page | 203
Egypt Book 2011/12
January 26, 2012
Telecom Services
Xxx
will be pressured by weaker purchasing power, competition, and market saturation.
Roaming revenues will be the most affected in 2012 by the negative outlook of the
tourism sector. Going forward, it will be crucial for mobile operators to introduce more
innovative VAS (e.g. mobile banking), as we believe future growth will come less
from customer acquisition and more from VAS and data services. Accordingly, we
believe that the company strategies will address value rather than customer growth in
an attempt to counter the continuing pressure on voice call revenues. This should
help mobile operators mitigate the continuous erosion of mobile ARPU and, hence,
declining profitability. Although we think the MB segment will start bearing fruit slowly
– most likely beyond 2012 – the numerous financial services and payments that
could be provided through MB will likely appeal to a wide base of mobile customers
and should eventually help in triggering top-line growth.
Seeking an amicable agreement on regulatory issues
Pending political stability in Egypt, we are awaiting an amicable end to outstanding
regulatory issues between mobile operators, Telecom Egypt [ETE], and the NTRA.
The interconnection fees, leasing ETEL’s network infrastructure and international
gateway services are the key regulatory issues. It is worth mentioning that the
interconnection dispute between EMOB and the NTRA could lead to a potential after-
tax one-time loss of EGP764mn (from January 1, 2008 up to September 30, 2011) on
the former, in case of losing its legal case.
EGP14bn investments in telecom and IT sector in 2012
Huge investments are expected to be directed toward the Egyptian telecom industry
as the private and public sectors look to boost capacity and increase the availability
of new technologies. The Egyptian Ministry of Planning expects EGP13.9bn
investments in the telecom and IT sector in FY2011/12, of which 85% will come from
the private sector, as the demand for telecom services remains strong and
competition between several major players ensures that continued spending will
enhance services.
Figure 12.8 | Mobile subs forecasts
Source: MCIT and CI Capital Research estimates
0%
5%
10%
15%
20%
25%
30%
35%
40%
-
20
40
60
80
100
120
2009 2010 2011 2012 2013 2014 2015
Millio
ns
ECMS VFE Etisalat Market YoY
Page | 204
Egypt Book 2011/12
January 26, 2012
Telecom Services
Xxx
Fixed line 2011 Review 700K YTD net disconnections in ALIS
For the first nine months of 2011, the number of active lines in services (ALIS) –
provided through the sole fixed-line operator, ETEL – contracted by more than
700,000 lines, helping in a 19% year-on-year drop in year-to-date (YTD) voice
revenues, comprising of local calls, long distance calls, fixed-to-international calls,
and fixed-to-mobile calls. The drop in telephone lines and voice revenues was mainly
driven by: (i) fixed-mobile substitution (FMS), (ii) dampening of tourism and business
activities, (iii) reduction of paying customers, (iv) tighter credit policy adopted by
ETEL to disconnect inactive subs, and (v) stolen copper cables.
Curfew and revolution events hit 1Q11 revenues
In 1Q11, the company said it had reactivated the telephone services “at no cost” to
more than 1.4mn customers, who failed to pay bills on time because of the events of
the revolution, and extended payment terms for active subscribers. Nonetheless, the
number of ALIS remained almost unchanged quarter-on-quarter (QoQ) at 9.3mn.
Despite the higher average local call volumes in 1Q11, voice revenues declined 12%
YoY due to the drop of paying customers as the government had imposed curfew
during the revolution events.
Active lines shrink on reduction of paying customers and stolen copper cable
In 2Q11, ETEL stated that some 750 thousand customers have experienced periods
of no service as a result of sections of copper cable being stolen as the price of the
underlying commodity soars. Accordingly, the number of ALIS contracted by net
disconnections of 300,000 to reach 9mn, while voice revenues declined by 25%
(YoY) on the back of the reduction in the number of paying customers. In an attempt
to boost voice call traffic, ETEL decided to cut the long-distance call tariff to be at the
same local call tariff of EGP0.03/min and lowered its fixed-to-mobile call tariff from
EGP0.15/min to EGP0.14/min.
Slower business and tourism activities put further pressure on revenues
In 3Q11, ETEL had temporary disconnected 400,000 customers during the quarter
to reach a customer base of 8.6mn. This decline was primarily attributable to the
tightening of ETEL credit policy following a “bit of relaxation” in credit policy post-
revolution. Voice revenue was 20% YoY lower, as the local and international calls
were negatively impacted by the seasonal effect of Ramadan falling within summer
period, depressed tourism levels, and slower business activity. Beside its regular
telephone services, ETEL provides domestic and international services – under the
umbrella of its wholesale business – to third parties who use TE’s extensive, digital
infrastructure principally for co-location and transmission services and infrastructure
leasing.
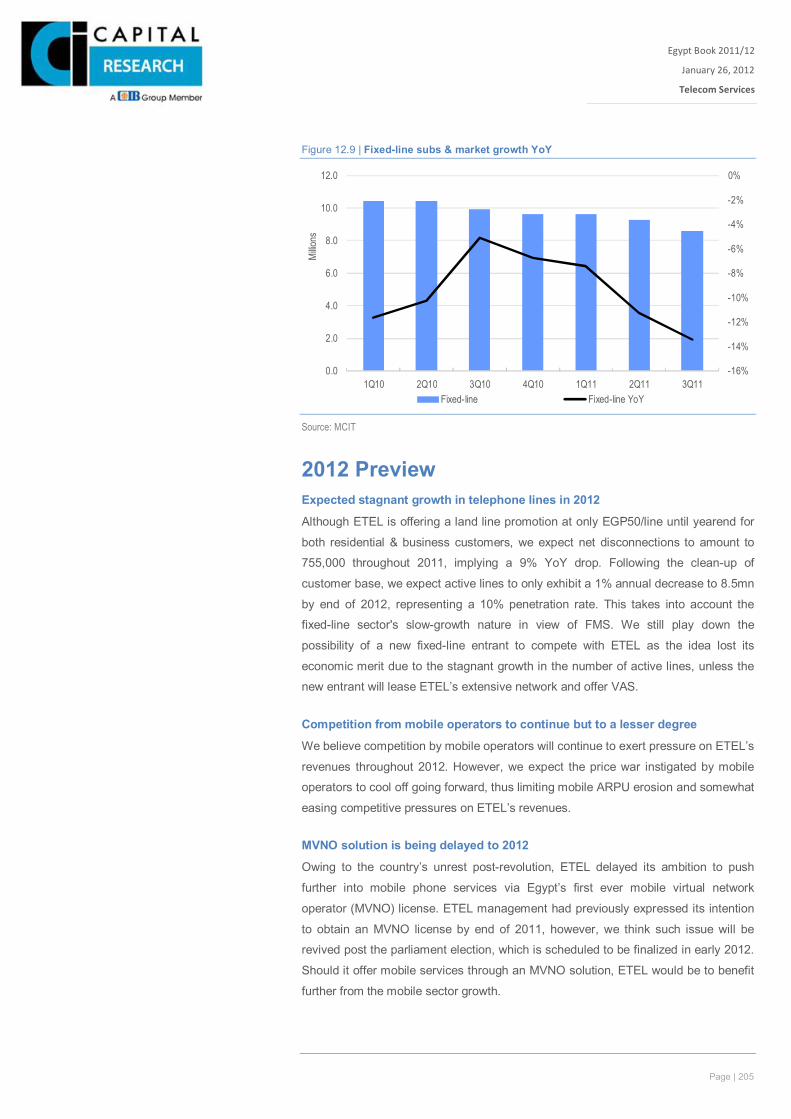
Page | 205
Egypt Book 2011/12
January 26, 2012
Telecom Services
Xxx
Figure 12.9 | Fixed-line subs & market growth YoY
Source: MCIT
2012 Preview Expected stagnant growth in telephone lines in 2012
Although ETEL is offering a land line promotion at only EGP50/line until yearend for
both residential & business customers, we expect net disconnections to amount to
755,000 throughout 2011, implying a 9% YoY drop. Following the clean-up of
customer base, we expect active lines to only exhibit a 1% annual decrease to 8.5mn
by end of 2012, representing a 10% penetration rate. This takes into account the
fixed-line sector's slow-growth nature in view of FMS. We still play down the
possibility of a new fixed-line entrant to compete with ETEL as the idea lost its
economic merit due to the stagnant growth in the number of active lines, unless the
new entrant will lease ETEL’s extensive network and offer VAS.
Competition from mobile operators to continue but to a lesser degree
We believe competition by mobile operators will continue to exert pressure on ETEL’s
revenues throughout 2012. However, we expect the price war instigated by mobile
operators to cool off going forward, thus limiting mobile ARPU erosion and somewhat
easing competitive pressures on ETEL’s revenues.
MVNO solution is being delayed to 2012
Owing to the country’s unrest post-revolution, ETEL delayed its ambition to push
further into mobile phone services via Egypt’s first ever mobile virtual network
operator (MVNO) license. ETEL management had previously expressed its intention
to obtain an MVNO license by end of 2011, however, we think such issue will be
revived post the parliament election, which is scheduled to be finalized in early 2012.
Should it offer mobile services through an MVNO solution, ETEL would be to benefit
further from the mobile sector growth.
-16%
-14%
-12%
-10%
-8%
-6%
-4%
-2%
0%
0.0
2.0
4.0
6.0
8.0
10.0
12.0
1Q10 2Q10 3Q10 4Q10 1Q11 2Q11 3Q11
Millio
ns
Fixed-line Fixed-line YoY
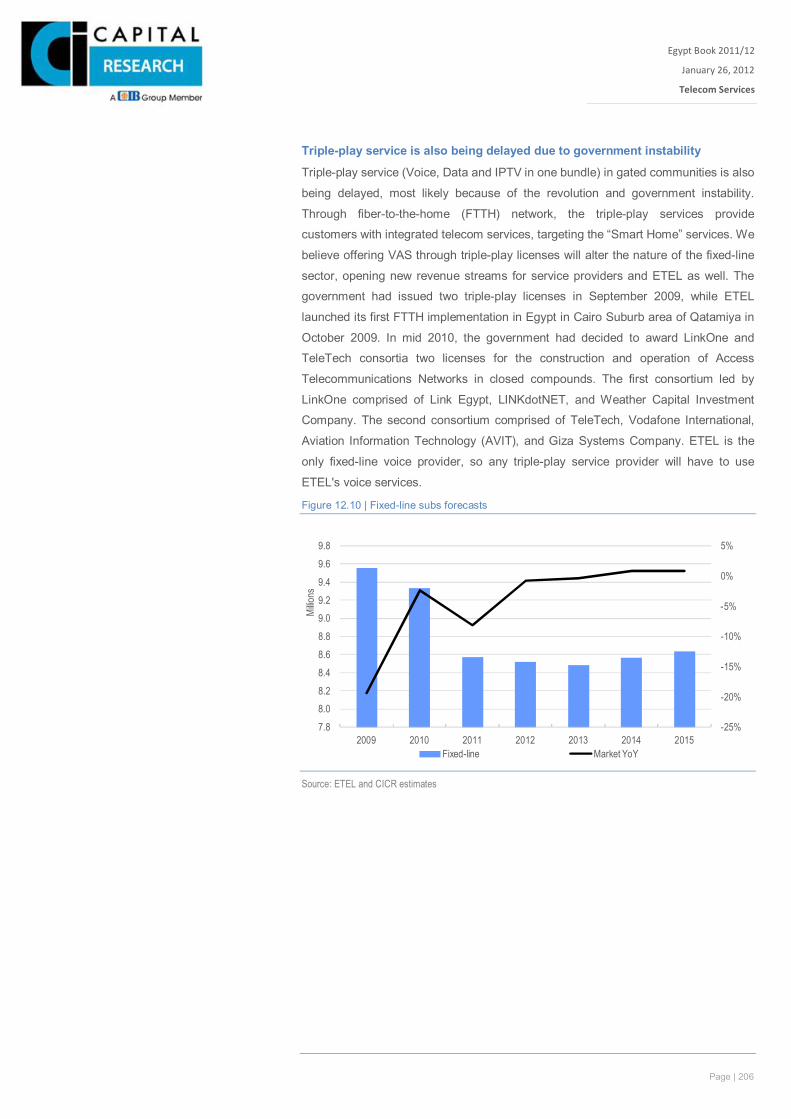
Page | 206
Egypt Book 2011/12
January 26, 2012
Telecom Services
Xxx
Triple-play service is also being delayed due to government instability
Triple-play service (Voice, Data and IPTV in one bundle) in gated communities is also
being delayed, most likely because of the revolution and government instability.
Through fiber-to-the-home (FTTH) network, the triple-play services provide
customers with integrated telecom services, targeting the “Smart Home” services. We
believe offering VAS through triple-play licenses will alter the nature of the fixed-line
sector, opening new revenue streams for service providers and ETEL as well. The
government had issued two triple-play licenses in September 2009, while ETEL
launched its first FTTH implementation in Egypt in Cairo Suburb area of Qatamiya in
October 2009. In mid 2010, the government had decided to award LinkOne and
TeleTech consortia two licenses for the construction and operation of Access
Telecommunications Networks in closed compounds. The first consortium led by
LinkOne comprised of Link Egypt, LINKdotNET, and Weather Capital Investment
Company. The second consortium comprised of TeleTech, Vodafone International,
Aviation Information Technology (AVIT), and Giza Systems Company. ETEL is the
only fixed-line voice provider, so any triple-play service provider will have to use
ETEL's voice services.
Figure 12.10 | Fixed-line subs forecasts
Source: ETEL and CICR estimates
-25%
-20%
-15%
-10%
-5%
0%
5%
7.88.08.28.48.68.89.09.29.49.69.8
2009 2010 2011 2012 2013 2014 2015
Millio
ns
Fixed-line Market YoY
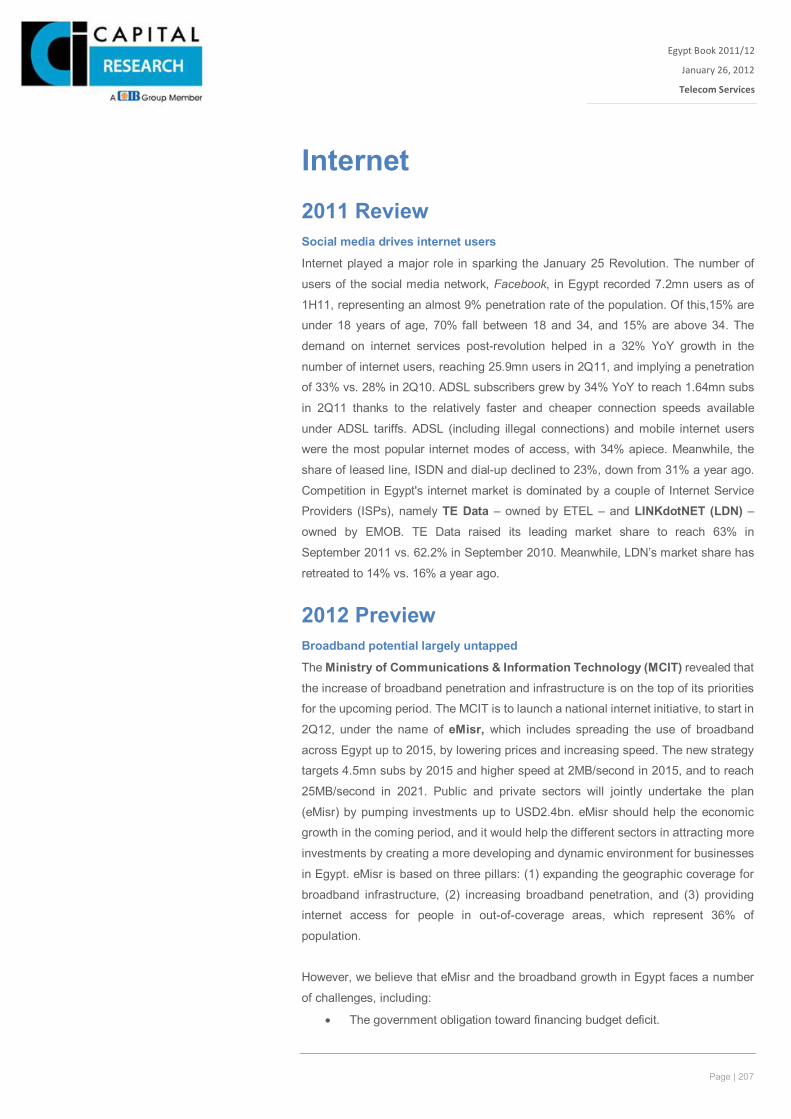
Page | 207
Egypt Book 2011/12
January 26, 2012
Telecom Services
Xxx
Internet 2011 Review Social media drives internet users
Internet played a major role in sparking the January 25 Revolution. The number of
users of the social media network, Facebook, in Egypt recorded 7.2mn users as of
1H11, representing an almost 9% penetration rate of the population. Of this,15% are
under 18 years of age, 70% fall between 18 and 34, and 15% are above 34. The
demand on internet services post-revolution helped in a 32% YoY growth in the
number of internet users, reaching 25.9mn users in 2Q11, and implying a penetration
of 33% vs. 28% in 2Q10. ADSL subscribers grew by 34% YoY to reach 1.64mn subs
in 2Q11 thanks to the relatively faster and cheaper connection speeds available
under ADSL tariffs. ADSL (including illegal connections) and mobile internet users
were the most popular internet modes of access, with 34% apiece. Meanwhile, the
share of leased line, ISDN and dial-up declined to 23%, down from 31% a year ago.
Competition in Egypt's internet market is dominated by a couple of Internet Service
Providers (ISPs), namely TE Data – owned by ETEL – and LINKdotNET (LDN) –
owned by EMOB. TE Data raised its leading market share to reach 63% in
September 2011 vs. 62.2% in September 2010. Meanwhile, LDN’s market share has
retreated to 14% vs. 16% a year ago.
2012 Preview Broadband potential largely untapped
The Ministry of Communications & Information Technology (MCIT) revealed that
the increase of broadband penetration and infrastructure is on the top of its priorities
for the upcoming period. The MCIT is to launch a national internet initiative, to start in
2Q12, under the name of eMisr, which includes spreading the use of broadband
across Egypt up to 2015, by lowering prices and increasing speed. The new strategy
targets 4.5mn subs by 2015 and higher speed at 2MB/second in 2015, and to reach
25MB/second in 2021. Public and private sectors will jointly undertake the plan
(eMisr) by pumping investments up to USD2.4bn. eMisr should help the economic
growth in the coming period, and it would help the different sectors in attracting more
investments by creating a more developing and dynamic environment for businesses
in Egypt. eMisr is based on three pillars: (1) expanding the geographic coverage for
broadband infrastructure, (2) increasing broadband penetration, and (3) providing
internet access for people in out-of-coverage areas, which represent 36% of
population.
However, we believe that eMisr and the broadband growth in Egypt faces a number
of challenges, including:
The government obligation toward financing budget deficit.
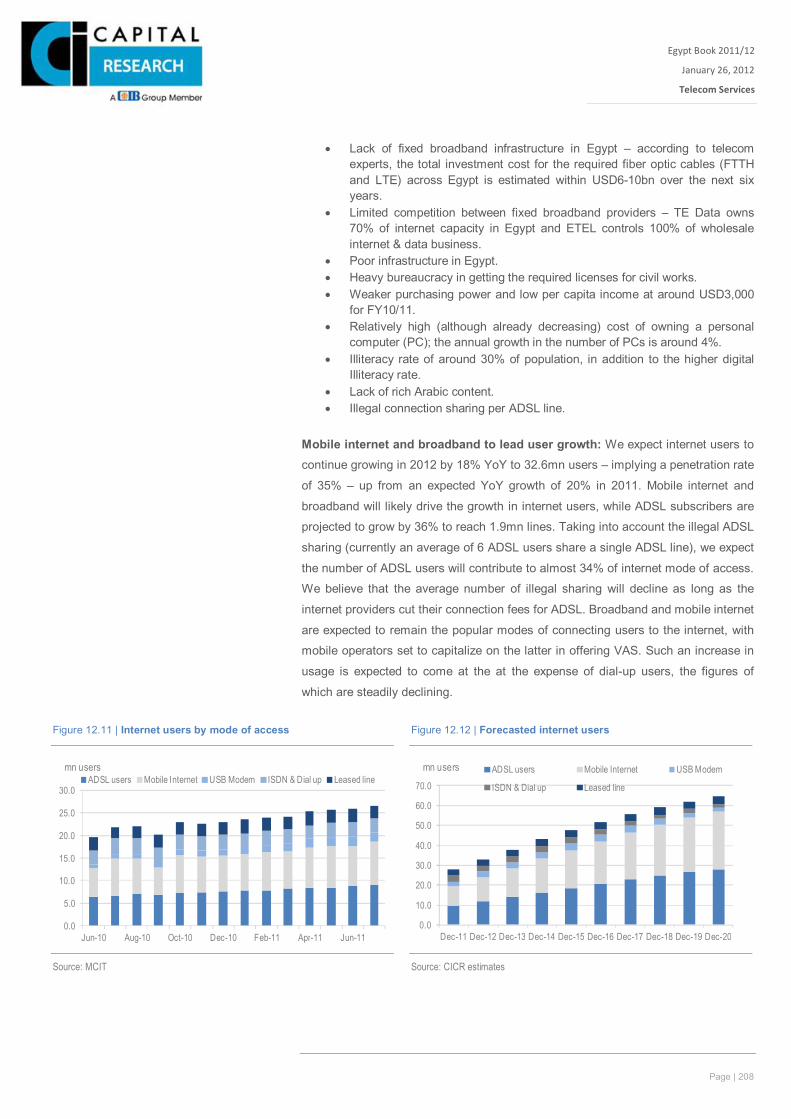
Page | 208
Egypt Book 2011/12
January 26, 2012
Telecom Services
Xxx
Lack of fixed broadband infrastructure in Egypt – according to telecom experts, the total investment cost for the required fiber optic cables (FTTH and LTE) across Egypt is estimated within USD6-10bn over the next six years.
Limited competition between fixed broadband providers – TE Data owns 70% of internet capacity in Egypt and ETEL controls 100% of wholesale internet & data business.
Poor infrastructure in Egypt. Heavy bureaucracy in getting the required licenses for civil works. Weaker purchasing power and low per capita income at around USD3,000
for FY10/11. Relatively high (although already decreasing) cost of owning a personal
computer (PC); the annual growth in the number of PCs is around 4%. Illiteracy rate of around 30% of population, in addition to the higher digital
Illiteracy rate. Lack of rich Arabic content. Illegal connection sharing per ADSL line.
Mobile internet and broadband to lead user growth: We expect internet users to
continue growing in 2012 by 18% YoY to 32.6mn users – implying a penetration rate
of 35% – up from an expected YoY growth of 20% in 2011. Mobile internet and
broadband will likely drive the growth in internet users, while ADSL subscribers are
projected to grow by 36% to reach 1.9mn lines. Taking into account the illegal ADSL
sharing (currently an average of 6 ADSL users share a single ADSL line), we expect
the number of ADSL users will contribute to almost 34% of internet mode of access.
We believe that the average number of illegal sharing will decline as long as the
internet providers cut their connection fees for ADSL. Broadband and mobile internet
are expected to remain the popular modes of connecting users to the internet, with
mobile operators set to capitalize on the latter in offering VAS. Such an increase in
usage is expected to come at the at the expense of dial-up users, the figures of
which are steadily declining.
Figure 12.11 | Internet users by mode of access Figure 12.12 | Forecasted internet users
Source: MCIT
Source: CICR estimates
0.0
5.0
10.0
15.0
20.0
25.0
30.0
Jun-10 Aug-10 Oct-10 Dec-10 Feb-11 Apr-11 Jun-11
ADSL users Mobile Internet USB Modem ISDN & Dial up Leased linemn users
0.0
10.0
20.0
30.0
40.0
50.0
60.0
70.0
Dec-11 Dec-12 Dec-13 Dec-14 Dec-15 Dec-16 Dec-17 Dec-18 Dec-19 Dec-20
ADSL users Mobile Internet USB Modem
ISDN & Dial up Leased line
mn users
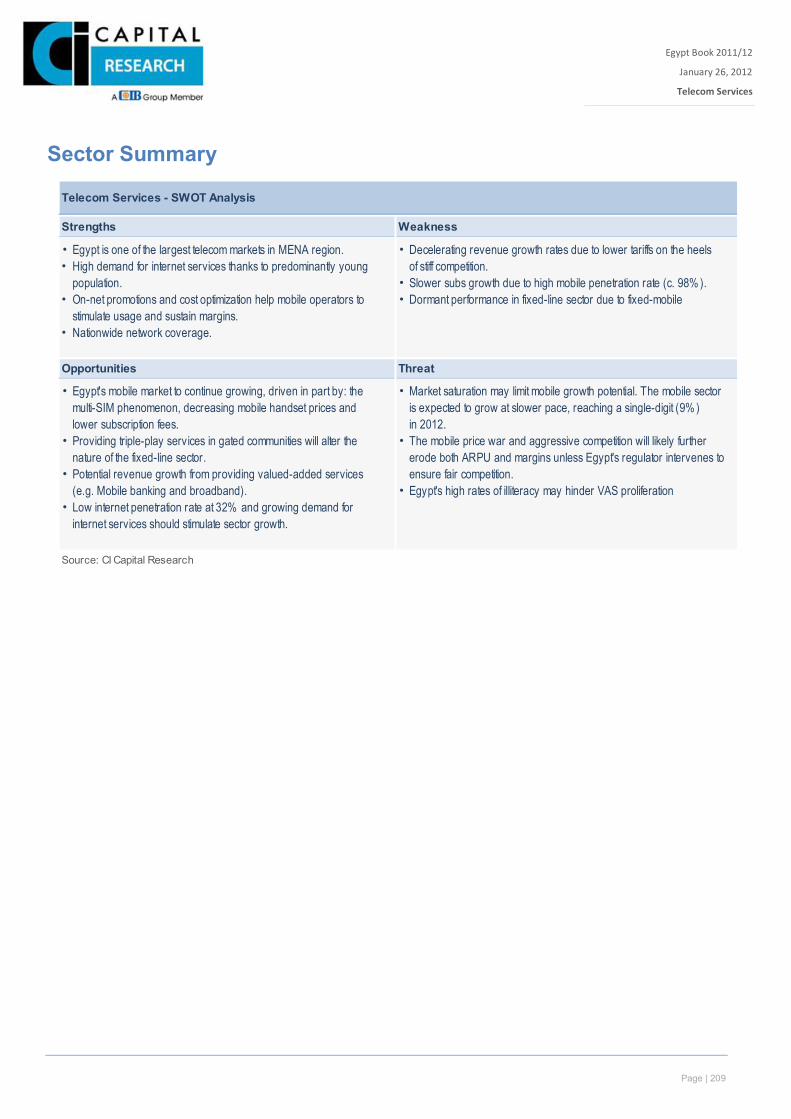
Page | 209
Egypt Book 2011/12
January 26, 2012
Telecom Services
Xxx
Sector Summary
Telecom Services - SWOT Analysis
Strengths Weakness
• Egypt is one of the largest telecom markets in MENA region. • Decelerating revenue growth rates due to lower tariffs on the heels• High demand for internet services thanks to predominantly young of stiff competition.
population. • Slower subs growth due to high mobile penetration rate (c. 98% ).• On-net promotions and cost optimization help mobile operators to • Dormant performance in fixed-line sector due to fixed-mobile
stimulate usage and sustain margins.• Nationwide network coverage.
Opportunities Threat
• Egypt's mobile market to continue growing, driven in part by: the • Market saturation may limit mobile growth potential. The mobile sectormulti-SIM phenomenon, decreasing mobile handset prices and is expected to grow at slower pace, reaching a single-digit (9% )lower subscription fees. in 2012.
• Providing triple-play services in gated communities will alter the •nature of the fixed-line sector.
•• Egypt's high rates of illiteracy may hinder VAS proliferation
•
Source: CI Capital Research
Potential revenue growth from providing valued-added services (e.g. Mobile banking and broadband).Low internet penetration rate at 32% and growing demand for internet services should stimulate sector growth.
The mobile price war and aggressive competition will likely further erode both ARPU and margins unless Egypt's regulator intervenes to ensure fair competition.
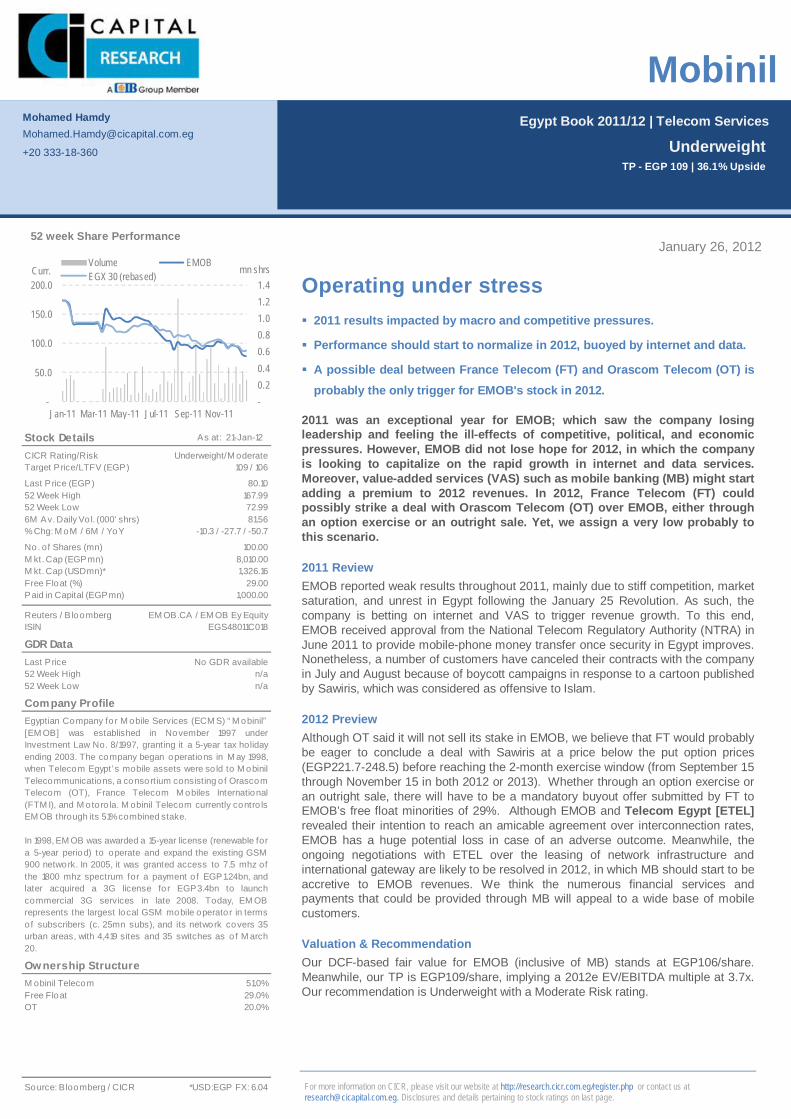
Page | 23
Egypt Book 2011/12 | Telecom Services
For more information on CICR, please visit our website at http://research.cicr.com.eg/register.php or contact us at [email protected]. Disclosures and details pertaining to stock ratings on last page.
January 26, 2012
Operating under stress 2011 results impacted by macro and competitive pressures.
Performance should start to normalize in 2012, buoyed by internet and data.
A possible deal between France Telecom (FT) and Orascom Telecom (OT) is probably the only trigger for EMOB's stock in 2012.
2011 was an exceptional year for EMOB; which saw the company losing leadership and feeling the ill-effects of competitive, political, and economic pressures. However, EMOB did not lose hope for 2012, in which the company is looking to capitalize on the rapid growth in internet and data services. Moreover, value-added services (VAS) such as mobile banking (MB) might start adding a premium to 2012 revenues. In 2012, France Telecom (FT) could possibly strike a deal with Orascom Telecom (OT) over EMOB, either through an option exercise or an outright sale. Yet, we assign a very low probably to this scenario.
2011 Review EMOB reported weak results throughout 2011, mainly due to stiff competition, market saturation, and unrest in Egypt following the January 25 Revolution. As such, the company is betting on internet and VAS to trigger revenue growth. To this end, EMOB received approval from the National Telecom Regulatory Authority (NTRA) in June 2011 to provide mobile-phone money transfer once security in Egypt improves. Nonetheless, a number of customers have canceled their contracts with the company in July and August because of boycott campaigns in response to a cartoon published by Sawiris, which was considered as offensive to Islam.
2012 Preview Although OT said it will not sell its stake in EMOB, we believe that FT would probably be eager to conclude a deal with Sawiris at a price below the put option prices (EGP221.7-248.5) before reaching the 2-month exercise window (from September 15 through November 15 in both 2012 or 2013). Whether through an option exercise or an outright sale, there will have to be a mandatory buyout offer submitted by FT to EMOB’s free float minorities of 29%. Although EMOB and Telecom Egypt [ETEL] revealed their intention to reach an amicable agreement over interconnection rates, EMOB has a huge potential loss in case of an adverse outcome. Meanwhile, the ongoing negotiations with ETEL over the leasing of network infrastructure and international gateway are likely to be resolved in 2012, in which MB should start to be accretive to EMOB revenues. We think the numerous financial services and payments that could be provided through MB will appeal to a wide base of mobile customers.
Valuation & Recommendation Our DCF-based fair value for EMOB (inclusive of MB) stands at EGP106/share. Meanwhile, our TP is EGP109/share, implying a 2012e EV/EBITDA multiple at 3.7x. Our recommendation is Underweight with a Moderate Risk rating.
Mohamed Hamdy [email protected]
+20 333-18-360
Underweight TP - EGP 109 | 36.1% Upside
Mobinil
Stock Details As at: 21-Jan-12
CICR Rating/RiskTarget Price/LTFV (EGP)
Last Price (EGP)52 Week High52 Week Low6M Av. Daily Vo l. (000' shrs)% Chg: M oM / 6M / YoY
No. of Shares (mn)M kt. Cap (EGPmn)M kt. Cap (USDmn)*Free Float (%)Paid in Capital (EGPmn)
Reuters / B loombergISIN
GDR DataLast Price52 Week High52 Week Low
Company Profile
Ow nership StructureM obinil Telecom 51.0%Free Float 29.0%OT 20.0%
Source: Bloomberg / CICR *USD:EGP FX: 6.04
Egyptian Company for M obile Services (ECM S) “ M obinil”[EM OB] was established in November 1997 underInvestment Law No. 8/1997, granting it a 5-year tax holidayending 2003. The company began operations in M ay 1998,when Telecom Egypt’ s mobile assets were so ld to M obinilTelecommunications, a consortium consisting o f Orascom Telecom (OT), France Telecom M obiles International(FTM I), and M otoro la. M obinil Telecom currently contro lsEM OB through its 51% combined stake.
In 1998, EM OB was awarded a 15-year license (renewable fora 5-year period) to operate and expand the existing GSM900 network. In 2005, it was granted access to 7.5 mhz ofthe 1800 mhz spectrum for a payment o f EGP1.24bn, andlater acquired a 3G license for EGP3.4bn to launchcommercial 3G services in late 2008. Today, EM OBrepresents the largest local GSM mobile operator in termsof subscribers (c. 25mn subs), and its network covers 35urban areas, with 4,419 sites and 35 switches as of M arch20.
167.9972.99
100.00
81.56
EM OB.CA / EM OB Ey Equity
1,326.16
-10.3 / -27.7 / -50.7
1,000.00
8,010.00
No GDR availablen/a
29.00
EGS48011C018
n/a
109 / 106
80.10
Underweight/M oderate
-0.2 0.4 0.6 0.8 1.0 1.2 1.4
-
50.0
100.0
150.0
200.0
Jan-11 Mar-11 May-11 Jul-11 Sep-11 Nov-11
mn shrsCurr.Volume EMOBEGX 30 (rebased)
52 week Share Performance
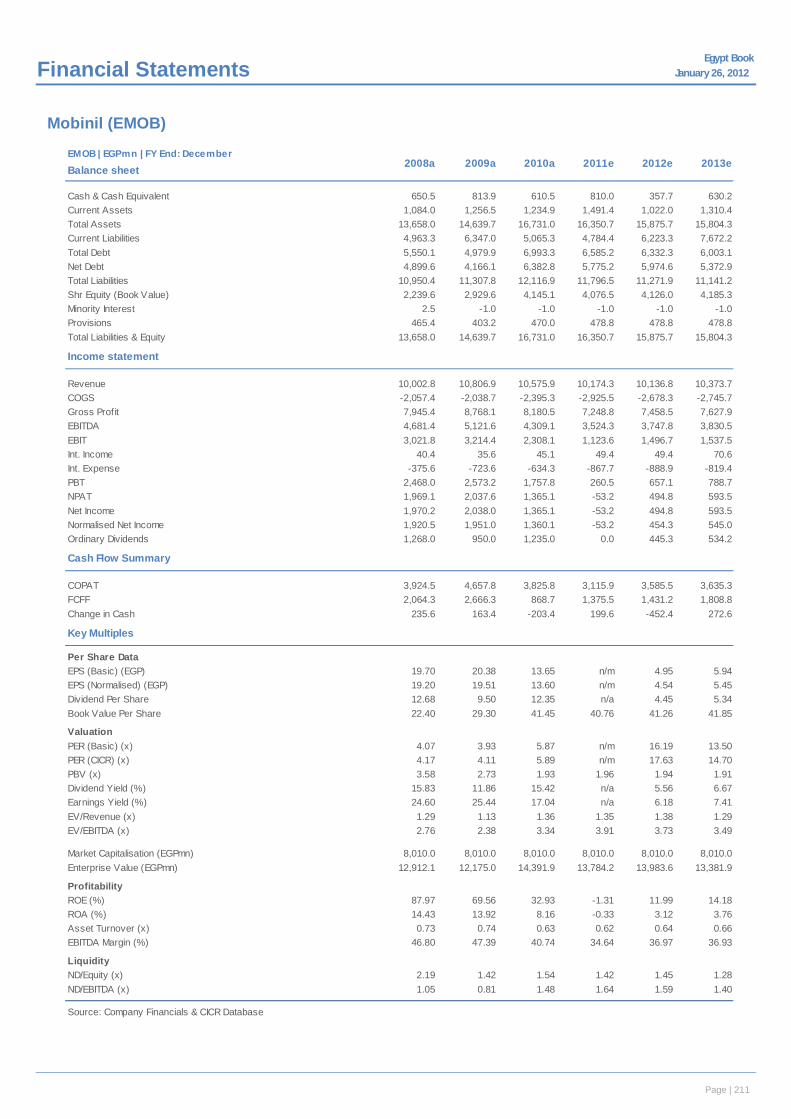
Page | 24
Egypt Book January 26, 2012x Financial Statements
Mobinil (EMOB)
cEMOB | EGPmn | FY End: December
Balance sheet
Cash & Cash Equivalent 650.5 813.9 610.5 810.0 357.7 630.2Current Assets 1,084.0 1,256.5 1,234.9 1,491.4 1,022.0 1,310.4Total Assets 13,658.0 14,639.7 16,731.0 16,350.7 15,875.7 15,804.3Current Liabilities 4,963.3 6,347.0 5,065.3 4,784.4 6,223.3 7,672.2Total Debt 5,550.1 4,979.9 6,993.3 6,585.2 6,332.3 6,003.1Net Debt 4,899.6 4,166.1 6,382.8 5,775.2 5,974.6 5,372.9Total Liabilities 10,950.4 11,307.8 12,116.9 11,796.5 11,271.9 11,141.2Shr Equity (Book Value) 2,239.6 2,929.6 4,145.1 4,076.5 4,126.0 4,185.3Minority Interest 2.5 -1.0 -1.0 -1.0 -1.0 -1.0Provisions 465.4 403.2 470.0 478.8 478.8 478.8Total Liabilities & Equity 13,658.0 14,639.7 16,731.0 16,350.7 15,875.7 15,804.3
Income statement
Revenue 10,002.8 10,806.9 10,575.9 10,174.3 10,136.8 10,373.7COGS -2,057.4 -2,038.7 -2,395.3 -2,925.5 -2,678.3 -2,745.7Gross Profit 7,945.4 8,768.1 8,180.5 7,248.8 7,458.5 7,627.9EBITDA 4,681.4 5,121.6 4,309.1 3,524.3 3,747.8 3,830.5EBIT 3,021.8 3,214.4 2,308.1 1,123.6 1,496.7 1,537.5Int. Income 40.4 35.6 45.1 49.4 49.4 70.6Int. Expense -375.6 -723.6 -634.3 -867.7 -888.9 -819.4PBT 2,468.0 2,573.2 1,757.8 260.5 657.1 788.7NPAT 1,969.1 2,037.6 1,365.1 -53.2 494.8 593.5Net Income 1,970.2 2,038.0 1,365.1 -53.2 494.8 593.5Normalised Net Income 1,920.5 1,951.0 1,360.1 -53.2 454.3 545.0Ordinary Dividends 1,268.0 950.0 1,235.0 0.0 445.3 534.2
Cash Flow Summary
COPAT 3,924.5 4,657.8 3,825.8 3,115.9 3,585.5 3,635.3FCFF 2,064.3 2,666.3 868.7 1,375.5 1,431.2 1,808.8Change in Cash 235.6 163.4 -203.4 199.6 -452.4 272.6
Key Multiples
Per Share DataEPS (Basic) (EGP) 19.70 20.38 13.65 n/m 4.95 5.94EPS (Normalised) (EGP) 19.20 19.51 13.60 n/m 4.54 5.45Dividend Per Share 12.68 9.50 12.35 n/a 4.45 5.34Book Value Per Share 22.40 29.30 41.45 40.76 41.26 41.85
ValuationPER (Basic) (x) 4.07 3.93 5.87 n/m 16.19 13.50PER (CICR) (x) 4.17 4.11 5.89 n/m 17.63 14.70PBV (x) 3.58 2.73 1.93 1.96 1.94 1.91Dividend Yield (%) 15.83 11.86 15.42 n/a 5.56 6.67Earnings Yield (%) 24.60 25.44 17.04 n/a 6.18 7.41EV/Revenue (x) 1.29 1.13 1.36 1.35 1.38 1.29EV/EBITDA (x) 2.76 2.38 3.34 3.91 3.73 3.49
Market Capitalisation (EGPmn) 8,010.0 8,010.0 8,010.0 8,010.0 8,010.0 8,010.0Enterprise Value (EGPmn) 12,912.1 12,175.0 14,391.9 13,784.2 13,983.6 13,381.9
ProfitabilityROE (%) 87.97 69.56 32.93 -1.31 11.99 14.18ROA (%) 14.43 13.92 8.16 -0.33 3.12 3.76Asset Turnover (x) 0.73 0.74 0.63 0.62 0.64 0.66EBITDA Margin (%) 46.80 47.39 40.74 34.64 36.97 36.93
LiquidityND/Equity (x) 2.19 1.42 1.54 1.42 1.45 1.28ND/EBITDA (x) 1.05 0.81 1.48 1.64 1.59 1.40
Source: Company Financials & CICR Database
2008a 2009a 2010a 2011e 2012e 2013e
Page | 211

Page | 25
Egypt Book 2011/12 | Telecom Services
For more information on CICR, please visit our website at http://research.cicr.com.eg/register.php or contact us at [email protected]. Disclosures and details pertaining to stock ratings on last page.
January 26, 2012
Renewed licenses – and optimism VimpelCom in talks with the Algerian government to sell a 51% stake in
Djezzy.
Renewal of existing licenses in Bangladesh.
Recent top management changes to reflect the new owners.
Successful demerger of OTMT after a two-month long trading suspension.
Djezzy is set to remain the catalyst for ORTE’s stock performance going into 2012, and we are optimistic the recently-signed non-binding memorandum of understanding (MoU) between VimpelCom and the Algerian government may end the two-year long dispute over the operator. Meanwhile, the successful renewal of Banglalink’s 2G license assures ORTE’s future presence in the country and its contribution to its revenue stream.
2011 Review As a result of VimpelCom’s acquisition of Wind Telecom, ORTE completed the demerger of assets not included in the deal into a new firm, Orascom Telecom Media & Technology Holding (OTMT), and accordingly the shares of both companies were successfully listed and traded on the Egyptian Exchange (EGX) according to their new trading prices. VimpelCom also assumed control of ORTE’s board by appointing Mr. Jo Lunder to the position of Chairman, replacing Mr. Khaled Bichara, thus reflecting ORTE's new owners. Meanwhile, in order to sustain its revenues and EBITDA streams going forward, ORTE renewed its 2G license in Bangladesh, as well as its management contract of the Lebanese Alfa. It also managed to free itself of its Namibian operator, Powercom, pursuant to its strategy to dispose of non-core assets.
2012 Preview We believe Djezzy will continue to be the catalyst for the ORTE’s (post-demerger) stock performance going into 2012. The recently-signed non-binding MoU between VimpelCom and the Algerian government to explore the possibility of selling a majority stake (c.51%) to the latter can be viewed as a potential end to a 2-year-long dispute that dates back to late 2009. However, the price and timeline of the transaction have not yet been disclosed. On the financial front, we expect continued revenue growth while maintaining healthy EBITDA level and further benefiting from the growing subscriber base (now standing at 73.4mn) by offering them more value-added services, as well as taking advantage of potential synergies from being part of the enlarged VimpelCom global telecom group.
Valuation & Recommendation We set our post-demerger long-term fair value (LTFV) and target price (TP) at EGP4.8/share (USD4.0/GDS) and EGP3.9/share (USD3.2/GDS), respectively. Our TP is based on four different probability-weighted scenarios for Djezzy, and our LTFV is driven off our DCF-based sum-of-the-parts model. Our recommendation for ORTE (post-demerger) is Strong Buy.
Amr Hussein Elalfy, CFA [email protected]
Yehia El Sherbiny [email protected]
Strong Buy TP – USD 3.2 | 61.7% Upside
Orascom Telecom
GDS Details As at: 21-Jan-12
CICR Rating/RiskTarget Price/LTFV (USD)
Last Price (USD)52 Week High52 Week Low6M Av. Daily Vo l. (000' shrs)% Chg: M oM / 6M / YoY
No. of Shares (mn)M kt. Cap (EGPmn)M kt. Cap (USDmn)*Free Float (%)Paid in Capital (USDmn)
Reuters / B loombergISIN
Company Profile
Ow nership StructureWind Telecom (100% owned by VimpelCom) 51.9%Free Float 48.1%
Source: Bloomberg / CICR
3.2 / 4
1.98
Strong Buy/High
507.00
21,673.73
48.10
US68554W2052
*USD:EGP FX: 6.04
Orascom Telecom Holding (OTH) is a leading regionalmobile operators and among the largest in the M iddle Eastand Africa. ORTE’s GSM networks cover 10 main countrieswith a to tal population of around 490mn. In December 2007,OTH so ld its GSM operator in Iraq to Zain for USD1.2bn andin 4Q10 OTH sold its stake in Tunisiana (Tunisia) forUSD1.2bn. Early 2008, OTH has been granted the first 25-year commercial license to provide mobile services in theNorth Korea, with an exclusivity period of four years. Inpartnership with Canada-based Globalive, OTH won anAWS spectrum in Canada which started operations at endof 2009 under the brand name WIND M obile. In 2010,Russia’s VimpelCom signed an agreement with WindTelecom (shareho lder of OTH) to merge their telecomassets, creating the world’s sixth-largest mobile companyby subs. As per the agreement, OTH will spin o ff a numbero f its assets, no t intended to form part o f the VimpelCom-Wind Telecom group, into a new company, OrascomTelecom M edia & Techno logy Ho lding (OTM T).
3.901.11
1049.14
951.91
ORTE.CA / OTLD LI Equity
3,587.00
20.8 / 4.6 / -6.8
-
20.0
40.0
60.0
80.0
100.0
120.0
-
0.5
1.0
1.5
2.0
2.5
3.0
Jan-11 Mar-11 May-11 Jul-11 Sep-11 Nov-11
mn shrsCurr.Volume ORTEEGX 30 (rebased)
52 week Share Performance
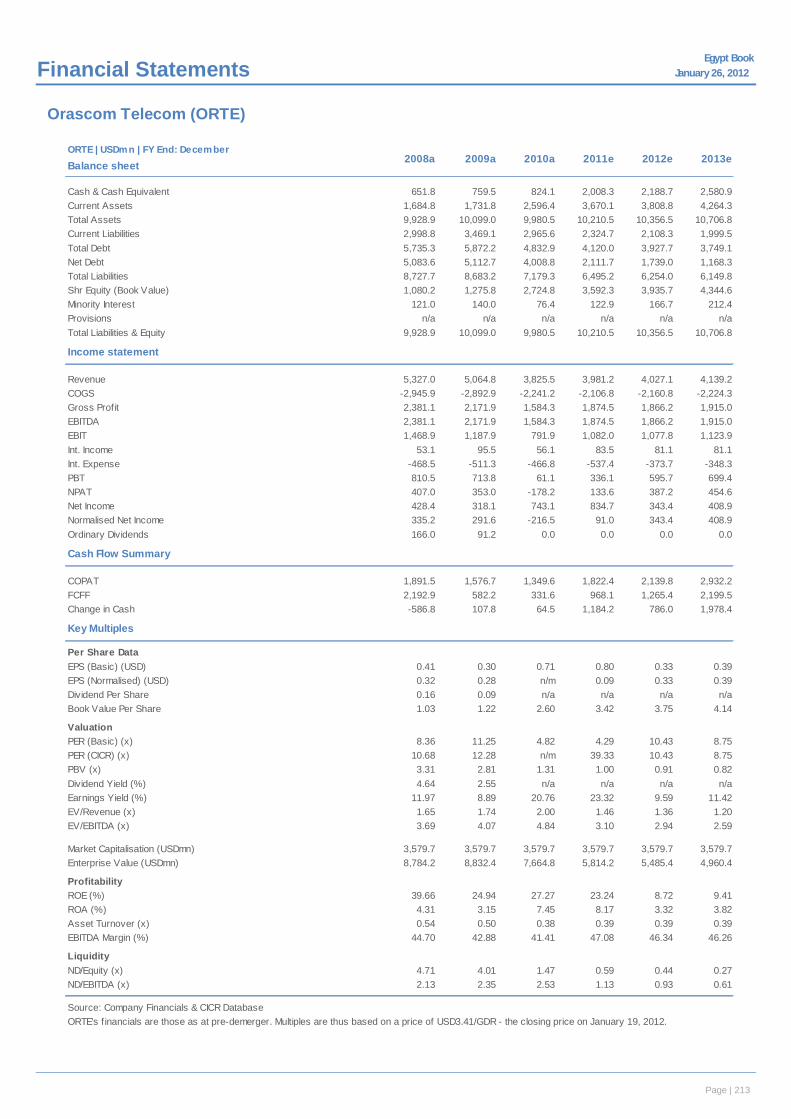
Page | 26
Egypt Book January 26, 2012x Financial Statements
Orascom Telecom (ORTE)
ORTE | USDmn | FY End: DecemberBalance sheet
Cash & Cash Equivalent 651.8 759.5 824.1 2,008.3 2,188.7 2,580.9Current Assets 1,684.8 1,731.8 2,596.4 3,670.1 3,808.8 4,264.3Total Assets 9,928.9 10,099.0 9,980.5 10,210.5 10,356.5 10,706.8Current Liabilities 2,998.8 3,469.1 2,965.6 2,324.7 2,108.3 1,999.5Total Debt 5,735.3 5,872.2 4,832.9 4,120.0 3,927.7 3,749.1Net Debt 5,083.6 5,112.7 4,008.8 2,111.7 1,739.0 1,168.3Total Liabilities 8,727.7 8,683.2 7,179.3 6,495.2 6,254.0 6,149.8Shr Equity (Book Value) 1,080.2 1,275.8 2,724.8 3,592.3 3,935.7 4,344.6Minority Interest 121.0 140.0 76.4 122.9 166.7 212.4Provisions n/a n/a n/a n/a n/a n/aTotal Liabilities & Equity 9,928.9 10,099.0 9,980.5 10,210.5 10,356.5 10,706.8
Income statement
Revenue 5,327.0 5,064.8 3,825.5 3,981.2 4,027.1 4,139.2COGS -2,945.9 -2,892.9 -2,241.2 -2,106.8 -2,160.8 -2,224.3Gross Profit 2,381.1 2,171.9 1,584.3 1,874.5 1,866.2 1,915.0EBITDA 2,381.1 2,171.9 1,584.3 1,874.5 1,866.2 1,915.0EBIT 1,468.9 1,187.9 791.9 1,082.0 1,077.8 1,123.9Int. Income 53.1 95.5 56.1 83.5 81.1 81.1Int. Expense -468.5 -511.3 -466.8 -537.4 -373.7 -348.3PBT 810.5 713.8 61.1 336.1 595.7 699.4NPAT 407.0 353.0 -178.2 133.6 387.2 454.6Net Income 428.4 318.1 743.1 834.7 343.4 408.9Normalised Net Income 335.2 291.6 -216.5 91.0 343.4 408.9Ordinary Dividends 166.0 91.2 0.0 0.0 0.0 0.0
Cash Flow Summary
COPAT 1,891.5 1,576.7 1,349.6 1,822.4 2,139.8 2,932.2FCFF 2,192.9 582.2 331.6 968.1 1,265.4 2,199.5Change in Cash -586.8 107.8 64.5 1,184.2 786.0 1,978.4
Key Multiples
Per Share DataEPS (Basic) (USD) 0.41 0.30 0.71 0.80 0.33 0.39EPS (Normalised) (USD) 0.32 0.28 n/m 0.09 0.33 0.39Dividend Per Share 0.16 0.09 n/a n/a n/a n/aBook Value Per Share 1.03 1.22 2.60 3.42 3.75 4.14
ValuationPER (Basic) (x) 8.36 11.25 4.82 4.29 10.43 8.75PER (CICR) (x) 10.68 12.28 n/m 39.33 10.43 8.75PBV (x) 3.31 2.81 1.31 1.00 0.91 0.82Dividend Yield (%) 4.64 2.55 n/a n/a n/a n/aEarnings Yield (%) 11.97 8.89 20.76 23.32 9.59 11.42EV/Revenue (x) 1.65 1.74 2.00 1.46 1.36 1.20EV/EBITDA (x) 3.69 4.07 4.84 3.10 2.94 2.59
Market Capitalisation (USDmn) 3,579.7 3,579.7 3,579.7 3,579.7 3,579.7 3,579.7Enterprise Value (USDmn) 8,784.2 8,832.4 7,664.8 5,814.2 5,485.4 4,960.4
ProfitabilityROE (%) 39.66 24.94 27.27 23.24 8.72 9.41ROA (%) 4.31 3.15 7.45 8.17 3.32 3.82Asset Turnover (x) 0.54 0.50 0.38 0.39 0.39 0.39EBITDA Margin (%) 44.70 42.88 41.41 47.08 46.34 46.26
LiquidityND/Equity (x) 4.71 4.01 1.47 0.59 0.44 0.27ND/EBITDA (x) 2.13 2.35 2.53 1.13 0.93 0.61
Source: Company Financials & CICR DatabaseORTE's f inancials are those as at pre-demerger. Multiples are thus based on a price of USD3.41/GDR - the closing price on January 19, 2012.
2008a 2009a 2010a 2011e 2012e 2013e
Page | 213

Page | 27
Egypt Book 2011/12 | Telecom Services
For more information on CICR, please visit our website at http://research.cicr.com.eg/register.php or contact us at [email protected]. Disclosures and details pertaining to stock ratings on last page.
January 26, 2012
Performance stimulated by strong fundamentals Performance balanced by a diversified business model.
Employee protests put top management under pressure.
ETEL might become an integrated operator in 2012 by launching MVNO and triple-play services.
Telecom Egypt [ETEL] has delivered a balanced top line performance so far in 2011, thanks to its diversified business model, which was mainly characterized by internet & data and wholesale growth. In addition, the company’s launch of its TE-NORTH (TEN) cable system operations further supported top-line growth. However, margins were hit in 2011 by the extraordinary salary increase, following employees’ protests. Absent any acquisition target, ETEL is still determined to fulfil its strategy in 2012, possibly by providing mobile services under a mobile virtual network operator (MVNO) business model, in addition to triple-play services in gated communities. ETEL’s strong balance sheet supported by its robust net cash position will likely result in higher dividends in 2012.
2011 Review In response to employee protests demanding higher salaries following the revolution, ETEL approved in February 2011 an extraordinary 15% increase in salaries, starting March 1, 2011. Later on, in October, a number of workers at TE protested and demanded higher wages; this put some pressure on the company’s margins. In early August, ETEL announced that the TEN Cable System is in service at a speed of 40 Gigabit/sec (40G), making it the first Mediterranean cable network to provide commercial service using this newest 40G technology. In an attempt to boost voice call traffic, ETEL launched a promotion till year end, by virtue of which the long-distance call tariff matches the local call tariff of EGP0.03/min, while the fixed-to-mobile call tariff was lowered from EGP0.15/min to EGP0.14/min. We believe such promotion will be extended into 2012.
2012 Preview Due to ongoing unrest, the government has delayed several projects into 2012. Should the macro picture improve, ETEL might become an integrated telecom operator in 2012 by launching MVNO and triple-play services in gated communities. The company has a strong net cash position that could help in targeting either a local or regional investment opportunity. Tough competition from mobile operators will likely continue to exert pressure on ETEL’s revenues— to be mitigated by strong internet growth and cable revenues. The company will undertake a restructuring plan for salaries in 2012. So we expect higher salaries and hence lower margins in 2012. The first phase of will be implemented in January 2012 on about 80% of the employees and the remaining 20% will be in March 2012.
Valuation & Recommendation Our DCF-based fair value for ETEL stands at EGP21.9/share, including its 45% stake in Vodafone Egypt and 100% ownership of Egypt's leading ISP, TE Data. Meanwhile, our TP is EGP21/share, implying a 2011e EV/EBITDA multiple at 3.7x. Our recommendation is Buy with a Moderate Risk rating.
Mohamed Hamdy [email protected]
+20 333-18-360
Buy TP - EGP 21 | 45.7% Upside
Telecom Egypt
Stock Details As at: 21-Jan-12
CICR Rating/RiskTarget Price/LTFV (EGP)
Last Price (EGP)52 Week High52 Week Low6M Av. Daily Vo l. (000' shrs)% Chg: M oM / 6M / YoY
No. of Shares (mn)M kt. Cap (EGPmn)M kt. Cap (USDmn)*Free Float (%)Paid in Capital (EGPmn)
Reuters / B loombergISIN
GDR DataLast Price (USD)52 Week High52 Week Low
Company Profile
Ow nership StructureGovernment o f Egypt (GoE) 80.0%Free Float 20.0%
Source: Bloomberg / CICR *USD:EGP FX: 6.04
In 1998, the Egyptian government converted its ArabRepublic of Egypt National TelecommunicationOrganization (ARENTO) into a joint stock company in 1998according to Law No. 19/1998, thus establishing TelecomEgypt [ETEL]. ETEL is Egypt's so le fixed-linetelecommunication operator, o ffering retailtelecommunication services including access, vo ice, andinternet and data through its subsidiary TE Data. It is alsothe so le provider o f who lesale services (includingbroadband capacity leasing to ISPs) and both national andinternational interconnection services.
The entity is one of the largest providers o f fixed-lineservices in the M iddle East & Africa, with more than 9.6mnsubscribers as of M arch 2010, implying a penetration rate ofc.12%. ETEL competes in Egypt’ s fast-growing mobilemarket through its 45% stake in Vodafone Egypt (VFE),Egypt’ s second largest mobile operator in terms ofsubscribers. ETEL’s ISP subsidiary, TE Data has a leadingmarket share o f 61%.
18.0011.99
1707.07
475.88
ETEL.CA / ETEL Ey Equity
4,072.67
6.7 / -8 / -17.7
17,070.72
24,598.91
11.5117.23
20.00
EGS48031C016
10.04
21 / 21.9
14.41
Buy/M oderate
-
2.0
4.0
6.0
8.0
10.0
-
5.0
10.0
15.0
20.0
25.0
Jan-11 Mar-11 May-11 Jul-11 Sep-11 Nov-11
mn shrsCurr.Volume ETELEGX 30 (rebased)
52 week Share Performance
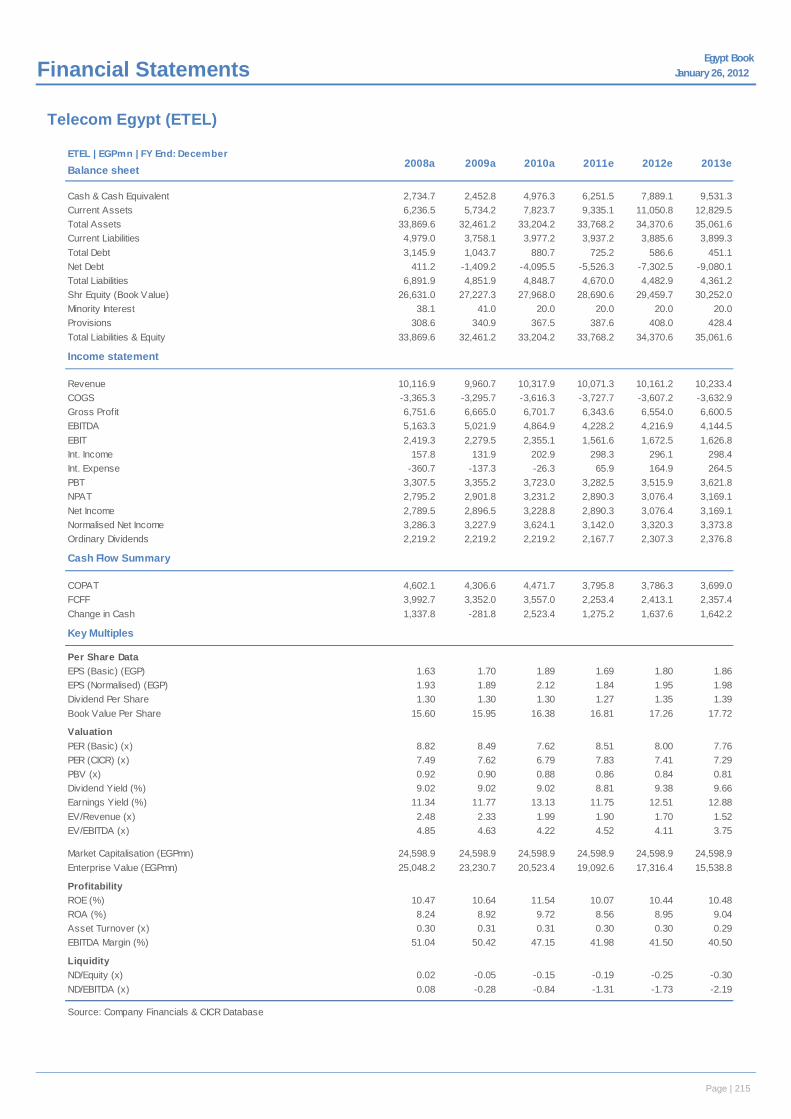
Page | 28
Egypt Book January 26, 2012x Financial Statements
Telecom Egypt (ETEL)
cETEL | EGPmn | FY End: December
Balance sheet
Cash & Cash Equivalent 2,734.7 2,452.8 4,976.3 6,251.5 7,889.1 9,531.3Current Assets 6,236.5 5,734.2 7,823.7 9,335.1 11,050.8 12,829.5Total Assets 33,869.6 32,461.2 33,204.2 33,768.2 34,370.6 35,061.6Current Liabilities 4,979.0 3,758.1 3,977.2 3,937.2 3,885.6 3,899.3Total Debt 3,145.9 1,043.7 880.7 725.2 586.6 451.1Net Debt 411.2 -1,409.2 -4,095.5 -5,526.3 -7,302.5 -9,080.1Total Liabilities 6,891.9 4,851.9 4,848.7 4,670.0 4,482.9 4,361.2Shr Equity (Book Value) 26,631.0 27,227.3 27,968.0 28,690.6 29,459.7 30,252.0Minority Interest 38.1 41.0 20.0 20.0 20.0 20.0Provisions 308.6 340.9 367.5 387.6 408.0 428.4Total Liabilities & Equity 33,869.6 32,461.2 33,204.2 33,768.2 34,370.6 35,061.6
Income statement
Revenue 10,116.9 9,960.7 10,317.9 10,071.3 10,161.2 10,233.4COGS -3,365.3 -3,295.7 -3,616.3 -3,727.7 -3,607.2 -3,632.9Gross Profit 6,751.6 6,665.0 6,701.7 6,343.6 6,554.0 6,600.5EBITDA 5,163.3 5,021.9 4,864.9 4,228.2 4,216.9 4,144.5EBIT 2,419.3 2,279.5 2,355.1 1,561.6 1,672.5 1,626.8Int. Income 157.8 131.9 202.9 298.3 296.1 298.4Int. Expense -360.7 -137.3 -26.3 65.9 164.9 264.5PBT 3,307.5 3,355.2 3,723.0 3,282.5 3,515.9 3,621.8NPAT 2,795.2 2,901.8 3,231.2 2,890.3 3,076.4 3,169.1Net Income 2,789.5 2,896.5 3,228.8 2,890.3 3,076.4 3,169.1Normalised Net Income 3,286.3 3,227.9 3,624.1 3,142.0 3,320.3 3,373.8Ordinary Dividends 2,219.2 2,219.2 2,219.2 2,167.7 2,307.3 2,376.8
Cash Flow Summary
COPAT 4,602.1 4,306.6 4,471.7 3,795.8 3,786.3 3,699.0FCFF 3,992.7 3,352.0 3,557.0 2,253.4 2,413.1 2,357.4Change in Cash 1,337.8 -281.8 2,523.4 1,275.2 1,637.6 1,642.2
Key Multiples
Per Share DataEPS (Basic) (EGP) 1.63 1.70 1.89 1.69 1.80 1.86EPS (Normalised) (EGP) 1.93 1.89 2.12 1.84 1.95 1.98Dividend Per Share 1.30 1.30 1.30 1.27 1.35 1.39Book Value Per Share 15.60 15.95 16.38 16.81 17.26 17.72
ValuationPER (Basic) (x) 8.82 8.49 7.62 8.51 8.00 7.76PER (CICR) (x) 7.49 7.62 6.79 7.83 7.41 7.29PBV (x) 0.92 0.90 0.88 0.86 0.84 0.81Dividend Yield (%) 9.02 9.02 9.02 8.81 9.38 9.66Earnings Yield (%) 11.34 11.77 13.13 11.75 12.51 12.88EV/Revenue (x) 2.48 2.33 1.99 1.90 1.70 1.52EV/EBITDA (x) 4.85 4.63 4.22 4.52 4.11 3.75
Market Capitalisation (EGPmn) 24,598.9 24,598.9 24,598.9 24,598.9 24,598.9 24,598.9Enterprise Value (EGPmn) 25,048.2 23,230.7 20,523.4 19,092.6 17,316.4 15,538.8
ProfitabilityROE (%) 10.47 10.64 11.54 10.07 10.44 10.48ROA (%) 8.24 8.92 9.72 8.56 8.95 9.04Asset Turnover (x) 0.30 0.31 0.31 0.30 0.30 0.29EBITDA Margin (%) 51.04 50.42 47.15 41.98 41.50 40.50
LiquidityND/Equity (x) 0.02 -0.05 -0.15 -0.19 -0.25 -0.30ND/EBITDA (x) 0.08 -0.28 -0.84 -1.31 -1.73 -2.19
Source: Company Financials & CICR Database
2008a 2009a 2010a 2011e 2012e 2013e
Page | 215
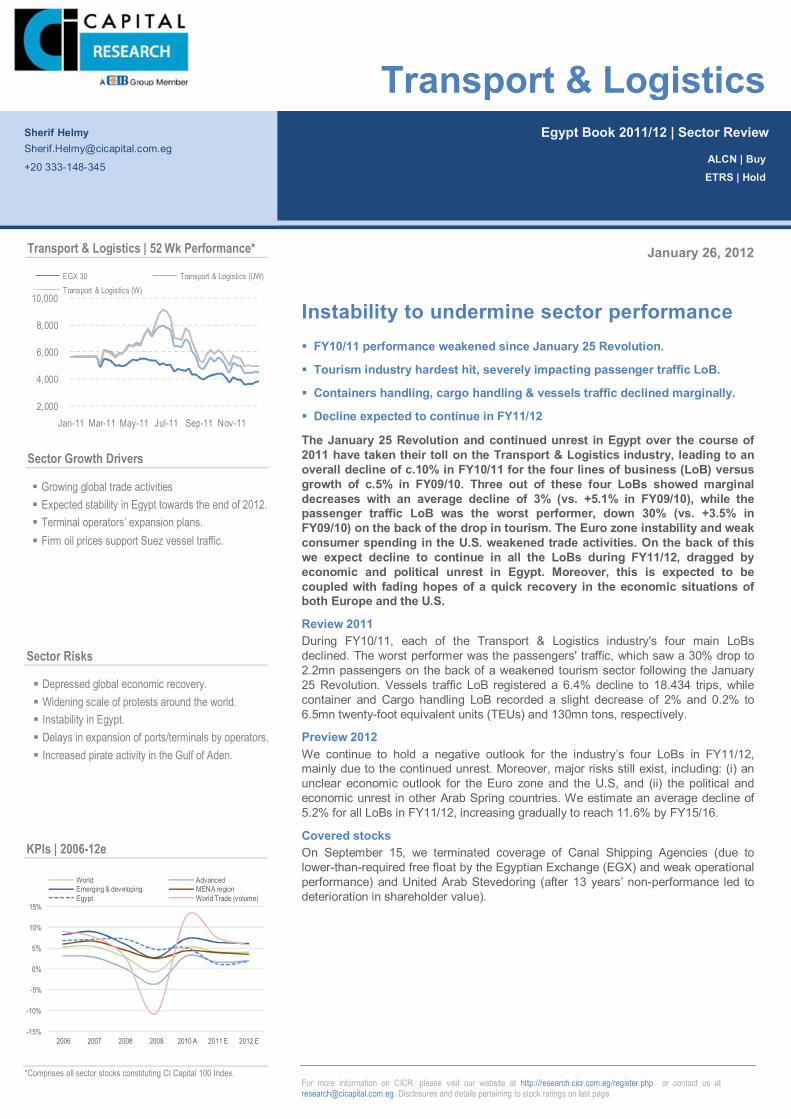
Page | 216
Page | 216
For more information on CICR, please visit our website at http://research.cicr.com.eg/register.php or contact us at [email protected]. Disclosures and details pertaining to stock ratings on last page.
January 26, 2012
Instability to undermine sector performance FY10/11 performance weakened since January 25 Revolution.
Tourism industry hardest hit, severely impacting passenger traffic LoB.
Containers handling, cargo handling & vessels traffic declined marginally.
Decline expected to continue in FY11/12
The January 25 Revolution and continued unrest in Egypt over the course of 2011 have taken their toll on the Transport & Logistics industry, leading to an overall decline of c.10% in FY10/11 for the four lines of business (LoB) versus growth of c.5% in FY09/10. Three out of these four LoBs showed marginal decreases with an average decline of 3% (vs. +5.1% in FY09/10), while the passenger traffic LoB was the worst performer, down 30% (vs. +3.5% in FY09/10) on the back of the drop in tourism. The Euro zone instability and weak consumer spending in the U.S. weakened trade activities. On the back of this we expect decline to continue in all the LoBs during FY11/12, dragged by economic and political unrest in Egypt. Moreover, this is expected to be coupled with fading hopes of a quick recovery in the economic situations of both Europe and the U.S.
Review 2011 During FY10/11, each of the Transport & Logistics industry's four main LoBs declined. The worst performer was the passengers' traffic, which saw a 30% drop to 2.2mn passengers on the back of a weakened tourism sector following the January 25 Revolution. Vessels traffic LoB registered a 6.4% decline to 18.434 trips, while container and Cargo handling LoB recorded a slight decrease of 2% and 0.2% to 6.5mn twenty-foot equivalent units (TEUs) and 130mn tons, respectively.
Preview 2012 We continue to hold a negative outlook for the industry’s four LoBs in FY11/12, mainly due to the continued unrest. Moreover, major risks still exist, including: (i) an unclear economic outlook for the Euro zone and the U.S, and (ii) the political and economic unrest in other Arab Spring countries. We estimate an average decline of 5.2% for all LoBs in FY11/12, increasing gradually to reach 11.6% by FY15/16.
Covered stocks On September 15, we terminated coverage of Canal Shipping Agencies (due to lower-than-required free float by the Egyptian Exchange (EGX) and weak operational performance) and United Arab Stevedoring (after 13 years’ non-performance led to deterioration in shareholder value).
Egypt Book 2011/12 | Sector Review
Transport & Logistics
ALCN | Buy ETRS | Hold
Sherif Helmy [email protected]
+20 333-148-345
Growing global trade activities Expected stability in Egypt towards the end of 2012. Terminal operators’ expansion plans. Firm oil prices support Suez vessel traffic.
Depressed global economic recovery. Widening scale of protests around the world. Instability in Egypt. Delays in expansion of ports/terminals by operators. Increased pirate activity in the Gulf of Aden.
Transport & Logistics | 52 Wk Performance*
2,000
4,000
6,000
8,000
10,000
Jan-11 Mar-11 May-11 Jul-11 Sep-11 Nov-11
EGX 30 Transport & Logistics (UW)Transport & Logistics (W)
Sector Growth Drivers
Sector Risks
-15%
-10%
-5%
0%
5%
10%
15%
2006 2007 2008 2009 2010 A 2011 E 2012 E
World AdvancedEmerging & developing MENA regionEgypt World Trade (volume)
KPIs | 2006-12e
*Comprises all sector stocks constituting CI Capital 100 Index.
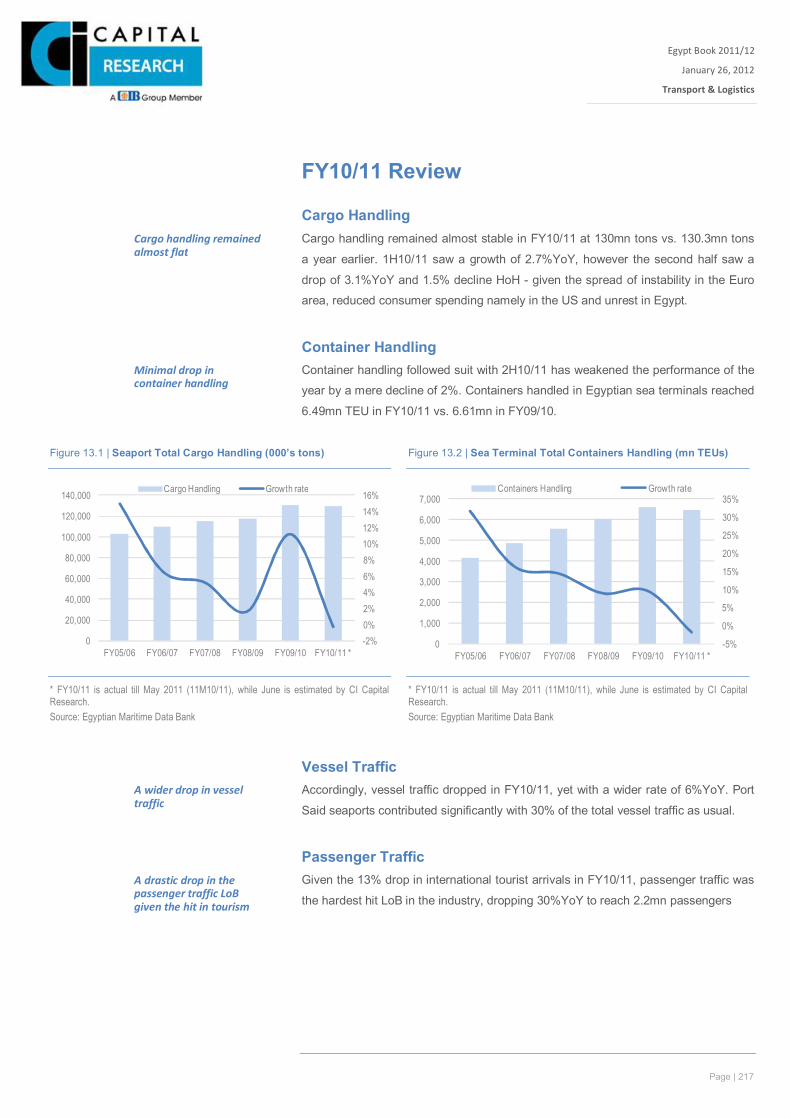
Page | 217
Egypt Book 2011/12
January 26, 2012
Transport & Logistics
Xxx
FY10/11 Review
Cargo Handling Cargo handling remained almost stable in FY10/11 at 130mn tons vs. 130.3mn tons
a year earlier. 1H10/11 saw a growth of 2.7%YoY, however the second half saw a
drop of 3.1%YoY and 1.5% decline HoH - given the spread of instability in the Euro
area, reduced consumer spending namely in the US and unrest in Egypt.
Container Handling Container handling followed suit with 2H10/11 has weakened the performance of the
year by a mere decline of 2%. Containers handled in Egyptian sea terminals reached
6.49mn TEU in FY10/11 vs. 6.61mn in FY09/10.
Vessel Traffic Accordingly, vessel traffic dropped in FY10/11, yet with a wider rate of 6%YoY. Port
Said seaports contributed significantly with 30% of the total vessel traffic as usual.
Passenger Traffic Given the 13% drop in international tourist arrivals in FY10/11, passenger traffic was
the hardest hit LoB in the industry, dropping 30%YoY to reach 2.2mn passengers
Cargo handling remained almost flat
Minimal drop in container handling
A wider drop in vessel traffic
A drastic drop in the passenger traffic LoB given the hit in tourism
Figure 13.1 | Seaport Total Cargo Handling (000’s tons) Figure 13.2 | Sea Terminal Total Containers Handling (mn TEUs)
* FY10/11 is actual till May 2011 (11M10/11), while June is estimated by CI Capital Research. Source: Egyptian Maritime Data Bank
* FY10/11 is actual till May 2011 (11M10/11), while June is estimated by CI Capital Research. Source: Egyptian Maritime Data Bank
-2%0%2%4%6%8%10%12%14%16%
0
20,000
40,000
60,000
80,000
100,000
120,000
140,000
FY05/06 FY06/07 FY07/08 FY08/09 FY09/10 FY10/11 *
Cargo Handling Growth rate
-5%
0%
5%
10%
15%
20%
25%
30%
35%
0
1,000
2,000
3,000
4,000
5,000
6,000
7,000
FY05/06 FY06/07 FY07/08 FY08/09 FY09/10 FY10/11 *
Containers Handling Growth rate
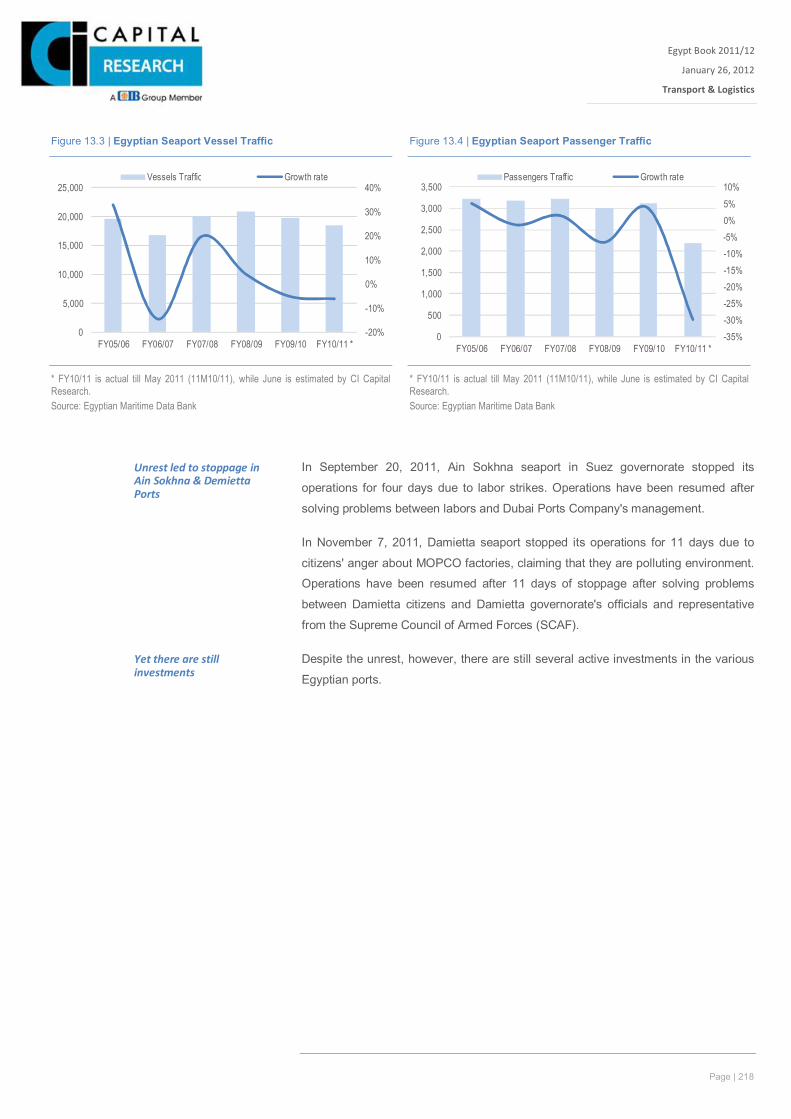
Page | 218
Egypt Book 2011/12
January 26, 2012
Transport & Logistics
Xxx
In September 20, 2011, Ain Sokhna seaport in Suez governorate stopped its
operations for four days due to labor strikes. Operations have been resumed after
solving problems between labors and Dubai Ports Company's management.
In November 7, 2011, Damietta seaport stopped its operations for 11 days due to
citizens' anger about MOPCO factories, claiming that they are polluting environment.
Operations have been resumed after 11 days of stoppage after solving problems
between Damietta citizens and Damietta governorate's officials and representative
from the Supreme Council of Armed Forces (SCAF).
Despite the unrest, however, there are still several active investments in the various
Egyptian ports.
Unrest led to stoppage in Ain Sokhna & Demietta Ports
Yet there are still investments
Figure 13.3 | Egyptian Seaport Vessel Traffic Figure 13.4 | Egyptian Seaport Passenger Traffic
* FY10/11 is actual till May 2011 (11M10/11), while June is estimated by CI Capital Research. Source: Egyptian Maritime Data Bank
* FY10/11 is actual till May 2011 (11M10/11), while June is estimated by CI Capital Research. Source: Egyptian Maritime Data Bank
-20%
-10%
0%
10%
20%
30%
40%
0
5,000
10,000
15,000
20,000
25,000
FY05/06 FY06/07 FY07/08 FY08/09 FY09/10 FY10/11 *
Vessels Traffic Growth rate
-35%-30%-25%-20%-15%-10%-5%0%5%10%
0
500
1,000
1,500
2,000
2,500
3,000
3,500
FY05/06 FY06/07 FY07/08 FY08/09 FY09/10 FY10/11 *
Passengers Traffic Growth rate
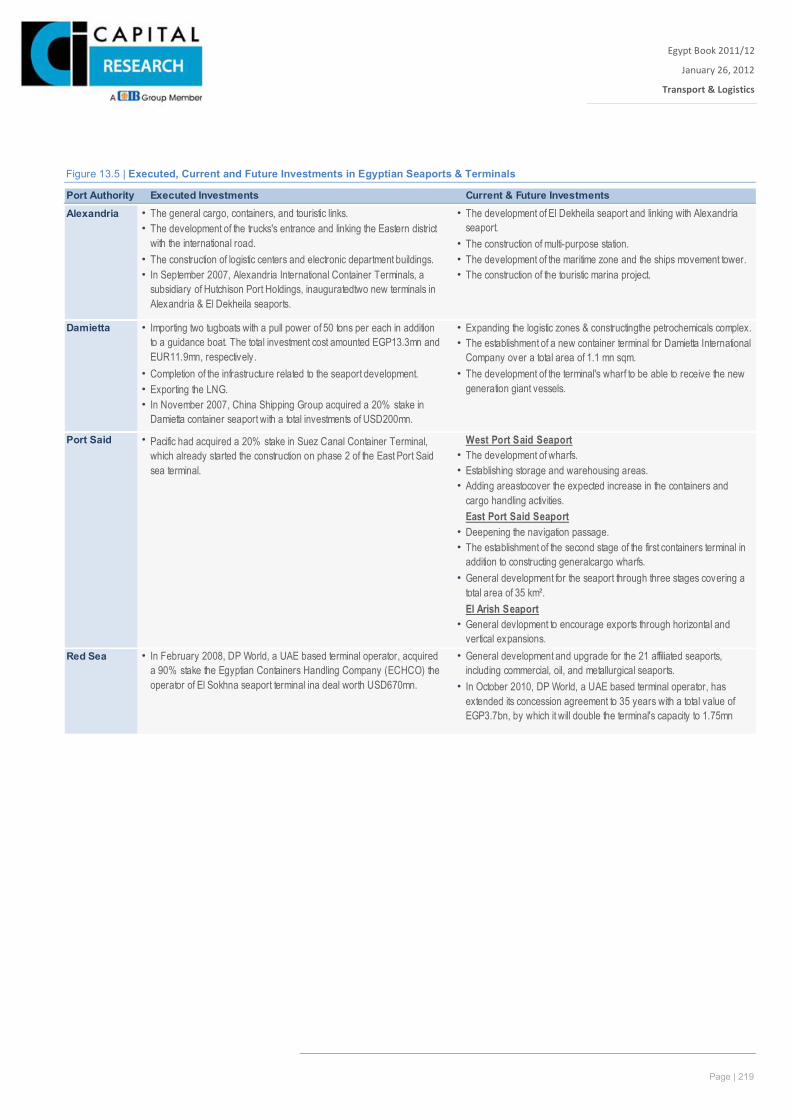
Page | 219
Egypt Book 2011/12
January 26, 2012
Transport & Logistics
Xxx
Figure 13.5 | Executed, Current and Future Investments in Egyptian Seaports & Terminals
Port Authority Executed Investments Current & Future Investments
Alexandria • The general cargo, containers, and touristic links. ••
• The construction of multi-purpose station.• The construction of logistic centers and electronic department buildings. • The development of the maritime zone and the ships movement tower.• • The construction of the touristic marina project.
Damietta • • Expanding the logistic zones & constructingthe petrochemicals complex.•
• Completion of the infrastructure related to the seaport development. •• Exporting the LNG.• In November 2007, China Shipping Group acquired a 20% stake in
Damietta container seaport with a total investments of USD200mn.
Port Said • West Port Said Seaport• The development of wharfs.• Establishing storage and warehousing areas.•
East Port Said Seaport• Deepening the navigation passage.•
•
El Arish Seaport•
Red Sea • •
•
In February 2008, DP World, a UAE based terminal operator, acquired a 90% stake the Egyptian Containers Handling Company (ECHCO) the operator of El Sokhna seaport terminal ina deal worth USD670mn.
The development of El Dekheila seaport and linking with Alexandria seaport.
Adding areastocover the expected increase in the containers and cargo handling activities.
The establishment of the second stage of the first containers terminal in addition to constructing generalcargo wharfs.General development for the seaport through three stages covering a total area of 35 km².
General devlopment to encourage exports through horizontal and vertical expansions.General development and upgrade for the 21 affiliated seaports, including commercial, oil, and metallurgical seaports.In October 2010, DP World, a UAE based terminal operator, has extended its concession agreement to 35 years with a total value of EGP3.7bn, by which it will double the terminal's capacity to 1.75mn TEUswithin the next four years.
The development of the trucks's entrance and linking the Eastern district with the international road.
In September 2007, Alexandria International Container Terminals, a subsidiary of Hutchison Port Holdings, inauguratedtwo new terminals in Alexandria & El Dekheila seaports.
Importing two tugboats with a pull power of 50 tons per each in addition to a guidance boat. The total investment cost amounted EGP13.3mn and EUR11.9mn, respectively.
In December 2007, it was announced that the Chinese based COSCO Pacific had acquired a 20% stake in Suez Canal Container Terminal, which already started the construction on phase 2 of the East Port Said sea terminal.
The establishment of a new container terminal for Damietta International Company over a total area of 1.1 mn sqm.The development of the terminal's wharf to be able to receive the new generation giant vessels.
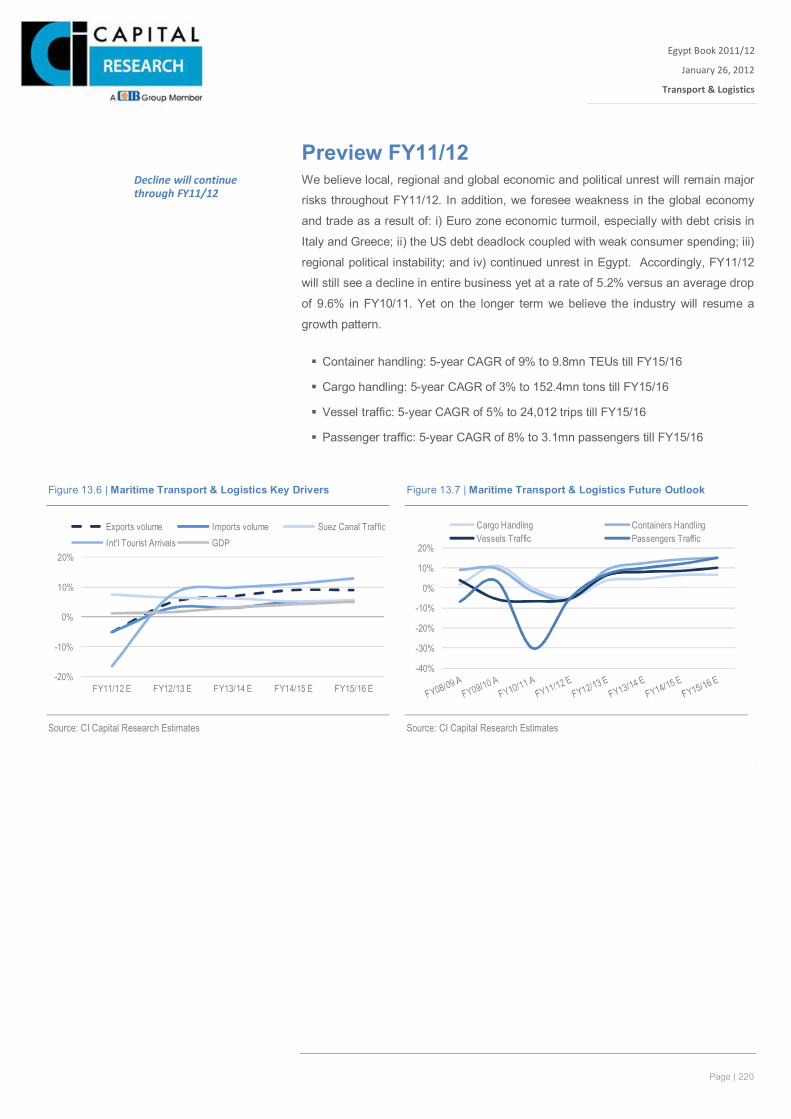
Page | 220
Egypt Book 2011/12
January 26, 2012
Transport & Logistics
Xxx
Preview FY11/12 We believe local, regional and global economic and political unrest will remain major
risks throughout FY11/12. In addition, we foresee weakness in the global economy
and trade as a result of: i) Euro zone economic turmoil, especially with debt crisis in
Italy and Greece; ii) the US debt deadlock coupled with weak consumer spending; iii)
regional political instability; and iv) continued unrest in Egypt. Accordingly, FY11/12
will still see a decline in entire business yet at a rate of 5.2% versus an average drop
of 9.6% in FY10/11. Yet on the longer term we believe the industry will resume a
growth pattern.
Container handling: 5-year CAGR of 9% to 9.8mn TEUs till FY15/16
Cargo handling: 5-year CAGR of 3% to 152.4mn tons till FY15/16
Vessel traffic: 5-year CAGR of 5% to 24,012 trips till FY15/16
Passenger traffic: 5-year CAGR of 8% to 3.1mn passengers till FY15/16
Figure 14.7 | Executed, Current and Future Investments in Egyptian Seaports & Terminals
Decline will continue through FY11/12
Figure 13.6 | Maritime Transport & Logistics Key Drivers Figure 13.7 | Maritime Transport & Logistics Future Outlook
Source: CI Capital Research Estimates
Source: CI Capital Research Estimates
-20%
-10%
0%
10%
20%
FY11/12 E FY12/13 E FY13/14 E FY14/15 E FY15/16 E
Exports volume Imports volume Suez Canal TrafficInt'l Tourist Arrivals GDP
-40%
-30%
-20%
-10%
0%
10%
20%
Cargo Handling Containers HandlingVessels Traffic Passengers Traffic
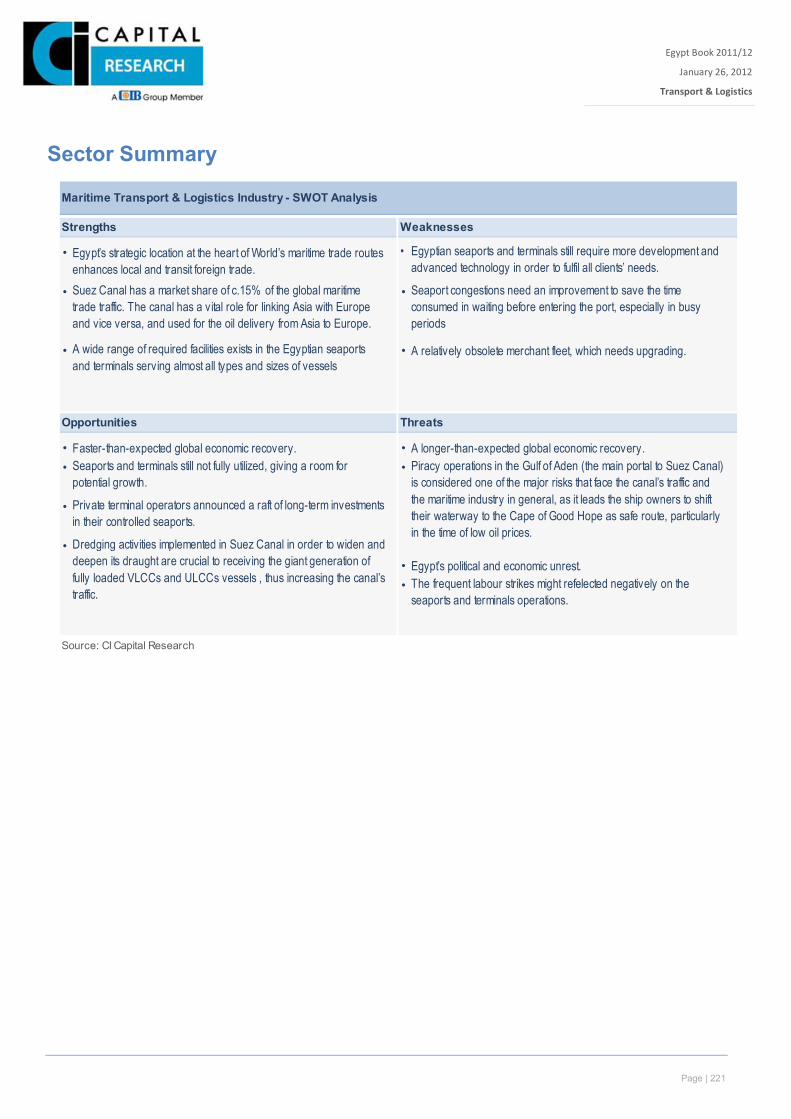
Page | 221
Egypt Book 2011/12
January 26, 2012
Transport & Logistics
Xxx
Sector Summary
Maritime Transport & Logistics Industry - SWOT Analysis
Strengths Weaknesses
•
• •
• • A relatively obsolete merchant fleet, which needs upgrading.
Opportunities Threats
• Faster-than-expected global economic recovery. • A longer-than-expected global economic recovery.• •
•
•• Egypt’s political and economic unrest.•
Source: CI Capital Research
Egypt’s strategic location at the heart of World’s maritime trade routes enhances local and transit foreign trade.Suez Canal has a market share of c.15% of the global maritime trade traffic. The canal has a vital role for linking Asia with Europe and vice versa, and used for the oil delivery from Asia to Europe.
A wide range of required facilities exists in the Egyptian seaports and terminals serving almost all types and sizes of vessels
Egyptian seaports and terminals still require more development and advanced technology in order to fulfil all clients’ needs.
Seaport congestions need an improvement to save the time consumed in waiting before entering the port, especially in busy periods
•
Seaports and terminals still not fully utilized, giving a room for potential growth.
Private terminal operators announced a raft of long-term investments in their controlled seaports.
Dredging activities implemented in Suez Canal in order to widen and deepen its draught are crucial to receiving the giant generation of fully loaded VLCCs and ULCCs vessels , thus increasing the canal’s traffic.
Piracy operations in the Gulf of Aden (the main portal to Suez Canal) is considered one of the major risks that face the canal’s traffic and the maritime industry in general, as it leads the ship owners to shift their waterway to the Cape of Good Hope as safe route, particularly in the time of low oil prices.
The frequent labour strikes might refelected negatively on the seaports and terminals operations.
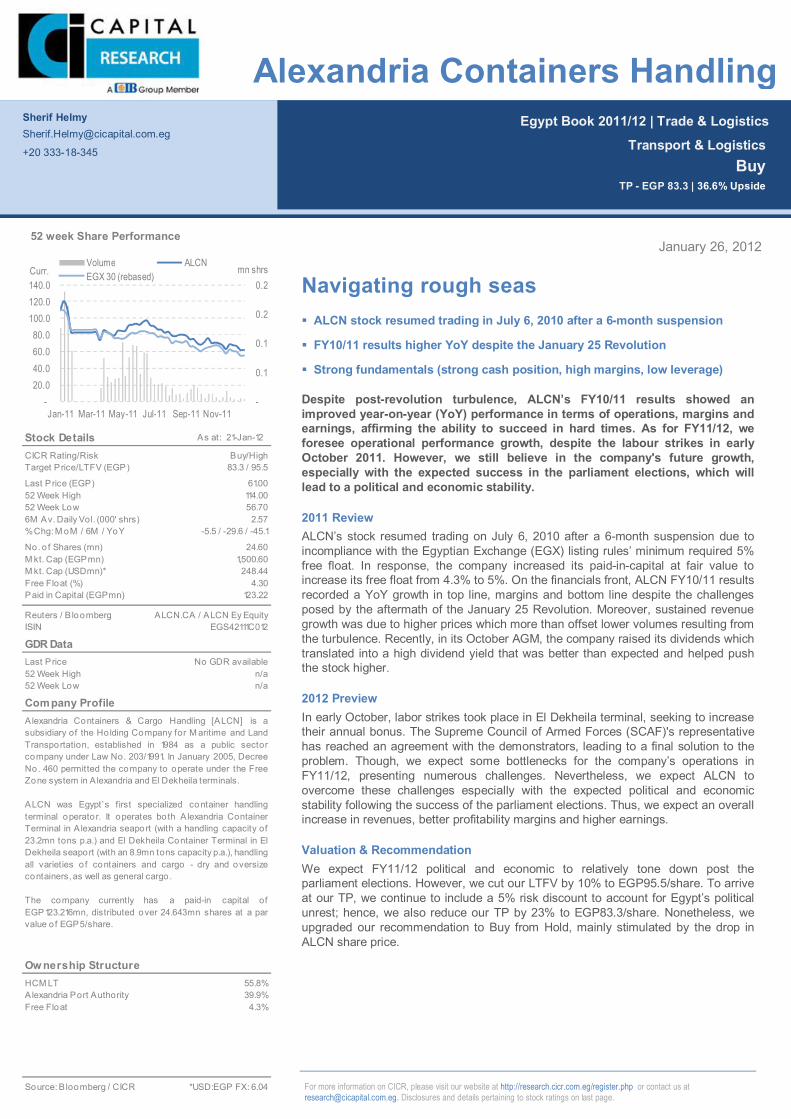
Page | 23
Egypt Book 2011/12 | Trade & Logistics
For more information on CICR, please visit our website at http://research.cicr.com.eg/register.php or contact us at [email protected]. Disclosures and details pertaining to stock ratings on last page.
January 26, 2012
Navigating rough seas ALCN stock resumed trading in July 6, 2010 after a 6-month suspension
FY10/11 results higher YoY despite the January 25 Revolution
Strong fundamentals (strong cash position, high margins, low leverage)
Despite post-revolution turbulence, ALCN’s FY10/11 results showed an improved year-on-year (YoY) performance in terms of operations, margins and earnings, affirming the ability to succeed in hard times. As for FY11/12, we foresee operational performance growth, despite the labour strikes in early October 2011. However, we still believe in the company's future growth, especially with the expected success in the parliament elections, which will lead to a political and economic stability.
2011 Review ALCN’s stock resumed trading on July 6, 2010 after a 6-month suspension due to incompliance with the Egyptian Exchange (EGX) listing rules’ minimum required 5% free float. In response, the company increased its paid-in-capital at fair value to increase its free float from 4.3% to 5%. On the financials front, ALCN FY10/11 results recorded a YoY growth in top line, margins and bottom line despite the challenges posed by the aftermath of the January 25 Revolution. Moreover, sustained revenue growth was due to higher prices which more than offset lower volumes resulting from the turbulence. Recently, in its October AGM, the company raised its dividends which translated into a high dividend yield that was better than expected and helped push the stock higher.
2012 Preview In early October, labor strikes took place in El Dekheila terminal, seeking to increase their annual bonus. The Supreme Council of Armed Forces (SCAF)'s representative has reached an agreement with the demonstrators, leading to a final solution to the problem. Though, we expect some bottlenecks for the company’s operations in FY11/12, presenting numerous challenges. Nevertheless, we expect ALCN to overcome these challenges especially with the expected political and economic stability following the success of the parliament elections. Thus, we expect an overall increase in revenues, better profitability margins and higher earnings.
Valuation & Recommendation We expect FY11/12 political and economic to relatively tone down post the parliament elections. However, we cut our LTFV by 10% to EGP95.5/share. To arrive at our TP, we continue to include a 5% risk discount to account for Egypt’s political unrest; hence, we also reduce our TP by 23% to EGP83.3/share. Nonetheless, we upgraded our recommendation to Buy from Hold, mainly stimulated by the drop in ALCN share price.
Sherif Helmy [email protected]
+20 333-18-345
Transport & Logistics Buy
TP - EGP 83.3 | 36.6% Upside
Alexandria Containers Handling
Stock Details As at: 21-Jan-12
CICR Rating/RiskTarget Price/LTFV (EGP)
Last Price (EGP)52 Week High52 Week Low6M Av. Daily Vol. (000' shrs)% Chg: M oM / 6M / YoY
No. o f Shares (mn)M kt. Cap (EGPmn)M kt. Cap (USDmn)*Free Float (%)Paid in Capital (EGPmn)
Reuters / B loombergISIN
GDR DataLast Price52 Week High52 Week Low
Company Profile
Ow nership StructureHCM LT 55.8%Alexandria Port Authority 39.9%Free Float 4.3%
Source: B loomberg / CICR *USD:EGP FX: 6.04
Alexandria Containers & Cargo Handling [ALCN] is asubsidiary of the Holding Company for M aritime and LandTransportation, established in 1984 as a public sectorcompany under Law No. 203/1991. In January 2005, DecreeNo. 460 permitted the company to operate under the FreeZone system in A lexandria and El Dekheila terminals. ALCN was Egypt’s first specialized container handlingterminal operator. It operates both Alexandria ContainerTerminal in A lexandria seaport (with a handling capacity of23.2mn tons p.a.) and El Dekheila Container Terminal in ElDekheila seaport (with an 8.9mn tons capacity p.a.), handling all varieties o f containers and cargo - dry and oversizecontainers, as well as general cargo .
The company currently has a paid-in capital ofEGP123.216mn, distributed over 24.643mn shares at a parvalue o f EGP5/share.
114.0056.70
24.60
2.57
ALCN.CA / ALCN Ey Equity
248.44
-5.5 / -29.6 / -45.1
123.22
1,500.60
No GDR availablen/a
4.30
EGS42111C012
n/a
83.3 / 95.5
61.00
Buy/High
-
0.1
0.1
0.2
0.2
-20.0 40.0 60.0 80.0
100.0 120.0 140.0
Jan-11 Mar-11 May-11 Jul-11 Sep-11 Nov-11
mn shrsCurr.Volume ALCNEGX 30 (rebased)
52 week Share Performance
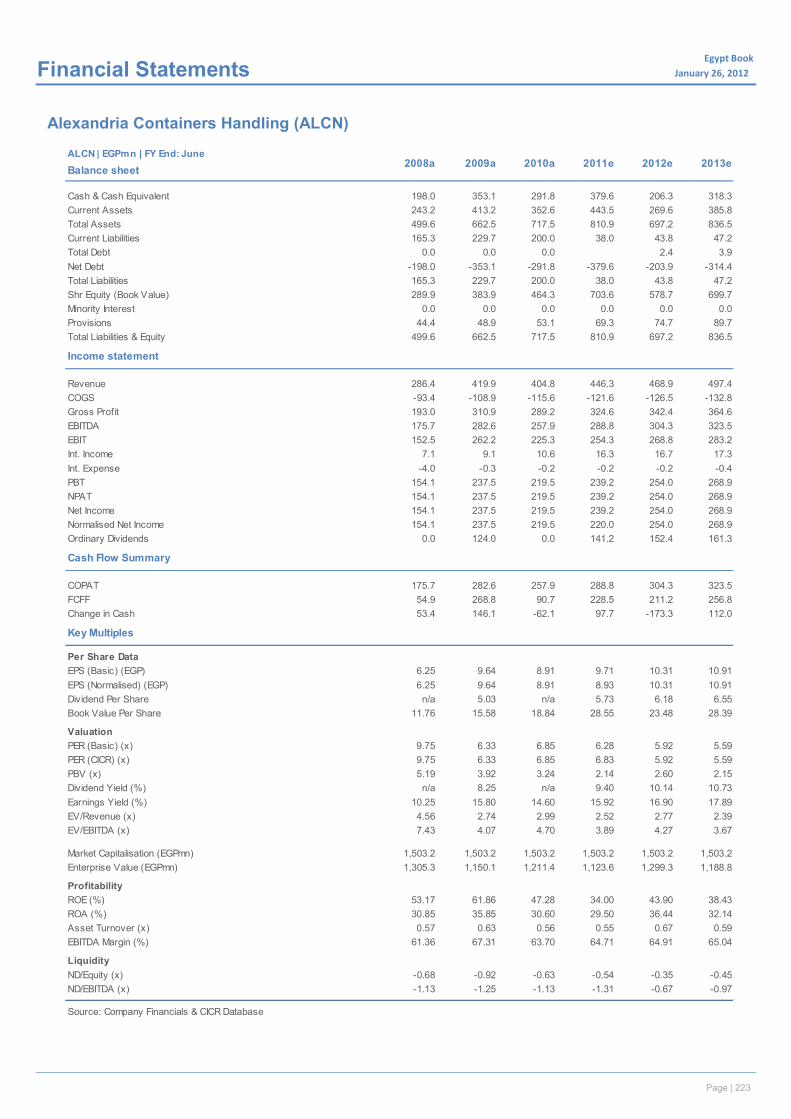
Page | 24
Egypt Book January 26, 2012x Financial Statements
Alexandria Containers Handling (ALCN)
cALCN | EGPmn | FY End: June
Balance sheet
Cash & Cash Equivalent 198.0 353.1 291.8 379.6 206.3 318.3Current Assets 243.2 413.2 352.6 443.5 269.6 385.8Total Assets 499.6 662.5 717.5 810.9 697.2 836.5Current Liabilities 165.3 229.7 200.0 38.0 43.8 47.2Total Debt 0.0 0.0 0.0 2.4 3.9Net Debt -198.0 -353.1 -291.8 -379.6 -203.9 -314.4Total Liabilities 165.3 229.7 200.0 38.0 43.8 47.2Shr Equity (Book Value) 289.9 383.9 464.3 703.6 578.7 699.7Minority Interest 0.0 0.0 0.0 0.0 0.0 0.0Provisions 44.4 48.9 53.1 69.3 74.7 89.7Total Liabilities & Equity 499.6 662.5 717.5 810.9 697.2 836.5
Income statement
Revenue 286.4 419.9 404.8 446.3 468.9 497.4COGS -93.4 -108.9 -115.6 -121.6 -126.5 -132.8Gross Profit 193.0 310.9 289.2 324.6 342.4 364.6EBITDA 175.7 282.6 257.9 288.8 304.3 323.5EBIT 152.5 262.2 225.3 254.3 268.8 283.2Int. Income 7.1 9.1 10.6 16.3 16.7 17.3Int. Expense -4.0 -0.3 -0.2 -0.2 -0.2 -0.4PBT 154.1 237.5 219.5 239.2 254.0 268.9NPAT 154.1 237.5 219.5 239.2 254.0 268.9Net Income 154.1 237.5 219.5 239.2 254.0 268.9Normalised Net Income 154.1 237.5 219.5 220.0 254.0 268.9Ordinary Dividends 0.0 124.0 0.0 141.2 152.4 161.3
Cash Flow Summary
COPAT 175.7 282.6 257.9 288.8 304.3 323.5FCFF 54.9 268.8 90.7 228.5 211.2 256.8Change in Cash 53.4 146.1 -62.1 97.7 -173.3 112.0
Key Multiples
Per Share DataEPS (Basic) (EGP) 6.25 9.64 8.91 9.71 10.31 10.91EPS (Normalised) (EGP) 6.25 9.64 8.91 8.93 10.31 10.91Dividend Per Share n/a 5.03 n/a 5.73 6.18 6.55Book Value Per Share 11.76 15.58 18.84 28.55 23.48 28.39
ValuationPER (Basic) (x) 9.75 6.33 6.85 6.28 5.92 5.59PER (CICR) (x) 9.75 6.33 6.85 6.83 5.92 5.59PBV (x) 5.19 3.92 3.24 2.14 2.60 2.15Dividend Yield (%) n/a 8.25 n/a 9.40 10.14 10.73Earnings Yield (%) 10.25 15.80 14.60 15.92 16.90 17.89EV/Revenue (x) 4.56 2.74 2.99 2.52 2.77 2.39EV/EBITDA (x) 7.43 4.07 4.70 3.89 4.27 3.67
Market Capitalisation (EGPmn) 1,503.2 1,503.2 1,503.2 1,503.2 1,503.2 1,503.2Enterprise Value (EGPmn) 1,305.3 1,150.1 1,211.4 1,123.6 1,299.3 1,188.8
ProfitabilityROE (%) 53.17 61.86 47.28 34.00 43.90 38.43ROA (%) 30.85 35.85 30.60 29.50 36.44 32.14Asset Turnover (x) 0.57 0.63 0.56 0.55 0.67 0.59EBITDA Margin (%) 61.36 67.31 63.70 64.71 64.91 65.04
LiquidityND/Equity (x) -0.68 -0.92 -0.63 -0.54 -0.35 -0.45ND/EBITDA (x) -1.13 -1.25 -1.13 -1.31 -0.67 -0.97
Source: Company Financials & CICR Database
2008a 2009a 2010a 2011e 2012e 2013e
Page | 223
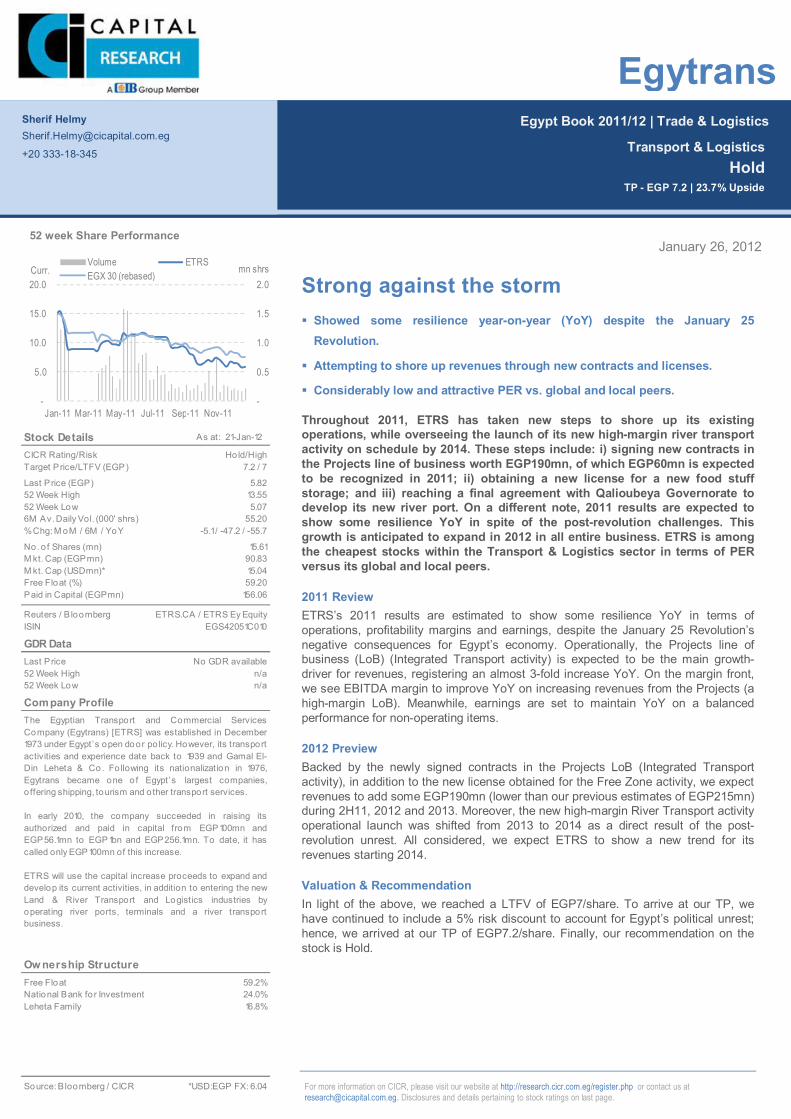
Page | 25
Egypt Book 2011/12 | Trade & Logistics
For more information on CICR, please visit our website at http://research.cicr.com.eg/register.php or contact us at [email protected]. Disclosures and details pertaining to stock ratings on last page.
January 26, 2012
Strong against the storm Showed some resilience year-on-year (YoY) despite the January 25
Revolution.
Attempting to shore up revenues through new contracts and licenses.
Considerably low and attractive PER vs. global and local peers.
Throughout 2011, ETRS has taken new steps to shore up its existing operations, while overseeing the launch of its new high-margin river transport activity on schedule by 2014. These steps include: i) signing new contracts in the Projects line of business worth EGP190mn, of which EGP60mn is expected to be recognized in 2011; ii) obtaining a new license for a new food stuff storage; and iii) reaching a final agreement with Qalioubeya Governorate to develop its new river port. On a different note, 2011 results are expected to show some resilience YoY in spite of the post-revolution challenges. This growth is anticipated to expand in 2012 in all entire business. ETRS is among the cheapest stocks within the Transport & Logistics sector in terms of PER versus its global and local peers.
2011 Review ETRS’s 2011 results are estimated to show some resilience YoY in terms of operations, profitability margins and earnings, despite the January 25 Revolution’s negative consequences for Egypt’s economy. Operationally, the Projects line of business (LoB) (Integrated Transport activity) is expected to be the main growth-driver for revenues, registering an almost 3-fold increase YoY. On the margin front, we see EBITDA margin to improve YoY on increasing revenues from the Projects (a high-margin LoB). Meanwhile, earnings are set to maintain YoY on a balanced performance for non-operating items.
2012 Preview Backed by the newly signed contracts in the Projects LoB (Integrated Transport activity), in addition to the new license obtained for the Free Zone activity, we expect revenues to add some EGP190mn (lower than our previous estimates of EGP215mn) during 2H11, 2012 and 2013. Moreover, the new high-margin River Transport activity operational launch was shifted from 2013 to 2014 as a direct result of the post-revolution unrest. All considered, we expect ETRS to show a new trend for its revenues starting 2014.
Valuation & Recommendation In light of the above, we reached a LTFV of EGP7/share. To arrive at our TP, we have continued to include a 5% risk discount to account for Egypt’s political unrest; hence, we arrived at our TP of EGP7.2/share. Finally, our recommendation on the stock is Hold.
Sherif Helmy [email protected]
+20 333-18-345
Transport & Logistics Hold
TP - EGP 7.2 | 23.7% Upside
Egytrans
Stock Details As at: 21-Jan-12
CICR Rating/RiskTarget Price/LTFV (EGP)
Last Price (EGP)52 Week High52 Week Low6M Av. Daily Vol. (000' shrs)% Chg: M oM / 6M / YoY
No. o f Shares (mn)M kt. Cap (EGPmn)M kt. Cap (USDmn)*Free Float (%)Paid in Capital (EGPmn)
Reuters / B loombergISIN
GDR DataLast Price52 Week High52 Week Low
Company Profile
Ow nership StructureFree Float 59.2%National Bank fo r Investment 24.0%Leheta Family 16.8%
Source: B loomberg / CICR *USD:EGP FX: 6.04
The Egyptian Transport and Commercial ServicesCompany (Egytrans) [ETRS] was established in December1973 under Egypt’s open door po licy. However, its transportactivities and experience date back to 1939 and Gamal El-Din Leheta & Co. Fo llowing its nationalization in 1976,Egytrans became one of Egypt’s largest companies,o ffering shipping, tourism and o ther transport services.
In early 2010, the company succeeded in raising itsauthorized and paid in capital from EGP100mn andEGP56.1mn to EGP1bn and EGP256.1mn. To date, it hascalled only EGP100mn of this increase.
ETRS will use the capital increase proceeds to expand anddevelop its current activities, in addition to entering the newLand & River Transport and Logistics industries byoperating river ports, terminals and a river transportbusiness.
13.555.07
15.61
55.20
ETRS.CA / ETRS Ey Equity
15.04
-5.1 / -47.2 / -55.7
156.06
90.83
No GDR availablen/a
59.20
EGS42051C010
n/a
7.2 / 7
5.82
Hold/High
-
0.5
1.0
1.5
2.0
-
5.0
10.0
15.0
20.0
Jan-11 Mar-11 May-11 Jul-11 Sep-11 Nov-11
mn shrsCurr.Volume ETRSEGX 30 (rebased)
52 week Share Performance
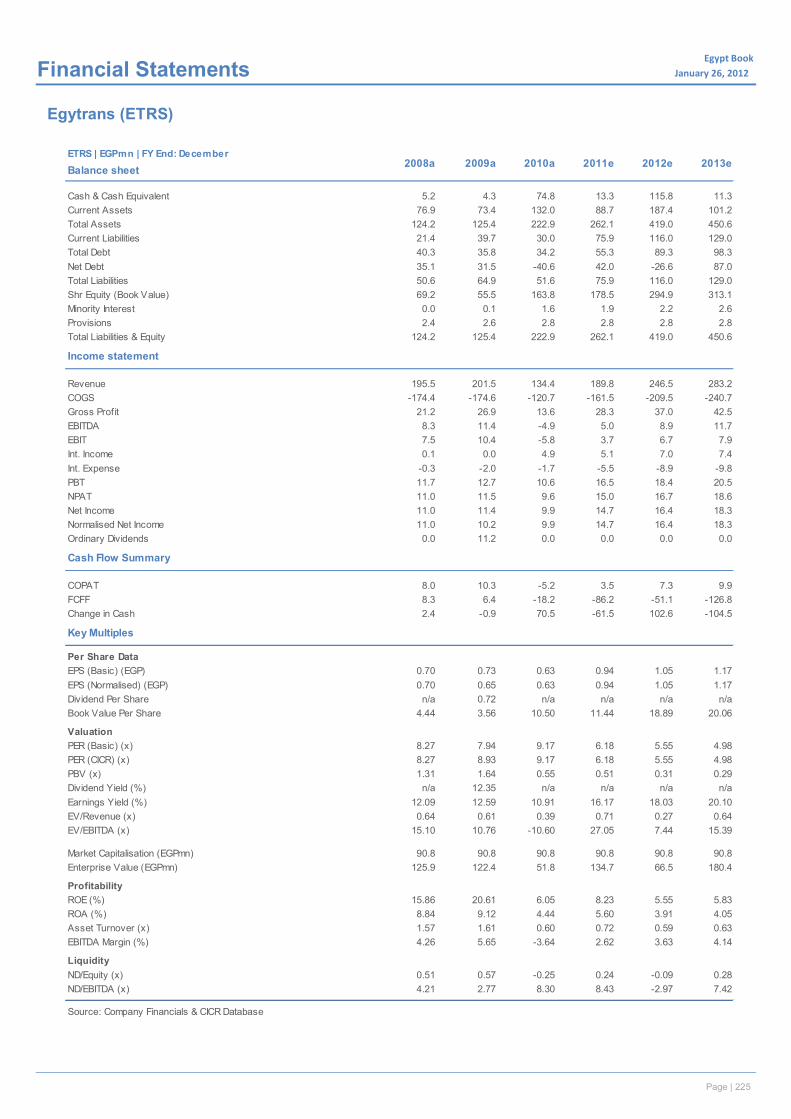
Page | 26
Egypt Book January 26, 2012x Financial Statements
Egytrans (ETRS)
cETRS | EGPmn | FY End: December
Balance sheet
Cash & Cash Equivalent 5.2 4.3 74.8 13.3 115.8 11.3Current Assets 76.9 73.4 132.0 88.7 187.4 101.2Total Assets 124.2 125.4 222.9 262.1 419.0 450.6Current Liabilities 21.4 39.7 30.0 75.9 116.0 129.0Total Debt 40.3 35.8 34.2 55.3 89.3 98.3Net Debt 35.1 31.5 -40.6 42.0 -26.6 87.0Total Liabilities 50.6 64.9 51.6 75.9 116.0 129.0Shr Equity (Book Value) 69.2 55.5 163.8 178.5 294.9 313.1Minority Interest 0.0 0.1 1.6 1.9 2.2 2.6Provisions 2.4 2.6 2.8 2.8 2.8 2.8Total Liabilities & Equity 124.2 125.4 222.9 262.1 419.0 450.6
Income statement
Revenue 195.5 201.5 134.4 189.8 246.5 283.2COGS -174.4 -174.6 -120.7 -161.5 -209.5 -240.7Gross Profit 21.2 26.9 13.6 28.3 37.0 42.5EBITDA 8.3 11.4 -4.9 5.0 8.9 11.7EBIT 7.5 10.4 -5.8 3.7 6.7 7.9Int. Income 0.1 0.0 4.9 5.1 7.0 7.4Int. Expense -0.3 -2.0 -1.7 -5.5 -8.9 -9.8PBT 11.7 12.7 10.6 16.5 18.4 20.5NPAT 11.0 11.5 9.6 15.0 16.7 18.6Net Income 11.0 11.4 9.9 14.7 16.4 18.3Normalised Net Income 11.0 10.2 9.9 14.7 16.4 18.3Ordinary Dividends 0.0 11.2 0.0 0.0 0.0 0.0
Cash Flow Summary
COPAT 8.0 10.3 -5.2 3.5 7.3 9.9FCFF 8.3 6.4 -18.2 -86.2 -51.1 -126.8Change in Cash 2.4 -0.9 70.5 -61.5 102.6 -104.5
Key Multiples
Per Share DataEPS (Basic) (EGP) 0.70 0.73 0.63 0.94 1.05 1.17EPS (Normalised) (EGP) 0.70 0.65 0.63 0.94 1.05 1.17Dividend Per Share n/a 0.72 n/a n/a n/a n/aBook Value Per Share 4.44 3.56 10.50 11.44 18.89 20.06
ValuationPER (Basic) (x) 8.27 7.94 9.17 6.18 5.55 4.98PER (CICR) (x) 8.27 8.93 9.17 6.18 5.55 4.98PBV (x) 1.31 1.64 0.55 0.51 0.31 0.29Dividend Yield (%) n/a 12.35 n/a n/a n/a n/aEarnings Yield (%) 12.09 12.59 10.91 16.17 18.03 20.10EV/Revenue (x) 0.64 0.61 0.39 0.71 0.27 0.64EV/EBITDA (x) 15.10 10.76 -10.60 27.05 7.44 15.39
Market Capitalisation (EGPmn) 90.8 90.8 90.8 90.8 90.8 90.8Enterprise Value (EGPmn) 125.9 122.4 51.8 134.7 66.5 180.4
ProfitabilityROE (%) 15.86 20.61 6.05 8.23 5.55 5.83ROA (%) 8.84 9.12 4.44 5.60 3.91 4.05Asset Turnover (x) 1.57 1.61 0.60 0.72 0.59 0.63EBITDA Margin (%) 4.26 5.65 -3.64 2.62 3.63 4.14
LiquidityND/Equity (x) 0.51 0.57 -0.25 0.24 -0.09 0.28ND/EBITDA (x) 4.21 2.77 8.30 8.43 -2.97 7.42
Source: Company Financials & CICR Database
2008a 2009a 2010a 2011e 2012e 2013e
Page | 225
CI Capital Research Team Strategy Amr Hussein Elalfy, CFA Director & Co-Head of Research [email protected] 333-18-349 Mona Mansour* Director & Co-Head of Research [email protected] 333-18-357 James Kostoris Associate [email protected] 333-18-357
Economy Mona Mansour Director & Co-Head of Research [email protected] 333-18-357 Alia Mamdouh Associate [email protected] 333-18-347
Automotive Ahmed Abdelghani Senior Analyst [email protected] 333-18-346
Banks Ali Abdoun Director [email protected] 333-18-348
Cement Sherif Helmy Senior Vice President [email protected] 333-18-345
Ceramics Ahmed Abdelghani Senior Analyst [email protected] 333-18-346 Yasmin Ghanem Analyst [email protected] 333-18-367
Consumer Goods / Media & IT Ingy El Diwany Senior Vice President [email protected] 333-18-354
Contracting & Fertilisers Muhammad Elebrashi Senior Vice President [email protected] 333-18-361
Food & Beverages Mirette Ghozzi Senior Analyst [email protected] 333-18-359 Mayan El Menshawy* Senior Analyst [email protected] 333-18-358
Engineering & Cables Muhammad Elebrashi Senior Vice President [email protected] 333-18-361
Housing & Real Estate Hany Samy Director [email protected] 333-18-353
Mills Ahmed Abdelghani Senior Analyst [email protected] 333-18-346 Mirette Ghozzi Senior Analyst [email protected] 333-18-359
Pharmaceuticals Ahmed Abdelghani Senior Analyst [email protected] 333-18-346
Steel Hany Samy Director [email protected] 333-18-353
Telecom Services Amr Hussein Elalfy, CFA Director & Co-Head of Research [email protected] 333-18-349 Mohamed Hamdy Director [email protected] 333-18-360 Yehia Elsherbiny Senior Analyst [email protected] 333-18-368
Hydrocarbons & Oil Services Noran Ali Senior Analyst [email protected] 333-18-363
Transport & Logistics Sherif Helmy Senior Vice President [email protected] 333-18-345
* Industry and thematic analysts with roving brief.
Other Adam Koppeser Editor [email protected] 333-18-369 Safwan Zahran Assistant Analyst [email protected] 333-18-365 Shehab Fawzy Translator [email protected] 333-18-366 Mary Talat Secretary [email protected] 333-18-357 Rania Hana Administrative Assistant [email protected] 333-18-364
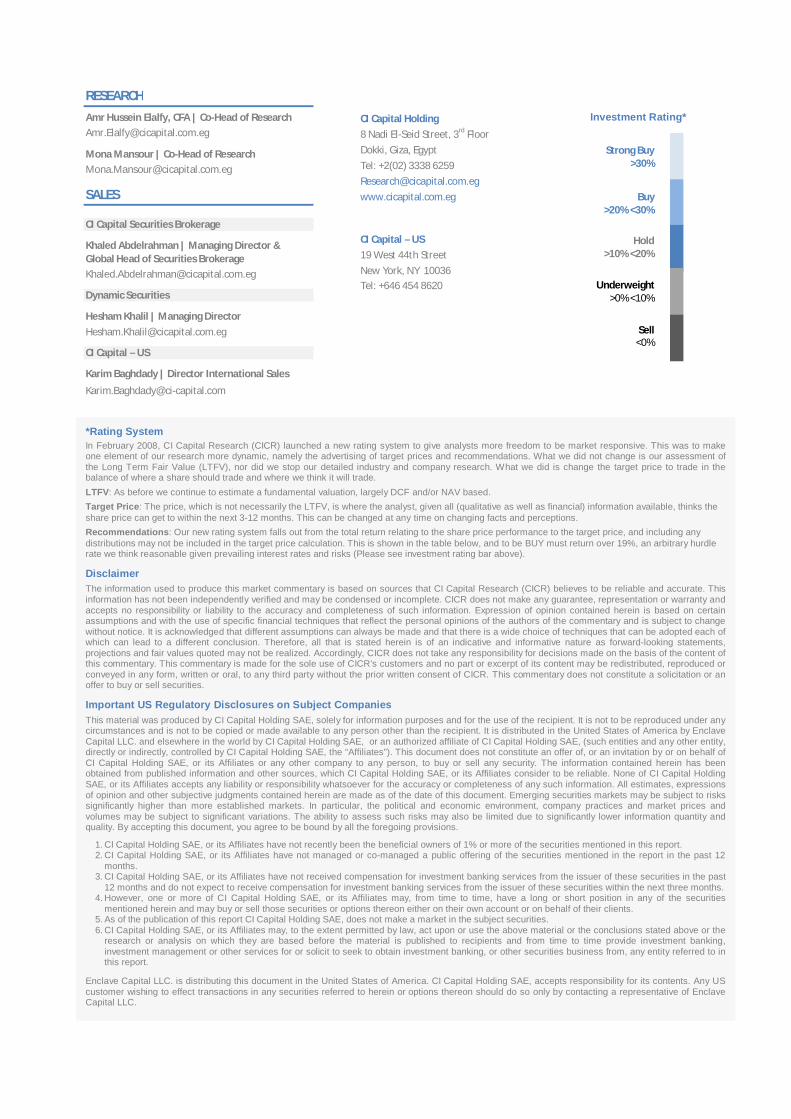
*Rating System In February 2008, CI Capital Research (CICR) launched a new rating system to give analysts more freedom to be market responsive. This was to make one element of our research more dynamic, namely the advertising of target prices and recommendations. What we did not change is our assessment of the Long Term Fair Value (LTFV), nor did we stop our detailed industry and company research. What we did is change the target price to trade in the balance of where a share should trade and where we think it will trade. LTFV: As before we continue to estimate a fundamental valuation, largely DCF and/or NAV based. Target Price: The price, which is not necessarily the LTFV, is where the analyst, given all (qualitative as well as financial) information available, thinks the share price can get to within the next 3-12 months. This can be changed at any time on changing facts and perceptions. Recommendations: Our new rating system falls out from the total return relating to the share price performance to the target price, and including any distributions may not be included in the target price calculation. This is shown in the table below, and to be BUY must return over 19%, an arbitrary hurdle rate we think reasonable given prevailing interest rates and risks (Please see investment rating bar above).
Disclaimer The information used to produce this market commentary is based on sources that CI Capital Research (CICR) believes to be reliable and accurate. This information has not been independently verified and may be condensed or incomplete. CICR does not make any guarantee, representation or warranty and accepts no responsibility or liability to the accuracy and completeness of such information. Expression of opinion contained herein is based on certain assumptions and with the use of specific financial techniques that reflect the personal opinions of the authors of the commentary and is subject to change without notice. It is acknowledged that different assumptions can always be made and that there is a wide choice of techniques that can be adopted each of which can lead to a different conclusion. Therefore, all that is stated herein is of an indicative and informative nature as forward-looking statements, projections and fair values quoted may not be realized. Accordingly, CICR does not take any responsibility for decisions made on the basis of the content of this commentary. This commentary is made for the sole use of CICR’s customers and no part or excerpt of its content may be redistributed, reproduced or conveyed in any form, written or oral, to any third party without the prior written consent of CICR. This commentary does not constitute a solicitation or an offer to buy or sell securities.
Important US Regulatory Disclosures on Subject Companies This material was produced by CI Capital Holding SAE, solely for information purposes and for the use of the recipient. It is not to be reproduced under any circumstances and is not to be copied or made available to any person other than the recipient. It is distributed in the United States of America by Enclave Capital LLC. and elsewhere in the world by CI Capital Holding SAE, or an authorized affiliate of CI Capital Holding SAE, (such entities and any other entity, directly or indirectly, controlled by CI Capital Holding SAE, the “Affiliates”). This document does not constitute an offer of, or an invitation by or on behalf of CI Capital Holding SAE, or its Affiliates or any other company to any person, to buy or sell any security. The information contained herein has been obtained from published information and other sources, which CI Capital Holding SAE, or its Affiliates consider to be reliable. None of CI Capital Holding SAE, or its Affiliates accepts any liability or responsibility whatsoever for the accuracy or completeness of any such information. All estimates, expressions of opinion and other subjective judgments contained herein are made as of the date of this document. Emerging securities markets may be subject to risks significantly higher than more established markets. In particular, the political and economic environment, company practices and market prices and volumes may be subject to significant variations. The ability to assess such risks may also be limited due to significantly lower information quantity and quality. By accepting this document, you agree to be bound by all the foregoing provisions.
1. CI Capital Holding SAE, or its Affiliates have not recently been the beneficial owners of 1% or more of the securities mentioned in this report. 2. CI Capital Holding SAE, or its Affiliates have not managed or co-managed a public offering of the securities mentioned in the report in the past 12
months. 3. CI Capital Holding SAE, or its Affiliates have not received compensation for investment banking services from the issuer of these securities in the past
12 months and do not expect to receive compensation for investment banking services from the issuer of these securities within the next three months. 4. However, one or more of CI Capital Holding SAE, or its Affiliates may, from time to time, have a long or short position in any of the securities
mentioned herein and may buy or sell those securities or options thereon either on their own account or on behalf of their clients. 5. As of the publication of this report CI Capital Holding SAE, does not make a market in the subject securities. 6. CI Capital Holding SAE, or its Affiliates may, to the extent permitted by law, act upon or use the above material or the conclusions stated above or the
research or analysis on which they are based before the material is published to recipients and from time to time provide investment banking, investment management or other services for or solicit to seek to obtain investment banking, or other securities business from, any entity referred to in this report.
Enclave Capital LLC. is distributing this document in the United States of America. CI Capital Holding SAE, accepts responsibility for its contents. Any US customer wishing to effect transactions in any securities referred to herein or options thereon should do so only by contacting a representative of Enclave Capital LLC.
Sell <0%
Underweight >0% <10%
Hold >10% <20%
Buy >20% <30%
Strong Buy >30%
Investment Rating* CI Capital Holding
8 Nadi El-Seid Street, 3rd Floor
Dokki, Giza, Egypt
Tel: +2(02) 3338 6259
www.cicapital.com.eg
CI Capital – US
19 West 44th Street
New York, NY 10036 Tel: +646 454 8620
Amr Hussein Elalfy, CFA | Co-Head of Research
Mona Mansour | Co-Head of Research
RESEARCH
SALES
CI Capital Securities Brokerage
Khaled Abdelrahman | Managing Director & Global Head of Securities Brokerage
Dynamic Securities
Hesham Khalil | Managing Director
CI Capital – US
Karim Baghdady | Director International Sales
Related Documents