NEW ISSUE – BOOK-ENTRY ONLY RATINGS: Moody’s: Aa1 S&P: AA+ Fitch: AA+ (See “Ratings” herein) In the opinion of Norton Rose Fulbright US LLP, Los Angeles, California, and Curls Bartling P.C., Oakland, California, Co-Bond Counsel, under existing statutes, regulations, rulings and court decisions, and subject to the matters described in “TAX MATTERS” herein, interest on the Bonds is excluded from the gross income of the owners thereof for federal income tax purposes and is not included in the federal alternative minimum tax for individuals or, except as described herein, corporations. It is also the opinion of Co-Bond Counsel that under existing law interest on the Bonds is exempt from personal income taxes of the State of California. See “TAX MATTERS” herein, including a discussion of the federal alternative minimum tax consequences for corporations. The Bonds will not be designated as “qualified tax-exempt obligations” for financial institutions. $173,120,000 CITY AND COUNTY OF SAN FRANCISCO TAX-EXEMPT GENERAL OBLIGATION BONDS (PUBLIC HEALTH AND SAFETY, 2016), SERIES 2017A Dated: Date of Delivery Due: June 15, as shown in the inside cover The City and County of San Francisco Tax-Exempt General Obligation Bonds (Public Health and Safety, 2016), Series 2017A (the “Bonds”) are being issued under the Government Code of the State of California and the Charter of the City and County of San Francisco (the “City”). The issuance of the Bonds has been authorized by certain resolutions adopted by the Board of Supervisors of the City and duly approved by the Mayor of the City, as described under “THE BONDS – Authority for Issuance; Purposes.” The proceeds of the Bonds will be used to finance certain public health and safety improvements and related costs as described herein, and to pay certain costs related to the issuance of the Bonds. See “PLAN OF FINANCE” and “SOURCES AND USES OF FUNDS.” The Bonds will be dated and bear interest from their date of delivery until paid in full at the rates shown in the maturity schedule on the inside cover hereof. Interest on the Bonds will be payable on June 15 and December 15 of each year, commencing June 15, 2017. Principal will be paid at maturity as shown on the inside cover. See “THE BONDS – Payment of Interest and Principal.” The Bonds will be issued only in fully registered form without coupons, and when issued will be registered in the name of Cede & Co., as nominee of The Depository Trust Company (“DTC”). Individual purchases of the Bonds will be made in book- entry form only, in denominations of $5,000 or any integral multiple thereof. Payments of principal of and interest on the Bonds will be made by the City Treasurer, as paying agent, to DTC, which in turn is required to remit such principal and interest to the DTC Participants for subsequent disbursement to the beneficial owners of the Bonds. See “THE BONDS – Form and Registration.” The Bonds will be subject to redemption prior to maturity, as described herein. See “THE BONDS – Redemption.” The Board of Supervisors has the power and is obligated to levy ad valorem taxes without limitation as to rate or amount upon all property subject to taxation by the City (except certain property which is taxable at limited rates) for the payment of the Bonds and the interest thereon when due. See “SECURITY FOR THE BONDS.” This cover page contains certain information for general reference only. It is not intended to be a summary of the security for or the terms of the Bonds. Investors are advised to read the entire Official Statement to obtain information essential to the making of an informed investment decision. _________________________ MATURITY SCHEDULE (See Inside Cover) _________________________ The Bonds are offered when, as and if issued by the City and accepted by the initial purchaser, subject to the approval of legality by Norton Rose Fulbright US LLP, Los Angeles, California, and Curls Bartling P.C., Oakland, California, Co-Bond Counsel, and certain other conditions. Certain legal matters will be passed upon for the City by its City Attorney and by Hawkins Delafield & Wood LLP, San Francisco, California, Disclosure Counsel. It is expected that the Bonds in book-entry form will be available for delivery through the facilities of DTC on or about February 1, 2017. Dated: January 18, 2017.

Welcome message from author
This document is posted to help you gain knowledge. Please leave a comment to let me know what you think about it! Share it to your friends and learn new things together.
Transcript
NEW ISSUE – BOOK-ENTRY ONLY RATINGS: Moody’s: Aa1 S&P: AA+ Fitch: AA+
(See “Ratings” herein)
In the opinion of Norton Rose Fulbright US LLP, Los Angeles, California, and Curls Bartling P.C., Oakland, California, Co-Bond Counsel, under existing statutes, regulations, rulings and court decisions, and subject to the matters described in “TAX MATTERS” herein, interest on the Bonds is excluded from the gross income of the owners thereof for federal income tax purposes and is not included in the federal alternative minimum tax for individuals or, except as described herein, corporations. It is also the opinion of Co-Bond Counsel that under existing law interest on the Bonds is exempt from personal income taxes of the State of California. See “TAX MATTERS” herein, including a discussion of the federal alternative minimum tax consequences for corporations. The Bonds will not be designated as “qualified tax-exempt obligations” for financial institutions.
$173,120,000CITY AND COUNTY OF SAN FRANCISCO
TAX-EXEMPT GENERAL OBLIGATION BONDS(PUBLIC HEALTH AND SAFETY, 2016),
SERIES 2017A
Dated: Date of Delivery Due: June 15, as shown in the inside cover
The City and County of San Francisco Tax-Exempt General Obligation Bonds (Public Health and Safety, 2016), Series 2017A (the “Bonds”) are being issued under the Government Code of the State of California and the Charter of the City and County of San Francisco (the “City”). The issuance of the Bonds has been authorized by certain resolutions adopted by the Board of Supervisors of the City and duly approved by the Mayor of the City, as described under “THE BONDS – Authority for Issuance; Purposes.” The proceeds of the Bonds will be used to finance certain public health and safety improvements and related costs as described herein, and to pay certain costs related to the issuance of the Bonds. See “PLAN OF FINANCE” and “SOURCES AND USES OF FUNDS.”
The Bonds will be dated and bear interest from their date of delivery until paid in full at the rates shown in the maturity schedule on the inside cover hereof. Interest on the Bonds will be payable on June 15 and December 15 of each year, commencing June 15, 2017. Principal will be paid at maturity as shown on the inside cover. See “THE BONDS – Payment of Interest and Principal.” The Bonds will be issued only in fully registered form without coupons, and when issued will be registered in the name of Cede & Co., as nominee of The Depository Trust Company (“DTC”). Individual purchases of the Bonds will be made in book-entry form only, in denominations of $5,000 or any integral multiple thereof. Payments of principal of and interest on the Bonds will be made by the City Treasurer, as paying agent, to DTC, which in turn is required to remit such principal and interest to the DTC Participants for subsequent disbursement to the beneficial owners of the Bonds. See “THE BONDS – Form and Registration.”
The Bonds will be subject to redemption prior to maturity, as described herein. See “THE BONDS – Redemption.”
The Board of Supervisors has the power and is obligated to levy ad valorem taxes without limitation as to rate or amount upon all property subject to taxation by the City (except certain property which is taxable at limited rates) for the payment of the Bonds and the interest thereon when due. See “SECURITY FOR THE BONDS.”
This cover page contains certain information for general reference only. It is not intended to be a summary of the security for or the terms of the Bonds. Investors are advised to read the entire Official Statement to obtain information essential to the making of an informed investment decision.
_________________________
MATURITY SCHEDULE (See Inside Cover)
_________________________
The Bonds are offered when, as and if issued by the City and accepted by the initial purchaser, subject to the approval of legality by Norton Rose Fulbright US LLP, Los Angeles, California, and Curls Bartling P.C., Oakland, California, Co-Bond Counsel, and certain other conditions. Certain legal matters will be passed upon for the City by its City Attorney and by Hawkins Delafield & Wood LLP, San Francisco, California, Disclosure Counsel. It is expected that the Bonds in book-entry form will be available for delivery through the facilities of DTC on or about February 1, 2017.
Dated: January 18, 2017.
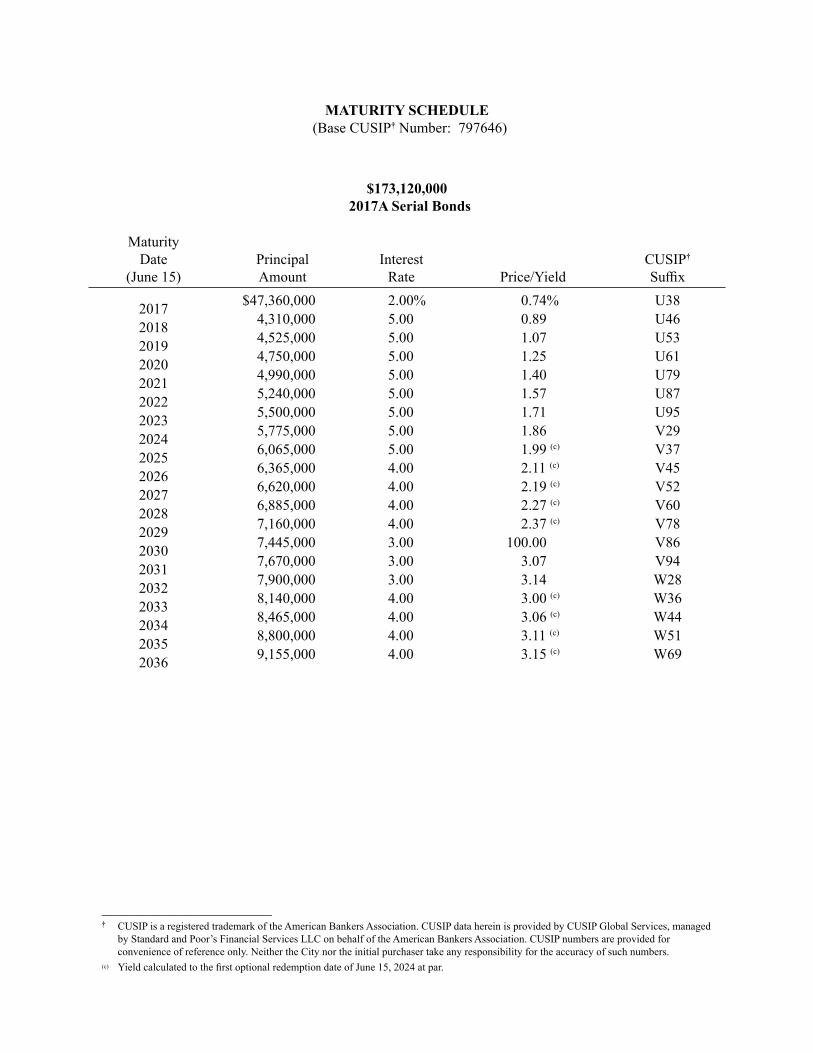
MATURITY SCHEDULE† Number: 797646)
$173,120,0002017A Serial Bonds
Maturity Date
(June 15)Principal Amount
Interest Price/Yield
†
2017 $47,360,000 2.00% 0.74%
2018 4,310,000 5.00 0.89
2019 4,525,000 5.00 1.07
2020 4,750,000 5.00 1.25
2021 4,990,000 5.00 1.40
2022 5,240,000 5.00 1.57
2023 5,500,000 5.00 1.71
2024 5,775,000 5.00 1.86 V29
2025 6,065,000 5.00 1.99 (c) V37
2026 6,365,000 4.00 2.11 (c) V45
2027 6,620,000 4.00 2.19 (c) V52
2028 6,885,000 4.00 2.27 (c) V60
2029 7,160,000 4.00 2.37 (c) V78
2030 7,445,000 3.00 100.00 V86
2031 7,670,000 3.00 3.07 V94
2032 7,900,000 3.00 3.14 W28
2033 8,140,000 4.00 3.00 (c) W36
2034 8,465,000 4.00 3.06 (c) W44
2035 8,800,000 4.00 3.11 (c) W51
2036 9,155,000 4.00 3.15 (c) W69
________________________________†
convenience of reference only. Neither the City nor the initial purchaser take any responsibility for the accuracy of such numbers.(c)
No dealer, broker, salesperson or other person has been authorized by the City to give any information or to make any representation other than those contained herein and, if given or made, such other information or representation must not be relied upon as having been authorized by the City. This Official Statement does not constitute an offer to sell or the solicitation of an offer to buy, nor shall there be any sale of the Bonds, by any person in any jurisdiction in which it is unlawful for such person to make such an offer, solicitation or sale.
The information set forth herein other than that provided by the City, although obtained from sources which are believed to be reliable, is not guaranteed as to accuracy or completeness. The information and expressions of opinion herein are subject to change without notice and neither delivery of this Official Statement nor any sale made hereunder shall, under any circumstances, create any implication that there has been no change in the affairs of the City since the date hereof.
The City maintains a website. The information presented on such website is not incorporated by reference as part of this Official Statement and should not be relied upon in making investment decisions with respect to the Bonds. Various other websites referred to in this Official Statement also are not incorporated herein by such references.
This Official Statement is not to be construed as a contract with the initial purchaser of the Bonds. Statements contained in this Official Statement which involve estimates, forecasts or matters of opinion, whether or not expressly so described herein, are intended solely as such and are not to be construed as representations of facts.
The issuance and sale of the Bonds have not been registered under the Securities Act of 1933 in reliance upon the exemption provided thereunder by Section 3(a)(2) for the issuance and sale of municipal securities.
IN CONNECTION WITH THE OFFERING OF THE BONDS, THE INITIAL PURCHASER MAY OVERALLOT OR EFFECT TRANSACTIONS WHICH STABILIZE OR MAINTAIN THE MARKET PRICE OF THE BONDS AT LEVELS ABOVE THAT WHICH MIGHT OTHERWISE PREVAIL IN THE OPEN MARKET. SUCH STABILIZING, IF COMMENCED, MAY BE DISCONTINUED AT ANY TIME.

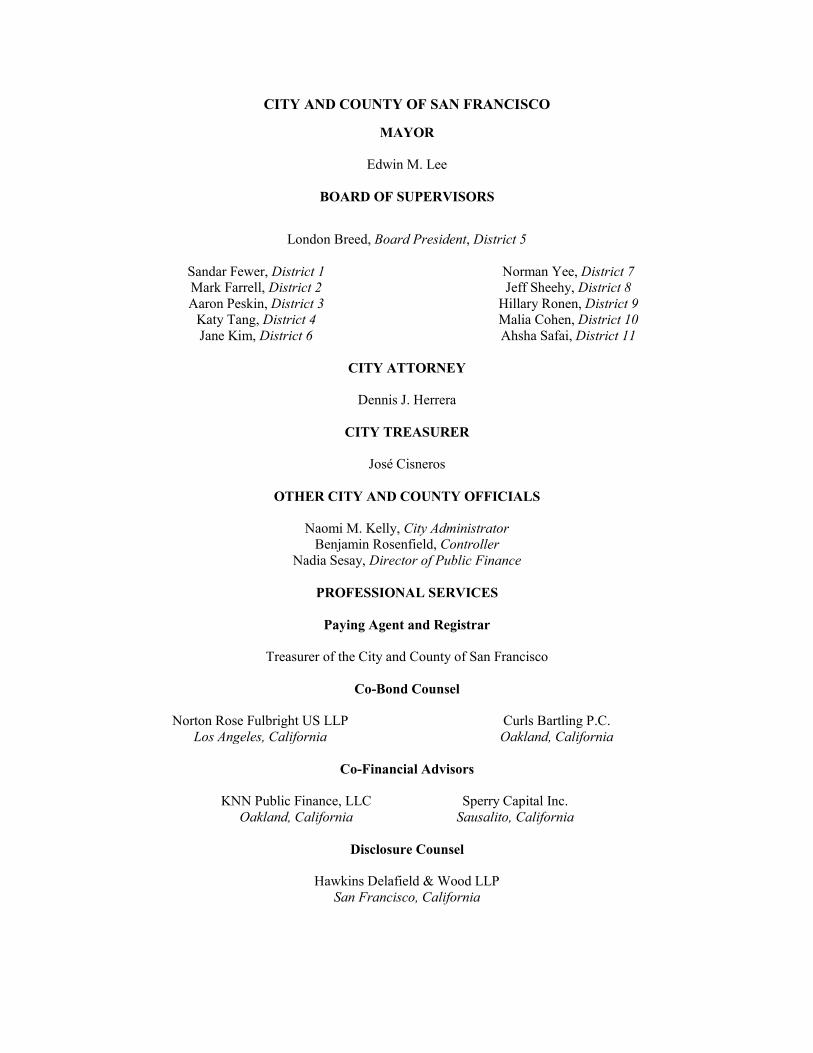
CITY AND COUNTY OF SAN FRANCISCO
MAYOR
Edwin M. Lee
BOARD OF SUPERVISORS
London Breed, Board President, District 5
Sandar Fewer, District 1 Mark Farrell, District 2 Aaron Peskin, District 3
Katy Tang, District 4 Jane Kim, District 6
Norman Yee, District 7 Jeff Sheehy, District 8
Hillary Ronen, District 9 Malia Cohen, District 10 Ahsha Safai, District 11
CITY ATTORNEY
Dennis J. Herrera
CITY TREASURER
José Cisneros
OTHER CITY AND COUNTY OFFICIALS
Naomi M. Kelly, City Administrator Benjamin Rosenfield, Controller
Nadia Sesay, Director of Public Finance
PROFESSIONAL SERVICES
Paying Agent and Registrar
Treasurer of the City and County of San Francisco
Co-Bond Counsel
Norton Rose Fulbright US LLP Los Angeles, California
Curls Bartling P.C. Oakland, California
Co-Financial Advisors
KNN Public Finance, LLC Oakland, California
Sperry Capital Inc. Sausalito, California
Disclosure Counsel
Hawkins Delafield & Wood LLP San Francisco, California

i
TABLE OF CONTENTS
INTRODUCTION ................................................................................................................................................ 1 THE CITY AND COUNTY OF SAN FRANCISCO ........................................................................................... 1 THE BONDS ........................................................................................................................................................ 3
Authority for Issuance; Purposes ...................................................................................................................... 3 Form and Registration ...................................................................................................................................... 3 Payment of Interest and Principal ..................................................................................................................... 3 Redemption ....................................................................................................................................................... 4 Defeasance ........................................................................................................................................................ 5
SOURCES AND USES OF FUNDS .................................................................................................................... 7 Deposit and Investment of Bond Proceeds ....................................................................................................... 7
DEBT SERVICE SCHEDULE............................................................................................................................. 8 SECURITY FOR THE BONDS ........................................................................................................................... 9
General .............................................................................................................................................................. 9 Factors Affecting Property Tax Security for the Bonds .................................................................................... 9 City Long-Term Challenges ........................................................................................................................... 10 Seismic Risks .................................................................................................................................................. 11 Risk of Sea Level Changes and Flooding ....................................................................................................... 12 Other Events ................................................................................................................................................... 12
TAX MATTERS................................................................................................................................................. 12 Tax Exemption ................................................................................................................................................ 12 Tax Accounting Treatment of Discount and Premium on Certain Bonds ...................................................... 14
OTHER LEGAL MATTERS ............................................................................................................................. 15 PROFESSIONALS INVOLVED IN THE OFFERING ..................................................................................... 15 ABSENCE OF LITIGATION ............................................................................................................................ 16 CONTINUING DISCLOSURE .......................................................................................................................... 16 RATINGS ........................................................................................................................................................... 16 SALE OF THE BONDS ..................................................................................................................................... 17 MISCELLANEOUS ........................................................................................................................................... 17
APPENDICES
APPENDIX A – CITY AND COUNTY OF SAN FRANCISCO – ORGANIZATION AND FINANCES
APPENDIX B – COMPREHENSIVE ANNUAL FINANCIAL REPORT OF THE CITY AND COUNTY OF SAN FRANCISCO FOR THE FISCAL YEAR ENDED JUNE 30, 2016
APPENDIX C – CITY AND COUNTY OF SAN FRANCISCO, OFFICE OF THE TREASURER – INVESTMENT POLICY
APPENDIX D – FORM OF CONTINUING DISCLOSURE CERTIFICATE
APPENDIX E – DTC AND THE BOOK ENTRY ONLY SYSTEM
APPENDIX F – PROPOSED FORM OF OPINION OF CO-BOND COUNSEL

1
OFFICIAL STATEMENT
$173,120,000 CITY AND COUNTY OF SAN FRANCISCO
TAX-EXEMPT GENERAL OBLIGATION BONDS (PUBLIC HEALTH AND SAFETY, 2016),
SERIES 2017A
INTRODUCTION
This Official Statement, including the cover page and the appendices hereto, is provided to furnish information in connection with the public offering by the City and County of San Francisco (the “City”) of its City and County of San Francisco Tax-Exempt General Obligation Bonds (Public Health and Safety, 2016), Series 2017A (the “Bonds”). The Board of Supervisors of the City has the power and is obligated to levy ad valorem taxes without limitation as to rate or amount upon all property subject to taxation by the City (except certain property which is taxable at limited rates) for the payment of the principal of and interest on the Bonds when due. See “SECURITY FOR THE BONDS” herein.
This Official Statement speaks only as of its date, and the information contained herein is subject to change. Except as required by the Continuing Disclosure Certificate to be executed by the City with respect to the Bonds, the City has no obligation to update the information in this Official Statement. See “CONTINUING DISCLOSURE” and APPENDIX D – “FORM OF CONTINUING DISCLOSURE CERTIFICATE” herein.
Quotations from and summaries and explanations of the Bonds, the resolutions providing for the issuance and payment of the Bonds, and provisions of the constitution and statutes of the State of California (the “State”), the charter of the City (the “Charter”) and City ordinances, and other documents described herein, do not purport to be complete, and reference is made to said laws and documents for the complete provisions thereof. Copies of those documents and information concerning the Bonds are available from the City through the Office of Public Finance, 1 Dr. Carlton B. Goodlett Place, Room 336, San Francisco, California 94102-4682. Reference is made herein to various other documents, reports, websites, etc., which were either prepared by parties other than the City, or were not prepared, reviewed and approved by the City with a view towards making an offering of public securities, and such materials are therefore not incorporated herein by such references nor deemed a part of this Official Statement.
THE CITY AND COUNTY OF SAN FRANCISCO
The City is the economic and cultural center of the San Francisco Bay Area and northern California. The limits of the City encompass over 93 square miles, of which 49 square miles are land, with the balance consisting of tidelands and a portion of the San Francisco Bay (the “Bay”). The City is located at the northern tip of the San Francisco Peninsula, bounded by the Pacific Ocean to the west, the Bay and the San Francisco-Oakland Bay Bridge to the east, the entrance to the Bay and the Golden Gate Bridge to the north, and San Mateo County to the south. Silicon Valley is about a 40-minute drive to the south, and the wine country is about an hour’s drive to the north. The City’s population in fiscal year 2014-15 was approximately 864,400.
The San Francisco Bay Area consists of the nine counties contiguous to the Bay: Alameda, Contra Costa, Marin, Napa, San Francisco, San Mateo, Santa Clara, Solano and Sonoma Counties (collectively, the “Bay Area”). The economy of the Bay Area includes a wide range of industries, supplying local needs as well as the needs of national and international markets. Major business sectors in the Bay Area include retail, entertainment and the arts, conventions and tourism, service businesses, banking, professional and financial
2
services, corporate headquarters, international and wholesale trade, multimedia and advertising, biotechnology and higher education.
The City is a major convention and tourist destination. According to the San Francisco Travel Association, a nonprofit membership organization, during the calendar year 2014, approximately 18.01 million people visited the City and spent an estimated $10.67 billion during their stay. The City is also a leading center for financial activity in the State and is the headquarters of the Twelfth Federal Reserve District, the Eleventh District Federal Home Loan Bank, and the San Francisco Regional Office of Thrift Supervision.
The City benefits from a highly skilled, educated and professional labor force. The per-capita personal income of the City for fiscal year 2015-16 was $95,815. The San Francisco Unified School District operates 16 transitional kindergarten schools, 72 elementary and K-8 school sites, 12 middle schools, 18 senior high schools (including two continuation schools and an independent study school), and 46 State-funded preschool sites, and sponsors 13 independent charter schools. Higher education institutions located in the City include the University of San Francisco, California State University – San Francisco, University of California – San Francisco (a medical school and health science campus), the University of California Hastings College of the Law, the University of the Pacific’s School of Dentistry, Golden Gate University, City College of San Francisco (a public community college), the Art Institute of California – San Francisco, the San Francisco Conservatory of Music, the California Culinary Academy, and the Academy of Art University.
San Francisco International Airport (“SFO”), located 14 miles south of downtown San Francisco in an unincorporated area of San Mateo County and owned and operated by the City, is the principal commercial service airport for the Bay Area and one of the nation’s principal gateways for Pacific traffic. In fiscal year 2015-16, SFO serviced approximately 51.4 million passengers and handled 451,501 metric tons of cargo. The City is also served by the Bay Area Rapid Transit District (electric rail commuter service linking the City with the East Bay and the San Francisco Peninsula, including SFO), Caltrain (a conventional commuter rail line linking the City with the San Francisco Peninsula), and bus and ferry services between the City and residential areas to the north, east and south of the City. San Francisco Municipal Railway, operated by the City, provides bus and streetcar service within the City. The Port of San Francisco (the “Port”), which administers 7.5 miles of Bay waterfront held in “public trust” by the Port on behalf of the people of the State, promotes a balance of maritime-related commerce, fishing, recreational, industrial and commercial activities and natural resource protection.
The City is governed by a Board of Supervisors elected from eleven districts to serve four-year terms, and a Mayor who serves as chief executive officer, elected citywide to a four-year term. Edwin M. Lee is the 43rd and current Mayor of the City, having been elected by the voters of the City to his current term on November 3, 2015. The City’s adopted budget for fiscal years 2016-17 and 2017-18 totals $9.59 billion and $9.72 billion, respectively. The General Fund portion of each year’s adopted budget is $4.86 billion in fiscal year 2016-17 and $5.09 billion in fiscal year 2017-18, with the balance being allocated to all other funds, including enterprise fund departments, such as SFO, the San Francisco Municipal Transportation Agency, the Port Commission and the San Francisco Public Utilities Commission. The City employed 31,342 full-time-equivalent employees at the end of fiscal year 2015-16. According to the Controller of the City (the “Controller”), the fiscal year 2016-17 total net assessed valuation of taxable property in the City is approximately $211.5 billion.
More detailed information about the City’s governance, organization and finances may be found in APPENDIX A – “CITY AND COUNTY OF SAN FRANCISCO ORGANIZATION AND FINANCES” and in APPENDIX B – “COMPREHENSIVE ANNUAL FINANCIAL REPORT OF THE CITY AND COUNTY OF SAN FRANCISCO FOR THE FISCAL YEAR ENDED JUNE 30, 2016.”
3
THE BONDS
Authority for Issuance; Purposes
The Bonds will be issued under the Government Code of the State and the Charter. The City authorized the issuance of the Bonds by Resolution No. 514-16 and Resolution No. 515-16, both adopted by the Board of Supervisors of the City on December 6, 2016, and duly approved by the Mayor of the City on December 16, 2016 (together, the “Resolution”).
The Bonds will constitute the first series of bonds to be issued from an aggregate authorized amount of $350,000,000 of City and County of San Francisco Taxable and Tax-Exempt General Obligation Bonds (Public Health and Safety, 2016), duly approved by at least two-thirds of the voters voting on Proposition A at an election held on June 7, 2016 (“Proposition A (2016)”), to provide funds for the purposes authorized in Proposition A (2016), which are summarized as follows: to protect public health and safety, improve community medical and mental health care services, earthquake safety, and emergency medical response; to seismically improve, and modernize neighborhood fire stations and vital public health and homeless service sites; to construct a seismically safe and improved San Francisco Fire Department ambulance deployment facility; and to pay related costs.
The Administrative Code of the City (the “Administrative Code”) and Proposition A (2016) provide that, to the extent permitted by law, 0.1% of the gross proceeds of all proposed bonds, including the Bonds, be deposited by the Controller and used to fund the costs of the City’s independent citizens’ general obligation bond oversight committee. The committee was created by the Administrative Code and is appointed by the Board of Supervisors of the City to inform the public concerning the expenditure of general obligation bond proceeds in accordance with the voter authorization.
Form and Registration
The Bonds will be issued in the principal amounts set forth on the inside cover hereof, in the denomination of $5,000 each or any integral multiple thereof, and will be dated their date of delivery. The Bonds will be issued in fully registered form, without coupons. The Bonds will be initially registered in the name of Cede & Co. as registered owner and nominee for The Depository Trust Company (“DTC”), which is required to remit payments of principal and interest to the DTC Participants for subsequent disbursement to the beneficial owners of the Bonds. See APPENDIX E – “DTC AND THE BOOK-ENTRY ONLY SYSTEM.”
Payment of Interest and Principal
Interest on the Bonds will be payable on each June 15 and December 15 to maturity or prior redemption, commencing June 15, 2017, at the interest rates shown on the inside cover hereof. Interest will be calculated on the basis of a 360-day year comprised of twelve 30-day months. The City Treasurer will act as paying agent and registrar with respect to the Bonds. The interest on the Bonds will be payable in lawful money of the United States to the person whose name appears on the Bond registration books of the City Treasurer as the owner thereof as of the close of business on the last day of the month immediately preceding an interest payment date (the “Record Date”), whether or not such day is a business day. Each Bond authenticated on or before May 31, 2017 will bear interest from the date of delivery. Every other Bond will bear interest from the interest payment date next preceding its date of authentication unless it is authenticated as of a day during the period from the Record Date next preceding any interest payment date to the interest payment date, inclusive, in which event it will bear interest from such interest payment date; provided, that if, at the time of authentication of any Bond, interest is then in default on the Bonds, such Bond will bear interest from the interest payment date to which interest has previously been paid or made available for payment on the Bonds.
4
The Bonds will mature on the dates shown on the inside cover page hereof. The Bonds will be subject to redemption prior to maturity, as described below. See “– Redemption” below. The principal of the Bonds will be payable in lawful money of the United States to the owner thereof upon the surrender thereof at maturity or earlier redemption at the office of the City Treasurer.
Redemption
Optional Redemption of the Bonds
The Bonds maturing on or before June 15, 2024 will not be subject to optional redemption prior to their respective stated maturity dates. The Bonds maturing on or after June 15, 2025 will be subject to optional redemption prior to their respective stated maturity dates, at the option of the City, from any source of available funds, as a whole or in part on any date (with the maturities to be redeemed to be determined by the City and by lot within a maturity), on or after June 15, 2024, at the redemption price equal to the principal amount of the Bonds redeemed, together with accrued interest to the date fixed for redemption (the “Redemption Date”), without premium.
Selection of Bonds for Redemption
Whenever less than all of the outstanding Bonds are called for redemption on any one date, the City Treasurer will select the maturities of Bonds to be redeemed in the sole discretion of the City Treasurer, and whenever less than all the outstanding Bonds maturing on any one date are called for redemption on any date, the particular Bonds or portions thereof to be redeemed will be selected by lot, in any manner which the City Treasurer deems fair. The Bonds may be redeemed in denominations of $5,000 or any integral multiple thereof.
Notice of Redemption
The City Treasurer will mail, or cause to be mailed, notice of any redemption of the Bonds, postage prepaid, to the respective registered owners thereof at the addresses appearing on the Bond registration books not less than 20 days and not more than 60 days prior to the Redemption Date.
Notice of redemption also will be given, or caused to be given, by the City Treasurer, by (i) registered or certified mail, postage prepaid, (ii) confirmed facsimile transmission, (iii) overnight delivery service, or (iv) to the extent applicable to the intended recipient, email or similar electronic means, to (a) all organizations registered with the Securities and Exchange Commission as securities depositories and (b) such other services or organizations as may be required in accordance with the Continuing Disclosure Certificate. See “CONTINUING DISCLOSURE” and APPENDIX D – “FORM OF CONTINUING DISCLOSURE CERTIFICATE” herein.
Each notice of redemption will (a) state the Redemption Date; (b) state the redemption price; (c) state the maturity dates of the Bonds called for redemption, and, if less than all of any such maturity is called for redemption, the distinctive numbers of the Bonds of such maturity to be redeemed, and in the case of a Bond redeemed in part only, the respective portions of the principal amount thereof to be redeemed; (d) state the CUSIP number, if any, of each Bond to be redeemed; (e) require that such Bonds be surrendered by the owners at the office of the City Treasurer or his or her agent; and (f) give notice that interest on such Bonds or portions of such Bonds to be redeemed will cease to accrue after the designated Redemption Date. Any notice of optional redemption may be conditioned on the receipt of funds or any other event specified in the notice. See “– Conditional Notice; Right to Rescind Notice of Optional Redemption” below.
The actual receipt by the owner of any Bond of such notice of redemption will not be a condition precedent to redemption of such Bond, and failure to receive such notice, or any defect in such notice, will not
5
affect the validity of the proceedings for the redemption of such Bond or the cessation of the accrual of interest on such Bond on the Redemption Date.
Effect of Notice of Redemption
When notice of optional redemption has been given as described above, and when the amount necessary for the redemption of the Bonds called for redemption (principal, premium, if any and accrued interest to the Redemption Date) is set aside for that purpose in the redemption account for the Bonds (the “Redemption Account”) established under the Resolution, the Bonds designated for redemption will become due and payable on the Redemption Date, and upon presentation and surrender of said Bonds at the place specified in the notice of redemption, those Bonds will be redeemed and paid at said redemption price out of the Redemption Account. No interest will accrue on such Bonds called for redemption after the Redemption Date and the registered owners of such Bonds will look for payment of such Bonds only to the Redemption Account. Moneys held in the Redemption Account will be invested by the City Treasurer pursuant to the City’s policies and guidelines for investment of moneys in the General Fund of the City. See APPENDIX C – “CITY AND COUNTY OF SAN FRANCISCO, OFFICE OF THE TREASURER – INVESTMENT POLICY.”
Conditional Notice; Right to Rescind Notice of Optional Redemption
Any notice of optional redemption may provide that such redemption is conditioned upon: (i) deposit of sufficient moneys to redeem the applicable Bonds called for redemption on the anticipated Redemption Date, or (ii) the occurrence of any other event specified in the notice of redemption. In the event that such conditional notice of optional redemption has been given and on the scheduled Redemption Date (i) sufficient moneys to redeem the Bonds have not been deposited or (ii) any other event specified in the notice of redemption did not occur, such Bonds for which notice of conditional optional redemption was given will not be redeemed and will remain Outstanding for all purposes and the redemption not occurring will not constitute a default under the Resolution.
In addition, the City may rescind any optional redemption and notice thereof for any reason on any date prior to any Redemption Date by causing written notice of the rescission to be given to the Registered Owner of all Bonds so called for redemption. Notice of such rescission of redemption will be given in the same manner notice of redemption was originally given. The actual receipt by the Registered Owner of any Bond of notice of such rescission will not be a condition precedent to rescission, and failure to receive such notice or any defect in such notice so mailed will not affect the validity of the rescission.
Defeasance
Payment of all or any portion of the Bonds may be provided for prior to such Bonds’ respective stated maturities by irrevocably depositing with the City Treasurer (or any commercial bank or trust company designated by the City Treasurer to act as escrow agent with respect thereto): (a) an amount of cash equal to the principal amount of all of such Bonds or a portion thereof, and all unpaid interest thereon to maturity, except that in the case of Bonds which are to be redeemed prior to such Bonds’ respective stated maturities and in respect of which notice of such redemption will have been given as described above or an irrevocable election to give such notice will have been made by the City, the amount to be deposited will be the principal amount thereof, all unpaid interest thereon to the Redemption Date, and premium, if any, due on such Redemption Date; or (b) Defeasance Securities (as defined below) not subject to call, except as described in the definition below, maturing and paying interest at such times and in such amounts, together with interest earnings and cash, if required, as will, without reinvestment, as certified by an independent certified public accountant, be fully sufficient to pay the principal and all unpaid interest to maturity, or to the Redemption Date, as the case may be, and any premium due on the Bonds to be paid or redeemed, as such principal and interest come due; provided, that, in the case of the Bonds which are to be redeemed prior to maturity, notice of such redemption will be given as described above or an irrevocable election to give such notice will have
6
been made by the City; then, all obligations of the City with respect to said outstanding Bonds will cease and terminate, except only the obligation of the City to pay or cause to be paid from the funds deposited as described in this paragraph, to the owners of said Bonds all sums due with respect thereto, and the tax covenant obligations of the City with respect to such Bonds; provided, that the City will have received an opinion of nationally recognized bond counsel that provision for the payment of said Bonds has been made as required by the Resolution.
As used in this section, the following terms have the meanings given below:
“Defeasance Securities” means any of the following which at the time are legal investments under the laws of the State of California for the moneys proposed to be invested therein: (1) United States Obligations (as defined below); and (2) Pre-refunded fixed interest rate municipal obligations meeting the following conditions: (a) the municipal obligations are not subject to redemption prior to maturity, or the trustee or paying agent has been given irrevocable instructions concerning their calling and redemption and the issuer has covenanted not to redeem such obligations other than as set forth in such instructions; (b) the municipal obligations are secured by cash or United States Obligations (as defined below); (c) the principal of and interest on the United States Obligations (plus any cash in the escrow fund or the applicable Redemption Account) are sufficient to meet the liabilities of the municipal obligations; (d) the United States Obligations serving as security for the municipal obligations are held by an escrow agent or trustee; (e) the United States Obligations are not available to satisfy any other claims, including those against the trustee or escrow agent; and (f) the municipal obligations are rated (without regard to any numerical modifier, plus or minus sign or other modifier), at the time of original deposit to the escrow fund, by any two Rating Agencies (as defined below) not lower than the rating then maintained by the respective Rating Agency on such United States Obligations.
“United States Obligations” means (i) direct and general obligations of the United States of America, or obligations that are unconditionally guaranteed as to principal and interest by the United States of America, including without limitation, the interest component of Resolution Funding Corporation (REFCORP) bonds that have been stripped by request to the Federal Reserve Bank of New York in book-entry form, or (ii) any security issued by an agency or instrumentality of the United States of America that is selected by the Director of Public Finance that results in the escrow fund being rated by any two Rating Agencies (as defined below) at the time of the initial deposit to the escrow fund and upon any substitution or subsequent deposit to the escrow fund, no lower than the rating then maintained by the respective Rating Agency on United States Obligations described in (i) herein.
“Rating Agencies” means Moody’s Investors Service, Inc., Fitch Ratings, and S&P Global Ratings, or any other nationally-recognized bond rating agency that is the successor to any of the foregoing rating agencies or that is otherwise established after the date of adoption of the related Resolution.
7
SOURCES AND USES OF FUNDS
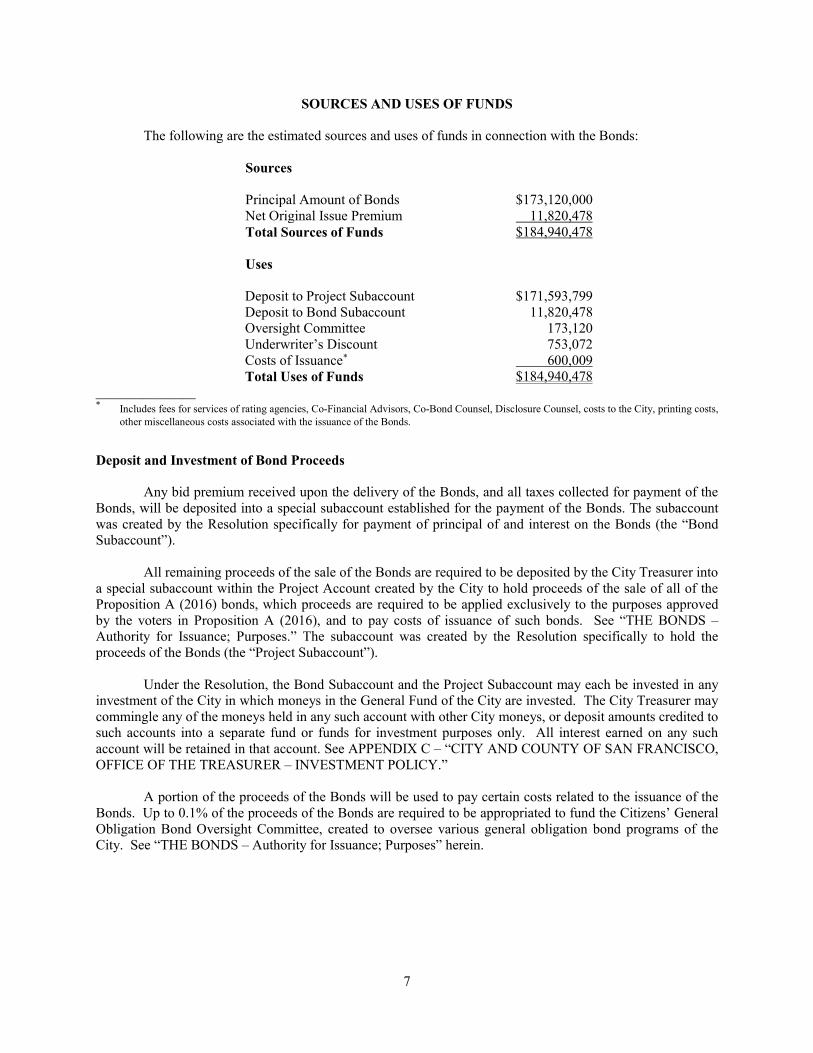
The following are the estimated sources and uses of funds in connection with the Bonds:
Sources Principal Amount of Bonds $173,120,000 Net Original Issue Premium 11,820,478 Total Sources of Funds $184,940,478 Uses Deposit to Project Subaccount $171,593,799 Deposit to Bond Subaccount 11,820,478 Oversight Committee 173,120 Underwriter’s Discount 753,072 Costs of Issuance* 600,009 Total Uses of Funds $184,940,478
_______________ * Includes fees for services of rating agencies, Co-Financial Advisors, Co-Bond Counsel, Disclosure Counsel, costs to the City, printing costs, other miscellaneous costs associated with the issuance of the Bonds.
Deposit and Investment of Bond Proceeds
Any bid premium received upon the delivery of the Bonds, and all taxes collected for payment of the Bonds, will be deposited into a special subaccount established for the payment of the Bonds. The subaccount was created by the Resolution specifically for payment of principal of and interest on the Bonds (the “Bond Subaccount”).
All remaining proceeds of the sale of the Bonds are required to be deposited by the City Treasurer into a special subaccount within the Project Account created by the City to hold proceeds of the sale of all of the Proposition A (2016) bonds, which proceeds are required to be applied exclusively to the purposes approved by the voters in Proposition A (2016), and to pay costs of issuance of such bonds. See “THE BONDS – Authority for Issuance; Purposes.” The subaccount was created by the Resolution specifically to hold the proceeds of the Bonds (the “Project Subaccount”).
Under the Resolution, the Bond Subaccount and the Project Subaccount may each be invested in any investment of the City in which moneys in the General Fund of the City are invested. The City Treasurer may commingle any of the moneys held in any such account with other City moneys, or deposit amounts credited to such accounts into a separate fund or funds for investment purposes only. All interest earned on any such account will be retained in that account. See APPENDIX C – “CITY AND COUNTY OF SAN FRANCISCO, OFFICE OF THE TREASURER – INVESTMENT POLICY.”
A portion of the proceeds of the Bonds will be used to pay certain costs related to the issuance of the Bonds. Up to 0.1% of the proceeds of the Bonds are required to be appropriated to fund the Citizens’ General Obligation Bond Oversight Committee, created to oversee various general obligation bond programs of the City. See “THE BONDS – Authority for Issuance; Purposes” herein.
8
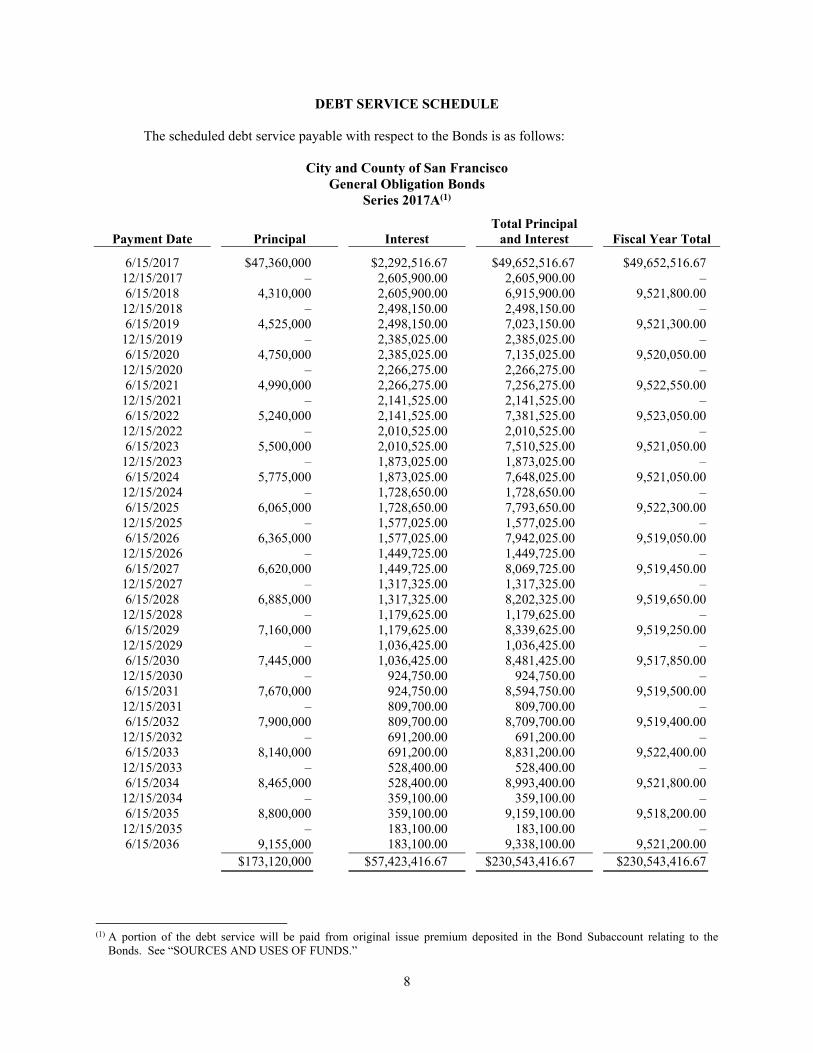
DEBT SERVICE SCHEDULE
The scheduled debt service payable with respect to the Bonds is as follows:
City and County of San Francisco General Obligation Bonds
Series 2017A(1)
Payment Date Principal Interest Total Principal
and Interest Fiscal Year Total
6/15/2017 $47,360,000 $2,292,516.67 $49,652,516.67 $49,652,516.67 12/15/2017 – 2,605,900.00 2,605,900.00 – 6/15/2018 4,310,000 2,605,900.00 6,915,900.00 9,521,800.00
12/15/2018 – 2,498,150.00 2,498,150.00 – 6/15/2019 4,525,000 2,498,150.00 7,023,150.00 9,521,300.00
12/15/2019 – 2,385,025.00 2,385,025.00 – 6/15/2020 4,750,000 2,385,025.00 7,135,025.00 9,520,050.00
12/15/2020 – 2,266,275.00 2,266,275.00 – 6/15/2021 4,990,000 2,266,275.00 7,256,275.00 9,522,550.00
12/15/2021 – 2,141,525.00 2,141,525.00 – 6/15/2022 5,240,000 2,141,525.00 7,381,525.00 9,523,050.00
12/15/2022 – 2,010,525.00 2,010,525.00 – 6/15/2023 5,500,000 2,010,525.00 7,510,525.00 9,521,050.00
12/15/2023 – 1,873,025.00 1,873,025.00 – 6/15/2024 5,775,000 1,873,025.00 7,648,025.00 9,521,050.00
12/15/2024 – 1,728,650.00 1,728,650.00 – 6/15/2025 6,065,000 1,728,650.00 7,793,650.00 9,522,300.00
12/15/2025 – 1,577,025.00 1,577,025.00 – 6/15/2026 6,365,000 1,577,025.00 7,942,025.00 9,519,050.00
12/15/2026 – 1,449,725.00 1,449,725.00 – 6/15/2027 6,620,000 1,449,725.00 8,069,725.00 9,519,450.00
12/15/2027 – 1,317,325.00 1,317,325.00 – 6/15/2028 6,885,000 1,317,325.00 8,202,325.00 9,519,650.00
12/15/2028 – 1,179,625.00 1,179,625.00 – 6/15/2029 7,160,000 1,179,625.00 8,339,625.00 9,519,250.00
12/15/2029 – 1,036,425.00 1,036,425.00 – 6/15/2030 7,445,000 1,036,425.00 8,481,425.00 9,517,850.00
12/15/2030 – 924,750.00 924,750.00 – 6/15/2031 7,670,000 924,750.00 8,594,750.00 9,519,500.00
12/15/2031 – 809,700.00 809,700.00 – 6/15/2032 7,900,000 809,700.00 8,709,700.00 9,519,400.00
12/15/2032 – 691,200.00 691,200.00 – 6/15/2033 8,140,000 691,200.00 8,831,200.00 9,522,400.00
12/15/2033 – 528,400.00 528,400.00 – 6/15/2034 8,465,000 528,400.00 8,993,400.00 9,521,800.00
12/15/2034 – 359,100.00 359,100.00 – 6/15/2035 8,800,000 359,100.00 9,159,100.00 9,518,200.00
12/15/2035 – 183,100.00 183,100.00 – 6/15/2036 9,155,000 183,100.00 9,338,100.00 9,521,200.00
$173,120,000 $57,423,416.67 $230,543,416.67 $230,543,416.67
(1) A portion of the debt service will be paid from original issue premium deposited in the Bond Subaccount relating to the
Bonds. See “SOURCES AND USES OF FUNDS.”
9
SECURITY FOR THE BONDS
General
The Board of Supervisors of the City has the power and is obligated, and under the Resolution has covenanted, to levy ad valorem taxes without limitation as to rate or amount upon all property subject to taxation by the City (except certain property which is taxable at limited rates) for the payment of the principal of and interest on the Bonds when due.
Factors Affecting Property Tax Security for the Bonds
The annual property tax rate for repayment of the Bonds will be based on the total assessed value of taxable property in the City and the scheduled debt service on the Bonds in each year, less any other lawfully available funds applied by the City for repayment of the Bonds. Fluctuations in the annual debt service on the Bonds, the assessed value of taxable property in the City, and the availability of such other funds in any year, may cause the annual property tax rate applicable to the Bonds to fluctuate. Issuance by the City of additional authorized bonds payable from ad valorem property taxes may cause the overall property tax rate to increase.
Discussed below are certain factors that may affect the City’s ability to levy and collect sufficient taxes to pay scheduled debt service on the Bonds each year. See APPENDIX A – “CITY AND COUNTY OF SAN FRANCISCO ORGANIZATION AND FINANCES” for additional information on these factors.
Total Assessed Value of Taxable Property in the City. The greater the assessed value of taxable property in the City, the lower the tax rate necessary to generate taxes sufficient to pay scheduled debt service on bonds. The total net assessed valuation of taxable property in the City in fiscal year 2016-17 is approximately $211.5 billion. During economic downturns, declining real estate values, increased foreclosures, and increases in requests submitted to the Assessor and the Assessment Appeals Board for reductions in assessed value have generally caused a reduction in the assessed value of some properties in the City. See APPENDIX A – “CITY AND COUNTY OF SAN FRANCISCO ORGANIZATION AND FINANCES – PROPERTY TAXATION – Assessed Valuations, Tax Rates and Tax Delinquencies.”
Natural and economic forces can affect the assessed value of taxable property in the City. The City is located in a seismically active region, and damage from an earthquake in or near the City could cause moderate to extensive or total damage to taxable property. See “Seismic Risks” below. Other natural or man-made disasters, such as flood, fire, toxic dumping or acts of terrorism, could also cause a reduction in the assessed value of taxable property within the City. Economic and market forces, such as a downturn in the Bay Area’s economy generally, can also affect assessed values, particularly as these forces might reverberate in the residential housing and commercial property markets. In addition, the total assessed value can be reduced through the reclassification of taxable property to a class exempt from taxation, whether by ownership or use (such as exemptions for property owned by State and local agencies and property used for qualified educational, hospital, charitable or religious purposes).
Concentration of Taxable Property Ownership. The more property (by assessed value) owned by any single assessee, the more exposure of tax collections to weakness in that taxpayer’s financial situation and ability or willingness to pay property taxes. As of July 1, 2016, no single assessee owned more than 0.51% of the total taxable property in the City. See APPENDIX A – “CITY AND COUNTY OF SAN FRANCISCO ORGANIZATION AND FINANCES – PROPERTY TAXATION – Tax Levy and Collection.”
10
Property Tax Rates. One factor in the ability of taxpayers to pay additional taxes for general obligation bonds is the cumulative rate of tax. The total tax rate per $100 of assessed value (including the basic countywide 1% rate required by statute) is discussed further in APPENDIX A – “CITY AND COUNTY OF SAN FRANCISCO ORGANIZATION AND FINANCES – PROPERTY TAXATION – Assessed Valuations, Tax Rates and Tax Delinquencies.”
Debt Burden on Owners of Taxable Property in the City. Another measure of the debt burden on local taxpayers is total debt as a percentage of taxable property value. Issuance of general obligation bonds by the City is limited under Section 9.106 of the Charter to 3.00% of the assessed value of all taxable real and personal property located within the City’s boundaries. For purposes of this provision of the Charter, the City calculates its debt limit on the basis of total assessed valuation net of non-reimbursable and homeowner exemptions. On this basis, the City’s gross general obligation debt limit for fiscal year 2016-17 is approximately $6.35 billion, based on a net assessed valuation of approximately $211.5 billion. As of December 15, 2016, the City had outstanding approximately $2.01 billion in aggregate principal amount of general obligation bonds, which equals approximately 0.95% of the net assessed valuation for fiscal year 2016-17. See APPENDIX A – “CITY AND COUNTY OF SAN FRANCISCO ORGANIZATION AND FINANCES – CAPITAL FINANCING AND BONDS.”
Additional Debt; Authorized but Unissued Bonds. Issuance of additional authorized bonds can cause the overall property tax rate to increase. As of December 15, 2016, the City had voter approval to issue up to $1.62 billion in additional aggregate principal amount of new bonds payable from ad valorem property taxes. See APPENDIX A – “CITY AND COUNTY OF SAN FRANCISCO ORGANIZATION AND FINANCES – CAPITAL FINANCING AND BONDS – General Obligation Bonds.” In addition, the City expects that it will propose further bond measures to the voters from time to time to help meet its capital needs. The City’s most recent adopted ten-year capital plan sets forth $32 billion of capital needs. See APPENDIX A – “CITY AND COUNTY OF SAN FRANCISCO ORGANIZATION AND FINANCES – CAPITAL FINANCING AND BONDS – Capital Plan.”
City Long-Term Challenges
The following discussion highlights certain long-term challenges facing the City and is not meant to be an exhaustive discussion of challenges facing the City. Notwithstanding the City’s strong economic and financial performance during the recent recovery and despite significant City initiatives to improve public transportation systems, expand access to healthcare and modernize parks and libraries, the City faces several long-term financial challenges and risks described below.
Significant capital investments are proposed in the City’s adopted ten-year capital plan. However identified funding resources are below those necessary to maintain and enhance the City’s physical infrastructure. As a result, over $10 billion in capital needs are deferred from the capital plan’s ten-year horizon. Over two-thirds of these unfunded needs relate to the City’s transportation and waterfront infrastructure, where state of good repair investment has lagged for decades. Mayor Edwin Lee has convened a taskforce to recommend funding mechanisms and strategies to bridge a portion of the gaps in the City’s transportation needs, but it is likely that significant funding gaps will remain even assuming the identification of significant new funding resources.
In addition, the City faces long term challenges with respect to the management of pension and post-employment retirement obligations. The City has taken significant steps to address long-term unfunded liabilities for employee pension and other post-employment benefits, including retiree health obligations, yet significant liabilities remain. In recent years, the City and voters have adopted significant changes that should mitigate these unfunded liabilities over time, including adoption of lower-cost benefit tiers, increases to employee and employer contribution requirements, and establishment of a trust fund to set-aside funding for future retiree health costs. The financial benefit from these changes will phase in over time, however, leaving ongoing financial challenges for the City in the shorter term. Further, the size of these liabilities is based on a
11
number of assumptions, including but not limited to assumed investment returns and actuarial assumptions. It is possible that actual results will differ materially from current assumptions, and such changes in investment returns or other actuarial assumptions could increase budgetary pressures on the City.
Lastly, while the City has adopted a number of measures to better position the City’s operating budget for future economic downturns, these measures may not be sufficient. Economic stabilization reserves have grown significantly during the last four fiscal years and now exceed pre-recession peaks, but remain below adopted target levels of 10% of discretionary General Fund revenues.
There is no assurance that other challenges not discussed in this Official Statement may become material to investors in the future. For more information, see APPENDIX A – “CITY AND COUNTY OF SAN FRANCISCO ORGANIZATION AND FINANCES” and in APPENDIX B – “COMPREHENSIVE ANNUAL FINANCIAL REPORT OF THE CITY AND COUNTY OF SAN FRANCISCO FOR THE FISCAL YEAR ENDED JUNE 30, 2016.”
Seismic Risks
The City is located in a seismically active region. Active earthquake faults underlie both the City and the surrounding Bay Area, including the San Andreas Fault, which passes about three miles to the southeast of the City’s border, and the Hayward Fault, which runs under Oakland, Berkeley and other cities on the east side of San Francisco Bay, about 10 miles away. Significant seismic events include the 1989 Loma Prieta earthquake, centered about 60 miles south of the City, which registered 6.9 on the Richter scale of earthquake intensity. That earthquake caused fires, building collapses, and structural damage to buildings and highways in the City and surrounding areas. The San Francisco-Oakland Bay Bridge, the only east-west vehicle access into the City, was closed for a month for repairs, and several highways in the City were permanently closed and eventually removed. On August 24, 2014, the San Francisco Bay Area experienced a 6.0 earthquake centered near Napa along the West Napa Fault. The City did not suffer any material damage as a result of this earthquake.
In March 2015, the Working Group on California Earthquake Probabilities (a collaborative effort of the U.S. Geological Survey (U.S.G.S.), the California Geological Survey, and the Southern California Earthquake Center) reported that there is a 72% chance that one or more quakes of about magnitude 6.7 or larger will occur in the San Francisco Bay Area before the year 2045. Such earthquakes may be very destructive. In addition to the potential damage to City-owned buildings and facilities (on which the City does not generally carry earthquake insurance), due to the importance of San Francisco as a tourist destination and regional hub of commercial, retail and entertainment activity, a major earthquake anywhere in the Bay Area may cause significant temporary and possibly long-term harm to the City’s economy, tax receipts, and residential and business real property values.
In early 2016, the Port Commission of the City and County of San Francisco commissioned an earthquake vulnerability study of the Northern Waterfront Seawall. The Seawall was constructed over 100 years ago and sits on reclaimed land, rendering it vulnerable to seismic risk. The Seawall provides flood and wave protection to downtown San Francisco, and stabilizes hundreds of acres of filled land. Preliminary findings of the study indicate that a strong earthquake may cause most of the Seawall to settle and move outward toward the Bay, which would significantly increase earthquake damage and disruption along the waterfront. The Port Commission estimates that seismic retrofitting of the Seawall could cost as much as $3 billion, with another $2 billion or more needed to prepare the Seawall for rising sea levels. The study estimates that approximately $1.6 billion in Port assets and $2.1 billion of rents, business income, and wages are at risk from major damage to the Seawall.
12
Risk of Sea Level Changes and Flooding
In May 2009, the California Climate Change Center released a final paper, for informational purposes only, which was funded by the California Energy Commission, the California Environmental Protection Agency, the Metropolitan Transportation Commission, the California Department of Transportation and the California Ocean Protection Council. The title of the paper is “The Impacts of Sea-Level Rise on the California Coast.” The paper posits that increases in sea level will be a significant consequence of climate change over the next century. The paper evaluated the population, infrastructure, and property at risk from projected sea-level rise if no actions are taken to protect the coast. The paper concluded that significant property is at risk of flooding from 100-year flood events as a result of a 1.4 meter sea level rise. The paper further estimates that the replacement value of this property totals nearly $100 billion (in 2000 dollars). Two-thirds of this at-risk property is concentrated in San Francisco Bay, indicating that this region is particularly vulnerable to impacts associated with sea-level rise due to extensive development on the margins of the Bay. A wide range of critical infrastructure, such as roads, hospitals, schools, emergency facilities, wastewater treatment plants, power plants, and wetlands is also vulnerable. Continued development in vulnerable areas will put additional assets at risk and raise protection costs.
The City is unable to predict whether sea-level rise or other impacts of climate change or flooding from a major storm will occur, when they may occur, and if any such events occur, whether they will have a material adverse effect on the business operations or financial condition of the City and the local economy.
Other Events
Seismic events, wildfires, tsunamis, and other natural or man-made events such as cybersecurity breaches may damage City infrastructure and adversely impact the City’s ability to provide municipal services. For example, in November 2016, the SFMTA was subjected to a ransomware attack which disrupted some of the SFMTA’s internal computer systems but did not impact any of the critical transportation systems. Therefore, the attack did not interrupt Muni services nor did it compromise customer privacy or transaction information. The SFMTA, however, took the precaution of turning off the ticket machines and faregates in the Muni Metro subway stations from Friday, November 25 until the morning of Sunday, November 27. While the City takes prudent measures to prevent cyberattacks, no assurance can be given that the City will not be the target of future cybersecurity attacks that could adversely impact the City’s operations.
As another example, in August 2013, a massive wildfire in Tuolumne County and the Stanislaus National Forest burned over 257,135 acres (the “Rim Fire”), which area included portions of the City’s Hetch Hetchy Project. The Hetch Hetchy Project is comprised of dams (including O’Shaughnessy Dam), reservoirs (including Hetch Hetchy Reservoir which supplies 85% of San Francisco’s drinking water), hydroelectric generator and transmission facilities and water transmission facilities. Hetch Hetchy facilities affected by the Rim Fire included two power generating stations and the southern edge of the Hetch Hetchy Reservoir. There was no impact to drinking water quality. The City’s hydroelectric power generation system was interrupted by the fire, forcing the San Francisco Public Utilities Commission to spend approximately $1.6 million buying power on the open market and using existing banked energy with PG&E. The Rim Fire inflicted approximately $40 million in damage to parts of the City’s water and power infrastructure located in the region. In September 2010, a Pacific Gas and Electric Company (“PG&E”) high pressure natural gas transmission pipeline exploded in San Bruno, California, with catastrophic results. There are numerous gas transmission and distribution pipelines owned, operated and maintained by PG&E throughout the City.
TAX MATTERS
Tax Exemption
The delivery of the Bonds is subject to the opinion of Co-Bond Counsel to the effect that interest on the Bonds for federal income tax purposes (1) will be excludable from gross income, as defined in section 61
13
of the Internal Revenue Code of 1986, as amended to the date of such opinion (the “Code”), pursuant to section 103 of the Code and existing regulations, published rulings, and court decisions, and (2) will not be included in computing the alternative minimum taxable income of the owners thereof who are individuals or, except as hereinafter described, corporations. The delivery of the Bonds is also subject to the delivery of the opinion of Co-Bond Counsel, based upon existing provisions of the laws of the State of California, that interest on the Bonds is exempt from personal income taxes of the State of California. A form of Co-Bond Counsel’s opinions is reproduced as APPENDIX F. The statutes, regulations, rulings, and court decisions on which such opinion is based are subject to change.
Interest on the Bonds owned by a corporation will be included in such corporation’s adjusted current earnings for purposes of calculating the federal alternative minimum taxable income of such corporation, other than an S corporation, a qualified mutual fund, a real estate investment trust, a real estate mortgage investment conduit, or a financial asset securitization investment trust (“FASIT”). A corporation’s alternative minimum taxable income is the basis on which the alternative minimum tax imposed by Section 55 of the Code will be computed.
In rendering the foregoing opinions, Co-Bond Counsel will rely upon representations and certifications of the City made in a certificate dated the date of delivery of the Bonds pertaining to the use, expenditure, and investment of the proceeds of the Bonds and will assume continuing compliance by the City with the provisions of the Resolution subsequent to the issuance of the Bonds. The Resolution contains covenants by the City with respect to, among other matters, the use of the proceeds of the Bonds and the facilities financed therewith by persons other than state or local governmental units, the manner in which the proceeds of the Bonds are to be invested, the periodic calculation and payment to the United States Treasury of arbitrage “profits” from the investment of proceeds, and the reporting of certain information to the United States Treasury. Failure to comply with any of these covenants may cause interest on the Bonds to be includable in the gross income of the owners thereof from the date of the issuance of the Bonds.
Co-Bond Counsel’s opinion is not a guarantee of a result, but represents their legal judgment based upon their review of existing statutes, regulations, published rulings and court decisions and the representations and covenants of the City described above. No ruling has been sought from the Internal Revenue Service (the “IRS”) with respect to the matters addressed in the opinion of Co-Bond Counsel, and Co-Bond Counsel’s opinion is not binding on the IRS. The IRS has an ongoing program of auditing the tax-exempt status of the interest on tax-exempt obligations. If an audit of the Bonds is commenced, under current procedures the IRS is likely to treat the City as the “taxpayer,” and the owners of the Bonds would have no right to participate in the audit process. In responding to or defending an audit of the tax-exempt status of the interest on the Bonds, the City may have different or conflicting interests from the owners of the Bonds. Public awareness of any future audit of the Bonds could adversely affect the value and liquidity of the Bonds during the pendency of the audit, regardless of its ultimate outcome.
Except as described above, Co-Bond Counsel expresses no other opinion with respect to any other federal, state or local tax consequences under present law, or proposed legislation, resulting from the receipt or accrual of interest on, or the acquisition or disposition of, the Bonds. Prospective purchasers of the Bonds should be aware that the ownership of tax-exempt obligations such as the Bonds may result in collateral federal tax consequences to, among others, financial institutions, life insurance companies, property and casualty insurance companies, certain foreign corporations doing business in the United States, S corporations with subchapter C earnings and profits, individual recipients of Social Security or Railroad Retirement benefits, individuals otherwise qualifying for the earned income tax credit, owners of an interest in a FASIT, and taxpayers who may be deemed to have incurred or continued indebtedness to purchase or carry, or who have paid or incurred certain expenses allocable to, tax-exempt obligations. Prospective purchasers should consult their own tax advisors as to the applicability of these consequences to their particular circumstances.
Existing law may change to reduce or eliminate the benefit to bondholders of the exclusion of interest on the Bonds from gross income for federal income tax purposes. Any proposed legislation or administrative
14
action, whether or not taken, could also affect the value and marketability of the Bonds. Prospective purchasers of the Bonds should consult with their own tax advisors with respect to any proposed or future changes in tax law.
Tax Accounting Treatment of Discount and Premium on Certain Bonds
The initial public offering price of certain Bonds (the “Discount Bonds”) may be less than the amount payable on such Bonds at maturity. An amount equal to the difference between the initial public offering price of a Discount Bond (assuming that a substantial amount of the Discount Bonds of that maturity are sold to the public at such price) and the amount payable at maturity constitutes original issue discount to the initial purchaser of such Discount Bond. A portion of such original issue discount allocable to the holding period of such Discount Bond by the initial purchaser will, upon the disposition of such Discount Bond (including by reason of its payment at maturity), be treated as interest excludable from gross income, rather than as taxable gain, for federal income tax purposes, on the same terms and conditions as those for other interest on the Bonds described above under “Tax Exemption.” Such interest is considered to be accrued actuarially in accordance with the constant interest method over the life of a Discount Bond, taking into account the semiannual compounding of accrued interest, at the yield to maturity on such Discount Bond and generally will be allocated to an initial purchaser in a different amount from the amount of the payment denominated as interest actually received by the initial purchaser during the tax year.
However, such interest may be required to be taken into account in determining the alternative minimum taxable income of a corporation, for purposes of calculating a corporation’s alternative minimum tax imposed by Section 55 of the Code, and the amount of the branch profits tax applicable to certain foreign corporations doing business in the United States, even though there will not be a corresponding cash payment. In addition, the accrual of such interest may result in certain other collateral federal income tax consequences to, among others, financial institutions, life insurance companies, property and casualty insurance companies, S corporations with subchapter C earnings and profits, individual recipients of Social Security or Railroad Retirement benefits, individuals otherwise qualifying for the earned income tax credit, owners of an interest in a FASIT, and taxpayers who may be deemed to have incurred or continued indebtedness to purchase or carry, or who have paid or incurred certain expenses allocable to, tax-exempt obligations. Moreover, in the event of the redemption, sale or other taxable disposition of a Discount Bond by the initial owner prior to maturity, the amount realized by such owner in excess of the basis of such Discount Bond in the hands of such owner (adjusted upward by the portion of the original issue discount allocable to the period for which such Discount Bond was held) is includable in gross income.
Owners of Discount Bonds should consult with their own tax advisors with respect to the determination of accrued original issue discount on Discount Bonds for federal income tax purposes and with respect to the state and local tax consequences of owning and disposing of Discount Bonds. It is possible that, under applicable provisions governing determination of state and local income taxes, accrued interest on Discount Bonds may be deemed to be received in the year of accrual even though there will not be a corresponding cash payment.
The initial public offering price of certain Bonds (the “Premium Bonds”) may be greater than the amount payable on such Bonds at maturity. An amount equal to the difference between the initial public offering price of a Premium Bond (assuming that a substantial amount of the Premium Bonds of that maturity are sold to the public at such price) and the amount payable at maturity constitutes premium to the initial purchaser of such Premium Bonds. The basis for federal income tax purposes of a Premium Bond in the hands of such initial purchaser must be reduced each year by the amortizable bond premium, although no federal income tax deduction is allowed as a result of such reduction in basis for amortizable bond premium. Such reduction in basis will increase the amount of any gain (or decrease the amount of any loss) to be recognized for federal income tax purposes upon a sale or other taxable disposition of a Premium Bond. The amount of premium which is amortizable each year by an initial purchaser is determined by using such purchaser’s yield to maturity.
15
Purchasers of the Premium Bonds should consult with their own tax advisors with respect to the determination of amortizable bond premium on Premium Bonds for federal income tax purposes and with respect to the state and local tax consequences of owning and disposing of Premium Bonds.
OTHER LEGAL MATTERS
Certain legal matters incident to the authorization, issuance and sale of the Bonds and with regard to the tax status of the interest on the Bonds (see “TAX MATTERS” herein) are subject to the legal opinions of Norton Rose Fulbright US LLP, Los Angeles, California, and Curls Bartling P.C., Oakland, California, Co-Bond Counsel to the City. The signed legal opinions of Co-Bond Counsel, dated and premised on facts existing and law in effect as of the date of original delivery of the Bonds, will be delivered to the initial purchaser of the Bonds at the time of original delivery of the Bonds.
The proposed forms of the legal opinion of Co-Bond Counsel are set forth in APPENDIX F hereto. The text of the legal opinions to be delivered may vary if necessary to reflect facts and law on the date of delivery. The opinions will speak only as of their date, and subsequent distributions of them by recirculation of this Official Statement or otherwise will create no implication that Co-Bond Counsel have reviewed or express any opinion concerning any of the matters referred to in the respective opinions subsequent to their date. In rendering their opinions, Co-Bond Counsel will rely upon certificates and representations of facts to be contained in the transcript of proceedings for the Bonds, which Co-Bond Counsel will not have independently verified.
Co-Bond Counsel undertake no responsibility for the accuracy, completeness or fairness of this Official Statement.
Certain legal matters will be passed upon for the City by the City Attorney and by Hawkins Delafield & Wood LLP, San Francisco, California, Disclosure Counsel.
Hawkins Delafield & Wood LLP has served as disclosure counsel to the City and in such capacity has advised the City with respect to applicable securities laws and participated with responsible City officials and staff in conferences and meetings where information contained in this Official Statement was reviewed for accuracy and completeness. Disclosure Counsel is not responsible for the accuracy or completeness of the statements or information presented in this Official Statement and has not undertaken to independently verify any of such statements or information. Rather, the City is solely responsible for the accuracy and completeness of the statements and information contained in this Official Statement. Upon the delivery of the Bonds, Disclosure Counsel will deliver a letter to the City which advises the City, subject to the assumptions, exclusions, qualifications and limitations set forth therein, that no facts came to attention of such firm which caused them to believe that this Official Statement as of its date and as of the date of delivery of the Bonds contained or contains any untrue statement of a material fact or omitted or omits to state any material fact necessary to make the statements therein, in light of the circumstances under which they were made, not misleading. No purchaser or holder of the Bonds, or other person or party other than the City, will be entitled to or may rely on such letter or Hawkins Delafield & Wood LLP’s having acted in the role of disclosure counsel to the City.
PROFESSIONALS INVOLVED IN THE OFFERING
KNN Public Finance, LLC, Oakland, California and Sperry Capital Inc., Sausalito, California, have served as Co-Financial Advisors to the City with respect to the sale of the Bonds. The Co-Financial Advisors have assisted the City in the City’s review and preparation of this Official Statement and in other matters relating to the planning, structuring, and sale of the Bonds. The Co-Financial Advisors have not independently verified any of the data contained herein nor conducted a detailed investigation of the affairs of the City to determine the accuracy or completeness of this Official Statement and assume no responsibility for the accuracy or completeness of any of the information contained herein. The Co-Financial Advisors, Co-Bond
16
Counsel and Disclosure Counsel will all receive compensation from the City for services rendered in connection with the Bonds contingent upon the sale and delivery of the Bonds. The City Treasurer is acting as paying agent and registrar with respect to the Bonds.
ABSENCE OF LITIGATION
No litigation is pending or threatened concerning the validity of the Bonds, the ability of the City to levy the ad valorem tax required to pay debt service on the Bonds, the corporate existence of the City, or the entitlement to their respective offices of the officers of the City who will execute and deliver the Bonds and other documents and certificates in connection therewith. The City will furnish to the initial purchaser of the Bonds a certificate of the City as to the foregoing as of the time of the original delivery of the Bonds.
CONTINUING DISCLOSURE
The City has covenanted for the benefit of the holders and beneficial owners of the Bonds to provide certain financial information and operating data relating to the City (the “Annual Report”) not later than 270 days after the end of the City’s fiscal year (which currently ends on June 30), commencing with the report for fiscal year 2016-17, which is due not later than March 27, 2018, and to provide notices of the occurrence of certain enumerated events. The Annual Report will be filed by the City with the Municipal Securities Rulemaking Board (“MSRB”). The notices of enumerated events will be filed by the City with the MSRB. The specific nature of the information to be contained in the Annual Report or the notices of enumerated events is summarized in APPENDIX D – “FORM OF CONTINUING DISCLOSURE CERTIFICATE.” These covenants have been made in order to assist the purchaser of the Bonds in complying with Securities and Exchange Commission Rule 15c2-12(b)(5). The ratings on certain obligations of the City were upgraded by Fitch Ratings on March 28, 2013. Under certain continuing disclosure undertakings of the City, the City was required to file a notice of such upgrade with the Electronic Municipal Market Access system of the MSRB by April 11, 2013. The City filed such notice on May 17, 2013.
The City may, from time to time, but is not obligated to, post its Comprehensive Annual Financial Report and other financial information on the City Controller’s web site at www. sfgov.org/controller.
RATINGS
Moody’s Investors Service, Inc. (“Moody’s”), S&P Global Ratings (“S&P”), and Fitch Ratings (“Fitch”), have assigned municipal bond ratings of “Aa1,” “AA+,” and “AA+,” respectively, to the Bonds. Certain information not included in this Official Statement was supplied by the City to the rating agencies to be considered in evaluating the Bonds. The ratings reflect only the views of each rating agency, and any explanation of the significance of any rating may be obtained only from the respective credit rating agencies: Moody’s, at www.moodys.com; S&P, at www.spratings.com; and Fitch, at www.fitchratings.com. The information presented on the website of each rating agency is not incorporated by reference as part of this Official Statement. Investors are advised to read the entire Official Statement to obtain information essential to the making of an informed investment decision. No assurance can be given that any rating issued by a rating agency will be retained for any given period of time or that the same will not be revised or withdrawn entirely by such rating agency, if in its judgment circumstances so warrant. Any such revision or withdrawal of the ratings obtained may have an adverse effect on the market price or marketability of the Bonds. The City undertakes no responsibility to oppose any such downward revision, suspension or withdrawal.
17
SALE OF THE BONDS
The Bonds were sold at competitive bid on January 18, 2017. The Bonds were awarded to Raymond James & Associates, Inc. (the “Purchaser”), which submitted the lowest true interest cost bid, at a purchase price of $184,187,405.70 (the “Purchase Price”). Under the terms of its bid, the Purchaser will be obligated to purchase all of the Bonds if any are purchased, the obligation to make such purchase being subject to the approval of certain legal matters by Co-Bond Counsel, and certain other conditions to be satisfied by the City.
The Purchaser provided the reoffering prices or yields set forth on the inside cover of this Official Statement and the City takes no responsibility for the accuracy of those reoffering prices or yields. Based on the reoffering prices, the Purchase Price reflects the par amount of the Bonds, plus a net original issue premium of $11,820,477.70, and less an underwriting discount (or “spread”) of $753,072.00. The Purchaser may offer and sell Bonds to certain dealers and others at yields that differ from those stated on the inside cover. The offering prices or yields may be changed from time to time by the Purchaser
MISCELLANEOUS
Any statements in this Official Statement involving matters of opinion, whether or not expressly so stated, are intended as such and not as representations of fact. This Official Statement is not to be construed as a contract or agreement between the City and the initial purchaser or owners and beneficial owners of any of the Bonds.
___________________________________
The preparation and distribution of this Official Statement have been duly authorized by the Board of Supervisors of the City.
CITY AND COUNTY OF SAN FRANCISCO
By: /s/ Benjamin Rosenfield Controller

A-1
APPENDIX A
CITY AND COUNTY OF SAN FRANCISCO ORGANIZATION AND FINANCES
This Appendix contains information that is current as of December 31, 2016.
This Appendix A to the Official Statement of the City and County of San Francisco (the “City” or “San Francisco”) covers general information about the City’s governance structure, budget processes, property taxation system and other tax and revenue sources, City expenditures, labor relations, employment benefits and retirement costs, and investments, bonds and other long-term obligations.
The various reports, documents, websites and other information referred to herein are not incorporated herein by such references. The City has referred to certain specified documents in this Appendix A which are hosted on the City’s website. A wide variety of other information, including financial information, concerning the City is available from the City’s publications, websites and its departments. Any such information that is inconsistent with the information set forth in this Official Statement should be disregarded and is not a part of or incorporated into this Appendix A. The information contained in this Official Statement, including this Appendix A, speaks only as of its date, and the information herein is subject to change. Prospective investors are advised to read the entire Official Statement to obtain information essential to the making of an informed investment decision.
TABLE OF CONTENTS
Page
CITY GOVERNMENT ..................................................................................................................................... A-3
City Charter ......................................................................................................................................... A-3
Mayor and Board of Supervisors .......................................................................................................... A-3
Other Elected and Appointed City Officers........................................................................................... A-4
CITY BUDGET ................................................................................................................................................ A-5
Overview ............................................................................................................................................. A-5
Budget Process .................................................................................................................................... A-5
November 2009 Charter Amendment Instituting Two-Year Budgetary Cycle ........................................ A-6
Role of Controller; Budgetary Analysis and Projections ....................................................................... A-7
General Fund Results; Audited Financial Statements ............................................................................ A-7
Five-Year Financial Plan.................................................................................................................... A-12
City Budget Adopted for Fiscal Years 2016-17 and 2017-18............................................................... A-13
Impact of the State of California Budget on Local Finances ................................................................ A-13 Impact of Presidential Election on Federal Revenues .......................................................................... A-14
Budgetary Reserves ........................................................................................................................... A-14
Rainy Day Reserve ............................................................................................................................ A-14
Budget Stabilization Reserve ............................................................................................................. A-15
THE SUCCESSOR AGENCY......................................................................................................................... A-16
Authority and Personnel ..................................................................................................................... A-16 Effect of the Dissolution Act .............................................................................................................. A-16 Oversight Board ................................................................................................................................ A-17 Department of Finance Finding of Completion ................................................................................... A-17 State Controller Asset Transfer Review .............................................................................................. A-17 Continuing Activities ......................................................................................................................... A-17
PROPERTY TAXATION ............................................................................................................................... A-18
Property Taxation System – General .................................................................................................. A-18
Assessed Valuations, Tax Rates and Tax Delinquencies ..................................................................... A-18
Tax Levy and Collection .................................................................................................................... A-20
Taxation of State-Assessed Utility Property........................................................................................ A-22
OTHER CITY TAX REVENUES ................................................................................................................... A-23
Business Taxes .................................................................................................................................. A-23
A-2
Transient Occupancy Tax (Hotel Tax) ................................................................................................ A-24
Real Property Transfer Tax ................................................................................................................ A-25
Sales and Use Tax.............................................................................................................................. A-26 Utility Users Tax ............................................................................................................................... A-27
Emergency Response Fee; Access Line Tax ....................................................................................... A-27 Sugar Sweetened Beverage Tax ......................................................................................................... A-28
Parking Tax ....................................................................................................................................... A-28
INTERGOVERNMENTAL REVENUES ........................................................................................................ A-28
State - Realignment............................................................................................................................ A-28
Public Safety Sales Tax...................................................................................................................... A-29
Other Intergovernmental Grants and Subventions ............................................................................... A-29
Charges for Services .......................................................................................................................... A-29
CITY GENERAL FUND PROGRAMS AND EXPENDITURES..................................................................... A-29
General Fund Expenditures by Major Service Area ............................................................................ A-29
Baselines ........................................................................................................................................... A-30
EMPLOYMENT COSTS; POST-RETIREMENT OBLIGATIONS ................................................................. A-32
Labor Relations ................................................................................................................................. A-32
San Francisco Employees’ Retirement System (“SFERS” or “Retirement System”) ............................ A-34
Medical Benefits ................................................................................................................................ A-40
Total City Employee Benefits Costs ................................................................................................... A-44
INVESTMENT OF CITY FUNDS .................................................................................................................. A-45
CAPITAL FINANCING AND BONDS........................................................................................................... A-47
Capital Plan ....................................................................................................................................... A-47
Tax-Supported Debt Service .............................................................................................................. A-48
General Obligation Bonds .................................................................................................................. A-49 Refunding General Obligation Bonds ................................................................................................. A-50 Lease Payments and Other Long-Term Obligations ............................................................................ A-51
Commercial Paper Program ............................................................................................................... A-53
Board Authorized and Unissued Long-Term Obligations .................................................................... A-54
Overlapping Debt .............................................................................................................................. A-54
MAJOR ECONOMIC DEVELOPMENT PROJECTS ..................................................................................... A-56
Hunters Point Shipyard (Phase 1 and 2) and Candlestick Point............................................................ A-56
Treasure Island .................................................................................................................................. A-57 Mission Bay Blocks 29-32-Warrior’s Multipurpose Recreation and Entertainment Venue ................... A-57
Transbay............................................................................................................................................ A-57
Mission Bay ...................................................................................................................................... A-58
Seawall Lot (SWL) 337 and Pier 48 (Mission Rock)........................................................................... A-58
Pier 70……………… ........................................................................................................................ A-59
Moscone Convention Center .............................................................................................................. A-59
CONSTITUTIONAL AND STATUTORY LIMITATIONS ON TAXES AND EXPENDITURES ................... A-59
Article XIII A of the California Constitution ...................................................................................... A-60
Article XIII B of the California Constitution....................................................................................... A-60
Articles XIII C and XIII D of the California Constitution ................................................................... A-60
Statutory Limitations ......................................................................................................................... A-61
Proposition 1A ................................................................................................................................... A-62
Proposition 22 ................................................................................................................................... A-62
Proposition 26 ................................................................................................................................... A-63
Future Initiatives and Changes in Law ................................................................................................ A-63
LITIGATION AND RISK MANAGEMENT................................................................................................... A-64
Pending Litigation ............................................................................................................................. A-64
Risk Retention Program ..................................................................................................................... A-64
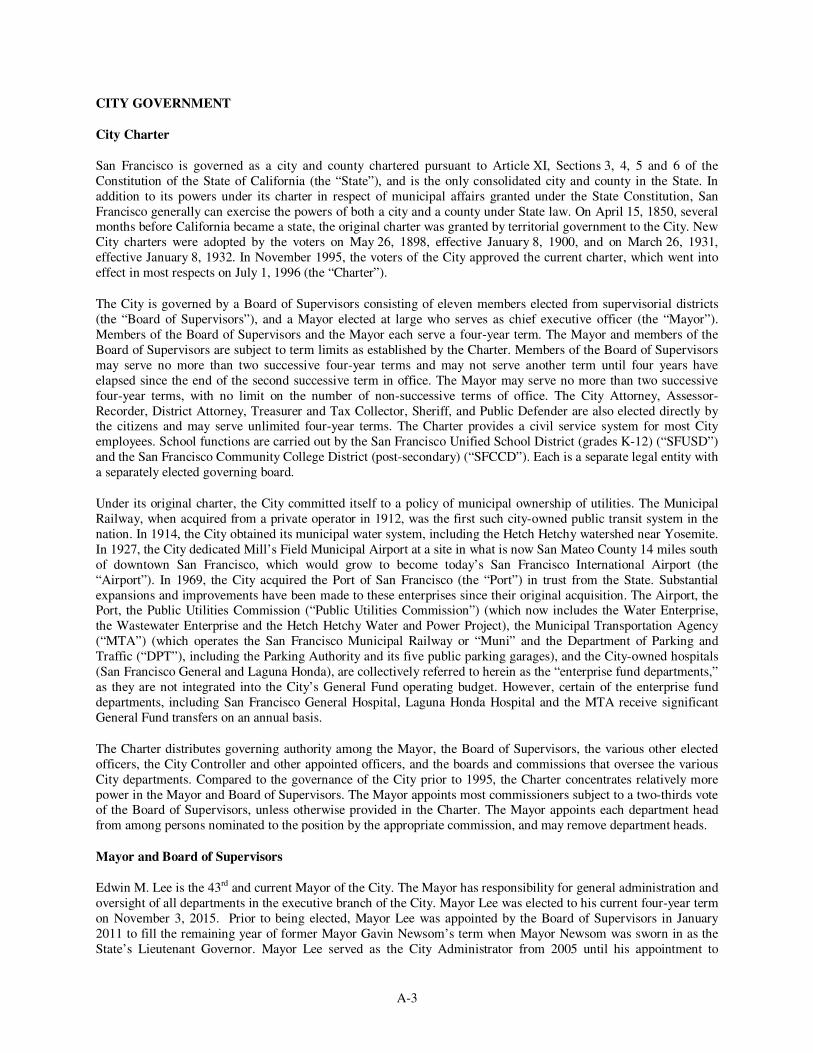
A-3
CITY GOVERNMENT
City Charter
San Francisco is governed as a city and county chartered pursuant to Article XI, Sections 3, 4, 5 and 6 of the Constitution of the State of California (the “State”), and is the only consolidated city and county in the State. In addition to its powers under its charter in respect of municipal affairs granted under the State Constitution, San Francisco generally can exercise the powers of both a city and a county under State law. On April 15, 1850, several months before California became a state, the original charter was granted by territorial government to the City. New City charters were adopted by the voters on May 26, 1898, effective January 8, 1900, and on March 26, 1931, effective January 8, 1932. In November 1995, the voters of the City approved the current charter, which went into effect in most respects on July 1, 1996 (the “Charter”).
The City is governed by a Board of Supervisors consisting of eleven members elected from supervisorial districts (the “Board of Supervisors”), and a Mayor elected at large who serves as chief executive officer (the “Mayor”). Members of the Board of Supervisors and the Mayor each serve a four-year term. The Mayor and members of the Board of Supervisors are subject to term limits as established by the Charter. Members of the Board of Supervisors may serve no more than two successive four-year terms and may not serve another term until four years have elapsed since the end of the second successive term in office. The Mayor may serve no more than two successive four-year terms, with no limit on the number of non-successive terms of office. The City Attorney, Assessor-Recorder, District Attorney, Treasurer and Tax Collector, Sheriff, and Public Defender are also elected directly by the citizens and may serve unlimited four-year terms. The Charter provides a civil service system for most City employees. School functions are carried out by the San Francisco Unified School District (grades K-12) (“SFUSD”) and the San Francisco Community College District (post-secondary) (“SFCCD”). Each is a separate legal entity with a separately elected governing board.
Under its original charter, the City committed itself to a policy of municipal ownership of utilities. The Municipal Railway, when acquired from a private operator in 1912, was the first such city-owned public transit system in the nation. In 1914, the City obtained its municipal water system, including the Hetch Hetchy watershed near Yosemite. In 1927, the City dedicated Mill’s Field Municipal Airport at a site in what is now San Mateo County 14 miles south of downtown San Francisco, which would grow to become today’s San Francisco International Airport (the “Airport”). In 1969, the City acquired the Port of San Francisco (the “Port”) in trust from the State. Substantial expansions and improvements have been made to these enterprises since their original acquisition. The Airport, the Port, the Public Utilities Commission (“Public Utilities Commission”) (which now includes the Water Enterprise, the Wastewater Enterprise and the Hetch Hetchy Water and Power Project), the Municipal Transportation Agency (“MTA”) (which operates the San Francisco Municipal Railway or “Muni” and the Department of Parking and Traffic (“DPT”), including the Parking Authority and its five public parking garages), and the City-owned hospitals (San Francisco General and Laguna Honda), are collectively referred to herein as the “enterprise fund departments,” as they are not integrated into the City’s General Fund operating budget. However, certain of the enterprise fund departments, including San Francisco General Hospital, Laguna Honda Hospital and the MTA receive significant General Fund transfers on an annual basis.
The Charter distributes governing authority among the Mayor, the Board of Supervisors, the various other elected officers, the City Controller and other appointed officers, and the boards and commissions that oversee the various City departments. Compared to the governance of the City prior to 1995, the Charter concentrates relatively more power in the Mayor and Board of Supervisors. The Mayor appoints most commissioners subject to a two-thirds vote of the Board of Supervisors, unless otherwise provided in the Charter. The Mayor appoints each department head from among persons nominated to the position by the appropriate commission, and may remove department heads.
Mayor and Board of Supervisors
Edwin M. Lee is the 43rd and current Mayor of the City. The Mayor has responsibility for general administration and oversight of all departments in the executive branch of the City. Mayor Lee was elected to his current four-year term on November 3, 2015. Prior to being elected, Mayor Lee was appointed by the Board of Supervisors in January 2011 to fill the remaining year of former Mayor Gavin Newsom’s term when Mayor Newsom was sworn in as the State’s Lieutenant Governor. Mayor Lee served as the City Administrator from 2005 until his appointment to
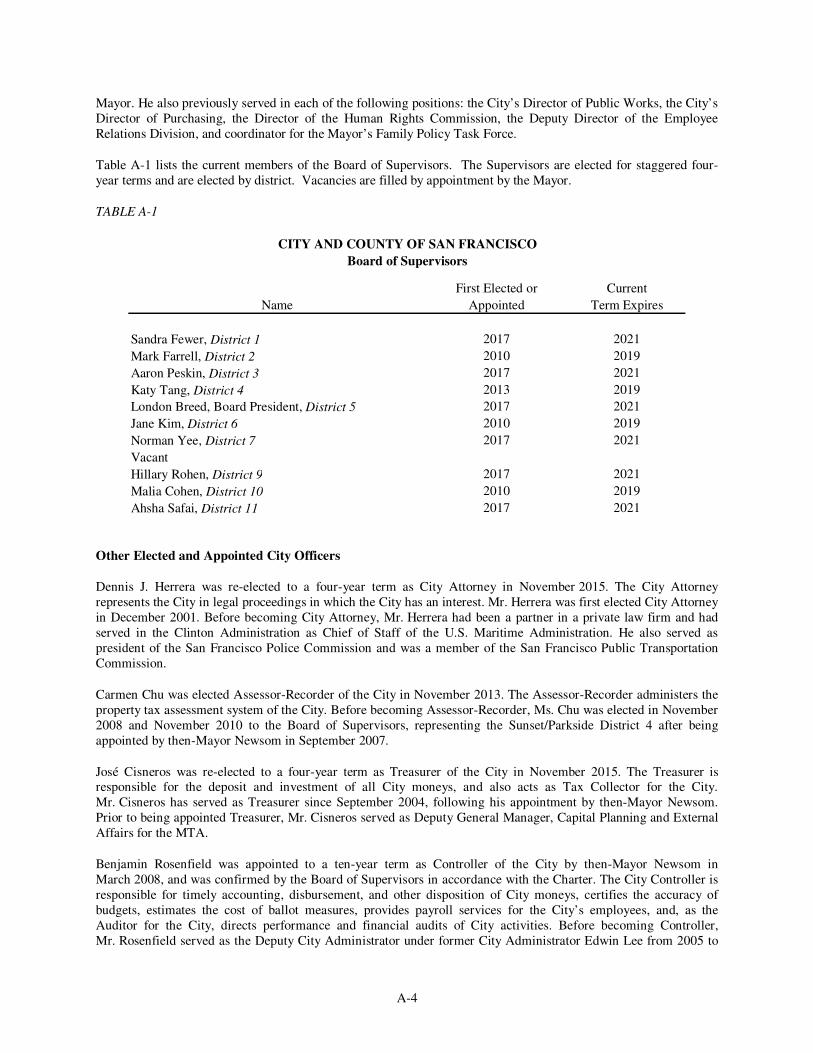
A-4
Mayor. He also previously served in each of the following positions: the City’s Director of Public Works, the City’s Director of Purchasing, the Director of the Human Rights Commission, the Deputy Director of the Employee Relations Division, and coordinator for the Mayor’s Family Policy Task Force.
Table A-1 lists the current members of the Board of Supervisors. The Supervisors are elected for staggered four-year terms and are elected by district. Vacancies are filled by appointment by the Mayor.
TABLE A-1
Name
First Elected or
Appointed
Current
Term Expires
Sandra Fewer, District 1 2017 2021
Mark Farrell, District 2 2010 2019
Aaron Peskin, District 3 2017 2021
Katy Tang, District 4 2013 2019
London Breed, Board President, District 5 2017 2021
Jane Kim, District 6 2010 2019
Norman Yee, District 7 2017 2021
Vacant
Hillary Rohen, District 9 2017 2021
Malia Cohen, District 10 2010 2019
Ahsha Safai, District 11 2017 2021
CITY AND COUNTY OF SAN FRANCISCO
Board of Supervisors
Other Elected and Appointed City Officers
Dennis J. Herrera was re-elected to a four-year term as City Attorney in November 2015. The City Attorney represents the City in legal proceedings in which the City has an interest. Mr. Herrera was first elected City Attorney in December 2001. Before becoming City Attorney, Mr. Herrera had been a partner in a private law firm and had served in the Clinton Administration as Chief of Staff of the U.S. Maritime Administration. He also served as president of the San Francisco Police Commission and was a member of the San Francisco Public Transportation Commission.
Carmen Chu was elected Assessor-Recorder of the City in November 2013. The Assessor-Recorder administers the property tax assessment system of the City. Before becoming Assessor-Recorder, Ms. Chu was elected in November 2008 and November 2010 to the Board of Supervisors, representing the Sunset/Parkside District 4 after being appointed by then-Mayor Newsom in September 2007.
José Cisneros was re-elected to a four-year term as Treasurer of the City in November 2015. The Treasurer is responsible for the deposit and investment of all City moneys, and also acts as Tax Collector for the City. Mr. Cisneros has served as Treasurer since September 2004, following his appointment by then-Mayor Newsom. Prior to being appointed Treasurer, Mr. Cisneros served as Deputy General Manager, Capital Planning and External Affairs for the MTA.
Benjamin Rosenfield was appointed to a ten-year term as Controller of the City by then-Mayor Newsom in March 2008, and was confirmed by the Board of Supervisors in accordance with the Charter. The City Controller is responsible for timely accounting, disbursement, and other disposition of City moneys, certifies the accuracy of budgets, estimates the cost of ballot measures, provides payroll services for the City’s employees, and, as the Auditor for the City, directs performance and financial audits of City activities. Before becoming Controller, Mr. Rosenfield served as the Deputy City Administrator under former City Administrator Edwin Lee from 2005 to
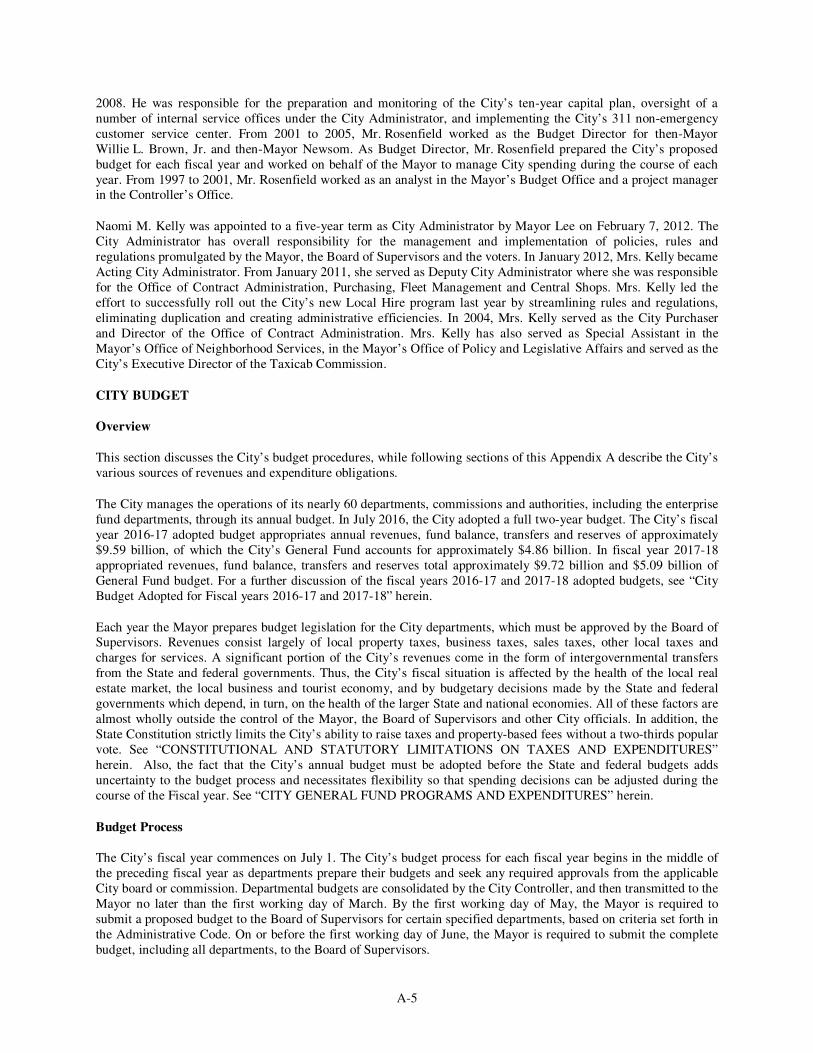
A-5
2008. He was responsible for the preparation and monitoring of the City’s ten-year capital plan, oversight of a number of internal service offices under the City Administrator, and implementing the City’s 311 non-emergency customer service center. From 2001 to 2005, Mr. Rosenfield worked as the Budget Director for then-Mayor Willie L. Brown, Jr. and then-Mayor Newsom. As Budget Director, Mr. Rosenfield prepared the City’s proposed budget for each fiscal year and worked on behalf of the Mayor to manage City spending during the course of each year. From 1997 to 2001, Mr. Rosenfield worked as an analyst in the Mayor’s Budget Office and a project manager in the Controller’s Office.
Naomi M. Kelly was appointed to a five-year term as City Administrator by Mayor Lee on February 7, 2012. The City Administrator has overall responsibility for the management and implementation of policies, rules and regulations promulgated by the Mayor, the Board of Supervisors and the voters. In January 2012, Mrs. Kelly became Acting City Administrator. From January 2011, she served as Deputy City Administrator where she was responsible for the Office of Contract Administration, Purchasing, Fleet Management and Central Shops. Mrs. Kelly led the effort to successfully roll out the City’s new Local Hire program last year by streamlining rules and regulations, eliminating duplication and creating administrative efficiencies. In 2004, Mrs. Kelly served as the City Purchaser and Director of the Office of Contract Administration. Mrs. Kelly has also served as Special Assistant in the Mayor’s Office of Neighborhood Services, in the Mayor’s Office of Policy and Legislative Affairs and served as the City’s Executive Director of the Taxicab Commission.
CITY BUDGET
Overview
This section discusses the City’s budget procedures, while following sections of this Appendix A describe the City’s various sources of revenues and expenditure obligations.
The City manages the operations of its nearly 60 departments, commissions and authorities, including the enterprise fund departments, through its annual budget. In July 2016, the City adopted a full two-year budget. The City’s fiscal year 2016-17 adopted budget appropriates annual revenues, fund balance, transfers and reserves of approximately $9.59 billion, of which the City’s General Fund accounts for approximately $4.86 billion. In fiscal year 2017-18 appropriated revenues, fund balance, transfers and reserves total approximately $9.72 billion and $5.09 billion of General Fund budget. For a further discussion of the fiscal years 2016-17 and 2017-18 adopted budgets, see “City Budget Adopted for Fiscal years 2016-17 and 2017-18” herein.
Each year the Mayor prepares budget legislation for the City departments, which must be approved by the Board of Supervisors. Revenues consist largely of local property taxes, business taxes, sales taxes, other local taxes and charges for services. A significant portion of the City’s revenues come in the form of intergovernmental transfers from the State and federal governments. Thus, the City’s fiscal situation is affected by the health of the local real estate market, the local business and tourist economy, and by budgetary decisions made by the State and federal governments which depend, in turn, on the health of the larger State and national economies. All of these factors are almost wholly outside the control of the Mayor, the Board of Supervisors and other City officials. In addition, the State Constitution strictly limits the City’s ability to raise taxes and property-based fees without a two-thirds popular vote. See “CONSTITUTIONAL AND STATUTORY LIMITATIONS ON TAXES AND EXPENDITURES” herein. Also, the fact that the City’s annual budget must be adopted before the State and federal budgets adds uncertainty to the budget process and necessitates flexibility so that spending decisions can be adjusted during the course of the Fiscal year. See “CITY GENERAL FUND PROGRAMS AND EXPENDITURES” herein.
Budget Process
The City’s fiscal year commences on July 1. The City’s budget process for each fiscal year begins in the middle of the preceding fiscal year as departments prepare their budgets and seek any required approvals from the applicable City board or commission. Departmental budgets are consolidated by the City Controller, and then transmitted to the Mayor no later than the first working day of March. By the first working day of May, the Mayor is required to submit a proposed budget to the Board of Supervisors for certain specified departments, based on criteria set forth in the Administrative Code. On or before the first working day of June, the Mayor is required to submit the complete budget, including all departments, to the Board of Supervisors.
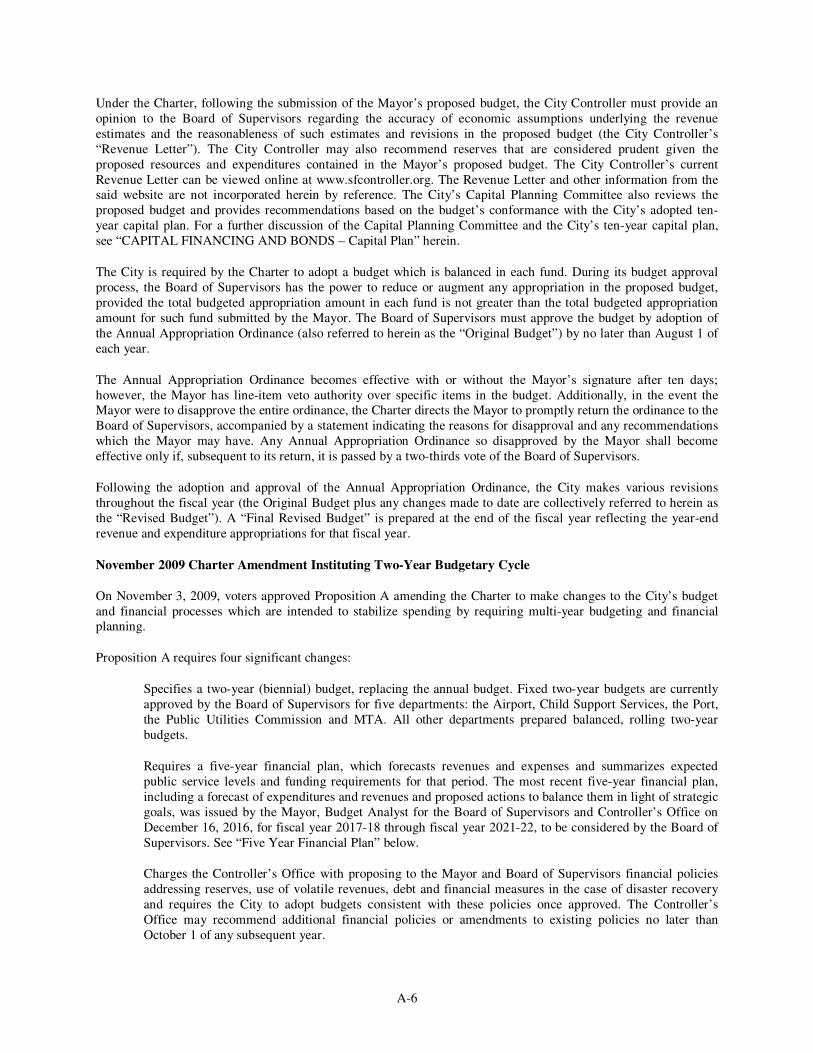
A-6
Under the Charter, following the submission of the Mayor’s proposed budget, the City Controller must provide an opinion to the Board of Supervisors regarding the accuracy of economic assumptions underlying the revenue estimates and the reasonableness of such estimates and revisions in the proposed budget (the City Controller’s “Revenue Letter”). The City Controller may also recommend reserves that are considered prudent given the proposed resources and expenditures contained in the Mayor’s proposed budget. The City Controller’s current Revenue Letter can be viewed online at www.sfcontroller.org. The Revenue Letter and other information from the said website are not incorporated herein by reference. The City’s Capital Planning Committee also reviews the proposed budget and provides recommendations based on the budget’s conformance with the City’s adopted ten-year capital plan. For a further discussion of the Capital Planning Committee and the City’s ten-year capital plan, see “CAPITAL FINANCING AND BONDS – Capital Plan” herein.
The City is required by the Charter to adopt a budget which is balanced in each fund. During its budget approval process, the Board of Supervisors has the power to reduce or augment any appropriation in the proposed budget, provided the total budgeted appropriation amount in each fund is not greater than the total budgeted appropriation amount for such fund submitted by the Mayor. The Board of Supervisors must approve the budget by adoption of the Annual Appropriation Ordinance (also referred to herein as the “Original Budget”) by no later than August 1 of each year.
The Annual Appropriation Ordinance becomes effective with or without the Mayor’s signature after ten days; however, the Mayor has line-item veto authority over specific items in the budget. Additionally, in the event the Mayor were to disapprove the entire ordinance, the Charter directs the Mayor to promptly return the ordinance to the Board of Supervisors, accompanied by a statement indicating the reasons for disapproval and any recommendations which the Mayor may have. Any Annual Appropriation Ordinance so disapproved by the Mayor shall become effective only if, subsequent to its return, it is passed by a two-thirds vote of the Board of Supervisors.
Following the adoption and approval of the Annual Appropriation Ordinance, the City makes various revisions throughout the fiscal year (the Original Budget plus any changes made to date are collectively referred to herein as the “Revised Budget”). A “Final Revised Budget” is prepared at the end of the fiscal year reflecting the year-end revenue and expenditure appropriations for that fiscal year.
November 2009 Charter Amendment Instituting Two-Year Budgetary Cycle
On November 3, 2009, voters approved Proposition A amending the Charter to make changes to the City’s budget and financial processes which are intended to stabilize spending by requiring multi-year budgeting and financial planning.
Proposition A requires four significant changes:
Specifies a two-year (biennial) budget, replacing the annual budget. Fixed two-year budgets are currently approved by the Board of Supervisors for five departments: the Airport, Child Support Services, the Port, the Public Utilities Commission and MTA. All other departments prepared balanced, rolling two-year budgets.
Requires a five-year financial plan, which forecasts revenues and expenses and summarizes expected public service levels and funding requirements for that period. The most recent five-year financial plan, including a forecast of expenditures and revenues and proposed actions to balance them in light of strategic goals, was issued by the Mayor, Budget Analyst for the Board of Supervisors and Controller’s Office on December 16, 2016, for fiscal year 2017-18 through fiscal year 2021-22, to be considered by the Board of Supervisors. See “Five Year Financial Plan” below.
Charges the Controller’s Office with proposing to the Mayor and Board of Supervisors financial policies addressing reserves, use of volatile revenues, debt and financial measures in the case of disaster recovery and requires the City to adopt budgets consistent with these policies once approved. The Controller’s Office may recommend additional financial policies or amendments to existing policies no later than October 1 of any subsequent year.
A-7
Standardizes the processes and deadlines for the City to submit labor agreements for all public employee unions by May 15.
On April 13, 2010, the Board of Supervisors unanimously adopted policies to 1) codify year the City’s current practice of maintaining an annual General Reserve for current year fiscal pressures not anticipated in the budget and roughly double the size of the General Reserve by fiscal year 2015-16, and 2) create a new Budget Stabilization Reserve funded by excess receipts from volatile revenue streams to augment the existing Rainy Day Reserve to help the City mitigate the impact of multi-year downturns. On November 8 and 22, 2011, the Board of Supervisors unanimously adopted additional financial policies limiting the future approval of Certificates of Participation and other long-term obligations to 3.25% of discretionary revenue, and specifying that selected nonrecurring revenues may only be spent on nonrecurring expenditures. On December 16, 2014, the Board of Supervisors unanimously adopted financial policies to implement voter-approved changes to the City’s Rainy Day Reserve, as well as changes to the General Reserve which would increase the cap from 2% to 3% of revenues and reduce deposit requirements during a recession. These policies are described in further detail below under “Budgetary Reserves.” The Controller’s Office may propose additional financial policies by October 1 of any year.
Role of Controller; Budgetary Analysis and Projections
As Chief Fiscal Officer and City Services Auditor, the City Controller monitors spending for all officers, departments and employees charged with receipt, collection or disbursement of City funds. Under the Charter, no obligation to expend City funds can be incurred without a prior certification by the Controller that sufficient revenues are or will be available to meet such obligation as it becomes due in the then-current fiscal year, which ends June 30. The Controller monitors revenues throughout the fiscal year, and if actual revenues are less than estimated, the City Controller may freeze department appropriations or place departments on spending “allotments” which will constrain department expenditures until estimated revenues are realized. If revenues are in excess of what was estimated, or budget surpluses are created, the Controller can certify these surplus funds as a source for supplemental appropriations that may be adopted throughout the year upon approval of the Mayor and the Board of Supervisors. The City’s annual expenditures are often different from the estimated expenditures in the Annual Appropriation Ordinance due to supplemental appropriations, continuing appropriations of prior years, and unexpended current-year funds.
In addition to the five year planning responsibilities established in Proposition A of November 2009 and discussed above, Charter Section 3.105 directs the Controller to issue periodic or special financial reports during the fiscal year. Each year, the Controller issues six-month and nine-month budget status reports to apprise the City’s policymakers of the current budgetary status, including projected year-end revenues, expenditures and fund balances. The Controller issued the most recent of these reports, the fiscal year 2015-16 Nine Month Budget Status Report (the “Nine Month Report”), on May 9, 2016. The City Charter also directs the Controller to annually report on the accuracy of economic assumptions underlying the revenue estimates in the Mayor’s proposed budget. On June 15, 2016 the Controller released the Discussion of the Mayor’s fiscal year 2016-17 and fiscal year 2017-18 Proposed Budget (the “Revenue Letter” as described in “Budget Process” above). All of these reports are available from the Controller’s website: www.sfcontroller.org. The information from said website is not incorporated herein by reference.
General Fund Results: Audited Financial Statements
The General Fund portions of the fiscal years 2016-17 and 2017-18 Original Budgets total $4.86 billion and $5.09 billion, respectively. This does not include expenditures of other governmental funds and enterprise fund departments such as the Airport, the MTA, the Public Utilities Commission, the Port and the City-owned hospitals (San Francisco General and Laguna Honda). Table A-2 shows Final Revised Budget revenues and appropriations for the City’s General Fund for fiscal years 2012-13 through 2015-16 and the Original Budgets for fiscal years 2016-17 and 2017-18. See “PROPERTY TAXATION –Tax Levy and Collection,” “OTHER CITY TAX REVENUES” and “CITY GENERAL FUND PROGRAMS AND EXPENDITURES” herein.
The City’s most recently completed Comprehensive Annual Financial Report (the “CAFR,” which includes the City’s audited financial statements) for fiscal year 2015-16 was issued on November 18, 2016. The fiscal year 2015-16 CAFR reported that as of June 30, 2016, the General Fund available for appropriation in subsequent years was
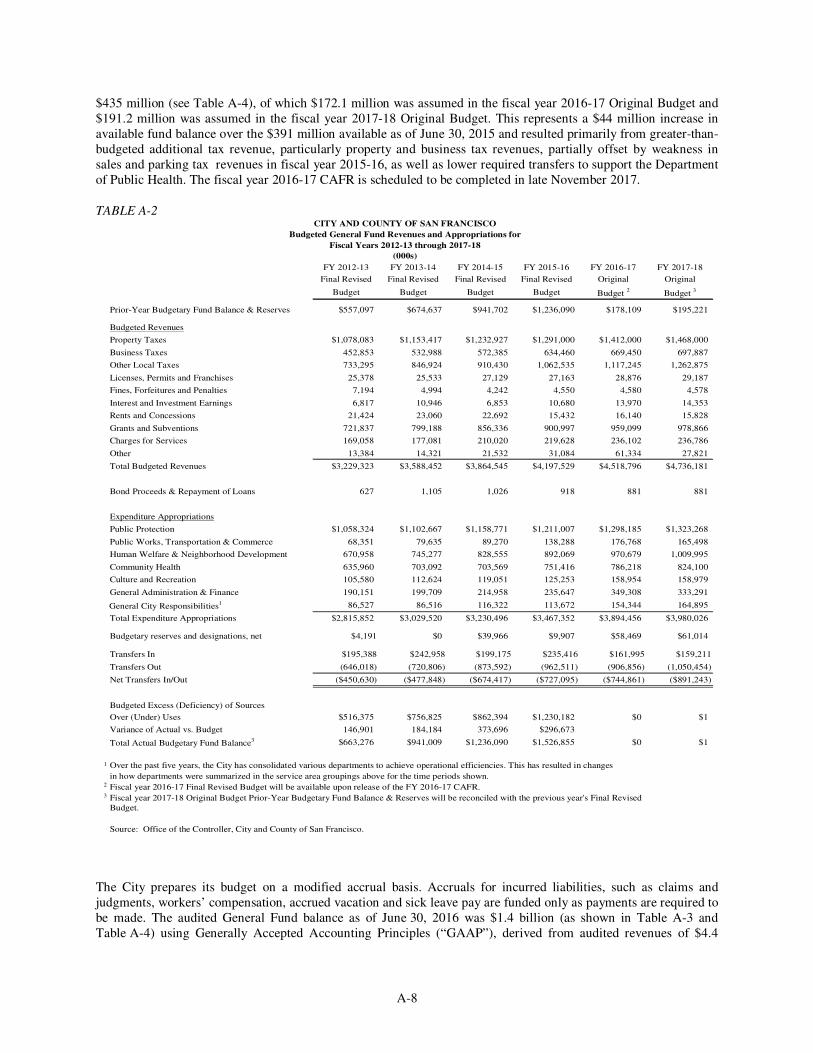
A-8
$435 million (see Table A-4), of which $172.1 million was assumed in the fiscal year 2016-17 Original Budget and $191.2 million was assumed in the fiscal year 2017-18 Original Budget. This represents a $44 million increase in available fund balance over the $391 million available as of June 30, 2015 and resulted primarily from greater-than-budgeted additional tax revenue, particularly property and business tax revenues, partially offset by weakness in sales and parking tax revenues in fiscal year 2015-16, as well as lower required transfers to support the Department of Public Health. The fiscal year 2016-17 CAFR is scheduled to be completed in late November 2017.
TABLE A-2
FY 2012-13 FY 2013-14 FY 2014-15 FY 2015-16 FY 2016-17 FY 2017-18
Final Revised Final Revised Final Revised Final Revised Original Original
Budget Budget Budget Budget Budget 2 Budget 3
Prior-Year Budgetary Fund Balance & Reserves $557,097 $674,637 $941,702 $1,236,090 $178,109 $195,221
Budgeted Revenues
Property Taxes $1,078,083 $1,153,417 $1,232,927 $1,291,000 $1,412,000 $1,468,000
Business Taxes 452,853 532,988 572,385 634,460 669,450 697,887
Other Local Taxes 733,295 846,924 910,430 1,062,535 1,117,245 1,262,875
Licenses, Permits and Franchises 25,378 25,533 27,129 27,163 28,876 29,187
Fines, Forfeitures and Penalties 7,194 4,994 4,242 4,550 4,580 4,578
Interest and Investment Earnings 6,817 10,946 6,853 10,680 13,970 14,353
Rents and Concessions 21,424 23,060 22,692 15,432 16,140 15,828
Grants and Subventions 721,837 799,188 856,336 900,997 959,099 978,866
Charges for Services 169,058 177,081 210,020 219,628 236,102 236,786
Other 13,384 14,321 21,532 31,084 61,334 27,821
Total Budgeted Revenues $3,229,323 $3,588,452 $3,864,545 $4,197,529 $4,518,796 $4,736,181
Bond Proceeds & Repayment of Loans 627 1,105 1,026 918 881 881
Expenditure Appropriations
Public Protection $1,058,324 $1,102,667 $1,158,771 $1,211,007 $1,298,185 $1,323,268
Public Works, Transportation & Commerce 68,351 79,635 89,270 138,288 176,768 165,498
Human Welfare & Neighborhood Development 670,958 745,277 828,555 892,069 970,679 1,009,995
Community Health 635,960 703,092 703,569 751,416 786,218 824,100
Culture and Recreation 105,580 112,624 119,051 125,253 158,954 158,979
General Administration & Finance 190,151 199,709 214,958 235,647 349,308 333,291
General City Responsibilities1 86,527 86,516 116,322 113,672 154,344 164,895
Total Expenditure Appropriations $2,815,852 $3,029,520 $3,230,496 $3,467,352 $3,894,456 $3,980,026
Budgetary reserves and designations, net $4,191 $0 $39,966 $9,907 $58,469 $61,014
Transfers In $195,388 $242,958 $199,175 $235,416 $161,995 $159,211
Transfers Out (646,018) (720,806) (873,592) (962,511) (906,856) (1,050,454)
Net Transfers In/Out ($450,630) ($477,848) ($674,417) ($727,095) ($744,861) ($891,243)
Budgeted Excess (Deficiency) of Sources
Over (Under) Uses $516,375 $756,825 $862,394 $1,230,182 $0 $1
Variance of Actual vs. Budget 146,901 184,184 373,696 $296,673
Total Actual Budgetary Fund Balance3 $663,276 $941,009 $1,236,090 $1,526,855 $0 $1
1 Over the past five years, the City has consolidated various departments to achieve operational efficiencies. This has resulted in changes
in how departments were summarized in the service area groupings above for the time periods shown.2 Fiscal year 2016-17 Final Revised Budget will be available upon release of the FY 2016-17 CAFR.3 Fiscal year 2017-18 Original Budget Prior-Year Budgetary Fund Balance & Reserves will be reconciled with the previous year's Final Revised
Budget.
Source: Office of the Controller, City and County of San Francisco.
CITY AND COUNTY OF SAN FRANCISCO
Budgeted General Fund Revenues and Appropriations for
Fiscal Years 2012-13 through 2017-18
(000s)
The City prepares its budget on a modified accrual basis. Accruals for incurred liabilities, such as claims and judgments, workers’ compensation, accrued vacation and sick leave pay are funded only as payments are required to be made. The audited General Fund balance as of June 30, 2016 was $1.4 billion (as shown in Table A-3 and Table A-4) using Generally Accepted Accounting Principles (“GAAP”), derived from audited revenues of $4.4
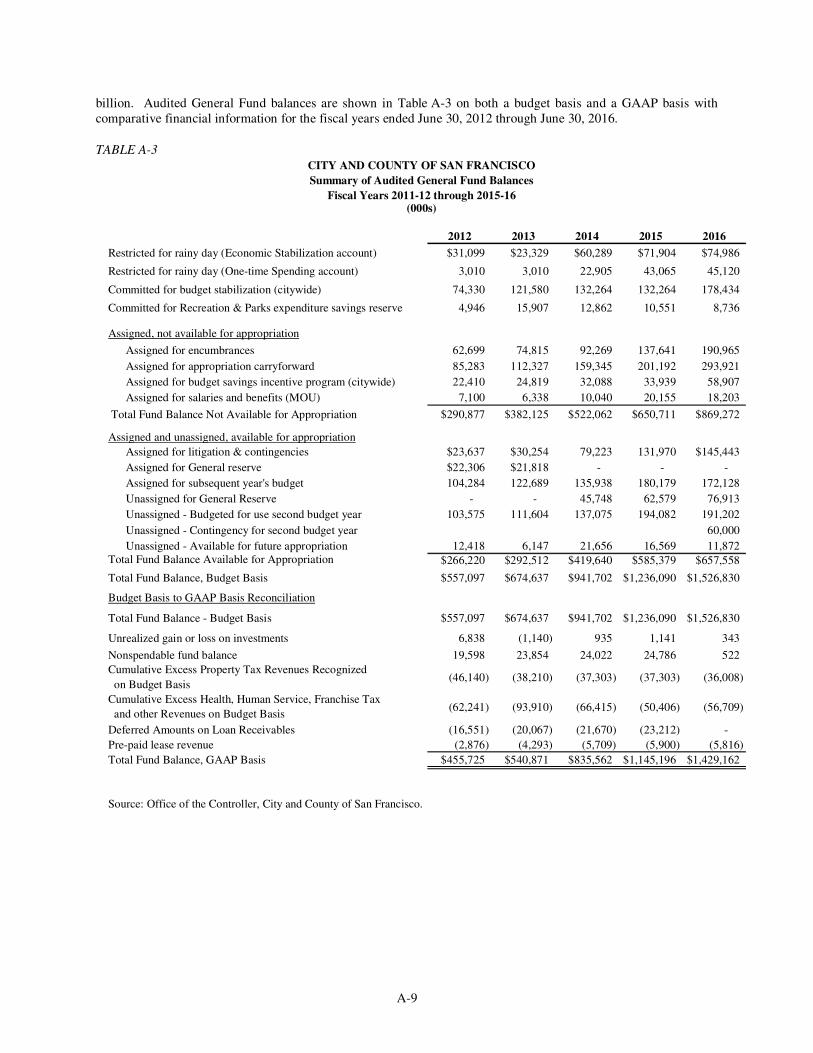
A-9
billion. Audited General Fund balances are shown in Table A-3 on both a budget basis and a GAAP basis with comparative financial information for the fiscal years ended June 30, 2012 through June 30, 2016.
TABLE A-3
2012 2013 2014 2015 2016
Restricted for rainy day (Economic Stabilization account) $31,099 $23,329 $60,289 $71,904 $74,986
Restricted for rainy day (One-time Spending account) 3,010 3,010 22,905 43,065 45,120
Committed for budget stabilization (citywide) 74,330 121,580 132,264 132,264 178,434
Committed for Recreation & Parks expenditure savings reserve 4,946 15,907 12,862 10,551 8,736
Assigned, not available for appropriation
Assigned for encumbrances 62,699 74,815 92,269 137,641 190,965
Assigned for appropriation carryforward 85,283 112,327 159,345 201,192 293,921
Assigned for budget savings incentive program (citywide) 22,410 24,819 32,088 33,939 58,907
Assigned for salaries and benefits (MOU) 7,100 6,338 10,040 20,155 18,203
Total Fund Balance Not Available for Appropriation $290,877 $382,125 $522,062 $650,711 $869,272
Assigned and unassigned, available for appropriation
Assigned for litigation & contingencies $23,637 $30,254 79,223 131,970 $145,443
Assigned for General reserve $22,306 $21,818 - - -
Assigned for subsequent year's budget 104,284 122,689 135,938 180,179 172,128
Unassigned for General Reserve - - 45,748 62,579 76,913
Unassigned - Budgeted for use second budget year 103,575 111,604 137,075 194,082 191,202
Unassigned - Contingency for second budget year 60,000
Unassigned - Available for future appropriation 12,418 6,147 21,656 16,569 11,872 Total Fund Balance Available for Appropriation $266,220 $292,512 $419,640 $585,379 $657,558
Total Fund Balance, Budget Basis $557,097 $674,637 $941,702 $1,236,090 $1,526,830
Budget Basis to GAAP Basis Reconciliation
Total Fund Balance - Budget Basis $557,097 $674,637 $941,702 $1,236,090 $1,526,830
Unrealized gain or loss on investments 6,838 (1,140) 935 1,141 343
Nonspendable fund balance 19,598 23,854 24,022 24,786 522
(46,140) (38,210) (37,303) (37,303) (36,008)
(62,241) (93,910) (66,415) (50,406) (56,709)
Deferred Amounts on Loan Receivables (16,551) (20,067) (21,670) (23,212) -
Pre-paid lease revenue (2,876) (4,293) (5,709) (5,900) (5,816)
Total Fund Balance, GAAP Basis $455,725 $540,871 $835,562 $1,145,196 $1,429,162
Source: Office of the Controller, City and County of San Francisco.
CITY AND COUNTY OF SAN FRANCISCO
(000s)
Cumulative Excess Property Tax Revenues Recognized
on Budget Basis
Cumulative Excess Health, Human Service, Franchise Tax
and other Revenues on Budget Basis
Summary of Audited General Fund Balances
Fiscal Years 2011-12 through 2015-16
A-10
Table A-4, entitled “Audited Statement of Revenues, Expenditures and Changes in General Fund Balances,” is extracted from information in the City’s CAFR for the five most recent fiscal years. Audited financial statements for the fiscal year ended June 30, 2016 are included herein as Appendix B – “COMPREHENSIVE ANNUAL FINANCIAL REPORT OF THE CITY AND COUNTY OF SAN FRANCISCO FOR THE YEAR ENDED JUNE 30, 2016.” Prior years’ audited financial statements can be obtained from the City Controller’s website. Information from the City Controller’s website is not incorporated herein by reference. Excluded from this Statement of General Fund Revenues and Expenditures in Table A-4 are fiduciary funds, internal service funds, special revenue funds (which relate to proceeds of specific revenue sources which are legally restricted to expenditures for specific purposes) and all of the enterprise fund departments of the City, each of which prepares separate audited financial statements.
[Remainder of Page Intentionally Left Blank.]
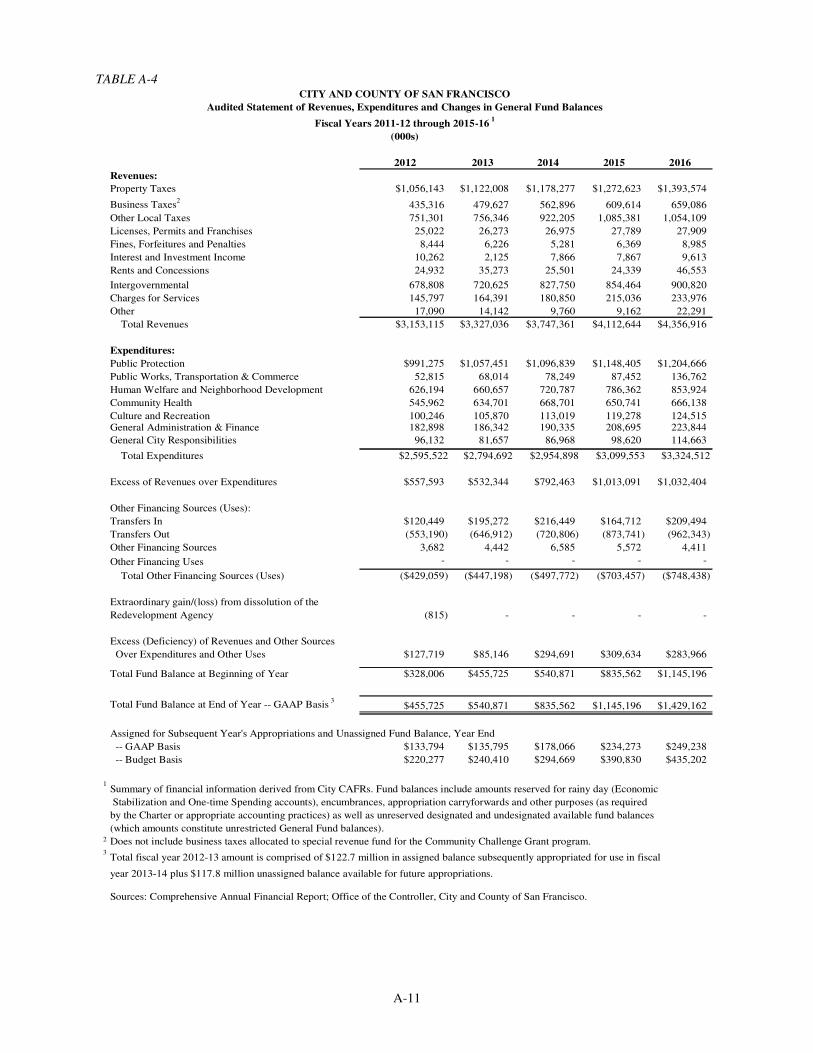
A-11
TABLE A-4
2012 2013 2014 2015 2016
Revenues:
Property Taxes $1,056,143 $1,122,008 $1,178,277 $1,272,623 $1,393,574
Business Taxes2
435,316 479,627 562,896 609,614 659,086
Other Local Taxes 751,301 756,346 922,205 1,085,381 1,054,109
Licenses, Permits and Franchises 25,022 26,273 26,975 27,789 27,909
Fines, Forfeitures and Penalties 8,444 6,226 5,281 6,369 8,985
Interest and Investment Income 10,262 2,125 7,866 7,867 9,613
Rents and Concessions 24,932 35,273 25,501 24,339 46,553
Intergovernmental 678,808 720,625 827,750 854,464 900,820
Charges for Services 145,797 164,391 180,850 215,036 233,976
Other 17,090 14,142 9,760 9,162 22,291
Total Revenues $3,153,115 $3,327,036 $3,747,361 $4,112,644 $4,356,916
Expenditures:
Public Protection $991,275 $1,057,451 $1,096,839 $1,148,405 $1,204,666
Public Works, Transportation & Commerce 52,815 68,014 78,249 87,452 136,762
Human Welfare and Neighborhood Development 626,194 660,657 720,787 786,362 853,924
Community Health 545,962 634,701 668,701 650,741 666,138
Culture and Recreation 100,246 105,870 113,019 119,278 124,515 General Administration & Finance 182,898 186,342 190,335 208,695 223,844
General City Responsibilities 96,132 81,657 86,968 98,620 114,663
Total Expenditures $2,595,522 $2,794,692 $2,954,898 $3,099,553 $3,324,512
Excess of Revenues over Expenditures $557,593 $532,344 $792,463 $1,013,091 $1,032,404
Other Financing Sources (Uses):
Transfers In $120,449 $195,272 $216,449 $164,712 $209,494
Transfers Out (553,190) (646,912) (720,806) (873,741) (962,343)
Other Financing Sources 3,682 4,442 6,585 5,572 4,411
Other Financing Uses - - - - -
Total Other Financing Sources (Uses) ($429,059) ($447,198) ($497,772) ($703,457) ($748,438)
Extraordinary gain/(loss) from dissolution of the
Redevelopment Agency (815) - - - -
Excess (Deficiency) of Revenues and Other Sources
Over Expenditures and Other Uses $127,719 $85,146 $294,691 $309,634 $283,966
Total Fund Balance at Beginning of Year $328,006 $455,725 $540,871 $835,562 $1,145,196
Total Fund Balance at End of Year -- GAAP Basis 3
$455,725 $540,871 $835,562 $1,145,196 $1,429,162
Assigned for Subsequent Year's Appropriations and Unassigned Fund Balance, Year End
-- GAAP Basis $133,794 $135,795 $178,066 $234,273 $249,238
-- Budget Basis $220,277 $240,410 $294,669 $390,830 $435,202
1Summary of financial information derived from City CAFRs. Fund balances include amounts reserved for rainy day (Economic
Stabilization and One-time Spending accounts), encumbrances, appropriation carryforwards and other purposes (as required
by the Charter or appropriate accounting practices) as well as unreserved designated and undesignated available fund balances
(which amounts constitute unrestricted General Fund balances).2 Does not include business taxes allocated to special revenue fund for the Community Challenge Grant program.3
Total fiscal year 2012-13 amount is comprised of $122.7 million in assigned balance subsequently appropriated for use in fiscal
year 2013-14 plus $117.8 million unassigned balance available for future appropriations.
Sources: Comprehensive Annual Financial Report; Office of the Controller, City and County of San Francisco.
CITY AND COUNTY OF SAN FRANCISCO
Audited Statement of Revenues, Expenditures and Changes in General Fund Balances
Fiscal Years 2011-12 through 2015-16 1
(000s)
A-12
Five-Year Financial Plan
The Five-Year Financial Plan (“Plan”) is required under Proposition A, a Charter amendment approved by voters in November 2009. The Charter requires the Plan to forecast expenditures and revenues for the next five fiscal years, propose actions to balance revenues and expenditures during each year of the Plan, and discuss strategic goals and corresponding resources for City departments. Proposition A required that a Plan be adopted every two years. The City updates the Plan annually. The most recently adopted Plan, for fiscal years 2015-16 through 2019-20, was adopted by the Board of Supervisors and signed by the Mayor on April 30, 2015. On March 22, 2016, the Mayor, Budget Analyst for the Board of Supervisors and the Controller’s Office issued the Joint Report for fiscal year 2016-17 through fiscal year 2019-20, which provided an update to the financial outlook of the April 2015 Plan. This report projected a cumulative deficit of $690 million over the following four year period. The increase in the cumulative shortfall projection since that time is largely due to increases in the projected employer contribution rates for the City’s retirement system, increased costs for employee and retiree health benefits, the adoption of several voter-approved spending requirements without commensurate revenue increases, and higher rates of inflationary growth in employee wages and contracts. On December 16, 2016, the Mayor, Budget Analyst for the Board of Supervisors and the Controller’s Office issued a proposed Plan for fiscal year 2017-18 through fiscal year 2021-22, to be considered by the Board of Supervisors. The proposed Plan projects shortfalls of $119 million, $283 million, $585 million, $713 million, and $848 million cumulatively for fiscal years 2017-18 through fiscal year 2021-22, respectively. This report will be updated in March, 2017 with the most recent information on the City’s fiscal condition available at that time. Continued Increases in Employer Contribution Rates to City Retirement System: Consistent with the Joint Report issued in March, 2016, the December 2016 proposed Plan anticipates increased retirement costs. This is in contrast to the pension relief anticipated at the time of the proposed Plan from December 2014, when decreased pension contributions were expected after the amortization of investment losses during the financial crisis. The increase in employer contribution rates is due to three main factors: lower than expected actual fiscal year 2015-16 investment earnings; updated demographic assumptions, which show that retirees are living longer and collecting pensions longer than previously expected; and an appellate court ruling against the City which found that voter-adopted changes to the conditions under which retirees could receive a supplemental COLA violated retirees’ vested rights. Current projections are marginally improved since the March 2016 Joint Report, as they incorporate final fiscal year 2015-16 earnings of 1.3%, compared to -5.0% assumed in the March 2016 Joint Report given investment performance at that point. Increases in Voter Adopted Baselines and Set-Asides: Since the March 2016 Joint Report, several new spending requirements have been adopted by voters: a Recreation and Parks baseline (June 2016 Proposition B), a Dignity Fund baseline (November 2016 Proposition I), and a Street Trees baseline (November 2016 Proposition E). In addition to these spending requirements, the voters rejected the proposed General Sales Tax (November 2016 Proposition K) and adopted an increase to the Real Property Transfer Tax rate (November 2016 Proposition W), as well as a tax on the distribution of sugar-sweetened beverages (November 2016 Proposition V). The December 2016 proposed Plan assumes both the new revenues and expenditure requirements. When voters approve increases to existing baselines, set-asides, or other spending requirements without commensurate revenue increases from new funding sources, this grows the projected deficits and future obligations of the City and also reduces policymakers’ flexibility when balancing the budget. While the projected shortfalls in the December 2016 proposed Plan reflect the difference in projected revenues and expenditures over the next five years if current service levels and policies continue, San Francisco’s Charter requires that each year’s budget be balanced. Balancing the budgets will require some combination of expenditure reductions and/or additional revenues. These projections assume no ongoing solutions are implemented. To the extent budgets are balanced with ongoing solutions, future shortfalls will decrease. The December 2016 proposed Plan does not assume an economic downturn due to the difficulty of predicting recessions; however, the City has historically not experienced more than six consecutive years of expansion and the current economic expansion began over seven years ago. For this reason, the December 16 proposed Plan includes a recession scenario, which reflects a revenue shortfall of $960 million during the forecast period, based on the
A-13
average rates of revenue declines experienced in major tax revenue sources during the previous two recessions. At a high level, the recession scenario would necessitate significant reductions in expenditures.
City Budget Adopted for Fiscal Years 2016-17 and 2017-18
On August 1, 2016, Mayor Lee signed the Consolidated Budget and Annual Appropriation Ordinance (the “Original Budget”) for the fiscal years ending June 30, 2017 and June 30, 2018. This is the fifth two-year budget for the entire City. The adopted budget closed the $100 million and $240 million General Fund shortfalls for fiscal year 2016-17 and fiscal year 2017-18 identified in the December 2015 Plan update through a combination of increased revenues and expenditures savings. The Original Budget for fiscal years 2016-17 and fiscal year 2017-18 totals $9.59 billion and $9.72 billion respectively, representing year over year increases of $360 million and $50 million. The General Fund portion of each year’s budget is $4.86 billion in fiscal year 2016-17 and $5.09 billion in fiscal year 2017-18 representing increases of $272 million and $232 million. There are 30,626 funded full time positions in the fiscal year 2016-17 Original Budget and 30,903 in the fiscal year 2017-18 Original Budget representing year-over-year increases of 1,074 and 277 positions, respectively.
The Original Budget for fiscal years 2016-17 and 2017-18 adheres to the City’s policy limiting the use of certain nonrecurring revenues to nonrecurring expenses proposed by the Controller’s Office and approved unanimously by the Board of Supervisors on November 22, 2011. The policy was approved by the Mayor on December 1, 2011 and can only be suspended for a given fiscal year by a two-thirds vote of the Board. Specifically, this policy limited the Mayor and Board’s ability to use for operating expenses the following nonrecurring revenues: extraordinary year-end General Fund balance (defined as General Fund prior year unassigned fund balance before deposits to the Rainy Day Reserve or Budget Stabilization Reserve in excess of the average of the previous five years), the General Fund share of revenues from prepayments provided under long-term leases, concessions, or contracts, otherwise unrestricted revenues from legal judgments and settlements, and other unrestricted revenues from the sale of land or other fixed assets. Under the policy, these nonrecurring revenues may only be used for nonrecurring expenditures that do not create liability for or expectation of substantial ongoing costs, including but not limited to: discretionary funding of reserves, acquisition of capital equipment, capital projects included in the City’s capital plans, development of affordable housing, and discretionary payment of pension, debt or other long term obligations.
Based on the revenue and expenditure projections contained in the December 2016 proposed plan, on December 8, 2016, the Mayor’s Office issued budget instructions to departments requiring expenditure reductions of 3.0% in fiscal year 2017-18 and an additional reduction of 3.0% in fiscal year 2018-19.
Impact of the State of California Budget on Local Finances Revenues from the State represent approximately 14% of the General Fund revenues appropriated in the budget for fiscal years 2016-17 and 2017-18, and thus changes in State revenues could have a significant impact on the City’s finances. In a typical year, the Governor releases two primary proposed budget documents: 1) the Governor’s Proposed Budget required to be submitted in January; and 2) the “May Revise” to the Governor’s Proposed Budget. The Governor’s Proposed Budget is then considered and typically revised by the State Legislature. Following that process, the State Legislature adopts, and the Governor signs, the State budget. City policy makers review and estimate the impact of both the Governor’s Proposed and May Revise Budgets prior to the City adopting its own budget.
On June 27, 2016, the Governor signed the 2016-17 State Budget, spending $170.9 billion from the General Fund and other State funds. General Fund appropriations total $122.5 billion, $6.9 billion or 6% more than the final 2015-16 spending level. An increase in State revenues boosted 2015-16 spending above the levels approved by the State Legislature in June 2015.
The budget agreement balances new spending with targeted one-time expenditures and preparations for the next recession. The budget makes significant investments in education, including $2.6 billion through the Local Control Funding Formula, as well as $1.4 billion in one-time funding for K-14 schools. Additionally, the state budget includes new commitments to expand health care and social safety net programs. The budget also allocates funding for one-time infrastructure projects for state, university, and community college facilities. Finally, the budget
A-14
prepares for the next recession by increasing deposits to the Rainy Day Fund to a balance $6.7 billion (including a one-time payment of $2 billion), setting an additional $1.8 billion to protect the budget from unexpected revenue shortfalls, and continuing to pay down Proposition 2 debt and liabilities.
Impact of Presidential Election on Federal Revenues
The City is currently assessing the potential for changes to federal funding under a new presidential administration. The scope and timing of changes will not be known until the administration takes office and begins implementing program changes. The fiscal year 2016-17 Original Budget includes $449.7 million in federal subventions, of which $285.3 million is for entitlement programs at the Human Services Agency and $70.9 million is grants to the Department of Public Health. In addition, the City has budgeted over $700 million in State-administered federal health programs, namely Medi-Care and Medicaid. The Controller’s Office will continue to monitor federal budget and policy changes and reflect their financial impact on the City in upcoming quarterly budget updates and long term financial plans.
Budgetary Reserves
Under the Charter, the Treasurer, upon recommendation of the City Controller, is authorized to transfer legally available moneys to the City’s operating cash reserve from any unencumbered funds then held in the City’s pooled investment fund. The operating cash reserve is available to cover cash flow deficits in various City funds, including the City’s General Fund. From time to time, the Treasurer has transferred unencumbered moneys in the pooled investment fund to the operating cash reserve to cover temporary cash flow deficits in the General Fund and other City funds. Any such transfers must be repaid within the same fiscal year in which the transfer was made, together with interest at the rate earned on the pooled funds at the time the funds were used. The City has not issued tax and revenue anticipation notes to finance short-term cash flow needs since fiscal year 1996-97. See “INVESTMENT OF CITY FUNDS – Investment Policy” herein.
The financial policies passed on April 13, 2010 codified the current practice of maintaining an annual General Reserve to be used for current-year fiscal pressures not anticipated during the budget process. The policy set the reserve equal to 1% of budgeted regular General Fund revenues in fiscal year 2012-13 and increasing by 0.25% each year thereafter until reaching 2% of General Fund revenues in fiscal year 2016-17. The Original Budget for fiscal years 2016-17 and 2017-18 includes starting balances of $90.4 million and $106.5 million for the General Reserve for fiscal years 2016-17 and 2017-18, respectively. On December 16, 2014, the Board of Supervisors adopted financial policies to further increase the City’s General Reserve from 2% to 3% of General Fund revenues between fiscal year 2017-18 and fiscal year 2020-21 while reducing the required deposit to 1.5% of General Fund revenues during economic downturns. The intent of this policy change is to increase reserves available during a multi-year downturn.
In addition to the operating cash and general reserves the City maintains two types of reserves to offset unanticipated expenses and which are available for appropriation to City departments by action of the Board of Supervisors. These include the Salaries and Benefit Reserve (Original Budget for fiscal years 2016-17 and 2017-18 includes $16.6 million in fiscal year 2016-17 and $19.3 million in fiscal year 2017-18), and the Litigation Reserve (Original Budget for fiscal years 2016-17 and 2017-18 includes $11 million in each year). Balances in both reflect new appropriations to the reserves and do not include carry-forward of prior year balances. The Charter also requires set asides of a portion of departmental expenditure savings in the form of a citywide Budget Savings Incentive Reserve and a Recreation and Parks Budget Savings Incentive Reserve.
The City also maintains Rainy Day and Budget Stabilization reserves whose balances carry-forward annually and whose use is allowed under select circumstances described below.
Rainy Day Reserve
In November 2003, City voters approved the creation of the City’s Rainy Day Reserve into which the previous Charter-mandated cash reserve was incorporated. Charter Section 9.113.5 requires that if the Controller projects total General Fund revenues for the upcoming budget year will exceed total General Fund revenues for the current year by more than five percent, then the City’s budget shall allocate the anticipated General Fund revenues in excess of that five percent growth into two accounts within the Rainy Day Reserve and for other lawful governmental
A-15
purposes. Effective January 1, 2015, Proposition C passed by the voters in November 2014 divided the existing Rainy Day Economic Stabilization Account into a City Rainy Day Reserve (“City Reserve”) and a School Rainy Day Reserve (“School Reserve”) with each reserve account receiving 50% of the existing balance. Additionally, any deposits to the reserve subsequent to January 1, 2015 will be allocated as follows:
37.5 percent of the excess revenues to the City Reserve; 12.5 percent of the excess revenues to the School Reserve; 25 percent of the excess revenues to the Rainy Day One-Time or Capital Expenditures account; and 25 percent of the excess revenues to any lawful governmental purpose.
Fiscal year 2015-16 revenue exceeded the deposit threshold by $8.2 million generating a deposit of $3.1 million to the City Reserve, $1.0 million to the School Reserve, and $2.1 million to the One-Time or Capital Expenditures account. Deposits to the Rainy Day Reserve’s Economic Stabilization account are subject to a cap of 10% of actual total General Fund revenues as stated in the City’s most recent independent annual audit. Amounts in excess of that cap in any year will be allocated to capital and other one-time expenditures.
Monies in the City Reserve are available to provide a budgetary cushion in years when General Fund revenues are projected to decrease from prior-year levels (or, in the case of a multi-year downturn, the highest of any previous year’s total General Fund revenues). Monies in the Rainy Day Reserve’s One-Time or Capital Expenditures account are available for capital and other one-time spending initiatives. The fiscal year 2015-16 combined ending balance of the One-Time and Economic Stabilization portions of the Reserve was $120.1 million. There are no projected deposits or withdrawals assumed in the fiscal year 2016-17 and 2017-18 budgets.
Budget Stabilization Reserve
On April 13, 2010, the Board of Supervisors unanimously approved the Controller’s proposed financial policies on reserves and the use of certain volatile revenues. The policies were approved by the Mayor on April 30, 2010, and can only be suspended for a given fiscal year by a two-thirds vote of the Board. With these policies the City created two additional types of reserves: the General Reserve, described above, and the Budget Stabilization Reserve.
The Budget Stabilization Reserve augments the existing Rainy Day Reserve and is funded through the dedication of 75% of certain volatile revenues, including Real Property Transfer Tax (“RPTT”) receipts in excess of the five-year annual average (controlling for the effect of any rate increases approved by voters), funds from the sale of assets, and year-end unassigned General Fund balances beyond the amount assumed as a source in the subsequent year’s budget.
Fiscal year 2015-16 RPTT receipts exceeded the five-year annual average by $22.3 million and ending general fund unassigned fund balance was $47.5 million, triggering a $52.3 million deposit. However, $6.2 million of this deposit requirement was offset by the Rainy Day Reserve deposit, resulting in a $46.2 million deposit to the Budget Stabilization Reserve and leaving an ending balance to $178.4 million. The fiscal years 2016-17 and 2017-18 budgets assume no reserve deposits given projected RPTT receipts. The Controller’s Office determines deposits in October of each year based on actual receipts during the prior fiscal year.
The maximum combined value of the Rainy Day Reserve and the Budget Stabilization Reserve is 10% of General Fund revenues, which would be approximately $437 million for fiscal year 2015-16. No further deposits will be made once this cap is reached, and no deposits are required in years when the City is eligible to withdraw. The Budget Stabilization Reserve has the same withdrawal requirements as the Rainy Day Reserve, however, there is no provision for allocations to the SFUSD. Withdrawals are structured to occur over a period of three years: in the first year of a downturn, a maximum of 30% of the combined value of the Rainy Day Reserve and Budget Stabilization Reserve could be drawn; in the second year, the maximum withdrawal is 50%; and, in the third year, the entire remaining balance may be drawn.
A-16
THE SUCCESSOR AGENCY
As described below, the Successor Agency was established by the Board of Supervisors of the City following dissolution of the former San Francisco Redevelopment Agency (the “Former Agency”) pursuant to the Dissolution Act. Within City government, the Successor Agency is titled “The Office of Community Investment and Infrastructure as the Successor to the San Francisco Redevelopment Agency.” Set forth below is a discussion of the history of the Former Agency and the Successor Agency, the governance and operations of the Successor Agency and its powers under the Redevelopment Law and the Dissolution Act, and the limitations thereon. The Successor Agency maintains a website as part of the City’s website. The information on such websites is not incorporated herein by reference.
Authority and Personnel
The powers of the Successor Agency are vested in its governing board (the “Successor Agency Commission”), referred to within the City as the “Commission on Community Investment and Infrastructure,” which has five members who are appointed by the Mayor of the City with the approval of the Board of Supervisors. Members are appointed to staggered four-year terms (provided that two members have initial two-year terms). Once appointed, members serve until replaced or reappointed.
The Successor Agency currently employs approximately 46 full-time equivalent positions. The Executive Director, Tiffany Bohee, was appointed in February 2012. The other principal full-time staff positions are the Deputy Executive Director, Community and Economic Development; the Deputy Executive Director, Finance and Administration; the Deputy Executive Director, Housing; and the Successor Agency General Counsel. Each project area in which the Successor Agency continues to implement redevelopment plans, is managed by a Project Manager. There are separate staff support divisions with real estate and housing development specialists, architects, engineers and planners, and the Successor Agency has its own fiscal, legal, administrative and property management staffs.
Effect of the Dissolution Act
AB 26 and AB 27. The Former Agency was established under the Community Redevelopment Law in 1948. The Former Agency was established under the Redevelopment Law in 1948. As a result of AB 1X 26 and the decision of the California Supreme Court in the California Redevelopment Association case, as of February 1, 2012, all redevelopment agencies in the State were dissolved, including the Former Agency, and successor agencies were designated as successor entities to the former redevelopment agencies to expeditiously wind down the affairs of the former redevelopment agencies and also to satisfy “enforceable obligations” of the former redevelopment agency all under the supervision of a new oversight board, the State Department of Finance and the State Controller. Pursuant to Resolution No. 11-12 (the “Establishing Resolution”) adopted by the Board of Supervisors of the City on January 24, 2012 and signed by the Mayor on January 26, 2012, and Sections 34171(j) and 34173 of the Dissolution Act, the Board of Supervisors of the City confirmed the City’s role as successor to the Former Agency. On June 27, 2012, the Redevelopment Law was amended by AB 1484, which clarified that successor agencies are separate political entities and that the successor agency succeeds to the organizational status of the former redevelopment agency but without any legal authority to participate in redevelopment activities except to complete the work related to an approved enforceable obligation. Pursuant to Ordinance No. 215-12 passed by the Board of Supervisors of the City on October 2, 2012 and signed by the Mayor on October 4, 2012, the Board of Supervisors (i) officially gave the following name to the Successor Agency: the “Successor Agency to the Redevelopment Agency of the City and County of San Francisco,” (ii) created the Successor Agency Commission as the policy body of the Successor Agency, (iii) delegated to the Successor Agency Commission the authority to act in place of the Former Agency Commission to implement the surviving redevelopment projects, the replacement housing obligations and other enforceable obligations of the Former Agency and the authority to take actions that AB 26 and AB 1484 require or allow on behalf of the Successor Agency and (iv) established the composition and terms of the members of the Successor Agency Commission.
A-17
As discussed below, many actions of the Successor Agency are subject to approval by an “oversight board” and the review or approval by the California Department of Finance, including the issuance of bonds such as the Bonds.
Oversight Board
The Oversight Board was formed pursuant to Establishing Resolution adopted by the City’s Board of Supervisors and signed by the Mayor on January 26, 2012. The Oversight Board is governed by a seven-member governing board, with four members appointed by the Mayor, and one member appointed by each of the Bay Area Rapid Transit District (“BART”), the Chancellor of the California Community Colleges, and the County Superintendent of Education.
Department of Finance Finding of Completion
The Dissolution Act established a process for determining the liquid assets that redevelopment agencies should have shifted to their successor agencies when they were dissolved, and the amount that should be available for remittance by the successor agencies to their respective county auditor-controllers for distribution to affected taxing entities within the project areas of the former redevelopment agencies. This determination process was required to be completed through the final step (review by the State Department of Finance) by November 9, 2012 with respect to affordable housing funds and by April 1, 2013 with respect to non-housing funds. Within five business days of receiving notification from the State Department of Finance, a successor agency must remit to the county auditor-controller the amount of unobligated balances determined by the State Department of Finance, or it may request a meet and confer with the State Department of Finance to resolve any disputes.
On May 23, 2013, the Successor Agency promptly remitted to the City Controller the amounts of unobligated balances relating to affording housing funds, determined by the State Department of Finance in the amount of $10,577,932, plus $1,916 in interest. On May 23, 2013, the Successor Agency promptly remitted to the City Controller the amount of unobligated balances relating to all other funds determined by the State Department of Finance in the amount of $959,147. The Successor Agency has made all payments required under AB 1484 and has received its finding of completion from the State Department of Finance on May 29, 2013.
State Controller Asset Transfer Review
The Dissolution Act requires that any assets of a former redevelopment agency transferred to a city, county or other local agency after January 1, 2011, be sent back to the successor agency. The Dissolution Act further requires that the State Controller review any such transfer. The State Controller’s Office issued their Asset Transfer Review in October 2014. The review found $746,060,330 in assets transferred to the City after January 1, 2011, including unallowable transfers to the City totaling $666,830, or less than 1% of transferred assets. The City returned $666,830 to OCII to comply with the State Controller’s Office review.
Continuing Activities
The Former Agency was organized in 1948 by the Board of Supervisors of the City pursuant to the Redevelopment Law. The Former Agency’s mission was to eliminate physical and economic blight within specific geographic areas of the City designated by the Board of Supervisors. The Former Agency had redevelopment plans for nine redevelopment project areas. Because of the existence of enforceable obligations, the Successor Agency is authorized to continue to implement, through the issuance of tax allocation bonds, four major redevelopment projects that were previously administered by the Former Agency: (i) the Mission Bay North and South Redevelopment Project Areas, (ii) the Hunters Point Shipyard Redevelopment Project Area and Zone 1 of the Bayview Redevelopment Project Area, and (iii) the Transbay Redevelopment Project Area (collectively, the “Major Approved Development Projects”). In addition, the Successor Agency continues to manage Yerba Buena Gardens and other assets within the former Yerba Buena Center Redevelopment Project Area (“YBC”). The Successor Agency exercises land use, development and design approval authority for the Major Approved Development Projects and manages the former Redevelopment Agency assets in YBC in place of the Former Agency.
A-18
PROPERTY TAXATION
Property Taxation System – General
The City receives approximately one-third of its total General Fund operating revenues from local property taxes. Property tax revenues result from the application of the appropriate tax rate to the total assessed value of taxable property in the City. The City levies property taxes for general operating purposes as well as for the payment of voter-approved bonds. As a county under State law, the City also levies property taxes on behalf of all local agencies with overlapping jurisdiction within the boundaries of the City.
Local property taxation is the responsibility of various City officers. The Assessor computes the value of locally assessed taxable property. After the assessed roll is closed on June 30th, the City Controller issues a Certificate of Assessed Valuation in August which certifies the taxable assessed value for that fiscal year. The Controller also compiles a schedule of tax rates including the 1.0% tax authorized by Article XIII A of the State Constitution (and mandated by statute), tax surcharges needed to repay voter-approved general obligation bonds, and tax surcharges imposed by overlapping jurisdictions that have been authorized to levy taxes on property located in the City. The Board of Supervisors approves the schedule of tax rates each year by ordinance adopted no later than the last working day of September. The Treasurer and Tax Collector prepare and mail tax bills to taxpayers and collect the taxes on behalf of the City and other overlapping taxing agencies that levy taxes on taxable property located in the City. The Treasurer holds and invests City tax funds, including taxes collected for payment of general obligation bonds, and is charged with payment of principal and interest on such bonds when due. The State Board of Equalization assesses certain special classes of property, as described below. See “Taxation of State-Assessed Utility Property” below.
Assessed Valuations, Tax Rates and Tax Delinquencies
Table A-5 provides a recent history of assessed valuations of taxable property within the City. The property tax rate is composed of two components: 1) the 1.0% countywide portion, and 2) all voter-approved overrides which fund debt service for general obligation bond indebtedness. The total tax rate shown in Table A-5 includes taxes assessed on behalf of the City as well as SFUSD, SFCCD, the Bay Area Air Quality Management District (“BAAQMD”), and BART, all of which are legal entities separate from the City. See also, Table A-26: “Statement of Direct and Overlapping Debt and Long-Term Obligations” below. In addition to ad valorem taxes, voter-approved special assessment taxes or direct charges may also appear on a property tax bill.
Additionally, although no additional rate is levied, a portion of property taxes collected within the City is allocated to the Successor Agency (also known as the Office of Community Investment and Infrastructure or OCII). Property tax revenues attributable to the growth in assessed value of taxable property (known as “tax increment”) within the adopted redevelopment project areas may be utilized by OCII to pay for outstanding and enforceable obligations, causing a loss of tax revenues from those parcels located within project areas to the City and other local taxing agencies, including SFUSD and SFCCD. Taxes collected for payment of debt service on general obligation bonds are not affected or diverted. The Successor Agency received $122 million of property tax increment in fiscal year 2015-16, diverting about $69 million that would have otherwise been apportioned to the City’s discretionary general fund.
The percent collected of property tax (current year levies excluding supplemental) was 99.07% for fiscal year 2015-16. This table has been modified from the corresponding table in previous disclosures in order to make the levy and collection figures consistent with statistical reports provided to the State. Foreclosures, defined as the number of trustee deeds recorded by the Assessor-Recorder’s Office, numbered 212 for fiscal year 2015-16 compared to 102 for fiscal year 2014-15. The trustee deeds recorded in fiscal year 2011-12, fiscal year 2012-13 and fiscal year 2013-14 were 804, 363 and 187, respectively.
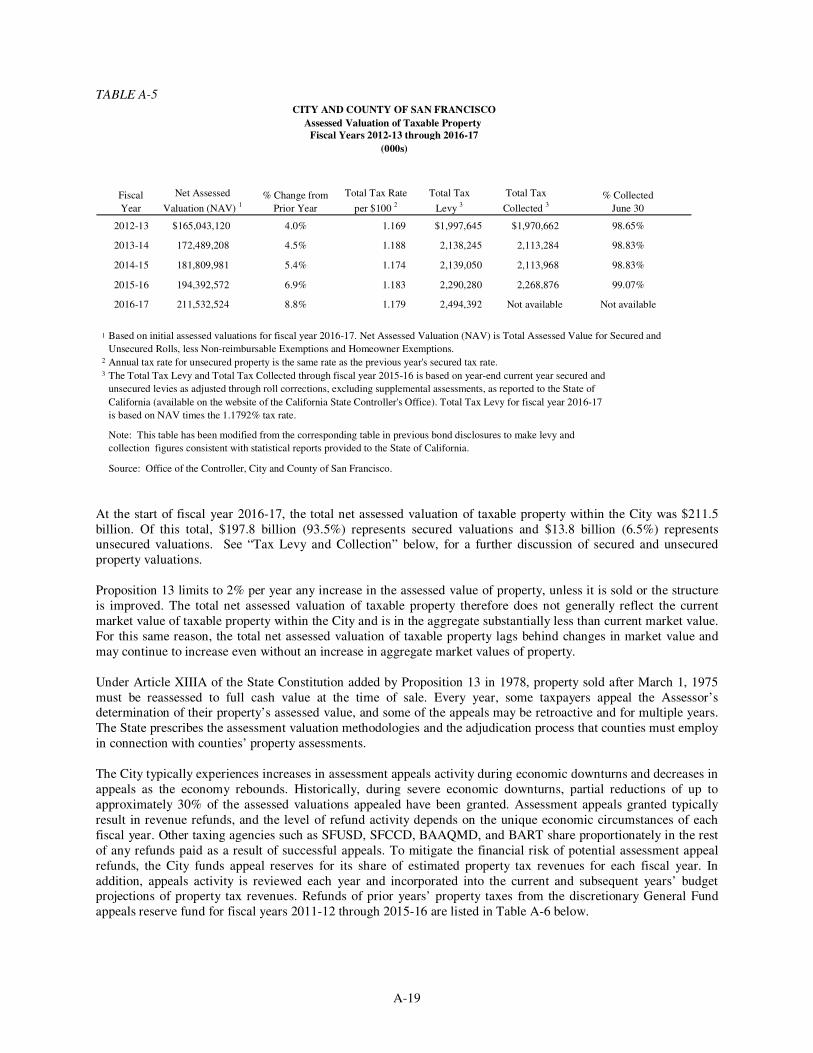
A-19
TABLE A-5
Fiscal
Year
Net Assessed
Valuation (NAV) 1
% Change from
Prior Year
Total Tax Rate
per $100 2Total Tax
Levy 3Total Tax
Collected 3% Collected
June 302011-12 158,649,888 0.5% 1.172 1,918,680 1,883,666 98.18%2012-13 $165,043,120 4.0% 1.169 $1,997,645 $1,970,662 98.65%
2013-14 172,489,208 4.5% 1.188 2,138,245 2,113,284 98.83%
2014-15 181,809,981 5.4% 1.174 2,139,050 2,113,968 98.83%
2015-16 194,392,572 6.9% 1.183 2,290,280 2,268,876 99.07%
2016-17 211,532,524 8.8% 1.179 2,494,392 Not available Not available
1
2
3
is based on NAV times the 1.1792% tax rate.
Note: This table has been modified from the corresponding table in previous bond disclosures to make levy and
collection figures consistent with statistical reports provided to the State of California.
Source: Office of the Controller, City and County of San Francisco.
unsecured levies as adjusted through roll corrections, excluding supplemental assessments, as reported to the State of
California (available on the website of the California State Controller's Office). Total Tax Levy for fiscal year 2016-17
(000s)
Fiscal Years 2012-13 through 2016-17
CITY AND COUNTY OF SAN FRANCISCO
Based on initial assessed valuations for fiscal year 2016-17. Net Assessed Valuation (NAV) is Total Assessed Value for Secured and
Unsecured Rolls, less Non-reimbursable Exemptions and Homeowner Exemptions.
Annual tax rate for unsecured property is the same rate as the previous year's secured tax rate.
The Total Tax Levy and Total Tax Collected through fiscal year 2015-16 is based on year-end current year secured and
Assessed Valuation of Taxable Property
At the start of fiscal year 2016-17, the total net assessed valuation of taxable property within the City was $211.5 billion. Of this total, $197.8 billion (93.5%) represents secured valuations and $13.8 billion (6.5%) represents unsecured valuations. See “Tax Levy and Collection” below, for a further discussion of secured and unsecured property valuations. Proposition 13 limits to 2% per year any increase in the assessed value of property, unless it is sold or the structure is improved. The total net assessed valuation of taxable property therefore does not generally reflect the current market value of taxable property within the City and is in the aggregate substantially less than current market value. For this same reason, the total net assessed valuation of taxable property lags behind changes in market value and may continue to increase even without an increase in aggregate market values of property. Under Article XIIIA of the State Constitution added by Proposition 13 in 1978, property sold after March 1, 1975 must be reassessed to full cash value at the time of sale. Every year, some taxpayers appeal the Assessor’s determination of their property’s assessed value, and some of the appeals may be retroactive and for multiple years. The State prescribes the assessment valuation methodologies and the adjudication process that counties must employ in connection with counties’ property assessments. The City typically experiences increases in assessment appeals activity during economic downturns and decreases in appeals as the economy rebounds. Historically, during severe economic downturns, partial reductions of up to approximately 30% of the assessed valuations appealed have been granted. Assessment appeals granted typically result in revenue refunds, and the level of refund activity depends on the unique economic circumstances of each fiscal year. Other taxing agencies such as SFUSD, SFCCD, BAAQMD, and BART share proportionately in the rest of any refunds paid as a result of successful appeals. To mitigate the financial risk of potential assessment appeal refunds, the City funds appeal reserves for its share of estimated property tax revenues for each fiscal year. In addition, appeals activity is reviewed each year and incorporated into the current and subsequent years’ budget projections of property tax revenues. Refunds of prior years’ property taxes from the discretionary General Fund appeals reserve fund for fiscal years 2011-12 through 2015-16 are listed in Table A-6 below.
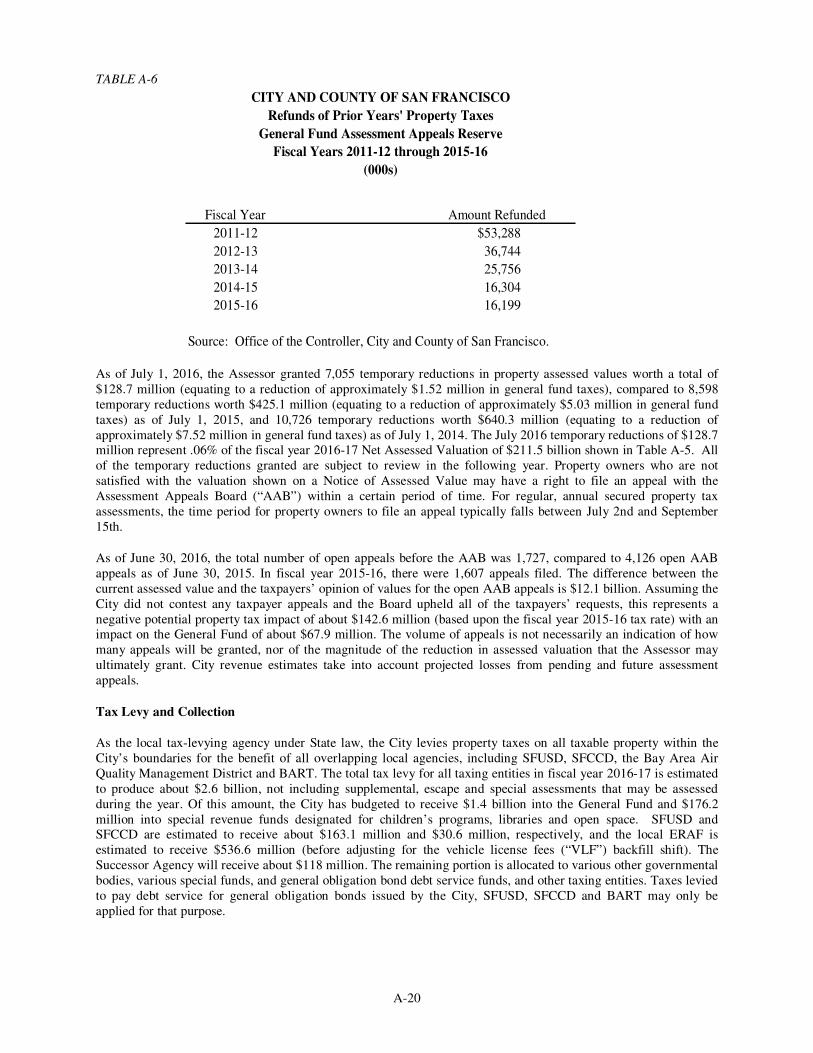
A-20
TABLE A-6
Fiscal Year
2011-12 $53,288
2012-13 36,744
2013-14 25,756
2014-15 16,304
2015-16 16,199
Amount Refunded
Source: Office of the Controller, City and County of San Francisco.
CITY AND COUNTY OF SAN FRANCISCO
Refunds of Prior Years' Property Taxes
General Fund Assessment Appeals Reserve
Fiscal Years 2011-12 through 2015-16
(000s)
As of July 1, 2016, the Assessor granted 7,055 temporary reductions in property assessed values worth a total of $128.7 million (equating to a reduction of approximately $1.52 million in general fund taxes), compared to 8,598 temporary reductions worth $425.1 million (equating to a reduction of approximately $5.03 million in general fund taxes) as of July 1, 2015, and 10,726 temporary reductions worth $640.3 million (equating to a reduction of approximately $7.52 million in general fund taxes) as of July 1, 2014. The July 2016 temporary reductions of $128.7 million represent .06% of the fiscal year 2016-17 Net Assessed Valuation of $211.5 billion shown in Table A-5. All of the temporary reductions granted are subject to review in the following year. Property owners who are not satisfied with the valuation shown on a Notice of Assessed Value may have a right to file an appeal with the Assessment Appeals Board (“AAB”) within a certain period of time. For regular, annual secured property tax assessments, the time period for property owners to file an appeal typically falls between July 2nd and September 15th.
As of June 30, 2016, the total number of open appeals before the AAB was 1,727, compared to 4,126 open AAB appeals as of June 30, 2015. In fiscal year 2015-16, there were 1,607 appeals filed. The difference between the current assessed value and the taxpayers’ opinion of values for the open AAB appeals is $12.1 billion. Assuming the City did not contest any taxpayer appeals and the Board upheld all of the taxpayers’ requests, this represents a negative potential property tax impact of about $142.6 million (based upon the fiscal year 2015-16 tax rate) with an impact on the General Fund of about $67.9 million. The volume of appeals is not necessarily an indication of how many appeals will be granted, nor of the magnitude of the reduction in assessed valuation that the Assessor may ultimately grant. City revenue estimates take into account projected losses from pending and future assessment appeals.
Tax Levy and Collection
As the local tax-levying agency under State law, the City levies property taxes on all taxable property within the City’s boundaries for the benefit of all overlapping local agencies, including SFUSD, SFCCD, the Bay Area Air Quality Management District and BART. The total tax levy for all taxing entities in fiscal year 2016-17 is estimated to produce about $2.6 billion, not including supplemental, escape and special assessments that may be assessed during the year. Of this amount, the City has budgeted to receive $1.4 billion into the General Fund and $176.2 million into special revenue funds designated for children’s programs, libraries and open space. SFUSD and SFCCD are estimated to receive about $163.1 million and $30.6 million, respectively, and the local ERAF is estimated to receive $536.6 million (before adjusting for the vehicle license fees (“VLF”) backfill shift). The Successor Agency will receive about $118 million. The remaining portion is allocated to various other governmental bodies, various special funds, and general obligation bond debt service funds, and other taxing entities. Taxes levied to pay debt service for general obligation bonds issued by the City, SFUSD, SFCCD and BART may only be applied for that purpose.
A-21
General Fund property tax revenues in fiscal year 2015-16 were $1.39 billion, representing an increase of $102.6 million (7.9%) over fiscal year 2015-16 Original Budget and $121.0 million (9.5%) over fiscal year 2014-15 actual revenue. Property tax revenue is budgeted at $1.4 billion in fiscal year 2016-17 representing an increase of $18.4 million (1.3%) over fiscal year 2015-16 actual receipts and $1.5 billion in fiscal year 2017-18 representing an annual increase of $56.0 million (4.0%) over fiscal year 2016-17 budget. Tables A-2 and A-3 set forth a history of budgeted and actual property tax revenues for fiscal years 2011-12 through 2015-16, and budgeted receipts for fiscal years 2016-17 and fiscal year 2017-18. The City’s General Fund is allocated about 48% of total property tax revenue before adjusting for the VLF backfill shift. The State’s Triple Flip ended in fiscal year 2015-16, eliminating the sales tax in-lieu revenue from property taxes from succeeding fiscal years and shifting it to the local sales tax revenue line.
Generally, property taxes levied by the City on real property become a lien on that property by operation of law. A tax levied on personal property does not automatically become a lien against real property without an affirmative act of the City taxing authority. Real property tax liens have priority over all other liens against the same property regardless of the time of their creation by virtue of express provision of law.
Property subject to ad valorem taxes is entered as secured or unsecured on the assessment roll maintained by the Assessor-Recorder. The secured roll is that part of the assessment roll containing State-assessed property and property (real or personal) on which liens are sufficient, in the opinion of the Assessor-Recorder, to secure payment of the taxes owed. Other property is placed on the “unsecured roll.”
The method of collecting delinquent taxes is substantially different for the two classifications of property. The City has four ways of collecting unsecured personal property taxes: 1) pursuing civil action against the taxpayer; 2) filing a certificate in the Office of the Clerk of the Court specifying certain facts, including the date of mailing a copy thereof to the affected taxpayer, in order to obtain a judgment against the taxpayer; 3) filing a certificate of delinquency for recording in the Assessor-Recorder’s Office in order to obtain a lien on certain property of the taxpayer; and 4) seizing and selling personal property, improvements or possessory interests belonging or assessed to the taxpayer. The exclusive means of enforcing the payment of delinquent taxes with respect to property on the secured roll is the sale of the property securing the taxes. Proceeds of the sale are used to pay the costs of sale and the amount of delinquent taxes.
A 10% penalty is added to delinquent taxes that have been levied on property on the secured roll. In addition, property on the secured roll with respect to which taxes are delinquent is declared “tax defaulted” and subject to eventual sale by the Treasurer and Tax Collector of the City. Such property may thereafter be redeemed by payment of the delinquent taxes and the delinquency penalty, plus a redemption penalty of 1.5% per month, which begins to accrue on such taxes beginning July 1 following the date on which the property becomes tax-defaulted.
In October 1993, the Board of Supervisors passed a resolution that adopted the Alternative Method of Tax Apportionment (the “Teeter Plan”). This resolution changed the method by which the City apportions property taxes among itself and other taxing agencies. This apportionment method authorizes the City Controller to allocate to the City’s taxing agencies 100% of the secured property taxes billed but not yet collected. In return, as the delinquent property taxes and associated penalties and interest are collected, the City’s General Fund retains such amounts. Prior to adoption of the Teeter Plan, the City could only allocate secured property taxes actually collected (property taxes billed minus delinquent taxes). Delinquent taxes, penalties and interest were allocated to the City and other taxing agencies only when they were collected. The City has funded payment of accrued and current delinquencies through authorized internal borrowing. The City also maintains a Tax Loss Reserve for the Teeter Plan as shown on Table A-7.
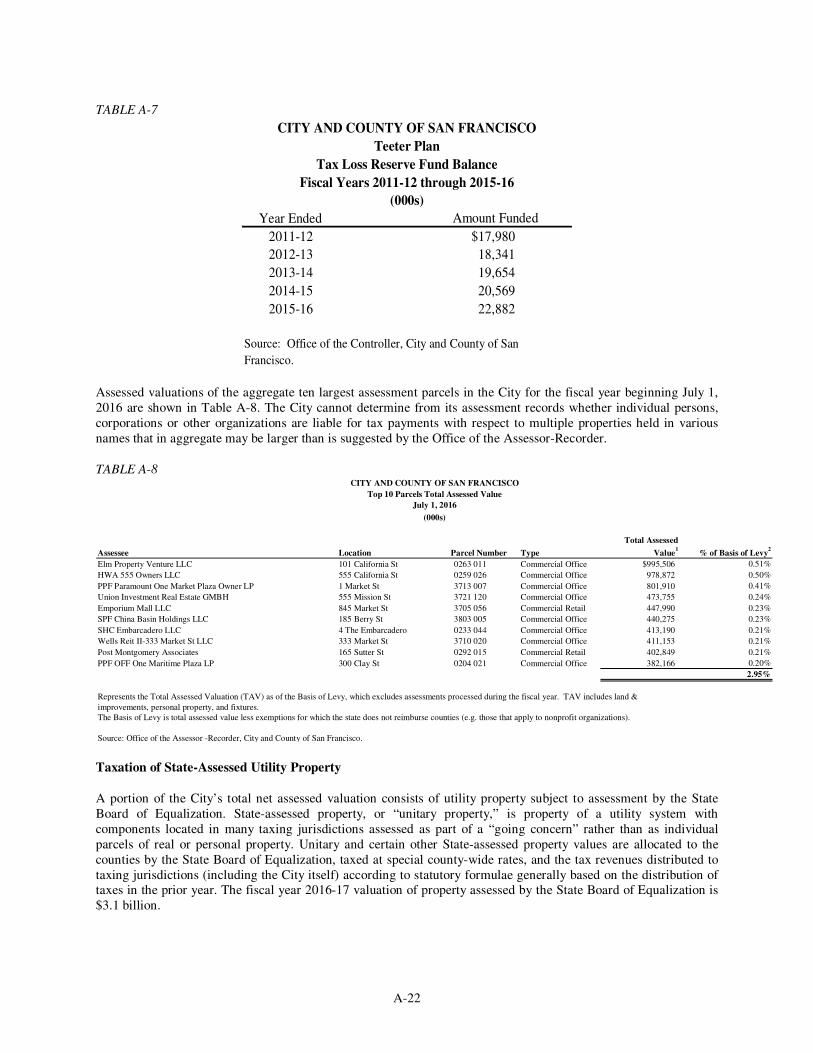
A-22
TABLE A-7
Year Ended
2011-12 $17,980
2012-13 18,341
2013-14 19,654
2014-15 20,569
2015-16 22,882
CITY AND COUNTY OF SAN FRANCISCO
Teeter Plan
Tax Loss Reserve Fund Balance
(000s)
Amount Funded
Source: Office of the Controller, City and County of San
Francisco.
Fiscal Years 2011-12 through 2015-16
Assessed valuations of the aggregate ten largest assessment parcels in the City for the fiscal year beginning July 1, 2016 are shown in Table A-8. The City cannot determine from its assessment records whether individual persons, corporations or other organizations are liable for tax payments with respect to multiple properties held in various names that in aggregate may be larger than is suggested by the Office of the Assessor-Recorder.
TABLE A-8
Assessee Location Parcel Number Type
Total Assessed
Value1
% of Basis of Levy2
Elm Property Venture LLC 101 California St 0263 011 Commercial Office $995,506 0.51%
HWA 555 Owners LLC 555 California St 0259 026 Commercial Office 978,872 0.50%
PPF Paramount One Market Plaza Owner LP 1 Market St 3713 007 Commercial Office 801,910 0.41%
Union Investment Real Estate GMBH 555 Mission St 3721 120 Commercial Office 473,755 0.24%
Emporium Mall LLC 845 Market St 3705 056 Commercial Retail 447,990 0.23%
SPF China Basin Holdings LLC 185 Berry St 3803 005 Commercial Office 440,275 0.23%
SHC Embarcadero LLC 4 The Embarcadero 0233 044 Commercial Office 413,190 0.21%
Wells Reit II-333 Market St LLC 333 Market St 3710 020 Commercial Office 411,153 0.21%
Post Montgomery Associates 165 Sutter St 0292 015 Commercial Retail 402,849 0.21%
PPF OFF One Maritime Plaza LP 300 Clay St 0204 021 Commercial Office 382,166 0.20%
2.95%
Represents the Total Assessed Valuation (TAV) as of the Basis of Levy, which excludes assessments processed during the fiscal year. TAV includes land &
improvements, personal property, and fixtures.
The Basis of Levy is total assessed value less exemptions for which the state does not reimburse counties (e.g. those that apply to nonprofit organizations).
Source: Office of the Assessor -Recorder, City and County of San Francisco.
CITY AND COUNTY OF SAN FRANCISCO
Top 10 Parcels Total Assessed Value
July 1, 2016
(000s)
Taxation of State-Assessed Utility Property
A portion of the City’s total net assessed valuation consists of utility property subject to assessment by the State Board of Equalization. State-assessed property, or “unitary property,” is property of a utility system with components located in many taxing jurisdictions assessed as part of a “going concern” rather than as individual parcels of real or personal property. Unitary and certain other State-assessed property values are allocated to the counties by the State Board of Equalization, taxed at special county-wide rates, and the tax revenues distributed to taxing jurisdictions (including the City itself) according to statutory formulae generally based on the distribution of taxes in the prior year. The fiscal year 2016-17 valuation of property assessed by the State Board of Equalization is $3.1 billion.
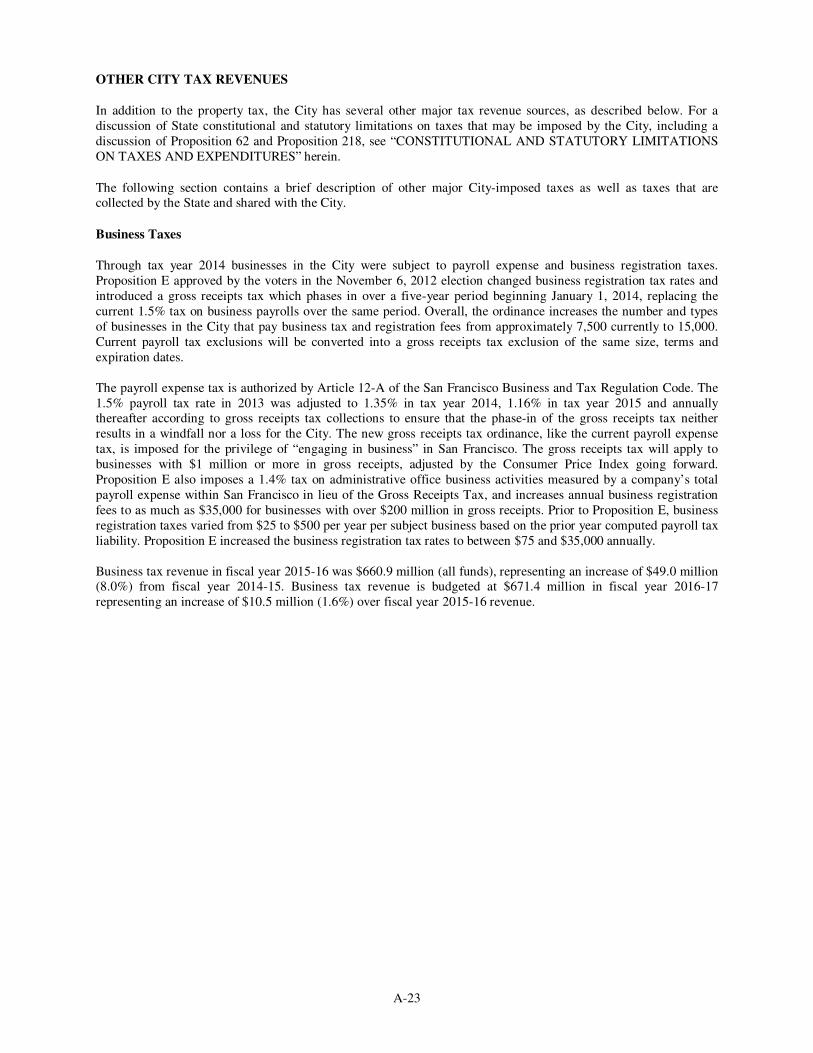
A-23
OTHER CITY TAX REVENUES
In addition to the property tax, the City has several other major tax revenue sources, as described below. For a discussion of State constitutional and statutory limitations on taxes that may be imposed by the City, including a discussion of Proposition 62 and Proposition 218, see “CONSTITUTIONAL AND STATUTORY LIMITATIONS ON TAXES AND EXPENDITURES” herein.
The following section contains a brief description of other major City-imposed taxes as well as taxes that are collected by the State and shared with the City.
Business Taxes
Through tax year 2014 businesses in the City were subject to payroll expense and business registration taxes. Proposition E approved by the voters in the November 6, 2012 election changed business registration tax rates and introduced a gross receipts tax which phases in over a five-year period beginning January 1, 2014, replacing the current 1.5% tax on business payrolls over the same period. Overall, the ordinance increases the number and types of businesses in the City that pay business tax and registration fees from approximately 7,500 currently to 15,000. Current payroll tax exclusions will be converted into a gross receipts tax exclusion of the same size, terms and expiration dates. The payroll expense tax is authorized by Article 12-A of the San Francisco Business and Tax Regulation Code. The 1.5% payroll tax rate in 2013 was adjusted to 1.35% in tax year 2014, 1.16% in tax year 2015 and annually thereafter according to gross receipts tax collections to ensure that the phase-in of the gross receipts tax neither results in a windfall nor a loss for the City. The new gross receipts tax ordinance, like the current payroll expense tax, is imposed for the privilege of “engaging in business” in San Francisco. The gross receipts tax will apply to businesses with $1 million or more in gross receipts, adjusted by the Consumer Price Index going forward. Proposition E also imposes a 1.4% tax on administrative office business activities measured by a company’s total payroll expense within San Francisco in lieu of the Gross Receipts Tax, and increases annual business registration fees to as much as $35,000 for businesses with over $200 million in gross receipts. Prior to Proposition E, business registration taxes varied from $25 to $500 per year per subject business based on the prior year computed payroll tax liability. Proposition E increased the business registration tax rates to between $75 and $35,000 annually. Business tax revenue in fiscal year 2015-16 was $660.9 million (all funds), representing an increase of $49.0 million (8.0%) from fiscal year 2014-15. Business tax revenue is budgeted at $671.4 million in fiscal year 2016-17 representing an increase of $10.5 million (1.6%) over fiscal year 2015-16 revenue.
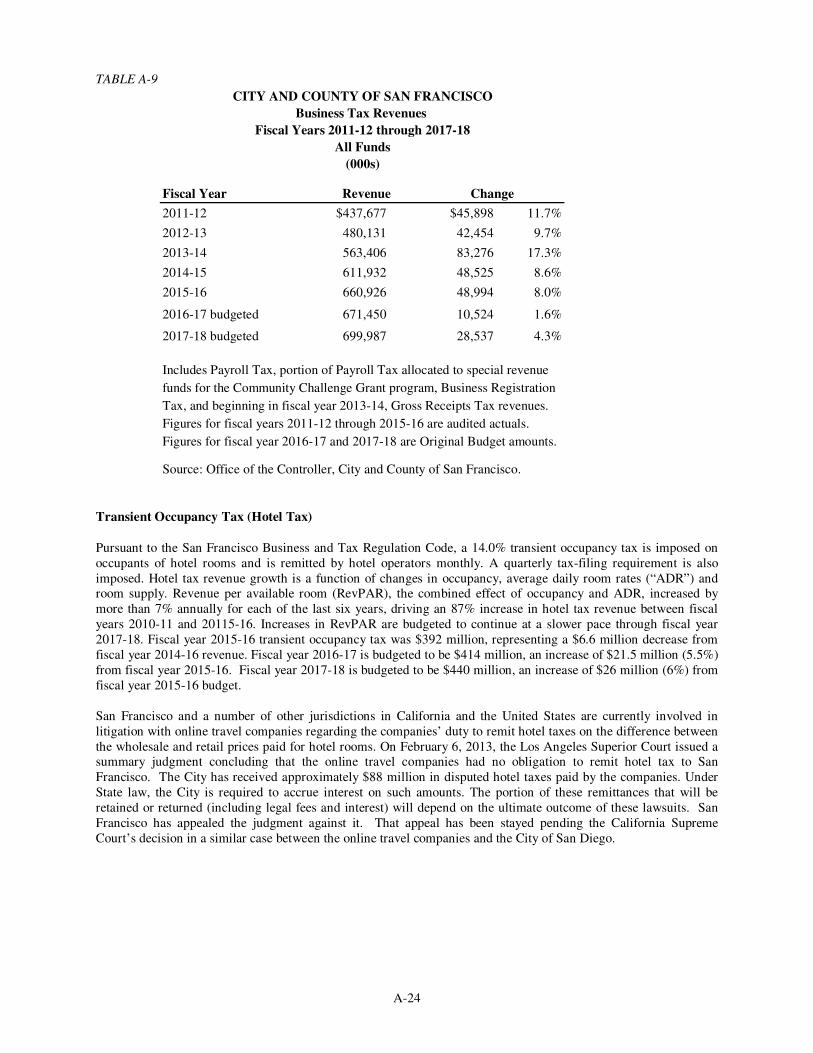
A-24
TABLE A-9
Fiscal Year Revenue
2011-12 $437,677 $45,898 11.7%
2012-13 480,131 42,454 9.7%
2013-14 563,406 83,276 17.3%
2014-15 611,932 48,525 8.6%
2015-16 660,926 48,994 8.0%
2016-17 budgeted 671,450 10,524 1.6%
2017-18 budgeted 699,987 28,537 4.3%
Includes Payroll Tax, portion of Payroll Tax allocated to special revenue
funds for the Community Challenge Grant program, Business Registration
Tax, and beginning in fiscal year 2013-14, Gross Receipts Tax revenues.
Figures for fiscal years 2011-12 through 2015-16 are audited actuals.
Figures for fiscal year 2016-17 and 2017-18 are Original Budget amounts.
Source: Office of the Controller, City and County of San Francisco.
Change
CITY AND COUNTY OF SAN FRANCISCO
Business Tax Revenues
Fiscal Years 2011-12 through 2017-18
All Funds
(000s)
Transient Occupancy Tax (Hotel Tax)
Pursuant to the San Francisco Business and Tax Regulation Code, a 14.0% transient occupancy tax is imposed on occupants of hotel rooms and is remitted by hotel operators monthly. A quarterly tax-filing requirement is also imposed. Hotel tax revenue growth is a function of changes in occupancy, average daily room rates (“ADR”) and room supply. Revenue per available room (RevPAR), the combined effect of occupancy and ADR, increased by more than 7% annually for each of the last six years, driving an 87% increase in hotel tax revenue between fiscal years 2010-11 and 20115-16. Increases in RevPAR are budgeted to continue at a slower pace through fiscal year 2017-18. Fiscal year 2015-16 transient occupancy tax was $392 million, representing a $6.6 million decrease from fiscal year 2014-16 revenue. Fiscal year 2016-17 is budgeted to be $414 million, an increase of $21.5 million (5.5%) from fiscal year 2015-16. Fiscal year 2017-18 is budgeted to be $440 million, an increase of $26 million (6%) from fiscal year 2015-16 budget. San Francisco and a number of other jurisdictions in California and the United States are currently involved in litigation with online travel companies regarding the companies’ duty to remit hotel taxes on the difference between the wholesale and retail prices paid for hotel rooms. On February 6, 2013, the Los Angeles Superior Court issued a summary judgment concluding that the online travel companies had no obligation to remit hotel tax to San Francisco. The City has received approximately $88 million in disputed hotel taxes paid by the companies. Under State law, the City is required to accrue interest on such amounts. The portion of these remittances that will be retained or returned (including legal fees and interest) will depend on the ultimate outcome of these lawsuits. San Francisco has appealed the judgment against it. That appeal has been stayed pending the California Supreme Court’s decision in a similar case between the online travel companies and the City of San Diego.
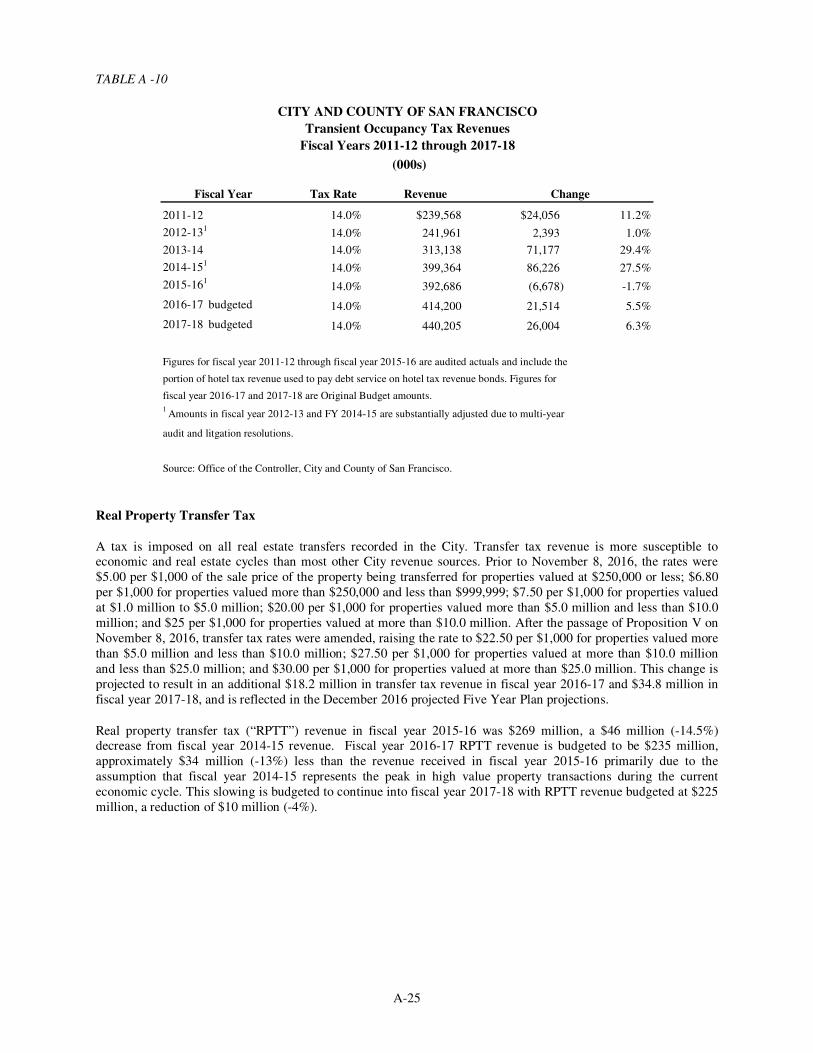
A-25
TABLE A -10
Fiscal Year Tax Rate Revenue
2011-12 14.0% $239,568 $24,056 11.2%
2012-13114.0% 241,961 2,393 1.0%
2013-14 14.0% 313,138 71,177 29.4%
2014-15114.0% 399,364 86,226 27.5%
2015-16114.0% 392,686 (6,678) -1.7%
2016-17 budgeted 14.0% 414,200 21,514 5.5%
2017-18 budgeted 14.0% 440,205 26,004 6.3%
Figures for fiscal year 2011-12 through fiscal year 2015-16 are audited actuals and include the
portion of hotel tax revenue used to pay debt service on hotel tax revenue bonds. Figures for
fiscal year 2016-17 and 2017-18 are Original Budget amounts.1
Amounts in fiscal year 2012-13 and FY 2014-15 are substantially adjusted due to multi-year
audit and litgation resolutions.
Source: Office of the Controller, City and County of San Francisco.
Change
CITY AND COUNTY OF SAN FRANCISCO
Transient Occupancy Tax Revenues
Fiscal Years 2011-12 through 2017-18
(000s)
Real Property Transfer Tax
A tax is imposed on all real estate transfers recorded in the City. Transfer tax revenue is more susceptible to economic and real estate cycles than most other City revenue sources. Prior to November 8, 2016, the rates were $5.00 per $1,000 of the sale price of the property being transferred for properties valued at $250,000 or less; $6.80 per $1,000 for properties valued more than $250,000 and less than $999,999; $7.50 per $1,000 for properties valued at $1.0 million to $5.0 million; $20.00 per $1,000 for properties valued more than $5.0 million and less than $10.0 million; and $25 per $1,000 for properties valued at more than $10.0 million. After the passage of Proposition V on November 8, 2016, transfer tax rates were amended, raising the rate to $22.50 per $1,000 for properties valued more than $5.0 million and less than $10.0 million; $27.50 per $1,000 for properties valued at more than $10.0 million and less than $25.0 million; and $30.00 per $1,000 for properties valued at more than $25.0 million. This change is projected to result in an additional $18.2 million in transfer tax revenue in fiscal year 2016-17 and $34.8 million in fiscal year 2017-18, and is reflected in the December 2016 projected Five Year Plan projections.
Real property transfer tax (“RPTT”) revenue in fiscal year 2015-16 was $269 million, a $46 million (-14.5%) decrease from fiscal year 2014-15 revenue. Fiscal year 2016-17 RPTT revenue is budgeted to be $235 million, approximately $34 million (-13%) less than the revenue received in fiscal year 2015-16 primarily due to the assumption that fiscal year 2014-15 represents the peak in high value property transactions during the current economic cycle. This slowing is budgeted to continue into fiscal year 2017-18 with RPTT revenue budgeted at $225 million, a reduction of $10 million (-4%).
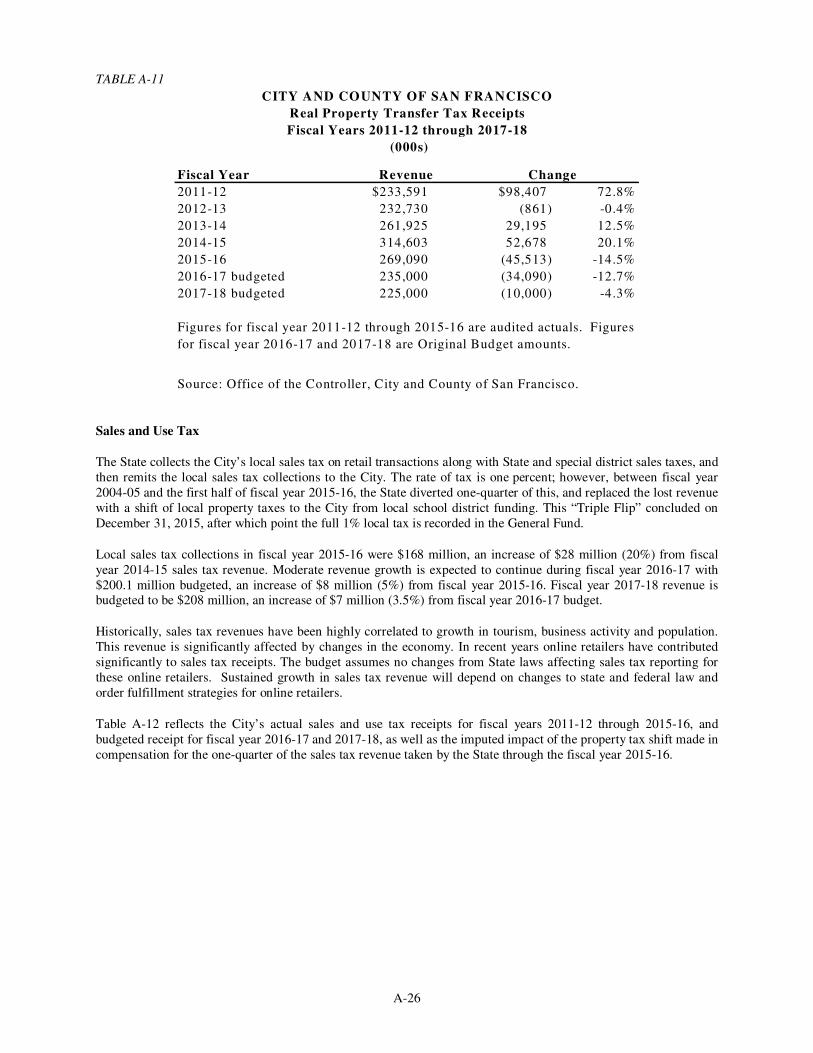
A-26
TABLE A-11
Fiscal Year Revenue
2011-12 $233,591 $98,407 72.8%
2012-13 232,730 (861) -0.4%
2013-14 261,925 29,195 12.5%
2014-15 314,603 52,678 20.1%
2015-16 269,090 (45,513) -14.5%
2016-17 budgeted 235,000 (34,090) -12.7%
2017-18 budgeted 225,000 (10,000) -4.3%
Source: Office of the Controller, City and County of San Francisco.
Figures for fiscal year 2011-12 through 2015-16 are audited actuals. Figures
for fiscal year 2016-17 and 2017-18 are Original Budget amounts.
CITY AND COUNTY OF SAN FRANCISCO
Real Property Transfer Tax Receipts
Fiscal Years 2011-12 through 2017-18
(000s)
Change
Sales and Use Tax
The State collects the City’s local sales tax on retail transactions along with State and special district sales taxes, and then remits the local sales tax collections to the City. The rate of tax is one percent; however, between fiscal year 2004-05 and the first half of fiscal year 2015-16, the State diverted one-quarter of this, and replaced the lost revenue with a shift of local property taxes to the City from local school district funding. This “Triple Flip” concluded on December 31, 2015, after which point the full 1% local tax is recorded in the General Fund.
Local sales tax collections in fiscal year 2015-16 were $168 million, an increase of $28 million (20%) from fiscal year 2014-15 sales tax revenue. Moderate revenue growth is expected to continue during fiscal year 2016-17 with $200.1 million budgeted, an increase of $8 million (5%) from fiscal year 2015-16. Fiscal year 2017-18 revenue is budgeted to be $208 million, an increase of $7 million (3.5%) from fiscal year 2016-17 budget.
Historically, sales tax revenues have been highly correlated to growth in tourism, business activity and population. This revenue is significantly affected by changes in the economy. In recent years online retailers have contributed significantly to sales tax receipts. The budget assumes no changes from State laws affecting sales tax reporting for these online retailers. Sustained growth in sales tax revenue will depend on changes to state and federal law and order fulfillment strategies for online retailers.
Table A-12 reflects the City’s actual sales and use tax receipts for fiscal years 2011-12 through 2015-16, and budgeted receipt for fiscal year 2016-17 and 2017-18, as well as the imputed impact of the property tax shift made in compensation for the one-quarter of the sales tax revenue taken by the State through the fiscal year 2015-16.
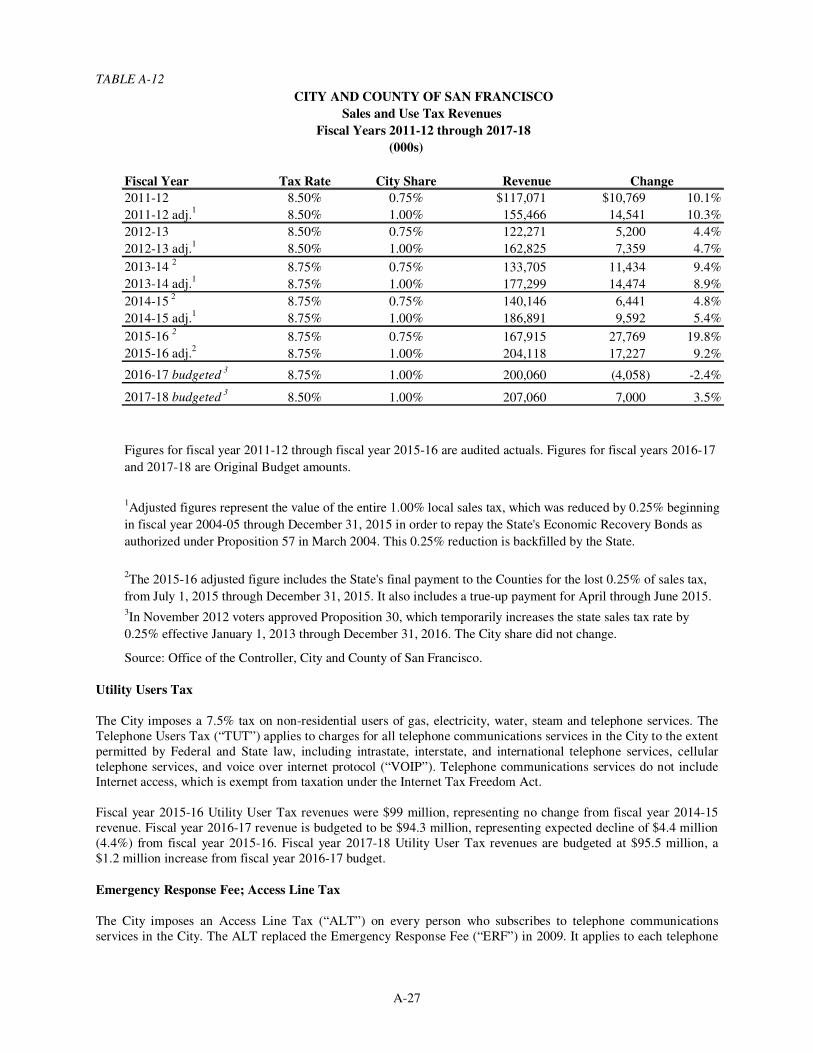
A-27
TABLE A-12
(000s)
Fiscal Year Tax Rate City Share Revenue
2011-12 8.50% 0.75% $117,071 $10,769 10.1%
2011-12 adj.1
8.50% 1.00% 155,466 14,541 10.3%
2012-13 8.50% 0.75% 122,271 5,200 4.4%
2012-13 adj.1
8.50% 1.00% 162,825 7,359 4.7%
2013-14 2
8.75% 0.75% 133,705 11,434 9.4%
2013-14 adj.1
8.75% 1.00% 177,299 14,474 8.9%
2014-15 2
8.75% 0.75% 140,146 6,441 4.8%
2014-15 adj.1
8.75% 1.00% 186,891 9,592 5.4%
2015-16 2
8.75% 0.75% 167,915 27,769 19.8%
2015-16 adj.2
8.75% 1.00% 204,118 17,227 9.2%
2016-17 budgeted3
8.75% 1.00% 200,060 (4,058) -2.4%
2017-18 budgeted3
8.50% 1.00% 207,060 7,000 3.5%
Source: Office of the Controller, City and County of San Francisco.
3In November 2012 voters approved Proposition 30, which temporarily increases the state sales tax rate by
0.25% effective January 1, 2013 through December 31, 2016. The City share did not change.
CITY AND COUNTY OF SAN FRANCISCO
Sales and Use Tax Revenues
Fiscal Years 2011-12 through 2017-18
Change
Figures for fiscal year 2011-12 through fiscal year 2015-16 are audited actuals. Figures for fiscal years 2016-17
and 2017-18 are Original Budget amounts.
1Adjusted figures represent the value of the entire 1.00% local sales tax, which was reduced by 0.25% beginning
in fiscal year 2004-05 through December 31, 2015 in order to repay the State's Economic Recovery Bonds as
authorized under Proposition 57 in March 2004. This 0.25% reduction is backfilled by the State.
2The 2015-16 adjusted figure includes the State's final payment to the Counties for the lost 0.25% of sales tax,
from July 1, 2015 through December 31, 2015. It also includes a true-up payment for April through June 2015.
Utility Users Tax
The City imposes a 7.5% tax on non-residential users of gas, electricity, water, steam and telephone services. The Telephone Users Tax (“TUT”) applies to charges for all telephone communications services in the City to the extent permitted by Federal and State law, including intrastate, interstate, and international telephone services, cellular telephone services, and voice over internet protocol (“VOIP”). Telephone communications services do not include Internet access, which is exempt from taxation under the Internet Tax Freedom Act. Fiscal year 2015-16 Utility User Tax revenues were $99 million, representing no change from fiscal year 2014-15 revenue. Fiscal year 2016-17 revenue is budgeted to be $94.3 million, representing expected decline of $4.4 million (4.4%) from fiscal year 2015-16. Fiscal year 2017-18 Utility User Tax revenues are budgeted at $95.5 million, a $1.2 million increase from fiscal year 2016-17 budget.
Emergency Response Fee; Access Line Tax
The City imposes an Access Line Tax (“ALT”) on every person who subscribes to telephone communications services in the City. The ALT replaced the Emergency Response Fee (“ERF”) in 2009. It applies to each telephone
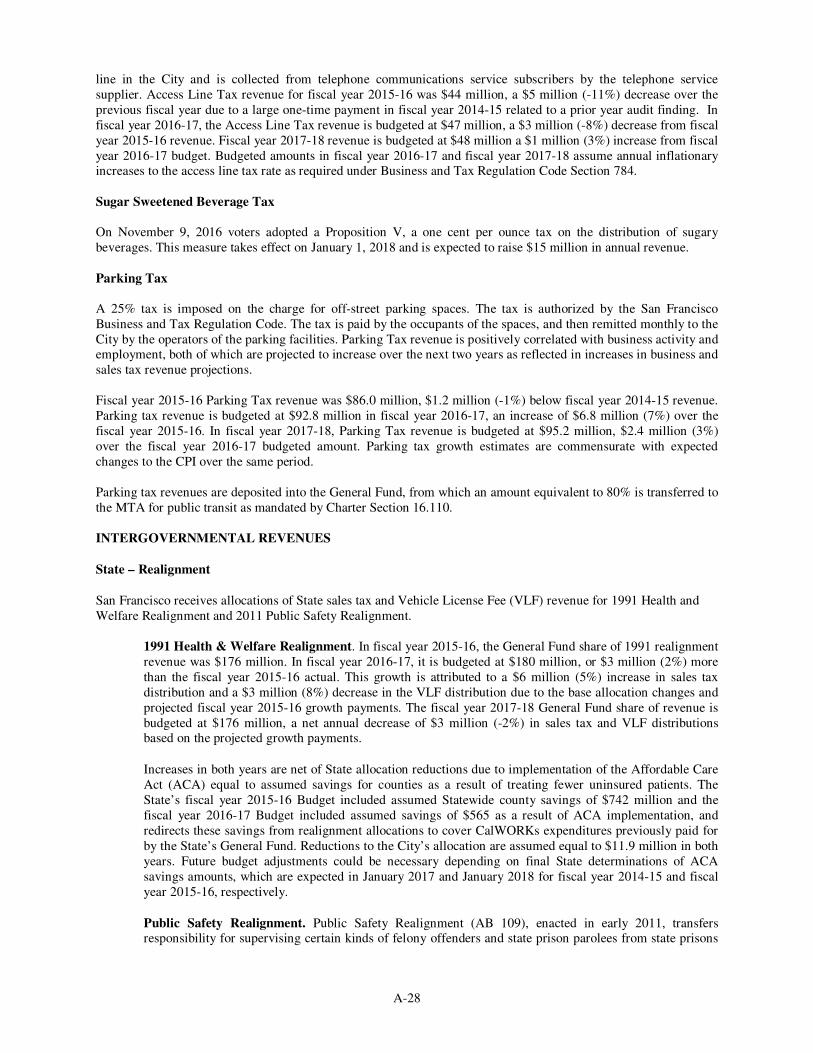
A-28
line in the City and is collected from telephone communications service subscribers by the telephone service supplier. Access Line Tax revenue for fiscal year 2015-16 was $44 million, a $5 million (-11%) decrease over the previous fiscal year due to a large one-time payment in fiscal year 2014-15 related to a prior year audit finding. In fiscal year 2016-17, the Access Line Tax revenue is budgeted at $47 million, a $3 million (-8%) decrease from fiscal year 2015-16 revenue. Fiscal year 2017-18 revenue is budgeted at $48 million a $1 million (3%) increase from fiscal year 2016-17 budget. Budgeted amounts in fiscal year 2016-17 and fiscal year 2017-18 assume annual inflationary increases to the access line tax rate as required under Business and Tax Regulation Code Section 784. Sugar Sweetened Beverage Tax On November 9, 2016 voters adopted a Proposition V, a one cent per ounce tax on the distribution of sugary beverages. This measure takes effect on January 1, 2018 and is expected to raise $15 million in annual revenue. Parking Tax A 25% tax is imposed on the charge for off-street parking spaces. The tax is authorized by the San Francisco Business and Tax Regulation Code. The tax is paid by the occupants of the spaces, and then remitted monthly to the City by the operators of the parking facilities. Parking Tax revenue is positively correlated with business activity and employment, both of which are projected to increase over the next two years as reflected in increases in business and sales tax revenue projections. Fiscal year 2015-16 Parking Tax revenue was $86.0 million, $1.2 million (-1%) below fiscal year 2014-15 revenue. Parking tax revenue is budgeted at $92.8 million in fiscal year 2016-17, an increase of $6.8 million (7%) over the fiscal year 2015-16. In fiscal year 2017-18, Parking Tax revenue is budgeted at $95.2 million, $2.4 million (3%) over the fiscal year 2016-17 budgeted amount. Parking tax growth estimates are commensurate with expected changes to the CPI over the same period. Parking tax revenues are deposited into the General Fund, from which an amount equivalent to 80% is transferred to the MTA for public transit as mandated by Charter Section 16.110. INTERGOVERNMENTAL REVENUES
State – Realignment
San Francisco receives allocations of State sales tax and Vehicle License Fee (VLF) revenue for 1991 Health and Welfare Realignment and 2011 Public Safety Realignment.
1991 Health & Welfare Realignment. In fiscal year 2015-16, the General Fund share of 1991 realignment revenue was $176 million. In fiscal year 2016-17, it is budgeted at $180 million, or $3 million (2%) more than the fiscal year 2015-16 actual. This growth is attributed to a $6 million (5%) increase in sales tax distribution and a $3 million (8%) decrease in the VLF distribution due to the base allocation changes and projected fiscal year 2015-16 growth payments. The fiscal year 2017-18 General Fund share of revenue is budgeted at $176 million, a net annual decrease of $3 million (-2%) in sales tax and VLF distributions based on the projected growth payments.
Increases in both years are net of State allocation reductions due to implementation of the Affordable Care Act (ACA) equal to assumed savings for counties as a result of treating fewer uninsured patients. The State’s fiscal year 2015-16 Budget included assumed Statewide county savings of $742 million and the fiscal year 2016-17 Budget included assumed savings of $565 as a result of ACA implementation, and redirects these savings from realignment allocations to cover CalWORKs expenditures previously paid for by the State’s General Fund. Reductions to the City’s allocation are assumed equal to $11.9 million in both years. Future budget adjustments could be necessary depending on final State determinations of ACA savings amounts, which are expected in January 2017 and January 2018 for fiscal year 2014-15 and fiscal year 2015-16, respectively.
Public Safety Realignment. Public Safety Realignment (AB 109), enacted in early 2011, transfers responsibility for supervising certain kinds of felony offenders and state prison parolees from state prisons
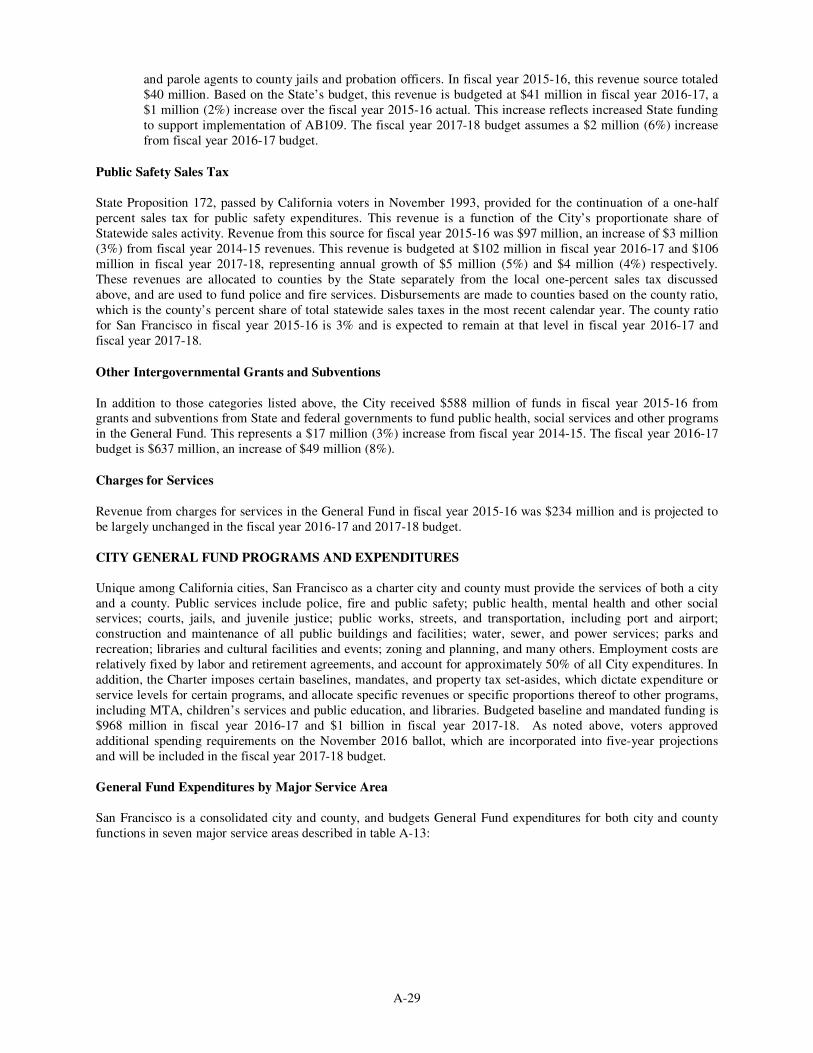
A-29
and parole agents to county jails and probation officers. In fiscal year 2015-16, this revenue source totaled $40 million. Based on the State’s budget, this revenue is budgeted at $41 million in fiscal year 2016-17, a $1 million (2%) increase over the fiscal year 2015-16 actual. This increase reflects increased State funding to support implementation of AB109. The fiscal year 2017-18 budget assumes a $2 million (6%) increase from fiscal year 2016-17 budget.
Public Safety Sales Tax
State Proposition 172, passed by California voters in November 1993, provided for the continuation of a one-half percent sales tax for public safety expenditures. This revenue is a function of the City’s proportionate share of Statewide sales activity. Revenue from this source for fiscal year 2015-16 was $97 million, an increase of $3 million (3%) from fiscal year 2014-15 revenues. This revenue is budgeted at $102 million in fiscal year 2016-17 and $106 million in fiscal year 2017-18, representing annual growth of $5 million (5%) and $4 million (4%) respectively. These revenues are allocated to counties by the State separately from the local one-percent sales tax discussed above, and are used to fund police and fire services. Disbursements are made to counties based on the county ratio, which is the county’s percent share of total statewide sales taxes in the most recent calendar year. The county ratio for San Francisco in fiscal year 2015-16 is 3% and is expected to remain at that level in fiscal year 2016-17 and fiscal year 2017-18.
Other Intergovernmental Grants and Subventions
In addition to those categories listed above, the City received $588 million of funds in fiscal year 2015-16 from grants and subventions from State and federal governments to fund public health, social services and other programs in the General Fund. This represents a $17 million (3%) increase from fiscal year 2014-15. The fiscal year 2016-17 budget is $637 million, an increase of $49 million (8%).
Charges for Services
Revenue from charges for services in the General Fund in fiscal year 2015-16 was $234 million and is projected to be largely unchanged in the fiscal year 2016-17 and 2017-18 budget. CITY GENERAL FUND PROGRAMS AND EXPENDITURES Unique among California cities, San Francisco as a charter city and county must provide the services of both a city and a county. Public services include police, fire and public safety; public health, mental health and other social services; courts, jails, and juvenile justice; public works, streets, and transportation, including port and airport; construction and maintenance of all public buildings and facilities; water, sewer, and power services; parks and recreation; libraries and cultural facilities and events; zoning and planning, and many others. Employment costs are relatively fixed by labor and retirement agreements, and account for approximately 50% of all City expenditures. In addition, the Charter imposes certain baselines, mandates, and property tax set-asides, which dictate expenditure or service levels for certain programs, and allocate specific revenues or specific proportions thereof to other programs, including MTA, children’s services and public education, and libraries. Budgeted baseline and mandated funding is $968 million in fiscal year 2016-17 and $1 billion in fiscal year 2017-18. As noted above, voters approved additional spending requirements on the November 2016 ballot, which are incorporated into five-year projections and will be included in the fiscal year 2017-18 budget. General Fund Expenditures by Major Service Area
San Francisco is a consolidated city and county, and budgets General Fund expenditures for both city and county functions in seven major service areas described in table A-13:
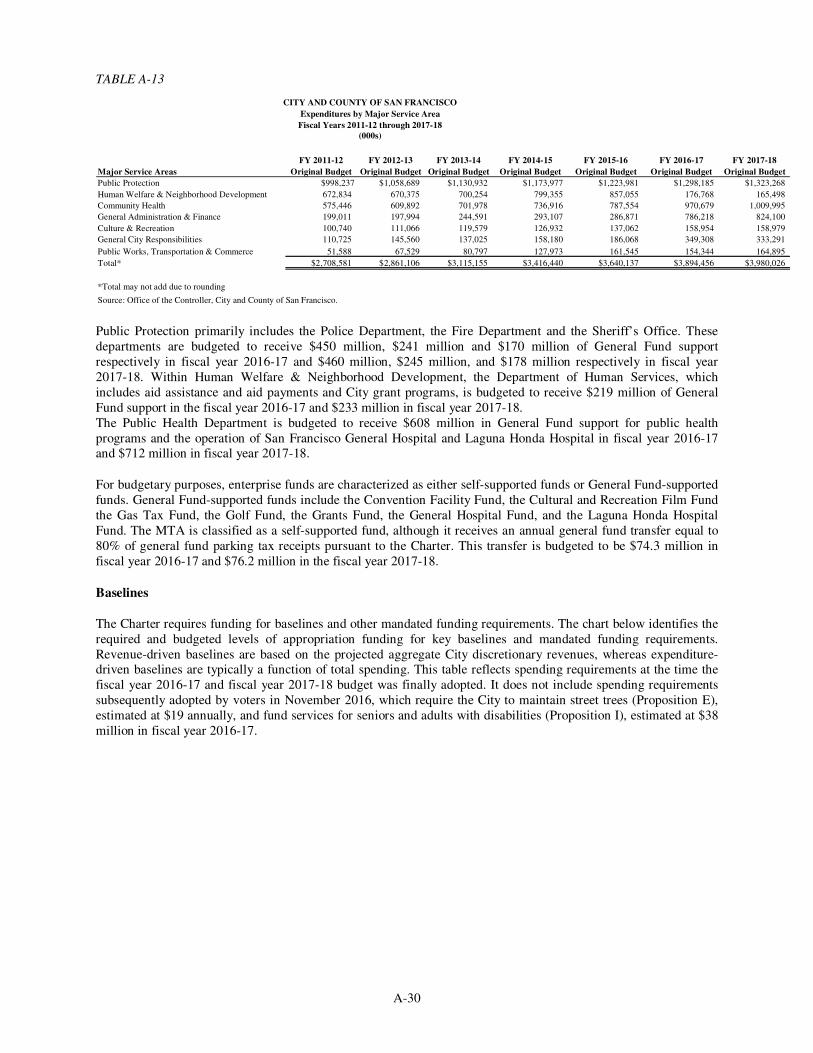
A-30
TABLE A-13
FY 2011-12 FY 2012-13 FY 2013-14 FY 2014-15 FY 2015-16 FY 2016-17 FY 2017-18
Major Service Areas Original Budget Original Budget Original Budget Original Budget Original Budget Original Budget Original Budget
Public Protection $998,237 $1,058,689 $1,130,932 $1,173,977 $1,223,981 $1,298,185 $1,323,268
Human Welfare & Neighborhood Development 672,834 670,375 700,254 799,355 857,055 176,768 165,498
Community Health 575,446 609,892 701,978 736,916 787,554 970,679 1,009,995
General Administration & Finance 199,011 197,994 244,591 293,107 286,871 786,218 824,100
Culture & Recreation 100,740 111,066 119,579 126,932 137,062 158,954 158,979
General City Responsibilities 110,725 145,560 137,025 158,180 186,068 349,308 333,291
Public Works, Transportation & Commerce 51,588 67,529 80,797 127,973 161,545 154,344 164,895
Total* $2,708,581 $2,861,106 $3,115,155 $3,416,440 $3,640,137 $3,894,456 $3,980,026
*Total may not add due to rounding
Source: Office of the Controller, City and County of San Francisco.
CITY AND COUNTY OF SAN FRANCISCO
Expenditures by Major Service Area
Fiscal Years 2011-12 through 2017-18(000s)
Public Protection primarily includes the Police Department, the Fire Department and the Sheriff’s Office. These departments are budgeted to receive $450 million, $241 million and $170 million of General Fund support respectively in fiscal year 2016-17 and $460 million, $245 million, and $178 million respectively in fiscal year 2017-18. Within Human Welfare & Neighborhood Development, the Department of Human Services, which includes aid assistance and aid payments and City grant programs, is budgeted to receive $219 million of General Fund support in the fiscal year 2016-17 and $233 million in fiscal year 2017-18. The Public Health Department is budgeted to receive $608 million in General Fund support for public health programs and the operation of San Francisco General Hospital and Laguna Honda Hospital in fiscal year 2016-17 and $712 million in fiscal year 2017-18.
For budgetary purposes, enterprise funds are characterized as either self-supported funds or General Fund-supported funds. General Fund-supported funds include the Convention Facility Fund, the Cultural and Recreation Film Fund the Gas Tax Fund, the Golf Fund, the Grants Fund, the General Hospital Fund, and the Laguna Honda Hospital Fund. The MTA is classified as a self-supported fund, although it receives an annual general fund transfer equal to 80% of general fund parking tax receipts pursuant to the Charter. This transfer is budgeted to be $74.3 million in fiscal year 2016-17 and $76.2 million in the fiscal year 2017-18.
Baselines
The Charter requires funding for baselines and other mandated funding requirements. The chart below identifies the required and budgeted levels of appropriation funding for key baselines and mandated funding requirements. Revenue-driven baselines are based on the projected aggregate City discretionary revenues, whereas expenditure-driven baselines are typically a function of total spending. This table reflects spending requirements at the time the fiscal year 2016-17 and fiscal year 2017-18 budget was finally adopted. It does not include spending requirements subsequently adopted by voters in November 2016, which require the City to maintain street trees (Proposition E), estimated at $19 annually, and fund services for seniors and adults with disabilities (Proposition I), estimated at $38 million in fiscal year 2016-17.
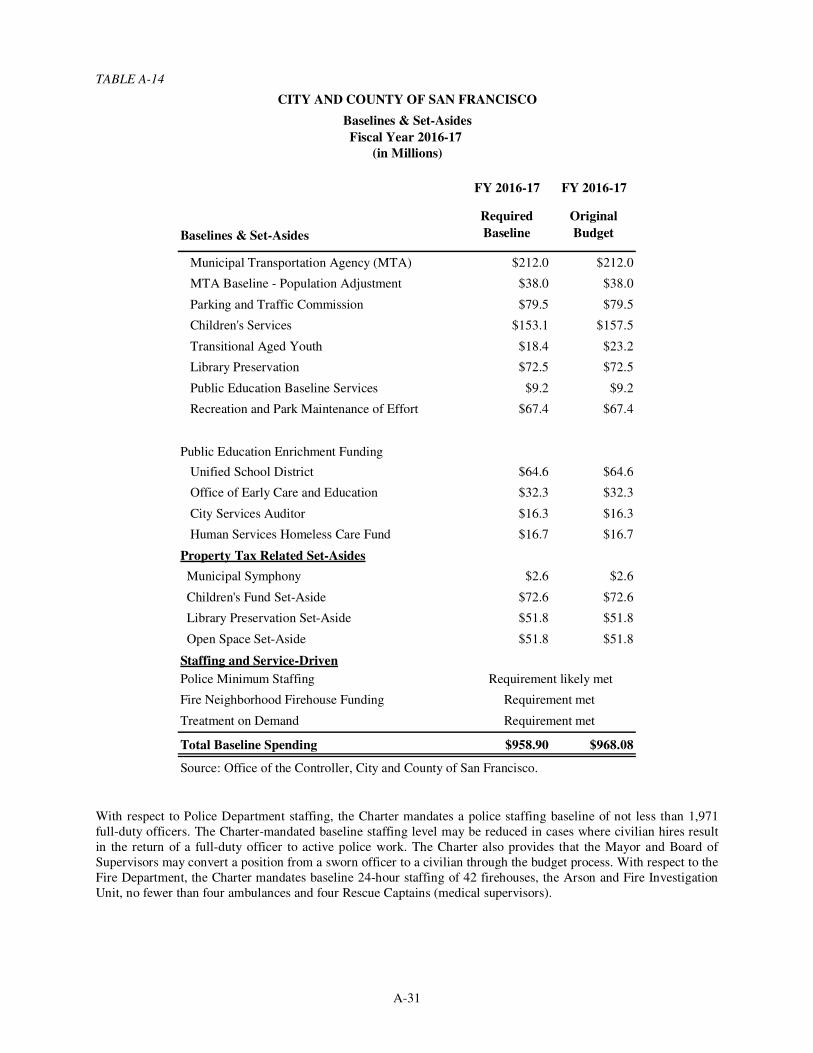
A-31
TABLE A-14
FY 2016-17 FY 2016-17
Baselines & Set-Asides
Municipal Transportation Agency (MTA) $212.0 $212.0
MTA Baseline - Population Adjustment $38.0 $38.0
Parking and Traffic Commission $79.5 $79.5
Children's Services $153.1 $157.5
Transitional Aged Youth $18.4 $23.2
Library Preservation $72.5 $72.5
Public Education Baseline Services $9.2 $9.2
Recreation and Park Maintenance of Effort $67.4 $67.4
Public Education Enrichment Funding
Unified School District $64.6 $64.6
Office of Early Care and Education $32.3 $32.3
City Services Auditor $16.3 $16.3
Human Services Homeless Care Fund $16.7 $16.7
Property Tax Related Set-Asides
Municipal Symphony $2.6 $2.6
Children's Fund Set-Aside $72.6 $72.6
Library Preservation Set-Aside $51.8 $51.8
Open Space Set-Aside $51.8 $51.8
Staffing and Service-Driven
Police Minimum Staffing
Fire Neighborhood Firehouse Funding
Treatment on Demand
Total Baseline Spending $958.90 $968.08
Source: Office of the Controller, City and County of San Francisco.
Requirement met
Requirement met
Requirement likely met
CITY AND COUNTY OF SAN FRANCISCO
Baselines & Set-Asides
Fiscal Year 2016-17
(in Millions)
Required
Baseline
Original
Budget
With respect to Police Department staffing, the Charter mandates a police staffing baseline of not less than 1,971 full-duty officers. The Charter-mandated baseline staffing level may be reduced in cases where civilian hires result in the return of a full-duty officer to active police work. The Charter also provides that the Mayor and Board of Supervisors may convert a position from a sworn officer to a civilian through the budget process. With respect to the Fire Department, the Charter mandates baseline 24-hour staffing of 42 firehouses, the Arson and Fire Investigation Unit, no fewer than four ambulances and four Rescue Captains (medical supervisors).
A-32
EMPLOYMENT COSTS; POST-RETIREMENT OBLIGATIONS
The cost of salaries and benefits for City employees represents approximately 50% of the City’s expenditures, totaling $4.7 billion in the fiscal year 2016-17 Original Budget (all-funds), and $4.9 billion in the fiscal year 2017-18 Original Budget. Looking only at the General Fund, the combined salary and benefits budget was $2.2 billion in the fiscal year 2016-17 Original Budget and $2.3 billion in the fiscal year 2017-18 Original Budget. This section discusses the organization of City workers into bargaining units, the status of employment contracts, and City expenditures on employee-related costs including salaries, wages, medical benefits, retirement benefits and the City’s retirement system, and post-retirement health and medical benefits. Employees of SFUSD, SFCCD and the San Francisco Superior Court are not City employees. Labor Relations
The City’s budget for fiscal years 2016-17 and 2017-18 includes 30,626 and 30,903 budgeted City positions, respectively. City workers are represented by 37 different labor unions. The largest unions in the City are the Service Employees International Union, Local 1021 (“SEIU”); the International Federation of Professional and Technical Engineers, Local 21(“IFPTE”); and the unions representing police, fire, deputy sheriffs and transit workers.
The wages, hours and working conditions of City employees are determined by collective bargaining pursuant to State law (the Meyers-Milias-Brown Act, California Government Code Sections 3500-3511) and the City Charter. San Francisco is unusual among California’s cities and counties in that nearly all of our employees, even managers, are represented by labor organizations. Further, the City Charter provides a unique impasse resolution procedure. In most cities and counties, when labor organizations cannot reach agreement on a new contract, there is no mandatory procedure to settle the impasse. However in San Francisco, nearly all of our contracts advance to interest arbitration in the event the parties cannot reach agreement. This process provides a mandatory ruling by an impartial third party arbitrator, who will set the terms of the new agreement. . Except for nurses and a few hundred unrepresented employees, the Charter requires that bargaining impasses be resolved through final and binding interest arbitration conducted by a panel of three arbitrators. The award of the arbitration panel is final and binding unless legally challenged. Wages, hours and working conditions of nurses are not subject to interest arbitration, but are subject to Charter-mandated economic limits. Strikes by City employees are prohibited by the Charter. Since 1976, no City employees have participated in a union-authorized strike.
The City’s employee selection procedures are established and maintained through a civil service system. In general, selection procedures and other merit system issues, with the exception of discipline, are not subject to arbitration. Disciplinary actions are generally subject to grievance arbitration, with the exception of police, fire and sheriff’s employees.
In May 2014, the City negotiated three-year agreements (for fiscal years 2014-15 through 2016-17) with most of its labor unions. In general, the parties agreed to: (1) annual wage increase schedules of 3% (October 11, 2014), 3.25% (October 10, 2015), and 3.25% (July 1, 2016); and (2) some structural reforms of the City’s healthcare benefit and cost-sharing structures to rebalance required premiums between the two main health plans offered by the City. These changes to health contributions build reforms agreed to by most unions during earlier negotiations.
In June 2013, the City negotiated a contract extension with the Police Officers’ Association (“POA”), through June 30, 2018, that includes wage increases of 1% on July 1, 2015; 2% on July 1, 2016; and 2% on July 1, 2017. In addition, the union agreed to lower entry rates of pay for new hires in entry Police Officer classifications. In May 2014, the City negotiated a contract extension with the Firefighters Association through June 30, 2018, which mirrored the terms of POA agreement.
Pursuant to Charter Section 8A.104, the MTA is responsible for negotiating contracts for the transit operators and employees in service-critical bargaining units. These contracts are subject to approval by the MTA Board. In May 2014, the MTA and the union representing the transit operators (TWU, Local 250-A) agreed to a three-year contract that runs through June 30, 2017. Provisions in the contract include 14.25% in wage increases in exchange for elimination of the 7.5% employer retirement pick-up.
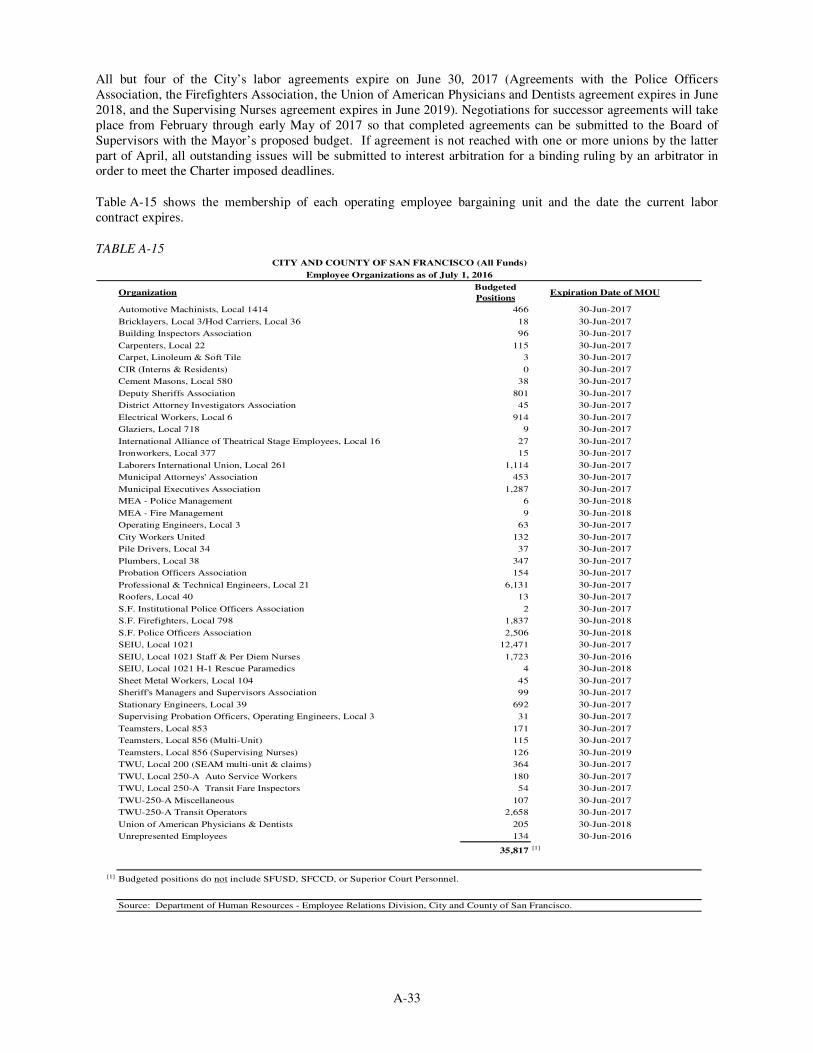
A-33
All but four of the City’s labor agreements expire on June 30, 2017 (Agreements with the Police Officers Association, the Firefighters Association, the Union of American Physicians and Dentists agreement expires in June 2018, and the Supervising Nurses agreement expires in June 2019). Negotiations for successor agreements will take place from February through early May of 2017 so that completed agreements can be submitted to the Board of Supervisors with the Mayor’s proposed budget. If agreement is not reached with one or more unions by the latter part of April, all outstanding issues will be submitted to interest arbitration for a binding ruling by an arbitrator in order to meet the Charter imposed deadlines.
Table A-15 shows the membership of each operating employee bargaining unit and the date the current labor contract expires.
TABLE A-15
OrganizationBudgeted
PositionsExpiration Date of MOU
Automotive Machinists, Local 1414 466 30-Jun-2017
Bricklayers, Local 3/Hod Carriers, Local 36 18 30-Jun-2017
Building Inspectors Association 96 30-Jun-2017
Carpenters, Local 22 115 30-Jun-2017
Carpet, Linoleum & Soft Tile 3 30-Jun-2017
CIR (Interns & Residents) 0 30-Jun-2017
Cement Masons, Local 580 38 30-Jun-2017
Deputy Sheriffs Association 801 30-Jun-2017
District Attorney Investigators Association 45 30-Jun-2017
Electrical Workers, Local 6 914 30-Jun-2017
Glaziers, Local 718 9 30-Jun-2017
International Alliance of Theatrical Stage Employees, Local 16 27 30-Jun-2017
Ironworkers, Local 377 15 30-Jun-2017
Laborers International Union, Local 261 1,114 30-Jun-2017
Municipal Attorneys' Association 453 30-Jun-2017
Municipal Executives Association 1,287 30-Jun-2017
MEA - Police Management 6 30-Jun-2018
MEA - Fire Management 9 30-Jun-2018
Operating Engineers, Local 3 63 30-Jun-2017
City Workers United 132 30-Jun-2017
Pile Drivers, Local 34 37 30-Jun-2017
Plumbers, Local 38 347 30-Jun-2017
Probation Officers Association 154 30-Jun-2017
Professional & Technical Engineers, Local 21 6,131 30-Jun-2017
Roofers, Local 40 13 30-Jun-2017
S.F. Institutional Police Officers Association 2 30-Jun-2017
S.F. Firefighters, Local 798 1,837 30-Jun-2018
S.F. Police Officers Association 2,506 30-Jun-2018
SEIU, Local 1021 12,471 30-Jun-2017
SEIU, Local 1021 Staff & Per Diem Nurses 1,723 30-Jun-2016
SEIU, Local 1021 H-1 Rescue Paramedics 4 30-Jun-2018
Sheet Metal Workers, Local 104 45 30-Jun-2017
Sheriff's Managers and Supervisors Association 99 30-Jun-2017
Stationary Engineers, Local 39 692 30-Jun-2017
Supervising Probation Officers, Operating Engineers, Local 3 31 30-Jun-2017
Teamsters, Local 853 171 30-Jun-2017
Teamsters, Local 856 (Multi-Unit) 115 30-Jun-2017
Teamsters, Local 856 (Supervising Nurses) 126 30-Jun-2019
TWU, Local 200 (SEAM multi-unit & claims) 364 30-Jun-2017
TWU, Local 250-A Auto Service Workers 180 30-Jun-2017
TWU, Local 250-A Transit Fare Inspectors 54 30-Jun-2017
TWU-250-A Miscellaneous 107 30-Jun-2017
TWU-250-A Transit Operators 2,658 30-Jun-2017
Union of American Physicians & Dentists 205 30-Jun-2018
Unrepresented Employees 134 30-Jun-2016
35,817 [1]
[1]
CITY AND COUNTY OF SAN FRANCISCO (All Funds)
Employee Organizations as of July 1, 2016
Budgeted positions do not include SFUSD, SFCCD, or Superior Court Personnel.
Source: Department of Human Resources - Employee Relations Division, City and County of San Francisco.
A-34
San Francisco City and County Employees’ Retirement System (“SFERS” or “Retirement System”)
History and Administration
SFERS is charged with administering a defined-benefit pension plan that covers substantially all City employees and certain other employees. The Retirement System was initially established by approval of City voters on November 2, 1920 and the State Legislature on January 12, 1921 and is currently codified in the City Charter. The Charter provisions governing the Retirement System may be revised only by a Charter amendment, which requires an affirmative public vote at a duly called election.
The Retirement System is administered by the Retirement Board consisting of seven members, three appointed by the Mayor, three elected from among the members of the Retirement System, at least two of whom must be actively employed, and a member of the Board of Supervisors appointed by the President of the Board of Supervisors.
The Retirement Board appoints an Executive Director and an Actuary to aid in the administration of the Retirement System. The Executive Director serves as chief executive officer, with responsibility extending to all divisions of the Retirement System. The Actuary’s responsibilities include advising the Retirement Board on actuarial matters and monitoring of actuarial service providers. The Retirement Board retains an independent consulting actuarial firm to prepare the annual valuation reports and other analyses. The independent consulting actuarial firm is currently Cheiron, Inc., a nationally recognized firm selected by the Retirement Board pursuant to a competitive process.
In 2014, the Retirement System filed an application with the Internal Revenue Service (“IRS”) for a Determination Letter. In July 2014, the IRS issued a favorable Determination Letter for SFERS. Issuance of a Determination Letter constitutes a finding by the IRS that operation of the defined benefit plan in accordance with the plan provisions and documents disclosed in the application qualifies the plan for federal tax exempt status. A tax qualified plan also provides tax advantages to the City and to members of the Retirement System. The favorable Determination Letter included IRS review of all SFERS provisions, including the provisions of Proposition C approved by the City voters in November 2011.
Membership
Retirement System members include eligible employees of the City and County of San Francisco, the SFUSD, the SFCCD, and the San Francisco Trial Courts.
The Retirement System estimates that the total active membership as of July 1, 2016 is 40,246, compared to 37,821 at the most recent valuation date of July 1, 2015. Active membership at July 1, 2016 includes 5,789 terminated vested members and 1,027 reciprocal members. Terminated vested members are former employees who have vested rights in future benefits from SFERS. Reciprocal members are individuals who have established membership in a reciprocal pension plan such as CalPERS and may be eligible to receive a reciprocal pension from the Retirement System in the future. Monthly retirement allowances are paid to approximately 28,304 retired members and beneficiaries. Benefit recipients include retired members, vested members receiving a vesting allowance, and qualified survivors.
Beginning July 1, 2008, the Retirement System had a Deferred Retirement Option Program (“DROP”) program for Police Plan members who were eligible and elected participation. The program “sunset” on June 30, 2011. A total of 354 eligible Police Plan members elected to participate in DROP during the three-year enrollment window. As of July 2016, there are no members active in DROP. Table A-16 displays total Retirement System participation (City and County of San Francisco, SFUSD, SFCCD, and San Francisco Trial Courts) as of the five most recent actuarial valuation dates, July 1, 2011 through July 1, 2015. The 2016 actuarial valuation will be completed in February of 2017.
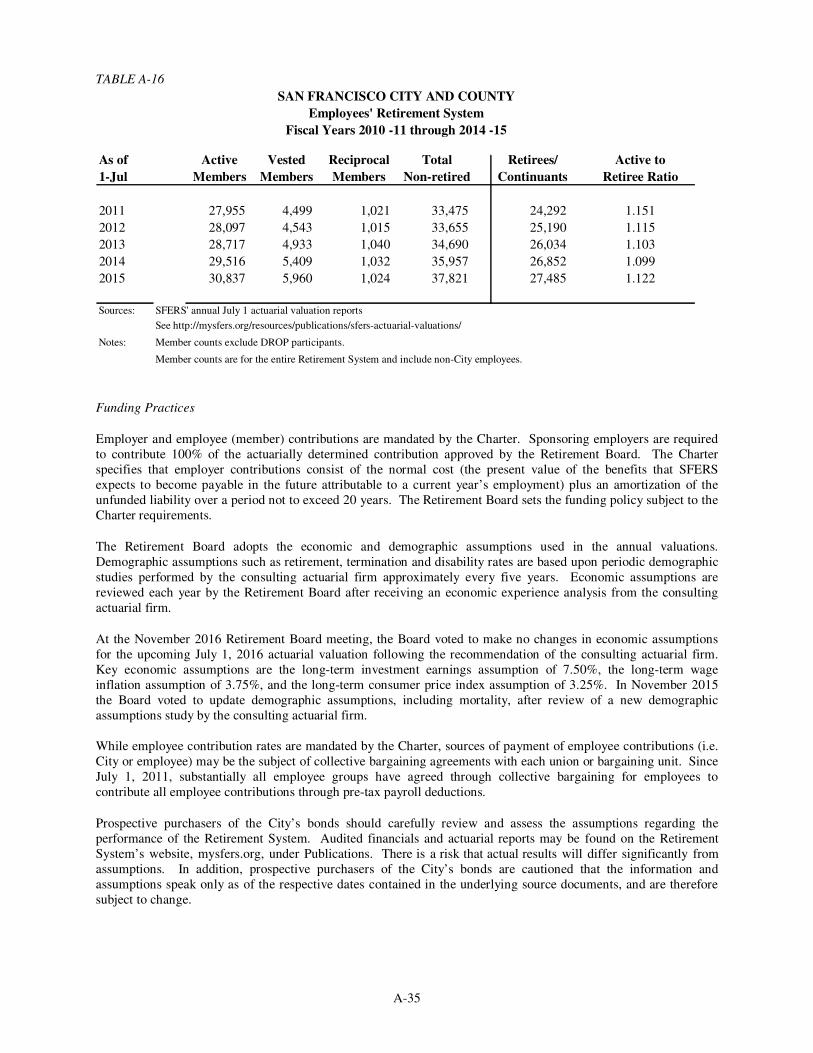
A-35
TABLE A-16
As of Active Vested Reciprocal Total Retirees/ Active to
1-Jul Members Members Members Non-retired Continuants Retiree Ratio
2011 27,955 4,499 1,021 33,475 24,292 1.151
2012 28,097 4,543 1,015 33,655 25,190 1.115
2013 28,717 4,933 1,040 34,690 26,034 1.103
2014 29,516 5,409 1,032 35,957 26,852 1.099
2015 30,837 5,960 1,024 37,821 27,485 1.122
Sources: SFERS' annual July 1 actuarial valuation reports
See http://mysfers.org/resources/publications/sfers-actuarial-valuations/
Notes: Member counts exclude DROP participants.
Member counts are for the entire Retirement System and include non-City employees.
SAN FRANCISCO CITY AND COUNTY
Employees' Retirement System
Fiscal Years 2010 -11 through 2014 -15
Funding Practices
Employer and employee (member) contributions are mandated by the Charter. Sponsoring employers are required to contribute 100% of the actuarially determined contribution approved by the Retirement Board. The Charter specifies that employer contributions consist of the normal cost (the present value of the benefits that SFERS expects to become payable in the future attributable to a current year’s employment) plus an amortization of the unfunded liability over a period not to exceed 20 years. The Retirement Board sets the funding policy subject to the Charter requirements.
The Retirement Board adopts the economic and demographic assumptions used in the annual valuations. Demographic assumptions such as retirement, termination and disability rates are based upon periodic demographic studies performed by the consulting actuarial firm approximately every five years. Economic assumptions are reviewed each year by the Retirement Board after receiving an economic experience analysis from the consulting actuarial firm.
At the November 2016 Retirement Board meeting, the Board voted to make no changes in economic assumptions for the upcoming July 1, 2016 actuarial valuation following the recommendation of the consulting actuarial firm. Key economic assumptions are the long-term investment earnings assumption of 7.50%, the long-term wage inflation assumption of 3.75%, and the long-term consumer price index assumption of 3.25%. In November 2015 the Board voted to update demographic assumptions, including mortality, after review of a new demographic assumptions study by the consulting actuarial firm.
While employee contribution rates are mandated by the Charter, sources of payment of employee contributions (i.e. City or employee) may be the subject of collective bargaining agreements with each union or bargaining unit. Since July 1, 2011, substantially all employee groups have agreed through collective bargaining for employees to contribute all employee contributions through pre-tax payroll deductions.
Prospective purchasers of the City’s bonds should carefully review and assess the assumptions regarding the performance of the Retirement System. Audited financials and actuarial reports may be found on the Retirement System’s website, mysfers.org, under Publications. There is a risk that actual results will differ significantly from assumptions. In addition, prospective purchasers of the City’s bonds are cautioned that the information and assumptions speak only as of the respective dates contained in the underlying source documents, and are therefore subject to change.
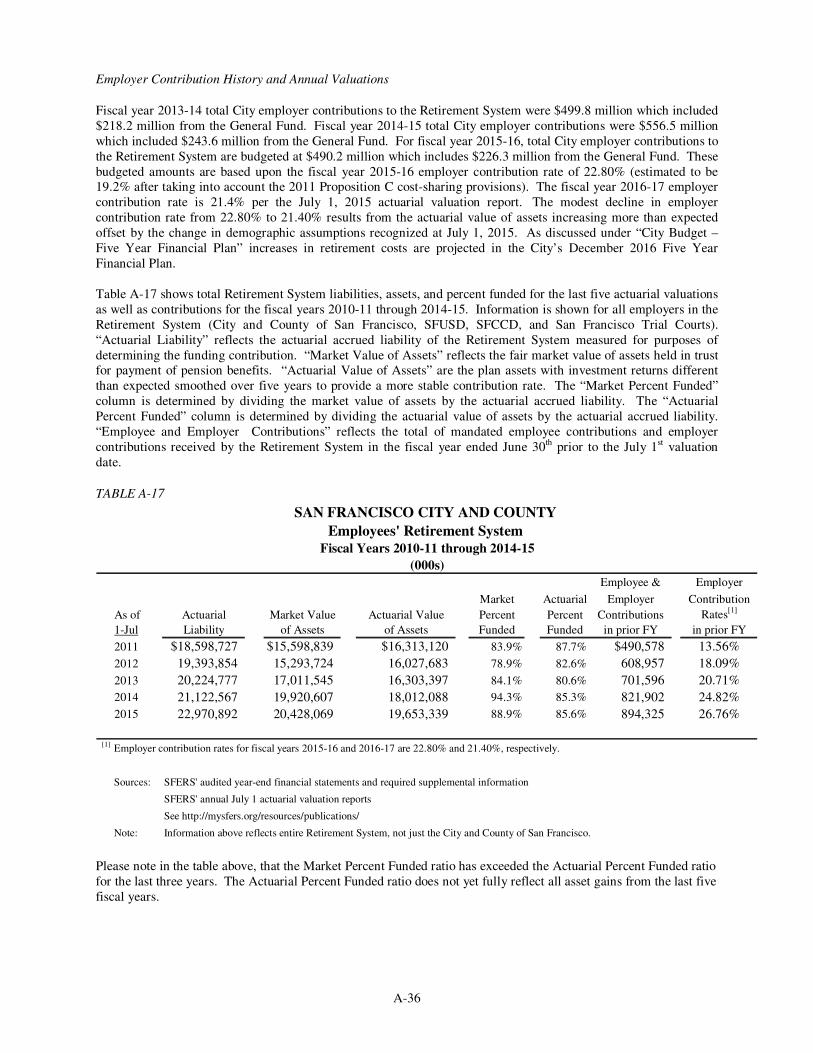
A-36
Employer Contribution History and Annual Valuations
Fiscal year 2013-14 total City employer contributions to the Retirement System were $499.8 million which included $218.2 million from the General Fund. Fiscal year 2014-15 total City employer contributions were $556.5 million which included $243.6 million from the General Fund. For fiscal year 2015-16, total City employer contributions to the Retirement System are budgeted at $490.2 million which includes $226.3 million from the General Fund. These budgeted amounts are based upon the fiscal year 2015-16 employer contribution rate of 22.80% (estimated to be 19.2% after taking into account the 2011 Proposition C cost-sharing provisions). The fiscal year 2016-17 employer contribution rate is 21.4% per the July 1, 2015 actuarial valuation report. The modest decline in employer contribution rate from 22.80% to 21.40% results from the actuarial value of assets increasing more than expected offset by the change in demographic assumptions recognized at July 1, 2015. As discussed under “City Budget – Five Year Financial Plan” increases in retirement costs are projected in the City’s December 2016 Five Year Financial Plan. Table A-17 shows total Retirement System liabilities, assets, and percent funded for the last five actuarial valuations as well as contributions for the fiscal years 2010-11 through 2014-15. Information is shown for all employers in the Retirement System (City and County of San Francisco, SFUSD, SFCCD, and San Francisco Trial Courts). “Actuarial Liability” reflects the actuarial accrued liability of the Retirement System measured for purposes of determining the funding contribution. “Market Value of Assets” reflects the fair market value of assets held in trust for payment of pension benefits. “Actuarial Value of Assets” are the plan assets with investment returns different than expected smoothed over five years to provide a more stable contribution rate. The “Market Percent Funded” column is determined by dividing the market value of assets by the actuarial accrued liability. The “Actuarial Percent Funded” column is determined by dividing the actuarial value of assets by the actuarial accrued liability. “Employee and Employer Contributions” reflects the total of mandated employee contributions and employer contributions received by the Retirement System in the fiscal year ended June 30th prior to the July 1st valuation date.
TABLE A-17
Employee & Employer
Market Actuarial Employer Contribution
As of Actuarial Market Value Actuarial Value Percent Percent Contributions Rates[1]
1-Jul Liability of Assets of Assets Funded Funded in prior FY in prior FY
2011 $18,598,727 $15,598,839 $16,313,120 83.9% 87.7% $490,578 13.56%
2012 19,393,854 15,293,724 16,027,683 78.9% 82.6% 608,957 18.09%
2013 20,224,777 17,011,545 16,303,397 84.1% 80.6% 701,596 20.71%
2014 21,122,567 19,920,607 18,012,088 94.3% 85.3% 821,902 24.82%
2015 22,970,892 20,428,069 19,653,339 88.9% 85.6% 894,325 26.76%
[1]Employer contribution rates for fiscal years 2015-16 and 2016-17 are 22.80% and 21.40%, respectively.
Sources: SFERS' audited year-end financial statements and required supplemental information
SFERS' annual July 1 actuarial valuation reports
See http://mysfers.org/resources/publications/
Note: Information above reflects entire Retirement System, not just the City and County of San Francisco.
Employees' Retirement System Fiscal Years 2010-11 through 2014-15
SAN FRANCISCO CITY AND COUNTY
(000s)
Please note in the table above, that the Market Percent Funded ratio has exceeded the Actuarial Percent Funded ratio for the last three years. The Actuarial Percent Funded ratio does not yet fully reflect all asset gains from the last five fiscal years.
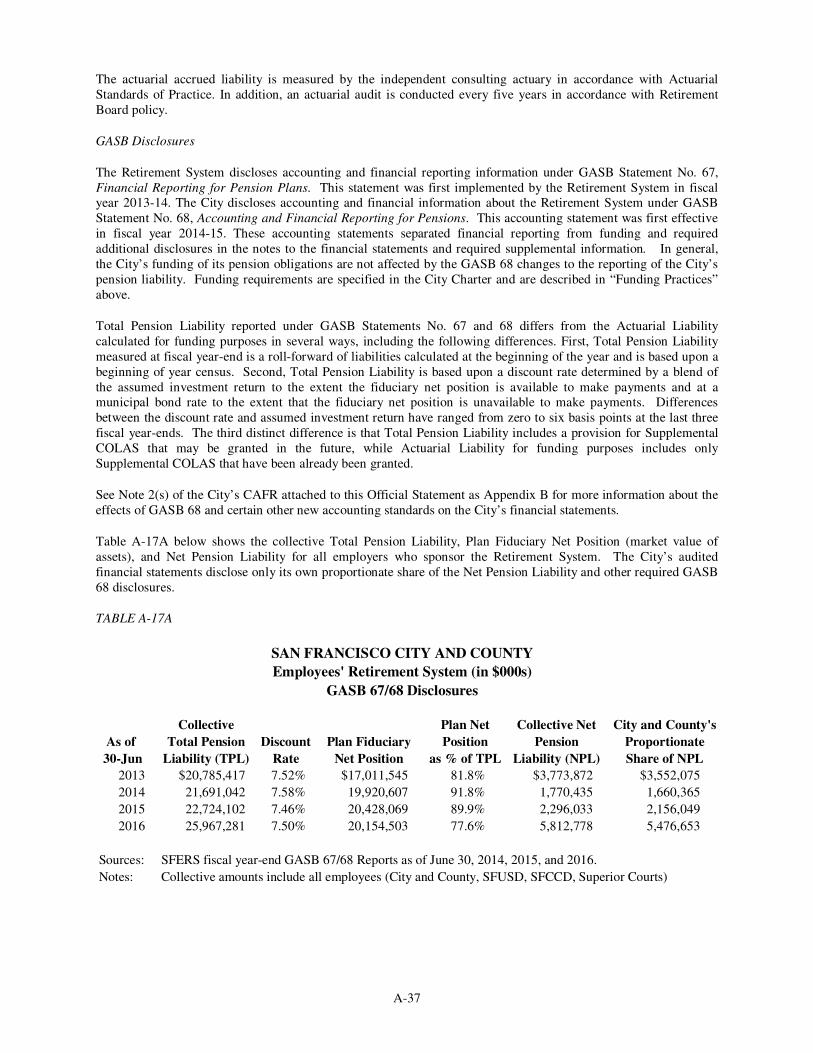
A-37
The actuarial accrued liability is measured by the independent consulting actuary in accordance with Actuarial Standards of Practice. In addition, an actuarial audit is conducted every five years in accordance with Retirement Board policy.
GASB Disclosures
The Retirement System discloses accounting and financial reporting information under GASB Statement No. 67, Financial Reporting for Pension Plans. This statement was first implemented by the Retirement System in fiscal year 2013-14. The City discloses accounting and financial information about the Retirement System under GASB Statement No. 68, Accounting and Financial Reporting for Pensions. This accounting statement was first effective in fiscal year 2014-15. These accounting statements separated financial reporting from funding and required additional disclosures in the notes to the financial statements and required supplemental information. In general, the City’s funding of its pension obligations are not affected by the GASB 68 changes to the reporting of the City’s pension liability. Funding requirements are specified in the City Charter and are described in “Funding Practices”
above.
Total Pension Liability reported under GASB Statements No. 67 and 68 differs from the Actuarial Liability calculated for funding purposes in several ways, including the following differences. First, Total Pension Liability measured at fiscal year-end is a roll-forward of liabilities calculated at the beginning of the year and is based upon a beginning of year census. Second, Total Pension Liability is based upon a discount rate determined by a blend of the assumed investment return to the extent the fiduciary net position is available to make payments and at a municipal bond rate to the extent that the fiduciary net position is unavailable to make payments. Differences between the discount rate and assumed investment return have ranged from zero to six basis points at the last three fiscal year-ends. The third distinct difference is that Total Pension Liability includes a provision for Supplemental COLAS that may be granted in the future, while Actuarial Liability for funding purposes includes only Supplemental COLAS that have been already been granted.
See Note 2(s) of the City’s CAFR attached to this Official Statement as Appendix B for more information about the effects of GASB 68 and certain other new accounting standards on the City’s financial statements.
Table A-17A below shows the collective Total Pension Liability, Plan Fiduciary Net Position (market value of assets), and Net Pension Liability for all employers who sponsor the Retirement System. The City’s audited financial statements disclose only its own proportionate share of the Net Pension Liability and other required GASB 68 disclosures.
TABLE A-17A
Collective Plan Net Collective Net City and County's
As of Total Pension Discount Plan Fiduciary Position Pension Proportionate
30-Jun Liability (TPL) Rate Net Position as % of TPL Liability (NPL) Share of NPL
2013 $20,785,417 7.52% $17,011,545 81.8% $3,773,872 $3,552,075
2014 21,691,042 7.58% 19,920,607 91.8% 1,770,435 1,660,365
2015 22,724,102 7.46% 20,428,069 89.9% 2,296,033 2,156,049
2016 25,967,281 7.50% 20,154,503 77.6% 5,812,778 5,476,653
Sources: SFERS fiscal year-end GASB 67/68 Reports as of June 30, 2014, 2015, and 2016.
Notes: Collective amounts include all employees (City and County, SFUSD, SFCCD, Superior Courts)
SAN FRANCISCO CITY AND COUNTY
Employees' Retirement System (in $000s)
GASB 67/68 Disclosures
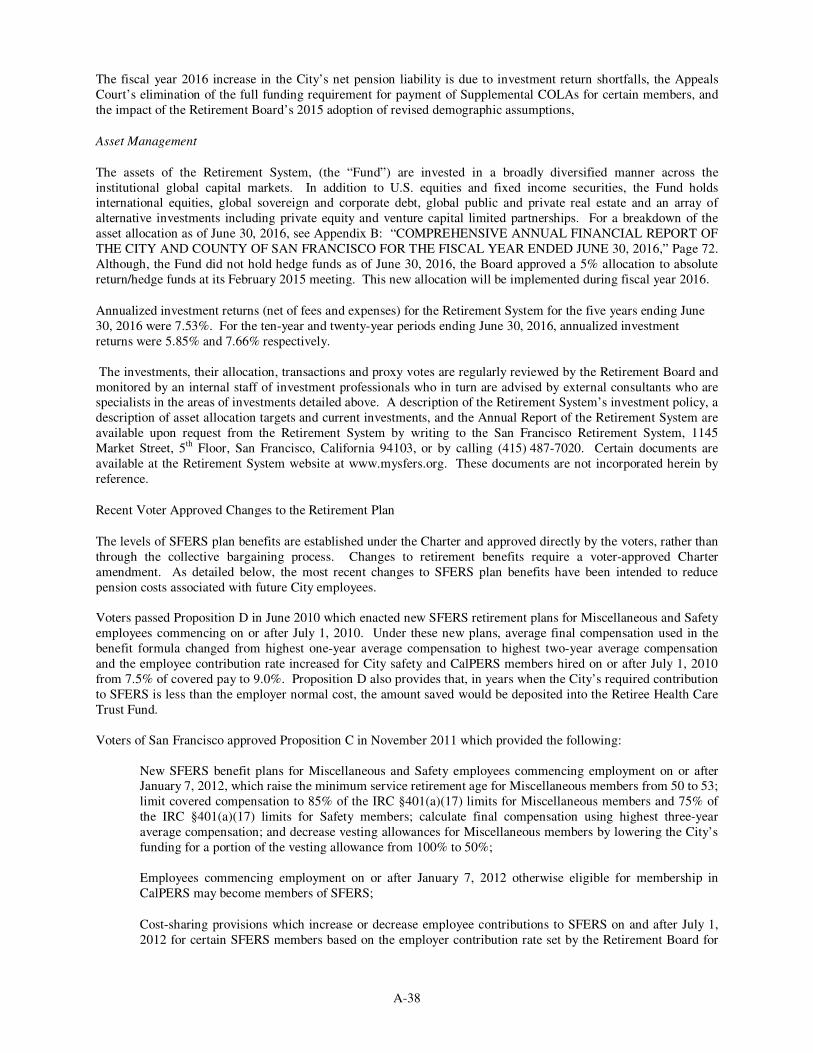
A-38
The fiscal year 2016 increase in the City’s net pension liability is due to investment return shortfalls, the Appeals Court’s elimination of the full funding requirement for payment of Supplemental COLAs for certain members, and the impact of the Retirement Board’s 2015 adoption of revised demographic assumptions,
Asset Management
The assets of the Retirement System, (the “Fund”) are invested in a broadly diversified manner across the institutional global capital markets. In addition to U.S. equities and fixed income securities, the Fund holds international equities, global sovereign and corporate debt, global public and private real estate and an array of alternative investments including private equity and venture capital limited partnerships. For a breakdown of the asset allocation as of June 30, 2016, see Appendix B: “COMPREHENSIVE ANNUAL FINANCIAL REPORT OF THE CITY AND COUNTY OF SAN FRANCISCO FOR THE FISCAL YEAR ENDED JUNE 30, 2016,” Page 72. Although, the Fund did not hold hedge funds as of June 30, 2016, the Board approved a 5% allocation to absolute return/hedge funds at its February 2015 meeting. This new allocation will be implemented during fiscal year 2016.
Annualized investment returns (net of fees and expenses) for the Retirement System for the five years ending June 30, 2016 were 7.53%. For the ten-year and twenty-year periods ending June 30, 2016, annualized investment returns were 5.85% and 7.66% respectively. The investments, their allocation, transactions and proxy votes are regularly reviewed by the Retirement Board and monitored by an internal staff of investment professionals who in turn are advised by external consultants who are specialists in the areas of investments detailed above. A description of the Retirement System’s investment policy, a description of asset allocation targets and current investments, and the Annual Report of the Retirement System are available upon request from the Retirement System by writing to the San Francisco Retirement System, 1145 Market Street, 5th Floor, San Francisco, California 94103, or by calling (415) 487-7020. Certain documents are available at the Retirement System website at www.mysfers.org. These documents are not incorporated herein by reference.
Recent Voter Approved Changes to the Retirement Plan
The levels of SFERS plan benefits are established under the Charter and approved directly by the voters, rather than through the collective bargaining process. Changes to retirement benefits require a voter-approved Charter amendment. As detailed below, the most recent changes to SFERS plan benefits have been intended to reduce pension costs associated with future City employees. Voters passed Proposition D in June 2010 which enacted new SFERS retirement plans for Miscellaneous and Safety employees commencing on or after July 1, 2010. Under these new plans, average final compensation used in the benefit formula changed from highest one-year average compensation to highest two-year average compensation and the employee contribution rate increased for City safety and CalPERS members hired on or after July 1, 2010 from 7.5% of covered pay to 9.0%. Proposition D also provides that, in years when the City’s required contribution to SFERS is less than the employer normal cost, the amount saved would be deposited into the Retiree Health Care Trust Fund. Voters of San Francisco approved Proposition C in November 2011 which provided the following: New SFERS benefit plans for Miscellaneous and Safety employees commencing employment on or after
January 7, 2012, which raise the minimum service retirement age for Miscellaneous members from 50 to 53; limit covered compensation to 85% of the IRC §401(a)(17) limits for Miscellaneous members and 75% of the IRC §401(a)(17) limits for Safety members; calculate final compensation using highest three-year average compensation; and decrease vesting allowances for Miscellaneous members by lowering the City’s funding for a portion of the vesting allowance from 100% to 50%;
Employees commencing employment on or after January 7, 2012 otherwise eligible for membership in
CalPERS may become members of SFERS;
Cost-sharing provisions which increase or decrease employee contributions to SFERS on and after July 1, 2012 for certain SFERS members based on the employer contribution rate set by the Retirement Board for
A-39
that year. For example, Miscellaneous employees who earn between $50,000 and $100,000 per year pay a fluctuating contribution rate in the range of +4% to -4% of the Charter-mandated employee contribution rate, while Miscellaneous employees who earn $100,000 or more per year pay a fluctuating contribution rate in the range of +5% to -5% of the Charter-mandated employee contribution rate. Similar fluctuating employee contributions are also required from Safety employees; and
Effective July 1, 2012, no Supplemental COLA will be paid unless SFERS is fully funded on a market value of assets basis and, for employees hired on or after January 7, 2012, Supplemental COLA benefits will not be permanent adjustments to retirement benefits - in any year when a Supplemental COLA is not paid, all previously paid Supplemental COLAs will expire.
A retiree organization has brought a legal action against the requirement in Proposition C that SFERS be fully funded in order to pay the Supplemental COLA. In that case, Protect our Benefits (POB) v. City of San Francisco
(1st DCA Case No. A140095), the Court of Appeals held that changes to the Supplemental COLA adopted by the voters in November 2011 under Proposition C could not be applied to current City and County employees and those who retired after November 1996 when the Supplemental COLA provisions were originally adopted, but could be applied to SFERS members who retired before November 1996. This decision is now final and it is estimated that the actuarial liabilities of the Plan will increase approximately $388 million or 1.8% for Supplemental COLAs granted retroactive to July 1, 2013 and July 1, 2014. On July 13, 2016, the SFERS Board adopted a Resolution to exempt members who retired before November 6, 1996, from the “fully funded” provision related to payment of Supplemental COLAs under Proposition C. The Resolution directed that retroactive payments for Supplemental COLAs be made to these retirees. After the Board adopted the Resolution, the Retirement System published an actuarial study on the cost to the Fund of payments to the pre-1996 retirees. The study reports that the two retroactive supplemental payments will trigger immediate payments of $34 million, create additional liability for continuing payments of $114 million, and cause a new unfunded liability of $148 million. This liability does not include the Supplemental COLA payments that may be triggered in the future. Under the cost sharing formulas in Proposition C, the City and its employees will pay for these costs in the form of higher yearly contribution rates. The Controller has projected the future cost to the City and its employees to be $260 million, with over $200 million to be paid in the next five fiscal years. The City has taken legal action to obtain an injunction to prevent SFERS from making Supplemental COLA payments to these members who retired before November 6, 1996 and seeking a judicial determination as to the authority of the Board in this matter. On October 5, 2016, the Superior Court of California granted the City’s motion for preliminary injunction, which enjoins SFERS from making such payments pending final court ruling on the matter. In August 2012, Governor Brown signed the Public Employee Pension Reform Act of 2012 (“PEPRA”). Current plan provisions of SFERS are not subject to PEPRA although future amendments may be subject to these reforms. Recent Changes in the Economic Environment and the Impact on the Retirement System
As of June 30, 2015, the audited market value of Retirement System assets was $20.4 billion. As of June 30, 2016, the as yet unaudited market value was $20.2 billion. These values represent, as of the date specified, the estimated value of the Retirement System’s portfolio if it were liquidated on that date. The Retirement System cannot be certain of the value of certain of its portfolio assets and, accordingly, the market value of the portfolio could be more or less. Moreover, appraisals for classes of assets that are not publicly traded are based on estimates which typically lag changes in actual market value by three to six months. Representations of market valuations are audited at each fiscal year end as part of the annual audit of the Retirement System’s financial statements. The Retirement System investment portfolio is structured for long-term performance. The Retirement System continually reviews investment and asset allocation policies as part of its regular operations and continues to rely on an investment policy which is consistent with the principles of diversification and the search for long-term value. Market fluctuations are an expected investment risk for any long-term strategy. Significant market fluctuations are expected to have significant impact on the value of the Retirement System investment portfolio.
A decline in the value of SFERS Trust assets over time, without a commensurate decline in the pension liabilities, will result in an increase in the contribution rate for the City. No assurance can be provided by the City that
A-40
contribution rates will not increase in the future, and that the impact of such increases will not have a material impact on City finances.
Other Employee Retirement Benefits
As noted above, various City employees are members of CalPERS, an agent multiple-employer public employee
defined benefit plan for safety members and a cost-sharing multiple-employer plan for miscellaneous members. The
City makes certain payments to CalPERS in respect of such members, at rates determined by the CalPERS board.
Such payment from the General Fund equaled $19.2 million in fiscal year 2012-13 and $20.0 million in fiscal year
2013-14. For fiscal year 2014-15, the City prepaid its annual CalPERS obligation at a level of $25.2 million.
Further discussion of the City’s CalPERS plan obligations are summarized in Note 9 to the City’s CAFR, as of
June 30, 2016, attached to this Official Statement as Appendix B. A discussion of other post-employment benefits,
including retiree medical benefits, is provided below under “Medical Benefits – Post-Employment Health Care
Benefits and GASB 45.”
Medical Benefits
Administration through Health Service System; Audited System Financial Statements
Medical benefits for eligible active City employees and eligible dependents, for retired City employees and eligible dependents, and for surviving spouses and domestic partners of covered City employees (the “City Beneficiaries”) are administered by the City’s Health Service System (the “Health Service System” or “HSS”) pursuant to City Charter Sections 12.200 et seq. and A8.420 et seq. Pursuant to such Charter Sections, the Health Service System also administers medical benefits to active and retired employees of SFUSD, SFCCD, and the San Francisco Superior Court (collectively the “System’s Other Beneficiaries”). However, the City is not required to fund medical benefits for the System’s Other Beneficiaries and therefore this section focuses on the funding by the City of medical and dental benefits for City Beneficiaries. The Health Service System is overseen by the City’s Health Service Board (the “Health Service Board”). The seven member Health Service Board is composed of members including a seated member of the City’s Board of Supervisors, appointed by the Board President; an individual who regularly consults in the health care field, appointed by the Mayor; a doctor of medicine, appointed by the Mayor; a member nominated by the Controller and approved by the Health Service Board, and three members of the Health Service System, active or retired, elected from among their members. The plans (the “HSS Medical Plans”) for providing medical care to the City Beneficiaries and the System’s Other Beneficiaries (collectively, the “HSS Beneficiaries”) are determined annually by the Health Service Board and approved by the Board of Supervisors pursuant to Charter Section A8.422.
The Health Service System oversees a trust fund (the “Health Service Trust Fund”) established pursuant to Charter Sections 12.203 and A8.428 through which medical benefits for the HSS Beneficiaries are funded. The Health Service System issues annually a publicly available, independently audited financial report that includes financial statements for the Health Service Trust Fund. This report may be obtained on the HSS website or by writing to the San Francisco Health Service System, 1145 Market Street, Third Floor, San Francisco, California 94103, or by calling (415) 554-1727. Audited annual financial statements for several years are also posted on the HSS website. The information available on such website is not incorporated in this Official Statement by reference.
As presently structured under the City Charter, the Health Service Trust Fund is not a fund through which assets are accumulated to finance post-employment healthcare benefits (an “OPEB trust fund”). Thus, the Health Service Trust Fund is not currently affected by Governmental Accounting Standards Board (“GASB”) Statement Number 45, Financial Reporting for Postemployment Benefit Plans Other Than Pensions (“GASB 45”), which applies to OPEB trust funds.
Determination of Employer and Employee Contributions for Medical Benefits
According to the City Charter Section A8.428, the City’s contribution towards HSS Medical Plans for active employees and retirees is determined by the results of a survey annually of the amount of premium contributions provided by the 10 most populous counties in California (other than the City). The survey is commonly called the 10-County Average Survey and used to determine “the average contribution made by each such County toward the
A-41
providing of health care plans, exclusive of dental or optical care, for each employee of such County.” Under City Charter Section A8.428, the City is required to contribute to the Health Service Trust Fund an amount equal to such “average contribution” for each City Beneficiary.
In the Memoranda of Understandings negotiated through collective bargaining in June 2014, the Average was eliminated in the calculation of premiums for Active employees represented by most unions, and exchanged for a percentage based employee premium contribution. The long term impact of the premium contribution model is anticipated to be a reduction in the relative proportion of the projected increases in the City’s contributions for Healthcare, stabilization of the medical plan membership and maintenance of competition among plans. The contribution amounts are paid by the City into the Health Service Trust Fund. The Average is still used as a basis for calculating all retiree premiums. To the extent annual medical premiums exceed the contributions made by the City as required by the Charter and union agreements, such excess must be paid by HSS Beneficiaries or, if elected by the Health Service Board, from net assets also held in the Health Service Trust Fund. Medical benefits for City Beneficiaries who are retired or otherwise not employed by the City (e.g., surviving spouses and surviving domestic partners of City retirees) (“Nonemployee City Beneficiaries”) are funded through contributions from such Nonemployee City Beneficiaries and the City as determined pursuant to Charter Section A8.428. The Health Service System medical benefit eligibility requirements for Nonemployee City Beneficiaries are described below under “– Post-Employment Health Care Benefits and GASB 45.”
Contributions relating to Nonemployee City Beneficiaries are also based on the negotiated methodologies found in most of the union agreements and, when applicable, the City contribution of the “average contribution” corresponding to such Nonemployee City Beneficiaries as described in Charter Section A8.423 along with the following:
Monthly contributions from Nonemployee City Beneficiaries in amounts equal to the monthly contributions required from active employees excluding health coverage or subsidies for health coverage paid for active employees as a result of collective bargaining. However, such monthly contributions from Nonemployee City Beneficiaries covered under Medicare are reduced by an amount equal to the amount contributed monthly by such persons to Medicare.
In addition to the average contribution the City contributes additional amounts in respect of the Nonemployee City Beneficiaries sufficient to defray the difference in cost to the Health Service System in providing the same health coverage to Nonemployee City Beneficiaries as is provided for active employee City Beneficiaries, excluding health coverage or subsidies for health coverage paid for active employees as a result of collective bargaining.
After application of the calculations described above, the City contributes 50% of monthly contributions required for the first dependent.
Health Care Reform
On March 23, 2010, President Obama signed into law the Patient Protection and Affordable Care Act (Public Law 111-114), and on March 30, 2010 signed the Health Care and Education Reconciliation of 2010 (collectively, the “Health Care Reform Law” or the Affordable Care Act (ACA) or “Obamacare”). The ACA was intended to extend health insurance to over 32 million uninsured Americans by 2019, and includes other significant changes with respect to the obligation to carry health insurance by individuals and the provision of health care by private and public employers, such as the City.
The Health Care Reform Law was designed to be implemented in phases from 2010 to 2018. The provisions of the Health Care Reform Law include the expansion of Medicaid, subsidies for health insurance for certain individuals, mandates that require most Americans obtain health insurance, and incentives for employers with over 50 employees to provide health insurance for their employees or pay a fine. On June 28, 2012 the U.S. Supreme Court ruled to uphold the employer mandate, the individual mandate and the state Medicaid expansion requirements. Provisions of Health Care Reform already implemented by HSS include discontinued eligibility for non-prescription drugs reimbursement through flexible spending accounts (“FSAs”) in 2011, eliminated copayments for wellness visits, eliminated life-time caps on coverage, and expanded eligibility to cover member dependent children up to age 26 in 2011, eliminated copayments for women’s preventative health including contraception in 2012, W-2 reporting on total healthcare premium costs, implementation of a medical loss ratio rebate on self-insured plans, issuance of a
A-42
separate summary of benefits to every member and provided to every new member and providing information on State Exchanges to both employees currently on COBRA and future COBRA recipients and as of 2015 and 2016, and beyond, healthcare FSAs are limited to $2,600 annually. The change to the definition of a full time employee was implemented in 2015. The City modified health benefit eligibility to employees who are employed, on average, at least 20 hours of service per week. The Automatic Enrollment requirement in the Health Care Reform was deferred indefinitely. This requires that employers automatically enroll new full-time employees in one of the employer’s health benefit plans (subject to any waiting period authorized by law). Further it is required than employees be given adequate notice and the opportunity to opt out of any coverage in which they were automatically enrolled. It is uncertain when final guidance will be issued by the Department of Labor. As a result of the federal Health Care Reform Law there are two direct fees and one tax that have been factored into the calculation of medical premium rates and premium equivalents for the 2016 plan year. The three fees are the Federal Health Insurer Tax (“HIT”), Patient Centered Outcomes Research Institute (“PCORI”) fee, and the Transitional Reinsurance Fee. The total impact on the City in 2016 is $14.88 million. The Federal HIT tax is a fixed-dollar amount distributed across health insurance providers for fully insured plans. The 2016 plan year premiums for Kaiser Permanente and Blue Shield of California included the impact of the HIT tax. The impact on the City only in 2016 is $12.73 million.
Beginning in 2013, the Patient Center Outcomes Research Institute (“PCORI”) Fee was accessed at the rate of $2.00 per enrollee per year was assessed per year to all participants in the Self-Insured medical-only plan (approximately 8,600). The fee is charged directly to the Health Service System. In 2015 the rate was $2.17 and is approximately $2.26 in 2016. The 2016 impact of PCORI is $0.21 million, HSS pays this fee directly to the Internal Revenue Service (IRS) and the fee will increase with health care inflation until it sunsets in 2019.
The Transitional Reinsurance Fee decreases from $44/year fee on each Health Service System beneficiary for plan year 2015. The Transitional Reinsurance Fee will be $27.00 in 2016 and the impact on the City is $1.85 million. Beginning in 2016, employers are required to report coverage for employees to the IRS each January on complex electronic interface systems. The Health Service System spent over 2080 hours on system configuration and is compliant with this requirement. As part of overall “HealthCare reform 2.0” under President-elect Trump, it is likely that the age for Medicare eligibility will be increased. If this occurs, there will be an estimated 1,500 additional “early retirees” not subsidized by Medicare requiring coverage by HSS. The Republicans have also proposed a “voucher” system for Medicare. If this occurs it will require major changes to retiree health coverage. At this time it is too early to predict what changes will be made and it is very possible that changes will be passed but not implemented until January 2019, after the mid-term Congressional elections. Local Elections:
Proposition B (2008) Changing Qualification for Retiree Health and Pension Benefits and Establishing a Retiree
Health Care Trust Fund
On June 3, 2008, the San Francisco voters approved Proposition B, a charter amendment that changed the way the City and current and future employees share in funding SFERS pension and health benefits. With regard to health benefits, elected officials and employees hired on or before January 9, 2009, contribute up to 2% of pre-tax compensation toward their retiree health care and the City contributes up to 1%. The impact of Proposition B on standard retirements occurred in 2014.
Proposition C (2011) City Pension and Health Care Benefit
On November 8, 2011, the San Francisco voters approved Proposition C, a charter amendment that made additional changes to the way the City and current and future employees share in funding SFERS pension and health benefits.
A-43
The Proposition limits the 50% coverage for dependents to employees who left the workforces (without retiring) prior to 2001. The Health Service System is in compliance with Proposition C.
Employer Contributions for Health Service System Benefits
For fiscal year 2015-16, based on the most recent audited financial statements, the Health Service System received approximately $674.6 million from participating employers for Health Service System benefit costs. Of this total, the City contributed approximately $569.0 million; approximately $158.4 million of this $569.0 million amount was for health care benefits for approximately 23,453 retired City employees and their eligible dependents and approximately $410.6 million was for benefits for approximately 31,085 active City employees and their eligible dependents.
The 2016 aggregate plan costs for the City increased by 3.80%. This is due to a number of factors including aggressive contracting by HSS that maintains competition among our vendors, implementing Accountable Care Organizations that reduced utilization and increased use of generic prescription rates and changing our Blue Shield plan from a fully-funded to a flex-funded product. Flex-funding allows lower premiums to be set by our actuarial consultant, AON-Hewitt, without the typical margins added by Blue Shield; however, more risk is assumed by the City and reserves are required to protect against this risk. The flatten trend is anticipated to continue.
Post-Employment Health Care Benefits and GASB 45
Eligibility of former City employees for retiree health care benefits is governed by the Charter. In general, employees hired before January 10, 2009 and a spouse or dependent are potentially eligible for health benefits following retirement at age 50 and completion of five years of City service. Proposition B, passed by San Francisco voters on June 3, 2008, tightened post-retirement health benefit eligibility rules for employees hired on or after January 10, 2009, and generally requires payments by the City and these employees equal to 3% of salary into a new retiree health trust fund.
Proposition A, passed by San Francisco voters on November 5, 2013 restricted the City’s ability to withdraw funds from the retiree health trust fund. The restrictions allow payments from the fund only when two of the three following conditions are met:
The City’s account balance in any fiscal year is fully funded. The account is fully funded when it is large enough to pay then-projected retiree health care costs as they come due; and,
The City’s retiree health care costs exceed 10% of the City’s total payroll costs in a fiscal year. The
Controller, Mayor, Trust Board, and a majority of the Board of Supervisors must agree to allow payments from the Fund for that year. These payments can only cover retiree health care costs that exceed 10% of the City’s total payroll cost. The payments are limited to no more than 10% of the City’s account; or,
The Controller, Mayor, Trust Board, and two-thirds of the Board of Supervisors approve changes to these limits.
GASB 45 Reporting Requirements. The City was required to begin reporting the liability and related information for unfunded OPEBs in the City’s financial statements for the fiscal year ending June 30, 2008. This reporting requirement is defined under GASB 45. GASB 45 does not require that the affected government agencies, including the City, actually fund any portion of this post-retirement health benefit liability – rather, GASB 45 requires government agencies to determine on an actuarial basis the amount of its total OPEB liability and the annual contributions estimated to fund such liability over 30 years. Any underfunding in a year is recognized as a liability on the government agency’s balance sheet. City’s Estimated Liability. The City is required by GASB 45 to prepare a new actuarial study of its post-retirement benefits obligation every two years. As of July 1, 2014, the most recent actuarial valuation date, the funded status of retiree health care benefits was 1.1%. The actuarial accrued liability for benefits was $4.26 billion, and the actuarial value of assets was $49.0 million, resulting in an unfunded actuarial accrued liability (UAAL) of $4.21 billion. As of July 1, 2014, the estimated covered payroll (annual payroll of active employees covered by the plan) was $2.62
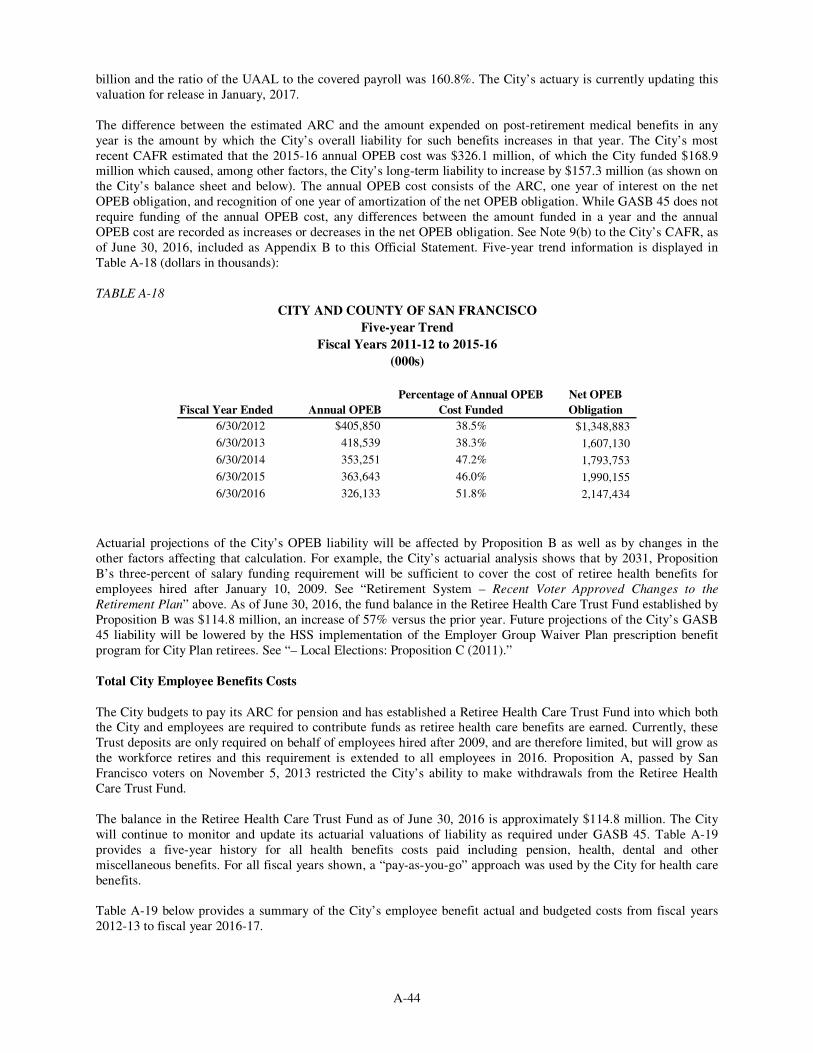
A-44
billion and the ratio of the UAAL to the covered payroll was 160.8%. The City’s actuary is currently updating this valuation for release in January, 2017. The difference between the estimated ARC and the amount expended on post-retirement medical benefits in any year is the amount by which the City’s overall liability for such benefits increases in that year. The City’s most recent CAFR estimated that the 2015-16 annual OPEB cost was $326.1 million, of which the City funded $168.9 million which caused, among other factors, the City’s long-term liability to increase by $157.3 million (as shown on the City’s balance sheet and below). The annual OPEB cost consists of the ARC, one year of interest on the net OPEB obligation, and recognition of one year of amortization of the net OPEB obligation. While GASB 45 does not require funding of the annual OPEB cost, any differences between the amount funded in a year and the annual OPEB cost are recorded as increases or decreases in the net OPEB obligation. See Note 9(b) to the City’s CAFR, as of June 30, 2016, included as Appendix B to this Official Statement. Five-year trend information is displayed in Table A-18 (dollars in thousands):
TABLE A-18
$1,348,883
1,607,130
1,793,753
1,990,155
2,147,434 6/30/2016 326,133 51.8%
CITY AND COUNTY OF SAN FRANCISCO
Five-year Trend
Fiscal Years 2011-12 to 2015-16
(000s)
Net OPEB
ObligationFiscal Year Ended Annual OPEB
Percentage of Annual OPEB
Cost Funded
6/30/2013 418,539 38.3%
6/30/2012 $405,850 38.5%
6/30/2014 353,251 47.2%
6/30/2015 363,643 46.0%
Actuarial projections of the City’s OPEB liability will be affected by Proposition B as well as by changes in the other factors affecting that calculation. For example, the City’s actuarial analysis shows that by 2031, Proposition B’s three-percent of salary funding requirement will be sufficient to cover the cost of retiree health benefits for employees hired after January 10, 2009. See “Retirement System – Recent Voter Approved Changes to the
Retirement Plan” above. As of June 30, 2016, the fund balance in the Retiree Health Care Trust Fund established by Proposition B was $114.8 million, an increase of 57% versus the prior year. Future projections of the City’s GASB 45 liability will be lowered by the HSS implementation of the Employer Group Waiver Plan prescription benefit program for City Plan retirees. See “– Local Elections: Proposition C (2011).”
Total City Employee Benefits Costs
The City budgets to pay its ARC for pension and has established a Retiree Health Care Trust Fund into which both the City and employees are required to contribute funds as retiree health care benefits are earned. Currently, these Trust deposits are only required on behalf of employees hired after 2009, and are therefore limited, but will grow as the workforce retires and this requirement is extended to all employees in 2016. Proposition A, passed by San Francisco voters on November 5, 2013 restricted the City’s ability to make withdrawals from the Retiree Health Care Trust Fund. The balance in the Retiree Health Care Trust Fund as of June 30, 2016 is approximately $114.8 million. The City will continue to monitor and update its actuarial valuations of liability as required under GASB 45. Table A-19 provides a five-year history for all health benefits costs paid including pension, health, dental and other miscellaneous benefits. For all fiscal years shown, a “pay-as-you-go” approach was used by the City for health care benefits. Table A-19 below provides a summary of the City’s employee benefit actual and budgeted costs from fiscal years 2012-13 to fiscal year 2016-17.
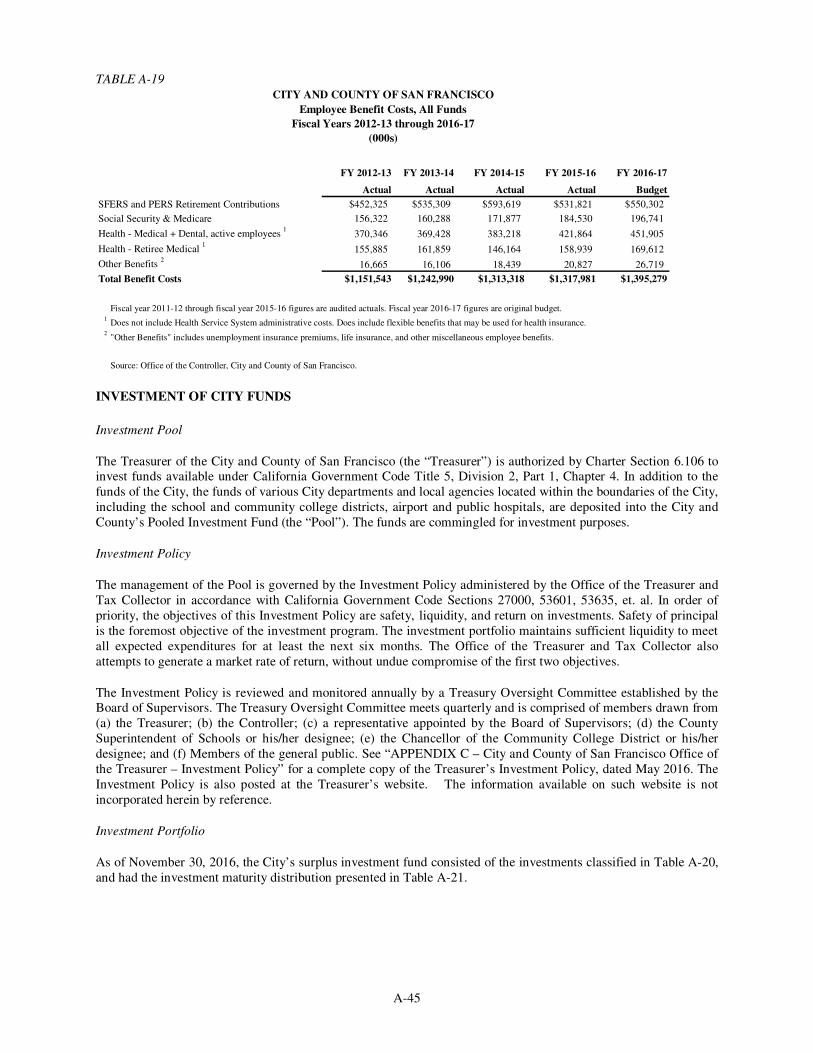
A-45
TABLE A-19
FY 2012-13 FY 2013-14 FY 2014-15 FY 2015-16 FY 2016-17
Actual Actual Actual Actual Budget
SFERS and PERS Retirement Contributions $452,325 $535,309 $593,619 $531,821 $550,302
Social Security & Medicare 156,322 160,288 171,877 184,530 196,741
Health - Medical + Dental, active employees 1
370,346 369,428 383,218 421,864 451,905
Health - Retiree Medical 1
155,885 161,859 146,164 158,939 169,612
Other Benefits 2
16,665 16,106 18,439 20,827 26,719
Total Benefit Costs $1,151,543 $1,242,990 $1,313,318 $1,317,981 $1,395,279
Fiscal year 2011-12 through fiscal year 2015-16 figures are audited actuals. Fiscal year 2016-17 figures are original budget.1
Does not include Health Service System administrative costs. Does include flexible benefits that may be used for health insurance.2
"Other Benefits" includes unemployment insurance premiums, life insurance, and other miscellaneous employee benefits.
Source: Office of the Controller, City and County of San Francisco.
CITY AND COUNTY OF SAN FRANCISCO
Employee Benefit Costs, All Funds
Fiscal Years 2012-13 through 2016-17
(000s)
INVESTMENT OF CITY FUNDS
Investment Pool
The Treasurer of the City and County of San Francisco (the “Treasurer”) is authorized by Charter Section 6.106 to invest funds available under California Government Code Title 5, Division 2, Part 1, Chapter 4. In addition to the funds of the City, the funds of various City departments and local agencies located within the boundaries of the City, including the school and community college districts, airport and public hospitals, are deposited into the City and County’s Pooled Investment Fund (the “Pool”). The funds are commingled for investment purposes.
Investment Policy
The management of the Pool is governed by the Investment Policy administered by the Office of the Treasurer and Tax Collector in accordance with California Government Code Sections 27000, 53601, 53635, et. al. In order of priority, the objectives of this Investment Policy are safety, liquidity, and return on investments. Safety of principal is the foremost objective of the investment program. The investment portfolio maintains sufficient liquidity to meet all expected expenditures for at least the next six months. The Office of the Treasurer and Tax Collector also attempts to generate a market rate of return, without undue compromise of the first two objectives.
The Investment Policy is reviewed and monitored annually by a Treasury Oversight Committee established by the Board of Supervisors. The Treasury Oversight Committee meets quarterly and is comprised of members drawn from (a) the Treasurer; (b) the Controller; (c) a representative appointed by the Board of Supervisors; (d) the County Superintendent of Schools or his/her designee; (e) the Chancellor of the Community College District or his/her designee; and (f) Members of the general public. See “APPENDIX C – City and County of San Francisco Office of the Treasurer – Investment Policy” for a complete copy of the Treasurer’s Investment Policy, dated May 2016. The Investment Policy is also posted at the Treasurer’s website. The information available on such website is not incorporated herein by reference.
Investment Portfolio
As of November 30, 2016, the City’s surplus investment fund consisted of the investments classified in Table A-20, and had the investment maturity distribution presented in Table A-21.
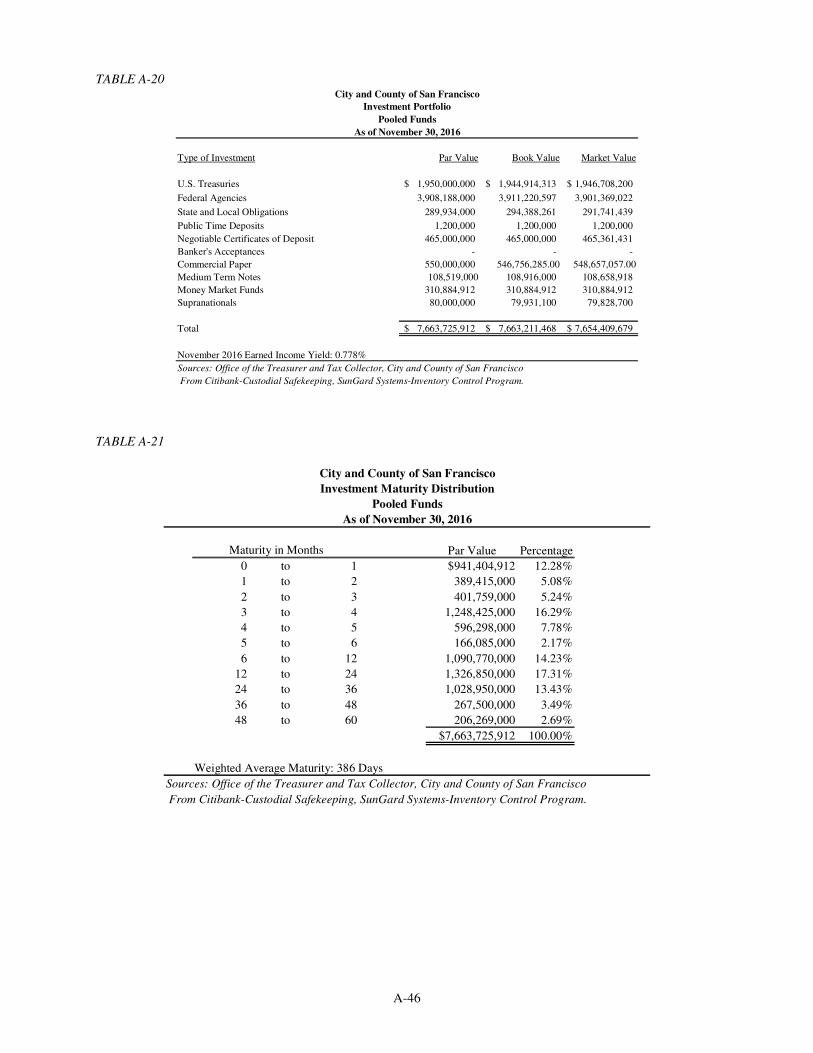
A-46
TABLE A-20 City and County of San Francisco
Investment Portfolio
Pooled Funds
As of November 30, 2016
Type of Investment Par Value Book Value Market Value
U.S. Treasuries 1,950,000,000$ 1,944,914,313$ 1,946,708,200$
Federal Agencies 3,908,188,000 3,911,220,597 3,901,369,022
State and Local Obligations 289,934,000 294,388,261 291,741,439
Public Time Deposits 1,200,000 1,200,000 1,200,000
Negotiable Certificates of Deposit 465,000,000 465,000,000 465,361,431
Banker's Acceptances - - -
Commercial Paper 550,000,000 546,756,285.00 548,657,057.00
Medium Term Notes 108,519,000 108,916,000 108,658,918
Money Market Funds 310,884,912 310,884,912 310,884,912
Supranationals 80,000,000 79,931,100 79,828,700
Total 7,663,725,912$ 7,663,211,468$ 7,654,409,679$
November 2016 Earned Income Yield: 0.778%
Sources: Office of the Treasurer and Tax Collector, City and County of San Francisco
From Citibank-Custodial Safekeeping, SunGard Systems-Inventory Control Program.
TABLE A-21
Par Value Percentage
0 to 1 $941,404,912 12.28%
1 to 2 389,415,000 5.08%
2 to 3 401,759,000 5.24%
3 to 4 1,248,425,000 16.29%
4 to 5 596,298,000 7.78%
5 to 6 166,085,000 2.17%
6 to 12 1,090,770,000 14.23%
12 to 24 1,326,850,000 17.31%
24 to 36 1,028,950,000 13.43%
36 to 48 267,500,000 3.49%
48 to 60 206,269,000 2.69%
$7,663,725,912 100.00%
Weighted Average Maturity: 386 Days
Sources: Office of the Treasurer and Tax Collector, City and County of San Francisco
From Citibank-Custodial Safekeeping, SunGard Systems-Inventory Control Program.
Maturity in Months
City and County of San Francisco
Investment Maturity Distribution
Pooled Funds
As of November 30, 2016
A-47
Further Information
A report detailing the investment portfolio and investment activity, including the market value of the portfolio, is submitted to the Mayor and the Board of Supervisors monthly. The monthly reports and annual reports are available on the Treasurer’s web page: www.sftreasurer.org. The monthly reports and annual reports are not incorporated by reference herein.
Additional information on the City’s investments, investment policies, and risk exposure as of June 30, 2016 are described in Appendix B: “COMPREHENSIVE ANNUAL FINANCIAL REPORT OF THE CITY AND COUNTY OF SAN FRANCISCO FOR THE FISCAL YEAR ENDED JUNE 30, 2016,” Notes 2(d) and 5.
CAPITAL FINANCING AND BONDS
Capital Plan
In October 2005, the Board of Supervisors adopted, and the Mayor approved, Ordinance No. 216-05, which established a new capital planning process for the City. The legislation requires that the City develop and adopt a ten-year capital expenditure plan for City-owned facilities and infrastructure. It also created the Capital Planning Committee (“CPC”) and the Capital Planning Program (“CPP”). The CPC, composed of other City finance and capital project officials, makes recommendations to the Mayor and Board of Supervisors on all of the City’s capital expenditures. To help inform CPC recommendations, the CPP staff, under the direction of the City Administrator, review and prioritize funding needs; project and coordinate funding sources and uses; and provide policy analysis and reports on interagency capital planning.
The City Administrator, in conjunction with the CPC, is directed to develop and submit a ten-year capital plan every other fiscal year for approval by the Board of Supervisors. The Capital Plan is a fiscally constrained long-term finance strategy that prioritizes projects based on a set of funding principles. It provides an assessment of the City’s infrastructure needs over ten years, highlights investments required to meet these needs and recommends a plan of finance to fund these investments. Although the Capital Plan provides cost estimates and proposes methods to finance such costs, the document does not reflect any commitment by the Board of Supervisors to expend such amounts or to adopt any specific financing method. The Capital Plan is required to be updated and adopted biennially, along with the City’s Five Year Financial Plan and the Five-Year Information & Communication Technology Plan. The CPC is also charged with reviewing the annual capital budget submission and all long-term financing proposals, and providing recommendations to the Board of Supervisors relating to the compliance of any such proposal or submission with the adopted Capital Plan.
The Capital Plan is required to be submitted to the Mayor and the Board of Supervisors by each March 1 in odd-numbered years and adopted by the Board of Supervisors and the Mayor on or before May 1 of the same year. The fiscal year 2016-2025 Capital Plan was approved by the CPC on March 2, 2015 and was adopted by the Board of Supervisors in April 2015. The Capital Plan contains $32 billion in capital investments over the coming decade for all City departments, including $5.1 billion in projects for General Fund-supported departments. The Capital Plan proposes $1.66 billion for General Fund pay-as-you-go capital projects over the next ten years. The amount for General Fund pay-as-you-go capital projects is assumed to grow to over $200 million per year by fiscal year 2025-26. Major capital projects for General Fund-supported departments included in the Capital Plan consist of upgrades to public health, police, fire and park facilities; street and right-of-way improvements; the removal of barriers to accessibility; park improvements; the replacement of the Hall of Justice; and seismic upgrades to the Veteran’s Memorial Building, among other capital projects. Approximately $1.8 billion of the capital projects of General Fund supported departments are expected to be financed with general obligation bonds and other long-term obligations. The balance is expected to be funded by federal and State funds, the General Fund, and other sources.
In addition to the City General Fund-supported capital spending, the Capital Plan recommends $18.2 billion in enterprise fund department projects to continue major transit, economic development and public utility projects such as the Central Subway project, runway and terminal upgrades at San Francisco International Airport, Pier 70 infrastructure investments, and the Sewer System Improvement Program, among others. Approximately $12.2 billion of enterprise fund department capital projects is financed with voter-approved revenue bonds and other long-term obligations. The balance is expected to be funded by federal and State funds, user/operator fees, General Fund and other sources.
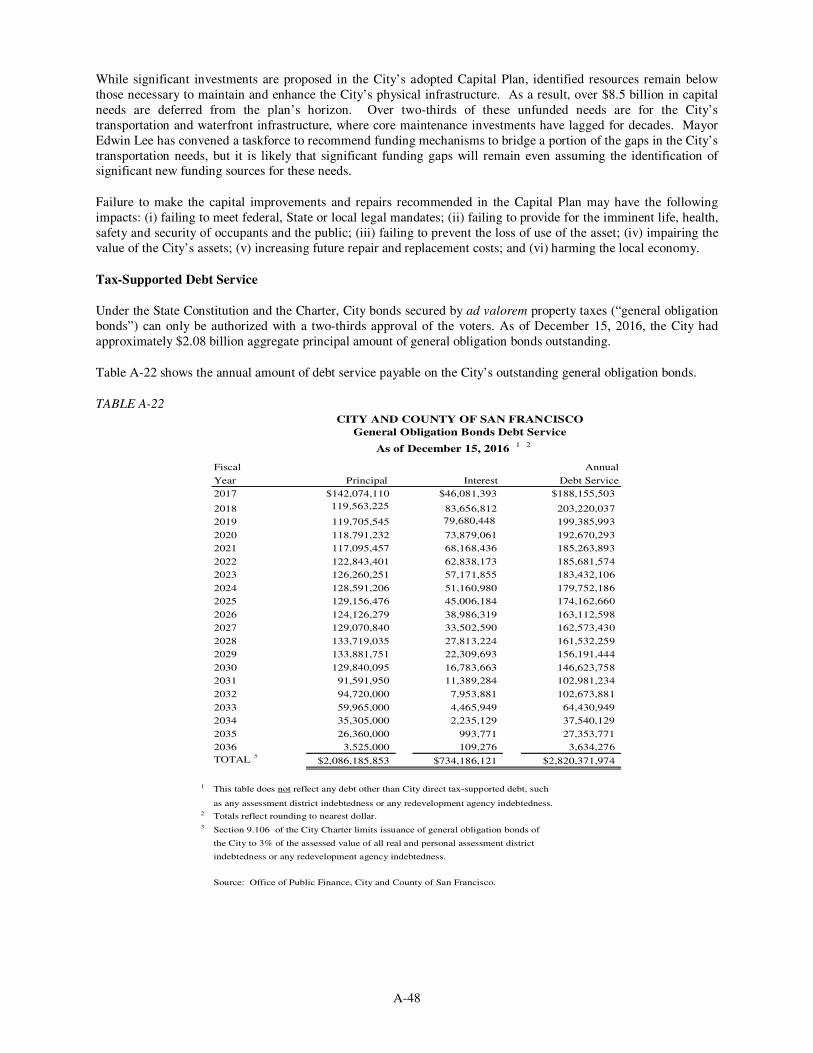
A-48
While significant investments are proposed in the City’s adopted Capital Plan, identified resources remain below those necessary to maintain and enhance the City’s physical infrastructure. As a result, over $8.5 billion in capital needs are deferred from the plan’s horizon. Over two-thirds of these unfunded needs are for the City’s transportation and waterfront infrastructure, where core maintenance investments have lagged for decades. Mayor Edwin Lee has convened a taskforce to recommend funding mechanisms to bridge a portion of the gaps in the City’s transportation needs, but it is likely that significant funding gaps will remain even assuming the identification of significant new funding sources for these needs.
Failure to make the capital improvements and repairs recommended in the Capital Plan may have the following impacts: (i) failing to meet federal, State or local legal mandates; (ii) failing to provide for the imminent life, health, safety and security of occupants and the public; (iii) failing to prevent the loss of use of the asset; (iv) impairing the value of the City’s assets; (v) increasing future repair and replacement costs; and (vi) harming the local economy.
Tax-Supported Debt Service
Under the State Constitution and the Charter, City bonds secured by ad valorem property taxes (“general obligation bonds”) can only be authorized with a two-thirds approval of the voters. As of December 15, 2016, the City had approximately $2.08 billion aggregate principal amount of general obligation bonds outstanding.
Table A-22 shows the annual amount of debt service payable on the City’s outstanding general obligation bonds.
TABLE A-22 CITY AND COUNTY OF SAN FRANCISCO
General Obligation Bonds Debt Service
Fiscal Annual
Year Principal Interest Debt Service
2017 $142,074,110 $46,081,393 $188,155,503
2018 119,563,225 83,656,812 203,220,037
2019 119,705,545 79,680,448 199,385,993
2020 118,791,232 73,879,061 192,670,293
2021 117,095,457 68,168,436 185,263,893
2022 122,843,401 62,838,173 185,681,574
2023 126,260,251 57,171,855 183,432,106
2024 128,591,206 51,160,980 179,752,186
2025 129,156,476 45,006,184 174,162,660
2026 124,126,279 38,986,319 163,112,598
2027 129,070,840 33,502,590 162,573,430
2028 133,719,035 27,813,224 161,532,259
2029 133,881,751 22,309,693 156,191,444
2030 129,840,095 16,783,663 146,623,758
2031 91,591,950 11,389,284 102,981,234
2032 94,720,000 7,953,881 102,673,881
2033 59,965,000 4,465,949 64,430,949
2034 35,305,000 2,235,129 37,540,129
2035 26,360,000 993,771 27,353,771
2036 3,525,000 109,276 3,634,276
TOTAL 3
$2,086,185,853 $734,186,121 $2,820,371,974
1 This table does not reflect any debt other than City direct tax-supported debt, such
as any assessment district indebtedness or any redevelopment agency indebtedness.2 Totals reflect rounding to nearest dollar.3 Section 9.106 of the City Charter limits issuance of general obligation bonds of
the City to 3% of the assessed value of all real and personal assessment district
indebtedness or any redevelopment agency indebtedness.
Source: Office of Public Finance, City and County of San Francisco.
As of December 15, 2016 1 2
A-49
General Obligation Bonds
Certain general obligation bonds authorized by the City’s voters as discussed below have not yet been issued. Such bonds may be issued at any time by action of the Board of Supervisors, without further approval by the voters.
In November 1992, voters approved Proposition A, which authorized the issuance of up to $350.0 million in general obligation bonds to provide moneys to fund the City’s Seismic Safety Loan Program (the “Loan Program”). The purpose of the Loan Program is to provide loans for the seismic strengthening of privately-owned unreinforced masonry buildings in San Francisco for affordable housing and market-rate residential, commercial and institutional purposes. In April 1994, the City issued $35.0 million in taxable general obligation bonds to fund the Loan Program and in October 2002, the City redeemed all outstanding bonds remaining from such issuance. In February 2007, the Board of Supervisors approved the issuance of additional indebtedness under this authorization in an amount not to exceed $35.0 million. Such issuance would be achieved pursuant to the terms of a Credit Agreement with Bank of America, N.A. (the “Credit Bank”), under which the Credit Bank agreed to fund one or more loans to the City from time to time as evidenced by the City’s issuance to the Credit Bank of the Taxable General Obligation Bond (Seismic Safety Loan Program), Series 2007A. The funding by the Credit Bank of the loans at the City’s request and the terms of repayment of such loans are governed by the terms of the Credit Agreement. Loan funds received by the City from the Credit Bank are in turn used to finance loans to Seismic Safety Loan Program borrowers. In March 2007, the City initiated an initial borrowing of $2.0 million, and in October 2007, the City borrowed approximately $3.8 million from the Credit Bank. In January 2008, the City borrowed approximately $3.9 million and in November 2008, the City borrowed $1.3 million from the Credit Bank. Further borrowings under the Credit Agreement with the Credit Bank (up to the $35.0 million not-to-exceed amount) are expected as additional loans to Seismic Safety Loan Program borrowers are approved.
In February 2008, voters approved Proposition A, which authorized the issuance of up to $185.0 million in general obligation bonds for the construction, reconstruction, purchase, and/or improvement of park and recreation facilities located in the City and under the jurisdiction of the Recreation and Parks Commission or under the jurisdiction of the Port Commission. The City issued the first series of bonds under Proposition A in the amount of approximately $42.5 million in August 2008. The City issued the second series in the amount of approximately $60.4 million in March 2010 and the third series in the amount of approximately $73.4 million in March 2012. The City issued the fourth series in the amount of approximately $8.7 million in January 2016.In June 2010, voters approved Proposition B, which authorized the issuance of up to $412.3 million in general obligation bonds to provide funds to finance the construction, acquisition, improvement and retrofitting of neighborhood fire and police stations, the auxiliary water supply system, a public safety building, and other critical infrastructure and facilities for earthquake safety and related costs. The City issued the first series of bonds under Proposition B in the amount of $79.5 million in December 2010 and the second series of bonds in the amount of $183.3 million in March 2012. The City issued the third series in the amount of approximately $38.3 million in August 2012 and the fourth series of bonds in the amount of $31.0 million in June 2013, and the fifth series in the amount of $54.9 million was issued in October 2014. The final series was issued in June 2016 in the amount of approximately $25 million. In November 2011, voters approved Proposition B, which authorized the issuance of up to $248.0 million in general obligation bonds to provide funds to repair and repave City streets and remove potholes; strengthen and seismically upgrade street structures; redesign street corridors by adding or improving pedestrian signals, lighting, sidewalk extensions, bicycle lanes, trees and landscaping; construct and renovate curb ramps and sidewalks to increase accessibility and safety for everyone, including persons with disabilities; and add and upgrade traffic signals to improve MUNI service and traffic flow. The City issued the first series of bonds under Proposition B in the amount of approximately $74.3 million in March 2012 and the second series of bonds in the amount of $129.6 million in June 2013. The City issued the final series in June 2016 in the amount of approximately $109 million.
In November 2012, voters approved Proposition B, which authorized the issuance of up to $195.0 million in general obligation bonds to provide funds for the construction, reconstruction, renovation, demolition, environmental remediation and/or improvement of park, open space, and recreation facilities located in the City and under the jurisdiction of the Recreation and Parks Commission or under the jurisdiction of the Port Commission. The City issued the first series of bonds under Proposition B in the amount of approximately $71.9 million in June 2013. The City issued the second series of bonds in the amount of $43 million in January 2016.
In June 2014, voters approved Proposition A, which authorized the issuance of up to $400.0 million in general obligation bonds to provide funds to finance the construction, acquisition, improvement and retrofitting of neighborhood fire and police stations, emergency firefighting water system, medical examiner facility, traffic
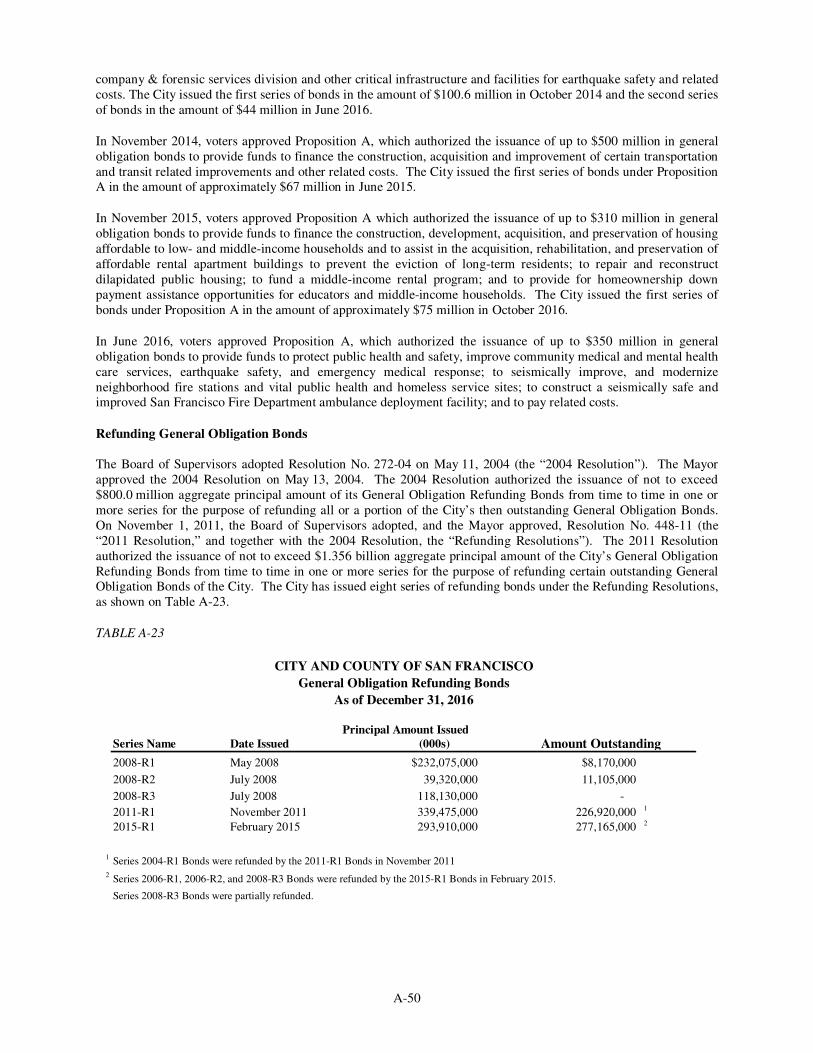
A-50
company & forensic services division and other critical infrastructure and facilities for earthquake safety and related costs. The City issued the first series of bonds in the amount of $100.6 million in October 2014 and the second series of bonds in the amount of $44 million in June 2016.
In November 2014, voters approved Proposition A, which authorized the issuance of up to $500 million in general obligation bonds to provide funds to finance the construction, acquisition and improvement of certain transportation and transit related improvements and other related costs. The City issued the first series of bonds under Proposition A in the amount of approximately $67 million in June 2015.
In November 2015, voters approved Proposition A which authorized the issuance of up to $310 million in general obligation bonds to provide funds to finance the construction, development, acquisition, and preservation of housing affordable to low- and middle-income households and to assist in the acquisition, rehabilitation, and preservation of affordable rental apartment buildings to prevent the eviction of long-term residents; to repair and reconstruct dilapidated public housing; to fund a middle-income rental program; and to provide for homeownership down payment assistance opportunities for educators and middle-income households. The City issued the first series of bonds under Proposition A in the amount of approximately $75 million in October 2016.
In June 2016, voters approved Proposition A, which authorized the issuance of up to $350 million in general obligation bonds to provide funds to protect public health and safety, improve community medical and mental health care services, earthquake safety, and emergency medical response; to seismically improve, and modernize neighborhood fire stations and vital public health and homeless service sites; to construct a seismically safe and improved San Francisco Fire Department ambulance deployment facility; and to pay related costs.
Refunding General Obligation Bonds The Board of Supervisors adopted Resolution No. 272-04 on May 11, 2004 (the “2004 Resolution”). The Mayor approved the 2004 Resolution on May 13, 2004. The 2004 Resolution authorized the issuance of not to exceed $800.0 million aggregate principal amount of its General Obligation Refunding Bonds from time to time in one or more series for the purpose of refunding all or a portion of the City’s then outstanding General Obligation Bonds. On November 1, 2011, the Board of Supervisors adopted, and the Mayor approved, Resolution No. 448-11 (the “2011 Resolution,” and together with the 2004 Resolution, the “Refunding Resolutions”). The 2011 Resolution authorized the issuance of not to exceed $1.356 billion aggregate principal amount of the City’s General Obligation Refunding Bonds from time to time in one or more series for the purpose of refunding certain outstanding General Obligation Bonds of the City. The City has issued eight series of refunding bonds under the Refunding Resolutions, as shown on Table A-23.
TABLE A-23
Principal Amount IssuedSeries Name Date Issued (000s) Amount Outstanding
2008-R1 May 2008 $232,075,000 $8,170,000
2008-R2 July 2008 39,320,000 11,105,000
2008-R3 July 2008 118,130,000 -
2011-R1 November 2011 339,475,000 226,920,000 1
2015-R1 February 2015 293,910,000 277,165,000 2
1Series 2004-R1 Bonds were refunded by the 2011-R1 Bonds in November 2011
2Series 2006-R1, 2006-R2, and 2008-R3 Bonds were refunded by the 2015-R1 Bonds in February 2015.
Series 2008-R3 Bonds were partially refunded.
As of December 31, 2016
CITY AND COUNTY OF SAN FRANCISCO
General Obligation Refunding Bonds
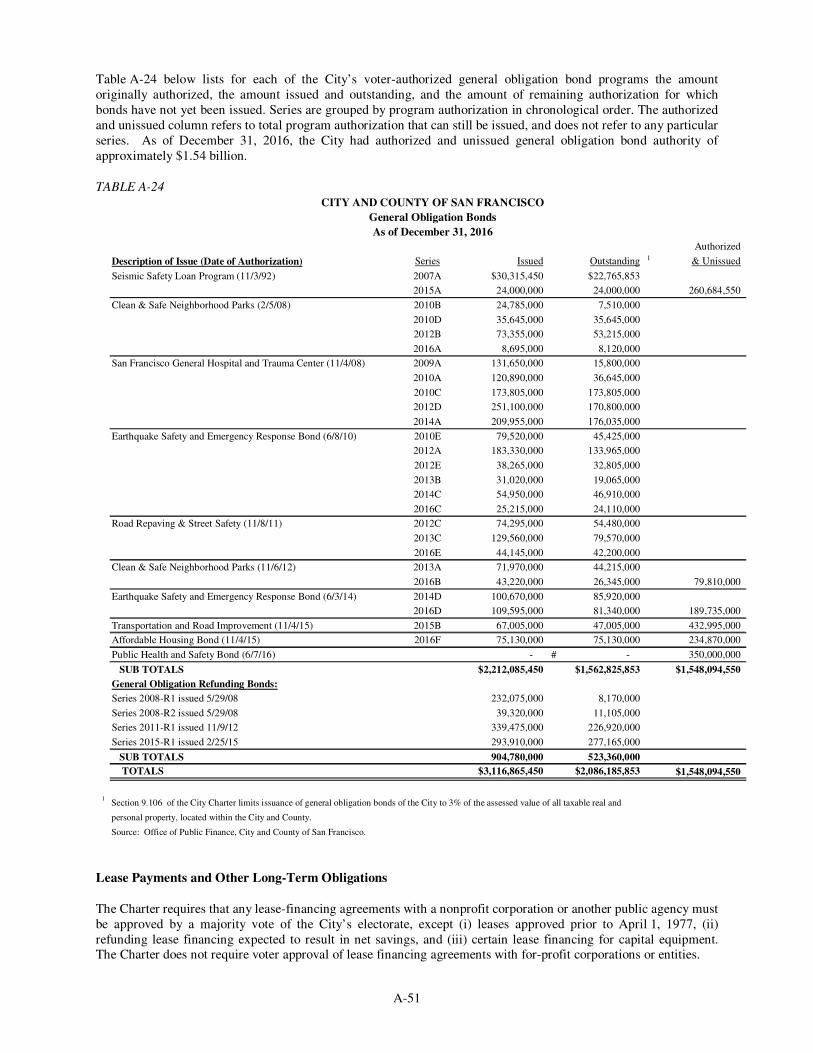
A-51
Table A-24 below lists for each of the City’s voter-authorized general obligation bond programs the amount originally authorized, the amount issued and outstanding, and the amount of remaining authorization for which bonds have not yet been issued. Series are grouped by program authorization in chronological order. The authorized and unissued column refers to total program authorization that can still be issued, and does not refer to any particular series. As of December 31, 2016, the City had authorized and unissued general obligation bond authority of approximately $1.54 billion.
TABLE A-24
CITY AND COUNTY OF SAN FRANCISCO
General Obligation Bonds
As of December 31, 2016
Authorized
Description of Issue (Date of Authorization) Series Issued Outstanding 1 & Unissued
Seismic Safety Loan Program (11/3/92) 2007A $30,315,450 $22,765,853
2015A 24,000,000 24,000,000 260,684,550
Clean & Safe Neighborhood Parks (2/5/08) 2010B 24,785,000 7,510,000
2010D 35,645,000 35,645,000
2012B 73,355,000 53,215,000
2016A 8,695,000 8,120,000
San Francisco General Hospital and Trauma Center (11/4/08) 2009A 131,650,000 15,800,000
2010A 120,890,000 36,645,000
2010C 173,805,000 173,805,000
2012D 251,100,000 170,800,000
2014A 209,955,000 176,035,000
Earthquake Safety and Emergency Response Bond (6/8/10) 2010E 79,520,000 45,425,000
2012A 183,330,000 133,965,000
2012E 38,265,000 32,805,000
2013B 31,020,000 19,065,000
2014C 54,950,000 46,910,000
2016C 25,215,000 24,110,000
Road Repaving & Street Safety (11/8/11) 2012C 74,295,000 54,480,000
2013C 129,560,000 79,570,000
2016E 44,145,000 42,200,000
Clean & Safe Neighborhood Parks (11/6/12) 2013A 71,970,000 44,215,000
2016B 43,220,000 26,345,000 79,810,000
Earthquake Safety and Emergency Response Bond (6/3/14) 2014D 100,670,000 85,920,000
2016D 109,595,000 81,340,000 189,735,000
Transportation and Road Improvement (11/4/15) 2015B 67,005,000 47,005,000 432,995,000
Affordable Housing Bond (11/4/15) 2016F 75,130,000 75,130,000 234,870,000
Public Health and Safety Bond (6/7/16) - # - 350,000,000
SUB TOTALS $2,212,085,450 $1,562,825,853 $1,548,094,550
General Obligation Refunding Bonds:
Series 2008-R1 issued 5/29/08 232,075,000 8,170,000
Series 2008-R2 issued 5/29/08 39,320,000 11,105,000
Series 2011-R1 issued 11/9/12 339,475,000 226,920,000
Series 2015-R1 issued 2/25/15 293,910,000 277,165,000
SUB TOTALS 904,780,000 523,360,000
TOTALS $3,116,865,450 $2,086,185,853 $1,548,094,550
1Section 9.106 of the City Charter limits issuance of general obligation bonds of the City to 3% of the assessed value of all taxable real and
personal property, located within the City and County.
Source: Office of Public Finance, City and County of San Francisco.
Lease Payments and Other Long-Term Obligations
The Charter requires that any lease-financing agreements with a nonprofit corporation or another public agency must be approved by a majority vote of the City’s electorate, except (i) leases approved prior to April 1, 1977, (ii) refunding lease financing expected to result in net savings, and (iii) certain lease financing for capital equipment. The Charter does not require voter approval of lease financing agreements with for-profit corporations or entities.
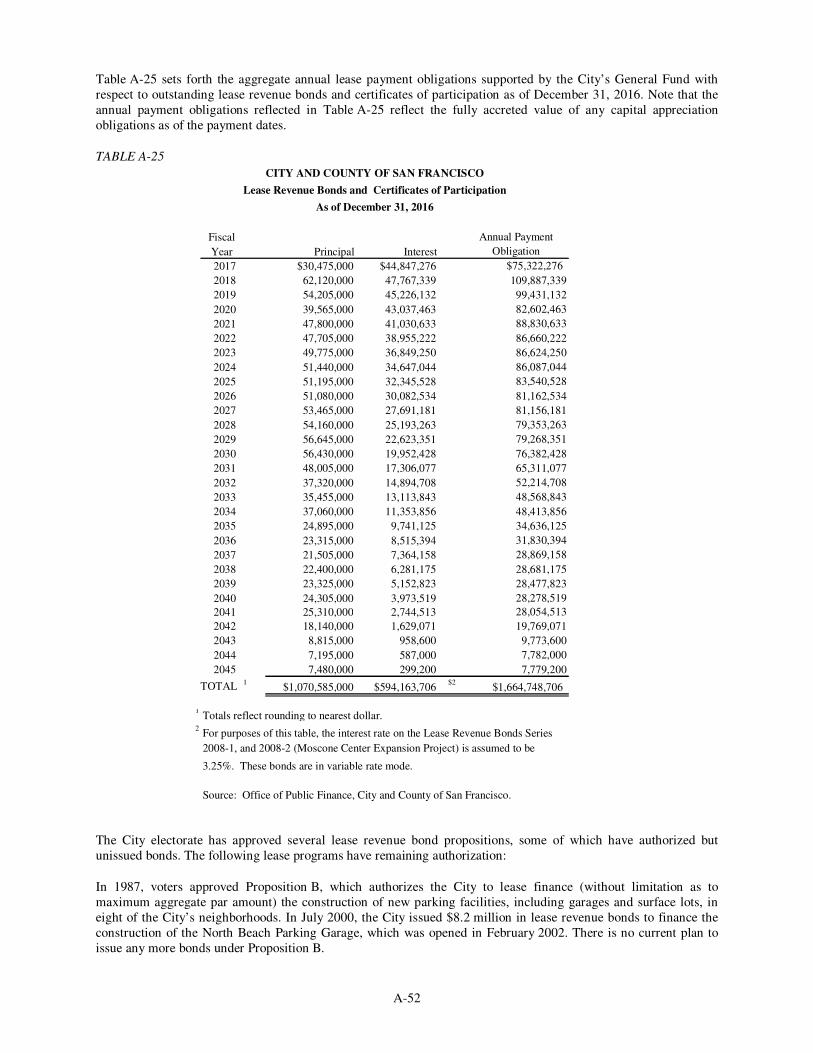
A-52
Table A-25 sets forth the aggregate annual lease payment obligations supported by the City’s General Fund with respect to outstanding lease revenue bonds and certificates of participation as of December 31, 2016. Note that the annual payment obligations reflected in Table A-25 reflect the fully accreted value of any capital appreciation obligations as of the payment dates.
TABLE A-25
CITY AND COUNTY OF SAN FRANCISCO
Lease Revenue Bonds and Certificates of Participation
As of December 31, 2016
Fiscal
Year Principal Interest
2017 $30,475,000 $44,847,276 $75,322,276
2018 62,120,000 47,767,339 109,887,339
2019 54,205,000 45,226,132 99,431,132
2020 39,565,000 43,037,463 82,602,463
2021 47,800,000 41,030,633 88,830,633
2022 47,705,000 38,955,222 86,660,222
2023 49,775,000 36,849,250 86,624,250
2024 51,440,000 34,647,044 86,087,044
2025 51,195,000 32,345,528 83,540,528
2026 51,080,000 30,082,534 81,162,534
2027 53,465,000 27,691,181 81,156,181
2028 54,160,000 25,193,263 79,353,263
2029 56,645,000 22,623,351 79,268,351
2030 56,430,000 19,952,428 76,382,428
2031 48,005,000 17,306,077 65,311,077
2032 37,320,000 14,894,708 52,214,708
2033 35,455,000 13,113,843 48,568,843
2034 37,060,000 11,353,856 48,413,856
2035 24,895,000 9,741,125 34,636,125
2036 23,315,000 8,515,394 31,830,394
2037 21,505,000 7,364,158 28,869,158
2038 22,400,000 6,281,175 28,681,175
2039 23,325,000 5,152,823 28,477,823
2040 24,305,000 3,973,519 28,278,519
2041 25,310,000 2,744,513 28,054,513
2042 18,140,000 1,629,071 19,769,071
2043 8,815,000 958,600 9,773,600
2044 7,195,000 587,000 7,782,000
2045 7,480,000 299,200 7,779,200
TOTAL 1$1,070,585,000 $594,163,706
$2$1,664,748,706
1Totals reflect rounding to nearest dollar.
2For purposes of this table, the interest rate on the Lease Revenue Bonds Series
2008-1, and 2008-2 (Moscone Center Expansion Project) is assumed to be
3.25%. These bonds are in variable rate mode.
Source: Office of Public Finance, City and County of San Francisco.
Annual Payment
Obligation
The City electorate has approved several lease revenue bond propositions, some of which have authorized but unissued bonds. The following lease programs have remaining authorization:
In 1987, voters approved Proposition B, which authorizes the City to lease finance (without limitation as to maximum aggregate par amount) the construction of new parking facilities, including garages and surface lots, in eight of the City’s neighborhoods. In July 2000, the City issued $8.2 million in lease revenue bonds to finance the construction of the North Beach Parking Garage, which was opened in February 2002. There is no current plan to issue any more bonds under Proposition B.
A-53
In 1990, voters approved Proposition C, which amended the Charter to authorize the City to lease-purchase equipment through a nonprofit corporation without additional voter approval but with certain restrictions. The City and County of San Francisco Finance Corporation (the “Corporation”) was incorporated for that purpose. Proposition C provides that the outstanding aggregate principal amount of obligations with respect to lease financings may not exceed $20.0 million, with such amount increasing by five percent each fiscal year. As of December 31, 2016 the total authorized amount for such financings was $67.7 million. The total principal amount outstanding as of December 31, 2016 was $3.54 million.
In 1994, voters approved Proposition B, which authorized the issuance of up to $60.0 million in lease revenue bonds for the acquisition and construction of a combined dispatch center for the City’s emergency 911 communication system and for the emergency information and communications equipment for the center. In 1997 and 1998, the Corporation issued $22.6 million and $23.3 million of Proposition B lease revenue bonds, respectively, leaving $14.0 million in remaining authorization. There is no current plan to issue additional series of bonds under Proposition B.
In June 1997, voters approved Proposition D, which authorized the issuance of up to $100.0 million in lease revenue bonds for the construction of a new football stadium at Candlestick Park, the previous home of the San Francisco 49ers football team. If issued, the $100.0 million of lease revenue bonds would be the City’s contribution toward the total cost of the stadium project and the 49ers would be responsible for paying the remaining cost of the stadium construction project. There is no current plan to issue the Proposition D bonds.
On March 7, 2000, voters approved Proposition C, which extended a two and one half cent per $100.0 in assessed valuation property tax set-aside for the benefit of the Recreation and Park Department (the “Open Space Fund”). Proposition C also authorizes the issuance of lease revenue bonds or other forms of indebtedness payable from the Open Space Fund. The City issued approximately $27.0 million and $42.4 million of such Open Space Fund lease revenue bonds in October 2006 and October 2007, respectively.
In November 2007, voters approved Proposition D, which amended the Charter and renewed the Library Preservation Fund. Proposition D continues the two and one half cent per $100.0 in assessed valuation property tax set-aside and establishes a minimum level of City appropriations, moneys that are maintained in the Library Preservation Fund. Proposition D also authorizes the issuance of revenue bonds or other evidences of indebtedness. The City issued the first series of lease revenue bonds in the amount of approximately $34.3 million in March 2009.
Commercial Paper Program
The Board authorized on March 17, 2009 and the Mayor approved on March 24, 2009 the establishment of a not-to-exceed $150.0 million Lease Revenue Commercial Paper Certificates of Participation Program, Series 1 and 1-T and Series 2 and 2-T (the “CP Program”). Commercial Paper Notes (the “CP Notes”) are issued from time to time to pay approved project costs in connection with the acquisition, improvement, renovation and construction of real property and the acquisition of capital equipment and vehicles in anticipation of long-term or other take-out financing to be issued when market conditions are favorable. Projects are eligible to access the CP Program once the Board and the Mayor have approved the project and the long-term, permanent financing for the project. The former Series 1 and 1-T and Series 2 and 2-T letters of credit issued in 2010 by J.P. Morgan Chase Bank, N.A. and U.S. Bank, N.A. expired in June 2016. In May 2016, the City obtained renewal credit facilities securing the CP Notes issued by State Street Bank and Trust Company with a maximum principal amount of $75 million and by U.S. Bank, N.A. with a maximum principal amount of $75 million. The renewal credit facilities will expire in May 2021.
The Board authorized on July 16, 2013 and the Mayor approved on July 25, 2013 an additional $100.0 million Lease Revenue Commercial Paper Certificates of Participation Program, Series 3 and 3-T and Series 4 and 4-T that increases the total authorization of the CP Program to $250.0 million. The Series 3 and 3-T and 4 and 4-T are secured by a letter of credit issued by State Street Bank and Trust Company expiring February 2019.
As of December 31, 2016, the outstanding principal amount of CP Notes is $171.2 million. The weighted average interest rate for CP Notes is approximately 0.77%.
A-54
Board Authorized and Unissued Long-Term Obligations
The Board of Supervisors authorized on October 26, 2010 and the Mayor approved on November 5, 2010 the issuance of not to exceed $38 million in City and County of San Francisco certificates of participation to partially finance the rebuilding of severely distressed public housing sites, while increasing affordable housing and ownership opportunities and improving the quality of life for existing residents and the surrounding communities (the HOPE SF Project). The City anticipates issuing the certificates in the Summer of 2017.
The Board of Supervisors authorized on February 12, 2013 and the Mayor approved on February 15, 2013 the issuance of not to exceed $507.9 million of City and County of San Francisco Certificates of Participation (Moscone Expansion Project) payable from Moscone Expansion District assessments to finance the costs of additions and improvements to the George R. Moscone Convention Center. The City anticipates issuing the certificates in 2017. The Board of Supervisors authorized October 8, 2013 and the Mayor approved October 11, 2013 the issuance of not to exceed $13.5 million of City and County of San Francisco Certificates of Participation (Treasure Island Improvement Project) to finance the cost of additions and improvements to the utility infrastructure at Treasure island.
Overlapping Debt
Table A-26 shows bonded debt and long-term obligations as of December 31, 2016 sold in the public capital markets by the City and those public agencies whose boundaries overlap the boundaries of the City in whole or in part. Long-term obligations of non-City agencies generally are not payable from revenues of the City. In many cases, long-term obligations issued by a public agency are payable only from the General Fund or other revenues of such public agency. In the table, lease obligations of the City which support indebtedness incurred by others are included. As noted below, the Charter limits the City’s outstanding general obligation bond debt to 3% of the total assessed valuation of all taxable real and personal property within the City.
[Remainder of Page Intentionally Left Blank.]
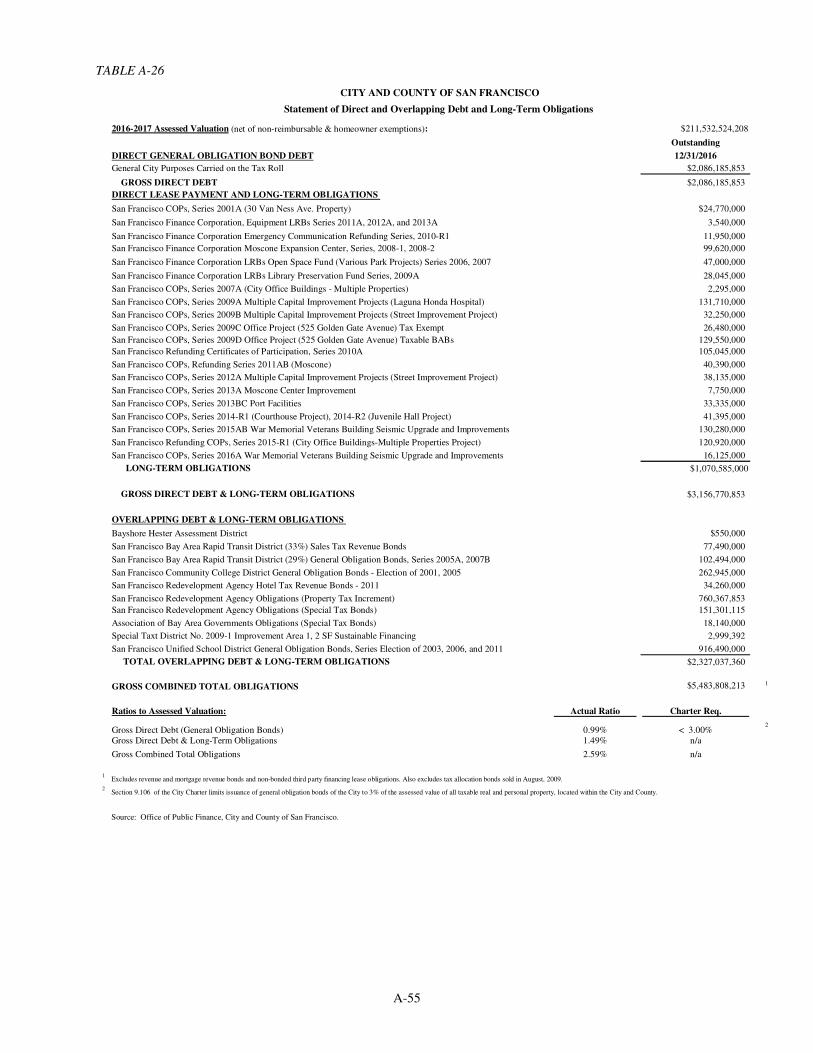
A-55
TABLE A-26
2016-2017 Assessed Valuation (net of non-reimbursable & homeowner exemptions): $211,532,524,208
Outstanding
DIRECT GENERAL OBLIGATION BOND DEBT 12/31/2016
General City Purposes Carried on the Tax Roll $2,086,185,853
GROSS DIRECT DEBT $2,086,185,853
DIRECT LEASE PAYMENT AND LONG-TERM OBLIGATIONS
San Francisco COPs, Series 2001A (30 Van Ness Ave. Property) $24,770,000
San Francisco Finance Corporation, Equipment LRBs Series 2011A, 2012A, and 2013A 3,540,000
San Francisco Finance Corporation Emergency Communication Refunding Series, 2010-R1 11,950,000
San Francisco Finance Corporation Moscone Expansion Center, Series, 2008-1, 2008-2 99,620,000
San Francisco Finance Corporation LRBs Open Space Fund (Various Park Projects) Series 2006, 2007 47,000,000
San Francisco Finance Corporation LRBs Library Preservation Fund Series, 2009A 28,045,000
San Francisco COPs, Series 2007A (City Office Buildings - Multiple Properties) 2,295,000
San Francisco COPs, Series 2009A Multiple Capital Improvement Projects (Laguna Honda Hospital) 131,710,000
San Francisco COPs, Series 2009B Multiple Capital Improvement Projects (Street Improvement Project) 32,250,000
San Francisco COPs, Series 2009C Office Project (525 Golden Gate Avenue) Tax Exempt 26,480,000
San Francisco COPs, Series 2009D Office Project (525 Golden Gate Avenue) Taxable BABs 129,550,000
San Francisco Refunding Certificates of Participation, Series 2010A 105,045,000
San Francisco COPs, Refunding Series 2011AB (Moscone) 40,390,000
San Francisco COPs, Series 2012A Multiple Capital Improvement Projects (Street Improvement Project) 38,135,000
San Francisco COPs, Series 2013A Moscone Center Improvement 7,750,000
San Francisco COPs, Series 2013BC Port Facilities 33,335,000
San Francisco COPs, Series 2014-R1 (Courthouse Project), 2014-R2 (Juvenile Hall Project) 41,395,000
San Francisco COPs, Series 2015AB War Memorial Veterans Building Seismic Upgrade and Improvements 130,280,000
San Francisco Refunding COPs, Series 2015-R1 (City Office Buildings-Multiple Properties Project) 120,920,000
San Francisco COPs, Series 2016A War Memorial Veterans Building Seismic Upgrade and Improvements 16,125,000
LONG-TERM OBLIGATIONS $1,070,585,000
GROSS DIRECT DEBT & LONG-TERM OBLIGATIONS $3,156,770,853
OVERLAPPING DEBT & LONG-TERM OBLIGATIONS
Bayshore Hester Assessment District $550,000
San Francisco Bay Area Rapid Transit District (33%) Sales Tax Revenue Bonds 77,490,000
San Francisco Bay Area Rapid Transit District (29%) General Obligation Bonds, Series 2005A, 2007B 102,494,000
San Francisco Community College District General Obligation Bonds - Election of 2001, 2005 262,945,000
San Francisco Redevelopment Agency Hotel Tax Revenue Bonds - 2011 34,260,000
San Francisco Redevelopment Agency Obligations (Property Tax Increment) 760,367,853
San Francisco Redevelopment Agency Obligations (Special Tax Bonds) 151,301,115
Association of Bay Area Governments Obligations (Special Tax Bonds) 18,140,000
Special Taxt District No. 2009-1 Improvement Area 1, 2 SF Sustainable Financing 2,999,392
San Francisco Unified School District General Obligation Bonds, Series Election of 2003, 2006, and 2011 916,490,000
TOTAL OVERLAPPING DEBT & LONG-TERM OBLIGATIONS $2,327,037,360
GROSS COMBINED TOTAL OBLIGATIONS $5,483,808,213 1
Ratios to Assessed Valuation: Actual Ratio Charter Req.
Gross Direct Debt (General Obligation Bonds) 0.99% < 3.00%2
Gross Direct Debt & Long-Term Obligations 1.49% n/a
Gross Combined Total Obligations 2.59% n/a
1Excludes revenue and mortgage revenue bonds and non-bonded third party financing lease obligations. Also excludes tax allocation bonds sold in August, 2009.
2Section 9.106 of the City Charter limits issuance of general obligation bonds of the City to 3% of the assessed value of all taxable real and personal property, located within the City and County.
Source: Office of Public Finance, City and County of San Francisco.
CITY AND COUNTY OF SAN FRANCISCO
Statement of Direct and Overlapping Debt and Long-Term Obligations
A-56
On November 4, 2003, voters approved Proposition A. Proposition A of 2003 authorized the SFUSD to issue up to $295.0 million of general obligation bonds to repair and rehabilitate school facilities, and various other improvements. The SFUSD issued $58.0 million of such authorization in October 2004, $130.0 million in October 2005, and $92.0 million in October 2006, leaving $15.0 million authorized but unissued. In March 2012, the SFUSD issued $116.1 million in refunding general obligation bonds that refunded $137.4 million in general obligation bonds authorized under Proposition A of 2003.
On November 2, 2004, voters approved Proposition AA. Proposition AA authorized the San Francisco BART to issue general obligation bonds in one or more series over time in an aggregate principal amount not to exceed $980.0 million to strengthen tunnels, bridges, overhead tracks and the underwater Transbay Tube for BART facilities in Alameda and Contra Costa counties and the City. Of the $980.0 million, the portion payable from the levy of ad valorem taxes on property within the City is approximately 29.0% or $282.0 million. Of such authorization, BART issued $100.0 million in May 2005 and $400.0 million in July 2007, of which the allocable City portion is approximately $29.0 million and $116.0 million, respectively.
On November 7, 2006, voters approved Proposition A. Proposition A of 2006 authorized the SFUSD to issue an aggregate principal amount not to exceed $450.0 million of general obligation bonds to modernize and repair up to 64 additional school facilities and various other improvements. The SFUSD issued the first series in the aggregate principal amount of $100 million under the Proposition A authorization in February 2007. The SFUSD issued the second series in the aggregate principal amount of $150.0 million under the Proposition A authorization in January 2009. The SFUSD issued the third series in the aggregate principal amount of $185.0 million under the Proposition A authorization in May 2010.
On November 8, 2011, voters approved Proposition A. Proposition A of 2011 authorized the SFUSD to issue an aggregate principal amount not to exceed $531.0 million of general obligation bonds to repair and rehabilitate school facilities to current accessibility, health, safety, and instructional standards, and where applicable, replace worn-out plumbing, electrical and other major building systems, replace aging heating, ventilation and air handling systems, renovate outdated classrooms and training facilities, construct facilities to replace aging modular classrooms. The SFUSD issued the first series in the aggregate principal amount of $115.0 million under the Proposition A of 2011 authorization in March 2012.
MAJOR ECONOMIC DEVELOPMENT PROJECTS Numerous development and construction projects are in progress throughout the City at any given time. This section describes several of the most significant privately owned and managed real estate developments currently under way in the City in which there is City participation, generally in the form of a public/private partnership. The information in this section has been prepared by the City based on City-approved plans as well as unofficial plans and representations of the developer in each case, and includes forward-looking statements. These forward-looking statements consist of expressions of opinion, estimates, predictions, projections, plans and the like; such forward-looking statements in this section are those of the developers and not of the City. The City makes no prediction, representation or assurance that the plans and projects described will actually be accomplished, or the time frame in which the developments will be completed, or as to the financial impact on City real estate taxes, developer fees, other tax and fee income, employment, retail or real estate activity, or other consequences that might be expected or projected to result from the successful completion of each development project. Completion of development in each case may depend on the local economy, the real estate market, the financial health of the developer and others involved in the project, specific features of each development and its attractiveness to buyers, tenants and others, as well as the financial health of such buyers, tenants, and others. Completion and success of each development will also likely depend on other factors unknown to the City.
Hunters Point Shipyard (Phase 1 and 2) and Candlestick Point
The Hunters Point Shipyard Phase 1 and 2 and Candlestick Point project area will deliver approximately 12,100 new homes, approximately 32 percent of which will be below market rate and will include the rebuilding of the Alice Griffith public housing development consistent with the City’s HOPE SF program, up to 3 million square feet of research and development space, and more than 350 acres of new parks in the southeast portion of San Francisco (the “Project”). In total, the Project will generate over $6 billion of new economic activity to the City, more than 12,000 permanent jobs, hundreds of new construction jobs each year, new community facilities, new transit
A-57
infrastructure, and provide approximately $90 million in community benefits. The Project’s full build out will occur over 20 to 30 years. In the next five years over 1,000 units of housing and 26 acres of parks will be completed in the first phase of the Shipyard. The first phase of development has begun at the Hunters Point Shipyard site with approximately 200 completed units and an additional 350 units currently under construction. and an additional 230 units will begin construction in 2017. On Candlestick Point, 306 housing units are under construction which includes a mix of public housing replacement and new, affordable units. In 2016, horizontal infrastructure construction commenced, which will support up to 1,710 units of housing, including 290 stand-alone affordable units and up to 145 inclusionary units, a 635,000 square foot mixed-use retail center, 220-room hotel, and a community facilities parcel. Two hillside open space areas at the base of Bayview Hill will be improved and a new wedge park and plaza will also be constructed, adding a total of 8.6 acres of open space adjacent to the new retail and residential development.
Treasure Island Former Naval Station Treasure Island is located in the San Francisco Bay and connected to the City by the San Francisco-Oakland Bay Bridge. The former base, which ceased operations in 1997, consists of approximately 405 acres on Treasure Island and 90 acres on adjoining Yerba Buena Island. Development plans for the islands include up to 8,000 new homes, 25% of which will be offered at below-market rates; up to 500 hotel rooms; a 400 slip marina; restaurants; retail and entertainment venues; and a world-class 300-acre parks and open space system. The compact mixed-use transit-oriented development is centered around a new ferry terminal connecting the island to downtown San Francisco and is designed to prioritize walking, biking and public transit. The development plans include green building standards and best practices in low-impact development. The first major land transfer from the Navy to the Treasure Island Development Authority (“TIDA”) will occur in early 2015 and will include the northern half of Yerba Buena Island and more than half of the area of Treasure Island. The developer, Treasure Island Community Development (“TICD”), is performing the preliminary engineering and pursuing the permits required to begin construction before the end of 2015. The first phase of development will include extensive horizontal infrastructure improvements (utilities, roadway improvements, site preparation, etc.) as well as the initial vertical developments. The complete build-out of the project is anticipated to occur over fifteen to twenty years.
Mission Bay Blocks 29-32– Warriors Multipurpose Recreation and Entertainment Venue The Golden State Warriors, a National Basketball Association team, is developing a multipurpose recreation and entertainment venue and associated development in Mission Bay. The site is bordered by Third Street to the West, Terry Francois Boulevard to the East, 16th Street to the South and South Street to the North. The Warriors project includes a state-of-the-art multi-purpose recreation and entertainment venue for Warriors’ home games, concerts and family shows. The site will also have, restaurants retail, office space, bike valet, public plazas and a limited amount of parking, and trigger the construction of a new 5 acre Bay Front Park between the new event center and the Bay. Environmental review has been completed for the site, and was upheld in a November 2016 decision. The project will begin construction n January 2017 and the event center will open in time for the 2019-2020 basketball season.
Transbay The Transbay Project Redevelopment Project Area was adopted in 2005 with the purpose of redeveloping 10 acres of property owned by the State in order to generate funding for the new Transbay Transit Center. In 2012 the Transit Center District Plan, the guiding document for the area surrounding the Transit Center, was approved by the Planning Commission and by the Board of Supervisors. The Transit Center District Plan includes additional funding sources for the Transbay Transit Center. The Transbay Transit Center Project will replace the outdated Transbay Terminal at First and Mission Streets with a modern transit hub and extend the Caltrain commuter rail line underground 1.3 miles into the Financial District. The Transbay Transit Center broke ground on August 11, 2010, and is scheduled to open by the end of 2017. Demolition of existing structures on the site was completed in August 2011. The 10 acres of property formerly owned by the State surrounding the Transbay Transit Center is being redeveloped with plans for 3,300 new homes, 1,400 to be affordable below-market rate homes, over 2 million square feet of new
A-58
office space, over 9 acres of new parks and open space, and a new retail boulevard on Folsom Street. Recently completed in the neighborhood is Rene Cazenave Apartments which is 120 units of permanent affordable housing for formerly homeless individuals, and Solaire, which consists of 479 residential units of which 70 units are affordable. There are over 1,200 units currently under construction on Folsom Street, 767,000 square feet of office space under construction at Howard and Beale Streets, and 1.4 million square feet of office space under construction at Mission and First Streets. In addition, a new construction projects along Folsom Street totaling 391 units is expected to break ground in early 2017. The Pelli Clarke Pelli Architects-designed Transit Center will serve more than 100,000 people per day through nine transportation systems, including future California High Speed Rail, which will be designed to connect San Francisco to Los Angeles in less than 2-1/2 hours. The Center is designed to embrace the goals of green architecture and sustainability. The heart of the Transbay Transit Center, “City Park,” a 5.4-acre public park that will sit atop the facility, and there will be a living green roof for the transit facility. The Center will have a LEED rating of Silver. The project is estimated to create more than 48,000 jobs in its first phase of construction, which will last seven years. The $4.5 billion Transbay Transit Center Project is funded by various public and private funding partners, including the federal government, the State, the Metropolitan Transportation Commission, the San Francisco County and San Mateo County Transportation Authorities, and AC Transit, among others. Mission Bay The development plans for Mission Bay include a new University of California-San Francisco (“UCSF”) research campus containing 3.15 million square feet of building space on 46 acres of land, of which 43 acres were donated by the Mission Bay Master Developer and the City; UCSF’s 550-bed hospital; 3.4 million square feet of biotech, ‘cleantech’ and health care office space; 6,400 housing units, with 1,850 (29%) affordable to moderate-, low-, and very low-income households; 425,000 square feet of retail space; a 250-room hotel with up to 25,000 square feet of retail entertainment uses; 49 acres of public open space, including parks along Mission Creek and San Francisco Bay and eight acres of open space within the UCSF campus; a new 500-student public school; and a new fire and police station and police headquarters. Mission Bay is approximately 50% complete. Over 4,067 units have been completed with an additional 900 units under construction, along with several new parks. Another 550 housing units, a 250-room hotel and several new commercial buildings will break ground in 2015. As discussed above, the design development process has also begun for that Golden State Warriors project.
Seawall Lot (SWL) 337 and Pier 48 (Mission Rock) Mission Rock is a proposed mixed-use development at Seawall Lot 337 and Pier 48, Port-owned property comprising approximately 25 acres. The Port, OEWD in its capacity as lead negotiator, and Mission Rock’s competitively-selected master developer, Seawall Lot 337 Associates, LLC, have agreed on a development concept and corresponding financial terms for Mission Rock, which are reflected in a non-binding Term Sheet that the Port Commission and Board of Supervisors have endorsed and which will be finalized in a Development Agreement following environmental review. The proposed development plan for Mission Rock set forth in the term sheet includes: approximately 8 acres of public parks and open spaces, including a 5-acre regional waterfront park; 650 to 1,500 new housing units, 15 percent of which will be affordable to low-income households; 1.3 to 1.7 million square feet of commercial space; 150,000 to 250,000 square feet of retail space, approximately 3,000 parking spaces within mixed-use buildings and a dedicated parking structure, which will serve San Francisco Giants baseball team patrons as well as Mission Rock occupants and visitors; and the rehabilitation and reuse of historic Pier 48 as a new brewery/distillery for Anchor Steam Brewing Company. In the wake of the passage of Proposition B on the June 2013 ballot, the developer, Port and OEWD staff have continued to engage relevant agencies and stakeholders to further refine the project plan. The environmental review process was initiated in January 2014 and is expected to last until mid-2017. That process will be accompanied by negotiation of transaction agreements and approval of any needed height limit and zoning changes.
A-59
Pier 70 Plans for Pier 70 call for substantial development, including major parks and historic building rehabilitation, on this 69-acre site to achieve a number of goals, including preservation and adaptive reuse of historic structures; retention of the ship repair operations; provision of new open space; reactivation and economic development on the site; and needed infrastructure and site remediation. The Port, which controls Pier 70, and OEWD, in its capacity as lead negotiator, have initiated preliminary negotiations with Forest City, the developer selected to build a new mixed-use neighborhood on a 28-acre portion of Pier 70 known as the Waterfront Site. The parties have agreed on a development concept and corresponding financial terms for the Waterfront Site, which are reflected in a non-binding Term Sheet that the Port Commission and Board of Supervisors have endorsed and which will be finalized in a Development Agreement following community and environmental review. In November 2014, Proposition F was approved by the voters, authorizing an increase of height limits on Pier 70 from 40 feet to 90 feet. Current development plans for the Pier 70 Waterfront Site call for 7 acres of parks and up to 3.25 million square feet of above-grade construction (not including parking) which may include up to 1.7 million square feet of office space; up to 400,000 square feet of retail, small-scale production, arts space intended to establish the new district as destination with unique character; and approximately 1600 housing units, with 30% percent of them made available to low- and middle- income households. This built area includes three historic industrial buildings that will be rehabilitated as part of the Waterfront Site development. Conclusion of the environmental review process, transaction agreements and planning approval are expected in mid-2017.
Moscone Convention Center The Moscone Center Expansion Project will add approximately 300,000 square feet and repurpose an additional 120,000 square feet to the portion of the existing Moscone Center located on Howard Street between 3rd and 4th Streets in the Yerba Buena Gardens neighborhood of San Francisco. Nearly 140,000 square feet of this additional space would be created by excavating and expanding the existing below-grade exhibition halls that connect the Moscone North and South buildings under Howard Street, with the remaining consisting of new and repurposed lobby area, new multi-purpose/meeting room area, and new and repurposed building support area. In addition to adding new rentable square footage, the project architects propose an iconic sense of arrival that enhances Moscone’s civic presence on Howard Street and reconnects it to the surrounding neighborhood through the creation of reintroduced lost mid-block passageways. As such, the project proposes a new mid-block pedestrian entrance from Third St and a replacement pedestrian bridge connecting Yerba Buena Gardens with the cultural facilities and children’s playground to the south. An additional enclosed pedestrian bridge would provide enhanced circulation for Moscone convention attendees and reduce on-street congestion. A May 2012 analysis by Jones Lang Lasalle Hotels estimated that the City would lose up to $2 billion in foregone revenue over the next decade if Moscone was not expanded. The project allows the City to recover approximately $734 million of this future revenue and create 3,480 local jobs through a phased construction schedule that keeps Moscone in continuous revenue generating operation. The proposed project is a joint partnership between the City and the hotel industry, acting through the Tourist Improvement District Management Corporation, with the City paying approximately one-third of all expansion costs and the hotel community paying approximately two-thirds. The Board of Supervisors unanimously approved the creation of the Moscone Expansion District and the issuance of $507 million in Certificates of Participation on February 5, 2013 and the Planning Commission unanimously approved the project on August 15, 2014. Project development began in December 2012, with major construction starting in November 2014. The project is expected to reach completion by the end of 2018.
CONSTITUTIONAL AND STATUTORY LIMITATIONS ON TAXES AND EXPENDITURES
Several constitutional and statutory limitations on taxes, revenues and expenditures exist under State law which limit the ability of the City to impose and increase taxes and other revenue sources and to spend such revenues, and which, under certain circumstances, would permit existing revenue sources of the City to be reduced by vote of the City electorate. These constitutional and statutory limitations, and future limitations, if enacted, could potentially have an adverse impact on the City’s general finances and its ability to raise revenue, or maintain existing revenue
A-60
sources, in the future. However, ad valorem property taxes required to be levied to pay debt service on general obligation bonds was authorized and approved in accordance with all applicable constitutional limitations. A summary of the currently effective limitations is set forth below.
Article XIII A of the California Constitution
Article XIII A of the California Constitution, known as “Proposition 13,” was approved by the California voters in June of 1978. It limits the amount of ad valorem tax on real property to 1% of “full cash value,” as determined by the county assessor. Article XIII A defines “full cash value” to mean the county assessor’s valuation of real property as shown on the 1975-76 tax bill under “full cash value,” or thereafter, the appraised value of real property when “purchased, newly constructed or a change in ownership has occurred” (as such terms are used in Article XIII A) after the 1975 assessment. Furthermore, all real property valuation may be increased or decreased to reflect the inflation rate, as shown by the CPI or comparable data, in an amount not to exceed 2% per year, or may be reduced in the event of declining property values caused by damage, destruction or other factors. Article XIII A provides that the 1% limitation does not apply to ad valorem taxes to pay interest or redemption charges on 1) indebtedness approved by the voters prior to July 1, 1978, 2) any bonded indebtedness for the acquisition or improvement of real property approved on or after July 1, 1978, by two-thirds of the votes cast by the voters voting on the proposition, or 3) bonded indebtedness incurred by a school district or community college district for the construction, reconstruction, rehabilitation or replacement of school facilities or the acquisition or lease of real property for school facilities, approved by 55% of the voters of the district voting on the proposition, but only if certain accountability measures are included in the proposition.
The California Revenue and Taxation Code permits county assessors who have reduced the assessed valuation of a property as a result of natural disasters, economic downturns or other factors, to subsequently “recapture” such value (up to the pre-decline value of the property) at an annual rate higher or lower than 2%, depending on the assessor’s measure of the restoration of value of the damaged property. The California courts have upheld the constitutionality of this procedure.
Since its adoption, Article XIII A has been amended a number of times. These amendments have created a number of exceptions to the requirement that property be assessed when purchased, newly constructed or a change in ownership has occurred. These exceptions include certain transfers of real property between family members, certain purchases of replacement dwellings for persons over age 55 and by property owners whose original property has been destroyed in a declared disaster, and certain improvements to accommodate persons with disabilities and for seismic upgrades to property. These amendments have resulted in marginal reductions in the property tax revenues of the City. Both the California State Supreme Court and the United States Supreme Court have upheld the validity of Article XIII A.
Article XIII B of the California Constitution
Article XIII B was enacted by California voters as an initiative constitutional amendment in November 1979. Article XIII B limits the annual appropriations from the proceeds of taxes of the State and any city, county, school district, authority or other political subdivision of the State to the level of appropriations for the prior fiscal year, as adjusted for changes in the cost of living, population, and services rendered by the governmental entity. However, no limit is imposed on the appropriation of local revenues and taxes to pay debt service on bonds existing or authorized by January 1, 1979, or subsequently authorized by the voters. Article XIII B includes a requirement that if an entity’s revenues in any year exceed the amount permitted to be spent, the excess would have to be returned by revising tax or fee schedules over the next two years.
Articles XIII C and XIII D of the California Constitution
Proposition 218, an initiative constitutional amendment, approved by the voters of the State in 1996, added Articles XIII C and XIII D to the State Constitution, which affect the ability of local governments, including charter cities such as the City, to levy and collect both existing and future taxes, assessments, fees and charges. Proposition 218 does not affect the levy and collection of taxes for voter-approved debt. However, Proposition 218 affects the City’s finances in other ways. Article XIII C requires that all new local taxes be submitted to the electorate for approval before such taxes become effective. Taxes for general governmental purposes of the City require a majority vote and taxes for specific purposes require a two-thirds vote. Under Proposition 218, the City can only continue to collect
A-61
taxes that were imposed after January 1, 1995 if voters subsequently approved such taxes by November 6, 1998. All of the City’s local taxes subject to such approval have been either reauthorized in accordance with Proposition 218 or discontinued. The voter approval requirements of Article XIII C reduce the City’s flexibility to manage fiscal problems through new, extended or increased taxes. No assurance can be given that the City will be able to raise taxes in the future to meet increased expenditure requirements.
In addition, Article XIII C addresses the initiative power in matters of local taxes, assessments, fees and charges. Pursuant to Article XIII C, the voters of the City could, by initiative, repeal, reduce or limit any existing or future local tax, assessment, fee or charge, subject to certain limitations imposed by the courts and additional limitations with respect to taxes levied to repay bonds. The City raises a substantial portion of its revenues from various local taxes which are not levied to repay bonded indebtedness and which could be reduced by initiative under Article XIII C. No assurance can be given that the voters of the City will disapprove initiatives that repeal, reduce or prohibit the imposition or increase of local taxes, assessments, fees or charges. See “OTHER CITY TAX REVENUES” herein, for a discussion of other City taxes that could be affected by Proposition 218.
With respect to the City’s general obligation bonds (City bonds secured by ad valorem property taxes), the State Constitution and the laws of the State impose a duty on the Board of Supervisors to levy a property tax sufficient to pay debt service coming due in each year. The initiative power cannot be used to reduce or repeal the authority and obligation to levy such taxes which are pledged as security for payment of the City’s general obligation bonds or to otherwise interfere with performance of the duty of the City with respect to such taxes which are pledged as security for payment of those bonds.
Article XIII D contains several provisions making it generally more difficult for local agencies, such as the City, to levy and maintain “assessments” (as defined in Article XIII D) for local services and programs. The City has created a number of special assessment districts both for neighborhood business improvement purposes and community benefit purposes, and has caused limited obligation bonds to be issued in 1996 to finance construction of a new public right of way. The City cannot predict the future impact of Proposition 218 on the finances of the City, and no assurance can be given that Proposition 218 will not have a material adverse impact on the City’s revenues.
Statutory Limitations
On November 4, 1986, California voters adopted Proposition 62, an initiative statute that, among other things, requires (i) that any new or increased general purpose tax be approved by a two-thirds vote of the local governmental entity’s legislative body and by a majority vote of the voters, and (ii) that any new or increased special purpose tax be approved by a two-thirds vote of the voters.
In Santa Clara County Local Transportation Authority v. Guardino, 11 Cal. 4th 220 (1995) (the “Santa Clara decision”), the California Supreme Court upheld a Court of Appeal decision invalidating a one-half cent countywide sales tax for transportation purposes levied by a local transportation authority. The California Supreme Court based its decision on the failure of the authority to obtain a two-thirds vote for the levy of a “special tax” as required by Proposition 62. The Santa Clara decision did not address the question of whether it should be applied retroactively. In McBrearty v. City of Brawley, 59 Cal. App. 4th 1441 (1997), the Court of Appeal, Fourth District, concluded that the Santa Clara decision is to be applied retroactively to require voter approval of taxes enacted after the adoption of Proposition 62 but before the Santa Clara decision.
The Santa Clara decision also did not decide, and the California Supreme Court has not otherwise decided, whether Proposition 62 applies to charter cities. The City is a charter city. Cases decided by the California Courts of Appeal have held that the voter approval requirements of Proposition 62 do not apply to certain taxes imposed by charter cities. See Fielder v. City of Los Angeles, 14 Cal. App. 4th 137 (1993) and Fisher v. County of Alameda, 20 Cal. App. 4th 120 (1993).
Proposition 62, as an initiative statute, does not have the same level of authority as a constitutional initiative, but is analogous to legislation adopted by the State Legislature, except that it may be amended only by a vote of the State’s electorate. Since it is a statute, it is subordinate to the authority of charter cities to impose taxes derived from the State Constitution. Proposition 218 (discussed above), however, incorporates the voter approval requirements initially imposed by Proposition 62 into the State Constitution.
A-62
Even if a court were to conclude that Proposition 62 applies to charter cities, the City’s exposure under Proposition 62 may not be significant. The effective date of Proposition 62 was November 1986. Proposition 62 contains provisions that apply to taxes imposed on or after August 1, 1985. Since August 1, 1985, the City has collected taxes on businesses, hotel occupancy, utility use, parking, property transfer, stadium admissions and vehicle rentals. See “OTHER CITY TAX REVENUES” herein. Only the hotel and stadium admissions taxes have been increased since that date. The increases in these taxes were ratified by the voters on November 3, 1998 pursuant to the requirements of Proposition 218. With the exception of the vehicle rental tax, the City continues to collect all of the taxes listed above. Since these remaining taxes were adopted prior to August 1, 1985, and have not been increased, these taxes would not be subject to Proposition 62 even if Proposition 62 applied to a charter city.
Proposition 1A
Proposition 1A, a constitutional amendment proposed by the State Legislature and approved by the voters in November 2004, provides that the State may not reduce any local sales tax rate, limit existing local government authority to levy a sales tax rate, or change the allocation of local sales tax revenues, subject to certain exceptions. As set forth under the laws in effect as of November 3, 2004, Proposition 1A generally prohibits the State from shifting any share of property tax revenues allocated to local governments for any fiscal year to schools or community colleges. Any change in the allocation of property tax revenues among local governments within a county must be approved by two-thirds of both houses of the Legislature. Proposition 1A provides, however, that beginning in fiscal year 2008-09, the State may shift to schools and community colleges up to 8% of local government property tax revenues, which amount must be repaid, with interest, within three years, if the Governor proclaims that the shift is needed due to a severe State financial hardship, the shift is approved by two-thirds of both houses and certain other conditions are met. The State may also approve voluntary exchanges of local sales tax and property tax revenues among local governments within a county.
Proposition 1A also provides that if the State reduces the annual vehicle license fee rate below 0.65% of vehicle value, the State must provide local governments with equal replacement revenues. Further, Proposition 1A requires the State to suspend State mandates affecting cities, counties and special districts, excepting mandates relating to employee rights, schools or community colleges, in any year that the State does not fully reimburse local governments for their costs to comply with such mandates.
Proposition 1A may result in increased and more stable City revenues. The magnitude of such increase and stability is unknown and would depend on future actions by the State. However, Proposition 1A could also result in decreased resources being available for State programs. This reduction, in turn, could affect actions taken by the State to resolve budget difficulties. Such actions could include increasing State taxes, decreasing aid to cities and spending on other State programs, or other actions, some of which could be adverse to the City.
Proposition 22
Proposition 22 (“Proposition 22”) which was approved by California voters in November 2010, prohibits the State, even during a period of severe fiscal hardship, from delaying the distribution of tax revenues for transportation, redevelopment, or local government projects and services and prohibits fuel tax revenues from being loaned for cash-flow or budget balancing purposes to the State General Fund or any other State fund. In addition, Proposition 22 generally eliminates the State’s authority to temporarily shift property taxes from cities, counties, and special districts to schools, temporarily increase a school and community college district’s share of property tax revenues, prohibits the State from borrowing or redirecting redevelopment property tax revenues or requiring increased pass-through payments thereof, and prohibits the State from reallocating vehicle license fee revenues to pay for State-imposed mandates. In addition, Proposition 22 requires a two-thirds vote of each house of the State Legislature and a public hearing process to be conducted in order to change the amount of fuel excise tax revenues shared with cities and counties. Proposition 22 prohibits the State from enacting new laws that require redevelopment agencies to shift funds to schools or other agencies (but see “San Francisco Redevelopment Agency Dissolution” above). While Proposition 22 will not change overall State and local government costs or revenues by the express terms thereof, it will cause the State to adopt alternative actions to address its fiscal and policy objectives.
Due to the prohibition with respect to the State’s ability to take, reallocate, and borrow money raised by local governments for local purposes, Proposition 22 supersedes certain provisions of Proposition 1A (2004). However,
A-63
borrowings and reallocations from local governments during 2009 are not subject to Proposition 22 prohibitions. In addition, Proposition 22 supersedes Proposition 1A of 2006. Accordingly, the State is prohibited from borrowing sales taxes or excise taxes on motor vehicle fuels or changing the allocations of those taxes among local governments except pursuant to specified procedures involving public notices and hearings.
Proposition 26
On November 2, 2010, the voters approved Proposition 26 (“Proposition 26”), revising certain provisions of Articles XIIIA and XIIIC of the California Constitution. Proposition 26 re-categorizes many State and local fees as taxes, requires local governments to obtain two-thirds voter approval for taxes levied by local governments, and requires the State to obtain the approval of two-thirds of both houses of the State Legislature to approve State laws that increase taxes. Furthermore, pursuant to Proposition 26, any increase in a fee beyond the amount needed to provide the specific service or benefit is deemed to be a tax and the approval thereof will require a two-thirds vote. In addition, for State-imposed charges, any tax or fee adopted after January 1, 2010 with a majority vote which would have required a two-thirds vote if Proposition 26 were effective at the time of such adoption is repealed as of November 2011 absent the re-adoption by the requisite two-thirds vote.
Proposition 26 amends Article XIII C of the State Constitution to state that a “tax” means a levy, charge or exaction of any kind imposed by a local government, except (1) a charge imposed for a specific benefit conferred or privilege granted directly to the payor that is not provided to those not charged, and which does not exceed the reasonable costs to the local government of conferring the benefit or granting the privilege; (2) a charge imposed for a specific government service or product provided directly to the payor that is not provided to those not charged, and which does not exceed the reasonable costs to the local government of providing the service or product; (3) a charge imposed for the reasonable regulatory costs to a local government for issuing licenses and permits, performing investigations, inspections and audits, enforcing agricultural marketing orders, and the administrative enforcement and adjudication thereof; (4) a charge imposed for entrance to or use of local government property or the purchase rental or lease of local government property; (5) a fine, penalty, or other monetary charge imposed by the judicial branch of government or a local government as a result of a violation of law, including late payment fees, fees imposed under administrative citation ordinances, parking violations, etc.; (6) a charge imposed as a condition of property development; or (7) assessments and property related fees imposed in accordance with the provisions of Proposition 218. Fees, charges and payments that are made pursuant to a voluntary contract that are not “imposed by a local government” are not considered taxes and are not covered by Proposition 26.
Proposition 26 applies to any levy, charge or exaction imposed, increased, or extended by local government on or after November 3, 2010. Accordingly, fees adopted prior to that date are not subject to the measure until they are increased or extended or if it is determined that an exemption applies.
If the local government specifies how the funds from a proposed local tax are to be used, the approval will be subject to a two-thirds voter requirement. If the local government does not specify how the funds from a proposed local tax are to be used, the approval will be subject to a fifty percent voter requirement. Proposed local government fees that are not subject to Proposition 26 are subject to the approval of a majority of the governing body. In general, proposed property charges will be subject to a majority vote of approval by the governing body although certain proposed property charges will also require approval by a majority of property owners.
Future Initiatives and Changes in Law
The laws and Constitutional provisions described above were each adopted as measures that qualified for the ballot pursuant to the State’s initiative process. From time to time other initiative measures could be adopted, further affecting revenues of the City or the City’s ability to expend revenues. The nature and impact of these measures cannot be anticipated by the City.
On April 25, 2013, the California Supreme Court in McWilliams v. City of Long Beach (April 25, 2013, No. S202037), held that the claims provisions of the Government Claims Act (Government Code Section 900 et. seq.) govern local tax and fee refund actions (absent another State statue governing the issue), and that local ordinances were without effect. The effect of the McWilliams case is that local governments could face class actions over disputes involving taxes and fees. Such cases could expose local governments to significant refund claims in the
A-64
future. The City cannot predict whether any such class claims will be filed against it in the future, the outcome of any such claim or its impact on the City. LITIGATION AND RISK MANAGEMENT
Pending Litigation
There are a number of lawsuits and claims routinely pending against the City, including those summarized in Note 16 to the City’s CAFR as of June 30, 2016, attached as Appendix B to this Official Statement. Included among these are a number of actions which if successful would be payable from the City’s General Fund. In the opinion of the City Attorney, such suits and claims presently pending will not impair the ability of the City to make debt service payments or otherwise meet its General Fund lease or debt obligations, nor materially impair the City’s ability to fund current operations.
Millennium Tower is a 58-story luxury residential building completed in 2009 and located at 301 Mission Street in downtown San Francisco. On August 17, 2016, owners of condominiums in Millennium Tower filed a lawsuit (the “Lawsuit”) against the Transbay Joint Powers Authority (“TJPA”) and the individual members of the TJPA, including the City. The TJPA is a joint exercise of powers authority created by the City, the Alameda-Contra Costa Transit District, the Peninsula Corridor Joint Powers Board, and Caltrans (ex officio). The TJPA is responsible under State law for developing the Transbay Transit Center, which will be a new regional transit hub located near the Millennium Tower. See “MAJOR ECONOMIC DEVELOPMENT PROJECTS—Transbay”.
The TJPA began excavation and construction of the Transbay Transit Center in 2010, after the Millennium Tower was completed. In brief, the Lawsuit claims that the construction of the Transbay Transit Center harmed the Millennium Tower by causing it to settle into the soil more than planned and tilt toward the west/northwest, and the owners claim unspecified monetary damages for inverse condemnation and nuisance. The TJPA has said that the Millennium Tower was already sinking more than planned and tilting before the TJPA began construction of the Transbay Transit Center and that the TJPA took precautionary efforts to avoid exacerbating the situation. The City expects that other lawsuits will be filed against the TJPA relating to the subsidence and tilting of the Millennium Tower. Other than the Lawsuit, there is no other pending legal claim against the City regarding the Millennium Tower. The City continues to evaluate the Lawsuit, and the subject matter of the lawsuit, but cannot now make any prediction as to the outcome of the Lawsuit, or whether the Lawsuit, if determined adversely to the TJPA or the City, would have a material adverse impact on City finances.
Risk Retention Program
Citywide risk management is coordinated by the Office of Risk Management Division within the City’s General Services Agency, which is under the supervision of the City Administrator. With certain exceptions, it is the general policy of the City not to purchase commercial insurance for the risks of losses to which it is exposed but rather to first evaluate self-insurance for such risks. The City’s policy in this regard is based on its analysis that it is more economical to manage its risks internally and administer, adjust, settle, defend, and pay claims from budgeted resources (i.e., “self-insurance”). The City obtains commercial insurance in certain circumstances, including when required by bond or lease financing covenants and for other limited purposes. The City actuarially determines liability and workers’ compensation risk exposures as permitted under State law. The City does not maintain commercial earthquake coverage, with certain minor exceptions.
The City’s property risk management approach varies depending on various factors including whether the facility is currently under construction or if the property is owned by a self-supporting enterprise fund department. For new construction projects, the City has utilized traditional insurance, owner-controlled insurance programs or contractor-controlled insurance programs. Under the latter two approaches, the insurance program provides coverage for the entire construction project. When a traditional insurance program is used, the City requires each contractor to provide its own insurance, while ensuring that the full scope of work be covered with satisfactory levels to limit the City’s risk exposure. The majority of the City’s commercial insurance coverage is purchased for enterprise fund departments and other similar revenue-generating departments (the Airport, MTA, the SF Public Utilities Commission, the Port and Convention Facilities, etc.). The remainder of the commercial insurance coverage is for General Fund departments that are required to provide coverage for bond-financed facilities, coverage for
A-65
collections at City-owned museums and to meet statutory requirements for bonding of various public officials, and other limited purposes where required by contract or other agreement.
Through coordination with the City Controller and the City Attorney’s Office, the City’s general liability risk exposure is actuarially determined and is addressed through appropriations in the City’s budget and also reflected in the CAFR. The appropriations are sized based on actuarially determined anticipated claim payments and the projected timing of disbursement.
The City actuarially estimates future workers’ compensation costs to the City according to a formula based on the following: (i) the dollar amount of claims; (ii) yearly projections of payments based on historical experience; and (iii) the size of the department’s payroll. The administration of workers’ compensation claims and payouts are handled by the Workers’ Compensation Division of the City’s Department of Human Resources. The Workers’ Compensation Division determines and allocates workers’ compensation costs to departments based upon actual payments and costs associated with a department’s injured workers’ claims. Statewide workers’ compensation reforms have resulted in City budgetary savings in recent years. The City continues to develop and implement programs to lower or mitigate workers’ compensation costs. These programs focus on accident prevention, transitional return to work for injured workers, improved efficiencies in claims handling and maximum utilization of medical cost containment strategies.
The City’s estimated liability and workers’ compensation risk exposures are summarized in Note 16 to the City’s CAFR, attached to this Official Statement as Appendix B.


APPENDIX B
COMPREHENSIVE ANNUAL FINANCIAL REPORT OF THE CITY AND COUNTY OF SAN FRANCISCO
FOR THE FISCAL YEAR ENDED JUNE 30, 2016
________________________________________________
This page has been intentionally left blank.
CITY AND COUNTY OF SAN FRANCISCO, CALIFORNIA
Comprehensive Annual Financial Report
Year ended June 30, 2016
Prepared by: Office of the Controller Ben Rosenfield Controller
________________________________________________
This page has been intentionally left blank.
CITY AND COUNTY OF SAN FRANCISCO Comprehensive Annual Financial Report
Year Ended June 30, 2016
TABLE OF CONTENTS
Page
INTRODUCTORY SECTION
Controller’s Letter of Transmittal ......................................................................................................... i Certificate of Achievement - Government Finance Officers Association ............................................ ix City and County of San Francisco Organization Chart ....................................................................... x List of Principal Officials ...................................................................................................................... xi
FINANCIAL SECTION
Independent Auditor’s Report ............................................................................................................. 1 Management’s Discussion and Analysis (unaudited) ......................................................................... 3 Basic Financial Statements:
Government-wide Financial Statements: Statement of Net Position ......................................................................................................... 23 Statement of Activities .............................................................................................................. 25
Fund Financial Statements: Balance Sheet - Governmental Funds ..................................................................................... 26 Reconciliation of the Governmental Funds Balance Sheet to the Statement of Net Position .. 27 Statement of Revenues, Expenditures, and Changes in Fund Balances - Governmental
Funds ................................................................................................................................... 28 Reconciliation of the Statement of Revenues, Expenditures, and Changes in Fund
Balances of Governmental Funds to the Statement of Activities ........................................ 29 Budgetary Comparison Statement - General Fund .................................................................. 30 Statement of Net Position - Proprietary Funds ......................................................................... 33 Statement of Revenues, Expenses, and Changes in Fund Net Position - Proprietary
Funds ................................................................................................................................... 35 Statement of Cash Flows - Proprietary Funds.......................................................................... 36 Statement of Fiduciary Net Position - Fiduciary Funds ............................................................ 38 Statement of Changes in Fiduciary Net Position - Fiduciary Funds ......................................... 39
Notes to the Basic Financial Statements: (1) The Financial Reporting Entity .............................................................................................. 40 (2) Summary of Significant Accounting Policies .......................................................................... 42 (3) Reconciliation of Government-wide and Fund Financial Statements .................................... 55 (4) Budgetary Results Reconciled to Results in Accordance with Generally Accepted
Accounting Principles ............................................................................................................. 61 (5) Deposits and Investments ...................................................................................................... 62 (6) Property Taxes ....................................................................................................................... 82 (7) Capital Assets ........................................................................................................................ 83 (8) Bonds, Loans, Capital Leases and Other Payables .............................................................. 85 (9) Employee Benefit Programs .................................................................................................. 103 (10) Fund Equity ............................................................................................................................ 119 (11) Unavailable Resources in Governmental Funds ................................................................... 122 (12) San Francisco County Transportation Authority .................................................................... 122 (13) Detailed Information for Enterprise Funds ............................................................................. 124
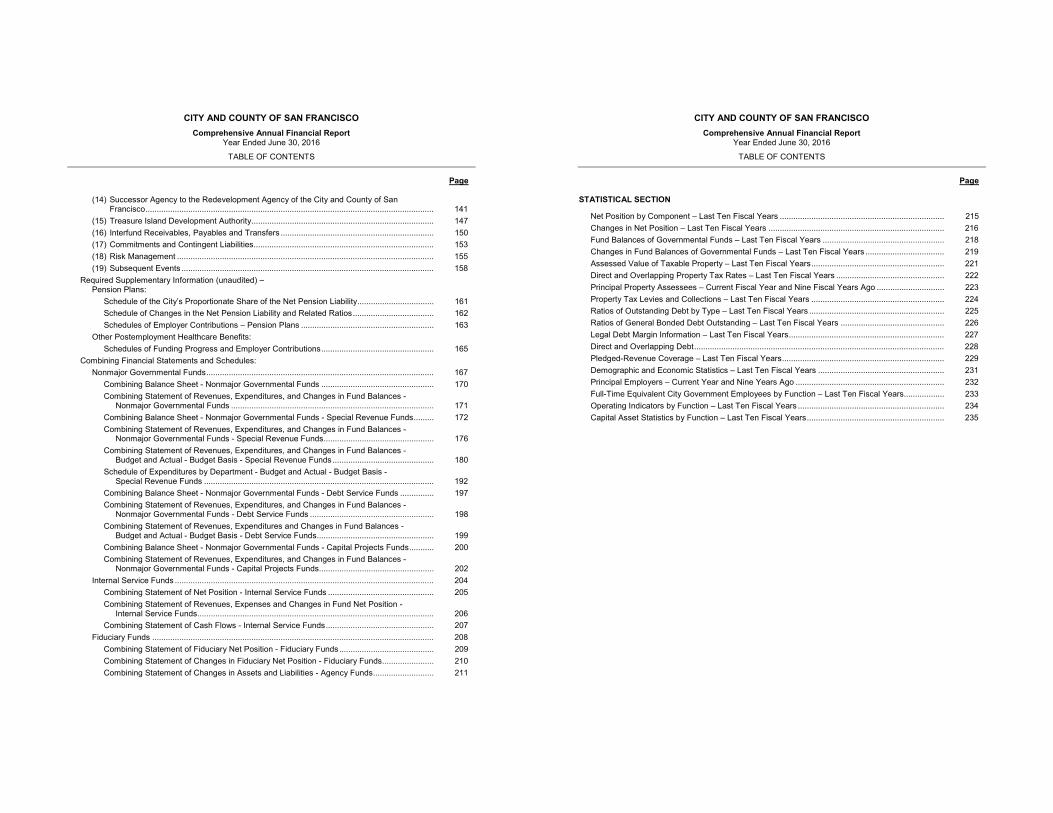
CITY AND COUNTY OF SAN FRANCISCO Comprehensive Annual Financial Report
Year Ended June 30, 2016
TABLE OF CONTENTS
Page
(14) Successor Agency to the Redevelopment Agency of the City and County of San Francisco ................................................................................................................................ 141
(15) Treasure Island Development Authority ................................................................................. 147 (16) Interfund Receivables, Payables and Transfers .................................................................... 150 (17) Commitments and Contingent Liabilities................................................................................ 153 (18) Risk Management .................................................................................................................. 155 (19) Subsequent Events ................................................................................................................ 158
Required Supplementary Information (unaudited) – Pension Plans:
Schedule of the City’s Proportionate Share of the Net Pension Liability .................................. 161 Schedule of Changes in the Net Pension Liability and Related Ratios .................................... 162 Schedules of Employer Contributions – Pension Plans ........................................................... 163
Other Postemployment Healthcare Benefits: Schedules of Funding Progress and Employer Contributions .................................................. 165
Combining Financial Statements and Schedules: Nonmajor Governmental Funds ..................................................................................................... 167
Combining Balance Sheet - Nonmajor Governmental Funds .................................................. 170 Combining Statement of Revenues, Expenditures, and Changes in Fund Balances -
Nonmajor Governmental Funds .......................................................................................... 171 Combining Balance Sheet - Nonmajor Governmental Funds - Special Revenue Funds ......... 172 Combining Statement of Revenues, Expenditures, and Changes in Fund Balances -
Nonmajor Governmental Funds - Special Revenue Funds ................................................. 176 Combining Statement of Revenues, Expenditures, and Changes in Fund Balances -
Budget and Actual - Budget Basis - Special Revenue Funds ............................................. 180 Schedule of Expenditures by Department - Budget and Actual - Budget Basis -
Special Revenue Funds ...................................................................................................... 192 Combining Balance Sheet - Nonmajor Governmental Funds - Debt Service Funds ............... 197 Combining Statement of Revenues, Expenditures, and Changes in Fund Balances -
Nonmajor Governmental Funds - Debt Service Funds ....................................................... 198 Combining Statement of Revenues, Expenditures and Changes in Fund Balances -
Budget and Actual - Budget Basis - Debt Service Funds .................................................... 199 Combining Balance Sheet - Nonmajor Governmental Funds - Capital Projects Funds ........... 200 Combining Statement of Revenues, Expenditures, and Changes in Fund Balances -
Nonmajor Governmental Funds - Capital Projects Funds ................................................... 202 Internal Service Funds ................................................................................................................... 204
Combining Statement of Net Position - Internal Service Funds ............................................... 205 Combining Statement of Revenues, Expenses and Changes in Fund Net Position -
Internal Service Funds......................................................................................................... 206 Combining Statement of Cash Flows - Internal Service Funds ................................................ 207
Fiduciary Funds ............................................................................................................................. 208 Combining Statement of Fiduciary Net Position - Fiduciary Funds .......................................... 209 Combining Statement of Changes in Fiduciary Net Position - Fiduciary Funds ....................... 210 Combining Statement of Changes in Assets and Liabilities - Agency Funds ........................... 211
CITY AND COUNTY OF SAN FRANCISCO Comprehensive Annual Financial Report
Year Ended June 30, 2016
TABLE OF CONTENTS
Page STATISTICAL SECTION
Net Position by Component – Last Ten Fiscal Years ......................................................................... 215 Changes in Net Position – Last Ten Fiscal Years .............................................................................. 216 Fund Balances of Governmental Funds – Last Ten Fiscal Years ...................................................... 218 Changes in Fund Balances of Governmental Funds – Last Ten Fiscal Years ................................... 219 Assessed Value of Taxable Property – Last Ten Fiscal Years ........................................................... 221 Direct and Overlapping Property Tax Rates – Last Ten Fiscal Years ................................................ 222 Principal Property Assessees – Current Fiscal Year and Nine Fiscal Years Ago .............................. 223 Property Tax Levies and Collections – Last Ten Fiscal Years ........................................................... 224 Ratios of Outstanding Debt by Type – Last Ten Fiscal Years ............................................................ 225 Ratios of General Bonded Debt Outstanding – Last Ten Fiscal Years .............................................. 226 Legal Debt Margin Information – Last Ten Fiscal Years ..................................................................... 227 Direct and Overlapping Debt ............................................................................................................... 228 Pledged-Revenue Coverage – Last Ten Fiscal Years ........................................................................ 229 Demographic and Economic Statistics – Last Ten Fiscal Years ........................................................ 231 Principal Employers – Current Year and Nine Years Ago .................................................................. 232 Full-Time Equivalent City Government Employees by Function – Last Ten Fiscal Years.................. 233 Operating Indicators by Function – Last Ten Fiscal Years ................................................................. 234 Capital Asset Statistics by Function – Last Ten Fiscal Years ............................................................. 235
________________________________________________
This page has been intentionally left blank.
CITY AND COUNTY OF SAN FRANCISCO OFFICE OF THE CONTROLLER
i
November 18, 2016 The Honorable Mayor Edwin Lee The Honorable Members of the Board of Supervisors Residents of the City and County of San Francisco San Francisco, California Ladies and Gentlemen: I am pleased to present the Comprehensive Annual Financial Report (CAFR) of the City and County of San Francisco, California (the City) for the year ended June 30, 2016, with the independent auditor’s report. The report is submitted in compliance with City Charter sections 2.115 and 3.105, and California Government Code Sections 25250 and 25253. The Office of the Controller prepared the CAFR in conformance with the principles and standards for accounting and financial reporting set forth by the Governmental Accounting Standards Board (GASB). The City is responsible for the accuracy of the data and for the completeness and fairness of its presentation. The existing comprehensive structure of internal accounting controls in the City provides reasonable assurance that the financial statements are free of any material misstatements. Because the cost of internal control should not exceed the anticipated benefits, the objective is to provide reasonable, rather than absolute, assurance that the financial statements are free of material misstatements. I believe that the reported data is accurate in all material respects and that its presentation fairly depicts the City’s financial position and changes in its financial position as measured by the financial activity of its various funds. I am confident that the included disclosures provide the reader with an understanding of the City’s financial affairs. The City’s Charter requires an annual audit of the Controller’s records. The records have been audited by Macias Gini & O’Connell LLP and are presented in the Basic Financial Statements in this CAFR. The CAFR also incorporates financial statements of various City enterprise funds and component units, including the San Francisco International Airport, the San Francisco Water Enterprise, Hetch Hetchy Water and Power, the Municipal Transportation Agency, the San Francisco Wastewater Enterprise, the Port of San Francisco, San Francisco General Hospital, Laguna Honda Hospital, the City and County of San Francisco Finance Corporation, the San Francisco County Transportation Authority, the City and County of San Francisco Health Service System, the San Francisco City and County Employees’ Retirement System, and the Successor Agency to the San Francisco Redevelopment Agency. This letter of transmittal is designed to complement the Management’s Discussion and Analysis (MD&A) section of the CAFR. The MD&A provides a narrative overview and analysis of the Basic Financial Statements and is presented after the independent auditor’s report. KEY FINANCIAL REPORT SECTIONS: The Introductory Section includes information about the organizational structure of the City, the City’s economy, major initiatives, status of City services, and cash management. The Financial Section includes the MD&A, Basic Financial Statements, notes to the Basic Financial Statements, and required supplementary information. The Basic Financial Statements include the government-wide financial and other statements that report on all City financial operations, and also include fund financial statements that present information for all City funds. The independent auditor’s report on the Basic Financial Statements is also included.
CITY AND COUNTY OF SAN FRANCISCO OFFICE OF THE CONTROLLER
ii
The financial statements of several enterprise activities and of all component units of government are included in this CAFR. Some component units’ financial statements are blended with the City’s, such as the San Francisco County Transportation Authority and the San Francisco Finance Corporation. The reason for this is that the primary government is financially accountable for the operations of these agencies. In other instances, namely, for the Treasure Island Development Authority, financial reporting is shown separately. Supplemental combining statements and schedules for non-major governmental funds, internal service funds and fiduciary funds are also presented in the financial section. The Statistical Section includes up to ten years of historical financial data and miscellaneous social and economic information that conforms to GASB standards for reporting statistical information. This section may be of special interest to citizens and prospective investors in our bonds. SAN FRANCISCO’S ECONOMY: Overview of Recent Trends An educated workforce and easy access to transit and financial capital continue to drive business investment in the City. San Francisco’s economy has fully recovered losses from the most recent recession, and growth continues to outpace that of the state and national economies. The City’s unemployment rate in fiscal year 2015-16 declined to a rate of 3.4%, a drop of 0.6% from the prior fiscal year’s rate of 4.0%. In comparison, average unemployment rates for California and the nation for fiscal year 2015-16 stood at 5.7% and 5.0%, respectively. Most importantly, this fall in unemployment rate is due to a strengthening labor market as opposed to people dropping out of the labor force. In fiscal year 2015-16, private nonfarm employment in the San Francisco Metropolitan Division grew 4.4% over the prior fiscal year, compared to 3.0% growth for the state overall. The resident population also continued to grow, reaching a new historical high of 864,816 in 2015 according to the U.S. Census Bureau. This represents a 1.4% increase versus the prior year, and cumulative growth of 101,800 or 13% over the last decade. Several local economic indicators have shown marked improvement over the past fiscal year. Housing prices, residential and commercial rents, and hotel room and occupancy rates, have all shown significant growth. Commercial and residential rents and median home prices all increased to new historical highs. The average asking monthly rent for apartments in San Francisco rose to $3,614 in fiscal year 2015-16, an increase of 4.9%. Monthly per square foot rental rates for commercial space grew to $70.16 in fiscal year 2015-16, a 6.5% increase versus the prior fiscal year. The average median home price in the fiscal year grew to a new annual high of approximately $1,133,813 up 10.4% from the previous fiscal year. Average annual hotel occupancy grew to 87.7%, a new historical high, while average room rates grew by 5.7% between FY2014-15 and FY2015-16. San Francisco’s economic recovery has stimulated the demand for new residential and commercial space. A large amount of private construction was completed or underway during the last fiscal year, with 4,703 housing units completed and 6,998 additional units under construction at the end of the fiscal year. Building permits for nearly 4.9 million square feet of construction were issued during the year. Much of this development is shaped by major area planning efforts that the City has completed in recent years, including in the Eastern Neighborhoods, Market-Octavia, and the Transit Center District. The City has also adopted or approved large-scale development projects in Candlestick Point/Hunters Point Shipyard, Treasure Island, and Park Merced. SAN FRANCISCO GOVERNMENT: Profile of San Francisco Government The City and County of San Francisco was established by Charter in 1850, and is the only legal subdivision of the State of California with the governmental powers of both a city and a county. The City’s legislative power is exercised through a Board of Supervisors, while its executive power is vested upon a Mayor and other appointed and elected officials. Key public services provided by the City include public safety and
CITY AND COUNTY OF SAN FRANCISCO OFFICE OF THE CONTROLLER
iii
protection, public transportation, water and sewer, parks and recreation, public health, social services and land-use and planning regulation. The heads of most of these departments are appointed by the Mayor and advised by commissions and boards appointed by City elected officials.
Elected officials include the Mayor, Members of the Board of Supervisors, Assessor-Recorder, City Attorney, District Attorney, Public Defender, Sheriff, Superior Court Judges, and Treasurer. Since November 2000, the eleven-member Board of Supervisors has been elected through district elections. The eleven district elections are staggered for five and six seats at a time, and held in even-numbered years. Board members serve four-year terms and vacancies are filled by Mayoral appointment. San Francisco’s Budgetary Process The budget is adopted at the character level of expenditure within each department, and the department level and fund is the legal level of budgetary control. Note 2(c) to the Basic Financial Statements summarizes the budgetary roles of City officials and the timetable for their various budgetary actions according to the City Charter. The City has historically adopted annual budgets for all governmental funds and typically adopts project-length budgets for capital projects and certain debt service funds. The voters adopted amendments to the Charter in November 2009 designed to further strengthen the City’s long-range financial planning. As a result of these changes, the City for the first time adopted a two-year budget for all funds for the two upcoming fiscal years in July 2012. The Charter requires that the City adopt a “rolling” two-year budget each year unless the Board of Supervisors authorizes a “fixed” two-year budget appropriation for a given fund, in which case authorization occurs every two years. As of fiscal year 2015-16 there were seven departments on a two-year fixed budget. As further required by these amendments, the Board of Supervisors and Mayor adopt a five-year financial plan every two years. The most recent plan was adopted in March 2015. Additionally, these Charter changes provided a mechanism for the Controller to propose, and the Board to adopt, various binding financial policies, which can only be suspended by a supermajority of the Board. Financial policies have now been adopted under these provisions governing the City’s budget reserve practices, the use of non-recurring revenues, and limits on the use of debt paid from the General Fund. Internal and Budgetary Controls In developing and evaluating the City’s accounting system, consideration is given to the adequacy of internal accounting controls. Internal accounting controls are designed to provide reasonable, but not absolute, assurance regarding: (1) the safeguarding of assets against loss from unauthorized use or disposition, and (2) the reliability of financial records for preparing financial statements and maintaining accountability for assets. The concept of reasonable assurance recognizes that: (1) the cost of a control should not exceed the benefits likely to be derived, and (2) the evaluation of costs and benefits requires estimates and judgments by management. All internal control evaluations occur within the above framework. We believe that the City’s internal accounting controls adequately safeguard assets and provide reasonable assurance of proper recording of financial transactions. The City maintains budgetary controls to ensure that legal provisions of the annual budget are in compliance and expenditures do not exceed budgeted amounts. Controls are exercised by integrating the budgetary accounts in fund ledgers for all budgeted funds. An encumbrance system is also used to account for purchase orders and other contractual commitments. Encumbered balances of appropriations at year-end are carried forward and are not reappropriated in the following year’s budget. Pension and Retiree Health Trust Fund Operations In FY 2014-15 the City implemented the Governmental Accounting Standards Board (GASB) Statement No. 68 related to financial reporting of pension plans. It requires additional disclosures in the notes and recognition of a net pension liability. While the City has six defined benefit retirement plans, a substantial majority of full-time employees participates in the San Francisco Employees’ Retirement System (SFERS).
CITY AND COUNTY OF SAN FRANCISCO OFFICE OF THE CONTROLLER
iv
With this new standard the City uses two different actuarial valuation studies – one for financial reporting purposes as required by Standard No. 68 and the other for funding purposes to determine the City’s annual required contributions to the plan. The new method, for financial reporting purposes, is used to calculate the net pension liability that appears on the City’s financial statements. Funding Purposes – The most recent actuarial valuation report for the SFERS pension plan, dated July 1, 2015, estimates the unfunded actuarial accrued liability at $3.32 billion, an increase of $207 million from the previous actuarial valuation dated July 1, 2014. For funding purposes, the pension plan’s funding ratio increased from 85.3% to 85.6%. Financial Reporting – As of June 30, 2016, for financial reporting purposes, the City’s net pension liability for SFERS is $2.16 billion, an increase of $496 million from the previous year. SFERS’s fiduciary net position as a percentage of total pension liability, which is comparable to the funding ratio mentioned above decreased from 91.8% to 89.9%. The City’s unfunded retiree health benefit liability has been calculated at $4.21 billion as of July 1, 2014. In 2009, the City and employees began to pre-fund prospective obligations through contributions of 3% of salary for employees hired on or after January 10, 2009. These contributions are held in an irrevocable trust, the Retiree Health Care Trust Fund. Beginning in fiscal year 2016-17, employees hired before January 10, 2009 will also start contributing to the Trust Fund with an employer match, starting at a combined 0.5% of salary and rising to 2.0% of salary by fiscal year 2019-20. As of June 30, 2016, the Trust Fund had assets of $114.8 million, an increase of 57% versus the prior year. General Fund Financial Position Highlights The City’s General Fund financial position continued to post significant improvement during this most recent fiscal year, continuing trends from recent years. Total GAAP-basis General Fund balance, which includes funds reserved for continuing appropriations and reserves, ended fiscal year 2015-16 at $1,429 million, up $284 million from the prior year. The General Fund’s cash position also reflects a strong improvement in fiscal year 2015-16, rising to a new year-end peak of $1.7 billion, up $0.43 billion from June 30, 2015.
The General Fund rainy day and budget stabilization reserves grew to $298.5 million at the end of fiscal years 2015-16, an increase of $51.3 million compared to prior year. The majority of fund balance available for appropriation on a budgetary basis totaled $435.2 million or $11.9 million more than had been previously projected and appropriated by the Mayor and Board as a source in the adopted two-year budget for fiscal years 2016-17 and 2017-18. Key Government Initiatives San Francisco’s economy depends on investments in infrastructure and services that benefit City residents, workers, visitors, and businesses. These economic foundations range from housing and commercial development, to transportation infrastructure, investments in health and human services, and the City’s quality of life. The City is taking steps to strengthen this infrastructure, to support San Francisco’s economic recovery and long-term prosperity. Some important initiatives are described below: Improving the City’s Public Transportation Systems San Francisco is ideally situated to serve the Bay Area’s need to rapidly bring a large numbers of workers into a transit-accessible employment center, and efficiently navigate the dense City on foot, mass transit, taxi or bicycle.
CITY AND COUNTY OF SAN FRANCISCO OFFICE OF THE CONTROLLER
v
Plans for a multi-modal transit hub located in the City’s core – the Transbay Transit Center – are targeted to meet a portion of this regional need. The center is designed to provide expanded bus, commuter train, and ultimately high-speed rail connections into the City from within the region and state, and to provide pedestrian connections to nearby subway, surface rail, and bus services within the City. The former terminal at the site has been demolished with completion of the new center targeted for fiscal year 2017-18. The $2.3 billion transit center, managed by a financially independent authority, is funded through a host of revenue sources; including federal stimulus funding, land sale proceeds, tax increment, local sales tax, and other revenues generated from planned dense, mixed-use development adjacent to the site. In order to meet cash flow needs of the project, an interim financing in an amount not to exceed $260 million was approved by both the City and the authority in fiscal year 2015-16. This interim financing will be provided by the City and repaid from future tax revenues generated by development from the district plan area and state-owned parcels within the redevelopment area. The City is currently constructing the Central Subway project, the second phase of a program designed to create a light-rail line running from Chinatown, under the heart of downtown, and connecting to the most-recent extension of the light-rail system to the Southeast portion of the City. The subway will connect to Bay Area Rapid Transit (BART) and Caltrain, the region’s two largest regional commuter rail services. The Central Subway project, with an estimated budget of $1.6 billion and a targeted completion date of 2018, is estimated to provide approximately 35,000 daily boardings at four stations along the new 1.7-mile line. Once in active service in 2019, the project will reduce travel times and congestion along some of the most congested vehicular and public transit routes in California. The City is also implementing a street repair and improvement program, funded with a $248 million general obligation bond, as well as state and local revenue sources. Under this program, over 2,500 blocks are expected to be repaved or preserved, 1,900 curb ramps for disabled access will be constructed, and over 125,000 square feet of public sidewalk will be repaired. In commercial corridors, and along busy routes, the program is enabling the City to build complete streets that enhance pedestrian and bicycle safety and enhance the vibrancy of urban neighborhoods. The program also provides funds to rehabilitate existing traffic signal infrastructure and allow transit signal priority along key transit routes, improving transit efficiency and relieving traffic congestion. During the last two years, the City has repaved or maintained more than 1,700 blocks, built 1,400 curb ramps, repaired 21 street structures, inspected and repaired more than 300,000 square feet of sidewalk. These improvements to the City’s transportation infrastructure will be accelerated given voter approval of a $500 million general obligation bond in November 2014, the first of four funding measures recommended by a Mayoral taskforce convened during fiscal year 2013-14 to prioritize critical transportation infrastructure projects and recommend funding strategies to meet these needs. Projects planned for the bond include investments designed to improve reliability and travel time on mass transit, improve pedestrian safety, improve accessibility, and address priority deferred maintenance needs. The City continued to invest in improvements at San Francisco International Airport (SFO) in fiscal year 2015-16 as part of an approved capital plan of $2.6 billion over the next five years. Completed projects during the fiscal year include runway safety area improvements and a new cargo facility, with work to construct a new air traffic control tower and renovations to Terminal 3 in construction. The plan also includes funds for programming, planning, and construction of the initial phases of the Terminal 1 Renovation Program, which has a projected cost of $2.2 billion and anticipated phased completion dates through 2023. These projects are necessitated by the continued growth in passenger volumes at SFO, which accounts for 93% of international air travel and 70% of all air travel into the Bay Area. Completing Critical Infrastructure Upgrades for Water, Power, and Sewer Services Service reliability and disaster preparedness are also priorities of the City’s Public Utilities Commission (PUC), as evidenced in the historic levels of infrastructure investment being deployed and planned in all three enterprises the PUC operates. As of the end of fiscal year 2015-16, the City was over 91% complete on a $4.8 billion multi-year capital program to upgrade local and regional water systems, known as the Water System Improvement Program
CITY AND COUNTY OF SAN FRANCISCO OFFICE OF THE CONTROLLER
vi
(WSIP). The WSIP program consists of both local and regional projects spread over seven counties from the Sierra foothills to San Francisco. The WSIP delivers capital improvements that enhance the system’s ability to provide reliable, affordable, high-quality drinking water in an environmentally sustainable manner to its 27 wholesale and regional retail customers in Alameda, Santa Clara, San Mateo, and San Francisco counties, collectively serving some 2.6 million people. The program is structured to cost effectively meet water quality requirements, improve seismic and delivery reliability, and meet long-term water supply objectives. The PUC is also underway with a $6.9 billion, three-phased 20-year program to upgrade of the City’s wastewater infrastructure, the Sewer System Improvement Program (SSIP). The first phase, totaling $2.7 billion, includes $1.7 billion in improvements to the Southeast Treatment Plant and funding for sustainable, green infrastructure and urban watershed assessment projects to minimize stormwater impact on the sewer system. The SSIP will upgrade the City’s combined sewer system, which was predominantly built out over the past century. Although significant investment occurred in the mid-1970s through the mid-1990s to comply with the Clean Water Act, today many of the existing facilities are in need of upgrade and major improvement to prepare San Francisco for the future. Hetch Hetchy Water and Power, which includes upcountry water operations and the City’s power enterprise, is in the midst of an upcountry rehabilitation program for its aging reservoirs, powerhouses, switchyards, pipelines, tunnels and in-city power assets. Upcountry water and power facilities are being assessed and rehabilitated where needed, including investments in reservoirs, powerhouses, switchyards, and substations, 170 miles of pipelines and tunnels, 160 miles of transmission lines, watershed land, and right-of-way property. Improvements in San Francisco include piloted replacement of old, outdated streetlight fixtures and poles with modern, energy-efficient ones. These new fixtures will have wireless controls, enabling the City to achieve cost-efficiency and higher performance through the ability to monitor and control them remotely. Over the next ten years, $1.2 billion of critical infrastructure investment is planned. Expanding Access to Healthcare Public health and human services are important to the long-term health and well-being of City residents, and to the overall productivity of the City’s workforce. The City offers a host of health and safety net services, including operation of two public hospitals, the administration of federal, state, and local entitlement programs, and a vast array of community-based health and human services. January 2014 marked the beginning of full-scale implementation of the Affordable Care Act (ACA), including the launch of Covered California and the Medi-Cal expansion. In preparation, the City conducted extensive outreach through various agencies, and the Department of Public Health (DPH) created the San Francisco Health Network, consolidating the department's full continuum of direct health care services. The San Francisco Health Network is an integrated health care delivery system that improves the department's ability to provide and manage care for insured patients that select our network, organize the elements of the delivery system, improve system efficiency, and improve the patient experience.
Approximately 140,000 San Franciscans have enrolled in new health insurance options since the launch of the ACA in 2014, including more than 92,000 in Medi-Cal and over 52,000 in Covered California. Paralleling the increased insurance enrollment is a continued reduction in enrollment in Healthy San Francisco, the City’s health access program for the uninsured, which declined from nearly 58,000 participants prior to ACA implementation to 14,500 as of June 2016. However, Healthy San Francisco does not account for all uninsured San Franciscans, and the City estimates that 25,000 to 30,000 residents continue to remain without insurance. The residually uninsured include those ineligible for the insurance expansions offered under the ACA and those who are eligible but who, for a variety of reasons, do not enroll. The City will continue to be a key provider of safety net services for these individuals.
Amidst these changes, the City has replaced and modernized the City’s two public hospitals. The voters approved an $887 million general obligation bond measure to fund the replacement of San Francisco General Hospital in November 2008. This replacement project is required given changes to state law governing seismic requirements for hospitals. It replaced the current facility with a new seven-story building, emergency rooms three times the size of the old hospital and more operating rooms on the existing hospital
CITY AND COUNTY OF SAN FRANCISCO OFFICE OF THE CONTROLLER
vii
campus. The hospital is the only trauma center in San Francisco, and also acts as the safety net hospital for our residents. The project was completed in November 2015 and patient move-in and official opening occurred in May. This project follows substantial completion of the reconstruction of the City’s skilled nursing facility, Laguna Honda Hospital, in fiscal year 2011-12. On June 7, 2016, a two-thirds majority of voters of the City approved $350 million in general obligation bonds to fund capital projects to renovate, expand, and seismically enhance fire safety and healthcare facilities, construct a larger and more modern City ambulance center, to repair and modernize neighborhood fire stations, and to build, acquire, and improve facilities to better serve homeless individuals and families. Modernizing the City’s Parks and Libraries San Francisco voters have approved a number of bond measures to fund capital improvements to the City’s parks and libraries during the past decade, including the most recent approval in November 2012 of a $195 million general obligation bond for improvements to neighborhood parks. Once implemented, the City will have completed substantial renovations of 13 recreation centers, 52 playgrounds, and 9 swimming pools during a ten-year period. The City substantially completed a comprehensive branch library improvement program in fiscal year 2013-14 that renovated 16 branch libraries, replaced seven branches with new buildings, and constructed a new branch library in Mission Bay. The $195 million program, funded with a mix of general obligation and lease-revenue bonds, state funds, and other local sources, focused on seismic safety, accessibility, and modernization for current uses. Delivering Public and Private Waterfront Improvements The Port of San Francisco, a department of the City, is custodian to seven and one-half miles of maritime industrial and urban waterfront property. The City utilizes public-private partnerships to marshal private sector creativity and financial resources to rehabilitate historic Port assets or develop new facilities for maximum public benefit. Public-private partnerships complement the City’s public works project-delivery mechanism, which has been used to deliver many waterfront projects. Development opportunity areas are identified and guided by the Port of San Francisco Waterfront Land Use Plan, which was initially adopted in 1997 and is in a public planning update process expected to conclude with policy recommendations for key waterfront subareas in 2017. Current public-private partnership projects include the rehabilitation of the Pier 70 area which contemplates continued ship repair, historic preservation, new waterfront parks, housing, and up to two million square feet of new commercial and office space and a new mixed-use neighborhood with waterfront parks and a rehabilitated Pier 48 adjacent to AT&T Park. Improving Public Safety and Earthquake Preparedness In June 2014, San Francisco voters approved a $400 million Earthquake Safety and Emergency Response Bond (ESER 2014) to continue vital work done in the ESER program and to pay for repairs and improvements that will allow San Francisco to quickly respond to a major earthquake or disaster. The first phase of the ESER program was approved by voters in June 2010 and since the program began, the City has completed the new Public Safety Building, made improvements to a number of neighborhood firehouses, and upgrades to the emergency firefighting water system. Other Long-Term Financial Challenges Remain Notwithstanding the City’s strong economic and financial performance during the recent recovery and despite significant initiatives outlined above, several long-term financial challenges and risks remain unresolved. While significant investments are proposed in the City’s adopted ten-year capital plan, identified resources remain below those necessary to maintain and enhance the City’s physical infrastructure. As a result, over $10 billion in capital needs are deferred from the plan’s horizon. Over two-thirds of these unfunded needs are for the City’s transportation and waterfront infrastructure, where core maintenance investments have lagged for decades. The City will update this plan in fiscal year 2016-17.
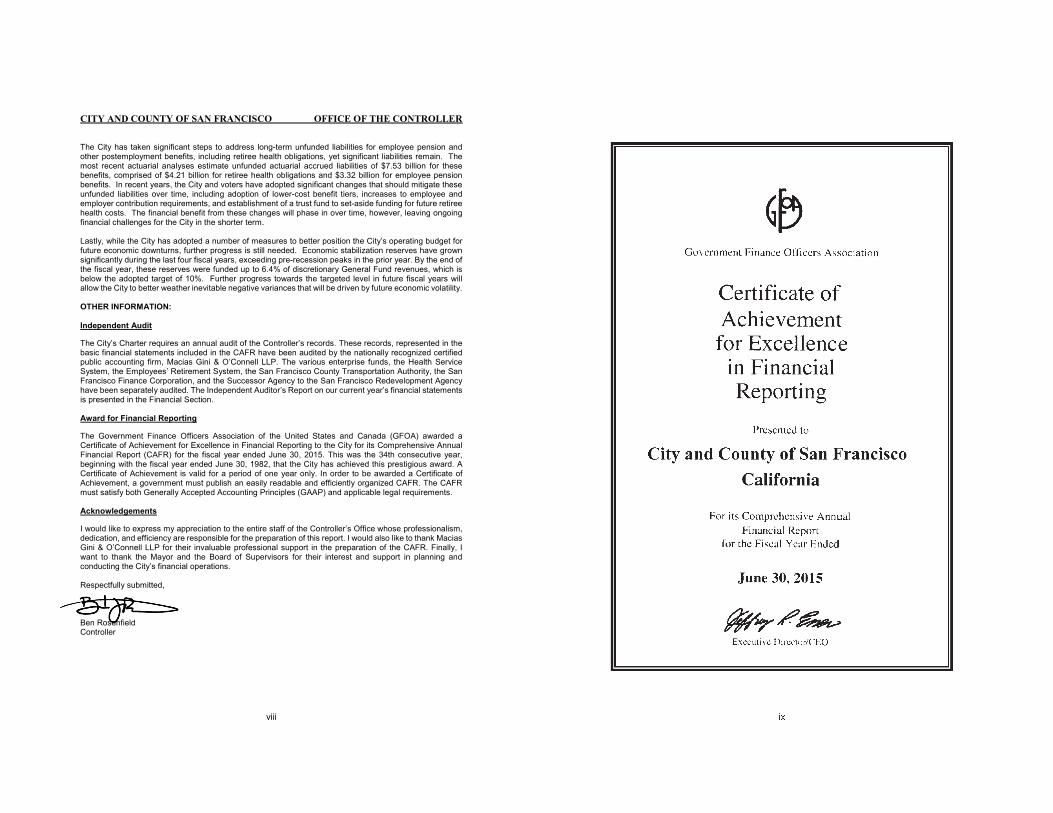
CITY AND COUNTY OF SAN FRANCISCO OFFICE OF THE CONTROLLER
viii
The City has taken significant steps to address long-term unfunded liabilities for employee pension and other postemployment benefits, including retiree health obligations, yet significant liabilities remain. The most recent actuarial analyses estimate unfunded actuarial accrued liabilities of $7.53 billion for these benefits, comprised of $4.21 billion for retiree health obligations and $3.32 billion for employee pension benefits. In recent years, the City and voters have adopted significant changes that should mitigate these unfunded liabilities over time, including adoption of lower-cost benefit tiers, increases to employee and employer contribution requirements, and establishment of a trust fund to set-aside funding for future retiree health costs. The financial benefit from these changes will phase in over time, however, leaving ongoing financial challenges for the City in the shorter term. Lastly, while the City has adopted a number of measures to better position the City’s operating budget for future economic downturns, further progress is still needed. Economic stabilization reserves have grown significantly during the last four fiscal years, exceeding pre-recession peaks in the prior year. By the end of the fiscal year, these reserves were funded up to 6.4% of discretionary General Fund revenues, which is below the adopted target of 10%. Further progress towards the targeted level in future fiscal years will allow the City to better weather inevitable negative variances that will be driven by future economic volatility. OTHER INFORMATION: Independent Audit The City’s Charter requires an annual audit of the Controller’s records. These records, represented in the basic financial statements included in the CAFR have been audited by the nationally recognized certified public accounting firm, Macias Gini & O’Connell LLP. The various enterprise funds, the Health Service System, the Employees’ Retirement System, the San Francisco County Transportation Authority, the San Francisco Finance Corporation, and the Successor Agency to the San Francisco Redevelopment Agency have been separately audited. The Independent Auditor’s Report on our current year’s financial statements is presented in the Financial Section. Award for Financial Reporting The Government Finance Officers Association of the United States and Canada (GFOA) awarded a Certificate of Achievement for Excellence in Financial Reporting to the City for its Comprehensive Annual Financial Report (CAFR) for the fiscal year ended June 30, 2015. This was the 34th consecutive year, beginning with the fiscal year ended June 30, 1982, that the City has achieved this prestigious award. A Certificate of Achievement is valid for a period of one year only. In order to be awarded a Certificate of Achievement, a government must publish an easily readable and efficiently organized CAFR. The CAFR must satisfy both Generally Accepted Accounting Principles (GAAP) and applicable legal requirements. Acknowledgements I would like to express my appreciation to the entire staff of the Controller’s Office whose professionalism, dedication, and efficiency are responsible for the preparation of this report. I would also like to thank Macias Gini & O’Connell LLP for their invaluable professional support in the preparation of the CAFR. Finally, I want to thank the Mayor and the Board of Supervisors for their interest and support in planning and conducting the City’s financial operations. Respectfully submitted, Ben Rosenfield Controller
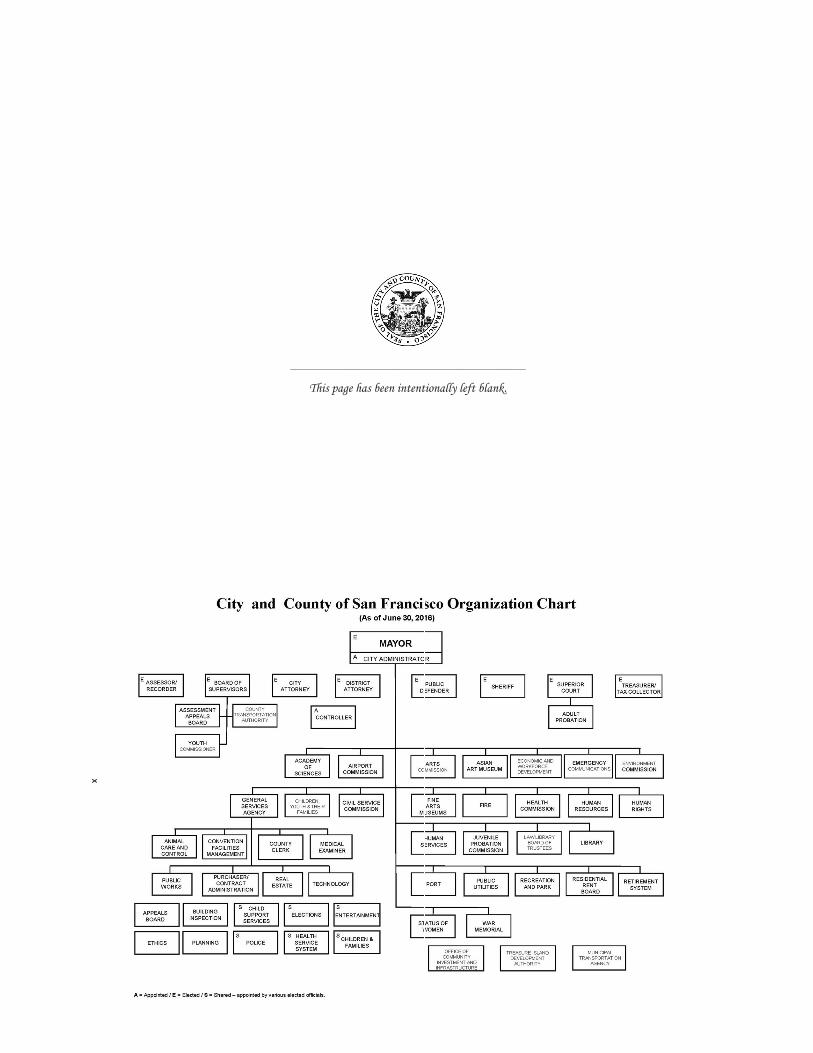
x
________________________________________________
This page has been intentionally left blank.
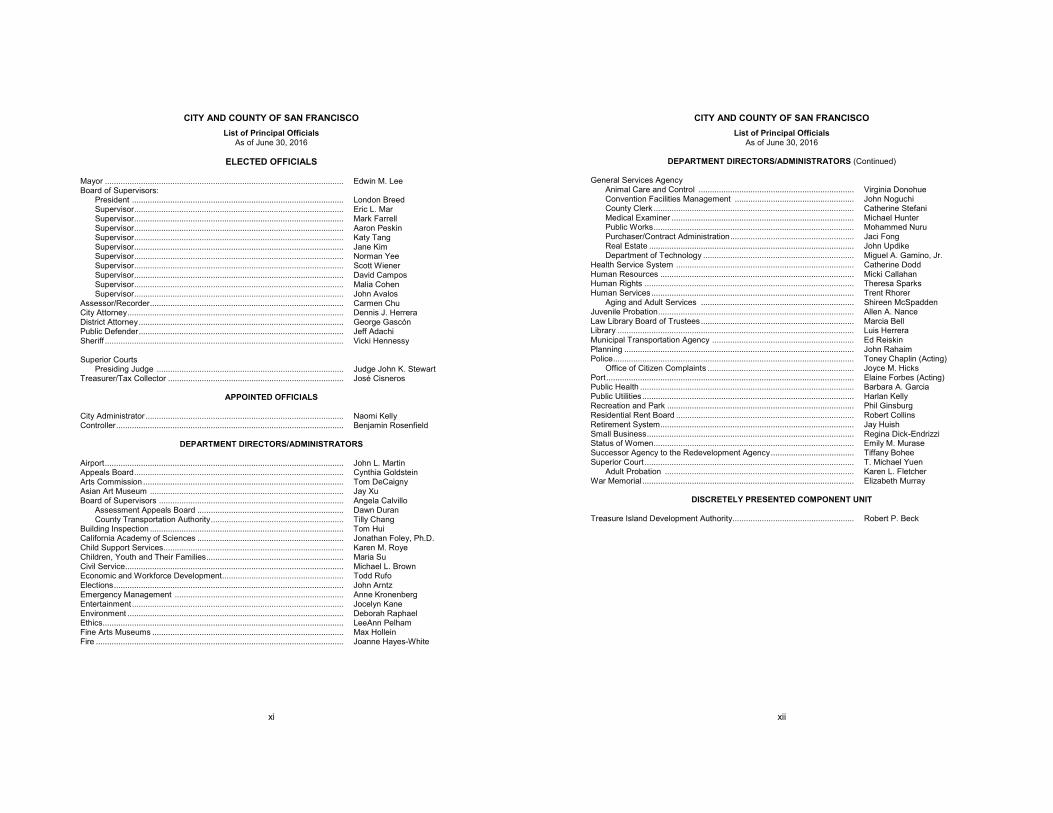
CITY AND COUNTY OF SAN FRANCISCO List of Principal Officials
As of June 30, 2016
xi
ELECTED OFFICIALS Mayor .......................................................................................................... Edwin M. Lee Board of Supervisors:
President .............................................................................................. London Breed Supervisor ............................................................................................. Eric L. Mar Supervisor ............................................................................................. Mark Farrell Supervisor ............................................................................................. Aaron Peskin Supervisor ............................................................................................. Katy Tang Supervisor ............................................................................................. Jane Kim Supervisor ............................................................................................. Norman Yee Supervisor ............................................................................................. Scott Wiener Supervisor ............................................................................................. David Campos Supervisor ............................................................................................. Malia Cohen Supervisor ............................................................................................. John Avalos
Assessor/Recorder ...................................................................................... Carmen Chu City Attorney ................................................................................................ Dennis J. Herrera District Attorney ........................................................................................... George Gascón Public Defender ........................................................................................... Jeff Adachi Sheriff .......................................................................................................... Vicki Hennessy Superior Courts
Presiding Judge ................................................................................... Judge John K. Stewart Treasurer/Tax Collector .............................................................................. José Cisneros
APPOINTED OFFICIALS City Administrator ........................................................................................ Naomi Kelly Controller ..................................................................................................... Benjamin Rosenfield
DEPARTMENT DIRECTORS/ADMINISTRATORS
Airport .......................................................................................................... John L. Martin Appeals Board ............................................................................................. Cynthia Goldstein Arts Commission ......................................................................................... Tom DeCaigny Asian Art Museum ...................................................................................... Jay Xu Board of Supervisors .................................................................................. Angela Calvillo
Assessment Appeals Board ................................................................. Dawn Duran County Transportation Authority ........................................................... Tilly Chang
Building Inspection ...................................................................................... Tom Hui California Academy of Sciences ................................................................. Jonathan Foley, Ph.D. Child Support Services ................................................................................ Karen M. Roye Children, Youth and Their Families ............................................................. Maria Su Civil Service................................................................................................. Michael L. Brown Economic and Workforce Development ...................................................... Todd Rufo Elections ...................................................................................................... John Arntz Emergency Management ........................................................................... Anne Kronenberg Entertainment .............................................................................................. Jocelyn Kane Environment ................................................................................................ Deborah Raphael Ethics ........................................................................................................... LeeAnn Pelham Fine Arts Museums ..................................................................................... Max Hollein Fire .............................................................................................................. Joanne Hayes-White
CITY AND COUNTY OF SAN FRANCISCO List of Principal Officials
As of June 30, 2016
xii
DEPARTMENT DIRECTORS/ADMINISTRATORS (Continued) General Services Agency
Animal Care and Control ..................................................................... Virginia Donohue Convention Facilities Management ..................................................... John Noguchi County Clerk ......................................................................................... Catherine Stefani Medical Examiner ................................................................................. Michael Hunter Public Works ......................................................................................... Mohammed Nuru Purchaser/Contract Administration ....................................................... Jaci Fong Real Estate ........................................................................................... John Updike Department of Technology ................................................................... Miguel A. Gamino, Jr.
Health Service System ............................................................................... Catherine Dodd Human Resources ...................................................................................... Micki Callahan Human Rights ............................................................................................. Theresa Sparks Human Services .......................................................................................... Trent Rhorer
Aging and Adult Services .................................................................... Shireen McSpadden Juvenile Probation ....................................................................................... Allen A. Nance Law Library Board of Trustees .................................................................... Marcia Bell Library ......................................................................................................... Luis Herrera Municipal Transportation Agency ............................................................... Ed Reiskin Planning ...................................................................................................... John Rahaim Police ........................................................................................................... Toney Chaplin (Acting)
Office of Citizen Complaints ................................................................. Joyce M. Hicks Port .............................................................................................................. Elaine Forbes (Acting) Public Health ............................................................................................... Barbara A. Garcia Public Utilities .............................................................................................. Harlan Kelly Recreation and Park ................................................................................... Phil Ginsburg Residential Rent Board ............................................................................... Robert Collins Retirement System ...................................................................................... Jay Huish Small Business ............................................................................................ Regina Dick-Endrizzi Status of Women ......................................................................................... Emily M. Murase Successor Agency to the Redevelopment Agency ..................................... Tiffany Bohee Superior Court ............................................................................................. T. Michael Yuen
Adult Probation .................................................................................... Karen L. Fletcher War Memorial .............................................................................................. Elizabeth Murray
DISCRETELY PRESENTED COMPONENT UNIT
Treasure Island Development Authority ...................................................... Robert P. Beck
________________________________________________
This page has been intentionally left blank.
Century City
Los Angeles
Newport Beach
Oakland
Sacramento
San
San
Walnut Creek
Woodland Hills
www.mgocpa.com Macias Gini & O’Connell LLP 315 Montgomery Street, Suite 806 San Francisco CA 94104
1
Independent Auditor’s Report
The Honorable Mayor Edwin Lee The Honorable Members of the Board of Supervisors City and County of San Francisco, California We have audited the accompanying financial statements of the governmental activities, the business-type activities, each major fund, and the aggregate remaining fund information and the discretely presented component unit, of the City and County of San Francisco (City), as of and for the year ended June 30, 2016, and the related notes to the financial statements, which collectively comprise the City’s basic financial statements as listed in the table of contents. Management’s Responsibility for the Financial Statements
Management is responsible for the preparation and fair presentation of these financial statements in accordance with accounting principles generally accepted in the United States of America; this includes the design, implementation, and maintenance of internal control relevant to the preparation and fair presentation of financial statements that are free from material misstatement, whether due to fraud or error. Auditor’s Responsibility
Our responsibility is to express opinions on these financial statements based on our audit. We did not audit the financial statements of the San Francisco County Transportation Authority, San Francisco International Airport (major fund), San Francisco Water Enterprise (major fund), Hetch Hetchy Water and Power (major fund), San Francisco Municipal Transportation Agency (major fund), San Francisco Wastewater Enterprise (major fund), and the Health Service System, which collectively represent the following percentages of the assets, net position/fund balances, and revenues/additions of the following opinion units.
Opinion Unit
Assets Net Position/
Fund Balances Revenues/
Additions Governmental activities 1.0% 3.1% 3.5% Business-type activities 89.9% 91.4% 73.0% Aggregate remaining fund information 0.8% 0.5% 14.6%
Those financial statements were audited by other auditors whose reports have been furnished to us, and our opinions, insofar as they relate to the amounts included for those entities, are based solely on the reports of the other auditors. We conducted our audit in accordance with auditing standards generally accepted in the United States of America. Those standards require that we plan and perform the audit to obtain reasonable assurance about whether the financial statements are free from material misstatement.
An audit involves performing procedures to obtain audit evidence about the amounts and disclosures in the financial statements. The procedures selected depend on the auditor’s judgment, including the assessment of the risks of material misstatement of the financial statements, whether due to fraud or error. In making those risk assessments, the auditor considers internal control relevant to the entity’s preparation and fair presentation of the financial statements in order to design audit procedures that are appropriate in the circumstances, but not for the purpose of expressing an opinion on the effectiveness of the entity’s internal control. Accordingly, we express no such opinion. An audit also includes evaluating the appropriateness of accounting policies used and the reasonableness of significant accounting estimates made by management, as well as evaluating the overall presentation of the financial statements.
We believe that the audit evidence we have obtained is sufficient and appropriate to provide a basis for our audit opinions. Opinions
In our opinion, based on our audit and the reports of other auditors, the financial statements referred to above present fairly, in all material respects, the respective financial position of the governmental activities, the business-type activities, each major fund, and the aggregate remaining fund information and the discretely presented component unit, of the City as of June 30, 2016, and the respective changes in financial position and, where applicable, cash flows thereof and the respective budgetary comparison for the General Fund for the year then ended in accordance with accounting principles generally accepted in the United States of America.
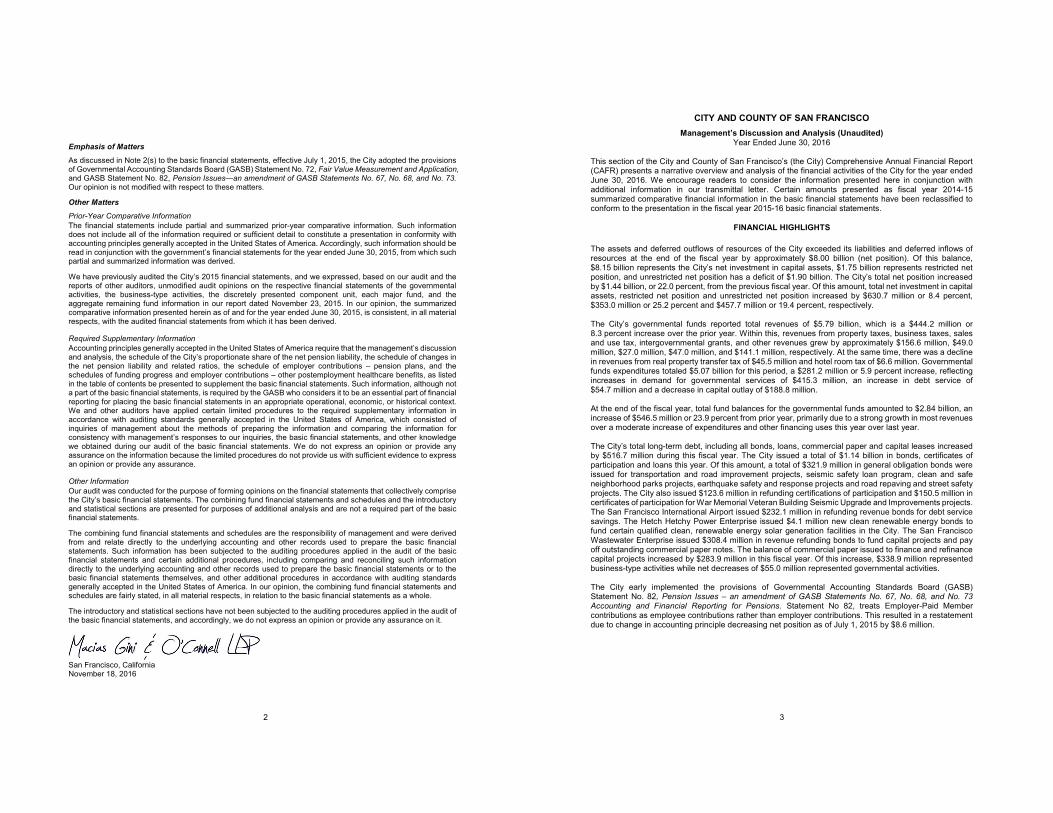
2
Emphasis of Matters
As discussed in Note 2(s) to the basic financial statements, effective July 1, 2015, the City adopted the provisions of Governmental Accounting Standards Board (GASB) Statement No. 72, Fair Value Measurement and Application, and GASB Statement No. 82, Pension Issues—an amendment of GASB Statements No. 67, No. 68, and No. 73. Our opinion is not modified with respect to these matters. Other Matters
Prior-Year Comparative Information The financial statements include partial and summarized prior-year comparative information. Such information does not include all of the information required or sufficient detail to constitute a presentation in conformity with accounting principles generally accepted in the United States of America. Accordingly, such information should be read in conjunction with the government’s financial statements for the year ended June 30, 2015, from which such partial and summarized information was derived.
We have previously audited the City’s 2015 financial statements, and we expressed, based on our audit and the reports of other auditors, unmodified audit opinions on the respective financial statements of the governmental activities, the business-type activities, the discretely presented component unit, each major fund, and the aggregate remaining fund information in our report dated November 23, 2015. In our opinion, the summarized comparative information presented herein as of and for the year ended June 30, 2015, is consistent, in all material respects, with the audited financial statements from which it has been derived. Required Supplementary Information Accounting principles generally accepted in the United States of America require that the management’s discussion and analysis, the schedule of the City’s proportionate share of the net pension liability, the schedule of changes in the net pension liability and related ratios, the schedule of employer contributions – pension plans, and the schedules of funding progress and employer contributions – other postemployment healthcare benefits, as listed in the table of contents be presented to supplement the basic financial statements. Such information, although not a part of the basic financial statements, is required by the GASB who considers it to be an essential part of financial reporting for placing the basic financial statements in an appropriate operational, economic, or historical context. We and other auditors have applied certain limited procedures to the required supplementary information in accordance with auditing standards generally accepted in the United States of America, which consisted of inquiries of management about the methods of preparing the information and comparing the information for consistency with management’s responses to our inquiries, the basic financial statements, and other knowledge we obtained during our audit of the basic financial statements. We do not express an opinion or provide any assurance on the information because the limited procedures do not provide us with sufficient evidence to express an opinion or provide any assurance. Other Information Our audit was conducted for the purpose of forming opinions on the financial statements that collectively comprise the City’s basic financial statements. The combining fund financial statements and schedules and the introductory and statistical sections are presented for purposes of additional analysis and are not a required part of the basic financial statements.
The combining fund financial statements and schedules are the responsibility of management and were derived from and relate directly to the underlying accounting and other records used to prepare the basic financial statements. Such information has been subjected to the auditing procedures applied in the audit of the basic financial statements and certain additional procedures, including comparing and reconciling such information directly to the underlying accounting and other records used to prepare the basic financial statements or to the basic financial statements themselves, and other additional procedures in accordance with auditing standards generally accepted in the United States of America. In our opinion, the combining fund financial statements and schedules are fairly stated, in all material respects, in relation to the basic financial statements as a whole.
The introductory and statistical sections have not been subjected to the auditing procedures applied in the audit of the basic financial statements, and accordingly, we do not express an opinion or provide any assurance on it.
San Francisco, California November 18, 2016
CITY AND COUNTY OF SAN FRANCISCO Management’s Discussion and Analysis (Unaudited)
Year Ended June 30, 2016
3
This section of the City and County of San Francisco’s (the City) Comprehensive Annual Financial Report (CAFR) presents a narrative overview and analysis of the financial activities of the City for the year ended June 30, 2016. We encourage readers to consider the information presented here in conjunction with additional information in our transmittal letter. Certain amounts presented as fiscal year 2014-15 summarized comparative financial information in the basic financial statements have been reclassified to conform to the presentation in the fiscal year 2015-16 basic financial statements.
FINANCIAL HIGHLIGHTS The assets and deferred outflows of resources of the City exceeded its liabilities and deferred inflows of resources at the end of the fiscal year by approximately $8.00 billion (net position). Of this balance, $8.15 billion represents the City’s net investment in capital assets, $1.75 billion represents restricted net position, and unrestricted net position has a deficit of $1.90 billion. The City’s total net position increased by $1.44 billion, or 22.0 percent, from the previous fiscal year. Of this amount, total net investment in capital assets, restricted net position and unrestricted net position increased by $630.7 million or 8.4 percent, $353.0 million or 25.2 percent and $457.7 million or 19.4 percent, respectively. The City’s governmental funds reported total revenues of $5.79 billion, which is a $444.2 million or 8.3 percent increase over the prior year. Within this, revenues from property taxes, business taxes, sales and use tax, intergovernmental grants, and other revenues grew by approximately $156.6 million, $49.0 million, $27.0 million, $47.0 million, and $141.1 million, respectively. At the same time, there was a decline in revenues from real property transfer tax of $45.5 million and hotel room tax of $6.6 million. Governmental funds expenditures totaled $5.07 billion for this period, a $281.2 million or 5.9 percent increase, reflecting increases in demand for governmental services of $415.3 million, an increase in debt service of $54.7 million and a decrease in capital outlay of $188.8 million. At the end of the fiscal year, total fund balances for the governmental funds amounted to $2.84 billion, an increase of $546.5 million or 23.9 percent from prior year, primarily due to a strong growth in most revenues over a moderate increase of expenditures and other financing uses this year over last year. The City’s total long-term debt, including all bonds, loans, commercial paper and capital leases increased by $516.7 million during this fiscal year. The City issued a total of $1.14 billion in bonds, certificates of participation and loans this year. Of this amount, a total of $321.9 million in general obligation bonds were issued for transportation and road improvement projects, seismic safety loan program, clean and safe neighborhood parks projects, earthquake safety and response projects and road repaving and street safety projects. The City also issued $123.6 million in refunding certifications of participation and $150.5 million in certificates of participation for War Memorial Veteran Building Seismic Upgrade and Improvements projects. The San Francisco International Airport issued $232.1 million in refunding revenue bonds for debt service savings. The Hetch Hetchy Power Enterprise issued $4.1 million new clean renewable energy bonds to fund certain qualified clean, renewable energy solar generation facilities in the City. The San Francisco Wastewater Enterprise issued $308.4 million in revenue refunding bonds to fund capital projects and pay off outstanding commercial paper notes. The balance of commercial paper issued to finance and refinance capital projects increased by $283.9 million in this fiscal year. Of this increase, $338.9 million represented business-type activities while net decreases of $55.0 million represented governmental activities. The City early implemented the provisions of Governmental Accounting Standards Board (GASB) Statement No. 82, Pension Issues – an amendment of GASB Statements No. 67, No. 68, and No. 73 Accounting and Financial Reporting for Pensions. Statement No 82, treats Employer-Paid Member contributions as employee contributions rather than employer contributions. This resulted in a restatement due to change in accounting principle decreasing net position as of July 1, 2015 by $8.6 million.
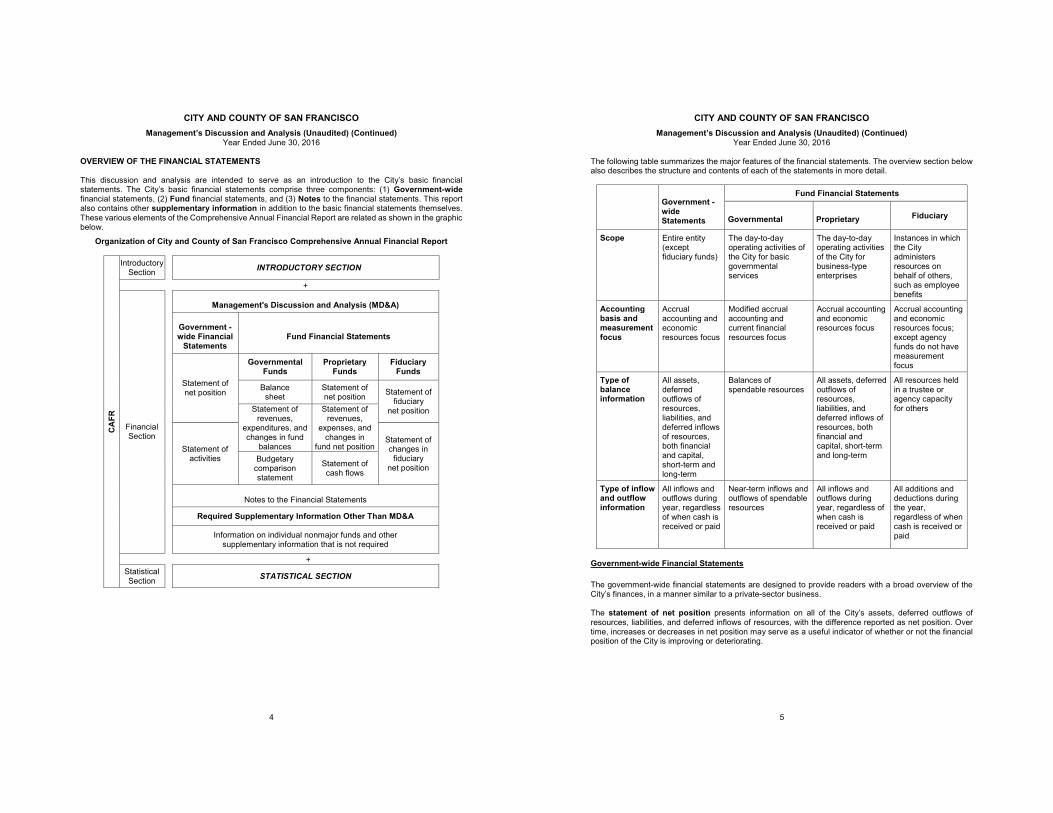
CITY AND COUNTY OF SAN FRANCISCO Management’s Discussion and Analysis (Unaudited) (Continued)
Year Ended June 30, 2016
4
OVERVIEW OF THE FINANCIAL STATEMENTS This discussion and analysis are intended to serve as an introduction to the City’s basic financial statements. The City’s basic financial statements comprise three components: (1) Government-wide financial statements, (2) Fund financial statements, and (3) Notes to the financial statements. This report also contains other supplementary information in addition to the basic financial statements themselves. These various elements of the Comprehensive Annual Financial Report are related as shown in the graphic below.
Organization of City and County of San Francisco Comprehensive Annual Financial Report
CA
FR
Introductory Section
INTRODUCTORY SECTION
+
Financial Section
Management's Discussion and Analysis (MD&A)
Government - wide Financial
Statements Fund Financial Statements
Statement of net position
Governmental Funds
Proprietary Funds
Fiduciary Funds
Balance
sheet Statement of net position Statement of
fiduciary net position
Statement of
revenues, expenditures, and changes in fund
balances
Statement of revenues,
expenses, and changes in
fund net position Statement of activities
Statement of changes in
fiduciary net position
Budgetary comparison statement
Statement of cash flows
Notes to the Financial Statements
Required Supplementary Information Other Than MD&A
Information on individual nonmajor funds and other supplementary information that is not required
+ Statistical Section
STATISTICAL SECTION
CITY AND COUNTY OF SAN FRANCISCO Management’s Discussion and Analysis (Unaudited) (Continued)
Year Ended June 30, 2016
5
The following table summarizes the major features of the financial statements. The overview section below also describes the structure and contents of each of the statements in more detail.
Government - wide Statements
Fund Financial Statements
Governmental Proprietary Fiduciary
Scope Entire entity (except fiduciary funds)
The day-to-day operating activities of the City for basic governmental services
The day-to-day operating activities of the City for business-type enterprises
Instances in which the City administers resources on behalf of others, such as employee benefits
Accounting basis and measurement focus
Accrual accounting and economic resources focus
Modified accrual accounting and current financial resources focus
Accrual accounting and economic resources focus
Accrual accounting and economic resources focus; except agency funds do not have measurement focus
Type of balance information
All assets, deferred outflows of resources, liabilities, and deferred inflows of resources, both financial and capital, short-term and long-term
Balances of spendable resources
All assets, deferred outflows of resources, liabilities, and deferred inflows of resources, both financial and capital, short-term and long-term
All resources held in a trustee or agency capacity for others
Type of inflow and outflow information
All inflows and outflows during year, regardless of when cash is received or paid
Near-term inflows and outflows of spendable resources
All inflows and outflows during year, regardless of when cash is received or paid
All additions and deductions during the year, regardless of when cash is received or paid
Government-wide Financial Statements The government-wide financial statements are designed to provide readers with a broad overview of the City’s finances, in a manner similar to a private-sector business. The statement of net position presents information on all of the City’s assets, deferred outflows of resources, liabilities, and deferred inflows of resources, with the difference reported as net position. Over time, increases or decreases in net position may serve as a useful indicator of whether or not the financial position of the City is improving or deteriorating.
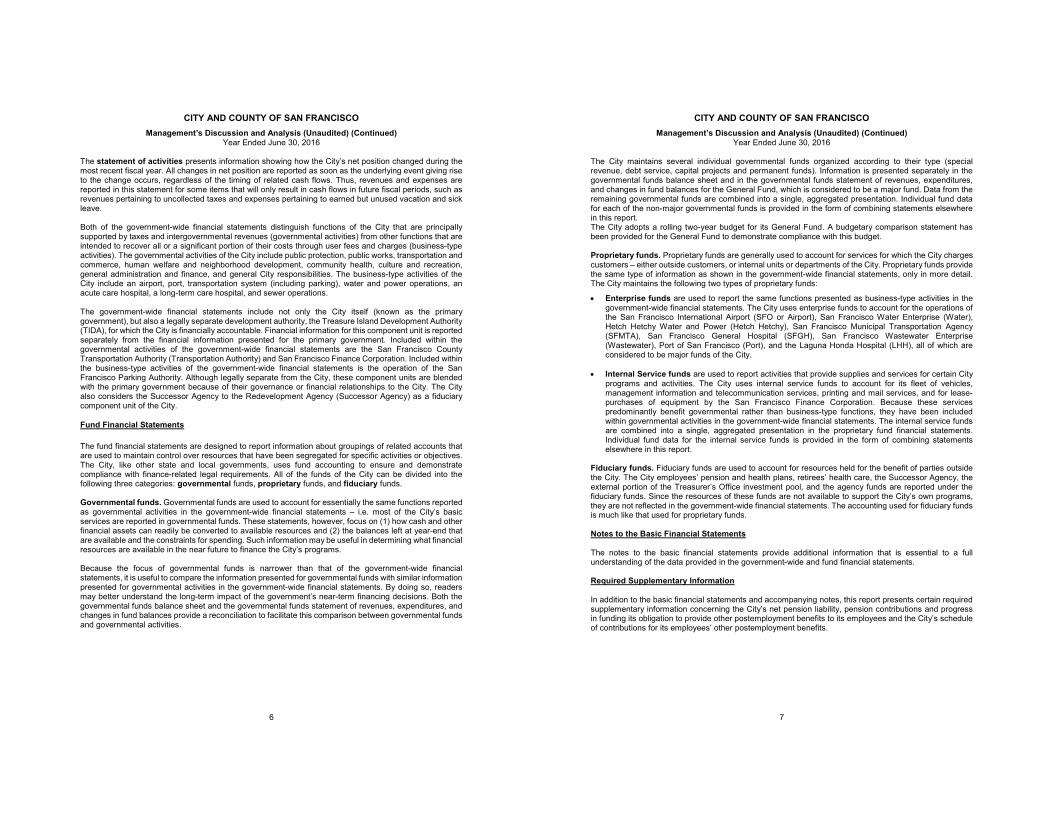
CITY AND COUNTY OF SAN FRANCISCO Management’s Discussion and Analysis (Unaudited) (Continued)
Year Ended June 30, 2016
6
The statement of activities presents information showing how the City’s net position changed during the most recent fiscal year. All changes in net position are reported as soon as the underlying event giving rise to the change occurs, regardless of the timing of related cash flows. Thus, revenues and expenses are reported in this statement for some items that will only result in cash flows in future fiscal periods, such as revenues pertaining to uncollected taxes and expenses pertaining to earned but unused vacation and sick leave. Both of the government-wide financial statements distinguish functions of the City that are principally supported by taxes and intergovernmental revenues (governmental activities) from other functions that are intended to recover all or a significant portion of their costs through user fees and charges (business-type activities). The governmental activities of the City include public protection, public works, transportation and commerce, human welfare and neighborhood development, community health, culture and recreation, general administration and finance, and general City responsibilities. The business-type activities of the City include an airport, port, transportation system (including parking), water and power operations, an acute care hospital, a long-term care hospital, and sewer operations. The government-wide financial statements include not only the City itself (known as the primary government), but also a legally separate development authority, the Treasure Island Development Authority (TIDA), for which the City is financially accountable. Financial information for this component unit is reported separately from the financial information presented for the primary government. Included within the governmental activities of the government-wide financial statements are the San Francisco County Transportation Authority (Transportation Authority) and San Francisco Finance Corporation. Included within the business-type activities of the government-wide financial statements is the operation of the San Francisco Parking Authority. Although legally separate from the City, these component units are blended with the primary government because of their governance or financial relationships to the City. The City also considers the Successor Agency to the Redevelopment Agency (Successor Agency) as a fiduciary component unit of the City.
Fund Financial Statements The fund financial statements are designed to report information about groupings of related accounts that are used to maintain control over resources that have been segregated for specific activities or objectives. The City, like other state and local governments, uses fund accounting to ensure and demonstrate compliance with finance-related legal requirements. All of the funds of the City can be divided into the following three categories: governmental funds, proprietary funds, and fiduciary funds. Governmental funds. Governmental funds are used to account for essentially the same functions reported as governmental activities in the government-wide financial statements – i.e. most of the City’s basic services are reported in governmental funds. These statements, however, focus on (1) how cash and other financial assets can readily be converted to available resources and (2) the balances left at year-end that are available and the constraints for spending. Such information may be useful in determining what financial resources are available in the near future to finance the City’s programs. Because the focus of governmental funds is narrower than that of the government-wide financial statements, it is useful to compare the information presented for governmental funds with similar information presented for governmental activities in the government-wide financial statements. By doing so, readers may better understand the long-term impact of the government’s near-term financing decisions. Both the governmental funds balance sheet and the governmental funds statement of revenues, expenditures, and changes in fund balances provide a reconciliation to facilitate this comparison between governmental funds and governmental activities.
CITY AND COUNTY OF SAN FRANCISCO Management’s Discussion and Analysis (Unaudited) (Continued)
Year Ended June 30, 2016
7
The City maintains several individual governmental funds organized according to their type (special revenue, debt service, capital projects and permanent funds). Information is presented separately in the governmental funds balance sheet and in the governmental funds statement of revenues, expenditures, and changes in fund balances for the General Fund, which is considered to be a major fund. Data from the remaining governmental funds are combined into a single, aggregated presentation. Individual fund data for each of the non-major governmental funds is provided in the form of combining statements elsewhere in this report. The City adopts a rolling two-year budget for its General Fund. A budgetary comparison statement has been provided for the General Fund to demonstrate compliance with this budget. Proprietary funds. Proprietary funds are generally used to account for services for which the City charges customers – either outside customers, or internal units or departments of the City. Proprietary funds provide the same type of information as shown in the government-wide financial statements, only in more detail. The City maintains the following two types of proprietary funds:
Enterprise funds are used to report the same functions presented as business-type activities in the government-wide financial statements. The City uses enterprise funds to account for the operations of the San Francisco International Airport (SFO or Airport), San Francisco Water Enterprise (Water), Hetch Hetchy Water and Power (Hetch Hetchy), San Francisco Municipal Transportation Agency (SFMTA), San Francisco General Hospital (SFGH), San Francisco Wastewater Enterprise (Wastewater), Port of San Francisco (Port), and the Laguna Honda Hospital (LHH), all of which are considered to be major funds of the City.
Internal Service funds are used to report activities that provide supplies and services for certain City
programs and activities. The City uses internal service funds to account for its fleet of vehicles, management information and telecommunication services, printing and mail services, and for lease-purchases of equipment by the San Francisco Finance Corporation. Because these services predominantly benefit governmental rather than business-type functions, they have been included within governmental activities in the government-wide financial statements. The internal service funds are combined into a single, aggregated presentation in the proprietary fund financial statements. Individual fund data for the internal service funds is provided in the form of combining statements elsewhere in this report.
Fiduciary funds. Fiduciary funds are used to account for resources held for the benefit of parties outside the City. The City employees’ pension and health plans, retirees’ health care, the Successor Agency, the external portion of the Treasurer’s Office investment pool, and the agency funds are reported under the fiduciary funds. Since the resources of these funds are not available to support the City’s own programs, they are not reflected in the government-wide financial statements. The accounting used for fiduciary funds is much like that used for proprietary funds. Notes to the Basic Financial Statements The notes to the basic financial statements provide additional information that is essential to a full understanding of the data provided in the government-wide and fund financial statements. Required Supplementary Information In addition to the basic financial statements and accompanying notes, this report presents certain required supplementary information concerning the City’s net pension liability, pension contributions and progress in funding its obligation to provide other postemployment benefits to its employees and the City’s schedule of contributions for its employees’ other postemployment benefits.
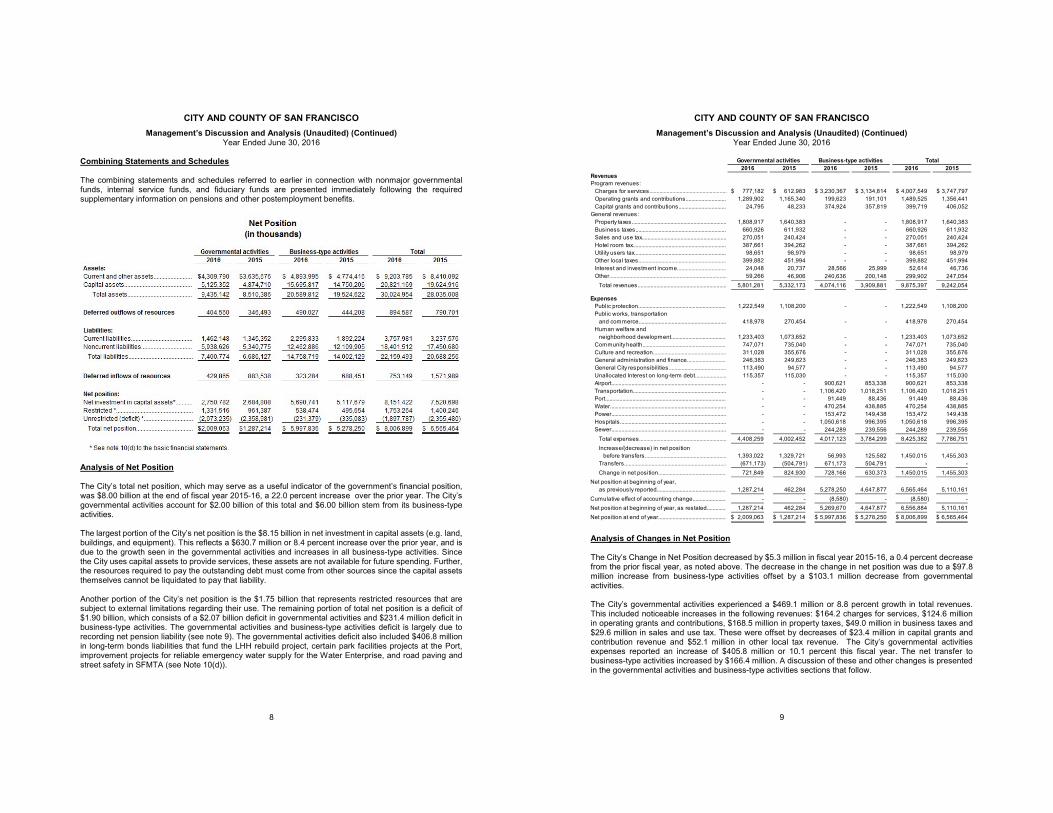
CITY AND COUNTY OF SAN FRANCISCO Management’s Discussion and Analysis (Unaudited) (Continued)
Year Ended June 30, 2016
8
Combining Statements and Schedules The combining statements and schedules referred to earlier in connection with nonmajor governmental funds, internal service funds, and fiduciary funds are presented immediately following the required supplementary information on pensions and other postemployment benefits.
Analysis of Net Position The City’s total net position, which may serve as a useful indicator of the government’s financial position, was $8.00 billion at the end of fiscal year 2015-16, a 22.0 percent increase over the prior year. The City’s governmental activities account for $2.00 billion of this total and $6.00 billion stem from its business-type activities. The largest portion of the City’s net position is the $8.15 billion in net investment in capital assets (e.g. land, buildings, and equipment). This reflects a $630.7 million or 8.4 percent increase over the prior year, and is due to the growth seen in the governmental activities and increases in all business-type activities. Since the City uses capital assets to provide services, these assets are not available for future spending. Further, the resources required to pay the outstanding debt must come from other sources since the capital assets themselves cannot be liquidated to pay that liability. Another portion of the City’s net position is the $1.75 billion that represents restricted resources that are subject to external limitations regarding their use. The remaining portion of total net position is a deficit of $1.90 billion, which consists of a $2.07 billion deficit in governmental activities and $231.4 million deficit in business-type activities. The governmental activities and business-type activities deficit is largely due to recording net pension liability (see note 9). The governmental activities deficit also included $406.8 million in long-term bonds liabilities that fund the LHH rebuild project, certain park facilities projects at the Port, improvement projects for reliable emergency water supply for the Water Enterprise, and road paving and street safety in SFMTA (see Note 10(d)).
CITY AND COUNTY OF SAN FRANCISCO Management’s Discussion and Analysis (Unaudited) (Continued)
Year Ended June 30, 2016
9
Analysis of Changes in Net Position The City’s Change in Net Position decreased by $5.3 million in fiscal year 2015-16, a 0.4 percent decrease from the prior fiscal year, as noted above. The decrease in the change in net position was due to a $97.8 million increase from business-type activities offset by a $103.1 million decrease from governmental activities. The City’s governmental activities experienced a $469.1 million or 8.8 percent growth in total revenues. This included noticeable increases in the following revenues: $164.2 charges for services, $124.6 million in operating grants and contributions, $168.5 million in property taxes, $49.0 million in business taxes and $29.6 million in sales and use tax. These were offset by decreases of $23.4 million in capital grants and contribution revenue and $52.1 million in other local tax revenue. The City’s governmental activities expenses reported an increase of $405.8 million or 10.1 percent this fiscal year. The net transfer to business-type activities increased by $166.4 million. A discussion of these and other changes is presented in the governmental activities and business-type activities sections that follow.
Governmental activities Business-type activities Total2016 2015 2016 2015 2016 2015
RevenuesProgram revenues:
Charges for services...................................................... 777,182$ 612,983$ 3,230,367$ 3,134,814$ 4,007,549$ 3,747,797$ Operating grants and contributions............................ 1,289,902 1,165,340 199,623 191,101 1,489,525 1,356,441 Capital grants and contributions................................. 24,795 48,233 374,924 357,819 399,719 406,052
General revenues:Property taxes.................................................................. 1,808,917 1,640,383 - - 1,808,917 1,640,383 Business taxes............................................................... 660,926 611,932 - - 660,926 611,932 Sales and use tax........................................................... 270,051 240,424 - - 270,051 240,424 Hotel room tax................................................................. 387,661 394,262 - - 387,661 394,262 Utility users tax................................................................ 98,651 98,979 - - 98,651 98,979 Other local taxes............................................................. 399,882 451,994 - - 399,882 451,994 Interest and investment income.................................. 24,048 20,737 28,566 25,999 52,614 46,736 Other.................................................................................. 59,266 46,906 240,636 200,148 299,902 247,054
Total revenues.............................................................. 5,801,281 5,332,173 4,074,116 3,909,881 9,875,397 9,242,054
ExpensesPublic protection............................................................. 1,222,549 1,108,200 - - 1,222,549 1,108,200 Public works, transportation
and commerce............................................................. 418,978 270,454 - - 418,978 270,454 Human welfare and
neighborhood development...................................... 1,233,403 1,073,652 - - 1,233,403 1,073,652 Community health.......................................................... 747,071 735,040 - - 747,071 735,040 Culture and recreation................................................... 311,028 355,676 - - 311,028 355,676 General administration and finance........................... 246,383 249,823 - - 246,383 249,823 General City responsibilities........................................ 113,490 94,577 - - 113,490 94,577 Unallocated Interest on long-term debt...................... 115,357 115,030 - - 115,357 115,030 Airport................................................................................ - - 900,621 853,338 900,621 853,338 Transportation................................................................. - - 1,106,420 1,018,251 1,106,420 1,018,251 Port.................................................................................... - - 91,449 88,436 91,449 88,436 Water................................................................................. - - 470,254 438,885 470,254 438,885 Power................................................................................ - - 153,472 149,438 153,472 149,438 Hospitals.......................................................................... - - 1,050,618 996,395 1,050,618 996,395 Sewer................................................................................ - - 244,289 239,556 244,289 239,556
Total expenses............................................................. 4,408,259 4,002,452 4,017,123 3,784,299 8,425,382 7,786,751 Increase/(decrease) in net position
before transfers......................................................... 1,393,022 1,329,721 56,993 125,582 1,450,015 1,455,303 Transfers....................................................................... (671,173) (504,791) 671,173 504,791 - - Change in net position............................................... 721,849 824,930 728,166 630,373 1,450,015 1,455,303
Net position at beginning of year,as previously reported................................................ 1,287,214 462,284 5,278,250 4,647,877 6,565,464 5,110,161
Cumulative effect of accounting change....................... - - (8,580) - (8,580) - Net position at beginning of year, as restated............. 1,287,214 462,284 5,269,670 4,647,877 6,556,884 5,110,161 Net position at end of year............................................... 2,009,063$ 1,287,214$ 5,997,836$ 5,278,250$ 8,006,899$ 6,565,464$
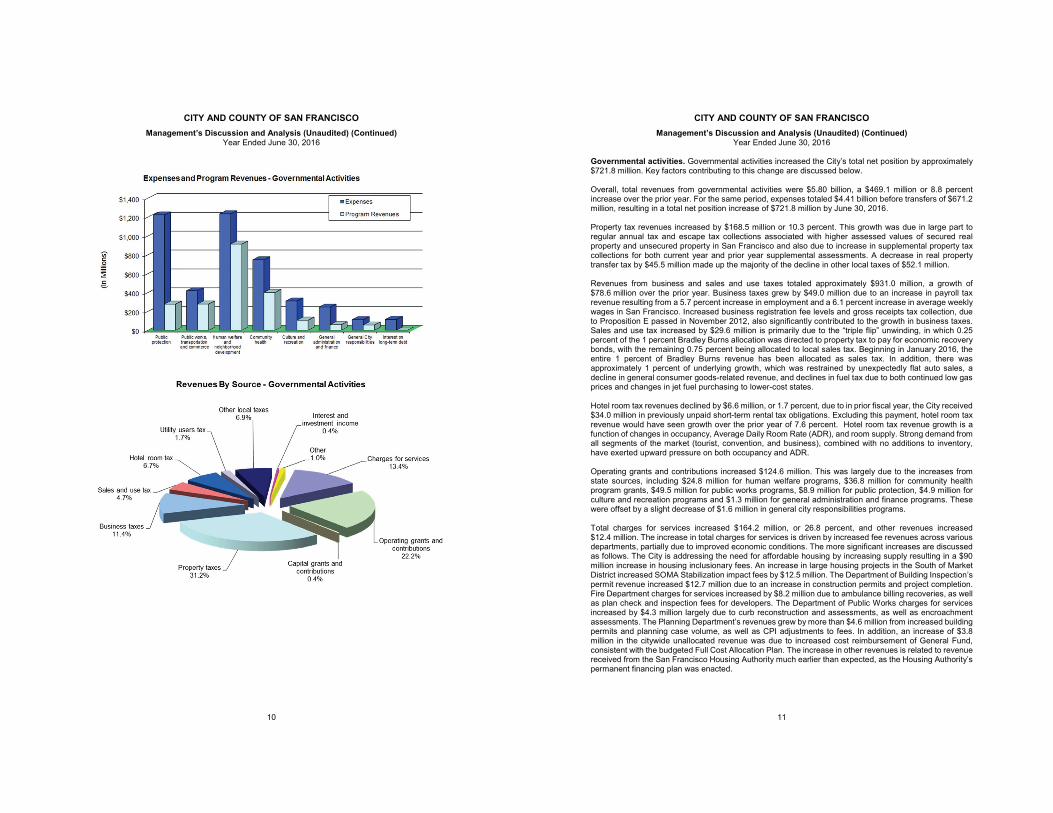
CITY AND COUNTY OF SAN FRANCISCO Management’s Discussion and Analysis (Unaudited) (Continued)
Year Ended June 30, 2016
10
CITY AND COUNTY OF SAN FRANCISCO Management’s Discussion and Analysis (Unaudited) (Continued)
Year Ended June 30, 2016
11
Governmental activities. Governmental activities increased the City’s total net position by approximately $721.8 million. Key factors contributing to this change are discussed below. Overall, total revenues from governmental activities were $5.80 billion, a $469.1 million or 8.8 percent increase over the prior year. For the same period, expenses totaled $4.41 billion before transfers of $671.2 million, resulting in a total net position increase of $721.8 million by June 30, 2016. Property tax revenues increased by $168.5 million or 10.3 percent. This growth was due in large part to regular annual tax and escape tax collections associated with higher assessed values of secured real property and unsecured property in San Francisco and also due to increase in supplemental property tax collections for both current year and prior year supplemental assessments. A decrease in real property transfer tax by $45.5 million made up the majority of the decline in other local taxes of $52.1 million. Revenues from business and sales and use taxes totaled approximately $931.0 million, a growth of $78.6 million over the prior year. Business taxes grew by $49.0 million due to an increase in payroll tax revenue resulting from a 5.7 percent increase in employment and a 6.1 percent increase in average weekly wages in San Francisco. Increased business registration fee levels and gross receipts tax collection, due to Proposition E passed in November 2012, also significantly contributed to the growth in business taxes. Sales and use tax increased by $29.6 million is primarily due to the “triple flip” unwinding, in which 0.25 percent of the 1 percent Bradley Burns allocation was directed to property tax to pay for economic recovery bonds, with the remaining 0.75 percent being allocated to local sales tax. Beginning in January 2016, the entire 1 percent of Bradley Burns revenue has been allocated as sales tax. In addition, there was approximately 1 percent of underlying growth, which was restrained by unexpectedly flat auto sales, a decline in general consumer goods-related revenue, and declines in fuel tax due to both continued low gas prices and changes in jet fuel purchasing to lower-cost states. Hotel room tax revenues declined by $6.6 million, or 1.7 percent, due to in prior fiscal year, the City received $34.0 million in previously unpaid short-term rental tax obligations. Excluding this payment, hotel room tax revenue would have seen growth over the prior year of 7.6 percent. Hotel room tax revenue growth is a function of changes in occupancy, Average Daily Room Rate (ADR), and room supply. Strong demand from all segments of the market (tourist, convention, and business), combined with no additions to inventory, have exerted upward pressure on both occupancy and ADR. Operating grants and contributions increased $124.6 million. This was largely due to the increases from state sources, including $24.8 million for human welfare programs, $36.8 million for community health program grants, $49.5 million for public works programs, $8.9 million for public protection, $4.9 million for culture and recreation programs and $1.3 million for general administration and finance programs. These were offset by a slight decrease of $1.6 million in general city responsibilities programs. Total charges for services increased $164.2 million, or 26.8 percent, and other revenues increased $12.4 million. The increase in total charges for services is driven by increased fee revenues across various departments, partially due to improved economic conditions. The more significant increases are discussed as follows. The City is addressing the need for affordable housing by increasing supply resulting in a $90 million increase in housing inclusionary fees. An increase in large housing projects in the South of Market District increased SOMA Stabilization impact fees by $12.5 million. The Department of Building Inspection’s permit revenue increased $12.7 million due to an increase in construction permits and project completion. Fire Department charges for services increased by $8.2 million due to ambulance billing recoveries, as well as plan check and inspection fees for developers. The Department of Public Works charges for services increased by $4.3 million largely due to curb reconstruction and assessments, as well as encroachment assessments. The Planning Department’s revenues grew by more than $4.6 million from increased building permits and planning case volume, as well as CPI adjustments to fees. In addition, an increase of $3.8 million in the citywide unallocated revenue was due to increased cost reimbursement of General Fund, consistent with the budgeted Full Cost Allocation Plan. The increase in other revenues is related to revenue received from the San Francisco Housing Authority much earlier than expected, as the Housing Authority’s permanent financing plan was enacted.
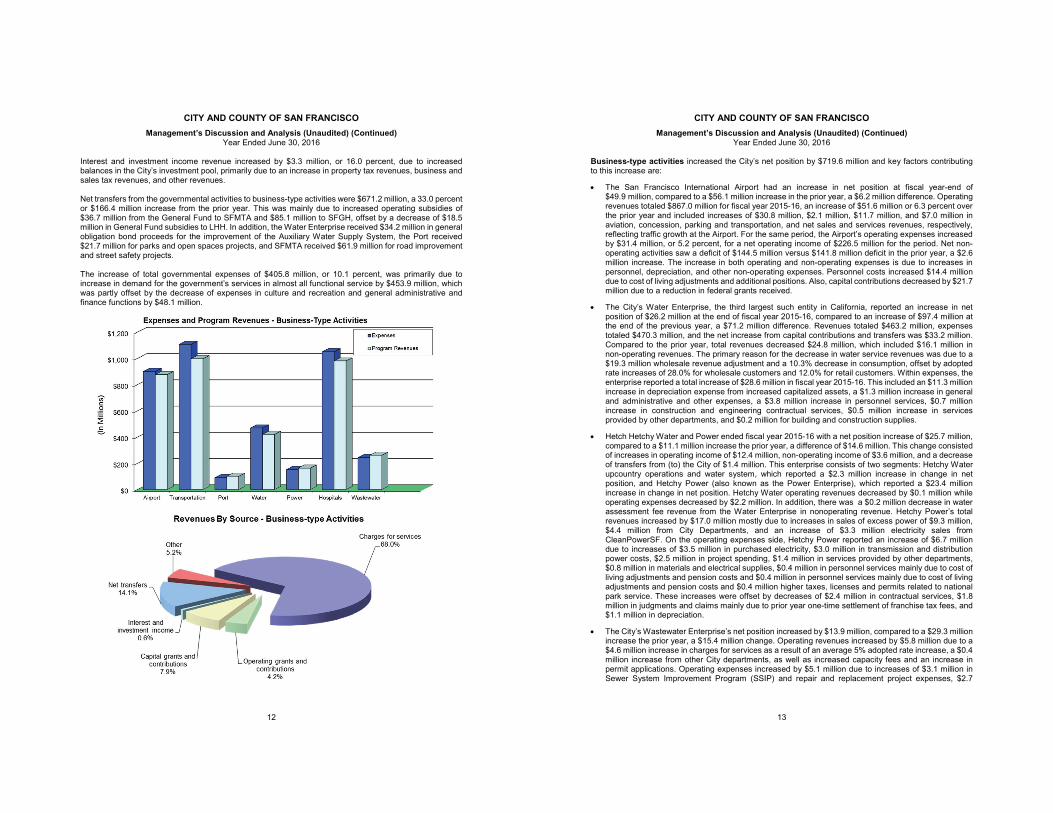
CITY AND COUNTY OF SAN FRANCISCO Management’s Discussion and Analysis (Unaudited) (Continued)
Year Ended June 30, 2016
12
Interest and investment income revenue increased by $3.3 million, or 16.0 percent, due to increased balances in the City’s investment pool, primarily due to an increase in property tax revenues, business and sales tax revenues, and other revenues. Net transfers from the governmental activities to business-type activities were $671.2 million, a 33.0 percent or $166.4 million increase from the prior year. This was mainly due to increased operating subsidies of $36.7 million from the General Fund to SFMTA and $85.1 million to SFGH, offset by a decrease of $18.5 million in General Fund subsidies to LHH. In addition, the Water Enterprise received $34.2 million in general obligation bond proceeds for the improvement of the Auxiliary Water Supply System, the Port received $21.7 million for parks and open spaces projects, and SFMTA received $61.9 million for road improvement and street safety projects. The increase of total governmental expenses of $405.8 million, or 10.1 percent, was primarily due to increase in demand for the government’s services in almost all functional service by $453.9 million, which was partly offset by the decrease of expenses in culture and recreation and general administrative and finance functions by $48.1 million.
CITY AND COUNTY OF SAN FRANCISCO Management’s Discussion and Analysis (Unaudited) (Continued)
Year Ended June 30, 2016
13
Business-type activities increased the City’s net position by $719.6 million and key factors contributing to this increase are:
The San Francisco International Airport had an increase in net position at fiscal year-end of $49.9 million, compared to a $56.1 million increase in the prior year, a $6.2 million difference. Operating revenues totaled $867.0 million for fiscal year 2015-16, an increase of $51.6 million or 6.3 percent over the prior year and included increases of $30.8 million, $2.1 million, $11.7 million, and $7.0 million in aviation, concession, parking and transportation, and net sales and services revenues, respectively, reflecting traffic growth at the Airport. For the same period, the Airport’s operating expenses increased by $31.4 million, or 5.2 percent, for a net operating income of $226.5 million for the period. Net non-operating activities saw a deficit of $144.5 million versus $141.8 million deficit in the prior year, a $2.6 million increase. The increase in both operating and non-operating expenses is due to increases in personnel, depreciation, and other non-operating expenses. Personnel costs increased $14.4 million due to cost of living adjustments and additional positions. Also, capital contributions decreased by $21.7 million due to a reduction in federal grants received.
The City’s Water Enterprise, the third largest such entity in California, reported an increase in net position of $26.2 million at the end of fiscal year 2015-16, compared to an increase of $97.4 million at the end of the previous year, a $71.2 million difference. Revenues totaled $463.2 million, expenses totaled $470.3 million, and the net increase from capital contributions and transfers was $33.2 million. Compared to the prior year, total revenues decreased $24.8 million, which included $16.1 million in non-operating revenues. The primary reason for the decrease in water service revenues was due to a $19.3 million wholesale revenue adjustment and a 10.3% decrease in consumption, offset by adopted rate increases of 28.0% for wholesale customers and 12.0% for retail customers. Within expenses, the enterprise reported a total increase of $28.6 million in fiscal year 2015-16. This included an $11.3 million increase in depreciation expense from increased capitalized assets, a $1.3 million increase in general and administrative and other expenses, a $3.8 million increase in personnel services, $0.7 million increase in construction and engineering contractual services, $0.5 million increase in services provided by other departments, and $0.2 million for building and construction supplies.
Hetch Hetchy Water and Power ended fiscal year 2015-16 with a net position increase of $25.7 million, compared to a $11.1 million increase the prior year, a difference of $14.6 million. This change consisted of increases in operating income of $12.4 million, non-operating income of $3.6 million, and a decrease of transfers from (to) the City of $1.4 million. This enterprise consists of two segments: Hetchy Water upcountry operations and water system, which reported a $2.3 million increase in change in net position, and Hetchy Power (also known as the Power Enterprise), which reported a $23.4 million increase in change in net position. Hetchy Water operating revenues decreased by $0.1 million while operating expenses decreased by $2.2 million. In addition, there was a $0.2 million decrease in water assessment fee revenue from the Water Enterprise in nonoperating revenue. Hetchy Power’s total revenues increased by $17.0 million mostly due to increases in sales of excess power of $9.3 million, $4.4 million from City Departments, and an increase of $3.3 million electricity sales from CleanPowerSF. On the operating expenses side, Hetchy Power reported an increase of $6.7 million due to increases of $3.5 million in purchased electricity, $3.0 million in transmission and distribution power costs, $2.5 million in project spending, $1.4 million in services provided by other departments, $0.8 million in materials and electrical supplies, $0.4 million in personnel services mainly due to cost of living adjustments and pension costs and $0.4 million in personnel services mainly due to cost of living adjustments and pension costs and $0.4 million higher taxes, licenses and permits related to national park service. These increases were offset by decreases of $2.4 million in contractual services, $1.8 million in judgments and claims mainly due to prior year one-time settlement of franchise tax fees, and $1.1 million in depreciation.
The City’s Wastewater Enterprise’s net position increased by $13.9 million, compared to a $29.3 million increase the prior year, a $15.4 million change. Operating revenues increased by $5.8 million due to a $4.6 million increase in charges for services as a result of an average 5% adopted rate increase, a $0.4 million increase from other City departments, as well as increased capacity fees and an increase in permit applications. Operating expenses increased by $5.1 million due to increases of $3.1 million in Sewer System Improvement Program (SSIP) and repair and replacement project expenses, $2.7
CITY AND COUNTY OF SAN FRANCISCO Management’s Discussion and Analysis (Unaudited) (Continued)
Year Ended June 30, 2016
14
million in personnel services mainly due to cost of living adjustments, health and pension costs, $2.1 million in pollution remediation obligations, $1.2 million in higher building and equipment maintenance services, $0.5 in depreciation expense, and $0.4 million in materials and supplies, which were offset by decreases of $4.9 million in general and administrative expenses mainly due to lower judgment and claims liability based on actuarial estimate. Transfers out increased by $16.3 million due to a transfer to the General Fund in order to secure jurisdiction of the City owned property adjacent to the Southeast Water Pollution Control Plant. This was offset by a transfer in of $0.5 million and a net nonoperating expense of $0.3 million.
The Port ended fiscal year 2015-16 with a net position increase of $35.1 million, compared to a $11.8 million increase in the previous year, a $23.3 million difference. The Port is responsible for seven and one-half miles of waterfront property and its revenue is derived primarily from property rentals to commercial and industrial enterprises and a diverse mix of maritime operations. In fiscal year 2015-16, operating revenues increased $4.4 million and included a net increase in property rentals of $1.8 million and an increase in cruise revenues of $2.7 million. Operating expenses increased $3.1 million over the prior year. This was due in part to a $2.0 million increase in the cost of services from other departments and a net increase of $1.5 million in personnel and other expenses. The above changes were offset by an increase of $0.4 million in interest expense.
The SFMTA had an increase in net position of $478.3 million for fiscal year 2015-16 before cumulative effect of accounting change, compared to an increase of $294.7 million in the prior year, a $183.6 million change. SFMTA’s total operating revenues were $495.3 million, while total operating expenses reached $1.10 billion. Operating revenues decreased by $4.3 million compared to the prior year and is mainly due to lower passenger fare revenue of $8.0 million, a slight decrease in rental income of $0.8 million, and $3.6 million in other revenues which consists primarily of taxi medallion revenue. These decreases were offset by an increase of $7.8 million in parking permit, fines, and penalties, and an increase in charges for services of $0.3 million. Operating expenses increased by $88.8 million primarily due to personnel costs. Net nonoperating revenue increased by $39.8 million mainly due to transit impact developer fees. An increase of capital contributions of $91.1 million is due to an increase in capital expenditures incurred and billable to grantors mostly related to Central Subway, revenue vehicles procurement, and other large projects. Net transfers in increased by $145.8 million due to a $36.7 million increase in transfers from the City’s General Fund mainly for operating subsidies and an increase of $99.7 million in transfers from nonmajor governmental funds and a decrease in transfers out of $9.4 million. Transfers from nonmajor governmental funds included $123.8 million for capital activities and street improvement projects. In fiscal year 2015-16, the City elected early implementation of GASB Statement No. 82, resulting in a restatement of SFMTA’s 2014-15 results, reducing the beginning net position in the amount of $8.6 million.
LHH, the City’s skilled nursing care hospital, had an increase in net position of $21.6 million at the end of fiscal year 2015-16, compared to an increase of $6.6 million at the end of the previous year, a $15.0 million difference. The LHH’s loss before capital contributions and transfers for the year was $22.7 million versus a loss of $61.5 million for the prior year. This change of $38.8 million was mostly due to a $48.8 million increase in operating revenues, a $8.6 million increase in operating expenses, and a $1.3 million decrease in other non-operating revenues. This was offset by a $23.9 million decrease in net transfers from the City this fiscal year.
SFGH, the City’s acute care hospital, ended fiscal year 2015-16 with a net position increase of $77.6 million, compared to a $123.4 million increase the prior year, a $45.8 million change. This was due to decreased capital contributions of $5.0 million compared to prior year’s capital contributions of $57.4 million. However, SFGH incurred an operating loss of $89.6 million, which was a $66.0 million increase from the prior year. This was due to a $21.2 million decrease in operating revenues, largely related to net patient services revenues; and increases in operating expenses mostly due to $26.2 million in personal services, $7.2 million in contractual services, and $10.9 million in depreciation and amortization.
CITY AND COUNTY OF SAN FRANCISCO Management’s Discussion and Analysis (Unaudited) (Continued)
Year Ended June 30, 2016
15
FINANCIAL ANALYSIS OF THE CITY’S FUNDS
As noted earlier, the City uses fund accounting to ensure and demonstrate compliance with finance-related legal requirements. Governmental Funds The focus of the City’s governmental funds statements is to provide information on near-term inflows, outflows, and balances of resources available for future spending. Such information is useful in assessing the City’s financing requirements. In particular, unrestricted fund balance may serve as a useful measure of a government’s net resources available for spending at the end of the fiscal year. Types of governmental funds reported by the City include the General Fund, Special Revenue Funds, Debt Service Funds, Capital Project Funds, and the Permanent Fund. At the end of fiscal year 2015-16, the City governmental funds reported combined fund balances of $2.84 billion, an increase of $546.5 million or 23.9 percent over the prior year. Of the total fund balances, $945.7 million is assigned and $138.0 million is unassigned. The total of $1.08 million or 38.2 percent of the total fund balances constitutes the fund balances that are accessible to meet the City’s needs. Within these fund balance classifications, the General Fund had an assigned fund balance of $879.6 million. The remainder of the governmental fund balances includes $0.1 million nonspendable for items that are not expected to be converted to cash such as inventories and long-term loans, $1.56 billion restricted for programs at various levels and $187.2 million committed for other reserves. The General Fund is the chief operating fund of the City. As a measure of liquidity, both the sum of assigned and unassigned fund balances and total fund balance can be compared to total fund expenditures. As of the end of the fiscal year, assigned and unassigned fund balances totaled $1.12 billion while total fund balance reached $1.43 billion. Combined assigned and unassigned fund balances represent 33.7 percent of total expenditures, while total fund balance represents 43.0 percent of total expenditures. For the year, the General Fund’s total revenues exceeded expenditures by $1.03 billion, before transfers and other items of $748.4 million, resulting in total fund balance increasing by $284.0 million. Overall, the significant growth in revenues, particularly in property taxes, business taxes, sales and uses tax and charges for services were offset by an increased rate of expenditure growth due to growing demand for services and personnel costs across City functions and resulted in an increased fund balance this fiscal year. Proprietary Funds The City’s proprietary fund statements provide the same type of information found in the business-type activities section of the government-wide financial statements but with some additional detail. At the end of fiscal year 2015-16, the unrestricted net position for the proprietary funds was as follows: Airport: $36.0 million, Water Enterprise: $26.5 million, Hetch Hetchy Water and Power: $141.1 million, Wastewater Enterprise: $38.0 million, and the Port: $57.1 million. In addition, SFMTA, San Francisco General Hospital, and Laguna Honda Hospital had deficits in unrestricted net position of $3.4 million, $341.4 million, and $185.5 million, respectively.
CITY AND COUNTY OF SAN FRANCISCO Management’s Discussion and Analysis (Unaudited) (Continued)
Year Ended June 30, 2016
16
The following table shows actual revenues, expenses and the results of operations for the current fiscal year in the City’s proprietary funds (in thousands). This shows that the total net position for these funds increased by approximately $728.2 million due to the current year financial activities. Reasons for this change are discussed in the previous section on the City’s business-type activities.
Fiduciary Funds The City maintains fiduciary funds for the assets of the San Francisco Employees’ Retirement System, Health Service System and Retiree Health Care Trust, and manages the investment of monies held in trust to benefit public service employees. At the end of fiscal year 2015-16, the net position of the Retirement System, Health Service System and Retiree Health Care Trust combined totaled $20.34 billion, representing a $244.7 million decrease from the prior year, and 1.2 percent change. The decrease is a result of benefit payments greater than contributions offset by net investment income. The Private-Purpose Trust Fund accounts for the Successor Agency, which had a net deficit of $377.0 million at year’s end. This 11.4 percent, or $48.4 million, decrease in the net deficit is due to increases in developer payments and the sale of the Jessie Square parking garage. The Investment Trust Fund’s net position was $743.9 million at year’s end, and the 37.8 percent increase represents the excess of contributions over distribution to external participants. General Fund Budgetary Highlights The City’s final budget differs from the original budget in that it contains carry-forward appropriations for various programs and projects, and supplemental appropriations approved during the fiscal year. During the year, actual revenues and other resources were $138.2 million higher than the final budget. The City realized $101.3 million, $24.6 million, $17.4 million, $15.4 million, $13.6 million, and $5.1 million more revenue than budgeted in property taxes, business taxes, other resources, charges for services, other grants and subventions, and utility users tax, respectively. These increases were partly offset by reductions of $28.9 million, $7.2 million, $5.4 million, and $5.0 million, in transfers from other funds, real property transfer tax, health and welfare realignment, and sales and use tax, respectively. Differences between the final budget and the actual (budgetary basis) expenditures resulted in $158.5 million in expenditure savings. Major factors include: $85.3 million in savings from the Department of Public Health due to delays in contracting and hiring
for vacant positions creating additional salary and fringe benefit savings, and prior year encumbrance closeouts.
$36.5 million in savings from the Human Services Agency, due largely to operating savings in salaries and benefits from delays in hiring, contract savings, reductions in aid assistance and aid payments resulting from a mid-year change in budgeting, and lower than expected caseload levels.
Operating Revenues
Operating Expenses
Operating Income (Loss)
Non-Operating Revenues (Expense)
Capital Contributions
and Others
Interfund Transfers,
Net
Change In Net
Position
Airport.............................................. 866,991$ 640,473$ 226,518$ (144,463)$ 10,424$ (42,542)$ 49,937$ Water............................................... 419,516 314,786 104,730 (111,771) - 33,244 26,203
Hetch Hetchy................................... 164,736 148,495 16,241 8,759 - 680 25,680 Municipal Transportation Agency.... 495,296 1,100,234 (604,938) 206,529 357,871 518,795 478,257
General Hospital............................... 717,053 806,694 (89,641) 53,520 5,000 108,681 77,560 Wastew ater Enterprise.................... 261,775 221,553 40,222 (10,309) - (16,025) 13,888
Port................................................... 99,733 86,793 12,940 (3,594) 1,629 24,100 35,075 Laguna Honda Hospital.................... 205,267 235,841 (30,574) 7,900 - 44,240 21,566
Total.............................................. 3,230,367$ 3,554,869$ (324,502)$ 6,571$ 374,924$ 671,173$ 728,166$
CITY AND COUNTY OF SAN FRANCISCO Management’s Discussion and Analysis (Unaudited) (Continued)
Year Ended June 30, 2016
17
$11.8 million savings in contracts and salary and benefits mainly in General Services Administration, Treasurer/Tax Collector, Assessor/Recorder, City Planning, City Attorney, Board of Supervisors, Elections, and other departments in general administration and finance.
$10.1 million in salary and benefit savings mainly in Juvenile Probation, Adult Probation, Sheriff, Emergency Communications and other departments in public protection.
The remaining lower than budgeted expenditures are savings from public works, transportation and commerce, and culture and recreation.
The net effect of substantial revenue increases, savings in expenditures and reduction in reserve deposits was a budgetary fund balance available for subsequent year appropriation of $435.2 million at the end of fiscal year 2015-16. The City’s fiscal year 2016-17 and 2017-18 Adopted Original Budget assumed an available balance of $363.3 million fully appropriated in fiscal year 2016-17 and fiscal year 2017-18 leaving $11.9 million available for future appropriations. (See also Note 4 to the Basic Financial Statements for additional budgetary fund balance details). Capital Assets and Debt Administration Capital Assets The City’s capital assets for its governmental and business-type activities as of June 30, 2016, increased by $1.20 billion, 6.1 percent, to $20.82 billion (net of accumulated depreciation). Capital assets include land, buildings and improvements, machinery and equipment, park facilities, roads, streets, bridges, and intangible assets. Governmental activities contributed $250.6 million or 21.0 percent to this total increase while $945.6 million or 79.0 percent was from business-type activities. Details are shown in the table below.
Major capital asset events during the current fiscal year included the following: Under governmental activities, net capital assets increased by $250.6 million or 5.1 percent. The City
issued $713.4 million in Commercial Paper to provide financing for various capital projects, including the purchase of capital equipment for San Francisco General Hospital, the Veterans Building seismic upgrades, and the Moscone Center expansion. Approximately $1.1 billion in construction in progress work was substantially completed and capitalized as facilities and improvement and infrastructure. The completed projects include capitalization of approximately $848.0 million for the new San Francisco General Hospital Rebuild Project and approximately $135.8 million for the seismic upgrade of the Veterans building. The remaining completed projects include public works, intangible assets, and traffic signal projects.
2016 2015 2016 2015 2016 2015Land.................................... 334,261$ 299,911$ 217,441$ 217,441$ 551,702$ 517,352$ Construction in progress........ 456,093 1,245,064 3,120,461 3,104,166 3,576,554 4,349,230 Facilities and improvements... 3,372,183 2,544,116 10,484,335 9,716,578 13,856,518 12,260,694 Machinery and equipment...... 201,333 76,202 1,112,860 926,979 1,314,193 1,003,181 Infrastructure......................... 686,365 659,502 701,029 719,240 1,387,394 1,378,742 Intangible asset....................… 75,117 49,915 59,691 65,802 134,808 115,717 Total……………………… 5,125,352$ 4,874,710$ 15,695,817$ 14,750,206$ 20,821,169$ 19,624,916$
Business-type Governmental Activities Activities Total
CITY AND COUNTY OF SAN FRANCISCO Management’s Discussion and Analysis (Unaudited) (Continued)
Year Ended June 30, 2016
18
The Water Enterprise’s net capital assets increased by $245.2 million or 5.3 percent, reflecting an increase in construction and capital improvement activities. Major additions to construction work in progress included Calaveras Dam Replacement, Regional Groundwater Storage and Recovery, the Harry Tracy Water Treatment Plan Long-Term Improvements, Auxiliary Water Supply System, San Francisco Groundwater Supply, Peninsula Pipeline Seismic Upgrade, Irvington Tunnel Alternatives, and other upgrade and improvement programs. As of June 30, 2016, the Water Enterprise is 90% through construction of its multi-billion dollar, multi-year program to upgrade the Hetch Hetchy Regional and Local Water Systems. The program consists of 35 local projects within San Francisco and 52 regional projects spread over seven different counties from the Sierra foothills to San Francisco. As of June 30, 2016, 34 local projects are completed and the target completion date is December 2016. For regional projects, 36 are completed and the expected completion date is December 2019. The Water System Improvement Program (WSIP) delivers capital improvements that enhance the Water Enterprise’s ability to provide reliable, affordable, high quality drinking water to its customers.
SFMTA’s net capital assets increased by $400.7 million or 14.6% mainly from construction in progress
of $212.7 million for the new Central Subway Project, Central Control, rail replacement, transit lane and street improvement projects. Equipment costs of $283.1 million was incurred during the fiscal year for the procurement of new light rail vehicles, trolley and motor buses to replace the old fleet, upgrade of communications system, traffic signals, radio replacement, and various information systems development. Building cost totaling $36.2 million was incurred in fiscal year 2016 for Islais Creek facility improvement, transit operator convenience stations, elevator and escalator modernization, and upgrade of garage facilities in various locations.
Laguna Honda Hospital’s net capital assets decreased by $15.0 million or 2.8 percent due primarily to
depreciation expense being greater than asset additions. Laguna Honda Hospital provides 780 resident beds in three state of the art buildings on Laguna Honda’s 62-acre campus. The 500,000 square foot facility received silver certification by the U.S. Green Building Council’s Leadership in Energy and Environmental Design (LEED) program, becoming the first green-certified hospital in California.
SFGH’s net capital assets increased by $61.0 million or 49.1 percent primarily due to the increases in
the acquisition of capital assets for the hospital. As of June 30, 2016, General Obligation Bonds in the amount of $887.4 million have been sold to fund the hospital rebuild. During the period of July 2015 - June 2016, construction of the new hospital was completed and reached substantial completion on August 18, 2015. Patients were moved into the new hospital on May 21, 2016. The General Obligation Bonds are accounted for as governmental activity and transactions are accounted for in the City's Governmental Capital Projects Funds. Upon completion of the new facility, it was capitalized and recorded under governmental activities.
The Wastewater Enterprise net capital assets reported an increase of $126.9 million or 6.6 percent mainly in completed construction activities. These include the Northshore to Channel Force Main, Ocean Side Treatment Plant Improvements, Southeast Treatment Plant Oxygen Generate Plant Replacement, and other capital projects throughout the system. The San Francisco Public Utilities Commission is underway with the initial phase of the Sewer System Improvement Program, a multi-year and multi-billion dollar investment to upgrade the aging sewer system to provide a reliable, sustainable, and seismically safe sewer system. The $7.0 billion program includes three phases over the span of next 20 years.
Hetch Hetchy’s net of accumulated depreciation and amortization, increased by $30.9 million or 8.3%
to $404.2 million primarily due to additions of facilities, improvements, machinery, and equipment for Moccasin Facilities Upgrade, Transmission and Distribution System, Lower Cherry Aqueduct, Streetlight Replacement, Server Building projects, and San Joaquin Pipeline Rehabilitation. The Hetchy System Improvement Program is a long-term capital program from 2012 to 2025 and includes projects, varying in scope and complexity, to address necessary work on water transmission, hydroelectric generation and power transmission facilities in Tuolumne, Mariposa, Stanislaus, San Joaquin and Alameda counties, essential to continued delivery of both water and power.
CITY AND COUNTY OF SAN FRANCISCO Management’s Discussion and Analysis (Unaudited) (Continued)
Year Ended June 30, 2016
19
The Airport’s net capital assets increased $109.2 million or 2.8 percent primarily due to the capitalization of capital improvement project costs. The Airport has five- and ten-year Capital Plans to build new facilities, improve existing facilities, renovate buildings, repair or replace infrastructure, preserve assets, enhance safety and security, develop systems functionality, and perform needed maintenance. Significant projects in design or under construction in fiscal year 2017 include the Terminal 1 (T1) Redevelopment Program which includes the redevelopment of Boarding Area B, the expansion of the T1 Central Area, and a new baggage handling system, in addition to the Terminal 3 (T3) Redevelopment Program which creates a unified T3 checkpoint and constructs a new secure connector and office block. Other notable ongoing projects include the on-airport hotel, a new consolidated administration campus building, a second long-term parking garage, and a new industrial waste treatment plant.
The Port’s net capital assets decreased by $13.3 million or 3.0 percent due to capitalization and
depreciation of capital improvements in 2015, including the James R. Herman Cruise Terminal at Pier 27. Pier 35 Building and Roof project provided for the upgrade of two elevators and essential water intrusion work (roofing, flashing, window and door weather stripping repairs) in several areas in the Pier 35 bulkhead and the shed building. Pier 49, Wharf J1 Under-Pier Sewer Replacement project’s scope included the replacement of all existing under-pier gravity main and branch sewer lines serving six Port tenant restaurants at Pier 49 Wharf J1. The security improvements through the installation and deployment of closed-circuit television (CCTV) and integrated access control/intrusion detection systems at key Port facilities continue in phases, largely based on priority and available funding. The opening of the Bayview Gateway was celebrated with a ribbon-cutting ceremony on September 18, 2015. It is a one-acre passive green open space at the intersection of Cargo Way and Third Street near Pier 90.
At the end of the year, the City’s business-type activities had approximately $1.20 billion in commitments for various capital projects. Of this, Water Enterprise had an estimated $283.3 million, SFMTA had $567.2 million, Wastewater had $190.7 million, Airport had $75.8 million, Hetch Hetchy had $63.6 million, Port had $15.1 million, Laguna Honda Hospital had $0.7 million and the General Hospital had $4.2 million. In addition, there was approximately $88.0 million reserved for encumbrances in capital project funds for the general government projects. For government-wide financial statement presentation, all depreciable capital assets were depreciated from acquisition date to the end of the current fiscal year. Governmental fund financial statements record capital asset purchases as expenditures. Additional information about the City’s capital assets can be found in Note 7 to the Basic Financial Statements. Debt Administration At the end of the June 30, 2016, the City had total long-term and commercial paper debt outstanding of $14.39 billion. Of this amount, $2.22 billion is general obligation bonds secured by ad valorem property taxes without limitation as to rate or amount upon all property subject to taxation by the City and $12.17 billion is revenue bonds, commercial papers, certificates of participation and other debts of the City secured solely by specified revenue sources. As noted previously, the City’s total long-term debt including all bonds, loans, commercial paper notes and capital leases increased by $516.7 million or 3.7 percent during the fiscal year.
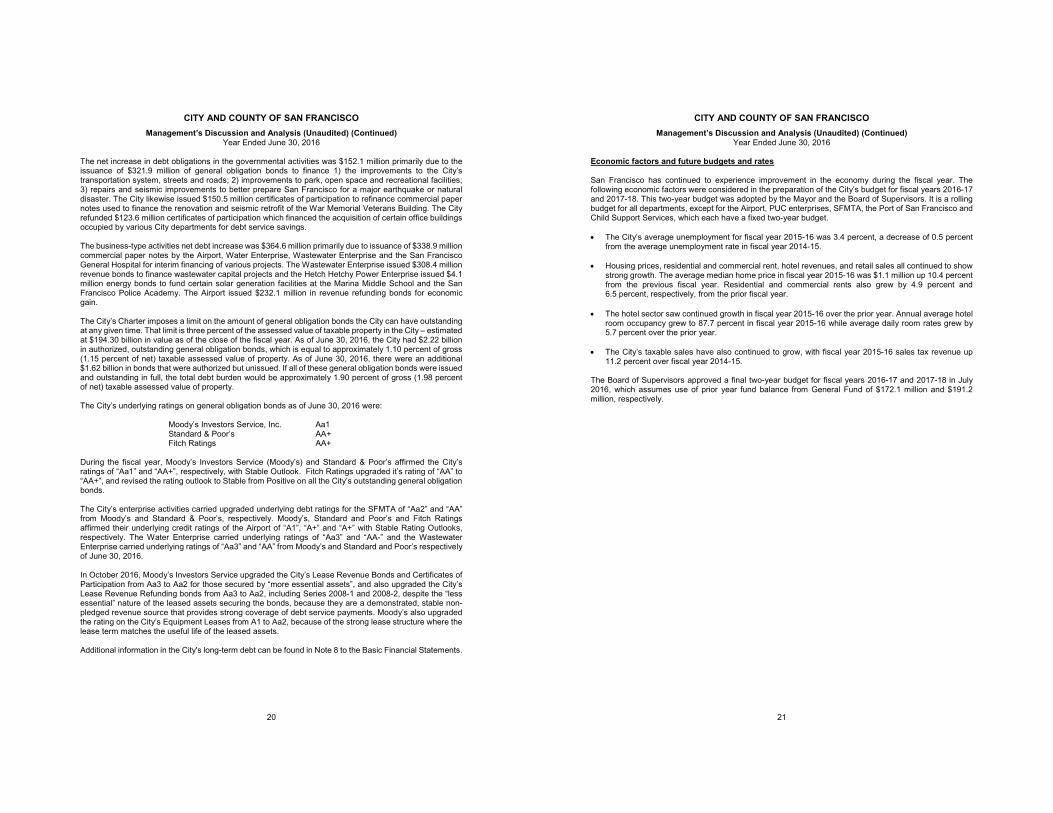
CITY AND COUNTY OF SAN FRANCISCO Management’s Discussion and Analysis (Unaudited) (Continued)
Year Ended June 30, 2016
20
The net increase in debt obligations in the governmental activities was $152.1 million primarily due to the issuance of $321.9 million of general obligation bonds to finance 1) the improvements to the City’s transportation system, streets and roads; 2) improvements to park, open space and recreational facilities; 3) repairs and seismic improvements to better prepare San Francisco for a major earthquake or natural disaster. The City likewise issued $150.5 million certificates of participation to refinance commercial paper notes used to finance the renovation and seismic retrofit of the War Memorial Veterans Building. The City refunded $123.6 million certificates of participation which financed the acquisition of certain office buildings occupied by various City departments for debt service savings. The business-type activities net debt increase was $364.6 million primarily due to issuance of $338.9 million commercial paper notes by the Airport, Water Enterprise, Wastewater Enterprise and the San Francisco General Hospital for interim financing of various projects. The Wastewater Enterprise issued $308.4 million revenue bonds to finance wastewater capital projects and the Hetch Hetchy Power Enterprise issued $4.1 million energy bonds to fund certain solar generation facilities at the Marina Middle School and the San Francisco Police Academy. The Airport issued $232.1 million in revenue refunding bonds for economic gain. The City’s Charter imposes a limit on the amount of general obligation bonds the City can have outstanding at any given time. That limit is three percent of the assessed value of taxable property in the City – estimated at $194.30 billion in value as of the close of the fiscal year. As of June 30, 2016, the City had $2.22 billion in authorized, outstanding general obligation bonds, which is equal to approximately 1.10 percent of gross (1.15 percent of net) taxable assessed value of property. As of June 30, 2016, there were an additional $1.62 billion in bonds that were authorized but unissued. If all of these general obligation bonds were issued and outstanding in full, the total debt burden would be approximately 1.90 percent of gross (1.98 percent of net) taxable assessed value of property. The City’s underlying ratings on general obligation bonds as of June 30, 2016 were:
Moody’s Investors Service, Inc. Aa1 Standard & Poor’s AA+ Fitch Ratings AA+
During the fiscal year, Moody’s Investors Service (Moody’s) and Standard & Poor’s affirmed the City’s ratings of “Aa1” and “AA+”, respectively, with Stable Outlook. Fitch Ratings upgraded it’s rating of “AA” to “AA+”, and revised the rating outlook to Stable from Positive on all the City’s outstanding general obligation bonds. The City’s enterprise activities carried upgraded underlying debt ratings for the SFMTA of “Aa2” and “AA” from Moody’s and Standard & Poor’s, respectively. Moody’s, Standard and Poor’s and Fitch Ratings affirmed their underlying credit ratings of the Airport of “A1”, “A+” and “A+” with Stable Rating Outlooks, respectively. The Water Enterprise carried underlying ratings of “Aa3” and “AA-” and the Wastewater Enterprise carried underlying ratings of “Aa3” and “AA” from Moody’s and Standard and Poor’s respectively of June 30, 2016. In October 2016, Moody’s Investors Service upgraded the City’s Lease Revenue Bonds and Certificates of Participation from Aa3 to Aa2 for those secured by “more essential assets”, and also upgraded the City’s Lease Revenue Refunding bonds from Aa3 to Aa2, including Series 2008-1 and 2008-2, despite the “less essential” nature of the leased assets securing the bonds, because they are a demonstrated, stable non-pledged revenue source that provides strong coverage of debt service payments. Moody’s also upgraded the rating on the City’s Equipment Leases from A1 to Aa2, because of the strong lease structure where the lease term matches the useful life of the leased assets. Additional information in the City's long-term debt can be found in Note 8 to the Basic Financial Statements.
CITY AND COUNTY OF SAN FRANCISCO Management’s Discussion and Analysis (Unaudited) (Continued)
Year Ended June 30, 2016
21
Economic factors and future budgets and rates San Francisco has continued to experience improvement in the economy during the fiscal year. The following economic factors were considered in the preparation of the City’s budget for fiscal years 2016-17 and 2017-18. This two-year budget was adopted by the Mayor and the Board of Supervisors. It is a rolling budget for all departments, except for the Airport, PUC enterprises, SFMTA, the Port of San Francisco and Child Support Services, which each have a fixed two-year budget. The City’s average unemployment for fiscal year 2015-16 was 3.4 percent, a decrease of 0.5 percent
from the average unemployment rate in fiscal year 2014-15.
Housing prices, residential and commercial rent, hotel revenues, and retail sales all continued to show strong growth. The average median home price in fiscal year 2015-16 was $1.1 million up 10.4 percent from the previous fiscal year. Residential and commercial rents also grew by 4.9 percent and 6.5 percent, respectively, from the prior fiscal year.
The hotel sector saw continued growth in fiscal year 2015-16 over the prior year. Annual average hotel
room occupancy grew to 87.7 percent in fiscal year 2015-16 while average daily room rates grew by 5.7 percent over the prior year.
The City’s taxable sales have also continued to grow, with fiscal year 2015-16 sales tax revenue up 11.2 percent over fiscal year 2014-15.
The Board of Supervisors approved a final two-year budget for fiscal years 2016-17 and 2017-18 in July 2016, which assumes use of prior year fund balance from General Fund of $172.1 million and $191.2 million, respectively.
CITY AND COUNTY OF SAN FRANCISCO Management’s Discussion and Analysis (Unaudited) (Continued)
Year Ended June 30, 2016
22
REQUESTS FOR INFORMATION This financial report is designed to provide our citizens, taxpayers, customers, and investors and creditors with a general overview of the City’s finances and to demonstrate the City’s accountability for the money it receives. Below are the contacts for questions about this report or requests for additional financial information. City and County of San Francisco Office of the Controller 1 Dr. Carlton B. Goodlett Place, Room 316 San Francisco, CA 94102-4694
Individual Department Financial Statements
San Francisco International Airport Office of the Airport Deputy Director Business and Finance Division PO Box 8097 San Francisco, CA 94128
Port of San Francisco Public Information Officer Pier 1, The Embarcadero San Francisco, CA 94111
San Francisco Water Enterprise Hetch Hetchy Water and Power San Francisco Wastewater Enterprise Chief Financial Officer 525 Golden Gate Avenue San Francisco, CA 94102
Laguna Honda Hospital Chief Financial Officer 375 Laguna Honda Blvd. San Francisco, CA 94116
Municipal Transportation Agency SFMTA Finance and Information Technology Services 1 South Van Ness Avenue, 8th Floor San Francisco, CA 94103
Health Service System Chief Financial Officer 1145 Market Street, Suite 300 San Francisco, CA 94103
Zuckerberg San Francisco General Hospital and Trauma Center Chief Financial Officer 1001 Potrero Avenue, Suite 2A7 San Francisco, CA 94110 Successor Agency to the San Francisco Redevelopment Agency 1 South Van Ness Avenue, 5th Floor San Francisco, CA 94103
San Francisco Employees’ Retirement System Executive Director 1145 Market Street, 5th Floor San Francisco, CA 94103
Blended Component Units Financial Statements
San Francisco County Transportation Authority Deputy Director for Administration and Finance 1455 Market Street, 22nd Floor San Francisco, CA 94103
San Francisco Finance Corporation Office of Public Finance City Hall, Room 336 1 Dr. Carlton B. Goodlett Place San Francisco, CA 94102
WWW.SFGOV.ORG
Basic Financial Statements
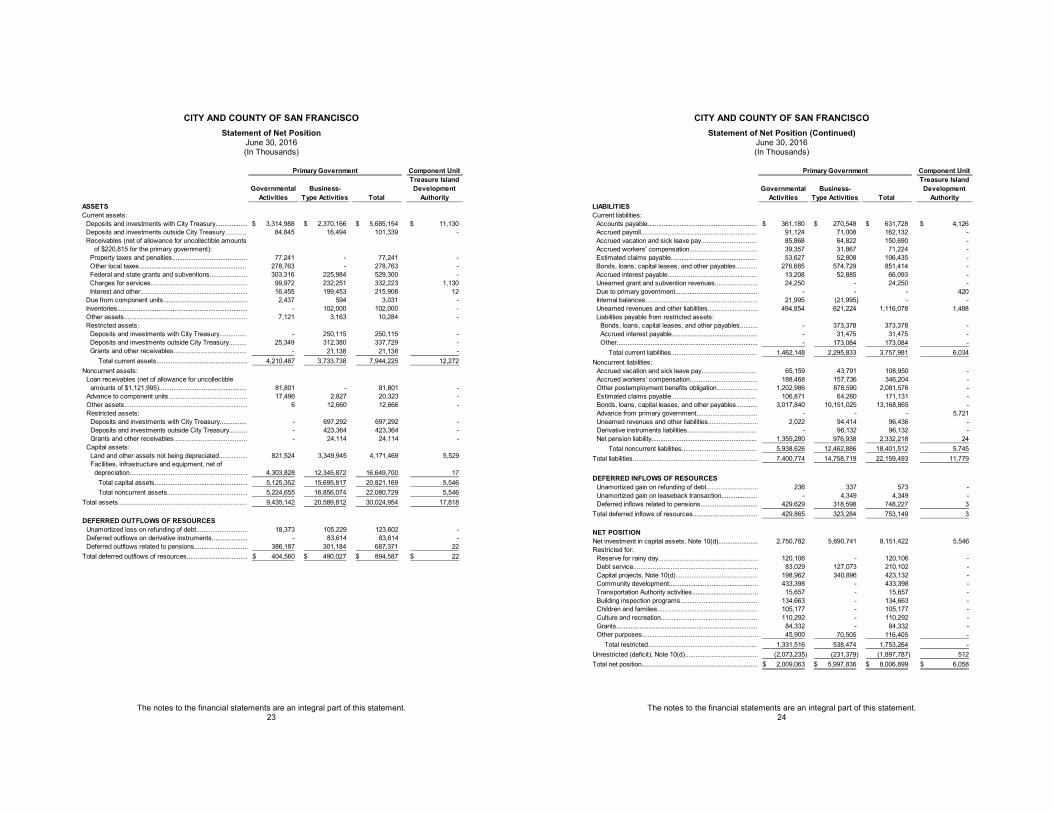
CITY AND COUNTY OF SAN FRANCISCO Statement of Net Position
June 30, 2016 (In Thousands)
The notes to the financial statements are an integral part of this statement. 23
Primary Government Component Unit
Governmental Activities
Business-Type Activities Total
Treasure Island Development
AuthorityASSETSCurrent assets:
Deposits and investments with City Treasury.................. 3,314,988$ 2,370,166$ 5,685,154$ 11,130$ Deposits and investments outside City Treasury............ 84,845 16,494 101,339 - Receivables (net of allowance for uncollectible amounts
of $220,815 for the primary government):Property taxes and penalties.......................................... 77,241 - 77,241 - Other local taxes............................................................ 278,763 - 278,763 - Federal and state grants and subventions..................... 303,316 225,984 529,300 - Charges for services...................................................... 99,972 232,251 332,223 1,130 Interest and other............................................................ 16,455 199,453 215,908 12
Due from component units............................................... 2,437 594 3,031 - Inventories......................................................................... - 102,000 102,000 - Other assets..................................................................... 7,121 3,163 10,284 - Restricted assets:
Deposits and investments with City Treasury............... - 250,115 250,115 - Deposits and investments outside City Treasury.......... 25,349 312,380 337,729 - Grants and other receivables......................................... - 21,138 21,138 -
Total current assets................................................... 4,210,487 3,733,738 7,944,225 12,272 Noncurrent assets:
Loan receivables (net of allowance for uncollectible amounts of $1,121,995)................................................. 81,801 - 81,801 -
Advance to component units............................................ 17,496 2,827 20,323 - Other assets..................................................................... 6 12,660 12,666 - Restricted assets:
Deposits and investments with City Treasury............... - 697,292 697,292 - Deposits and investments outside City Treasury.......... - 423,364 423,364 - Grants and other receivables......................................... - 24,114 24,114 -
Capital assets:Land and other assets not being depreciated................ 821,524 3,349,945 4,171,469 5,529 Facilities, infrastructure and equipment, net of
depreciation.................................................................. 4,303,828 12,345,872 16,649,700 17 Total capital assets.................................................... 5,125,352 15,695,817 20,821,169 5,546 Total noncurrent assets............................................. 5,224,655 16,856,074 22,080,729 5,546
Total assets........................................................................ 9,435,142 20,589,812 30,024,954 17,818
DEFERRED OUTFLOWS OF RESOURCESUnamortized loss on refunding of debt............................. 18,373 105,229 123,602 - Deferred outflows on derivative instruments.................... - 83,614 83,614 - Deferred outflows related to pensions.............................. 386,187 301,184 687,371 22
Total deferred outflows of resources.................................. 404,560$ 490,027$ 894,587$ 22$
CITY AND COUNTY OF SAN FRANCISCO Statement of Net Position (Continued)
June 30, 2016 (In Thousands)
The notes to the financial statements are an integral part of this statement. 24
Primary Government Component Unit
Governmental Activities
Business-Type Activities Total
Treasure Island Development
AuthorityLIABILITIESCurrent liabilities:
Accounts payable............................................................. 361,180$ 270,548$ 631,728$ 4,126$ Accrued payroll................................................................. 91,124 71,008 162,132 - Accrued vacation and sick leave pay............................... 85,868 64,822 150,690 - Accrued workers' compensation...................................... 39,357 31,867 71,224 - Estimated claims payable................................................ 53,627 52,808 106,435 - Bonds, loans, capital leases, and other payables............ 276,685 574,729 851,414 - Accrued interest payable.................................................. 13,208 52,885 66,093 - Unearned grant and subvention revenues........................ 24,250 - 24,250 - Due to primary government.............................................. - - - 420 Internal balances............................................................... 21,995 (21,995) - - Unearned revenues and other liabilities............................ 494,854 621,224 1,116,078 1,488 Liabilities payable from restricted assets:
Bonds, loans, capital leases, and other payables.......... - 373,378 373,378 - Accrued interest payable................................................ - 31,475 31,475 - Other............................................................................... - 173,084 173,084 -
Total current liabilities................................................ 1,462,148 2,295,833 3,757,981 6,034 Noncurrent liabilities:
Accrued vacation and sick leave pay............................... 65,159 43,791 108,950 - Accrued workers' compensation...................................... 188,468 157,736 346,204 - Other postemployment benefits obligation....................... 1,202,986 878,590 2,081,576 - Estimated claims payable................................................ 106,871 64,260 171,131 - Bonds, loans, capital leases, and other payables............ 3,017,840 10,151,025 13,168,865 - Advance from primary government.................................. - - - 5,721 Unearned revenues and other liabilities............................ 2,022 94,414 96,436 - Derivative instruments liabilities....................................... - 96,132 96,132 - Net pension liability........................................................... 1,355,280 976,938 2,332,218 24
Total noncurrent liabilities.......................................... 5,938,626 12,462,886 18,401,512 5,745 Total liabilities...................................................................... 7,400,774 14,758,719 22,159,493 11,779
DEFERRED INFLOWS OF RESOURCESUnamortized gain on refunding of debt............................. 236 337 573 - Unamortized gain on leaseback transaction.................... - 4,349 4,349 - Deferred inflows related to pensions................................ 429,629 318,598 748,227 3
Total deferred inflows of resources.................................... 429,865 323,284 753,149 3
NET POSITIONNet investment in capital assets, Note 10(d)...................... 2,750,782 5,690,741 8,151,422 5,546 Restricted for:
Reserve for rainy day........................................................ 120,106 - 120,106 - Debt service...................................................................... 83,029 127,073 210,102 - Capital projects, Note 10(d).............................................. 198,962 340,896 423,132 - Community development.................................................. 433,398 - 433,398 - Transportation Authority activities..................................... 15,657 - 15,657 - Building inspection programs........................................... 134,663 - 134,663 - Children and families........................................................ 105,177 - 105,177 - Culture and recreation...................................................... 110,292 - 110,292 - Grants............................................................................... 84,332 - 84,332 - Other purposes................................................................. 45,900 70,505 116,405 -
Total restricted............................................................. 1,331,516 538,474 1,753,264 - Unrestricted (deficit), Note 10(d)......................................... (2,073,235) (231,379) (1,897,787) 512 Total net position................................................................. 2,009,063$ 5,997,836$ 8,006,899$ 6,058$
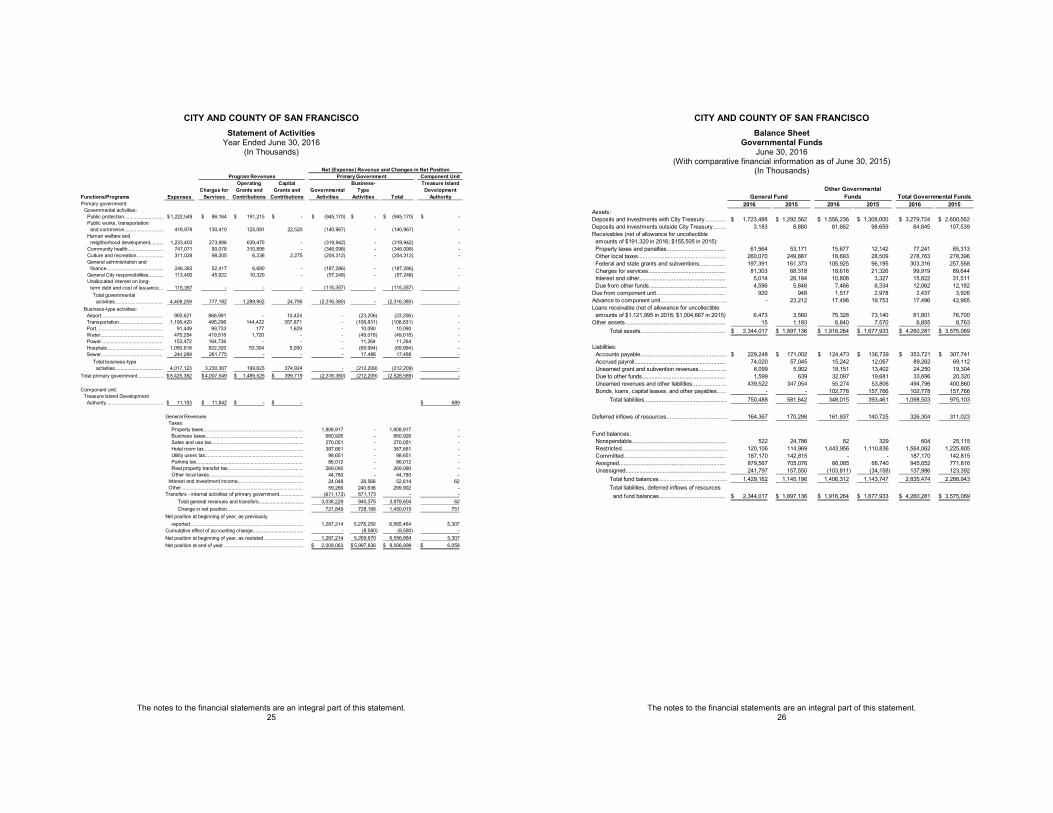
CITY AND COUNTY OF SAN FRANCISCO Statement of Activities
Year Ended June 30, 2016 (In Thousands)
The notes to the financial statements are an integral part of this statement. 25
Net (Expense) Revenue and Changes in Net PositionProgram Revenues Primary Government Component Unit
Functions/Programs ExpensesCharges for
Services
Operating Grants and
Contributions
Capital Grants and
ContributionsGovernmental
Activities
Business-Type
Activities Total
Treasure Island Development
AuthorityPrimary government:
Governmental activities:Public protection............................. 1,222,549$ 86,164$ 191,215$ -$ (945,170)$ -$ (945,170)$ -$ Public works, transportation
and commerce............................. 418,978 130,410 125,081 22,520 (140,967) - (140,967) - Human welfare and
neighborhood development.......... 1,233,403 273,986 639,475 - (319,942) - (319,942) - Community health.......................... 747,071 90,078 310,895 - (346,098) - (346,098) - Culture and recreation.................... 311,028 98,205 6,236 2,275 (204,312) - (204,312) - General administration and
finance.......................................... 246,383 52,417 6,680 - (187,286) - (187,286) - General City responsibilities........... 113,490 45,922 10,320 - (57,248) - (57,248) - Unallocated interest on long-
term debt and cost of issuance... 115,357 - - - (115,357) - (115,357) - Total governmental
activities................................... 4,408,259 777,182 1,289,902 24,795 (2,316,380) - (2,316,380) - Business-type activities:
Airport............................................. 900,621 866,991 - 10,424 - (23,206) (23,206) - Transportation................................ 1,106,420 495,296 144,422 357,871 - (108,831) (108,831) - Port................................................. 91,449 99,733 177 1,629 - 10,090 10,090 - Water.............................................. 470,254 419,516 1,720 - - (49,018) (49,018) - Power............................................. 153,472 164,736 - - - 11,264 11,264 - Hospitals......................................... 1,050,618 922,320 53,304 5,000 - (69,994) (69,994) - Sewer............................................. 244,289 261,775 - - - 17,486 17,486 -
Total business-typeactivities................................... 4,017,123 3,230,367 199,623 374,924 - (212,209) (212,209) -
Total primary government................... 8,425,382$ 4,007,549$ 1,489,525$ 399,719$ (2,316,380) (212,209) (2,528,589) -
Component unit:Treasure Island Development
Authority.......................................... 11,153$ 11,842$ -$ -$ 689$
1,808,917 - 1,808,917 - 660,926 - 660,926 - 270,051 - 270,051 - 387,661 - 387,661 - 98,651 - 98,651 - 86,012 - 86,012 -
269,090 - 269,090 - 44,780 - 44,780 - 24,048 28,566 52,614 62 59,266 240,636 299,902 -
(671,173) 671,173 - - 3,038,229 940,375 3,978,604 62
721,849 728,166 1,450,015 751
1,287,214 5,278,250 6,565,464 5,307 - (8,580) (8,580) -
1,287,214 5,269,670 6,556,884 5,307 2,009,063$ 5,997,836$ 8,006,899$ 6,058$
Business taxes........................................................................Sales and use tax....................................................................
General RevenuesTaxes:
Property taxes.........................................................................
reported...................................................................................
Net position at end of year...........................................................
Hotel room tax.........................................................................Utility users tax........................................................................
Other local taxes.....................................................................Interest and investment income................................................
Change in net position........................................................
Other..........................................................................................Transfers - internal activities of primary government..................
Total general revenues and transfers.................................
Net position at beginning of year, as restated..............................Cumulative effect of accounting change.....................................
Parking tax...............................................................................Real property transfer tax........................................................
Net position at beginning of year, as previously
CITY AND COUNTY OF SAN FRANCISCO Balance Sheet
Governmental Funds June 30, 2016
(With comparative financial information as of June 30, 2015) (In Thousands)
The notes to the financial statements are an integral part of this statement. 26
General FundOther Governmental
Funds Total Governmental Funds2016 2015 2016 2015 2016 2015
Assets:Deposits and investments with City Treasury.............. 1,723,488$ 1,292,562$ 1,556,236$ 1,308,000$ 3,279,724$ 2,600,562$ Deposits and investments outside City Treasury......... 3,183 8,880 81,662 98,659 84,845 107,539 Receivables (net of allowance for uncollectible
amounts of $191,320 in 2016; $155,505 in 2015):Property taxes and penalties...................................... 61,564 53,171 15,677 12,142 77,241 65,313 Other local taxes......................................................... 260,070 249,887 18,693 28,509 278,763 278,396 Federal and state grants and subventions................. 197,391 161,373 105,925 96,195 303,316 257,568 Charges for services.................................................. 81,303 68,318 18,616 21,326 99,919 89,644 Interest and other........................................................ 5,014 28,184 10,808 3,327 15,822 31,511 Due from other funds.................................................. 4,596 5,848 7,466 6,334 12,062 12,182
Due from component unit............................................. 920 948 1,517 2,978 2,437 3,926 Advance to component unit........................................... - 23,212 17,496 19,753 17,496 42,965 Loans receivable (net of allowance for uncollectible
amounts of $1,121,995 in 2016; $1,004,667 in 2015) 6,473 3,560 75,328 73,140 81,801 76,700 Other assets................................................................. 15 1,193 6,840 7,570 6,855 8,763
Total assets....................................................... 2,344,017$ 1,897,136$ 1,916,264$ 1,677,933$ 4,260,281$ 3,575,069$
Liabilities:Accounts payable........................................................ 229,248$ 171,002$ 124,473$ 136,739$ 353,721$ 307,741$ Accrued payroll........................................................... 74,020 57,045 15,242 12,067 89,262 69,112 Unearned grant and subvention revenues.................. 6,099 5,902 18,151 13,402 24,250 19,304 Due to other funds...................................................... 1,599 639 32,097 19,681 33,696 20,320 Unearned revenues and other liabilities...................... 439,522 347,054 55,274 53,806 494,796 400,860 Bonds, loans, capital leases, and other payables...... - - 102,778 157,766 102,778 157,766
Total liabilities..................................................... 750,488 581,642 348,015 393,461 1,098,503 975,103
Deferred inflows of resources....................................... 164,367 170,298 161,937 140,725 326,304 311,023
Fund balances:Nonspendable............................................................. 522 24,786 82 329 604 25,115 Restricted.................................................................... 120,106 114,969 1,443,956 1,110,836 1,564,062 1,225,805 Committed.................................................................. 187,170 142,815 - - 187,170 142,815 Assigned..................................................................... 879,567 705,076 66,085 66,740 945,652 771,816 Unassigned................................................................. 241,797 157,550 (103,811) (34,158) 137,986 123,392
Total fund balances............................................ 1,429,162 1,145,196 1,406,312 1,143,747 2,835,474 2,288,943 Total liabilities, deferred inflows of resources
and fund balances........................................... 2,344,017$ 1,897,136$ 1,916,264$ 1,677,933$ 4,260,281$ 3,575,069$
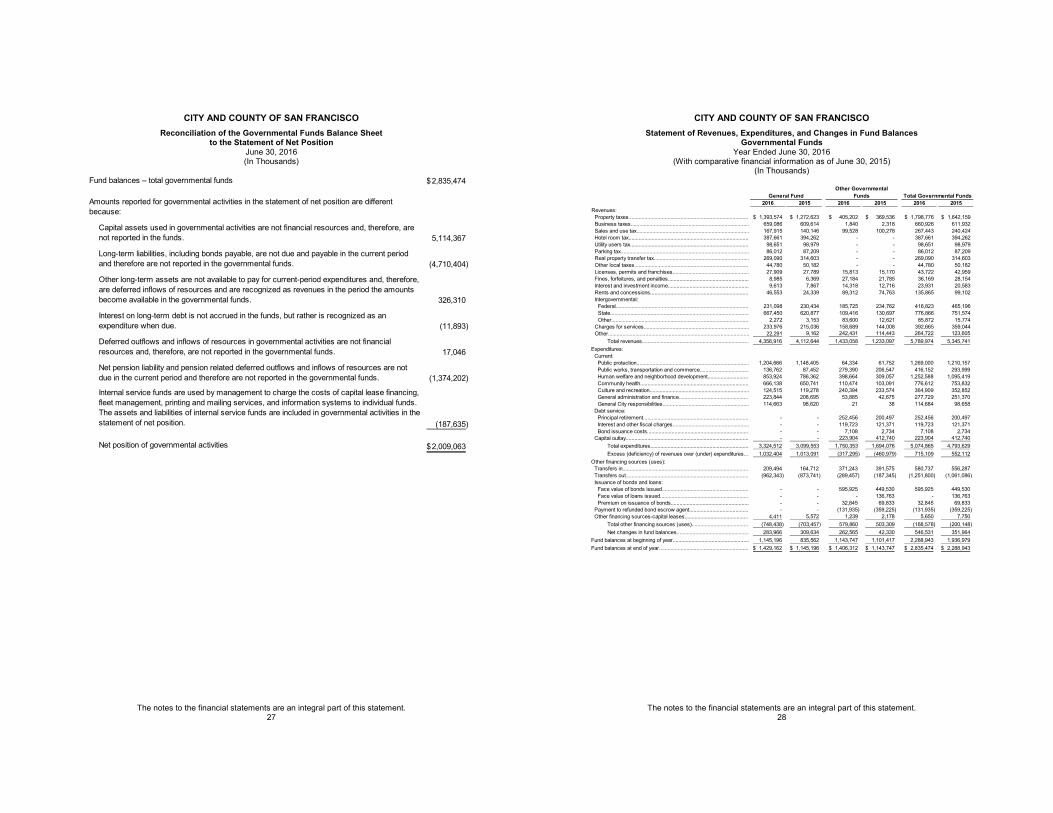
CITY AND COUNTY OF SAN FRANCISCO Reconciliation of the Governmental Funds Balance Sheet
to the Statement of Net Position June 30, 2016 (In Thousands)
The notes to the financial statements are an integral part of this statement. 27
Fund balances – total governmental funds 2,835,474$
Amounts reported for governmental activities in the statement of net position are different because:
Capital assets used in governmental activities are not financial resources and, therefore, are not reported in the funds. 5,114,367
Long-term liabilities, including bonds payable, are not due and payable in the current period and therefore are not reported in the governmental funds. (4,710,404)
Other long-term assets are not available to pay for current-period expenditures and, therefore, are deferred inflows of resources and are recognized as revenues in the period the amounts become available in the governmental funds. 326,310
Interest on long-term debt is not accrued in the funds, but rather is recognized as an expenditure when due. (11,893)
Deferred outflows and inflows of resources in governmental activities are not financial resources and, therefore, are not reported in the governmental funds. 17,046
Net pension liability and pension related deferred outflows and inflows of resources are not due in the current period and therefore are not reported in the governmental funds. (1,374,202)
Internal service funds are used by management to charge the costs of capital lease financing, fleet management, printing and mailing services, and information systems to individual funds. The assets and liabilities of internal service funds are included in governmental activities in the statement of net position. (187,635)
Net position of governmental activities 2,009,063$
CITY AND COUNTY OF SAN FRANCISCO Statement of Revenues, Expenditures, and Changes in Fund Balances
Governmental Funds Year Ended June 30, 2016
(With comparative financial information as of June 30, 2015) (In Thousands)
The notes to the financial statements are an integral part of this statement. 28
General FundOther Governmental
Funds Total Governmental Funds2016 2015 2016 2015 2016 2015
Revenues:Property taxes................................................................................... 1,393,574$ 1,272,623$ 405,202$ 369,536$ 1,798,776$ 1,642,159$ Business taxes.................................................................................. 659,086 609,614 1,840 2,318 660,926 611,932 Sales and use tax.............................................................................. 167,915 140,146 99,528 100,278 267,443 240,424 Hotel room tax................................................................................... 387,661 394,262 - - 387,661 394,262 Utility users tax.................................................................................. 98,651 98,979 - - 98,651 98,979 Parking tax......................................................................................... 86,012 87,209 - - 86,012 87,209 Real property transfer tax.................................................................. 269,090 314,603 - - 269,090 314,603 Other local taxes............................................................................... 44,780 50,182 - - 44,780 50,182 Licenses, permits and franchises..................................................... 27,909 27,789 15,813 15,170 43,722 42,959 Fines, forfeitures, and penalties........................................................ 8,985 6,369 27,184 21,785 36,169 28,154 Interest and investment income........................................................ 9,613 7,867 14,318 12,716 23,931 20,583 Rents and concessions.................................................................... 46,553 24,339 89,312 74,763 135,865 99,102 Intergovernmental:
Federal............................................................................................ 231,098 230,434 185,725 234,762 416,823 465,196 State................................................................................................ 667,450 620,877 109,416 130,697 776,866 751,574 Other............................................................................................... 2,272 3,153 83,600 12,621 85,872 15,774
Charges for services......................................................................... 233,976 215,036 158,689 144,008 392,665 359,044 Other.................................................................................................. 22,291 9,162 242,431 114,443 264,722 123,605
Total revenues.......................................................................... 4,356,916 4,112,644 1,433,058 1,233,097 5,789,974 5,345,741 Expenditures:
Current:Public protection.............................................................................. 1,204,666 1,148,405 64,334 61,752 1,269,000 1,210,157 Public works, transportation and commerce.................................. 136,762 87,452 279,390 206,547 416,152 293,999 Human welfare and neighborhood development............................ 853,924 786,362 398,664 309,057 1,252,588 1,095,419 Community health........................................................................... 666,138 650,741 110,474 103,091 776,612 753,832 Culture and recreation..................................................................... 124,515 119,278 240,394 233,574 364,909 352,852 General administration and finance................................................ 223,844 208,695 53,885 42,675 277,729 251,370 General City responsibilities............................................................ 114,663 98,620 21 38 114,684 98,658
Debt service:Principal retirement......................................................................... - - 252,456 200,497 252,456 200,497 Interest and other fiscal charges..................................................... - - 119,723 121,371 119,723 121,371 Bond issuance costs...................................................................... - - 7,108 2,734 7,108 2,734
Capital outlay..................................................................................... - - 223,904 412,740 223,904 412,740 Total expenditures.................................................................... 3,324,512 3,099,553 1,750,353 1,694,076 5,074,865 4,793,629 Excess (deficiency) of revenues over (under) expenditures... 1,032,404 1,013,091 (317,295) (460,979) 715,109 552,112
Other financing sources (uses):Transfers in....................................................................................... 209,494 164,712 371,243 391,575 580,737 556,287 Transfers out..................................................................................... (962,343) (873,741) (289,457) (187,345) (1,251,800) (1,061,086) Issuance of bonds and loans:
Face value of bonds issued............................................................ - - 595,925 449,530 595,925 449,530 Face value of loans issued............................................................. - - - 136,763 - 136,763 Premium on issuance of bonds...................................................... - - 32,845 69,833 32,845 69,833
Payment to refunded bond escrow agent......................................... - - (131,935) (359,225) (131,935) (359,225) Other financing sources-capital leases............................................ 4,411 5,572 1,239 2,178 5,650 7,750
Total other financing sources (uses)....................................... (748,438) (703,457) 579,860 503,309 (168,578) (200,148) Net changes in fund balances.................................................. 283,966 309,634 262,565 42,330 546,531 351,964
Fund balances at beginning of year..................................................... 1,145,196 835,562 1,143,747 1,101,417 2,288,943 1,936,979 Fund balances at end of year.............................................................. 1,429,162$ 1,145,196$ 1,406,312$ 1,143,747$ 2,835,474$ 2,288,943$
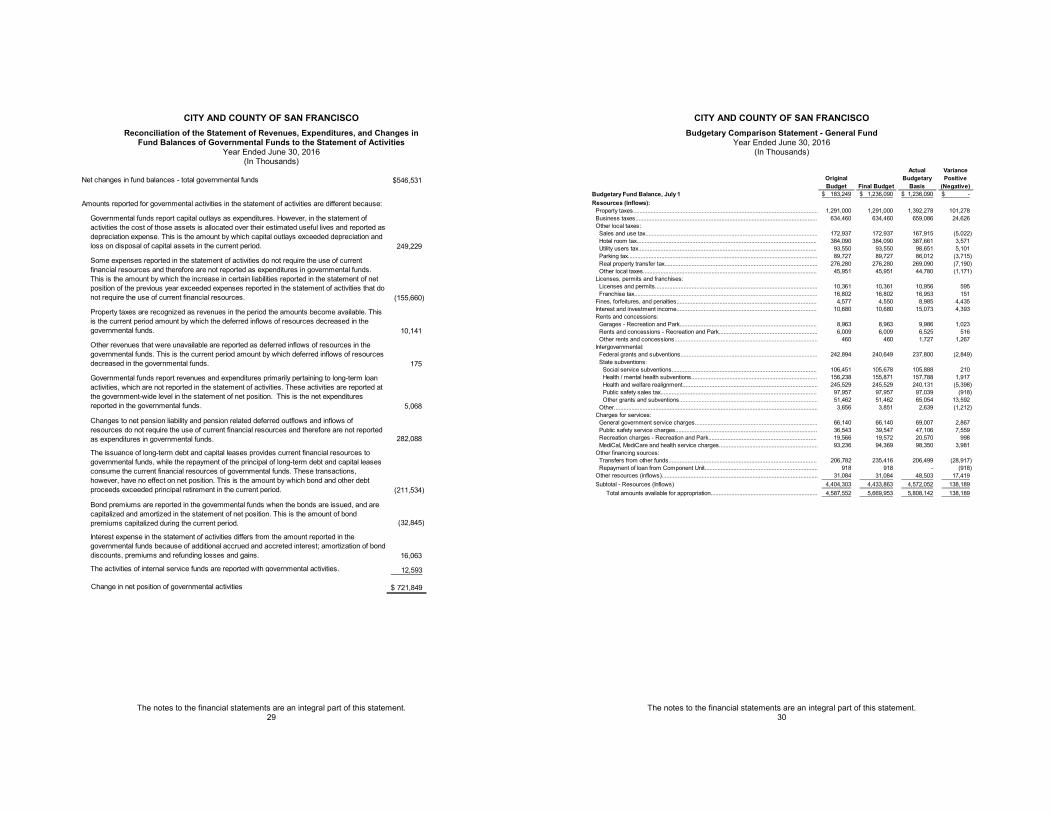
CITY AND COUNTY OF SAN FRANCISCO Reconciliation of the Statement of Revenues, Expenditures, and Changes in
Fund Balances of Governmental Funds to the Statement of Activities Year Ended June 30, 2016
(In Thousands)
The notes to the financial statements are an integral part of this statement. 29
Net changes in fund balances - total governmental funds $546,531
Amounts reported for governmental activities in the statement of activities are different because:
Governmental funds report capital outlays as expenditures. However, in the statement of activities the cost of those assets is allocated over their estimated useful lives and reported as depreciation expense. This is the amount by which capital outlays exceeded depreciation and loss on disposal of capital assets in the current period. 249,229
Some expenses reported in the statement of activities do not require the use of current financial resources and therefore are not reported as expenditures in governmental funds. This is the amount by which the increase in certain liabilities reported in the statement of net position of the previous year exceeded expenses reported in the statement of activities that do not require the use of current financial resources. (155,660)
Property taxes are recognized as revenues in the period the amounts become available. This is the current period amount by which the deferred inflows of resources decreased in the governmental funds. 10,141
Other revenues that were unavailable are reported as deferred inflows of resources in the governmental funds. This is the current period amount by which deferred inflows of resources decreased in the governmental funds. 175
Governmental funds report revenues and expenditures primarily pertaining to long-term loan activities, which are not reported in the statement of activities. These activities are reported at the government-wide level in the statement of net position. This is the net expenditures reported in the governmental funds. 5,068
Changes to net pension liability and pension related deferred outflows and inflows of resources do not require the use of current financial resources and therefore are not reported as expenditures in governmental funds. 282,088
The issuance of long-term debt and capital leases provides current financial resources to governmental funds, while the repayment of the principal of long-term debt and capital leases consume the current financial resources of governmental funds. These transactions, however, have no effect on net position. This is the amount by which bond and other debt proceeds exceeded principal retirement in the current period. (211,534)
Bond premiums are reported in the governmental funds when the bonds are issued, and are capitalized and amortized in the statement of net position. This is the amount of bond premiums capitalized during the current period. (32,845)
Interest expense in the statement of activities differs from the amount reported in the governmental funds because of additional accrued and accreted interest; amortization of bond discounts, premiums and refunding losses and gains. 16,063
The activities of internal service funds are reported with governmental activities. 12,593
Change in net position of governmental activities 721,849$
CITY AND COUNTY OF SAN FRANCISCO Budgetary Comparison Statement - General Fund
Year Ended June 30, 2016 (In Thousands)
The notes to the financial statements are an integral part of this statement. 30
Original Budget Final Budget
Actual Budgetary
Basis
Variance Positive
(Negative)Budgetary Fund Balance, July 1 183,249$ 1,236,090$ 1,236,090$ -$ Resources (Inflows):
Property taxes.................................................................................................................... 1,291,000 1,291,000 1,392,278 101,278 Business taxes.................................................................................................................. 634,460 634,460 659,086 24,626 Other local taxes:
Sales and use tax............................................................................................................ 172,937 172,937 167,915 (5,022) Hotel room tax................................................................................................................. 384,090 384,090 387,661 3,571 Utility users tax................................................................................................................ 93,550 93,550 98,651 5,101 Parking tax....................................................................................................................... 89,727 89,727 86,012 (3,715) Real property transfer tax................................................................................................ 276,280 276,280 269,090 (7,190) Other local taxes............................................................................................................. 45,951 45,951 44,780 (1,171)
Licenses, permits and franchises:Licenses and permits...................................................................................................... 10,361 10,361 10,956 595 Franchise tax................................................................................................................... 16,802 16,802 16,953 151
Fines, forfeitures, and penalties........................................................................................ 4,577 4,550 8,985 4,435 Interest and investment income........................................................................................ 10,680 10,680 15,073 4,393 Rents and concessions:
Garages - Recreation and Park...................................................................................... 8,963 8,963 9,986 1,023 Rents and concessions - Recreation and Park.............................................................. 6,009 6,009 6,525 516 Other rents and concessions.......................................................................................... 460 460 1,727 1,267
Intergovernmental:Federal grants and subventions...................................................................................... 242,894 240,649 237,800 (2,849) State subventions:
Social service subventions........................................................................................... 106,451 105,678 105,888 210 Health / mental health subventions............................................................................... 156,238 155,871 157,788 1,917 Health and welfare realignment..................................................................................... 245,529 245,529 240,131 (5,398) Public safety sales tax.................................................................................................. 97,957 97,957 97,039 (918) Other grants and subventions....................................................................................... 51,462 51,462 65,054 13,592
Other................................................................................................................................ 3,656 3,851 2,639 (1,212) Charges for services:
General government service charges............................................................................. 66,140 66,140 69,007 2,867 Public safety service charges......................................................................................... 36,543 39,547 47,106 7,559 Recreation charges - Recreation and Park.................................................................... 19,566 19,572 20,570 998 MediCal, MediCare and health service charges.............................................................. 93,236 94,369 98,350 3,981
Other financing sources:Transfers from other funds............................................................................................. 206,782 235,416 206,499 (28,917) Repayment of loan from Component Unit....................................................................... 918 918 - (918)
Other resources (inflows).................................................................................................. 31,084 31,084 48,503 17,419 Subtotal - Resources (Inflows) 4,404,303 4,433,863 4,572,052 138,189
Total amounts available for appropriation................................................................... 4,587,552 5,669,953 5,808,142 138,189
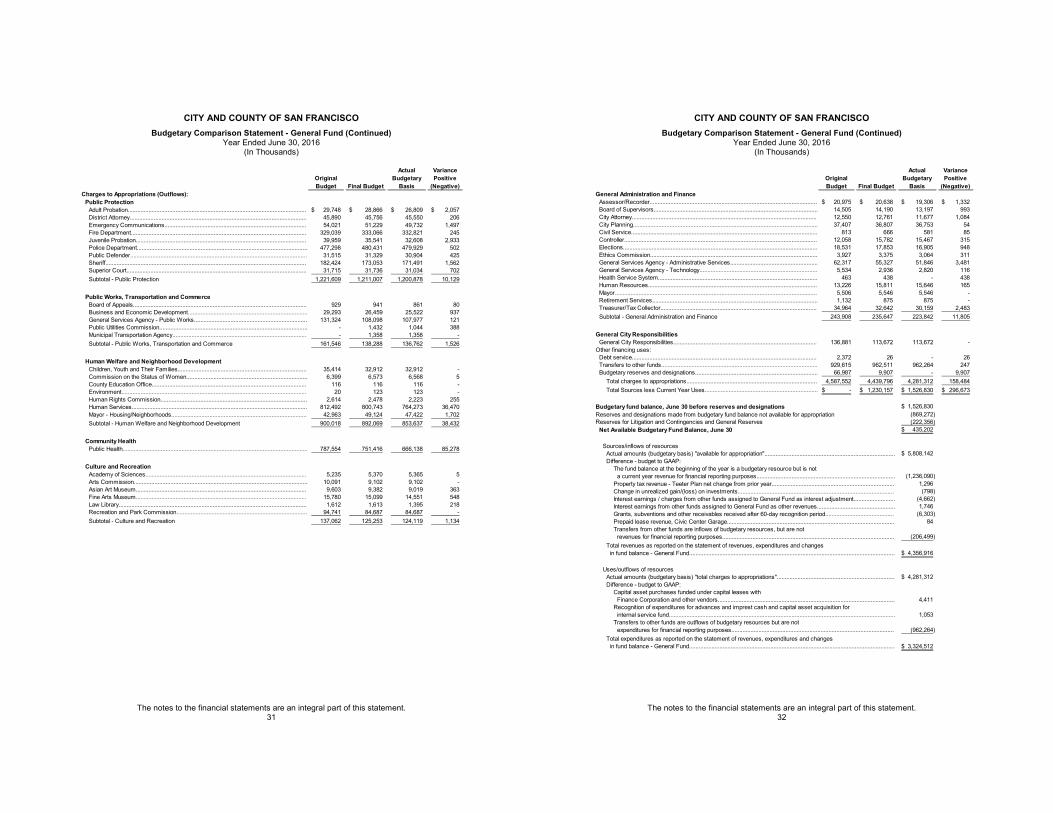
CITY AND COUNTY OF SAN FRANCISCO Budgetary Comparison Statement - General Fund (Continued)
Year Ended June 30, 2016 (In Thousands)
The notes to the financial statements are an integral part of this statement. 31
Original Budget Final Budget
Actual Budgetary
Basis
Variance Positive
(Negative)Charges to Appropriations (Outflows):
Public ProtectionAdult Probation................................................................................................................ 29,748$ 28,866$ 26,809$ 2,057$ District Attorney............................................................................................................... 45,890 45,756 45,550 206 Emergency Communications......................................................................................... 54,021 51,229 49,732 1,497 Fire Department.............................................................................................................. 329,039 333,066 332,821 245 Juvenile Probation........................................................................................................... 39,959 35,541 32,608 2,933 Police Department........................................................................................................... 477,298 480,431 479,929 502 Public Defender............................................................................................................... 31,515 31,329 30,904 425 Sheriff.............................................................................................................................. 182,424 173,053 171,491 1,562 Superior Court................................................................................................................. 31,715 31,736 31,034 702 Subtotal - Public Protection 1,221,609 1,211,007 1,200,878 10,129
Public Works, Transportation and CommerceBoard of Appeals............................................................................................................. 929 941 861 80 Business and Economic Development........................................................................... 29,293 26,459 25,522 937 General Services Agency - Public Works....................................................................... 131,324 108,098 107,977 121 Public Utilities Commission............................................................................................. - 1,432 1,044 388 Municipal Transportation Agency.................................................................................... - 1,358 1,358 - Subtotal - Public Works, Transportation and Commerce 161,546 138,288 136,762 1,526
Human Welfare and Neighborhood DevelopmentChildren, Youth and Their Families................................................................................. 35,414 32,912 32,912 - Commission on the Status of Women............................................................................ 6,399 6,573 6,568 5 County Education Office................................................................................................. 116 116 116 - Environment.................................................................................................................... 20 123 123 - Human Rights Commission............................................................................................ 2,614 2,478 2,223 255 Human Services.............................................................................................................. 812,492 800,743 764,273 36,470 Mayor - Housing/Neighborhoods..................................................................................... 42,963 49,124 47,422 1,702 Subtotal - Human Welfare and Neighborhood Development 900,018 892,069 853,637 38,432
Community HealthPublic Health.................................................................................................................... 787,554 751,416 666,138 85,278
Culture and RecreationAcademy of Sciences..................................................................................................... 5,235 5,370 5,365 5 Arts Commission............................................................................................................. 10,091 9,102 9,102 - Asian Art Museum........................................................................................................... 9,603 9,382 9,019 363 Fine Arts Museum........................................................................................................... 15,780 15,099 14,551 548 Law Library...................................................................................................................... 1,612 1,613 1,395 218 Recreation and Park Commission.................................................................................. 94,741 84,687 84,687 - Subtotal - Culture and Recreation 137,062 125,253 124,119 1,134
CITY AND COUNTY OF SAN FRANCISCO Budgetary Comparison Statement - General Fund (Continued)
Year Ended June 30, 2016 (In Thousands)
The notes to the financial statements are an integral part of this statement. 32
Original Budget Final Budget
Actual Budgetary
Basis
Variance Positive
(Negative)General Administration and Finance
Assessor/Recorder......................................................................................................... 20,975$ 20,638$ 19,306$ 1,332$ Board of Supervisors....................................................................................................... 14,505 14,190 13,197 993 City Attorney.................................................................................................................... 12,550 12,761 11,677 1,084 City Planning.................................................................................................................... 37,407 36,807 36,753 54 Civil Service..................................................................................................................... 813 666 581 85 Controller......................................................................................................................... 12,058 15,782 15,467 315 Elections.......................................................................................................................... 18,531 17,853 16,905 948 Ethics Commission......................................................................................................... 3,927 3,375 3,064 311 General Services Agency - Administrative Services....................................................... 62,317 55,327 51,846 3,481 General Services Agency - Technology.......................................................................... 5,534 2,936 2,820 116 Health Service System.................................................................................................... 463 438 - 438 Human Resources.......................................................................................................... 13,226 15,811 15,646 165 Mayor............................................................................................................................... 5,506 5,546 5,546 - Retirement Services........................................................................................................ 1,132 875 875 - Treasurer/Tax Collector.................................................................................................. 34,964 32,642 30,159 2,483 Subtotal - General Administration and Finance 243,908 235,647 223,842 11,805
General City ResponsibilitiesGeneral City Responsibilities.......................................................................................... 136,881 113,672 113,672 -
Other financing uses:Debt service.................................................................................................................... 2,372 26 - 26 Transfers to other funds.................................................................................................. 929,615 962,511 962,264 247 Budgetary reserves and designations............................................................................. 66,987 9,907 - 9,907
Total charges to appropriations.................................................................................. 4,587,552 4,439,796 4,281,312 158,484 Total Sources less Current Year Uses....................................................................... -$ 1,230,157$ 1,526,830$ 296,673$
1,526,830$ (869,272)
Reserves for Litigation and Contingencies and General Reserves (222,356) 435,202$
5,808,142$
(1,236,090) 1,296 (798)
(4,662) 1,746
(6,303) 84
(206,499)
4,356,916$
4,281,312$
4,411 Recognition of expenditures for advances and imprest cash and capital asset acquisition for
1,053
(962,264)
3,324,512$
Actual amounts (budgetary basis) "available for appropriation"..................................................................................
Budgetary fund balance, June 30 before reserves and designationsReserves and designations made from budgetary fund balance not available for appropriation
Net Available Budgetary Fund Balance, June 30
Sources/inflows of resources
Difference - budget to GAAP:
Total revenues as reported on the statement of revenues, expenditures and changes
Difference - budget to GAAP: The fund balance at the beginning of the year is a budgetary resource but is not
a current year revenue for financial reporting purposes.......................................................................................Property tax revenue - Teeter Plan net change from prior year.............................................................................Change in unrealized gain/(loss) on investments..................................................................................................Interest earnings / charges from other funds assigned to General Fund as interest adjustment..........................Interest earnings from other funds assigned to General Fund as other revenues.................................................Grants, subventions and other receivables received after 60-day recognition period...........................................Prepaid lease revenue, Civic Center Garage.........................................................................................................Transfers from other funds are inflows of budgetary resources, but are not
revenues for financial reporting purposes............................................................................................................
in fund balance - General Fund.................................................................................................................................
Uses/outflows of resourcesActual amounts (budgetary basis) "total charges to appropriations"..........................................................................
Transfers to other funds are outflows of budgetary resources but are not
Total expenditures as reported on the statement of revenues, expenditures and changesin fund balance - General Fund.................................................................................................................................
Capital asset purchases funded under capital leases withFinance Corporation and other vendors...............................................................................................................
expenditures for financial reporting purposes......................................................................................................
internal service fund..............................................................................................................................................
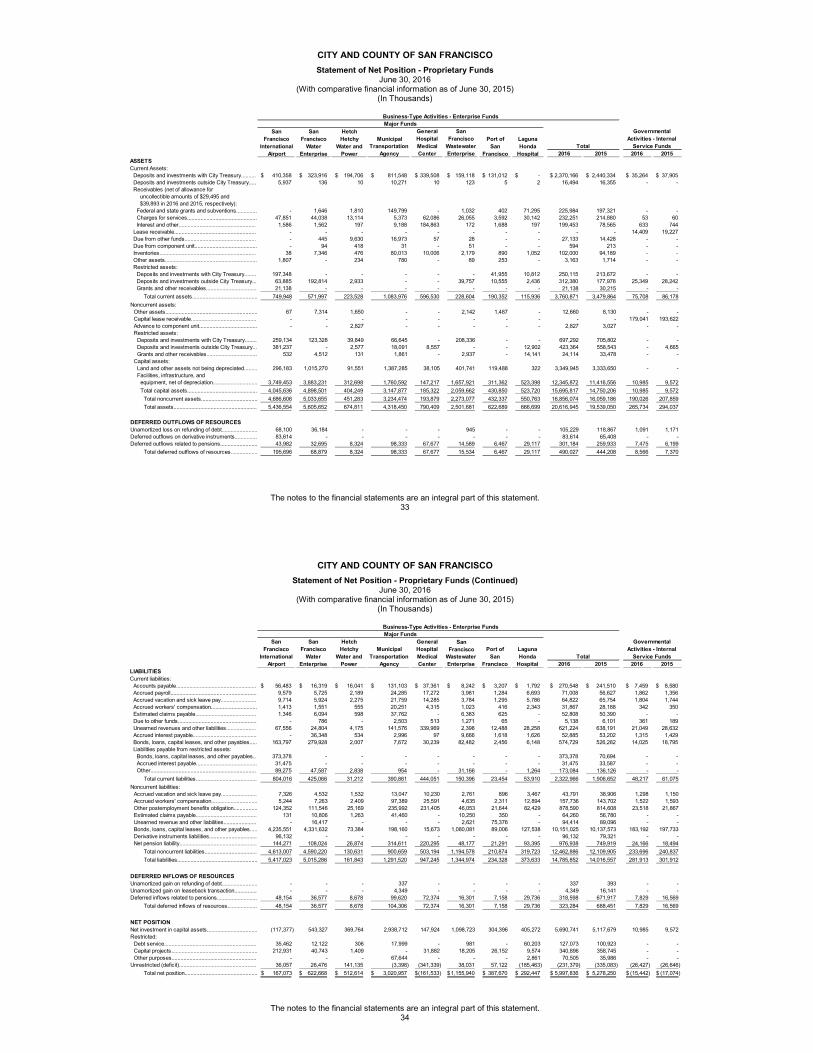
CITY AND COUNTY OF SAN FRANCISCO Statement of Net Position - Proprietary Funds
June 30, 2016 (With comparative financial information as of June 30, 2015)
(In Thousands)
The notes to the financial statements are an integral part of this statement. 33
Business-Type Activities - Enterprise FundsMajor Funds
Total
Governmental Activities - Internal
Service Funds2016 2015 2016 2015
ASSETSCurrent Assets:
Deposits and investments with City Treasury.......... 410,358$ 323,916$ 194,706$ 811,548$ 339,508$ 159,118$ 131,012$ -$ 2,370,166$ 2,440,334$ 35,264$ 37,905$ Deposits and investments outside City Treasury..... 5,937 136 10 10,271 10 123 5 2 16,494 16,355 - - Receivables (net of allowance for
uncollectible amounts of $29,495 and $39,893 in 2016 and 2015, respectively):
Federal and state grants and subventions.............. - 1,646 1,810 149,799 - 1,032 402 71,295 225,984 197,321 - - Charges for services............................................... 47,851 44,038 13,114 5,373 62,086 26,055 3,592 30,142 232,251 214,880 53 60 Interest and other.................................................... 1,586 1,562 197 9,188 184,863 172 1,688 197 199,453 78,565 633 744
Lease receivable....................................................... - - - - - - - - - - 14,409 19,227 Due from other funds................................................ - 445 9,630 16,973 57 28 - - 27,133 14,428 - - Due from component unit.......................................... - 94 418 31 - 51 - - 594 213 - - Inventories................................................................. 38 7,346 476 80,013 10,006 2,179 890 1,052 102,000 94,189 - - Other assets.............................................................. 1,807 - 234 780 - 89 253 - 3,163 1,714 - - Restricted assets:
Deposits and investments with City Treasury........ 197,348 - - - - - 41,955 10,812 250,115 213,672 - - Deposits and investments outside City Treasury... 63,885 192,814 2,933 - - 39,757 10,555 2,436 312,380 177,978 25,349 28,242 Grants and other receivables.................................. 21,138 - - - - - - - 21,138 30,215 - -
Total current assets............................................ 749,948 571,997 223,528 1,083,976 596,530 228,604 190,352 115,936 3,760,871 3,479,864 75,708 86,178 Noncurrent assets:
Other assets.............................................................. 67 7,314 1,650 - - 2,142 1,487 - 12,660 8,130 - - Capital lease receivable............................................ - - - - - - - - - - 179,041 193,622 Advance to component unit....................................... - - 2,827 - - - - - 2,827 3,027 - - Restricted assets:
Deposits and investments with City Treasury........ 259,134 123,328 39,849 66,645 - 208,336 - - 697,292 705,802 - - Deposits and investments outside City Treasury... 381,237 - 2,577 18,091 8,557 - - 12,902 423,364 558,543 - 4,665 Grants and other receivables.................................. 532 4,512 131 1,861 - 2,937 - 14,141 24,114 33,478 - -
Capital assets:Land and other assets not being depreciated......... 296,183 1,015,270 91,551 1,387,285 38,105 401,741 119,488 322 3,349,945 3,333,650 - - Facilities, infrastructure, and
equipment, net of depreciation.............................. 3,749,453 3,883,231 312,698 1,760,592 147,217 1,657,921 311,362 523,398 12,345,872 11,416,556 10,985 9,572 Total capital assets............................................... 4,045,636 4,898,501 404,249 3,147,877 185,322 2,059,662 430,850 523,720 15,695,817 14,750,206 10,985 9,572
Total noncurrent assets...................................... 4,686,606 5,033,655 451,283 3,234,474 193,879 2,273,077 432,337 550,763 16,856,074 16,059,186 190,026 207,859 Total assets........................................................ 5,436,554 5,605,652 674,811 4,318,450 790,409 2,501,681 622,689 666,699 20,616,945 19,539,050 265,734 294,037
DEFERRED OUTFLOWS OF RESOURCESUnamortized loss on refunding of debt........................ 68,100 36,184 - - - 945 - - 105,229 118,867 1,091 1,171 Deferred outflows on derivative instruments............... 83,614 - - - - - - - 83,614 65,408 - - Deferred outflows related to pensions......................... 43,982 32,695 8,324 98,333 67,677 14,589 6,467 29,117 301,184 259,933 7,475 6,199
Total deferred outflows of resources.................. 195,696 68,879 8,324 98,333 67,677 15,534 6,467 29,117 490,027 444,208 8,566 7,370
Port of San
Francisco
Laguna Honda
Hospital
San Francisco
International Airport
San Francisco
Water Enterprise
Hetch Hetchy
Water and Power
Municipal Transportation
Agency
General Hospital Medical Center
San Francisco
Wastewater Enterprise
CITY AND COUNTY OF SAN FRANCISCO Statement of Net Position - Proprietary Funds (Continued)
June 30, 2016 (With comparative financial information as of June 30, 2015)
(In Thousands)
The notes to the financial statements are an integral part of this statement. 34
Business-Type Activities - Enterprise FundsMajor Funds
Total
Governmental Activities - Internal
Service Funds2016 2015 2016 2015
LIABILITIESCurrent liabilities:
Accounts payable...................................................... 56,483$ 16,319$ 16,041$ 131,103$ 37,361$ 8,242$ 3,207$ 1,792$ 270,548$ 241,510$ 7,459$ 8,580$ Accrued payroll.......................................................... 9,579 5,725 2,189 24,285 17,272 3,981 1,284 6,693 71,008 56,627 1,862 1,356 Accrued vacation and sick leave pay........................ 9,714 5,924 2,275 21,759 14,285 3,784 1,295 5,786 64,822 65,754 1,804 1,744 Accrued workers' compensation............................... 1,413 1,551 555 20,251 4,315 1,023 416 2,343 31,867 28,188 342 350 Estimated claims payable......................................... 1,346 6,094 598 37,762 - 6,383 625 - 52,808 50,390 - - Due to other funds..................................................... - 786 - 2,503 513 1,271 65 - 5,138 6,101 361 189 Unearned revenues and other liabilities.................... 67,556 24,804 4,175 141,576 339,969 2,398 12,488 28,258 621,224 638,191 21,049 28,632 Accrued interest payable........................................... - 36,348 534 2,996 97 9,666 1,618 1,626 52,885 53,202 1,315 1,429 Bonds, loans, capital leases, and other payables..... 163,797 279,928 2,007 7,672 30,239 82,482 2,456 6,148 574,729 526,282 14,025 18,795 Liabilities payable from restricted assets:
Bonds, loans, capital leases, and other payables.. 373,378 - - - - - - - 373,378 70,694 - - Accrued interest payable......................................... 31,475 - - - - - - - 31,475 33,587 - - Other....................................................................... 89,275 47,587 2,838 954 - 31,166 - 1,264 173,084 136,126 - -
Total current liabilities......................................... 804,016 425,066 31,212 390,861 444,051 150,396 23,454 53,910 2,322,966 1,906,652 48,217 61,075 Noncurrent liabilities:
Accrued vacation and sick leave pay........................ 7,326 4,532 1,532 13,047 10,230 2,761 896 3,467 43,791 38,906 1,298 1,150 Accrued workers' compensation............................... 5,244 7,263 2,409 97,389 25,591 4,635 2,311 12,894 157,736 143,702 1,522 1,593 Other postemployment benefits obligation................ 124,352 111,546 25,169 235,992 231,405 46,053 21,644 82,429 878,590 814,608 23,518 21,867 Estimated claims payable......................................... 131 10,806 1,263 41,460 - 10,250 350 - 64,260 56,780 - - Unearned revenue and other liabilities...................... - 16,417 - - - 2,621 75,376 - 94,414 89,096 - - Bonds, loans, capital leases, and other payables..... 4,235,551 4,331,632 73,384 198,160 15,673 1,080,081 89,006 127,538 10,151,025 10,137,573 183,192 197,733 Derivative instruments liabilities................................ 96,132 - - - - - - - 96,132 79,321 - - Net pension liability.................................................... 144,271 108,024 26,874 314,611 220,295 48,177 21,291 93,395 976,938 749,919 24,166 18,494
Total noncurrent liabilities................................... 4,613,007 4,590,220 130,631 900,659 503,194 1,194,578 210,874 319,723 12,462,886 12,109,905 233,696 240,837 Total liabilities...................................................... 5,417,023 5,015,286 161,843 1,291,520 947,245 1,344,974 234,328 373,633 14,785,852 14,016,557 281,913 301,912
DEFERRED INFLOWS OF RESOURCESUnamortized gain on refunding of debt........................ - - - 337 - - - - 337 393 - - Unamortized gain on leaseback transaction............... - - - 4,349 - - - - 4,349 16,141 - - Deferred inflows related to pensions........................... 48,154 36,577 8,678 99,620 72,374 16,301 7,158 29,736 318,598 671,917 7,829 16,569
Total deferred inflows of resources.................... 48,154 36,577 8,678 104,306 72,374 16,301 7,158 29,736 323,284 688,451 7,829 16,569
NET POSITIONNet investment in capital assets.................................. (117,377) 543,327 369,764 2,938,712 147,924 1,098,723 304,396 405,272 5,690,741 5,117,679 10,985 9,572 Restricted:
Debt service.............................................................. 35,462 12,122 306 17,999 - 981 - 60,203 127,073 100,923 - - Capital projects.......................................................... 212,931 40,743 1,409 - 31,882 18,205 26,152 9,574 340,896 358,745 - - Other purposes......................................................... - - - 67,644 - - - 2,861 70,505 35,986 - -
Unrestricted (deficit).................................................... 36,057 26,476 141,135 (3,398) (341,339) 38,031 57,122 (185,463) (231,379) (335,083) (26,427) (26,646) Total net position................................................. 167,073$ 622,668$ 512,614$ 3,020,957$ (161,533)$ 1,155,940$ 387,670$ 292,447$ 5,997,836$ 5,278,250$ (15,442)$ (17,074)$
San Francisco
Wastewater Enterprise
Port of San
Francisco
Laguna Honda
Hospital
San Francisco
International Airport
San Francisco
Water Enterprise
Hetch Hetchy
Water and Power
Municipal Transportation
Agency
General Hospital Medical Center
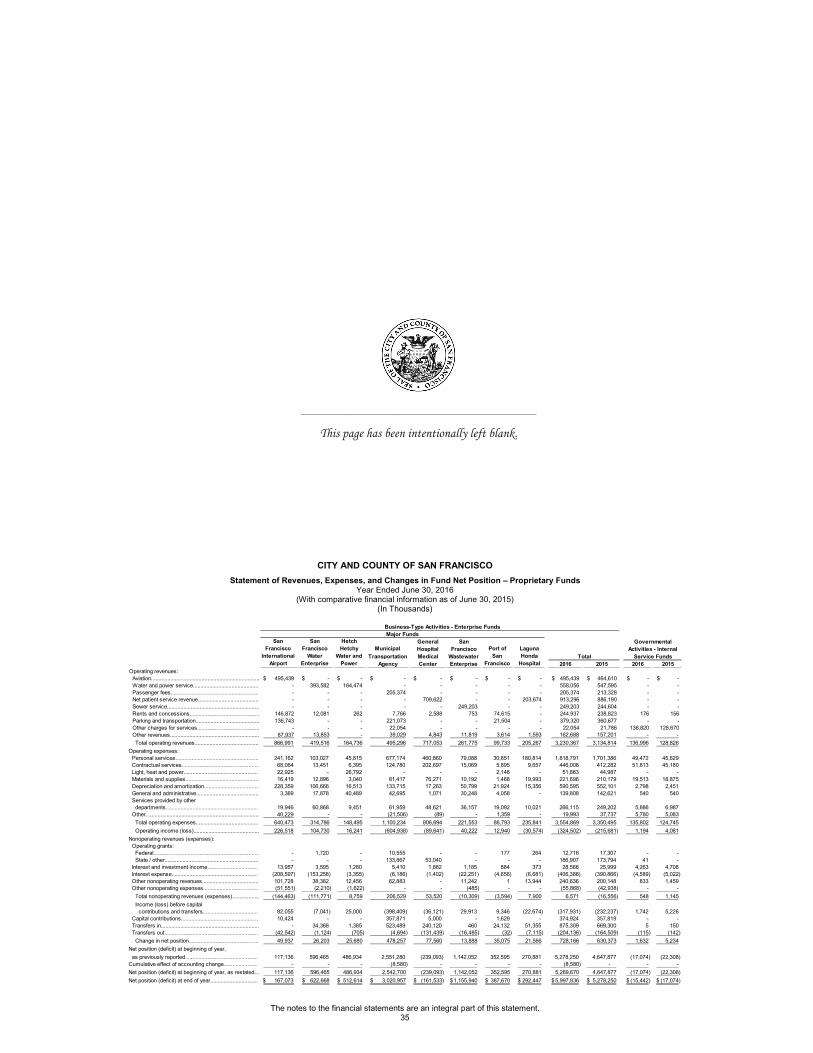
CITY AND COUNTY OF SAN FRANCISCO Statement of Revenues, Expenses, and Changes in Fund Net Position – Proprietary Funds
Year Ended June 30, 2016 (With comparative financial information as of June 30, 2015)
(In Thousands)
The notes to the financial statements are an integral part of this statement. 35
Business-Type Activities - Enterprise FundsMajor Funds
Total
Governmental Activities - Internal
Service Funds2016 2015 2016 2015
Operating revenues:Aviation......................................................................... 495,439$ -$ -$ -$ -$ -$ -$ -$ 495,439$ 464,610$ -$ -$ Water and power service............................................ - 393,582 164,474 - - - - - 558,056 547,595 - - Passenger fees........................................................... - - - 205,374 - - - - 205,374 213,328 - -Net patient service revenue......................................... - - - - 709,622 - - 203,674 913,296 886,190 - - Sewer service.............................................................. - - - - - 249,203 - - 249,203 244,604 - -Rents and concessions............................................... 146,872 12,081 262 7,766 2,588 753 74,615 - 244,937 238,823 176 156 Parking and transportation........................................... 136,743 - - 221,073 - - 21,504 - 379,320 360,677 - - Other charges for services.......................................... - - - 22,054 - - - - 22,054 21,786 136,820 128,670 Other revenues............................................................ 87,937 13,853 - 39,029 4,843 11,819 3,614 1,593 162,688 157,201 - -Total operating revenues........................................... 866,991 419,516 164,736 495,296 717,053 261,775 99,733 205,267 3,230,367 3,134,814 136,996 128,826
Operating expenses:Personal services........................................................ 241,162 103,027 45,815 677,174 460,860 79,088 30,851 180,814 1,818,791 1,701,386 49,472 45,629 Contractual services.................................................... 68,064 13,451 6,395 124,780 202,697 15,069 5,895 9,657 446,008 412,282 51,813 45,180 Light, heat and power.................................................. 22,925 - 26,792 - - - 2,146 - 51,863 44,987 - - Materials and supplies................................................. 16,419 12,896 3,040 81,417 76,271 10,192 1,468 19,993 221,696 210,179 19,513 18,875 Depreciation and amortization..................................... 228,359 106,666 16,513 133,715 17,263 50,799 21,924 15,356 590,595 552,101 2,798 2,451 General and administrative.......................................... 3,369 17,878 40,489 42,695 1,071 30,248 4,058 - 139,808 142,621 540 540 Services provided by other
departments.............................................................. 19,946 60,868 9,451 61,959 48,621 36,157 19,092 10,021 266,115 249,202 5,886 6,987 Other............................................................................ 40,229 - - (21,506) (89) - 1,359 - 19,993 37,737 5,780 5,083
Total operating expenses.......................................... 640,473 314,786 148,495 1,100,234 806,694 221,553 86,793 235,841 3,554,869 3,350,495 135,802 124,745 Operating income (loss)............................................ 226,518 104,730 16,241 (604,938) (89,641) 40,222 12,940 (30,574) (324,502) (215,681) 1,194 4,081
Nonoperating revenues (expenses):Operating grants:
Federal....................................................................... - 1,720 - 10,555 - - 177 264 12,716 17,307 - - State / other............................................................... - - - 133,867 53,040 - - - 186,907 173,794 41 -
Interest and investment income.................................. 13,957 3,595 1,280 5,410 1,882 1,185 884 373 28,566 25,999 4,263 4,708 Interest expense.......................................................... (208,597) (153,258) (3,355) (6,186) (1,402) (22,251) (4,656) (6,681) (406,386) (390,866) (4,589) (5,022) Other nonoperating revenues...................................... 101,728 38,382 12,456 62,883 - 11,242 1 13,944 240,636 200,148 833 1,459 Other nonoperating expenses..................................... (51,551) (2,210) (1,622) - - (485) - - (55,868) (42,938) - -
Total nonoperating revenues (expenses).................. (144,463) (111,771) 8,759 206,529 53,520 (10,309) (3,594) 7,900 6,571 (16,556) 548 1,145 Income (loss) before capital
contributions and transfers..................................... 82,055 (7,041) 25,000 (398,409) (36,121) 29,913 9,346 (22,674) (317,931) (232,237) 1,742 5,226 Capital contributions.................................................... 10,424 - - 357,871 5,000 - 1,629 - 374,924 357,819 - - Transfers in.................................................................. - 34,368 1,385 523,489 240,120 460 24,132 51,355 875,309 669,300 5 150 Transfers out............................................................... (42,542) (1,124) (705) (4,694) (131,439) (16,485) (32) (7,115) (204,136) (164,509) (115) (142)
Change in net position............................................... 49,937 26,203 25,680 478,257 77,560 13,888 35,075 21,566 728,166 630,373 1,632 5,234 Net position (deficit) at beginning of year,
as previously reported................................................. 117,136 596,465 486,934 2,551,280 (239,093) 1,142,052 352,595 270,881 5,278,250 4,647,877 (17,074) (22,308) Cumulative effect of accounting change....................... - - - (8,580) - - - - (8,580) - - - Net position (deficit) at beginning of year, as restated... 117,136 596,465 486,934 2,542,700 (239,093) 1,142,052 352,595 270,881 5,269,670 4,647,877 (17,074) (22,308) Net position (deficit) at end of year................................ 167,073$ 622,668$ 512,614$ 3,020,957$ (161,533)$ 1,155,940$ 387,670$ 292,447$ 5,997,836$ 5,278,250$ (15,442)$ (17,074)$
Port of San
Francisco
Laguna Honda
Hospital
San Francisco
International Airport
San Francisco
Water Enterprise
Hetch Hetchy
Water and Power
Municipal Transportation
Agency
General Hospital Medical Center
San Francisco
Wastewater Enterprise
________________________________________________
This page has been intentionally left blank.
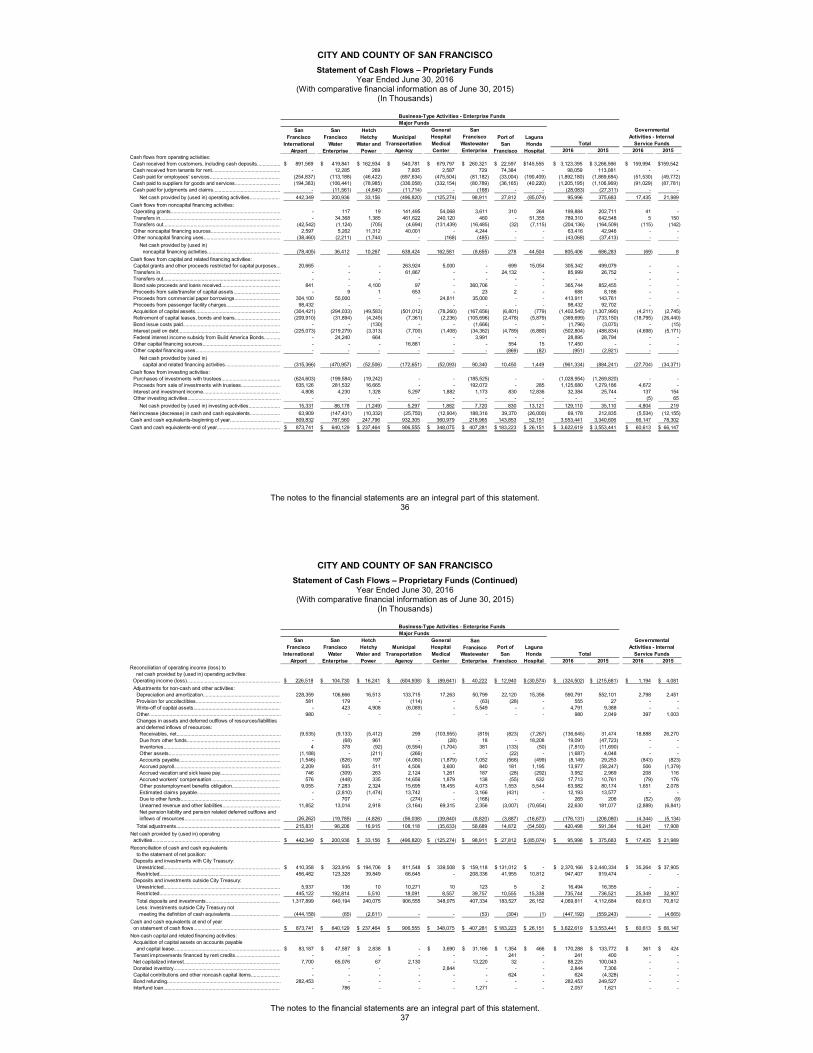
CITY AND COUNTY OF SAN FRANCISCO Statement of Cash Flows – Proprietary Funds
Year Ended June 30, 2016 (With comparative financial information as of June 30, 2015)
(In Thousands)
The notes to the financial statements are an integral part of this statement. 36
Business-Type Activities - Enterprise FundsMajor Funds
Total
Governmental Activities - Internal
Service Funds2016 2015 2016 2015
Cash flows from operating activities:Cash received from customers, including cash deposits................. 891,569$ 419,841$ 162,934$ 540,781$ 679,797$ 260,321$ 22,597$ 145,555$ 3,123,395$ 3,266,566$ 159,994$ 159,542$ Cash received from tenants for rent.................................................. - 12,285 269 7,805 2,587 729 74,384 - 98,059 113,081 - - Cash paid for employees' services................................................... (254,837) (113,188) (46,422) (697,634) (475,504) (81,182) (33,004) (190,409) (1,892,180) (1,869,684) (51,530) (49,772) Cash paid to suppliers for goods and services................................. (194,383) (106,441) (78,985) (336,058) (332,154) (80,789) (36,165) (40,220) (1,205,195) (1,106,969) (91,029) (87,781) Cash paid for judgments and claims................................................. - (11,561) (4,640) (11,714) - (168) - - (28,083) (27,311) - -
Net cash provided by (used in) operating activities...................... 442,349 200,936 33,156 (496,820) (125,274) 98,911 27,812 (85,074) 95,996 375,683 17,435 21,989 Cash flows from noncapital financing activities:
Operating grants................................................................................ - 117 19 141,495 54,068 3,611 310 264 199,884 202,711 41 - Transfers in........................................................................................ - 34,368 1,385 461,622 240,120 460 - 51,355 789,310 642,548 5 150 Transfers out..................................................................................... (42,542) (1,124) (705) (4,694) (131,439) (16,485) (32) (7,115) (204,136) (164,509) (115) (142) Other noncapital financing sources................................................... 2,597 5,262 11,312 40,001 - 4,244 - - 63,416 42,946 - - Other noncapital financing uses........................................................ (38,460) (2,211) (1,744) - (168) (485) - - (43,068) (37,413) - -
Net cash provided by (used in)noncapital financing activities..................................................... (78,405) 36,412 10,267 638,424 162,581 (8,655) 278 44,504 805,406 686,283 (69) 8
Cash flows from capital and related financing activities:Capital grants and other proceeds restricted for capital purposes... 20,665 - - 263,924 5,000 - 699 15,054 305,342 499,079 - - Transfers in........................................................................................ - - - 61,867 - - 24,132 - 85,999 26,752 - - Transfers out..................................................................................... - - - - - - - - - - - - Bond sale proceeds and loans received........................................... 841 - 4,100 97 - 360,706 - - 365,744 852,455 - - Proceeds from sale/transfer of capital assets.................................. - 9 1 653 - 23 2 - 688 8,186 - - Proceeds from commercial paper borrowings................................. 304,100 50,000 - - 24,811 35,000 - - 413,911 143,761 - - Proceeds from passenger facility charges....................................... 98,432 - - - - - - - 98,432 92,702 - - Acquisition of capital assets.............................................................. (304,421) (294,033) (49,583) (501,012) (78,260) (167,656) (6,801) (779) (1,402,545) (1,307,990) (4,211) (2,745) Retirement of capital leases, bonds and loans................................. (209,910) (31,894) (4,245) (7,361) (2,236) (105,696) (2,478) (5,879) (369,699) (733,150) (18,795) (26,440) Bond issue costs paid....................................................................... - - (130) - - (1,666) - - (1,796) (3,075) - (15) Interest paid on debt.......................................................................... (225,073) (219,279) (3,313) (7,700) (1,408) (34,362) (4,789) (6,880) (502,804) (488,834) (4,698) (5,171) Federal interest income subsidy from Build America Bonds............ - 24,240 664 - - 3,991 - - 28,895 28,794 - - Other capital financing sources......................................................... - - - 16,881 - - 554 15 17,450 - - - Other capital financing uses.............................................................. - - - - - - (869) (82) (951) (2,921) - -
Net cash provided by (used in)capital and related financing activities........................................ (315,366) (470,957) (52,506) (172,651) (52,093) 90,340 10,450 1,449 (961,334) (884,241) (27,704) (34,371)
Cash flows from investing activities:Purchases of investments with trustees........................................... (624,603) (199,584) (19,242) - - (185,525) - - (1,028,954) (1,269,820) - - Proceeds from sale of investments with trustees............................. 635,126 281,532 16,665 - - 192,072 - 285 1,125,680 1,279,186 4,672 - Interest and investment income........................................................ 4,808 4,230 1,328 5,297 1,882 1,173 830 12,836 32,384 25,744 137 154 Other investing activities.................................................................... - - - - - - - - - - (5) 65
Net cash provided by (used in) investing activities....................... 15,331 86,178 (1,249) 5,297 1,882 7,720 830 13,121 129,110 35,110 4,804 219 Net increase (decrease) in cash and cash equivalents...................... 63,909 (147,431) (10,332) (25,750) (12,904) 188,316 39,370 (26,000) 69,178 212,835 (5,534) (12,155) Cash and cash equivalents-beginning of year..................................... 809,832 787,560 247,796 932,305 360,979 218,965 143,853 52,151 3,553,441 3,340,606 66,147 78,302 Cash and cash equivalents-end of year.............................................. 873,741$ 640,129$ 237,464$ 906,555$ 348,075$ 407,281$ 183,223$ 26,151$ 3,622,619$ 3,553,441$ 60,613$ 66,147$
Port of San
Francisco
Laguna Honda
Hospital
San Francisco
International Airport
San Francisco
Water Enterprise
Hetch Hetchy
Water and Power
Municipal Transportation
Agency
General Hospital Medical Center
San Francisco
Wastewater Enterprise
CITY AND COUNTY OF SAN FRANCISCO Statement of Cash Flows – Proprietary Funds (Continued)
Year Ended June 30, 2016 (With comparative financial information as of June 30, 2015)
(In Thousands)
The notes to the financial statements are an integral part of this statement. 37
Business-Type Activities - Enterprise FundsMajor Funds
Total
Governmental Activities - Internal
Service Funds2016 2015 2016 2015
Reconciliation of operating income (loss) tonet cash provided by (used in) operating activities:
Operating income (loss).................................................................... 226,518$ 104,730$ 16,241$ (604,938)$ (89,641)$ 40,222$ 12,940$ (30,574)$ (324,502)$ (215,681)$ 1,194$ 4,081$ Adjustments for non-cash and other activities:
Depreciation and amortization........................................................ 228,359 106,666 16,513 133,715 17,263 50,799 22,120 15,356 590,791 552,101 2,798 2,451 Provision for uncollectibles.............................................................. 581 179 - (114) - (63) (28) - 555 27 - - Write-off of capital assets............................................................... - 423 4,908 (6,089) - 5,549 - - 4,791 9,388 - - Other................................................................................................ 980 - - - - - - - 980 2,049 397 1,003 Changes in assets and deferred outflows of resources/liabilitiesand deferred inflows of resources:
Receivables, net............................................................................ (9,535) (9,133) (5,412) 299 (103,955) (819) (823) (7,267) (136,645) 31,474 18,888 26,270 Due from other funds.................................................................... - (68) 961 - (28) 18 - 18,208 19,091 (47,723) - - Inventories..................................................................................... 4 378 (92) (6,594) (1,704) 381 (133) (50) (7,810) (11,690) - - Other assets................................................................................. (1,188) - (211) (266) - - (22) - (1,687) 4,048 - - Accounts payable.......................................................................... (1,546) (826) 197 (4,080) (1,879) 1,052 (568) (499) (8,149) 29,253 (843) (823) Accrued payroll.............................................................................. 2,209 935 511 4,506 3,600 840 181 1,195 13,977 (58,247) 506 (1,379) Accrued vacation and sick leave pay............................................ 746 (309) 263 2,124 1,261 187 (28) (292) 3,952 2,969 208 116 Accrued workers' compensation.................................................. 576 (448) 335 14,656 1,879 138 (55) 632 17,713 10,761 (79) 176 Other postemployment benefits obligation................................... 9,055 7,283 2,324 15,695 18,455 4,073 1,553 5,544 63,982 80,174 1,651 2,078 Estimated claims payable............................................................. - (2,810) (1,474) 13,742 - 3,166 (431) - 12,193 13,577 - - Due to other funds......................................................................... - 707 - (274) - (168) - - 265 206 (52) (9) Unearned revenue and other liabilities.......................................... 11,852 13,014 2,918 (3,164) 69,315 2,356 (3,007) (70,654) 22,630 181,077 (2,889) (6,841) Net pension liability and pension related deferred outflows andinflows of resources...................................................................... (26,262) (19,785) (4,826) (56,038) (39,840) (8,820) (3,887) (16,673) (176,131) (208,080) (4,344) (5,134)
Total adjustments............................................................................ 215,831 96,206 16,915 108,118 (35,633) 58,689 14,872 (54,500) 420,498 591,364 16,241 17,908 Net cash provided by (used in) operating
activities............................................................................................. 442,349$ 200,936$ 33,156$ (496,820)$ (125,274)$ 98,911$ 27,812$ (85,074)$ 95,996$ 375,683$ 17,435$ 21,989$ Reconciliation of cash and cash equivalents
to the statement of net position:Deposits and investments with City Treasury:
Unrestricted..................................................................................... 410,358$ 323,916$ 194,706$ 811,548$ 339,508$ 159,118$ 131,012$ -$ 2,370,166$ 2,440,334$ 35,264$ 37,905$ Restricted........................................................................................ 456,482 123,328 39,849 66,645 - 208,336 41,955 10,812 947,407 919,474 - -
Deposits and investments outside City Treasury:Unrestricted..................................................................................... 5,937 136 10 10,271 10 123 5 2 16,494 16,355 - - Restricted........................................................................................ 445,122 192,814 5,510 18,091 8,557 39,757 10,555 15,338 735,744 736,521 25,349 32,907 Total deposits and investments...................................................... 1,317,899 640,194 240,075 906,555 348,075 407,334 183,527 26,152 4,069,811 4,112,684 60,613 70,812 Less: Investments outside City Treasury not meeting the definition of cash equivalents.................................... (444,158) (65) (2,611) - - (53) (304) (1) (447,192) (559,243) - (4,665)
Cash and cash equivalents at end of yearon statement of cash flows............................................................... 873,741$ 640,129$ 237,464$ 906,555$ 348,075$ 407,281$ 183,223$ 26,151$ 3,622,619$ 3,553,441$ 60,613$ 66,147$
Non-cash capital and related financing activities:Acquisition of capital assets on accounts payable
and capital lease.............................................................................. 83,187$ 47,587$ 2,838$ -$ 3,690$ 31,166$ 1,354$ 466$ 170,288$ 133,772$ 361$ 424$ Tenant improvements financed by rent credits................................. - - - - - - 241 - 241 400 - - Net capitalized interest...................................................................... 7,700 65,076 67 2,130 - 13,220 32 - 88,225 100,043 - - Donated inventory.............................................................................. - - - - 2,844 - - - 2,844 7,306 - - Capital contributions and other noncash capital items..................... - - - - - - 624 - 624 (4,328) - - Bond refunding................................................................................... 282,453 - - - - - - - 282,453 249,527 - - Interfund loan..................................................................................... - 786 - - - 1,271 - - 2,057 1,621 - -
San Francisco
Wastewater Enterprise
Port of San
Francisco
Laguna Honda
Hospital
San Francisco
International Airport
San Francisco
Water Enterprise
Hetch Hetchy
Water and Power
Municipal Transportation
Agency
General Hospital Medical Center
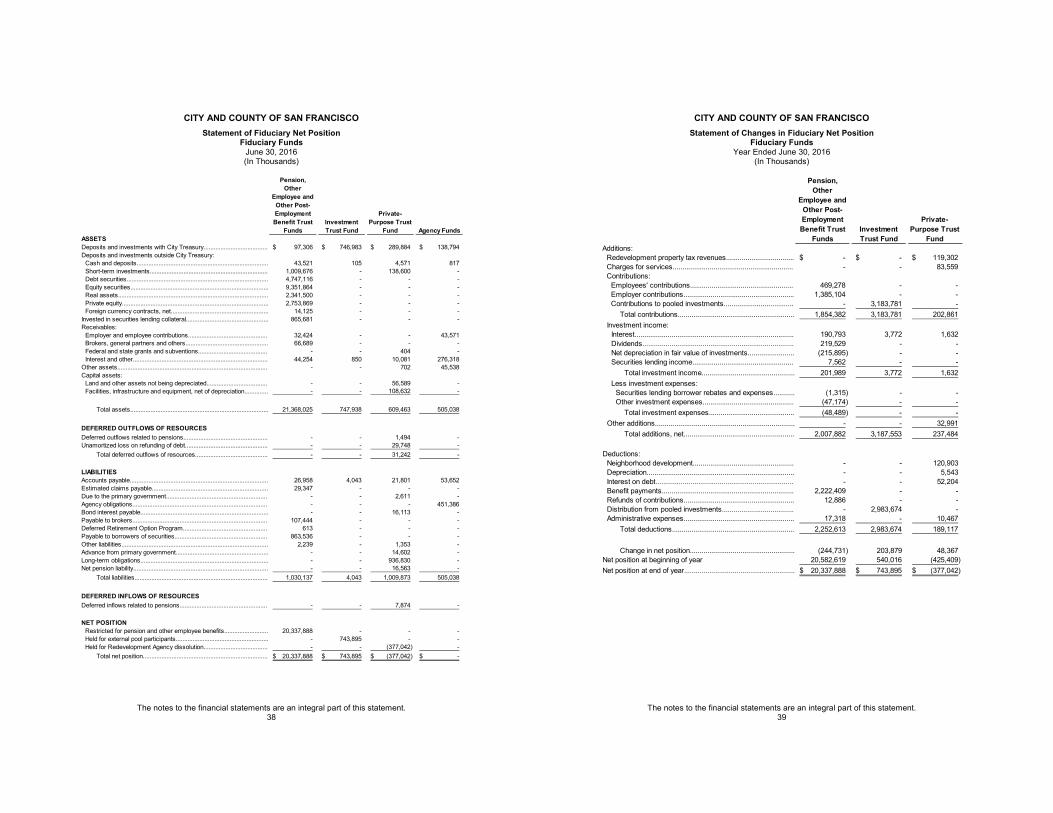
CITY AND COUNTY OF SAN FRANCISCO Statement of Fiduciary Net Position
Fiduciary Funds June 30, 2016 (In Thousands)
The notes to the financial statements are an integral part of this statement. 38
Pension, Other
Employee and Other Post-Employment Benefit Trust
FundsInvestment Trust Fund
Private-Purpose Trust
Fund Agency FundsASSETSDeposits and investments with City Treasury...................................... 97,306$ 746,983$ 289,884$ 138,794$ Deposits and investments outside City Treasury:
Cash and deposits.............................................................................. 43,521 105 4,571 817 Short-term investments...................................................................... 1,009,676 - 138,600 - Debt securities.................................................................................... 4,747,116 - - - Equity securities.................................................................................. 9,351,864 - - - Real assets......................................................................................... 2,341,500 - - - Private equity....................................................................................... 2,753,869 - - - Foreign currency contracts, net.......................................................... 14,125 - - -
Invested in securities lending collateral................................................. 865,681 - - - Receivables:
Employer and employee contributions............................................... 32,424 - - 43,571 Brokers, general partners and others................................................. 66,689 - - - Federal and state grants and subventions......................................... - - 404 - Interest and other................................................................................ 44,254 850 10,081 276,318
Other assets......................................................................................... - - 702 45,538 Capital assets:
Land and other assets not being depreciated.................................... - - 56,589 - Facilities, infrastructure and equipment, net of depreciation.............. - - 108,632 -
Total assets.................................................................................. 21,368,025 747,938 609,463 505,038
DEFERRED OUTFLOWS OF RESOURCESDeferred outflows related to pensions.................................................. - - 1,494 - Unamortized loss on refunding of debt................................................. - - 29,748 -
Total deferred outflows of resources........................................... - - 31,242 -
LIABILITIESAccounts payable.................................................................................. 26,958 4,043 21,801 53,652 Estimated claims payable..................................................................... 29,347 - - - Due to the primary government............................................................ - - 2,611 - Agency obligations................................................................................ - - - 451,386 Bond interest payable............................................................................ - - 16,113 - Payable to brokers................................................................................ 107,444 - - - Deferred Retirement Option Program.................................................. 613 - - - Payable to borrowers of securities....................................................... 863,536 - - - Other liabilities....................................................................................... 2,239 - 1,353 - Advance from primary government....................................................... - - 14,602 - Long-term obligations............................................................................ - - 936,830 - Net pension liability................................................................................ - - 16,563 -
Total liabilities............................................................................... 1,030,137 4,043 1,009,873 505,038
DEFERRED INFLOWS OF RESOURCESDeferred inflows related to pensions.................................................... - - 7,874 -
NET POSITIONRestricted for pension and other employee benefits.......................... 20,337,888 - - - Held for external pool participants....................................................... - 743,895 - - Held for Redevelopment Agency dissolution...................................... - - (377,042) -
Total net position.......................................................................... 20,337,888$ 743,895$ (377,042)$ -$
CITY AND COUNTY OF SAN FRANCISCO Statement of Changes in Fiduciary Net Position
Fiduciary Funds Year Ended June 30, 2016
(In Thousands)
The notes to the financial statements are an integral part of this statement. 39
Pension, Other
Employee and Other Post-Employment Benefit Trust
FundsInvestment Trust Fund
Private-Purpose Trust
FundAdditions:
Redevelopment property tax revenues................................... -$ -$ 119,302$ Charges for services.............................................................. - - 83,559 Contributions:
Employees' contributions..................................................... 469,278 - - Employer contributions......................................................... 1,385,104 - - Contributions to pooled investments.................................... - 3,183,781 -
Total contributions............................................................ 1,854,382 3,183,781 202,861 Investment income:
Interest.................................................................................. 190,793 3,772 1,632 Dividends.............................................................................. 219,529 - - Net depreciation in fair value of investments........................ (215,895) - - Securities lending income.................................................... 7,562 - -
Total investment income................................................ 201,989 3,772 1,632 Less investment expenses:
Securities lending borrower rebates and expenses........... (1,315) - - Other investment expenses............................................... (47,174) - -
Total investment expenses............................................ (48,489) - - Other additions........................................................................ - - 32,991
Total additions, net......................................................... 2,007,882 3,187,553 237,484
Deductions:Neighborhood development.................................................... - - 120,903 Depreciation............................................................................ - - 5,543 Interest on debt....................................................................... - - 52,204 Benefit payments.................................................................... 2,222,409 - - Refunds of contributions......................................................... 12,886 - - Distribution from pooled investments..................................... - 2,983,674 - Administrative expenses......................................................... 17,318 - 10,467
Total deductions............................................................... 2,252,613 2,983,674 189,117
Change in net position...................................................... (244,731) 203,879 48,367 Net position at beginning of year 20,582,619 540,016 (425,409) Net position at end of year......................................................... 20,337,888$ 743,895$ (377,042)$
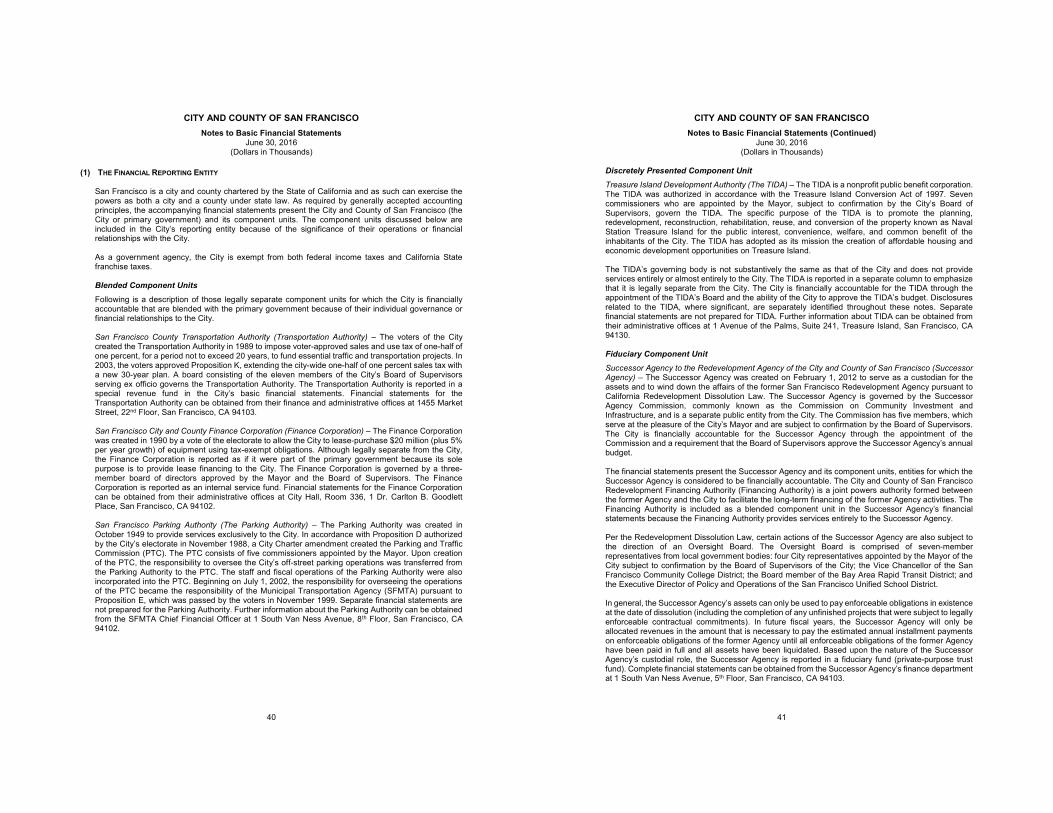
CITY AND COUNTY OF SAN FRANCISCO Notes to Basic Financial Statements
June 30, 2016 (Dollars in Thousands)
40
(1) THE FINANCIAL REPORTING ENTITY
San Francisco is a city and county chartered by the State of California and as such can exercise the powers as both a city and a county under state law. As required by generally accepted accounting principles, the accompanying financial statements present the City and County of San Francisco (the City or primary government) and its component units. The component units discussed below are included in the City’s reporting entity because of the significance of their operations or financial relationships with the City. As a government agency, the City is exempt from both federal income taxes and California State franchise taxes. Blended Component Units Following is a description of those legally separate component units for which the City is financially accountable that are blended with the primary government because of their individual governance or financial relationships to the City. San Francisco County Transportation Authority (Transportation Authority) – The voters of the City created the Transportation Authority in 1989 to impose voter-approved sales and use tax of one-half of one percent, for a period not to exceed 20 years, to fund essential traffic and transportation projects. In 2003, the voters approved Proposition K, extending the city-wide one-half of one percent sales tax with a new 30-year plan. A board consisting of the eleven members of the City’s Board of Supervisors serving ex officio governs the Transportation Authority. The Transportation Authority is reported in a special revenue fund in the City’s basic financial statements. Financial statements for the Transportation Authority can be obtained from their finance and administrative offices at 1455 Market Street, 22nd Floor, San Francisco, CA 94103. San Francisco City and County Finance Corporation (Finance Corporation) – The Finance Corporation was created in 1990 by a vote of the electorate to allow the City to lease-purchase $20 million (plus 5% per year growth) of equipment using tax-exempt obligations. Although legally separate from the City, the Finance Corporation is reported as if it were part of the primary government because its sole purpose is to provide lease financing to the City. The Finance Corporation is governed by a three-member board of directors approved by the Mayor and the Board of Supervisors. The Finance Corporation is reported as an internal service fund. Financial statements for the Finance Corporation can be obtained from their administrative offices at City Hall, Room 336, 1 Dr. Carlton B. Goodlett Place, San Francisco, CA 94102. San Francisco Parking Authority (The Parking Authority) – The Parking Authority was created in October 1949 to provide services exclusively to the City. In accordance with Proposition D authorized by the City’s electorate in November 1988, a City Charter amendment created the Parking and Traffic Commission (PTC). The PTC consists of five commissioners appointed by the Mayor. Upon creation of the PTC, the responsibility to oversee the City’s off-street parking operations was transferred from the Parking Authority to the PTC. The staff and fiscal operations of the Parking Authority were also incorporated into the PTC. Beginning on July 1, 2002, the responsibility for overseeing the operations of the PTC became the responsibility of the Municipal Transportation Agency (SFMTA) pursuant to Proposition E, which was passed by the voters in November 1999. Separate financial statements are not prepared for the Parking Authority. Further information about the Parking Authority can be obtained from the SFMTA Chief Financial Officer at 1 South Van Ness Avenue, 8th Floor, San Francisco, CA 94102.
CITY AND COUNTY OF SAN FRANCISCO Notes to Basic Financial Statements (Continued)
June 30, 2016 (Dollars in Thousands)
41
Discretely Presented Component Unit Treasure Island Development Authority (The TIDA) – The TIDA is a nonprofit public benefit corporation. The TIDA was authorized in accordance with the Treasure Island Conversion Act of 1997. Seven commissioners who are appointed by the Mayor, subject to confirmation by the City’s Board of Supervisors, govern the TIDA. The specific purpose of the TIDA is to promote the planning, redevelopment, reconstruction, rehabilitation, reuse, and conversion of the property known as Naval Station Treasure Island for the public interest, convenience, welfare, and common benefit of the inhabitants of the City. The TIDA has adopted as its mission the creation of affordable housing and economic development opportunities on Treasure Island. The TIDA’s governing body is not substantively the same as that of the City and does not provide services entirely or almost entirely to the City. The TIDA is reported in a separate column to emphasize that it is legally separate from the City. The City is financially accountable for the TIDA through the appointment of the TIDA’s Board and the ability of the City to approve the TIDA’s budget. Disclosures related to the TIDA, where significant, are separately identified throughout these notes. Separate financial statements are not prepared for TIDA. Further information about TIDA can be obtained from their administrative offices at 1 Avenue of the Palms, Suite 241, Treasure Island, San Francisco, CA 94130. Fiduciary Component Unit Successor Agency to the Redevelopment Agency of the City and County of San Francisco (Successor Agency) – The Successor Agency was created on February 1, 2012 to serve as a custodian for the assets and to wind down the affairs of the former San Francisco Redevelopment Agency pursuant to California Redevelopment Dissolution Law. The Successor Agency is governed by the Successor Agency Commission, commonly known as the Commission on Community Investment and Infrastructure, and is a separate public entity from the City. The Commission has five members, which serve at the pleasure of the City’s Mayor and are subject to confirmation by the Board of Supervisors. The City is financially accountable for the Successor Agency through the appointment of the Commission and a requirement that the Board of Supervisors approve the Successor Agency’s annual budget. The financial statements present the Successor Agency and its component units, entities for which the Successor Agency is considered to be financially accountable. The City and County of San Francisco Redevelopment Financing Authority (Financing Authority) is a joint powers authority formed between the former Agency and the City to facilitate the long-term financing of the former Agency activities. The Financing Authority is included as a blended component unit in the Successor Agency’s financial statements because the Financing Authority provides services entirely to the Successor Agency. Per the Redevelopment Dissolution Law, certain actions of the Successor Agency are also subject to the direction of an Oversight Board. The Oversight Board is comprised of seven-member representatives from local government bodies: four City representatives appointed by the Mayor of the City subject to confirmation by the Board of Supervisors of the City; the Vice Chancellor of the San Francisco Community College District; the Board member of the Bay Area Rapid Transit District; and the Executive Director of Policy and Operations of the San Francisco Unified School District. In general, the Successor Agency’s assets can only be used to pay enforceable obligations in existence at the date of dissolution (including the completion of any unfinished projects that were subject to legally enforceable contractual commitments). In future fiscal years, the Successor Agency will only be allocated revenues in the amount that is necessary to pay the estimated annual installment payments on enforceable obligations of the former Agency until all enforceable obligations of the former Agency have been paid in full and all assets have been liquidated. Based upon the nature of the Successor Agency’s custodial role, the Successor Agency is reported in a fiduciary fund (private-purpose trust fund). Complete financial statements can be obtained from the Successor Agency’s finance department at 1 South Van Ness Avenue, 5th Floor, San Francisco, CA 94103.
CITY AND COUNTY OF SAN FRANCISCO Notes to Basic Financial Statements (Continued)
June 30, 2016 (Dollars in Thousands)
42
Non-Disclosed Organizations There are other governmental agencies that provide services within the City. These entities have independent governing boards and the City is not financially accountable for them. The City’s basic financial statements, except for certain cash held by the City as an agent, do not reflect operations of the San Francisco Airport Improvement Corporation, San Francisco Health Authority, San Francisco Housing Authority, San Francisco Unified School District and San Francisco Community College District. The City is represented in two regional agencies, the Bay Area Rapid Transit District and the Bay Area Air Quality Management District, both of which are also excluded from the City’s reporting entity.
(2) SUMMARY OF SIGNIFICANT ACCOUNTING POLICIES
(a) Government-wide and fund financial statements The government-wide financial statements (i.e., the statement of net position and the statement of activities) report information on all of the non-fiduciary activities of the primary government and its component units. Governmental activities, which normally are supported by taxes and intergovernmental revenues, are reported separately from business-type activities, which rely, to a significant extent, on fees and charges for support. Likewise, the primary government is reported separately from certain legally separate component units for which the primary government is financially accountable. The statement of activities demonstrates the degree to which the direct expenses of a given function or segment is offset by program revenues. Direct expenses are those that are clearly identifiable with a specific function or segment. Program revenues include (1) charges to customers or applicants who purchase, use, or directly benefit from goods, services, or privileges provided by a given function or segment, and (2) grants and contributions that are restricted to meeting the operational or capital requirements of a particular function or segment. Taxes and other items not properly included among program revenues are reported instead as general revenues. Separate financial statements are provided for governmental funds, proprietary funds, and fiduciary funds, even though the latter are excluded from the government-wide financial statements. Major individual governmental funds and major individual enterprise funds are reported as separate columns in the fund financial statements. The basic financial statements include certain prior year summarized comparative information. This information is presented only to facilitate financial analysis, and is not at the level of detail required for a presentation in accordance with generally accepted accounting principles. Accordingly, such information should be read in conjunction with the City's financial statements for the year ended June 30, 2015, from which the summarized information was derived. (b) Measurement focus, basis of accounting, and financial statement presentation The government-wide financial statements are reported using the economic resources measurement focus and the accrual basis of accounting, as are the proprietary fund and fiduciary fund financial statements. Agency funds, however, report only assets and liabilities and cannot be said to have a measurement focus. Revenues are recorded when earned and expenses are recorded when a liability is incurred, regardless of the timing of related cash flows. Property taxes are recognized as revenues in the year for which they are levied. Grants and similar items are recognized as revenue as soon as all eligibility requirements have been met. Governmental fund financial statements are reported using the current financial resources measurement focus and the modified accrual basis of accounting. Revenues are recognized as soon as they are both measurable and available. Revenues are considered to be available when they are collectible within the current period or soon enough thereafter to pay liabilities of the current period. The
CITY AND COUNTY OF SAN FRANCISCO Notes to Basic Financial Statements (Continued)
June 30, 2016 (Dollars in Thousands)
43
City considers property tax revenues to be available if they are collected within 60 days of the end of the current fiscal period. All other revenues are considered to be available if they are generally collected within 60 days of the end of the current fiscal period. It is the City’s policy to submit reimbursement and claim requests for federal and state grant revenues within 30 days of the end of the program cycle and payment is generally received within the first or second quarter of the following fiscal year. Expenditures generally are recorded when a liability is incurred, as under accrual accounting. However, debt service expenditures, as well as expenditures related to vacation, sick leave, claims and judgments, are recorded only when payment is due.
Property taxes, other local taxes, grants and subventions, licenses, charges for services, rents and concessions, and interest associated with the current fiscal period are all considered susceptible to accrual and so have been recognized as revenues of the current fiscal period. All other revenue items are considered to be measurable and available only when the City receives cash. During the year ended June 30, 2016, the City adopted a new revenue recognition policy, and changed the availability period from 90 days to 60 days. The new policy more closely reflects the use of current resources to pay liabilities of the current period. The adoption of the new accounting principle resulted in a reduction in revenues by approximately $23.7 million for the year ended June 30, 2016, and did not have a significant impact on the financial statements as of and for the year ended June 30, 2015. The City reports the following major governmental fund: The General Fund is the City’s primary operating fund. It accounts for all financial resources of the
City except those required to be accounted for in another fund. The City reports the following major proprietary (enterprise) funds: The San Francisco International Airport Fund accounts for the activities of the City-owned
commercial service airport in the San Francisco Bay Area. The San Francisco Water Enterprise Fund accounts for the activities of the San Francisco Water
Enterprise (Water Enterprise). The Water Enterprise is engaged in the distribution of water to the City and certain suburban areas.
The Hetch Hetchy Water and Power Enterprise Fund accounts for the activities of Hetch Hetchy Water and Power Department (Hetch Hetchy). The department is engaged in the collection and conveyance of approximately 85% of the City’s water supply and in the generation and transmission of electricity.
The Municipal Transportation Agency Fund accounts for the activities of the Municipal Transportation Agency (SFMTA). The SFMTA was established by Proposition E, passed by the City’s voters in November 1999. The SFMTA includes the San Francisco Municipal Railway (Muni) and the operations of Sustainable Streets, which includes the Parking Authority. Muni was established in 1912 and is responsible for the operations of the City’s public transportation system. Sustainable Streets is responsible for proposing and implementing street and traffic changes and oversees the City’s off-street parking operations. Sustainable Streets is a separate department of the SFMTA. The parking garages fund accounts for the activities of various non-profit corporations formed by the Parking Authority to provide financial and other assistance to the City to acquire land, construct facilities, and manage various parking facilities.
The General Hospital Medical Center Fund accounts for the activities of the San Francisco General Hospital (SFGH), a City-owned acute care hospital.
The San Francisco Wastewater Enterprise Fund was created after the San Francisco voters approved a proposition in 1976, authorizing the City to issue $240 million in bonds for the purpose of acquiring, construction, improving, and financing improvements to the City’s municipal sewage treatment and disposal system.
CITY AND COUNTY OF SAN FRANCISCO Notes to Basic Financial Statements (Continued)
June 30, 2016 (Dollars in Thousands)
44
The Port of San Francisco Fund accounts for the operation, development, and maintenance of seven and one-half miles of waterfront property of the Port of San Francisco (Port). This was established in 1969 after the San Francisco voters approved a proposition to accept the transfer of the Harbor of San Francisco from the State of California.
The Laguna Honda Hospital Fund accounts for the activities of Laguna Honda Hospital (LHH), the City-owned skilled nursing facility, which specializes in serving elderly and disabled residents.
Additionally, the City reports the following fund types: The Debt Service Funds account for the accumulation of property taxes and other revenues for
periodic payment of interest and principal on general obligation and certain lease revenue bonds and related authorized costs.
The Capital Projects Funds are used to account for financial resources that are restricted, committed or assigned to expenditures for the acquisition of land or acquisition and construction of major facilities other than those financed in the proprietary fund types.
The Special Revenue Funds are used to account for the proceeds of specific revenue sources that are restricted or committed to expenditures for specified purposes other than debt service or capital projects
The Permanent Fund accounts for resources that are legally restricted to the extent that only earnings, not principal, may be used for purposes that support specific programs.
The Internal Service Funds account for the financing of goods or services provided by one City department to another City department on a cost-reimbursement basis. Internal Service Funds account for the activities of the equipment maintenance services, centralized printing and mailing services, centralized telecommunications and information services, and lease financing through the Finance Corporation.
The Pension, Other Employee and Other Postemployment Benefit Trust Funds reflect the activities of the Employees’ Retirement System (Retirement System), the Health Service System and the Retiree Health Care Trust Fund. The Retirement System accounts for employee contributions, City contributions, and the earnings and profits from investments. It also accounts for the disbursements made for employee retirement benefits, withdrawals, disability and death benefits as well as administrative expenses. The Health Service System accounts for contributions from active and retired employees and surviving spouses, City contributions, and the earnings and profits from investments. It also accounts for the disbursements to various health plans and health care providers for the medical expenses of beneficiaries. The Retiree Health Care Trust Fund currently accounts for other postemployment benefit contributions from the City and the San Francisco Community College District, together with the earnings and profits from investments. No disbursements, other than to defray reasonable expenses of administering the trust, will be made until sufficient funds are set aside to pay for all future retiree health care costs, except in certain limited circumstances.
The Investment Trust Fund accounts for the external portion of the Treasurer’s Office investment pool. The funds of the San Francisco Community College District, San Francisco Unified School District, the Trial Courts of the State of California and the Transbay Joint Powers Authority are accounted for within the Investment Trust Fund.
The Private-Purpose Trust Fund accounts for the custodial responsibilities that are assigned to the Successor Agency with the passage of the Redevelopment Dissolution Act.
The Agency Funds account for the resources held by the City in a custodial capacity on behalf of: the State of California and other governmental agencies; employees for payroll deductions; and human welfare, community health, and transportation programs.
The City applies all applicable Governmental Accounting Standards Board (GASB) pronouncements.
CITY AND COUNTY OF SAN FRANCISCO Notes to Basic Financial Statements (Continued)
June 30, 2016 (Dollars in Thousands)
45
In general, the effect of interfund activity has been eliminated from the government-wide financial statements. Exceptions to this rule are charges to other City departments from the General Fund, Water Enterprise and Hetch Hetchy. These charges have not been eliminated because elimination would distort the direct costs and program revenues reported in the statement of activities. Proprietary funds distinguish operating revenues and expenses from nonoperating items. Operating revenues and expenses generally result from providing services in connection with the fund’s principal ongoing operations. The principal operating revenues of the City’s enterprise and internal service funds are charges for customer services including: water, sewer and power charges, public transportation fees, airline fees and charges, parking fees, hospital patient service fees, commercial and industrial rents, printing services, vehicle maintenance fees, and telecommunication and information system support charges. Operating expenses for enterprise funds and internal service funds include the cost of services, administrative expenses, and depreciation on capital assets. All revenues and expenses not meeting this definition are reported as nonoperating revenues and expenses. When both restricted and unrestricted resources are available for use, it is the City’s policy to use restricted resources first, then unrestricted resources as they are needed. (c) Budgetary Data
The City adopts two-year rolling budgets annually for all governmental funds on a substantially modified accrual basis of accounting except for capital project funds and certificates of participation and other debt service funds, which substantially adopt project length budgets. The budget of the City is a detailed operating plan, which identifies estimated costs and results in relation to estimated revenues. The budget includes (1) the programs, projects, services, and activities to be provided during the fiscal year, (2) the estimated resources (inflows) available for appropriation, and (3) the estimated charges to appropriations. The budget represents a process through which policy decisions are deliberated, implemented, and controlled. The City Charter prohibits expending funds for which there is no legal appropriation. The Administrative Code Chapter 3 outlines the City’s general budgetary procedures, with Section 3.3 detailing the budget timeline. A summary of the key budgetary steps is summarized as follows: Original Budget
(1) Departments and Commissions conduct hearings to obtain public comment on their proposed annual budgets beginning in December and submit their budget proposals to the Controller’s Office no later than February 21.
(2) The Controller’s Office consolidates the budget estimates and transmits them to the Mayor’s Office no later than the first working day of March. Staff of the Mayor’s Office analyze, review and refine the budget estimates before transmitting the Mayor’s Proposed Budget to the Board of Supervisors.
(3) By the first working day of May, the Mayor submits the Proposed Budget for selected departments to the Board of Supervisors. The selected departments are determined by the Controller in consultation with the Board President and the Mayor’s Budget Director. Criteria for selecting the departments include (1) that they are not supported by the City’s General Fund or (2) that they do not rely on the State’s budget submission in May for their revenue sources.
(4) By the first working day of June, the Mayor submits the complete Proposed Budget to the Board of Supervisors along with a draft of the Annual Appropriation Ordinance prepared by the Controller’s Office.
(5) Within five working days of the Mayor’s proposed budget transmission to the Board of Supervisors, the Controller reviews the estimated revenues and assumptions in the Mayor’s Proposed Budget and provides an opinion as to their accuracy and reasonableness. The Controller also may make
CITY AND COUNTY OF SAN FRANCISCO Notes to Basic Financial Statements (Continued)
June 30, 2016 (Dollars in Thousands)
46
a recommendation regarding prudent reserves given the Mayor’s proposed resources and expenditures.
(6) The designated Committee (usually the Budget Committee) of the Board of Supervisors conducts hearings, hears public comment, and reviews the Mayor’s Proposed Budget. The Committee recommends an interim budget reflecting the Mayor’s budget transmittal and, by June 30, the Board of Supervisors passes an interim appropriation and salary ordinances.
(7) Not later than the last working day of July, the Board of Supervisors adopts the budget through passage of the Annual Appropriation Ordinance, the legal authority for enactment of the budget.
Final Budget The final budgetary data presented in the basic financial statements reflects the following changes to the original budget:
(1) Certain annual appropriations are budgeted on a project or program basis. If such projects or programs are not completed at the end of the fiscal year, unexpended appropriations, including encumbered funds, are carried forward to the following year. In certain circumstances, other programs and regular annual appropriations may be carried forward after appropriate approval. Annually appropriated funds, not authorized to be carried forward, lapse at the end of the fiscal year. Appropriations carried forward from the prior year are included in the final budgetary data.
(2) Appropriations may be adjusted during the year with the approval of the Mayor and the Board of Supervisors, e.g. supplemental appropriations. Additionally, the Controller is authorized to make certain transfers of surplus appropriations within a department. Such adjustments are reflected in the final budgetary data.
The Annual Appropriation Ordinance adopts the budget at the character level of expenditure within departments. As described above, the Controller is authorized to make certain transfers of appropriations within departments. Accordingly, the legal level of budgetary control by the Board of Supervisors is the department level.
Budgetary data, as revised, is presented in the basic financial statements for the General Fund. Final budgetary data excludes the amount reserved for encumbrances for appropriate comparison to actual expenditures.
(d) Deposits and Investments Investment in the Treasurer’s Pool The Treasurer invests on behalf of most funds of the City and external participants in accordance with the City’s investment policy and the California State Government Code. The City Treasurer who reports on a monthly basis to the Board of Supervisors manages the Treasurer’s pool. In addition, the function of the County Treasury Oversight Committee is to review and monitor the City’s investment policy and to monitor compliance with the investment policy and reporting provisions of the law through an annual audit. The Treasurer’s investment pool consists of two components: 1) pooled deposits and investments and 2) dedicated investment funds. The dedicated investment funds represent restricted funds and relate to Successor Agency separately managed funds, bond issues of the Enterprise Funds, and the General Fund’s cash reserve requirement. In addition to the Treasurer’s investment pool, the City has other funds that are held by trustees. These funds are related to the issuance of bonds and certain loan programs of the City. The investments of the Retirement System and of the Retiree Health Care Trust Fund are held by trustees. The San Francisco Unified School District (School District), San Francisco Community College District (Community College District), and the City are involuntary participants in the City’s investment pool. As of June 30, 2016, involuntary participants accounted for approximately 95.6% of the pool. Voluntary
CITY AND COUNTY OF SAN FRANCISCO Notes to Basic Financial Statements (Continued)
June 30, 2016 (Dollars in Thousands)
47
participants accounted for 4.4% of the pool. Further, the School District, Community College District, the Trial Courts of the State of California, and the Transbay Joint Powers Authority are external participants of the City’s pool. At June 30, 2016, $743.9 million was held on behalf of these external participants. The total percentage share of the City’s pool that relates to these four external participants is 9.4%. Internal participants accounted for 90.6% of the pool. Investment Valuation
Investments are carried at fair value, except for certain non-negotiable investments that are reported at cost because they are not transferable and have terms that are not affected by changes in market interest rates, such as collateralized certificates of deposit and public time deposits. The fair value of investments is determined monthly and is based on current market prices. The fair value of participants’ position in the pool approximates the value of the pool shares. The method used to determine the value of participants’ equity is based on the book value of the participants’ percentage participation. In the event that a certain fund overdraws its share of pooled cash, the overdraft is covered by the General Fund and a payable to the General Fund is established in the City’s basic financial statements. Retirement System – Investments are reported at fair value. Securities traded on national or international exchanges are valued at the last reported sales price at current exchange rates. Securities that do not have an established market are reported at estimated fair value derived from third-party pricing services. Purchases and sales of investments are recorded on a trade date basis. The fair values of real estate investments are based on net asset values provided by the investment managers. Private equity investments represent interest in limited partnerships. The fair values of private equity investments are also based on net asset values provided by the general partners. For investments that are not traded on national or international exchanges with closing market prices available data is obtained to corroborate pricing. The Charter and Retirement Board policies permit the Retirement System to use investments to enter into securities lending transactions – loans of securities to broker-dealers and other entities for collateral with a simultaneous agreement to return the collateral for the same securities in the future. The collateral may consist of cash or non-cash; non-cash collateral is generally U.S. Treasuries or other U.S. government obligations. The Retirement System’s securities custodian is the agent in lending the domestic securities for collateral of 102% and international securities for collateral of 105%. Contracts with the lending agent require them to indemnify the Retirement System if the borrowers fail to return the securities (and if the collateral were inadequate to replace the securities lent) or fail to pay the Retirement System for income distributions by the securities’ issuers while the securities are on loan. Non-cash collateral cannot be pledged or sold unless the borrower defaults, and therefore, is not reported in the Retirement System’s financial statements. All securities loans can be terminated on demand by either the Retirement System or the borrower, although the average term of the loans as of June 30, 2016 was 78 days. All cash collateral received was invested in a separately managed account by the lending agent using investment guidelines developed and approved by the Retirement System. As of June 30, 2016, the weighted average maturity of the reinvested cash collateral account was 25 days. The term to maturity of the loaned securities is generally not matched with the term to maturity of the investment of the said collateral. Cash collateral may also be invested separately in term loans, in which case the maturity of the loaned securities matches the term of the loan. Cash collateral invested in the separate account managed by the lending agent is reported at fair value. Payable to borrowers of securities in the statement of fiduciary net position represents the cash collateral received from borrowers. Additionally, the income and costs of securities lending transactions, such as borrower rebates and fees, are recorded respectively as revenues and expenses in the statement of changes in fiduciary net position.
CITY AND COUNTY OF SAN FRANCISCO Notes to Basic Financial Statements (Continued)
June 30, 2016 (Dollars in Thousands)
48
San Francisco International Airport – The Airport has entered into certain derivative instruments, which it values at fair value, in accordance with GASB Statement No. 53 – Accounting and Financial Reporting for Derivative Instruments and GASB Statement No. 72 – Fair Value Measurement and Application. The Airport applies hedge accounting for changes in the fair value of hedging derivative instruments, in accordance with GASB Statement No. 64 – Derivative Instruments: Application of Hedge Accounting Termination Provisions, an amendment of GASB Statement No. 53. Under hedge accounting, if the derivatives are determined to be effective hedges, the changes in the fair value of hedging derivative instruments are reported as either deferred inflows or deferred outflows in the statement of net position, otherwise changes in fair value are recorded within the investment revenue classification. Other funds – Non-pooled investments are also generally carried at fair value. However, money market investments (such as short-term, highly liquid debt instruments including commercial paper, bankers’ acceptances, and U.S. Treasury and agency obligations) that have a remaining maturity at the time of purchase of one year or less and participating interest-earning investment contracts (such as negotiable certificates of deposit, repurchase agreements and guaranteed or bank investment contracts) are carried at amortized cost, which approximates fair value. The fair value of non-pooled investments is determined annually and is based on current market prices. The fair value of investments in open-end mutual funds is determined based on the fund’s current share price. Investment Income Income from pooled investments is allocated at month-end to the individual funds or external participants based on the fund or participant’s average daily cash balance in relation to total pooled investments. City management has determined that the investment income related to certain funds should be allocated to the General Fund. On a budget basis, the interest income is recorded in the General Fund. On a generally accepted accounting principles (GAAP) basis, the income is reported in the fund where the related investments reside. A transfer is then recorded to transfer an amount equal to the interest earnings to the General Fund. This is the case for certain other governmental funds, Internal Service, Investment Trust and Agency Funds. It is the City’s policy to charge interest at month-end to those funds that have a negative average daily cash balance. In certain instances, City management has determined that the interest expense related to the fund should be allocated to the General Fund. On a budget basis, the interest expense is recorded in the General Fund. On a GAAP basis, the interest expense is recorded in the fund and then a transfer from the General Fund for an amount equal to the interest expense is made to the fund. This is the case for certain other funds, SFMTA, LHH, SFGH, and the Internal Service Funds. Income from non-pooled investments is recorded based on the specific investments held by the fund. The interest income is recorded in the fund that earned the interest. (e) Loans Receivable The Mayor’s Office of Housing (MOH) and the Mayor’s Office of Community Development (MOCD) administer several housing and small business subsidy programs and issue loans to qualified applicants. In addition, the Department of Building Inspection manages other receivables from organizations. Management has determined through policy that many of these loans may be forgiven or renegotiated and extended long into the future if certain terms and conditions of the loans are met. At June 30, 2016, it was determined that $1,122.0 million of the $1,203.8 million loan portfolio is not expected to be ultimately collected. For the purposes of the fund financial statements, the governmental funds expenditures relating to long-term loans arising from loan subsidy programs are charged to operations upon funding and the loans are recorded, net of an estimated allowance for potentially uncollectible loans, with an offset to a deferred inflow of resources. For purposes of the government-wide financial statements, long-term loans are not offset by deferred inflows of resources.
CITY AND COUNTY OF SAN FRANCISCO Notes to Basic Financial Statements (Continued)
June 30, 2016 (Dollars in Thousands)
49
(f) Inventories Inventories recorded in the proprietary funds primarily consist of construction materials and maintenance supplies, as well as pharmaceutical supplies maintained by the hospitals. Generally, proprietary funds value inventory at cost or average cost and expense supply inventory as it is consumed. This is referred to as the consumption method of inventory accounting. The governmental fund types use the purchase method to account for supply inventories, which are not material. This method records items as expenditures when they are acquired. (g) Property Held for Resale Property held for resale includes both residential and commercial property and is recorded as other assets at the lower of estimated cost or estimated conveyance value. Estimated conveyance value is management’s estimate of net realizable value of each property parcel based on its current intended use. Property held for sale may, during the period it is held by the City, generate rental income, which is recognized as it becomes due and is considered collectible. (h) Capital Assets Capital assets, which include land, facilities and improvements, machinery and equipment, infrastructure assets, and intangible assets, are reported in the applicable governmental or business-type activities columns in the government-wide financial statements and in the proprietary and private-purpose trust funds. Capital assets, except for intangible assets, are defined as assets with an initial individual cost of more than $5 thousand and have an estimated life that extends beyond a single reporting period or more than a year. Intangible assets have a capitalization threshold of $100 thousand. Such assets are recorded at historical cost or estimated historical cost if purchased or constructed. Donated capital assets are recorded at estimated fair value at the date of donation. Capital outlay is recorded as expenditures of the General Fund and other governmental funds and as assets in the government-wide financial statements to the extent the City’s capitalization threshold is met. Interest incurred during the construction phase of the capital assets of business-type activities is reflected in the capitalized value of the asset constructed, net of interest earned on the invested proceeds of tax-exempt debt over the same period. Amortization of assets acquired under capital leases is included in depreciation and amortization. Facilities and improvements, infrastructure, machinery and equipment, easements, and intangible assets of the primary government, as well as the component units, are depreciated using the straight-line method over the following estimated useful lives:
Assets
Years
Facilities and improvements 15 to 175 Infrastructure 15 to 70 Machinery and equipment 2 to 75 Intangible assets Varies with type
Works of art, historical treasures and zoological animals held for public exhibition, education, or research in furtherance of public service, rather than financial gain, are not capitalized. These items are protected, kept unencumbered, cared for, and preserved by the City. It is the City’s policy to utilize proceeds from the sale of these items for the acquisition of other items for collection and display. (i) Accrued Vacation and Sick Leave Pay
Vacation pay, which may be accumulated up to ten weeks depending on an employee’s length of service, is payable upon termination. Sick leave may be accumulated up to six months. Unused amounts accumulated prior to December 6, 1978 are vested and payable upon termination of employment by retirement or disability caused by industrial accident or death.
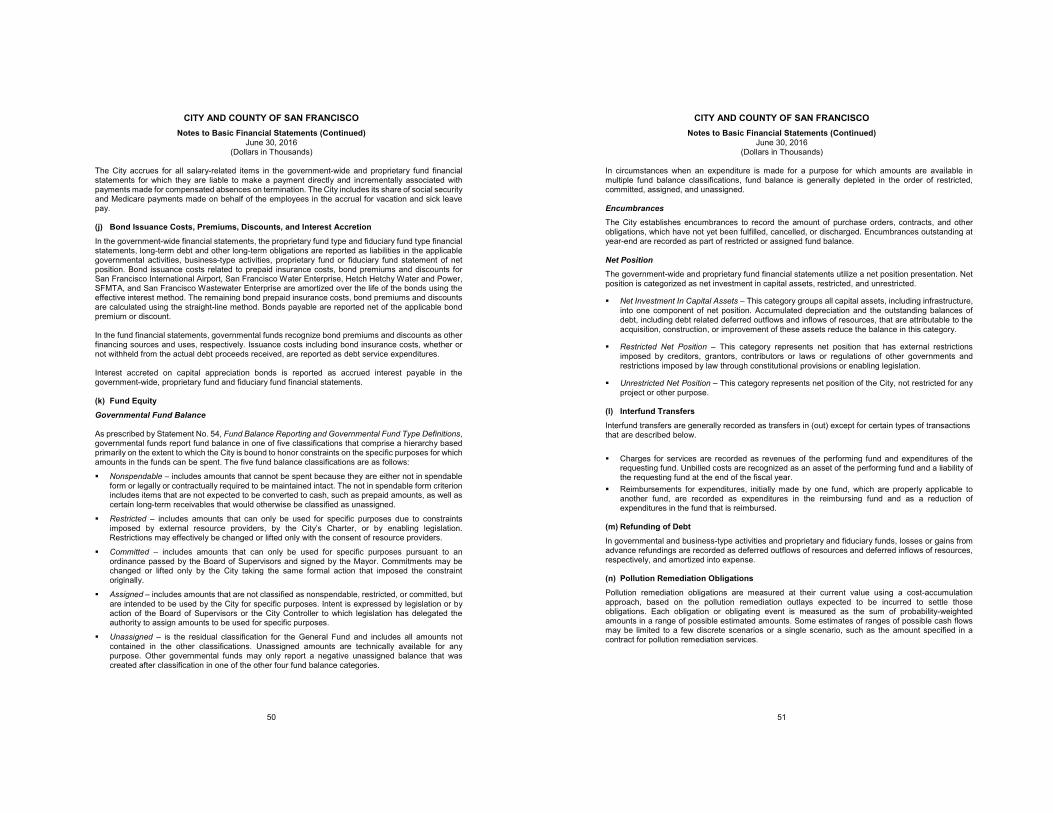
CITY AND COUNTY OF SAN FRANCISCO Notes to Basic Financial Statements (Continued)
June 30, 2016 (Dollars in Thousands)
50
The City accrues for all salary-related items in the government-wide and proprietary fund financial statements for which they are liable to make a payment directly and incrementally associated with payments made for compensated absences on termination. The City includes its share of social security and Medicare payments made on behalf of the employees in the accrual for vacation and sick leave pay. (j) Bond Issuance Costs, Premiums, Discounts, and Interest Accretion
In the government-wide financial statements, the proprietary fund type and fiduciary fund type financial statements, long-term debt and other long-term obligations are reported as liabilities in the applicable governmental activities, business-type activities, proprietary fund or fiduciary fund statement of net position. Bond issuance costs related to prepaid insurance costs, bond premiums and discounts for San Francisco International Airport, San Francisco Water Enterprise, Hetch Hetchy Water and Power, SFMTA, and San Francisco Wastewater Enterprise are amortized over the life of the bonds using the effective interest method. The remaining bond prepaid insurance costs, bond premiums and discounts are calculated using the straight-line method. Bonds payable are reported net of the applicable bond premium or discount. In the fund financial statements, governmental funds recognize bond premiums and discounts as other financing sources and uses, respectively. Issuance costs including bond insurance costs, whether or not withheld from the actual debt proceeds received, are reported as debt service expenditures. Interest accreted on capital appreciation bonds is reported as accrued interest payable in the government-wide, proprietary fund and fiduciary fund financial statements. (k) Fund Equity
Governmental Fund Balance As prescribed by Statement No. 54, Fund Balance Reporting and Governmental Fund Type Definitions, governmental funds report fund balance in one of five classifications that comprise a hierarchy based primarily on the extent to which the City is bound to honor constraints on the specific purposes for which amounts in the funds can be spent. The five fund balance classifications are as follows:
Nonspendable – includes amounts that cannot be spent because they are either not in spendable form or legally or contractually required to be maintained intact. The not in spendable form criterion includes items that are not expected to be converted to cash, such as prepaid amounts, as well as certain long-term receivables that would otherwise be classified as unassigned.
Restricted – includes amounts that can only be used for specific purposes due to constraints imposed by external resource providers, by the City’s Charter, or by enabling legislation. Restrictions may effectively be changed or lifted only with the consent of resource providers.
Committed – includes amounts that can only be used for specific purposes pursuant to an ordinance passed by the Board of Supervisors and signed by the Mayor. Commitments may be changed or lifted only by the City taking the same formal action that imposed the constraint originally.
Assigned – includes amounts that are not classified as nonspendable, restricted, or committed, but are intended to be used by the City for specific purposes. Intent is expressed by legislation or by action of the Board of Supervisors or the City Controller to which legislation has delegated the authority to assign amounts to be used for specific purposes.
Unassigned – is the residual classification for the General Fund and includes all amounts not contained in the other classifications. Unassigned amounts are technically available for any purpose. Other governmental funds may only report a negative unassigned balance that was created after classification in one of the other four fund balance categories.
CITY AND COUNTY OF SAN FRANCISCO Notes to Basic Financial Statements (Continued)
June 30, 2016 (Dollars in Thousands)
51
In circumstances when an expenditure is made for a purpose for which amounts are available in multiple fund balance classifications, fund balance is generally depleted in the order of restricted, committed, assigned, and unassigned.
Encumbrances The City establishes encumbrances to record the amount of purchase orders, contracts, and other obligations, which have not yet been fulfilled, cancelled, or discharged. Encumbrances outstanding at year-end are recorded as part of restricted or assigned fund balance. Net Position The government-wide and proprietary fund financial statements utilize a net position presentation. Net position is categorized as net investment in capital assets, restricted, and unrestricted.
Net Investment In Capital Assets – This category groups all capital assets, including infrastructure, into one component of net position. Accumulated depreciation and the outstanding balances of debt, including debt related deferred outflows and inflows of resources, that are attributable to the acquisition, construction, or improvement of these assets reduce the balance in this category.
Restricted Net Position – This category represents net position that has external restrictions imposed by creditors, grantors, contributors or laws or regulations of other governments and restrictions imposed by law through constitutional provisions or enabling legislation.
Unrestricted Net Position – This category represents net position of the City, not restricted for any project or other purpose.
(l) Interfund Transfers
Interfund transfers are generally recorded as transfers in (out) except for certain types of transactions that are described below. Charges for services are recorded as revenues of the performing fund and expenditures of the
requesting fund. Unbilled costs are recognized as an asset of the performing fund and a liability of the requesting fund at the end of the fiscal year.
Reimbursements for expenditures, initially made by one fund, which are properly applicable to another fund, are recorded as expenditures in the reimbursing fund and as a reduction of expenditures in the fund that is reimbursed.
(m) Refunding of Debt In governmental and business-type activities and proprietary and fiduciary funds, losses or gains from advance refundings are recorded as deferred outflows of resources and deferred inflows of resources, respectively, and amortized into expense.
(n) Pollution Remediation Obligations Pollution remediation obligations are measured at their current value using a cost-accumulation approach, based on the pollution remediation outlays expected to be incurred to settle those obligations. Each obligation or obligating event is measured as the sum of probability-weighted amounts in a range of possible estimated amounts. Some estimates of ranges of possible cash flows may be limited to a few discrete scenarios or a single scenario, such as the amount specified in a contract for pollution remediation services.
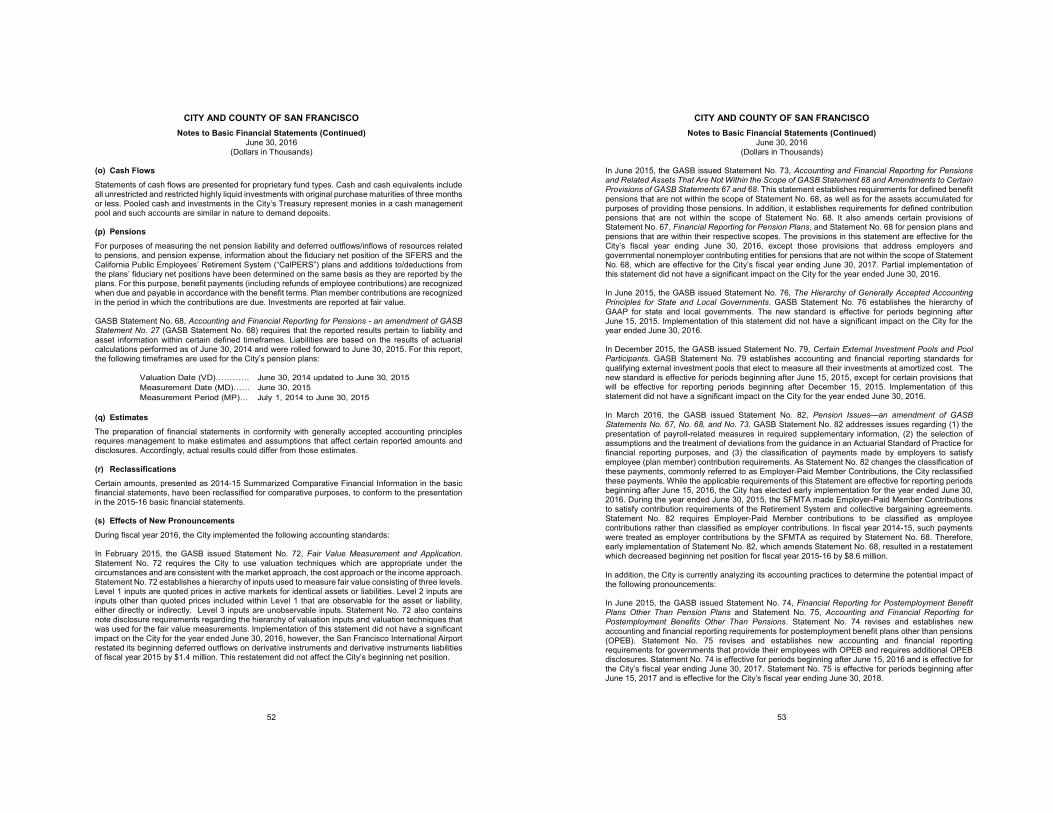
CITY AND COUNTY OF SAN FRANCISCO Notes to Basic Financial Statements (Continued)
June 30, 2016 (Dollars in Thousands)
52
(o) Cash Flows
Statements of cash flows are presented for proprietary fund types. Cash and cash equivalents include all unrestricted and restricted highly liquid investments with original purchase maturities of three months or less. Pooled cash and investments in the City’s Treasury represent monies in a cash management pool and such accounts are similar in nature to demand deposits. (p) Pensions For purposes of measuring the net pension liability and deferred outflows/inflows of resources related to pensions, and pension expense, information about the fiduciary net position of the SFERS and the California Public Employees’ Retirement System (“CalPERS”) plans and additions to/deductions from the plans’ fiduciary net positions have been determined on the same basis as they are reported by the plans. For this purpose, benefit payments (including refunds of employee contributions) are recognized when due and payable in accordance with the benefit terms. Plan member contributions are recognized in the period in which the contributions are due. Investments are reported at fair value. GASB Statement No. 68, Accounting and Financial Reporting for Pensions - an amendment of GASB Statement No. 27 (GASB Statement No. 68) requires that the reported results pertain to liability and asset information within certain defined timeframes. Liabilities are based on the results of actuarial calculations performed as of June 30, 2014 and were rolled forward to June 30, 2015. For this report, the following timeframes are used for the City’s pension plans:
(q) Estimates
The preparation of financial statements in conformity with generally accepted accounting principles requires management to make estimates and assumptions that affect certain reported amounts and disclosures. Accordingly, actual results could differ from those estimates. (r) Reclassifications
Certain amounts, presented as 2014-15 Summarized Comparative Financial Information in the basic financial statements, have been reclassified for comparative purposes, to conform to the presentation in the 2015-16 basic financial statements. (s) Effects of New Pronouncements During fiscal year 2016, the City implemented the following accounting standards: In February 2015, the GASB issued Statement No. 72, Fair Value Measurement and Application. Statement No. 72 requires the City to use valuation techniques which are appropriate under the circumstances and are consistent with the market approach, the cost approach or the income approach. Statement No. 72 establishes a hierarchy of inputs used to measure fair value consisting of three levels. Level 1 inputs are quoted prices in active markets for identical assets or liabilities. Level 2 inputs are inputs other than quoted prices included within Level 1 that are observable for the asset or liability, either directly or indirectly. Level 3 inputs are unobservable inputs. Statement No. 72 also contains note disclosure requirements regarding the hierarchy of valuation inputs and valuation techniques that was used for the fair value measurements. Implementation of this statement did not have a significant impact on the City for the year ended June 30, 2016, however, the San Francisco International Airport restated its beginning deferred outflows on derivative instruments and derivative instruments liabilities of fiscal year 2015 by $1.4 million. This restatement did not affect the City’s beginning net position.
Valuation Date (VD)………… June 30, 2014 updated to June 30, 2015Measurement Date (MD)…… June 30, 2015Measurement Period (MP)… July 1, 2014 to June 30, 2015
CITY AND COUNTY OF SAN FRANCISCO Notes to Basic Financial Statements (Continued)
June 30, 2016 (Dollars in Thousands)
53
In June 2015, the GASB issued Statement No. 73, Accounting and Financial Reporting for Pensions and Related Assets That Are Not Within the Scope of GASB Statement 68 and Amendments to Certain Provisions of GASB Statements 67 and 68. This statement establishes requirements for defined benefit pensions that are not within the scope of Statement No. 68, as well as for the assets accumulated for purposes of providing those pensions. In addition, it establishes requirements for defined contribution pensions that are not within the scope of Statement No. 68. It also amends certain provisions of Statement No. 67, Financial Reporting for Pension Plans, and Statement No. 68 for pension plans and pensions that are within their respective scopes. The provisions in this statement are effective for the City’s fiscal year ending June 30, 2016, except those provisions that address employers and governmental nonemployer contributing entities for pensions that are not within the scope of Statement No. 68, which are effective for the City’s fiscal year ending June 30, 2017. Partial implementation of this statement did not have a significant impact on the City for the year ended June 30, 2016. In June 2015, the GASB issued Statement No. 76, The Hierarchy of Generally Accepted Accounting Principles for State and Local Governments. GASB Statement No. 76 establishes the hierarchy of GAAP for state and local governments. The new standard is effective for periods beginning after June 15, 2015. Implementation of this statement did not have a significant impact on the City for the year ended June 30, 2016. In December 2015, the GASB issued Statement No. 79, Certain External Investment Pools and Pool Participants. GASB Statement No. 79 establishes accounting and financial reporting standards for qualifying external investment pools that elect to measure all their investments at amortized cost. The new standard is effective for periods beginning after June 15, 2015, except for certain provisions that will be effective for reporting periods beginning after December 15, 2015. Implementation of this statement did not have a significant impact on the City for the year ended June 30, 2016. In March 2016, the GASB issued Statement No. 82, Pension Issues—an amendment of GASB Statements No. 67, No. 68, and No. 73. GASB Statement No. 82 addresses issues regarding (1) the presentation of payroll-related measures in required supplementary information, (2) the selection of assumptions and the treatment of deviations from the guidance in an Actuarial Standard of Practice for financial reporting purposes, and (3) the classification of payments made by employers to satisfy employee (plan member) contribution requirements. As Statement No. 82 changes the classification of these payments, commonly referred to as Employer-Paid Member Contributions, the City reclassified these payments. While the applicable requirements of this Statement are effective for reporting periods beginning after June 15, 2016, the City has elected early implementation for the year ended June 30, 2016. During the year ended June 30, 2015, the SFMTA made Employer-Paid Member Contributions to satisfy contribution requirements of the Retirement System and collective bargaining agreements. Statement No. 82 requires Employer-Paid Member contributions to be classified as employee contributions rather than classified as employer contributions. In fiscal year 2014-15, such payments were treated as employer contributions by the SFMTA as required by Statement No. 68. Therefore, early implementation of Statement No. 82, which amends Statement No. 68, resulted in a restatement which decreased beginning net position for fiscal year 2015-16 by $8.6 million. In addition, the City is currently analyzing its accounting practices to determine the potential impact of the following pronouncements:
In June 2015, the GASB issued Statement No. 74, Financial Reporting for Postemployment Benefit Plans Other Than Pension Plans and Statement No. 75, Accounting and Financial Reporting for Postemployment Benefits Other Than Pensions. Statement No. 74 revises and establishes new accounting and financial reporting requirements for postemployment benefit plans other than pensions (OPEB). Statement No. 75 revises and establishes new accounting and financial reporting requirements for governments that provide their employees with OPEB and requires additional OPEB disclosures. Statement No. 74 is effective for periods beginning after June 15, 2016 and is effective for the City’s fiscal year ending June 30, 2017. Statement No. 75 is effective for periods beginning after June 15, 2017 and is effective for the City’s fiscal year ending June 30, 2018.
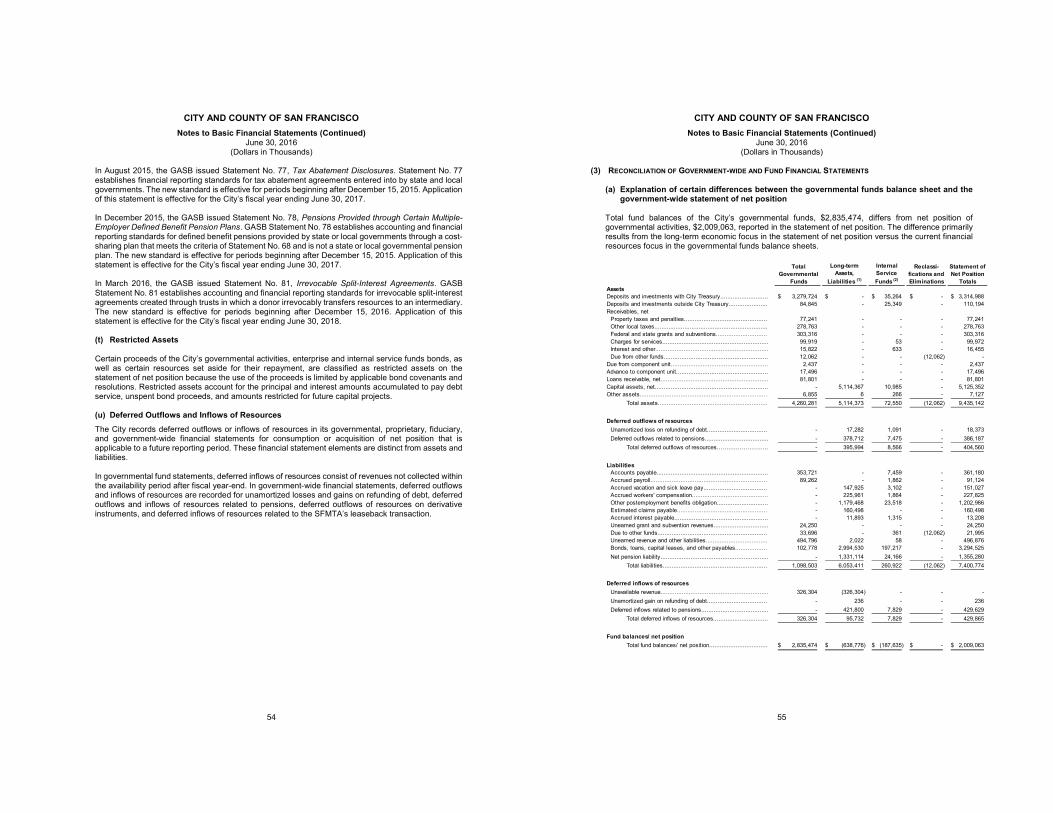
CITY AND COUNTY OF SAN FRANCISCO Notes to Basic Financial Statements (Continued)
June 30, 2016 (Dollars in Thousands)
54
In August 2015, the GASB issued Statement No. 77, Tax Abatement Disclosures. Statement No. 77 establishes financial reporting standards for tax abatement agreements entered into by state and local governments. The new standard is effective for periods beginning after December 15, 2015. Application of this statement is effective for the City’s fiscal year ending June 30, 2017. In December 2015, the GASB issued Statement No. 78, Pensions Provided through Certain Multiple-Employer Defined Benefit Pension Plans. GASB Statement No. 78 establishes accounting and financial reporting standards for defined benefit pensions provided by state or local governments through a cost-sharing plan that meets the criteria of Statement No. 68 and is not a state or local governmental pension plan. The new standard is effective for periods beginning after December 15, 2015. Application of this statement is effective for the City’s fiscal year ending June 30, 2017. In March 2016, the GASB issued Statement No. 81, Irrevocable Split-Interest Agreements. GASB Statement No. 81 establishes accounting and financial reporting standards for irrevocable split-interest agreements created through trusts in which a donor irrevocably transfers resources to an intermediary. The new standard is effective for periods beginning after December 15, 2016. Application of this statement is effective for the City’s fiscal year ending June 30, 2018.
(t) Restricted Assets
Certain proceeds of the City’s governmental activities, enterprise and internal service funds bonds, as well as certain resources set aside for their repayment, are classified as restricted assets on the statement of net position because the use of the proceeds is limited by applicable bond covenants and resolutions. Restricted assets account for the principal and interest amounts accumulated to pay debt service, unspent bond proceeds, and amounts restricted for future capital projects. (u) Deferred Outflows and Inflows of Resources The City records deferred outflows or inflows of resources in its governmental, proprietary, fiduciary, and government-wide financial statements for consumption or acquisition of net position that is applicable to a future reporting period. These financial statement elements are distinct from assets and liabilities. In governmental fund statements, deferred inflows of resources consist of revenues not collected within the availability period after fiscal year-end. In government-wide financial statements, deferred outflows and inflows of resources are recorded for unamortized losses and gains on refunding of debt, deferred outflows and inflows of resources related to pensions, deferred outflows of resources on derivative instruments, and deferred inflows of resources related to the SFMTA’s leaseback transaction.
CITY AND COUNTY OF SAN FRANCISCO Notes to Basic Financial Statements (Continued)
June 30, 2016 (Dollars in Thousands)
55
(3) RECONCILIATION OF GOVERNMENT-WIDE AND FUND FINANCIAL STATEMENTS
(a) Explanation of certain differences between the governmental funds balance sheet and the government-wide statement of net position
Total fund balances of the City’s governmental funds, $2,835,474, differs from net position of governmental activities, $2,009,063, reported in the statement of net position. The difference primarily results from the long-term economic focus in the statement of net position versus the current financial resources focus in the governmental funds balance sheets.
Total Governmental
Funds
Long-term Assets,
Liabilities (1)
Internal Service Funds (2)
Reclassi-fications and Eliminations
Statement of Net Position
TotalsAssetsDeposits and investments with City Treasury........................... 3,279,724$ -$ 35,264$ -$ 3,314,988$ Deposits and investments outside City Treasury...................... 84,845 - 25,349 - 110,194 Receivables, net
Property taxes and penalties............................................... 77,241 - - - 77,241 Other local taxes................................................................ 278,763 - - - 278,763 Federal and state grants and subventions............................. 303,316 - - - 303,316 Charges for services............................................................ 99,919 - 53 - 99,972 Interest and other................................................................ 15,822 - 633 - 16,455 Due from other funds........................................................... 12,062 - - (12,062) -
Due from component unit....................................................... 2,437 - - - 2,437 Advance to component unit.................................................... 17,496 - - - 17,496 Loans receivable, net............................................................. 81,801 - - - 81,801 Capital assets, net................................................................ - 5,114,367 10,985 - 5,125,352 Other assets........................................................................ 6,855 6 266 - 7,127
Total assets.............................................................. 4,260,281 5,114,373 72,550 (12,062) 9,435,142
Deferred outflows of resourcesUnamortized loss on refunding of debt.................................. - 17,282 1,091 - 18,373 Deferred outflows related to pensions.................................... - 378,712 7,475 - 386,187
Total deferred outflows of resources……………………... - 395,994 8,566 - 404,560
LiabilitiesAccounts payable............................................................... 353,721 - 7,459 - 361,180 Accrued payroll.................................................................. 89,262 - 1,862 - 91,124 Accrued vacation and sick leave pay.................................... - 147,925 3,102 - 151,027 Accrued workers' compensation........................................... - 225,961 1,864 - 227,825 Other postemployment benefits obligation............................. - 1,179,468 23,518 - 1,202,986 Estimated claims payable................................................... - 160,498 - - 160,498 Accrued interest payable..................................................... - 11,893 1,315 - 13,208 Unearned grant and subvention revenues............................... 24,250 - - - 24,250 Due to other funds.............................................................. 33,696 - 361 (12,062) 21,995 Unearned revenue and other liabilities................................... 494,796 2,022 58 - 496,876 Bonds, loans, capital leases, and other payables.................. 102,778 2,994,530 197,217 - 3,294,525 Net pension liability............................................................. - 1,331,114 24,166 - 1,355,280
Total liabilities........................................................... 1,098,503 6,053,411 260,922 (12,062) 7,400,774
Deferred inflows of resourcesUnavailable revenue............................................................. 326,304 (326,304) - - - Unamortized gain on refunding of debt.................................. - 236 - - 236 Deferred inflows related to pensions...................................... - 421,800 7,829 - 429,629
Total deferred inflows of resources............................... 326,304 95,732 7,829 - 429,865
Fund balances/ net positionTotal fund balances/ net position................................. 2,835,474$ (638,776)$ (187,635)$ -$ 2,009,063$
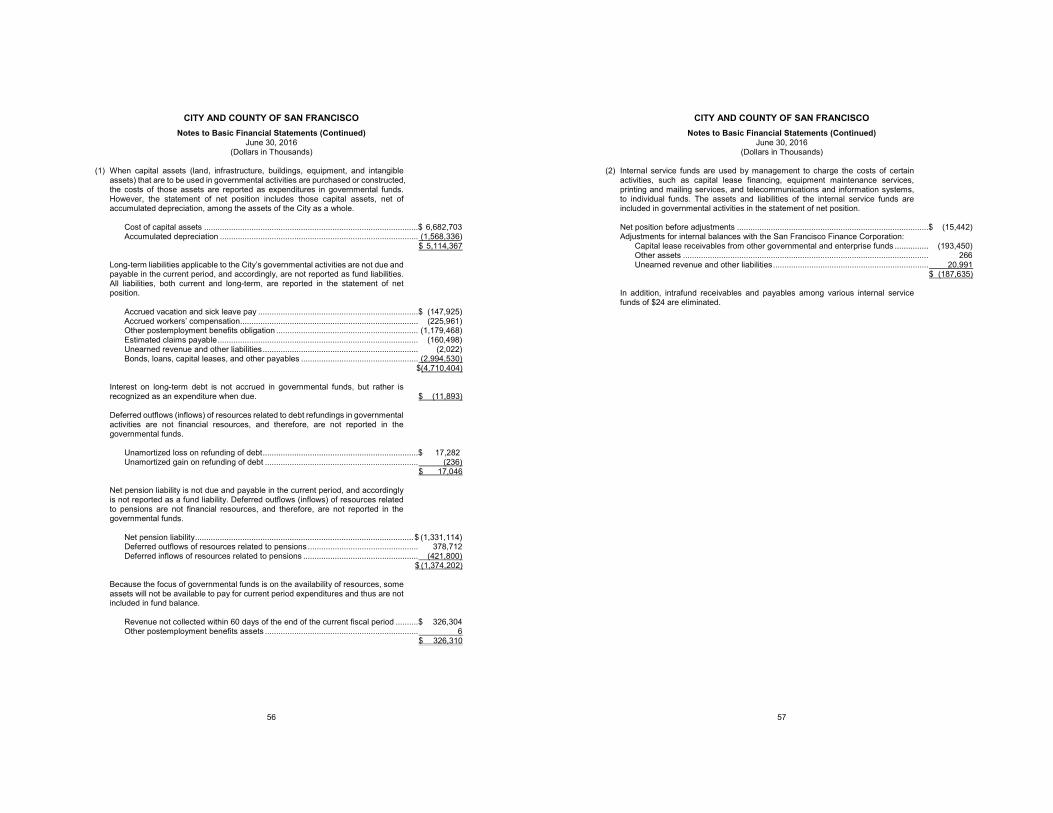
CITY AND COUNTY OF SAN FRANCISCO Notes to Basic Financial Statements (Continued)
June 30, 2016 (Dollars in Thousands)
56
(1) When capital assets (land, infrastructure, buildings, equipment, and intangible assets) that are to be used in governmental activities are purchased or constructed, the costs of those assets are reported as expenditures in governmental funds. However, the statement of net position includes those capital assets, net of accumulated depreciation, among the assets of the City as a whole.
Cost of capital assets ............................................................................................... $ 6,682,703 Accumulated depreciation ........................................................................................ (1,568,336)
$ 5,114,367 Long-term liabilities applicable to the City’s governmental activities are not due and payable in the current period, and accordingly, are not reported as fund liabilities. All liabilities, both current and long-term, are reported in the statement of net position.
Accrued vacation and sick leave pay ....................................................................... $ (147,925) Accrued workers’ compensation............................................................................... (225,961) Other postemployment benefits obligation ............................................................... (1,179,468) Estimated claims payable ......................................................................................... (160,498) Unearned revenue and other liabilities ..................................................................... (2,022) Bonds, loans, capital leases, and other payables .................................................... (2,994,530)
$(4,710,404) Interest on long-term debt is not accrued in governmental funds, but rather is recognized as an expenditure when due. $ (11,893) Deferred outflows (inflows) of resources related to debt refundings in governmental activities are not financial resources, and therefore, are not reported in the governmental funds.
Unamortized loss on refunding of debt ..................................................................... $ 17,282 Unamortized gain on refunding of debt .................................................................... (236)
$ 17,046 Net pension liability is not due and payable in the current period, and accordingly is not reported as a fund liability. Deferred outflows (inflows) of resources related to pensions are not financial resources, and therefore, are not reported in the governmental funds.
Net pension liability ................................................................................................. $ (1,331,114) Deferred outflows of resources related to pensions ................................................. 378,712 Deferred inflows of resources related to pensions ................................................... (421,800)
$ (1,374,202)
Because the focus of governmental funds is on the availability of resources, some assets will not be available to pay for current period expenditures and thus are not included in fund balance.
Revenue not collected within 60 days of the end of the current fiscal period .......... $ 326,304 Other postemployment benefits assets .................................................................... 6
$ 326,310
CITY AND COUNTY OF SAN FRANCISCO Notes to Basic Financial Statements (Continued)
June 30, 2016 (Dollars in Thousands)
57
(2) Internal service funds are used by management to charge the costs of certain activities, such as capital lease financing, equipment maintenance services, printing and mailing services, and telecommunications and information systems, to individual funds. The assets and liabilities of the internal service funds are included in governmental activities in the statement of net position. Net position before adjustments ..................................................................................... $ (15,442) Adjustments for internal balances with the San Francisco Finance Corporation:
Capital lease receivables from other governmental and enterprise funds ............... (193,450) Other assets ............................................................................................................. 266 Unearned revenue and other liabilities ..................................................................... 20,991
$ (187,635) In addition, intrafund receivables and payables among various internal service funds of $24 are eliminated.
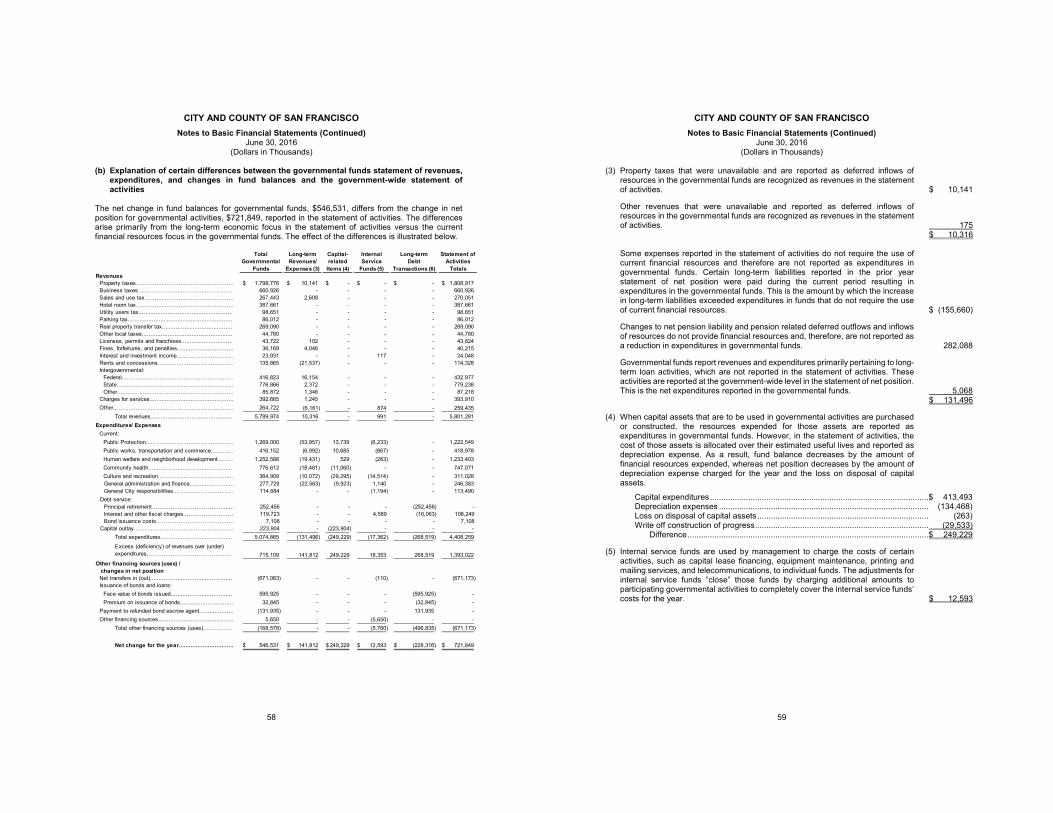
CITY AND COUNTY OF SAN FRANCISCO Notes to Basic Financial Statements (Continued)
June 30, 2016 (Dollars in Thousands)
58
(b) Explanation of certain differences between the governmental funds statement of revenues, expenditures, and changes in fund balances and the government-wide statement of activities
The net change in fund balances for governmental funds, $546,531, differs from the change in net position for governmental activities, $721,849, reported in the statement of activities. The differences arise primarily from the long-term economic focus in the statement of activities versus the current financial resources focus in the governmental funds. The effect of the differences is illustrated below.
Total Governmental
Funds
Long-term Revenues/
Expenses (3)
Capital-related
Items (4)
Internal Service
Funds (5)
Long-term Debt
Transactions (6)
Statement of Activities
TotalsRevenues
Property taxes......................................................... 1,798,776$ 10,141$ -$ -$ -$ 1,808,917$ Business taxes....................................................... 660,926 - - - - 660,926 Sales and use tax.................................................... 267,443 2,608 - - - 270,051 Hotel room tax......................................................... 387,661 - - - - 387,661 Utility users tax....................................................... 98,651 - - - - 98,651 Parking tax............................................................. 86,012 - - - - 86,012 Real property transfer tax......................................... 269,090 - - - - 269,090 Other local taxes..................................................... 44,780 - - - - 44,780 Licenses, permits and franchises.............................. 43,722 102 - - - 43,824 Fines, forfeitures, and penalties................................. 36,169 4,046 - - - 40,215 Interest and investment income................................. 23,931 - - 117 - 24,048 Rents and concessions............................................ 135,865 (21,537) - - - 114,328 Intergovernmental:
Federal................................................................. 416,823 16,154 - - - 432,977 State.................................................................... 776,866 2,372 - - - 779,238 Other.................................................................... 85,872 1,346 - - - 87,218
Charges for services................................................. 392,665 1,245 - - - 393,910 Other...................................................................... 264,722 (6,161) - 874 - 259,435
Total revenues................................................ 5,789,974 10,316 - 991 - 5,801,281 Expenditures/ Expenses
Current:Public Protection................................................... 1,269,000 (53,957) 13,739 (6,233) - 1,222,549 Public works, transportation and commerce............. 416,152 (6,992) 10,685 (867) - 418,978 Human welfare and neighborhood development......... 1,252,588 (19,431) 529 (283) - 1,233,403 Community health................................................. 776,612 (18,481) (11,060) - - 747,071 Culture and recreation............................................ 364,909 (10,072) (29,295) (14,514) - 311,028 General administration and finance.......................... 277,729 (22,563) (9,923) 1,140 - 246,383 General City responsibilities................................... 114,684 - - (1,194) - 113,490
Debt service:Principal retirement………………………………......... 252,456 - - - (252,456) - Interest and other fiscal charges……………………… 119,723 - - 4,589 (16,063) 108,249 Bond issuance costs…………………………………… 7,108 - - - - 7,108
Capital outlay.......................................................... 223,904 - (223,904) - - - Total expenditures.......................................... 5,074,865 (131,496) (249,229) (17,362) (268,519) 4,408,259 Excess (deficiency) of revenues over (under) expenditures………………………………………. 715,109 141,812 249,229 18,353 268,519 1,393,022
Other financing sources (uses) / changes in net position
Net transfers in (out)................................................ (671,063) - - (110) - (671,173) Issuance of bonds and loans:
Face value of bonds issued.................................... 595,925 - - - (595,925) - Premium on issuance of bonds............................... 32,845 - - - (32,845) -
Payment to refunded bond escrow agent.................... (131,935) - - - 131,935 - Other financing sources............................................ 5,650 - - (5,650) - -
Total other financing sources (uses)................. (168,578) - - (5,760) (496,835) (671,173)
Net change for the year................................ 546,531$ 141,812$ 249,229$ 12,593$ (228,316)$ 721,849$
CITY AND COUNTY OF SAN FRANCISCO Notes to Basic Financial Statements (Continued)
June 30, 2016 (Dollars in Thousands)
59
(3) Property taxes that were unavailable and are reported as deferred inflows of resources in the governmental funds are recognized as revenues in the statement of activities. $ 10,141 Other revenues that were unavailable and reported as deferred inflows of resources in the governmental funds are recognized as revenues in the statement of activities. 175 $ 10,316 Some expenses reported in the statement of activities do not require the use of current financial resources and therefore are not reported as expenditures in governmental funds. Certain long-term liabilities reported in the prior year statement of net position were paid during the current period resulting in expenditures in the governmental funds. This is the amount by which the increase in long-term liabilities exceeded expenditures in funds that do not require the use of current financial resources. $ (155,660) Changes to net pension liability and pension related deferred outflows and inflows of resources do not provide financial resources and, therefore, are not reported as a reduction in expenditures in governmental funds. 282,088 Governmental funds report revenues and expenditures primarily pertaining to long-term loan activities, which are not reported in the statement of activities. These activities are reported at the government-wide level in the statement of net position. This is the net expenditures reported in the governmental funds. 5,068 $ 131,496
(4) When capital assets that are to be used in governmental activities are purchased or constructed, the resources expended for those assets are reported as expenditures in governmental funds. However, in the statement of activities, the cost of those assets is allocated over their estimated useful lives and reported as depreciation expense. As a result, fund balance decreases by the amount of financial resources expended, whereas net position decreases by the amount of depreciation expense charged for the year and the loss on disposal of capital assets.
Capital expenditures ................................................................................................. $ 413,493 Depreciation expenses ............................................................................................. (134,468) Loss on disposal of capital assets ............................................................................ (263) Write off construction of progress ............................................................................. (29,533)
Difference ........................................................................................................... $ 249,229 (5) Internal service funds are used by management to charge the costs of certain
activities, such as capital lease financing, equipment maintenance, printing and mailing services, and telecommunications, to individual funds. The adjustments for internal service funds “close” those funds by charging additional amounts to participating governmental activities to completely cover the internal service funds’ costs for the year. $ 12,593
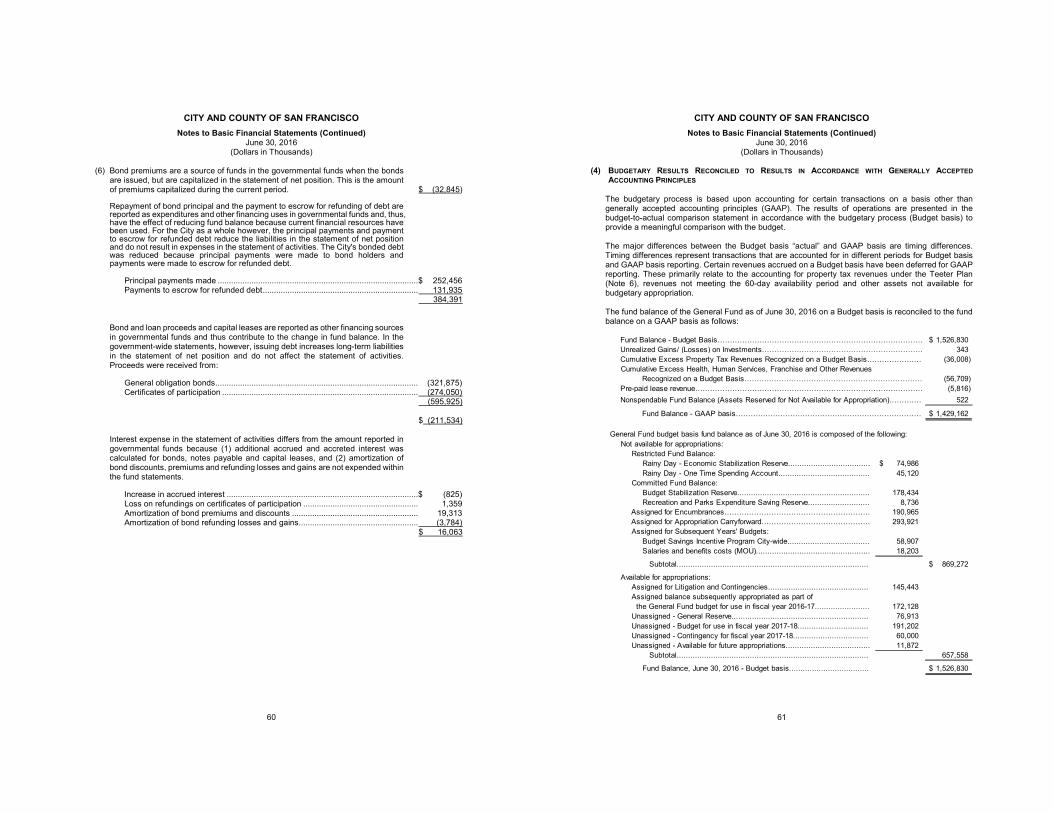
CITY AND COUNTY OF SAN FRANCISCO Notes to Basic Financial Statements (Continued)
June 30, 2016 (Dollars in Thousands)
60
(6) Bond premiums are a source of funds in the governmental funds when the bonds are issued, but are capitalized in the statement of net position. This is the amount of premiums capitalized during the current period. $ (32,845) Repayment of bond principal and the payment to escrow for refunding of debt are reported as expenditures and other financing uses in governmental funds and, thus, have the effect of reducing fund balance because current financial resources have been used. For the City as a whole however, the principal payments and payment to escrow for refunded debt reduce the liabilities in the statement of net position and do not result in expenses in the statement of activities. The City's bonded debt was reduced because principal payments were made to bond holders and payments were made to escrow for refunded debt.
Principal payments made ......................................................................................... $ 252,456 Payments to escrow for refunded debt ..................................................................... 131,935 384,391
Bond and loan proceeds and capital leases are reported as other financing sources in governmental funds and thus contribute to the change in fund balance. In the government-wide statements, however, issuing debt increases long-term liabilities in the statement of net position and do not affect the statement of activities. Proceeds were received from:
General obligation bonds .......................................................................................... (321,875) Certificates of participation ....................................................................................... (274,050) (595,925) $ (211,534)
Interest expense in the statement of activities differs from the amount reported in governmental funds because (1) additional accrued and accreted interest was calculated for bonds, notes payable and capital leases, and (2) amortization of bond discounts, premiums and refunding losses and gains are not expended within the fund statements.
Increase in accrued interest ..................................................................................... $ (825) Loss on refundings on certificates of participation ................................................... 1,359 Amortization of bond premiums and discounts ........................................................ 19,313 Amortization of bond refunding losses and gains..................................................... (3,784)
$ 16,063
CITY AND COUNTY OF SAN FRANCISCO Notes to Basic Financial Statements (Continued)
June 30, 2016 (Dollars in Thousands)
61
(4) BUDGETARY RESULTS RECONCILED TO RESULTS IN ACCORDANCE WITH GENERALLY ACCEPTED ACCOUNTING PRINCIPLES
The budgetary process is based upon accounting for certain transactions on a basis other than generally accepted accounting principles (GAAP). The results of operations are presented in the budget-to-actual comparison statement in accordance with the budgetary process (Budget basis) to provide a meaningful comparison with the budget. The major differences between the Budget basis “actual” and GAAP basis are timing differences. Timing differences represent transactions that are accounted for in different periods for Budget basis and GAAP basis reporting. Certain revenues accrued on a Budget basis have been deferred for GAAP reporting. These primarily relate to the accounting for property tax revenues under the Teeter Plan (Note 6), revenues not meeting the 60-day availability period and other assets not available for budgetary appropriation. The fund balance of the General Fund as of June 30, 2016 on a Budget basis is reconciled to the fund balance on a GAAP basis as follows:
Fund Balance - Budget Basis………………………………………………………………………… 1,526,830$ Unrealized Gains/ (Losses) on Investments………………………………………………………… 343 Cumulative Excess Property Tax Revenues Recognized on a Budget Basis…………………… (36,008) Cumulative Excess Health, Human Services, Franchise and Other Revenues
Recognized on a Budget Basis……………………………………………………………… (56,709) Pre-paid lease revenue………………………………………………………………………………… (5,816) Nonspendable Fund Balance (Assets Reserved for Not Available for Appropriation)…………… 522
Fund Balance - GAAP basis…………………………………………………………………… 1,429,162$
Not available for appropriations:Restricted Fund Balance:
Rainy Day - Economic Stabilization Reserve.................................... 74,986$ Rainy Day - One Time Spending Account........................................ 45,120
Committed Fund Balance:Budget Stabilization Reserve.......................................................... 178,434 Recreation and Parks Expenditure Saving Reserve........................... 8,736
Assigned for Encumbrances…………………………………………………… 190,965 Assigned for Appropriation Carryforward……………………………………… 293,921 Assigned for Subsequent Years' Budgets:
Budget Savings Incentive Program City-wide.................................... 58,907 Salaries and benefits costs (MOU).................................................. 18,203
Subtotal.................................................................................... 869,272$
Available for appropriations: 145,443
172,128 76,913
191,202 60,000
11,872 Subtotal.................................................................................... 657,558
Fund Balance, June 30, 2016 - Budget basis................................... 1,526,830$
Unassigned - Contingency for fiscal year 2017-18.................................
Assigned balance subsequently appropriated as part of
Unassigned - Available for future appropriations.....................................
General Fund budget basis fund balance as of June 30, 2016 is composed of the following:
Assigned for Litigation and Contingencies............................................
the General Fund budget for use in fiscal year 2016-17........................Unassigned - General Reserve............................................................Unassigned - Budget for use in fiscal year 2017-18...............................
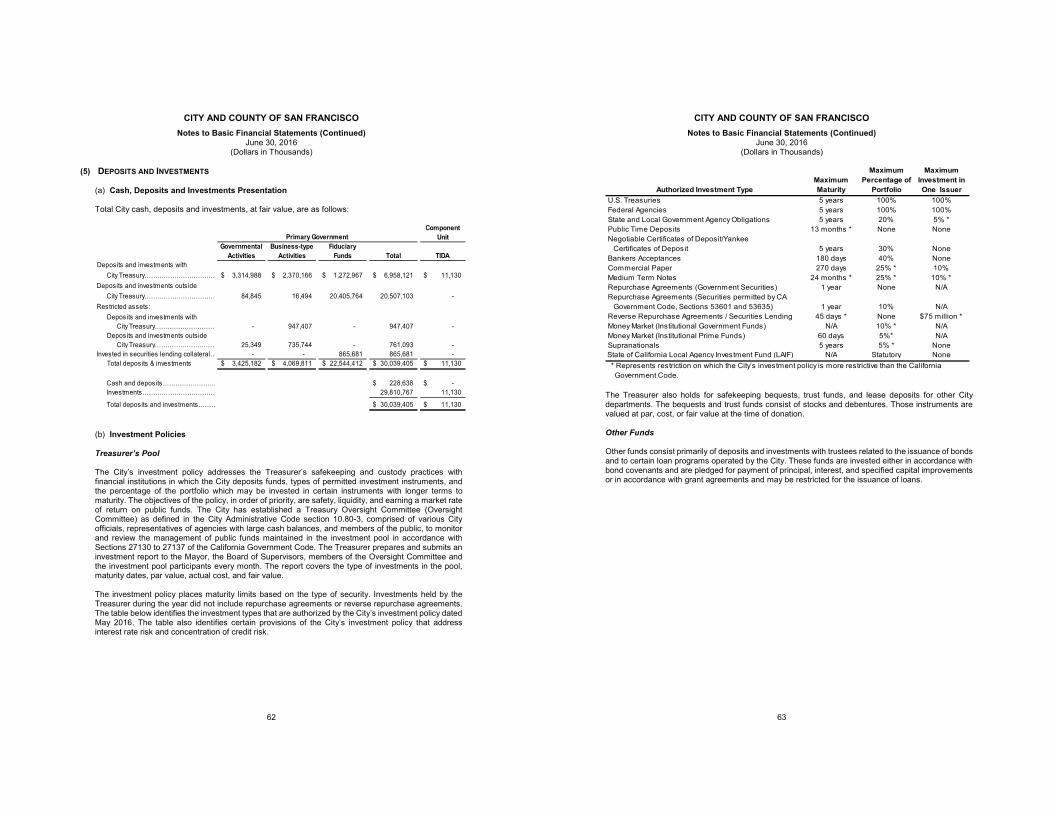
CITY AND COUNTY OF SAN FRANCISCO Notes to Basic Financial Statements (Continued)
June 30, 2016 (Dollars in Thousands)
62
(5) DEPOSITS AND INVESTMENTS (a) Cash, Deposits and Investments Presentation Total City cash, deposits and investments, at fair value, are as follows:
Component Unit
Governmental Activities
Business-type Activities
Fiduciary Funds Total TIDA
Deposits and investments withCity Treasury…………………………… 3,314,988$ 2,370,166$ 1,272,967$ 6,958,121$ 11,130$
Deposits and investments outsideCity Treasury…………………………… 84,845 16,494 20,405,764 20,507,103 -
Restricted assets:Deposits and investments with
City Treasury………………………… - 947,407 - 947,407 - Deposits and investments outside
City Treasury………………………… 25,349 735,744 - 761,093 - Invested in securities lending collateral… - - 865,681 865,681 -
Total deposits & investments 3,425,182$ 4,069,811$ 22,544,412$ 30,039,405$ 11,130$
Cash and deposits……………………… 228,638$ -$ Investments……………………………… 29,810,767 11,130
Total deposits and investments……… 30,039,405$ 11,130$
Primary Government
(b) Investment Policies Treasurer’s Pool The City’s investment policy addresses the Treasurer’s safekeeping and custody practices with financial institutions in which the City deposits funds, types of permitted investment instruments, and the percentage of the portfolio which may be invested in certain instruments with longer terms to maturity. The objectives of the policy, in order of priority, are safety, liquidity, and earning a market rate of return on public funds. The City has established a Treasury Oversight Committee (Oversight Committee) as defined in the City Administrative Code section 10.80-3, comprised of various City officials, representatives of agencies with large cash balances, and members of the public, to monitor and review the management of public funds maintained in the investment pool in accordance with Sections 27130 to 27137 of the California Government Code. The Treasurer prepares and submits an investment report to the Mayor, the Board of Supervisors, members of the Oversight Committee and the investment pool participants every month. The report covers the type of investments in the pool, maturity dates, par value, actual cost, and fair value. The investment policy places maturity limits based on the type of security. Investments held by the Treasurer during the year did not include repurchase agreements or reverse repurchase agreements. The table below identifies the investment types that are authorized by the City’s investment policy dated May 2016. The table also identifies certain provisions of the City’s investment policy that address interest rate risk and concentration of credit risk.
CITY AND COUNTY OF SAN FRANCISCO Notes to Basic Financial Statements (Continued)
June 30, 2016 (Dollars in Thousands)
63
The Treasurer also holds for safekeeping bequests, trust funds, and lease deposits for other City departments. The bequests and trust funds consist of stocks and debentures. Those instruments are valued at par, cost, or fair value at the time of donation. Other Funds Other funds consist primarily of deposits and investments with trustees related to the issuance of bonds and to certain loan programs operated by the City. These funds are invested either in accordance with bond covenants and are pledged for payment of principal, interest, and specified capital improvements or in accordance with grant agreements and may be restricted for the issuance of loans.
Authorized Investment TypeMaximum Maturity
Maximum Percentage of
Portfolio
Maximum Investment in One Issuer
U.S. Treasuries 5 years 100% 100%Federal Agencies 5 years 100% 100%State and Local Government Agency Obligations 5 years 20% 5% *Public Time Deposits 13 months * None NoneNegotiable Certificates of Deposit/Yankee Certificates of Deposit 5 years 30% NoneBankers Acceptances 180 days 40% NoneCommercial Paper 270 days 25% * 10%Medium Term Notes 24 months * 25% * 10% *Repurchase Agreements (Government Securities) 1 year None N/ARepurchase Agreements (Securities permitted by CA Government Code, Sections 53601 and 53635) 1 year 10% N/AReverse Repurchase Agreements / Securities Lending 45 days * None $75 million *Money Market (Institutional Government Funds) N/A 10% * N/AMoney Market (Institutional Prime Funds) 60 days 5%* N/ASupranationals 5 years 5% * NoneState of California Local Agency Investment Fund (LAIF) N/A Statutory None * Represents restriction on which the City’s investment policy is more restrictive than the California Government Code.
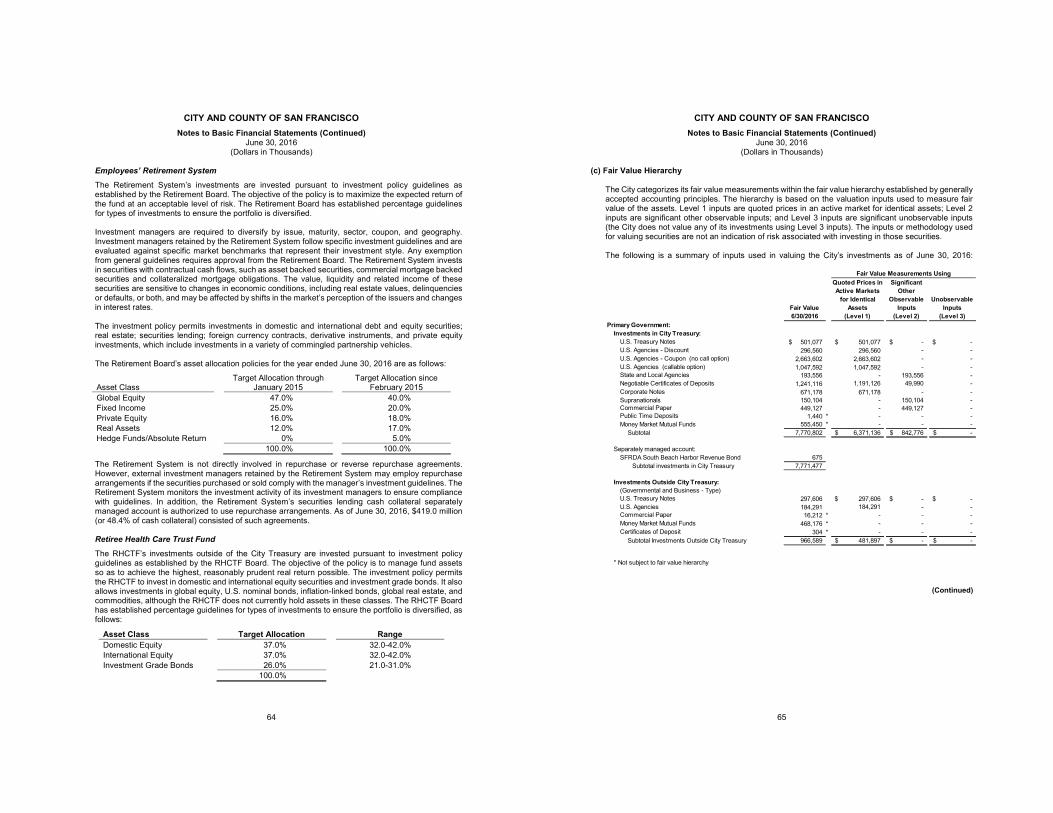
CITY AND COUNTY OF SAN FRANCISCO Notes to Basic Financial Statements (Continued)
June 30, 2016 (Dollars in Thousands)
64
Employees’ Retirement System
The Retirement System’s investments are invested pursuant to investment policy guidelines as established by the Retirement Board. The objective of the policy is to maximize the expected return of the fund at an acceptable level of risk. The Retirement Board has established percentage guidelines for types of investments to ensure the portfolio is diversified. Investment managers are required to diversify by issue, maturity, sector, coupon, and geography. Investment managers retained by the Retirement System follow specific investment guidelines and are evaluated against specific market benchmarks that represent their investment style. Any exemption from general guidelines requires approval from the Retirement Board. The Retirement System invests in securities with contractual cash flows, such as asset backed securities, commercial mortgage backed securities and collateralized mortgage obligations. The value, liquidity and related income of these securities are sensitive to changes in economic conditions, including real estate values, delinquencies or defaults, or both, and may be affected by shifts in the market’s perception of the issuers and changes in interest rates. The investment policy permits investments in domestic and international debt and equity securities; real estate; securities lending; foreign currency contracts, derivative instruments, and private equity investments, which include investments in a variety of commingled partnership vehicles. The Retirement Board’s asset allocation policies for the year ended June 30, 2016 are as follows:
Asset Class Target Allocation through
January 2015 Target Allocation since
February 2015 Global Equity 47.0% 40.0% Fixed Income 25.0% 20.0% Private Equity 16.0% 18.0% Real Assets 12.0% 17.0% Hedge Funds/Absolute Return 0% 5.0% 100.0% 100.0%
The Retirement System is not directly involved in repurchase or reverse repurchase agreements. However, external investment managers retained by the Retirement System may employ repurchase arrangements if the securities purchased or sold comply with the manager’s investment guidelines. The Retirement System monitors the investment activity of its investment managers to ensure compliance with guidelines. In addition, the Retirement System’s securities lending cash collateral separately managed account is authorized to use repurchase arrangements. As of June 30, 2016, $419.0 million (or 48.4% of cash collateral) consisted of such agreements. Retiree Health Care Trust Fund
The RHCTF’s investments outside of the City Treasury are invested pursuant to investment policy guidelines as established by the RHCTF Board. The objective of the policy is to manage fund assets so as to achieve the highest, reasonably prudent real return possible. The investment policy permits the RHCTF to invest in domestic and international equity securities and investment grade bonds. It also allows investments in global equity, U.S. nominal bonds, inflation-linked bonds, global real estate, and commodities, although the RHCTF does not currently hold assets in these classes. The RHCTF Board has established percentage guidelines for types of investments to ensure the portfolio is diversified, as follows:
Asset Class Target Allocation Range Domestic Equity 37.0% 32.0-42.0% International Equity 37.0% 32.0-42.0% Investment Grade Bonds 26.0% 21.0-31.0% 100.0%
CITY AND COUNTY OF SAN FRANCISCO Notes to Basic Financial Statements (Continued)
June 30, 2016 (Dollars in Thousands)
65
(c) Fair Value Hierarchy The City categorizes its fair value measurements within the fair value hierarchy established by generally accepted accounting principles. The hierarchy is based on the valuation inputs used to measure fair value of the assets. Level 1 inputs are quoted prices in an active market for identical assets; Level 2 inputs are significant other observable inputs; and Level 3 inputs are significant unobservable inputs (the City does not value any of its investments using Level 3 inputs). The inputs or methodology used for valuing securities are not an indication of risk associated with investing in those securities. The following is a summary of inputs used in valuing the City’s investments as of June 30, 2016:
(Continued)
Fair Value
Quoted Prices in Active Markets
for Identical Assets
Significant Other
Observable Inputs
Unobservable Inputs
6/30/2016 (Level 1) (Level 2) (Level 3)
501,077$ 501,077$ -$ -$ 296,560 296,560 - -
2,663,602 2,663,602 - - 1,047,592 1,047,592 - -
193,556 - 193,556 - 1,241,116 1,191,126 49,990 -
671,178 671,178 - - Supranationals 150,104 - 150,104 -
449,127 - 449,127 - 1,440 * - - -
555,450 * - - - Subtotal 7,770,802 6,371,136$ 842,776$ -$
675 Subtotal investments in City Treasury 7,771,477
297,606 297,606$ -$ -$ 184,291 184,291 - - 16,212 * - - -
468,176 * - - - 304 * - - -
Subtotal Investments Outside City Treasury 966,589 481,897$ -$ -$
* Not subject to fair value hierarchy
Public Time Deposits
Negotiable Certificates of Deposits
U.S. Agencies (callable option)
U.S. Agencies - Discount
U.S. Treasury Notes
Commercial Paper
Corporate Notes
Money Market Mutual Funds
Fair Value Measurements Using
Primary Government:Investments in City Treasury:
U.S. Treasury Notes
U.S. Agencies - Coupon (no call option)
State and Local Agencies
U.S. AgenciesCommercial PaperMoney Market Mutual Funds
Separately managed account:SFRDA South Beach Harbor Revenue Bond
Investments Outside City Treasury: (Governmental and Business - Type)
Certificates of Deposit
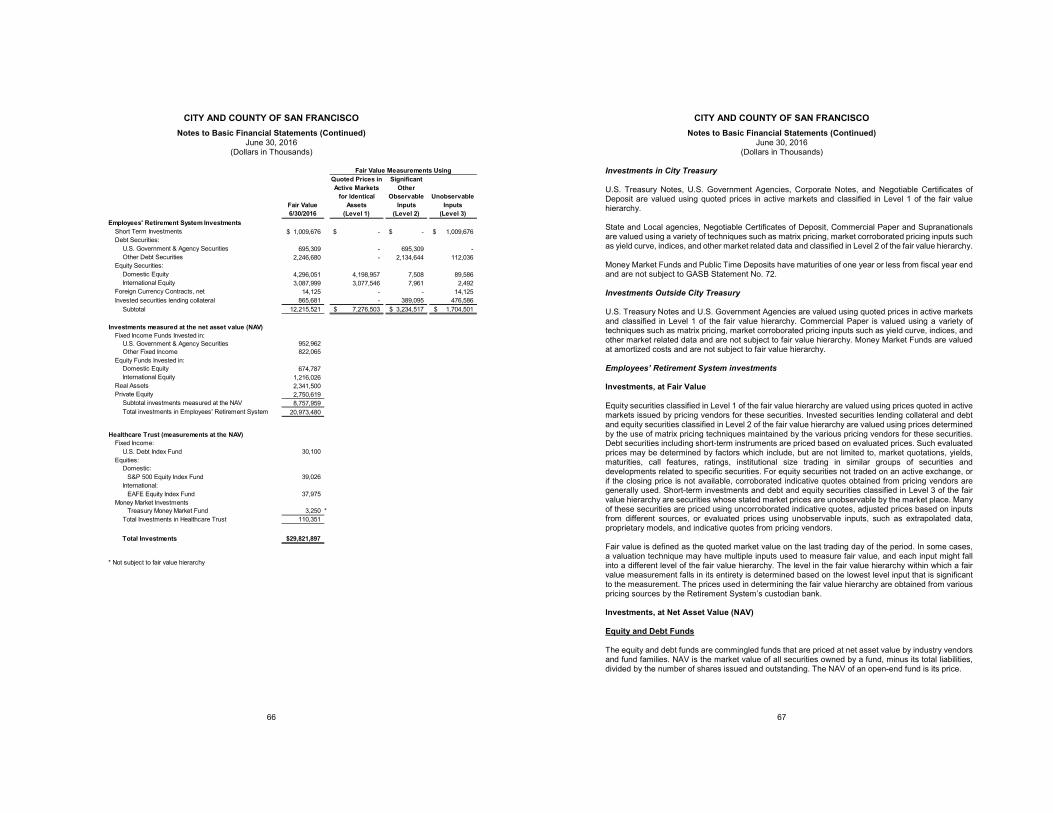
CITY AND COUNTY OF SAN FRANCISCO Notes to Basic Financial Statements (Continued)
June 30, 2016 (Dollars in Thousands)
66
Fair Value
Quoted Prices in Active Markets
for Identical Assets
Significant Other
Observable Inputs
Unobservable Inputs
6/30/2016 (Level 1) (Level 2) (Level 3)
Short Term Investments 1,009,676$ -$ -$ 1,009,676$ Debt Securities:
U.S. Government & Agency Securities 695,309 - 695,309 - Other Debt Securities 2,246,680 - 2,134,644 112,036
Equity Securities:Domestic Equity 4,296,051 4,198,957 7,508 89,586 International Equity 3,087,999 3,077,546 7,961 2,492
Foreign Currency Contracts, net 14,125 - - 14,125 Invested securities lending collateral 865,681 - 389,095 476,586
Subtotal 12,215,521 7,276,503$ 3,234,517$ 1,704,501$
Investments measured at the net asset value (NAV)Fixed Income Funds Invested in:
U.S. Government & Agency Securities 952,962 Other Fixed Income 822,065
Equity Funds Invested in:Domestic Equity 674,787 International Equity 1,216,026
Real Assets 2,341,500 Private Equity 2,750,619
Subtotal investments measured at the NAV 8,757,959 Total investments in Employees' Retirement System 20,973,480
Healthcare Trust (measurements at the NAV)Fixed Income:
U.S. Debt Index Fund 30,100 Equities:
Domestic:S&P 500 Equity Index Fund 39,026
International: EAFE Equity Index Fund 37,975 Money Market Investments
Treasury Money Market Fund 3,250 *Total Investments in Healthcare Trust 110,351
Total Investments 29,821,897$
* Not subject to fair value hierarchy
Fair Value Measurements Using
Employees' Retirement System Investments
CITY AND COUNTY OF SAN FRANCISCO Notes to Basic Financial Statements (Continued)
June 30, 2016 (Dollars in Thousands)
67
Investments in City Treasury U.S. Treasury Notes, U.S. Government Agencies, Corporate Notes, and Negotiable Certificates of Deposit are valued using quoted prices in active markets and classified in Level 1 of the fair value hierarchy. State and Local agencies, Negotiable Certificates of Deposit, Commercial Paper and Supranationals are valued using a variety of techniques such as matrix pricing, market corroborated pricing inputs such as yield curve, indices, and other market related data and classified in Level 2 of the fair value hierarchy. Money Market Funds and Public Time Deposits have maturities of one year or less from fiscal year end and are not subject to GASB Statement No. 72. Investments Outside City Treasury U.S. Treasury Notes and U.S. Government Agencies are valued using quoted prices in active markets and classified in Level 1 of the fair value hierarchy. Commercial Paper is valued using a variety of techniques such as matrix pricing, market corroborated pricing inputs such as yield curve, indices, and other market related data and are not subject to fair value hierarchy. Money Market Funds are valued at amortized costs and are not subject to fair value hierarchy. Employees’ Retirement System investments Investments, at Fair Value Equity securities classified in Level 1 of the fair value hierarchy are valued using prices quoted in active markets issued by pricing vendors for these securities. Invested securities lending collateral and debt and equity securities classified in Level 2 of the fair value hierarchy are valued using prices determined by the use of matrix pricing techniques maintained by the various pricing vendors for these securities. Debt securities including short-term instruments are priced based on evaluated prices. Such evaluated prices may be determined by factors which include, but are not limited to, market quotations, yields, maturities, call features, ratings, institutional size trading in similar groups of securities and developments related to specific securities. For equity securities not traded on an active exchange, or if the closing price is not available, corroborated indicative quotes obtained from pricing vendors are generally used. Short-term investments and debt and equity securities classified in Level 3 of the fair value hierarchy are securities whose stated market prices are unobservable by the market place. Many of these securities are priced using uncorroborated indicative quotes, adjusted prices based on inputs from different sources, or evaluated prices using unobservable inputs, such as extrapolated data, proprietary models, and indicative quotes from pricing vendors. Fair value is defined as the quoted market value on the last trading day of the period. In some cases, a valuation technique may have multiple inputs used to measure fair value, and each input might fall into a different level of the fair value hierarchy. The level in the fair value hierarchy within which a fair value measurement falls in its entirety is determined based on the lowest level input that is significant to the measurement. The prices used in determining the fair value hierarchy are obtained from various pricing sources by the Retirement System’s custodian bank. Investments, at Net Asset Value (NAV) Equity and Debt Funds The equity and debt funds are commingled funds that are priced at net asset value by industry vendors and fund families. NAV is the market value of all securities owned by a fund, minus its total liabilities, divided by the number of shares issued and outstanding. The NAV of an open-end fund is its price.
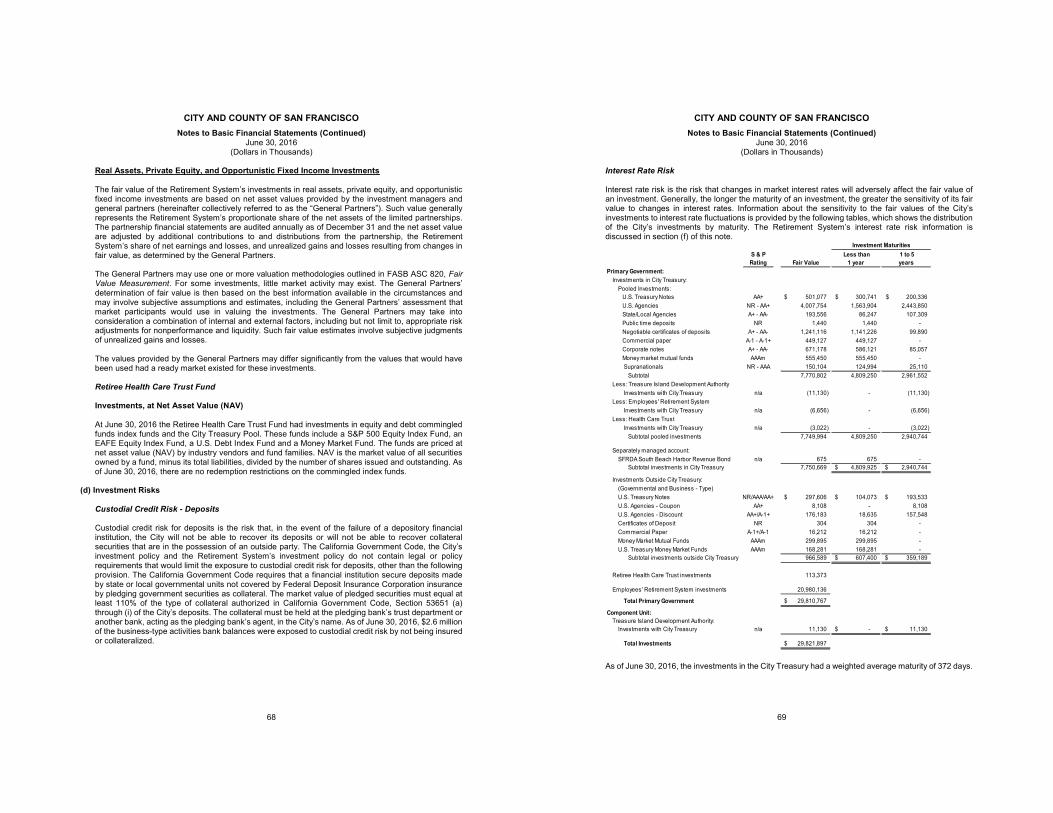
CITY AND COUNTY OF SAN FRANCISCO Notes to Basic Financial Statements (Continued)
June 30, 2016 (Dollars in Thousands)
68
Real Assets, Private Equity, and Opportunistic Fixed Income Investments The fair value of the Retirement System’s investments in real assets, private equity, and opportunistic fixed income investments are based on net asset values provided by the investment managers and general partners (hereinafter collectively referred to as the “General Partners”). Such value generally represents the Retirement System’s proportionate share of the net assets of the limited partnerships. The partnership financial statements are audited annually as of December 31 and the net asset value are adjusted by additional contributions to and distributions from the partnership, the Retirement System’s share of net earnings and losses, and unrealized gains and losses resulting from changes in fair value, as determined by the General Partners. The General Partners may use one or more valuation methodologies outlined in FASB ASC 820, Fair Value Measurement. For some investments, little market activity may exist. The General Partners’ determination of fair value is then based on the best information available in the circumstances and may involve subjective assumptions and estimates, including the General Partners’ assessment that market participants would use in valuing the investments. The General Partners may take into consideration a combination of internal and external factors, including but not limit to, appropriate risk adjustments for nonperformance and liquidity. Such fair value estimates involve subjective judgments of unrealized gains and losses. The values provided by the General Partners may differ significantly from the values that would have been used had a ready market existed for these investments. Retiree Health Care Trust Fund Investments, at Net Asset Value (NAV) At June 30, 2016 the Retiree Health Care Trust Fund had investments in equity and debt commingled funds index funds and the City Treasury Pool. These funds include a S&P 500 Equity Index Fund, an EAFE Equity Index Fund, a U.S. Debt Index Fund and a Money Market Fund. The funds are priced at net asset value (NAV) by industry vendors and fund families. NAV is the market value of all securities owned by a fund, minus its total liabilities, divided by the number of shares issued and outstanding. As of June 30, 2016, there are no redemption restrictions on the commingled index funds.
(d) Investment Risks
Custodial Credit Risk - Deposits Custodial credit risk for deposits is the risk that, in the event of the failure of a depository financial institution, the City will not be able to recover its deposits or will not be able to recover collateral securities that are in the possession of an outside party. The California Government Code, the City’s investment policy and the Retirement System’s investment policy do not contain legal or policy requirements that would limit the exposure to custodial credit risk for deposits, other than the following provision. The California Government Code requires that a financial institution secure deposits made by state or local governmental units not covered by Federal Deposit Insurance Corporation insurance by pledging government securities as collateral. The market value of pledged securities must equal at least 110% of the type of collateral authorized in California Government Code, Section 53651 (a) through (i) of the City’s deposits. The collateral must be held at the pledging bank’s trust department or another bank, acting as the pledging bank’s agent, in the City’s name. As of June 30, 2016, $2.6 million of the business-type activities bank balances were exposed to custodial credit risk by not being insured or collateralized.
CITY AND COUNTY OF SAN FRANCISCO Notes to Basic Financial Statements (Continued)
June 30, 2016 (Dollars in Thousands)
69
Interest Rate Risk Interest rate risk is the risk that changes in market interest rates will adversely affect the fair value of an investment. Generally, the longer the maturity of an investment, the greater the sensitivity of its fair value to changes in interest rates. Information about the sensitivity to the fair values of the City’s investments to interest rate fluctuations is provided by the following tables, which shows the distribution of the City’s investments by maturity. The Retirement System’s interest rate risk information is discussed in section (f) of this note.
S & P Rating Fair Value
Less than 1 year
1 to 5 years
Primary Government:Investments in City Treasury:
Pooled Investments:U.S. Treasury Notes AA+ 501,077$ 300,741$ 200,336$ U.S. Agencies NR - AA+ 4,007,754 1,563,904 2,443,850 State/Local Agencies A+ - AA- 193,556 86,247 107,309 Public time deposits NR 1,440 1,440 - Negotiable certificates of deposits A+ - AA- 1,241,116 1,141,226 99,890 Commercial paper A-1 - A-1+ 449,127 449,127 - Corporate notes A+ - AA- 671,178 586,121 85,057 Money market mutual funds AAAm 555,450 555,450 - Supranationals NR - AAA 150,104 124,994 25,110
Subtotal 7,770,802 4,809,250 2,961,552 Less: Treasure Island Development Authority
Investments with City Treasury n/a (11,130) - (11,130) Less: Employees' Retirement System
Investments with City Treasury n/a (6,656) - (6,656) Less: Health Care Trust
Investments with City Treasury n/a (3,022) - (3,022) Subtotal pooled investments 7,749,994 4,809,250 2,940,744
Separately managed account:SFRDA South Beach Harbor Revenue Bond n/a 675 675 -
Subtotal investments in City Treasury 7,750,669 4,809,925$ 2,940,744$
Investments Outside City Treasury: (Governmental and Business - Type)U.S. Treasury Notes NR/AAA/AA+ 297,606$ 104,073$ 193,533$ U.S. Agencies - Coupon AA+ 8,108 - 8,108 U.S. Agencies - Discount AA+/A-1+ 176,183 18,635 157,548 Certificates of Deposit NR 304 304 - Commercial Paper A-1+/A-1 16,212 16,212 - Money Market Mutual Funds AAAm 299,895 299,895 - U.S. Treasury Money Market Funds AAAm 168,281 168,281 -
Subtotal investments outside City Treasury 966,589 607,400$ 359,189$
Retiree Health Care Trust investments 113,373
Employees' Retirement System investments 20,980,136
Total Primary Government 29,810,767$
Component Unit:Treasure Island Development Authority:
Investments with City Treasury n/a 11,130 -$ 11,130$
Total Investments 29,821,897$
Investment Maturities
As of June 30, 2016, the investments in the City Treasury had a weighted average maturity of 372 days.
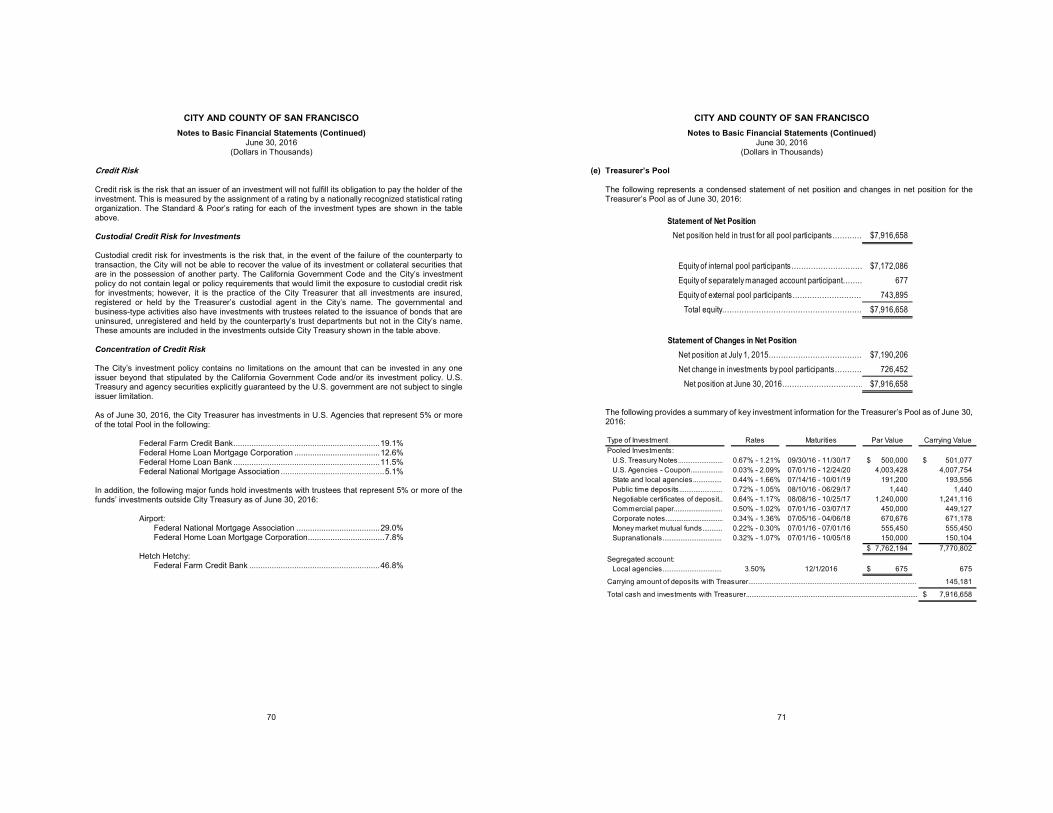
CITY AND COUNTY OF SAN FRANCISCO Notes to Basic Financial Statements (Continued)
June 30, 2016 (Dollars in Thousands)
70
Credit Risk
Credit risk is the risk that an issuer of an investment will not fulfill its obligation to pay the holder of the investment. This is measured by the assignment of a rating by a nationally recognized statistical rating organization. The Standard & Poor’s rating for each of the investment types are shown in the table above. Custodial Credit Risk for Investments Custodial credit risk for investments is the risk that, in the event of the failure of the counterparty to transaction, the City will not be able to recover the value of its investment or collateral securities that are in the possession of another party. The California Government Code and the City’s investment policy do not contain legal or policy requirements that would limit the exposure to custodial credit risk for investments; however, it is the practice of the City Treasurer that all investments are insured, registered or held by the Treasurer’s custodial agent in the City’s name. The governmental and business-type activities also have investments with trustees related to the issuance of bonds that are uninsured, unregistered and held by the counterparty’s trust departments but not in the City’s name. These amounts are included in the investments outside City Treasury shown in the table above. Concentration of Credit Risk The City’s investment policy contains no limitations on the amount that can be invested in any one issuer beyond that stipulated by the California Government Code and/or its investment policy. U.S. Treasury and agency securities explicitly guaranteed by the U.S. government are not subject to single issuer limitation. As of June 30, 2016, the City Treasurer has investments in U.S. Agencies that represent 5% or more of the total Pool in the following:
Federal Farm Credit Bank ................................................................. 19.1% Federal Home Loan Mortgage Corporation ...................................... 12.6% Federal Home Loan Bank ................................................................. 11.5% Federal National Mortgage Association .............................................. 5.1%
In addition, the following major funds hold investments with trustees that represent 5% or more of the funds’ investments outside City Treasury as of June 30, 2016:
Airport: Federal National Mortgage Association ..................................... 29.0% Federal Home Loan Mortgage Corporation .................................. 7.8%
Hetch Hetchy: Federal Farm Credit Bank .......................................................... 46.8%
CITY AND COUNTY OF SAN FRANCISCO Notes to Basic Financial Statements (Continued)
June 30, 2016 (Dollars in Thousands)
71
(e) Treasurer’s Pool The following represents a condensed statement of net position and changes in net position for the Treasurer’s Pool as of June 30, 2016:
The following provides a summary of key investment information for the Treasurer’s Pool as of June 30, 2016:
Statement of Net Position Net position held in trust for all pool participants………… $7,916,658
Equity of internal pool participants………………………… $7,172,086 Equity of separately managed account participant……… 677 Equity of external pool participants………………………… 743,895 Total equity………………………………………………… $7,916,658
Statement of Changes in Net Position Net position at July 1, 2015………………………………… $7,190,206 Net change in investments by pool participants………… 726,452 Net position at June 30, 2016…………………………… $7,916,658
Type of Investment Rates Maturities Par Value Carrying ValuePooled Investments:
U.S. Treasury Notes......................... 0.67% - 1.21% 09/30/16 - 11/30/17 500,000$ 501,077$ U.S. Agencies - Coupon.................. 0.03% - 2.09% 07/01/16 - 12/24/20 4,003,428 4,007,754 State and local agencies................ 0.44% - 1.66% 07/14/16 - 10/01/19 191,200 193,556 Public time deposits........................ 0.72% - 1.05% 08/10/16 - 06/29/17 1,440 1,440 Negotiable certificates of deposit.. 0.64% - 1.17% 08/08/16 - 10/25/17 1,240,000 1,241,116 Commercial paper........................... 0.50% - 1.02% 07/01/16 - 03/07/17 450,000 449,127 Corporate notes................................ 0.34% - 1.36% 07/05/16 - 04/06/18 670,676 671,178 Money market mutual funds........... 0.22% - 0.30% 07/01/16 - 07/01/16 555,450 555,450 Supranationals................................. 0.32% - 1.07% 07/01/16 - 10/05/18 150,000 150,104
7,762,194$ 7,770,802 Segregated account:
Local agencies................................. 3.50% 12/1/2016 675$ 675
145,181
7,916,658$
Carrying amount of deposits with Treasurer..............................................................................................
Total cash and investments with Treasurer................................................................................................
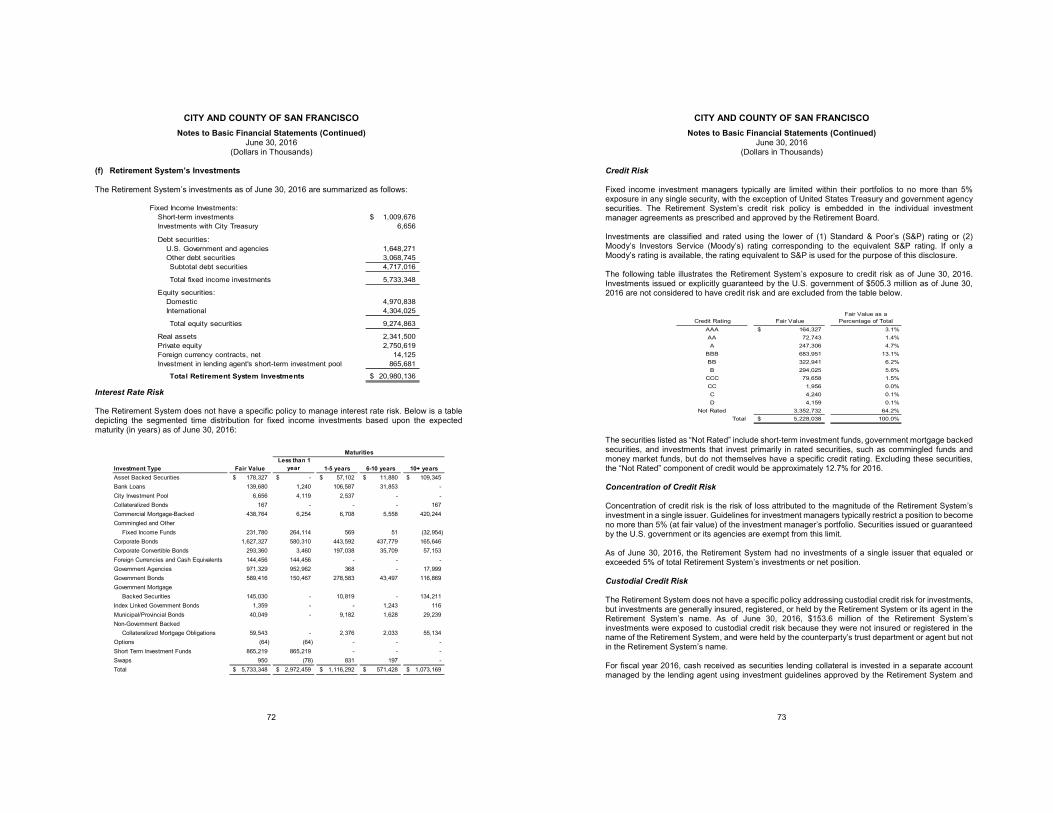
CITY AND COUNTY OF SAN FRANCISCO Notes to Basic Financial Statements (Continued)
June 30, 2016 (Dollars in Thousands)
72
(f) Retirement System’s Investments The Retirement System’s investments as of June 30, 2016 are summarized as follows:
Interest Rate Risk The Retirement System does not have a specific policy to manage interest rate risk. Below is a table depicting the segmented time distribution for fixed income investments based upon the expected maturity (in years) as of June 30, 2016:
Fixed Income Investments:Short-term investments 1,009,676$ Investments with City Treasury 6,656
Debt securities:U.S. Government and agencies 1,648,271 Other debt securities 3,068,745 Subtotal debt securities 4,717,016
Total fixed income investments 5,733,348
Equity securities:Domestic 4,970,838 International 4,304,025
Total equity securities 9,274,863
Real assets 2,341,500 Private equity 2,750,619 Foreign currency contracts, net 14,125 Investment in lending agent's short-term investment pool 865,681
Total Retirement System Investments 20,980,136$
Maturities
Investment Type Fair Value Less than 1
year 1-5 years 6-10 years 10+ yearsAsset Backed Securities 178,327$ -$ 57,102$ 11,880$ 109,345$ Bank Loans 139,680 1,240 106,587 31,853 - City Investment Pool 6,656 4,119 2,537 - - Collateralized Bonds 167 - - - 167 Commercial Mortgage-Backed 438,764 6,254 6,708 5,558 420,244 Commingled and Other
Fixed Income Funds 231,780 264,114 569 51 (32,954) Corporate Bonds 1,627,327 580,310 443,592 437,779 165,646 Corporate Convertible Bonds 293,360 3,460 197,038 35,709 57,153 Foreign Currencies and Cash Equivalents 144,456 144,456 - - - Government Agencies 971,329 952,962 368 - 17,999 Government Bonds 589,416 150,467 278,583 43,497 116,869 Government Mortgage
Backed Securities 145,030 - 10,819 - 134,211 Index Linked Government Bonds 1,359 - - 1,243 116 Municipal/Provincial Bonds 40,049 - 9,182 1,628 29,239 Non-Government Backed
Collateralized Mortgage Obligations 59,543 - 2,376 2,033 55,134 Options (64) (64) - - - Short Term Investment Funds 865,219 865,219 - - - Swaps 950 (78) 831 197 - Total 5,733,348$ 2,972,459$ 1,116,292$ 571,428$ 1,073,169$
CITY AND COUNTY OF SAN FRANCISCO Notes to Basic Financial Statements (Continued)
June 30, 2016 (Dollars in Thousands)
73
Credit Risk Fixed income investment managers typically are limited within their portfolios to no more than 5% exposure in any single security, with the exception of United States Treasury and government agency securities. The Retirement System’s credit risk policy is embedded in the individual investment manager agreements as prescribed and approved by the Retirement Board. Investments are classified and rated using the lower of (1) Standard & Poor’s (S&P) rating or (2) Moody’s Investors Service (Moody’s) rating corresponding to the equivalent S&P rating. If only a Moody’s rating is available, the rating equivalent to S&P is used for the purpose of this disclosure. The following table illustrates the Retirement System’s exposure to credit risk as of June 30, 2016. Investments issued or explicitly guaranteed by the U.S. government of $505.3 million as of June 30, 2016 are not considered to have credit risk and are excluded from the table below.
The securities listed as “Not Rated” include short-term investment funds, government mortgage backed securities, and investments that invest primarily in rated securities, such as commingled funds and money market funds, but do not themselves have a specific credit rating. Excluding these securities, the “Not Rated” component of credit would be approximately 12.7% for 2016.
Concentration of Credit Risk Concentration of credit risk is the risk of loss attributed to the magnitude of the Retirement System’s investment in a single issuer. Guidelines for investment managers typically restrict a position to become no more than 5% (at fair value) of the investment manager’s portfolio. Securities issued or guaranteed by the U.S. government or its agencies are exempt from this limit. As of June 30, 2016, the Retirement System had no investments of a single issuer that equaled or exceeded 5% of total Retirement System’s investments or net position. Custodial Credit Risk The Retirement System does not have a specific policy addressing custodial credit risk for investments, but investments are generally insured, registered, or held by the Retirement System or its agent in the Retirement System’s name. As of June 30, 2016, $153.6 million of the Retirement System’s investments were exposed to custodial credit risk because they were not insured or registered in the name of the Retirement System, and were held by the counterparty’s trust department or agent but not in the Retirement System’s name. For fiscal year 2016, cash received as securities lending collateral is invested in a separate account managed by the lending agent using investment guidelines approved by the Retirement System and
Credit Rating Fair Value Fair Value as a
Percentage of TotalAAA 164,327$ 3.1%AA 72,743 1.4%A 247,306 4.7%
BBB 683,951 13.1%BB 322,941 6.2%B 294,025 5.6%
CCC 79,658 1.5%CC 1,956 0.0%C 4,240 0.1%D 4,159 0.1%
Not Rated 3,352,732 64.2%Total 5,228,038$ 100.0%
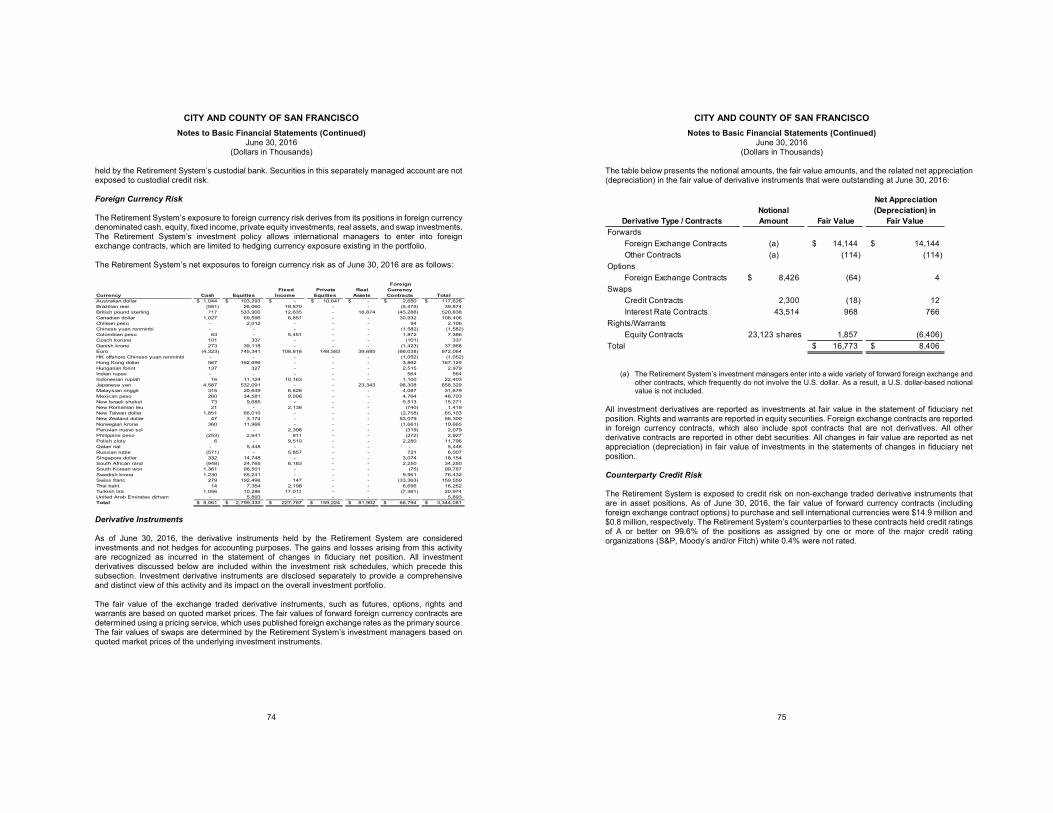
CITY AND COUNTY OF SAN FRANCISCO Notes to Basic Financial Statements (Continued)
June 30, 2016 (Dollars in Thousands)
74
held by the Retirement System’s custodial bank. Securities in this separately managed account are not exposed to custodial credit risk. Foreign Currency Risk The Retirement System’s exposure to foreign currency risk derives from its positions in foreign currency denominated cash, equity, fixed income, private equity investments, real assets, and swap investments. The Retirement System’s investment policy allows international managers to enter into foreign exchange contracts, which are limited to hedging currency exposure existing in the portfolio. The Retirement System’s net exposures to foreign currency risk as of June 30, 2016 are as follows:
Derivative Instruments As of June 30, 2016, the derivative instruments held by the Retirement System are considered investments and not hedges for accounting purposes. The gains and losses arising from this activity are recognized as incurred in the statement of changes in fiduciary net position. All investment derivatives discussed below are included within the investment risk schedules, which precede this subsection. Investment derivative instruments are disclosed separately to provide a comprehensive and distinct view of this activity and its impact on the overall investment portfolio. The fair value of the exchange traded derivative instruments, such as futures, options, rights and warrants are based on quoted market prices. The fair values of forward foreign currency contracts are determined using a pricing service, which uses published foreign exchange rates as the primary source. The fair values of swaps are determined by the Retirement System’s investment managers based on quoted market prices of the underlying investment instruments.
Currency Cash Equities Fixed
Income Private Equities
Real Assets
Foreign Currency Contracts Total
Australian dollar 1,044$ 103,293$ -$ 10,641$ -$ 2,650$ 117,628$ Brazilian real (581) 26,060 19,870 - - (5,475) 39,874 British pound sterling 717 533,900 12,635 - 18,874 (45,288) 520,838 Canadian dollar 1,027 69,596 6,851 - - 30,932 108,406 Chilean peso - 2,012 - - - 94 2,106 Chinese yuan renminbi - - - - - (1,582) (1,582) Colombian peso 63 - 5,451 - - 1,872 7,386 Czech koruna 101 337 - - - (101) 337 Danish krone 273 39,118 - - - (1,423) 37,968 Euro (4,323) 745,341 108,816 148,583 39,685 (66,038) 972,064 HK offshore Chinese yuan renminbi - - - - - (1,052) (1,052) Hong Kong dollar 567 162,696 - - - 3,862 167,125 Hungarian forint 137 327 - - - 2,515 2,979 Indian rupee - - - - - 564 564 Indonesian rupiah 16 11,124 10,163 - - 1,100 22,403 Japanese yen 4,587 532,091 - - 23,343 98,308 658,329 Malaysian ringgit 315 20,649 6,628 - - 4,087 31,679 Mexican peso 260 34,581 9,098 - - 4,764 48,703 New Israeli shekel 73 9,685 - - - 5,513 15,271 New Romanian leu 21 - 2,138 - - (740) 1,419 New Taiwan dollar 1,851 66,010 - - - (2,758) 65,103 New Zealand dollar 47 3,174 - - - 53,079 56,300 Norwegian krone 360 11,966 - - - (1,661) 10,665 Peruvian nuevo sol - - 2,398 - - (319) 2,079 Philippine peso (253) 2,641 811 - - (272) 2,927 Polish zloty 6 - 9,510 - - 2,280 11,796 Qatari rial - 5,448 - - - - 5,448 Russian ruble (571) - 5,857 - - 721 6,007 Singapore dollar 332 14,748 - - - 3,074 18,154 South African rand (948) 24,765 8,183 - - 2,250 34,250 South Korean won 1,361 98,501 - - - (75) 99,787 Swedish krona 1,230 65,241 - - - 9,961 76,432 Swiss franc 279 192,496 147 - - (33,363) 159,559 Thai baht 14 7,354 2,198 - - 6,696 16,262 Turkish lira 1,056 10,286 17,013 - - (7,381) 20,974 United Arab Emirates dirham - 5,893 - - - - 5,893 Total 9,061$ 2,799,333$ 227,767$ 159,224$ 81,902$ 66,794$ 3,344,081$
CITY AND COUNTY OF SAN FRANCISCO Notes to Basic Financial Statements (Continued)
June 30, 2016 (Dollars in Thousands)
75
The table below presents the notional amounts, the fair value amounts, and the related net appreciation (depreciation) in the fair value of derivative instruments that were outstanding at June 30, 2016:
(a) The Retirement System’s investment managers enter into a wide variety of forward foreign exchange and
other contracts, which frequently do not involve the U.S. dollar. As a result, a U.S. dollar-based notional value is not included.
All investment derivatives are reported as investments at fair value in the statement of fiduciary net position. Rights and warrants are reported in equity securities. Foreign exchange contracts are reported in foreign currency contracts, which also include spot contracts that are not derivatives. All other derivative contracts are reported in other debt securities. All changes in fair value are reported as net appreciation (depreciation) in fair value of investments in the statements of changes in fiduciary net position. Counterparty Credit Risk The Retirement System is exposed to credit risk on non-exchange traded derivative instruments that are in asset positions. As of June 30, 2016, the fair value of forward currency contracts (including foreign exchange contract options) to purchase and sell international currencies were $14.9 million and $0.8 million, respectively. The Retirement System’s counterparties to these contracts held credit ratings of A or better on 99.6% of the positions as assigned by one or more of the major credit rating organizations (S&P, Moody’s and/or Fitch) while 0.4% were not rated.
Derivative Type / ContractsNotional Amount Fair Value
Net Appreciation (Depreciation) in
Fair Value Forwards
Foreign Exchange Contracts (a) 14,144$ 14,144$ Other Contracts (a) (114) (114)
OptionsForeign Exchange Contracts 8,426$ (64) 4
SwapsCredit Contracts 2,300 (18) 12 Interest Rate Contracts 43,514 968 766
Rights/WarrantsEquity Contracts 23,123 shares 1,857 (6,406)
Total 16,773$ 8,406$
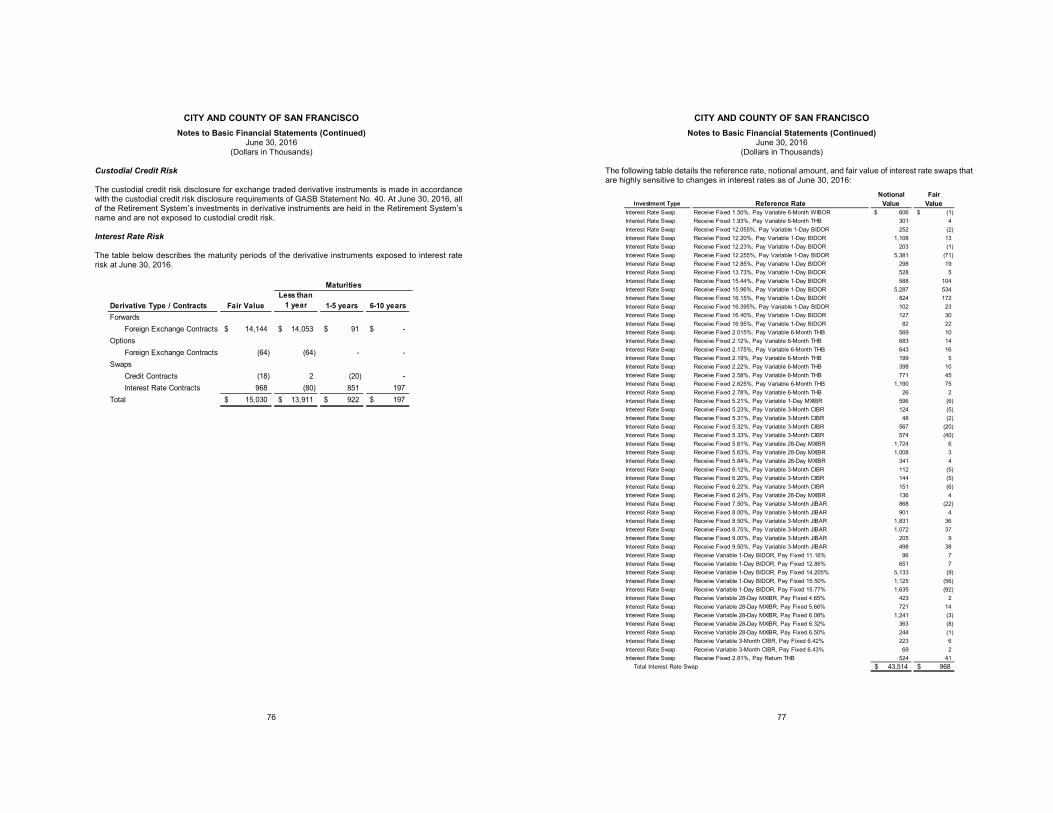
CITY AND COUNTY OF SAN FRANCISCO Notes to Basic Financial Statements (Continued)
June 30, 2016 (Dollars in Thousands)
76
Custodial Credit Risk The custodial credit risk disclosure for exchange traded derivative instruments is made in accordance with the custodial credit risk disclosure requirements of GASB Statement No. 40. At June 30, 2016, all of the Retirement System’s investments in derivative instruments are held in the Retirement System’s name and are not exposed to custodial credit risk. Interest Rate Risk The table below describes the maturity periods of the derivative instruments exposed to interest rate risk at June 30, 2016.
Maturities
Derivative Type / Contracts Fair ValueLess than
1 year 1-5 years 6-10 yearsForwards
Foreign Exchange Contracts 14,144$ 14,053$ 91$ -$ Options
Foreign Exchange Contracts (64) (64) - - Swaps
Credit Contracts (18) 2 (20) - Interest Rate Contracts 968 (80) 851 197
Total 15,030$ 13,911$ 922$ 197$
CITY AND COUNTY OF SAN FRANCISCO Notes to Basic Financial Statements (Continued)
June 30, 2016 (Dollars in Thousands)
77
The following table details the reference rate, notional amount, and fair value of interest rate swaps that are highly sensitive to changes in interest rates as of June 30, 2016:
Notional FairInvestment Type Reference Rate Value Value
Interest Rate Swap Receive Fixed 1.50%, Pay Variable 6-Month WIBOR 606$ (1)$ Interest Rate Swap Receive Fixed 1.93%, Pay Variable 6-Month THB 301 4 Interest Rate Swap Receive Fixed 12.055%, Pay Variable 1-Day BIDOR 252 (2) Interest Rate Swap Receive Fixed 12.20%, Pay Variable 1-Day BIDOR 1,108 13 Interest Rate Swap Receive Fixed 12.23%, Pay Variable 1-Day BIDOR 203 (1) Interest Rate Swap Receive Fixed 12.255%, Pay Variable 1-Day BIDOR 5,381 (71) Interest Rate Swap Receive Fixed 12.85%, Pay Variable 1-Day BIDOR 298 19 Interest Rate Swap Receive Fixed 13.73%, Pay Variable 1-Day BIDOR 528 5 Interest Rate Swap Receive Fixed 15.44%, Pay Variable 1-Day BIDOR 588 104 Interest Rate Swap Receive Fixed 15.96%, Pay Variable 1-Day BIDOR 5,287 534 Interest Rate Swap Receive Fixed 16.15%, Pay Variable 1-Day BIDOR 824 172 Interest Rate Swap Receive Fixed 16.395%, Pay Variable 1-Day BIDOR 102 23 Interest Rate Swap Receive Fixed 16.40%, Pay Variable 1-Day BIDOR 127 30 Interest Rate Swap Receive Fixed 16.95%, Pay Variable 1-Day BIDOR 82 22 Interest Rate Swap Receive Fixed 2.015%, Pay Variable 6-Month THB 569 10 Interest Rate Swap Receive Fixed 2.12%, Pay Variable 6-Month THB 683 14 Interest Rate Swap Receive Fixed 2.175%, Pay Variable 6-Month THB 643 16 Interest Rate Swap Receive Fixed 2.19%, Pay Variable 6-Month THB 199 5 Interest Rate Swap Receive Fixed 2.22%, Pay Variable 6-Month THB 398 10 Interest Rate Swap Receive Fixed 2.58%, Pay Variable 6-Month THB 771 45 Interest Rate Swap Receive Fixed 2.625%, Pay Variable 6-Month THB 1,190 75 Interest Rate Swap Receive Fixed 2.78%, Pay Variable 6-Month THB 26 2 Interest Rate Swap Receive Fixed 5.21%, Pay Variable 1-Day MXIBR 596 (6) Interest Rate Swap Receive Fixed 5.23%, Pay Variable 3-Month CIBR 124 (5) Interest Rate Swap Receive Fixed 5.31%, Pay Variable 3-Month CIBR 48 (2) Interest Rate Swap Receive Fixed 5.32%, Pay Variable 3-Month CIBR 567 (20) Interest Rate Swap Receive Fixed 5.33%, Pay Variable 3-Month CIBR 574 (40) Interest Rate Swap Receive Fixed 5.61%, Pay Variable 28-Day MXIBR 1,724 6 Interest Rate Swap Receive Fixed 5.63%, Pay Variable 28-Day MXIBR 1,008 3 Interest Rate Swap Receive Fixed 5.84%, Pay Variable 28-Day MXIBR 341 4 Interest Rate Swap Receive Fixed 6.12%, Pay Variable 3-Month CIBR 112 (5) Interest Rate Swap Receive Fixed 6.20%, Pay Variable 3-Month CIBR 144 (5) Interest Rate Swap Receive Fixed 6.22%, Pay Variable 3-Month CIBR 151 (6) Interest Rate Swap Receive Fixed 6.24%, Pay Variable 28-Day MXIBR 136 4 Interest Rate Swap Receive Fixed 7.50%, Pay Variable 3-Month JIBAR 868 (22) Interest Rate Swap Receive Fixed 8.00%, Pay Variable 3-Month JIBAR 901 4 Interest Rate Swap Receive Fixed 8.50%, Pay Variable 3-Month JIBAR 1,831 36 Interest Rate Swap Receive Fixed 8.75%, Pay Variable 3-Month JIBAR 1,072 37 Interest Rate Swap Receive Fixed 9.00%, Pay Variable 3-Month JIBAR 205 9 Interest Rate Swap Receive Fixed 9.50%, Pay Variable 3-Month JIBAR 498 38 Interest Rate Swap Receive Variable 1-Day BIDOR, Pay Fixed 11.16% 96 7 Interest Rate Swap Receive Variable 1-Day BIDOR, Pay Fixed 12.86% 651 7 Interest Rate Swap Receive Variable 1-Day BIDOR, Pay Fixed 14.205% 5,133 (9) Interest Rate Swap Receive Variable 1-Day BIDOR, Pay Fixed 15.50% 1,125 (56) Interest Rate Swap Receive Variable 1-Day BIDOR, Pay Fixed 15.77% 1,635 (92) Interest Rate Swap Receive Variable 28-Day MXIBR, Pay Fixed 4.65% 423 2 Interest Rate Swap Receive Variable 28-Day MXIBR, Pay Fixed 5.66% 721 14 Interest Rate Swap Receive Variable 28-Day MXIBR, Pay Fixed 6.08% 1,241 (3) Interest Rate Swap Receive Variable 28-Day MXIBR, Pay Fixed 6.32% 363 (8) Interest Rate Swap Receive Variable 28-Day MXIBR, Pay Fixed 6.50% 244 (1) Interest Rate Swap Receive Variable 3-Month CIBR, Pay Fixed 6.42% 223 6 Interest Rate Swap Receive Variable 3-Month CIBR, Pay Fixed 6.43% 69 2 Interest Rate Swap Receive Fixed 2.81%, Pay Return THB 524 41
Total Interest Rate Swap 43,514$ 968$
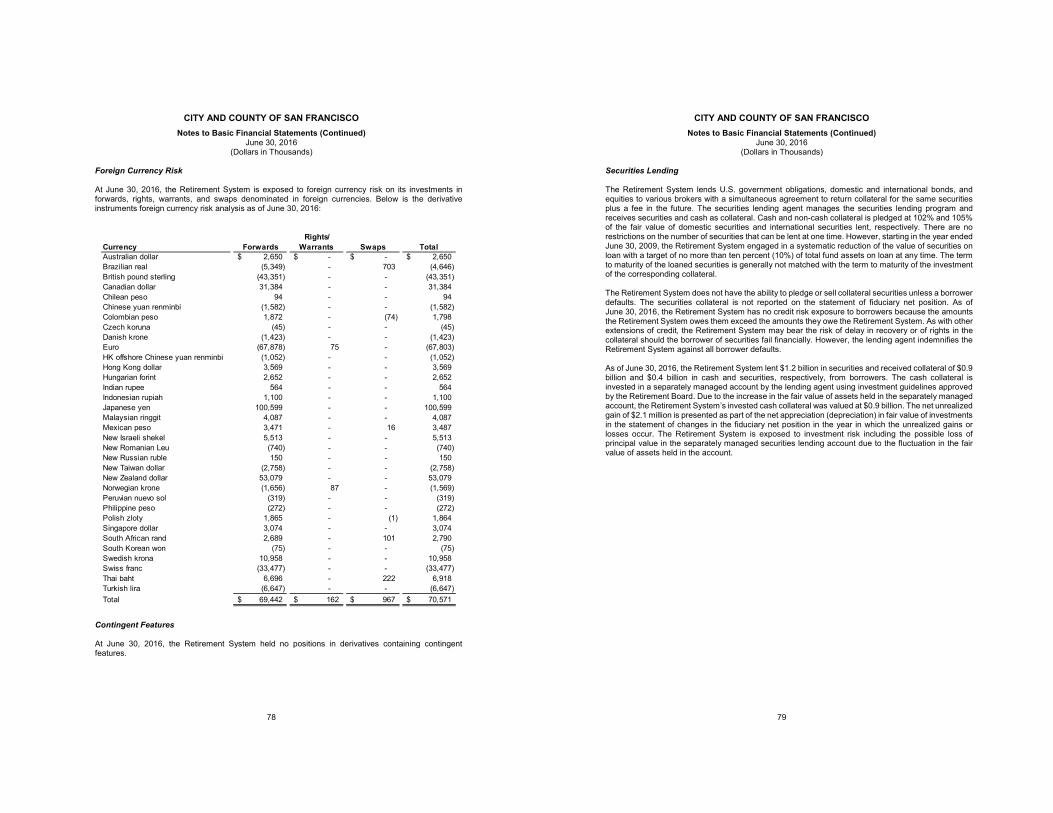
CITY AND COUNTY OF SAN FRANCISCO Notes to Basic Financial Statements (Continued)
June 30, 2016 (Dollars in Thousands)
78
Foreign Currency Risk At June 30, 2016, the Retirement System is exposed to foreign currency risk on its investments in forwards, rights, warrants, and swaps denominated in foreign currencies. Below is the derivative instruments foreign currency risk analysis as of June 30, 2016:
Contingent Features At June 30, 2016, the Retirement System held no positions in derivatives containing contingent features.
Currency Forwards Rights/
Warrants Swaps TotalAustralian dollar 2,650$ -$ -$ 2,650$ Brazilian real (5,349) - 703 (4,646) British pound sterling (43,351) - - (43,351) Canadian dollar 31,384 - - 31,384 Chilean peso 94 - - 94 Chinese yuan renminbi (1,582) - - (1,582) Colombian peso 1,872 - (74) 1,798 Czech koruna (45) - - (45) Danish krone (1,423) - - (1,423) Euro (67,878) 75 - (67,803) HK offshore Chinese yuan renminbi (1,052) - - (1,052) Hong Kong dollar 3,569 - - 3,569 Hungarian forint 2,652 - - 2,652 Indian rupee 564 - - 564 Indonesian rupiah 1,100 - - 1,100 Japanese yen 100,599 - - 100,599 Malaysian ringgit 4,087 - - 4,087 Mexican peso 3,471 - 16 3,487 New Israeli shekel 5,513 - - 5,513 New Romanian Leu (740) - - (740) New Russian ruble 150 - - 150 New Taiwan dollar (2,758) - - (2,758) New Zealand dollar 53,079 - - 53,079 Norwegian krone (1,656) 87 - (1,569) Peruvian nuevo sol (319) - - (319) Philippine peso (272) - - (272) Polish zloty 1,865 - (1) 1,864 Singapore dollar 3,074 - - 3,074 South African rand 2,689 - 101 2,790 South Korean won (75) - - (75) Swedish krona 10,958 - - 10,958 Swiss franc (33,477) - - (33,477) Thai baht 6,696 - 222 6,918 Turkish lira (6,647) - - (6,647) Total 69,442$ 162$ 967$ 70,571$
CITY AND COUNTY OF SAN FRANCISCO Notes to Basic Financial Statements (Continued)
June 30, 2016 (Dollars in Thousands)
79
Securities Lending The Retirement System lends U.S. government obligations, domestic and international bonds, and equities to various brokers with a simultaneous agreement to return collateral for the same securities plus a fee in the future. The securities lending agent manages the securities lending program and receives securities and cash as collateral. Cash and non-cash collateral is pledged at 102% and 105% of the fair value of domestic securities and international securities lent, respectively. There are no restrictions on the number of securities that can be lent at one time. However, starting in the year ended June 30, 2009, the Retirement System engaged in a systematic reduction of the value of securities on loan with a target of no more than ten percent (10%) of total fund assets on loan at any time. The term to maturity of the loaned securities is generally not matched with the term to maturity of the investment of the corresponding collateral. The Retirement System does not have the ability to pledge or sell collateral securities unless a borrower defaults. The securities collateral is not reported on the statement of fiduciary net position. As of June 30, 2016, the Retirement System has no credit risk exposure to borrowers because the amounts the Retirement System owes them exceed the amounts they owe the Retirement System. As with other extensions of credit, the Retirement System may bear the risk of delay in recovery or of rights in the collateral should the borrower of securities fail financially. However, the lending agent indemnifies the Retirement System against all borrower defaults. As of June 30, 2016, the Retirement System lent $1.2 billion in securities and received collateral of $0.9 billion and $0.4 billion in cash and securities, respectively, from borrowers. The cash collateral is invested in a separately managed account by the lending agent using investment guidelines approved by the Retirement Board. Due to the increase in the fair value of assets held in the separately managed account, the Retirement System’s invested cash collateral was valued at $0.9 billion. The net unrealized gain of $2.1 million is presented as part of the net appreciation (depreciation) in fair value of investments in the statement of changes in the fiduciary net position in the year in which the unrealized gains or losses occur. The Retirement System is exposed to investment risk including the possible loss of principal value in the separately managed securities lending account due to the fluctuation in the fair value of assets held in the account.
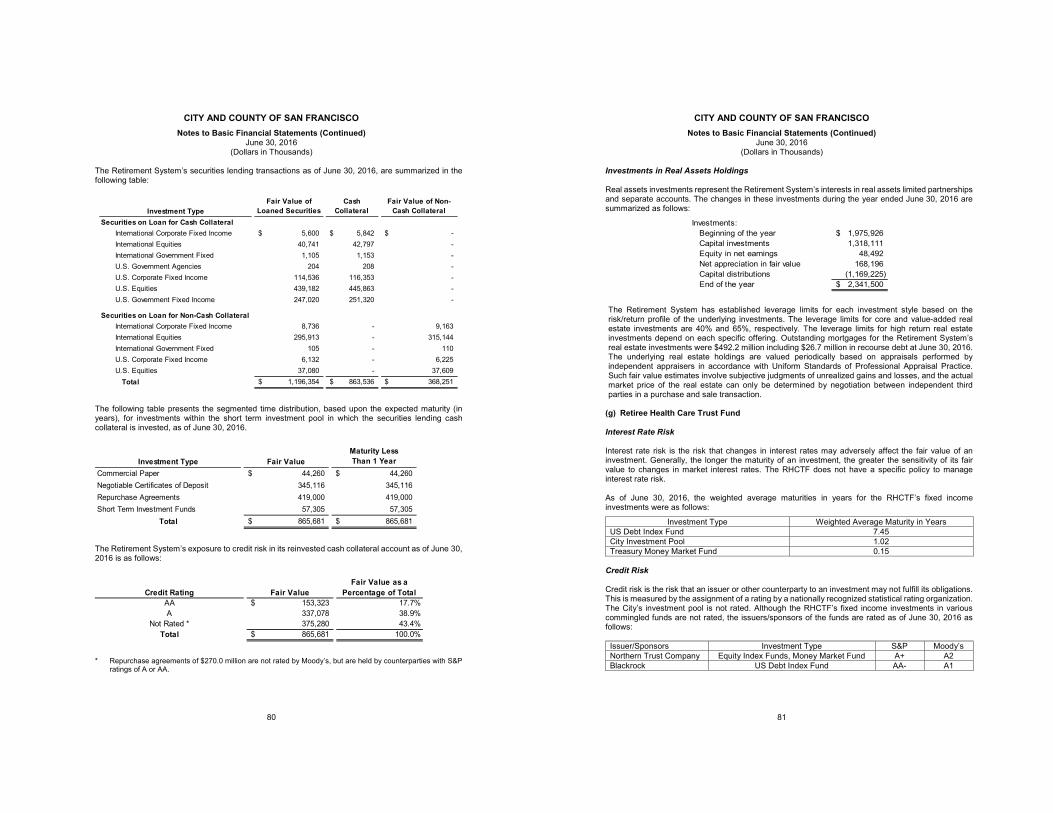
CITY AND COUNTY OF SAN FRANCISCO Notes to Basic Financial Statements (Continued)
June 30, 2016 (Dollars in Thousands)
80
The Retirement System’s securities lending transactions as of June 30, 2016, are summarized in the following table:
The following table presents the segmented time distribution, based upon the expected maturity (in years), for investments within the short term investment pool in which the securities lending cash collateral is invested, as of June 30, 2016.
The Retirement System’s exposure to credit risk in its reinvested cash collateral account as of June 30, 2016 is as follows:
* Repurchase agreements of $270.0 million are not rated by Moody’s, but are held by counterparties with S&P
ratings of A or AA.
Investment Type
Fair Value of Loaned Securities
Cash Collateral
Fair Value of Non-Cash Collateral
Securities on Loan for Cash CollateralInternational Corporate Fixed Income 5,600$ 5,842$ -$ International Equities 40,741 42,797 - International Government Fixed 1,105 1,153 - U.S. Government Agencies 204 208 - U.S. Corporate Fixed Income 114,536 116,353 - U.S. Equities 439,182 445,863 - U.S. Government Fixed Income 247,020 251,320 -
Securities on Loan for Non-Cash CollateralInternational Corporate Fixed Income 8,736 - 9,163 International Equities 295,913 - 315,144 International Government Fixed 105 - 110 U.S. Corporate Fixed Income 6,132 - 6,225 U.S. Equities 37,080 - 37,609 Total 1,196,354$ 863,536$ 368,251$
Investment Type Fair ValueMaturity Less Than 1 Year
Commercial Paper 44,260$ 44,260$ Negotiable Certificates of Deposit 345,116 345,116 Repurchase Agreements 419,000 419,000 Short Term Investment Funds 57,305 57,305
Total 865,681$ 865,681$
Credit Rating Fair ValueFair Value as a
Percentage of TotalAA 153,323$ 17.7%A 337,078 38.9%
Not Rated * 375,280 43.4%Total 865,681$ 100.0%
CITY AND COUNTY OF SAN FRANCISCO Notes to Basic Financial Statements (Continued)
June 30, 2016 (Dollars in Thousands)
81
Investments in Real Assets Holdings Real assets investments represent the Retirement System’s interests in real assets limited partnerships and separate accounts. The changes in these investments during the year ended June 30, 2016 are summarized as follows:
The Retirement System has established leverage limits for each investment style based on the risk/return profile of the underlying investments. The leverage limits for core and value-added real estate investments are 40% and 65%, respectively. The leverage limits for high return real estate investments depend on each specific offering. Outstanding mortgages for the Retirement System’s real estate investments were $492.2 million including $26.7 million in recourse debt at June 30, 2016. The underlying real estate holdings are valued periodically based on appraisals performed by independent appraisers in accordance with Uniform Standards of Professional Appraisal Practice. Such fair value estimates involve subjective judgments of unrealized gains and losses, and the actual market price of the real estate can only be determined by negotiation between independent third parties in a purchase and sale transaction.
(g) Retiree Health Care Trust Fund
Interest Rate Risk Interest rate risk is the risk that changes in interest rates may adversely affect the fair value of an investment. Generally, the longer the maturity of an investment, the greater the sensitivity of its fair value to changes in market interest rates. The RHCTF does not have a specific policy to manage interest rate risk. As of June 30, 2016, the weighted average maturities in years for the RHCTF’s fixed income investments were as follows:
Investment Type Weighted Average Maturity in Years US Debt Index Fund 7.45 City Investment Pool 1.02 Treasury Money Market Fund 0.15
Credit Risk Credit risk is the risk that an issuer or other counterparty to an investment may not fulfill its obligations. This is measured by the assignment of a rating by a nationally recognized statistical rating organization. The City’s investment pool is not rated. Although the RHCTF’s fixed income investments in various commingled funds are not rated, the issuers/sponsors of the funds are rated as of June 30, 2016 as follows:
Issuer/Sponsors Investment Type S&P Moody’s Northern Trust Company Equity Index Funds, Money Market Fund A+ A2 Blackrock US Debt Index Fund AA- A1
Investments:Beginning of the year 1,975,926$ Capital investments 1,318,111 Equity in net earnings 48,492 Net appreciation in fair value 168,196 Capital distributions (1,169,225) End of the year 2,341,500$
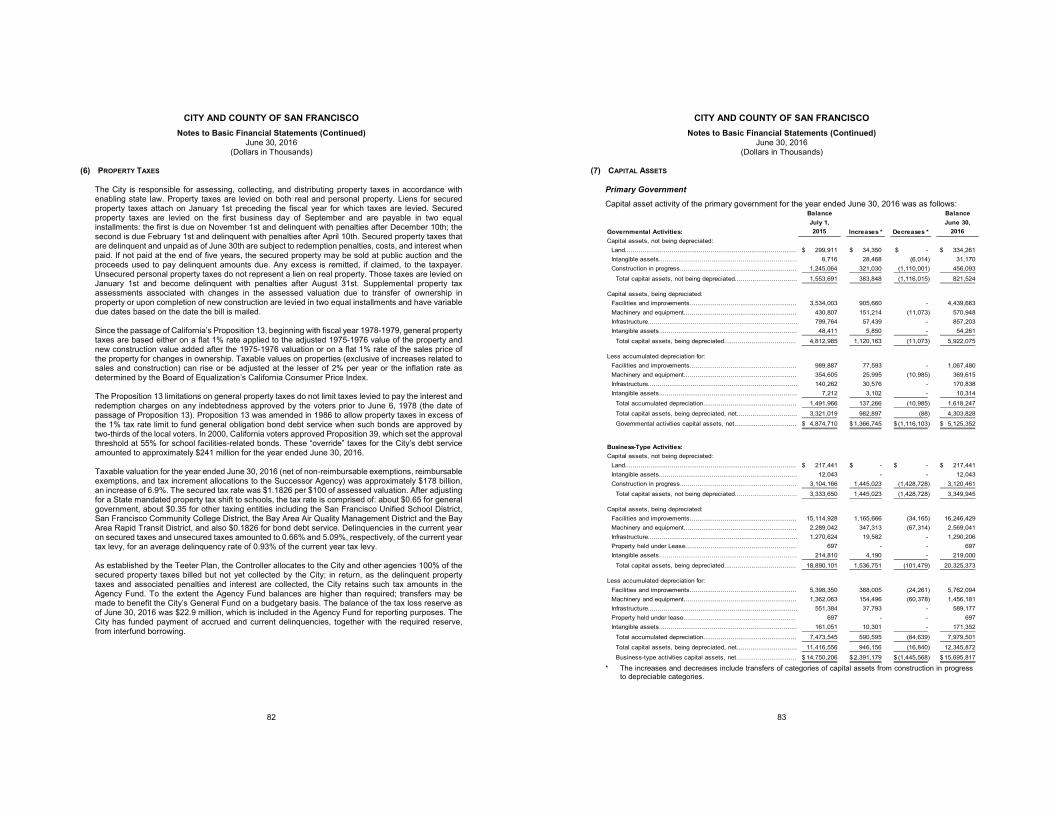
CITY AND COUNTY OF SAN FRANCISCO Notes to Basic Financial Statements (Continued)
June 30, 2016 (Dollars in Thousands)
82
(6) PROPERTY TAXES The City is responsible for assessing, collecting, and distributing property taxes in accordance with enabling state law. Property taxes are levied on both real and personal property. Liens for secured property taxes attach on January 1st preceding the fiscal year for which taxes are levied. Secured property taxes are levied on the first business day of September and are payable in two equal installments: the first is due on November 1st and delinquent with penalties after December 10th; the second is due February 1st and delinquent with penalties after April 10th. Secured property taxes that are delinquent and unpaid as of June 30th are subject to redemption penalties, costs, and interest when paid. If not paid at the end of five years, the secured property may be sold at public auction and the proceeds used to pay delinquent amounts due. Any excess is remitted, if claimed, to the taxpayer. Unsecured personal property taxes do not represent a lien on real property. Those taxes are levied on January 1st and become delinquent with penalties after August 31st. Supplemental property tax assessments associated with changes in the assessed valuation due to transfer of ownership in property or upon completion of new construction are levied in two equal installments and have variable due dates based on the date the bill is mailed. Since the passage of California’s Proposition 13, beginning with fiscal year 1978-1979, general property taxes are based either on a flat 1% rate applied to the adjusted 1975-1976 value of the property and new construction value added after the 1975-1976 valuation or on a flat 1% rate of the sales price of the property for changes in ownership. Taxable values on properties (exclusive of increases related to sales and construction) can rise or be adjusted at the lesser of 2% per year or the inflation rate as determined by the Board of Equalization’s California Consumer Price Index. The Proposition 13 limitations on general property taxes do not limit taxes levied to pay the interest and redemption charges on any indebtedness approved by the voters prior to June 6, 1978 (the date of passage of Proposition 13). Proposition 13 was amended in 1986 to allow property taxes in excess of the 1% tax rate limit to fund general obligation bond debt service when such bonds are approved by two-thirds of the local voters. In 2000, California voters approved Proposition 39, which set the approval threshold at 55% for school facilities-related bonds. These “override” taxes for the City’s debt service amounted to approximately $241 million for the year ended June 30, 2016. Taxable valuation for the year ended June 30, 2016 (net of non-reimbursable exemptions, reimbursable exemptions, and tax increment allocations to the Successor Agency) was approximately $178 billion, an increase of 6.9%. The secured tax rate was $1.1826 per $100 of assessed valuation. After adjusting for a State mandated property tax shift to schools, the tax rate is comprised of: about $0.65 for general government, about $0.35 for other taxing entities including the San Francisco Unified School District, San Francisco Community College District, the Bay Area Air Quality Management District and the Bay Area Rapid Transit District, and also $0.1826 for bond debt service. Delinquencies in the current year on secured taxes and unsecured taxes amounted to 0.66% and 5.09%, respectively, of the current year tax levy, for an average delinquency rate of 0.93% of the current year tax levy. As established by the Teeter Plan, the Controller allocates to the City and other agencies 100% of the secured property taxes billed but not yet collected by the City; in return, as the delinquent property taxes and associated penalties and interest are collected, the City retains such tax amounts in the Agency Fund. To the extent the Agency Fund balances are higher than required; transfers may be made to benefit the City’s General Fund on a budgetary basis. The balance of the tax loss reserve as of June 30, 2016 was $22.9 million, which is included in the Agency Fund for reporting purposes. The City has funded payment of accrued and current delinquencies, together with the required reserve, from interfund borrowing.
CITY AND COUNTY OF SAN FRANCISCO Notes to Basic Financial Statements (Continued)
June 30, 2016 (Dollars in Thousands)
83
(7) CAPITAL ASSETS
Primary Government
Capital asset activity of the primary government for the year ended June 30, 2016 was as follows:
* The increases and decreases include transfers of categories of capital assets from construction in progress
to depreciable categories.
Balance BalanceJuly 1, June 30,
Governmental Activities: 2015 Increases * Decreases * 2016Capital assets, not being depreciated:
Land........................................................................................ 299,911$ 34,350$ -$ 334,261$ Intangible assets....................................................................... 8,716 28,468 (6,014) 31,170 Construction in progress............................................................ 1,245,064 321,030 (1,110,001) 456,093
Total capital assets, not being depreciated................................ 1,553,691 383,848 (1,116,015) 821,524
Capital assets, being depreciated:Facilities and improvements....................................................... 3,534,003 905,660 - 4,439,663 Machinery and equipment.......................................................... 430,807 151,214 (11,073) 570,948 Infrastructure............................................................................. 799,764 57,439 - 857,203 Intangible assets....................................................................... 48,411 5,850 - 54,261
Total capital assets, being depreciated..................................... 4,812,985 1,120,163 (11,073) 5,922,075
Less accumulated depreciation for:Facilities and improvements....................................................... 989,887 77,593 - 1,067,480 Machinery and equipment.......................................................... 354,605 25,995 (10,985) 369,615 Infrastructure............................................................................. 140,262 30,576 - 170,838 Intangible assets....................................................................... 7,212 3,102 - 10,314
Total accumulated depreciation................................................ 1,491,966 137,266 (10,985) 1,618,247 Total capital assets, being depreciated, net............................... 3,321,019 982,897 (88) 4,303,828 Governmental activities capital assets, net................................ 4,874,710$ 1,366,745$ (1,116,103)$ 5,125,352$
Business-Type Activities:Capital assets, not being depreciated:
Land........................................................................................ 217,441$ -$ -$ 217,441$ Intangible assets....................................................................... 12,043 - - 12,043 Construction in progress............................................................ 3,104,166 1,445,023 (1,428,728) 3,120,461
Total capital assets, not being depreciated................................ 3,333,650 1,445,023 (1,428,728) 3,349,945
Capital assets, being depreciated:Facilities and improvements....................................................... 15,114,928 1,165,666 (34,165) 16,246,429 Machinery and equipment.......................................................... 2,289,042 347,313 (67,314) 2,569,041 Infrastructure............................................................................. 1,270,624 19,582 - 1,290,206 Property held under Lease......................................................... 697 - - 697 Intangible assets....................................................................... 214,810 4,190 - 219,000
Total capital assets, being depreciated..................................... 18,890,101 1,536,751 (101,479) 20,325,373
Less accumulated depreciation for:Facilities and improvements....................................................... 5,398,350 388,005 (24,261) 5,762,094 Machinery and equipment.......................................................... 1,362,063 154,496 (60,378) 1,456,181 Infrastructure............................................................................. 551,384 37,793 - 589,177 Property held under lease.......................................................... 697 - - 697 Intangible assets....................................................................... 161,051 10,301 - 171,352
Total accumulated depreciation................................................ 7,473,545 590,595 (84,639) 7,979,501 Total capital assets, being depreciated, net............................... 11,416,556 946,156 (16,840) 12,345,872 Business-type activities capital assets, net............................... 14,750,206$ 2,391,179$ (1,445,568)$ 15,695,817$
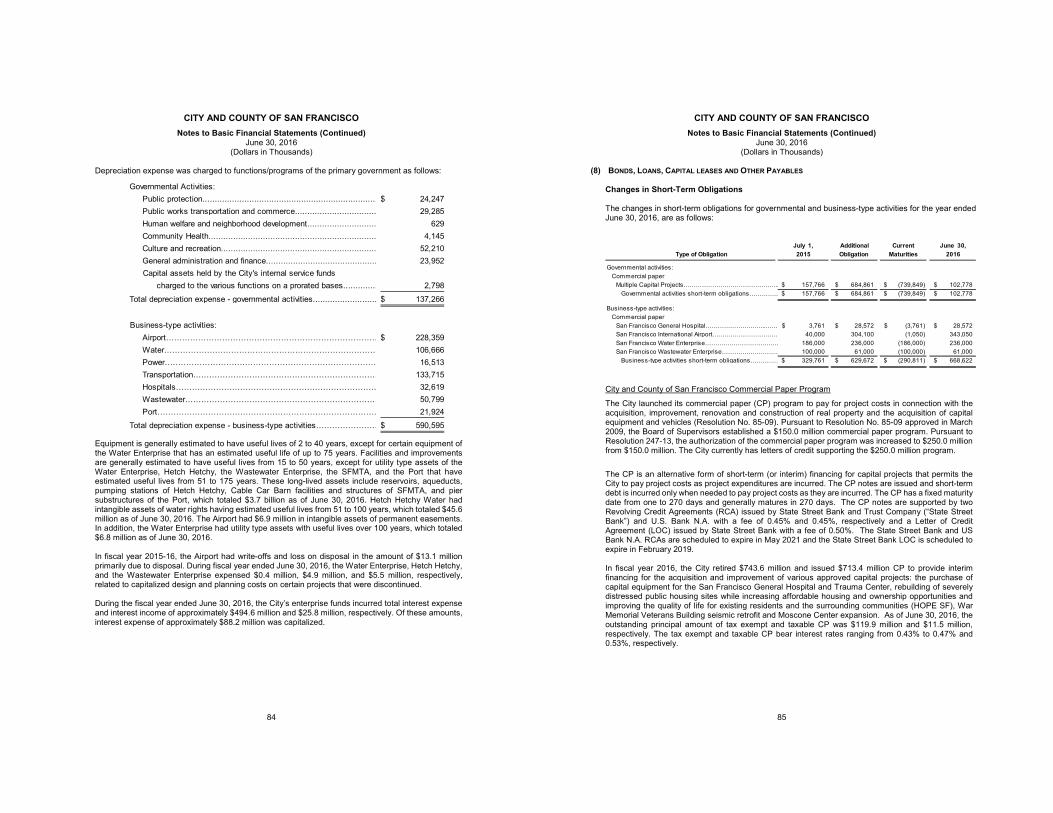
CITY AND COUNTY OF SAN FRANCISCO Notes to Basic Financial Statements (Continued)
June 30, 2016 (Dollars in Thousands)
84
Depreciation expense was charged to functions/programs of the primary government as follows:
Equipment is generally estimated to have useful lives of 2 to 40 years, except for certain equipment of the Water Enterprise that has an estimated useful life of up to 75 years. Facilities and improvements are generally estimated to have useful lives from 15 to 50 years, except for utility type assets of the Water Enterprise, Hetch Hetchy, the Wastewater Enterprise, the SFMTA, and the Port that have estimated useful lives from 51 to 175 years. These long-lived assets include reservoirs, aqueducts, pumping stations of Hetch Hetchy, Cable Car Barn facilities and structures of SFMTA, and pier substructures of the Port, which totaled $3.7 billion as of June 30, 2016. Hetch Hetchy Water had intangible assets of water rights having estimated useful lives from 51 to 100 years, which totaled $45.6 million as of June 30, 2016. The Airport had $6.9 million in intangible assets of permanent easements. In addition, the Water Enterprise had utility type assets with useful lives over 100 years, which totaled $6.8 million as of June 30, 2016. In fiscal year 2015-16, the Airport had write-offs and loss on disposal in the amount of $13.1 million primarily due to disposal. During fiscal year ended June 30, 2016, the Water Enterprise, Hetch Hetchy, and the Wastewater Enterprise expensed $0.4 million, $4.9 million, and $5.5 million, respectively, related to capitalized design and planning costs on certain projects that were discontinued. During the fiscal year ended June 30, 2016, the City’s enterprise funds incurred total interest expense and interest income of approximately $494.6 million and $25.8 million, respectively. Of these amounts, interest expense of approximately $88.2 million was capitalized.
Governmental Activities:Public protection....................................................................... 24,247$ Public works transportation and commerce................................. 29,285 Human welfare and neighborhood development............................ 629 Community Health.................................................................... 4,145 Culture and recreation............................................................... 52,210 General administration and finance............................................. 23,952 Capital assets held by the City's internal service funds
charged to the various functions on a prorated bases.............. 2,798 Total depreciation expense - governmental activities.......................... 137,266$
Business-type activities:Airport……………………………………………………………………… 228,359$ Water……………………………………………………………………… 106,666 Power……………………………………………………………………… 16,513 Transportation…………………………………………………………… 133,715 Hospitals………………………………………………………………… 32,619 Wastewater……………………………………………………………… 50,799 Port………………………………………………………………………… 21,924
Total depreciation expense - business-type activities…………………… 590,595$
CITY AND COUNTY OF SAN FRANCISCO Notes to Basic Financial Statements (Continued)
June 30, 2016 (Dollars in Thousands)
85
(8) BONDS, LOANS, CAPITAL LEASES AND OTHER PAYABLES
Changes in Short-Term Obligations The changes in short-term obligations for governmental and business-type activities for the year ended June 30, 2016, are as follows:
City and County of San Francisco Commercial Paper Program
The City launched its commercial paper (CP) program to pay for project costs in connection with the acquisition, improvement, renovation and construction of real property and the acquisition of capital equipment and vehicles (Resolution No. 85-09). Pursuant to Resolution No. 85-09 approved in March 2009, the Board of Supervisors established a $150.0 million commercial paper program. Pursuant to Resolution 247-13, the authorization of the commercial paper program was increased to $250.0 million from $150.0 million. The City currently has letters of credit supporting the $250.0 million program.
The CP is an alternative form of short-term (or interim) financing for capital projects that permits the City to pay project costs as project expenditures are incurred. The CP notes are issued and short-term debt is incurred only when needed to pay project costs as they are incurred. The CP has a fixed maturity date from one to 270 days and generally matures in 270 days. The CP notes are supported by two Revolving Credit Agreements (RCA) issued by State Street Bank and Trust Company (“State Street Bank”) and U.S. Bank N.A. with a fee of 0.45% and 0.45%, respectively and a Letter of Credit Agreement (LOC) issued by State Street Bank with a fee of 0.50%. The State Street Bank and US Bank N.A. RCAs are scheduled to expire in May 2021 and the State Street Bank LOC is scheduled to expire in February 2019. In fiscal year 2016, the City retired $743.6 million and issued $713.4 million CP to provide interim financing for the acquisition and improvement of various approved capital projects: the purchase of capital equipment for the San Francisco General Hospital and Trauma Center, rebuilding of severely distressed public housing sites while increasing affordable housing and ownership opportunities and improving the quality of life for existing residents and the surrounding communities (HOPE SF), War Memorial Veterans Building seismic retrofit and Moscone Center expansion. As of June 30, 2016, the outstanding principal amount of tax exempt and taxable CP was $119.9 million and $11.5 million, respectively. The tax exempt and taxable CP bear interest rates ranging from 0.43% to 0.47% and 0.53%, respectively.
July 1, Additional Current June 30,Type of Obligation 2015 Obligation Maturities 2016
Governmental activities:Commercial paper
Multiple Capital Projects……………………………………….. 157,766$ 684,861$ (739,849)$ 102,778$ Governmental activities short-term obligations…………… 157,766$ 684,861$ (739,849)$ 102,778$
Business-type activities:Commercial paper
3,761$ 28,572$ (3,761)$ 28,572$ San Francisco International Airport…………………………… 40,000 304,100 (1,050) 343,050 San Francisco Water Enterprise……………………………… 186,000 236,000 (186,000) 236,000 San Francisco Wastewater Enterprise………………………… 100,000 61,000 (100,000) 61,000
Business-type activities short-term obligations…………… 329,761$ 629,672$ (290,811)$ 668,622$
San Francisco General Hospital………………………...……
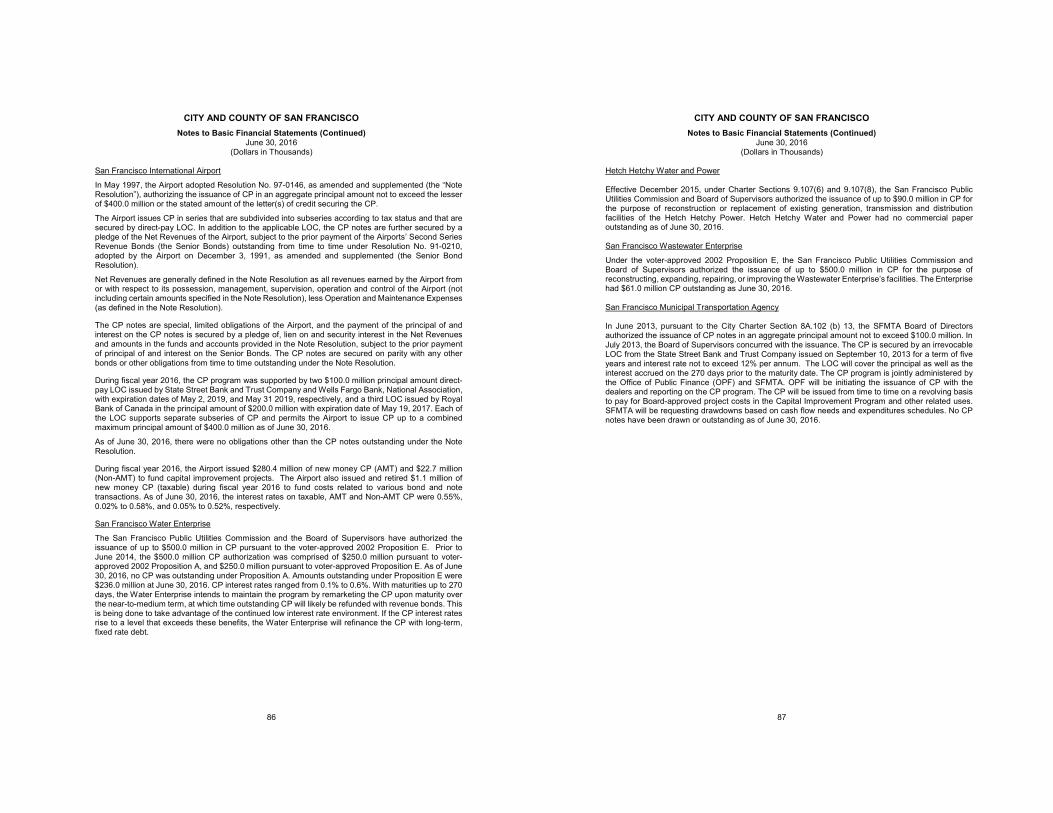
CITY AND COUNTY OF SAN FRANCISCO Notes to Basic Financial Statements (Continued)
June 30, 2016 (Dollars in Thousands)
86
San Francisco International Airport
In May 1997, the Airport adopted Resolution No. 97-0146, as amended and supplemented (the “Note Resolution”), authorizing the issuance of CP in an aggregate principal amount not to exceed the lesser of $400.0 million or the stated amount of the letter(s) of credit securing the CP.
The Airport issues CP in series that are subdivided into subseries according to tax status and that are secured by direct-pay LOC. In addition to the applicable LOC, the CP notes are further secured by a pledge of the Net Revenues of the Airport, subject to the prior payment of the Airports’ Second Series Revenue Bonds (the Senior Bonds) outstanding from time to time under Resolution No. 91-0210, adopted by the Airport on December 3, 1991, as amended and supplemented (the Senior Bond Resolution).
Net Revenues are generally defined in the Note Resolution as all revenues earned by the Airport from or with respect to its possession, management, supervision, operation and control of the Airport (not including certain amounts specified in the Note Resolution), less Operation and Maintenance Expenses (as defined in the Note Resolution).
The CP notes are special, limited obligations of the Airport, and the payment of the principal of and interest on the CP notes is secured by a pledge of, lien on and security interest in the Net Revenues and amounts in the funds and accounts provided in the Note Resolution, subject to the prior payment of principal of and interest on the Senior Bonds. The CP notes are secured on parity with any other bonds or other obligations from time to time outstanding under the Note Resolution.
During fiscal year 2016, the CP program was supported by two $100.0 million principal amount direct-pay LOC issued by State Street Bank and Trust Company and Wells Fargo Bank, National Association, with expiration dates of May 2, 2019, and May 31 2019, respectively, and a third LOC issued by Royal Bank of Canada in the principal amount of $200.0 million with expiration date of May 19, 2017. Each of the LOC supports separate subseries of CP and permits the Airport to issue CP up to a combined maximum principal amount of $400.0 million as of June 30, 2016.
As of June 30, 2016, there were no obligations other than the CP notes outstanding under the Note Resolution.
During fiscal year 2016, the Airport issued $280.4 million of new money CP (AMT) and $22.7 million (Non-AMT) to fund capital improvement projects. The Airport also issued and retired $1.1 million of new money CP (taxable) during fiscal year 2016 to fund costs related to various bond and note transactions. As of June 30, 2016, the interest rates on taxable, AMT and Non-AMT CP were 0.55%, 0.02% to 0.58%, and 0.05% to 0.52%, respectively.
San Francisco Water Enterprise
The San Francisco Public Utilities Commission and the Board of Supervisors have authorized the issuance of up to $500.0 million in CP pursuant to the voter-approved 2002 Proposition E. Prior to June 2014, the $500.0 million CP authorization was comprised of $250.0 million pursuant to voter-approved 2002 Proposition A, and $250.0 million pursuant to voter-approved Proposition E. As of June 30, 2016, no CP was outstanding under Proposition A. Amounts outstanding under Proposition E were $236.0 million at June 30, 2016. CP interest rates ranged from 0.1% to 0.6%. With maturities up to 270 days, the Water Enterprise intends to maintain the program by remarketing the CP upon maturity over the near-to-medium term, at which time outstanding CP will likely be refunded with revenue bonds. This is being done to take advantage of the continued low interest rate environment. If the CP interest rates rise to a level that exceeds these benefits, the Water Enterprise will refinance the CP with long-term, fixed rate debt.
CITY AND COUNTY OF SAN FRANCISCO Notes to Basic Financial Statements (Continued)
June 30, 2016 (Dollars in Thousands)
87
Hetch Hetchy Water and Power Effective December 2015, under Charter Sections 9.107(6) and 9.107(8), the San Francisco Public Utilities Commission and Board of Supervisors authorized the issuance of up to $90.0 million in CP for the purpose of reconstruction or replacement of existing generation, transmission and distribution facilities of the Hetch Hetchy Power. Hetch Hetchy Water and Power had no commercial paper outstanding as of June 30, 2016. San Francisco Wastewater Enterprise
Under the voter-approved 2002 Proposition E, the San Francisco Public Utilities Commission and Board of Supervisors authorized the issuance of up to $500.0 million in CP for the purpose of reconstructing, expanding, repairing, or improving the Wastewater Enterprise’s facilities. The Enterprise had $61.0 million CP outstanding as June 30, 2016. San Francisco Municipal Transportation Agency In June 2013, pursuant to the City Charter Section 8A.102 (b) 13, the SFMTA Board of Directors authorized the issuance of CP notes in an aggregate principal amount not to exceed $100.0 million. In July 2013, the Board of Supervisors concurred with the issuance. The CP is secured by an irrevocable LOC from the State Street Bank and Trust Company issued on September 10, 2013 for a term of five years and interest rate not to exceed 12% per annum. The LOC will cover the principal as well as the interest accrued on the 270 days prior to the maturity date. The CP program is jointly administered by the Office of Public Finance (OPF) and SFMTA. OPF will be initiating the issuance of CP with the dealers and reporting on the CP program. The CP will be issued from time to time on a revolving basis to pay for Board-approved project costs in the Capital Improvement Program and other related uses. SFMTA will be requesting drawdowns based on cash flow needs and expenditures schedules. No CP notes have been drawn or outstanding as of June 30, 2016.
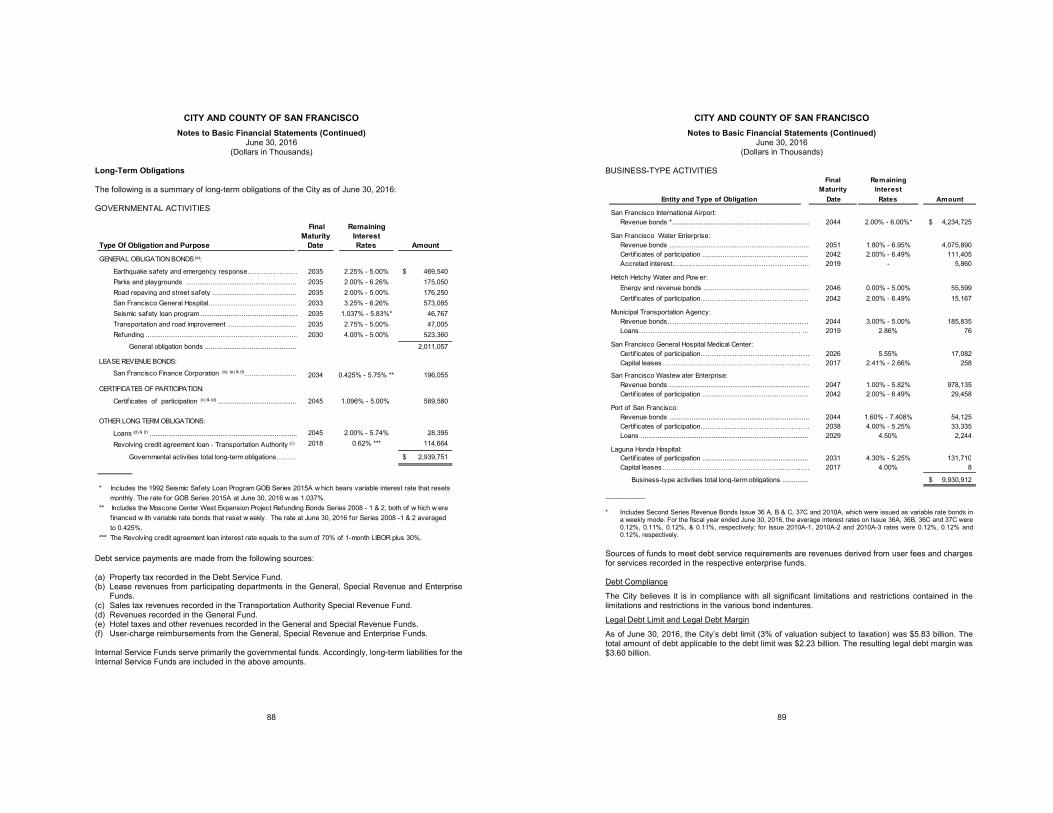
CITY AND COUNTY OF SAN FRANCISCO Notes to Basic Financial Statements (Continued)
June 30, 2016 (Dollars in Thousands)
88
Long-Term Obligations The following is a summary of long-term obligations of the City as of June 30, 2016: GOVERNMENTAL ACTIVITIES
Debt service payments are made from the following sources: (a) Property tax recorded in the Debt Service Fund. (b) Lease revenues from participating departments in the General, Special Revenue and Enterprise
Funds. (c) Sales tax revenues recorded in the Transportation Authority Special Revenue Fund. (d) Revenues recorded in the General Fund. (e) Hotel taxes and other revenues recorded in the General and Special Revenue Funds. (f) User-charge reimbursements from the General, Special Revenue and Enterprise Funds. Internal Service Funds serve primarily the governmental funds. Accordingly, long-term liabilities for the Internal Service Funds are included in the above amounts.
Final RemainingMaturity Interest
Type Of Obligation and Purpose Date Rates Amount
GENERAL OBLIGATION BONDS (a):
Earthquake safety and emergency response…………………… 2035 2.25% - 5.00% 469,540$ Parks and playgrounds ............................................................ 2035 2.00% - 6.26% 175,050 Road repaving and street safety .............................................. 2035 2.00% - 5.00% 176,250 San Francisco General Hospital………………………………… 2033 3.25% - 6.26% 573,085 Seismic safety loan program .................................................... 2035 1.037% - 5.83%* 46,767 Transportation and road improvement ...................................... 2035 2.75% - 5.00% 47,005 Refunding ................................................................................. 2030 4.00% - 5.00% 523,360
General obligation bonds .................................................. 2,011,057
LEASE REVENUE BONDS:
San Francisco Finance Corporation (b), (e) & (f)............................. 2034 0.425% - 5.75% ** 196,055
CERTIFICATES OF PARTICIPATION:
Certif icates of participation (c) & (d) ........................................... 2045 1.096% - 5.00% 589,580
OTHER LONG TERM OBLIGATIONS:
Loans (d) & (f) ............................................................................... 2045 2.00% - 5.74% 28,395
Revolving credit agreement loan - Transportation Authority (c) . 2018 0.62% *** 114,664
Governmental activities total long-term obligations……… 2,939,751$
* Includes the 1992 Seismic Safety Loan Program GOB Series 2015A w hich bears variable interest rate that resets monthly. The rate for GOB Series 2015A at June 30, 2016 w as 1.037%.** Includes the Moscone Center West Expansion Project Refunding Bonds Series 2008 - 1 & 2, both of w hich w ere f inanced w ith variable rate bonds that reset w eekly. The rate at June 30, 2016 for Series 2008 -1 & 2 averaged to 0.425%.*** The Revolving credit agreement loan interest rate equals to the sum of 70% of 1-month LIBOR plus 30%.
CITY AND COUNTY OF SAN FRANCISCO Notes to Basic Financial Statements (Continued)
June 30, 2016 (Dollars in Thousands)
89
BUSINESS-TYPE ACTIVITIES
___________ * Includes Second Series Revenue Bonds Issue 36 A, B & C, 37C and 2010A, which were issued as variable rate bonds in
a weekly mode. For the fiscal year ended June 30, 2016, the average interest rates on Issue 36A, 36B, 36C and 37C were 0.12%, 0.11%, 0.12%, & 0.11%, respectively; for Issue 2010A-1, 2010A-2 and 2010A-3 rates were 0.12%, 0.12% and 0.12%, respectively.
Sources of funds to meet debt service requirements are revenues derived from user fees and charges for services recorded in the respective enterprise funds.
Debt Compliance
The City believes it is in compliance with all significant limitations and restrictions contained in the limitations and restrictions in the various bond indentures.
Legal Debt Limit and Legal Debt Margin
As of June 30, 2016, the City’s debt limit (3% of valuation subject to taxation) was $5.83 billion. The total amount of debt applicable to the debt limit was $2.23 billion. The resulting legal debt margin was $3.60 billion.
Final RemainingMaturity Interest
Entity and Type of Obligation Date Rates Amount
San Francisco International Airport:Revenue bonds *.......................................................................... 2044 2.00% - 6.00%* 4,234,725$
San Francisco Water Enterprise:Revenue bonds ........................................................................... 2051 1.80% - 6.95% 4,075,890 Certif icates of participation ......................................................... 2042 2.00% - 6.49% 111,405 Accreted interest…………………………………………………… 2019 - 5,860
Hetch Hetchy Water and Pow er:Energy and revenue bonds ......................................................... 2046 0.00% - 5.00% 55,599 Certif icates of participation………………………...……………… 2042 2.00% - 6.49% 15,167
Municipal Transportation Agency:Revenue bonds……………………………………………………… 2044 3.00% - 5.00% 185,835 Loans………………………………………………………………… 2019 2.86% 76
San Francisco General Hospital Medical Center:Certif icates of participation………………………………………… 2026 5.55% 17,082 Capital leases………………………………………………………… 2017 2.41% - 2.66% 258
San Francisco Wastew ater Enterprise:Revenue bonds ........................................................................... 2047 1.00% - 5.82% 978,135 Certif icates of participation ......................................................... 2042 2.00% - 6.49% 29,458
Port of San Francisco:Revenue bonds ........................................................................... 2044 1.60% - 7.408% 54,125 Certif icates of participation………………………………………… 2038 4.00% - 5.25% 33,335 Loans .......................................................................................... 2029 4.50% 2,244
Laguna Honda Hospital:Certif icates of participation ......................................................... 2031 4.30% - 5.25% 131,710 Capital leases………………………………………………………… 2017 4.00% 8
Business-type activities total long-term obligations .............. 9,930,912$
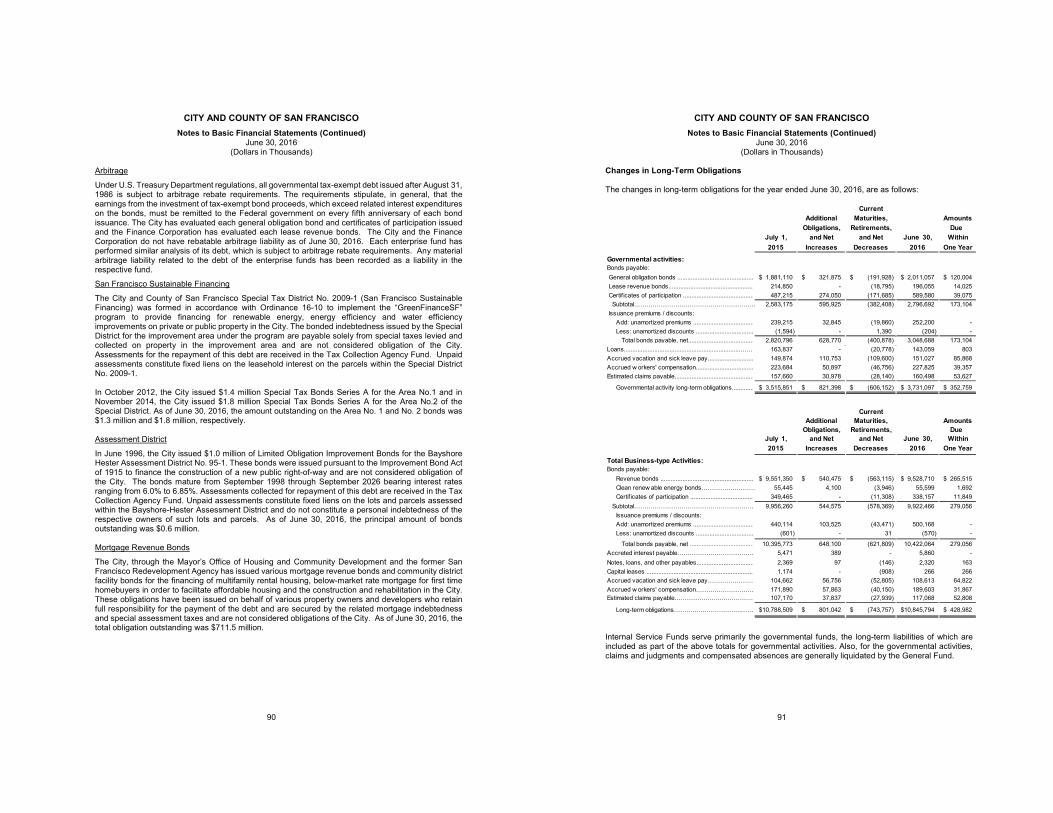
CITY AND COUNTY OF SAN FRANCISCO Notes to Basic Financial Statements (Continued)
June 30, 2016 (Dollars in Thousands)
90
Arbitrage
Under U.S. Treasury Department regulations, all governmental tax-exempt debt issued after August 31, 1986 is subject to arbitrage rebate requirements. The requirements stipulate, in general, that the earnings from the investment of tax-exempt bond proceeds, which exceed related interest expenditures on the bonds, must be remitted to the Federal government on every fifth anniversary of each bond issuance. The City has evaluated each general obligation bond and certificates of participation issued and the Finance Corporation has evaluated each lease revenue bonds. The City and the Finance Corporation do not have rebatable arbitrage liability as of June 30, 2016. Each enterprise fund has performed similar analysis of its debt, which is subject to arbitrage rebate requirements. Any material arbitrage liability related to the debt of the enterprise funds has been recorded as a liability in the respective fund.
San Francisco Sustainable Financing
The City and County of San Francisco Special Tax District No. 2009-1 (San Francisco Sustainable Financing) was formed in accordance with Ordinance 16-10 to implement the “GreenFinanceSF” program to provide financing for renewable energy, energy efficiency and water efficiency improvements on private or public property in the City. The bonded indebtedness issued by the Special District for the improvement area under the program are payable solely from special taxes levied and collected on property in the improvement area and are not considered obligation of the City. Assessments for the repayment of this debt are received in the Tax Collection Agency Fund. Unpaid assessments constitute fixed liens on the leasehold interest on the parcels within the Special District No. 2009-1. In October 2012, the City issued $1.4 million Special Tax Bonds Series A for the Area No.1 and in November 2014, the City issued $1.8 million Special Tax Bonds Series A for the Area No.2 of the Special District. As of June 30, 2016, the amount outstanding on the Area No. 1 and No. 2 bonds was $1.3 million and $1.8 million, respectively. Assessment District
In June 1996, the City issued $1.0 million of Limited Obligation Improvement Bonds for the Bayshore Hester Assessment District No. 95-1. These bonds were issued pursuant to the Improvement Bond Act of 1915 to finance the construction of a new public right-of-way and are not considered obligation of the City. The bonds mature from September 1998 through September 2026 bearing interest rates ranging from 6.0% to 6.85%. Assessments collected for repayment of this debt are received in the Tax Collection Agency Fund. Unpaid assessments constitute fixed liens on the lots and parcels assessed within the Bayshore-Hester Assessment District and do not constitute a personal indebtedness of the respective owners of such lots and parcels. As of June 30, 2016, the principal amount of bonds outstanding was $0.6 million. Mortgage Revenue Bonds
The City, through the Mayor’s Office of Housing and Community Development and the former San Francisco Redevelopment Agency has issued various mortgage revenue bonds and community district facility bonds for the financing of multifamily rental housing, below-market rate mortgage for first time homebuyers in order to facilitate affordable housing and the construction and rehabilitation in the City. These obligations have been issued on behalf of various property owners and developers who retain full responsibility for the payment of the debt and are secured by the related mortgage indebtedness and special assessment taxes and are not considered obligations of the City. As of June 30, 2016, the total obligation outstanding was $711.5 million.
CITY AND COUNTY OF SAN FRANCISCO Notes to Basic Financial Statements (Continued)
June 30, 2016 (Dollars in Thousands)
91
Changes in Long-Term Obligations The changes in long-term obligations for the year ended June 30, 2016, are as follows:
Internal Service Funds serve primarily the governmental funds, the long-term liabilities of which are included as part of the above totals for governmental activities. Also, for the governmental activities, claims and judgments and compensated absences are generally liquidated by the General Fund.
Current Additional Maturities, Amounts Obligations, Retirements, Due
July 1, and Net and Net June 30, Within2015 Increases Decreases 2016 One Year
Governmental activities: Bonds payable: General obligation bonds ............................................. 1,881,110$ 321,875$ (191,928)$ 2,011,057$ 120,004$ Lease revenue bonds................................................... 214,850 - (18,795) 196,055 14,025 Certificates of participation .......................................... 487,215 274,050 (171,685) 589,580 39,075 Subtotal…………………………………………………… 2,583,175 595,925 (382,408) 2,796,692 173,104 Issuance premiums / discounts:
Add: unamortized premiums .................................... 239,215 32,845 (19,860) 252,200 - Less: unamortized discounts .................................. (1,594) - 1,390 (204) -
Total bonds payable, net....................................... 2,820,796 628,770 (400,878) 3,048,688 173,104 Loans.....................................................................…… 163,837 - (20,778) 143,059 803 Accrued vacation and sick leave pay........................... 149,874 110,753 (109,600) 151,027 85,868 Accrued w orkers' compensation.................................. 223,684 50,897 (46,756) 227,825 39,357 Estimated claims payable............................................... 157,660 30,978 (28,140) 160,498 53,627
Governmental activity long-term obligations............. 3,515,851$ 821,398$ (606,152)$ 3,731,097$ 352,759$ Current Additional Maturities, Amounts Obligations, Retirements, Due
July 1, and Net and Net June 30, Within2015 Increases Decreases 2016 One Year
Total Business-type Activities: Bonds payable:
Revenue bonds ....................................................... 9,551,350$ 540,475$ (563,115)$ 9,528,710$ 265,515$ Clean renew able energy bonds……………………… 55,445 4,100 (3,946) 55,599 1,692 Certif icates of participation ...................................... 349,465 - (11,308) 338,157 11,849
Subtotal…………………………………………………… 9,956,260 544,575 (578,369) 9,922,466 279,056 Issuance premiums / discounts: Add: unamortized premiums .................................... 440,114 103,525 (43,471) 500,168 - Less: unamortized discounts .................................. (601) - 31 (570) -
Total bonds payable, net ...................................... 10,395,773 648,100 (621,809) 10,422,064 279,056 Accreted interest payable………………………………… 5,471 389 - 5,860 - Notes, loans, and other payables.................................. 2,369 97 (146) 2,320 163 Capital leases ................................................................ 1,174 - (908) 266 266 Accrued vacation and sick leave pay…………………… 104,662 56,756 (52,805) 108,613 64,822 Accrued w orkers' compensation………………………… 171,890 57,863 (40,150) 189,603 31,867 Estimated claims payable…………………..……………. 107,170 37,837 (27,939) 117,068 52,808
Long-term obligations………….…………….….…… 10,788,509$ 801,042$ (743,757)$ 10,845,794$ 428,982$
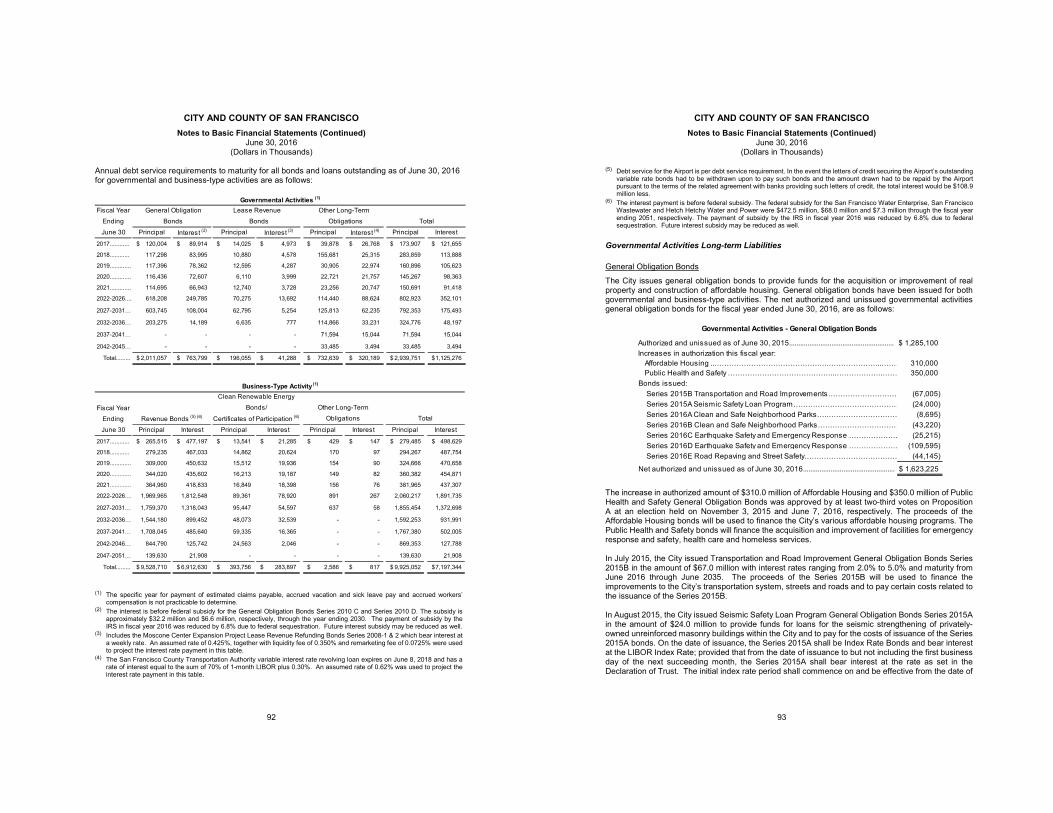
CITY AND COUNTY OF SAN FRANCISCO Notes to Basic Financial Statements (Continued)
June 30, 2016 (Dollars in Thousands)
92
Annual debt service requirements to maturity for all bonds and loans outstanding as of June 30, 2016 for governmental and business-type activities are as follows:
(1) The specific year for payment of estimated claims payable, accrued vacation and sick leave pay and accrued workers’
compensation is not practicable to determine. (2) The interest is before federal subsidy for the General Obligation Bonds Series 2010 C and Series 2010 D. The subsidy is
approximately $32.2 million and $6.6 million, respectively, through the year ending 2030. The payment of subsidy by the IRS in fiscal year 2016 was reduced by 6.8% due to federal sequestration. Future interest subsidy may be reduced as well.
(3) Includes the Moscone Center Expansion Project Lease Revenue Refunding Bonds Series 2008-1 & 2 which bear interest at a weekly rate. An assumed rate of 0.425%, together with liquidity fee of 0.350% and remarketing fee of 0.0725% were used to project the interest rate payment in this table.
(4) The San Francisco County Transportation Authority variable interest rate revolving loan expires on June 8, 2018 and has a rate of interest equal to the sum of 70% of 1-month LIBOR plus 0.30%. An assumed rate of 0.62% was used to project the interest rate payment in this table.
Governmental Activities (1)
Fiscal Year General Obligation Lease Revenue Other Long-TermEnding Bonds Bonds Obligations TotalJune 30 Principal Interest (2) Principal Interest (3) Principal Interest (4) Principal Interest
2017............ 120,004$ 89,914$ 14,025$ 4,973$ 39,878$ 26,768$ 173,907$ 121,655$
2018............ 117,298 83,995 10,880 4,578 155,681 25,315 283,859 113,888
2019............. 117,396 78,362 12,595 4,287 30,905 22,974 160,896 105,623
2020............. 116,436 72,607 6,110 3,999 22,721 21,757 145,267 98,363
2021............. 114,695 66,943 12,740 3,728 23,256 20,747 150,691 91,418
2022-2026.... 618,208 249,785 70,275 13,692 114,440 88,624 802,923 352,101
2027-2031… 603,745 108,004 62,795 5,254 125,813 62,235 792,353 175,493
2032-2036… 203,275 14,189 6,635 777 114,866 33,231 324,776 48,197
2037-2041… - - - - 71,594 15,044 71,594 15,044
2042-2045… - - - - 33,485 3,494 33,485 3,494
Total.......... 2,011,057$ 763,799$ 196,055$ 41,288$ 732,639$ 320,189$ 2,939,751$ 1,125,276$
Fiscal YearEndingJune 30 Principal Interest Principal Interest Principal Interest Principal Interest
2017............ 265,515$ 477,197$ 13,541$ 21,285$ 429$ 147$ 279,485$ 498,629$
2018............ 279,235 467,033 14,862 20,624 170 97 294,267 487,754
2019............. 309,000 450,632 15,512 19,936 154 90 324,666 470,658
2020............. 344,020 435,602 16,213 19,187 149 82 360,382 454,871
2021............. 364,960 418,833 16,849 18,398 156 76 381,965 437,307
2022-2026.... 1,969,965 1,812,548 89,361 78,920 891 267 2,060,217 1,891,735
2027-2031… 1,759,370 1,318,043 95,447 54,597 637 58 1,855,454 1,372,698
2032-2036… 1,544,180 899,452 48,073 32,539 - - 1,592,253 931,991
2037-2041… 1,708,045 485,640 59,335 16,365 - - 1,767,380 502,005
2042-2046… 844,790 125,742 24,563 2,046 - - 869,353 127,788
2047-2051… 139,630 21,908 - - - - 139,630 21,908
Total.......... 9,528,710$ 6,912,630$ 393,756$ 283,897$ 2,586$ 817$ 9,925,052$ 7,197,344$
Business-Type Activity (1)
Certificates of Participation (6)
Bonds/ Other Long-TermObligationsRevenue Bonds (5) (6) Total
Clean Renewable Energy
CITY AND COUNTY OF SAN FRANCISCO Notes to Basic Financial Statements (Continued)
June 30, 2016 (Dollars in Thousands)
93
(5) Debt service for the Airport is per debt service requirement. In the event the letters of credit securing the Airport’s outstanding variable rate bonds had to be withdrawn upon to pay such bonds and the amount drawn had to be repaid by the Airport pursuant to the terms of the related agreement with banks providing such letters of credit, the total interest would be $108.9 million less.
(6) The interest payment is before federal subsidy. The federal subsidy for the San Francisco Water Enterprise, San Francisco Wastewater and Hetch Hetchy Water and Power were $472.5 million, $68.0 million and $7.3 million through the fiscal year ending 2051, respectively. The payment of subsidy by the IRS in fiscal year 2016 was reduced by 6.8% due to federal sequestration. Future interest subsidy may be reduced as well.
Governmental Activities Long-term Liabilities General Obligation Bonds
The City issues general obligation bonds to provide funds for the acquisition or improvement of real property and construction of affordable housing. General obligation bonds have been issued for both governmental and business-type activities. The net authorized and unissued governmental activities general obligation bonds for the fiscal year ended June 30, 2016, are as follows:
The increase in authorized amount of $310.0 million of Affordable Housing and $350.0 million of Public Health and Safety General Obligation Bonds was approved by at least two-third votes on Proposition A at an election held on November 3, 2015 and June 7, 2016, respectively. The proceeds of the Affordable Housing bonds will be used to finance the City’s various affordable housing programs. The Public Health and Safety bonds will finance the acquisition and improvement of facilities for emergency response and safety, health care and homeless services. In July 2015, the City issued Transportation and Road Improvement General Obligation Bonds Series 2015B in the amount of $67.0 million with interest rates ranging from 2.0% to 5.0% and maturity from June 2016 through June 2035. The proceeds of the Series 2015B will be used to finance the improvements to the City’s transportation system, streets and roads and to pay certain costs related to the issuance of the Series 2015B. In August 2015, the City issued Seismic Safety Loan Program General Obligation Bonds Series 2015A in the amount of $24.0 million to provide funds for loans for the seismic strengthening of privately-owned unreinforced masonry buildings within the City and to pay for the costs of issuance of the Series 2015A bonds. On the date of issuance, the Series 2015A shall be Index Rate Bonds and bear interest at the LIBOR Index Rate; provided that from the date of issuance to but not including the first business day of the next succeeding month, the Series 2015A shall bear interest at the rate as set in the Declaration of Trust. The initial index rate period shall commence on and be effective from the date of
Governmental Activities - General Obligation Bonds
Authorized and unissued as of June 30, 2015......................................................... 1,285,100 $ Increases in authorization this fiscal year:
Affordable Housing ..……………………………………….…………………..……… 310,000 Public Health and Safety ……………………………………..……………….……… 350,000
Bonds issued: Series 2015B Transportation and Road Improvements………………………… (67,005) Series 2015A Seismic Safety Loan Program……………………………………… (24,000) Series 2016A Clean and Safe Neighborhood Parks….………………………… (8,695) Series 2016B Clean and Safe Neighborhood Parks…………………………… (43,220) Series 2016C Earthquake Safety and Emergency Response ………………… (25,215) Series 2016D Earthquake Safety and Emergency Response ………………… (109,595) Series 2016E Road Repaving and Street Safety………………………………… (44,145)
Net authorized and unissued as of June 30, 2016.................................................. 1,623,225 $
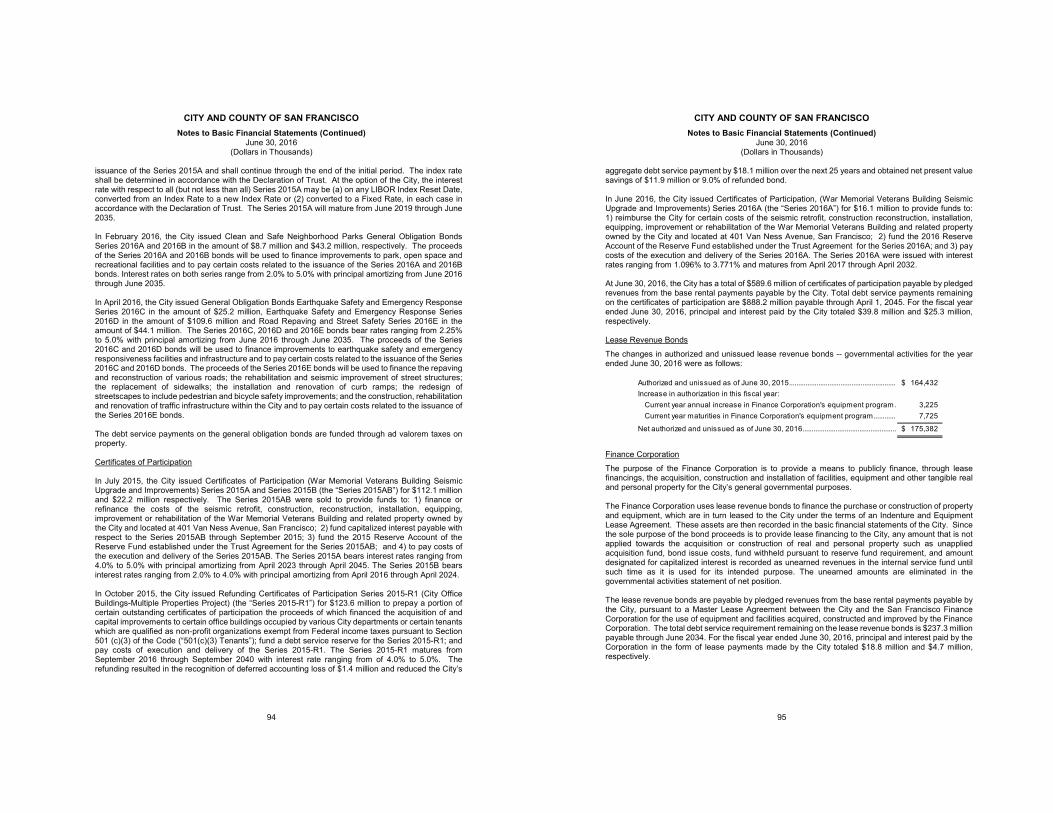
CITY AND COUNTY OF SAN FRANCISCO Notes to Basic Financial Statements (Continued)
June 30, 2016 (Dollars in Thousands)
94
issuance of the Series 2015A and shall continue through the end of the initial period. The index rate shall be determined in accordance with the Declaration of Trust. At the option of the City, the interest rate with respect to all (but not less than all) Series 2015A may be (a) on any LIBOR Index Reset Date, converted from an Index Rate to a new Index Rate or (2) converted to a Fixed Rate, in each case in accordance with the Declaration of Trust. The Series 2015A will mature from June 2019 through June 2035. In February 2016, the City issued Clean and Safe Neighborhood Parks General Obligation Bonds Series 2016A and 2016B in the amount of $8.7 million and $43.2 million, respectively. The proceeds of the Series 2016A and 2016B bonds will be used to finance improvements to park, open space and recreational facilities and to pay certain costs related to the issuance of the Series 2016A and 2016B bonds. Interest rates on both series range from 2.0% to 5.0% with principal amortizing from June 2016 through June 2035. In April 2016, the City issued General Obligation Bonds Earthquake Safety and Emergency Response Series 2016C in the amount of $25.2 million, Earthquake Safety and Emergency Response Series 2016D in the amount of $109.6 million and Road Repaving and Street Safety Series 2016E in the amount of $44.1 million. The Series 2016C, 2016D and 2016E bonds bear rates ranging from 2.25% to 5.0% with principal amortizing from June 2016 through June 2035. The proceeds of the Series 2016C and 2016D bonds will be used to finance improvements to earthquake safety and emergency responsiveness facilities and infrastructure and to pay certain costs related to the issuance of the Series 2016C and 2016D bonds. The proceeds of the Series 2016E bonds will be used to finance the repaving and reconstruction of various roads; the rehabilitation and seismic improvement of street structures; the replacement of sidewalks; the installation and renovation of curb ramps; the redesign of streetscapes to include pedestrian and bicycle safety improvements; and the construction, rehabilitation and renovation of traffic infrastructure within the City and to pay certain costs related to the issuance of the Series 2016E bonds. The debt service payments on the general obligation bonds are funded through ad valorem taxes on property. Certificates of Participation In July 2015, the City issued Certificates of Participation (War Memorial Veterans Building Seismic Upgrade and Improvements) Series 2015A and Series 2015B (the “Series 2015AB”) for $112.1 million and $22.2 million respectively. The Series 2015AB were sold to provide funds to: 1) finance or refinance the costs of the seismic retrofit, construction, reconstruction, installation, equipping, improvement or rehabilitation of the War Memorial Veterans Building and related property owned by the City and located at 401 Van Ness Avenue, San Francisco; 2) fund capitalized interest payable with respect to the Series 2015AB through September 2015; 3) fund the 2015 Reserve Account of the Reserve Fund established under the Trust Agreement for the Series 2015AB; and 4) to pay costs of the execution and delivery of the Series 2015AB. The Series 2015A bears interest rates ranging from 4.0% to 5.0% with principal amortizing from April 2023 through April 2045. The Series 2015B bears interest rates ranging from 2.0% to 4.0% with principal amortizing from April 2016 through April 2024. In October 2015, the City issued Refunding Certificates of Participation Series 2015-R1 (City Office Buildings-Multiple Properties Project) (the “Series 2015-R1”) for $123.6 million to prepay a portion of certain outstanding certificates of participation the proceeds of which financed the acquisition of and capital improvements to certain office buildings occupied by various City departments or certain tenants which are qualified as non-profit organizations exempt from Federal income taxes pursuant to Section 501 (c)(3) of the Code (“501(c)(3) Tenants”); fund a debt service reserve for the Series 2015-R1; and pay costs of execution and delivery of the Series 2015-R1. The Series 2015-R1 matures from September 2016 through September 2040 with interest rate ranging from of 4.0% to 5.0%. The refunding resulted in the recognition of deferred accounting loss of $1.4 million and reduced the City’s
CITY AND COUNTY OF SAN FRANCISCO Notes to Basic Financial Statements (Continued)
June 30, 2016 (Dollars in Thousands)
95
aggregate debt service payment by $18.1 million over the next 25 years and obtained net present value savings of $11.9 million or 9.0% of refunded bond. In June 2016, the City issued Certificates of Participation, (War Memorial Veterans Building Seismic Upgrade and Improvements) Series 2016A (the “Series 2016A”) for $16.1 million to provide funds to: 1) reimburse the City for certain costs of the seismic retrofit, construction reconstruction, installation, equipping, improvement or rehabilitation of the War Memorial Veterans Building and related property owned by the City and located at 401 Van Ness Avenue, San Francisco; 2) fund the 2016 Reserve Account of the Reserve Fund established under the Trust Agreement for the Series 2016A; and 3) pay costs of the execution and delivery of the Series 2016A. The Series 2016A were issued with interest rates ranging from 1.096% to 3.771% and matures from April 2017 through April 2032. At June 30, 2016, the City has a total of $589.6 million of certificates of participation payable by pledged revenues from the base rental payments payable by the City. Total debt service payments remaining on the certificates of participation are $888.2 million payable through April 1, 2045. For the fiscal year ended June 30, 2016, principal and interest paid by the City totaled $39.8 million and $25.3 million, respectively. Lease Revenue Bonds
The changes in authorized and unissued lease revenue bonds -- governmental activities for the year ended June 30, 2016 were as follows:
Finance Corporation
The purpose of the Finance Corporation is to provide a means to publicly finance, through lease financings, the acquisition, construction and installation of facilities, equipment and other tangible real and personal property for the City’s general governmental purposes. The Finance Corporation uses lease revenue bonds to finance the purchase or construction of property and equipment, which are in turn leased to the City under the terms of an Indenture and Equipment Lease Agreement. These assets are then recorded in the basic financial statements of the City. Since the sole purpose of the bond proceeds is to provide lease financing to the City, any amount that is not applied towards the acquisition or construction of real and personal property such as unapplied acquisition fund, bond issue costs, fund withheld pursuant to reserve fund requirement, and amount designated for capitalized interest is recorded as unearned revenues in the internal service fund until such time as it is used for its intended purpose. The unearned amounts are eliminated in the governmental activities statement of net position. The lease revenue bonds are payable by pledged revenues from the base rental payments payable by the City, pursuant to a Master Lease Agreement between the City and the San Francisco Finance Corporation for the use of equipment and facilities acquired, constructed and improved by the Finance Corporation. The total debt service requirement remaining on the lease revenue bonds is $237.3 million payable through June 2034. For the fiscal year ended June 30, 2016, principal and interest paid by the Corporation in the form of lease payments made by the City totaled $18.8 million and $4.7 million, respectively.
Authorized and unissued as of June 30, 2015........................................................... 164,432$ Increase in authorization in this fiscal year:
Current year annual increase in Finance Corporation's equipment program. 3,225 Current year maturities in Finance Corporation's equipment program............. 7,725
Net authorized and unissued as of June 30, 2016................................................... 175,382$
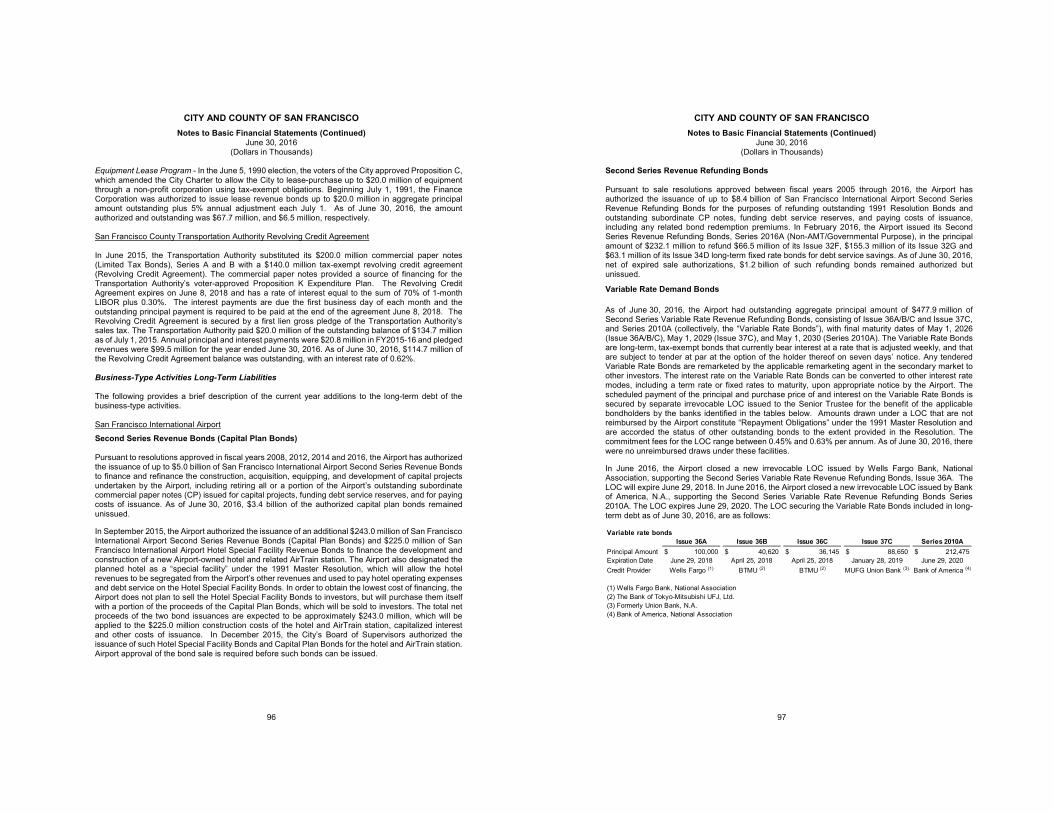
CITY AND COUNTY OF SAN FRANCISCO Notes to Basic Financial Statements (Continued)
June 30, 2016 (Dollars in Thousands)
96
Equipment Lease Program - In the June 5, 1990 election, the voters of the City approved Proposition C, which amended the City Charter to allow the City to lease-purchase up to $20.0 million of equipment through a non-profit corporation using tax-exempt obligations. Beginning July 1, 1991, the Finance Corporation was authorized to issue lease revenue bonds up to $20.0 million in aggregate principal amount outstanding plus 5% annual adjustment each July 1. As of June 30, 2016, the amount authorized and outstanding was $67.7 million, and $6.5 million, respectively. San Francisco County Transportation Authority Revolving Credit Agreement In June 2015, the Transportation Authority substituted its $200.0 million commercial paper notes (Limited Tax Bonds), Series A and B with a $140.0 million tax-exempt revolving credit agreement (Revolving Credit Agreement). The commercial paper notes provided a source of financing for the Transportation Authority’s voter-approved Proposition K Expenditure Plan. The Revolving Credit Agreement expires on June 8, 2018 and has a rate of interest equal to the sum of 70% of 1-month LIBOR plus 0.30%. The interest payments are due the first business day of each month and the outstanding principal payment is required to be paid at the end of the agreement June 8, 2018. The Revolving Credit Agreement is secured by a first lien gross pledge of the Transportation Authority’s sales tax. The Transportation Authority paid $20.0 million of the outstanding balance of $134.7 million as of July 1, 2015. Annual principal and interest payments were $20.8 million in FY2015-16 and pledged revenues were $99.5 million for the year ended June 30, 2016. As of June 30, 2016, $114.7 million of the Revolving Credit Agreement balance was outstanding, with an interest rate of 0.62%. Business-Type Activities Long-Term Liabilities The following provides a brief description of the current year additions to the long-term debt of the business-type activities. San Francisco International Airport
Second Series Revenue Bonds (Capital Plan Bonds) Pursuant to resolutions approved in fiscal years 2008, 2012, 2014 and 2016, the Airport has authorized the issuance of up to $5.0 billion of San Francisco International Airport Second Series Revenue Bonds to finance and refinance the construction, acquisition, equipping, and development of capital projects undertaken by the Airport, including retiring all or a portion of the Airport’s outstanding subordinate commercial paper notes (CP) issued for capital projects, funding debt service reserves, and for paying costs of issuance. As of June 30, 2016, $3.4 billion of the authorized capital plan bonds remained unissued.
In September 2015, the Airport authorized the issuance of an additional $243.0 million of San Francisco International Airport Second Series Revenue Bonds (Capital Plan Bonds) and $225.0 million of San Francisco International Airport Hotel Special Facility Revenue Bonds to finance the development and construction of a new Airport-owned hotel and related AirTrain station. The Airport also designated the planned hotel as a “special facility” under the 1991 Master Resolution, which will allow the hotel revenues to be segregated from the Airport’s other revenues and used to pay hotel operating expenses and debt service on the Hotel Special Facility Bonds. In order to obtain the lowest cost of financing, the Airport does not plan to sell the Hotel Special Facility Bonds to investors, but will purchase them itself with a portion of the proceeds of the Capital Plan Bonds, which will be sold to investors. The total net proceeds of the two bond issuances are expected to be approximately $243.0 million, which will be applied to the $225.0 million construction costs of the hotel and AirTrain station, capitalized interest and other costs of issuance. In December 2015, the City’s Board of Supervisors authorized the issuance of such Hotel Special Facility Bonds and Capital Plan Bonds for the hotel and AirTrain station. Airport approval of the bond sale is required before such bonds can be issued.
CITY AND COUNTY OF SAN FRANCISCO Notes to Basic Financial Statements (Continued)
June 30, 2016 (Dollars in Thousands)
97
Second Series Revenue Refunding Bonds Pursuant to sale resolutions approved between fiscal years 2005 through 2016, the Airport has authorized the issuance of up to $8.4 billion of San Francisco International Airport Second Series Revenue Refunding Bonds for the purposes of refunding outstanding 1991 Resolution Bonds and outstanding subordinate CP notes, funding debt service reserves, and paying costs of issuance, including any related bond redemption premiums. In February 2016, the Airport issued its Second Series Revenue Refunding Bonds, Series 2016A (Non-AMT/Governmental Purpose), in the principal amount of $232.1 million to refund $66.5 million of its Issue 32F, $155.3 million of its Issue 32G and $63.1 million of its Issue 34D long-term fixed rate bonds for debt service savings. As of June 30, 2016, net of expired sale authorizations, $1.2 billion of such refunding bonds remained authorized but unissued.
Variable Rate Demand Bonds As of June 30, 2016, the Airport had outstanding aggregate principal amount of $477.9 million of Second Series Variable Rate Revenue Refunding Bonds, consisting of Issue 36A/B/C and Issue 37C, and Series 2010A (collectively, the “Variable Rate Bonds”), with final maturity dates of May 1, 2026 (Issue 36A/B/C), May 1, 2029 (Issue 37C), and May 1, 2030 (Series 2010A). The Variable Rate Bonds are long-term, tax-exempt bonds that currently bear interest at a rate that is adjusted weekly, and that are subject to tender at par at the option of the holder thereof on seven days’ notice. Any tendered Variable Rate Bonds are remarketed by the applicable remarketing agent in the secondary market to other investors. The interest rate on the Variable Rate Bonds can be converted to other interest rate modes, including a term rate or fixed rates to maturity, upon appropriate notice by the Airport. The scheduled payment of the principal and purchase price of and interest on the Variable Rate Bonds is secured by separate irrevocable LOC issued to the Senior Trustee for the benefit of the applicable bondholders by the banks identified in the tables below. Amounts drawn under a LOC that are not reimbursed by the Airport constitute “Repayment Obligations” under the 1991 Master Resolution and are accorded the status of other outstanding bonds to the extent provided in the Resolution. The commitment fees for the LOC range between 0.45% and 0.63% per annum. As of June 30, 2016, there were no unreimbursed draws under these facilities.
In June 2016, the Airport closed a new irrevocable LOC issued by Wells Fargo Bank, National Association, supporting the Second Series Variable Rate Revenue Refunding Bonds, Issue 36A. The LOC will expire June 29, 2018. In June 2016, the Airport closed a new irrevocable LOC issued by Bank of America, N.A., supporting the Second Series Variable Rate Revenue Refunding Bonds Series 2010A. The LOC expires June 29, 2020. The LOC securing the Variable Rate Bonds included in long-term debt as of June 30, 2016, are as follows:
Variable rate bondsIssue 36A Issue 36B Issue 36C Issue 37C Series 2010A
Principal Amount 100,000$ 40,620$ 36,145$ 88,650$ 212,475$ Expiration Date June 29, 2018 April 25, 2018 April 25, 2018 January 28, 2019 June 29, 2020Credit Provider Wells Fargo (1) BTMU (2) BTMU (2) MUFG Union Bank (3) Bank of America (4)
(1) Wells Fargo Bank, National Association(2) The Bank of Tokyo-Mitsubishi UFJ, Ltd.(3) Formerly Union Bank, N.A.(4) Bank of America, National Association
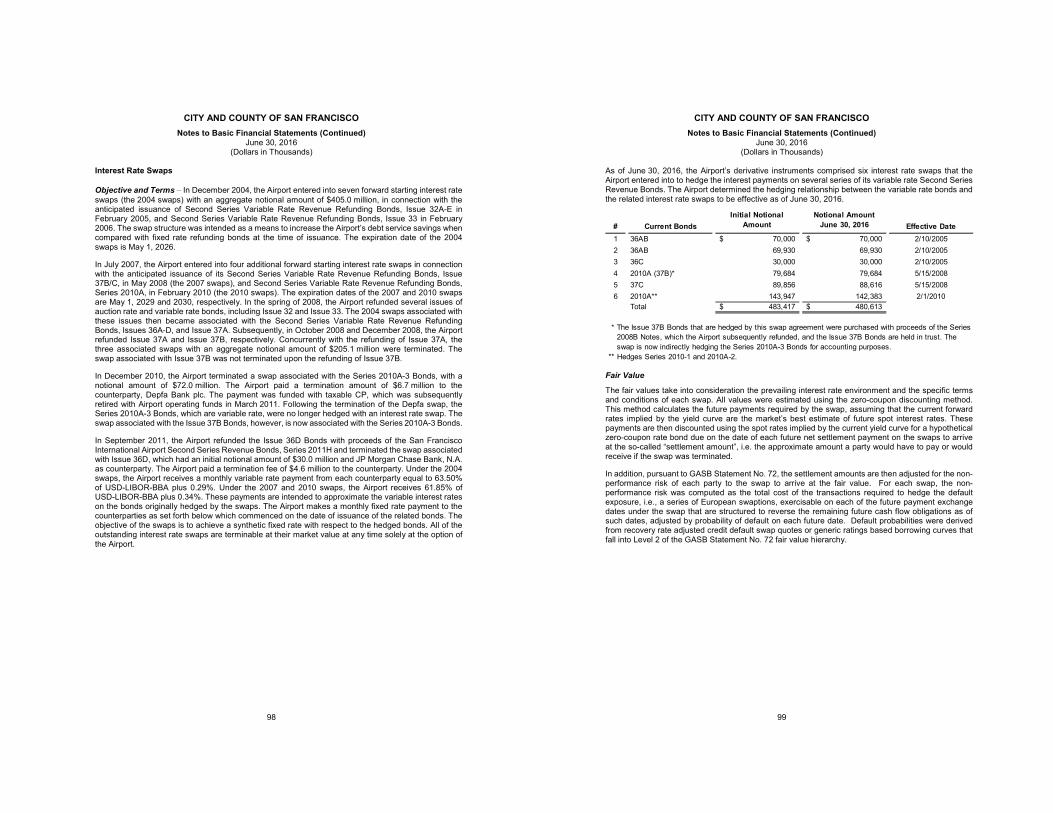
CITY AND COUNTY OF SAN FRANCISCO Notes to Basic Financial Statements (Continued)
June 30, 2016 (Dollars in Thousands)
98
Interest Rate Swaps Objective and Terms – In December 2004, the Airport entered into seven forward starting interest rate swaps (the 2004 swaps) with an aggregate notional amount of $405.0 million, in connection with the anticipated issuance of Second Series Variable Rate Revenue Refunding Bonds, Issue 32A-E in February 2005, and Second Series Variable Rate Revenue Refunding Bonds, Issue 33 in February 2006. The swap structure was intended as a means to increase the Airport’s debt service savings when compared with fixed rate refunding bonds at the time of issuance. The expiration date of the 2004 swaps is May 1, 2026.
In July 2007, the Airport entered into four additional forward starting interest rate swaps in connection with the anticipated issuance of its Second Series Variable Rate Revenue Refunding Bonds, Issue 37B/C, in May 2008 (the 2007 swaps), and Second Series Variable Rate Revenue Refunding Bonds, Series 2010A, in February 2010 (the 2010 swaps). The expiration dates of the 2007 and 2010 swaps are May 1, 2029 and 2030, respectively. In the spring of 2008, the Airport refunded several issues of auction rate and variable rate bonds, including Issue 32 and Issue 33. The 2004 swaps associated with these issues then became associated with the Second Series Variable Rate Revenue Refunding Bonds, Issues 36A-D, and Issue 37A. Subsequently, in October 2008 and December 2008, the Airport refunded Issue 37A and Issue 37B, respectively. Concurrently with the refunding of Issue 37A, the three associated swaps with an aggregate notional amount of $205.1 million were terminated. The swap associated with Issue 37B was not terminated upon the refunding of Issue 37B.
In December 2010, the Airport terminated a swap associated with the Series 2010A-3 Bonds, with a notional amount of $72.0 million. The Airport paid a termination amount of $6.7 million to the counterparty, Depfa Bank plc. The payment was funded with taxable CP, which was subsequently retired with Airport operating funds in March 2011. Following the termination of the Depfa swap, the Series 2010A-3 Bonds, which are variable rate, were no longer hedged with an interest rate swap. The swap associated with the Issue 37B Bonds, however, is now associated with the Series 2010A-3 Bonds.
In September 2011, the Airport refunded the Issue 36D Bonds with proceeds of the San Francisco International Airport Second Series Revenue Bonds, Series 2011H and terminated the swap associated with Issue 36D, which had an initial notional amount of $30.0 million and JP Morgan Chase Bank, N.A. as counterparty. The Airport paid a termination fee of $4.6 million to the counterparty. Under the 2004 swaps, the Airport receives a monthly variable rate payment from each counterparty equal to 63.50% of USD-LIBOR-BBA plus 0.29%. Under the 2007 and 2010 swaps, the Airport receives 61.85% of USD-LIBOR-BBA plus 0.34%. These payments are intended to approximate the variable interest rates on the bonds originally hedged by the swaps. The Airport makes a monthly fixed rate payment to the counterparties as set forth below which commenced on the date of issuance of the related bonds. The objective of the swaps is to achieve a synthetic fixed rate with respect to the hedged bonds. All of the outstanding interest rate swaps are terminable at their market value at any time solely at the option of the Airport.
CITY AND COUNTY OF SAN FRANCISCO Notes to Basic Financial Statements (Continued)
June 30, 2016 (Dollars in Thousands)
99
As of June 30, 2016, the Airport’s derivative instruments comprised six interest rate swaps that the Airport entered into to hedge the interest payments on several series of its variable rate Second Series Revenue Bonds. The Airport determined the hedging relationship between the variable rate bonds and the related interest rate swaps to be effective as of June 30, 2016.
Fair Value
The fair values take into consideration the prevailing interest rate environment and the specific terms and conditions of each swap. All values were estimated using the zero-coupon discounting method. This method calculates the future payments required by the swap, assuming that the current forward rates implied by the yield curve are the market’s best estimate of future spot interest rates. These payments are then discounted using the spot rates implied by the current yield curve for a hypothetical zero-coupon rate bond due on the date of each future net settlement payment on the swaps to arrive at the so-called “settlement amount”, i.e. the approximate amount a party would have to pay or would receive if the swap was terminated.
In addition, pursuant to GASB Statement No. 72, the settlement amounts are then adjusted for the non-performance risk of each party to the swap to arrive at the fair value. For each swap, the non-performance risk was computed as the total cost of the transactions required to hedge the default exposure, i.e., a series of European swaptions, exercisable on each of the future payment exchange dates under the swap that are structured to reverse the remaining future cash flow obligations as of such dates, adjusted by probability of default on each future date. Default probabilities were derived from recovery rate adjusted credit default swap quotes or generic ratings based borrowing curves that fall into Level 2 of the GASB Statement No. 72 fair value hierarchy.
# Current BondsInitial Notional
AmountNotional Amount
June 30, 2016 Effective Date1 36AB 70,000$ 70,000$ 2/10/20052 36AB 69,930 69,930 2/10/20053 36C 30,000 30,000 2/10/20054 2010A (37B)* 79,684 79,684 5/15/20085 37C 89,856 88,616 5/15/20086 2010A** 143,947 142,383 2/1/2010
Total 483,417$ 480,613$
*
** Hedges Series 2010-1 and 2010A-2.
The Issue 37B Bonds that are hedged by this swap agreement were purchased with proceeds of the Series 2008B Notes, which the Airport subsequently refunded, and the Issue 37B Bonds are held in trust. The swap is now indirectly hedging the Series 2010A-3 Bonds for accounting purposes.
CITY AND COUNTY OF SAN FRANCISCO Notes to Basic Financial Statements (Continued)
June 30, 2016 (Dollars in Thousands)
100
As of June 30, 2016, the fair value of the Airport’s six outstanding swaps, counterparty credit ratings, and fixed rate payable by the Airport are as follows:
Fair Value Hierarchy
Fair Value Measurement Using
Fair Value6/30/2016
Significant Other Observable Inputs
(Level 2)Interest rate swaps (96,132)$ (96,132)$
The impact of the interest rate swaps on the financial statements for the fiscal year ended June 30, 2016 is as follows:
Deferred outflows on derivative instruments Derivative instruments
Balance as of June 30, 2015 (as restated) 65,408$ 79,321$ Change in fair value to year end 18,206 16,811 Balance as of June 30, 2016 83,614$ 96,132$
The fair value of the interest rate swap portfolio is recorded as a liability (since the Airport would owe a termination payment to the counterparty) in the statements of net position. Unless a swap was determined to be an off-market swap at the inception of its hedging relationship, the fair value of the swap is recorded as a deferred outflow asset (if a termination payment would be due to the counterparty) or inflow liability (if a termination payment would be due to the Airport). The off-market portions of the Airport’s swaps are recorded as carrying costs with respect to various refunded bond issues. Unlike fair value and deferred inflow/outflow values, the balance of remaining off-market portions are valued on a present value, or fixed yield, to maturity basis. The difference between the deferred outflows and derivative instruments presented in the table above constitutes the unamortized off-market portions of the swaps as of June 30, 2016.
# Current Bonds Counterparty/guarantor*
Counterparty credit ratings
(S&P/Moody's/Fitch)
Fixed Rate Payable by
AirportFair Value to
Airport1 36AB J.P. Morgan Chase Bank, N.A. A+/Aa3/AA- 3.444% (8,963)$ 2 36AB J.P. Morgan Chase Bank, N.A. A+/Aa3/AA- 3.445% (8,965) 3 36C J.P. Morgan Chase Bank, N.A. A+/Aa3/AA- 3.444% (3,842) 4 2010A (37B)** Merrill Lynch Capital Services, Inc./
Merrill Lynch Derivative Products AG AA-/Aa3/NR* 3.773% (17,705) 5 37C J.P. Morgan Chase Bank, N.A. A+/Aa3/AA- 3.898% (20,588) 6 2010A*** Goldman Sachs Bank USA/
Goldman Sachs Group, Inc. BBB+/A3/A* 3.925% (36,069) (96,132)$
* Reflects ratings of the guarantor.** The issue 37B Bonds that are hedged by this swap agreement were purchased with proceeds of the Series 2008B
Notes, which the Airport subsequently refunded, and the Issue 37B are held in trust. The swap is now indirectlyhedging the Series 2010A-3 Bonds for accounting purpose
*** Hedges Series 2010A - 1 and 2010A - 2.
CITY AND COUNTY OF SAN FRANCISCO Notes to Basic Financial Statements (Continued)
June 30, 2016 (Dollars in Thousands)
101
Basis Risk – The Airport has chosen a variable rate index based on a percentage of London Interbank Offered Rate (LIBOR) plus a spread, which historically has closely approximated the variable rates payable on the related bonds. However, the Airport is subject to the risk that a change in the relationship between the LIBOR-based swap rate and the variable bond rates would cause a material mismatch between the two rates. Changes that cause the payments received from the counterparty to be insufficient to make the payments due on the associated bonds result in an increase in the synthetic interest rate on the bonds, while changes that cause the counterparty payments to exceed the payments due on the associated bonds result in a decrease in the synthetic interest rate on the bonds. During the fiscal year ended June 30, 2016, the Airport paid a total of $2.0 million less in interest on its variable rate bonds than the floating-rate payments it received from the swap counterparties, resulting in a decrease in the effective synthetic interest rates on the associated bonds.
Credit Risk – As of June 30, 2016, the Airport is not exposed to credit risk because the swaps have a negative fair value to the Airport. Should long-term interest rates rise and the fair value of the swaps become positive, the Airport would be exposed to credit risk in the amount of the swaps’ fair value. Under the terms of the swaps, counterparties are required to post collateral consisting of specified U.S. Treasury and Agency securities in an amount equal to the market value of a swap that exceeds specified thresholds linked to the counterparty’s credit ratings. Any such collateral will be held by a custodial bank.
Counterparty Risk – The Airport is exposed to counterparty risk, which is related to credit and termination risk. While the insolvency or bankruptcy of a counterparty, or its failure to perform would be a default under the applicable swap documents, none of the Airport’s swaps would automatically terminate. Rather, the Airport would have the option to terminate the affected swap at its fair value, which may result in a payment to the counterparty. The Airport may also be exposed to counterparty risk in a high interest rate environment in the event a counterparty is unable to perform its obligations on a swap transaction leaving the Airport exposed to the variable rates on the associated debt. In order to diversify the Airport’s swap counterparty credit risk and to limit the Airport’s credit exposure to any one counterparty, the Airport’s swap policy imposes limits on the maximum net termination exposure to any one counterparty. Maximum net termination exposure is calculated as of the date of execution of each swap and is monitored regularly during the term of the swap. The exposure limits vary for collateralized and non-collateralized swaps based upon the credit rating of the counterparty. If any exposure limit is exceeded by a counterparty during the term of a swap, the Airport Director is required to consult with the Airport’s swap advisor and bond counsel regarding appropriate actions to take, if any, to mitigate such increased exposure, including, without limitation, transfer or substitution of a swap. As of June 30, 2016, the fair value of the Airport’s swaps was negative to the Airport (representing an amount payable by the Airport to each counterparty in the event the relevant swap was terminated).
Termination Risk – All of the interest rate swaps are terminable at their market value at any time at the option of the Airport. The Airport has limited termination risk with respect to the interest rate swaps. That risk would arise primarily from certain credit-related events or events of default on the part of the Airport, the municipal swap insurer, or the counterparty.
The Airport has secured municipal swap insurance for all its regular payments and some termination payments due under all its interest rate swaps, except the swaps associated with the Series 2010A Bonds, from the following insurers:
#
Swap
Swap Insurer
Insurer Credit Ratings June 30, 2016
(S&P/Moody’s/Fitch) 1 Issue 36AB FGIC/National Public Finance Guarantee Corporation AA-/A3/NR 2 Issue 36AB FGIC/National Public Finance Guarantee Corporation AA-/A3/NR 3 Issue 36C Assured Guaranty Municipal Corp. AA/A2/NR 4 Series 2010A None N/A 5 Issue 37C Assured Guaranty Municipal Corp. AA/A2/NR 6 Series 2010A None N/A
CITY AND COUNTY OF SAN FRANCISCO Notes to Basic Financial Statements (Continued)
June 30, 2016 (Dollars in Thousands)
102
If the Airport is rated between Baa1/BBB+/BBB+ and Baa3/BBB-/BBB- (Moody’s/S&P/Fitch), and the applicable bond insurer is rated below A3/A- (Moody’s/S&P), the counterparties may terminate the swaps and require the Airport to pay the termination value, if any, unless the Airport chooses to provide suitable replacement credit enhancement, assign the Airport’s interest in the swaps to a suitable replacement counterparty, or post collateral to secure the swap termination value. If the Airport is rated below Baa3/BBB-/BBB- (Moody’s/S&P/Fitch) or its ratings are withdrawn or suspended, and the applicable bond insurer is rated below A3/A- (Moody’s/S&P), the counterparties may terminate the swaps and require the Airport to pay the termination value, if any. With respect to the Series 2010A swaps with no swap insurance, the counterparty termination provisions and the Airport rating thresholds are the same as described above. Additional Termination Events under the swap documents with respect to the Airport include an insurer payment default under the applicable swap insurance policy, and certain insurer rating downgrades or specified insurer nonpayment defaults combined with a termination event or event of default on the part of the Airport or a ratings downgrade of the Airport below investment grade. Additional Termination Events under the swap documents with respect to a counterparty or its guarantor include a rating downgrade below A3/A1/A1 (Moody’s/S&P/Fitch), followed by a failure of the counterparty to assign its rights and obligations under the swap documents to another entity acceptable to the applicable insurer within 15 business days. Goldman Sachs Group, Inc., which is the guarantor of the Airport’s swap counterparty Goldman Sachs Bank USA, was downgraded to BBB+ by S&P during the year ended June 30, 2016. Merrill Lynch Derivative Products AG, which is the guarantor of the Airport’s swap counterparty Merrill Lynch Capital Services, Inc., was upgraded by one or more of the rating agencies during the year ended June 30, 2016. The downgrade of any swap counterparty increases the risk to the Airport that such counterparty may become bankrupt or insolvent and not perform under the applicable swap. If a counterparty does not perform under its swap, the Airport may be required to continue making its fixed rate payments to the counterparty even though it does not receive a variable rate payment in return. The Airport may elect to terminate a swap with a non-performing counterparty and may be required to pay a substantial termination payment approximately equal to the fair value of such swap, depending on market conditions at the time. As of June 30, 2016, the fair value of each swap was negative to the Airport as shown above. San Francisco Wastewater Enterprise In May 2016, the San Francisco Wastewater Enterprise issued tax-exempt revenue bonds 2016 Series A (Green Bonds) in the amount of $240.6 million with interest rates ranging from 4.0% to 5.0%. Proceeds from the bonds were used for Wastewater capital projects, to pay off $53.4 million of outstanding commercial paper notes, to fund capitalized interest, and pay the costs of issuing the bonds. The bonds carried ratings of “AA” and “Aa3” from S&P and Moody’s, respectively and mature through October 1, 2046. The bonds have a true interest cost of 3.2%. As of June 30, 2016, the principal amount outstanding of the 2016 Series A bonds was $240.6 million. Also in May 2016, the Wastewater Enterprise issued tax-exempt revenue bonds 2016 Series B in the amount of $67.8 million with interest rates ranging from 4.0% to 5.0%. Proceeds from the bonds were used for Wastewater capital projects, to pay off $20.6 million of outstanding commercial paper notes, to fund capitalized interest, and pay the costs of issuing the bonds. The bonds carried ratings of “AA” and “Aa3” from S&P and Moody’s, respectively and mature through October 1, 2046. The bonds have a true interest cost of 3.2%. As of June 30, 2016, the principal amount outstanding of the 2016 Series B bonds was $67.8 million.
CITY AND COUNTY OF SAN FRANCISCO Notes to Basic Financial Statements (Continued)
June 30, 2016 (Dollars in Thousands)
103
Hetch Hetchy Water and Power
In October 2015, Hetch Hetchy Power issued $4.1 million of taxable 2015 New Clean Renewable Energy Bonds (NCREB). The NCREB were issued to fund certain qualified clean, renewable energy solar generation facilities at the Marina Middle School and the San Francisco Police Academy. The 2015 NCREBs were non-rated and privately-placed with Bank of America Leasing. The NCREB bears interest rate of 4.62%, with net effective interest rate of 1.4% after the federal tax subsidy and matures through fiscal year 2033.
(9) EMPLOYEE BENEFIT PROGRAMS
(a) Retirement Plans
General Information About the Pension Plans – The San Francisco City and County Employees’ Retirement System (Retirement System) administers a cost-sharing multiple-employer defined benefit pension plan (SFERS Plan), which covers substantially all of the employees of the City and County of San Francisco, and certain classified and certificated employees of the San Francisco Community College and Unified School Districts, and San Francisco Trial Court employees other than judges. The San Francisco City and County Charter and the Administrative Code are the authority which establishes and amends the benefit provisions and employer obligations of the SFERS Plan. The Retirement System issues a publicly available financial report that includes financial statements and required supplementary information for the SFERS Plan. That report may be obtained by writing to the San Francisco City and County Employees’ Retirement System, 1145 Market Street, 5th Floor, San Francisco, CA 94103 or by calling (415) 487-7000. In addition, some City employees are eligible to participate in the Public Employees’ Retirement Fund (PERF) of the California Public Employees’ Retirement System (CalPERS) Safety Plan, an agent multi-employer pension plan, or the CalPERS Miscellaneous Plan, a cost-sharing multiple-employer pension plan. Some employees of the Transportation Authority, a blended component unit, are eligible to participate in a CalPERS Miscellaneous Plan or a CalPERS PEPRA Miscellaneous Plan, both are cost-sharing multiple-employer pension plans. In addition, some employees of the Successor Agency, a fiduciary component unit, are eligible to participate in a CalPERS Miscellaneous Plan or a CalPERS PEPRA Miscellaneous Plan, both are cost-sharing multiple-employer pension plans. Lastly, some employees of the Treasure Island Development Authority, a discretely presented component unit, are eligible to participate in the CalPERS Miscellaneous cost-sharing multiple-employer pension plan. CalPERS acts as a common investment and administrative agent for various local and state governmental agencies within the State of California. Benefit provisions and other requirements are established by State statute, employer contract with CalPERS and by City resolution. CalPERS issues publicly available reports that include a full description of the pension plans regarding benefit provisions, assumptions and membership information that can be found on the CalPERS website at www.calpers.ca.gov.
CITY AND COUNTY OF SAN FRANCISCO Notes to Basic Financial Statements (Continued)
June 30, 2016 (Dollars in Thousands)
104
Benefits SFERS – The SFERS Plan provides service retirement, disability, and death benefits based on specified percentages of defined final average monthly salary and provides annual cost-of-living adjustments (COLA) after retirement. The SFERS Plan also provides pension continuation benefits to qualified survivors. The Retirement System pays benefits according to the category of employment and the type of benefit coverage provided by the City. The four main categories of SFERS Plan members are: Miscellaneous Non-Safety Members – staff, operational, supervisory, and all other eligible
employees who are not in special membership categories.
Sheriff’s Department and Miscellaneous Safety Members – sheriffs assuming office on and after January 7, 2012, and undersheriffs, deputized personnel of the Sheriff’s Department, and miscellaneous safety employees hired on and after January 7, 2012.
Firefighter Members – firefighters and other employees whose principal duties are in fire prevention and suppression work or who occupy positions designated by law as firefighter member positions.
Police Members – police officers and other employees whose principal duties are in active law enforcement or who occupy positions designated by law as police member positions.
The membership groups and the related service retirement benefits are summarized as follows: Miscellaneous Non-Safety Members who became members prior to July 1, 2010 qualify for a service retirement benefit if they are at least 50 years old and have at least 20 years of credited service or if they are at least 60 years old and have at least 10 years of credited service. The service retirement benefit is calculated using the member’s final compensation (highest one-year average monthly compensation) multiplied by the member’s years of credited service times the member’s age factor up to a maximum of 75% of the member’s final compensation. Miscellaneous Non-Safety Members who became members on or after July 1, 2010 and prior to January 7, 2012 qualify for a service retirement benefit if they are at least 50 years old and have at least 20 years of credited service or if they are at least 60 years old and have at least 10 years of credited service. The service retirement benefit is calculated using the member’s final compensation (highest two-year average monthly compensation) multiplied by the member’s years of credited service times the member’s age factor up to a maximum of 75% of the member’s final compensation. Miscellaneous Non-Safety Members who became members on or after January 7, 2012 qualify for a service retirement benefit if they are at least 53 years old and have at least 20 years of credited service or if they are at least 60 years old and have at least 10 years of credited service. The service retirement benefit is calculated using the member’s final compensation (highest three-year average monthly compensation) multiplied by the member’s years of credited service times the member’s age factor up to a maximum of 75% of the member’s final compensation. Sheriff’s Department Members and Miscellaneous Safety Members who were hired on or after January 7, 2012 qualify for a service retirement benefit if they are at least 50 years old and have at least 5 years of credited service. The service retirement benefit is calculated using the member’s final compensation (highest three-year average monthly compensation) multiplied by the member’s years of credited service times the member’s age factor up to a maximum of 90% of the member’s final compensation.
CITY AND COUNTY OF SAN FRANCISCO Notes to Basic Financial Statements (Continued)
June 30, 2016 (Dollars in Thousands)
105
Firefighter Members and Police Members who became members before November 2, 1976 qualify for a service retirement benefit if they are at least 50 years old and have at least 25 years of credited service. The service retirement benefit is calculated using the member’s final compensation (monthly salary earnable at the rank or position the member held for at least one year immediately prior to retiring) multiplied by the member’s years of credited service times the member’s age factor up to a maximum of 90% of the member’s final compensation. Firefighter Members and Police Members who became members on or after November 2, 1976 and prior to July 1, 2010 qualify for a service retirement benefit if they are at least 50 years old and have at least 5 years of credited service. The service retirement benefit is calculated using the member’s final compensation (highest one-year average monthly compensation) multiplied by the member’s years of credited service times the member’s age factor up to a maximum of 90% of the member’s final compensation. Firefighter Members and Police Members who became members on or after July 1, 2010 and prior to January 7, 2012 qualify for a service retirement benefit if they are at least 50 years old and have at least 5 years of credited service. The service retirement benefit is calculated using the member’s final compensation (highest two-year average monthly compensation) multiplied by the member’s years of credited service times the member’s age factor up to a maximum of 90% of the member’s final compensation. Firefighter Members and Police Members who became members on or after January 7, 2012 qualify for a service retirement benefit if they are at least 50 years old and have at least 5 years of credited service. The service retirement benefit is calculated using the member’s final compensation (highest three-year average monthly compensation) multiplied by the member’s years of credited service times the member’s age factor up to a maximum of 90% of the member’s final compensation. All members are eligible to apply for a disability retirement benefit, regardless of age, when they have 10 or more years of credited service and they sustain an injury or illness that prevents them from performing their duties. Safety members are eligible to apply for an industrial disability retirement benefit from their first day on the job if their disability is caused by an illness or injury that they receive while performing their duties. All retired members receive a benefit adjustment each July 1, which is the Basic COLA. The majority of adjustments are determined by changes in CPI with increases capped at 2%. Effective July 1, 2012, the SFERS Plan provides for a Supplemental COLA in years when there are sufficient “excess” investment earnings in the SFERS Plan and the SFERS Plan is fully funded on a market value of assets basis. The maximum benefit adjustment is 3.5% including the Basic COLA. For members hired on or after January 7, 2012, Supplemental COLAs will not be permanent adjustments to retirement benefits. CalPERS – CalPERS provides service retirement and disability benefits, annual cost of living adjustments and death benefits to plan members, who must be public employees and beneficiaries. Benefits are based on a final compensation which is the highest average pay rate and special compensation during any consecutive one-year or three-year period. The cost of living adjustments for the CalPERS plans are applied as specified by the Public Employees’ Retirement Law. The California Public Employees’ Pension Reform Act (PEPRA), which took effect in January 2013, changes the way CalPERS retirement and health benefits are applied, and places compensation limits on members. As such, members who established CalPERS membership on or after January 1, 2013 are known as “PEPRA” members.
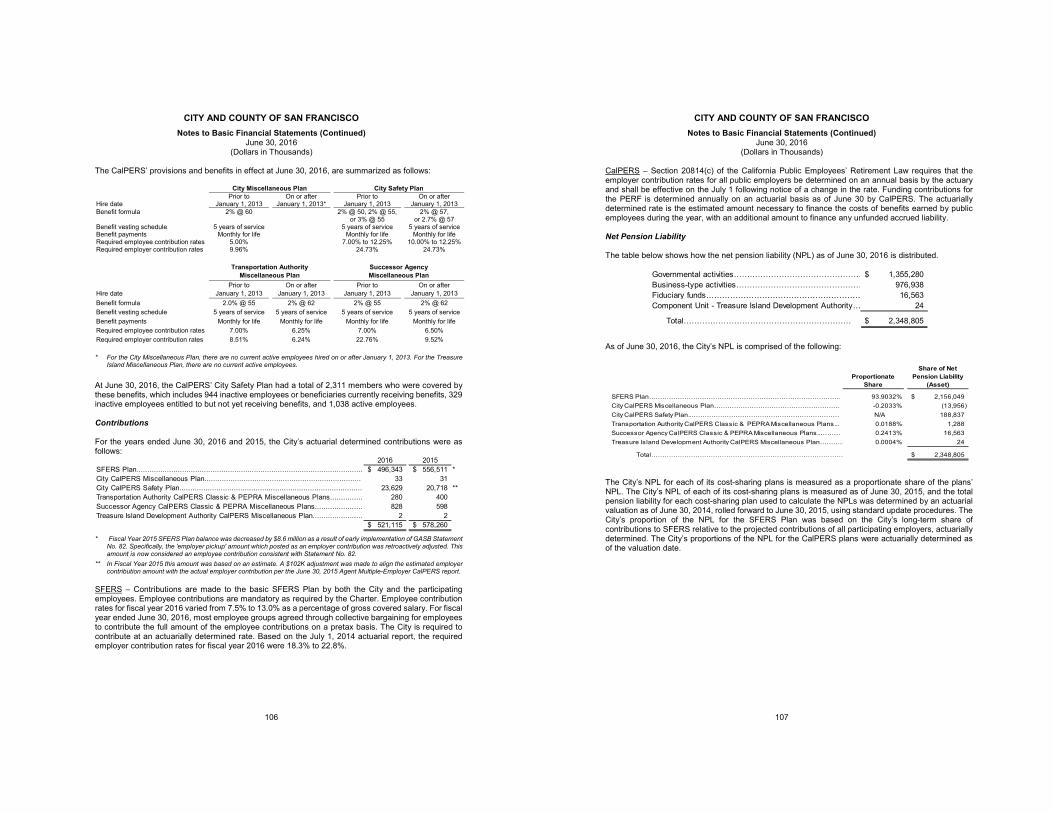
CITY AND COUNTY OF SAN FRANCISCO Notes to Basic Financial Statements (Continued)
June 30, 2016 (Dollars in Thousands)
106
The CalPERS’ provisions and benefits in effect at June 30, 2016, are summarized as follows: City Miscellaneous Plan City Safety Plan
Hire date Prior to
January 1, 2013 On or after
January 1, 2013* Prior to
January 1, 2013 On or after
January 1, 2013 Benefit formula 2% @ 60 2% @ 50, 2% @ 55,
or 3% @ 55 2% @ 57,
or 2.7% @ 57 Benefit vesting schedule 5 years of service 5 years of service 5 years of service Benefit payments Monthly for life Monthly for life Monthly for life Required employee contribution rates 5.00% 7.00% to 12.25% 10.00% to 12.25% Required employer contribution rates 9.96% 24.73% 24.73%
Transportation Authority
Miscellaneous Plan Successor Agency Miscellaneous Plan
Hire date Prior to
January 1, 2013 On or after
January 1, 2013 Prior to
January 1, 2013 On or after
January 1, 2013 Benefit formula 2.0% @ 55 2% @ 62 2% @ 55 2% @ 62 Benefit vesting schedule 5 years of service 5 years of service 5 years of service 5 years of service Benefit payments Monthly for life Monthly for life Monthly for life Monthly for life Required employee contribution rates 7.00% 6.25% 7.00% 6.50% Required employer contribution rates 8.51% 6.24% 22.76% 9.52% * For the City Miscellaneous Plan, there are no current active employees hired on or after January 1, 2013. For the Treasure
Island Miscellaneous Plan, there are no current active employees.
At June 30, 2016, the CalPERS’ City Safety Plan had a total of 2,311 members who were covered by these benefits, which includes 944 inactive employees or beneficiaries currently receiving benefits, 329 inactive employees entitled to but not yet receiving benefits, and 1,038 active employees. Contributions For the years ended June 30, 2016 and 2015, the City’s actuarial determined contributions were as follows:
* Fiscal Year 2015 SFERS Plan balance was decreased by $8.6 million as a result of early implementation of GASB Statement
No. 82. Specifically, the 'employer pickup' amount which posted as an employer contribution was retroactively adjusted. This amount is now considered an employee contribution consistent with Statement No. 82.
** In Fiscal Year 2015 this amount was based on an estimate. A $102K adjustment was made to align the estimated employer contribution amount with the actual employer contribution per the June 30, 2015 Agent Multiple-Employer CalPERS report.
SFERS – Contributions are made to the basic SFERS Plan by both the City and the participating employees. Employee contributions are mandatory as required by the Charter. Employee contribution rates for fiscal year 2016 varied from 7.5% to 13.0% as a percentage of gross covered salary. For fiscal year ended June 30, 2016, most employee groups agreed through collective bargaining for employees to contribute the full amount of the employee contributions on a pretax basis. The City is required to contribute at an actuarially determined rate. Based on the July 1, 2014 actuarial report, the required employer contribution rates for fiscal year 2016 were 18.3% to 22.8%.
2016 2015SFERS Plan........................................................................................................ 496,343$ 556,511$ *City CalPERS Miscellaneous Plan........................................................................ 33 31 City CalPERS Safety Plan.................................................................................... 23,629 20,718 **Transportation Authority CalPERS Classic & PEPRA Miscellaneous Plans............... 280 400 Successor Agency CalPERS Classic & PEPRA Miscellaneous Plans...................... 828 598 Treasure Island Development Authority CalPERS Miscellaneous Plan....................... 2 2
521,115$ 578,260$
CITY AND COUNTY OF SAN FRANCISCO Notes to Basic Financial Statements (Continued)
June 30, 2016 (Dollars in Thousands)
107
CalPERS – Section 20814(c) of the California Public Employees’ Retirement Law requires that the employer contribution rates for all public employers be determined on an annual basis by the actuary and shall be effective on the July 1 following notice of a change in the rate. Funding contributions for the PERF is determined annually on an actuarial basis as of June 30 by CalPERS. The actuarially determined rate is the estimated amount necessary to finance the costs of benefits earned by public employees during the year, with an additional amount to finance any unfunded accrued liability. Net Pension Liability The table below shows how the net pension liability (NPL) as of June 30, 2016 is distributed.
As of June 30, 2016, the City’s NPL is comprised of the following:
Proportionate Share
Share of Net Pension Liability
(Asset)
SFERS Plan…………………………………………………………………………… 93.9032% 2,156,049$ City CalPERS Miscellaneous Plan…………………………………………………… -0.2033% (13,956) City CalPERS Safety Plan..…………………………………………………………… N/A 188,837 Transportation Authority CalPERS Classic & PEPRA Miscellaneous Plans..… 0.0188% 1,288 Successor Agency CalPERS Classic & PEPRA Miscellaneous Plans..……… 0.2413% 16,563 Treasure Island Development Authority CalPERS Miscellaneous Plan………… 0.0004% 24
Total…………………………………………………………………………… 2,348,805$
The City’s NPL for each of its cost-sharing plans is measured as a proportionate share of the plans’ NPL. The City’s NPL of each of its cost-sharing plans is measured as of June 30, 2015, and the total pension liability for each cost-sharing plan used to calculate the NPLs was determined by an actuarial valuation as of June 30, 2014, rolled forward to June 30, 2015, using standard update procedures. The City’s proportion of the NPL for the SFERS Plan was based on the City’s long-term share of contributions to SFERS relative to the projected contributions of all participating employers, actuarially determined. The City’s proportions of the NPL for the CalPERS plans were actuarially determined as of the valuation date.
Governmental activities………………………………………… 1,355,280$ Business-type activities………………………………………… 976,938 Fiduciary funds…………………………………………………… 16,563 Component Unit - Treasure Island Development Authority… 24
Total……………………………………………………… 2,348,805$
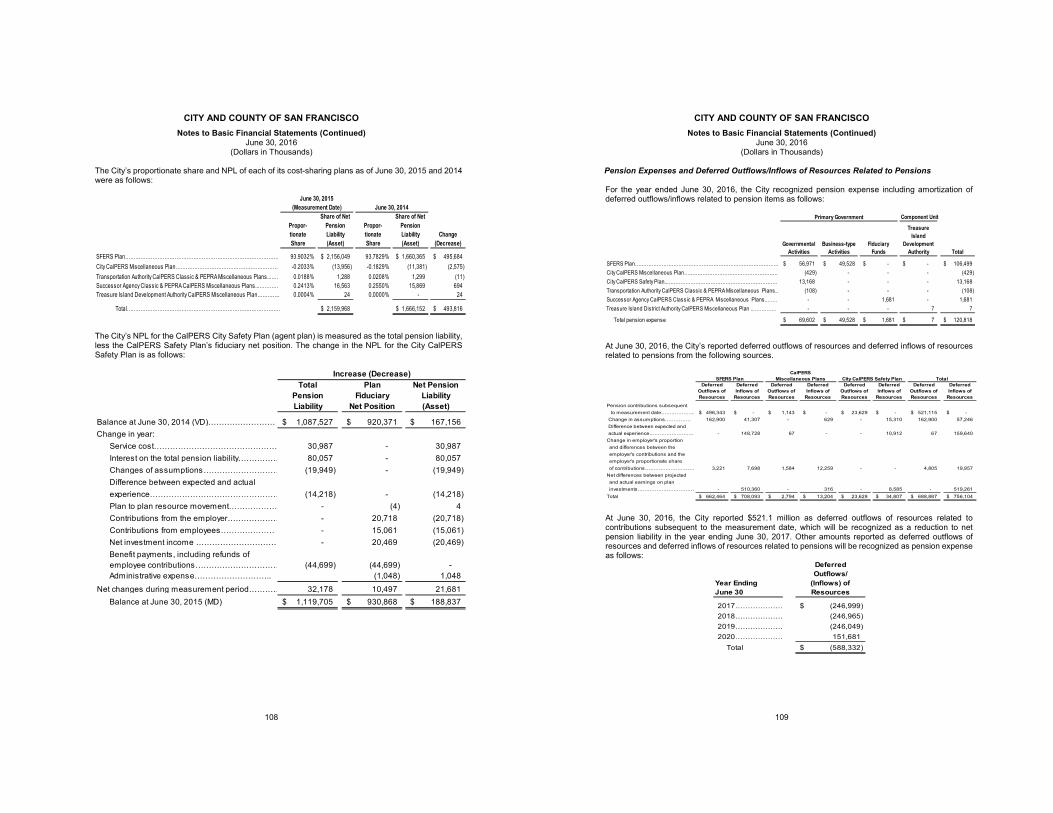
CITY AND COUNTY OF SAN FRANCISCO Notes to Basic Financial Statements (Continued)
June 30, 2016 (Dollars in Thousands)
108
The City’s proportionate share and NPL of each of its cost-sharing plans as of June 30, 2015 and 2014 were as follows:
The City’s NPL for the CalPERS City Safety Plan (agent plan) is measured as the total pension liability, less the CalPERS Safety Plan’s fiduciary net position. The change in the NPL for the City CalPERS Safety Plan is as follows:
Propor-tionate Share
Share of Net Pension Liability (Asset)
Propor-tionate Share
Share of Net Pension Liability (Asset)
Change (Decrease)
SFERS Plan……………………………………………………………………………… 93.9032% 2,156,049$ 93.7829% 1,660,365$ 495,684$ City CalPERS Miscellaneous Plan……………………………………………………… -0.2033% (13,956) -0.1829% (11,381) (2,575) Transportation Authority CalPERS Classic & PEPRA Miscellaneous Plans..…… 0.0188% 1,288 0.0208% 1,299 (11) Successor Agency Classic & PEPRA CalPERS Miscellaneous Plans..………… 0.2413% 16,563 0.2550% 15,869 694 Treasure Is land Development Authority CalPERS Miscellaneous Plan…………… 0.0004% 24 0.0000% - 24
Total……………………………………………………………………………… 2,159,968$ 1,666,152$ 493,816$
(Measurement Date) June 30, 2014June 30, 2015
Total Pension Liability
Plan Fiduciary
Net Position
Net Pension Liability (Asset)
Balance at June 30, 2014 (VD)……………………… 1,087,527$ 920,371$ 167,156$ Change in year:
Service cost………………………………………… 30,987 - 30,987 Interest on the total pension liability…………… 80,057 - 80,057 Changes of assumptions………………………… (19,949) - (19,949) Difference between expected and actualexperience………………………………………… (14,218) - (14,218) Plan to plan resource movement……………… - (4) 4 Contributions from the employer………………… - 20,718 (20,718) Contributions from employees………………… - 15,061 (15,061) Net investment income …………………………… - 20,469 (20,469) Benefit payments, including refunds ofemployee contributions…………………………… (44,699) (44,699) - Administrative expense……………………….. (1,048) 1,048
Net changes during measurement period………… 32,178 10,497 21,681 Balance at June 30, 2015 (MD) 1,119,705$ 930,868$ 188,837$
Increase (Decrease)
CITY AND COUNTY OF SAN FRANCISCO Notes to Basic Financial Statements (Continued)
June 30, 2016 (Dollars in Thousands)
109
Pension Expenses and Deferred Outflows/Inflows of Resources Related to Pensions For the year ended June 30, 2016, the City recognized pension expense including amortization of deferred outflows/inflows related to pension items as follows:
At June 30, 2016, the City’s reported deferred outflows of resources and deferred inflows of resources related to pensions from the following sources.
At June 30, 2016, the City reported $521.1 million as deferred outflows of resources related to contributions subsequent to the measurement date, which will be recognized as a reduction to net pension liability in the year ending June 30, 2017. Other amounts reported as deferred outflows of resources and deferred inflows of resources related to pensions will be recognized as pension expense as follows:
Component Unit
Governmental Activities
Business-type Activities
Fiduciary Funds
Treasure Island
Development Authority Total
SFERS Plan…………………………………………………………………………… 56,971$ 49,528$ -$ -$ 106,499$ City CalPERS Miscellaneous Plan………………………………………………… (429) - - - (429) City CalPERS Safety Plan..…………………………………………………………… 13,168 - - - 13,168 Transportation Authority CalPERS Classic & PEPRA Miscellaneous Plans… (108) - - - (108) Successor Agency CalPERS Classic & PEPRA Miscellaneous Plans..……… - - 1,681 - 1,681 Treasure Island District Authority CalPERS Miscellaneous Plan ..………….. - - - 7 7
Total pension expense 69,602$ 49,528$ 1,681$ 7$ 120,818$
Primary Government
Deferred Outflows of Resources
Deferred Inflows of
Resources
Deferred Outflows of Resources
Deferred Inflows of
Resources
Deferred Outflows of Resources
Deferred Inflows of
Resources
Deferred Outflows of Resources
Deferred Inflows of
Resources
Pension contributions subsequent to measurement date……………….. 496,343$ -$ 1,143$ -$ 23,629$ -$ 521,115$ -$ Change in assumptions…………… 162,900 41,307 - 629 - 15,310 162,900 57,246 Difference between expected andactual experience…………………….. - 148,728 67 - - 10,912 67 159,640
Change in employer's proportion and differences between the employer's contributions and the employer's proportionate share of contributions………………………… 3,221 7,698 1,584 12,259 - - 4,805 19,957 Net differences between projected and actual earnings on plan investments…………………………… - 510,360 - 316 - 8,585 - 519,261 Total 662,464$ 708,093$ 2,794$ 13,204$ 23,629$ 34,807$ 688,887$ 756,104$
TotalSFERS PlanCalPERS
Miscellaneous Plans City CalPERS Safety Plan
Year Ending June 30
Deferred Outflows/
(Inflows) of Resources
2017………………… (246,999)$ 2018………………… (246,965) 2019………………… (246,049) 2020………………… 151,681
Total (588,332)$
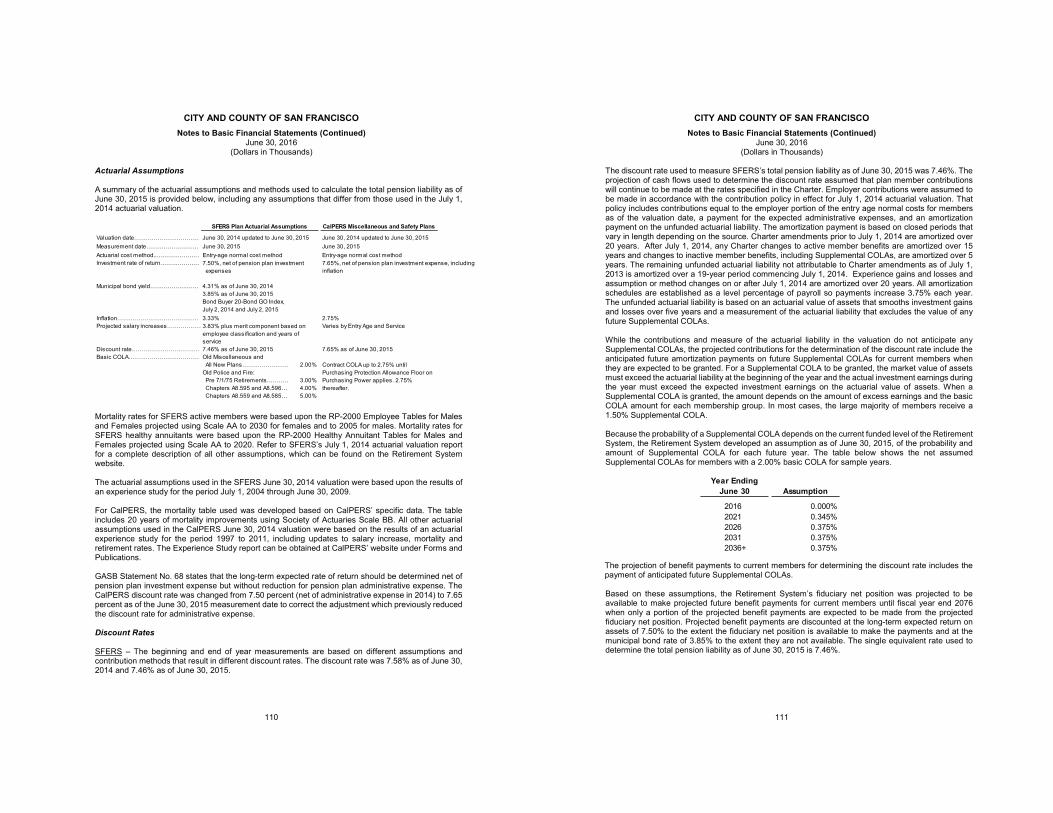
CITY AND COUNTY OF SAN FRANCISCO Notes to Basic Financial Statements (Continued)
June 30, 2016 (Dollars in Thousands)
110
Actuarial Assumptions A summary of the actuarial assumptions and methods used to calculate the total pension liability as of June 30, 2015 is provided below, including any assumptions that differ from those used in the July 1, 2014 actuarial valuation.
Mortality rates for SFERS active members were based upon the RP-2000 Employee Tables for Males and Females projected using Scale AA to 2030 for females and to 2005 for males. Mortality rates for SFERS healthy annuitants were based upon the RP-2000 Healthy Annuitant Tables for Males and Females projected using Scale AA to 2020. Refer to SFERS’s July 1, 2014 actuarial valuation report for a complete description of all other assumptions, which can be found on the Retirement System website. The actuarial assumptions used in the SFERS June 30, 2014 valuation were based upon the results of an experience study for the period July 1, 2004 through June 30, 2009. For CalPERS, the mortality table used was developed based on CalPERS’ specific data. The table includes 20 years of mortality improvements using Society of Actuaries Scale BB. All other actuarial assumptions used in the CalPERS June 30, 2014 valuation were based on the results of an actuarial experience study for the period 1997 to 2011, including updates to salary increase, mortality and retirement rates. The Experience Study report can be obtained at CalPERS’ website under Forms and Publications. GASB Statement No. 68 states that the long-term expected rate of return should be determined net of pension plan investment expense but without reduction for pension plan administrative expense. The CalPERS discount rate was changed from 7.50 percent (net of administrative expense in 2014) to 7.65 percent as of the June 30, 2015 measurement date to correct the adjustment which previously reduced the discount rate for administrative expense. Discount Rates SFERS – The beginning and end of year measurements are based on different assumptions and contribution methods that result in different discount rates. The discount rate was 7.58% as of June 30, 2014 and 7.46% as of June 30, 2015.
Valuation date……………………………… June 30, 2014 updated to June 30, 2015 June 30, 2014 updated to June 30, 2015Measurement date……………………… June 30, 2015 June 30, 2015Actuarial cost method..…………………… Entry-age normal cost method Entry-age normal cost methodInvestment rate of return…………………
Municipal bond yield……………………… 4.31% as of June 30, 2014
3.85% as of June 30, 2015Bond Buyer 20-Bond GO Index,July 2, 2014 and July 2, 2015
Inflation…………………………………… 3.33% 2.75%Projected salary increases………………
Discount rate……………………………… 7.46% as of June 30, 2015 7.65% as of June 30, 2015Basic COLA………………………………… Old Miscellaneous and
All New Plans…………………… 2.00%Old Police and Fire: Pre 7/1/75 Retirements………… 3.00% Chapters A8.595 and A8.596…… 4.00% Chapters A8.559 and A8.585…… 5.00%
Contract COLA up to 2.75% until Purchasing Protection Allowance Floor on Purchasing Power applies. 2.75% thereafter.
CalPERS Miscellaneous and Safety PlansSFERS Plan Actuarial Assumptions
7.50%, net of pension plan investment expenses
7.65%, net of pension plan investment expense, including inflation
3.83% plus merit component based on employee classification and years of service
Varies by Entry Age and Service
CITY AND COUNTY OF SAN FRANCISCO Notes to Basic Financial Statements (Continued)
June 30, 2016 (Dollars in Thousands)
111
The discount rate used to measure SFERS’s total pension liability as of June 30, 2015 was 7.46%. The projection of cash flows used to determine the discount rate assumed that plan member contributions will continue to be made at the rates specified in the Charter. Employer contributions were assumed to be made in accordance with the contribution policy in effect for July 1, 2014 actuarial valuation. That policy includes contributions equal to the employer portion of the entry age normal costs for members as of the valuation date, a payment for the expected administrative expenses, and an amortization payment on the unfunded actuarial liability. The amortization payment is based on closed periods that vary in length depending on the source. Charter amendments prior to July 1, 2014 are amortized over 20 years. After July 1, 2014, any Charter changes to active member benefits are amortized over 15 years and changes to inactive member benefits, including Supplemental COLAs, are amortized over 5 years. The remaining unfunded actuarial liability not attributable to Charter amendments as of July 1, 2013 is amortized over a 19-year period commencing July 1, 2014. Experience gains and losses and assumption or method changes on or after July 1, 2014 are amortized over 20 years. All amortization schedules are established as a level percentage of payroll so payments increase 3.75% each year. The unfunded actuarial liability is based on an actuarial value of assets that smooths investment gains and losses over five years and a measurement of the actuarial liability that excludes the value of any future Supplemental COLAs. While the contributions and measure of the actuarial liability in the valuation do not anticipate any Supplemental COLAs, the projected contributions for the determination of the discount rate include the anticipated future amortization payments on future Supplemental COLAs for current members when they are expected to be granted. For a Supplemental COLA to be granted, the market value of assets must exceed the actuarial liability at the beginning of the year and the actual investment earnings during the year must exceed the expected investment earnings on the actuarial value of assets. When a Supplemental COLA is granted, the amount depends on the amount of excess earnings and the basic COLA amount for each membership group. In most cases, the large majority of members receive a 1.50% Supplemental COLA. Because the probability of a Supplemental COLA depends on the current funded level of the Retirement System, the Retirement System developed an assumption as of June 30, 2015, of the probability and amount of Supplemental COLA for each future year. The table below shows the net assumed Supplemental COLAs for members with a 2.00% basic COLA for sample years.
The projection of benefit payments to current members for determining the discount rate includes the payment of anticipated future Supplemental COLAs. Based on these assumptions, the Retirement System’s fiduciary net position was projected to be available to make projected future benefit payments for current members until fiscal year end 2076 when only a portion of the projected benefit payments are expected to be made from the projected fiduciary net position. Projected benefit payments are discounted at the long-term expected return on assets of 7.50% to the extent the fiduciary net position is available to make the payments and at the municipal bond rate of 3.85% to the extent they are not available. The single equivalent rate used to determine the total pension liability as of June 30, 2015 is 7.46%.
Year Ending June 30 Assumption
2016 0.000%2021 0.345%2026 0.375%2031 0.375%2036+ 0.375%
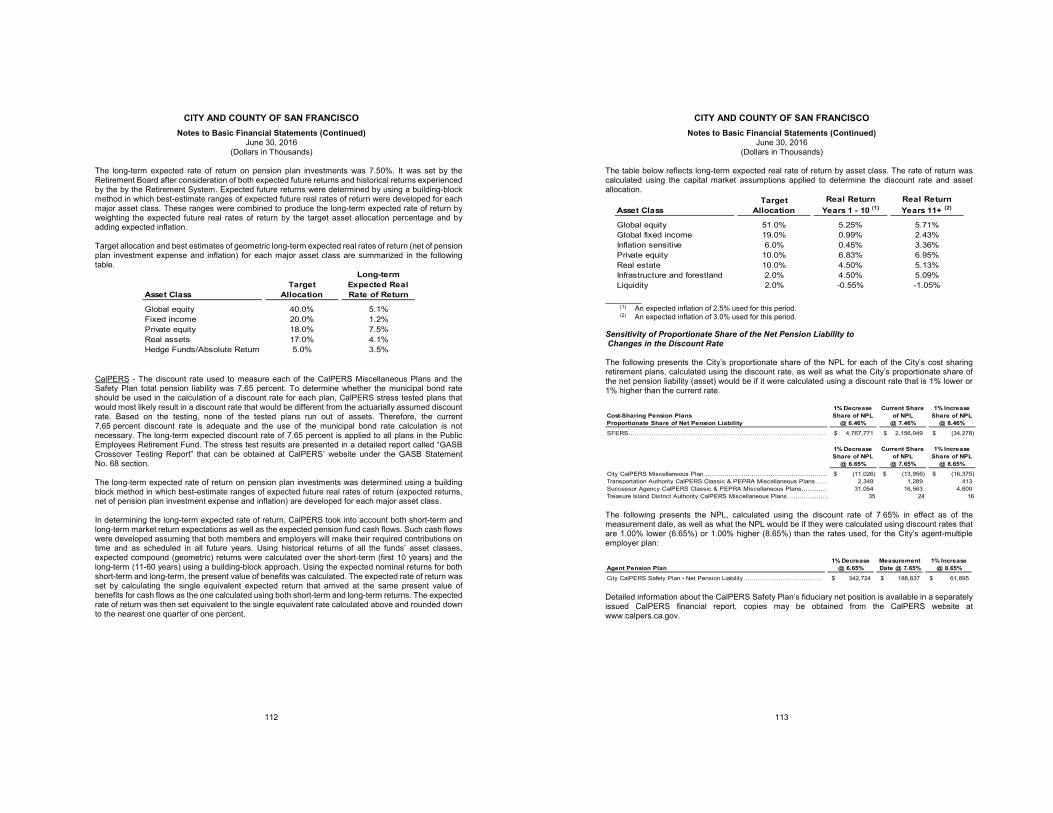
CITY AND COUNTY OF SAN FRANCISCO Notes to Basic Financial Statements (Continued)
June 30, 2016 (Dollars in Thousands)
112
The long-term expected rate of return on pension plan investments was 7.50%. It was set by the Retirement Board after consideration of both expected future returns and historical returns experienced by the by the Retirement System. Expected future returns were determined by using a building-block method in which best-estimate ranges of expected future real rates of return were developed for each major asset class. These ranges were combined to produce the long-term expected rate of return by weighting the expected future real rates of return by the target asset allocation percentage and by adding expected inflation. Target allocation and best estimates of geometric long-term expected real rates of return (net of pension plan investment expense and inflation) for each major asset class are summarized in the following table.
CalPERS - The discount rate used to measure each of the CalPERS Miscellaneous Plans and the Safety Plan total pension liability was 7.65 percent. To determine whether the municipal bond rate should be used in the calculation of a discount rate for each plan, CalPERS stress tested plans that would most likely result in a discount rate that would be different from the actuarially assumed discount rate. Based on the testing, none of the tested plans run out of assets. Therefore, the current 7.65 percent discount rate is adequate and the use of the municipal bond rate calculation is not necessary. The long-term expected discount rate of 7.65 percent is applied to all plans in the Public Employees Retirement Fund. The stress test results are presented in a detailed report called “GASB Crossover Testing Report” that can be obtained at CalPERS’ website under the GASB Statement No. 68 section. The long-term expected rate of return on pension plan investments was determined using a building block method in which best-estimate ranges of expected future real rates of return (expected returns, net of pension plan investment expense and inflation) are developed for each major asset class. In determining the long-term expected rate of return, CalPERS took into account both short-term and long-term market return expectations as well as the expected pension fund cash flows. Such cash flows were developed assuming that both members and employers will make their required contributions on time and as scheduled in all future years. Using historical returns of all the funds’ asset classes, expected compound (geometric) returns were calculated over the short-term (first 10 years) and the long-term (11-60 years) using a building-block approach. Using the expected nominal returns for both short-term and long-term, the present value of benefits was calculated. The expected rate of return was set by calculating the single equivalent expected return that arrived at the same present value of benefits for cash flows as the one calculated using both short-term and long-term returns. The expected rate of return was then set equivalent to the single equivalent rate calculated above and rounded down to the nearest one quarter of one percent.
Asset ClassTarget
Allocation
Long-term Expected Real Rate of Return
Global equity 40.0% 5.1%Fixed income 20.0% 1.2%Private equity 18.0% 7.5%Real assets 17.0% 4.1%Hedge Funds/Absolute Return 5.0% 3.5%
CITY AND COUNTY OF SAN FRANCISCO Notes to Basic Financial Statements (Continued)
June 30, 2016 (Dollars in Thousands)
113
The table below reflects long-term expected real rate of return by asset class. The rate of return was calculated using the capital market assumptions applied to determine the discount rate and asset allocation.
________
(1) An expected inflation of 2.5% used for this period. (2) An expected inflation of 3.0% used for this period.
Sensitivity of Proportionate Share of the Net Pension Liability to Changes in the Discount Rate The following presents the City’s proportionate share of the NPL for each of the City’s cost sharing retirement plans, calculated using the discount rate, as well as what the City’s proportionate share of the net pension liability (asset) would be if it were calculated using a discount rate that is 1% lower or 1% higher than the current rate.
The following presents the NPL, calculated using the discount rate of 7.65% in effect as of the measurement date, as well as what the NPL would be if they were calculated using discount rates that are 1.00% lower (6.65%) or 1.00% higher (8.65%) than the rates used, for the City’s agent-multiple employer plan:
Detailed information about the CalPERS Safety Plan’s fiduciary net position is available in a separately issued CalPERS financial report, copies may be obtained from the CalPERS website at www.calpers.ca.gov.
Asset ClassTarget
AllocationReal Return
Years 1 - 10 (1)Real ReturnYears 11+ (2)
Global equity 51.0% 5.25% 5.71%Global fixed income 19.0% 0.99% 2.43%Inflation sensitive 6.0% 0.45% 3.36%Private equity 10.0% 6.83% 6.95%Real estate 10.0% 4.50% 5.13%Infrastructure and forestland 2.0% 4.50% 5.09%Liquidity 2.0% -0.55% -1.05%
Cost-Sharing Pension Plans Proportionate Share of Net Pension Liability
1% Decrease Share of NPL
@ 6.46%
Current Share of NPL
@ 7.46%
1% Increase Share of NPL
@ 8.46%SFERS…………………………………………………………………………………. 4,767,771$ 2,156,049$ (34,278)$
1% Decrease Share of NPL
@ 6.65%
Current Share of NPL
@ 7.65%
1% Increase Share of NPL
@ 8.65%City CalPERS Miscellaneous Plan………………………………………………….. (11,026)$ (13,956)$ (16,375)$ Transportation Authority CalPERS Classic & PEPRA Miscellaneous Plans…… 2,349 1,289 413 Successor Agency CalPERS Classic & PEPRA Miscellaneous Plans………… 31,054 16,563 4,600 Treasure Island District Authority CalPERS Miscellaneous Plans………………… 35 24 16
Agent Pension Plan1% Decrease
@ 6.65%Measurement Date @ 7.65%
1% Increase @ 8.65%
City CalPERS Safety Plan - Net Pension Liability……………………………….. 342,724$ 188,837$ 61,895$
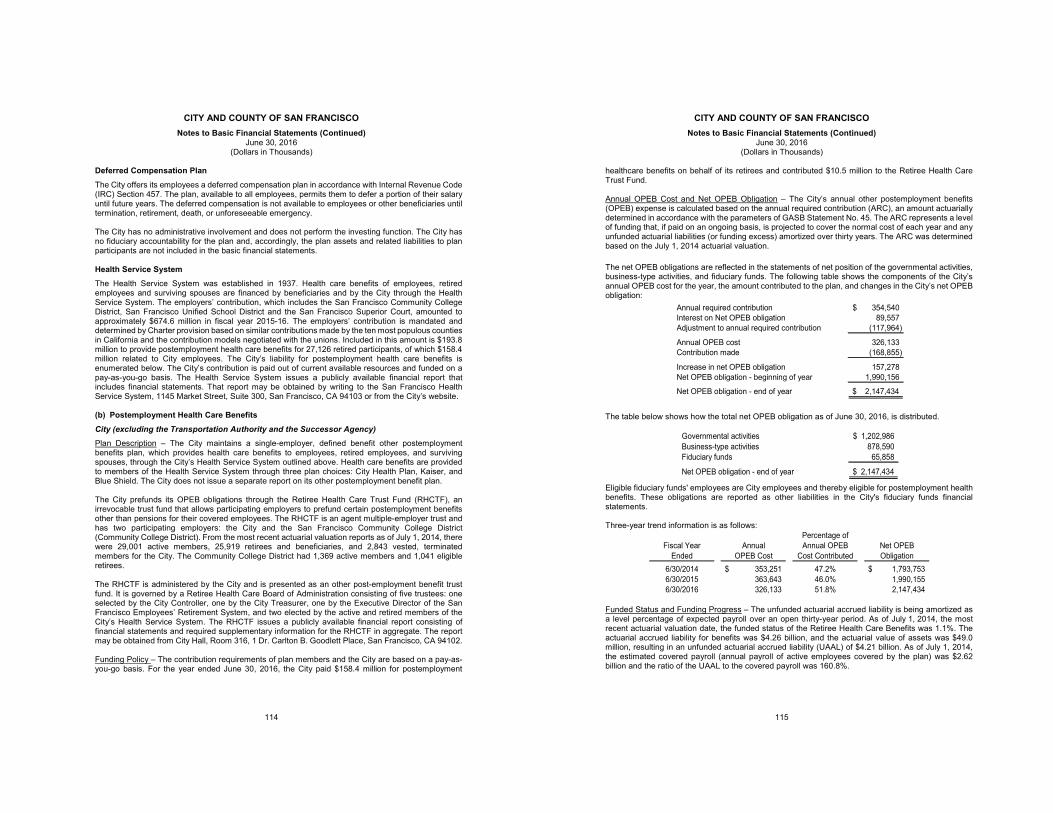
CITY AND COUNTY OF SAN FRANCISCO Notes to Basic Financial Statements (Continued)
June 30, 2016 (Dollars in Thousands)
114
Deferred Compensation Plan
The City offers its employees a deferred compensation plan in accordance with Internal Revenue Code (IRC) Section 457. The plan, available to all employees, permits them to defer a portion of their salary until future years. The deferred compensation is not available to employees or other beneficiaries until termination, retirement, death, or unforeseeable emergency. The City has no administrative involvement and does not perform the investing function. The City has no fiduciary accountability for the plan and, accordingly, the plan assets and related liabilities to plan participants are not included in the basic financial statements. Health Service System
The Health Service System was established in 1937. Health care benefits of employees, retired employees and surviving spouses are financed by beneficiaries and by the City through the Health Service System. The employers’ contribution, which includes the San Francisco Community College District, San Francisco Unified School District and the San Francisco Superior Court, amounted to approximately $674.6 million in fiscal year 2015-16. The employers’ contribution is mandated and determined by Charter provision based on similar contributions made by the ten most populous counties in California and the contribution models negotiated with the unions. Included in this amount is $193.8 million to provide postemployment health care benefits for 27,126 retired participants, of which $158.4 million related to City employees. The City’s liability for postemployment health care benefits is enumerated below. The City’s contribution is paid out of current available resources and funded on a pay-as-you-go basis. The Health Service System issues a publicly available financial report that includes financial statements. That report may be obtained by writing to the San Francisco Health Service System, 1145 Market Street, Suite 300, San Francisco, CA 94103 or from the City’s website. (b) Postemployment Health Care Benefits City (excluding the Transportation Authority and the Successor Agency) Plan Description – The City maintains a single-employer, defined benefit other postemployment benefits plan, which provides health care benefits to employees, retired employees, and surviving spouses, through the City’s Health Service System outlined above. Health care benefits are provided to members of the Health Service System through three plan choices: City Health Plan, Kaiser, and Blue Shield. The City does not issue a separate report on its other postemployment benefit plan. The City prefunds its OPEB obligations through the Retiree Health Care Trust Fund (RHCTF), an irrevocable trust fund that allows participating employers to prefund certain postemployment benefits other than pensions for their covered employees. The RHCTF is an agent multiple-employer trust and has two participating employers: the City and the San Francisco Community College District (Community College District). From the most recent actuarial valuation reports as of July 1, 2014, there were 29,001 active members, 25,919 retirees and beneficiaries, and 2,843 vested, terminated members for the City. The Community College District had 1,369 active members and 1,041 eligible retirees. The RHCTF is administered by the City and is presented as an other post-employment benefit trust fund. It is governed by a Retiree Health Care Board of Administration consisting of five trustees: one selected by the City Controller, one by the City Treasurer, one by the Executive Director of the San Francisco Employees’ Retirement System, and two elected by the active and retired members of the City’s Health Service System. The RHCTF issues a publicly available financial report consisting of financial statements and required supplementary information for the RHCTF in aggregate. The report may be obtained from City Hall, Room 316, 1 Dr. Carlton B. Goodlett Place, San Francisco, CA 94102. Funding Policy – The contribution requirements of plan members and the City are based on a pay-as-you-go basis. For the year ended June 30, 2016, the City paid $158.4 million for postemployment
CITY AND COUNTY OF SAN FRANCISCO Notes to Basic Financial Statements (Continued)
June 30, 2016 (Dollars in Thousands)
115
healthcare benefits on behalf of its retirees and contributed $10.5 million to the Retiree Health Care Trust Fund. Annual OPEB Cost and Net OPEB Obligation – The City’s annual other postemployment benefits (OPEB) expense is calculated based on the annual required contribution (ARC), an amount actuarially determined in accordance with the parameters of GASB Statement No. 45. The ARC represents a level of funding that, if paid on an ongoing basis, is projected to cover the normal cost of each year and any unfunded actuarial liabilities (or funding excess) amortized over thirty years. The ARC was determined based on the July 1, 2014 actuarial valuation. The net OPEB obligations are reflected in the statements of net position of the governmental activities, business-type activities, and fiduciary funds. The following table shows the components of the City’s annual OPEB cost for the year, the amount contributed to the plan, and changes in the City’s net OPEB obligation:
Annual required contribution 354,540$ Interest on Net OPEB obligation 89,557 Adjustment to annual required contribution (117,964)
Annual OPEB cost 326,133 Contribution made (168,855)
Increase in net OPEB obligation 157,278 Net OPEB obligation - beginning of year 1,990,156
Net OPEB obligation - end of year 2,147,434$
The table below shows how the total net OPEB obligation as of June 30, 2016, is distributed.
Governmental activities 1,202,986$ Business-type activities 878,590 Fiduciary funds 65,858
Net OPEB obligation - end of year 2,147,434$
Eligible fiduciary funds' employees are City employees and thereby eligible for postemployment health benefits. These obligations are reported as other liabilities in the City's fiduciary funds financial statements. Three-year trend information is as follows:
Percentage ofFiscal Year Annual Annual OPEB Net OPEB
Ended OPEB Cost Cost Contributed Obligation6/30/2014 353,251$ 47.2% 1,793,753$ 6/30/2015 363,643 46.0% 1,990,155 6/30/2016 326,133 51.8% 2,147,434
Funded Status and Funding Progress – The unfunded actuarial accrued liability is being amortized as a level percentage of expected payroll over an open thirty-year period. As of July 1, 2014, the most recent actuarial valuation date, the funded status of the Retiree Health Care Benefits was 1.1%. The actuarial accrued liability for benefits was $4.26 billion, and the actuarial value of assets was $49.0 million, resulting in an unfunded actuarial accrued liability (UAAL) of $4.21 billion. As of July 1, 2014, the estimated covered payroll (annual payroll of active employees covered by the plan) was $2.62 billion and the ratio of the UAAL to the covered payroll was 160.8%.
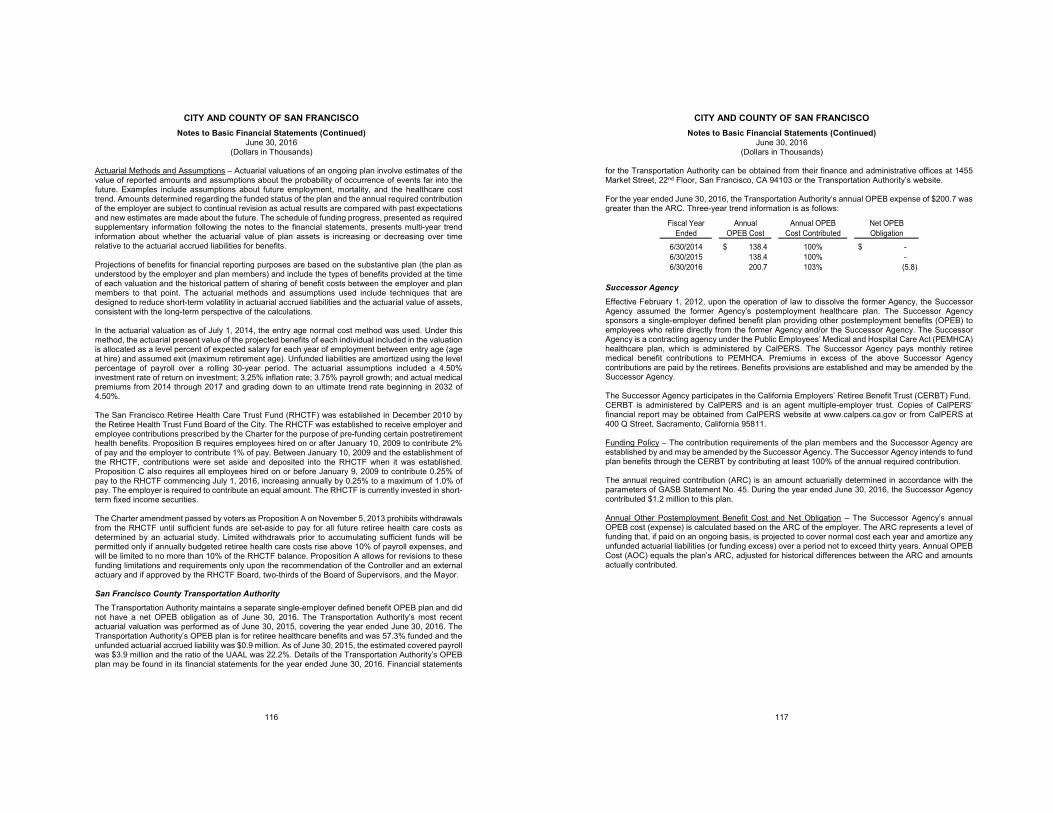
CITY AND COUNTY OF SAN FRANCISCO Notes to Basic Financial Statements (Continued)
June 30, 2016 (Dollars in Thousands)
116
Actuarial Methods and Assumptions – Actuarial valuations of an ongoing plan involve estimates of the value of reported amounts and assumptions about the probability of occurrence of events far into the future. Examples include assumptions about future employment, mortality, and the healthcare cost trend. Amounts determined regarding the funded status of the plan and the annual required contribution of the employer are subject to continual revision as actual results are compared with past expectations and new estimates are made about the future. The schedule of funding progress, presented as required supplementary information following the notes to the financial statements, presents multi-year trend information about whether the actuarial value of plan assets is increasing or decreasing over time relative to the actuarial accrued liabilities for benefits. Projections of benefits for financial reporting purposes are based on the substantive plan (the plan as understood by the employer and plan members) and include the types of benefits provided at the time of each valuation and the historical pattern of sharing of benefit costs between the employer and plan members to that point. The actuarial methods and assumptions used include techniques that are designed to reduce short-term volatility in actuarial accrued liabilities and the actuarial value of assets, consistent with the long-term perspective of the calculations. In the actuarial valuation as of July 1, 2014, the entry age normal cost method was used. Under this method, the actuarial present value of the projected benefits of each individual included in the valuation is allocated as a level percent of expected salary for each year of employment between entry age (age at hire) and assumed exit (maximum retirement age). Unfunded liabilities are amortized using the level percentage of payroll over a rolling 30-year period. The actuarial assumptions included a 4.50% investment rate of return on investment; 3.25% inflation rate; 3.75% payroll growth; and actual medical premiums from 2014 through 2017 and grading down to an ultimate trend rate beginning in 2032 of 4.50%. The San Francisco Retiree Health Care Trust Fund (RHCTF) was established in December 2010 by the Retiree Health Trust Fund Board of the City. The RHCTF was established to receive employer and employee contributions prescribed by the Charter for the purpose of pre-funding certain postretirement health benefits. Proposition B requires employees hired on or after January 10, 2009 to contribute 2% of pay and the employer to contribute 1% of pay. Between January 10, 2009 and the establishment of the RHCTF, contributions were set aside and deposited into the RHCTF when it was established. Proposition C also requires all employees hired on or before January 9, 2009 to contribute 0.25% of pay to the RHCTF commencing July 1, 2016, increasing annually by 0.25% to a maximum of 1.0% of pay. The employer is required to contribute an equal amount. The RHCTF is currently invested in short-term fixed income securities. The Charter amendment passed by voters as Proposition A on November 5, 2013 prohibits withdrawals from the RHCTF until sufficient funds are set-aside to pay for all future retiree health care costs as determined by an actuarial study. Limited withdrawals prior to accumulating sufficient funds will be permitted only if annually budgeted retiree health care costs rise above 10% of payroll expenses, and will be limited to no more than 10% of the RHCTF balance. Proposition A allows for revisions to these funding limitations and requirements only upon the recommendation of the Controller and an external actuary and if approved by the RHCTF Board, two-thirds of the Board of Supervisors, and the Mayor. San Francisco County Transportation Authority The Transportation Authority maintains a separate single-employer defined benefit OPEB plan and did not have a net OPEB obligation as of June 30, 2016. The Transportation Authority’s most recent actuarial valuation was performed as of June 30, 2015, covering the year ended June 30, 2016. The Transportation Authority’s OPEB plan is for retiree healthcare benefits and was 57.3% funded and the unfunded actuarial accrued liability was $0.9 million. As of June 30, 2015, the estimated covered payroll was $3.9 million and the ratio of the UAAL was 22.2%. Details of the Transportation Authority’s OPEB plan may be found in its financial statements for the year ended June 30, 2016. Financial statements
CITY AND COUNTY OF SAN FRANCISCO Notes to Basic Financial Statements (Continued)
June 30, 2016 (Dollars in Thousands)
117
for the Transportation Authority can be obtained from their finance and administrative offices at 1455 Market Street, 22nd Floor, San Francisco, CA 94103 or the Transportation Authority’s website. For the year ended June 30, 2016, the Transportation Authority’s annual OPEB expense of $200.7 was greater than the ARC. Three-year trend information is as follows:
Fiscal Year Annual Annual OPEB Net OPEBEnded OPEB Cost Cost Contributed Obligation
6/30/2014 138.4$ 100% -$ 6/30/2015 138.4 100% - 6/30/2016 200.7 103% (5.8)
Successor Agency Effective February 1, 2012, upon the operation of law to dissolve the former Agency, the Successor Agency assumed the former Agency’s postemployment healthcare plan. The Successor Agency sponsors a single-employer defined benefit plan providing other postemployment benefits (OPEB) to employees who retire directly from the former Agency and/or the Successor Agency. The Successor Agency is a contracting agency under the Public Employees’ Medical and Hospital Care Act (PEMHCA) healthcare plan, which is administered by CalPERS. The Successor Agency pays monthly retiree medical benefit contributions to PEMHCA. Premiums in excess of the above Successor Agency contributions are paid by the retirees. Benefits provisions are established and may be amended by the Successor Agency. The Successor Agency participates in the California Employers’ Retiree Benefit Trust (CERBT) Fund. CERBT is administered by CalPERS and is an agent multiple-employer trust. Copies of CalPERS’ financial report may be obtained from CalPERS website at www.calpers.ca.gov or from CalPERS at 400 Q Street, Sacramento, California 95811. Funding Policy – The contribution requirements of the plan members and the Successor Agency are established by and may be amended by the Successor Agency. The Successor Agency intends to fund plan benefits through the CERBT by contributing at least 100% of the annual required contribution. The annual required contribution (ARC) is an amount actuarially determined in accordance with the parameters of GASB Statement No. 45. During the year ended June 30, 2016, the Successor Agency contributed $1.2 million to this plan. Annual Other Postemployment Benefit Cost and Net Obligation – The Successor Agency’s annual OPEB cost (expense) is calculated based on the ARC of the employer. The ARC represents a level of funding that, if paid on an ongoing basis, is projected to cover normal cost each year and amortize any unfunded actuarial liabilities (or funding excess) over a period not to exceed thirty years. Annual OPEB Cost (AOC) equals the plan’s ARC, adjusted for historical differences between the ARC and amounts actually contributed.
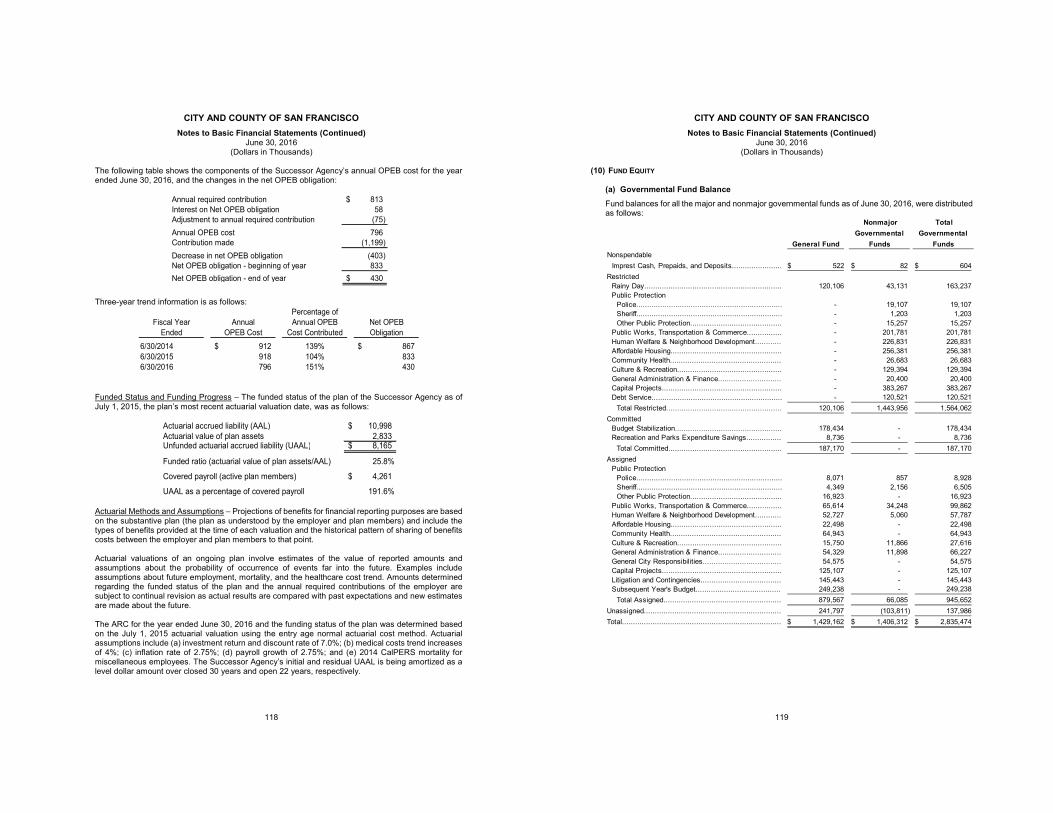
CITY AND COUNTY OF SAN FRANCISCO Notes to Basic Financial Statements (Continued)
June 30, 2016 (Dollars in Thousands)
118
The following table shows the components of the Successor Agency’s annual OPEB cost for the year ended June 30, 2016, and the changes in the net OPEB obligation:
Annual required contribution 813$ Interest on Net OPEB obligation 58 Adjustment to annual required contribution (75) Annual OPEB cost 796 Contribution made (1,199) Decrease in net OPEB obligation (403) Net OPEB obligation - beginning of year 833 Net OPEB obligation - end of year 430$
Three-year trend information is as follows: Percentage of
Fiscal Year Annual Annual OPEB Net OPEBEnded OPEB Cost Cost Contributed Obligation
6/30/2014 912$ 139% 867$ 6/30/2015 918 104% 833 6/30/2016 796 151% 430
Funded Status and Funding Progress – The funded status of the plan of the Successor Agency as of July 1, 2015, the plan’s most recent actuarial valuation date, was as follows:
Actuarial accrued liability (AAL) 10,998$ Actuarial value of plan assets 2,833 Unfunded actuarial accrued liability (UAAL) 8,165$
Funded ratio (actuarial value of plan assets/AAL) 25.8%
Covered payroll (active plan members) 4,261$
UAAL as a percentage of covered payroll 191.6%
Actuarial Methods and Assumptions – Projections of benefits for financial reporting purposes are based on the substantive plan (the plan as understood by the employer and plan members) and include the types of benefits provided at the time of each valuation and the historical pattern of sharing of benefits costs between the employer and plan members to that point.
Actuarial valuations of an ongoing plan involve estimates of the value of reported amounts and assumptions about the probability of occurrence of events far into the future. Examples include assumptions about future employment, mortality, and the healthcare cost trend. Amounts determined regarding the funded status of the plan and the annual required contributions of the employer are subject to continual revision as actual results are compared with past expectations and new estimates are made about the future.
The ARC for the year ended June 30, 2016 and the funding status of the plan was determined based on the July 1, 2015 actuarial valuation using the entry age normal actuarial cost method. Actuarial assumptions include (a) investment return and discount rate of 7.0%; (b) medical costs trend increases of 4%; (c) inflation rate of 2.75%; (d) payroll growth of 2.75%; and (e) 2014 CalPERS mortality for miscellaneous employees. The Successor Agency’s initial and residual UAAL is being amortized as a level dollar amount over closed 30 years and open 22 years, respectively.
CITY AND COUNTY OF SAN FRANCISCO Notes to Basic Financial Statements (Continued)
June 30, 2016 (Dollars in Thousands)
119
(10) FUND EQUITY
(a) Governmental Fund Balance
Fund balances for all the major and nonmajor governmental funds as of June 30, 2016, were distributed as follows:
General Fund
Nonmajor Governmental
Funds
Total Governmental
Funds Nonspendable
Imprest Cash, Prepaids, and Deposits....................... 522$ 82$ 604$ Restricted
Rainy Day............................................................... 120,106 43,131 163,237 Public Protection
Police................................................................... - 19,107 19,107 Sheriff................................................................... - 1,203 1,203 Other Public Protection.......................................... - 15,257 15,257
Public Works, Transportation & Commerce................ - 201,781 201,781 Human Welfare & Neighborhood Development............ - 226,831 226,831 Affordable Housing................................................... - 256,381 256,381 Community Health................................................... - 26,683 26,683 Culture & Recreation................................................ - 129,394 129,394 General Administration & Finance............................. - 20,400 20,400 Capital Projects....................................................... - 383,267 383,267 Debt Service............................................................ - 120,521 120,521
Total Restricted..................................................... 120,106 1,443,956 1,564,062 Committed
Budget Stabilization................................................. 178,434 - 178,434 Recreation and Parks Expenditure Savings................ 8,736 - 8,736
Total Committed.................................................... 187,170 - 187,170 Assigned
Public ProtectionPolice................................................................... 8,071 857 8,928 Sheriff................................................................... 4,349 2,156 6,505 Other Public Protection.......................................... 16,923 - 16,923
Public Works, Transportation & Commerce................ 65,614 34,248 99,862 Human Welfare & Neighborhood Development............ 52,727 5,060 57,787 Affordable Housing................................................... 22,498 - 22,498 Community Health................................................... 64,943 - 64,943 Culture & Recreation................................................ 15,750 11,866 27,616 General Administration & Finance............................. 54,329 11,898 66,227 General City Responsibilities.................................... 54,575 - 54,575 Capital Projects....................................................... 125,107 - 125,107 Litigation and Contingencies..................................... 145,443 - 145,443 Subsequent Year's Budget....................................... 249,238 - 249,238
Total Assigned...................................................... 879,567 66,085 945,652 Unassigned............................................................... 241,797 (103,811) 137,986 Total......................................................................... 1,429,162$ 1,406,312$ 2,835,474$
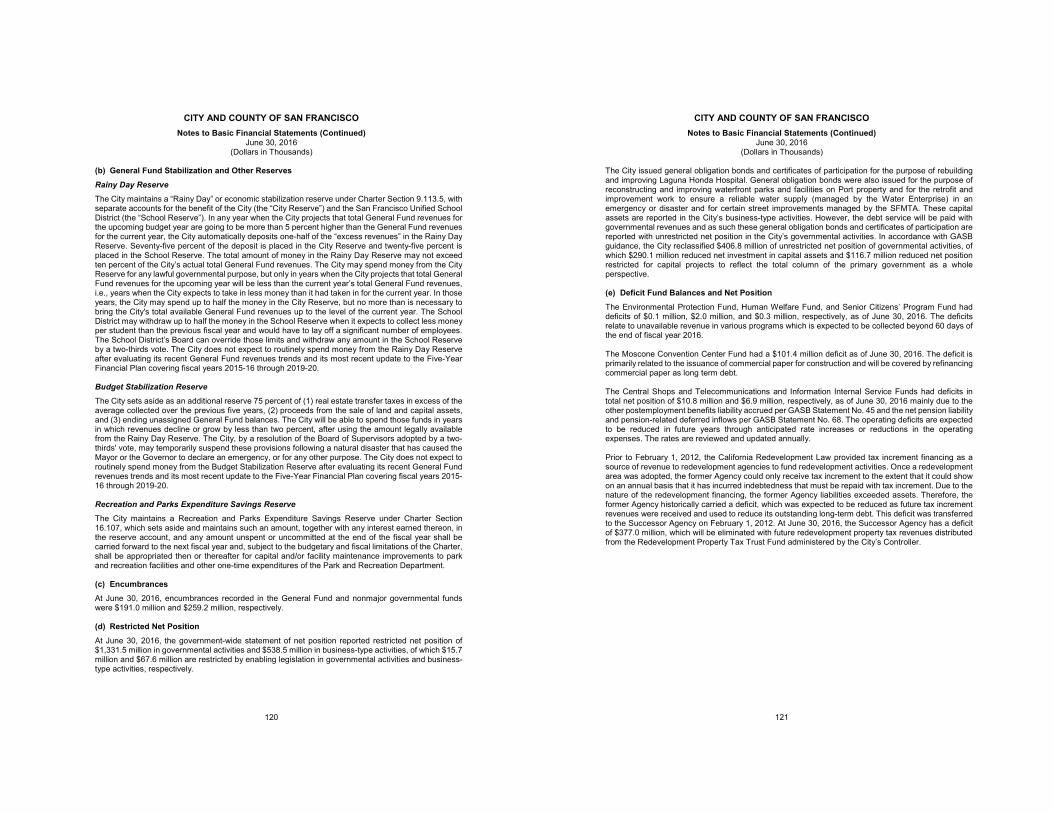
CITY AND COUNTY OF SAN FRANCISCO Notes to Basic Financial Statements (Continued)
June 30, 2016 (Dollars in Thousands)
120
(b) General Fund Stabilization and Other Reserves Rainy Day Reserve
The City maintains a “Rainy Day” or economic stabilization reserve under Charter Section 9.113.5, with separate accounts for the benefit of the City (the “City Reserve”) and the San Francisco Unified School District (the “School Reserve”). In any year when the City projects that total General Fund revenues for the upcoming budget year are going to be more than 5 percent higher than the General Fund revenues for the current year, the City automatically deposits one-half of the “excess revenues” in the Rainy Day Reserve. Seventy-five percent of the deposit is placed in the City Reserve and twenty-five percent is placed in the School Reserve. The total amount of money in the Rainy Day Reserve may not exceed ten percent of the City’s actual total General Fund revenues. The City may spend money from the City Reserve for any lawful governmental purpose, but only in years when the City projects that total General Fund revenues for the upcoming year will be less than the current year’s total General Fund revenues, i.e., years when the City expects to take in less money than it had taken in for the current year. In those years, the City may spend up to half the money in the City Reserve, but no more than is necessary to bring the City's total available General Fund revenues up to the level of the current year. The School District may withdraw up to half the money in the School Reserve when it expects to collect less money per student than the previous fiscal year and would have to lay off a significant number of employees. The School District’s Board can override those limits and withdraw any amount in the School Reserve by a two-thirds vote. The City does not expect to routinely spend money from the Rainy Day Reserve after evaluating its recent General Fund revenues trends and its most recent update to the Five-Year Financial Plan covering fiscal years 2015-16 through 2019-20. Budget Stabilization Reserve
The City sets aside as an additional reserve 75 percent of (1) real estate transfer taxes in excess of the average collected over the previous five years, (2) proceeds from the sale of land and capital assets, and (3) ending unassigned General Fund balances. The City will be able to spend those funds in years in which revenues decline or grow by less than two percent, after using the amount legally available from the Rainy Day Reserve. The City, by a resolution of the Board of Supervisors adopted by a two-thirds' vote, may temporarily suspend these provisions following a natural disaster that has caused the Mayor or the Governor to declare an emergency, or for any other purpose. The City does not expect to routinely spend money from the Budget Stabilization Reserve after evaluating its recent General Fund revenues trends and its most recent update to the Five-Year Financial Plan covering fiscal years 2015-16 through 2019-20. Recreation and Parks Expenditure Savings Reserve
The City maintains a Recreation and Parks Expenditure Savings Reserve under Charter Section 16.107, which sets aside and maintains such an amount, together with any interest earned thereon, in the reserve account, and any amount unspent or uncommitted at the end of the fiscal year shall be carried forward to the next fiscal year and, subject to the budgetary and fiscal limitations of the Charter, shall be appropriated then or thereafter for capital and/or facility maintenance improvements to park and recreation facilities and other one-time expenditures of the Park and Recreation Department. (c) Encumbrances At June 30, 2016, encumbrances recorded in the General Fund and nonmajor governmental funds were $191.0 million and $259.2 million, respectively. (d) Restricted Net Position At June 30, 2016, the government-wide statement of net position reported restricted net position of $1,331.5 million in governmental activities and $538.5 million in business-type activities, of which $15.7 million and $67.6 million are restricted by enabling legislation in governmental activities and business-type activities, respectively.
CITY AND COUNTY OF SAN FRANCISCO Notes to Basic Financial Statements (Continued)
June 30, 2016 (Dollars in Thousands)
121
The City issued general obligation bonds and certificates of participation for the purpose of rebuilding and improving Laguna Honda Hospital. General obligation bonds were also issued for the purpose of reconstructing and improving waterfront parks and facilities on Port property and for the retrofit and improvement work to ensure a reliable water supply (managed by the Water Enterprise) in an emergency or disaster and for certain street improvements managed by the SFMTA. These capital assets are reported in the City’s business-type activities. However, the debt service will be paid with governmental revenues and as such these general obligation bonds and certificates of participation are reported with unrestricted net position in the City’s governmental activities. In accordance with GASB guidance, the City reclassified $406.8 million of unrestricted net position of governmental activities, of which $290.1 million reduced net investment in capital assets and $116.7 million reduced net position restricted for capital projects to reflect the total column of the primary government as a whole perspective. (e) Deficit Fund Balances and Net Position The Environmental Protection Fund, Human Welfare Fund, and Senior Citizens’ Program Fund had deficits of $0.1 million, $2.0 million, and $0.3 million, respectively, as of June 30, 2016. The deficits relate to unavailable revenue in various programs which is expected to be collected beyond 60 days of the end of fiscal year 2016.
The Moscone Convention Center Fund had a $101.4 million deficit as of June 30, 2016. The deficit is primarily related to the issuance of commercial paper for construction and will be covered by refinancing commercial paper as long term debt. The Central Shops and Telecommunications and Information Internal Service Funds had deficits in total net position of $10.8 million and $6.9 million, respectively, as of June 30, 2016 mainly due to the other postemployment benefits liability accrued per GASB Statement No. 45 and the net pension liability and pension-related deferred inflows per GASB Statement No. 68. The operating deficits are expected to be reduced in future years through anticipated rate increases or reductions in the operating expenses. The rates are reviewed and updated annually. Prior to February 1, 2012, the California Redevelopment Law provided tax increment financing as a source of revenue to redevelopment agencies to fund redevelopment activities. Once a redevelopment area was adopted, the former Agency could only receive tax increment to the extent that it could show on an annual basis that it has incurred indebtedness that must be repaid with tax increment. Due to the nature of the redevelopment financing, the former Agency liabilities exceeded assets. Therefore, the former Agency historically carried a deficit, which was expected to be reduced as future tax increment revenues were received and used to reduce its outstanding long-term debt. This deficit was transferred to the Successor Agency on February 1, 2012. At June 30, 2016, the Successor Agency has a deficit of $377.0 million, which will be eliminated with future redevelopment property tax revenues distributed from the Redevelopment Property Tax Trust Fund administered by the City’s Controller.
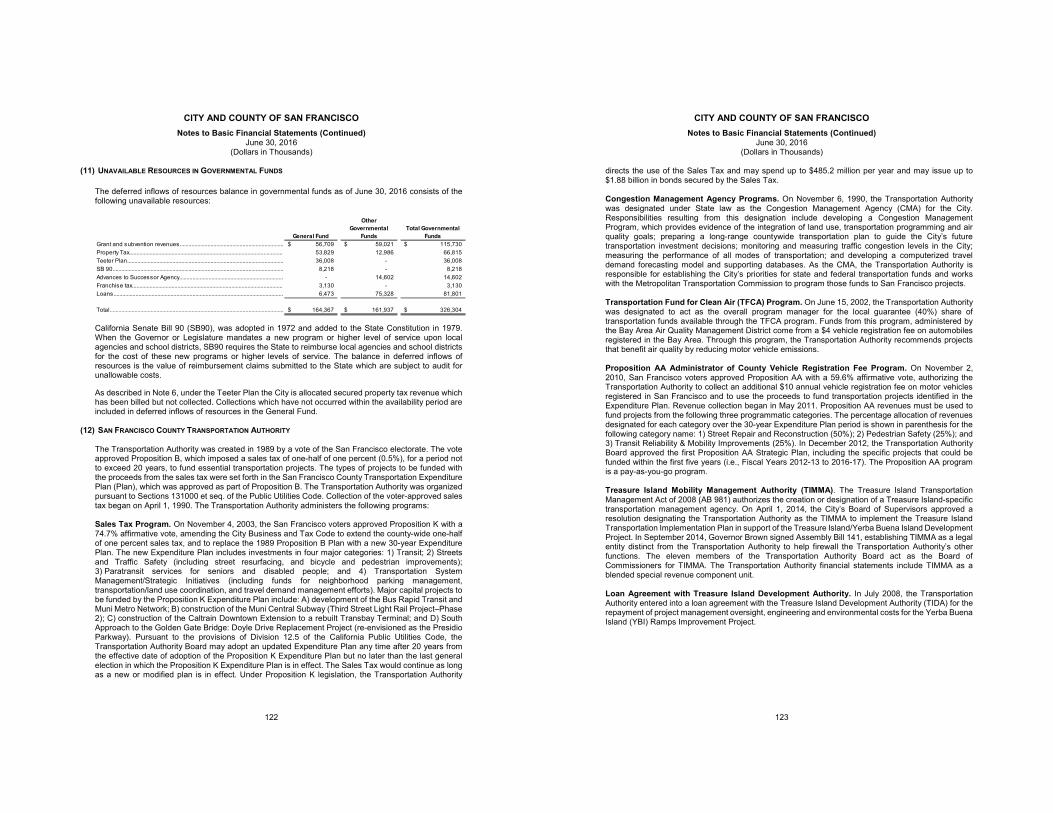
CITY AND COUNTY OF SAN FRANCISCO Notes to Basic Financial Statements (Continued)
June 30, 2016 (Dollars in Thousands)
122
(11) UNAVAILABLE RESOURCES IN GOVERNMENTAL FUNDS
The deferred inflows of resources balance in governmental funds as of June 30, 2016 consists of the following unavailable resources:
California Senate Bill 90 (SB90), was adopted in 1972 and added to the State Constitution in 1979. When the Governor or Legislature mandates a new program or higher level of service upon local agencies and school districts, SB90 requires the State to reimburse local agencies and school districts for the cost of these new programs or higher levels of service. The balance in deferred inflows of resources is the value of reimbursement claims submitted to the State which are subject to audit for unallowable costs. As described in Note 6, under the Teeter Plan the City is allocated secured property tax revenue which has been billed but not collected. Collections which have not occurred within the availability period are included in deferred inflows of resources in the General Fund.
(12) SAN FRANCISCO COUNTY TRANSPORTATION AUTHORITY The Transportation Authority was created in 1989 by a vote of the San Francisco electorate. The vote approved Proposition B, which imposed a sales tax of one-half of one percent (0.5%), for a period not to exceed 20 years, to fund essential transportation projects. The types of projects to be funded with the proceeds from the sales tax were set forth in the San Francisco County Transportation Expenditure Plan (Plan), which was approved as part of Proposition B. The Transportation Authority was organized pursuant to Sections 131000 et seq. of the Public Utilities Code. Collection of the voter-approved sales tax began on April 1, 1990. The Transportation Authority administers the following programs: Sales Tax Program. On November 4, 2003, the San Francisco voters approved Proposition K with a 74.7% affirmative vote, amending the City Business and Tax Code to extend the county-wide one-half of one percent sales tax, and to replace the 1989 Proposition B Plan with a new 30-year Expenditure Plan. The new Expenditure Plan includes investments in four major categories: 1) Transit; 2) Streets and Traffic Safety (including street resurfacing, and bicycle and pedestrian improvements); 3) Paratransit services for seniors and disabled people; and 4) Transportation System Management/Strategic Initiatives (including funds for neighborhood parking management, transportation/land use coordination, and travel demand management efforts). Major capital projects to be funded by the Proposition K Expenditure Plan include: A) development of the Bus Rapid Transit and Muni Metro Network; B) construction of the Muni Central Subway (Third Street Light Rail Project–Phase 2); C) construction of the Caltrain Downtown Extension to a rebuilt Transbay Terminal; and D) South Approach to the Golden Gate Bridge: Doyle Drive Replacement Project (re-envisioned as the Presidio Parkway). Pursuant to the provisions of Division 12.5 of the California Public Utilities Code, the Transportation Authority Board may adopt an updated Expenditure Plan any time after 20 years from the effective date of adoption of the Proposition K Expenditure Plan but no later than the last general election in which the Proposition K Expenditure Plan is in effect. The Sales Tax would continue as long as a new or modified plan is in effect. Under Proposition K legislation, the Transportation Authority
General Fund
Other Governmental
FundsTotal Governmental
FundsGrant and subvention revenues....................................................................... 56,709$ 59,021$ 115,730$ Property Tax......................................................................................................... 53,829 12,986 66,815 Teeter Plan........................................................................................................... 36,008 - 36,008 SB 90..................................................................................................................... 8,218 - 8,218 Advances to Successor Agency....................................................................... - 14,602 14,602 Franchise tax....................................................................................................... 3,130 - 3,130 Loans.................................................................................................................... 6,473 75,328 81,801
Total....................................................................................................................... 164,367$ 161,937$ 326,304$
CITY AND COUNTY OF SAN FRANCISCO Notes to Basic Financial Statements (Continued)
June 30, 2016 (Dollars in Thousands)
123
directs the use of the Sales Tax and may spend up to $485.2 million per year and may issue up to $1.88 billion in bonds secured by the Sales Tax. Congestion Management Agency Programs. On November 6, 1990, the Transportation Authority was designated under State law as the Congestion Management Agency (CMA) for the City. Responsibilities resulting from this designation include developing a Congestion Management Program, which provides evidence of the integration of land use, transportation programming and air quality goals; preparing a long-range countywide transportation plan to guide the City’s future transportation investment decisions; monitoring and measuring traffic congestion levels in the City; measuring the performance of all modes of transportation; and developing a computerized travel demand forecasting model and supporting databases. As the CMA, the Transportation Authority is responsible for establishing the City’s priorities for state and federal transportation funds and works with the Metropolitan Transportation Commission to program those funds to San Francisco projects. Transportation Fund for Clean Air (TFCA) Program. On June 15, 2002, the Transportation Authority was designated to act as the overall program manager for the local guarantee (40%) share of transportation funds available through the TFCA program. Funds from this program, administered by the Bay Area Air Quality Management District come from a $4 vehicle registration fee on automobiles registered in the Bay Area. Through this program, the Transportation Authority recommends projects that benefit air quality by reducing motor vehicle emissions. Proposition AA Administrator of County Vehicle Registration Fee Program. On November 2, 2010, San Francisco voters approved Proposition AA with a 59.6% affirmative vote, authorizing the Transportation Authority to collect an additional $10 annual vehicle registration fee on motor vehicles registered in San Francisco and to use the proceeds to fund transportation projects identified in the Expenditure Plan. Revenue collection began in May 2011. Proposition AA revenues must be used to fund projects from the following three programmatic categories. The percentage allocation of revenues designated for each category over the 30-year Expenditure Plan period is shown in parenthesis for the following category name: 1) Street Repair and Reconstruction (50%); 2) Pedestrian Safety (25%); and 3) Transit Reliability & Mobility Improvements (25%). In December 2012, the Transportation Authority Board approved the first Proposition AA Strategic Plan, including the specific projects that could be funded within the first five years (i.e., Fiscal Years 2012-13 to 2016-17). The Proposition AA program is a pay-as-you-go program. Treasure Island Mobility Management Authority (TIMMA). The Treasure Island Transportation Management Act of 2008 (AB 981) authorizes the creation or designation of a Treasure Island-specific transportation management agency. On April 1, 2014, the City’s Board of Supervisors approved a resolution designating the Transportation Authority as the TIMMA to implement the Treasure Island Transportation Implementation Plan in support of the Treasure Island/Yerba Buena Island Development Project. In September 2014, Governor Brown signed Assembly Bill 141, establishing TIMMA as a legal entity distinct from the Transportation Authority to help firewall the Transportation Authority’s other functions. The eleven members of the Transportation Authority Board act as the Board of Commissioners for TIMMA. The Transportation Authority financial statements include TIMMA as a blended special revenue component unit. Loan Agreement with Treasure Island Development Authority. In July 2008, the Transportation Authority entered into a loan agreement with the Treasure Island Development Authority (TIDA) for the repayment of project management oversight, engineering and environmental costs for the Yerba Buena Island (YBI) Ramps Improvement Project.
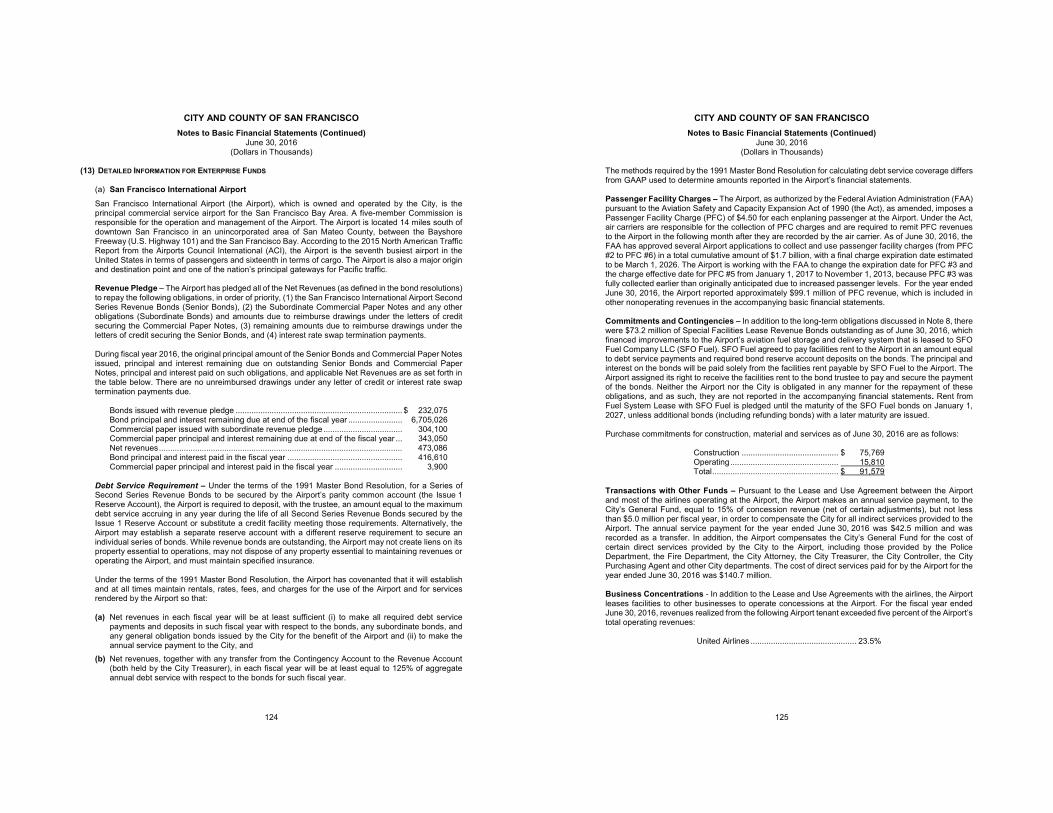
CITY AND COUNTY OF SAN FRANCISCO Notes to Basic Financial Statements (Continued)
June 30, 2016 (Dollars in Thousands)
124
(13) DETAILED INFORMATION FOR ENTERPRISE FUNDS
(a) San Francisco International Airport San Francisco International Airport (the Airport), which is owned and operated by the City, is the principal commercial service airport for the San Francisco Bay Area. A five-member Commission is responsible for the operation and management of the Airport. The Airport is located 14 miles south of downtown San Francisco in an unincorporated area of San Mateo County, between the Bayshore Freeway (U.S. Highway 101) and the San Francisco Bay. According to the 2015 North American Traffic Report from the Airports Council International (ACI), the Airport is the seventh busiest airport in the United States in terms of passengers and sixteenth in terms of cargo. The Airport is also a major origin and destination point and one of the nation’s principal gateways for Pacific traffic. Revenue Pledge – The Airport has pledged all of the Net Revenues (as defined in the bond resolutions) to repay the following obligations, in order of priority, (1) the San Francisco International Airport Second Series Revenue Bonds (Senior Bonds), (2) the Subordinate Commercial Paper Notes and any other obligations (Subordinate Bonds) and amounts due to reimburse drawings under the letters of credit securing the Commercial Paper Notes, (3) remaining amounts due to reimburse drawings under the letters of credit securing the Senior Bonds, and (4) interest rate swap termination payments. During fiscal year 2016, the original principal amount of the Senior Bonds and Commercial Paper Notes issued, principal and interest remaining due on outstanding Senior Bonds and Commercial Paper Notes, principal and interest paid on such obligations, and applicable Net Revenues are as set forth in the table below. There are no unreimbursed drawings under any letter of credit or interest rate swap termination payments due.
Bonds issued with revenue pledge .......................................................................... $ 232,075 Bond principal and interest remaining due at end of the fiscal year ........................ 6,705,026 Commercial paper issued with subordinate revenue pledge ................................... 304,100 Commercial paper principal and interest remaining due at end of the fiscal year ... 343,050 Net revenues ............................................................................................................ 473,086 Bond principal and interest paid in the fiscal year ................................................... 416,610 Commercial paper principal and interest paid in the fiscal year .............................. 3,900
Debt Service Requirement – Under the terms of the 1991 Master Bond Resolution, for a Series of Second Series Revenue Bonds to be secured by the Airport’s parity common account (the Issue 1 Reserve Account), the Airport is required to deposit, with the trustee, an amount equal to the maximum debt service accruing in any year during the life of all Second Series Revenue Bonds secured by the Issue 1 Reserve Account or substitute a credit facility meeting those requirements. Alternatively, the Airport may establish a separate reserve account with a different reserve requirement to secure an individual series of bonds. While revenue bonds are outstanding, the Airport may not create liens on its property essential to operations, may not dispose of any property essential to maintaining revenues or operating the Airport, and must maintain specified insurance. Under the terms of the 1991 Master Bond Resolution, the Airport has covenanted that it will establish and at all times maintain rentals, rates, fees, and charges for the use of the Airport and for services rendered by the Airport so that: (a) Net revenues in each fiscal year will be at least sufficient (i) to make all required debt service
payments and deposits in such fiscal year with respect to the bonds, any subordinate bonds, and any general obligation bonds issued by the City for the benefit of the Airport and (ii) to make the annual service payment to the City, and
(b) Net revenues, together with any transfer from the Contingency Account to the Revenue Account (both held by the City Treasurer), in each fiscal year will be at least equal to 125% of aggregate annual debt service with respect to the bonds for such fiscal year.
CITY AND COUNTY OF SAN FRANCISCO Notes to Basic Financial Statements (Continued)
June 30, 2016 (Dollars in Thousands)
125
The methods required by the 1991 Master Bond Resolution for calculating debt service coverage differs from GAAP used to determine amounts reported in the Airport’s financial statements. Passenger Facility Charges – The Airport, as authorized by the Federal Aviation Administration (FAA) pursuant to the Aviation Safety and Capacity Expansion Act of 1990 (the Act), as amended, imposes a Passenger Facility Charge (PFC) of $4.50 for each enplaning passenger at the Airport. Under the Act, air carriers are responsible for the collection of PFC charges and are required to remit PFC revenues to the Airport in the following month after they are recorded by the air carrier. As of June 30, 2016, the FAA has approved several Airport applications to collect and use passenger facility charges (from PFC #2 to PFC #6) in a total cumulative amount of $1.7 billion, with a final charge expiration date estimated to be March 1, 2026. The Airport is working with the FAA to change the expiration date for PFC #3 and the charge effective date for PFC #5 from January 1, 2017 to November 1, 2013, because PFC #3 was fully collected earlier than originally anticipated due to increased passenger levels. For the year ended June 30, 2016, the Airport reported approximately $99.1 million of PFC revenue, which is included in other nonoperating revenues in the accompanying basic financial statements. Commitments and Contingencies – In addition to the long-term obligations discussed in Note 8, there were $73.2 million of Special Facilities Lease Revenue Bonds outstanding as of June 30, 2016, which financed improvements to the Airport’s aviation fuel storage and delivery system that is leased to SFO Fuel Company LLC (SFO Fuel). SFO Fuel agreed to pay facilities rent to the Airport in an amount equal to debt service payments and required bond reserve account deposits on the bonds. The principal and interest on the bonds will be paid solely from the facilities rent payable by SFO Fuel to the Airport. The Airport assigned its right to receive the facilities rent to the bond trustee to pay and secure the payment of the bonds. Neither the Airport nor the City is obligated in any manner for the repayment of these obligations, and as such, they are not reported in the accompanying financial statements. Rent from Fuel System Lease with SFO Fuel is pledged until the maturity of the SFO Fuel bonds on January 1, 2027, unless additional bonds (including refunding bonds) with a later maturity are issued. Purchase commitments for construction, material and services as of June 30, 2016 are as follows:
Construction ........................................... $ 75,769 Operating ................................................ 15,810 Total ........................................................ $ 91,579
Transactions with Other Funds – Pursuant to the Lease and Use Agreement between the Airport and most of the airlines operating at the Airport, the Airport makes an annual service payment, to the City’s General Fund, equal to 15% of concession revenue (net of certain adjustments), but not less than $5.0 million per fiscal year, in order to compensate the City for all indirect services provided to the Airport. The annual service payment for the year ended June 30, 2016 was $42.5 million and was recorded as a transfer. In addition, the Airport compensates the City’s General Fund for the cost of certain direct services provided by the City to the Airport, including those provided by the Police Department, the Fire Department, the City Attorney, the City Treasurer, the City Controller, the City Purchasing Agent and other City departments. The cost of direct services paid for by the Airport for the year ended June 30, 2016 was $140.7 million. Business Concentrations - In addition to the Lease and Use Agreements with the airlines, the Airport leases facilities to other businesses to operate concessions at the Airport. For the fiscal year ended June 30, 2016, revenues realized from the following Airport tenant exceeded five percent of the Airport’s total operating revenues:
United Airlines ............................................... 23.5%
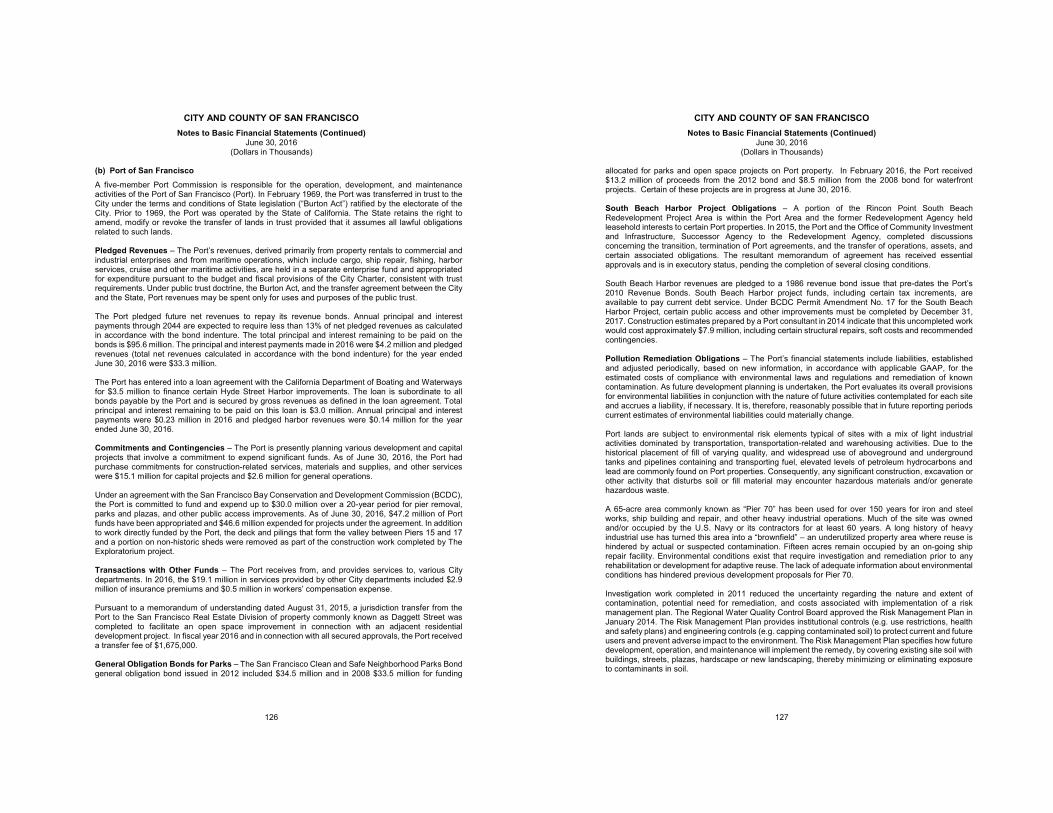
CITY AND COUNTY OF SAN FRANCISCO Notes to Basic Financial Statements (Continued)
June 30, 2016 (Dollars in Thousands)
126
(b) Port of San Francisco A five-member Port Commission is responsible for the operation, development, and maintenance activities of the Port of San Francisco (Port). In February 1969, the Port was transferred in trust to the City under the terms and conditions of State legislation (“Burton Act”) ratified by the electorate of the City. Prior to 1969, the Port was operated by the State of California. The State retains the right to amend, modify or revoke the transfer of lands in trust provided that it assumes all lawful obligations related to such lands. Pledged Revenues – The Port’s revenues, derived primarily from property rentals to commercial and industrial enterprises and from maritime operations, which include cargo, ship repair, fishing, harbor services, cruise and other maritime activities, are held in a separate enterprise fund and appropriated for expenditure pursuant to the budget and fiscal provisions of the City Charter, consistent with trust requirements. Under public trust doctrine, the Burton Act, and the transfer agreement between the City and the State, Port revenues may be spent only for uses and purposes of the public trust. The Port pledged future net revenues to repay its revenue bonds. Annual principal and interest payments through 2044 are expected to require less than 13% of net pledged revenues as calculated in accordance with the bond indenture. The total principal and interest remaining to be paid on the bonds is $95.6 million. The principal and interest payments made in 2016 were $4.2 million and pledged revenues (total net revenues calculated in accordance with the bond indenture) for the year ended June 30, 2016 were $33.3 million. The Port has entered into a loan agreement with the California Department of Boating and Waterways for $3.5 million to finance certain Hyde Street Harbor improvements. The loan is subordinate to all bonds payable by the Port and is secured by gross revenues as defined in the loan agreement. Total principal and interest remaining to be paid on this loan is $3.0 million. Annual principal and interest payments were $0.23 million in 2016 and pledged harbor revenues were $0.14 million for the year ended June 30, 2016. Commitments and Contingencies – The Port is presently planning various development and capital projects that involve a commitment to expend significant funds. As of June 30, 2016, the Port had purchase commitments for construction-related services, materials and supplies, and other services were $15.1 million for capital projects and $2.6 million for general operations.
Under an agreement with the San Francisco Bay Conservation and Development Commission (BCDC), the Port is committed to fund and expend up to $30.0 million over a 20-year period for pier removal, parks and plazas, and other public access improvements. As of June 30, 2016, $47.2 million of Port funds have been appropriated and $46.6 million expended for projects under the agreement. In addition to work directly funded by the Port, the deck and pilings that form the valley between Piers 15 and 17 and a portion on non-historic sheds were removed as part of the construction work completed by The Exploratorium project. Transactions with Other Funds – The Port receives from, and provides services to, various City departments. In 2016, the $19.1 million in services provided by other City departments included $2.9 million of insurance premiums and $0.5 million in workers’ compensation expense. Pursuant to a memorandum of understanding dated August 31, 2015, a jurisdiction transfer from the Port to the San Francisco Real Estate Division of property commonly known as Daggett Street was completed to facilitate an open space improvement in connection with an adjacent residential development project. In fiscal year 2016 and in connection with all secured approvals, the Port received a transfer fee of $1,675,000. General Obligation Bonds for Parks – The San Francisco Clean and Safe Neighborhood Parks Bond general obligation bond issued in 2012 included $34.5 million and in 2008 $33.5 million for funding
CITY AND COUNTY OF SAN FRANCISCO Notes to Basic Financial Statements (Continued)
June 30, 2016 (Dollars in Thousands)
127
allocated for parks and open space projects on Port property. In February 2016, the Port received $13.2 million of proceeds from the 2012 bond and $8.5 million from the 2008 bond for waterfront projects. Certain of these projects are in progress at June 30, 2016. South Beach Harbor Project Obligations – A portion of the Rincon Point South Beach Redevelopment Project Area is within the Port Area and the former Redevelopment Agency held leasehold interests to certain Port properties. In 2015, the Port and the Office of Community Investment and Infrastructure, Successor Agency to the Redevelopment Agency, completed discussions concerning the transition, termination of Port agreements, and the transfer of operations, assets, and certain associated obligations. The resultant memorandum of agreement has received essential approvals and is in executory status, pending the completion of several closing conditions. South Beach Harbor revenues are pledged to a 1986 revenue bond issue that pre-dates the Port’s 2010 Revenue Bonds. South Beach Harbor project funds, including certain tax increments, are available to pay current debt service. Under BCDC Permit Amendment No. 17 for the South Beach Harbor Project, certain public access and other improvements must be completed by December 31, 2017. Construction estimates prepared by a Port consultant in 2014 indicate that this uncompleted work would cost approximately $7.9 million, including certain structural repairs, soft costs and recommended contingencies. Pollution Remediation Obligations – The Port’s financial statements include liabilities, established and adjusted periodically, based on new information, in accordance with applicable GAAP, for the estimated costs of compliance with environmental laws and regulations and remediation of known contamination. As future development planning is undertaken, the Port evaluates its overall provisions for environmental liabilities in conjunction with the nature of future activities contemplated for each site and accrues a liability, if necessary. It is, therefore, reasonably possible that in future reporting periods current estimates of environmental liabilities could materially change. Port lands are subject to environmental risk elements typical of sites with a mix of light industrial activities dominated by transportation, transportation-related and warehousing activities. Due to the historical placement of fill of varying quality, and widespread use of aboveground and underground tanks and pipelines containing and transporting fuel, elevated levels of petroleum hydrocarbons and lead are commonly found on Port properties. Consequently, any significant construction, excavation or other activity that disturbs soil or fill material may encounter hazardous materials and/or generate hazardous waste. A 65-acre area commonly known as “Pier 70” has been used for over 150 years for iron and steel works, ship building and repair, and other heavy industrial operations. Much of the site was owned and/or occupied by the U.S. Navy or its contractors for at least 60 years. A long history of heavy industrial use has turned this area into a “brownfield” – an underutilized property area where reuse is hindered by actual or suspected contamination. Fifteen acres remain occupied by an on-going ship repair facility. Environmental conditions exist that require investigation and remediation prior to any rehabilitation or development for adaptive reuse. The lack of adequate information about environmental conditions has hindered previous development proposals for Pier 70. Investigation work completed in 2011 reduced the uncertainty regarding the nature and extent of contamination, potential need for remediation, and costs associated with implementation of a risk management plan. The Regional Water Quality Control Board approved the Risk Management Plan in January 2014. The Risk Management Plan provides institutional controls (e.g. use restrictions, health and safety plans) and engineering controls (e.g. capping contaminated soil) to protect current and future users and prevent adverse impact to the environment. The Risk Management Plan specifies how future development, operation, and maintenance will implement the remedy, by covering existing site soil with buildings, streets, plazas, hardscape or new landscaping, thereby minimizing or eliminating exposure to contaminants in soil.
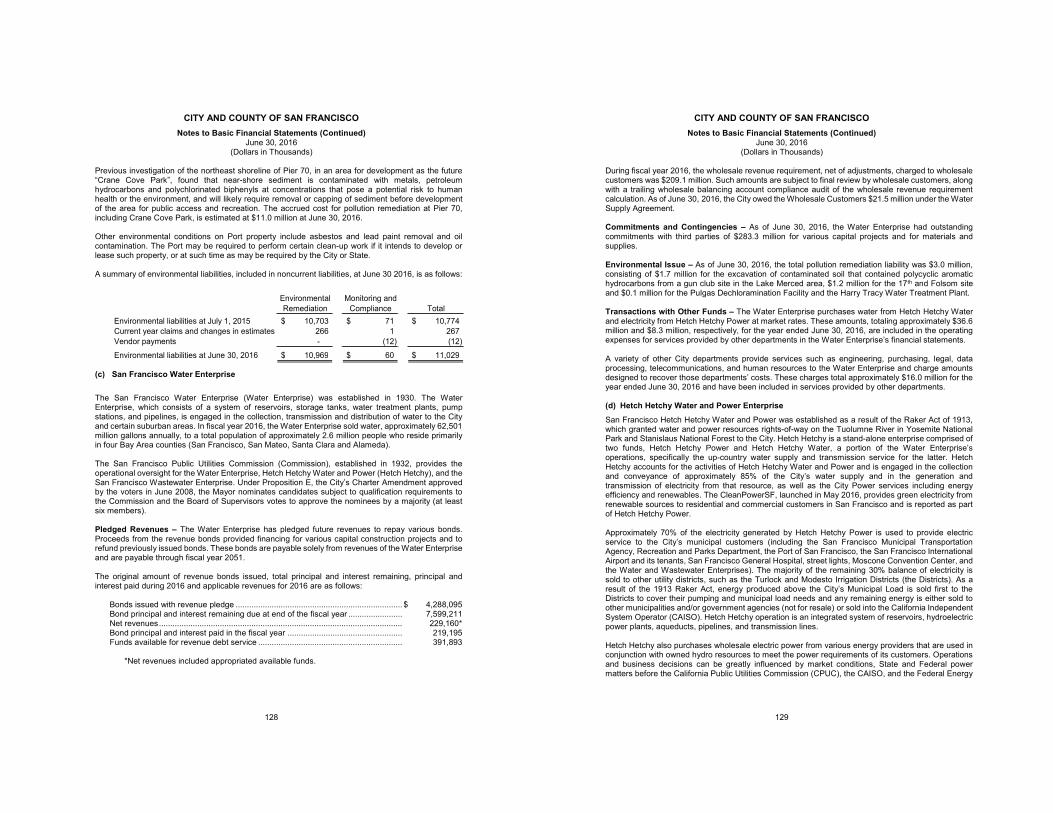
CITY AND COUNTY OF SAN FRANCISCO Notes to Basic Financial Statements (Continued)
June 30, 2016 (Dollars in Thousands)
128
Previous investigation of the northeast shoreline of Pier 70, in an area for development as the future “Crane Cove Park”, found that near-shore sediment is contaminated with metals, petroleum hydrocarbons and polychlorinated biphenyls at concentrations that pose a potential risk to human health or the environment, and will likely require removal or capping of sediment before development of the area for public access and recreation. The accrued cost for pollution remediation at Pier 70, including Crane Cove Park, is estimated at $11.0 million at June 30, 2016. Other environmental conditions on Port property include asbestos and lead paint removal and oil contamination. The Port may be required to perform certain clean-up work if it intends to develop or lease such property, or at such time as may be required by the City or State. A summary of environmental liabilities, included in noncurrent liabilities, at June 30 2016, is as follows:
Environmental Monitoring andRemediation Compliance Total
Environmental liabilities at July 1, 2015 10,703$ 71$ 10,774$ Current year claims and changes in estimates 266 1 267 Vendor payments - (12) (12) Environmental liabilities at June 30, 2016 10,969$ 60$ 11,029$
(c) San Francisco Water Enterprise
The San Francisco Water Enterprise (Water Enterprise) was established in 1930. The Water Enterprise, which consists of a system of reservoirs, storage tanks, water treatment plants, pump stations, and pipelines, is engaged in the collection, transmission and distribution of water to the City and certain suburban areas. In fiscal year 2016, the Water Enterprise sold water, approximately 62,501 million gallons annually, to a total population of approximately 2.6 million people who reside primarily in four Bay Area counties (San Francisco, San Mateo, Santa Clara and Alameda). The San Francisco Public Utilities Commission (Commission), established in 1932, provides the operational oversight for the Water Enterprise, Hetch Hetchy Water and Power (Hetch Hetchy), and the San Francisco Wastewater Enterprise. Under Proposition E, the City’s Charter Amendment approved by the voters in June 2008, the Mayor nominates candidates subject to qualification requirements to the Commission and the Board of Supervisors votes to approve the nominees by a majority (at least six members). Pledged Revenues – The Water Enterprise has pledged future revenues to repay various bonds. Proceeds from the revenue bonds provided financing for various capital construction projects and to refund previously issued bonds. These bonds are payable solely from revenues of the Water Enterprise and are payable through fiscal year 2051.
The original amount of revenue bonds issued, total principal and interest remaining, principal and interest paid during 2016 and applicable revenues for 2016 are as follows:
Bonds issued with revenue pledge .......................................................................... $ 4,288,095 Bond principal and interest remaining due at end of the fiscal year ........................ 7,599,211 Net revenues ............................................................................................................ 229,160* Bond principal and interest paid in the fiscal year ................................................... 219,195 Funds available for revenue debt service ................................................................ 391,893
*Net revenues included appropriated available funds.
CITY AND COUNTY OF SAN FRANCISCO Notes to Basic Financial Statements (Continued)
June 30, 2016 (Dollars in Thousands)
129
During fiscal year 2016, the wholesale revenue requirement, net of adjustments, charged to wholesale customers was $209.1 million. Such amounts are subject to final review by wholesale customers, along with a trailing wholesale balancing account compliance audit of the wholesale revenue requirement calculation. As of June 30, 2016, the City owed the Wholesale Customers $21.5 million under the Water Supply Agreement. Commitments and Contingencies – As of June 30, 2016, the Water Enterprise had outstanding commitments with third parties of $283.3 million for various capital projects and for materials and supplies. Environmental Issue – As of June 30, 2016, the total pollution remediation liability was $3.0 million, consisting of $1.7 million for the excavation of contaminated soil that contained polycyclic aromatic hydrocarbons from a gun club site in the Lake Merced area, $1.2 million for the 17th and Folsom site and $0.1 million for the Pulgas Dechloramination Facility and the Harry Tracy Water Treatment Plant. Transactions with Other Funds – The Water Enterprise purchases water from Hetch Hetchy Water and electricity from Hetch Hetchy Power at market rates. These amounts, totaling approximately $36.6 million and $8.3 million, respectively, for the year ended June 30, 2016, are included in the operating expenses for services provided by other departments in the Water Enterprise’s financial statements. A variety of other City departments provide services such as engineering, purchasing, legal, data processing, telecommunications, and human resources to the Water Enterprise and charge amounts designed to recover those departments’ costs. These charges total approximately $16.0 million for the year ended June 30, 2016 and have been included in services provided by other departments.
(d) Hetch Hetchy Water and Power Enterprise San Francisco Hetch Hetchy Water and Power was established as a result of the Raker Act of 1913, which granted water and power resources rights-of-way on the Tuolumne River in Yosemite National Park and Stanislaus National Forest to the City. Hetch Hetchy is a stand-alone enterprise comprised of two funds, Hetch Hetchy Power and Hetch Hetchy Water, a portion of the Water Enterprise’s operations, specifically the up-country water supply and transmission service for the latter. Hetch Hetchy accounts for the activities of Hetch Hetchy Water and Power and is engaged in the collection and conveyance of approximately 85% of the City’s water supply and in the generation and transmission of electricity from that resource, as well as the City Power services including energy efficiency and renewables. The CleanPowerSF, launched in May 2016, provides green electricity from renewable sources to residential and commercial customers in San Francisco and is reported as part of Hetch Hetchy Power. Approximately 70% of the electricity generated by Hetch Hetchy Power is used to provide electric service to the City’s municipal customers (including the San Francisco Municipal Transportation Agency, Recreation and Parks Department, the Port of San Francisco, the San Francisco International Airport and its tenants, San Francisco General Hospital, street lights, Moscone Convention Center, and the Water and Wastewater Enterprises). The majority of the remaining 30% balance of electricity is sold to other utility districts, such as the Turlock and Modesto Irrigation Districts (the Districts). As a result of the 1913 Raker Act, energy produced above the City’s Municipal Load is sold first to the Districts to cover their pumping and municipal load needs and any remaining energy is either sold to other municipalities and/or government agencies (not for resale) or sold into the California Independent System Operator (CAISO). Hetch Hetchy operation is an integrated system of reservoirs, hydroelectric power plants, aqueducts, pipelines, and transmission lines. Hetch Hetchy also purchases wholesale electric power from various energy providers that are used in conjunction with owned hydro resources to meet the power requirements of its customers. Operations and business decisions can be greatly influenced by market conditions, State and Federal power matters before the California Public Utilities Commission (CPUC), the CAISO, and the Federal Energy
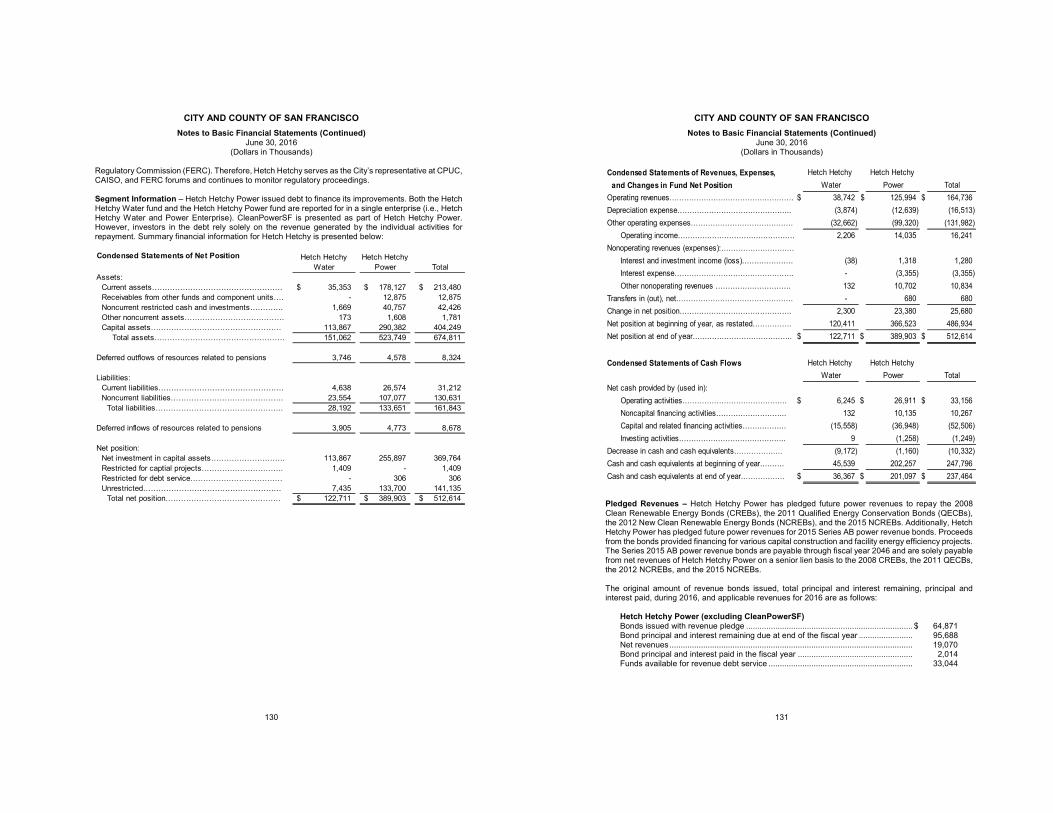
CITY AND COUNTY OF SAN FRANCISCO Notes to Basic Financial Statements (Continued)
June 30, 2016 (Dollars in Thousands)
130
Regulatory Commission (FERC). Therefore, Hetch Hetchy serves as the City’s representative at CPUC, CAISO, and FERC forums and continues to monitor regulatory proceedings.
Segment Information – Hetch Hetchy Power issued debt to finance its improvements. Both the Hetch Hetchy Water fund and the Hetch Hetchy Power fund are reported for in a single enterprise (i.e., Hetch Hetchy Water and Power Enterprise). CleanPowerSF is presented as part of Hetch Hetchy Power. However, investors in the debt rely solely on the revenue generated by the individual activities for repayment. Summary financial information for Hetch Hetchy is presented below:
Condensed Statements of Net Position Hetch Hetchy Water
Hetch Hetchy Power Total
Assets:Current assets…………………………………………… 35,353$ 178,127$ 213,480$ Receivables from other funds and component units…. - 12,875 12,875 Noncurrent restricted cash and investments…………. 1,669 40,757 42,426 Other noncurrent assets………………………………… 173 1,608 1,781 Capital assets…………………………………………… 113,867 290,382 404,249
Total assets…………………………………………… 151,062 523,749 674,811
Deferred outflows of resources related to pensions 3,746 4,578 8,324
Liabilities:Current liabilities…………………………………………. 4,638 26,574 31,212 Noncurrent liabilities…………………………………….. 23,554 107,077 130,631
Total liabilities………………………………………….. 28,192 133,651 161,843
Deferred inflows of resources related to pensions 3,905 4,773 8,678
Net position:Net investment in capital assets……………………….. 113,867 255,897 369,764 Restricted for captial projects………………………….. 1,409 - 1,409 Restricted for debt service……………………………… - 306 306 Unrestricted……………………………………………… 7,435 133,700 141,135
Total net position……………………………………… 122,711$ 389,903$ 512,614$
CITY AND COUNTY OF SAN FRANCISCO Notes to Basic Financial Statements (Continued)
June 30, 2016 (Dollars in Thousands)
131
Pledged Revenues – Hetch Hetchy Power has pledged future power revenues to repay the 2008 Clean Renewable Energy Bonds (CREBs), the 2011 Qualified Energy Conservation Bonds (QECBs), the 2012 New Clean Renewable Energy Bonds (NCREBs), and the 2015 NCREBs. Additionally, Hetch Hetchy Power has pledged future power revenues for 2015 Series AB power revenue bonds. Proceeds from the bonds provided financing for various capital construction and facility energy efficiency projects. The Series 2015 AB power revenue bonds are payable through fiscal year 2046 and are solely payable from net revenues of Hetch Hetchy Power on a senior lien basis to the 2008 CREBs, the 2011 QECBs, the 2012 NCREBs, and the 2015 NCREBs. The original amount of revenue bonds issued, total principal and interest remaining, principal and interest paid, during 2016, and applicable revenues for 2016 are as follows:
Hetch Hetchy Power (excluding CleanPowerSF) Bonds issued with revenue pledge .......................................................................... $ 64,871 Bond principal and interest remaining due at end of the fiscal year ........................ 95,688 Net revenues ............................................................................................................ 19,070 Bond principal and interest paid in the fiscal year ................................................... 2,014 Funds available for revenue debt service ................................................................ 33,044
Condensed Statements of Revenues, Expenses, Hetch Hetchy Hetch Hetchy and Changes in Fund Net Position Water Power TotalOperating revenues…………………………………………… $ 38,742 $ 125,994 $ 164,736 Depreciation expense……………………………………….. (3,874) (12,639) (16,513) Other operating expenses…………………………………… (32,662) (99,320) (131,982)
Operating income………………………………………… 2,206 14,035 16,241 Nonoperating revenues (expenses):…………………………
Interest and investment income (loss)………………… (38) 1,318 1,280 Interest expense…………………………………………. - (3,355) (3,355) Other nonoperating revenues …………………………. 132 10,702 10,834
Transfers in (out), net………………………………………… - 680 680 Change in net position………………………………………. 2,300 23,380 25,680 Net position at beginning of year, as restated……………. 120,411 366,523 486,934 Net position at end of year………………………………….. $ 122,711 $ 389,903 $ 512,614
Condensed Statements of Cash Flows Hetch Hetchy Hetch Hetchy Water Power Total
Net cash provided by (used in):Operating activities……………………………………. $ 6,245 $ 26,911 $ 33,156 Noncapital financing activities……………………….. 132 10,135 10,267 Capital and related financing activities……………… (15,558) (36,948) (52,506) Investing activities…………………………………….. 9 (1,258) (1,249)
Decrease in cash and cash equivalents……………….. (9,172) (1,160) (10,332) Cash and cash equivalents at beginning of year………. 45,539 202,257 247,796 Cash and cash equivalents at end of year……………… $ 36,367 $ 201,097 $ 237,464
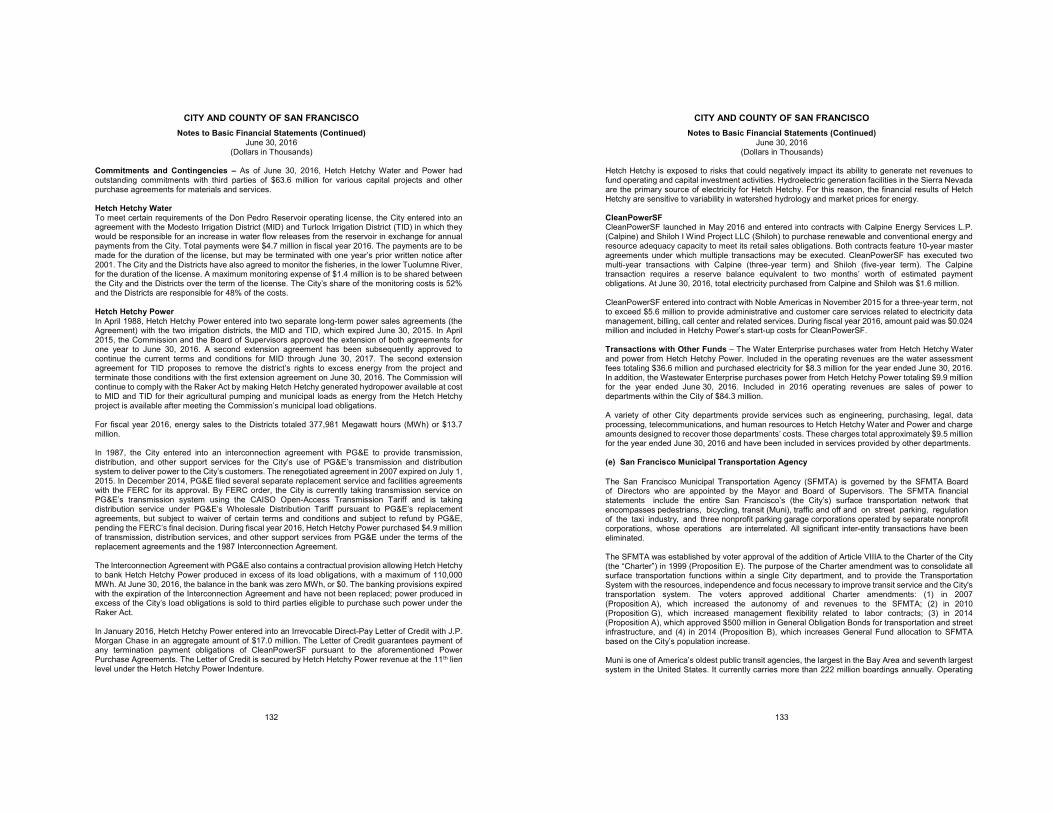
CITY AND COUNTY OF SAN FRANCISCO Notes to Basic Financial Statements (Continued)
June 30, 2016 (Dollars in Thousands)
132
Commitments and Contingencies – As of June 30, 2016, Hetch Hetchy Water and Power had outstanding commitments with third parties of $63.6 million for various capital projects and other purchase agreements for materials and services. Hetch Hetchy Water To meet certain requirements of the Don Pedro Reservoir operating license, the City entered into an agreement with the Modesto Irrigation District (MID) and Turlock Irrigation District (TID) in which they would be responsible for an increase in water flow releases from the reservoir in exchange for annual payments from the City. Total payments were $4.7 million in fiscal year 2016. The payments are to be made for the duration of the license, but may be terminated with one year’s prior written notice after 2001. The City and the Districts have also agreed to monitor the fisheries, in the lower Tuolumne River, for the duration of the license. A maximum monitoring expense of $1.4 million is to be shared between the City and the Districts over the term of the license. The City’s share of the monitoring costs is 52% and the Districts are responsible for 48% of the costs. Hetch Hetchy Power In April 1988, Hetch Hetchy Power entered into two separate long-term power sales agreements (the Agreement) with the two irrigation districts, the MID and TID, which expired June 30, 2015. In April 2015, the Commission and the Board of Supervisors approved the extension of both agreements for one year to June 30, 2016. A second extension agreement has been subsequently approved to continue the current terms and conditions for MID through June 30, 2017. The second extension agreement for TID proposes to remove the district’s rights to excess energy from the project and terminate those conditions with the first extension agreement on June 30, 2016. The Commission will continue to comply with the Raker Act by making Hetch Hetchy generated hydropower available at cost to MID and TID for their agricultural pumping and municipal loads as energy from the Hetch Hetchy project is available after meeting the Commission’s municipal load obligations. For fiscal year 2016, energy sales to the Districts totaled 377,981 Megawatt hours (MWh) or $13.7 million. In 1987, the City entered into an interconnection agreement with PG&E to provide transmission, distribution, and other support services for the City’s use of PG&E’s transmission and distribution system to deliver power to the City’s customers. The renegotiated agreement in 2007 expired on July 1, 2015. In December 2014, PG&E filed several separate replacement service and facilities agreements with the FERC for its approval. By FERC order, the City is currently taking transmission service on PG&E’s transmission system using the CAISO Open-Access Transmission Tariff and is taking distribution service under PG&E’s Wholesale Distribution Tariff pursuant to PG&E’s replacement agreements, but subject to waiver of certain terms and conditions and subject to refund by PG&E, pending the FERC’s final decision. During fiscal year 2016, Hetch Hetchy Power purchased $4.9 million of transmission, distribution services, and other support services from PG&E under the terms of the replacement agreements and the 1987 Interconnection Agreement. The Interconnection Agreement with PG&E also contains a contractual provision allowing Hetch Hetchy to bank Hetch Hetchy Power produced in excess of its load obligations, with a maximum of 110,000 MWh. At June 30, 2016, the balance in the bank was zero MWh, or $0. The banking provisions expired with the expiration of the Interconnection Agreement and have not been replaced; power produced in excess of the City’s load obligations is sold to third parties eligible to purchase such power under the Raker Act. In January 2016, Hetch Hetchy Power entered into an Irrevocable Direct-Pay Letter of Credit with J.P. Morgan Chase in an aggregate amount of $17.0 million. The Letter of Credit guarantees payment of any termination payment obligations of CleanPowerSF pursuant to the aforementioned Power Purchase Agreements. The Letter of Credit is secured by Hetch Hetchy Power revenue at the 11th lien level under the Hetch Hetchy Power Indenture.
CITY AND COUNTY OF SAN FRANCISCO Notes to Basic Financial Statements (Continued)
June 30, 2016 (Dollars in Thousands)
133
Hetch Hetchy is exposed to risks that could negatively impact its ability to generate net revenues to fund operating and capital investment activities. Hydroelectric generation facilities in the Sierra Nevada are the primary source of electricity for Hetch Hetchy. For this reason, the financial results of Hetch Hetchy are sensitive to variability in watershed hydrology and market prices for energy. CleanPowerSF CleanPowerSF launched in May 2016 and entered into contracts with Calpine Energy Services L.P. (Calpine) and Shiloh I Wind Project LLC (Shiloh) to purchase renewable and conventional energy and resource adequacy capacity to meet its retail sales obligations. Both contracts feature 10-year master agreements under which multiple transactions may be executed. CleanPowerSF has executed two multi-year transactions with Calpine (three-year term) and Shiloh (five-year term). The Calpine transaction requires a reserve balance equivalent to two months’ worth of estimated payment obligations. At June 30, 2016, total electricity purchased from Calpine and Shiloh was $1.6 million. CleanPowerSF entered into contract with Noble Americas in November 2015 for a three-year term, not to exceed $5.6 million to provide administrative and customer care services related to electricity data management, billing, call center and related services. During fiscal year 2016, amount paid was $0.024 million and included in Hetchy Power’s start-up costs for CleanPowerSF. Transactions with Other Funds – The Water Enterprise purchases water from Hetch Hetchy Water and power from Hetch Hetchy Power. Included in the operating revenues are the water assessment fees totaling $36.6 million and purchased electricity for $8.3 million for the year ended June 30, 2016. In addition, the Wastewater Enterprise purchases power from Hetch Hetchy Power totaling $9.9 million for the year ended June 30, 2016. Included in 2016 operating revenues are sales of power to departments within the City of $84.3 million. A variety of other City departments provide services such as engineering, purchasing, legal, data processing, telecommunications, and human resources to Hetch Hetchy Water and Power and charge amounts designed to recover those departments’ costs. These charges total approximately $9.5 million for the year ended June 30, 2016 and have been included in services provided by other departments. (e) San Francisco Municipal Transportation Agency
The San Francisco Municipal Transportation Agency (SFMTA) is governed by the SFMTA Board of Directors who are appointed by the Mayor and Board of Supervisors. The SFMTA financial statements include the entire San Francisco’s (the City’s) surface transportation network that encompasses pedestrians, bicycling, transit (Muni), traffic and off and on street parking, regulation of the taxi industry, and three nonprofit parking garage corporations operated by separate nonprofit corporations, whose operations are interrelated. All significant inter-entity transactions have been eliminated. The SFMTA was established by voter approval of the addition of Article VIIIA to the Charter of the City (the “Charter”) in 1999 (Proposition E). The purpose of the Charter amendment was to consolidate all surface transportation functions within a single City department, and to provide the Transportation System with the resources, independence and focus necessary to improve transit service and the City's transportation system. The voters approved additional Charter amendments: (1) in 2007 (Proposition A), which increased the autonomy of and revenues to the SFMTA; (2) in 2010 (Proposition G), which increased management flexibility related to labor contracts; (3) in 2014 (Proposition A), which approved $500 million in General Obligation Bonds for transportation and street infrastructure, and (4) in 2014 (Proposition B), which increases General Fund allocation to SFMTA based on the City’s population increase. Muni is one of America’s oldest public transit agencies, the largest in the Bay Area and seventh largest system in the United States. It currently carries more than 222 million boardings annually. Operating
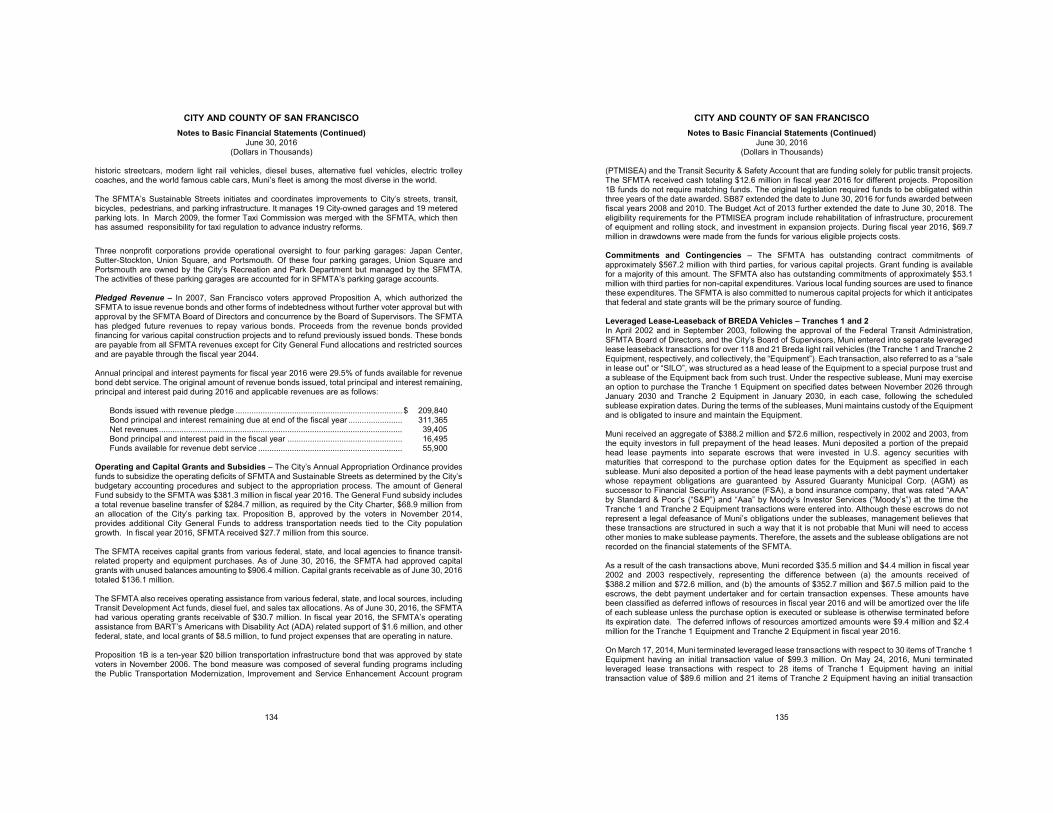
CITY AND COUNTY OF SAN FRANCISCO Notes to Basic Financial Statements (Continued)
June 30, 2016 (Dollars in Thousands)
134
historic streetcars, modern light rail vehicles, diesel buses, alternative fuel vehicles, electric trolley coaches, and the world famous cable cars, Muni’s fleet is among the most diverse in the world. The SFMTA’s Sustainable Streets initiates and coordinates improvements to City’s streets, transit, bicycles, pedestrians, and parking infrastructure. It manages 19 City-owned garages and 19 metered parking lots. In March 2009, the former Taxi Commission was merged with the SFMTA, which then has assumed responsibility for taxi regulation to advance industry reforms.
Three nonprofit corporations provide operational oversight to four parking garages: Japan Center, Sutter-Stockton, Union Square, and Portsmouth. Of these four parking garages, Union Square and Portsmouth are owned by the City’s Recreation and Park Department but managed by the SFMTA. The activities of these parking garages are accounted for in SFMTA’s parking garage accounts. Pledged Revenue – In 2007, San Francisco voters approved Proposition A, which authorized the SFMTA to issue revenue bonds and other forms of indebtedness without further voter approval but with approval by the SFMTA Board of Directors and concurrence by the Board of Supervisors. The SFMTA has pledged future revenues to repay various bonds. Proceeds from the revenue bonds provided financing for various capital construction projects and to refund previously issued bonds. These bonds are payable from all SFMTA revenues except for City General Fund allocations and restricted sources and are payable through the fiscal year 2044. Annual principal and interest payments for fiscal year 2016 were 29.5% of funds available for revenue bond debt service. The original amount of revenue bonds issued, total principal and interest remaining, principal and interest paid during 2016 and applicable revenues are as follows:
Bonds issued with revenue pledge .......................................................................... $ 209,840 Bond principal and interest remaining due at end of the fiscal year ........................ 311,365 Net revenues ............................................................................................................ 39,405 Bond principal and interest paid in the fiscal year ................................................... 16,495 Funds available for revenue debt service ................................................................ 55,900
Operating and Capital Grants and Subsidies – The City’s Annual Appropriation Ordinance provides funds to subsidize the operating deficits of SFMTA and Sustainable Streets as determined by the City’s budgetary accounting procedures and subject to the appropriation process. The amount of General Fund subsidy to the SFMTA was $381.3 million in fiscal year 2016. The General Fund subsidy includes a total revenue baseline transfer of $284.7 million, as required by the City Charter, $68.9 million from an allocation of the City’s parking tax. Proposition B, approved by the voters in November 2014, provides additional City General Funds to address transportation needs tied to the City population growth. In fiscal year 2016, SFMTA received $27.7 million from this source. The SFMTA receives capital grants from various federal, state, and local agencies to finance transit-related property and equipment purchases. As of June 30, 2016, the SFMTA had approved capital grants with unused balances amounting to $906.4 million. Capital grants receivable as of June 30, 2016 totaled $136.1 million. The SFMTA also receives operating assistance from various federal, state, and local sources, including Transit Development Act funds, diesel fuel, and sales tax allocations. As of June 30, 2016, the SFMTA had various operating grants receivable of $30.7 million. In fiscal year 2016, the SFMTA’s operating assistance from BART’s Americans with Disability Act (ADA) related support of $1.6 million, and other federal, state, and local grants of $8.5 million, to fund project expenses that are operating in nature. Proposition 1B is a ten-year $20 billion transportation infrastructure bond that was approved by state voters in November 2006. The bond measure was composed of several funding programs including the Public Transportation Modernization, Improvement and Service Enhancement Account program
CITY AND COUNTY OF SAN FRANCISCO Notes to Basic Financial Statements (Continued)
June 30, 2016 (Dollars in Thousands)
135
(PTMISEA) and the Transit Security & Safety Account that are funding solely for public transit projects. The SFMTA received cash totaling $12.6 million in fiscal year 2016 for different projects. Proposition 1B funds do not require matching funds. The original legislation required funds to be obligated within three years of the date awarded. SB87 extended the date to June 30, 2016 for funds awarded between fiscal years 2008 and 2010. The Budget Act of 2013 further extended the date to June 30, 2018. The eligibility requirements for the PTMISEA program include rehabilitation of infrastructure, procurement of equipment and rolling stock, and investment in expansion projects. During fiscal year 2016, $69.7 million in drawdowns were made from the funds for various eligible projects costs. Commitments and Contingencies – The SFMTA has outstanding contract commitments of approximately $567.2 million with third parties, for various capital projects. Grant funding is available for a majority of this amount. The SFMTA also has outstanding commitments of approximately $53.1 million with third parties for non-capital expenditures. Various local funding sources are used to finance these expenditures. The SFMTA is also committed to numerous capital projects for which it anticipates that federal and state grants will be the primary source of funding. Leveraged Lease-Leaseback of BREDA Vehicles – Tranches 1 and 2 In April 2002 and in September 2003, following the approval of the Federal Transit Administration, SFMTA Board of Directors, and the City’s Board of Supervisors, Muni entered into separate leveraged lease leaseback transactions for over 118 and 21 Breda light rail vehicles (the Tranche 1 and Tranche 2 Equipment, respectively, and collectively, the “Equipment”). Each transaction, also referred to as a “sale in lease out” or “SILO”, was structured as a head lease of the Equipment to a special purpose trust and a sublease of the Equipment back from such trust. Under the respective sublease, Muni may exercise an option to purchase the Tranche 1 Equipment on specified dates between November 2026 through January 2030 and Tranche 2 Equipment in January 2030, in each case, following the scheduled sublease expiration dates. During the terms of the subleases, Muni maintains custody of the Equipment and is obligated to insure and maintain the Equipment. Muni received an aggregate of $388.2 million and $72.6 million, respectively in 2002 and 2003, from the equity investors in full prepayment of the head leases. Muni deposited a portion of the prepaid head lease payments into separate escrows that were invested in U.S. agency securities with maturities that correspond to the purchase option dates for the Equipment as specified in each sublease. Muni also deposited a portion of the head lease payments with a debt payment undertaker whose repayment obligations are guaranteed by Assured Guaranty Municipal Corp. (AGM) as successor to Financial Security Assurance (FSA), a bond insurance company, that was rated “AAA” by Standard & Poor’s (“S&P”) and “Aaa” by Moody’s Investor Services (“Moody’s”) at the time the Tranche 1 and Tranche 2 Equipment transactions were entered into. Although these escrows do not represent a legal defeasance of Muni’s obligations under the subleases, management believes that these transactions are structured in such a way that it is not probable that Muni will need to access other monies to make sublease payments. Therefore, the assets and the sublease obligations are not recorded on the financial statements of the SFMTA.
As a result of the cash transactions above, Muni recorded $35.5 million and $4.4 million in fiscal year 2002 and 2003 respectively, representing the difference between (a) the amounts received of $388.2 million and $72.6 million, and (b) the amounts of $352.7 million and $67.5 million paid to the escrows, the debt payment undertaker and for certain transaction expenses. These amounts have been classified as deferred inflows of resources in fiscal year 2016 and will be amortized over the life of each sublease unless the purchase option is executed or sublease is otherwise terminated before its expiration date. The deferred inflows of resources amortized amounts were $9.4 million and $2.4 million for the Tranche 1 Equipment and Tranche 2 Equipment in fiscal year 2016. On March 17, 2014, Muni terminated leveraged lease transactions with respect to 30 items of Tranche 1 Equipment having an initial transaction value of $99.3 million. On May 24, 2016, Muni terminated leveraged lease transactions with respect to 28 items of Tranche 1 Equipment having an initial transaction value of $89.6 million and 21 items of Tranche 2 Equipment having an initial transaction
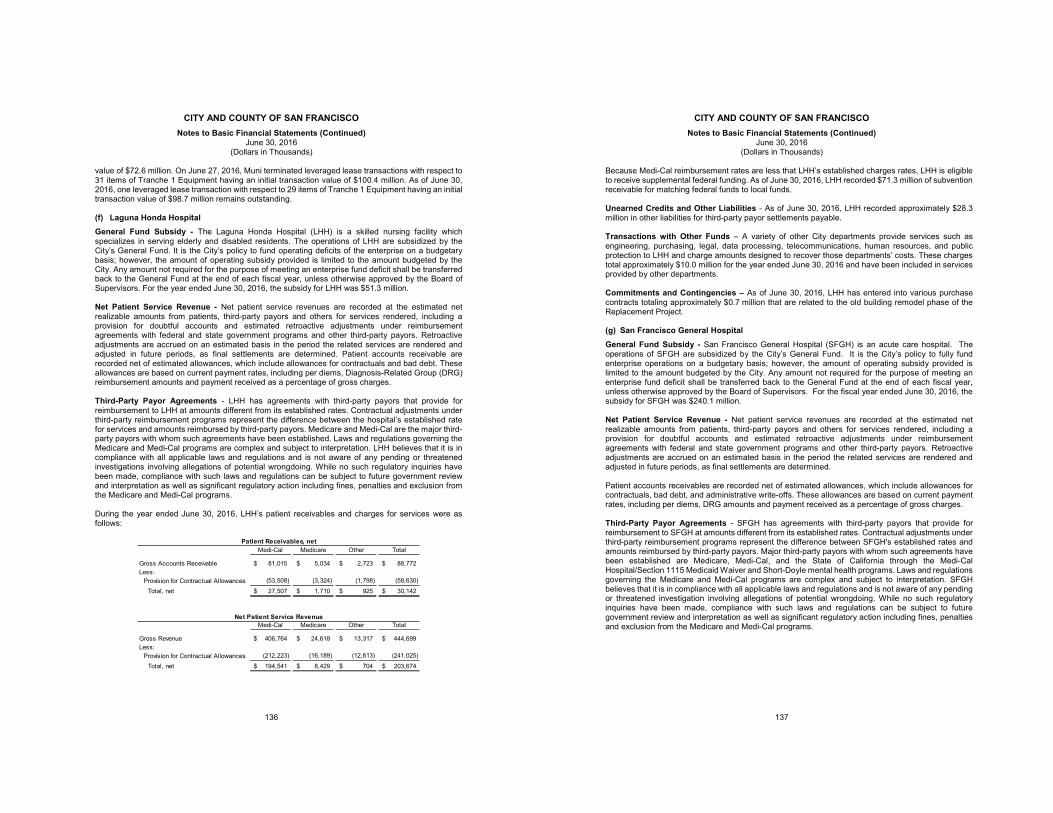
CITY AND COUNTY OF SAN FRANCISCO Notes to Basic Financial Statements (Continued)
June 30, 2016 (Dollars in Thousands)
136
value of $72.6 million. On June 27, 2016, Muni terminated leveraged lease transactions with respect to 31 items of Tranche 1 Equipment having an initial transaction value of $100.4 million. As of June 30, 2016, one leveraged lease transaction with respect to 29 items of Tranche 1 Equipment having an initial transaction value of $98.7 million remains outstanding. (f) Laguna Honda Hospital General Fund Subsidy - The Laguna Honda Hospital (LHH) is a skilled nursing facility which specializes in serving elderly and disabled residents. The operations of LHH are subsidized by the City’s General Fund. It is the City’s policy to fund operating deficits of the enterprise on a budgetary basis; however, the amount of operating subsidy provided is limited to the amount budgeted by the City. Any amount not required for the purpose of meeting an enterprise fund deficit shall be transferred back to the General Fund at the end of each fiscal year, unless otherwise approved by the Board of Supervisors. For the year ended June 30, 2016, the subsidy for LHH was $51.3 million. Net Patient Service Revenue - Net patient service revenues are recorded at the estimated net realizable amounts from patients, third-party payors and others for services rendered, including a provision for doubtful accounts and estimated retroactive adjustments under reimbursement agreements with federal and state government programs and other third-party payors. Retroactive adjustments are accrued on an estimated basis in the period the related services are rendered and adjusted in future periods, as final settlements are determined. Patient accounts receivable are recorded net of estimated allowances, which include allowances for contractuals and bad debt. These allowances are based on current payment rates, including per diems, Diagnosis-Related Group (DRG) reimbursement amounts and payment received as a percentage of gross charges. Third-Party Payor Agreements - LHH has agreements with third-party payors that provide for reimbursement to LHH at amounts different from its established rates. Contractual adjustments under third-party reimbursement programs represent the difference between the hospital’s established rate for services and amounts reimbursed by third-party payors. Medicare and Medi-Cal are the major third-party payors with whom such agreements have been established. Laws and regulations governing the Medicare and Medi-Cal programs are complex and subject to interpretation. LHH believes that it is in compliance with all applicable laws and regulations and is not aware of any pending or threatened investigations involving allegations of potential wrongdoing. While no such regulatory inquiries have been made, compliance with such laws and regulations can be subject to future government review and interpretation as well as significant regulatory action including fines, penalties and exclusion from the Medicare and Medi-Cal programs. During the year ended June 30, 2016, LHH’s patient receivables and charges for services were as follows:
Medi-Cal Medicare Other Total
Gross Accounts Receivable 81,015$ 5,034$ 2,723$ 88,772$ Less:
Provision for Contractual Allowances (53,508) (3,324) (1,798) (58,630) Total, net 27,507$ 1,710$ 925$ 30,142$
Medi-Cal Medicare Other Total
Gross Revenue 406,764$ 24,618$ 13,317$ 444,699$ Less:
Provision for Contractual Allowances (212,223) (16,189) (12,613) (241,025) Total, net 194,541$ 8,429$ 704$ 203,674$
Patient Receivables, net
Net Patient Service Revenue
CITY AND COUNTY OF SAN FRANCISCO Notes to Basic Financial Statements (Continued)
June 30, 2016 (Dollars in Thousands)
137
Because Medi-Cal reimbursement rates are less that LHH’s established charges rates, LHH is eligible to receive supplemental federal funding. As of June 30, 2016, LHH recorded $71.3 million of subvention receivable for matching federal funds to local funds. Unearned Credits and Other Liabilities - As of June 30, 2016, LHH recorded approximately $28.3 million in other liabilities for third-party payor settlements payable. Transactions with Other Funds – A variety of other City departments provide services such as engineering, purchasing, legal, data processing, telecommunications, human resources, and public protection to LHH and charge amounts designed to recover those departments’ costs. These charges total approximately $10.0 million for the year ended June 30, 2016 and have been included in services provided by other departments.
Commitments and Contingencies – As of June 30, 2016, LHH has entered into various purchase contracts totaling approximately $0.7 million that are related to the old building remodel phase of the Replacement Project. (g) San Francisco General Hospital General Fund Subsidy - San Francisco General Hospital (SFGH) is an acute care hospital. The operations of SFGH are subsidized by the City’s General Fund. It is the City’s policy to fully fund enterprise operations on a budgetary basis; however, the amount of operating subsidy provided is limited to the amount budgeted by the City. Any amount not required for the purpose of meeting an enterprise fund deficit shall be transferred back to the General Fund at the end of each fiscal year, unless otherwise approved by the Board of Supervisors. For the fiscal year ended June 30, 2016, the subsidy for SFGH was $240.1 million. Net Patient Service Revenue - Net patient service revenues are recorded at the estimated net realizable amounts from patients, third-party payors and others for services rendered, including a provision for doubtful accounts and estimated retroactive adjustments under reimbursement agreements with federal and state government programs and other third-party payors. Retroactive adjustments are accrued on an estimated basis in the period the related services are rendered and adjusted in future periods, as final settlements are determined. Patient accounts receivables are recorded net of estimated allowances, which include allowances for contractuals, bad debt, and administrative write-offs. These allowances are based on current payment rates, including per diems, DRG amounts and payment received as a percentage of gross charges. Third-Party Payor Agreements - SFGH has agreements with third-party payors that provide for reimbursement to SFGH at amounts different from its established rates. Contractual adjustments under third-party reimbursement programs represent the difference between SFGH's established rates and amounts reimbursed by third-party payors. Major third-party payors with whom such agreements have been established are Medicare, Medi-Cal, and the State of California through the Medi-Cal Hospital/Section 1115 Medicaid Waiver and Short-Doyle mental health programs. Laws and regulations governing the Medicare and Medi-Cal programs are complex and subject to interpretation. SFGH believes that it is in compliance with all applicable laws and regulations and is not aware of any pending or threatened investigation involving allegations of potential wrongdoing. While no such regulatory inquiries have been made, compliance with such laws and regulations can be subject to future government review and interpretation as well as significant regulatory action including fines, penalties and exclusion from the Medicare and Medi-Cal programs.
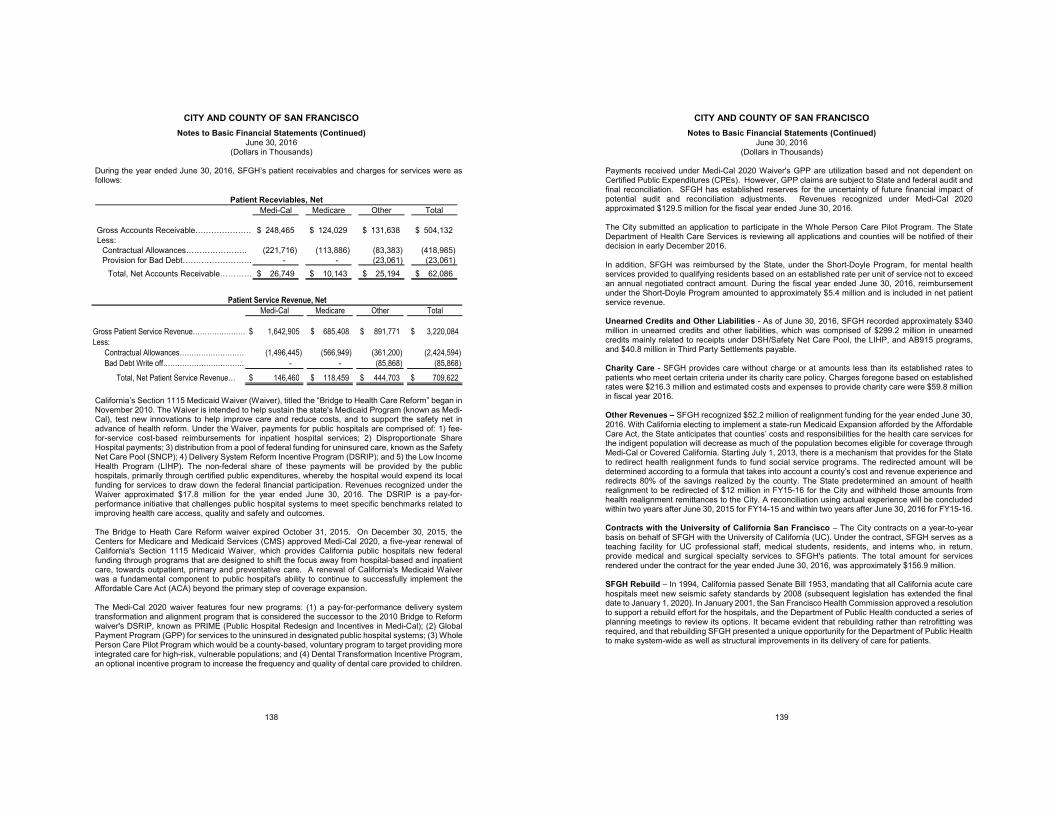
CITY AND COUNTY OF SAN FRANCISCO Notes to Basic Financial Statements (Continued)
June 30, 2016 (Dollars in Thousands)
138
During the year ended June 30, 2016, SFGH’s patient receivables and charges for services were as follows:
Medi-Cal Medicare Other Total
Gross Accounts Receivable…………………. 248,465$ 124,029$ 131,638$ 504,132$ Less:
Contractual Allowances………………….. (221,716) (113,886) (83,383) (418,985) Provision for Bad Debt……………………… - - (23,061) (23,061)
Total, Net Accounts Receivable………… 26,749$ 10,143$ 25,194$ 62,086$
Patient Receviables, Net
Medi-Cal Medicare Other Total
Gross Patient Service Revenue…………………. 1,642,905$ 685,408$ 891,771$ 3,220,084$ Less:
Contractual Allowances……………………… (1,496,445) (566,949) (361,200) (2,424,594) Bad Debt Write off……………………………. - - (85,868) (85,868)
Total, Net Patient Service Revenue… 146,460$ 118,459$ 444,703$ 709,622$
Patient Service Revenue, Net
California’s Section 1115 Medicaid Waiver (Waiver), titled the “Bridge to Health Care Reform” began in November 2010. The Waiver is intended to help sustain the state's Medicaid Program (known as Medi-Cal), test new innovations to help improve care and reduce costs, and to support the safety net in advance of health reform. Under the Waiver, payments for public hospitals are comprised of: 1) fee-for-service cost-based reimbursements for inpatient hospital services; 2) Disproportionate Share Hospital payments; 3) distribution from a pool of federal funding for uninsured care, known as the Safety Net Care Pool (SNCP); 4) Delivery System Reform Incentive Program (DSRIP); and 5) the Low Income Health Program (LIHP). The non-federal share of these payments will be provided by the public hospitals, primarily through certified public expenditures, whereby the hospital would expend its local funding for services to draw down the federal financial participation. Revenues recognized under the Waiver approximated $17.8 million for the year ended June 30, 2016. The DSRIP is a pay-for-performance initiative that challenges public hospital systems to meet specific benchmarks related to improving health care access, quality and safety and outcomes. The Bridge to Heath Care Reform waiver expired October 31, 2015. On December 30, 2015, the Centers for Medicare and Medicaid Services (CMS) approved Medi-Cal 2020, a five-year renewal of California's Section 1115 Medicaid Waiver, which provides California public hospitals new federal funding through programs that are designed to shift the focus away from hospital-based and inpatient care, towards outpatient, primary and preventative care. A renewal of California's Medicaid Waiver was a fundamental component to public hospital's ability to continue to successfully implement the Affordable Care Act (ACA) beyond the primary step of coverage expansion. The Medi-Cal 2020 waiver features four new programs: (1) a pay-for-performance delivery system transformation and alignment program that is considered the successor to the 2010 Bridge to Reform waiver's DSRIP, known as PRIME (Public Hospital Redesign and Incentives in Medi-Cal); (2) Global Payment Program (GPP) for services to the uninsured in designated public hospital systems; (3) Whole Person Care Pilot Program which would be a county-based, voluntary program to target providing more integrated care for high-risk, vulnerable populations; and (4) Dental Transformation Incentive Program, an optional incentive program to increase the frequency and quality of dental care provided to children.
CITY AND COUNTY OF SAN FRANCISCO Notes to Basic Financial Statements (Continued)
June 30, 2016 (Dollars in Thousands)
139
Payments received under Medi-Cal 2020 Waiver's GPP are utilization based and not dependent on Certified Public Expenditures (CPEs). However, GPP claims are subject to State and federal audit and final reconciliation. SFGH has established reserves for the uncertainty of future financial impact of potential audit and reconciliation adjustments. Revenues recognized under Medi-Cal 2020 approximated $129.5 million for the fiscal year ended June 30, 2016. The City submitted an application to participate in the Whole Person Care Pilot Program. The State Department of Health Care Services is reviewing all applications and counties will be notified of their decision in early December 2016. In addition, SFGH was reimbursed by the State, under the Short-Doyle Program, for mental health services provided to qualifying residents based on an established rate per unit of service not to exceed an annual negotiated contract amount. During the fiscal year ended June 30, 2016, reimbursement under the Short-Doyle Program amounted to approximately $5.4 million and is included in net patient service revenue. Unearned Credits and Other Liabilities - As of June 30, 2016, SFGH recorded approximately $340 million in unearned credits and other liabilities, which was comprised of $299.2 million in unearned credits mainly related to receipts under DSH/Safety Net Care Pool, the LIHP, and AB915 programs, and $40.8 million in Third Party Settlements payable. Charity Care - SFGH provides care without charge or at amounts less than its established rates to patients who meet certain criteria under its charity care policy. Charges foregone based on established rates were $216.3 million and estimated costs and expenses to provide charity care were $59.8 million in fiscal year 2016. Other Revenues – SFGH recognized $52.2 million of realignment funding for the year ended June 30, 2016. With California electing to implement a state-run Medicaid Expansion afforded by the Affordable Care Act, the State anticipates that counties’ costs and responsibilities for the health care services for the indigent population will decrease as much of the population becomes eligible for coverage through Medi-Cal or Covered California. Starting July 1, 2013, there is a mechanism that provides for the State to redirect health realignment funds to fund social service programs. The redirected amount will be determined according to a formula that takes into account a county’s cost and revenue experience and redirects 80% of the savings realized by the county. The State predetermined an amount of health realignment to be redirected of $12 million in FY15-16 for the City and withheld those amounts from health realignment remittances to the City. A reconciliation using actual experience will be concluded within two years after June 30, 2015 for FY14-15 and within two years after June 30, 2016 for FY15-16. Contracts with the University of California San Francisco – The City contracts on a year-to-year basis on behalf of SFGH with the University of California (UC). Under the contract, SFGH serves as a teaching facility for UC professional staff, medical students, residents, and interns who, in return, provide medical and surgical specialty services to SFGH's patients. The total amount for services rendered under the contract for the year ended June 30, 2016, was approximately $156.9 million. SFGH Rebuild – In 1994, California passed Senate Bill 1953, mandating that all California acute care hospitals meet new seismic safety standards by 2008 (subsequent legislation has extended the final date to January 1, 2020). In January 2001, the San Francisco Health Commission approved a resolution to support a rebuild effort for the hospitals, and the Department of Public Health conducted a series of planning meetings to review its options. It became evident that rebuilding rather than retrofitting was required, and that rebuilding SFGH presented a unique opportunity for the Department of Public Health to make system-wide as well as structural improvements in its delivery of care for patients.
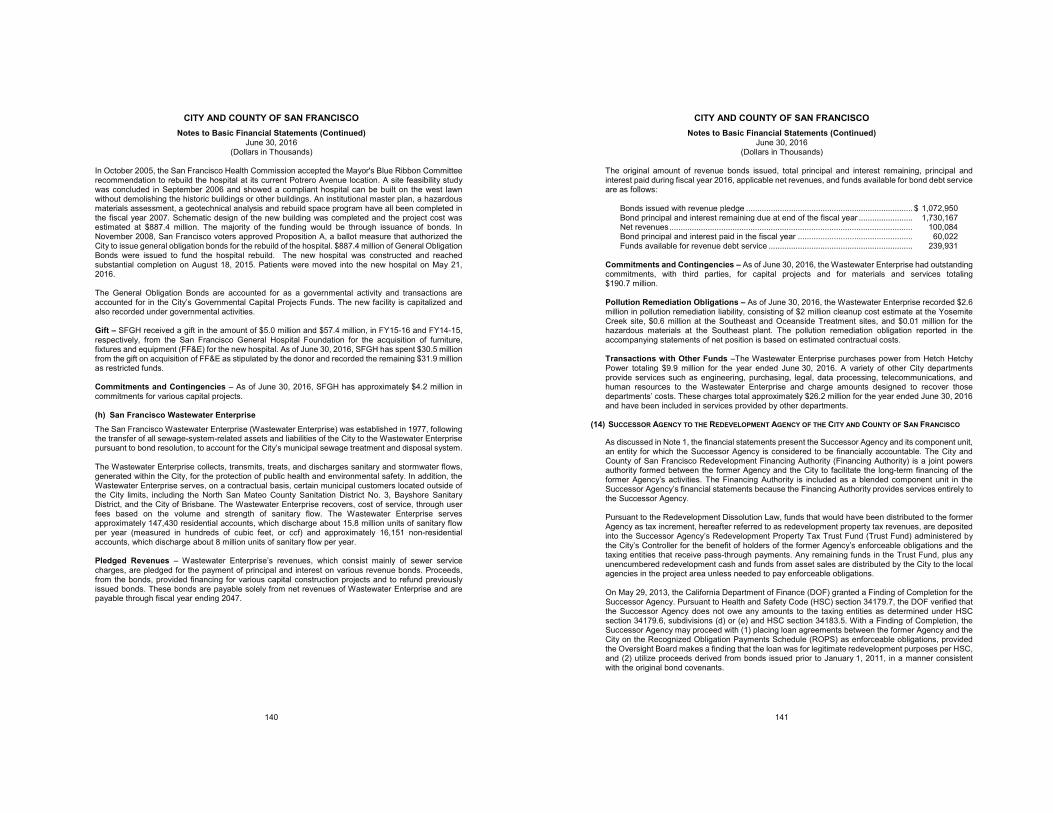
CITY AND COUNTY OF SAN FRANCISCO Notes to Basic Financial Statements (Continued)
June 30, 2016 (Dollars in Thousands)
140
In October 2005, the San Francisco Health Commission accepted the Mayor's Blue Ribbon Committee recommendation to rebuild the hospital at its current Potrero Avenue location. A site feasibility study was concluded in September 2006 and showed a compliant hospital can be built on the west lawn without demolishing the historic buildings or other buildings. An institutional master plan, a hazardous materials assessment, a geotechnical analysis and rebuild space program have all been completed in the fiscal year 2007. Schematic design of the new building was completed and the project cost was estimated at $887.4 million. The majority of the funding would be through issuance of bonds. In November 2008, San Francisco voters approved Proposition A, a ballot measure that authorized the City to issue general obligation bonds for the rebuild of the hospital. $887.4 million of General Obligation Bonds were issued to fund the hospital rebuild. The new hospital was constructed and reached substantial completion on August 18, 2015. Patients were moved into the new hospital on May 21, 2016. The General Obligation Bonds are accounted for as a governmental activity and transactions are accounted for in the City’s Governmental Capital Projects Funds. The new facility is capitalized and also recorded under governmental activities. Gift – SFGH received a gift in the amount of $5.0 million and $57.4 million, in FY15-16 and FY14-15, respectively, from the San Francisco General Hospital Foundation for the acquisition of furniture, fixtures and equipment (FF&E) for the new hospital. As of June 30, 2016, SFGH has spent $30.5 million from the gift on acquisition of FF&E as stipulated by the donor and recorded the remaining $31.9 million as restricted funds. Commitments and Contingencies – As of June 30, 2016, SFGH has approximately $4.2 million in commitments for various capital projects. (h) San Francisco Wastewater Enterprise The San Francisco Wastewater Enterprise (Wastewater Enterprise) was established in 1977, following the transfer of all sewage-system-related assets and liabilities of the City to the Wastewater Enterprise pursuant to bond resolution, to account for the City’s municipal sewage treatment and disposal system. The Wastewater Enterprise collects, transmits, treats, and discharges sanitary and stormwater flows, generated within the City, for the protection of public health and environmental safety. In addition, the Wastewater Enterprise serves, on a contractual basis, certain municipal customers located outside of the City limits, including the North San Mateo County Sanitation District No. 3, Bayshore Sanitary District, and the City of Brisbane. The Wastewater Enterprise recovers, cost of service, through user fees based on the volume and strength of sanitary flow. The Wastewater Enterprise serves approximately 147,430 residential accounts, which discharge about 15.8 million units of sanitary flow per year (measured in hundreds of cubic feet, or ccf) and approximately 16,151 non-residential accounts, which discharge about 8 million units of sanitary flow per year. Pledged Revenues – Wastewater Enterprise’s revenues, which consist mainly of sewer service charges, are pledged for the payment of principal and interest on various revenue bonds. Proceeds, from the bonds, provided financing for various capital construction projects and to refund previously issued bonds. These bonds are payable solely from net revenues of Wastewater Enterprise and are payable through fiscal year ending 2047.
CITY AND COUNTY OF SAN FRANCISCO Notes to Basic Financial Statements (Continued)
June 30, 2016 (Dollars in Thousands)
141
The original amount of revenue bonds issued, total principal and interest remaining, principal and interest paid during fiscal year 2016, applicable net revenues, and funds available for bond debt service are as follows:
Bonds issued with revenue pledge .......................................................................... $ 1,072,950 Bond principal and interest remaining due at end of the fiscal year ........................ 1,730,167 Net revenues ............................................................................................................ 100,084 Bond principal and interest paid in the fiscal year ................................................... 60,022 Funds available for revenue debt service ................................................................ 239,931
Commitments and Contingencies – As of June 30, 2016, the Wastewater Enterprise had outstanding commitments, with third parties, for capital projects and for materials and services totaling $190.7 million. Pollution Remediation Obligations – As of June 30, 2016, the Wastewater Enterprise recorded $2.6 million in pollution remediation liability, consisting of $2 million cleanup cost estimate at the Yosemite Creek site, $0.6 million at the Southeast and Oceanside Treatment sites, and $0.01 million for the hazardous materials at the Southeast plant. The pollution remediation obligation reported in the accompanying statements of net position is based on estimated contractual costs. Transactions with Other Funds –The Wastewater Enterprise purchases power from Hetch Hetchy Power totaling $9.9 million for the year ended June 30, 2016. A variety of other City departments provide services such as engineering, purchasing, legal, data processing, telecommunications, and human resources to the Wastewater Enterprise and charge amounts designed to recover those departments’ costs. These charges total approximately $26.2 million for the year ended June 30, 2016 and have been included in services provided by other departments.
(14) SUCCESSOR AGENCY TO THE REDEVELOPMENT AGENCY OF THE CITY AND COUNTY OF SAN FRANCISCO
As discussed in Note 1, the financial statements present the Successor Agency and its component unit, an entity for which the Successor Agency is considered to be financially accountable. The City and County of San Francisco Redevelopment Financing Authority (Financing Authority) is a joint powers authority formed between the former Agency and the City to facilitate the long-term financing of the former Agency’s activities. The Financing Authority is included as a blended component unit in the Successor Agency’s financial statements because the Financing Authority provides services entirely to the Successor Agency. Pursuant to the Redevelopment Dissolution Law, funds that would have been distributed to the former Agency as tax increment, hereafter referred to as redevelopment property tax revenues, are deposited into the Successor Agency’s Redevelopment Property Tax Trust Fund (Trust Fund) administered by the City’s Controller for the benefit of holders of the former Agency’s enforceable obligations and the taxing entities that receive pass-through payments. Any remaining funds in the Trust Fund, plus any unencumbered redevelopment cash and funds from asset sales are distributed by the City to the local agencies in the project area unless needed to pay enforceable obligations. On May 29, 2013, the California Department of Finance (DOF) granted a Finding of Completion for the Successor Agency. Pursuant to Health and Safety Code (HSC) section 34179.7, the DOF verified that the Successor Agency does not owe any amounts to the taxing entities as determined under HSC section 34179.6, subdivisions (d) or (e) and HSC section 34183.5. With a Finding of Completion, the Successor Agency may proceed with (1) placing loan agreements between the former Agency and the City on the Recognized Obligation Payments Schedule (ROPS) as enforceable obligations, provided the Oversight Board makes a finding that the loan was for legitimate redevelopment purposes per HSC, and (2) utilize proceeds derived from bonds issued prior to January 1, 2011, in a manner consistent with the original bond covenants.
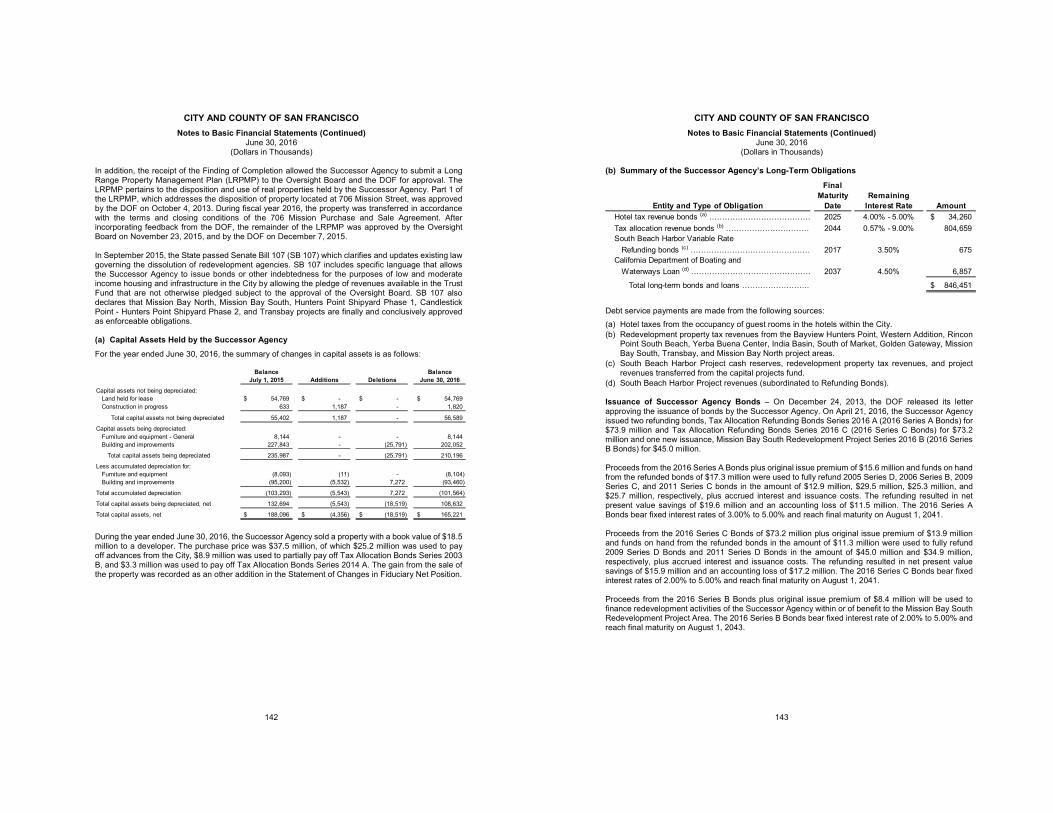
CITY AND COUNTY OF SAN FRANCISCO Notes to Basic Financial Statements (Continued)
June 30, 2016 (Dollars in Thousands)
142
In addition, the receipt of the Finding of Completion allowed the Successor Agency to submit a Long Range Property Management Plan (LRPMP) to the Oversight Board and the DOF for approval. The LRPMP pertains to the disposition and use of real properties held by the Successor Agency. Part 1 of the LRPMP, which addresses the disposition of property located at 706 Mission Street, was approved by the DOF on October 4, 2013. During fiscal year 2016, the property was transferred in accordance with the terms and closing conditions of the 706 Mission Purchase and Sale Agreement. After incorporating feedback from the DOF, the remainder of the LRPMP was approved by the Oversight Board on November 23, 2015, and by the DOF on December 7, 2015. In September 2015, the State passed Senate Bill 107 (SB 107) which clarifies and updates existing law governing the dissolution of redevelopment agencies. SB 107 includes specific language that allows the Successor Agency to issue bonds or other indebtedness for the purposes of low and moderate income housing and infrastructure in the City by allowing the pledge of revenues available in the Trust Fund that are not otherwise pledged subject to the approval of the Oversight Board. SB 107 also declares that Mission Bay North, Mission Bay South, Hunters Point Shipyard Phase 1, Candlestick Point - Hunters Point Shipyard Phase 2, and Transbay projects are finally and conclusively approved as enforceable obligations. (a) Capital Assets Held by the Successor Agency For the year ended June 30, 2016, the summary of changes in capital assets is as follows:
During the year ended June 30, 2016, the Successor Agency sold a property with a book value of $18.5 million to a developer. The purchase price was $37.5 million, of which $25.2 million was used to pay off advances from the City, $8.9 million was used to partially pay off Tax Allocation Bonds Series 2003 B, and $3.3 million was used to pay off Tax Allocation Bonds Series 2014 A. The gain from the sale of the property was recorded as an other addition in the Statement of Changes in Fiduciary Net Position.
Balance BalanceJuly 1, 2015 Additions Deletions June 30, 2016
Capital assets not being depreciated: Land held for lease 54,769$ -$ -$ 54,769$ Construction in progress 633 1,187 - 1,820
Total capital assets not being depreciated 55,402 1,187 - 56,589
Capital assets being depreciated:Furniture and equipment - General 8,144 - - 8,144 Building and improvements 227,843 - (25,791) 202,052
Total capital assets being depreciated 235,987 - (25,791) 210,196
Less accumulated depreciation for:Furniture and equipment (8,093) (11) - (8,104) Building and improvements (95,200) (5,532) 7,272 (93,460)
Total accumulated depreciation (103,293) (5,543) 7,272 (101,564)
Total capital assets being depreciated, net 132,694 (5,543) (18,519) 108,632
Total capital assets, net 188,096$ (4,356)$ (18,519)$ 165,221$
CITY AND COUNTY OF SAN FRANCISCO Notes to Basic Financial Statements (Continued)
June 30, 2016 (Dollars in Thousands)
143
(b) Summary of the Successor Agency’s Long-Term Obligations
Debt service payments are made from the following sources: (a) Hotel taxes from the occupancy of guest rooms in the hotels within the City. (b) Redevelopment property tax revenues from the Bayview Hunters Point, Western Addition, Rincon
Point South Beach, Yerba Buena Center, India Basin, South of Market, Golden Gateway, Mission Bay South, Transbay, and Mission Bay North project areas.
(c) South Beach Harbor Project cash reserves, redevelopment property tax revenues, and project revenues transferred from the capital projects fund.
(d) South Beach Harbor Project revenues (subordinated to Refunding Bonds). Issuance of Successor Agency Bonds – On December 24, 2013, the DOF released its letter approving the issuance of bonds by the Successor Agency. On April 21, 2016, the Successor Agency issued two refunding bonds, Tax Allocation Refunding Bonds Series 2016 A (2016 Series A Bonds) for $73.9 million and Tax Allocation Refunding Bonds Series 2016 C (2016 Series C Bonds) for $73.2 million and one new issuance, Mission Bay South Redevelopment Project Series 2016 B (2016 Series B Bonds) for $45.0 million. Proceeds from the 2016 Series A Bonds plus original issue premium of $15.6 million and funds on hand from the refunded bonds of $17.3 million were used to fully refund 2005 Series D, 2006 Series B, 2009 Series C, and 2011 Series C bonds in the amount of $12.9 million, $29.5 million, $25.3 million, and $25.7 million, respectively, plus accrued interest and issuance costs. The refunding resulted in net present value savings of $19.6 million and an accounting loss of $11.5 million. The 2016 Series A Bonds bear fixed interest rates of 3.00% to 5.00% and reach final maturity on August 1, 2041. Proceeds from the 2016 Series C Bonds of $73.2 million plus original issue premium of $13.9 million and funds on hand from the refunded bonds in the amount of $11.3 million were used to fully refund 2009 Series D Bonds and 2011 Series D Bonds in the amount of $45.0 million and $34.9 million, respectively, plus accrued interest and issuance costs. The refunding resulted in net present value savings of $15.9 million and an accounting loss of $17.2 million. The 2016 Series C Bonds bear fixed interest rates of 2.00% to 5.00% and reach final maturity on August 1, 2041. Proceeds from the 2016 Series B Bonds plus original issue premium of $8.4 million will be used to finance redevelopment activities of the Successor Agency within or of benefit to the Mission Bay South Redevelopment Project Area. The 2016 Series B Bonds bear fixed interest rate of 2.00% to 5.00% and reach final maturity on August 1, 2043.
FinalMaturity Remaining
Entity and Type of Obligation Date Interest Rate AmountHotel tax revenue bonds (a) ………………………………… 2025 4.00% - 5.00% 34,260$ Tax allocation revenue bonds (b) …………………………… 2044 0.57% - 9.00% 804,659 South Beach Harbor Variable Rate
Refunding bonds (c) ………………………………………… 2017 3.50% 675 California Department of Boating and
Waterways Loan (d) ………………………………………… 2037 4.50% 6,857
Total long-term bonds and loans …………………….. 846,451$
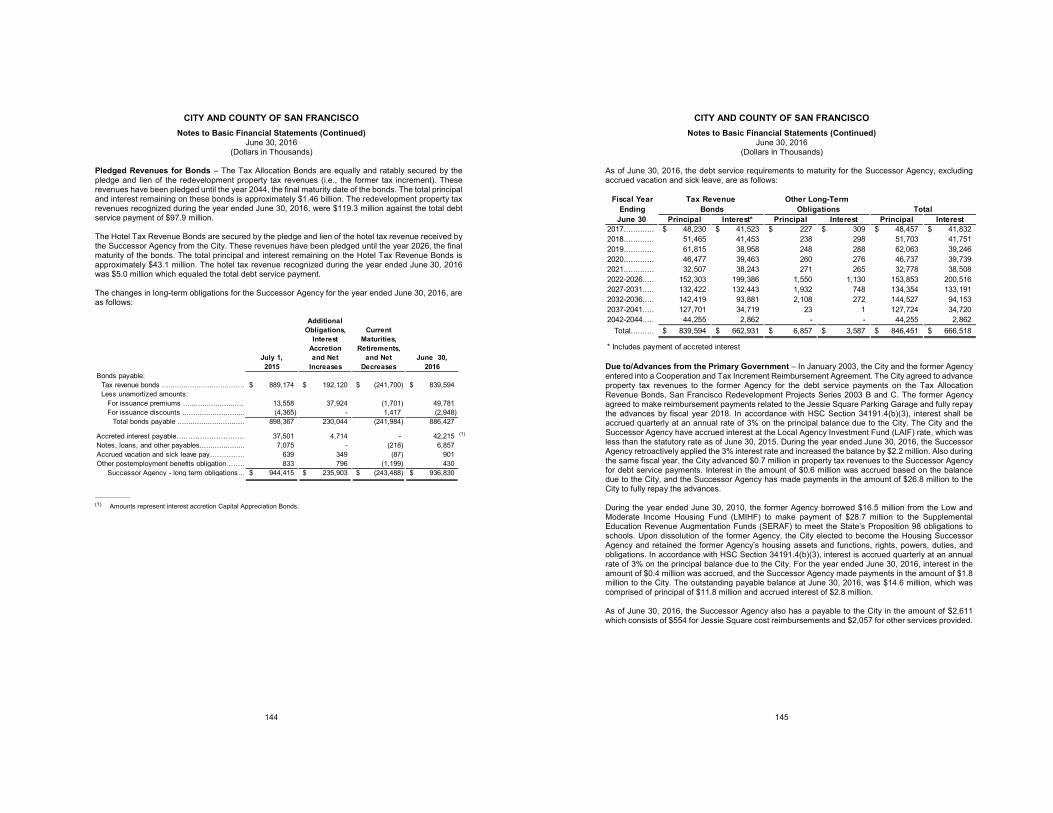
CITY AND COUNTY OF SAN FRANCISCO Notes to Basic Financial Statements (Continued)
June 30, 2016 (Dollars in Thousands)
144
Pledged Revenues for Bonds – The Tax Allocation Bonds are equally and ratably secured by the pledge and lien of the redevelopment property tax revenues (i.e., the former tax increment). These revenues have been pledged until the year 2044, the final maturity date of the bonds. The total principal and interest remaining on these bonds is approximately $1.46 billion. The redevelopment property tax revenues recognized during the year ended June 30, 2016, were $119.3 million against the total debt service payment of $97.9 million. The Hotel Tax Revenue Bonds are secured by the pledge and lien of the hotel tax revenue received by the Successor Agency from the City. These revenues have been pledged until the year 2026, the final maturity of the bonds. The total principal and interest remaining on the Hotel Tax Revenue Bonds is approximately $43.1 million. The hotel tax revenue recognized during the year ended June 30, 2016 was $5.0 million which equaled the total debt service payment. The changes in long-term obligations for the Successor Agency for the year ended June 30, 2016, are as follows:
____________
(1) Amounts represent interest accretion Capital Appreciation Bonds.
Additional Obligations, Current Interest Maturities, Accretion Retirements,
July 1, and Net and Net June 30,2015 Increases Decreases 2016
Bonds payable: Tax revenue bonds ..................................…… 889,174$ 192,120$ (241,700)$ 839,594$ Less unamortized amounts:
For issuance premiums ............................ 13,558 37,924 (1,701) 49,781 For issuance discounts ............................. (4,365) - 1,417 (2,948)
Total bonds payable ............................... 898,367 230,044 (241,984) 886,427
Accreted interest payable………………………… 37,501 4,714 - 42,215 (1)
Notes, loans, and other payables..................... 7,075 - (218) 6,857 Accrued vacation and sick leave pay…………… 639 349 (87) 901 Other postemployment benefits obligation……… 833 796 (1,199) 430
Successor Agency - long term obligations… 944,415$ 235,903$ (243,488)$ 936,830$
CITY AND COUNTY OF SAN FRANCISCO Notes to Basic Financial Statements (Continued)
June 30, 2016 (Dollars in Thousands)
145
As of June 30, 2016, the debt service requirements to maturity for the Successor Agency, excluding accrued vacation and sick leave, are as follows:
Due to/Advances from the Primary Government – In January 2003, the City and the former Agency entered into a Cooperation and Tax Increment Reimbursement Agreement. The City agreed to advance property tax revenues to the former Agency for the debt service payments on the Tax Allocation Revenue Bonds, San Francisco Redevelopment Projects Series 2003 B and C. The former Agency agreed to make reimbursement payments related to the Jessie Square Parking Garage and fully repay the advances by fiscal year 2018. In accordance with HSC Section 34191.4(b)(3), interest shall be accrued quarterly at an annual rate of 3% on the principal balance due to the City. The City and the Successor Agency have accrued interest at the Local Agency Investment Fund (LAIF) rate, which was less than the statutory rate as of June 30, 2015. During the year ended June 30, 2016, the Successor Agency retroactively applied the 3% interest rate and increased the balance by $2.2 million. Also during the same fiscal year, the City advanced $0.7 million in property tax revenues to the Successor Agency for debt service payments. Interest in the amount of $0.6 million was accrued based on the balance due to the City, and the Successor Agency has made payments in the amount of $26.8 million to the City to fully repay the advances. During the year ended June 30, 2010, the former Agency borrowed $16.5 million from the Low and Moderate Income Housing Fund (LMIHF) to make payment of $28.7 million to the Supplemental Education Revenue Augmentation Funds (SERAF) to meet the State’s Proposition 98 obligations to schools. Upon dissolution of the former Agency, the City elected to become the Housing Successor Agency and retained the former Agency’s housing assets and functions, rights, powers, duties, and obligations. In accordance with HSC Section 34191.4(b)(3), interest is accrued quarterly at an annual rate of 3% on the principal balance due to the City. For the year ended June 30, 2016, interest in the amount of $0.4 million was accrued, and the Successor Agency made payments in the amount of $1.8 million to the City. The outstanding payable balance at June 30, 2016, was $14.6 million, which was comprised of principal of $11.8 million and accrued interest of $2.8 million. As of June 30, 2016, the Successor Agency also has a payable to the City in the amount of $2,611 which consists of $554 for Jessie Square cost reimbursements and $2,057 for other services provided.
Fiscal Year Tax Revenue Other Long-TermEnding Bonds Obligations Total
June 30 Principal Interest* Principal Interest Principal Interest2017............. 48,230$ 41,523$ 227$ 309$ 48,457$ 41,832$ 2018............. 51,465 41,453 238 298 51,703 41,751 2019............. 61,815 38,958 248 288 62,063 39,246 2020............. 46,477 39,463 260 276 46,737 39,739 2021............. 32,507 38,243 271 265 32,778 38,508 2022-2026..... 152,303 199,386 1,550 1,130 153,853 200,516 2027-2031..... 132,422 132,443 1,932 748 134,354 133,191 2032-2036..... 142,419 93,881 2,108 272 144,527 94,153 2037-2041..... 127,701 34,719 23 1 127,724 34,720 2042-2044..... 44,255 2,862 - - 44,255 2,862
Total.......... 839,594$ 662,931$ 6,857$ 3,587$ 846,451$ 666,518$
* Includes payment of accreted interest
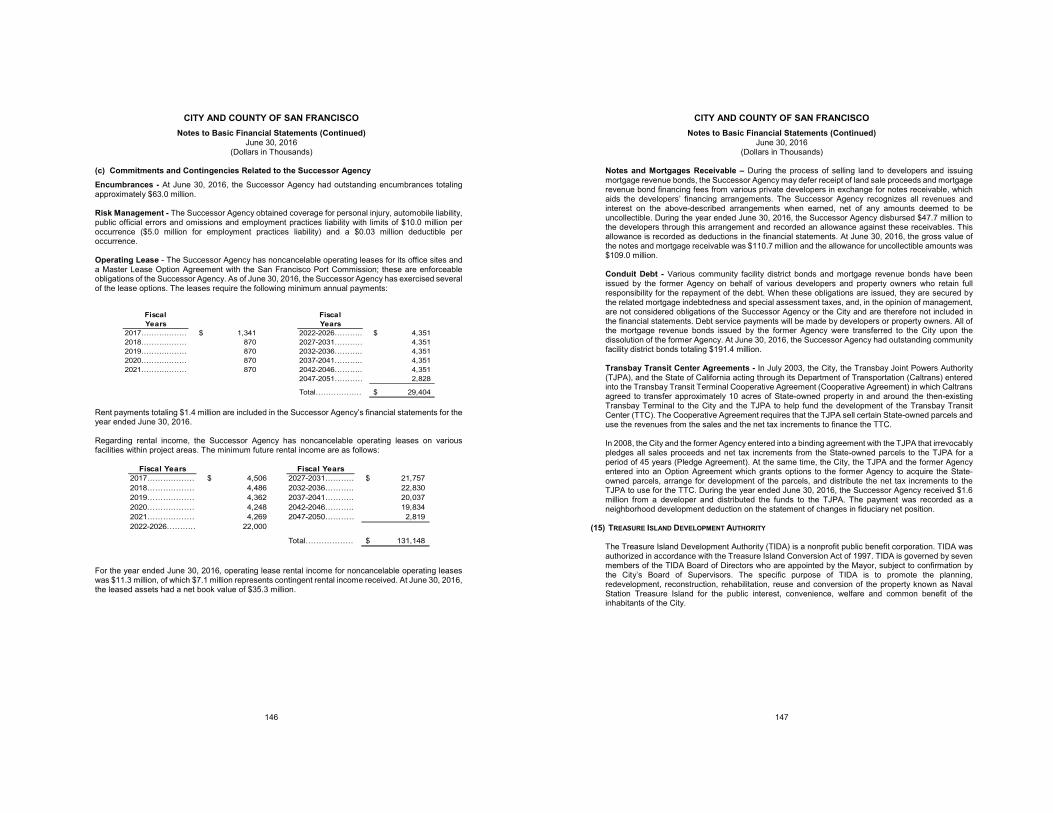
CITY AND COUNTY OF SAN FRANCISCO Notes to Basic Financial Statements (Continued)
June 30, 2016 (Dollars in Thousands)
146
(c) Commitments and Contingencies Related to the Successor Agency Encumbrances - At June 30, 2016, the Successor Agency had outstanding encumbrances totaling approximately $63.0 million. Risk Management - The Successor Agency obtained coverage for personal injury, automobile liability, public official errors and omissions and employment practices liability with limits of $10.0 million per occurrence ($5.0 million for employment practices liability) and a $0.03 million deductible per occurrence. Operating Lease - The Successor Agency has noncancelable operating leases for its office sites and a Master Lease Option Agreement with the San Francisco Port Commission; these are enforceable obligations of the Successor Agency. As of June 30, 2016, the Successor Agency has exercised several of the lease options. The leases require the following minimum annual payments:
Fiscal FiscalYears Years
2017………..……… 1,341$ 2022-2026……….. 4,351$ 2018………..……… 870 2027-2031……….… 4,351 2019………..……… 870 2032-2036……….. 4,351 2020………..……… 870 2037-2041……….. 4,351 2021………..……… 870 2042-2046……….. 4,351
2047-2051………… 2,828
Total…………….… 29,404$ Rent payments totaling $1.4 million are included in the Successor Agency’s financial statements for the year ended June 30, 2016. Regarding rental income, the Successor Agency has noncancelable operating leases on various facilities within project areas. The minimum future rental income are as follows:
Fiscal Years Fiscal Years2017………..……… 4,506$ 2027-2031……….… 21,757$ 2018………..……… 4,486 2032-2036……….. 22,830 2019………..……… 4,362 2037-2041……….. 20,037 2020………..……… 4,248 2042-2046……….. 19,834 2021………..……… 4,269 2047-2050………… 2,819 2022-2026……….… 22,000
Total……………… 131,148$
For the year ended June 30, 2016, operating lease rental income for noncancelable operating leases was $11.3 million, of which $7.1 million represents contingent rental income received. At June 30, 2016, the leased assets had a net book value of $35.3 million.
CITY AND COUNTY OF SAN FRANCISCO Notes to Basic Financial Statements (Continued)
June 30, 2016 (Dollars in Thousands)
147
Notes and Mortgages Receivable – During the process of selling land to developers and issuing mortgage revenue bonds, the Successor Agency may defer receipt of land sale proceeds and mortgage revenue bond financing fees from various private developers in exchange for notes receivable, which aids the developers’ financing arrangements. The Successor Agency recognizes all revenues and interest on the above-described arrangements when earned, net of any amounts deemed to be uncollectible. During the year ended June 30, 2016, the Successor Agency disbursed $47.7 million to the developers through this arrangement and recorded an allowance against these receivables. This allowance is recorded as deductions in the financial statements. At June 30, 2016, the gross value of the notes and mortgage receivable was $110.7 million and the allowance for uncollectible amounts was $109.0 million. Conduit Debt - Various community facility district bonds and mortgage revenue bonds have been issued by the former Agency on behalf of various developers and property owners who retain full responsibility for the repayment of the debt. When these obligations are issued, they are secured by the related mortgage indebtedness and special assessment taxes, and, in the opinion of management, are not considered obligations of the Successor Agency or the City and are therefore not included in the financial statements. Debt service payments will be made by developers or property owners. All of the mortgage revenue bonds issued by the former Agency were transferred to the City upon the dissolution of the former Agency. At June 30, 2016, the Successor Agency had outstanding community facility district bonds totaling $191.4 million. Transbay Transit Center Agreements - In July 2003, the City, the Transbay Joint Powers Authority (TJPA), and the State of California acting through its Department of Transportation (Caltrans) entered into the Transbay Transit Terminal Cooperative Agreement (Cooperative Agreement) in which Caltrans agreed to transfer approximately 10 acres of State-owned property in and around the then-existing Transbay Terminal to the City and the TJPA to help fund the development of the Transbay Transit Center (TTC). The Cooperative Agreement requires that the TJPA sell certain State-owned parcels and use the revenues from the sales and the net tax increments to finance the TTC. In 2008, the City and the former Agency entered into a binding agreement with the TJPA that irrevocably pledges all sales proceeds and net tax increments from the State-owned parcels to the TJPA for a period of 45 years (Pledge Agreement). At the same time, the City, the TJPA and the former Agency entered into an Option Agreement which grants options to the former Agency to acquire the State-owned parcels, arrange for development of the parcels, and distribute the net tax increments to the TJPA to use for the TTC. During the year ended June 30, 2016, the Successor Agency received $1.6 million from a developer and distributed the funds to the TJPA. The payment was recorded as a neighborhood development deduction on the statement of changes in fiduciary net position.
(15) TREASURE ISLAND DEVELOPMENT AUTHORITY
The Treasure Island Development Authority (TIDA) is a nonprofit public benefit corporation. TIDA was authorized in accordance with the Treasure Island Conversion Act of 1997. TIDA is governed by seven members of the TIDA Board of Directors who are appointed by the Mayor, subject to confirmation by the City’s Board of Supervisors. The specific purpose of TIDA is to promote the planning, redevelopment, reconstruction, rehabilitation, reuse and conversion of the property known as Naval Station Treasure Island for the public interest, convenience, welfare and common benefit of the inhabitants of the City.
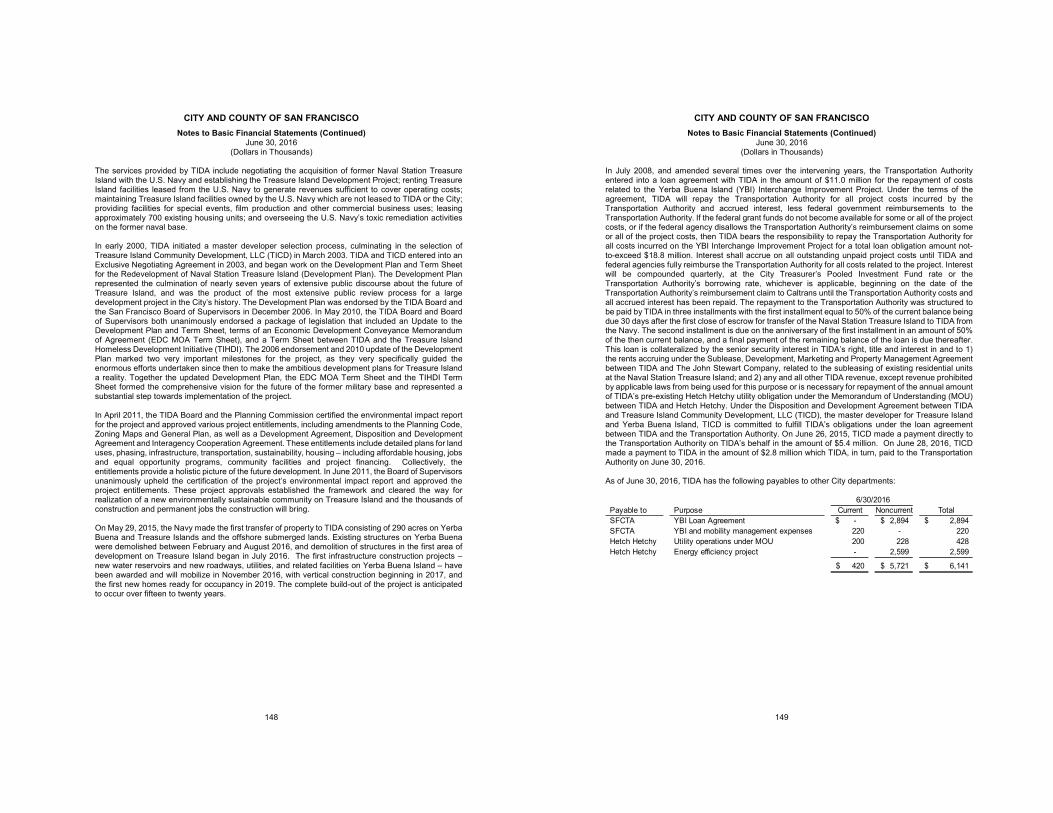
CITY AND COUNTY OF SAN FRANCISCO Notes to Basic Financial Statements (Continued)
June 30, 2016 (Dollars in Thousands)
148
The services provided by TIDA include negotiating the acquisition of former Naval Station Treasure Island with the U.S. Navy and establishing the Treasure Island Development Project; renting Treasure Island facilities leased from the U.S. Navy to generate revenues sufficient to cover operating costs; maintaining Treasure Island facilities owned by the U.S. Navy which are not leased to TIDA or the City; providing facilities for special events, film production and other commercial business uses; leasing approximately 700 existing housing units; and overseeing the U.S. Navy’s toxic remediation activities on the former naval base. In early 2000, TIDA initiated a master developer selection process, culminating in the selection of Treasure Island Community Development, LLC (TICD) in March 2003. TIDA and TICD entered into an Exclusive Negotiating Agreement in 2003, and began work on the Development Plan and Term Sheet for the Redevelopment of Naval Station Treasure Island (Development Plan). The Development Plan represented the culmination of nearly seven years of extensive public discourse about the future of Treasure Island, and was the product of the most extensive public review process for a large development project in the City’s history. The Development Plan was endorsed by the TIDA Board and the San Francisco Board of Supervisors in December 2006. In May 2010, the TIDA Board and Board of Supervisors both unanimously endorsed a package of legislation that included an Update to the Development Plan and Term Sheet, terms of an Economic Development Conveyance Memorandum of Agreement (EDC MOA Term Sheet), and a Term Sheet between TIDA and the Treasure Island Homeless Development Initiative (TIHDI). The 2006 endorsement and 2010 update of the Development Plan marked two very important milestones for the project, as they very specifically guided the enormous efforts undertaken since then to make the ambitious development plans for Treasure Island a reality. Together the updated Development Plan, the EDC MOA Term Sheet and the TIHDI Term Sheet formed the comprehensive vision for the future of the former military base and represented a substantial step towards implementation of the project. In April 2011, the TIDA Board and the Planning Commission certified the environmental impact report for the project and approved various project entitlements, including amendments to the Planning Code, Zoning Maps and General Plan, as well as a Development Agreement, Disposition and Development Agreement and Interagency Cooperation Agreement. These entitlements include detailed plans for land uses, phasing, infrastructure, transportation, sustainability, housing – including affordable housing, jobs and equal opportunity programs, community facilities and project financing. Collectively, the entitlements provide a holistic picture of the future development. In June 2011, the Board of Supervisors unanimously upheld the certification of the project’s environmental impact report and approved the project entitlements. These project approvals established the framework and cleared the way for realization of a new environmentally sustainable community on Treasure Island and the thousands of construction and permanent jobs the construction will bring. On May 29, 2015, the Navy made the first transfer of property to TIDA consisting of 290 acres on Yerba Buena and Treasure Islands and the offshore submerged lands. Existing structures on Yerba Buena were demolished between February and August 2016, and demolition of structures in the first area of development on Treasure Island began in July 2016. The first infrastructure construction projects – new water reservoirs and new roadways, utilities, and related facilities on Yerba Buena Island – have been awarded and will mobilize in November 2016, with vertical construction beginning in 2017, and the first new homes ready for occupancy in 2019. The complete build-out of the project is anticipated to occur over fifteen to twenty years.
CITY AND COUNTY OF SAN FRANCISCO Notes to Basic Financial Statements (Continued)
June 30, 2016 (Dollars in Thousands)
149
In July 2008, and amended several times over the intervening years, the Transportation Authority entered into a loan agreement with TIDA in the amount of $11.0 million for the repayment of costs related to the Yerba Buena Island (YBI) Interchange Improvement Project. Under the terms of the agreement, TIDA will repay the Transportation Authority for all project costs incurred by the Transportation Authority and accrued interest, less federal government reimbursements to the Transportation Authority. If the federal grant funds do not become available for some or all of the project costs, or if the federal agency disallows the Transportation Authority’s reimbursement claims on some or all of the project costs, then TIDA bears the responsibility to repay the Transportation Authority for all costs incurred on the YBI Interchange Improvement Project for a total loan obligation amount not-to-exceed $18.8 million. Interest shall accrue on all outstanding unpaid project costs until TIDA and federal agencies fully reimburse the Transportation Authority for all costs related to the project. Interest will be compounded quarterly, at the City Treasurer’s Pooled Investment Fund rate or the Transportation Authority’s borrowing rate, whichever is applicable, beginning on the date of the Transportation Authority’s reimbursement claim to Caltrans until the Transportation Authority costs and all accrued interest has been repaid. The repayment to the Transportation Authority was structured to be paid by TIDA in three installments with the first installment equal to 50% of the current balance being due 30 days after the first close of escrow for transfer of the Naval Station Treasure Island to TIDA from the Navy. The second installment is due on the anniversary of the first installment in an amount of 50% of the then current balance, and a final payment of the remaining balance of the loan is due thereafter. This loan is collateralized by the senior security interest in TIDA’s right, title and interest in and to 1) the rents accruing under the Sublease, Development, Marketing and Property Management Agreement between TIDA and The John Stewart Company, related to the subleasing of existing residential units at the Naval Station Treasure Island; and 2) any and all other TIDA revenue, except revenue prohibited by applicable laws from being used for this purpose or is necessary for repayment of the annual amount of TIDA’s pre-existing Hetch Hetchy utility obligation under the Memorandum of Understanding (MOU) between TIDA and Hetch Hetchy. Under the Disposition and Development Agreement between TIDA and Treasure Island Community Development, LLC (TICD), the master developer for Treasure Island and Yerba Buena Island, TICD is committed to fulfill TIDA’s obligations under the loan agreement between TIDA and the Transportation Authority. On June 26, 2015, TICD made a payment directly to the Transportation Authority on TIDA’s behalf in the amount of $5.4 million. On June 28, 2016, TICD made a payment to TIDA in the amount of $2.8 million which TIDA, in turn, paid to the Transportation Authority on June 30, 2016.
As of June 30, 2016, TIDA has the following payables to other City departments:
Payable to Purpose Current Noncurrent TotalSFCTA YBI Loan Agreement -$ 2,894$ 2,894$ SFCTA YBI and mobility management expenses 220 - 220 Hetch Hetchy Utility operations under MOU 200 228 428 Hetch Hetchy Energy efficiency project - 2,599 2,599
420$ 5,721$ 6,141$
6/30/2016
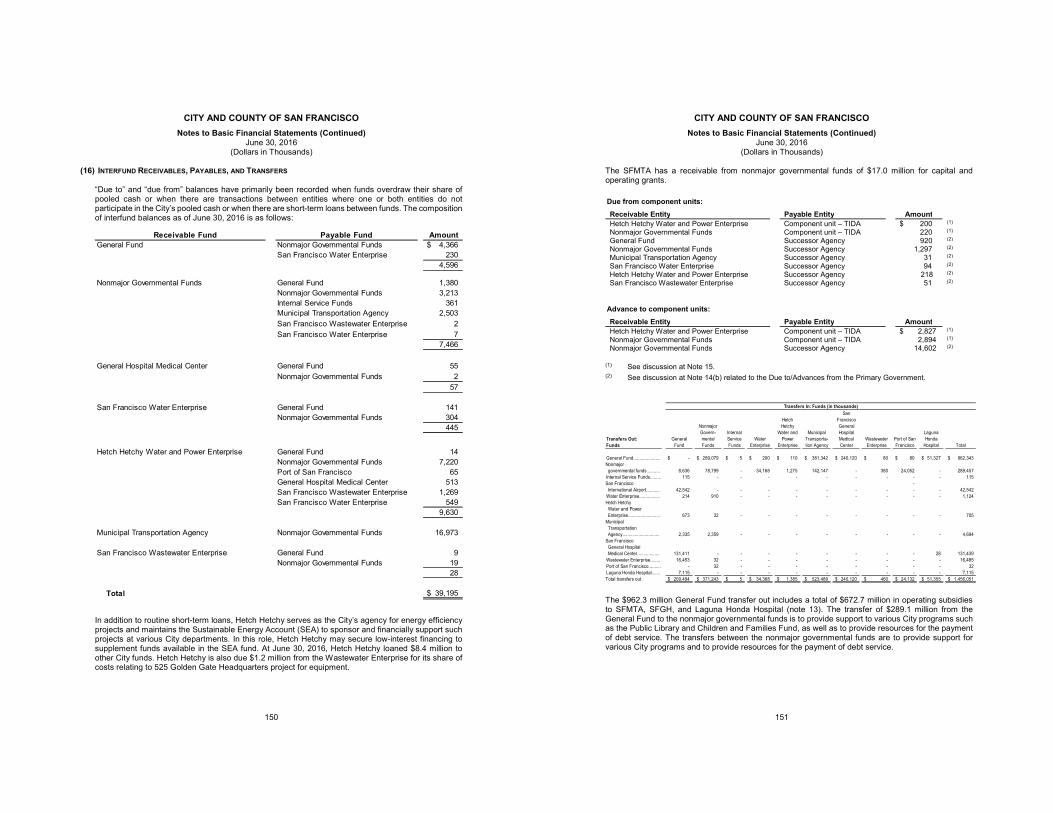
CITY AND COUNTY OF SAN FRANCISCO Notes to Basic Financial Statements (Continued)
June 30, 2016 (Dollars in Thousands)
150
(16) INTERFUND RECEIVABLES, PAYABLES, AND TRANSFERS “Due to” and “due from” balances have primarily been recorded when funds overdraw their share of pooled cash or when there are transactions between entities where one or both entities do not participate in the City’s pooled cash or when there are short-term loans between funds. The composition of interfund balances as of June 30, 2016 is as follows:
In addition to routine short-term loans, Hetch Hetchy serves as the City’s agency for energy efficiency projects and maintains the Sustainable Energy Account (SEA) to sponsor and financially support such projects at various City departments. In this role, Hetch Hetchy may secure low-interest financing to supplement funds available in the SEA fund. At June 30, 2016, Hetch Hetchy loaned $8.4 million to other City funds. Hetch Hetchy is also due $1.2 million from the Wastewater Enterprise for its share of costs relating to 525 Golden Gate Headquarters project for equipment.
Receivable Fund Payable Fund Amount General Fund Nonmajor Governmental Funds 4,366$
San Francisco Water Enterprise 230 4,596
Nonmajor Governmental Funds General Fund 1,380 Nonmajor Governmental Funds 3,213 Internal Service Funds 361 Municipal Transportation Agency 2,503 San Francisco Wastewater Enterprise 2 San Francisco Water Enterprise 7
7,466
General Hospital Medical Center General Fund 55 Nonmajor Governmental Funds 2
57
San Francisco Water Enterprise General Fund 141 Nonmajor Governmental Funds 304
445
Hetch Hetchy Water and Power Enterprise General Fund 14 Nonmajor Governmental Funds 7,220 Port of San Francisco 65 General Hospital Medical Center 513 San Francisco Wastewater Enterprise 1,269 San Francisco Water Enterprise 549
9,630
Municipal Transportation Agency Nonmajor Governmental Funds 16,973
San Francisco Wastewater Enterprise General Fund 9 Nonmajor Governmental Funds 19
28
Total 39,195$
CITY AND COUNTY OF SAN FRANCISCO Notes to Basic Financial Statements (Continued)
June 30, 2016 (Dollars in Thousands)
151
The SFMTA has a receivable from nonmajor governmental funds of $17.0 million for capital and operating grants.
Due from component units:
Receivable Entity Payable Entity Amount Hetch Hetchy Water and Power Enterprise Component unit – TIDA $ 200 (1) Nonmajor Governmental Funds Component unit – TIDA 220 (1) General Fund Successor Agency 920 (2) Nonmajor Governmental Funds Successor Agency 1,297 (2) Municipal Transportation Agency Successor Agency 31 (2) San Francisco Water Enterprise Successor Agency 94 (2)
Hetch Hetchy Water and Power Enterprise Successor Agency 218 (2)
San Francisco Wastewater Enterprise Successor Agency 51 (2)
Advance to component units:
Receivable Entity Payable Entity Amount Hetch Hetchy Water and Power Enterprise Component unit – TIDA $ 2,827 (1) Nonmajor Governmental Funds Component unit – TIDA 2,894 (1) Nonmajor Governmental Funds Successor Agency 14,602 (2)
(1) See discussion at Note 15. (2) See discussion at Note 14(b) related to the Due to/Advances from the Primary Government.
General Fund
Nonmajor Govern-mentalFunds
Internal Service Funds
Water Enterprise
Hetch Hetchy
Water and Power
Enterprise
Municipal Transporta-tion Agency
San Francisco General Hospital Medical Center
Wastewater Enterprise
Port of San Francisco
Laguna Honda
Hospital Total
-$ 289,079$ 5$ 200$ 110$ 381,342$ 240,120$ 80$ 80$ 51,327$ 962,343$ Nonmajor
governmental funds........... 8,636 78,799 - 34,168 1,275 142,147 - 380 24,052 - 289,457 115 - - - - - - - - - 115
San Francisco - International Airport........... 42,542 - - - - - - - - - 42,542
214 910 - - - - - - - - 1,124 Hetch Hetchy
Water and PowerEnterprise.......................... 673 32 - - - - - - - - 705
Municipal TransportationAgency.............................. 2,335 2,359 - - - - - - - - 4,694
San Francisco General Hospital Medical Center.................. 131,411 - - - - - - - - 28 131,439
16,453 32 - - - - - - - - 16,485 - 32 - - - - - - - - 32
7,115 - - - - - - - - - 7,115 Total transfers out 209,494$ 371,243$ 5$ 34,368$ 1,385$ 523,489$ 240,120$ 460$ 24,132$ 51,355$ 1,456,051$
Transfers In: Funds (in thousands)
Transfers Out:Funds
General Fund......................
Internal Service Funds.........
Water Enterprise.................
Wastewater Enterprise........Port of San Francisco..........Laguna Honda Hospital.......
The $962.3 million General Fund transfer out includes a total of $672.7 million in operating subsidies to SFMTA, SFGH, and Laguna Honda Hospital (note 13). The transfer of $289.1 million from the General Fund to the nonmajor governmental funds is to provide support to various City programs such as the Public Library and Children and Families Fund, as well as to provide resources for the payment of debt service. The transfers between the nonmajor governmental funds are to provide support for various City programs and to provide resources for the payment of debt service.
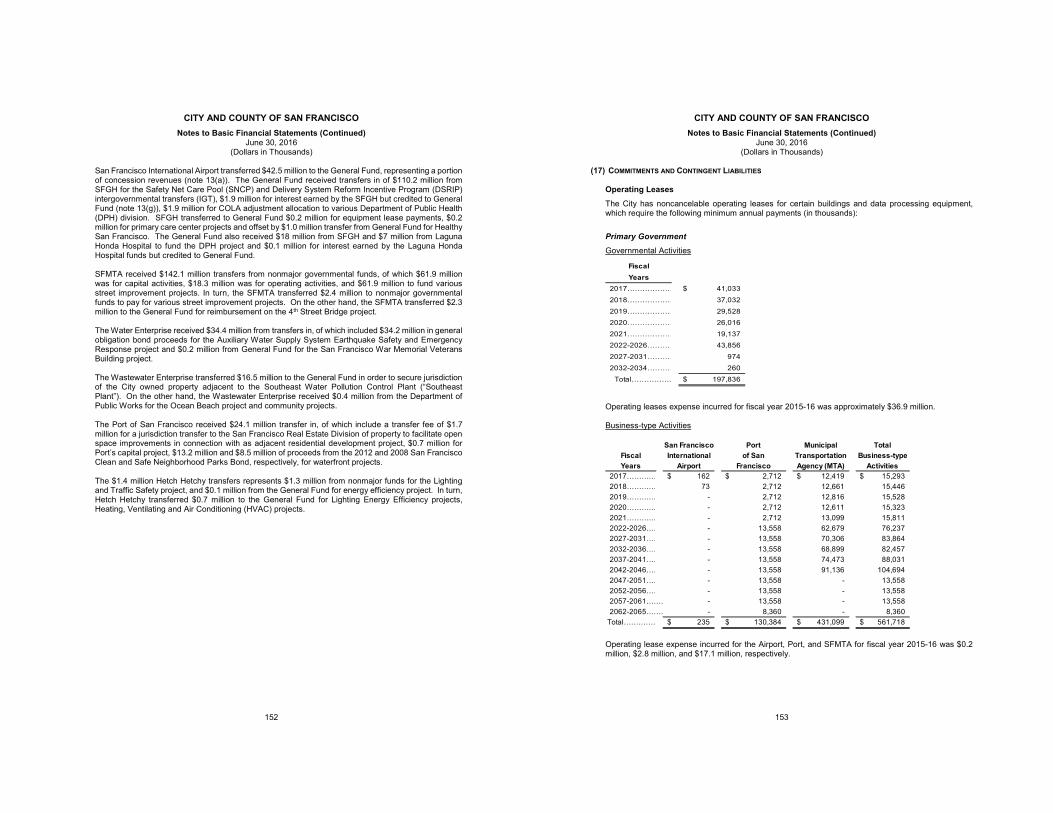
CITY AND COUNTY OF SAN FRANCISCO Notes to Basic Financial Statements (Continued)
June 30, 2016 (Dollars in Thousands)
152
San Francisco International Airport transferred $42.5 million to the General Fund, representing a portion of concession revenues (note 13(a)). The General Fund received transfers in of $110.2 million from SFGH for the Safety Net Care Pool (SNCP) and Delivery System Reform Incentive Program (DSRIP) intergovernmental transfers (IGT), $1.9 million for interest earned by the SFGH but credited to General Fund (note 13(g)), $1.9 million for COLA adjustment allocation to various Department of Public Health (DPH) division. SFGH transferred to General Fund $0.2 million for equipment lease payments, $0.2 million for primary care center projects and offset by $1.0 million transfer from General Fund for Healthy San Francisco. The General Fund also received $18 million from SFGH and $7 million from Laguna Honda Hospital to fund the DPH project and $0.1 million for interest earned by the Laguna Honda Hospital funds but credited to General Fund. SFMTA received $142.1 million transfers from nonmajor governmental funds, of which $61.9 million was for capital activities, $18.3 million was for operating activities, and $61.9 million to fund various street improvement projects. In turn, the SFMTA transferred $2.4 million to nonmajor governmental funds to pay for various street improvement projects. On the other hand, the SFMTA transferred $2.3 million to the General Fund for reimbursement on the 4th Street Bridge project. The Water Enterprise received $34.4 million from transfers in, of which included $34.2 million in general obligation bond proceeds for the Auxiliary Water Supply System Earthquake Safety and Emergency Response project and $0.2 million from General Fund for the San Francisco War Memorial Veterans Building project. The Wastewater Enterprise transferred $16.5 million to the General Fund in order to secure jurisdiction of the City owned property adjacent to the Southeast Water Pollution Control Plant (“Southeast Plant”). On the other hand, the Wastewater Enterprise received $0.4 million from the Department of Public Works for the Ocean Beach project and community projects. The Port of San Francisco received $24.1 million transfer in, of which include a transfer fee of $1.7 million for a jurisdiction transfer to the San Francisco Real Estate Division of property to facilitate open space improvements in connection with as adjacent residential development project, $0.7 million for Port’s capital project, $13.2 million and $8.5 million of proceeds from the 2012 and 2008 San Francisco Clean and Safe Neighborhood Parks Bond, respectively, for waterfront projects. The $1.4 million Hetch Hetchy transfers represents $1.3 million from nonmajor funds for the Lighting and Traffic Safety project, and $0.1 million from the General Fund for energy efficiency project. In turn, Hetch Hetchy transferred $0.7 million to the General Fund for Lighting Energy Efficiency projects, Heating, Ventilating and Air Conditioning (HVAC) projects.
CITY AND COUNTY OF SAN FRANCISCO Notes to Basic Financial Statements (Continued)
June 30, 2016 (Dollars in Thousands)
153
(17) COMMITMENTS AND CONTINGENT LIABILITIES
Operating Leases The City has noncancelable operating leases for certain buildings and data processing equipment, which require the following minimum annual payments (in thousands): Primary Government Governmental Activities
Operating leases expense incurred for fiscal year 2015-16 was approximately $36.9 million. Business-type Activities
Operating lease expense incurred for the Airport, Port, and SFMTA for fiscal year 2015-16 was $0.2 million, $2.8 million, and $17.1 million, respectively.
FiscalYears
2017……………… 41,033$ 2018……………… 37,032 2019……………… 29,528 2020……………… 26,016 2021……………… 19,137 2022-2026………… 43,856 2027-2031………… 974 2032-2034………… 260
Total……………. 197,836$
San Francisco Port Municipal TotalFiscal International of San Transportation Business-typeYears Airport Francisco Agency (MTA) Activities
2017………… 162$ 2,712$ 12,419$ 15,293$ 2018………… 73 2,712 12,661 15,446 2019………… - 2,712 12,816 15,528 2020………… - 2,712 12,611 15,323 2021………… - 2,712 13,099 15,811 2022-2026…… - 13,558 62,679 76,237 2027-2031…… - 13,558 70,306 83,864 2032-2036…… - 13,558 68,899 82,457 2037-2041…… - 13,558 74,473 88,031 2042-2046…… - 13,558 91,136 104,694 2047-2051…… - 13,558 - 13,558 2052-2056…… - 13,558 - 13,558 2057-2061……… - 13,558 - 13,558 2062-2065……… - 8,360 - 8,360
Total…………… 235$ 130,384$ 431,099$ 561,718$
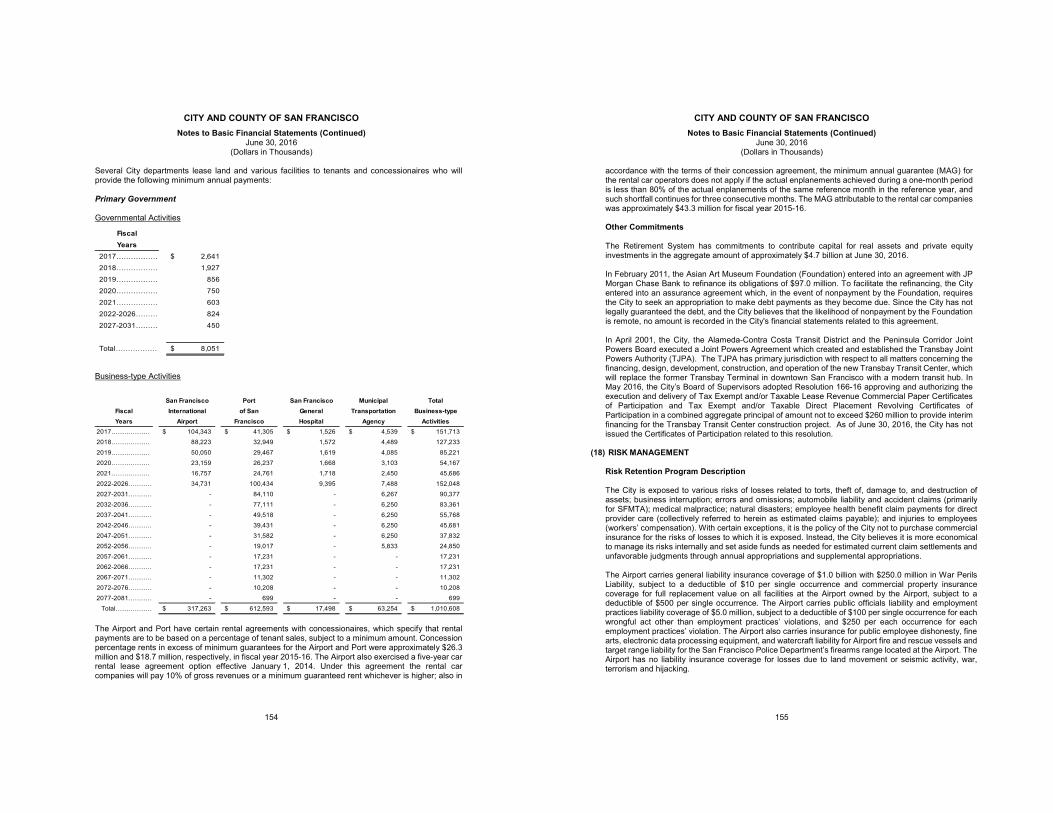
CITY AND COUNTY OF SAN FRANCISCO Notes to Basic Financial Statements (Continued)
June 30, 2016 (Dollars in Thousands)
154
Several City departments lease land and various facilities to tenants and concessionaires who will provide the following minimum annual payments: Primary Government Governmental Activities
Business-type Activities
The Airport and Port have certain rental agreements with concessionaires, which specify that rental payments are to be based on a percentage of tenant sales, subject to a minimum amount. Concession percentage rents in excess of minimum guarantees for the Airport and Port were approximately $26.3 million and $18.7 million, respectively, in fiscal year 2015-16. The Airport also exercised a five-year car rental lease agreement option effective January 1, 2014. Under this agreement the rental car companies will pay 10% of gross revenues or a minimum guaranteed rent whichever is higher; also in
FiscalYears
2017……………… 2,641$ 2018……………… 1,927 2019……………… 856 2020……………… 750 2021……………… 603 2022-2026……… 824 2027-2031……… 450
Total……………… 8,051$
San Francisco Port San Francisco Municipal TotalFiscal International of San General Transportation Business-typeYears Airport Francisco Hospital Agency Activities
2017……………… 104,343$ 41,305$ 1,526$ 4,539$ 151,713$ 2018……………… 88,223 32,949 1,572 4,489 127,233 2019……………… 50,050 29,467 1,619 4,085 85,221 2020……………… 23,159 26,237 1,668 3,103 54,167 2021……………… 16,757 24,761 1,718 2,450 45,686 2022-2026………… 34,731 100,434 9,395 7,488 152,048 2027-2031………… - 84,110 - 6,267 90,377 2032-2036………… - 77,111 - 6,250 83,361 2037-2041………… - 49,518 - 6,250 55,768 2042-2046………… - 39,431 - 6,250 45,681 2047-2051………… - 31,582 - 6,250 37,832 2052-2056………… - 19,017 - 5,833 24,850 2057-2061………… - 17,231 - - 17,231 2062-2066………… - 17,231 - - 17,231 2067-2071………… - 11,302 - - 11,302 2072-2076………… - 10,208 - - 10,208 2077-2081………… - 699 - - 699 Total……………… 317,263$ 612,593$ 17,498$ 63,254$ 1,010,608$
CITY AND COUNTY OF SAN FRANCISCO Notes to Basic Financial Statements (Continued)
June 30, 2016 (Dollars in Thousands)
155
accordance with the terms of their concession agreement, the minimum annual guarantee (MAG) for the rental car operators does not apply if the actual enplanements achieved during a one-month period is less than 80% of the actual enplanements of the same reference month in the reference year, and such shortfall continues for three consecutive months. The MAG attributable to the rental car companies was approximately $43.3 million for fiscal year 2015-16. Other Commitments The Retirement System has commitments to contribute capital for real assets and private equity investments in the aggregate amount of approximately $4.7 billion at June 30, 2016. In February 2011, the Asian Art Museum Foundation (Foundation) entered into an agreement with JP Morgan Chase Bank to refinance its obligations of $97.0 million. To facilitate the refinancing, the City entered into an assurance agreement which, in the event of nonpayment by the Foundation, requires the City to seek an appropriation to make debt payments as they become due. Since the City has not legally guaranteed the debt, and the City believes that the likelihood of nonpayment by the Foundation is remote, no amount is recorded in the City's financial statements related to this agreement. In April 2001, the City, the Alameda-Contra Costa Transit District and the Peninsula Corridor Joint Powers Board executed a Joint Powers Agreement which created and established the Transbay Joint Powers Authority (TJPA). The TJPA has primary jurisdiction with respect to all matters concerning the financing, design, development, construction, and operation of the new Transbay Transit Center, which will replace the former Transbay Terminal in downtown San Francisco with a modern transit hub. In May 2016, the City’s Board of Supervisors adopted Resolution 166-16 approving and authorizing the execution and delivery of Tax Exempt and/or Taxable Lease Revenue Commercial Paper Certificates of Participation and Tax Exempt and/or Taxable Direct Placement Revolving Certificates of Participation in a combined aggregate principal of amount not to exceed $260 million to provide interim financing for the Transbay Transit Center construction project. As of June 30, 2016, the City has not issued the Certificates of Participation related to this resolution.
(18) RISK MANAGEMENT
Risk Retention Program Description The City is exposed to various risks of losses related to torts, theft of, damage to, and destruction of assets; business interruption; errors and omissions; automobile liability and accident claims (primarily for SFMTA); medical malpractice; natural disasters; employee health benefit claim payments for direct provider care (collectively referred to herein as estimated claims payable); and injuries to employees (workers’ compensation). With certain exceptions, it is the policy of the City not to purchase commercial insurance for the risks of losses to which it is exposed. Instead, the City believes it is more economical to manage its risks internally and set aside funds as needed for estimated current claim settlements and unfavorable judgments through annual appropriations and supplemental appropriations. The Airport carries general liability insurance coverage of $1.0 billion with $250.0 million in War Perils Liability, subject to a deductible of $10 per single occurrence and commercial property insurance coverage for full replacement value on all facilities at the Airport owned by the Airport, subject to a deductible of $500 per single occurrence. The Airport carries public officials liability and employment practices liability coverage of $5.0 million, subject to a deductible of $100 per single occurrence for each wrongful act other than employment practices’ violations, and $250 per each occurrence for each employment practices’ violation. The Airport also carries insurance for public employee dishonesty, fine arts, electronic data processing equipment, and watercraft liability for Airport fire and rescue vessels and target range liability for the San Francisco Police Department’s firearms range located at the Airport. The Airport has no liability insurance coverage for losses due to land movement or seismic activity, war, terrorism and hijacking.
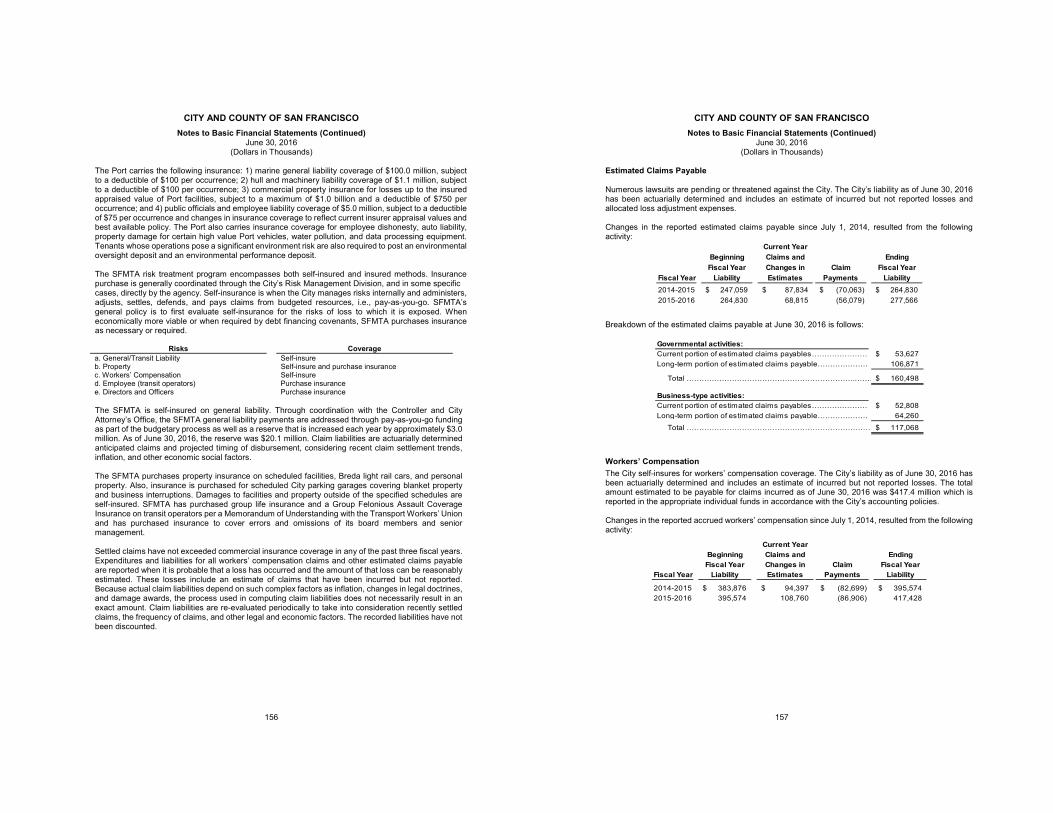
CITY AND COUNTY OF SAN FRANCISCO Notes to Basic Financial Statements (Continued)
June 30, 2016 (Dollars in Thousands)
156
The Port carries the following insurance: 1) marine general liability coverage of $100.0 million, subject to a deductible of $100 per occurrence; 2) hull and machinery liability coverage of $1.1 million, subject to a deductible of $100 per occurrence; 3) commercial property insurance for losses up to the insured appraised value of Port facilities, subject to a maximum of $1.0 billion and a deductible of $750 per occurrence; and 4) public officials and employee liability coverage of $5.0 million, subject to a deductible of $75 per occurrence and changes in insurance coverage to reflect current insurer appraisal values and best available policy. The Port also carries insurance coverage for employee dishonesty, auto liability, property damage for certain high value Port vehicles, water pollution, and data processing equipment. Tenants whose operations pose a significant environment risk are also required to post an environmental oversight deposit and an environmental performance deposit. The SFMTA risk treatment program encompasses both self-insured and insured methods. Insurance purchase is generally coordinated through the City’s Risk Management Division, and in some specific cases, directly by the agency. Self-insurance is when the City manages risks internally and administers, adjusts, settles, defends, and pays claims from budgeted resources, i.e., pay-as-you-go. SFMTA’s general policy is to first evaluate self-insurance for the risks of loss to which it is exposed. When economically more viable or when required by debt financing covenants, SFMTA purchases insurance as necessary or required.
Risks Coverage a. General/Transit Liability Self-insure b. Property Self-insure and purchase insurance c. Workers’ Compensation Self-insure d. Employee (transit operators) Purchase insurance e. Directors and Officers Purchase insurance The SFMTA is self-insured on general liability. Through coordination with the Controller and City Attorney’s Office, the SFMTA general liability payments are addressed through pay-as-you-go funding as part of the budgetary process as well as a reserve that is increased each year by approximately $3.0 million. As of June 30, 2016, the reserve was $20.1 million. Claim liabilities are actuarially determined anticipated claims and projected timing of disbursement, considering recent claim settlement trends, inflation, and other economic social factors. The SFMTA purchases property insurance on scheduled facilities, Breda light rail cars, and personal property. Also, insurance is purchased for scheduled City parking garages covering blanket property and business interruptions. Damages to facilities and property outside of the specified schedules are self-insured. SFMTA has purchased group life insurance and a Group Felonious Assault Coverage Insurance on transit operators per a Memorandum of Understanding with the Transport Workers’ Union and has purchased insurance to cover errors and omissions of its board members and senior management. Settled claims have not exceeded commercial insurance coverage in any of the past three fiscal years. Expenditures and liabilities for all workers’ compensation claims and other estimated claims payable are reported when it is probable that a loss has occurred and the amount of that loss can be reasonably estimated. These losses include an estimate of claims that have been incurred but not reported. Because actual claim liabilities depend on such complex factors as inflation, changes in legal doctrines, and damage awards, the process used in computing claim liabilities does not necessarily result in an exact amount. Claim liabilities are re-evaluated periodically to take into consideration recently settled claims, the frequency of claims, and other legal and economic factors. The recorded liabilities have not been discounted.
CITY AND COUNTY OF SAN FRANCISCO Notes to Basic Financial Statements (Continued)
June 30, 2016 (Dollars in Thousands)
157
Estimated Claims Payable Numerous lawsuits are pending or threatened against the City. The City’s liability as of June 30, 2016 has been actuarially determined and includes an estimate of incurred but not reported losses and allocated loss adjustment expenses. Changes in the reported estimated claims payable since July 1, 2014, resulted from the following activity:
Breakdown of the estimated claims payable at June 30, 2016 is follows:
Workers’ Compensation The City self-insures for workers’ compensation coverage. The City’s liability as of June 30, 2016 has been actuarially determined and includes an estimate of incurred but not reported losses. The total amount estimated to be payable for claims incurred as of June 30, 2016 was $417.4 million which is reported in the appropriate individual funds in accordance with the City’s accounting policies. Changes in the reported accrued workers’ compensation since July 1, 2014, resulted from the following activity:
Current YearBeginning Claims and EndingFiscal Year Changes in Claim Fiscal Year
Fiscal Year Liability Estimates Payments Liability2014-2015 247,059$ 87,834$ (70,063)$ 264,830$ 2015-2016 264,830 68,815 (56,079) 277,566
Governmental activities:Current portion of estimated claims payables…………………… 53,627$ Long-term portion of estimated claims payable………………… 106,871
Total ………………………………………………………….……… 160,498$
Business-type activities:Current portion of estimated claims payables…………………… 52,808$ Long-term portion of estimated claims payable………………… 64,260
Total ………………………………………………………………… 117,068$
Current YearBeginning Claims and EndingFiscal Year Changes in Claim Fiscal Year
Fiscal Year Liability Estimates Payments Liability
2014-2015 383,876$ 94,397$ (82,699)$ 395,574$ 2015-2016 395,574 108,760 (86,906) 417,428
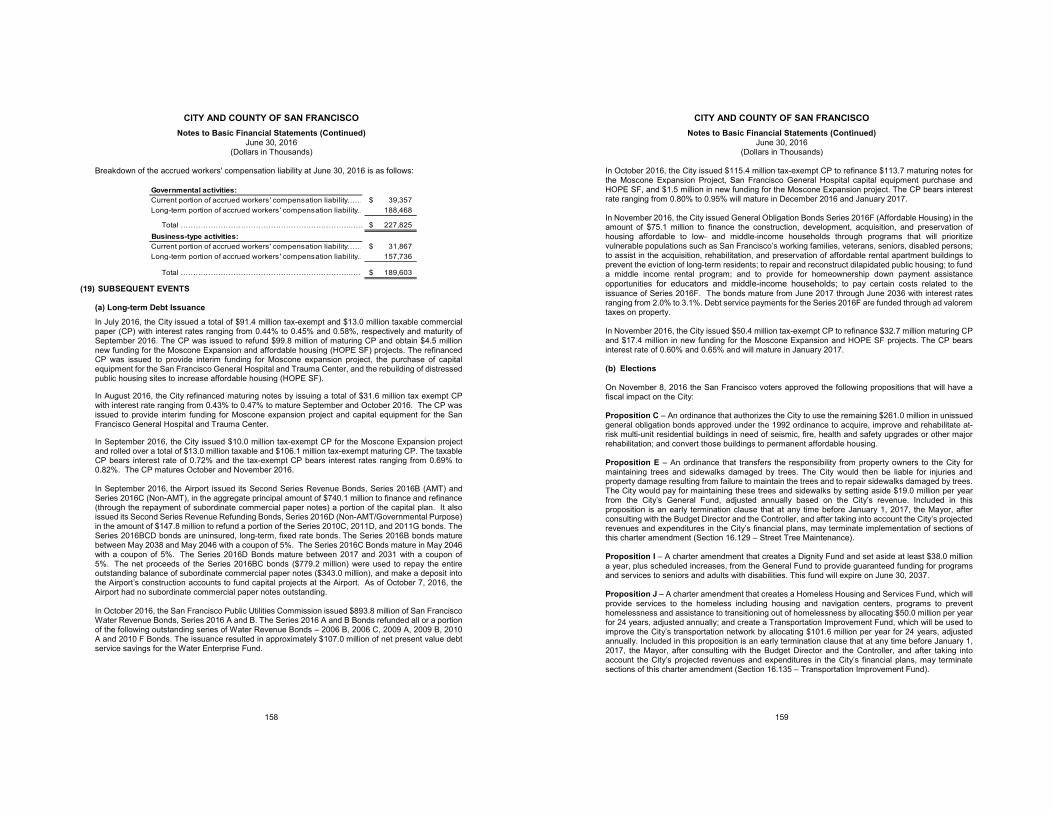
CITY AND COUNTY OF SAN FRANCISCO Notes to Basic Financial Statements (Continued)
June 30, 2016 (Dollars in Thousands)
158
Breakdown of the accrued workers' compensation liability at June 30, 2016 is as follows:
(19) SUBSEQUENT EVENTS
(a) Long-term Debt Issuance In July 2016, the City issued a total of $91.4 million tax-exempt and $13.0 million taxable commercial paper (CP) with interest rates ranging from 0.44% to 0.45% and 0.58%, respectively and maturity of September 2016. The CP was issued to refund $99.8 million of maturing CP and obtain $4.5 million new funding for the Moscone Expansion and affordable housing (HOPE SF) projects. The refinanced CP was issued to provide interim funding for Moscone expansion project, the purchase of capital equipment for the San Francisco General Hospital and Trauma Center, and the rebuilding of distressed public housing sites to increase affordable housing (HOPE SF).
In August 2016, the City refinanced maturing notes by issuing a total of $31.6 million tax exempt CP with interest rate ranging from 0.43% to 0.47% to mature September and October 2016. The CP was issued to provide interim funding for Moscone expansion project and capital equipment for the San Francisco General Hospital and Trauma Center.
In September 2016, the City issued $10.0 million tax-exempt CP for the Moscone Expansion project and rolled over a total of $13.0 million taxable and $106.1 million tax-exempt maturing CP. The taxable CP bears interest rate of 0.72% and the tax-exempt CP bears interest rates ranging from 0.69% to 0.82%. The CP matures October and November 2016. In September 2016, the Airport issued its Second Series Revenue Bonds, Series 2016B (AMT) and Series 2016C (Non-AMT), in the aggregate principal amount of $740.1 million to finance and refinance (through the repayment of subordinate commercial paper notes) a portion of the capital plan. It also issued its Second Series Revenue Refunding Bonds, Series 2016D (Non-AMT/Governmental Purpose) in the amount of $147.8 million to refund a portion of the Series 2010C, 2011D, and 2011G bonds. The Series 2016BCD bonds are uninsured, long-term, fixed rate bonds. The Series 2016B bonds mature between May 2038 and May 2046 with a coupon of 5%. The Series 2016C Bonds mature in May 2046 with a coupon of 5%. The Series 2016D Bonds mature between 2017 and 2031 with a coupon of 5%. The net proceeds of the Series 2016BC bonds ($779.2 million) were used to repay the entire outstanding balance of subordinate commercial paper notes ($343.0 million), and make a deposit into the Airport’s construction accounts to fund capital projects at the Airport. As of October 7, 2016, the Airport had no subordinate commercial paper notes outstanding. In October 2016, the San Francisco Public Utilities Commission issued $893.8 million of San Francisco Water Revenue Bonds, Series 2016 A and B. The Series 2016 A and B Bonds refunded all or a portion of the following outstanding series of Water Revenue Bonds – 2006 B, 2006 C, 2009 A, 2009 B, 2010 A and 2010 F Bonds. The issuance resulted in approximately $107.0 million of net present value debt service savings for the Water Enterprise Fund.
Governmental activities:Current portion of accrued workers' compensation liability…… 39,357$ Long-term portion of accrued workers' compensation liability… 188,468
Total ………………………………………………………….……… 227,825$ Business-type activities:Current portion of accrued workers' compensation liability…… 31,867$ Long-term portion of accrued workers' compensation liability… 157,736
Total ………………………………………………………….…… 189,603$
CITY AND COUNTY OF SAN FRANCISCO Notes to Basic Financial Statements (Continued)
June 30, 2016 (Dollars in Thousands)
159
In October 2016, the City issued $115.4 million tax-exempt CP to refinance $113.7 maturing notes for the Moscone Expansion Project, San Francisco General Hospital capital equipment purchase and HOPE SF, and $1.5 million in new funding for the Moscone Expansion project. The CP bears interest rate ranging from 0.80% to 0.95% will mature in December 2016 and January 2017. In November 2016, the City issued General Obligation Bonds Series 2016F (Affordable Housing) in the amount of $75.1 million to finance the construction, development, acquisition, and preservation of housing affordable to low- and middle-income households through programs that will prioritize vulnerable populations such as San Francisco’s working families, veterans, seniors, disabled persons; to assist in the acquisition, rehabilitation, and preservation of affordable rental apartment buildings to prevent the eviction of long-term residents; to repair and reconstruct dilapidated public housing; to fund a middle income rental program; and to provide for homeownership down payment assistance opportunities for educators and middle-income households; to pay certain costs related to the issuance of Series 2016F. The bonds mature from June 2017 through June 2036 with interest rates ranging from 2.0% to 3.1%. Debt service payments for the Series 2016F are funded through ad valorem taxes on property.
In November 2016, the City issued $50.4 million tax-exempt CP to refinance $32.7 million maturing CP and $17.4 million in new funding for the Moscone Expansion and HOPE SF projects. The CP bears interest rate of 0.60% and 0.65% and will mature in January 2017.
(b) Elections On November 8, 2016 the San Francisco voters approved the following propositions that will have a fiscal impact on the City: Proposition C – An ordinance that authorizes the City to use the remaining $261.0 million in unissued general obligation bonds approved under the 1992 ordinance to acquire, improve and rehabilitate at-risk multi-unit residential buildings in need of seismic, fire, health and safety upgrades or other major rehabilitation; and convert those buildings to permanent affordable housing. Proposition E – An ordinance that transfers the responsibility from property owners to the City for maintaining trees and sidewalks damaged by trees. The City would then be liable for injuries and property damage resulting from failure to maintain the trees and to repair sidewalks damaged by trees. The City would pay for maintaining these trees and sidewalks by setting aside $19.0 million per year from the City’s General Fund, adjusted annually based on the City’s revenue. Included in this proposition is an early termination clause that at any time before January 1, 2017, the Mayor, after consulting with the Budget Director and the Controller, and after taking into account the City’s projected revenues and expenditures in the City’s financial plans, may terminate implementation of sections of this charter amendment (Section 16.129 – Street Tree Maintenance). Proposition I – A charter amendment that creates a Dignity Fund and set aside at least $38.0 million a year, plus scheduled increases, from the General Fund to provide guaranteed funding for programs and services to seniors and adults with disabilities. This fund will expire on June 30, 2037. Proposition J – A charter amendment that creates a Homeless Housing and Services Fund, which will provide services to the homeless including housing and navigation centers, programs to prevent homelessness and assistance to transitioning out of homelessness by allocating $50.0 million per year for 24 years, adjusted annually; and create a Transportation Improvement Fund, which will be used to improve the City’s transportation network by allocating $101.6 million per year for 24 years, adjusted annually. Included in this proposition is an early termination clause that at any time before January 1, 2017, the Mayor, after consulting with the Budget Director and the Controller, and after taking into account the City’s projected revenues and expenditures in the City’s financial plans, may terminate sections of this charter amendment (Section 16.135 – Transportation Improvement Fund).
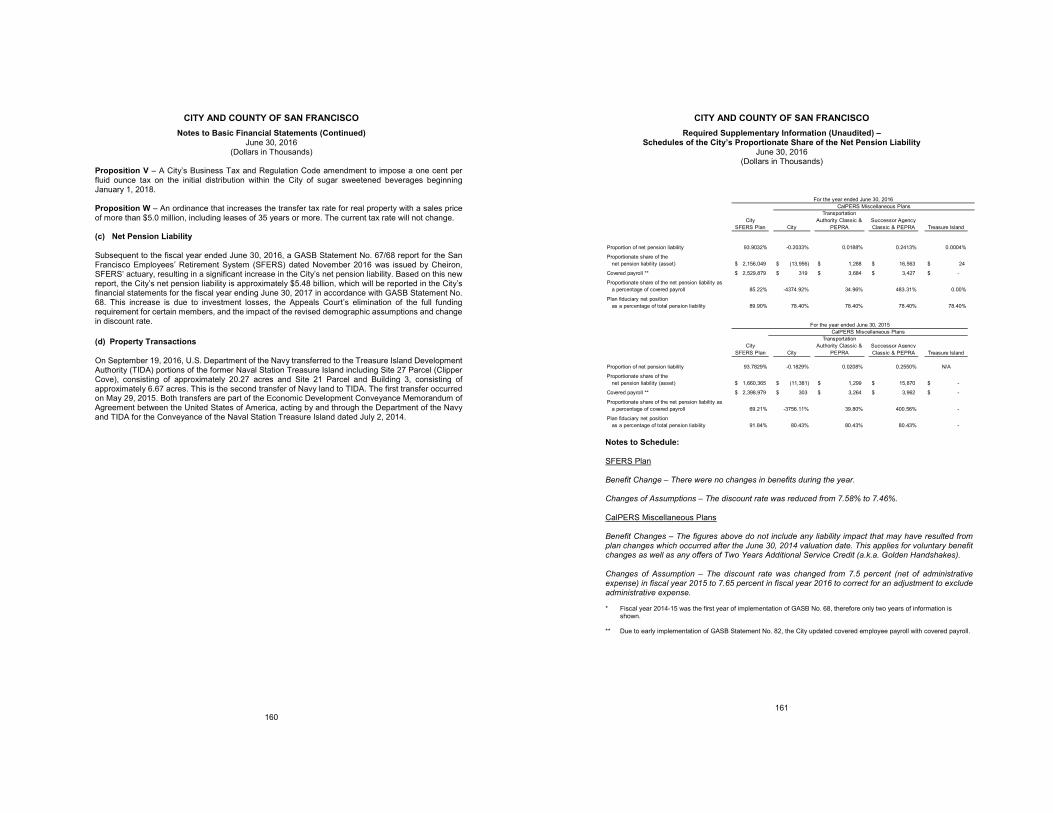
CITY AND COUNTY OF SAN FRANCISCO Notes to Basic Financial Statements (Continued)
June 30, 2016 (Dollars in Thousands)
160
Proposition V – A City’s Business Tax and Regulation Code amendment to impose a one cent per fluid ounce tax on the initial distribution within the City of sugar sweetened beverages beginning January 1, 2018. Proposition W – An ordinance that increases the transfer tax rate for real property with a sales price of more than $5.0 million, including leases of 35 years or more. The current tax rate will not change.
(c) Net Pension Liability Subsequent to the fiscal year ended June 30, 2016, a GASB Statement No. 67/68 report for the San Francisco Employees’ Retirement System (SFERS) dated November 2016 was issued by Cheiron, SFERS’ actuary, resulting in a significant increase in the City’s net pension liability. Based on this new report, the City’s net pension liability is approximately $5.48 billion, which will be reported in the City’s financial statements for the fiscal year ending June 30, 2017 in accordance with GASB Statement No. 68. This increase is due to investment losses, the Appeals Court’s elimination of the full funding requirement for certain members, and the impact of the revised demographic assumptions and change in discount rate.
(d) Property Transactions On September 19, 2016, U.S. Department of the Navy transferred to the Treasure Island Development Authority (TIDA) portions of the former Naval Station Treasure Island including Site 27 Parcel (Clipper Cove), consisting of approximately 20.27 acres and Site 21 Parcel and Building 3, consisting of approximately 6.67 acres. This is the second transfer of Navy land to TIDA. The first transfer occurred on May 29, 2015. Both transfers are part of the Economic Development Conveyance Memorandum of Agreement between the United States of America, acting by and through the Department of the Navy and TIDA for the Conveyance of the Naval Station Treasure Island dated July 2, 2014.
CITY AND COUNTY OF SAN FRANCISCO Required Supplementary Information (Unaudited) –
Schedules of the City’s Proportionate Share of the Net Pension Liability June 30, 2016
(Dollars in Thousands)
161
Notes to Schedule: SFERS Plan Benefit Change – There were no changes in benefits during the year. Changes of Assumptions – The discount rate was reduced from 7.58% to 7.46%. CalPERS Miscellaneous Plans
Benefit Changes – The figures above do not include any liability impact that may have resulted from plan changes which occurred after the June 30, 2014 valuation date. This applies for voluntary benefit changes as well as any offers of Two Years Additional Service Credit (a.k.a. Golden Handshakes). Changes of Assumption – The discount rate was changed from 7.5 percent (net of administrative expense) in fiscal year 2015 to 7.65 percent in fiscal year 2016 to correct for an adjustment to exclude administrative expense.
* Fiscal year 2014-15 was the first year of implementation of GASB No. 68, therefore only two years of information is
shown. ** Due to early implementation of GASB Statement No. 82, the City updated covered employee payroll with covered payroll.
City SFERS Plan City
TransportationAuthority Classic &
PEPRASuccessor Agency Classic & PEPRA Treasure Island
Proportion of net pension liability 93.9032% -0.2033% 0.0188% 0.2413% 0.0004%
Proportionate share of the net pension liability (asset) 2,156,049$ (13,956)$ 1,288$ 16,563$ 24$
Covered payroll ** 2,529,879$ 319$ 3,684$ 3,427$ -$
Proportionate share of the net pension liability as a percentage of covered payroll 85.22% -4374.92% 34.96% 483.31% 0.00%
Plan fiduciary net position as a percentage of total pension liability 89.90% 78.40% 78.40% 78.40% 78.40%
City SFERS Plan City
TransportationAuthority Classic &
PEPRASuccessor Agency Classic & PEPRA Treasure Island
Proportion of net pension liability 93.7829% -0.1829% 0.0208% 0.2550% N/A
Proportionate share of the net pension liability (asset) 1,660,365$ (11,381)$ 1,299$ 15,870$ -$
Covered payroll ** 2,398,979$ 303$ 3,264$ 3,962$ -$
Proportionate share of the net pension liability as a percentage of covered payroll 69.21% -3756.11% 39.80% 400.56% -
Plan fiduciary net position as a percentage of total pension liability 91.84% 80.43% 80.43% 80.43% -
CalPERS Miscellaneous PlansFor the year ended June 30, 2016
For the year ended June 30, 2015CalPERS Miscellaneous Plans
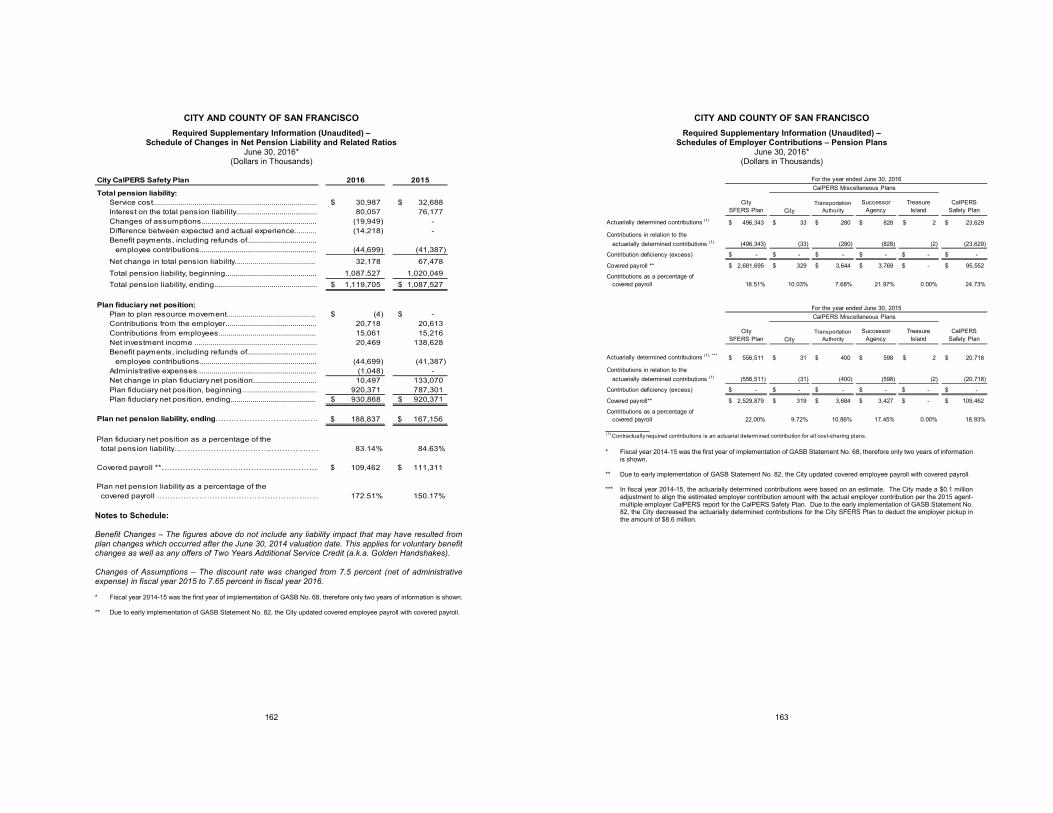
CITY AND COUNTY OF SAN FRANCISCO Required Supplementary Information (Unaudited) –
Schedule of Changes in Net Pension Liability and Related Ratios June 30, 2016*
(Dollars in Thousands)
162
Notes to Schedule: Benefit Changes – The figures above do not include any liability impact that may have resulted from plan changes which occurred after the June 30, 2014 valuation date. This applies for voluntary benefit changes as well as any offers of Two Years Additional Service Credit (a.k.a. Golden Handshakes). Changes of Assumptions – The discount rate was changed from 7.5 percent (net of administrative expense) in fiscal year 2015 to 7.65 percent in fiscal year 2016. * Fiscal year 2014-15 was the first year of implementation of GASB No. 68, therefore only two years of information is shown. ** Due to early implementation of GASB Statement No. 82, the City updated covered employee payroll with covered payroll.
City CalPERS Safety Plan 2016 2015
Total pension liability:Service cost................................................................................... 30,987$ 32,688$ Interest on the total pension liability......................................... 80,057 76,177 Changes of assumptions.......................................................... (19,949) - Difference between expected and actual experience........... (14,218) - Benefit payments, including refunds of................................... employee contributions........................................................... (44,699) (41,387) Net change in total pension liability......................................... 32,178 67,478 Total pension liability, beginning.............................................. 1,087,527 1,020,049 Total pension liability, ending.................................................... 1,119,705$ 1,087,527$
Plan fiduciary net position:Plan to plan resource movement............................................. (4)$ -$ Contributions from the employer.............................................. 20,718 20,613 Contributions from employees................................................. 15,061 15,216 Net investment income .............................................................. 20,469 138,628 Benefit payments, including refunds of................................... employee contributions........................................................... (44,699) (41,387) Administrative expenses............................................................ (1,048) - Net change in plan fiduciary net position................................ 10,497 133,070 Plan fiduciary net position, beginning...................................... 920,371 787,301 Plan fiduciary net position, ending........................................... 930,868$ 920,371$
Plan net pension liability, ending………………………………… 188,837$ 167,156$
Plan fiduciary net position as a percentage of the total pension liability………………………………………………… 83.14% 84.63%
Covered payroll **…………………………………………………… 109,462$ 111,311$
Plan net pension liability as a percentage of the covered payroll …………………………………………………….. 172.51% 150.17%
CITY AND COUNTY OF SAN FRANCISCO Required Supplementary Information (Unaudited) –
Schedules of Employer Contributions – Pension Plans June 30, 2016*
(Dollars in Thousands)
163
* Fiscal year 2014-15 was the first year of implementation of GASB Statement No. 68, therefore only two years of information
is shown. ** Due to early implementation of GASB Statement No. 82, the City updated covered employee payroll with covered payroll. *** In fiscal year 2014-15, the actuarially determined contributions were based on an estimate. The City made a $0.1 million
adjustment to align the estimated employer contribution amount with the actual employer contribution per the 2015 agent-multiple employer CalPERS report for the CalPERS Safety Plan. Due to the early implementation of GASB Statement No. 82, the City decreased the actuarially determined contributions for the City SFERS Plan to deduct the employer pickup in the amount of $8.6 million.
City SFERS Plan City
TransportationAuthority
Successor Agency
Treasure Island
CalPERS Safety Plan
Actuarially determined contributions (1) 496,343$ 33$ 280$ 828$ 2$ 23,629$
Contributions in relation to the actuarially determined contributions (1) (496,343) (33) (280) (828) (2) (23,629)
Contribution deficiency (excess) -$ -$ -$ -$ -$ -$
Covered payroll ** 2,681,695$ 329$ 3,644$ 3,769$ -$ 95,552$
Contributions as a percentage ofcovered payroll 18.51% 10.03% 7.68% 21.97% 0.00% 24.73%
City SFERS Plan City
TransportationAuthority
Successor Agency
Treasure Island
CalPERS Safety Plan
Actuarially determined contributions (1), *** 556,511$ 31$ 400$ 598$ 2$ 20,718$
Contributions in relation to the actuarially determined contributions (1) (556,511) (31) (400) (598) (2) (20,718)
Contribution deficiency (excess) -$ -$ -$ -$ -$ -$
Covered payroll** 2,529,879$ 319$ 3,684$ 3,427$ -$ 109,462$
Contributions as a percentage ofcovered payroll 22.00% 9.72% 10.86% 17.45% 0.00% 18.93%
(1) Contractually required contributions is an actuarial determined contribution for all cost-sharing plans.
For the year ended June 30, 2016
For the year ended June 30, 2015CalPERS Miscellaneous Plans
CalPERS Miscellaneous Plans
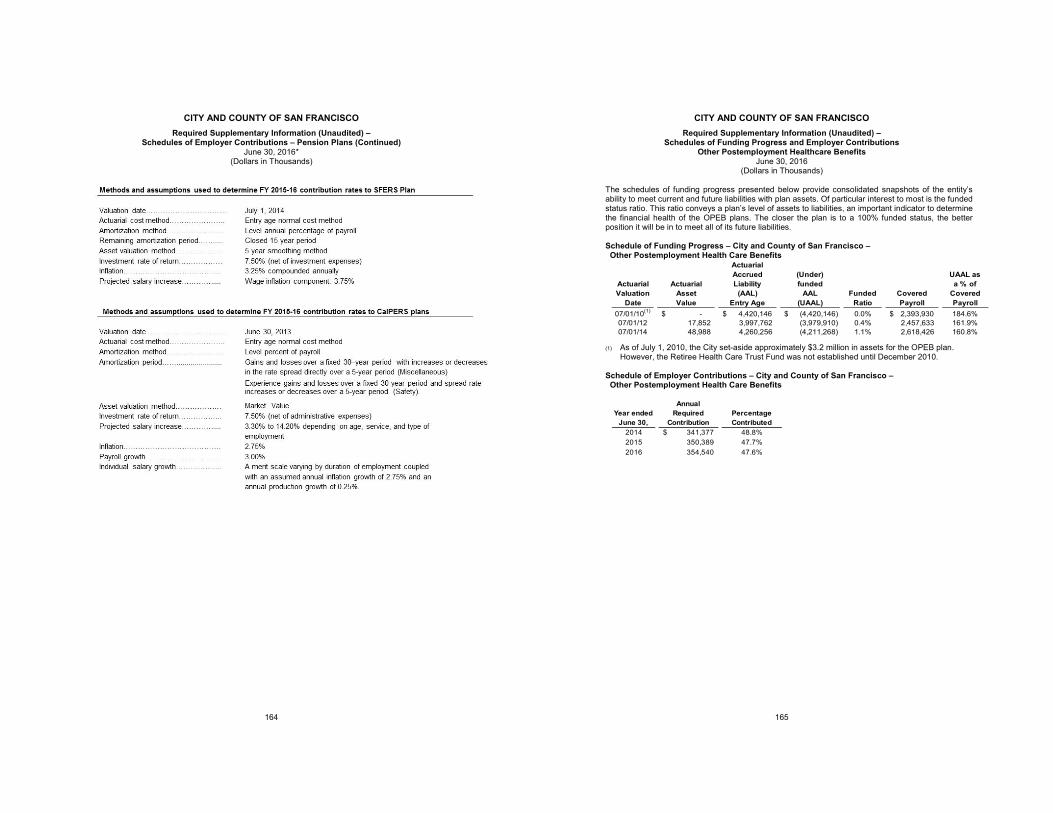
CITY AND COUNTY OF SAN FRANCISCO Required Supplementary Information (Unaudited) –
Schedules of Employer Contributions – Pension Plans (Continued) June 30, 2016*
(Dollars in Thousands)
164
CITY AND COUNTY OF SAN FRANCISCO Required Supplementary Information (Unaudited) –
Schedules of Funding Progress and Employer Contributions Other Postemployment Healthcare Benefits
June 30, 2016 (Dollars in Thousands)
165
The schedules of funding progress presented below provide consolidated snapshots of the entity’s ability to meet current and future liabilities with plan assets. Of particular interest to most is the funded status ratio. This ratio conveys a plan’s level of assets to liabilities, an important indicator to determine the financial health of the OPEB plans. The closer the plan is to a 100% funded status, the better position it will be in to meet all of its future liabilities. Schedule of Funding Progress – City and County of San Francisco – Other Postemployment Health Care Benefits
ActuarialAccrued (Under) UAAL as
Actuarial Actuarial Liability funded a % ofValuation Asset (AAL) AAL Funded Covered Covered
Date Value Entry Age (UAAL) Ratio Payroll Payroll07/01/10(1) -$ 4,420,146$ (4,420,146)$ 0.0% 2,393,930$ 184.6%07/01/12 17,852 3,997,762 (3,979,910) 0.4% 2,457,633 161.9%07/01/14 48,988 4,260,256 (4,211,268) 1.1% 2,618,426 160.8%
(1) As of July 1, 2010, the City set-aside approximately $3.2 million in assets for the OPEB plan.
However, the Retiree Health Care Trust Fund was not established until December 2010. Schedule of Employer Contributions – City and County of San Francisco – Other Postemployment Health Care Benefits
Year ended June 30,
Annual Required
ContributionPercentage Contributed
2014 341,377$ 48.8%2015 350,389 47.7%2016 354,540 47.6%
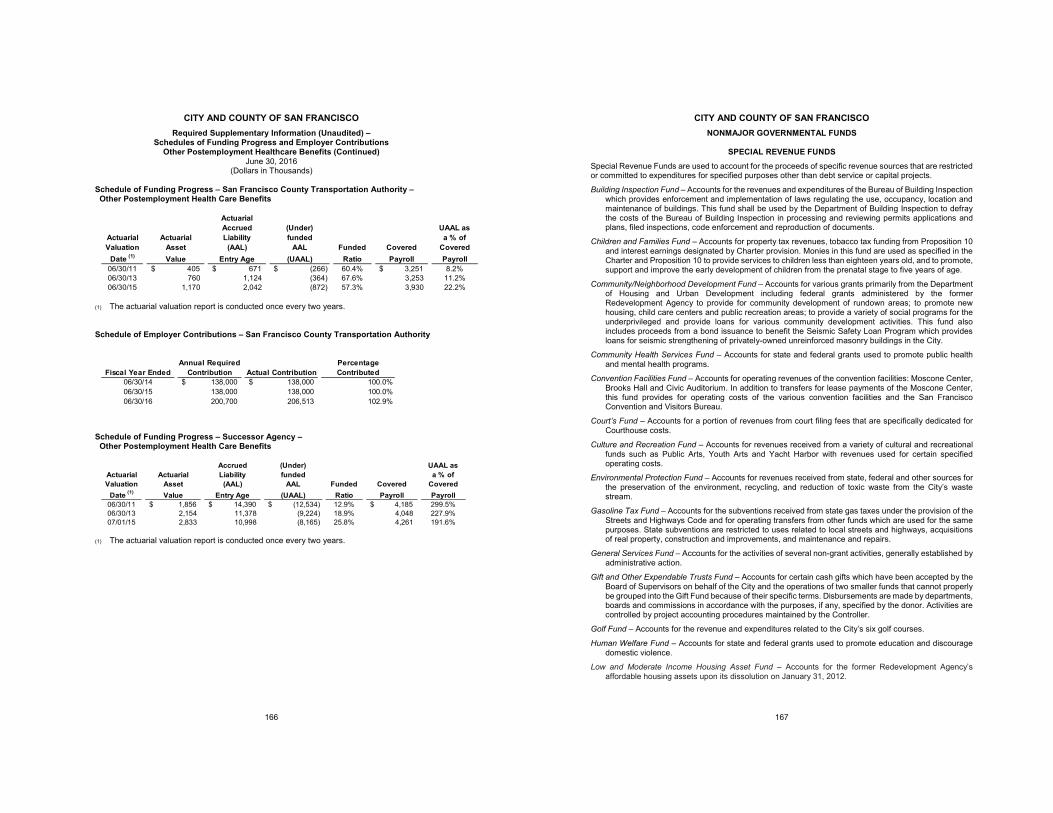
CITY AND COUNTY OF SAN FRANCISCO Required Supplementary Information (Unaudited) –
Schedules of Funding Progress and Employer Contributions Other Postemployment Healthcare Benefits (Continued)
June 30, 2016 (Dollars in Thousands)
166
Schedule of Funding Progress – San Francisco County Transportation Authority – Other Postemployment Health Care Benefits
ActuarialAccrued (Under) UAAL as
Actuarial Actuarial Liability funded a % ofValuation Asset (AAL) AAL Funded Covered Covered
Date (1) Value Entry Age (UAAL) Ratio Payroll Payroll06/30/11 405$ 671$ (266)$ 60.4% 3,251$ 8.2%06/30/13 760 1,124 (364) 67.6% 3,253 11.2%06/30/15 1,170 2,042 (872) 57.3% 3,930 22.2%
(1) The actuarial valuation report is conducted once every two years. Schedule of Employer Contributions – San Francisco County Transportation Authority
Annual Required PercentageFiscal Year Ended Contribution Actual Contribution Contributed
06/30/14 138,000$ 138,000$ 100.0%06/30/15 138,000 138,000 100.0%06/30/16 200,700 206,513 102.9%
Schedule of Funding Progress – Successor Agency – Other Postemployment Health Care Benefits
(1) The actuarial valuation report is conducted once every two years.
Accrued (Under) UAAL asActuarial Actuarial Liability funded a % ofValuation Asset (AAL) AAL Funded Covered Covered
Date (1) Value Entry Age (UAAL) Ratio Payroll Payroll06/30/11 1,856$ 14,390$ (12,534)$ 12.9% 4,185$ 299.5%06/30/13 2,154 11,378 (9,224) 18.9% 4,048 227.9%07/01/15 2,833 10,998 (8,165) 25.8% 4,261 191.6%
CITY AND COUNTY OF SAN FRANCISCO NONMAJOR GOVERNMENTAL FUNDS
167
SPECIAL REVENUE FUNDS Special Revenue Funds are used to account for the proceeds of specific revenue sources that are restricted or committed to expenditures for specified purposes other than debt service or capital projects.
Building Inspection Fund – Accounts for the revenues and expenditures of the Bureau of Building Inspection which provides enforcement and implementation of laws regulating the use, occupancy, location and maintenance of buildings. This fund shall be used by the Department of Building Inspection to defray the costs of the Bureau of Building Inspection in processing and reviewing permits applications and plans, filed inspections, code enforcement and reproduction of documents.
Children and Families Fund – Accounts for property tax revenues, tobacco tax funding from Proposition 10 and interest earnings designated by Charter provision. Monies in this fund are used as specified in the Charter and Proposition 10 to provide services to children less than eighteen years old, and to promote, support and improve the early development of children from the prenatal stage to five years of age.
Community/Neighborhood Development Fund – Accounts for various grants primarily from the Department of Housing and Urban Development including federal grants administered by the former Redevelopment Agency to provide for community development of rundown areas; to promote new housing, child care centers and public recreation areas; to provide a variety of social programs for the underprivileged and provide loans for various community development activities. This fund also includes proceeds from a bond issuance to benefit the Seismic Safety Loan Program which provides loans for seismic strengthening of privately-owned unreinforced masonry buildings in the City.
Community Health Services Fund – Accounts for state and federal grants used to promote public health and mental health programs.
Convention Facilities Fund – Accounts for operating revenues of the convention facilities: Moscone Center, Brooks Hall and Civic Auditorium. In addition to transfers for lease payments of the Moscone Center, this fund provides for operating costs of the various convention facilities and the San Francisco Convention and Visitors Bureau.
Court’s Fund – Accounts for a portion of revenues from court filing fees that are specifically dedicated for Courthouse costs.
Culture and Recreation Fund – Accounts for revenues received from a variety of cultural and recreational funds such as Public Arts, Youth Arts and Yacht Harbor with revenues used for certain specified operating costs.
Environmental Protection Fund – Accounts for revenues received from state, federal and other sources for the preservation of the environment, recycling, and reduction of toxic waste from the City’s waste stream.
Gasoline Tax Fund – Accounts for the subventions received from state gas taxes under the provision of the Streets and Highways Code and for operating transfers from other funds which are used for the same purposes. State subventions are restricted to uses related to local streets and highways, acquisitions of real property, construction and improvements, and maintenance and repairs.
General Services Fund – Accounts for the activities of several non-grant activities, generally established by administrative action.
Gift and Other Expendable Trusts Fund – Accounts for certain cash gifts which have been accepted by the Board of Supervisors on behalf of the City and the operations of two smaller funds that cannot properly be grouped into the Gift Fund because of their specific terms. Disbursements are made by departments, boards and commissions in accordance with the purposes, if any, specified by the donor. Activities are controlled by project accounting procedures maintained by the Controller.
Golf Fund – Accounts for the revenue and expenditures related to the City’s six golf courses.
Human Welfare Fund – Accounts for state and federal grants used to promote education and discourage domestic violence.
Low and Moderate Income Housing Asset Fund – Accounts for the former Redevelopment Agency’s affordable housing assets upon its dissolution on January 31, 2012.
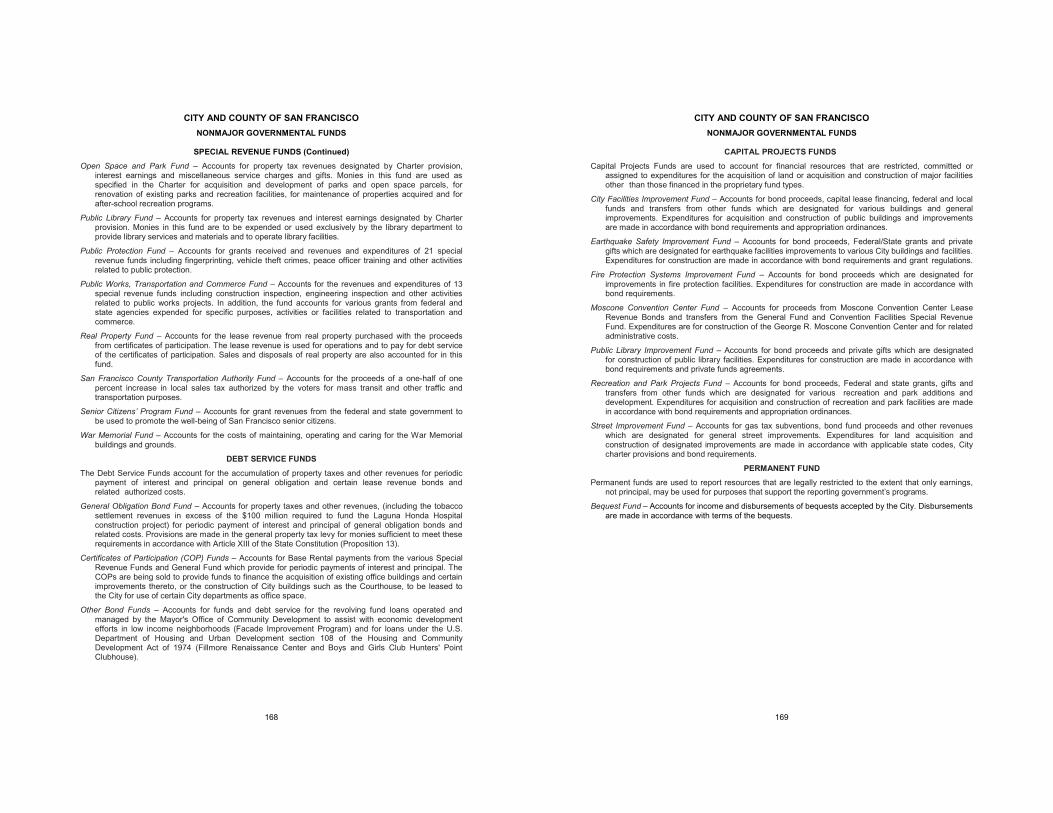
CITY AND COUNTY OF SAN FRANCISCO NONMAJOR GOVERNMENTAL FUNDS
168
SPECIAL REVENUE FUNDS (Continued) Open Space and Park Fund – Accounts for property tax revenues designated by Charter provision,
interest earnings and miscellaneous service charges and gifts. Monies in this fund are used as specified in the Charter for acquisition and development of parks and open space parcels, for renovation of existing parks and recreation facilities, for maintenance of properties acquired and for after-school recreation programs.
Public Library Fund – Accounts for property tax revenues and interest earnings designated by Charter provision. Monies in this fund are to be expended or used exclusively by the library department to provide library services and materials and to operate library facilities.
Public Protection Fund – Accounts for grants received and revenues and expenditures of 21 special revenue funds including fingerprinting, vehicle theft crimes, peace officer training and other activities related to public protection.
Public Works, Transportation and Commerce Fund – Accounts for the revenues and expenditures of 13 special revenue funds including construction inspection, engineering inspection and other activities related to public works projects. In addition, the fund accounts for various grants from federal and state agencies expended for specific purposes, activities or facilities related to transportation and commerce.
Real Property Fund – Accounts for the lease revenue from real property purchased with the proceeds from certificates of participation. The lease revenue is used for operations and to pay for debt service of the certificates of participation. Sales and disposals of real property are also accounted for in this fund.
San Francisco County Transportation Authority Fund – Accounts for the proceeds of a one-half of one percent increase in local sales tax authorized by the voters for mass transit and other traffic and transportation purposes.
Senior Citizens’ Program Fund – Accounts for grant revenues from the federal and state government to be used to promote the well-being of San Francisco senior citizens.
War Memorial Fund – Accounts for the costs of maintaining, operating and caring for the War Memorial buildings and grounds.
DEBT SERVICE FUNDS
The Debt Service Funds account for the accumulation of property taxes and other revenues for periodic payment of interest and principal on general obligation and certain lease revenue bonds and related authorized costs.
General Obligation Bond Fund – Accounts for property taxes and other revenues, (including the tobacco settlement revenues in excess of the $100 million required to fund the Laguna Honda Hospital construction project) for periodic payment of interest and principal of general obligation bonds and related costs. Provisions are made in the general property tax levy for monies sufficient to meet these requirements in accordance with Article XIII of the State Constitution (Proposition 13).
Certificates of Participation (COP) Funds – Accounts for Base Rental payments from the various Special Revenue Funds and General Fund which provide for periodic payments of interest and principal. The COPs are being sold to provide funds to finance the acquisition of existing office buildings and certain improvements thereto, or the construction of City buildings such as the Courthouse, to be leased to the City for use of certain City departments as office space.
Other Bond Funds – Accounts for funds and debt service for the revolving fund loans operated and managed by the Mayor's Office of Community Development to assist with economic development efforts in low income neighborhoods (Facade Improvement Program) and for loans under the U.S. Department of Housing and Urban Development section 108 of the Housing and Community Development Act of 1974 (Fillmore Renaissance Center and Boys and Girls Club Hunters' Point Clubhouse).
CITY AND COUNTY OF SAN FRANCISCO NONMAJOR GOVERNMENTAL FUNDS
169
CAPITAL PROJECTS FUNDS Capital Projects Funds are used to account for financial resources that are restricted, committed or
assigned to expenditures for the acquisition of land or acquisition and construction of major facilities other than those financed in the proprietary fund types.
City Facilities Improvement Fund – Accounts for bond proceeds, capital lease financing, federal and local funds and transfers from other funds which are designated for various buildings and general improvements. Expenditures for acquisition and construction of public buildings and improvements are made in accordance with bond requirements and appropriation ordinances.
Earthquake Safety Improvement Fund – Accounts for bond proceeds, Federal/State grants and private gifts which are designated for earthquake facilities improvements to various City buildings and facilities. Expenditures for construction are made in accordance with bond requirements and grant regulations.
Fire Protection Systems Improvement Fund – Accounts for bond proceeds which are designated for improvements in fire protection facilities. Expenditures for construction are made in accordance with bond requirements.
Moscone Convention Center Fund – Accounts for proceeds from Moscone Convention Center Lease Revenue Bonds and transfers from the General Fund and Convention Facilities Special Revenue Fund. Expenditures are for construction of the George R. Moscone Convention Center and for related administrative costs.
Public Library Improvement Fund – Accounts for bond proceeds and private gifts which are designated for construction of public library facilities. Expenditures for construction are made in accordance with bond requirements and private funds agreements.
Recreation and Park Projects Fund – Accounts for bond proceeds, Federal and state grants, gifts and transfers from other funds which are designated for various recreation and park additions and development. Expenditures for acquisition and construction of recreation and park facilities are made in accordance with bond requirements and appropriation ordinances.
Street Improvement Fund – Accounts for gas tax subventions, bond fund proceeds and other revenues which are designated for general street improvements. Expenditures for land acquisition and construction of designated improvements are made in accordance with applicable state codes, City charter provisions and bond requirements.
PERMANENT FUND Permanent funds are used to report resources that are legally restricted to the extent that only earnings,
not principal, may be used for purposes that support the reporting government’s programs.
Bequest Fund – Accounts for income and disbursements of bequests accepted by the City. Disbursements are made in accordance with terms of the bequests.
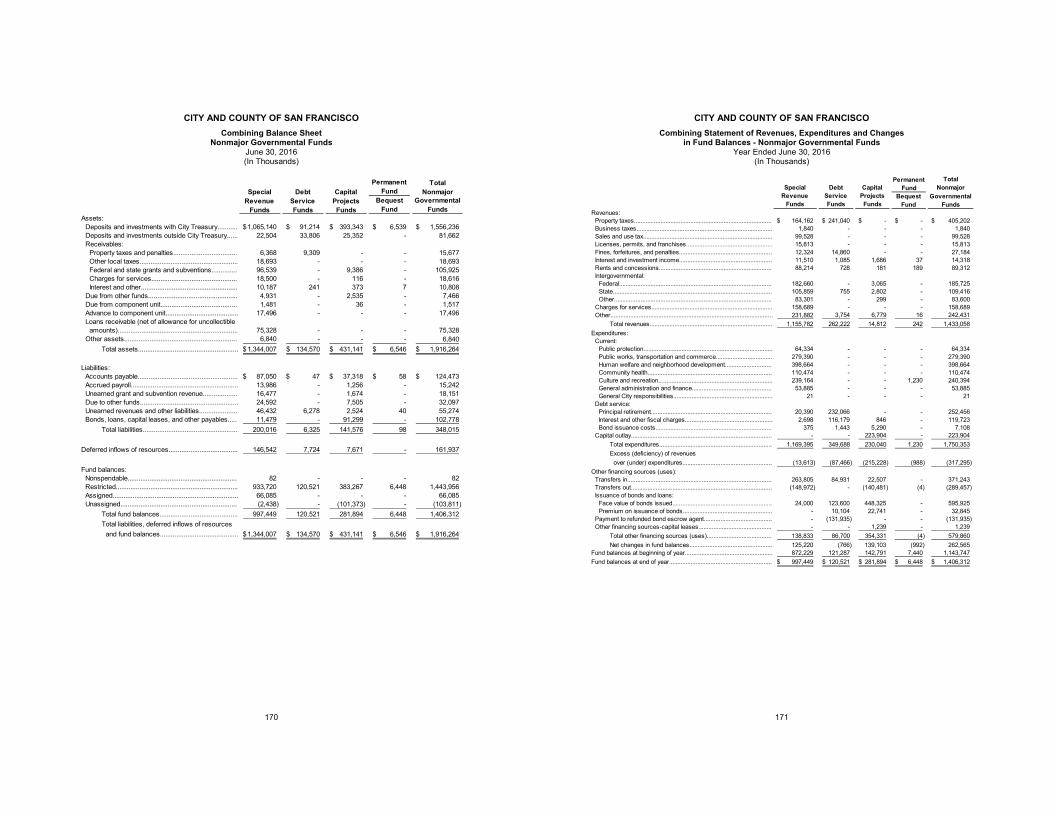
CITY AND COUNTY OF SAN FRANCISCO Combining Balance Sheet
Nonmajor Governmental Funds June 30, 2016 (In Thousands)
170
Permanent Fund
Bequest Fund
Assets:Deposits and investments with City Treasury........... 1,065,140$ 91,214$ 393,343$ 6,539$ 1,556,236$ Deposits and investments outside City Treasury...... 22,504 33,806 25,352 - 81,662 Receivables:
Property taxes and penalties................................... 6,368 9,309 - - 15,677 Other local taxes...................................................... 18,693 - - - 18,693 Federal and state grants and subventions.............. 96,539 - 9,386 - 105,925 Charges for services............................................... 18,500 - 116 - 18,616 Interest and other..................................................... 10,187 241 373 7 10,808
Due from other funds................................................. 4,931 - 2,535 - 7,466 Due from component unit.......................................... 1,481 - 36 - 1,517 Advance to component unit........................................ 17,496 - - - 17,496 Loans receivable (net of allowance for uncollectible
amounts).................................................................. 75,328 - - - 75,328 Other assets.............................................................. 6,840 - - - 6,840
Total assets....................................................... 1,344,007$ 134,570$ 431,141$ 6,546$ 1,916,264$
Liabilities:Accounts payable....................................................... 87,050$ 47$ 37,318$ 58$ 124,473$ Accrued payroll........................................................... 13,986 - 1,256 - 15,242 Unearned grant and subvention revenue................... 16,477 - 1,674 - 18,151 Due to other funds...................................................... 24,592 - 7,505 - 32,097 Unearned revenues and other liabilities..................... 46,432 6,278 2,524 40 55,274 Bonds, loans, capital leases, and other payables..... 11,479 - 91,299 - 102,778
Total liabilities.................................................... 200,016 6,325 141,576 98 348,015
Deferred inflows of resources...................................... 146,542 7,724 7,671 - 161,937
Fund balances:Nonspendable............................................................ 82 - - - 82 Restricted................................................................... 933,720 120,521 383,267 6,448 1,443,956 Assigned..................................................................... 66,085 - - - 66,085 Unassigned................................................................ (2,438) - (101,373) - (103,811)
Total fund balances........................................... 997,449 120,521 281,894 6,448 1,406,312 Total liabilities, deferred inflows of resources
and fund balances........................................... 1,344,007$ 134,570$ 431,141$ 6,546$ 1,916,264$
Special Revenue
Funds
Debt Service Funds
Capital Projects Funds
Total Nonmajor
Governmental Funds
CITY AND COUNTY OF SAN FRANCISCO Combining Statement of Revenues, Expenditures and Changes
in Fund Balances - Nonmajor Governmental Funds Year Ended June 30, 2016
(In Thousands)
171
Permanent Fund
Bequest Fund
Revenues:Property taxes................................................................................... 164,162$ 241,040$ -$ -$ 405,202$ Business taxes.................................................................................. 1,840 - - - 1,840 Sales and use tax.............................................................................. 99,528 - - - 99,528 Licenses, permits, and franchises.................................................... 15,813 - - - 15,813 Fines, forfeitures, and penalties........................................................ 12,324 14,860 - - 27,184 Interest and investment income........................................................ 11,510 1,085 1,686 37 14,318 Rents and concessions.................................................................... 88,214 728 181 189 89,312 Intergovernmental:
Federal............................................................................................ 182,660 - 3,065 - 185,725 State................................................................................................ 105,859 755 2,802 - 109,416 Other............................................................................................... 83,301 - 299 - 83,600
Charges for services......................................................................... 158,689 - - - 158,689 Other.................................................................................................. 231,882 3,754 6,779 16 242,431
Total revenues.......................................................................... 1,155,782 262,222 14,812 242 1,433,058 Expenditures:
Current:Public protection.............................................................................. 64,334 - - - 64,334 Public works, transportation and commerce.................................. 279,390 - - - 279,390 Human welfare and neighborhood development............................ 398,664 - - - 398,664 Community health........................................................................... 110,474 - - - 110,474 Culture and recreation..................................................................... 239,164 - - 1,230 240,394 General administration and finance................................................ 53,885 - - - 53,885 General City responsibilities............................................................ 21 - - - 21
Debt service:Principal retirement......................................................................... 20,390 232,066 - - 252,456 Interest and other fiscal charges..................................................... 2,698 116,179 846 - 119,723 Bond issuance costs...................................................................... 375 1,443 5,290 - 7,108
Capital outlay..................................................................................... - - 223,904 - 223,904 Total expenditures.................................................................... 1,169,395 349,688 230,040 1,230 1,750,353 Excess (deficiency) of revenues
over (under) expenditures...................................................... (13,613) (87,466) (215,228) (988) (317,295) Other financing sources (uses):
Transfers in....................................................................................... 263,805 84,931 22,507 - 371,243 Transfers out..................................................................................... (148,972) - (140,481) (4) (289,457) Issuance of bonds and loans:
Face value of bonds issued............................................................ 24,000 123,600 448,325 - 595,925 Premium on issuance of bonds...................................................... - 10,104 22,741 - 32,845
Payment to refunded bond escrow agent......................................... - (131,935) - - (131,935) Other financing sources-capital leases............................................ - - 1,239 - 1,239
Total other financing sources (uses)....................................... 138,833 86,700 354,331 (4) 579,860 Net changes in fund balances.................................................. 125,220 (766) 139,103 (992) 262,565
Fund balances at beginning of year..................................................... 872,229 121,287 142,791 7,440 1,143,747 Fund balances at end of year.............................................................. 997,449$ 120,521$ 281,894$ 6,448$ 1,406,312$
Special Revenue
Funds
Debt Service Funds
Capital Projects Funds
Total Nonmajor
Governmental Funds
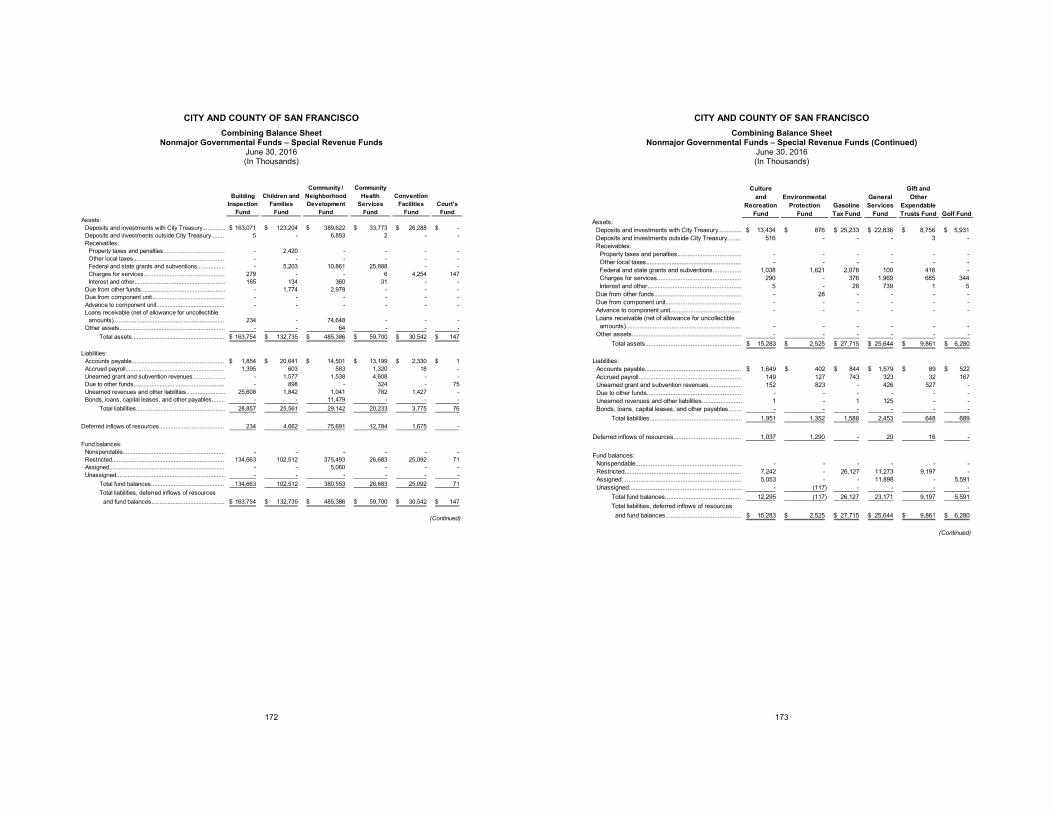
CITY AND COUNTY OF SAN FRANCISCO Combining Balance Sheet
Nonmajor Governmental Funds – Special Revenue Funds June 30, 2016 (In Thousands)
172
Building Inspection
Fund
Children and Families
Fund
Community / Neighborhood Development
Fund
Community Health
Services Fund
Convention Facilities
FundCourt's Fund
Assets:Deposits and investments with City Treasury.............. 163,071$ 123,204$ 389,622$ 33,773$ 26,288$ -$ Deposits and investments outside City Treasury........ 5 - 6,853 2 - - Receivables:
Property taxes and penalties...................................... - 2,420 - - - - Other local taxes........................................................ - - - - - - Federal and state grants and subventions................. - 5,203 10,861 25,888 - - Charges for services.................................................. 279 - - 6 4,254 147 Interest and other........................................................ 165 134 360 31 - -
Due from other funds.................................................... - 1,774 2,978 - - - Due from component unit............................................. - - - - - - Advance to component unit.......................................... - - - - - - Loans receivable (net of allowance for uncollectible
amounts).................................................................... 234 - 74,648 - - - Other assets................................................................. - - 64 - - -
Total assets......................................................... 163,754$ 132,735$ 485,386$ 59,700$ 30,542$ 147$
Liabilities:Accounts payable......................................................... 1,854$ 20,641$ 14,501$ 13,199$ 2,330$ 1$ Accrued payroll............................................................. 1,395 603 583 1,320 18 - Unearned grant and subvention revenues.................... - 1,577 1,538 4,608 - - Due to other funds........................................................ - 898 - 324 - 75 Unearned revenues and other liabilities........................ 25,608 1,842 1,041 782 1,427 - Bonds, loans, capital leases, and other payables........ - - 11,479 - - -
Total liabilities....................................................... 28,857 25,561 29,142 20,233 3,775 76
Deferred inflows of resources........................................ 234 4,662 75,691 12,784 1,675 -
Fund balances:Nonspendable............................................................... - - - - - - Restricted..................................................................... 134,663 102,512 375,493 26,683 25,092 71 Assigned....................................................................... - - 5,060 - - - Unassigned................................................................... - - - - - -
Total fund balances............................................. 134,663 102,512 380,553 26,683 25,092 71 Total liabilities, deferred inflows of resources
and fund balances............................................. 163,754$ 132,735$ 485,386$ 59,700$ 30,542$ 147$
(Continued)
CITY AND COUNTY OF SAN FRANCISCO Combining Balance Sheet
Nonmajor Governmental Funds – Special Revenue Funds (Continued) June 30, 2016 (In Thousands)
173
Culture and
Recreation Fund
Environmental Protection
FundGasoline Tax Fund
General Services
Fund
Gift and Other
Expendable Trusts Fund Golf Fund
Assets:Deposits and investments with City Treasury.............. 13,434$ 876$ 25,233$ 22,836$ 8,756$ 5,931$ Deposits and investments outside City Treasury........ 516 - - - 3 - Receivables:
Property taxes and penalties...................................... - - - - - - Other local taxes........................................................ - - - - - - Federal and state grants and subventions................. 1,038 1,621 2,078 100 416 - Charges for services.................................................. 290 - 376 1,969 685 344 Interest and other........................................................ 5 - 28 739 1 5
Due from other funds.................................................... - 28 - - - - Due from component unit............................................. - - - - - - Advance to component unit.......................................... - - - - - - Loans receivable (net of allowance for uncollectible
amounts).................................................................... - - - - - - Other assets................................................................. - - - - - -
Total assets......................................................... 15,283$ 2,525$ 27,715$ 25,644$ 9,861$ 6,280$
Liabilities:Accounts payable......................................................... 1,649$ 402$ 844$ 1,579$ 89$ 522$ Accrued payroll............................................................. 149 127 743 323 32 167 Unearned grant and subvention revenues.................... 152 823 - 426 527 - Due to other funds........................................................ - - - - - - Unearned revenues and other liabilities........................ 1 - 1 125 - - Bonds, loans, capital leases, and other payables........ - - - - - -
Total liabilities....................................................... 1,951 1,352 1,588 2,453 648 689
Deferred inflows of resources........................................ 1,037 1,290 - 20 16 -
Fund balances:Nonspendable............................................................... - - - - - - Restricted..................................................................... 7,242 - 26,127 11,273 9,197 - Assigned....................................................................... 5,053 - - 11,898 - 5,591 Unassigned................................................................... - (117) - - - -
Total fund balances............................................. 12,295 (117) 26,127 23,171 9,197 5,591 Total liabilities, deferred inflows of resources
and fund balances............................................. 15,283$ 2,525$ 27,715$ 25,644$ 9,861$ 6,280$
(Continued)
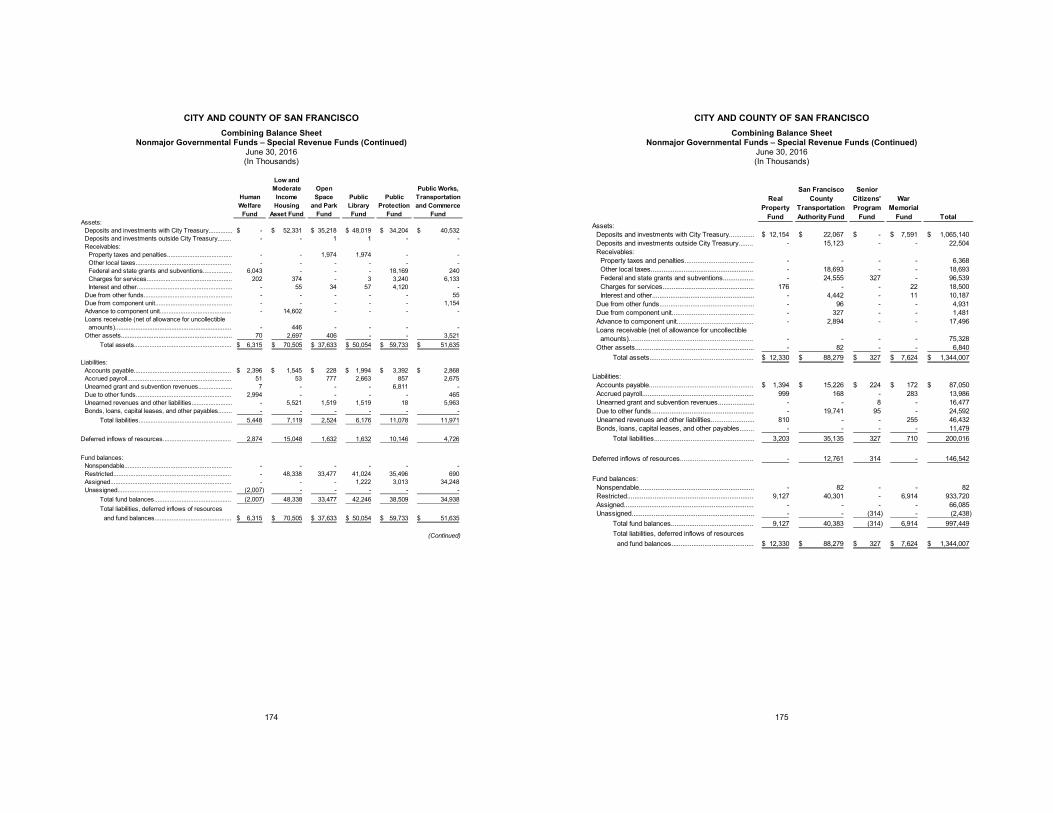
CITY AND COUNTY OF SAN FRANCISCO Combining Balance Sheet
Nonmajor Governmental Funds – Special Revenue Funds (Continued) June 30, 2016 (In Thousands)
174
Human Welfare
Fund
Low and Moderate Income Housing
Asset Fund
Open Space
and Park Fund
Public Library Fund
Public Protection
Fund
Public Works, Transportation and Commerce
FundAssets:
Deposits and investments with City Treasury.............. -$ 52,331$ 35,218$ 48,019$ 34,204$ 40,532$ Deposits and investments outside City Treasury........ - - 1 1 - - Receivables:
Property taxes and penalties...................................... - - 1,974 1,974 - - Other local taxes........................................................ - - - - - - Federal and state grants and subventions................. 6,043 - - - 18,169 240 Charges for services.................................................. 202 374 - 3 3,240 6,133 Interest and other........................................................ - 55 34 57 4,120 -
Due from other funds.................................................... - - - - - 55 Due from component unit............................................. - - - - - 1,154 Advance to component unit.......................................... - 14,602 - - - - Loans receivable (net of allowance for uncollectible
amounts).................................................................... - 446 - - - - Other assets................................................................. 70 2,697 406 - - 3,521
Total assets......................................................... 6,315$ 70,505$ 37,633$ 50,054$ 59,733$ 51,635$
Liabilities:Accounts payable......................................................... 2,396$ 1,545$ 228$ 1,994$ 3,392$ 2,868$ Accrued payroll............................................................. 51 53 777 2,663 857 2,675 Unearned grant and subvention revenues.................... 7 - - - 6,811 - Due to other funds........................................................ 2,994 - - - - 465 Unearned revenues and other liabilities........................ - 5,521 1,519 1,519 18 5,963 Bonds, loans, capital leases, and other payables........ - - - - - -
Total liabilities....................................................... 5,448 7,119 2,524 6,176 11,078 11,971
Deferred inflows of resources........................................ 2,874 15,048 1,632 1,632 10,146 4,726
Fund balances:Nonspendable............................................................... - - - - - - Restricted..................................................................... - 48,338 33,477 41,024 35,496 690 Assigned....................................................................... - - - 1,222 3,013 34,248 Unassigned................................................................... (2,007) - - - - -
Total fund balances............................................. (2,007) 48,338 33,477 42,246 38,509 34,938 Total liabilities, deferred inflows of resources
and fund balances............................................. 6,315$ 70,505$ 37,633$ 50,054$ 59,733$ 51,635$
(Continued)
CITY AND COUNTY OF SAN FRANCISCO Combining Balance Sheet
Nonmajor Governmental Funds – Special Revenue Funds (Continued) June 30, 2016 (In Thousands)
175
Real Property
Fund
San Francisco County
Transportation Authority Fund
Senior Citizens' Program
Fund
War Memorial
Fund TotalAssets:
Deposits and investments with City Treasury.............. 12,154$ 22,067$ -$ 7,591$ 1,065,140$ Deposits and investments outside City Treasury........ - 15,123 - - 22,504 Receivables:
Property taxes and penalties...................................... - - - - 6,368 Other local taxes........................................................ - 18,693 - - 18,693 Federal and state grants and subventions................. - 24,555 327 - 96,539 Charges for services.................................................. 176 - - 22 18,500 Interest and other........................................................ - 4,442 - 11 10,187
Due from other funds.................................................... - 96 - - 4,931 Due from component unit............................................. - 327 - - 1,481 Advance to component unit.......................................... - 2,894 - - 17,496 Loans receivable (net of allowance for uncollectible
amounts).................................................................... - - - - 75,328 Other assets................................................................. - 82 - - 6,840
Total assets......................................................... 12,330$ 88,279$ 327$ 7,624$ 1,344,007$
Liabilities:Accounts payable......................................................... 1,394$ 15,226$ 224$ 172$ 87,050$ Accrued payroll............................................................. 999 168 - 283 13,986 Unearned grant and subvention revenues.................... - - 8 - 16,477 Due to other funds........................................................ - 19,741 95 - 24,592 Unearned revenues and other liabilities........................ 810 - - 255 46,432 Bonds, loans, capital leases, and other payables........ - - - - 11,479
Total liabilities....................................................... 3,203 35,135 327 710 200,016
Deferred inflows of resources........................................ - 12,761 314 - 146,542
Fund balances:Nonspendable............................................................... - 82 - - 82 Restricted..................................................................... 9,127 40,301 - 6,914 933,720 Assigned....................................................................... - - - - 66,085 Unassigned................................................................... - - (314) - (2,438)
Total fund balances............................................. 9,127 40,383 (314) 6,914 997,449 Total liabilities, deferred inflows of resources
and fund balances............................................. 12,330$ 88,279$ 327$ 7,624$ 1,344,007$
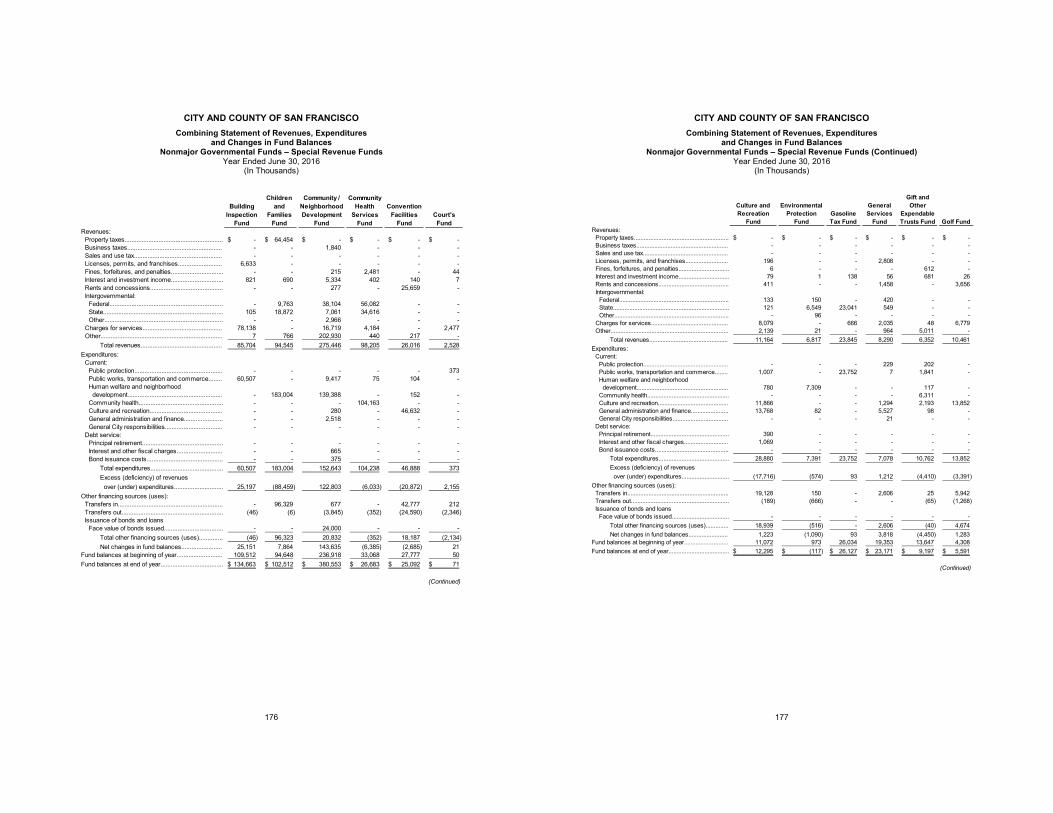
CITY AND COUNTY OF SAN FRANCISCO Combining Statement of Revenues, Expenditures
and Changes in Fund Balances Nonmajor Governmental Funds – Special Revenue Funds
Year Ended June 30, 2016 (In Thousands)
176
Building Inspection
Fund
Children and
Families Fund
Community / Neighborhood Development
Fund
Community Health
Services Fund
Convention Facilities
FundCourt's Fund
Revenues: Property taxes.......................................................... -$ 64,454$ -$ -$ -$ -$ Business taxes........................................................ - - 1,840 - - - Sales and use tax.................................................... - - - - - - Licenses, permits, and franchises.......................... 6,633 - - - - - Fines, forfeitures, and penalties............................... - - 215 2,481 - 44 Interest and investment income............................... 821 690 5,334 402 140 7 Rents and concessions........................................... - - 277 - 25,659 - Intergovernmental:
Federal................................................................... - 9,763 38,104 56,082 - - State....................................................................... 105 18,872 7,061 34,616 - - Other...................................................................... - - 2,966 - - -
Charges for services............................................... 78,138 - 16,719 4,184 - 2,477 Other........................................................................ 7 766 202,930 440 217 -
Total revenues................................................ 85,704 94,545 275,446 98,205 26,016 2,528 Expenditures:
Current:Public protection.................................................... - - - - - 373 Public works, transportation and commerce........ 60,507 - 9,417 75 104 - Human welfare and neighborhood
development........................................................ - 183,004 139,388 - 152 - Community health.................................................. - - - 104,163 - - Culture and recreation........................................... - - 280 - 46,632 - General administration and finance....................... - - 2,518 - - - General City responsibilities.................................. - - - - - -
Debt service:Principal retirement................................................ - - - - - - Interest and other fiscal charges........................... - - 665 - - - Bond issuance costs............................................. - - 375 - - -
Total expenditures........................................... 60,507 183,004 152,643 104,238 46,888 373 Excess (deficiency) of revenues
over (under) expenditures............................. 25,197 (88,459) 122,803 (6,033) (20,872) 2,155 Other financing sources (uses):
Transfers in.............................................................. - 96,329 677 - 42,777 212 Transfers out............................................................ (46) (6) (3,845) (352) (24,590) (2,346) Issuance of bonds and loans
Face value of bonds issued................................... - - 24,000 - - - Total other financing sources (uses).............. (46) 96,323 20,832 (352) 18,187 (2,134) Net changes in fund balances........................ 25,151 7,864 143,635 (6,385) (2,685) 21
Fund balances at beginning of year........................... 109,512 94,648 236,918 33,068 27,777 50 Fund balances at end of year..................................... 134,663$ 102,512$ 380,553$ 26,683$ 25,092$ 71$
(Continued)
CITY AND COUNTY OF SAN FRANCISCO Combining Statement of Revenues, Expenditures
and Changes in Fund Balances Nonmajor Governmental Funds – Special Revenue Funds (Continued)
Year Ended June 30, 2016 (In Thousands)
177
Culture and Recreation
Fund
Environmental Protection
FundGasoline Tax Fund
General Services
Fund
Gift and Other
Expendable Trusts Fund Golf Fund
Revenues:Property taxes.......................................................... -$ -$ -$ -$ -$ -$ Business taxes........................................................ - - - - - - Sales and use tax.................................................... - - - - - - Licenses, permits, and franchises.......................... 196 - - 2,808 - - Fines, forfeitures, and penalties............................... 6 - - - 612 - Interest and investment income............................... 79 1 138 56 681 26 Rents and concessions........................................... 411 - - 1,458 - 3,656 Intergovernmental:
Federal................................................................... 133 150 - 420 - - State....................................................................... 121 6,549 23,041 549 - - Other...................................................................... - 96 - - - -
Charges for services............................................... 8,079 - 666 2,035 48 6,779 Other........................................................................ 2,139 21 - 964 5,011 -
Total revenues................................................ 11,164 6,817 23,845 8,290 6,352 10,461 Expenditures:
Current:Public protection.................................................... - - - 229 202 - Public works, transportation and commerce........ 1,007 - 23,752 7 1,841 - Human welfare and neighborhood
development........................................................ 780 7,309 - - 117 - Community health.................................................. - - - - 6,311 - Culture and recreation........................................... 11,866 - - 1,294 2,193 13,852 General administration and finance....................... 13,768 82 - 5,527 98 - General City responsibilities.................................. - - - 21 - -
Debt service:Principal retirement................................................ 390 - - - - - Interest and other fiscal charges........................... 1,069 - - - - - Bond issuance costs............................................. - - - - - -
Total expenditures........................................... 28,880 7,391 23,752 7,078 10,762 13,852 Excess (deficiency) of revenues
over (under) expenditures............................. (17,716) (574) 93 1,212 (4,410) (3,391) Other financing sources (uses):
Transfers in.............................................................. 19,128 150 - 2,606 25 5,942 Transfers out............................................................ (189) (666) - - (65) (1,268) Issuance of bonds and loans
Face value of bonds issued................................... - - - - - - Total other financing sources (uses).............. 18,939 (516) - 2,606 (40) 4,674 Net changes in fund balances........................ 1,223 (1,090) 93 3,818 (4,450) 1,283
Fund balances at beginning of year........................... 11,072 973 26,034 19,353 13,647 4,308 Fund balances at end of year..................................... 12,295$ (117)$ 26,127$ 23,171$ 9,197$ 5,591$
(Continued)
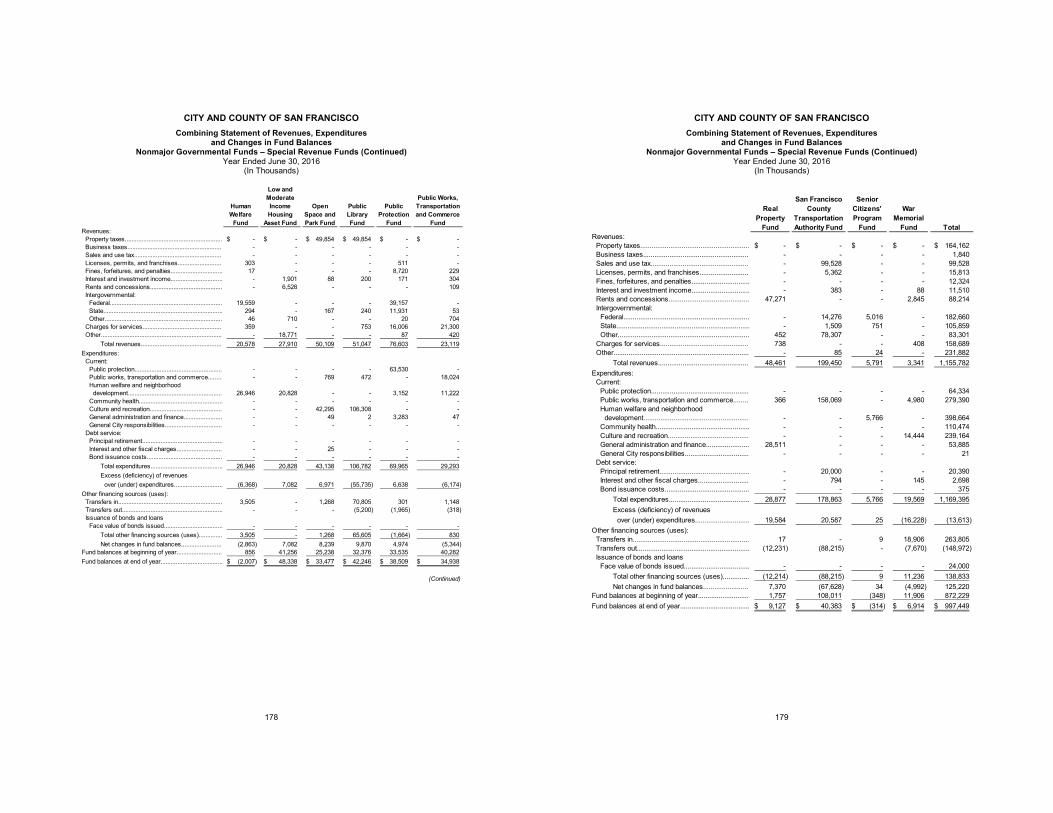
CITY AND COUNTY OF SAN FRANCISCO Combining Statement of Revenues, Expenditures
and Changes in Fund Balances Nonmajor Governmental Funds – Special Revenue Funds (Continued)
Year Ended June 30, 2016 (In Thousands)
178
Human Welfare
Fund
Low and Moderate Income Housing
Asset Fund
Open Space and Park Fund
Public Library Fund
Public Protection
Fund
Public Works, Transportation and Commerce
FundRevenues:
Property taxes.......................................................... -$ -$ 49,854$ 49,854$ -$ -$ Business taxes........................................................ - - - - - - Sales and use tax.................................................... - - - - - - Licenses, permits, and franchises.......................... 303 - - - 511 - Fines, forfeitures, and penalties............................... 17 - - - 8,720 229 Interest and investment income............................... - 1,901 88 200 171 304 Rents and concessions........................................... - 6,528 - - - 109 Intergovernmental:
Federal................................................................... 19,559 - - - 39,157 - State....................................................................... 294 - 167 240 11,931 53 Other...................................................................... 46 710 - - 20 704
Charges for services............................................... 359 - - 753 16,006 21,300 Other........................................................................ - 18,771 - - 87 420
Total revenues................................................ 20,578 27,910 50,109 51,047 76,603 23,119 Expenditures:
Current:Public protection.................................................... - - - - 63,530 - Public works, transportation and commerce........ - - 769 472 - 18,024 Human welfare and neighborhood
development........................................................ 26,946 20,828 - - 3,152 11,222 Community health.................................................. - - - - - - Culture and recreation........................................... - - 42,295 106,308 - - General administration and finance....................... - - 49 2 3,283 47 General City responsibilities.................................. - - - - - -
Debt service:Principal retirement................................................ - - - - - - Interest and other fiscal charges........................... - - 25 - - - Bond issuance costs............................................. - - - - - -
Total expenditures........................................... 26,946 20,828 43,138 106,782 69,965 29,293 Excess (deficiency) of revenues
over (under) expenditures............................. (6,368) 7,082 6,971 (55,735) 6,638 (6,174) Other financing sources (uses):
Transfers in.............................................................. 3,505 - 1,268 70,805 301 1,148 Transfers out............................................................ - - - (5,200) (1,965) (318) Issuance of bonds and loans
Face value of bonds issued................................... - - - - - - Total other financing sources (uses).............. 3,505 - 1,268 65,605 (1,664) 830 Net changes in fund balances........................ (2,863) 7,082 8,239 9,870 4,974 (5,344)
Fund balances at beginning of year........................... 856 41,256 25,238 32,376 33,535 40,282 Fund balances at end of year..................................... (2,007)$ 48,338$ 33,477$ 42,246$ 38,509$ 34,938$
(Continued)
CITY AND COUNTY OF SAN FRANCISCO Combining Statement of Revenues, Expenditures
and Changes in Fund Balances Nonmajor Governmental Funds – Special Revenue Funds (Continued)
Year Ended June 30, 2016 (In Thousands)
179
Real Property
Fund
San Francisco County
Transportation Authority Fund
Senior Citizens' Program
Fund
War Memorial
Fund TotalRevenues:
Property taxes.......................................................... -$ -$ -$ -$ 164,162$ Business taxes........................................................ - - - - 1,840 Sales and use tax.................................................... - 99,528 - - 99,528 Licenses, permits, and franchises.......................... - 5,362 - - 15,813 Fines, forfeitures, and penalties............................... - - - - 12,324 Interest and investment income............................... - 383 - 88 11,510 Rents and concessions........................................... 47,271 - - 2,845 88,214 Intergovernmental:
Federal................................................................... - 14,276 5,016 - 182,660 State....................................................................... - 1,509 751 - 105,859 Other...................................................................... 452 78,307 - - 83,301
Charges for services............................................... 738 - - 408 158,689 Other........................................................................ - 85 24 - 231,882
Total revenues................................................ 48,461 199,450 5,791 3,341 1,155,782 Expenditures:
Current:Public protection.................................................... - - - - 64,334 Public works, transportation and commerce........ 366 158,069 - 4,980 279,390 Human welfare and neighborhood
development........................................................ - - 5,766 - 398,664 Community health.................................................. - - - - 110,474 Culture and recreation........................................... - - - 14,444 239,164 General administration and finance....................... 28,511 - - - 53,885 General City responsibilities.................................. - - - - 21
Debt service:Principal retirement................................................ - 20,000 - - 20,390 Interest and other fiscal charges........................... - 794 - 145 2,698 Bond issuance costs............................................. - - - - 375
Total expenditures........................................... 28,877 178,863 5,766 19,569 1,169,395 Excess (deficiency) of revenues
over (under) expenditures............................. 19,584 20,587 25 (16,228) (13,613) Other financing sources (uses):
Transfers in.............................................................. 17 - 9 18,906 263,805 Transfers out............................................................ (12,231) (88,215) - (7,670) (148,972) Issuance of bonds and loans
Face value of bonds issued................................... - - - - 24,000 Total other financing sources (uses).............. (12,214) (88,215) 9 11,236 138,833 Net changes in fund balances........................ 7,370 (67,628) 34 (4,992) 125,220
Fund balances at beginning of year........................... 1,757 108,011 (348) 11,906 872,229 Fund balances at end of year..................................... 9,127$ 40,383$ (314)$ 6,914$ 997,449$
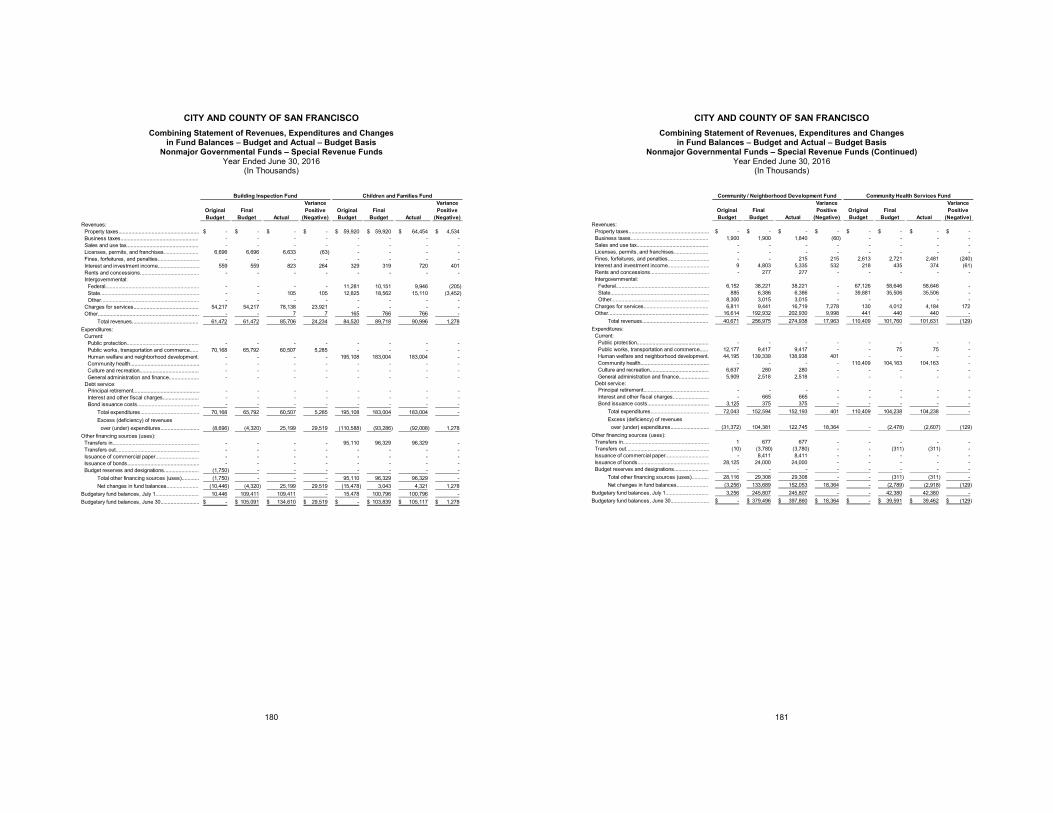
CITY AND COUNTY OF SAN FRANCISCO Combining Statement of Revenues, Expenditures and Changes
in Fund Balances – Budget and Actual – Budget Basis Nonmajor Governmental Funds – Special Revenue Funds
Year Ended June 30, 2016 (In Thousands)
180
Building Inspection Fund Children and Families Fund
Original Budget
Final Budget Actual
Variance Positive
(Negative)Original Budget
Final Budget Actual
Variance Positive
(Negative)Revenues:
Property taxes........................................................ -$ -$ -$ -$ 59,920$ 59,920$ 64,454$ 4,534$ Business taxes...................................................... - - - - - - - - Sales and use tax.................................................. - - - - - - - - Licenses, permits, and franchises........................ 6,696 6,696 6,633 (63) - - - - Fines, forfeitures, and penalties............................. - - - - - - - - Interest and investment income............................. 559 559 823 264 329 319 720 401 Rents and concessions......................................... - - - - - - - - Intergovernmental:
Federal................................................................. - - - - 11,281 10,151 9,946 (205) State..................................................................... - - 105 105 12,825 18,562 15,110 (3,452) Other.................................................................... - - - - - - - -
Charges for services............................................. 54,217 54,217 78,138 23,921 - - - - Other...................................................................... - - 7 7 165 766 766 -
Total revenues.............................................. 61,472 61,472 85,706 24,234 84,520 89,718 90,996 1,278 Expenditures:
Current:Public protection.................................................. - - - - - - - - Public works, transportation and commerce...... 70,168 65,792 60,507 5,285 - - - - Human welfare and neighborhood development. - - - - 195,108 183,004 183,004 - Community health................................................ - - - - - - - - Culture and recreation......................................... - - - - - - - - General administration and finance..................... - - - - - - - -
Debt service:Principal retirement.............................................. - - - - - - - - Interest and other fiscal charges......................... - - - - - - - - Bond issuance costs........................................... - - - - - - - -
Total expenditures......................................... 70,168 65,792 60,507 5,285 195,108 183,004 183,004 - Excess (deficiency) of revenues
over (under) expenditures........................... (8,696) (4,320) 25,199 29,519 (110,588) (93,286) (92,008) 1,278 Other financing sources (uses):
Transfers in............................................................ - - - - 95,110 96,329 96,329 - Transfers out.......................................................... - - - - - - - - Issuance of commercial paper.............................. - - - - - - - - Issuance of bonds.................................................. - - - - - - - - Budget reserves and designations........................ (1,750) - - - - - - -
Total other financing sources (uses)............ (1,750) - - - 95,110 96,329 96,329 - Net changes in fund balances...................... (10,446) (4,320) 25,199 29,519 (15,478) 3,043 4,321 1,278
Budgetary fund balances, July 1.............................. 10,446 109,411 109,411 - 15,478 100,796 100,796 - Budgetary fund balances, June 30........................... -$ 105,091$ 134,610$ 29,519$ -$ 103,839$ 105,117$ 1,278$
CITY AND COUNTY OF SAN FRANCISCO Combining Statement of Revenues, Expenditures and Changes
in Fund Balances – Budget and Actual – Budget Basis Nonmajor Governmental Funds – Special Revenue Funds (Continued)
Year Ended June 30, 2016 (In Thousands)
181
Community / Neighborhood Development Fund Community Health Services Fund
Original Budget
Final Budget Actual
Variance Positive
(Negative)Original Budget
Final Budget Actual
Variance Positive
(Negative)Revenues:
Property taxes........................................................ -$ -$ -$ -$ -$ -$ -$ -$ Business taxes...................................................... 1,900 1,900 1,840 (60) - - - - Sales and use tax.................................................. - - - - - - - - Licenses, permits, and franchises........................ - - - - - - - - Fines, forfeitures, and penalties............................. - - 215 215 2,613 2,721 2,481 (240) Interest and investment income............................. 9 4,803 5,335 532 218 435 374 (61) Rents and concessions......................................... - 277 277 - - - - - Intergovernmental:
Federal................................................................. 6,152 38,221 38,221 - 67,126 58,646 58,646 - State..................................................................... 885 6,386 6,386 - 39,881 35,506 35,506 - Other.................................................................... 8,300 3,015 3,015 - - - - -
Charges for services............................................. 6,811 9,441 16,719 7,278 130 4,012 4,184 172 Other...................................................................... 16,614 192,932 202,930 9,998 441 440 440 -
Total revenues.............................................. 40,671 256,975 274,938 17,963 110,409 101,760 101,631 (129) Expenditures:
Current:Public protection.................................................. - - - - - - - - Public works, transportation and commerce...... 12,177 9,417 9,417 - - 75 75 - Human welfare and neighborhood development. 44,195 139,339 138,938 401 - - - - Community health................................................ - - - - 110,409 104,163 104,163 - Culture and recreation......................................... 6,637 280 280 - - - - - General administration and finance..................... 5,909 2,518 2,518 - - - - -
Debt service:Principal retirement.............................................. - - - - - - - - Interest and other fiscal charges......................... - 665 665 - - - - - Bond issuance costs........................................... 3,125 375 375 - - - - -
Total expenditures......................................... 72,043 152,594 152,193 401 110,409 104,238 104,238 - Excess (deficiency) of revenues
over (under) expenditures........................... (31,372) 104,381 122,745 18,364 - (2,478) (2,607) (129) Other financing sources (uses):
Transfers in............................................................ 1 677 677 - - - - - Transfers out.......................................................... (10) (3,780) (3,780) - - (311) (311) - Issuance of commercial paper.............................. - 8,411 8,411 - - - - - Issuance of bonds.................................................. 28,125 24,000 24,000 - - - - - Budget reserves and designations........................ - - - - - - - -
Total other financing sources (uses)............ 28,116 29,308 29,308 - - (311) (311) - Net changes in fund balances...................... (3,256) 133,689 152,053 18,364 - (2,789) (2,918) (129)
Budgetary fund balances, July 1.............................. 3,256 245,807 245,807 - - 42,380 42,380 - Budgetary fund balances, June 30........................... -$ 379,496$ 397,860$ 18,364$ -$ 39,591$ 39,462$ (129)$
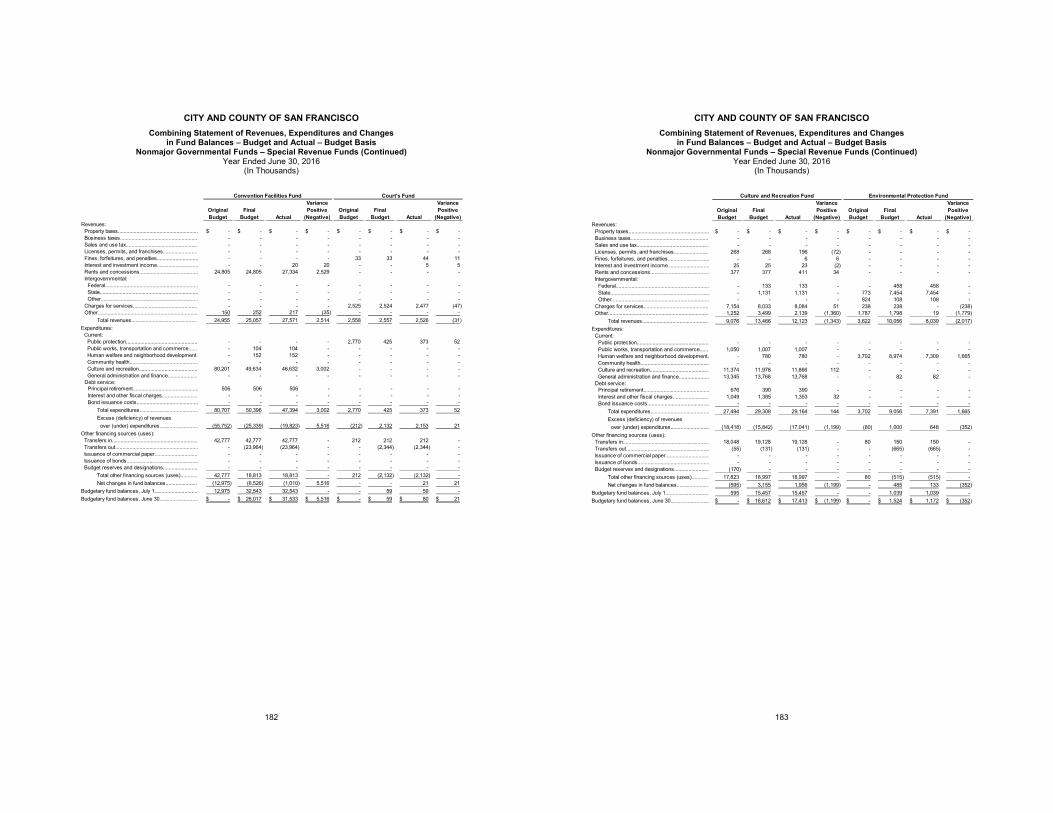
CITY AND COUNTY OF SAN FRANCISCO Combining Statement of Revenues, Expenditures and Changes
in Fund Balances – Budget and Actual – Budget Basis Nonmajor Governmental Funds – Special Revenue Funds (Continued)
Year Ended June 30, 2016 (In Thousands)
182
Convention Facilities Fund Court's Fund
Original Budget
Final Budget Actual
Variance Positive
(Negative)Original Budget
Final Budget Actual
Variance Positive
(Negative)Revenues:
Property taxes........................................................ -$ -$ -$ -$ -$ -$ -$ -$ Business taxes...................................................... - - - - - - - - Sales and use tax.................................................. - - - - - - - - Licenses, permits, and franchises........................ - - - - - - - - Fines, forfeitures, and penalties............................. - - - - 33 33 44 11 Interest and investment income............................. - - 20 20 - - 5 5 Rents and concessions......................................... 24,805 24,805 27,334 2,529 - - - - Intergovernmental:
Federal................................................................. - - - - - - - - State..................................................................... - - - - - - - - Other.................................................................... - - - - - - - -
Charges for services............................................. - - - - 2,525 2,524 2,477 (47) Other...................................................................... 150 252 217 (35) - - - -
Total revenues.............................................. 24,955 25,057 27,571 2,514 2,558 2,557 2,526 (31) Expenditures:
Current:Public protection.................................................. - - - - 2,770 425 373 52 Public works, transportation and commerce...... - 104 104 - - - - - Human welfare and neighborhood development. - 152 152 - - - - - Community health................................................ - - - - - - - - Culture and recreation......................................... 80,201 49,634 46,632 3,002 - - - - General administration and finance..................... - - - - - - - -
Debt service:Principal retirement.............................................. 506 506 506 - - - - - Interest and other fiscal charges......................... - - - - - - - - Bond issuance costs........................................... - - - - - - - -
Total expenditures......................................... 80,707 50,396 47,394 3,002 2,770 425 373 52 Excess (deficiency) of revenues
over (under) expenditures........................... (55,752) (25,339) (19,823) 5,516 (212) 2,132 2,153 21 Other financing sources (uses):
Transfers in............................................................ 42,777 42,777 42,777 - 212 212 212 - Transfers out.......................................................... - (23,964) (23,964) - - (2,344) (2,344) - Issuance of commercial paper.............................. - - - - - - - - Issuance of bonds.................................................. - - - - - - - - Budget reserves and designations........................ - - - - - - - -
Total other financing sources (uses)............ 42,777 18,813 18,813 - 212 (2,132) (2,132) - Net changes in fund balances...................... (12,975) (6,526) (1,010) 5,516 - - 21 21
Budgetary fund balances, July 1.............................. 12,975 32,543 32,543 - - 59 59 - Budgetary fund balances, June 30........................... -$ 26,017$ 31,533$ 5,516$ -$ 59$ 80$ 21$
CITY AND COUNTY OF SAN FRANCISCO Combining Statement of Revenues, Expenditures and Changes
in Fund Balances – Budget and Actual – Budget Basis Nonmajor Governmental Funds – Special Revenue Funds (Continued)
Year Ended June 30, 2016 (In Thousands)
183
Culture and Recreation Fund Environmental Protection Fund
Original Budget
Final Budget Actual
Variance Positive
(Negative)Original Budget
Final Budget Actual
Variance Positive
(Negative)Revenues:
Property taxes........................................................ -$ -$ -$ -$ -$ -$ -$ -$ Business taxes...................................................... - - - - - - - - Sales and use tax.................................................. - - - - - - - - Licenses, permits, and franchises........................ 268 268 196 (72) - - - - Fines, forfeitures, and penalties............................. - - 6 6 - - - - Interest and investment income............................. 25 25 23 (2) - - - - Rents and concessions......................................... 377 377 411 34 - - - - Intergovernmental:
Federal................................................................. - 133 133 - - 458 458 - State..................................................................... - 1,131 1,131 - 773 7,454 7,454 - Other.................................................................... - - - - 824 108 108 -
Charges for services............................................. 7,154 8,033 8,084 51 238 238 - (238) Other...................................................................... 1,252 3,499 2,139 (1,360) 1,787 1,798 19 (1,779)
Total revenues.............................................. 9,076 13,466 12,123 (1,343) 3,622 10,056 8,039 (2,017) Expenditures:
Current:Public protection.................................................. - - - - - - - - Public works, transportation and commerce...... 1,050 1,007 1,007 - - - - - Human welfare and neighborhood development. - 780 780 - 3,702 8,974 7,309 1,665 Community health................................................ - - - - - - - - Culture and recreation......................................... 11,374 11,978 11,866 112 - - - - General administration and finance..................... 13,345 13,768 13,768 - - 82 82 -
Debt service:Principal retirement.............................................. 676 390 390 - - - - - Interest and other fiscal charges......................... 1,049 1,385 1,353 32 - - - - Bond issuance costs........................................... - - - - - - - -
Total expenditures......................................... 27,494 29,308 29,164 144 3,702 9,056 7,391 1,665 Excess (deficiency) of revenues
over (under) expenditures........................... (18,418) (15,842) (17,041) (1,199) (80) 1,000 648 (352) Other financing sources (uses):
Transfers in............................................................ 18,048 19,128 19,128 - 80 150 150 - Transfers out.......................................................... (55) (131) (131) - - (665) (665) - Issuance of commercial paper.............................. - - - - - - - - Issuance of bonds.................................................. - - - - - - - - Budget reserves and designations........................ (170) - - - - - - -
Total other financing sources (uses)............ 17,823 18,997 18,997 - 80 (515) (515) - Net changes in fund balances...................... (595) 3,155 1,956 (1,199) - 485 133 (352)
Budgetary fund balances, July 1.............................. 595 15,457 15,457 - - 1,039 1,039 - Budgetary fund balances, June 30........................... -$ 18,612$ 17,413$ (1,199)$ -$ 1,524$ 1,172$ (352)$
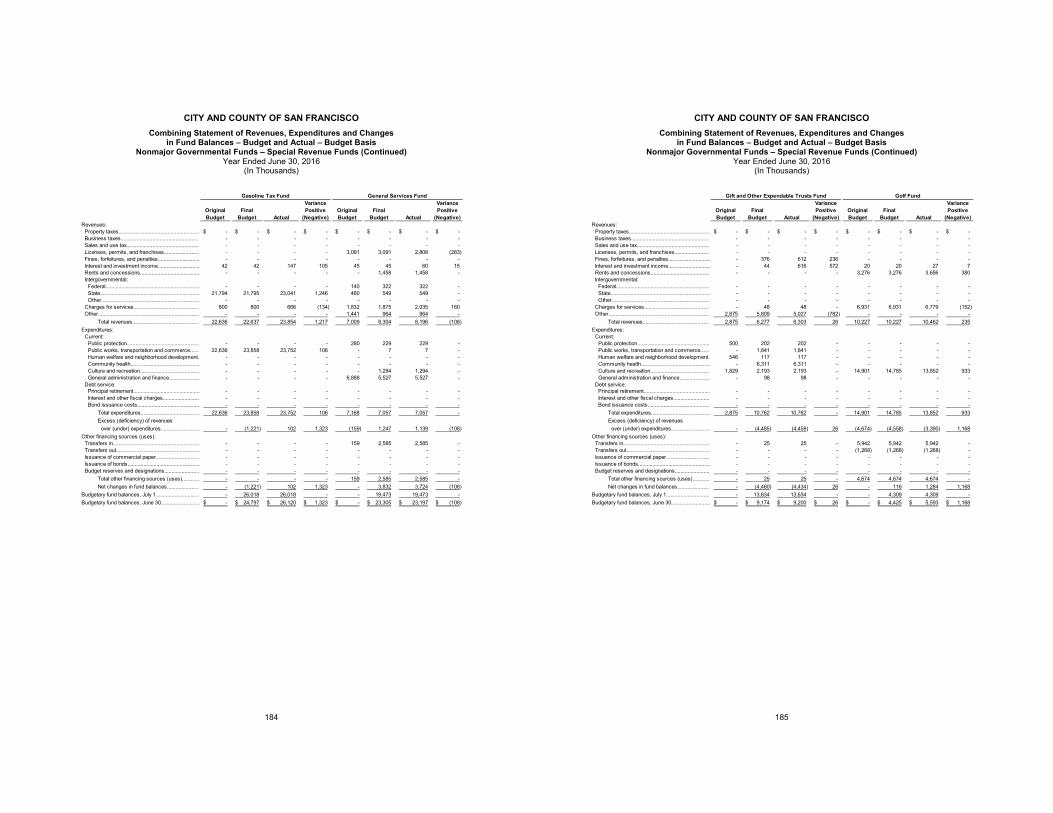
CITY AND COUNTY OF SAN FRANCISCO Combining Statement of Revenues, Expenditures and Changes
in Fund Balances – Budget and Actual – Budget Basis Nonmajor Governmental Funds – Special Revenue Funds (Continued)
Year Ended June 30, 2016 (In Thousands)
184
Gasoline Tax Fund General Services Fund
Original Budget
Final Budget Actual
Variance Positive
(Negative)Original Budget
Final Budget Actual
Variance Positive
(Negative)Revenues:
Property taxes........................................................ -$ -$ -$ -$ -$ -$ -$ -$ Business taxes...................................................... - - - - - - - - Sales and use tax.................................................. - - - - - - - - Licenses, permits, and franchises........................ - - - - 3,091 3,091 2,808 (283) Fines, forfeitures, and penalties............................. - - - - - - - - Interest and investment income............................. 42 42 147 105 45 45 60 15 Rents and concessions......................................... - - - - - 1,458 1,458 - Intergovernmental:
Federal................................................................. - - - - 140 322 322 - State..................................................................... 21,794 21,795 23,041 1,246 460 549 549 - Other.................................................................... - - - - - - - -
Charges for services............................................. 800 800 666 (134) 1,832 1,875 2,035 160 Other...................................................................... - - - - 1,441 964 964 -
Total revenues.............................................. 22,636 22,637 23,854 1,217 7,009 8,304 8,196 (108) Expenditures:
Current:Public protection.................................................. - - - - 280 229 229 - Public works, transportation and commerce...... 22,636 23,858 23,752 106 - 7 7 - Human welfare and neighborhood development. - - - - - - - - Community health................................................ - - - - - - - - Culture and recreation......................................... - - - - - 1,294 1,294 - General administration and finance..................... - - - - 6,888 5,527 5,527 -
Debt service:Principal retirement.............................................. - - - - - - - - Interest and other fiscal charges......................... - - - - - - - - Bond issuance costs........................................... - - - - - - - -
Total expenditures......................................... 22,636 23,858 23,752 106 7,168 7,057 7,057 - Excess (deficiency) of revenues
over (under) expenditures........................... - (1,221) 102 1,323 (159) 1,247 1,139 (108) Other financing sources (uses):
Transfers in............................................................ - - - - 159 2,585 2,585 - Transfers out.......................................................... - - - - - - - - Issuance of commercial paper.............................. - - - - - - - - Issuance of bonds.................................................. - - - - - - - - Budget reserves and designations........................ - - - - - - - -
Total other financing sources (uses)............ - - - - 159 2,585 2,585 - Net changes in fund balances...................... - (1,221) 102 1,323 - 3,832 3,724 (108)
Budgetary fund balances, July 1.............................. - 26,018 26,018 - - 19,473 19,473 - Budgetary fund balances, June 30........................... -$ 24,797$ 26,120$ 1,323$ -$ 23,305$ 23,197$ (108)$
CITY AND COUNTY OF SAN FRANCISCO Combining Statement of Revenues, Expenditures and Changes
in Fund Balances – Budget and Actual – Budget Basis Nonmajor Governmental Funds – Special Revenue Funds (Continued)
Year Ended June 30, 2016 (In Thousands)
185
Gift and Other Expendable Trusts Fund Golf Fund
Original Budget
Final Budget Actual
Variance Positive
(Negative)Original Budget
Final Budget Actual
Variance Positive
(Negative)Revenues:
Property taxes........................................................ -$ -$ -$ -$ -$ -$ -$ -$ Business taxes...................................................... - - - - - - - - Sales and use tax.................................................. - - - - - - - - Licenses, permits, and franchises........................ - - - - - - - - Fines, forfeitures, and penalties............................. - 376 612 236 - - - - Interest and investment income............................. - 44 616 572 20 20 27 7 Rents and concessions......................................... - - - - 3,276 3,276 3,656 380 Intergovernmental:
Federal................................................................. - - - - - - - - State..................................................................... - - - - - - - - Other.................................................................... - - - - - - - -
Charges for services............................................. - 48 48 - 6,931 6,931 6,779 (152) Other...................................................................... 2,875 5,809 5,027 (782) - - - -
Total revenues.............................................. 2,875 6,277 6,303 26 10,227 10,227 10,462 235 Expenditures:
Current:Public protection.................................................. 500 202 202 - - - - - Public works, transportation and commerce...... - 1,841 1,841 - - - - - Human welfare and neighborhood development. 546 117 117 - - - - - Community health................................................ - 6,311 6,311 - - - - - Culture and recreation......................................... 1,829 2,193 2,193 - 14,901 14,785 13,852 933 General administration and finance..................... - 98 98 - - - - -
Debt service:Principal retirement.............................................. - - - - - - - - Interest and other fiscal charges......................... - - - - - - - - Bond issuance costs........................................... - - - - - - - -
Total expenditures......................................... 2,875 10,762 10,762 - 14,901 14,785 13,852 933 Excess (deficiency) of revenues
over (under) expenditures........................... - (4,485) (4,459) 26 (4,674) (4,558) (3,390) 1,168 Other financing sources (uses):
Transfers in............................................................ - 25 25 - 5,942 5,942 5,942 - Transfers out.......................................................... - - - - (1,268) (1,268) (1,268) - Issuance of commercial paper.............................. - - - - - - - - Issuance of bonds.................................................. - - - - - - - - Budget reserves and designations........................ - - - - - - - -
Total other financing sources (uses)............ - 25 25 - 4,674 4,674 4,674 - Net changes in fund balances...................... - (4,460) (4,434) 26 - 116 1,284 1,168
Budgetary fund balances, July 1.............................. - 13,634 13,634 - - 4,309 4,309 - Budgetary fund balances, June 30........................... -$ 9,174$ 9,200$ 26$ -$ 4,425$ 5,593$ 1,168$
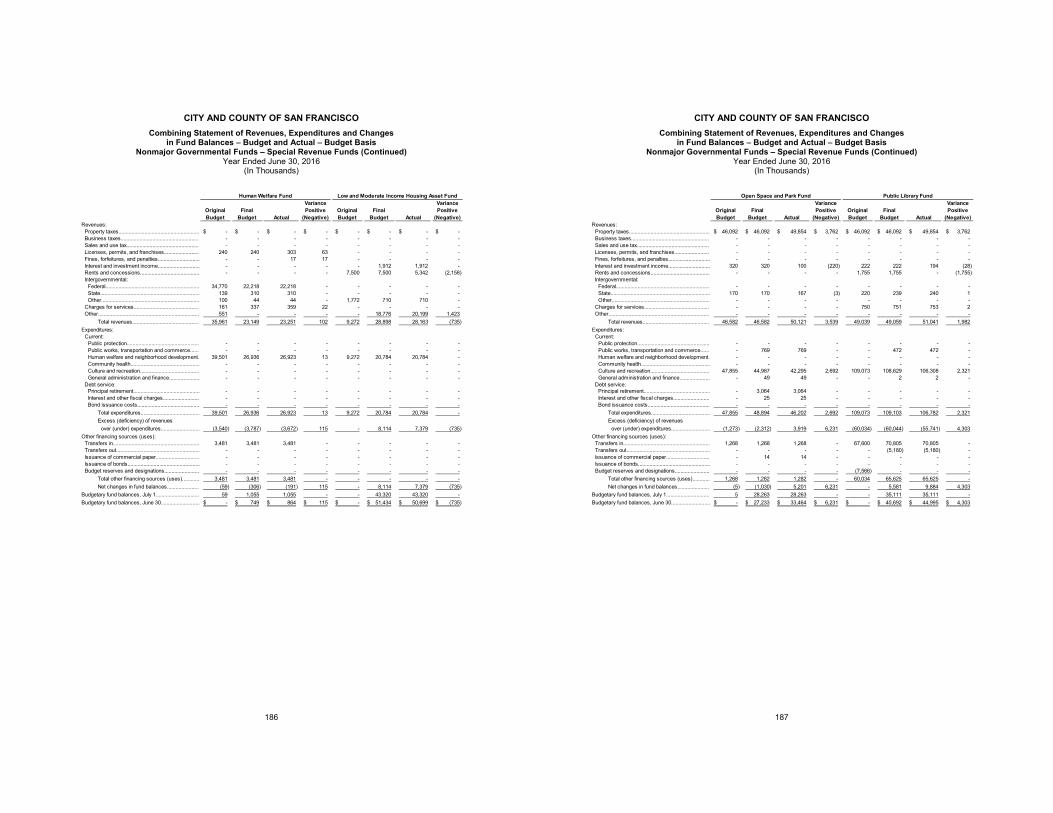
CITY AND COUNTY OF SAN FRANCISCO Combining Statement of Revenues, Expenditures and Changes
in Fund Balances – Budget and Actual – Budget Basis Nonmajor Governmental Funds – Special Revenue Funds (Continued)
Year Ended June 30, 2016 (In Thousands)
186
Human Welfare Fund Low and Moderate Income Housing Asset Fund
Original Budget
Final Budget Actual
Variance Positive
(Negative)Original Budget
Final Budget Actual
Variance Positive
(Negative)Revenues:
Property taxes........................................................ -$ -$ -$ -$ -$ -$ -$ -$ Business taxes...................................................... - - - - - - - - Sales and use tax.................................................. - - - - - - - - Licenses, permits, and franchises........................ 240 240 303 63 - - - - Fines, forfeitures, and penalties............................. - - 17 17 - - - - Interest and investment income............................. - - - - - 1,912 1,912 - Rents and concessions......................................... - - - - 7,500 7,500 5,342 (2,158) Intergovernmental:
Federal................................................................. 34,770 22,218 22,218 - - - - - State..................................................................... 139 310 310 - - - - - Other.................................................................... 100 44 44 - 1,772 710 710 -
Charges for services............................................. 161 337 359 22 - - - - Other...................................................................... 551 - - - - 18,776 20,199 1,423
Total revenues.............................................. 35,961 23,149 23,251 102 9,272 28,898 28,163 (735) Expenditures:
Current:Public protection.................................................. - - - - - - - - Public works, transportation and commerce...... - - - - - - - - Human welfare and neighborhood development. 39,501 26,936 26,923 13 9,272 20,784 20,784 - Community health................................................ - - - - - - - - Culture and recreation......................................... - - - - - - - - General administration and finance..................... - - - - - - - -
Debt service:Principal retirement.............................................. - - - - - - - - Interest and other fiscal charges......................... - - - - - - - - Bond issuance costs........................................... - - - - - - - -
Total expenditures......................................... 39,501 26,936 26,923 13 9,272 20,784 20,784 - Excess (deficiency) of revenues
over (under) expenditures........................... (3,540) (3,787) (3,672) 115 - 8,114 7,379 (735) Other financing sources (uses):
Transfers in............................................................ 3,481 3,481 3,481 - - - - - Transfers out.......................................................... - - - - - - - - Issuance of commercial paper.............................. - - - - - - - - Issuance of bonds.................................................. - - - - - - - - Budget reserves and designations........................ - - - - - - - -
Total other financing sources (uses)............ 3,481 3,481 3,481 - - - - - Net changes in fund balances...................... (59) (306) (191) 115 - 8,114 7,379 (735)
Budgetary fund balances, July 1.............................. 59 1,055 1,055 - - 43,320 43,320 - Budgetary fund balances, June 30........................... -$ 749$ 864$ 115$ -$ 51,434$ 50,699$ (735)$
CITY AND COUNTY OF SAN FRANCISCO Combining Statement of Revenues, Expenditures and Changes
in Fund Balances – Budget and Actual – Budget Basis Nonmajor Governmental Funds – Special Revenue Funds (Continued)
Year Ended June 30, 2016 (In Thousands)
187
Open Space and Park Fund Public Library Fund
Original Budget
Final Budget Actual
Variance Positive
(Negative)Original Budget
Final Budget Actual
Variance Positive
(Negative)Revenues:
Property taxes........................................................ 46,092$ 46,092$ 49,854$ 3,762$ 46,092$ 46,092$ 49,854$ 3,762$ Business taxes...................................................... - - - - - - - - Sales and use tax.................................................. - - - - - - - - Licenses, permits, and franchises........................ - - - - - - - - Fines, forfeitures, and penalties............................. - - - - - - - - Interest and investment income............................. 320 320 100 (220) 222 222 194 (28) Rents and concessions......................................... - - - - 1,755 1,755 - (1,755) Intergovernmental:
Federal................................................................. - - - - - - - - State..................................................................... 170 170 167 (3) 220 239 240 1 Other.................................................................... - - - - - - - -
Charges for services............................................. - - - - 750 751 753 2 Other...................................................................... - - - - - - - -
Total revenues.............................................. 46,582 46,582 50,121 3,539 49,039 49,059 51,041 1,982 Expenditures:
Current:Public protection.................................................. - - - - - - - - Public works, transportation and commerce...... - 769 769 - - 472 472 - Human welfare and neighborhood development. - - - - - - - - Community health................................................ - - - - - - - - Culture and recreation......................................... 47,855 44,987 42,295 2,692 109,073 108,629 106,308 2,321 General administration and finance..................... - 49 49 - - 2 2 -
Debt service:Principal retirement.............................................. - 3,064 3,064 - - - - - Interest and other fiscal charges......................... - 25 25 - - - - - Bond issuance costs........................................... - - - - - - - -
Total expenditures......................................... 47,855 48,894 46,202 2,692 109,073 109,103 106,782 2,321 Excess (deficiency) of revenues
over (under) expenditures........................... (1,273) (2,312) 3,919 6,231 (60,034) (60,044) (55,741) 4,303 Other financing sources (uses):
Transfers in............................................................ 1,268 1,268 1,268 - 67,600 70,805 70,805 - Transfers out.......................................................... - - - - - (5,180) (5,180) - Issuance of commercial paper.............................. - 14 14 - - - - - Issuance of bonds.................................................. - - - - - - - - Budget reserves and designations........................ - - - - (7,566) - - -
Total other financing sources (uses)............ 1,268 1,282 1,282 - 60,034 65,625 65,625 - Net changes in fund balances...................... (5) (1,030) 5,201 6,231 - 5,581 9,884 4,303
Budgetary fund balances, July 1.............................. 5 28,263 28,263 - - 35,111 35,111 - Budgetary fund balances, June 30........................... -$ 27,233$ 33,464$ 6,231$ -$ 40,692$ 44,995$ 4,303$
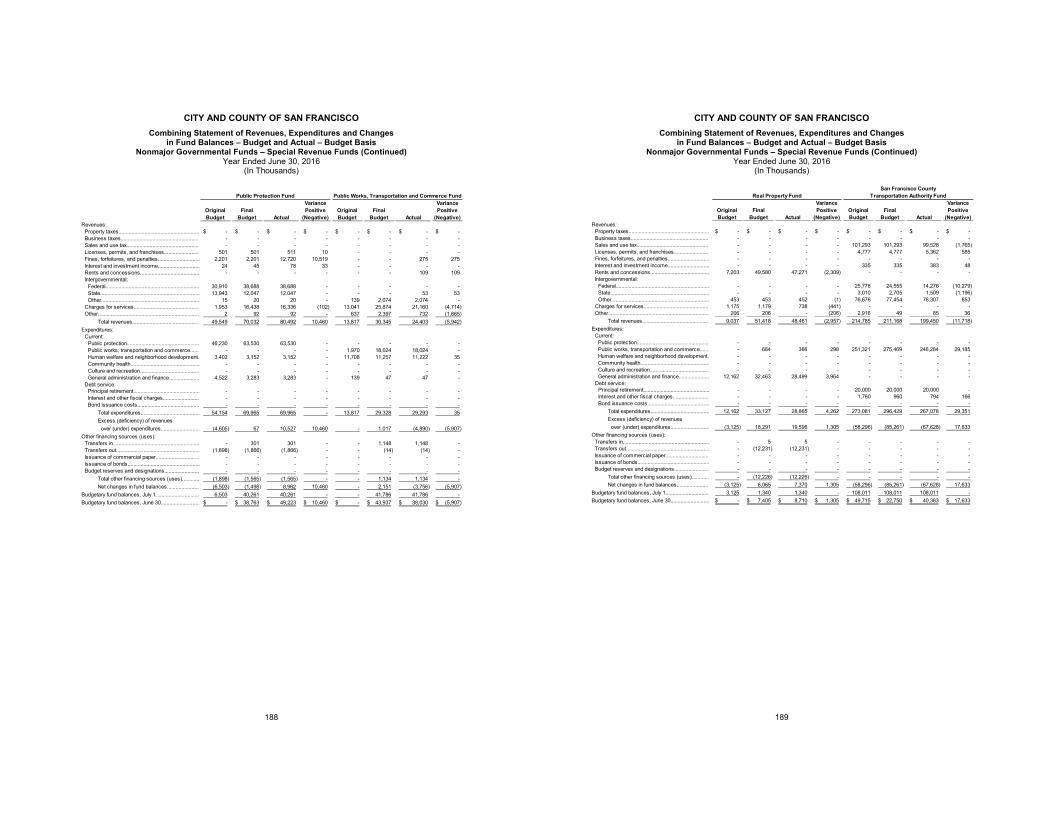
CITY AND COUNTY OF SAN FRANCISCO Combining Statement of Revenues, Expenditures and Changes
in Fund Balances – Budget and Actual – Budget Basis Nonmajor Governmental Funds – Special Revenue Funds (Continued)
Year Ended June 30, 2016 (In Thousands)
188
Public Protection Fund Public Works, Transportation and Commerce Fund
Original Budget
Final Budget Actual
Variance Positive
(Negative)Original Budget
Final Budget Actual
Variance Positive
(Negative)Revenues:
Property taxes........................................................ -$ -$ -$ -$ -$ -$ -$ -$ Business taxes...................................................... - - - - - - - - Sales and use tax.................................................. - - - - - - - - Licenses, permits, and franchises........................ 501 501 511 10 - - - - Fines, forfeitures, and penalties............................. 2,201 2,201 12,720 10,519 - - 275 275 Interest and investment income............................. 24 45 78 33 - - - - Rents and concessions......................................... - - - - - - 109 109 Intergovernmental:
Federal................................................................. 30,910 38,688 38,688 - - - - - State..................................................................... 13,943 12,047 12,047 - - - 53 53 Other.................................................................... 15 20 20 - 139 2,074 2,074 -
Charges for services............................................. 1,953 16,438 16,336 (102) 13,041 25,874 21,160 (4,714) Other...................................................................... 2 92 92 - 637 2,397 732 (1,665)
Total revenues.............................................. 49,549 70,032 80,492 10,460 13,817 30,345 24,403 (5,942) Expenditures:
Current:Public protection.................................................. 46,230 63,530 63,530 - - - - - Public works, transportation and commerce...... - - - - 1,970 18,024 18,024 - Human welfare and neighborhood development. 3,402 3,152 3,152 - 11,708 11,257 11,222 35 Community health................................................ - - - - - - - - Culture and recreation......................................... - - - - - - - - General administration and finance..................... 4,522 3,283 3,283 - 139 47 47 -
Debt service:Principal retirement.............................................. - - - - - - - - Interest and other fiscal charges......................... - - - - - - - - Bond issuance costs........................................... - - - - - - - -
Total expenditures......................................... 54,154 69,965 69,965 - 13,817 29,328 29,293 35 Excess (deficiency) of revenues
over (under) expenditures........................... (4,605) 67 10,527 10,460 - 1,017 (4,890) (5,907) Other financing sources (uses):
Transfers in............................................................ - 301 301 - - 1,148 1,148 - Transfers out.......................................................... (1,898) (1,866) (1,866) - - (14) (14) - Issuance of commercial paper.............................. - - - - - - - - Issuance of bonds.................................................. - - - - - - - - Budget reserves and designations........................ - - - - - - - -
Total other financing sources (uses)............ (1,898) (1,565) (1,565) - - 1,134 1,134 - Net changes in fund balances...................... (6,503) (1,498) 8,962 10,460 - 2,151 (3,756) (5,907)
Budgetary fund balances, July 1.............................. 6,503 40,261 40,261 - - 41,786 41,786 - Budgetary fund balances, June 30........................... -$ 38,763$ 49,223$ 10,460$ -$ 43,937$ 38,030$ (5,907)$
CITY AND COUNTY OF SAN FRANCISCO Combining Statement of Revenues, Expenditures and Changes
in Fund Balances – Budget and Actual – Budget Basis Nonmajor Governmental Funds – Special Revenue Funds (Continued)
Year Ended June 30, 2016 (In Thousands)
189
Real Property FundSan Francisco County
Transportation Authority Fund
Original Budget
Final Budget Actual
Variance Positive
(Negative)Original Budget
Final Budget Actual
Variance Positive
(Negative)Revenues:
Property taxes........................................................ -$ -$ -$ -$ -$ -$ -$ -$ Business taxes...................................................... - - - - - - - - Sales and use tax.................................................. - - - - 101,293 101,293 99,528 (1,765) Licenses, permits, and franchises........................ - - - - 4,777 4,777 5,362 585 Fines, forfeitures, and penalties............................. - - - - - - - - Interest and investment income............................. - - - - 335 335 383 48 Rents and concessions......................................... 7,203 49,580 47,271 (2,309) - - - - Intergovernmental:
Federal................................................................. - - - - 25,778 24,555 14,276 (10,279) State..................................................................... - - - - 3,010 2,705 1,509 (1,196) Other.................................................................... 453 453 452 (1) 76,676 77,454 78,307 853
Charges for services............................................. 1,175 1,179 738 (441) - - - - Other...................................................................... 206 206 - (206) 2,916 49 85 36
Total revenues.............................................. 9,037 51,418 48,461 (2,957) 214,785 211,168 199,450 (11,718) Expenditures:
Current:Public protection.................................................. - - - - - - - - Public works, transportation and commerce...... - 664 366 298 251,321 275,469 246,284 29,185 Human welfare and neighborhood development. - - - - - - - - Community health................................................ - - - - - - - - Culture and recreation......................................... - - - - - - - - General administration and finance..................... 12,162 32,463 28,499 3,964 - - - -
Debt service:Principal retirement.............................................. - - - - 20,000 20,000 20,000 - Interest and other fiscal charges......................... - - - - 1,760 960 794 166 Bond issuance costs........................................... - - - - - - - -
Total expenditures......................................... 12,162 33,127 28,865 4,262 273,081 296,429 267,078 29,351 Excess (deficiency) of revenues
over (under) expenditures........................... (3,125) 18,291 19,596 1,305 (58,296) (85,261) (67,628) 17,633 Other financing sources (uses):
Transfers in............................................................ - 5 5 - - - - - Transfers out.......................................................... - (12,231) (12,231) - - - - - Issuance of commercial paper.............................. - - - - - - - - Issuance of bonds.................................................. - - - - - - - - Budget reserves and designations........................ - - - - - - - -
Total other financing sources (uses)............ - (12,226) (12,226) - - - - - Net changes in fund balances...................... (3,125) 6,065 7,370 1,305 (58,296) (85,261) (67,628) 17,633
Budgetary fund balances, July 1.............................. 3,125 1,340 1,340 - 108,011 108,011 108,011 - Budgetary fund balances, June 30........................... -$ 7,405$ 8,710$ 1,305$ 49,715$ 22,750$ 40,383$ 17,633$
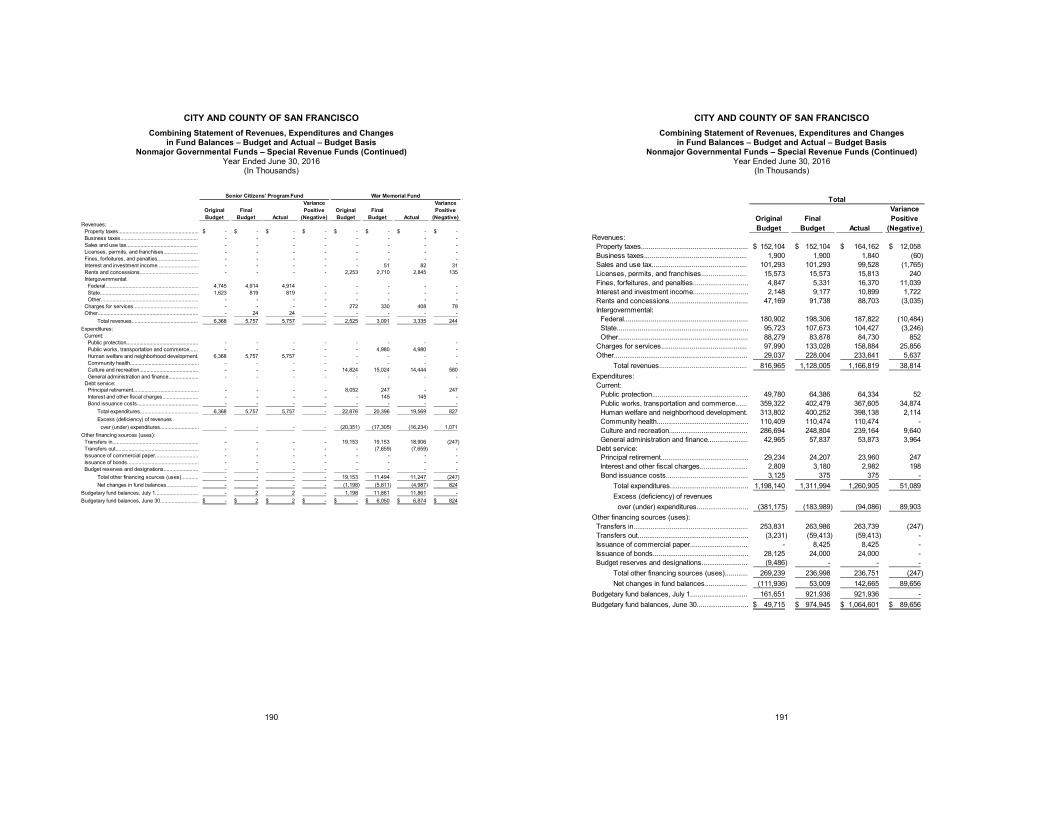
CITY AND COUNTY OF SAN FRANCISCO Combining Statement of Revenues, Expenditures and Changes
in Fund Balances – Budget and Actual – Budget Basis Nonmajor Governmental Funds – Special Revenue Funds (Continued)
Year Ended June 30, 2016 (In Thousands)
190
Senior Citizens' Program Fund War Memorial Fund
Original Budget
Final Budget Actual
Variance Positive
(Negative)Original Budget
Final Budget Actual
Variance Positive
(Negative)Revenues:
Property taxes........................................................ -$ -$ -$ -$ -$ -$ -$ -$ Business taxes...................................................... - - - - - - - - Sales and use tax.................................................. - - - - - - - - Licenses, permits, and franchises........................ - - - - - - - - Fines, forfeitures, and penalties............................. - - - - - - - - Interest and investment income............................. - - - - - 51 82 31 Rents and concessions......................................... - - - - 2,253 2,710 2,845 135 Intergovernmental:
Federal................................................................. 4,745 4,914 4,914 - - - - - State..................................................................... 1,623 819 819 - - - - - Other.................................................................... - - - - - - - -
Charges for services............................................. - - - - 272 330 408 78 Other...................................................................... - 24 24 - - - - -
Total revenues.............................................. 6,368 5,757 5,757 - 2,525 3,091 3,335 244 Expenditures:
Current:Public protection.................................................. - - - - - - - - Public works, transportation and commerce...... - - - - - 4,980 4,980 - Human welfare and neighborhood development. 6,368 5,757 5,757 - - - - - Community health................................................ - - - - - - - - Culture and recreation......................................... - - - - 14,824 15,024 14,444 580 General administration and finance..................... - - - - - - - -
Debt service:Principal retirement.............................................. - - - - 8,052 247 - 247 Interest and other fiscal charges......................... - - - - - 145 145 - Bond issuance costs........................................... - - - - - - - -
Total expenditures......................................... 6,368 5,757 5,757 - 22,876 20,396 19,569 827 Excess (deficiency) of revenues
over (under) expenditures........................... - - - - (20,351) (17,305) (16,234) 1,071 Other financing sources (uses):
Transfers in............................................................ - - - - 19,153 19,153 18,906 (247) Transfers out.......................................................... - - - - - (7,659) (7,659) - Issuance of commercial paper.............................. - - - - - - - - Issuance of bonds.................................................. - - - - - - - - Budget reserves and designations........................ - - - - - - - -
Total other financing sources (uses)............ - - - - 19,153 11,494 11,247 (247) Net changes in fund balances...................... - - - - (1,198) (5,811) (4,987) 824
Budgetary fund balances, July 1.............................. - 2 2 - 1,198 11,861 11,861 - Budgetary fund balances, June 30........................... -$ 2$ 2$ -$ -$ 6,050$ 6,874$ 824$
CITY AND COUNTY OF SAN FRANCISCO Combining Statement of Revenues, Expenditures and Changes
in Fund Balances – Budget and Actual – Budget Basis Nonmajor Governmental Funds – Special Revenue Funds (Continued)
Year Ended June 30, 2016 (In Thousands)
191
Total
Original Budget
Final Budget Actual
Variance Positive
(Negative)Revenues:
Property taxes........................................................ 152,104$ 152,104$ 164,162$ 12,058$ Business taxes...................................................... 1,900 1,900 1,840 (60) Sales and use tax.................................................. 101,293 101,293 99,528 (1,765) Licenses, permits, and franchises........................ 15,573 15,573 15,813 240 Fines, forfeitures, and penalties............................. 4,847 5,331 16,370 11,039 Interest and investment income............................. 2,148 9,177 10,899 1,722 Rents and concessions......................................... 47,169 91,738 88,703 (3,035) Intergovernmental:
Federal................................................................. 180,902 198,306 187,822 (10,484) State..................................................................... 95,723 107,673 104,427 (3,246) Other.................................................................... 88,279 83,878 84,730 852
Charges for services............................................. 97,990 133,028 158,884 25,856 Other...................................................................... 29,037 228,004 233,641 5,637
Total revenues.............................................. 816,965 1,128,005 1,166,819 38,814 Expenditures:
Current:Public protection.................................................. 49,780 64,386 64,334 52 Public works, transportation and commerce...... 359,322 402,479 367,605 34,874 Human welfare and neighborhood development. 313,802 400,252 398,138 2,114 Community health................................................ 110,409 110,474 110,474 - Culture and recreation......................................... 286,694 248,804 239,164 9,640 General administration and finance..................... 42,965 57,837 53,873 3,964
Debt service:Principal retirement.............................................. 29,234 24,207 23,960 247 Interest and other fiscal charges......................... 2,809 3,180 2,982 198 Bond issuance costs........................................... 3,125 375 375 -
Total expenditures......................................... 1,198,140 1,311,994 1,260,905 51,089 Excess (deficiency) of revenues
over (under) expenditures........................... (381,175) (183,989) (94,086) 89,903 Other financing sources (uses):
Transfers in............................................................ 253,831 263,986 263,739 (247) Transfers out.......................................................... (3,231) (59,413) (59,413) - Issuance of commercial paper.............................. - 8,425 8,425 - Issuance of bonds.................................................. 28,125 24,000 24,000 - Budget reserves and designations........................ (9,486) - - -
Total other financing sources (uses)............ 269,239 236,998 236,751 (247) Net changes in fund balances...................... (111,936) 53,009 142,665 89,656
Budgetary fund balances, July 1.............................. 161,651 921,936 921,936 - Budgetary fund balances, June 30........................... 49,715$ 974,945$ 1,064,601$ 89,656$
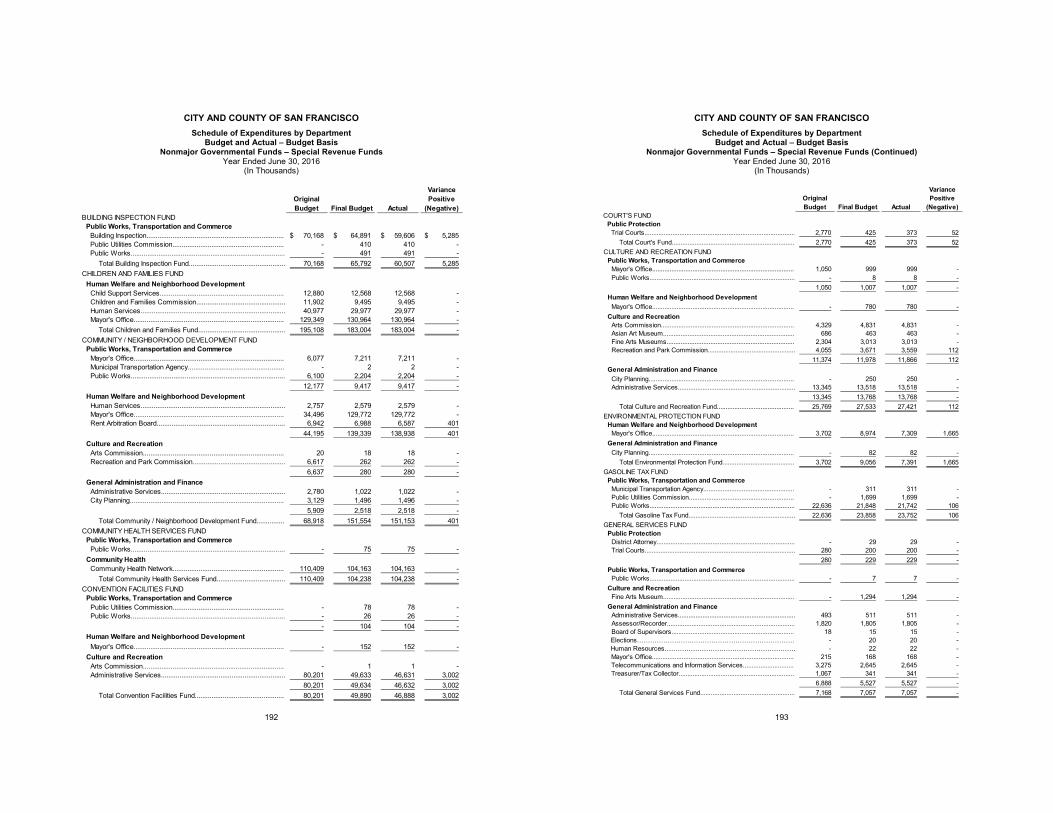
CITY AND COUNTY OF SAN FRANCISCO Schedule of Expenditures by Department
Budget and Actual – Budget Basis Nonmajor Governmental Funds – Special Revenue Funds
Year Ended June 30, 2016 (In Thousands)
192
Original Budget Final Budget Actual
Variance Positive
(Negative)BUILDING INSPECTION FUND
Public Works, Transportation and CommerceBuilding Inspection.......................................................................... 70,168$ 64,891$ 59,606$ 5,285$ Public Utilities Commission............................................................ - 410 410 - Public Works................................................................................... - 491 491 -
Total Building Inspection Fund.................................................... 70,168 65,792 60,507 5,285 CHILDREN AND FAMILIES FUND
Human Welfare and Neighborhood DevelopmentChild Support Services................................................................... 12,880 12,568 12,568 - Children and Families Commission................................................ 11,902 9,495 9,495 - Human Services.............................................................................. 40,977 29,977 29,977 - Mayor's Office................................................................................. 129,349 130,964 130,964 -
Total Children and Families Fund............................................... 195,108 183,004 183,004 - COMMUNITY / NEIGHBORHOOD DEVELOPMENT FUND
Public Works, Transportation and CommerceMayor's Office................................................................................. 6,077 7,211 7,211 - Municipal Transportation Agency.................................................... - 2 2 - Public Works................................................................................... 6,100 2,204 2,204 -
12,177 9,417 9,417 - Human Welfare and Neighborhood Development
Human Services.............................................................................. 2,757 2,579 2,579 - Mayor's Office................................................................................. 34,496 129,772 129,772 - Rent Arbitration Board..................................................................... 6,942 6,988 6,587 401
44,195 139,339 138,938 401 Culture and Recreation
Arts Commission............................................................................ 20 18 18 - Recreation and Park Commission.................................................. 6,617 262 262 -
6,637 280 280 - General Administration and Finance
Administrative Services................................................................... 2,780 1,022 1,022 - City Planning................................................................................... 3,129 1,496 1,496 -
5,909 2,518 2,518 - Total Community / Neighborhood Development Fund............... 68,918 151,554 151,153 401
COMMUNITY HEALTH SERVICES FUNDPublic Works, Transportation and Commerce
Public Works................................................................................... - 75 75 - Community Health
Community Health Network............................................................ 110,409 104,163 104,163 - Total Community Health Services Fund..................................... 110,409 104,238 104,238 -
CONVENTION FACILITIES FUNDPublic Works, Transportation and Commerce
Public Utilities Commission............................................................ - 78 78 - Public Works................................................................................... - 26 26 -
- 104 104 - Human Welfare and Neighborhood Development
Mayor's Office................................................................................. - 152 152 - Culture and Recreation
Arts Commission............................................................................ - 1 1 - Administrative Services................................................................... 80,201 49,633 46,631 3,002
80,201 49,634 46,632 3,002 Total Convention Facilities Fund................................................ 80,201 49,890 46,888 3,002
CITY AND COUNTY OF SAN FRANCISCO Schedule of Expenditures by Department
Budget and Actual – Budget Basis Nonmajor Governmental Funds – Special Revenue Funds (Continued)
Year Ended June 30, 2016 (In Thousands)
193
Original Budget Final Budget Actual
Variance Positive
(Negative)COURT'S FUND
Public ProtectionTrial Courts...................................................................................... 2,770 425 373 52
Total Court's Fund...................................................................... 2,770 425 373 52 CULTURE AND RECREATION FUND
Public Works, Transportation and CommerceMayor's Office................................................................................. 1,050 999 999 - Public Works................................................................................... - 8 8 -
1,050 1,007 1,007 - Human Welfare and Neighborhood Development
Mayor's Office................................................................................. - 780 780 - Culture and Recreation
Arts Commission............................................................................ 4,329 4,831 4,831 - Asian Art Museum........................................................................... 686 463 463 - Fine Arts Museums......................................................................... 2,304 3,013 3,013 - Recreation and Park Commission.................................................. 4,055 3,671 3,559 112
11,374 11,978 11,866 112 General Administration and Finance
City Planning................................................................................... - 250 250 - Administrative Services................................................................... 13,345 13,518 13,518 -
13,345 13,768 13,768 - Total Culture and Recreation Fund............................................ 25,769 27,533 27,421 112
ENVIRONMENTAL PROTECTION FUNDHuman Welfare and Neighborhood Development
Mayor's Office................................................................................. 3,702 8,974 7,309 1,665 General Administration and Finance
City Planning................................................................................... - 82 82 - Total Environmental Protection Fund......................................... 3,702 9,056 7,391 1,665
GASOLINE TAX FUNDPublic Works, Transportation and Commerce
Municipal Transportation Agency.................................................... - 311 311 - Public Utilities Commission............................................................ - 1,699 1,699 - Public Works................................................................................... 22,636 21,848 21,742 106
Total Gasoline Tax Fund............................................................. 22,636 23,858 23,752 106 GENERAL SERVICES FUND
Public ProtectionDistrict Attorney............................................................................... - 29 29 - Trial Courts...................................................................................... 280 200 200 -
280 229 229 - Public Works, Transportation and Commerce
Public Works................................................................................... - 7 7 - Culture and Recreation
Fine Arts Museum........................................................................... - 1,294 1,294 - General Administration and Finance
Administrative Services................................................................... 493 511 511 - Assessor/Recorder......................................................................... 1,820 1,805 1,805 - Board of Supervisors...................................................................... 18 15 15 - Elections………………………………………………………………. - 20 20 - Human Resources…………………………………………………… - 22 22 - Mayor's Office................................................................................. 215 168 168 - Telecommunications and Information Services............................. 3,275 2,645 2,645 - Treasurer/Tax Collector.................................................................. 1,067 341 341 -
6,888 5,527 5,527 - Total General Services Fund...................................................... 7,168 7,057 7,057 -
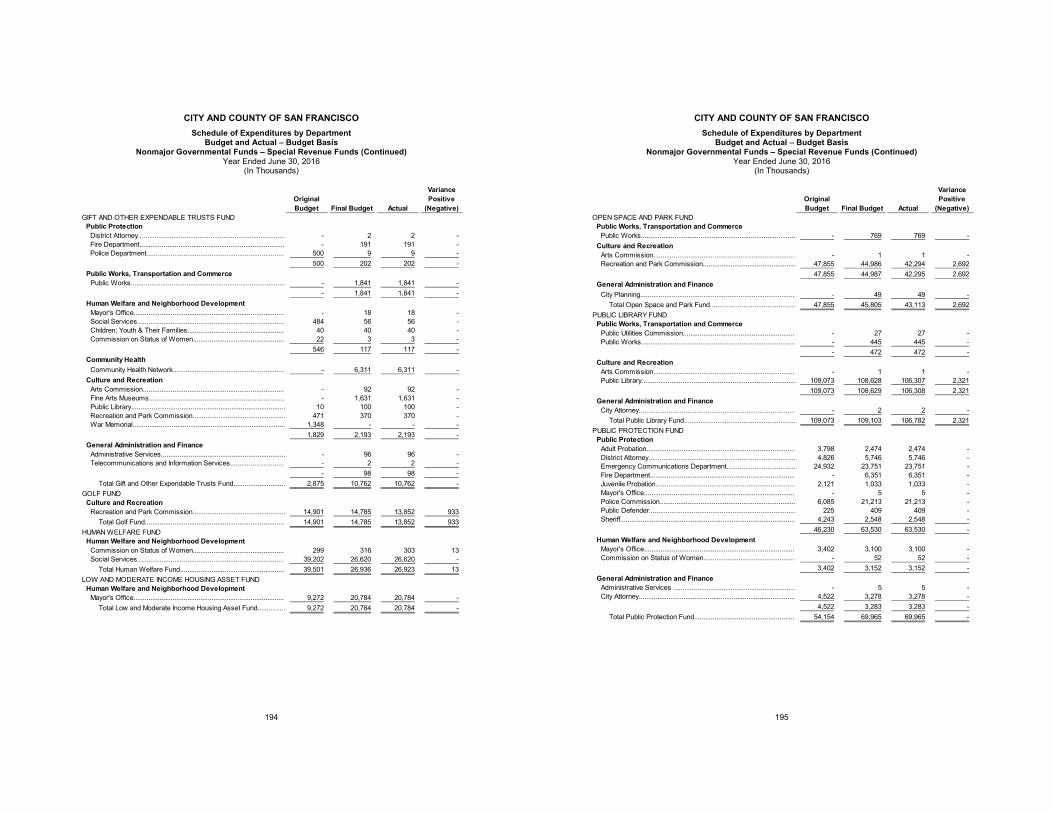
CITY AND COUNTY OF SAN FRANCISCO Schedule of Expenditures by Department
Budget and Actual – Budget Basis Nonmajor Governmental Funds – Special Revenue Funds (Continued)
Year Ended June 30, 2016 (In Thousands)
194
Original Budget Final Budget Actual
Variance Positive
(Negative)GIFT AND OTHER EXPENDABLE TRUSTS FUND
Public ProtectionDistrict Attorney............................................................................... - 2 2 - Fire Department.............................................................................. - 191 191 - Police Department.......................................................................... 500 9 9 -
500 202 202 - Public Works, Transportation and Commerce
Public Works................................................................................... - 1,841 1,841 - - 1,841 1,841 -
Human Welfare and Neighborhood DevelopmentMayor's Office................................................................................. - 18 18 - Social Services............................................................................... 484 56 56 - Children; Youth & Their Families.................................................... 40 40 40 - Commission on Status of Women................................................. 22 3 3 -
546 117 117 - Community Health
Community Health Network............................................................ - 6,311 6,311 - Culture and Recreation
Arts Commission............................................................................ - 92 92 - Fine Arts Museums......................................................................... - 1,631 1,631 - Public Library................................................................................... 10 100 100 - Recreation and Park Commission.................................................. 471 370 370 - War Memorial.................................................................................. 1,348 - - -
1,829 2,193 2,193 - General Administration and Finance
Administrative Services................................................................... - 96 96 - Telecommunications and Information Services............................. - 2 2 -
- 98 98 - Total Gift and Other Expendable Trusts Fund............................ 2,875 10,762 10,762 -
GOLF FUNDCulture and Recreation
Recreation and Park Commission.................................................. 14,901 14,785 13,852 933 Total Golf Fund........................................................................... 14,901 14,785 13,852 933
HUMAN WELFARE FUNDHuman Welfare and Neighborhood Development
Commission on Status of Women................................................. 299 316 303 13 Social Services............................................................................... 39,202 26,620 26,620 -
Total Human Welfare Fund........................................................ 39,501 26,936 26,923 13 LOW AND MODERATE INCOME HOUSING ASSET FUND
Human Welfare and Neighborhood DevelopmentMayor's Office................................................................................. 9,272 20,784 20,784 -
Total Low and Moderate Income Housing Asset Fund............... 9,272 20,784 20,784 -
CITY AND COUNTY OF SAN FRANCISCO Schedule of Expenditures by Department
Budget and Actual – Budget Basis Nonmajor Governmental Funds – Special Revenue Funds (Continued)
Year Ended June 30, 2016 (In Thousands)
195
Original Budget Final Budget Actual
Variance Positive
(Negative)OPEN SPACE AND PARK FUND
Public Works, Transportation and CommercePublic Works................................................................................... - 769 769 -
Culture and RecreationArts Commission............................................................................ - 1 1 - Recreation and Park Commission.................................................. 47,855 44,986 42,294 2,692
47,855 44,987 42,295 2,692 General Administration and Finance
City Planning................................................................................... - 49 49 - Total Open Space and Park Fund.............................................. 47,855 45,805 43,113 2,692
PUBLIC LIBRARY FUNDPublic Works, Transportation and Commerce
Public Utilities Commission............................................................ - 27 27 - Public Works................................................................................... - 445 445 -
- 472 472 - Culture and Recreation
Arts Commission............................................................................ - 1 1 - Public Library................................................................................... 109,073 108,628 106,307 2,321
109,073 108,629 106,308 2,321 General Administration and Finance
City Attorney.................................................................................... - 2 2 - Total Public Library Fund............................................................ 109,073 109,103 106,782 2,321
PUBLIC PROTECTION FUNDPublic Protection
Adult Probation................................................................................ 3,798 2,474 2,474 - District Attorney............................................................................... 4,826 5,746 5,746 - Emergency Communications Department..................................... 24,932 23,751 23,751 - Fire Department.............................................................................. - 6,351 6,351 - Juvenile Probation........................................................................... 2,121 1,033 1,033 - Mayor's Office................................................................................. - 5 5 - Police Commission......................................................................... 6,085 21,213 21,213 - Public Defender............................................................................... 225 409 409 - Sheriff.............................................................................................. 4,243 2,548 2,548 -
46,230 63,530 63,530 - Human Welfare and Neighborhood Development
Mayor's Office................................................................................. 3,402 3,100 3,100 - Commission on Status of Women................................................. - 52 52 -
3,402 3,152 3,152 - General Administration and Finance
Administrative Services .................................................................. - 5 5 - City Attorney.................................................................................... 4,522 3,278 3,278 -
4,522 3,283 3,283 - Total Public Protection Fund...................................................... 54,154 69,965 69,965 -
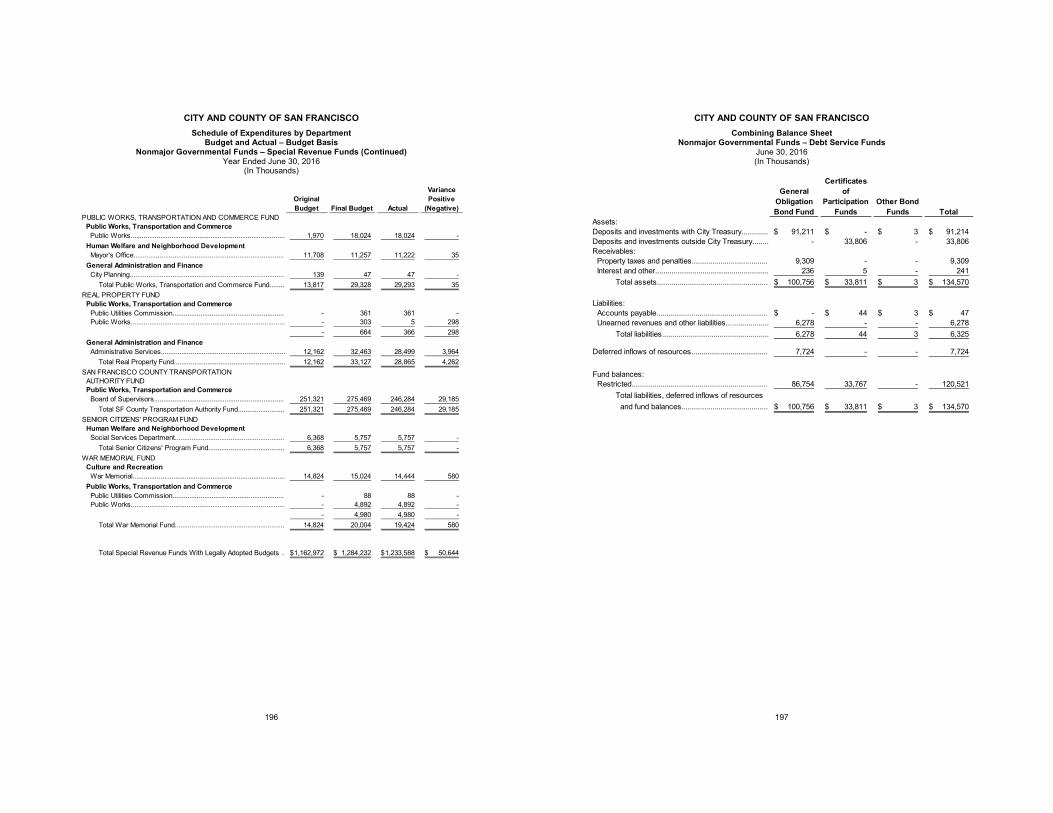
CITY AND COUNTY OF SAN FRANCISCO Schedule of Expenditures by Department
Budget and Actual – Budget Basis Nonmajor Governmental Funds – Special Revenue Funds (Continued)
Year Ended June 30, 2016 (In Thousands)
196
Original Budget Final Budget Actual
Variance Positive
(Negative)PUBLIC WORKS, TRANSPORTATION AND COMMERCE FUND
Public Works, Transportation and CommercePublic Works................................................................................... 1,970 18,024 18,024 -
Human Welfare and Neighborhood DevelopmentMayor's Office................................................................................. 11,708 11,257 11,222 35
General Administration and FinanceCity Planning................................................................................... 139 47 47 -
Total Public Works, Transportation and Commerce Fund........ 13,817 29,328 29,293 35 REAL PROPERTY FUND
Public Works, Transportation and CommercePublic Utilities Commission............................................................ - 361 361 - Public Works................................................................................... - 303 5 298
- 664 366 298 General Administration and Finance
Administrative Services................................................................... 12,162 32,463 28,499 3,964 Total Real Property Fund............................................................ 12,162 33,127 28,865 4,262
SAN FRANCISCO COUNTY TRANSPORTATIONAUTHORITY FUNDPublic Works, Transportation and Commerce
Board of Supervisors...................................................................... 251,321 275,469 246,284 29,185 Total SF County Transportation Authority Fund......................... 251,321 275,469 246,284 29,185
SENIOR CITIZENS' PROGRAM FUNDHuman Welfare and Neighborhood Development
Social Services Department........................................................... 6,368 5,757 5,757 - Total Senior Citizens' Program Fund......................................... 6,368 5,757 5,757 -
WAR MEMORIAL FUNDCulture and Recreation
War Memorial.................................................................................. 14,824 15,024 14,444 580 Public Works, Transportation and Commerce
Public Utilities Commission............................................................ - 88 88 - Public Works................................................................................... - 4,892 4,892 -
- 4,980 4,980 - Total War Memorial Fund........................................................... 14,824 20,004 19,424 580
Total Special Revenue Funds With Legally Adopted Budgets .. 1,162,972$ 1,284,232$ 1,233,588$ 50,644$
CITY AND COUNTY OF SAN FRANCISCO Combining Balance Sheet
Nonmajor Governmental Funds – Debt Service Funds June 30, 2016 (In Thousands)
197
General Obligation Bond Fund
Certificates of
Participation Funds
Other Bond Funds Total
Assets:Deposits and investments with City Treasury............. 91,211$ -$ 3$ 91,214$ Deposits and investments outside City Treasury........ - 33,806 - 33,806 Receivables:
Property taxes and penalties..................................... 9,309 - - 9,309 Interest and other....................................................... 236 5 - 241
Total assets...................................................... 100,756$ 33,811$ 3$ 134,570$
Liabilities:Accounts payable...................................................... -$ 44$ 3$ 47$ Unearned revenues and other liabilities..................... 6,278 - - 6,278
Total liabilities.................................................... 6,278 44 3 6,325
Deferred inflows of resources..................................... 7,724 - - 7,724
Fund balances:Restricted.................................................................. 86,754 33,767 - 120,521
Total liabilities, deferred inflows of resourcesand fund balances.......................................... 100,756$ 33,811$ 3$ 134,570$
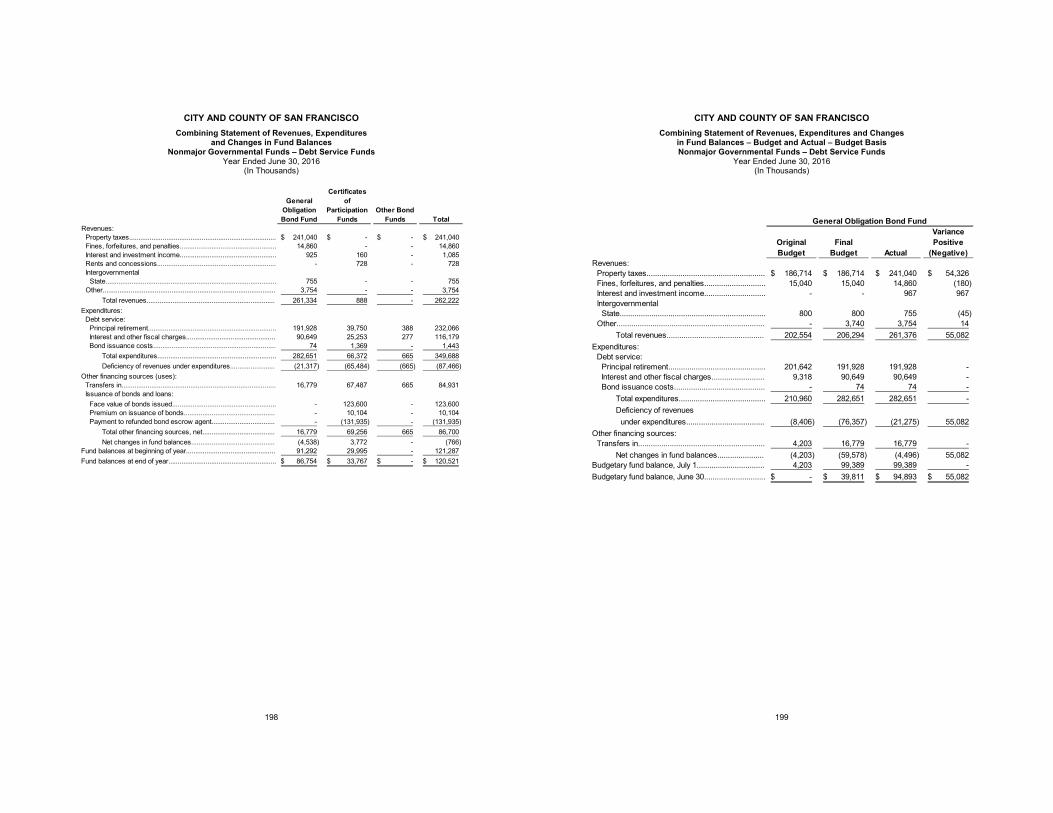
CITY AND COUNTY OF SAN FRANCISCO Combining Statement of Revenues, Expenditures
and Changes in Fund Balances Nonmajor Governmental Funds – Debt Service Funds
Year Ended June 30, 2016 (In Thousands)
198
General Obligation Bond Fund
Certificates of
Participation Funds
Other Bond Funds Total
Revenues:Property taxes............................................................................... 241,040$ -$ -$ 241,040$ Fines, forfeitures, and penalties.................................................... 14,860 - - 14,860 Interest and investment income.................................................... 925 160 - 1,085 Rents and concessions................................................................ - 728 - 728 Intergovernmental
State............................................................................................ 755 - - 755 Other............................................................................................. 3,754 - - 3,754
Total revenues..................................................................... 261,334 888 - 262,222 Expenditures:
Debt service:Principal retirement..................................................................... 191,928 39,750 388 232,066 Interest and other fiscal charges................................................ 90,649 25,253 277 116,179 Bond issuance costs.................................................................. 74 1,369 - 1,443
Total expenditures................................................................ 282,651 66,372 665 349,688 Deficiency of revenues under expenditures........................ (21,317) (65,484) (665) (87,466)
Other financing sources (uses):Transfers in................................................................................... 16,779 67,487 665 84,931 Issuance of bonds and loans:
Face value of bonds issued........................................................ - 123,600 - 123,600 Premium on issuance of bonds................................................. - 10,104 - 10,104 Payment to refunded bond escrow agent.................................. - (131,935) - (131,935)
Total other financing sources, net....................................... 16,779 69,256 665 86,700 Net changes in fund balances............................................. (4,538) 3,772 - (766)
Fund balances at beginning of year................................................ 91,292 29,995 - 121,287 Fund balances at end of year.......................................................... 86,754$ 33,767$ -$ 120,521$
CITY AND COUNTY OF SAN FRANCISCO Combining Statement of Revenues, Expenditures and Changes
in Fund Balances – Budget and Actual – Budget Basis Nonmajor Governmental Funds – Debt Service Funds
Year Ended June 30, 2016 (In Thousands)
199
General Obligation Bond Fund
Original Budget
Final Budget Actual
Variance Positive
(Negative)Revenues:
Property taxes........................................................ 186,714$ 186,714$ 241,040$ 54,326$ Fines, forfeitures, and penalties............................. 15,040 15,040 14,860 (180) Interest and investment income............................. - - 967 967 Intergovernmental
State..................................................................... 800 800 755 (45) Other...................................................................... - 3,740 3,754 14
Total revenues.............................................. 202,554 206,294 261,376 55,082 Expenditures:
Debt service:Principal retirement.............................................. 201,642 191,928 191,928 - Interest and other fiscal charges......................... 9,318 90,649 90,649 - Bond issuance costs........................................... - 74 74 -
Total expenditures......................................... 210,960 282,651 282,651 - Deficiency of revenues
under expenditures..................................... (8,406) (76,357) (21,275) 55,082 Other financing sources:
Transfers in............................................................ 4,203 16,779 16,779 - Net changes in fund balances...................... (4,203) (59,578) (4,496) 55,082
Budgetary fund balance, July 1................................ 4,203 99,389 99,389 - Budgetary fund balance, June 30............................. -$ 39,811$ 94,893$ 55,082$
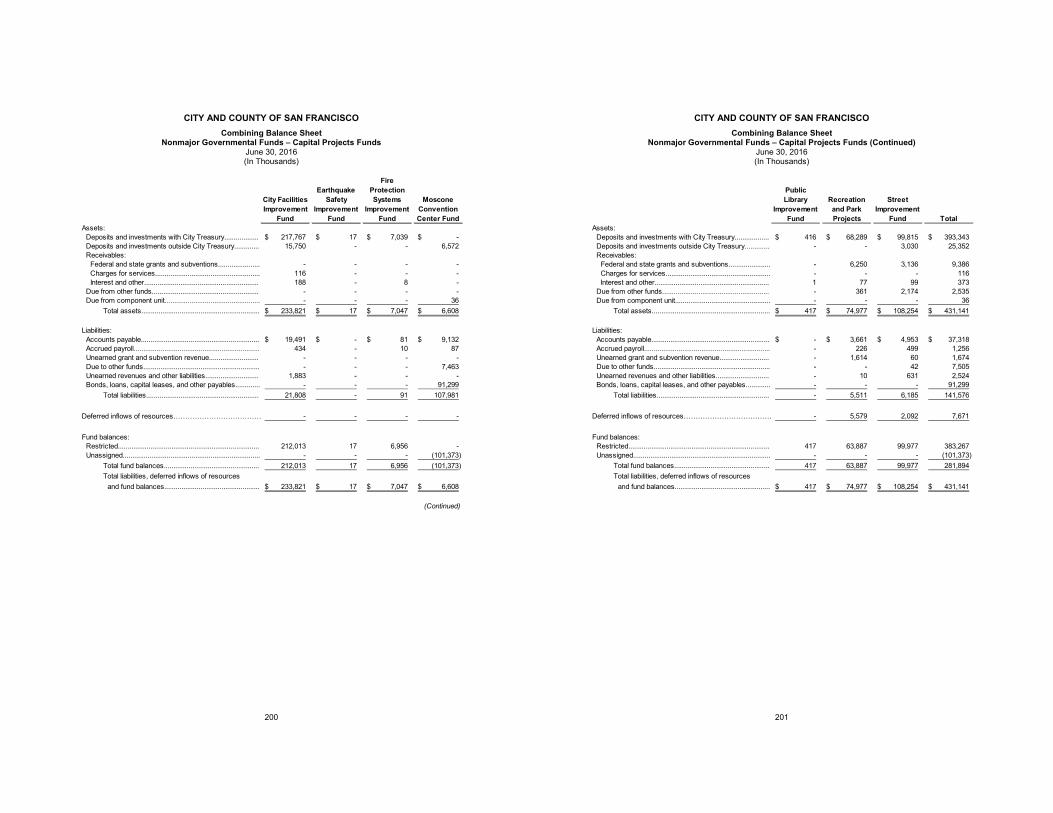
CITY AND COUNTY OF SAN FRANCISCO Combining Balance Sheet
Nonmajor Governmental Funds – Capital Projects Funds June 30, 2016 (In Thousands)
200
City Facilities Improvement
Fund
Earthquake Safety
Improvement Fund
Fire Protection Systems
Improvement Fund
Moscone Convention Center Fund
Assets:Deposits and investments with City Treasury.................. 217,767$ 17$ 7,039$ -$ Deposits and investments outside City Treasury............. 15,750 - - 6,572 Receivables:
Federal and state grants and subventions...................... - - - - Charges for services....................................................... 116 - - - Interest and other............................................................ 188 - 8 -
Due from other funds........................................................ - - - - Due from component unit.................................................. - - - 36
Total assets.............................................................. 233,821$ 17$ 7,047$ 6,608$
Liabilities:Accounts payable.............................................................. 19,491$ -$ 81$ 9,132$ Accrued payroll.................................................................. 434 - 10 87 Unearned grant and subvention revenue.......................... - - - - Due to other funds............................................................. - - - 7,463 Unearned revenues and other liabilities............................ 1,883 - - - Bonds, loans, capital leases, and other payables............. - - - 91,299
Total liabilities........................................................... 21,808 - 91 107,981
Deferred inflows of resources………………………………… - - - -
Fund balances:Restricted.......................................................................... 212,013 17 6,956 - Unassigned........................................................................ - - - (101,373)
Total fund balances.................................................. 212,013 17 6,956 (101,373) Total liabilities, deferred inflows of resources
and fund balances.................................................. 233,821$ 17$ 7,047$ 6,608$
(Continued)
CITY AND COUNTY OF SAN FRANCISCO Combining Balance Sheet
Nonmajor Governmental Funds – Capital Projects Funds (Continued) June 30, 2016 (In Thousands)
201
Public Library
Improvement Fund
Recreation and Park Projects
Street Improvement
Fund TotalAssets:
Deposits and investments with City Treasury.................. 416$ 68,289$ 99,815$ 393,343$ Deposits and investments outside City Treasury............. - - 3,030 25,352 Receivables:
Federal and state grants and subventions...................... - 6,250 3,136 9,386 Charges for services....................................................... - - - 116 Interest and other............................................................ 1 77 99 373
Due from other funds........................................................ - 361 2,174 2,535 Due from component unit.................................................. - - - 36
Total assets.............................................................. 417$ 74,977$ 108,254$ 431,141$
Liabilities:Accounts payable.............................................................. -$ 3,661$ 4,953$ 37,318$ Accrued payroll.................................................................. - 226 499 1,256 Unearned grant and subvention revenue.......................... - 1,614 60 1,674 Due to other funds............................................................. - - 42 7,505 Unearned revenues and other liabilities............................ - 10 631 2,524 Bonds, loans, capital leases, and other payables............. - - - 91,299
Total liabilities........................................................... - 5,511 6,185 141,576
Deferred inflows of resources………………………………… - 5,579 2,092 7,671
Fund balances:Restricted.......................................................................... 417 63,887 99,977 383,267 Unassigned........................................................................ - - - (101,373)
Total fund balances.................................................. 417 63,887 99,977 281,894 Total liabilities, deferred inflows of resources
and fund balances.................................................. 417$ 74,977$ 108,254$ 431,141$
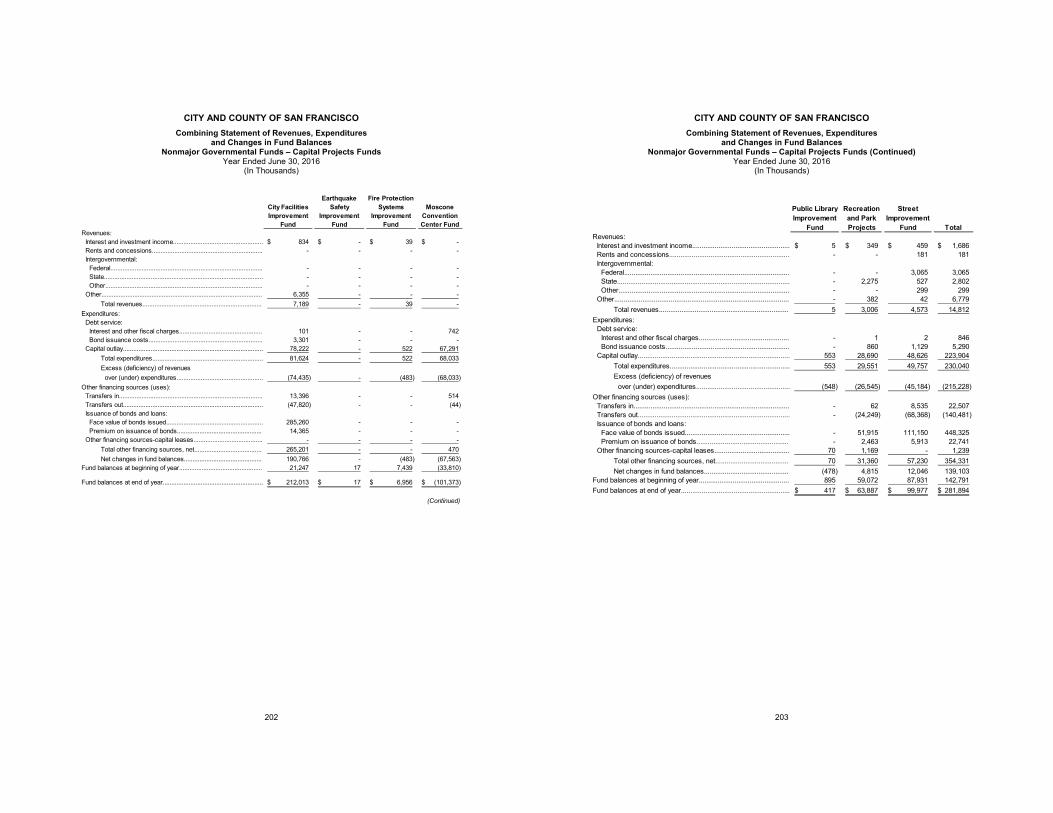
CITY AND COUNTY OF SAN FRANCISCO Combining Statement of Revenues, Expenditures
and Changes in Fund Balances Nonmajor Governmental Funds – Capital Projects Funds
Year Ended June 30, 2016 (In Thousands)
202
City Facilities Improvement
Fund
Earthquake Safety
Improvement Fund
Fire Protection Systems
Improvement Fund
Moscone Convention Center Fund
Revenues:Interest and investment income.................................................... 834$ -$ 39$ -$ Rents and concessions................................................................ - - - - Intergovernmental:
Federal........................................................................................ - - - - State............................................................................................ - - - - Other........................................................................................... - - - -
Other............................................................................................. 6,355 - - - Total revenues..................................................................... 7,189 - 39 -
Expenditures:Debt service:
Interest and other fiscal charges................................................ 101 - - 742 Bond issuance costs.................................................................. 3,301 - - -
Capital outlay................................................................................. 78,222 - 522 67,291 Total expenditures................................................................ 81,624 - 522 68,033 Excess (deficiency) of revenues
over (under) expenditures.................................................. (74,435) - (483) (68,033) Other financing sources (uses):
Transfers in................................................................................... 13,396 - - 514 Transfers out................................................................................. (47,820) - - (44) Issuance of bonds and loans:
Face value of bonds issued........................................................ 285,260 - - - Premium on issuance of bonds................................................. 14,365 - - -
Other financing sources-capital leases........................................ - - - - Total other financing sources, net....................................... 265,201 - - 470 Net changes in fund balances............................................. 190,766 - (483) (67,563)
Fund balances at beginning of year................................................ 21,247 17 7,439 (33,810)
Fund balances at end of year.......................................................... 212,013$ 17$ 6,956$ (101,373)$
(Continued)
CITY AND COUNTY OF SAN FRANCISCO Combining Statement of Revenues, Expenditures
and Changes in Fund Balances Nonmajor Governmental Funds – Capital Projects Funds (Continued)
Year Ended June 30, 2016 (In Thousands)
203
Public Library Improvement
Fund
Recreation and Park Projects
Street Improvement
Fund TotalRevenues:
Interest and investment income.................................................... 5$ 349$ 459$ 1,686$ Rents and concessions................................................................ - - 181 181 Intergovernmental:
Federal........................................................................................ - - 3,065 3,065 State............................................................................................ - 2,275 527 2,802 Other........................................................................................... - - 299 299
Other............................................................................................. - 382 42 6,779 Total revenues..................................................................... 5 3,006 4,573 14,812
Expenditures:Debt service:
Interest and other fiscal charges................................................ - 1 2 846 Bond issuance costs.................................................................. - 860 1,129 5,290
Capital outlay................................................................................. 553 28,690 48,626 223,904 Total expenditures................................................................ 553 29,551 49,757 230,040 Excess (deficiency) of revenues
over (under) expenditures.................................................. (548) (26,545) (45,184) (215,228) Other financing sources (uses):
Transfers in................................................................................... - 62 8,535 22,507 Transfers out................................................................................. - (24,249) (68,368) (140,481) Issuance of bonds and loans:
Face value of bonds issued........................................................ - 51,915 111,150 448,325 Premium on issuance of bonds................................................. - 2,463 5,913 22,741
Other financing sources-capital leases........................................ 70 1,169 - 1,239 Total other financing sources, net....................................... 70 31,360 57,230 354,331 Net changes in fund balances............................................. (478) 4,815 12,046 139,103
Fund balances at beginning of year................................................ 895 59,072 87,931 142,791 Fund balances at end of year.......................................................... 417$ 63,887$ 99,977$ 281,894$
________________________________________________
This page has been intentionally left blank.
CITY AND COUNTY OF SAN FRANCISCO INTERNAL SERVICE FUNDS
204
Internal Service Funds are used to account for the financing of goods and services provided by one department or agency to other departments or agencies on a cost reimbursement basis.
Central Shops Fund – Accounts for Central Shops equipment (primarily vehicle) maintenance service charges and the related billings to various departments.
Finance Corporation – Accounts for the lease financing services provided by the Finance Corporation to City departments. On July 1, 2001 the City established the Finance Corporation Internal Service fund because its sole purpose is to provide lease financing to the City. Previously, the activities of the Finance Corporation were reported within governmental funds.
Reproduction Fund – Accounts for printing, design and mail services required by various City departments and agencies.
Telecommunications and Information Fund – Accounts for centralized telecommunications activities in the City’s Wide Area Network, radio communication and telephone systems. In addition, it accounts for application support provided to many department-specific and citywide systems, management of the City’s Web site, operations of the City’s mainframe computers and technology training provided to city the related billings to various departments for specific services performed and operating support from the General Fund.
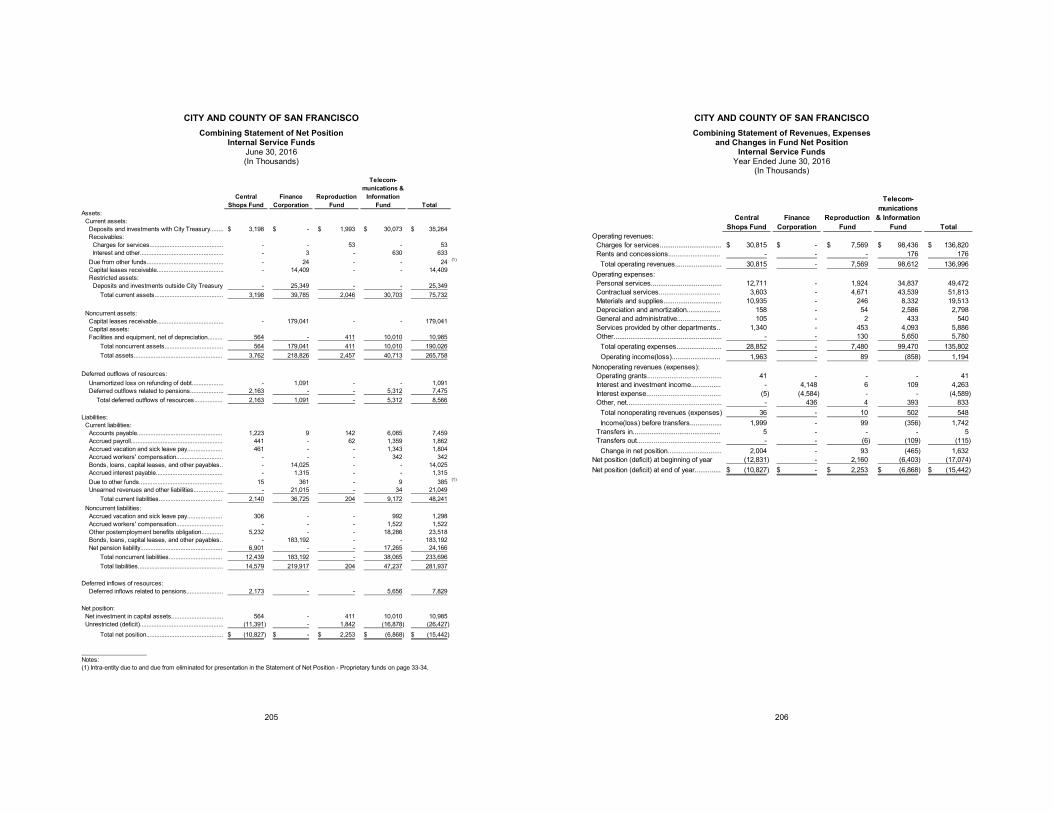
CITY AND COUNTY OF SAN FRANCISCO Combining Statement of Net Position
Internal Service Funds June 30, 2016 (In Thousands)
205
Central Shops Fund
Finance Corporation
Reproduction Fund
Telecom-munications &
Information Fund Total
Assets:Current assets:
Deposits and investments with City Treasury........ 3,198$ -$ 1,993$ 30,073$ 35,264$ Receivables:
Charges for services............................................ - - 53 - 53 Interest and other.................................................. - 3 - 630 633
Due from other funds.............................................. - 24 - - 24 (1)
Capital leases receivable........................................ - 14,409 - - 14,409 Restricted assets:
Deposits and investments outside City Treasury - 25,349 - - 25,349 Total current assets......................................... 3,198 39,785 2,046 30,703 75,732
Noncurrent assets:Capital leases receivable........................................ - 179,041 - - 179,041 Capital assets:Facilities and equipment, net of depreciation......... 564 - 411 10,010 10,985
Total noncurrent assets................................... 564 179,041 411 10,010 190,026 Total assets..................................................... 3,762 218,826 2,457 40,713 265,758
Deferred outflows of resources:Unamortized loss on refunding of debt................... - 1,091 - - 1,091 Deferred outflows related to pensions.................... 2,163 - - 5,312 7,475
Total deferred outflows of resources................. 2,163 1,091 - 5,312 8,566
Liabilities:Current liabilities:
Accounts payable................................................... 1,223 9 142 6,085 7,459 Accrued payroll....................................................... 441 - 62 1,359 1,862 Accrued vacation and sick leave pay..................... 461 - - 1,343 1,804 Accrued workers' compensation............................ - - - 342 342 Bonds, loans, capital leases, and other payables.. - 14,025 - - 14,025 Accrued interest payable........................................ - 1,315 - - 1,315 Due to other funds.................................................. 15 361 - 9 385 (1)
Unearned revenues and other liabilities.................. - 21,015 - 34 21,049 Total current liabilities...................................... 2,140 36,725 204 9,172 48,241
Noncurrent liabilities:Accrued vacation and sick leave pay..................... 306 - - 992 1,298 Accrued workers' compensation............................ - - - 1,522 1,522 Other postemployment benefits obligation............. 5,232 - - 18,286 23,518 Bonds, loans, capital leases, and other payables.. - 183,192 - - 183,192 Net pension liability................................................. 6,901 - - 17,265 24,166
Total noncurrent liabilities................................ 12,439 183,192 - 38,065 233,696 Total liabilities................................................... 14,579 219,917 204 47,237 281,937
Deferred inflows of resources:Deferred inflows related to pensions...................... 2,173 - - 5,656 7,829
Net position:Net investment in capital assets............................... 564 - 411 10,010 10,985 Unrestricted (deficit).................................................. (11,391) - 1,842 (16,878) (26,427)
Total net position.............................................. (10,827)$ -$ 2,253$ (6,868)$ (15,442)$
Notes:(1) Intra-entity due to and due from eliminated for presentation in the Statement of Net Position - Proprietary funds on page 33-34.
CITY AND COUNTY OF SAN FRANCISCO Combining Statement of Revenues, Expenses
and Changes in Fund Net Position Internal Service Funds
Year Ended June 30, 2016 (In Thousands)
206
Central Shops Fund
Finance Corporation
Reproduction Fund
Telecom-munications
& Information Fund Total
Operating revenues:Charges for services................................. 30,815$ -$ 7,569$ 98,436$ 136,820$ Rents and concessions............................ - - - 176 176
Total operating revenues......................... 30,815 - 7,569 98,612 136,996 Operating expenses:
Personal services...................................... 12,711 - 1,924 34,837 49,472 Contractual services................................. 3,603 - 4,671 43,539 51,813 Materials and supplies............................... 10,935 - 246 8,332 19,513 Depreciation and amortization.................. 158 - 54 2,586 2,798 General and administrative........................ 105 - 2 433 540 Services provided by other departments.. 1,340 - 453 4,093 5,886 Other.......................................................... - - 130 5,650 5,780
Total operating expenses........................ 28,852 - 7,480 99,470 135,802 Operating income(loss).......................... 1,963 - 89 (858) 1,194
Nonoperating revenues (expenses):Operating grants........................................ 41 - - - 41 Interest and investment income................ - 4,148 6 109 4,263 Interest expense........................................ (5) (4,584) - - (4,589) Other, net................................................... - 436 4 393 833
Total nonoperating revenues (expenses) 36 - 10 502 548 Income(loss) before transfers................. 1,999 - 99 (356) 1,742
Transfers in............................................... 5 - - - 5 Transfers out............................................. - - (6) (109) (115)
Change in net position............................. 2,004 - 93 (465) 1,632 Net position (deficit) at beginning of year (12,831) - 2,160 (6,403) (17,074) Net position (deficit) at end of year.............. (10,827)$ -$ 2,253$ (6,868)$ (15,442)$
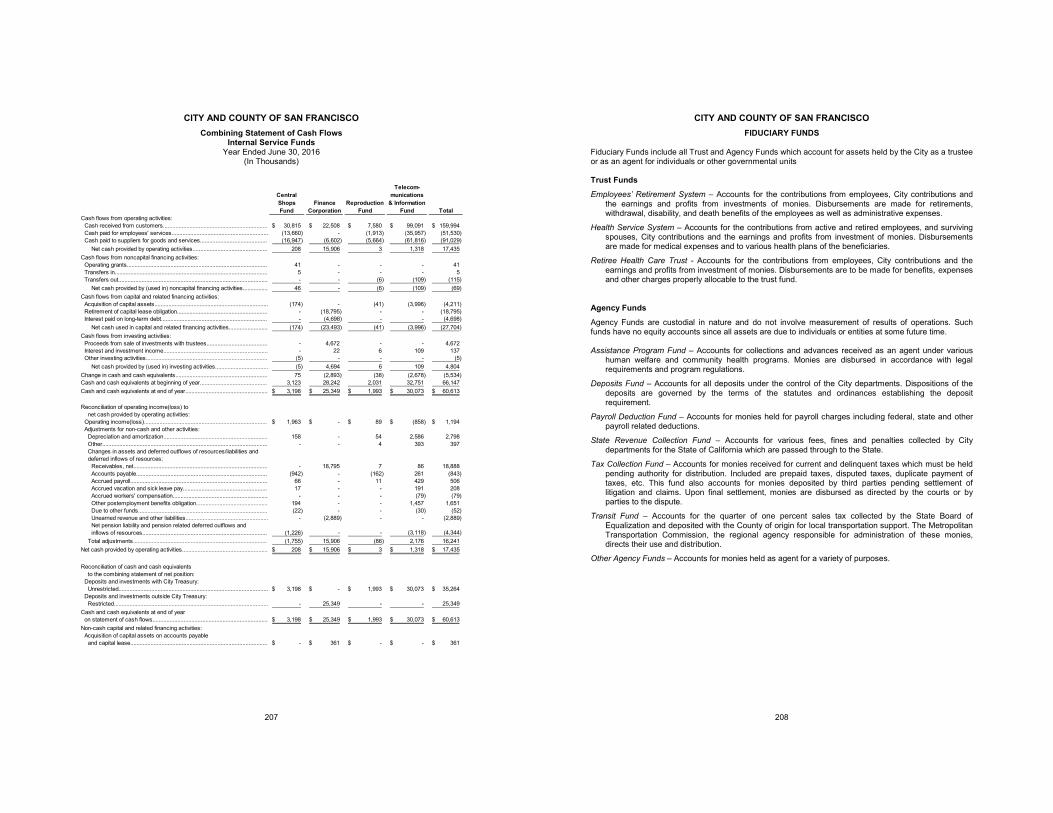
CITY AND COUNTY OF SAN FRANCISCO Combining Statement of Cash Flows
Internal Service Funds Year Ended June 30, 2016
(In Thousands)
207
Central Shops Fund
Finance Corporation
Reproduction Fund
Telecom-munications
& Information Fund Total
Cash flows from operating activities:Cash received from customers................................................................... 30,815$ 22,508$ 7,580$ 99,091$ 159,994$ Cash paid for employees' services.............................................................. (13,660) - (1,913) (35,957) (51,530) Cash paid to suppliers for goods and services........................................... (16,947) (6,602) (5,664) (61,816) (91,029)
Net cash provided by operating activities................................................ 208 15,906 3 1,318 17,435 Cash flows from noncapital financing activities:
Operating grants.......................................................................................... 41 - - - 41 Transfers in.................................................................................................. 5 - - - 5 Transfers out................................................................................................ - - (6) (109) (115)
Net cash provided by (used in) noncapital financing activities................ 46 - (6) (109) (69) Cash flows from capital and related financing activities:
Acquisition of capital assets......................................................................... (174) - (41) (3,996) (4,211) Retirement of capital lease obligation.......................................................... - (18,795) - - (18,795) Interest paid on long-term debt.................................................................... - (4,698) - - (4,698)
Net cash used in capital and related financing activities......................... (174) (23,493) (41) (3,996) (27,704) Cash flows from investing activities:
Proceeds from sale of investments with trustees....................................... - 4,672 - - 4,672 Interest and investment income................................................................... - 22 6 109 137 Other investing activities.............................................................................. (5) - - - (5)
Net cash provided by (used in) investing activities.................................. (5) 4,694 6 109 4,804 Change in cash and cash equivalents........................................................... 75 (2,893) (38) (2,678) (5,534) Cash and cash equivalents at beginning of year........................................... 3,123 28,242 2,031 32,751 66,147 Cash and cash equivalents at end of year..................................................... 3,198$ 25,349$ 1,993$ 30,073$ 60,613$
Reconciliation of operating income(loss) tonet cash provided by operating activities:
Operating income(loss)............................................................................... 1,963$ -$ 89$ (858)$ 1,194$ Adjustments for non-cash and other activities:
Depreciation and amortization................................................................... 158 - 54 2,586 2,798 Other.......................................................................................................... - - 4 393 397 Changes in assets and deferred outflows of resources/liabilities anddeferred inflows of resources:
Receivables, net...................................................................................... - 18,795 7 86 18,888 Accounts payable.................................................................................... (942) - (162) 261 (843) Accrued payroll........................................................................................ 66 - 11 429 506 Accrued vacation and sick leave pay...................................................... 17 - - 191 208 Accrued workers' compensation............................................................. - - - (79) (79) Other postemployment benefits obligation.............................................. 194 - - 1,457 1,651 Due to other funds................................................................................... (22) - - (30) (52) Unearned revenue and other liabilities..................................................... - (2,889) - - (2,889) Net pension liability and pension related deferred outflows andinflows of resources................................................................................ (1,226) - - (3,118) (4,344)
Total adjustments...................................................................................... (1,755) 15,906 (86) 2,176 16,241 Net cash provided by operating activities....................................................... 208$ 15,906$ 3$ 1,318$ 17,435$
Reconciliation of cash and cash equivalentsto the combining statement of net position:
Deposits and investments with City Treasury:Unrestricted................................................................................................ 3,198$ -$ 1,993$ 30,073$ 35,264$
Deposits and investments outside City Treasury:Restricted................................................................................................... - 25,349 - - 25,349
Cash and cash equivalents at end of yearon statement of cash flows.......................................................................... 3,198$ 25,349$ 1,993$ 30,073$ 60,613$
Non-cash capital and related financing activities:Acquisition of capital assets on accounts payable
and capital lease........................................................................................ -$ 361$ -$ -$ 361$
CITY AND COUNTY OF SAN FRANCISCO FIDUCIARY FUNDS
208
Fiduciary Funds include all Trust and Agency Funds which account for assets held by the City as a trustee or as an agent for individuals or other governmental units Trust Funds
Employees’ Retirement System – Accounts for the contributions from employees, City contributions and the earnings and profits from investments of monies. Disbursements are made for retirements, withdrawal, disability, and death benefits of the employees as well as administrative expenses.
Health Service System – Accounts for the contributions from active and retired employees, and surviving spouses, City contributions and the earnings and profits from investment of monies. Disbursements are made for medical expenses and to various health plans of the beneficiaries.
Retiree Health Care Trust - Accounts for the contributions from employees, City contributions and the earnings and profits from investment of monies. Disbursements are to be made for benefits, expenses and other charges properly allocable to the trust fund.
Agency Funds
Agency Funds are custodial in nature and do not involve measurement of results of operations. Such funds have no equity accounts since all assets are due to individuals or entities at some future time. Assistance Program Fund – Accounts for collections and advances received as an agent under various
human welfare and community health programs. Monies are disbursed in accordance with legal requirements and program regulations.
Deposits Fund – Accounts for all deposits under the control of the City departments. Dispositions of the deposits are governed by the terms of the statutes and ordinances establishing the deposit requirement.
Payroll Deduction Fund – Accounts for monies held for payroll charges including federal, state and other payroll related deductions.
State Revenue Collection Fund – Accounts for various fees, fines and penalties collected by City departments for the State of California which are passed through to the State.
Tax Collection Fund – Accounts for monies received for current and delinquent taxes which must be held pending authority for distribution. Included are prepaid taxes, disputed taxes, duplicate payment of taxes, etc. This fund also accounts for monies deposited by third parties pending settlement of litigation and claims. Upon final settlement, monies are disbursed as directed by the courts or by parties to the dispute.
Transit Fund – Accounts for the quarter of one percent sales tax collected by the State Board of Equalization and deposited with the County of origin for local transportation support. The Metropolitan Transportation Commission, the regional agency responsible for administration of these monies, directs their use and distribution.
Other Agency Funds – Accounts for monies held as agent for a variety of purposes.
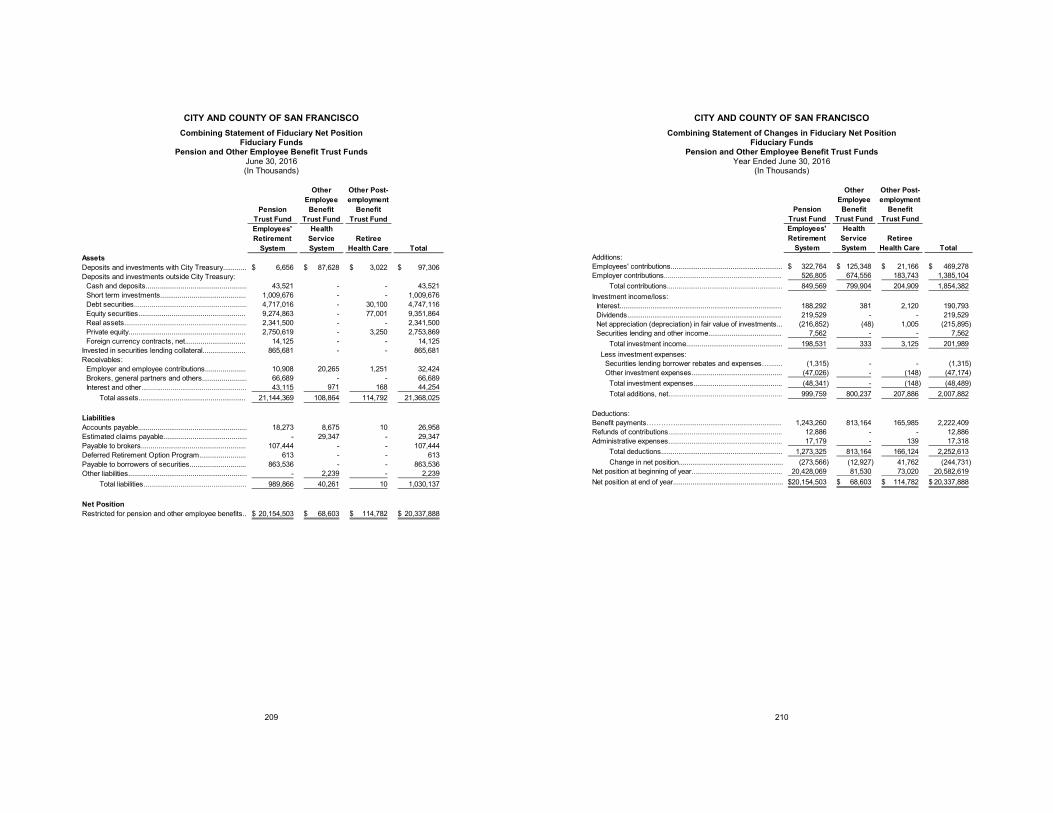
CITY AND COUNTY OF SAN FRANCISCO Combining Statement of Fiduciary Net Position
Fiduciary Funds Pension and Other Employee Benefit Trust Funds
June 30, 2016 (In Thousands)
209
Pension Trust Fund
Other Employee Benefit
Trust Fund
Other Post-employment
Benefit Trust Fund
Employees' Retirement
System
Health Service System
Retiree Health Care Total
AssetsDeposits and investments with City Treasury............ 6,656$ 87,628$ 3,022$ 97,306$ Deposits and investments outside City Treasury:
Cash and deposits.................................................... 43,521 - - 43,521 Short term investments............................................ 1,009,676 - - 1,009,676 Debt securities.......................................................... 4,717,016 - 30,100 4,747,116 Equity securities....................................................... 9,274,863 - 77,001 9,351,864 Real assets............................................................... 2,341,500 - - 2,341,500 Private equity............................................................ 2,750,619 - 3,250 2,753,869 Foreign currency contracts, net............................... 14,125 - - 14,125
Invested in securities lending collateral...................... 865,681 - - 865,681 Receivables:
Employer and employee contributions..................... 10,908 20,265 1,251 32,424 Brokers, general partners and others....................... 66,689 - - 66,689 Interest and other...................................................... 43,115 971 168 44,254
Total assets....................................................... 21,144,369 108,864 114,792 21,368,025
LiabilitiesAccounts payable........................................................ 18,273 8,675 10 26,958 Estimated claims payable........................................... - 29,347 - 29,347 Payable to brokers...................................................... 107,444 - - 107,444 Deferred Retirement Option Program........................ 613 - - 613 Payable to borrowers of securities............................. 863,536 - - 863,536 Other liabilities............................................................. - 2,239 - 2,239
Total liabilities..................................................... 989,866 40,261 10 1,030,137
Net PositionRestricted for pension and other employee benefits.. 20,154,503$ 68,603$ 114,782$ 20,337,888$
CITY AND COUNTY OF SAN FRANCISCO Combining Statement of Changes in Fiduciary Net Position
Fiduciary Funds Pension and Other Employee Benefit Trust Funds
Year Ended June 30, 2016 (In Thousands)
210
Pension Trust Fund
Other Employee Benefit
Trust Fund
Other Post-employment
Benefit Trust Fund
Employees' Retirement
System
Health Service System
Retiree Health Care Total
Additions:Employees' contributions.......................................................... 322,764$ 125,348$ 21,166$ 469,278$ Employer contributions............................................................. 526,805 674,556 183,743 1,385,104
Total contributions............................................................ 849,569 799,904 204,909 1,854,382 Investment income/loss:
Interest.................................................................................... 188,292 381 2,120 190,793 Dividends................................................................................ 219,529 - - 219,529 Net appreciation (depreciation) in fair value of investments... (216,852) (48) 1,005 (215,895) Securities lending and other income...................................... 7,562 - - 7,562
Total investment income.................................................. 198,531 333 3,125 201,989 Less investment expenses:
Securities lending borrower rebates and expenses…....... (1,315) - - (1,315) Other investment expenses............................................... (47,026) - (148) (47,174)
Total investment expenses.............................................. (48,341) - (148) (48,489) Total additions, net........................................................... 999,759 800,237 207,886 2,007,882
Deductions:Benefit payments…………....................................................... 1,243,260 813,164 165,985 2,222,409 Refunds of contributions........................................................... 12,886 - - 12,886 Administrative expenses........................................................... 17,179 - 139 17,318
Total deductions............................................................... 1,273,325 813,164 166,124 2,252,613 Change in net position...................................................... (273,566) (12,927) 41,762 (244,731)
Net position at beginning of year............................................... 20,428,069 81,530 73,020 20,582,619 Net position at end of year......................................................... 20,154,503$ 68,603$ 114,782$ 20,337,888$
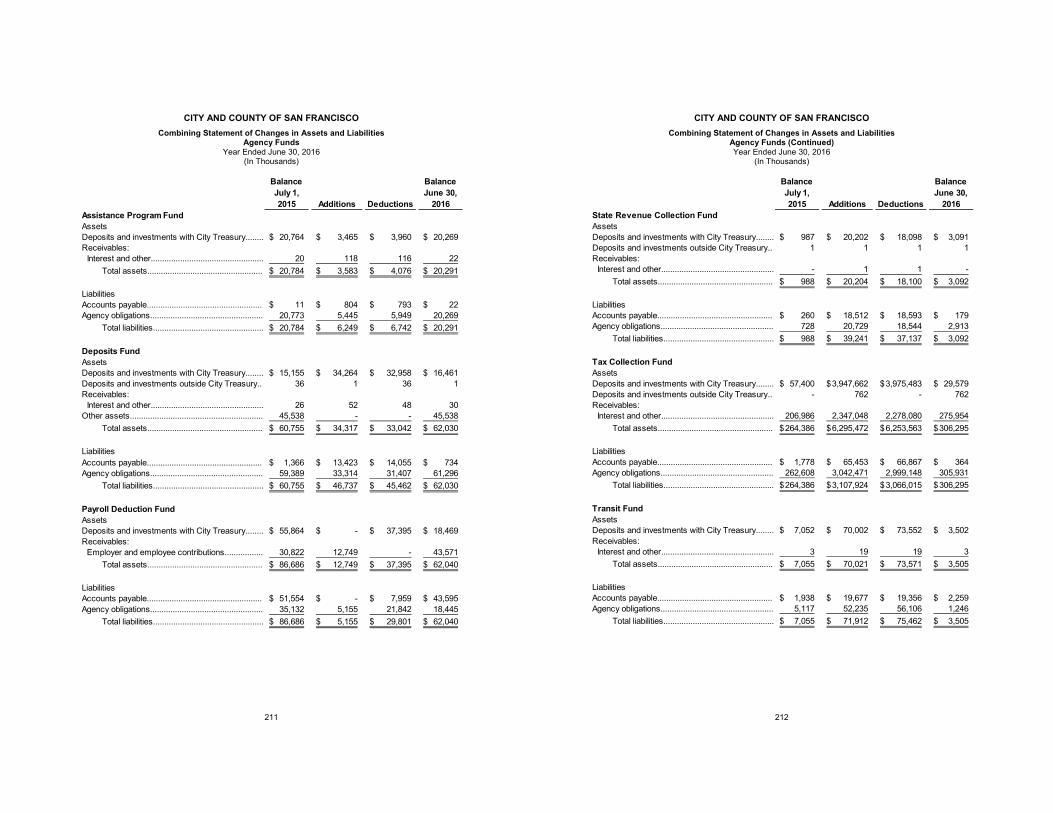
CITY AND COUNTY OF SAN FRANCISCO Combining Statement of Changes in Assets and Liabilities
Agency Funds Year Ended June 30, 2016
(In Thousands)
211
Balance July 1, 2015 Additions Deductions
Balance June 30,
2016Assistance Program FundAssetsDeposits and investments with City Treasury........ 20,764$ 3,465$ 3,960$ 20,269$ Receivables:
Interest and other.................................................. 20 118 116 22 Total assets................................................... 20,784$ 3,583$ 4,076$ 20,291$
LiabilitiesAccounts payable................................................... 11$ 804$ 793$ 22$ Agency obligations.................................................. 20,773 5,445 5,949 20,269
Total liabilities................................................. 20,784$ 6,249$ 6,742$ 20,291$
Deposits FundAssetsDeposits and investments with City Treasury........ 15,155$ 34,264$ 32,958$ 16,461$ Deposits and investments outside City Treasury.. 36 1 36 1 Receivables:
Interest and other.................................................. 26 52 48 30 Other assets........................................................... 45,538 - - 45,538
Total assets................................................... 60,755$ 34,317$ 33,042$ 62,030$
LiabilitiesAccounts payable................................................... 1,366$ 13,423$ 14,055$ 734$ Agency obligations.................................................. 59,389 33,314 31,407 61,296
Total liabilities................................................. 60,755$ 46,737$ 45,462$ 62,030$
Payroll Deduction FundAssetsDeposits and investments with City Treasury........ 55,864$ -$ 37,395$ 18,469$ Receivables:
Employer and employee contributions................. 30,822 12,749 - 43,571 Total assets................................................... 86,686$ 12,749$ 37,395$ 62,040$
LiabilitiesAccounts payable................................................... 51,554$ -$ 7,959$ 43,595$ Agency obligations.................................................. 35,132 5,155 21,842 18,445
Total liabilities................................................. 86,686$ 5,155$ 29,801$ 62,040$
CITY AND COUNTY OF SAN FRANCISCO Combining Statement of Changes in Assets and Liabilities
Agency Funds (Continued) Year Ended June 30, 2016
(In Thousands)
212
Balance July 1, 2015 Additions Deductions
Balance June 30,
2016State Revenue Collection FundAssetsDeposits and investments with City Treasury........ 987$ 20,202$ 18,098$ 3,091$ Deposits and investments outside City Treasury.. 1 1 1 1 Receivables:
Interest and other.................................................. - 1 1 - Total assets................................................... 988$ 20,204$ 18,100$ 3,092$
LiabilitiesAccounts payable................................................... 260$ 18,512$ 18,593$ 179$ Agency obligations.................................................. 728 20,729 18,544 2,913
Total liabilities................................................. 988$ 39,241$ 37,137$ 3,092$
Tax Collection FundAssetsDeposits and investments with City Treasury........ 57,400$ 3,947,662$ 3,975,483$ 29,579$ Deposits and investments outside City Treasury.. - 762 - 762 Receivables:
Interest and other.................................................. 206,986 2,347,048 2,278,080 275,954 Total assets................................................... 264,386$ 6,295,472$ 6,253,563$ 306,295$
LiabilitiesAccounts payable................................................... 1,778$ 65,453$ 66,867$ 364$ Agency obligations.................................................. 262,608 3,042,471 2,999,148 305,931
Total liabilities................................................. 264,386$ 3,107,924$ 3,066,015$ 306,295$
Transit FundAssetsDeposits and investments with City Treasury........ 7,052$ 70,002$ 73,552$ 3,502$ Receivables:
Interest and other.................................................. 3 19 19 3 Total assets................................................... 7,055$ 70,021$ 73,571$ 3,505$
LiabilitiesAccounts payable................................................... 1,938$ 19,677$ 19,356$ 2,259$ Agency obligations.................................................. 5,117 52,235 56,106 1,246
Total liabilities................................................. 7,055$ 71,912$ 75,462$ 3,505$
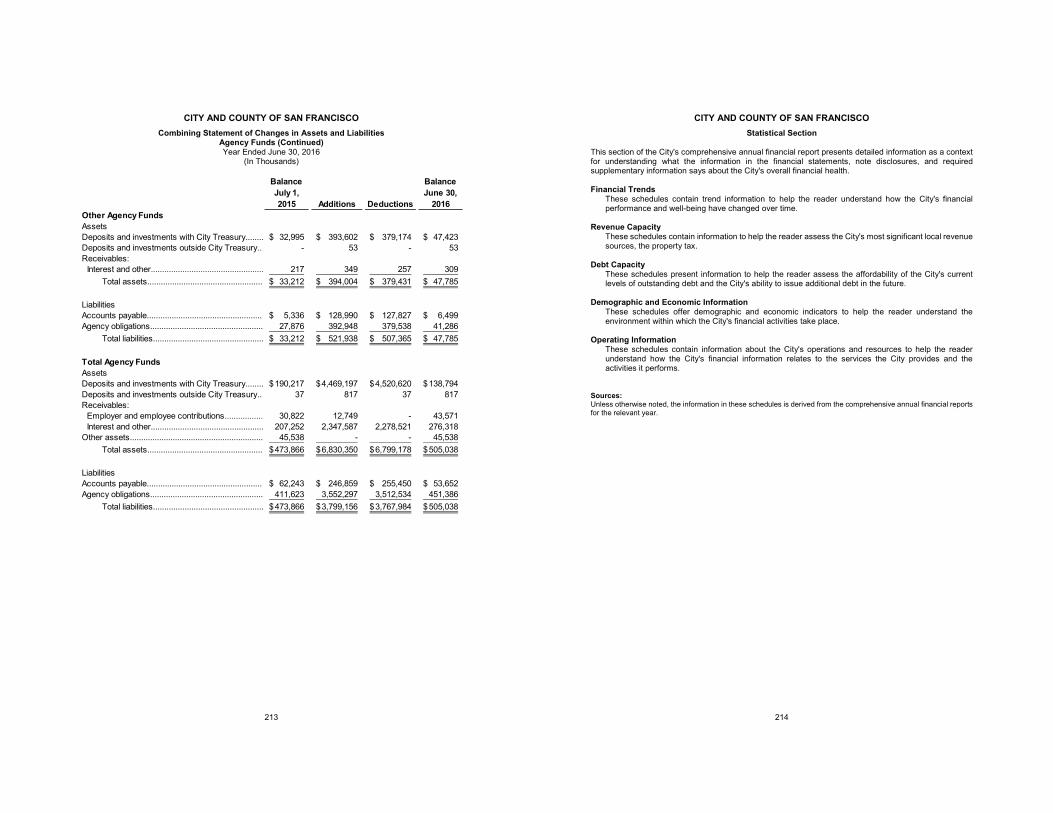
CITY AND COUNTY OF SAN FRANCISCO Combining Statement of Changes in Assets and Liabilities
Agency Funds (Continued) Year Ended June 30, 2016
(In Thousands)
213
Balance July 1, 2015 Additions Deductions
Balance June 30,
2016Other Agency FundsAssetsDeposits and investments with City Treasury........ 32,995$ 393,602$ 379,174$ 47,423$ Deposits and investments outside City Treasury.. - 53 - 53 Receivables:
Interest and other.................................................. 217 349 257 309 Total assets................................................... 33,212$ 394,004$ 379,431$ 47,785$
LiabilitiesAccounts payable................................................... 5,336$ 128,990$ 127,827$ 6,499$ Agency obligations.................................................. 27,876 392,948 379,538 41,286
Total liabilities................................................. 33,212$ 521,938$ 507,365$ 47,785$
Total Agency FundsAssetsDeposits and investments with City Treasury........ 190,217$ 4,469,197$ 4,520,620$ 138,794$ Deposits and investments outside City Treasury.. 37 817 37 817 Receivables:
Employer and employee contributions................. 30,822 12,749 - 43,571 Interest and other.................................................. 207,252 2,347,587 2,278,521 276,318
Other assets........................................................... 45,538 - - 45,538 Total assets................................................... 473,866$ 6,830,350$ 6,799,178$ 505,038$
LiabilitiesAccounts payable................................................... 62,243$ 246,859$ 255,450$ 53,652$ Agency obligations.................................................. 411,623 3,552,297 3,512,534 451,386
Total liabilities................................................. 473,866$ 3,799,156$ 3,767,984$ 505,038$
CITY AND COUNTY OF SAN FRANCISCO Statistical Section
214
This section of the City's comprehensive annual financial report presents detailed information as a context for understanding what the information in the financial statements, note disclosures, and required supplementary information says about the City's overall financial health. Financial Trends
These schedules contain trend information to help the reader understand how the City's financial performance and well-being have changed over time.
Revenue Capacity
These schedules contain information to help the reader assess the City's most significant local revenue sources, the property tax.
Debt Capacity
These schedules present information to help the reader assess the affordability of the City's current levels of outstanding debt and the City's ability to issue additional debt in the future.
Demographic and Economic Information
These schedules offer demographic and economic indicators to help the reader understand the environment within which the City's financial activities take place.
Operating Information
These schedules contain information about the City's operations and resources to help the reader understand how the City's financial information relates to the services the City provides and the activities it performs.
Sources: Unless otherwise noted, the information in these schedules is derived from the comprehensive annual financial reports for the relevant year.
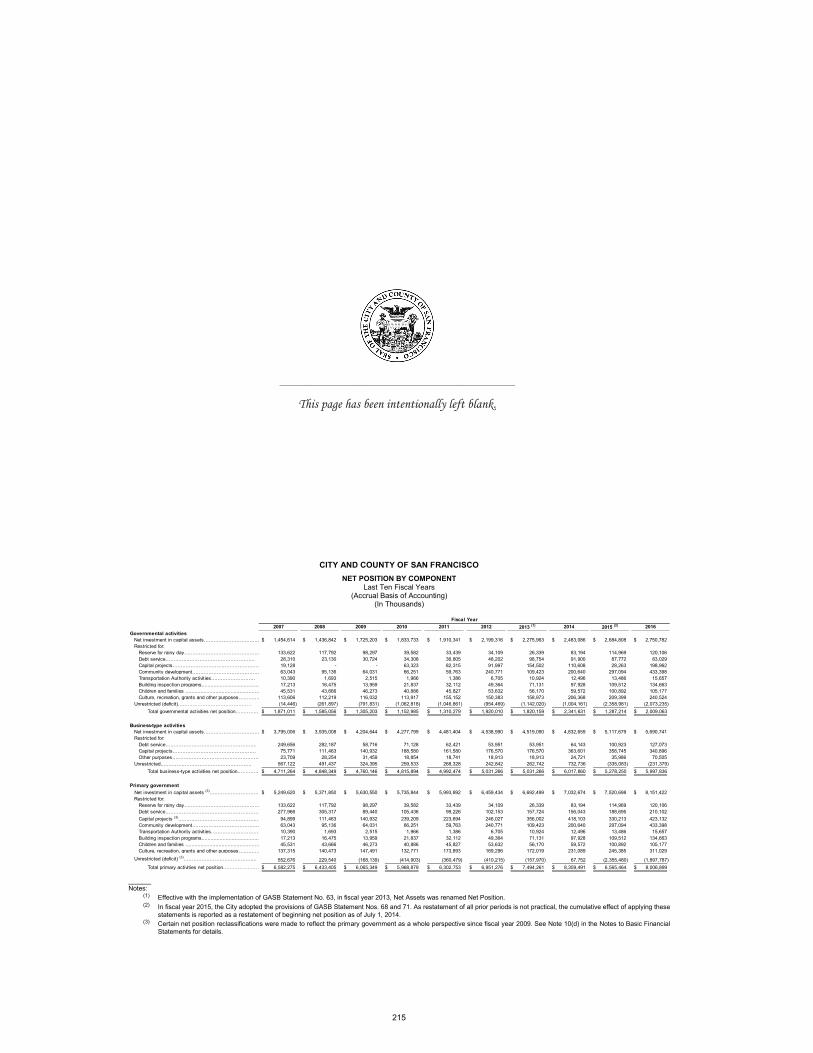
CITY AND COUNTY OF SAN FRANCISCO NET POSITION BY COMPONENT
Last Ten Fiscal Years (Accrual Basis of Accounting)
(In Thousands)
215
_____ Notes:
(1) Effective with the implementation of GASB Statement No. 63, in fiscal year 2013, Net Assets was renamed Net Position. (2) In fiscal year 2015, the City adopted the provisions of GASB Statement Nos. 68 and 71. As restatement of all prior periods is not practical, the cumulative effect of applying these
statements is reported as a restatement of beginning net position as of July 1, 2014.(3) Certain net position reclassifications were made to reflect the primary government as a whole perspective since fiscal year 2009. See Note 10(d) in the Notes to Basic Financial
Statements for details.
2007 2008 2009 2010 2011 2012 2013 (1) 2014 2015 (2) 2016Governmental activities
Net investment in capital assets……………………………… 1,454,614$ 1,436,842$ 1,725,203$ 1,833,733$ 1,910,341$ 2,199,316$ 2,275,963$ 2,483,086$ 2,684,808$ 2,750,782$ Restricted for:
Reserve for rainy day………………………………………… 133,622 117,792 98,297 39,582 33,439 34,109 26,339 83,194 114,969 120,106 Debt service…………...…………………………………. 28,310 23,130 30,724 34,308 36,805 48,202 98,754 91,900 87,772 83,029 Capital projects……………….……………………………… 19,128 - - 63,323 82,315 91,997 154,502 110,608 28,263 198,962 Community development…………………………………… 63,043 95,136 64,031 66,251 59,763 240,771 109,423 200,640 297,094 433,398 Transportation Authority activities……………………… 10,390 1,693 2,515 1,966 1,386 6,705 10,924 12,496 13,486 15,657 Building inspection programs...................................... 17,213 16,475 13,959 21,837 32,112 49,364 71,131 97,928 109,512 134,663 Children and families ................................................. 45,531 43,666 46,273 40,886 45,827 53,632 56,170 59,572 100,892 105,177 Culture, recreation, grants and other purposes…………… 113,606 112,219 116,032 113,917 155,152 150,383 158,973 206,368 209,399 240,524
Unrestricted (deficit)……………………………………… (14,446) (261,897) (791,831) (1,062,818) (1,046,861) (954,469) (1,142,020) (1,004,161) (2,358,981) (2,073,235) Total governmental activities net position…………… 1,871,011$ 1,585,056$ 1,305,203$ 1,152,985$ 1,310,279$ 1,920,010$ 1,820,159$ 2,341,631$ 1,287,214$ 2,009,063$
Business-type activitiesNet investment in capital assets……………………………… 3,795,006$ 3,935,008$ 4,204,644$ 4,277,799$ 4,481,404$ 4,538,990$ 4,519,090$ 4,832,659$ 5,117,679$ 5,690,741$ Restricted for:
Debt service……………………………………………….. 249,656 282,187 58,716 71,128 62,421 53,951 53,951 64,143 100,923 127,073 Capital projects…………………………………………… 75,771 111,463 140,932 188,580 161,580 176,570 176,570 363,601 358,745 340,896 Other purposes……………………………………………… 23,709 28,254 31,459 18,854 18,741 18,913 18,913 24,721 35,986 70,505
Unrestricted.…..………………………………………….. 567,122 491,437 324,395 259,533 268,328 242,842 262,742 732,736 (335,083) (231,379) Total business-type activities net position…………… 4,711,264$ 4,848,349$ 4,760,146$ 4,815,894$ 4,992,474$ 5,031,266$ 5,031,266$ 6,017,860$ 5,278,250$ 5,997,836$
Primary governmentNet investment in capital assets (3)………………………… 5,249,620$ 5,371,850$ 5,630,550$ 5,735,844$ 5,993,892$ 6,459,434$ 6,692,499$ 7,032,674$ 7,520,698$ 8,151,422$ Restricted for:
Reserve for rainy day………………………………………. 133,622 117,792 98,297 39,582 33,439 34,109 26,339 83,194 114,969 120,106 Debt service…………………………………………………. 277,966 305,317 89,440 105,436 99,226 102,153 157,724 156,043 188,695 210,102 Capital projects (3)…………………………………………… 94,899 111,463 140,932 239,209 223,694 246,027 356,002 418,103 330,213 423,132 Community development…………………………………… 63,043 95,136 64,031 66,251 59,763 240,771 109,423 200,640 297,094 433,398 Transportation Authority activities………………………… 10,390 1,693 2,515 1,966 1,386 6,705 10,924 12,496 13,486 15,657 Building inspection programs...................................... 17,213 16,475 13,959 21,837 32,112 49,364 71,131 97,928 109,512 134,663 Children and families ................................................. 45,531 43,666 46,273 40,886 45,827 53,632 56,170 59,572 100,892 105,177 Culture, recreation, grants and other purposes…………… 137,315 140,473 147,491 132,771 173,893 169,296 172,019 231,089 245,385 311,029
Unrestricted (deficit) (3)……………………………………... 552,676 229,540 (168,139) (414,903) (360,479) (410,215) (157,970) 67,752 (2,355,480) (1,897,787) Total primary activities net position…………………… 6,582,275$ 6,433,405$ 6,065,349$ 5,968,879$ 6,302,753$ 6,951,276$ 7,494,261$ 8,359,491$ 6,565,464$ 8,006,899$
Fiscal Year
________________________________________________
This page has been intentionally left blank.
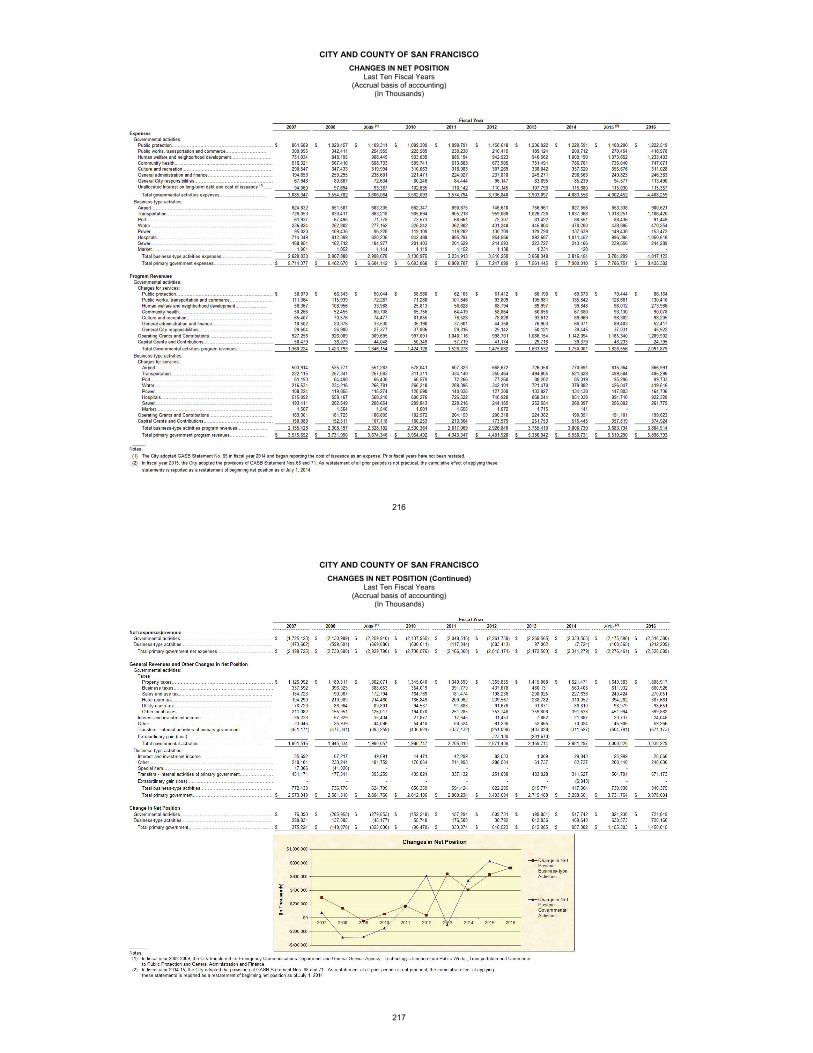
CITY AND COUNTY OF SAN FRANCISCO CHANGES IN NET POSITION
Last Ten Fiscal Years (Accrual basis of accounting)
(In Thousands)
216
CITY AND COUNTY OF SAN FRANCISCO CHANGES IN NET POSITION (Continued)
Last Ten Fiscal Years (Accrual basis of accounting)
(In Thousands)
217
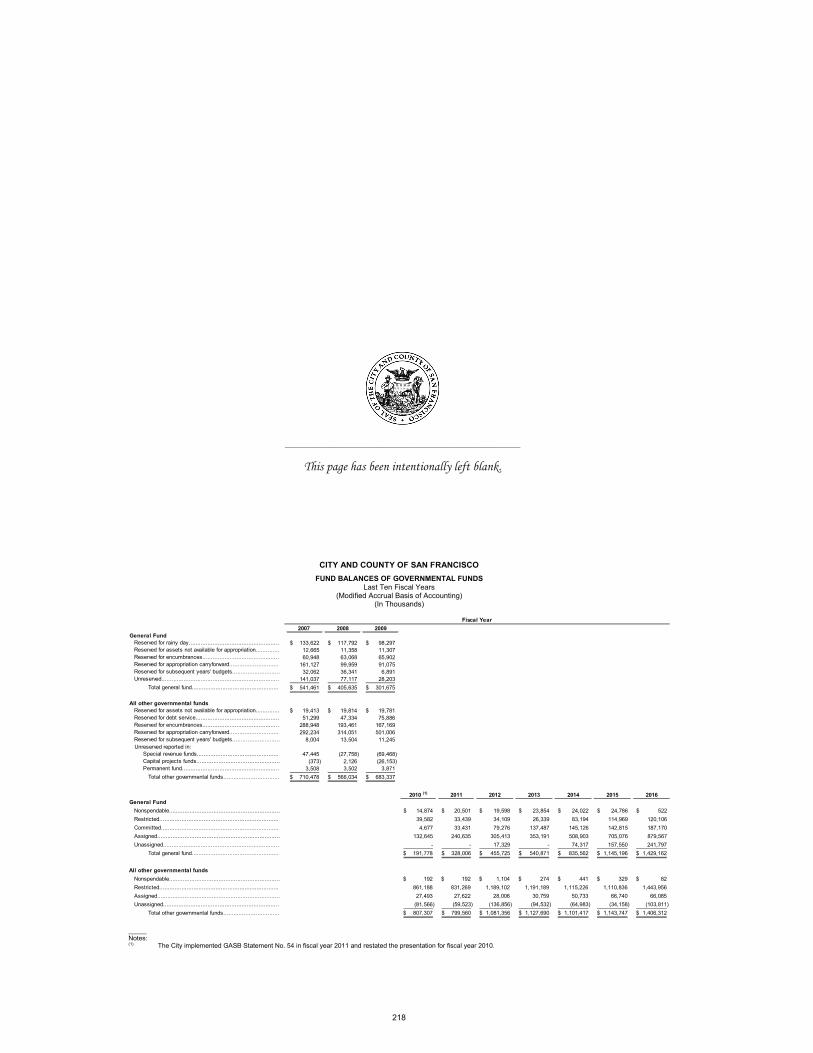
CITY AND COUNTY OF SAN FRANCISCO FUND BALANCES OF GOVERNMENTAL FUNDS
Last Ten Fiscal Years (Modified Accrual Basis of Accounting)
(In Thousands)
218
_____ Notes: (1) The City implemented GASB Statement No. 54 in fiscal year 2011 and restated the presentation for fiscal year 2010.
2007 2008 2009General Fund
133,622$ 117,792$ 98,297$ 12,665 11,358 11,307 60,948 63,068 65,902
161,127 99,959 91,075 32,062 36,341 6,891
141,037 77,117 28,203 541,461$ 405,635$ 301,675$
All other governmental funds19,413$ 19,814$ 19,781$ 51,299 47,334 75,886
288,948 193,461 167,169 292,234 314,051 501,006
8,004 13,504 11,245 Unreserved reported in:
47,445 (27,758) (69,468) (373) 2,126 (26,153)
3,508 3,502 3,871 710,478$ 566,034$ 683,337$
2010 (1) 2011 2012 2013 2014 2015 2016General Fund
14,874$ 20,501$ 19,598$ 23,854$ 24,022$ 24,786$ 522$ 39,582 33,439 34,109 26,339 83,194 114,969 120,106 4,677 33,431 79,276 137,487 145,126 142,815 187,170
132,645 240,635 305,413 353,191 508,903 705,076 879,567 - - 17,329 - 74,317 157,550 241,797
191,778$ 328,006$ 455,725$ 540,871$ 835,562$ 1,145,196$ 1,429,162$
All other governmental funds192$ 192$ 1,104$ 274$ 441$ 329$ 82$
861,188 831,269 1,189,102 1,191,189 1,115,226 1,110,836 1,443,956 27,493 27,622 28,006 30,759 50,733 66,740 66,085
(81,566) (59,523) (136,856) (94,532) (64,983) (34,158) (103,811) 807,307$ 799,560$ 1,081,356$ 1,127,690$ 1,101,417$ 1,143,747$ 1,406,312$ Total other governmental funds.................................
Restricted......................................................................Assigned........................................................................Unassigned....................................................................
Special revenue funds................................................Capital projects funds.................................................Permanent fund.........................................................
Total other governmental funds.................................
Total general fund...................................................
Nonspendable.................................................................Restricted......................................................................Committed.....................................................................Assigned........................................................................Unassigned....................................................................
Nonspendable.................................................................
Unreserved.....................................................................
Reserved for assets not available for appropriation..............Reserved for debt service.................................................Reserved for encumbrances.............................................Reserved for appropriation carryforward.............................Reserved for subsequent years' budgets............................
Total general fund...................................................
Fiscal Year
Reserved for rainy day.....................................................Reserved for assets not available for appropriation..............Reserved for encumbrances.............................................Reserved for appropriation carryforward.............................Reserved for subsequent years' budgets............................
________________________________________________
This page has been intentionally left blank.
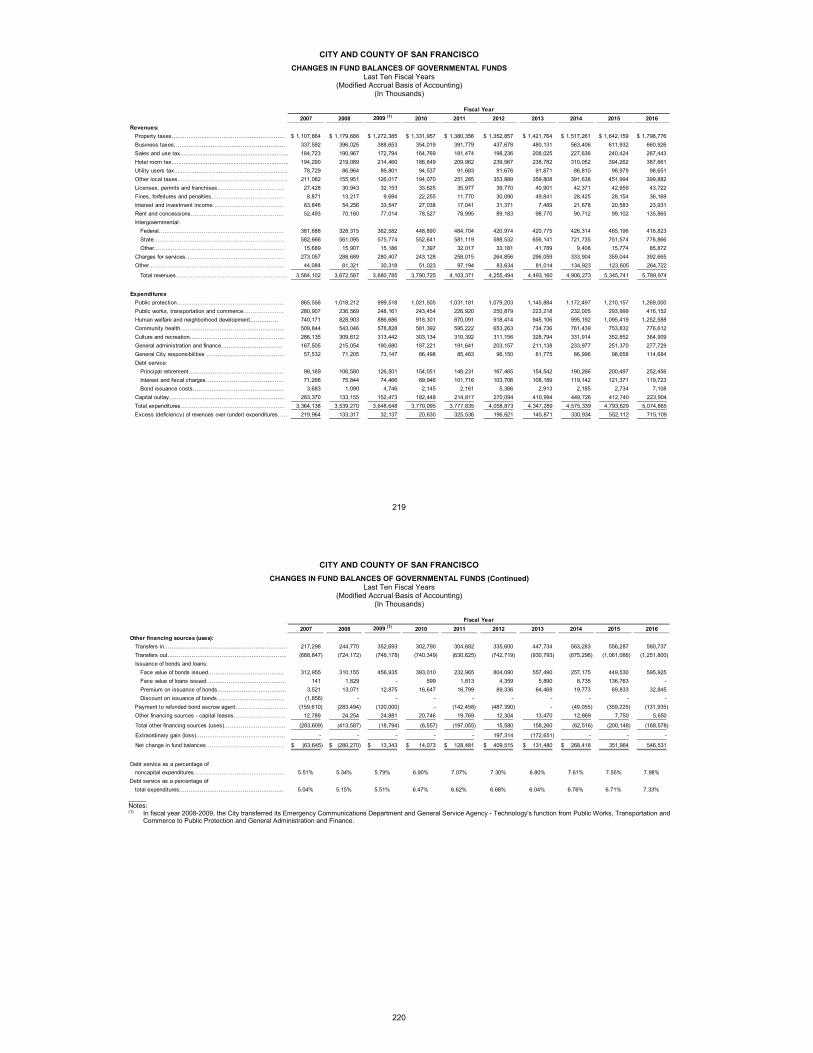
CITY AND COUNTY OF SAN FRANCISCO CHANGES IN FUND BALANCES OF GOVERNMENTAL FUNDS
Last Ten Fiscal Years (Modified Accrual Basis of Accounting)
(In Thousands)
219
2007 2008 2009 (1) 2010 2011 2012 2013 2014 2015 2016Revenues:
Property taxes………………...…………………………………. 1,107,864$ 1,179,688$ 1,272,385$ 1,331,957$ 1,380,356$ 1,352,857$ 1,421,764$ 1,517,261$ 1,642,159$ 1,798,776$ Business taxes………..…………………………………………. 337,592 396,025 388,653 354,019 391,779 437,678 480,131 563,406 611,932 660,926 Sales and use tax............................................................... 184,723 190,967 172,794 164,769 181,474 198,236 208,025 227,636 240,424 267,443 Hotel room tax.................................................................... 194,290 219,089 214,460 186,849 209,962 239,567 238,782 310,052 394,262 387,661 Utility users tax.................................................................. 78,729 86,964 89,801 94,537 91,683 91,676 91,871 86,810 98,979 98,651 Other local taxes................................................................ 211,082 155,951 126,017 194,070 251,285 353,889 359,808 391,638 451,994 399,882 Licenses, permits and franchises……………………………… 27,428 30,943 32,153 33,625 35,977 39,770 40,901 42,371 42,959 43,722 Fines, forfeitures and penalties………………………………… 8,871 13,217 9,694 22,255 11,770 30,090 49,841 28,425 28,154 36,169 Interest and investment income……………………………….. 83,846 54,256 33,547 27,038 17,041 31,371 7,489 21,678 20,583 23,931 Rent and concessions………………………………………….. 52,493 70,160 77,014 78,527 78,995 89,183 98,770 90,712 99,102 135,865 Intergovernmental:
Federal…………………………………………………………. 381,688 328,315 362,582 448,890 484,704 420,974 420,775 426,314 465,196 416,823 State……………………………………………………………. 582,666 561,095 575,774 552,641 581,119 588,532 656,141 721,735 751,574 776,866 Other……………………………………………………………. 15,689 15,907 15,186 7,397 32,017 33,181 41,789 9,408 15,774 85,872
Charges for services…………………………………………….. 273,057 288,689 280,407 243,128 258,015 264,856 296,059 333,904 359,044 392,665 Other…………………………………………………………….... 44,084 81,321 30,318 51,023 97,194 83,634 81,014 134,923 123,605 264,722
Total revenues………………….………………………………… 3,584,102 3,672,587 3,680,785 3,790,725 4,103,371 4,255,494 4,493,160 4,906,273 5,345,741 5,789,974
ExpendituresPublic protection…………………………………………………. 865,556 1,018,212 999,518 1,021,505 1,031,181 1,079,203 1,145,884 1,172,497 1,210,157 1,269,000 Public works, transportation and commerce…………………. 280,907 236,569 248,161 243,454 226,920 250,879 223,218 232,005 293,999 416,152 Human welfare and neighborhood development…………… 740,171 828,903 886,686 918,301 870,091 918,414 945,106 995,192 1,095,419 1,252,588 Community health……………………………………………….. 509,844 543,046 578,828 581,392 595,222 653,263 734,736 761,439 753,832 776,612 Culture and recreation…………………………………………… 286,135 309,612 313,442 303,134 310,392 311,156 328,794 331,914 352,852 364,909 General administration and finance…………………………… 167,505 215,054 190,680 187,221 191,641 203,157 211,138 233,977 251,370 277,729 General City responsibilities …………………………………… 57,532 71,205 73,147 86,498 85,463 96,150 81,775 86,996 98,658 114,684 Debt service:
Principal retirement…………………………………………… 98,169 106,580 126,501 154,051 148,231 167,465 154,542 190,266 200,497 252,456 Interest and fiscal charges…………………………………… 71,266 75,844 74,466 89,946 101,716 103,706 108,189 119,142 121,371 119,723 Bond issuance costs…………………………………………. 3,683 1,090 4,746 2,145 2,161 5,386 2,913 2,185 2,734 7,108
Capital outlay…………………………………………………….. 283,370 133,155 152,473 182,448 214,817 270,094 410,994 449,726 412,740 223,904 Total expenditures……………………………………………….. 3,364,138 3,539,270 3,648,648 3,770,095 3,777,835 4,058,873 4,347,289 4,575,339 4,793,629 5,074,865 Excess (deficiency) of revenues over (under) expenditures…… 219,964 133,317 32,137 20,630 325,536 196,621 145,871 330,934 552,112 715,109
Fiscal Year
CITY AND COUNTY OF SAN FRANCISCO CHANGES IN FUND BALANCES OF GOVERNMENTAL FUNDS (Continued)
Last Ten Fiscal Years (Modified Accrual Basis of Accounting)
(In Thousands)
220
_____ Notes: (1) In fiscal year 2008-2009, the City transferred its Emergency Communications Department and General Service Agency - Technology's function from Public Works, Transportation and
Commerce to Public Protection and General Administration and Finance.
2007 2008 2009 (1) 2010 2011 2012 2013 2014 2015 2016Other financing sources (uses):
Transfers in………………………………………………………… 217,298 244,770 352,693 302,790 304,682 335,600 447,734 563,283 556,287 580,737 Transfers out………………………………………………………. (668,847) (724,172) (746,178) (740,349) (630,625) (742,719) (930,793) (875,296) (1,061,086) (1,251,800) Issuance of bonds and loans:
Face value of bonds issued………………………………….. 312,955 310,155 456,935 393,010 232,965 804,090 557,490 257,175 449,530 595,925 Face value of loans issued…………………………………… 141 1,829 - 599 1,813 4,359 5,890 8,735 136,763 - Premium on issuance of bonds………………………………. 3,521 13,071 12,875 16,647 16,799 89,336 64,469 19,773 69,833 32,845 Discount on issuance of bonds……………………………… (1,856) - - - - - - - - -
Payment to refunded bond escrow agent………………………… (159,610) (283,494) (120,000) - (142,458) (487,390) - (49,055) (359,225) (131,935) Other financing sources - capital leases………………………. 12,789 24,254 24,881 20,746 19,769 12,304 13,470 12,869 7,750 5,650
Total other financing sources (uses)…………………………… (283,609) (413,587) (18,794) (6,557) (197,055) 15,580 158,260 (62,516) (200,148) (168,578)
Extraordinary gain (loss)…………………………….………….. - - - - - 197,314 (172,651) - - -
Net change in fund balances…………………………………… (63,645)$ (280,270)$ 13,343$ 14,073$ 128,481$ 409,515$ 131,480$ 268,418$ 351,964 546,531
Debt service as a percentage of noncapital expenditures…...……………………………………. 5.51% 5.34% 5.79% 6.90% 7.07% 7.30% 6.80% 7.61% 7.55% 7.98%
Debt service as a percentage of total expenditures……………………………………………….. 5.04% 5.15% 5.51% 6.47% 6.62% 6.68% 6.04% 6.76% 6.71% 7.33%
Fiscal Year
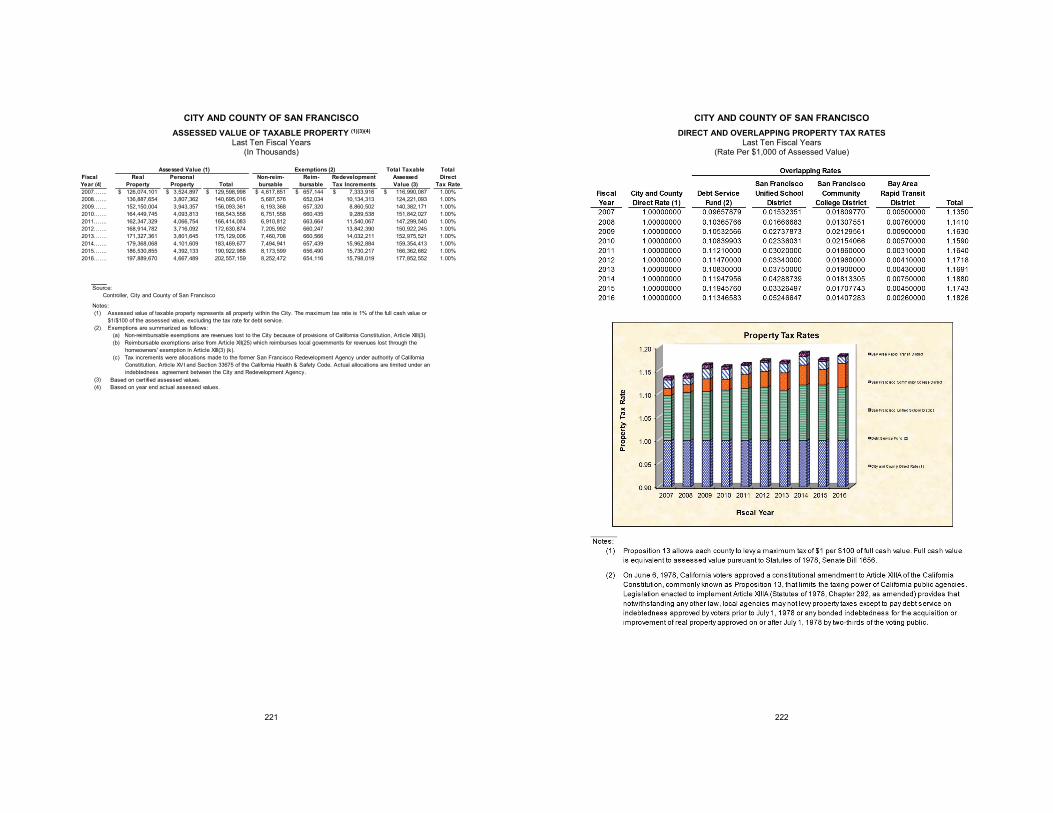
CITY AND COUNTY OF SAN FRANCISCO ASSESSED VALUE OF TAXABLE PROPERTY (1)(3)(4)
Last Ten Fiscal Years (In Thousands)
221
Assessed Value (1) Exemptions (2) Total Taxable TotalFiscal Real Personal Non-reim- Reim- Redevelopment Assessed DirectYear (4) Property Property Total bursable bursable Tax Increments Value (3) Tax Rate2007……. 126,074,101$ 3,524,897$ 129,598,998$ 4,617,851$ 657,144$ 7,333,916$ 116,990,087$ 1.00%2008……. 136,887,654 3,807,362 140,695,016 5,687,576 652,034 10,134,313 124,221,093 1.00%2009……. 152,150,004 3,943,357 156,093,361 6,193,368 657,320 8,860,502 140,382,171 1.00%2010……. 164,449,745 4,093,813 168,543,558 6,751,558 660,435 9,289,538 151,842,027 1.00%2011……. 162,347,329 4,066,754 166,414,083 6,910,812 663,664 11,540,067 147,299,540 1.00%2012……. 168,914,782 3,716,092 172,630,874 7,205,992 660,247 13,842,390 150,922,245 1.00%2013……. 171,327,361 3,801,645 175,129,006 7,460,708 660,566 14,032,211 152,975,521 1.00%2014……. 179,368,068 4,101,609 183,469,677 7,494,941 657,439 15,962,884 159,354,413 1.00%2015……. 186,530,855 4,392,133 190,922,988 8,173,599 656,490 15,730,217 166,362,682 1.00%2016……. 197,889,670 4,667,489 202,557,159 8,252,472 654,116 15,798,019 177,852,552 1.00%
Source:Controller, City and County of San Francisco
Notes:(1) Assessed value of taxable property represents all property within the City. The maximum tax rate is 1% of the full cash value or
$1/$100 of the assessed value, excluding the tax rate for debt service.(2) Exemptions are summarized as follows:
(a) Non-reimbursable exemptions are revenues lost to the City because of provisions of California Constitution, Article XIII(3).(b) Reimbursable exemptions arise from Article XII(25) which reimburses local governments for revenues lost through the homeowners' exemption in Article XIII(3) (k).(c) Tax increments were allocations made to the former San Francisco Redevelopment Agency under authority of California Constitution, Article XVI and Section 33675 of the California Health & Safety Code. Actual allocations are limited under an indebtedness agreement between the City and Redevelopment Agency.
(3) Based on certified assessed values.(4) Based on year end actual assessed values.
CITY AND COUNTY OF SAN FRANCISCO DIRECT AND OVERLAPPING PROPERTY TAX RATES
Last Ten Fiscal Years (Rate Per $1,000 of Assessed Value)
222
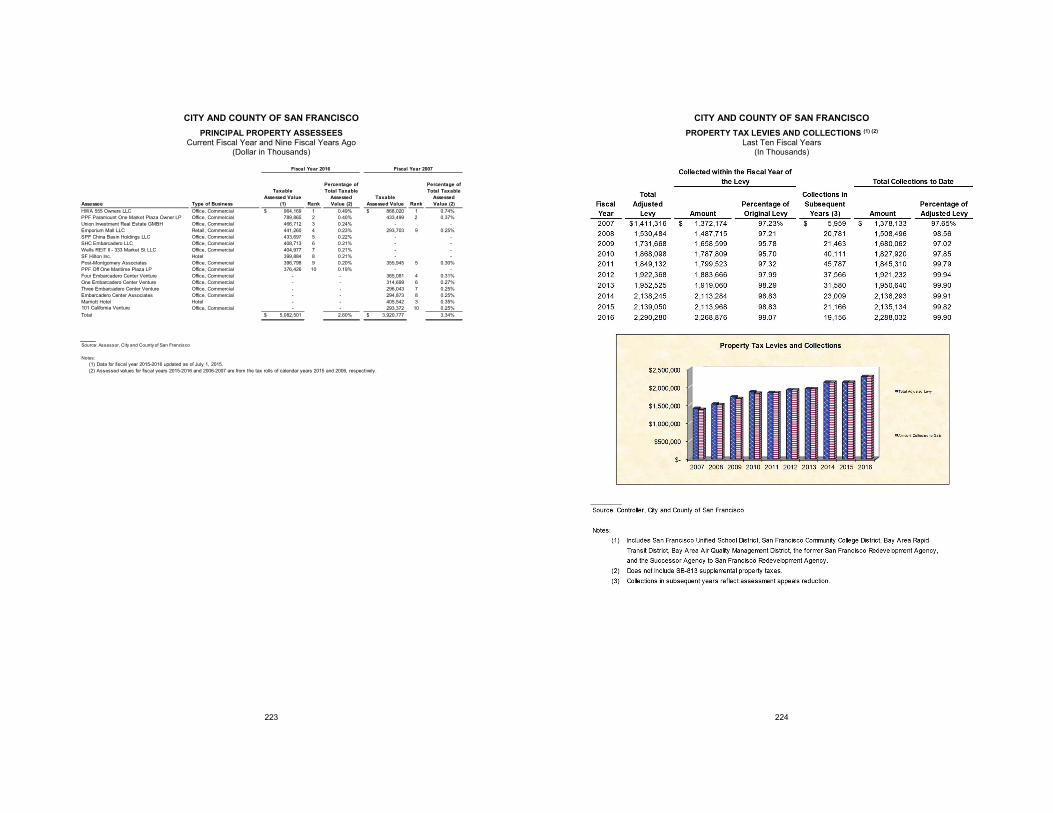
CITY AND COUNTY OF SAN FRANCISCO PRINCIPAL PROPERTY ASSESSEES
Current Fiscal Year and Nine Fiscal Years Ago (Dollar in Thousands)
223
Type of Business
Taxable Assessed Value
(1) Rank
Percentage of Total Taxable
Assessed Value (2)
Taxable Assessed Value Rank
Percentage of Total Taxable
Assessed Value (2)
HWA 555 Owners LLC Office, Commercial 964,169$ 1 0.49% 868,020$ 1 0.74%PPF Paramount One Market Plaza Owner LP Office, Commercial 789,865 2 0.40% 433,499 2 0.37%Union Investment Real Estate GMBH Office, Commercial 466,712 3 0.24% - - Emporium Mall LLC Retail, Commercial 441,260 4 0.23% 293,703 9 0.25%SPF China Basin Holdings LLC Office, Commercial 433,697 5 0.22% - - SHC Embarcadero LLC Office, Commercial 408,713 6 0.21% - - Wells REIT II - 333 Market St LLC Office, Commercial 404,977 7 0.21% - - SF Hilton Inc. Hotel 399,884 8 0.21% - - Post-Montgomery Associates Office, Commercial 396,798 9 0.20% 355,945 5 0.30%PPF Off One Maritime Plaza LP Office, Commercial 376,426 10 0.19% - - Four Embarcadero Center Venture Office, Commercial - - 365,081 4 0.31%One Embarcadero Center Venture Office, Commercial - - 314,699 6 0.27%Three Embarcadero Center Venture Office, Commercial - - 296,043 7 0.25%Embarcadero Center Associates Office, Commercial - - 294,873 8 0.25%Marriott Hotel Hotel - - 405,542 3 0.35%
Office, Commercial - - 293,372 10 0.25%Total 5,082,501$ 2.60% 3,920,777$ 3.34%
Source: Assessor, City and County of San Francisco
Notes:(1) Data for fiscal year 2015-2016 updated as of July 1, 2015.(2) Assessed values for fiscal years 2015-2016 and 2006-2007 are from the tax rolls of calendar years 2015 and 2006, respectively.
101 California Venture
Assessee
Fiscal Year 2016 Fiscal Year 2007
CITY AND COUNTY OF SAN FRANCISCO PROPERTY TAX LEVIES AND COLLECTIONS (1) (2)
Last Ten Fiscal Years (In Thousands)
224
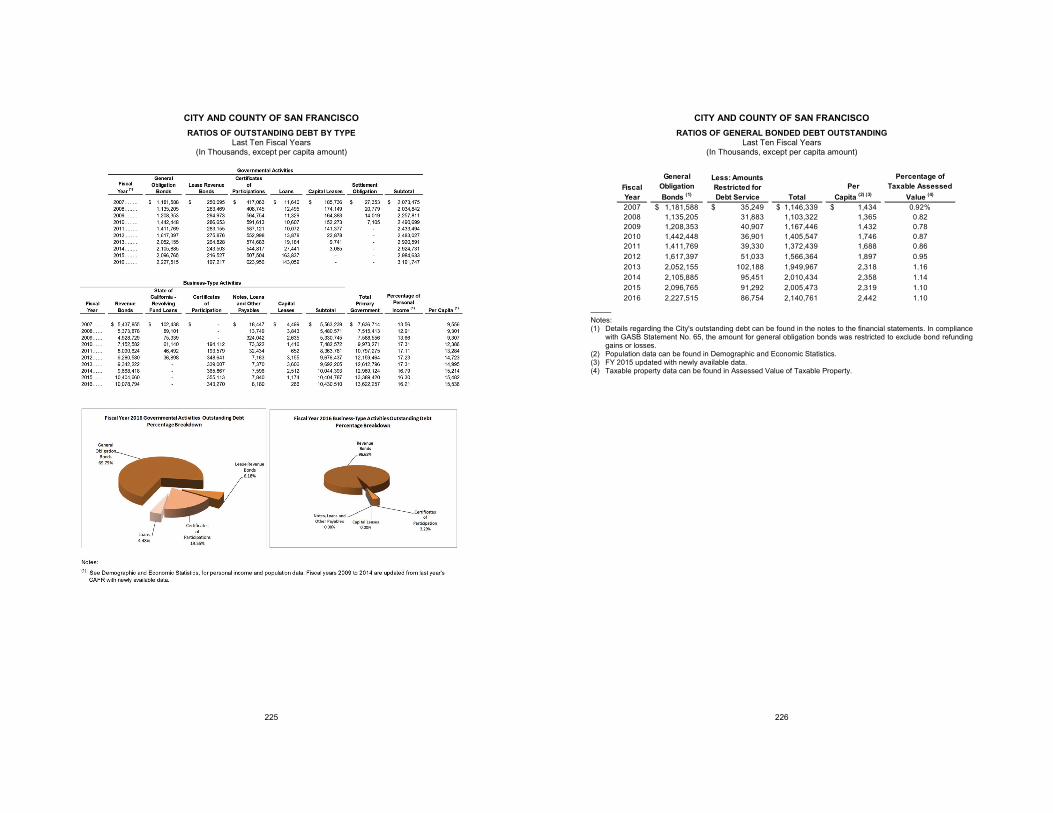
CITY AND COUNTY OF SAN FRANCISCO RATIOS OF OUTSTANDING DEBT BY TYPE
Last Ten Fiscal Years (In Thousands, except per capita amount)
225
CITY AND COUNTY OF SAN FRANCISCO RATIOS OF GENERAL BONDED DEBT OUTSTANDING
Last Ten Fiscal Years (In Thousands, except per capita amount)
226
_____ Notes: (1) Details regarding the City's outstanding debt can be found in the notes to the financial statements. In compliance
with GASB Statement No. 65, the amount for general obligation bonds was restricted to exclude bond refunding gains or losses.
(2) Population data can be found in Demographic and Economic Statistics. (3) FY 2015 updated with newly available data. (4) Taxable property data can be found in Assessed Value of Taxable Property.
Fiscal Year
General Obligation Bonds (1)
Less: Amounts Restricted for Debt Service Total
PerCapita (2) (3)
Percentage of Taxable Assessed
Value (4)
2007 1,181,588$ 35,249$ 1,146,339$ 1,434$ 0.92%2008 1,135,205 31,883 1,103,322 1,365 0.822009 1,208,353 40,907 1,167,446 1,432 0.782010 1,442,448 36,901 1,405,547 1,746 0.872011 1,411,769 39,330 1,372,439 1,688 0.862012 1,617,397 51,033 1,566,364 1,897 0.952013 2,052,155 102,188 1,949,967 2,318 1.162014 2,105,885 95,451 2,010,434 2,358 1.142015 2,096,765 91,292 2,005,473 2,319 1.102016 2,227,515 86,754 2,140,761 2,442 1.10
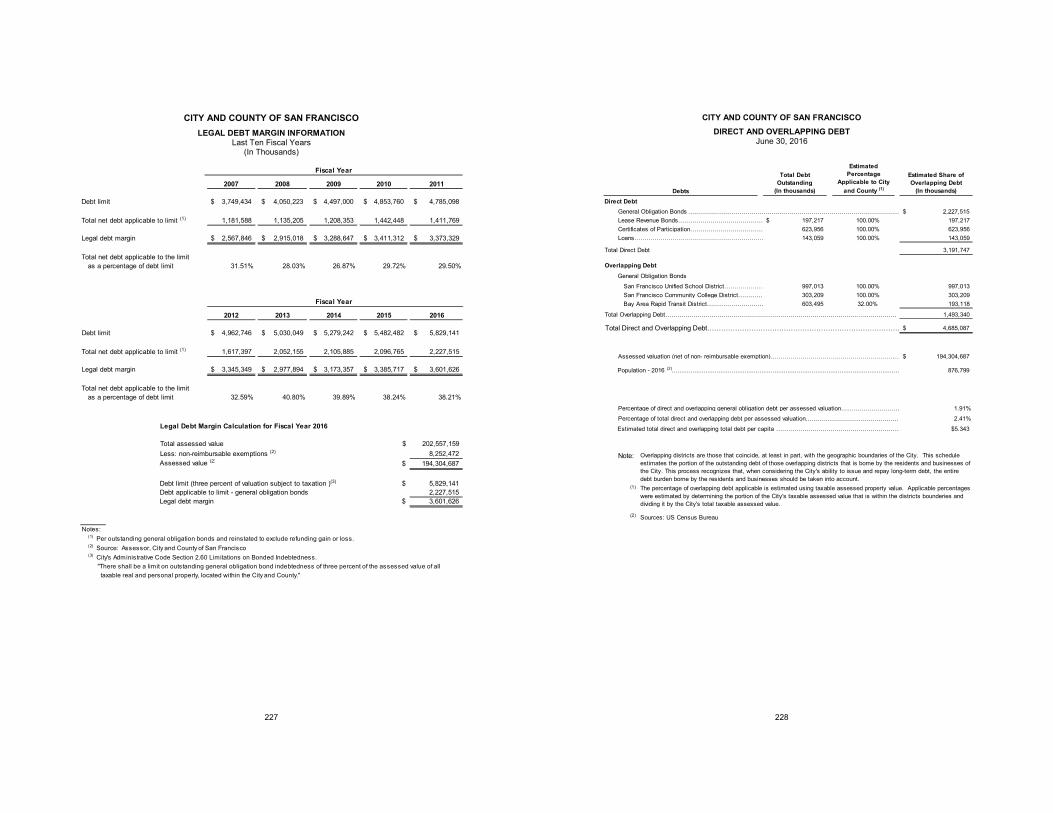
CITY AND COUNTY OF SAN FRANCISCO LEGAL DEBT MARGIN INFORMATION
Last Ten Fiscal Years (In Thousands)
227
Fiscal Year
2007 2008 2009 2010 2011
Debt limit 3,749,434$ 4,050,223$ 4,497,000$ 4,853,760$ 4,785,098$
Total net debt applicable to limit (1) 1,181,588 1,135,205 1,208,353 1,442,448 1,411,769
Legal debt margin 2,567,846$ 2,915,018$ 3,288,647$ 3,411,312$ 3,373,329$
Total net debt applicable to the limit as a percentage of debt limit 31.51% 28.03% 26.87% 29.72% 29.50%
Fiscal Year
2012 2013 2014 2015 2016
Debt limit 4,962,746$ 5,030,049$ 5,279,242$ 5,482,482$ 5,829,141$
Total net debt applicable to limit (1) 1,617,397 2,052,155 2,105,885 2,096,765 2,227,515
Legal debt margin 3,345,349$ 2,977,894$ 3,173,357$ 3,385,717$ 3,601,626$
Total net debt applicable to the limit as a percentage of debt limit 32.59% 40.80% 39.89% 38.24% 38.21%
Legal Debt Margin Calculation for Fiscal Year 2016
Total assessed value $ 202,557,159 Less: non-reimbursable exemptions (2) 8,252,472 Assessed value (2) $ 194,304,687
Debt limit (three percent of valuation subject to taxation )(3) $ 5,829,141 Debt applicable to limit - general obligation bonds 2,227,515 Legal debt margin $ 3,601,626
Notes:(1) Per outstanding general obligation bonds and reinstated to exclude refunding gain or loss.(2) Source: Assessor, City and County of San Francisco(3) City's Administrative Code Section 2.60 Limitations on Bonded Indebtedness. "There shall be a limit on outstanding general obligation bond indebtedness of three percent of the assessed value of all taxable real and personal property, located within the City and County."
CITY AND COUNTY OF SAN FRANCISCO DIRECT AND OVERLAPPING DEBT
June 30, 2016
228
Total Debt Outstanding
(In thousands)
Estimated Percentage
Applicable to City and County (1)
Estimated Share of Overlapping Debt
(In thousands)Direct Debt
General Obligation Bonds ……………………………………...………………………………………………….… 2,227,515$ Lease Revenue Bonds…………………………………… 197,217$ 100.00% 197,217 Certificates of Participation……………………………… 623,956 100.00% 623,956 Loans………………………………………………………… 143,059 100.00% 143,059
Total Direct Debt 3,191,747
Overlapping DebtGeneral Obligation Bonds San Francisco Unified School District………………… 997,013 100.00% 997,013 San Francisco Community College District………… 303,209 100.00% 303,209 Bay Area Rapid Transit District………………………… 603,495 32.00% 193,118
Total Overlapping Debt………………………………………………………………………………………..……..…… 1,493,340
Total Direct and Overlapping Debt………………………………………………………………………… 4,685,087$
Assessed valuation (net of non- reimbursable exemption)……………………………...…………………...…… 194,304,687$
Population - 2016 (2).......................................................................................................................... 876,799
Percentage of direct and overlapping general obligation debt per assessed valuation………………………… 1.91%Percentage of total direct and overlapping debt per assessed valuation………………………………………… 2.41%Estimated total direct and overlapping total debt per capita …………….………………….…………………… $5.343
Note:
(1)
(2)
Debts
Overlapping districts are those that coincide, at least in part, with the geographic boundaries of the City. This scheduleestimates the portion of the outstanding debt of those overlapping districts that is borne by the residents and businesses ofthe City. This process recognizes that, when considering the City's ability to issue and repay long-term debt, the entire debt burden borne by the residents and businesses should be taken into account.The percentage of overlapping debt applicable is estimated using taxable assessed property value. Applicable percentages were estimated by determining the portion of the City's taxable assessed value that is within the districts bounderies and dividing it by the City's total taxable assessed value.
Sources: US Census Bureau
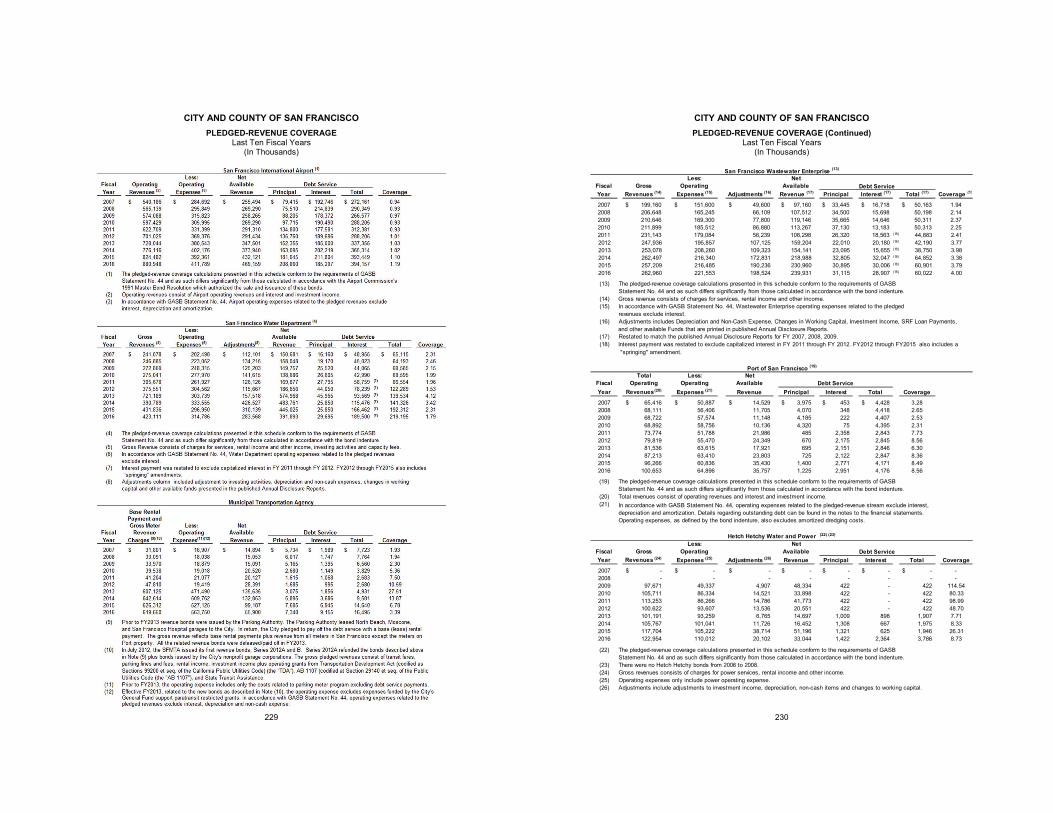
CITY AND COUNTY OF SAN FRANCISCO PLEDGED-REVENUE COVERAGE
Last Ten Fiscal Years (In Thousands)
229
CITY AND COUNTY OF SAN FRANCISCO PLEDGED-REVENUE COVERAGE (Continued)
Last Ten Fiscal Years (In Thousands)
230
Fiscal GrossLess:
Operating Net
AvailableYear Revenues (14) Expenses (15) Adjustments (16) Revenue (17) Principal Interest (17) Total (17) Coverage (17
2007 199,160$ 151,600$ 49,600$ 97,160$ 33,445$ 16,718$ 50,163$ 1.942008 206,648 165,245 66,109 107,512 34,500 15,698 50,198 2.142009 210,646 169,300 77,800 119,146 35,665 14,646 50,311 2.372010 211,899 185,512 86,880 113,267 37,130 13,183 50,313 2.252011 231,143 179,084 56,239 108,298 26,320 18,563 (18) 44,883 2.412012 247,936 195,857 107,125 159,204 22,010 20,180 (18) 42,190 3.772013 253,078 208,260 109,323 154,141 23,095 15,655 (18) 38,750 3.982014 262,497 216,340 172,831 218,988 32,805 32,047 (18) 64,852 3.382015 257,209 216,485 190,236 230,960 30,895 30,006 (18) 60,901 3.792016 262,960 221,553 198,524 239,931 31,115 28,907 (18) 60,022 4.00
(13) The pledged-revenue coverage calculations presented in this schedule conform to the requirements of GASBStatement No. 44 and as such differs significantly from those calculated in accordance with the bond indenture.
(14)(15) In accordance with GASB Statement No. 44, Wastewater Enterprise operating expenses related to the pledged
revenues exclude interest.(16) Adjustments includes Depreciation and Non-Cash Expense, Changes in Working Capital, Investment Income, SRF Loan Payments,
(17) Restated to match the published Annual Disclosure Reports for FY 2007, 2008, 2009.(18)
Fiscal Total
OperatingLess:
Operating Net
AvailableYear Revenues (20) Expenses (21) Revenue Principal Interest Total Coverage
2007 65,416$ 50,887$ 14,529$ 3,975$ 453$ 4,428$ 3.282008 68,111 56,406 11,705 4,070 348 4,418 2.652009 68,722 57,574 11,148 4,185 222 4,407 2.532010 68,892 58,756 10,136 4,320 75 4,395 2.312011 73,774 51,788 21,986 485 2,358 2,843 7.732012 79,819 55,470 24,349 670 2,175 2,845 8.562013 81,536 63,615 17,921 695 2,151 2,846 6.302014 87,213 63,410 23,803 725 2,122 2,847 8.362015 96,266 60,836 35,430 1,400 2,771 4,171 8.492016 100,653 64,896 35,757 1,225 2,951 4,176 8.56
(19) The pledged-revenue coverage calculations presented in this schedule conform to the requirements of GASBStatement No. 44 and as such differs significantly from those calculated in accordance with the bond indenture.
(20) Total revenues consist of operating revenues and interest and investment income.(21)
Fiscal GrossLess:
Operating Net
AvailableYear Revenues (24) Expenses (25) Adjustments (26) Revenue Principal Interest Total Coverage
2007 -$ -$ -$ -$ -$ -$ -$ - 2008 - - - - - - - - 2009 97,671 49,337 4,907 48,334 422 - 422 114.542010 105,711 86,334 14,521 33,898 422 - 422 80.332011 113,253 86,266 14,786 41,773 422 - 422 98.992012 100,622 93,607 13,536 20,551 422 - 422 48.702013 101,191 93,259 6,765 14,697 1,009 898 1,907 7.712014 105,767 101,041 11,726 16,452 1,308 667 1,975 8.332015 117,704 105,222 38,714 51,196 1,321 625 1,946 26.312016 122,954 110,012 20,102 33,044 1,422 2,364 3,786 8.73
(22) The pledged-revenue coverage calculations presented in this schedule conform to the requirements of GASBStatement No. 44 and as such differs significantly from those calculated in accordance with the bond indenture.
(23) There were no Hetch Hetchy bonds from 2006 to 2008.(24) Gross revenues consists of charges for power services, rental income and other income.(25) Operating expenses only include power operating expense.(26) Adjustments include adjustments to investment income, depreciation, non-cash items and changes to working capital.
In accordance with GASB Statement No. 44, operating expenses related to the pledged-revenue stream exclude interest, depreciation and amortization. Details regarding outstanding debt can be found in the notes to the financial statements. Operating expenses, as defined by the bond indenture, also excludes amortized dredging costs.
Debt Service
Port of San Francisco (19)
Debt Service
"springing" amendment.
San Francisco Wastewater Enterprise (13)
and other available Funds that are printed in published Annual Disclosure Reports.
Gross revenue consists of charges for services, rental income and other income.
Interest payment was restated to exclude capitalized interest in FY 2011 through FY 2012. FY2012 through FY2015 also includes a
Hetch Hetchy Water and Power (22) (23)
Debt Service
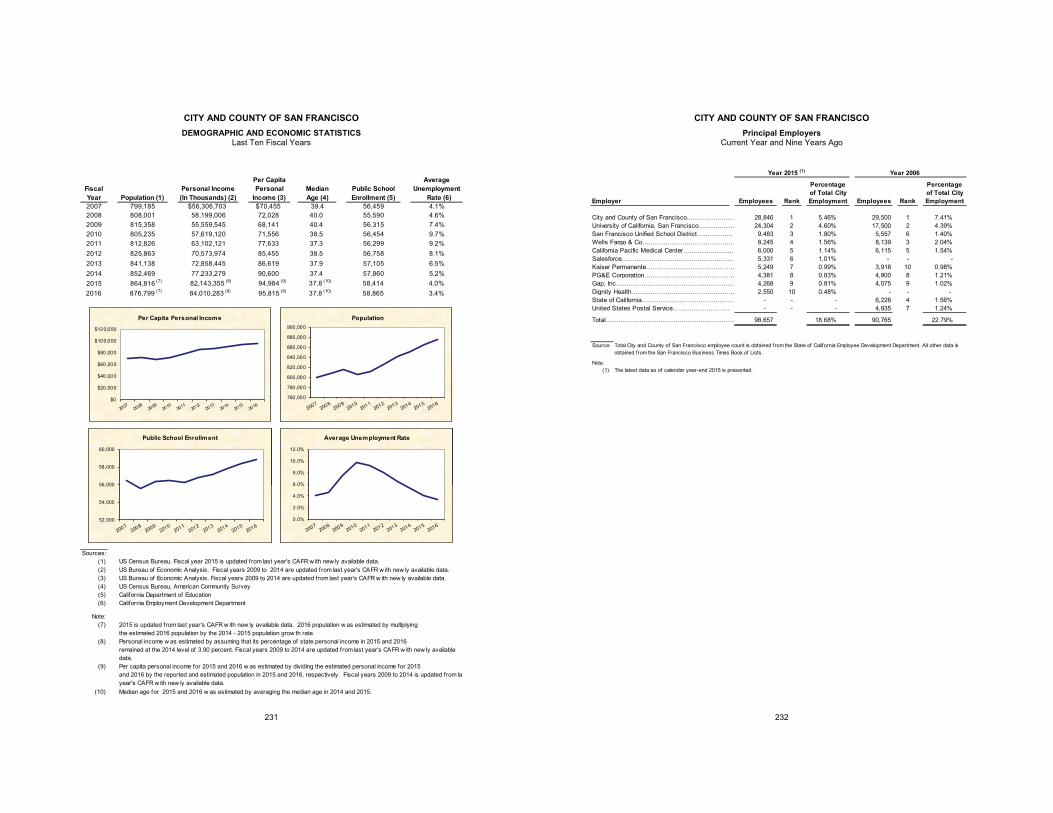
CITY AND COUNTY OF SAN FRANCISCO DEMOGRAPHIC AND ECONOMIC STATISTICS
Last Ten Fiscal Years
231
Fiscal Year Population (1)
Personal Income (In Thousands) (2)
Per Capita Personal
Income (3)MedianAge (4)
Public School Enrollment (5)
AverageUnemployment
Rate (6)2007 799,185 $56,306,703 $70,455 39.4 56,459 4.1%2008 808,001 58,199,006 72,028 40.0 55,590 4.6%2009 815,358 55,559,545 68,141 40.4 56,315 7.4%2010 805,235 57,619,120 71,556 38.5 56,454 9.7%2011 812,826 63,102,121 77,633 37.3 56,299 9.2%2012 825,863 70,573,974 85,455 38.5 56,758 8.1%2013 841,138 72,858,445 86,619 37.9 57,105 6.5%2014 852,469 77,233,279 90,600 37.4 57,860 5.2%2015 864,816 (7) 82,143,355 (8) 94,984 (9) 37.8 (10) 58,414 4.0%2016 876,799 (7) 84,010,283 (8) 95,815 (9) 37.8 (10) 58,865 3.4%
Sources:(1)(2) US Bureau of Economic Analysis. Fiscal years 2009 to 2014 are updated from last year's CAFR w ith new ly available data.(3) US Bureau of Economic Analysis. Fiscal years 2009 to 2014 are updated from last year's CAFR w ith new ly available data.(4) US Census Bureau, American Community Survey(5) California Department of Education(6) California Employment Development Department
Note:(7) 2015 is updated from last year's CAFR w ith new ly available data. 2016 population w as estimated by multiplying
the estimated 2016 population by the 2014 - 2015 population grow th rate.(8) Personal income w as estimated by assuming that its percentage of state personal income in 2015 and 2016
remained at the 2014 level of 3.90 percent. Fiscal years 2009 to 2014 are updated from last year's CAFR w ith new ly availabledata.
(9) Per capita personal income for 2015 and 2016 w as estimated by dividing the estimated personal income for 2015and 2016 by the reported and estimated population in 2015 and 2016, respectively. Fiscal years 2009 to 2014 is updated from lasyear's CAFR w ith new ly available data.
(10) Median age for 2015 and 2016 w as estimated by averaging the median age in 2014 and 2015.
US Census Bureau. Fiscal year 2015 is updated from last year's CAFR w ith new ly available data.
760000
780000
800000Population
52000
54000
56000
58000
60000
62000
64000
Public School Enrollment
0.0%
2.0%
4.0%
6.0%
8.0%
Average Unemployment Rate
760,000
780,000
800,000
820,000
840,000
860,000
880,000
900,000
Population
$0
$20,000
$40,000
$60,000
$80,000
$100,000
$120,000
Per Capita Personal Income
52,000
54,000
56,000
58,000
60,000
Public School Enrollment
0.0%
2.0%
4.0%
6.0%
8.0%
10.0%
12.0%
Average Unemployment Rate
CITY AND COUNTY OF SAN FRANCISCO Principal Employers
Current Year and Nine Years Ago
232
Employees Rank Employees Rank
City and County of San Francisco.....………...…… 28,846 1 5.46% 29,500 1 7.41%University of California, San Francisco……………… 24,304 2 4.60% 17,500 2 4.39%San Francisco Unified School District…………….. 9,483 3 1.80% 5,557 6 1.40%Wells Fargo & Co……………………………………… 8,245 4 1.56% 8,139 3 2.04%California Pacific Medical Center……………………… 6,000 5 1.14% 6,115 5 1.54%Salesforce……………………………………………… 5,331 6 1.01% - - -Kaiser Permanente…………………………………… 5,249 7 0.99% 3,918 10 0.98%PG&E Corporation……………………………………. 4,381 8 0.83% 4,800 8 1.21%Gap, Inc………………………………………………… 4,268 9 0.81% 4,075 9 1.02%Dignity Health…………………………………………. 2,550 10 0.48% - - - State of California…………………………………….. - - - 6,226 4 1.56%United States Postal Service……………………… - - - 4,935 7 1.24%
Total……………………………………………………… 98,657 90,765
Source:
Note:(1)
Percentage of Total City Employment
18.68% 22.79%
Total City and County of San Francisco employee count is obtained from the State of California Employee Development Department. All other data is obtained from the San Francisco Business Times Book of Lists.
The latest data as of calendar year-end 2015 is presented.
Year 2015 (1) Year 2006
Employer
Percentage of Total City Employment
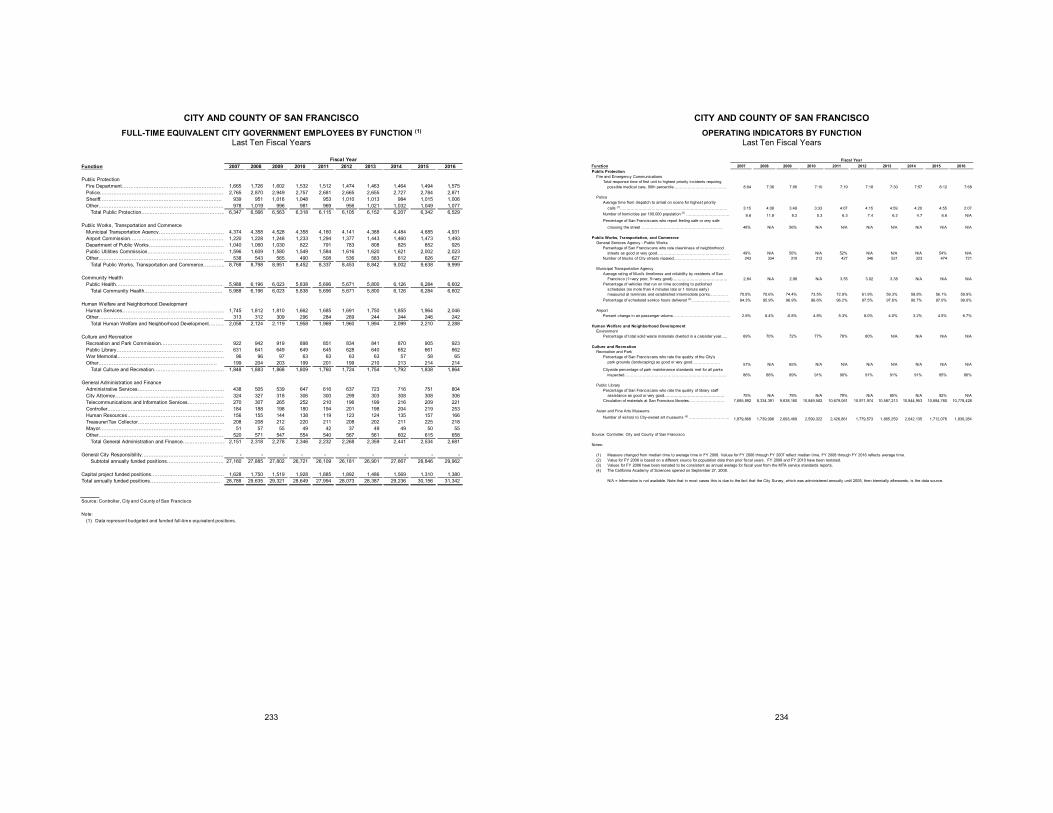
CITY AND COUNTY OF SAN FRANCISCO FULL-TIME EQUIVALENT CITY GOVERNMENT EMPLOYEES BY FUNCTION (1)
Last Ten Fiscal Years
233
Function 2007 2008 2009 2010 2011 2012 2013 2014 2015 2016
Public ProtectionFire Department……………………………………...……………… 1,665 1,726 1,602 1,532 1,512 1,474 1,463 1,464 1,494 1,575 Police………………………………………………………………… 2,765 2,870 2,949 2,757 2,681 2,665 2,655 2,727 2,784 2,871 Sheriff………………………………………………………………. 939 951 1,016 1,048 953 1,010 1,013 984 1,015 1,006 Other…………………………………………………………………… 978 1,019 996 981 969 956 1,021 1,032 1,049 1,077
Total Public Protection…………………………………………… 6,347 6,566 6,563 6,318 6,115 6,105 6,152 6,207 6,342 6,529
Public Works, Transportation and CommerceMunicipal Transportation Agency…………………………………. 4,374 4,358 4,528 4,358 4,160 4,141 4,388 4,484 4,685 4,931 Airport Commission………………………………………………… 1,220 1,228 1,248 1,233 1,294 1,377 1,443 1,460 1,473 1,493 Department of Public Works………………………………………. 1,040 1,060 1,030 822 791 783 808 825 852 925 Public Utilities Commission………………………………………. 1,596 1,609 1,580 1,549 1,584 1,616 1,620 1,621 2,002 2,023 Other…………………………………………………………………… 538 543 565 490 508 536 583 612 626 627
Total Public Works, Transportation and Commerce…………. 8,768 8,798 8,951 8,452 8,337 8,453 8,842 9,002 9,638 9,999
Community HealthPublic Health………………………………………………………. 5,988 6,196 6,023 5,838 5,696 5,671 5,800 6,126 6,284 6,602
Total Community Health……………………………………….. 5,988 6,196 6,023 5,838 5,696 5,671 5,800 6,126 6,284 6,602
Human Welfare and Neighborhood DevelopmentHuman Services……………………………………………………. 1,745 1,812 1,810 1,662 1,685 1,691 1,750 1,855 1,964 2,046 Other………………………………………………………………… 313 312 309 296 284 269 244 244 246 242
Total Human Welfare and Neighborhood Development………. 2,058 2,124 2,119 1,958 1,969 1,960 1,994 2,099 2,210 2,288
Culture and RecreationRecreation and Park Commission………………………………. 922 942 919 898 851 834 841 870 905 923 Public Library………………………………………………………. 631 641 649 649 645 628 640 652 661 662 War Memorial………………………………………………………. 96 96 97 63 63 63 63 57 58 65 Other……………………………………………………………… 199 204 203 199 201 199 210 213 214 214
Total Culture and Recreation…………………………………… 1,848 1,883 1,868 1,809 1,760 1,724 1,754 1,792 1,838 1,864
General Administration and FinanceAdministrative Services……………………………………………. 438 505 539 647 616 637 723 716 751 804 City Attorney………………………………………………………… 324 327 318 306 300 299 303 308 308 306 Telecommunications and Information Services…………………… 270 307 265 252 210 196 199 216 209 221 Controller…………………………………………………………… 184 188 198 180 194 201 198 204 219 253 Human Resources…………………………………………………… 156 155 144 138 119 123 124 135 157 166 Treasurer/Tax Collector……………………………………………. 208 208 212 220 211 208 202 211 225 218 Mayor………………………………………………………………. 51 57 55 49 42 37 49 49 50 55 Other…………………………………………………………………… 520 571 547 554 540 567 561 602 615 658
Total General Administration and Finance……………………… 2,151 2,318 2,278 2,346 2,232 2,268 2,359 2,441 2,534 2,681
General City Responsibility…………………………………………… - - - - - - - - - - Subtotal annually funded positions………………………………27,160 27,885 27,802 26,721 26,109 26,181 26,901 27,667 28,846 29,962
Capital project funded positions………..…………………………… 1,628 1,750 1,519 1,928 1,885 1,892 1,486 1,569 1,310 1,380 Total annually funded positions…………………………………… 28,788 29,635 29,321 28,649 27,994 28,073 28,387 29,236 30,156 31,342
Source: Controller, City and County of San Francisco
Note:(1) Data represent budgeted and funded full-time equivalent positions.
Fiscal Year
CITY AND COUNTY OF SAN FRANCISCO OPERATING INDICATORS BY FUNCTION
Last Ten Fiscal Years
234
Function 2007 2008 2009 2010 2011 2012 2013 2014 2015 2016Public Protection
Fire and Emergency CommunicationsTotal response time of first unit to highest priority incidents requiring
possible medical care, 90th percentile ...……………….….……..…… 8:04 7:36 7:06 7:10 7:19 7:18 7:30 7:57 8:12 7:68
PoliceAverage time from dispatch to arrival on scene for highest priority
calls (1)………………………………..…….………………………………. 3:15 4:08 3:49 3:33 4:07 4:15 4:59 4:20 4:55 2:07Number of homicides per 100,000 population (2) ……………………………… 9.6 11.8 8.2 5.3 6.3 7.4 6.2 4.7 6.6 N/APercentage of San Franciscans who report feeling safe or very safe
crossing the street …………………………………………………….. 48% N/A 56% N/A N/A N/A N/A N/A N/A N/A
Public Works, Transportation, and CommerceGeneral Services Agency - Public Works
Percentage of San Franciscans who rate cleanliness of neighborhood streets as good or very good………………………………………………. 49% N/A 50% N/A 52% N/A N/A N/A 54% N/A
Number of blocks of City streets repaved…………………………………….. 243 334 310 312 427 346 521 323 474 721
Municipal Transportation AgencyAverage rating of Muni's timeliness and reliability by residents of San
Francisco (1=very poor, 5=very good)…………………………………… 2.84 N/A 2.98 N/A 3.55 3.02 3.38 N/A N/A N/APercentage of vehicles that run on time according to published
schedules (no more than 4 minutes late or 1 minute early) measured at terminals and established intermediate points………….. 70.8% 70.6% 74.4% 73.5% 72.9% 61.9% 59.3% 58.8% 56.1% 59.9%
Percentage of scheduled service hours delivered (3)………………………… 94.3% 95.9% 96.9% 96.6% 96.2% 97.5% 97.6% 90.7% 97.0% 99.0%
AirportPercent change in air passenger volume……………………………………… 2.8% 8.4% -0.8% 4.8% 5.3% 8.0% 4.0% 3.2% 4.5% 6.7%
Human Welfare and Neighborhood DevelopmentEnvironment
Percentage of total solid waste materials diverted in a calendar year….. 69% 70% 72% 77% 78% 80% N/A N/A N/A N/A
Culture and RecreationRecreation and Park
Percentage of San Franciscans who rate the quality of the City'spark grounds (landscaping) as good or very good………………… 57% N/A 65% N/A N/A N/A N/A N/A N/A N/A
Citywide percentage of park maintenance standards met for all parks inspected…………………………………………………………………… 86% 88% 89% 91% 90% 91% 91% 91% 85% 86%
Public LibraryPercentage of San Franciscans who rate the quality of library staff
assistance as good or very good………………………………………. 75% N/A 79% N/A 79% N/A 85% N/A 92% N/ACirculation of materials at San Francisco libraries……………………… 7,685,892 8,334,391 9,638,160 10,849,582 10,679,061 10,971,974 10,587,213 10,844,953 10,684,760 10,778,428
Asian and Fine Arts MuseumsNumber of visitors to City-owned art museums (4) ...………………………. 1,879,868 1,739,096 2,693,469 2,599,322 2,426,861 1,779,573 1,865,259 2,042,135 1,712,076 1,830,284
Source: Controller, City and County of San Francisco
Notes:
(1) Measure changed from median time to average time in FY 2008. Values for FY 2006 through FY 2007 reflect median time, FY 2008 through FY 2016 reflects average time.(2) Value for FY 2008 is based on a different source for population data than prior fiscal years. FY 2008 and FY 2010 have been restated.(3) Values for FY 2006 have been restated to be consistent as annual average for fiscal year from the MTA service standards reports.(4) The California Academy of Sciences opened on September 27, 2008.
N/A = Information is not available. Note that in most cases this is due to the fact that the City Survey, which was administered annually until 2005, then biennially afterwards, is the data source.
Fiscal Year
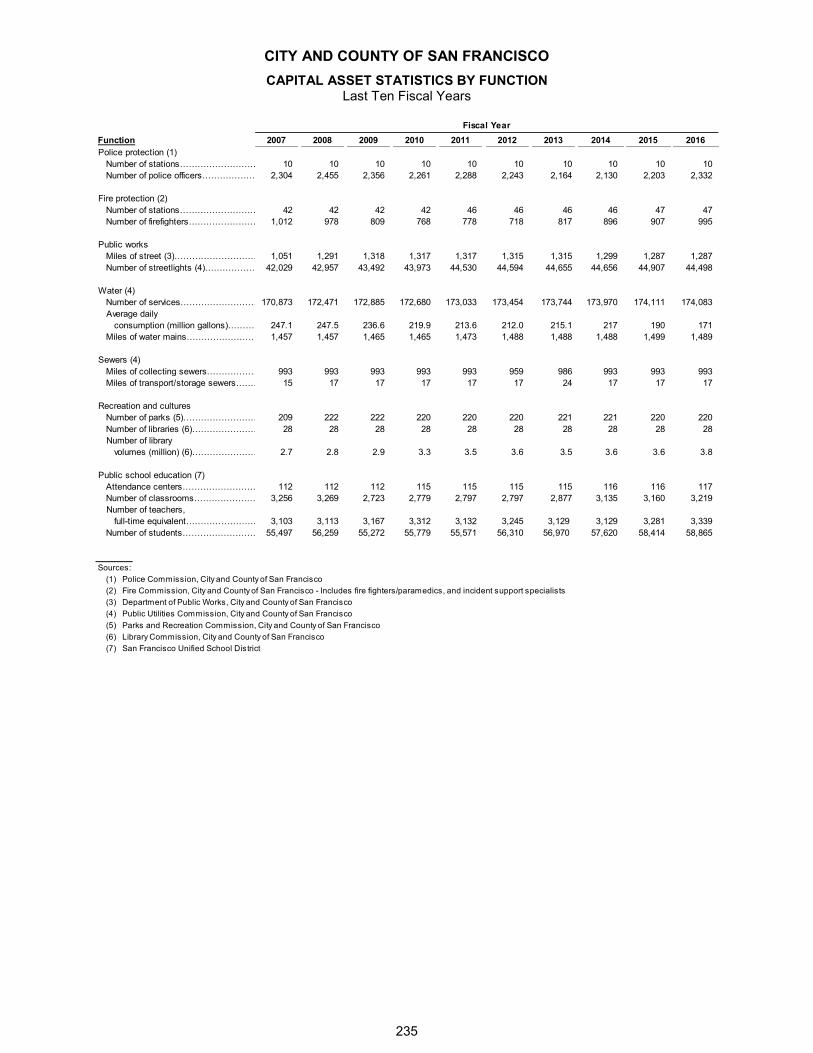
CITY AND COUNTY OF SAN FRANCISCO
CAPITAL ASSET STATISTICS BY FUNCTION Last Ten Fiscal Years
235
Function 2007 2008 2009 2010 2011 2012 2013 2014 2015 2016Police protection (1)
Number of stations………………………………..10 10 10 10 10 10 10 10 10 10 Number of police officers……………………………….2,304 2,455 2,356 2,261 2,288 2,243 2,164 2,130 2,203 2,332
Fire protection (2)Number of stations……………………………………42 42 42 42 46 46 46 46 47 47 Number of firefighters…………………………….1,012 978 809 768 778 718 817 896 907 995
Public worksMiles of street (3)…………………………………..1,051 1,291 1,318 1,317 1,317 1,315 1,315 1,299 1,287 1,287 Number of streetlights (4)…………………………..42,029 42,957 43,492 43,973 44,530 44,594 44,655 44,656 44,907 44,498
Water (4)Number of services…………………………………..170,873 172,471 172,885 172,680 173,033 173,454 173,744 173,970 174,111 174,083 Average daily
consumption (million gallons)………………………..……….247.1 247.5 236.6 219.9 213.6 212.0 215.1 217 190 171 Miles of water mains………………………………..1,457 1,457 1,465 1,465 1,473 1,488 1,488 1,488 1,499 1,489
Sewers (4)Miles of collecting sewers……………………………..993 993 993 993 993 959 986 993 993 993 Miles of transport/storage sewers………………….15 17 17 17 17 17 24 17 17 17
Recreation and culturesNumber of parks (5)…………………………………209 222 222 220 220 220 221 221 220 220 Number of libraries (6)………………………………..28 28 28 28 28 28 28 28 28 28 Number of library
volumes (million) (6)…………………………………2.7 2.8 2.9 3.3 3.5 3.6 3.5 3.6 3.6 3.8
Public school education (7)Attendance centers………………………………..112 112 112 115 115 115 115 116 116 117 Number of classrooms……………………………….3,256 3,269 2,723 2,779 2,797 2,797 2,877 3,135 3,160 3,219 Number of teachers,
full-time equivalent……………………………………….….3,103 3,113 3,167 3,312 3,132 3,245 3,129 3,129 3,281 3,339 Number of students………………………………….55,497 56,259 55,272 55,779 55,571 56,310 56,970 57,620 58,414 58,865
Sources:
(1) Police Commission, City and County of San Francisco
(2) Fire Commission, City and County of San Francisco - Includes fire fighters/paramedics, and incident support specialists
(3) Department of Public Works, City and County of San Francisco
(4) Public Utilities Commission, City and County of San Francisco
(5) Parks and Recreation Commission, City and County of San Francisco
(6) Library Commission, City and County of San Francisco
(7) San Francisco Unified School District
Fiscal Year


APPENDIX C
CITY AND COUNTY OF SAN FRANCISCO OFFICE OF THE TREASURER
INVESTMENT POLICY

May 2016
CITY AND COUNTY OF SAN FRANCISCO OFFICE OF THE TREASURER & TAX COLLECTOR
INVESTMENT POLICY
Effective May 2016
1.0 Policy
It is the policy of the Office of the Treasurer & Tax Collector of the City and County of San Francisco (Treasurer’s Office) to invest public funds in a manner which will preserve capital, meet the daily cash flow demands of the City, and provide a market rate of return while conforming to all state and local statutes governing the investment of public funds. 2.0 Scope
This investment policy applies to all funds over which the Treasurer’s Office has been granted fiduciary responsibility and direct control for their management. 3.0 Prudence
The standard of prudence to be used by the Treasurer’s Office shall be the Prudent Investor Standard as set forth by California Government Code, Section 53600.3 and 27000.3. The Section reads as follows: The Prudent Investor Standard states that when investing, reinvesting, purchasing, acquiring, exchanging, selling, or managing public funds, a trustee shall act with care, skill, prudence, and diligence under the circumstances then prevailing, including, but not limited to, the general economic conditions and the anticipated needs of the Treasurer’s Office, that a prudent person acting in a like capacity and familiarity with those matters would use in the conduct of funds of a like character and with like aims, to safeguard the principal and maintain the liquidity needs of the Treasurer’s Office. This standard of prudence shall be applied in the context of managing those investments that fall under the Treasurer’s direct control. Investment officers acting in accordance with written procedures and this investment policy and exercising due diligence shall be relieved of personal responsibility for an individual security’s credit risk or market price changes provided deviations from expectations are reported in a timely fashion and appropriate action is taken to control adverse developments. 4.0 Objective
The primary objectives, in priority order, of the Treasurer’s Office’s investment activities shall be:
4.1 Safety: Safety of principal is the foremost objective of the investment program. Investments of the Treasurer’s Office shall be undertaken in a manner that seeks to ensure the preservation of capital. To attain this objective, the Treasurer’s Office will diversify its investments.
4.2 Liquidity: The Treasurer’s Office investment portfolio will remain sufficiently liquid to enable the Treasurer’s Office to meet cash flow needs which might be reasonably anticipated.
May 2016
4.3 Return on Investments: The portfolio shall be designed with the objective of generating a market rate of return without undue compromise of the first two objectives.
5.0 Delegation of Authority
The Treasurer of the City and County of San Francisco (Treasurer) is authorized by Charter Section 6.106 to invest funds available under California Government Code Title 5, Division 2, Part 1, Chapter 4, Article 1. The Treasurer shall submit any modification to this Investment Policy to the Treasury Oversight Committee members within five (5) working days of the adoption of the change. 6.0 Authorized Broker/Dealer Firms
The City seeks to employ a fair and unbiased broker-dealer selection process, which culminates in an array of medium to large-sized firms that provide the best investment opportunities and service to the City. The Treasurer’s Office will evaluate and classify broker-dealers based on the qualifications of the firm and firm’s assigned individual. Approved broker-dealers will be evaluated and may be classified into one of the following categories:
FULL ACCESS – Broker-dealers will have significant opportunity to present investment ideas to the investment team.
LIMITED ACCESS – Broker-dealers will have limited opportunity to present investment ideas to the investment team.
All others may apply for Provisional status appointment. Provisional appointments will be made for:
(1) Applicants who have changed firms; (2) Applicants (firm and individual) who were not approved by the Treasurer’s Office in the
past year; and (3) Broker-dealers who have been classified as Limited Access, but are seeking Full Access
status. Broker-dealers, who are granted Provisional status, will be treated as Full Access firms for a limited time period of up to six months. During the Provisional status period, the investment team will evaluate the applicant and provide a determination of status (Full Access, Limited Access or Not Approved). Broker-dealers may reapply for Provisional status every two years. A limited number of broker-dealers will be granted Provisional status concurrently. All broker-dealers are encouraged to apply for consideration. All applicants will be evaluated and classified based on the qualifications of the firm and the firm’s assigned individual. A score will be assigned to each applicant and will serve as the sole determinant for Full Access, Limited Access, or Not-Approved status. All approved broker-dealers will be re-assessed annually. During the reassessment period, broker-dealers will be sent the City’s most recent Investment Policy and are expected to respond with a policy acknowledgement letter, updated profile information and a completed questionnaire.
May 2016
All securities shall be purchased and sold in a competitive environment. The Treasurer’s Office will not do business with a firm which has, within any consecutive 48-month period following January 1, 1996, made a political contribution in an amount exceeding the limitations contained in Rule G-37 of the Municipal Securities Rulemaking Board, to the Treasurer, any member of the Board of Supervisors, or any candidate for those offices.
Investments will be made pursuant to the California Government Code (including Section 53601 et seq.) and this investment policy to ensure sufficient liquidity to meet all anticipated disbursements.
7.0 Authorized & Suitable Investments
Unless otherwise noted, the maximum maturity from the trade settlement date can be no longer than five years.
Types of investment vehicles not authorized by this investment policy are prohibited.
In an effort to limit credit exposure, the Treasurer’s Office will maintain Eligible Issuer, Eligible Counterparty and Eligible Money Market lists for security types where appropriate. These lists are intended to guide investment decisions. Investments, at time of purchase, are limited solely to issuers, counterparties and money market funds listed; however, investment staff may choose to implement further restrictions at any time.
The Treasurer’s Office shall establish a Credit Committee comprised of the Treasurer, Chief Assistant Treasurer, Chief Investment Officer and additional investment personnel at the Treasurer’s discretion. The Committee shall review and approve all eligible issuers and counterparties prior to inclusion on the aforementioned Eligible Issuer and Eligible Counterparty lists. The Committee shall also be charged with determining the collateral securing the City’s repurchase agreements. In the event of a downgrade of the issuer’s credit rating below the stated requirements herein, the Credit Committee shall convene and determine the appropriate action. In addition, the Treasurer’s Office shall conduct an independent credit review, or shall cause an independent credit review to be conducted, of the collateralized CD issuers to determine the creditworthiness of the financial institution. The credit review shall include an evaluation of the issuer’s financial strength, experience, and capitalization, including, but not limited to leverage and capital ratios relative to benchmark and regulatory standards (See Section 7.4). The following policy shall govern unless a variance is specifically authorized by the Treasurer and reviewed by the Treasury Oversight Committee pursuant to Section 5.0.
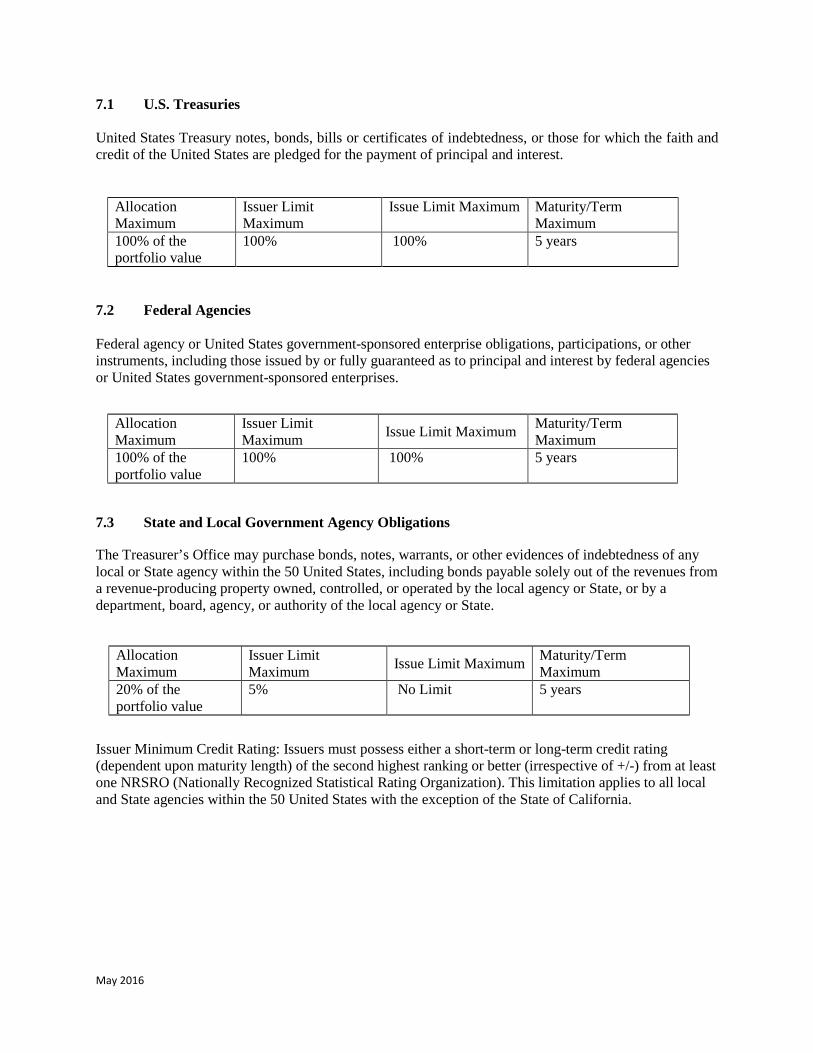
May 2016
7.1 U.S. Treasuries United States Treasury notes, bonds, bills or certificates of indebtedness, or those for which the faith and credit of the United States are pledged for the payment of principal and interest.
7.2 Federal Agencies
Federal agency or United States government-sponsored enterprise obligations, participations, or other instruments, including those issued by or fully guaranteed as to principal and interest by federal agencies or United States government-sponsored enterprises.
7.3 State and Local Government Agency Obligations
The Treasurer’s Office may purchase bonds, notes, warrants, or other evidences of indebtedness of any local or State agency within the 50 United States, including bonds payable solely out of the revenues from a revenue-producing property owned, controlled, or operated by the local agency or State, or by a department, board, agency, or authority of the local agency or State.
Issuer Minimum Credit Rating: Issuers must possess either a short-term or long-term credit rating (dependent upon maturity length) of the second highest ranking or better (irrespective of +/-) from at least one NRSRO (Nationally Recognized Statistical Rating Organization). This limitation applies to all local and State agencies within the 50 United States with the exception of the State of California.
Allocation Maximum
Issuer Limit Maximum
Issue Limit Maximum Maturity/Term Maximum
100% of the portfolio value
100% 100% 5 years
Allocation Maximum
Issuer Limit Maximum Issue Limit Maximum Maturity/Term
Maximum 100% of the portfolio value
100% 100% 5 years
Allocation Maximum
Issuer Limit Maximum Issue Limit Maximum Maturity/Term
Maximum 20% of the portfolio value
5% No Limit 5 years
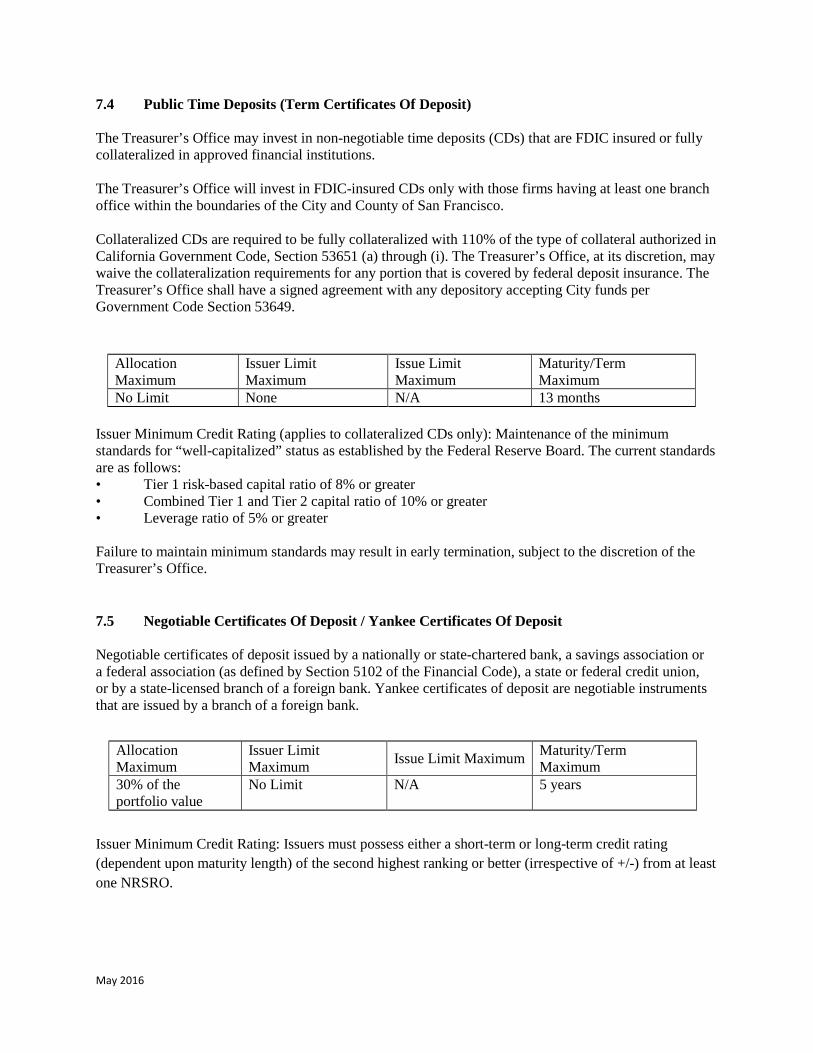
May 2016
7.4 Public Time Deposits (Term Certificates Of Deposit)
The Treasurer’s Office may invest in non-negotiable time deposits (CDs) that are FDIC insured or fully collateralized in approved financial institutions.
The Treasurer’s Office will invest in FDIC-insured CDs only with those firms having at least one branch office within the boundaries of the City and County of San Francisco.
Collateralized CDs are required to be fully collateralized with 110% of the type of collateral authorized in California Government Code, Section 53651 (a) through (i). The Treasurer’s Office, at its discretion, may waive the collateralization requirements for any portion that is covered by federal deposit insurance. The Treasurer’s Office shall have a signed agreement with any depository accepting City funds per Government Code Section 53649.
Issuer Minimum Credit Rating (applies to collateralized CDs only): Maintenance of the minimum standards for “well-capitalized” status as established by the Federal Reserve Board. The current standards are as follows: • Tier 1 risk-based capital ratio of 8% or greater • Combined Tier 1 and Tier 2 capital ratio of 10% or greater • Leverage ratio of 5% or greater Failure to maintain minimum standards may result in early termination, subject to the discretion of the Treasurer’s Office.
7.5 Negotiable Certificates Of Deposit / Yankee Certificates Of Deposit
Negotiable certificates of deposit issued by a nationally or state-chartered bank, a savings association or a federal association (as defined by Section 5102 of the Financial Code), a state or federal credit union, or by a state-licensed branch of a foreign bank. Yankee certificates of deposit are negotiable instruments that are issued by a branch of a foreign bank.
Issuer Minimum Credit Rating: Issuers must possess either a short-term or long-term credit rating (dependent upon maturity length) of the second highest ranking or better (irrespective of +/-) from at least one NRSRO.
Allocation Maximum
Issuer Limit Maximum
Issue Limit Maximum
Maturity/Term Maximum
No Limit None N/A 13 months
Allocation Maximum
Issuer Limit Maximum Issue Limit Maximum Maturity/Term
Maximum 30% of the portfolio value
No Limit N/A 5 years
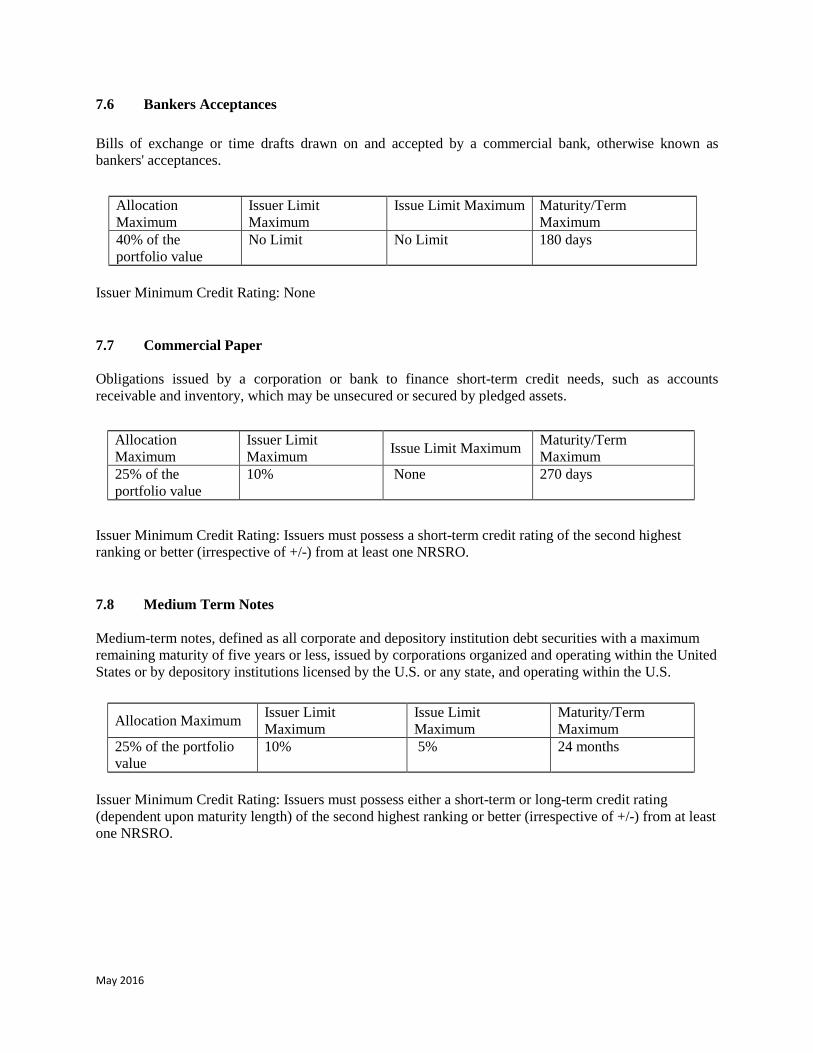
May 2016
7.6 Bankers Acceptances
Bills of exchange or time drafts drawn on and accepted by a commercial bank, otherwise known as bankers' acceptances.
Issuer Minimum Credit Rating: None
7.7 Commercial Paper
Obligations issued by a corporation or bank to finance short-term credit needs, such as accounts receivable and inventory, which may be unsecured or secured by pledged assets.
Allocation Maximum
Issuer Limit Maximum Issue Limit Maximum Maturity/Term
Maximum 25% of the portfolio value
10% None 270 days
Issuer Minimum Credit Rating: Issuers must possess a short-term credit rating of the second highest ranking or better (irrespective of +/-) from at least one NRSRO.
7.8 Medium Term Notes
Medium-term notes, defined as all corporate and depository institution debt securities with a maximum remaining maturity of five years or less, issued by corporations organized and operating within the United States or by depository institutions licensed by the U.S. or any state, and operating within the U.S.
Allocation Maximum Issuer Limit Maximum
Issue Limit Maximum
Maturity/Term Maximum
25% of the portfolio value
10% 5% 24 months
Issuer Minimum Credit Rating: Issuers must possess either a short-term or long-term credit rating (dependent upon maturity length) of the second highest ranking or better (irrespective of +/-) from at least one NRSRO.
Allocation Maximum
Issuer Limit Maximum
Issue Limit Maximum Maturity/Term Maximum
40% of the portfolio value
No Limit No Limit 180 days
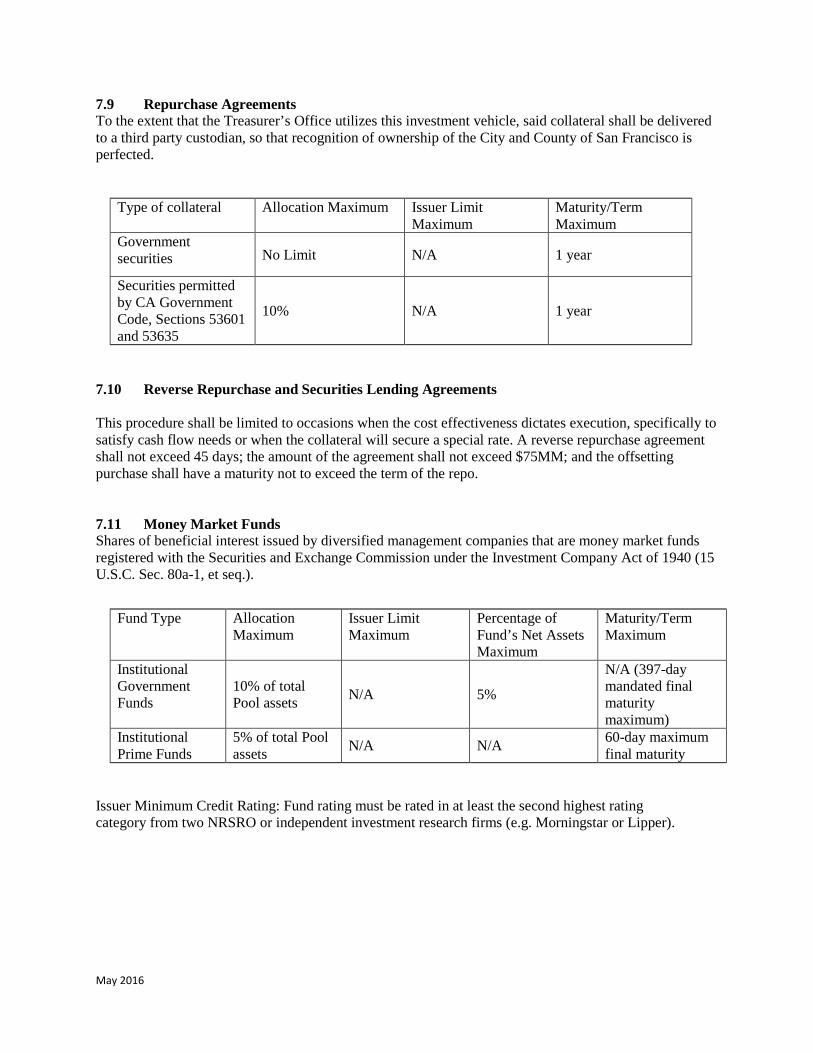
May 2016
7.9 Repurchase Agreements To the extent that the Treasurer’s Office utilizes this investment vehicle, said collateral shall be delivered to a third party custodian, so that recognition of ownership of the City and County of San Francisco is perfected.
7.10 Reverse Repurchase and Securities Lending Agreements
This procedure shall be limited to occasions when the cost effectiveness dictates execution, specifically to satisfy cash flow needs or when the collateral will secure a special rate. A reverse repurchase agreement shall not exceed 45 days; the amount of the agreement shall not exceed $75MM; and the offsetting purchase shall have a maturity not to exceed the term of the repo. 7.11 Money Market Funds Shares of beneficial interest issued by diversified management companies that are money market funds registered with the Securities and Exchange Commission under the Investment Company Act of 1940 (15 U.S.C. Sec. 80a-1, et seq.).
Issuer Minimum Credit Rating: Fund rating must be rated in at least the second highest rating category from two NRSRO or independent investment research firms (e.g. Morningstar or Lipper).
Type of collateral Allocation Maximum Issuer Limit Maximum
Maturity/Term Maximum
Government securities No Limit N/A 1 year
Securities permitted by CA Government Code, Sections 53601 and 53635
10% N/A 1 year
Fund Type Allocation Maximum
Issuer Limit Maximum
Percentage of Fund’s Net Assets Maximum
Maturity/Term Maximum
Institutional Government Funds
10% of total Pool assets N/A 5%
N/A (397-day mandated final maturity maximum)
Institutional Prime Funds
5% of total Pool assets N/A N/A 60-day maximum
final maturity
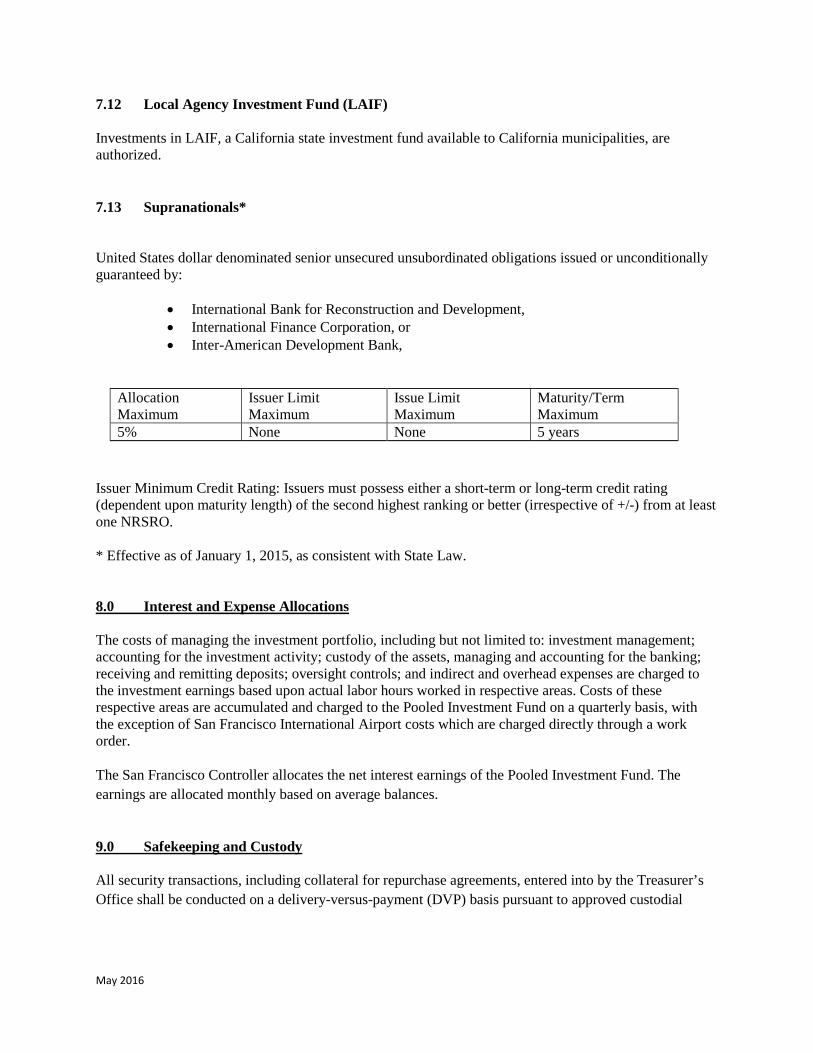
May 2016
7.12 Local Agency Investment Fund (LAIF)
Investments in LAIF, a California state investment fund available to California municipalities, are authorized.
7.13 Supranationals*
United States dollar denominated senior unsecured unsubordinated obligations issued or unconditionally guaranteed by:
• International Bank for Reconstruction and Development, • International Finance Corporation, or • Inter-American Development Bank,
Issuer Minimum Credit Rating: Issuers must possess either a short-term or long-term credit rating (dependent upon maturity length) of the second highest ranking or better (irrespective of +/-) from at least one NRSRO.
* Effective as of January 1, 2015, as consistent with State Law.
The costs of managing the investment portfolio, including but not limited to: investment management; accounting for the investment activity; custody of the assets, managing and accounting for the banking; receiving and remitting deposits; oversight controls; and indirect and overhead expenses are charged to the investment earnings based upon actual labor hours worked in respective areas. Costs of these respective areas are accumulated and charged to the Pooled Investment Fund on a quarterly basis, with the exception of San Francisco International Airport costs which are charged directly through a work order.
8.0 Interest and Expense Allocations
The San Francisco Controller allocates the net interest earnings of the Pooled Investment Fund. The earnings are allocated monthly based on average balances.
All security transactions, including collateral for repurchase agreements, entered into by the Treasurer’s Office shall be conducted on a delivery-versus-payment (DVP) basis pursuant to approved custodial
9.0 Safekeeping and Custody
Allocation Maximum
Issuer Limit Maximum
Issue Limit Maximum
Maturity/Term Maximum
5% None None 5 years
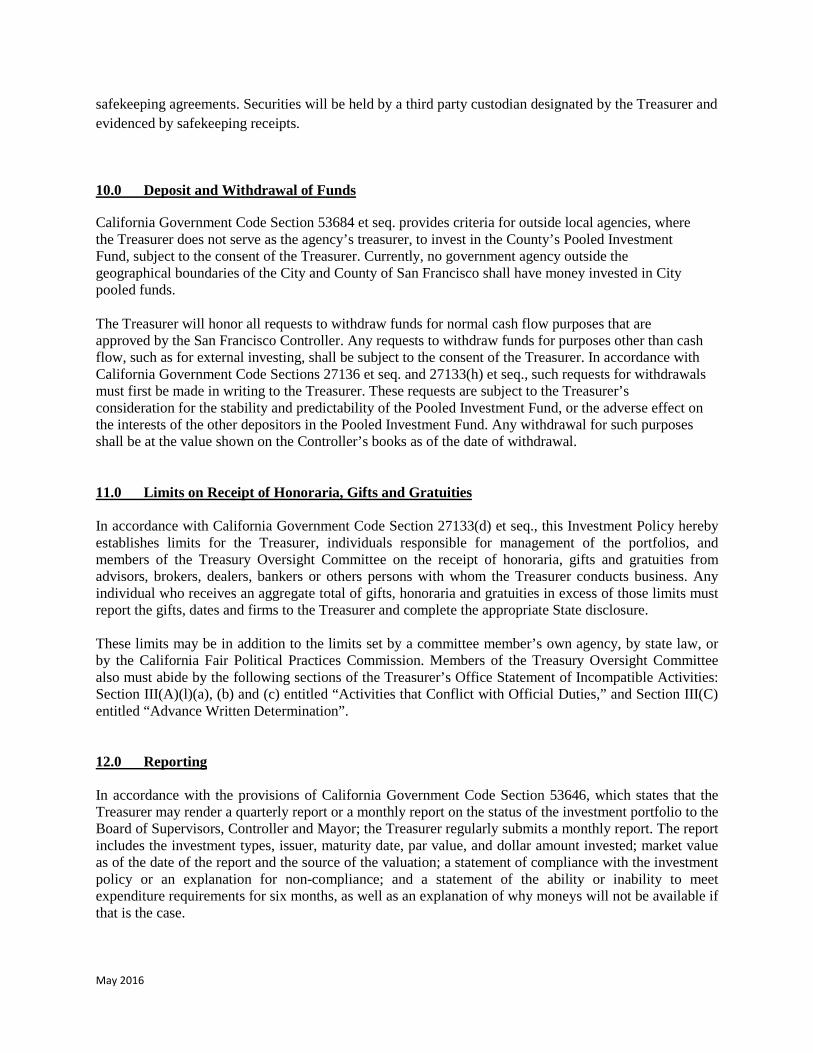
May 2016
safekeeping agreements. Securities will be held by a third party custodian designated by the Treasurer and evidenced by safekeeping receipts.
10.0 Deposit and Withdrawal of Funds
California Government Code Section 53684 et seq. provides criteria for outside local agencies, where the Treasurer does not serve as the agency’s treasurer, to invest in the County’s Pooled Investment Fund, subject to the consent of the Treasurer. Currently, no government agency outside the geographical boundaries of the City and County of San Francisco shall have money invested in City pooled funds.
The Treasurer will honor all requests to withdraw funds for normal cash flow purposes that are approved by the San Francisco Controller. Any requests to withdraw funds for purposes other than cash flow, such as for external investing, shall be subject to the consent of the Treasurer. In accordance with California Government Code Sections 27136 et seq. and 27133(h) et seq., such requests for withdrawals must first be made in writing to the Treasurer. These requests are subject to the Treasurer’s consideration for the stability and predictability of the Pooled Investment Fund, or the adverse effect on the interests of the other depositors in the Pooled Investment Fund. Any withdrawal for such purposes shall be at the value shown on the Controller’s books as of the date of withdrawal.
11.0 Limits on Receipt of Honoraria, Gifts and Gratuities In accordance with California Government Code Section 27133(d) et seq., this Investment Policy hereby establishes limits for the Treasurer, individuals responsible for management of the portfolios, and members of the Treasury Oversight Committee on the receipt of honoraria, gifts and gratuities from advisors, brokers, dealers, bankers or others persons with whom the Treasurer conducts business. Any individual who receives an aggregate total of gifts, honoraria and gratuities in excess of those limits must report the gifts, dates and firms to the Treasurer and complete the appropriate State disclosure. These limits may be in addition to the limits set by a committee member’s own agency, by state law, or by the California Fair Political Practices Commission. Members of the Treasury Oversight Committee also must abide by the following sections of the Treasurer’s Office Statement of Incompatible Activities: Section III(A)(l)(a), (b) and (c) entitled “Activities that Conflict with Official Duties,” and Section III(C) entitled “Advance Written Determination”. 12.0 Reporting In accordance with the provisions of California Government Code Section 53646, which states that the Treasurer may render a quarterly report or a monthly report on the status of the investment portfolio to the Board of Supervisors, Controller and Mayor; the Treasurer regularly submits a monthly report. The report includes the investment types, issuer, maturity date, par value, and dollar amount invested; market value as of the date of the report and the source of the valuation; a statement of compliance with the investment policy or an explanation for non-compliance; and a statement of the ability or inability to meet expenditure requirements for six months, as well as an explanation of why moneys will not be available if that is the case.
May 2016
13.0 Social Responsibility
In addition to and subordinate to the objectives set forth in Section 4.0 herein, investment of funds should be guided by the following socially responsible investment goals when investing in corporate securities and depository institutions. Investments shall be made in compliance with the forgoing socially responsible investment goals to the extent that such investments achieve substantially equivalent safety, liquidity and yield compared to investments permitted by state law. 13.1 Social and Environmental Concerns Investments are encouraged in entities that support community well-being through safe and environmentally sound practices and fair labor practices. Investments are encouraged in entities that support equality of rights regardless of sex, race, age, disability or sexual orientation. Investments are discouraged in entities that manufacture tobacco products, firearms, or nuclear weapons. In addition, investments are encouraged in entities that offer banking products to serve all members of the local community, and investments are discouraged in entities that finance high-cost check-cashing and deferred deposit (payday-lending) businesses. Prior to making investments, the Treasurer’s Office will verify an entity’s support of the socially responsible goals listed above through direct contact or through the use of a third party such as the Investors Responsibility Research Center, or a similar ratings service. The entity will be evaluated at the time of purchase of the securities. 13.2 Community Investments Investments are encouraged in entities that promote community economic development. Investments are encouraged in entities that have a demonstrated involvement in the development or rehabilitation of low income affordable housing, and have a demonstrated commitment to reducing predatory mortgage lending and increasing the responsible servicing of mortgage loans. Securities investments are encouraged in financial institutions that have a Community Reinvestment Act (CRA) rating of either Satisfactory or Outstanding, as well as financial institutions that are designated as a Community Development Financial Institution (CDFI) by the United States Treasury Department, or otherwise demonstrate commitment to community economic development. 13.3 City Ordinances All depository institutions are to be advised of applicable City contracting ordinances, and shall certify their compliance therewith, if required. 14.0 Treasury Oversight Committee A Treasury Oversight Committee was established by the San Francisco Board of Supervisors in Ordinance No. 316-00. The duties of the Committee shall be the following: (a) Review and monitor the investment policy described in California Government Code Section 27133 and prepared annually by the Treasurer. (b) Cause an annual audit to be conducted to determine the Treasurer’s compliance with California Government Code Article 6 including Sections 27130 through 27137 and City Administrative Code Section 10.80-1. The audit may examine the structure of the investment portfolio and risk. This audit may
May 2016
be a part of the County Controller’s usual audit of the Treasurer’s Office by internal audit staff or the outside audit firm reviewing the Controller’s Annual Report. (c) Nothing herein shall be construed to allow the Committee to direct individual decisions, select individual investment advisors, brokers, or dealers, or impinge on the day-to-day operations of the Treasurer. (See California Government Code, Section 27137.)
May 2016
APPENDIX Glossary AGENCIES: Federal agency securities and/or Government-sponsored enterprises. ASK/OFFER: The price at which securities are offered. BANKERS’ ACCEPTANCE (BA): A draft or bill or exchange accepted by a bank or trust company. The accepting institution guarantees payment of the bill, as well as the issuer. BENCHMARK: A comparative base for measuring the performance or risk tolerance of the investment portfolio. A benchmark should represent a close correlation to the level of risk and the average duration of the portfolio’s investments. BID: The price offered by a buyer of securities. (When you are selling securities, you ask for a bid.) See Offer. BROKER: A broker brings buyers and sellers together for a commission. CERTIFICATE OF DEPOSIT (CD): A time deposit with a specific maturity evidenced by a Certificate. Large-denomination CD’s are typically negotiable. COLLATERAL: Securities, evidence of deposit or other property, which a borrower pledges to secure repayment of a loan. Also refers to securities pledged by a bank to secure deposits of public monies. COMPREHENSIVE ANNUAL FINANCIAL REPORT (CAFR): The CAFR is the City’s official annual financial report. It consists of three major sections: introductory, financial, and statistical. The introductory section furnishes general information on the City’s structure, services, and environment. The financial section contains all basic financial statements and required supplementary information, as well as information on all individual funds and discretely presented component units not reported separately in the basic financial statements. The financial section may also include supplementary information not required by GAAP. The statistical section provides trend data and nonfinancial data useful in interpreting the basic financial statements and is especially important for evaluating economic condition. COUPON: (a) The annual rate of interest that a bond’s issuer promises to pay the bondholder on the bond’s face value. (b) A certificate attached to a bond evidencing interest due on a payment date. DEALER: A dealer, as opposed to a broker, acts as a principal in all transactions, buying and selling for his own account. DEBENTURE: A bond secured only by the general credit of the issuer. DELIVERY VERSUS PAYMENT: There are two methods of delivery of securities: delivery versus payment and delivery versus receipt. Delivery versus payment is delivery of securities with an exchange of money for the securities. Delivery versus receipt is delivery of securities with an exchange of a signed receipt for the securities. DEPOSITORY INSTITUTIONS: These institutions hold City and County moneys in the forms of certificates of deposit (negotiable or term), public time deposits and public demand accounts.
May 2016
DERIVATIVES: (l) Financial instruments whose return profile is linked to, or derived from, the movement of one or more underlying index or security, and may include a leveraging factor, or (2) financial contracts based upon notional amounts whose value is derived from an underlying index or security (interest rates, foreign exchange rates, equities or commodities). DISCOUNT: The difference between the cost price of a security and its maturity when quoted at lower than face value. A security selling below original offering price shortly after sale also is considered to be at a discount. DISCOUNT SECURITIES: Non-interest bearing money market instruments that are issued a discount and redeemed at maturity for full face value, e.g., U.S. Treasury Bills. DIVERSIFICATION: Dividing investment funds among a variety of securities offering independent returns. FDIC DEPOSIT INSURANCE COVERAGE: The FDIC is an independent agency of the United States government that protects against the loss of insured deposits if an FDIC-insured bank or savings association fails. Deposit insurance is backed by the full faith and credit of the United States government. Since the FDIC was established, no depositor has ever lost a single penny of FDIC-insured funds. FDIC insurance covers funds in deposit accounts, including checking and savings accounts, money market deposit accounts and certificates of deposit (CDs). FDIC insurance does not, however, cover other financial products and services that insured banks may offer, such as stocks, bonds, mutual fund shares, life insurance policies, annuities or municipal securities. There is no need for depositors to apply for FDIC insurance or even to request it. Coverage is automatic. To ensure funds are fully protected, depositors should understand their deposit insurance coverage limits. The FDIC provides separate insurance coverage for deposits held in different ownership categories such as single accounts, joint accounts, Individual Retirement Accounts (IRAs) and trust accounts. Basic FDIC Deposit Insurance Coverage Limits* Single Accounts (owned by one person) $250,000 per owner Joint Accounts (two or more persons) $250,000 per co-owner IRAs and certain other retirement accounts $250,000 per owner Trust Accounts $250,000 per owner per beneficiary subject to specific limitations and requirements** *The financial reform bill, officially named the Dodd-Frank Wall Street Reform and Consumer Protection Act, signed into law on July 21, 2010, made the $250,000 FDIC coverage limit permanent. FEDERAL CREDIT AGENCIES: Agencies of the Federal government set up to supply credit to various classes of institutions and individuals, e.g., S&L’s, small business firms, students, farmers, farm cooperatives, and exporters. FEDERAL FUNDS RATE: The rate of interest that depository institutions lend monies overnight to other depository institutions. Also referred to as the overnight lending rate.This rate is currently pegged by the Federal Reserve through open-market operations. FEDERAL HOME LOAN BANKS (FHLB): Government sponsored wholesale banks (currently 12 regional banks), which lend funds and provide correspondent banking services to member commercial banks, thrift institutions, credit unions and insurance companies. The mission of the FHLBs is to liquefy the housing related assets of its members who must purchase stock in their district Bank.
May 2016
FEDERAL NATIONAL MORTGAGE ASSOCIATION (FNMA): FNMA, like GNMA was chartered under the Federal National Mortgage Association Act in 1938. FNMA is a federal corporation working under the auspices of the Department of Housing and Urban Development (HUD). It is the largest single provider of residential mortgage funds in the United States. Fannie Mae, as the corporation is called, is a private stockholder-owned corporation. The corporation’s purchases include a variety of adjustable mortgages and second loans, in addition to fixed-rate mortgages. FNMA’s securities are also highly liquid and are widely accepted. FNMA assumes and guarantees that all security holders will receive timely payment of principal and interest. FEDERAL HOME LOAN MORTGAGE CORPORATION (FHLMC): Freddie Mac’s mission is to provide liquidity, stability and affordability to the housing market. Congress defined this mission in (their) 1970 charter. Freddie Mac buys mortgage loans from banks, thrifts and other financial intermediaries, and re-sells these loans to investors, or keeps them for their own portfolio, profiting from the difference between their funding costs and the yield generated by the mortgages. FEDERAL OPEN MARKET COMMITTEE (FOMC): Consists of seven members of the Federal Reserve Board and five of the twelve Federal Reserve Bank Presidents. The President of the New York Federal Reserve Bank is a permanent member, while the other Presidents serve on a rotating basis. The Committee periodically meets to set Federal Reserve guidelines regarding purchases and sales of Government Securities in the open market as a means of influencing the volume of bank credit and money. FEDERAL RESERVE SYSTEM: The central bank of the United States created by Congress and consisting of a seven member Board of Governors in Washington, D.C., 12 regional banks and about 5,700 commercial banks that are members of the system. GOVERNMENT NATIONAL MORTGAGE ASSOCIATION (GNMA or Ginnie Mae): Securities influencing the volume of bank credit guaranteed by GNMA and issued by mortgage bankers, commercial banks, savings and loan associations, and other institutions. Security holder is protected by full faith and credit of the U.S. Government. Ginnie Mae securities are backed by the FHA, VA or FmHA mortgages. The term “pass-throughs” is often used to describe Ginnie Maes. GOVERNMENT SECURITIES: Obligations of the U.S. Government and its agencies and instrumentalities. LIQUIDITY: A liquid asset is one that can be converted easily and rapidly into cash without a substantial loss of value. In the money market, a security is said to be liquid if the spread between bid and asked prices is narrow and reasonable size can be done at those quotes. LOCAL GOVERNMENT INVESTMENT POOL (LGIP): The aggregate of all funds from political subdivisions that are placed in the custody of the State Treasurer for investment and reinvestment. MARKET VALUE: The price at which a security is trading and could presumably be purchased or sold. MASTER REPURCHASE AGREEMENT: A written contract covering all future transactions between the parties to repurchase—reverse repurchase agreements that establishes each party’s rights in the transactions. A master agreement will often specify, among other things, the right of the buyer-lender to liquidate the underlying securities in the event of default by the seller borrower.
May 2016
MATURITY: The date upon which the principal or stated value of an investment becomes due and payable. MONEY MARKET: The market in which short-term debt instruments (bills, commercial paper, bankers’ acceptances, etc.) are issued and traded. NRSRO: Nationally Recognized Statistical Rating Organization; Credit rating agencies that are registered with the SEC. Such agencies provide an opinion on the creditworthiness of an entity and the financial obligations issued by an entity. OFFER: The price asked by a seller of securities. (When you are buying securities, you ask for an offer.) See Asked and Bid. OPEN MARKET OPERATIONS: Purchases and sales of government and certain other securities in the open market by the New York Federal Reserve Bank as directed by the FOMC in order to influence the volume of money and credit in the economy. Purchases inject reserves into the bank system and stimulate growth of money and credit; sales have the opposite effect. Open market operations are the Federal Reserve’s most important and most flexible monetary policy tool. PAR VALUE: The principal amount of a bond returned by the maturity date. PORTFOLIO: Collection of securities held by an investor. PRIMARY DEALER: A group of government securities dealers who submit daily reports of market activity and positions and monthly financial statements to the Federal Reserve Bank of New York and are subject to its informal oversight. Primary dealers include Securities and Exchange Commission (SEC)-registered securities broker-dealers, banks, and a few unregulated firms. PRUDENT PERSON RULE: An investment standard. In some states the law requires that a fiduciary, such as a trustee, may invest money only in a list of securities selected by the custody state—the so-called legal list. In other states the trustee may invest in a security if it is one which would be bought by a prudent person of discretion and intelligence who is seeking a reasonable income and preservation of capital. PUBLIC TIME DEPOSITS (Term Certificates Of Deposit): Time deposits are issued by depository institutions against funds deposited for a specified length of time. Time deposits include instruments such as deposit notes. They are distinct from certificates of deposit (CDs) in that interest payments on time deposits are calculated in a manner similar to that of corporate bonds whereas interest payments on CDs are calculated similar to that of money market instruments. QUALIFIED PUBLIC DEPOSITORIES: A financial institution which does not claim exemption from the payment of any sales or compensating use or ad valorem taxes under the laws of this state, which has segregated for the benefit of the commission eligible collateral having a value of not less than its maximum liability and which has been approved by the Public Deposit Protection Commission to hold public deposits. RATE OF RETURN: The yield obtainable on a security based on its purchase price or its current market price. This may be the amortized yield to maturity on a bond the current income return.
May 2016
REPURCHASE AGREEMENT (RP OR REPO): A holder of securities sells these securities to an investor with an agreement to repurchase them at a fixed price on a fixed date. The security “buyer” in effect lends the “seller” money for the period of the agreement, and the terms of the agreement are structured to compensate him for this. Dealers use RP extensively to finance their positions. Exception: When the Fed is said to be doing RP, it is lending money that is, increasing bank reserves. SAFEKEEPING: A service to customers rendered by banks for a fee whereby securities and valuables of all types and descriptions are held in the bank’s vaults for protection. SECONDARY MARKET: A market made for the purchase and sale of outstanding issues following the initial distribution. SECURITIES & EXCHANGE COMMISSION: Agency created by Congress to protect investors in securities transactions by administering securities legislation. SEC RULE l5(C))3-1: See Uniform Net Capital Rule. STRUCTURED NOTES: Notes issued by Government Sponsored Enterprises (FHLB, FNMA, SLMA, etc.) and Corporations, which have imbedded options (e.g., call features, step-up coupons, floating rate coupons, derivative-based returns) into their debt structure. Their market performance is impacted by the fluctuation of interest rates, the volatility of the imbedded options and shifts in the shape of the yield curve. TREASURY BILLS: A non-interest bearing discount security issued by the U.S. Treasury to finance the national debt. Most bills are issued to mature in three months, six months, or one year. TREASURY BONDS: Long-term coupon-bearing U.S. Treasury securities issued as direct obligations of the U.S. Government and having initial maturities of more than 10 years. TREASURY NOTES: Medium-term coupon-bearing U.S. Treasury securities issued as direct obligations of the U.S. Government and having initial maturities from two to 10 years. UNIFORM NET CAPITAL RULE: Securities and Exchange Commission requirement that member firms as well as nonmember broker-dealers in securities maintain a maximum ratio of indebtedness to liquid capital of 15 to 1; also called net capital rule and net capital ratio. Indebtedness covers all money owed to a firm, including margin loans and commitments to purchase securities, one reason new public issues are spread among members of underwriting syndicates. Liquid capital includes cash and assets easily converted into cash. YIELD: The rate of annual income return on an investment, expressed as a percentage. (a) INCOME YIELD is obtained by dividing the current dollar income by the current market price for the security. (b) NET YIELD or YIELD TO MATURITY is the current income yield minus any premium above par or plus any discount from par in purchase price, with the adjustment spread over the period from the date of purchase to the date of maturity of the bond.
D-1
APPENDIX D
FORM OF CONTINUING DISCLOSURE CERTIFICATE
$173,120,000 CITY AND COUNTY OF SAN FRANCISCO
GENERAL OBLIGATION BONDS (PUBLIC HEALTH AND SAFETY, 2016),
SERIES 2017A
This Continuing Disclosure Certificate (the “Disclosure Certificate”) is executed and delivered by the City and County of San Francisco (the “City”) in connection with the issuance of the bonds captioned above (the “Bonds”). The Bonds are issued pursuant to Resolution No. 514-16 and Resolution No. 515-16, both adopted by the Board of Supervisors of the City on December 6, 2016, and duly approved by the Mayor of the City on December 16, 2016 (together, the “Resolution”). The City covenants and agrees as follows:
SECTION 1. Purpose of the Disclosure Certificate. This Disclosure Certificate is being executed and delivered by the City for the benefit of the Holders and Beneficial Owners of the Bonds and in order to assist the Participating Underwriters in complying with Securities and Exchange Commission Rule 15c2-12(b)(5).
SECTION 2. Definitions. The following capitalized terms shall have the following meanings:
“Annual Report” shall mean any Annual Report provided by the City pursuant to, and as described in, Sections 3 and 4 of this Disclosure Certificate.
“Beneficial Owner” shall mean any person which: (a) has or shares the power, directly or indirectly, to make investment decisions concerning ownership of any Bonds (including persons holding Bonds through nominees, depositories or other intermediaries) including, but not limited to, the power to vote or consent with respect to any Bonds or to dispose of ownership of any Bonds; or (b) is treated as the owner of any Bonds for federal income tax purposes.
“Dissemination Agent” shall mean the City, acting in its capacity as Dissemination Agent under this Disclosure Certificate, or any successor Dissemination Agent designated in writing by the City and which has filed with the City a written acceptance of such designation.
“Holder” shall mean either the registered owners of the Bonds, or, if the Bonds are registered in the name of The Depository Trust Company or another recognized depository, any applicable participant in such depository system.
“Listed Events” shall mean any of the events listed in Section 5(a) and 5(b) of this Disclosure Certificate.
“MSRB” shall mean the Municipal Securities Rulemaking Board or any other entity designated or authorized by the Securities and Exchange Commission to receive reports pursuant to the Rule. Until otherwise designated by the MSRB or the Securities and Exchange Commission, filings with the MSRB are to be made through the Electronic Municipal Market Access (EMMA) website of the MSRB currently located at http://emma.msrb.org.
“Participating Underwriter” shall mean any of the original underwriters or purchasers of the Bonds required to comply with the Rule in connection with offering of the Bonds.
D-2
“Rule” shall mean Rule 15c2-12(b)(5) adopted by the Securities and Exchange Commission under the Securities Exchange Act of 1934, as the same may be amended from time to time.
SECTION 3. Provision of Annual Reports.
(a) The City shall, or shall cause the Dissemination Agent to, not later than 270 days after the end of the City’s fiscal year (which is June 30), commencing with the report for the 2016-17 Fiscal Year (which is due not later than March 27, 2018), provide to the MSRB an Annual Report which is consistent with the requirements of Section 4 of this Disclosure Certificate. If the Dissemination Agent is not the City, the City shall provide the Annual Report to the Dissemination Agent not later than 15 days prior to said date. The Annual Report must be submitted in electronic format and accompanied by such identifying information as is prescribed by the MSRB, and may cross-reference other information as provided in Section 4 of this Disclosure Certificate; provided, that if the audited financial statements of the City are not available by the date required above for the filing of the Annual Report, the City shall submit unaudited financial statements and submit the audited financial statements as soon as they are available. If the City’s Fiscal Year changes, it shall give notice of such change in the same manner as for a Listed Event under Section 5(e).
(b) If the City is unable to provide to the MSRB an Annual Report by the date required in subsection (a), the City shall send a notice to the MSRB in substantially the form attached as Exhibit A.
(c) The Dissemination Agent shall (if the Dissemination Agent is other than the City), file a report with the City certifying the date that the Annual Report was provided to the MSRB pursuant to this Disclosure Certificate.
SECTION 4. Content of Annual Reports. The City’s Annual Report shall contain or incorporate by reference the following information, as required by the Rule:
(a) the audited general purpose financial statements of the City prepared in accordance with generally accepted accounting principles applicable to governmental entities;
(b) a summary of budgeted general fund revenues and appropriations;
(c) a summary of the assessed valuation of taxable property in the City;
(d) a summary of the ad valorem property tax levy and delinquency rate;
(e) a schedule of aggregate annual debt service on tax-supported indebtedness of the City; and
(f) summary of outstanding and authorized but unissued tax-supported indebtedness of the City.
Any or all of the items listed above may be set forth in a document or set of documents, or may be included by specific reference to other documents, including official statements of debt issues of the City or related public entities, which are available to the public on the MSRB website. If the document included by reference is a final official statement, it must be available from the MSRB. The City shall clearly identify each such other document so included by reference.
SECTION 5. Reporting of Significant Events.
(a) The City shall give, or cause to be given, notice of the occurrence of any of the following events numbered 1-9 with respect to the Bonds not later than ten business days after the occurrence of the event:
D-3
1. Principal and interest payment delinquencies; 2. Unscheduled draws on debt service reserves reflecting financial difficulties; 3. Unscheduled draws on credit enhancements reflecting financial difficulties; 4. Substitution of credit or liquidity providers, or their failure to perform; 5. Issuance by the Internal Revenue Service of proposed or final determination of taxability
or of a Notice of Proposed Issue (IRS Form 5701 TEB) or adverse tax opinions; 6. Tender offers; 7. Defeasances; 8. Rating changes; or 9. Bankruptcy, insolvency, receivership or similar event of the obligated person.
Note: for the purposes of the event identified in subparagraph (9), the event is considered to occur when any of the following occur: the appointment of a receiver, fiscal agent or similar officer for an obligated person in a proceeding under the U.S. Bankruptcy Code or in any other proceeding under State or federal law in which a court or governmental authority has assumed jurisdiction over substantially all of the assets or business of the obligated person, or if such jurisdiction has been assumed by leaving the existing governmental body and officials or officers in possession but subject to the supervision and orders of a court or governmental authority, or the entry of an order confirming a plan of reorganization, arrangement or liquidation by a court or governmental authority having supervision or jurisdiction over substantially all of the assets or business of the obligated person.
(b) The City shall give, or cause to be given, notice of the occurrence of any of the following events numbered 10-16 with respect to the Bonds not later than ten business days after the occurrence of the event, if material:
10. Unless described in paragraph 5(a)(5), other material notices or determinations by the Internal Revenue Service with respect to the tax status of the Bonds or other material events affecting the tax status of the Bonds;
11. Modifications to rights of Bond holders; 12. Unscheduled or contingent Bond calls; 13. Release, substitution, or sale of property securing repayment of the Bonds; 14. Non-payment related defaults; 15. The consummation of a merger, consolidation, or acquisition involving an obligated
person or the sale of all or substantially all of the assets of the obligated person, other than in the ordinary course of business, the entry into a definitive agreement to undertake such an action or the termination of a definitive agreement relating to any such actions, other than pursuant to its terms; or
16. Appointment of a successor or additional trustee or the change of name of a trustee.
(c) The City shall give, or cause to be given, in a timely manner, notice of a failure to provide the annual financial information on or before the date specified in Section 3, as provided in Section 3(b).
(d) Whenever the City obtains knowledge of the occurrence of a Listed Event described in Section 5(b), the City shall determine if such event would be material under applicable federal securities laws.
(e) If the City learns of the occurrence of a Listed Event described in Section 5(a), or determines that knowledge of a Listed Event described in Section 5(b) would be material under
D-4
applicable federal securities laws, the City shall within ten business days of occurrence file a notice of such occurrence with the MSRB in electronic format, accompanied by such identifying information as is prescribed by the MSRB. Notwithstanding the foregoing, notice of the Listed Event described in subsection 5(b)(12) need not be given under this subsection any earlier than the notice (if any) of the underlying event is given to Holders of affected Bonds pursuant to the Resolution.
SECTION 6. Termination of Reporting Obligation. The City’s obligations under this Disclosure Certificate shall terminate upon the legal defeasance, prior redemption or payment in full of all of the Bonds. If such termination occurs prior to the final maturity of the Bonds, the City shall give notice of such termination in the same manner as for a Listed Event under Section 5(e).
SECTION 7. Dissemination Agent. The City may, from time to time, appoint or engage a Dissemination Agent to assist it in carrying out its obligations under this Disclosure Certificate, and may discharge any such Agent, with or without appointing a successor Dissemination Agent. The Dissemination Agent shall have only such duties as are specifically set forth in this Disclosure Certificate.
SECTION 8. Amendment; Waiver. Notwithstanding any other provision of this Disclosure Certificate, the City may amend or waive this Disclosure Certificate or any provision of this Disclosure Certificate, provided that the following conditions are satisfied:
(a) If the amendment or waiver relates to the provisions of Sections 3(a), 3(b), 4, 5(a) or 5(b), it may only be made in connection with a change in circumstances that arises from a change in legal requirements, change in law, or change in the identity, nature or status of an obligated person with respect to the Bonds or the type of business conducted;
(b) The undertaking, as amended or taking into account such waiver, would, in the opinion of the City Attorney or nationally recognized bond counsel, have complied with the requirements of the Rule at the time of the original issuance of the Bonds, after taking into account any amendments or interpretations of the Rule, as well as any change in circumstances; and
(c) The amendment or waiver either (i) is approved by the owners of a majority in aggregate principal amount of the Bonds or (ii) does not, in the opinion of the City Attorney or nationally recognized bond counsel, materially impair the interests of the Holders.
In the event of any amendment or waiver of a provision of this Disclosure Certificate, the City shall describe such amendment in the next Annual Report, and shall include, as applicable, a narrative explanation of the reason for the amendment or waiver and its impact on the type (or in the case of a change of accounting principles, on the presentation) of financial information or operating data being presented by the City. In addition, if the amendment relates to the accounting principles to be followed in preparing financial statements: (i) notice of such change shall be given in the same manner as for a Listed Event under Section 5; and (ii) the Annual Report for the year in which the change is made should present a comparison (in narrative form and also, if feasible, in quantitative form) between the financial statements as prepared on the basis of the new accounting principles and those prepared on the basis of the former accounting principles.
SECTION 9. Additional Information. Nothing in this Disclosure Certificate shall be deemed to prevent the City from disseminating any other information, using the means of dissemination set forth in this Disclosure Certificate or any other means of communication, or including any other information in any Annual Report or notice of occurrence of a Listed Event, in addition to that which is required by this Disclosure Certificate. If the City chooses to include any information in any Annual Report or notice of occurrence of a Listed Event in addition to that which is specifically required by this Disclosure Certificate, the City shall have no obligation under this Disclosure Certificate to update such information or include it in any future Annual Report or notice of occurrence of a Listed Event.
D-5
SECTION 10. Remedies. In the event of a failure of the City to comply with any provision of this Disclosure Certificate, any Participating Underwriter, Holder or Beneficial Owner of the Bonds may take such actions as may be necessary and appropriate to cause the City to comply with its obligations under this Disclosure Certificate; provided that any such action may be instituted only in a federal or state court located in the City and County of San Francisco, State of California, and that the sole remedy under this Disclosure Certificate in the event of any failure of the City to comply with this Disclosure Certificate shall be an action to compel performance.
SECTION 11. Beneficiaries. This Disclosure Certificate shall inure solely to the benefit of the City, the Dissemination Agent, the Participating Underwriters and Holders and Beneficial Owners from time to time of the Bonds, and shall create no rights in any other person or entity.
Date: February 1, 2017.
CITY AND COUNTY OF SAN FRANCISCO
Benjamin Rosenfield Controller
Approved as to form:
DENNIS J. HERRERA CITY ATTORNEY
By: Deputy City Attorney
D-6
CONTINUING DISCLOSURE CERTIFICATE EXHIBIT A
FORM OF NOTICE TO THE MUNICIPAL SECURITIES RULEMAKING BOARD
OF FAILURE TO FILE ANNUAL REPORT
Name of City: CITY AND COUNTY OF SAN FRANCISCO
Name of Bond Issue: CITY AND COUNTY OF SAN FRANCISCO TAX-EXEMPT GENERAL OBLIGATION BONDS
(PUBLIC HEALTH AND SAFETY, 2016) SERIES 2017A
Date of Issuance: February 1, 2017
NOTICE IS HEREBY GIVEN to the Municipal Securities Rulemaking Board that the City has not provided an Annual Report with respect to the above-named Bonds as required by Section 3 of the Continuing Disclosure Certificate of the City and County of San Francisco, dated February 1, 2017. The City anticipates that the Annual Report will be filed by _____________.
Dated:_______________
CITY AND COUNTY OF SAN FRANCISCO
By: [to be signed only if filed] Title:
E-1
APPENDIX E
DTC AND THE BOOK ENTRY ONLY SYSTEM
The information in numbered paragraphs 1-10 of this Appendix E, concerning The Depository Trust Company (“DTC”) and DTC’s book-entry system, has been furnished by DTC for use in official statements and the City takes no responsibility for the completeness or accuracy thereof. The City cannot and does not give any assurances that DTC, DTC Participants or Indirect Participants will distribute to the Beneficial Owners (a) payments of interest or principal with respect to the Bonds, (b) certificates representing ownership interest in or other confirmation or ownership interest in the Bonds, or (c) redemption or other notices sent to DTC or Cede & Co., its nominee, as the registered owner of the Bonds, or that they will so do on a timely basis, or that DTC, DTC Participants or DTC Indirect Participants will act in the manner described in this Appendix. The current “Rules” applicable to DTC are on file with the Securities and Exchange Commission and the current “Procedures” of DTC to be followed in dealing with DTC Participants are on file with DTC. As used in this appendix, “Securities” means the Bonds, “Issuer” means the City, and “Agent” means the Paying Agent.
Information Furnished by DTC Regarding its Book-Entry Only System
1. The Depository Trust Company (“DTC”) will act as securities depository for the securities (the “Securities”). The Securities will be issued as fully-registered securities registered in the name of Cede & Co. (DTC’s partnership nominee) or such other name as may be requested by an authorized representative of DTC. One fully-registered Security certificate will be issued for the Securities, in the aggregate principal amount of such issue, and will be deposited with DTC.
2. DTC, the world’s largest securities depository, is a limited-purpose trust company organized under the New York Banking Law, a “banking organization” within the meaning of the New York Banking Law, a member of the Federal Reserve System, a “clearing corporation” within the meaning of the New York Uniform Commercial Code, and a “clearing agency” registered pursuant to the provisions of Section 17A of the Securities Exchange Act of 1934. DTC holds and provides asset servicing for over 3.5 million issues of U.S. and non-U.S. equity issues, corporate and municipal debt issues, and money market instruments (from over 100 countries) that DTC’s participants (“Direct Participants”) deposit with DTC. DTC also facilitates the post-trade settlement among Direct Participants of sales and other securities transactions in deposited securities, through electronic computerized book-entry transfers and pledges between Direct Participants’ accounts. This eliminates the need for physical movement of securities certificates. Direct Participants include both U.S. and non-U.S. securities brokers and dealers, banks, trust companies, clearing corporations, and certain other organizations. DTC is a wholly-owned subsidiary of The Depository Trust & Clearing Corporation (“DTCC”). DTCC is the holding company for DTC, National Securities Clearing Corporation and Fixed Income Clearing Corporation, all of which are registered clearing agencies. DTCC is owned by the users of its regulated subsidiaries. Access to the DTC system is also available to others such as both U.S. and non-U.S. securities brokers and dealers, banks, trust companies, and clearing corporations that clear through or maintain a custodial relationship with a Direct Participant, either directly or indirectly (“Indirect Participants”). DTC has a Standard & Poor’s rating of AA+. The DTC Rules applicable to its Participants are on file with the Securities and Exchange Commission. More information about DTC can be found at www.dtcc.com.
3. Purchases of Securities under the DTC system must be made by or through Direct Participants, which will receive a credit for the Securities on DTC’s records. The ownership interest of each actual purchaser of each Security (“Beneficial Owner”) is in turn to be recorded on the Direct and Indirect Participants’ records. Beneficial Owners will not receive written confirmation from DTC of their purchase. Beneficial Owners are, however, expected to receive written confirmations providing details of the transaction, as well as periodic statements of their holdings, from the Direct or Indirect Participant through which the Beneficial Owner entered into the transaction. Transfers of ownership interests in the Securities are to be accomplished by entries made on the books of Direct and Indirect Participants acting on behalf of Beneficial
E-2
Owners. Beneficial Owners will not receive certificates representing their ownership interests in Securities, except in the event that use of the book-entry system for the Securities is discontinued.
4. To facilitate subsequent transfers, all Securities deposited by Direct Participants with DTC are registered in the name of DTC’s partnership nominee, Cede & Co., or such other name as may be requested by an authorized representative of DTC. The deposit of Securities with DTC and their registration in the name of Cede & Co. or such other DTC nominee do not effect any change in beneficial ownership. DTC has no knowledge of the actual Beneficial Owners of the Securities; DTC’s records reflect only the identity of the Direct Participants to whose accounts such Securities are credited, which may or may not be the Beneficial Owners. The Direct and Indirect Participants will remain responsible for keeping account of their holdings on behalf of their customers.
5. Conveyance of notices and other communications by DTC to Direct Participants, by Direct Participants to Indirect Participants, and by Direct Participants and Indirect Participants to Beneficial Owners will be governed by arrangements among them, subject to any statutory or regulatory requirements as may be in effect from time to time.
6. Redemption notices shall be sent to DTC. If less than all of the Bonds of a maturity are being redeemed, DTC’s practice is to determine by lot the amount of the interest of each Direct Participant in such issue to be redeemed.
7. Neither DTC nor Cede & Co. (nor any other DTC nominee) will consent or vote with respect to Securities unless authorized by a Direct Participant in accordance with DTC’s MMI Procedures. Under its usual procedures, DTC mails an Omnibus Proxy to Issuer as soon as possible after the record date. The Omnibus Proxy assigns Cede & Co.’s consenting or voting rights to those Direct Participants to whose accounts Securities are credited on the record date (identified in a listing attached to the Omnibus Proxy).
8. Redemption proceeds, distributions, and dividend payments on the Securities will be made to Cede & Co., or such other nominee as may be requested by an authorized representative of DTC. DTC’s practice is to credit Direct Participants’ accounts upon DTC’s receipt of funds and corresponding detail information from Issuer or Agent, on payable date in accordance with their respective holdings shown on DTC’s records. Payments by Participants to Beneficial Owners will be governed by standing instructions and customary practices, as is the case with securities held for the accounts of customers in bearer form or registered in “street name,” and will be the responsibility of such Participant and not of DTC, Agent, or Issuer, subject to any statutory or regulatory requirements as may be in effect from time to time. Payment of redemption proceeds, distributions, and dividend payments to Cede & Co. (or such other nominee as may be requested by an authorized representative of DTC) is the responsibility of Issuer or Agent, disbursement of such payments to Direct Participants will be the responsibility of DTC, and disbursement of such payments to the Beneficial Owners will be the responsibility of Direct and Indirect Participants.
9. DTC may discontinue providing its services as depository with respect to the Securities at any time by giving reasonable notice to Issuer or Agent. Under such circumstances, in the event that a successor depository is not obtained, Security certificates are required to be printed and delivered.
10. Issuer may decide to discontinue use of the system of book-entry-only transfers through DTC (or a successor securities depository). In that event, Security certificates will be printed and delivered to DTC.
Discontinuation of Book-Entry Only System; Payment to Beneficial Owners
In the event that the book-entry system described above is no longer used with respect to the Bonds, the following provisions will govern the registration, transfer and exchange of the Bonds.
E-3
Payment of the interest on any Bond shall be made by check mailed on the interest payment date to the owner at the owner’s address at it appears on the registration books described below as of the Record Date (as defined herein).
The City Treasurer will keep or cause to be kept, at the office of the City Treasurer, or at the designated office of any registrar appointed by the City Treasurer, sufficient books for the registration and transfer of the Bonds, which shall at all times be open to inspection, and, upon presentation for such purpose, the City Treasurer shall, under such reasonable regulations as he or she may prescribe, register or transfer or cause to be registered or transferred, on said books, Bonds as hereinbefore provided.
Any Bond may, in accordance with its terms, be transferred, upon the registration books described above, by the person in whose name it is registered, in person or by the duly authorized attorney of such person, upon surrender of such Bond for cancellation, accompanied by delivery of a duly executed written instrument of transfer in a form approved by the City Treasurer.
Any Bonds may be exchanged at the office of the City Treasurer for a like aggregate principal amount of other authorized denominations of the same interest rate and maturity.
Whenever any Bond or Bonds shall be surrendered for transfer or exchange, the designated City officials shall execute and the City Treasurer shall authenticate and deliver a new Bond or Bonds of the same series, interest rate and maturity, for a like aggregate principal amount. The City Treasurer shall require the payment by any Bond owner requesting any such transfer of any tax or other governmental charge required to be paid with respect to such transfer or exchange.
No transfer or exchange of Bonds shall be required to be made by the City Treasurer during the period from the Record Date (as defined in this Official Statement) next preceding each interest payment date to such interest payment date or after a notice of redemption shall have been mailed with respect to such Bond.

F-1
APPENDIX F
PROPOSED FORM OF OPINION OF CO-BOND COUNSEL
[Closing Date]
City and County of San Francisco 1 Dr. Carlton B. Goodlett Place San Francisco, California 94102
Re: $173,120,000 City and County of San Francisco Tax-Exempt General Obligation Bonds (Public Health and Safety, 2016), Series 2017A
Ladies and Gentlemen:
We have acted as Co-Bond Counsel in connection with the issuance by the City and County of San Francisco (the “City”) of its $173,120,000 General Obligation Bonds (Public Health and Safety, 2016), Series 2017A (the “Bonds”).
The Bonds will be issued under the Government Code of the State of California and the Charter of the City. The City authorized the issuance of the Bonds by its Resolution No. 514-16, adopted by the Board of Supervisors of the City on December 6, 2016 and duly approved by the Mayor of the City on December 16, 2016, and Resolution No. 515-16, adopted by the Board of Supervisors of the City on December 6, 2016 and duly approved by the Mayor of the City on December 16, 2016 (together, the “Resolutions”). Capitalized terms used herein and not otherwise defined shall have the meanings assigned to them in the Resolutions.
As Co-Bond Counsel, we have examined copies certified to us as being true and complete copies of the proceedings of the City in connection with the issuance of the Bonds. We have also examined such certificates of officers of the City and others as we have considered necessary for the purposes of this opinion. This opinion is limited to the laws of the State of California and the federal laws of the United States of America.
Based upon the foregoing, we are of the opinion that:
1. The Bonds constitute valid and binding obligations of the City.
2. The Board of Supervisors has the power and is obligated to levy property taxes without limitation as to rate or amount upon all property within the City’s boundaries subject to taxation by the City (except for certain property which is taxable at limited rates) for payment of the Bonds and the interest thereon.
3. Under existing statutes, regulations, rulings and court decisions, interest on the Bonds is exempt from personal income taxes of the State of California and, assuming compliance with the covenants mentioned herein after the date hereof, interest on the Bonds is excluded pursuant to section 103(a) of the Internal Revenue Code of 1986 (the “Code”) from the gross income of the owners thereof for federal income tax purposes and will not be included in computing the federal alternative minimum taxable income of individuals or, except as hereinafter described, corporations. Interest on the Bonds owned by a corporation will be included in such corporation’s adjusted current earnings for purposes of calculating the federal alternative minimum taxable income of such corporation, other than an S corporation, a qualified mutual fund, a real estate mortgage investment conduit, a real estate investment trust, or a financial asset securitization investment trust (“FASIT”). A corporation’s alternative minimum taxable income is the basis on which the alternative minimum tax imposed by section 55 of the Code will be computed. The Code imposes certain requirements that must be met subsequent to the issuance and delivery of the Bonds for interest thereon to be and remain excluded pursuant to section 103(a) of the Code from the gross income of the owners thereof for federal income tax purposes. Non-compliance with such requirements could cause the interest on the Bonds to fail to be excluded from the gross income of the owners thereof retroactive to
F-2
the date of issuance of the Bonds. Pursuant to the Resolutions and a tax certificate pertaining to arbitrage and other matters under sections 103 and 141-150 of the Code being delivered by the City in connection with the issuance of the Bonds (the “Tax Certificate”), the City is making representations relevant to the determination of, and is undertaking certain covenants regarding or affecting, the exclusion of interest on the Bonds from the gross income of the owners thereof for federal income tax purposes.
In reaching our opinions described in the immediately preceding paragraph, we have assumed the accuracy of and have relied upon such representations and the present and future compliance by the City with such covenants. Further, except as stated in the preceding paragraph, we express no opinion as to any federal, state, or local tax consequence of the receipt or accrual of interest on, or the ownership or disposition of, the Bonds. Furthermore, we express no opinion as to any federal, state or local tax law consequence with respect to the Bonds, or the interest thereon, if any action is taken with respect to the Bonds or the proceeds thereof predicated or permitted upon the advice or approval of other counsel. Ownership of tax-exempt obligations such as the Bonds may result in collateral federal tax consequences to, among others, financial institutions, life insurance companies, property and casualty insurance companies, certain foreign corporations doing business in the United States, S corporations with subchapter C earnings and profits, owners of an interest in a FASIT, individual recipients of Social Security or Railroad Retirement benefits, individuals otherwise qualifying for the earned income tax credit, and taxpayers who may be deemed to have incurred or continued indebtedness to purchase or carry, or who have paid or incurred certain expenses allocable to, tax-exempt obligations.
The opinion expressed in paragraph 1 above is qualified to the extent the enforceability of the Bonds may be limited by applicable bankruptcy, insolvency, debt adjustment, reorganization, moratorium or similar laws or equitable principles relating to or limiting creditors’ rights generally or as to the availability of any particular remedy. The enforceability of the Bonds is subject to the effect of general principles of equity, including, without limitation, concepts of materiality, reasonableness, good faith and fair dealing, to the possible unavailability of specific performance or injunctive relief, regardless of whether considered in a proceeding in equity or at law, and to the limitations on legal remedies against governmental entities in the State of California.
No opinion is expressed herein on the accuracy, completeness or fairness of the Official Statement or other offering material relating to the Bonds.
Our opinions are based on existing law, which is subject to change. Such opinions are further based on our knowledge of facts as of the date hereof. We assume no duty to update or supplement our opinions to reflect any facts or circumstances that may thereafter come to our attention or to reflect any changes in any law that may thereafter occur or become effective. Moreover, our opinions are not a guarantee of result and are not binding on the Internal Revenue Service; rather, such opinions represent our legal judgment based upon our review of existing law that we deem relevant to such opinions and in reliance upon the representations and covenants referenced above.
Respectfully submitted,


FOR ADDITIONAL BOOKS: ELABRA.COM OR (888) 935-2272
Related Documents


