Bonny Utility Company Mario Caenen General Manager BUC 14 December 2006 A closer look at Sustainable Development in Practice

Bonny Utility Company Mario Caenen General Manager BUC 14 December 2006 A closer look at Sustainable Development in Practice.
Dec 30, 2015
Welcome message from author
This document is posted to help you gain knowledge. Please leave a comment to let me know what you think about it! Share it to your friends and learn new things together.
Transcript

Bonny Utility Company
Mario CaenenGeneral Manager BUC14 December 2006
A closer look at Sustainable Development in Practice

• BUC Foundation
• The Story Unfolding
• Do’s and Don'ts
A Closer Look
To be Covered

Brief History
BUC Foundation
• Started as 5M$ infrastructure community support project:– Upgrade electrical distribution system– Replace stand-alone diesel driven generation by gas turbine
generation from oil installations– Utility Management Committee to oversee operation
• Project technically successful: not a successful project– New investment idle while fuelling and maintaining old system– Bad press– Regular minor incidents, visits by youth to plant gate– No view on management of operational phase, No acceptable
operator to hand-over– Management by Committee

Current Concept
BUC Foundation
• Separate Utility Company– Delegated authority to handle the business– Clear and agreed deliverables Contour of supply– High local content Employment Bonny Indigenes > 75%– Front office in town, easy to access with questions, comments,
problems– Stakeholder involved from day one, carried along in good and
bad times
• Provision of Electricity free up to limit– Above limit at subsidised rates (70% to 0%)– Pre-payment meters– No direct cash transactions– Non profit Organisation

Current Concept (continued)
BUC Foundation
• World Class Service
–Reliable Power Availability 95% or above
–Quick response 24*7 emergency response team
–Adhere to global utility standards High Quality Equipment
–Professional approach tools, training, procedures, KPI’s
–Firm policy against corruption/fraud

Involved Parties
BUC Foundation
Joint Industries
B
U
C
LGA
Bonny Kingdom
Ministry Of Power
Community
Residential UsersLocal Businesses
Stake Holders Service Provider Customers
Community
Support
$
Power
Street lighting,Good business environment, Employment,Contracts
Reliable & Safe Electricity
Naira

Organisation
BUC Foundation
– All stakeholders represented in Board– GM and Head finance seconded by
shareholders – Ministry of Power manpower seconded to
supervisory and operational positions– Some non-core business activities outsourced
to indigenous contractors (security, cleaning)
FinanceBUC/7
General ManagerBUC
Deputy ManagerBUC/0
Quality ServicesBUC/5
AdminBUC/1
Revenue ProtectionBUC/2
Power O&MBUC/3
Water O&MBUC/4
future extension
General ServicesBUC/6
Extended Management BUC
Management Team BUC
Community RelationsBUC/8
Board of Directors1 LGA, 1 MOP, 2 BKDC, 2 JIC

Let there be light project start 2001
Preliminary Estimate• 2 years for contour• 3000 customers• Capex 5M US$ <=>
$1665/connection• Load growth 15% per year
• Protest on payment
• Fraud 5% customer base
Actual• 4 years for contour• 8500 customers• Capex 6.48M US$ <=>
$760/connection• Initial decrease of 20% on
connection, next 12.9% per year
• Early protest changed to eagerness to join; people lining up
• Fraud 1.3% customer base, yet requires continuous attention
The Story Unfolding

…and there was light Substations
The Story Unfolding
NowThen

…and there was light Grid
The Story Unfolding
Then

…and there was light Grid
The Story Unfolding
Now

…and there was light Connections
The Story Unfolding
Now
Then

Immediate Benefits
• To Community:– Better environment –
clean power– Higher availability >95%– Improved power quality
• To Companies:– Major saving on fuel and
maintenance– Less community
disturbances
The Story Unfolding
Goodbye diesel generators
March 2005Last set removed from contour
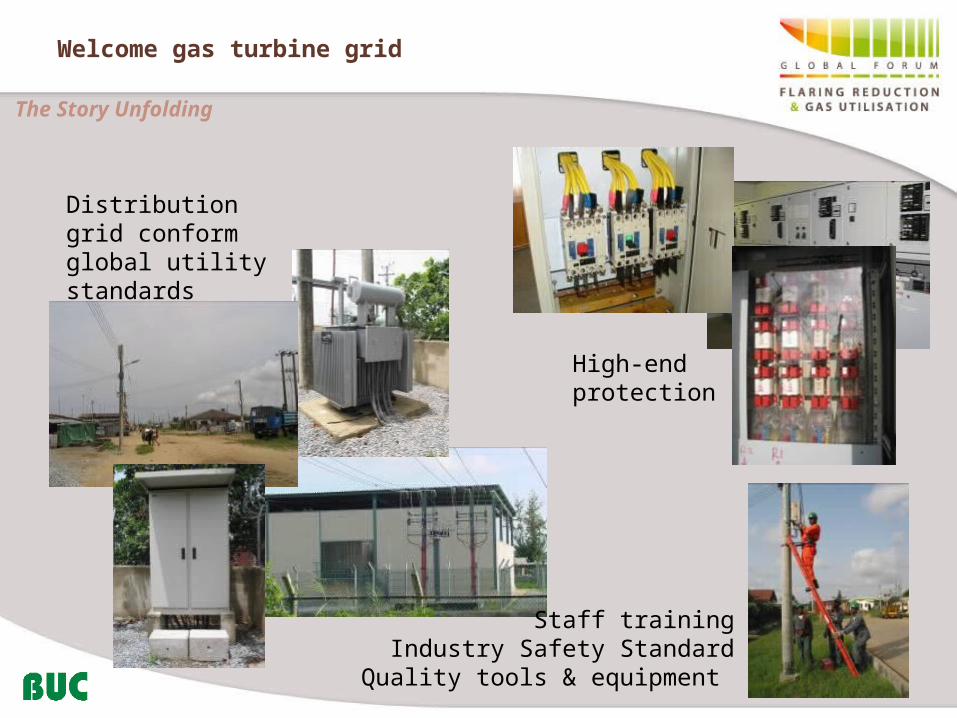
Welcome gas turbine grid
The Story Unfolding
Distribution grid conform global utility standards
High-end protection
Staff trainingIndustry Safety Standard
Quality tools & equipment

The Story Unfolding
New… pre-payment
• Customers pay into designated bank • On hand-over teller, customer receives 20 digit token only
applicable to specific customer and meter no.• Customer enters token into meter to upgrade credits• Central system tracks use and alerts irregularities• Back-up meter/customer tracks meter by-pass• BUC inspects connection 2x/year
Model to achieve sustainability and avoid immense waste related to free arrangements

Average Monthly Sales pattern
19,77%
26,48%
19,89%
15,43%
12,01%
5,95%
0,47%0,00%
5,25%
10,77%
15,08%
20,26%
22,79%
25,84%
0,00%
5,00%
10,00%
15,00%
20,00%
25,00%
30,00%
BESA ONLY 1 - 150 151 - 300 301 - 500 501 - 900 901 - 5000 > 5000
Customer%
Amount%
• 20% of the customers enjoy electricity via the free issue without buying additional credits
• 60% being small residential customers pay less then $2.50 per month
• 7% being commercial users and large scale consumers are accountable for 50% of the electricity sales
The Story Unfolding

Average Monthly Sales pattern
• Average Revenue/month
2002 US$ 1500
2003 US$ 8000
2004 US$ 18,500
2005 US$ 24,000
2006 US$ 26,000
• Since project start in 2001 the community contributed 28.78% to the O&M budget through electricity sales
The Story Unfolding
NLNG; 35,61%
SPDC; 21,36%
Community; 28,78%
Mobil; 14,24%
0%
10%
20%
30%
40%
50%
60%
70%
80%
90%
100%
BUC O&M budget contributions 2001 to 2006

The Story Unfolding
Key Figures 2006
• 7500 + buildings connected, approx. 60,000 people
• 95.2% availability of power in BUC contour of supply
• Peak Load 7.5 MW
• Bonny power consumption 3625 MWh /month,approx. 725 kWh per capita per annum
• 83% of all BUC positions filled by Bonny Indigenes
• 1,068,337 LTI-free man-hours
• Revenue approx. 26K US$/month, this covers manpower cost but not yet spares, consumables and electricity charge

The Story Unfolding
Impact
• Public services perform better hospital doubled operations
• Businesses (small and large) are flourishing
• Higher comfort level to residential users/workers
• Over 150 people direct or indirect employed BUC provides training and opportunity for growth
• Boost of general confidence Elite relocate back
• General safety level increased Street Lighting
• Image Companies improved Less Gate Incidents
• Improved environment No noisy, polluting gensets

The Story Unfolding
Impact (continued)
NewBusinesses
arise
Numerous Micro Economic Developments

The Story Unfolding
Outlook
• Challenges– Power supply in line with demand growth– Power provision outside BUC contour
• Planned activities 2007/08– Higher Availability Added power Supplier– Improved Power Quality More substations, smaller areas– Extension Contour Services to more Customers– Upgrade BUC office facilities Enhanced Technical Services in-
house, Improved Customer Service Centre– Expansion portfolio Water production/distribution services– Rate Review Cost neutral operation = Full Sustainability

Do’s and Don’ts
What has gone wrong
• Community Support initially approached with Public Relations mindset
• Utility committee model had no noteworthy effect on improvement power services, professional body for actual operation & maintenance is a must
• Issue of payment controversial on start-up, which caused significant delays
• Impact underestimated, poor forecast on volume customer base, rapid growth in town not anticipated

Do’s and Don’ts
Lessons
• Focus on objectives; i.e Community Development is not a Public Relations activity
• Carry stakeholders along, even if they are slowing down the project initially
• Be prepared to be in the game for a long time, no fast results
• Lead times of projects are long, ensure stake-holder’s understanding for continued commitment
• Do not cluster projects, slice them in stand alone sub-projects to deliver tangible milestones
• Split post-handover activities from project deliverables

Do’s and Don’ts
Lessons (continued)
• Ensure Management support for SD activities; a large parts of the organisation may not necessarily see the need for SD, while their support is required for success (e.g. logistics). Declare it “part of the business” and explain why
• Make clear agreements with stakeholders on deliverables. List also what is NOT included in the scope. Once final be ready to act without delay
• Apart from obvious culture difference, beware of Babylonian miscommunications
• Keep all communications formal and in writing, also when no replies are received

Related Documents