Original Article Bone Mineral Density of Healthy Turkish Children and Adolescents Damla Goksen, * ,1 Sukran Darcan, 1 Mahmut Coker, 1 and Timur Kose 2 1 Ege University Faculty of Medicine Department of Pediatric Endocrinology and Metabolism, Bornova/ _ Izmir, Turkey; and 2 Ege University Faculty of Computer Engineering, Bornova/ _ Izmir, Turkey Abstract The objective of this article is to gain reference values of lumbar and femoral neck bone mineral density (BMD) for healthy Turkish children. Three hundred forty-five children aged 2–18 years were examined. Weight and height development were normal for age according to national growth charts. Areal BMD (aBMD) was corrected using the model of Kroger et al (9). The results of the lumbar and femoral aBMD increased progressively from childhood to adulthood. Statistically significant correlation was found between lumbar and femoral neck aBMD and age and height ( p ! 0.01). Lumbar volumetric (vBMD) data were similar between males and females. Femoral vBMD was only significantly different at the ages of 8 and 16 ( p ! 0.05) in girls and boys and did not increase with age. A significant increase in aBMD L1–L4 values according to puberty was observed between all Tanner stages, except Tanner stages 3 and 4 ( p O 0.05). A significant difference was found between stages 1 and 2, and 2 and 3 in femoral neck aBMD ( p ! 0.05). This data provides a tool for the investigation and follow-up of Turkish children at risk for low-bone mineralization. Key Words: Areal bone mineral density (aBMD); volumetric bone mineral density (vBMD); children; adolescents. Introduction During childhood and adolescence, bone mineral density (BMD) increases until peak bone mass is reached. Age, weight, height, pubertal status, nutrition, physical activity level, and ethnicity are the factors that influence peak bone mass and BMD (1,2). Dual energy X-ray absorptiometry (DXA) is the method of choice to measure BMD allowing rapid assessment of low radiation dose with high precision and accuracy. In physical terms, bone mass depends on the size and the density of skeletal bone. It is not possible to measure true bone density by DXA because it measures only the cross- sectional area of the scanned bone. True BMD is a function of the bone mineral content per volume of bone (3). Correc- tion of lumbar BMD for bone volume by the use of mathe- matical formulations reduces the effect of bone size during growth (4). In some studies it has been shown that volumetric BMD (vBMD) remains dependent on age and bone size dur- ing growth, except prior to puberty when femoral neck vBMD is independent of age (5–9). Studies in healthy children using quantitative computed tomography (QCT) have shown that BMD of cortical bone is not influenced by age, anthropo- metric parameters, puberty, gender or race; however events during puberty are the major determinants of the increases in the cancellous bone density (10). In order to assess children and adolescents who are at risk for low bone mass, normative data based on large samples are required (11). Several cross-sectional studies have presented normative data for children and adolescence, but these are limited with small sample size, they are specific to geo- graphic areas, and they use different software programs (5,11–19). The objective of this study was to gain BMD reference values for the lumbar spine and femoral neck of healthy Received 03/28/05; Revised 06/21/2005; 08/10/2005; Accepted 08/10/05. *Address correspondece to: Damla Goksen, Mithatpas xa cad No 1114/5, G€ uzelyalı/ _ Izmir 35290 Turkey. E-mail: damla.goksen@ ege.edu.tr 84 Journal of Clinical Densitometry, vol. 9, no. 1, 84–90, 2006 Ó Copyright 2006 by The International Society for Clinical Densitometry 1094-6950/06/9:84–90/$32.00 DOI: 10.1016/j.jocd.2005.08.001

Welcome message from author
This document is posted to help you gain knowledge. Please leave a comment to let me know what you think about it! Share it to your friends and learn new things together.
Transcript

Journal of Clinical Densitometry, vol. 9, no. 1, 84–90, 2006� Copyright 2006 by The International Society for Clinical Densitometry1094-6950/06/9:84–90/$32.00DOI: 10.1016/j.jocd.2005.08.001
Original Article
Bone Mineral Density of Healthy TurkishChildren and Adolescents
Damla Goksen,*,1 Sukran Darcan,1 Mahmut Coker,1 and Timur Kose2
1Ege University Faculty of Medicine Department of Pediatric Endocrinology and Metabolism, Bornova/ _Izmir, Turkey;and 2Ege University Faculty of Computer Engineering, Bornova/ _Izmir, Turkey
Abstract
The objective of this article is to gain reference values of lumbar and femoral neck bone mineral density (BMD)for healthy Turkish children. Three hundred forty-five children aged 2–18 years were examined. Weight and heightdevelopment were normal for age according to national growth charts. Areal BMD (aBMD) was corrected using themodel of Kroger et al (9). The results of the lumbar and femoral aBMD increased progressively from childhood toadulthood. Statistically significant correlation was found between lumbar and femoral neck aBMD and age andheight ( p ! 0.01). Lumbar volumetric (vBMD) data were similar between males and females. Femoral vBMDwas only significantly different at the ages of 8 and 16 ( p ! 0.05) in girls and boys and did not increase withage. A significant increase in aBMD L1–L4 values according to puberty was observed between all Tanner stages,except Tanner stages 3 and 4 ( p O 0.05). A significant difference was found between stages 1 and 2, and 2 and3 in femoral neck aBMD ( p ! 0.05). This data provides a tool for the investigation and follow-up of Turkishchildren at risk for low-bone mineralization.
Key Words: Areal bone mineral density (aBMD); volumetric bone mineral density (vBMD); children; adolescents.
Introduction
During childhood and adolescence, bone mineral density(BMD) increases until peak bone mass is reached. Age,weight, height, pubertal status, nutrition, physical activitylevel, and ethnicity are the factors that influence peak bonemass and BMD (1,2). Dual energy X-ray absorptiometry(DXA) is the method of choice to measure BMD allowingrapid assessment of low radiation dose with high precisionand accuracy.
In physical terms, bone mass depends on the size and thedensity of skeletal bone. It is not possible to measure truebone density by DXA because it measures only the cross-sectional area of the scanned bone. True BMD is a function
Received 03/28/05; Revised 06/21/2005; 08/10/2005; Accepted08/10/05.
*Address correspondece to: Damla Goksen, Mithatpasxa cad No1114/5, G€uzelyalı/_Izmir 35290 Turkey. E-mail: [email protected]
84
of the bone mineral content per volume of bone (3). Correc-tion of lumbar BMD for bone volume by the use of mathe-matical formulations reduces the effect of bone size duringgrowth (4). In some studies it has been shown that volumetricBMD (vBMD) remains dependent on age and bone size dur-ing growth, except prior to puberty when femoral neck vBMDis independent of age (5–9). Studies in healthy children usingquantitative computed tomography (QCT) have shown thatBMD of cortical bone is not influenced by age, anthropo-metric parameters, puberty, gender or race; however eventsduring puberty are the major determinants of the increasesin the cancellous bone density (10).
In order to assess children and adolescents who are at riskfor low bone mass, normative data based on large samples arerequired (11). Several cross-sectional studies have presentednormative data for children and adolescence, but these arelimited with small sample size, they are specific to geo-graphic areas, and they use different software programs(5,11–19).
The objective of this study was to gain BMD referencevalues for the lumbar spine and femoral neck of healthy
BMD in Pediatrics 85
Caucasian Turkish children, and to evaluate the influence ofage, nutrition, physical activity, weight, height, and pubertalstatus on these reference values. This normative BMD dataprovides information on children as young as 2 years of agethat can be used as reference values for children and adoles-cents based on age and pubertal status using the Hologic QDR4500A (Hologic, Bedford, MA) in the array mode, which willenable us to treat and follow-up these patients.
Subjects and Methods
A total of 345 Caucasian children aged 2–18 years wereexamined (i.e., 176 girls and 169 boys). The participantswere recruited from the primary and secondary schools of_Izmir, Turkey. The study protocol was approved by the ethicscommittee of the Ege University Medical Faculty. Written in-formed consent was obtained from individual participants ifthey were of legal adult age and from their parents if theywere not.
Children treated with oral corticosteroids, anticonvulsants,or heparin, or who suffered from metabolic bone disease (i.e.,those who had a bone age of more or less than 1 standarddeviation (SD) from their chronological age, disease of thekidneys or liver, diabetes mellitus, and were small for theirgestational age or were premature) were excluded from thestudy. Participants included in the study were between 10–90 percentile for height and weight according to Neyzi et al(20).
A questionnaire was administered to all subjects to deter-mine calcium and vitamin D intake, physical activity, medicalhistory, low birth weight, and age at onset of puberty. Thequestions were asked to participants or to one of the parentsif the child was less than 12 years of age. A food frequencyfor the dietary intake of calcium (Ca) was obtained fromeach participant to estimate daily Ca intake (i.e., daily milkand milk product consumption of each child was asked, andCa intake other than daily products, which is 250 mg/dayfor each child was added; Table 1) (21). Physical activityincluded physical classes and organized sports measured inmin/wk in school-age children. In preschool-age children,organized sports were accepted as physical activity.
Height was measured without shoes with a wall mountedHarpenden stadiometer (Holtain LTd., Crymych, UK).Weight was measured without shoes on a standard balancenearest to 0.1 kg. Pubertal development was evaluated ac-cording to the method of Tanner (22), and bone age accordingto Greulich and Pyle (23) by the same pediatric endocrinolo-gist in every child.
Table 1Estimated Calcium Intake From Dairy Products
Milk 8 oz 300 mgYogurt 8 oz 300 mgCheese 1 oz 200 mg
Journal of Clinical Densitometry
The BMD (gr/cm2) of the lumbar spine and femoral neckwas measured with dual energy X-ray absorptiometry(Hologic QDR 4500A Fan Beam X-ray Bone Densitometer,Hologic, Bedford, MA). During measurement of the lumbarspine, the child was supine and physiological lumbar lordosiswas flattened by elevation of the knees. For femoral neck po-sitioning, the manufacturer’s standards were used. All mea-surements were performed and analyzed by the sameperson. This measurement was an areal density that variedwith bone size. Bone volume was calculated based on the2-dimensional DXA measurements on L1–L4 and the femoralneck. To calculate vBMD of the lumbar spine and femoralneck, the mathematical model of Kroger et al (9) was used,which assumed the lumbar body and femoral neck as havinga cylindrical shape (9). The volume of the femoral neckis 5 P � (radius of femoral neck)2 � height of measuredarea in femoral neck 5 P � (area of the femoral neck fromthe scan projection 5 2r � h)2/4 height of measured area infemoral neck. So vBMD is: BMD � (4/[P � height/area]).The height of the femur neck can be obtained on the scans.Each lumbar vertebral body was approximated as a cylinder.The diameter and height of the four vertebral bodies were ob-tained from DXA scans. The bone volume of each vertebralbody is calculated as p � (diameter/2)2 � height, where thediameter of the vertebral column is area/height of the fourvertebrae, which can be obtained on the scans (9).
The SPSS version 10.0 program (SPSS Inc., Chicago, IL,USA) was used for statistical analysis. The results are givenas mean 6 SD. Two-way variance analyses were used forthe statistical analysis of aBMD and vBMD related to genderand age. The results of the two-way variance analyses showeda significant difference between age and gender, but the inter-action between age and gender factors were not statisticallysignificant, indicating that the changes between age groupswere similar between males and females. For this reasonthe variables were analyzed separately according to agegroups with one-way variance analysis. Multiple regressionanalysis was performed with the backward eliminationmethod to find the factors (i.e., puberty, height, and weight)influencing aBMD and vBMD.
Results
The aBMD of the lumbar spine (L1–L4) and femoral neckincreased with age in boys and girls. Mean aBMD of the lum-bar spine and femoral neck in boys and girls in age groups aregiven in Table 2.
Males and females in the same age groups were comparedwith two sample Student’s t-tests. Mean values of the lumbaraBMD were similar in males and females until the age of 10years, and a significant difference between the two groups atthe age of 10 years and at the ages of 12 through 14 yearswere found ( p ! 0.01). In contrast, the femoral neckaBMD of the boys was greater than the girls, but was onlystatistically significant at ages 8 and 16 years ( p ! 0.05).The Lumbar vBMD was similar in both groups until theage of 18 years ( p O 0.05). The increment was statistically
Volume 9, 2006

86 Goksen et al.
Table 2Increase of aBMD and vBMD L1–L4 According to Age in Males and Females
Females Males
aBMD vBMD aBMD vBMD
Age n Mean 6 SD Mean 6 SD n Mean 6 SD Mean 6 SD
2–2.99 12 0.432 6 0.061 0.195 6 0.038 8 0.401 6 0.046 0.170 6 0.0403–3.99 14 0.473 6 0.072 0.209 6 0.046 12 0.472 6 0.062 0.198 6 0.0414–4.99 17 0.513 6 0.055 0.224 6 0.029 12 0.498 6 0.051 0.204 6 0.0275–5.99 14 0.525 6 0.075 0.217 6 0.031 23 0.506 6 0.065 0.205 6 0.0376–6.99 15 0.520 6 0.053 0.209 6 0.026 10 0.522 6 0.053 0.197 6 0.0327–7.99 15 0.559 6 0.055 0.224 6 0.033 9 0.532 6 0.084 0.192 6 0.0378–8.99 11 0.559 6 0.052 0.217 6 0.028 8 0.543 6 0.071 0.187 6 0.0279–9.99 3 0.556 6 0.102 0.192 6 0.053 10 0.610 6 0.050 0.225 6 0.026
10–10.99 9 0.656 6 0.074 0.223 6 0.014 14 0.568 6 0.073 0.206 6 0.03311–11.99 7 0.739 6 0.126 0.251 6 0.024 9 0.660 6 0.047 0.230 6 0.02812–12.99 14 0.766 6 0.102 0.239 6 0.023 12 0.662 6 0.051 0.219 6 0.01413–13.99 12 0.818 6 0.098 0.260 6 0.032 11 0.702 6 0.114 0.206 6 0.03214–14.99 5 0.786 6 0.052 0.240 6 0.015 11 0.746 6 0.096 0.229 6 0.02615–15.99 8 0.894 6 0.141 0.273 6 0.042 11 0.861 6 0.071 0.248 6 0.02116–16.99 14 0.922 6 0.067 0.279 6 0.026 4 1.027 6 0.120 0.275 6 0.03117–18 4 0.977 6 0.083 0.298 6 0.013 5 0.919 6 0.091 0.247 6 0.023
Abbr: aBMD, areal bone mineral density; vBMD, volumetric bone mineral density; SD, standard deviation.
significant between the ages of 11 and 13 years and 15through 18 years in girls, and 13 through 18 years inboys ( p ! 0.05). Femoral vBMD was only significantly dif-ferent at the ages of 8 and 16 years ( p ! 0.05) betweengirls and boys and did not increase with age (r 5 20.04and 20.16 in girls and boys, respectively). Mean vBMDof the lumbar spine and femoral neck in boys and girlsare given in Table 3.
Because the variations according to age for males andfemales were not similar for lumbar aBMD, different regres-sion models were performed for boys (i.e., predicted BMD,L1–L4 5 0.455 1 0.0018 � age2, R2 5 % 81,6; p 5 0.00)and girls (i.e., predicted BMD, L1–L4 5 0.3157 1 [0.0562� age] – [0.054 � age2] 1 [0.003 � age3, R2 5 % 76,6;p 5 0.00]). Because the interaction was not significant be-tween gender and age in areal femur neck BMD, one regres-sion model was performed for both males and females (i.e.,predicted femur neck 5 0.407 1 0.023 � age, R2 5 % 67,2; p 5 0.00).
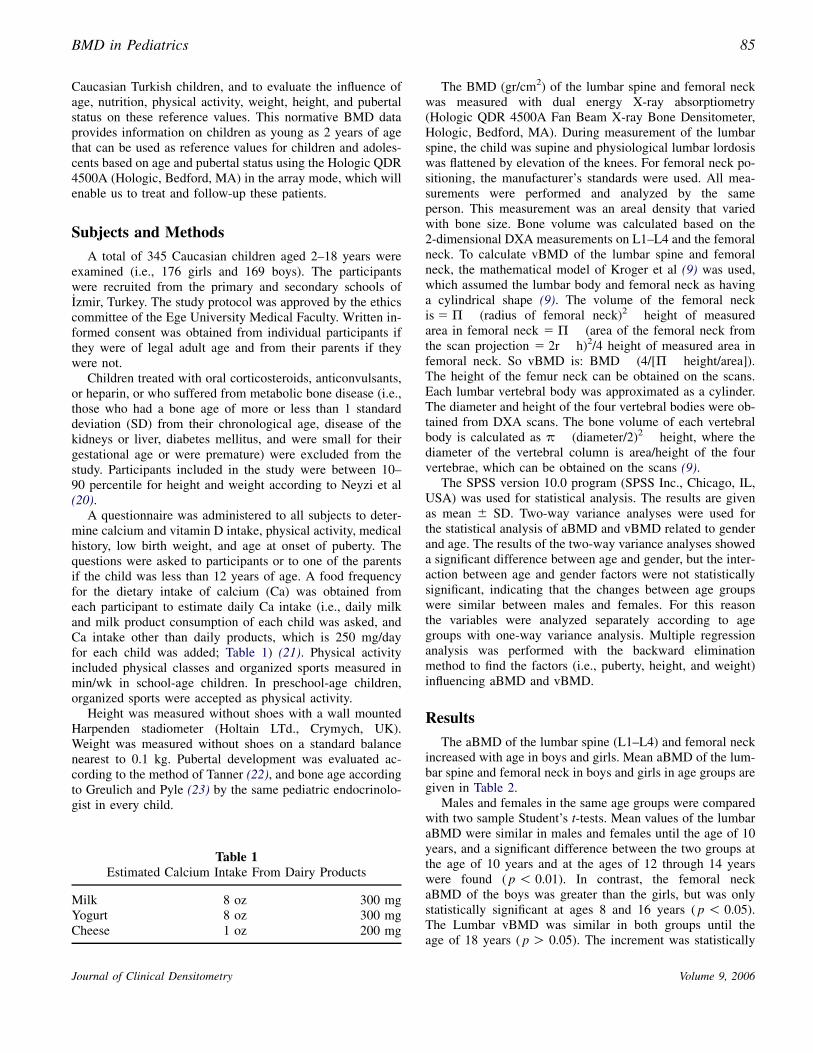
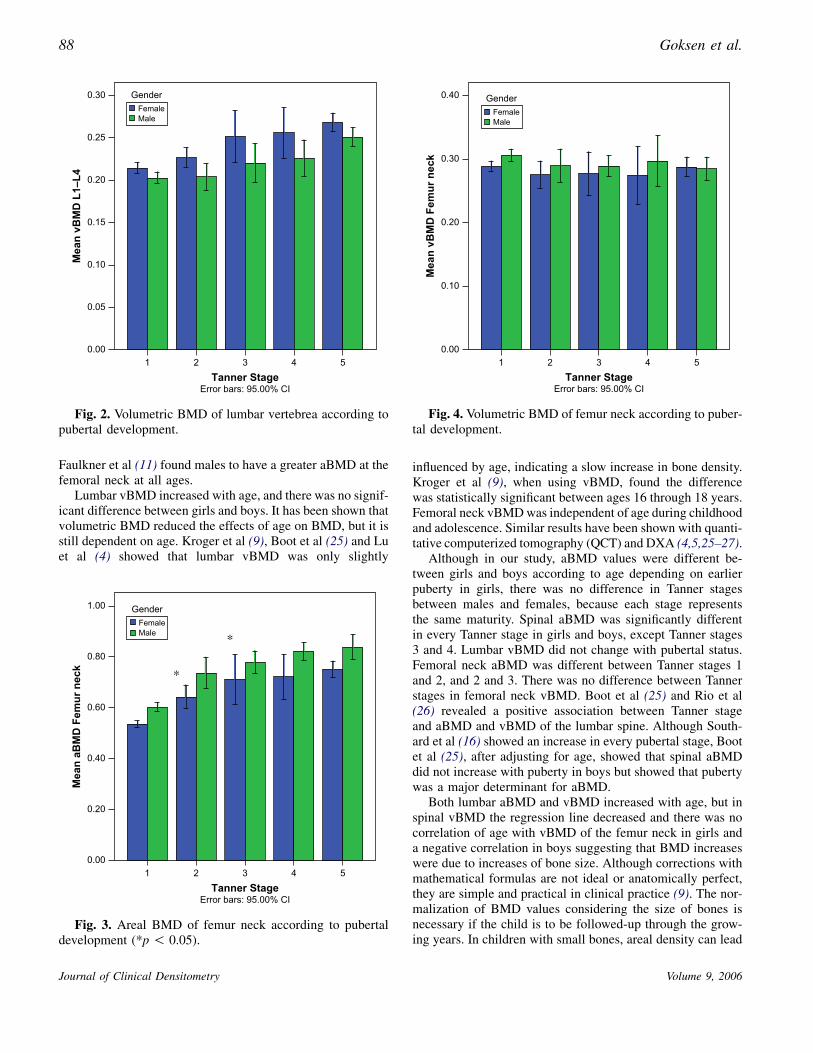
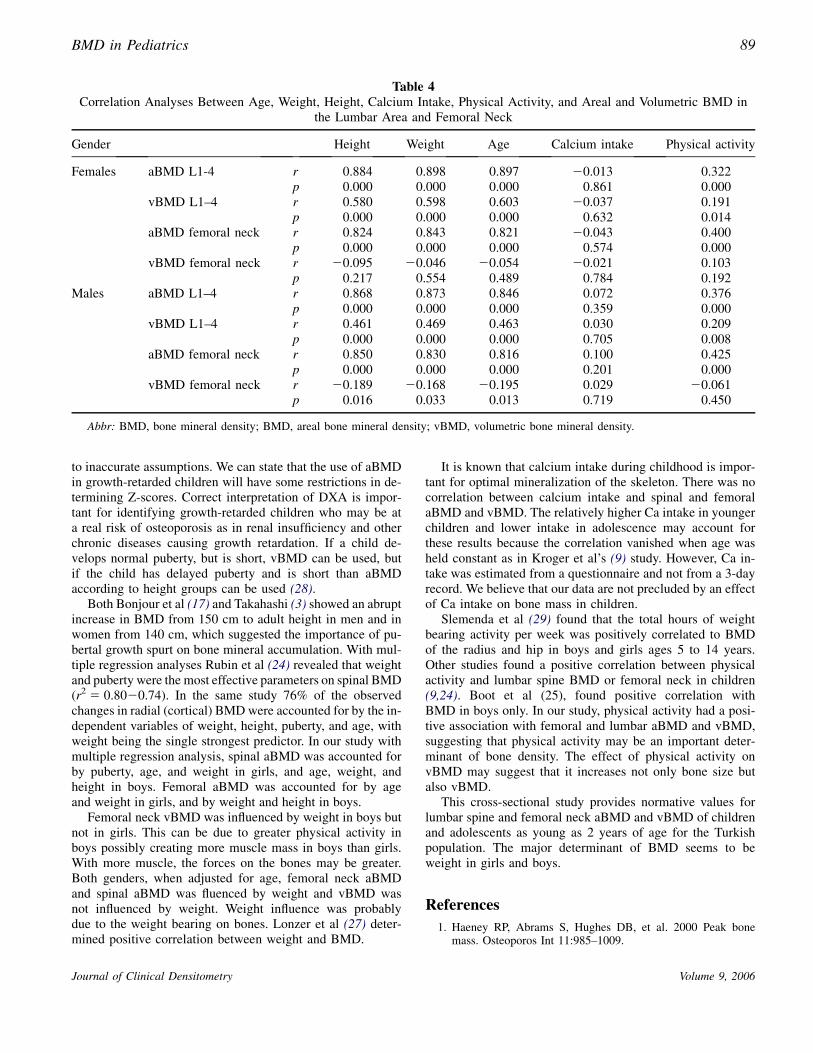
Figures 1–4 show aBMD and vBMD of lumbar vertebraeand the femoral neck according to pubertal development. Inboth sexes, increase in aBMD L1–L4 values according topubertal status were significant except aBMD did not differbetween Tanner stage 3 and stage 4 ( p O 0.05). There wasno difference in L1–L4 aBMD between males and femalesaccording to pubertal status. A significant difference wasfound between stages 1 and 2, and 2 and 3 in femoral neckaBMD ( p ! 0.05). Lumbar and femoral vBMD did notchange with pubertal status as indicated by Tanner in eitherthe males or the females.
Journal of Clinical Densitometry
Lumbar and femoral aBMD and lumbar vBMD showedpositive correlation with age, height, weight, and physical ac-tivity in both females and males. Femoral neck vBMDshowed no correlation with age, height, and weight in femalesand showed a negative correlation with age, height, andweight in males. Correlation coefficients decreased in spinevBMD, and the significance disappeared in femoral neckvBMD (Table 4).
As age and growth variables are codependent for aBMD,the relationship among these was examined using multiple re-gression tests with the backward elimination method. Withmultiple regression analysis, we revealed that approximately85% of the observed changes in lumbar aBMD were ac-counted for by puberty, age, and weight in girls (i.e., pre-dicted L1–L4 aBMD 5 20.021 1 0.0208 � puberty 1
0.000341 � age(3) 1 0.39 � weight[log]). As much as 82%of variation was explained by age, weight, and height inboys (i.e., predicted L1–L4 aBMD 5 2.923–0.066 � age 1
0.0011 � age(3) 1 0.771 � age[log] 21.87 � height[log] 1
0.901 � weight[log]). Forty percent of the changes in lumbarvBMD were accounted for by age and weight in girls (i.e.,predicted L1–L4 vBMD 5 20.0520.007 � age 2 0.005 �weight 1 0.000026 � age(3) 1 0.27 � weight[log]), and by28%–30% by age, weight, and height in males (i.e., predictedL1–L4 vBMD 5 1.9420.02 � age 20.004 � weight 1 0.3� age[log] 1 21.2 � height[log] 1 0.53 � weight[log]).
Median calcium (Ca) intake of the children according toage groups 2–3.99, 4–7.99, and 8–18 years were 975 (range,250–2,250), 850 (range, 250–1,650), 850 (range, 250–1,850)mg/d, respectively.
Volume 9, 2006

BMD in Pediatrics 87
Table 3Increase of Areal and Volumetric Femoral Neck BMD According to Age in Males and Females
Females Males
aBMD vBMD aBMD vBMD
Age n Mean 6 SD Mean 6 SDS n Mean 6 SD Mean 6 SDS
2–2.99 11 0.460 6 0.055 0.295 6 0.060 7 0.455 6 0.059 0.272 6 0.0463–3.99 11 0.503 6 0.049 0.299 6 0.046 11 0.554 6 0.111 0.331 6 0.0654–4.99 17 0.511 6 0.043 0.298 6 0.031 12 0.563 6 0.050 0.314 6 0.0465–5.99 14 0.532 6 0.068 0.287 6 0.043 23 0.547 6 0.067 0.296 6 0.0496–6.99 15 0.558 6 0.059 0.290 6 0.038 10 0.576 6 0.051 0.310 6 0.0367–7.99 15 0.571 6 0.052 0.286 6 0.044 9 0.651 6 0.080 0.319 6 0.0408–8.99 11 0.578 6 0.053 0.286 6 0.034 8 0.647 6 0.056 0.310 6 0.0359–9.99 3 0.637 6 0.023 0.292 6 0.032 10 0.722 6 0.054 0.348 6 0.036
10–10.99 9 0.628 6 0.088 0.275 6 0.036 14 0.672 6 0.064 0.293 6 0.03911–11.99 7 0.655 6 0.103 0.258 6 0.030 9 0.702 6 0.056 0.286 6 0.02712–12.99 14 0.723 6 0.101 0.284 6 0.047 12 0.732 6 0.060 0.310 6 0.03813–13.99 12 0.673 6 0.077 0.265 6 0.041 11 0.793 6 0.110 0.280 6 0.02314–14.99 5 0.714 6 0.090 0.271 6 0.044 11 0.785 6 0.074 0.277 6 0.02415–15.99 8 0.806 6 0.109 0.313 6 0.039 11 0.830 6 0.101 0.291 6 0.04816–16.99 14 0.756 6 0.071 0.281 6 0.040 4 0.913 6 0.135 0.295 6 0.03917–18 4 0.851 6 0.097 0.345 6 0.035 5 0.841 6 0.092 0.258 6 0.017
Abbr: BMD, bone mineral density; aBMD, areal bone mineral density; vBMD, volumetric bone mineral density; SD, standard deviation;SDS, Standard deviation score.
There was a significant difference between boys and girlsregarding duration of physical activity (91.7 6 198.7 vs45.5 6 121.7 min/wk, respectively; p ! 0.05). There wereno correlations between femoral vBMD and physical activity
54321Tanner Stage
Error bars: 95.00% CI
1.00
0.80
0.60
0.40
0.20
0.00
Mean
aB
MD
L
1–L
4
MaleFemale
Gender*
*
*
Fig. 1. Areal BMD of lumbar vertebrea according topubertal development (*p ! 0.05).
Journal of Clinical Densitometry
in either boys or girls, and no correlations between any of theoutcome measures and Ca intake.
Discussion
The DXA of the lumbar vertebrae and femoral neck isuseful in the measurement of BMD in children because ofits accuracy, low radiation dose, short scan time, and easeof examination without sedation. Age, weight, height, puber-tal status, nutrition, physical activity, genetics, and ethnicityare the factors that influence peak bone mass and BMD (1,2).
In this study, lumbar BMD started to increase at the age of 2but showed a steeper increase from the age of 10 years in girlsand 14 years in boys. Lumbar aBMD showed a significant dif-ference between girls and boys at ages 10 through 14 years.This suggests the rapid development of spinal bone mass ingirls indicating earlier onset of puberty in girls than in boys.Kroger et al (9) showed the same increase after the age of10 years in girls and 12 years in boys. Rubin et al (24) showedthat the increase started at the age of 10 years until the age of15 years in girls and from the age of 13 to 17 years in boys.
The increase in femoral neck aBMD in girls and boys waslinear as in the study of Kroger et al (9). This could be due tothe increased cortical bone in the femoral neck. The Femoralneck aBMD showed linear increase in both genders until theage of 11. After this age, similar to the studies of Faulkner etal (11) and Bonjour et al (17), the increase in males was dom-inant but not significant. A significant difference was found atthe age of 8 and 16 years between boys and girls, respectively.
Volume 9, 2006
88 Goksen et al.
Faulkner et al (11) found males to have a greater aBMD at thefemoral neck at all ages.
Lumbar vBMD increased with age, and there was no signif-icant difference between girls and boys. It has been shown thatvolumetric BMD reduced the effects of age on BMD, but it isstill dependent on age. Kroger et al (9), Boot et al (25) and Luet al (4) showed that lumbar vBMD was only slightly
54321Tanner Stage
Error bars: 95.00% CI
0.30
0.25
0.20
0.15
0.10
0.05
0.00
Mean
vB
MD
L
1–L
4
MaleFemale
Gender
Fig. 2. Volumetric BMD of lumbar vertebrea according topubertal development.
54321Tanner Stage
Error bars: 95.00% CI
1.00
0.80
0.60
0.40
0.20
0.00
Mean
aB
MD
F
em
ur n
eck
*
*
MaleFemale
Gender
Fig. 3. Areal BMD of femur neck according to pubertaldevelopment (*p ! 0.05).
Journal of Clinical Densitometry
influenced by age, indicating a slow increase in bone density.Kroger et al (9), when using vBMD, found the differencewas statistically significant between ages 16 through 18 years.Femoral neck vBMD was independent of age during childhoodand adolescence. Similar results have been shown with quanti-tative computerized tomography (QCT) and DXA (4,5,25–27).
Although in our study, aBMD values were different be-tween girls and boys according to age depending on earlierpuberty in girls, there was no difference in Tanner stagesbetween males and females, because each stage representsthe same maturity. Spinal aBMD was significantly differentin every Tanner stage in girls and boys, except Tanner stages3 and 4. Lumbar vBMD did not change with pubertal status.Femoral neck aBMD was different between Tanner stages 1and 2, and 2 and 3. There was no difference between Tannerstages in femoral neck vBMD. Boot et al (25) and Rio et al(26) revealed a positive association between Tanner stageand aBMD and vBMD of the lumbar spine. Although South-ard et al (16) showed an increase in every pubertal stage, Bootet al (25), after adjusting for age, showed that spinal aBMDdid not increase with puberty in boys but showed that pubertywas a major determinant for aBMD.
Both lumbar aBMD and vBMD increased with age, but inspinal vBMD the regression line decreased and there was nocorrelation of age with vBMD of the femur neck in girls anda negative correlation in boys suggesting that BMD increaseswere due to increases of bone size. Although corrections withmathematical formulas are not ideal or anatomically perfect,they are simple and practical in clinical practice (9). The nor-malization of BMD values considering the size of bones isnecessary if the child is to be followed-up through the grow-ing years. In children with small bones, areal density can lead
54321Tanner Stage
Error bars: 95.00% CI
0.40
0.30
0.20
0.10
0.00
Mean
vB
MD
F
em
ur n
eck
MaleFemale
Gender
Fig. 4. Volumetric BMD of femur neck according to puber-tal development.
Volume 9, 2006
BMD in Pediatrics 89
Table 4Correlation Analyses Between Age, Weight, Height, Calcium Intake, Physical Activity, and Areal and Volumetric BMD in
the Lumbar Area and Femoral Neck
Gender Height Weight Age Calcium intake Physical activity
Females aBMD L1-4 r 0.884 0.898 0.897 20.013 0.322p 0.000 0.000 0.000 0.861 0.000
vBMD L1–4 r 0.580 0.598 0.603 20.037 0.191p 0.000 0.000 0.000 0.632 0.014
aBMD femoral neck r 0.824 0.843 0.821 20.043 0.400p 0.000 0.000 0.000 0.574 0.000
vBMD femoral neck r 20.095 20.046 20.054 20.021 0.103p 0.217 0.554 0.489 0.784 0.192
Males aBMD L1–4 r 0.868 0.873 0.846 0.072 0.376p 0.000 0.000 0.000 0.359 0.000
vBMD L1–4 r 0.461 0.469 0.463 0.030 0.209p 0.000 0.000 0.000 0.705 0.008
aBMD femoral neck r 0.850 0.830 0.816 0.100 0.425p 0.000 0.000 0.000 0.201 0.000
vBMD femoral neck r 20.189 20.168 20.195 0.029 20.061p 0.016 0.033 0.013 0.719 0.450
Abbr: BMD, bone mineral density; BMD, areal bone mineral density; vBMD, volumetric bone mineral density.
to inaccurate assumptions. We can state that the use of aBMDin growth-retarded children will have some restrictions in de-termining Z-scores. Correct interpretation of DXA is impor-tant for identifying growth-retarded children who may be ata real risk of osteoporosis as in renal insufficiency and otherchronic diseases causing growth retardation. If a child de-velops normal puberty, but is short, vBMD can be used, butif the child has delayed puberty and is short than aBMDaccording to height groups can be used (28).
Both Bonjour et al (17) and Takahashi (3) showed an abruptincrease in BMD from 150 cm to adult height in men and inwomen from 140 cm, which suggested the importance of pu-bertal growth spurt on bone mineral accumulation. With mul-tiple regression analyses Rubin et al (24) revealed that weightand puberty were the most effective parameters on spinal BMD(r2 5 0.8020.74). In the same study 76% of the observedchanges in radial (cortical) BMD were accounted for by the in-dependent variables of weight, height, puberty, and age, withweight being the single strongest predictor. In our study withmultiple regression analysis, spinal aBMD was accounted forby puberty, age, and weight in girls, and age, weight, andheight in boys. Femoral aBMD was accounted for by ageand weight in girls, and by weight and height in boys.
Femoral neck vBMD was influenced by weight in boys butnot in girls. This can be due to greater physical activity inboys possibly creating more muscle mass in boys than girls.With more muscle, the forces on the bones may be greater.Both genders, when adjusted for age, femoral neck aBMDand spinal aBMD was fluenced by weight and vBMD wasnot influenced by weight. Weight influence was probablydue to the weight bearing on bones. Lonzer et al (27) deter-mined positive correlation between weight and BMD.
Journal of Clinical Densitometry
It is known that calcium intake during childhood is impor-tant for optimal mineralization of the skeleton. There was nocorrelation between calcium intake and spinal and femoralaBMD and vBMD. The relatively higher Ca intake in youngerchildren and lower intake in adolescence may account forthese results because the correlation vanished when age washeld constant as in Kroger et al’s (9) study. However, Ca in-take was estimated from a questionnaire and not from a 3-dayrecord. We believe that our data are not precluded by an effectof Ca intake on bone mass in children.
Slemenda et al (29) found that the total hours of weightbearing activity per week was positively correlated to BMDof the radius and hip in boys and girls ages 5 to 14 years.Other studies found a positive correlation between physicalactivity and lumbar spine BMD or femoral neck in children(9,24). Boot et al (25), found positive correlation withBMD in boys only. In our study, physical activity had a posi-tive association with femoral and lumbar aBMD and vBMD,suggesting that physical activity may be an important deter-minant of bone density. The effect of physical activity onvBMD may suggest that it increases not only bone size butalso vBMD.
This cross-sectional study provides normative values forlumbar spine and femoral neck aBMD and vBMD of childrenand adolescents as young as 2 years of age for the Turkishpopulation. The major determinant of BMD seems to beweight in girls and boys.
References
1. Haeney RP, Abrams S, Hughes DB, et al. 2000 Peak bonemass. Osteoporos Int 11:985–1009.
Volume 9, 2006
90 Goksen et al.
2. Eastell R, Lambert H. 2002 Diet and healthy bones. CalcifTissue Int 70(5):400–404.
3. Takahashi Y, Minamitani K, Kobayashi Y, Minagawa M,Yasuda T, Niimi H. 1996 Spinal and femoral bone mass accu-mulation during normal adolescence:comparision with femalepatients with sexual precocity and with hypogonodism. J ClinEndocrinol Metab 81:1248–1253.
4. Lu PW, Cowell CT, Lloyd-Jones SA, Briody JN, HowmanGiles R. 1996 Volumetric bone mineral density in normalsubjects, aged 5-27 years. J Clin Endocrinol Metab 81:1586–1590.
5. Boroncelli GI, Saggase G. 2000 Critical age and stages of pu-berty in the accumulation of spinal and femoral bone mass: Thevalidity of bone mass measurements. Horm Res 54(Suppl 1):2–8.
6. Schonau E. 1998 Problems of bone analyses in childhood andadolescence. Pediatr Nehprol 12:420–429.
7. Compston JE. 1995 Bone Density: BMC, BMD, or correctedBMD? Bone 16(1):5–7.
8. Warner JT, Cowan FJ, Dunstan FDJ, Evans WD, Webb DKH,Gregory JW. 1998 Measured and predicted bone mineral con-tent in healthy boys and girls aged 6-18 years: adjustment forbody size and puberty. Acta Pediatr 87:244–249.
9. Kroger H, Kotaniemi A, Vainio P, Alhava E. 1992 Bone densi-tometry of the spine and femur in children by dual energy x rayabsorptiometry. Bone and Mineral 17:75–82.
10. Gilsanz V. 1998 Bone density in children: review of the avail-able techniques and indications. European J of Radiology 26:177–182.
11. Faulkner RA, Bailey DA, Drinkwater DT, McKay HA,Arnold C, Wilkonson AA. 1996 Bone Densitometry in Cana-dian children 8-17 years of age. Calcif Tissue Int 59:344–351.
12. Sabatier JP, Souquieres G, Benmalk A, Marcelli C. 1999 Evol-uation of lumbar bone mineral content during adolescence andadulthood: a longitudinal study in 395 healthy females 10-24years of age and 206 premenopausal women. OsteoporosisInt 9:476–482.
13. Lu PW, Briody JN, Ogle GD, et al. 1994 Bone Mineral Densityof total body spine and femoral neck in children and youngadults: a cross sectional and longitudinal study. J Bone MierRes 9:1451–1458.
14. Glastre C, Braillon P, David L, Cochat P, Meunier PJ,Delmas PD. 1990 Measurement of bone mineral content oflumbar spine by dual energy x-ray absorptiometry in normalchildren: correlations with growth parameters. J Clin Endocri-nol Metab 70:1330–1333.
15. Bachrach L. 2001 Acquisition of optimal bone mass in child-hood and adolescence. Trends Endocrinol and Metab 12(1):22–28.
Journal of Clinical Densitometry
16. Southard RN, Morris JD, Mahan JD, Hayes JR, Torch MA,Sommer A, Zipf W. 1991 Bone mass in healthy children: mea-surement with quantitative DEXA. Radiology 179:735–738.
17. Bonjour JP, Theintz G, Buchs B, Slosman D, Rizzoli R. 1991Critical years and stages of puberty for spinal and bone massaccumulation during adolescence. J Clin Endocrinol Metab73:555–563.
18. Arabi A, Nabulsi M, Maalouf J, Choucair M, Khalife H, Vieth R,El-Hajj Fuleihan G. 2004 Bone mineral density by age, gender,pubertal stages, and socioeconomic status in healthy Lebanesechildren and adolescents. Bone 35(5):1169–1179.
19. del Rio L, Carrascosa A, Pons F, Gusinye M, Yeste D,Domenech FM. 1994 Bone mineral density of the lumbar spinein white Mediterranean Spanish children and adolescents:changes related to age, sex, and puberty. Pediatr Res 35(3):362–366.
20. Neyzi O, Yalcındag A, Alp H. 1973 Heights and weights ofTurkish children. J Trop Pediatr Environ Child Health 19(1):5–13.
21. Physician’s guide to prevention and treatment of osteoporosis.Developed by the National Osteoporosis Foundation, 1997.www.nof.org/physguide/univeral_recommandations.htm.
22. Tanner JM. 1973 Recording adolescent physical changes: Tan-ner system. Del Med J 45(3):84–88.
23. Greulich WW, Pyle SI. 1958 Radiographic atlas of skeletal de-volepment of the hand and wrist, 2nd ed. Stanford: StanfordUniversity Press.
24. Rubin K, Schirduan V, Gendrau P, Sarfarazi M, Mendeola R,Dalsky G. 1993 Predictors of axial and peripheral bone mineraldensity in healthy children and adolescents, with special atten-tion to the role of puberty. J Pediatr 123:863–870.
25. Boot AM, Ridder MA, Pols HA, Krenning PE, KeizerSchrama SM. 1997 Bone mineral density in children andadolescence: relation to puberty, calcium intake and physicalactivity. J Clin Endocrinol Metab 82:57–62.
26. Rio L, Carrascosa A, Pons F, Gusinye M, Yeste D, Domenech M.1994 Bone mineral density of the lumbar spine in white mediter-ranean Spanish children and adolescence: changes related to age,sex and puberty. Pediatr Res 35:362–366.
27. Lonzer MD, Imrie R, Rogers D, Worley D, Licata A, Secic M.2005 Effects of heredity, age, weight, puberty, activity andcalcium intake on bone mineral density in children. ClinicalPediatrics 35(4):464–469.
28. Goksen D, Darcan S, Kara P, Mir S, Coker M, Kabasakal C.2005 Bone mineral density in pediatric and adolescent renaltransplant patients. How to evaluate? Pediatr Transplant 9(4):464–469.
29. Slemenda CW, Miller JZ, Hui SL, Reister TK, Johnston CC.1991 Role of physical activity in the development of skeletalmass in children. J Bone Miner Res 6:1227–1233.
Volume 9, 2006
Related Documents


![Turkish Van Cat and Turkish Angora Cat: A Revie · Turkish Van Cat and Turkish Angora Cat: A Review 156 Fig. 6 Some morphological properties of Turkish Angora cat [15]. Table 2 Turkish](https://static.cupdf.com/doc/110x72/5f0387937e708231d40981f4/turkish-van-cat-and-turkish-angora-cat-a-turkish-van-cat-and-turkish-angora-cat.jpg)
