Bond University Research Repository Promoting quality use of medicines in South-East Asia Holloway, Kathleen Anne; Kotwani, Anita; Batmanabane, Gitanjali; Santoso, Budiono; Ratanawijitrasin, Sauwakon; Henry, David Published in: BMC Health Services Research DOI: 10.1186/s12913-018-3333-1 10.1186/s12913-018-3333-1 Published: 05/07/2018 Document Version: Publisher's PDF, also known as Version of record Link to publication in Bond University research repository. Recommended citation(APA): Holloway, K. A., Kotwani, A., Batmanabane, G., Santoso, B., Ratanawijitrasin, S., & Henry, D. (2018). Promoting quality use of medicines in South-East Asia: Reports from country situational analyses. BMC Health Services Research, 18(1), 526. [526]. https://doi.org/10.1186/s12913-018-3333-1, https://doi.org/10.1186/s12913-018- 3333-1 General rights Copyright and moral rights for the publications made accessible in the public portal are retained by the authors and/or other copyright owners and it is a condition of accessing publications that users recognise and abide by the legal requirements associated with these rights. For more information, or if you believe that this document breaches copyright, please contact the Bond University research repository coordinator. Download date: 11 Jul 2019

Welcome message from author
This document is posted to help you gain knowledge. Please leave a comment to let me know what you think about it! Share it to your friends and learn new things together.
Transcript

Bond UniversityResearch Repository
Promoting quality use of medicines in South-East AsiaHolloway, Kathleen Anne; Kotwani, Anita; Batmanabane, Gitanjali; Santoso, Budiono;Ratanawijitrasin, Sauwakon; Henry, DavidPublished in:BMC Health Services Research
DOI:10.1186/s12913-018-3333-110.1186/s12913-018-3333-1
Published: 05/07/2018
Document Version:Publisher's PDF, also known as Version of record
Link to publication in Bond University research repository.
Recommended citation(APA):Holloway, K. A., Kotwani, A., Batmanabane, G., Santoso, B., Ratanawijitrasin, S., & Henry, D. (2018). Promotingquality use of medicines in South-East Asia: Reports from country situational analyses. BMC Health ServicesResearch, 18(1), 526. [526]. https://doi.org/10.1186/s12913-018-3333-1, https://doi.org/10.1186/s12913-018-3333-1
General rightsCopyright and moral rights for the publications made accessible in the public portal are retained by the authors and/or other copyright ownersand it is a condition of accessing publications that users recognise and abide by the legal requirements associated with these rights.
For more information, or if you believe that this document breaches copyright, please contact the Bond University research repositorycoordinator.
Download date: 11 Jul 2019

RESEARCH ARTICLE Open Access
Promoting quality use of medicines inSouth-East Asia: reports from countrysituational analysesKathleen Anne Holloway1,2* , Anita Kotwani3, Gitanjali Batmanabane4, Budiono Santoso5,Sauwakon Ratanawijitrasin6 and David Henry7,8
Abstract
Background: Irrational use of medicines is widespread in the South-East Asia Region (SEAR), where policy implementationto encourage quality use of medicines (QUM) is often low. The aim was to determine whether public-sector QUM is betterin SEAR countries implementing essential medicines (EM) policies than in those not implementing them.
Methods: Data on six QUM indicators and 25 EM policies were extracted from situational analysis reports of 20country (2-week) visits made during 2010–2015. The average difference (as percent) for the QUM indicatorsbetween countries implementing versus not implementing specific policies was calculated. Policies associatedwith better (> 1%) QUM were included in regression of a composite QUM score versus total number of policiesimplemented.
Results: Twenty-two policies were associated with better (> 1%) QUM. Twelve policies were associated with 3.6–9.5% significantly better use (p < 0.05), namely: standard treatment guidelines; formulary; a government unit topromote QUM; continuing health worker education on prescribing by government; limiting over-the-counter(OTC) availability of systemic antibiotics; disallowing public-sector prescriber revenue from medicines sales; notcharging fees at the point of care; monitoring advertisements of OTC medicines; public education on QUM; and agood drug supply system. There was significant correlation between the number of policies implemented out of22 and the composite QUM score (r = 0.71, r2 = 0.50, p < 0.05).
Conclusions: Country situational analyses allowed rapid data collection that showed EM policies are associatedwith better QUM. SEAR countries should implement all such policies.
Keywords: South-East Asia, Quality use of medicines, Essential medicines policy
BackgroundInappropriate (irrational, incorrect, improper, poor qual-ity) use of medicines is a serious public health problemworld-wide [1–5] that wastes resources and may resultin treatment failure and avoidable adverse drug events,including antimicrobial resistance [6–8], hospitalisationand death [9–11]. The World Health Organisation(WHO) has been promoting the concept of essentialmedicines and a range of policies to promote betterquality (rational) use of medicines (QUM) for many
years [12, 13]. The extent to which countries, includingmany in South-East Asia, monitor use or implementthese recommended policies vary greatly [14, 15]. A re-view of interventions to promote better QUM in lowand middle-income countries found that relatively fewhad been implemented and that most were small scaleof short duration with small or modest effect [4, 5].Analysis of secondary data on public-sector medicines
use in primary care (from WHO’s database of medicinesuse surveys) and policy implementation as reported byMinistries of Health (MOH) (from questionnaires sentto Ministries of Health by WHO) showed that many es-sential medicines policies are associated with betterQUM and that the more policies are implemented the
* Correspondence: [email protected] Institute of Health Management Research, Jaipur, India2Institute of Development Studies, University of Sussex, Brighton BN1 9RE, UKFull list of author information is available at the end of the article
© The Author(s). 2018 Open Access This article is distributed under the terms of the Creative Commons Attribution 4.0International License (http://creativecommons.org/licenses/by/4.0/), which permits unrestricted use, distribution, andreproduction in any medium, provided you give appropriate credit to the original author(s) and the source, provide a link tothe Creative Commons license, and indicate if changes were made. The Creative Commons Public Domain Dedication waiver(http://creativecommons.org/publicdomain/zero/1.0/) applies to the data made available in this article, unless otherwise stated.
Holloway et al. BMC Health Services Research (2018) 18:526 https://doi.org/10.1186/s12913-018-3333-1

better the use [16, 17]. Policies most strongly associatedwith QUM were: undergraduate training of doctors andnurses in standard treatment guidelines, the ministry ofhealth having a unit promoting QUM, and provision ofessential medicines free at point of care to all patients[16, 17].The need for an integrated health systems approach,
incorporating regular monitoring of medicines use andthe sustainable implementation of multiple policies haslong been recognised [18, 19]. However, development ofsuch an approach remains elusive in many low andmiddle-income countries, where data are scant, infra-structure is lacking and responsibility for medicinesmanagement often falls between different departmentswith no clear accountability [20].Since 2010 South-East Asian countries of the WHO
have been undertaking 4-yearly rapid situational analysesof how medicines are used and managed with a view todeveloping a more integrated, coordinated health sys-tems approach to promoting better QUM [21]. Thisprocess consists of rapid systematic data collection onmedicines use and policy implementation by a multi-disciplinary government team of four to eight peopleover 2 weeks using a predesigned workbook tool andending with a national workshop to identify prioritiesfor action [21]. During 2010–2015, all 11 jurisdictions(all South-East Asia countries including two IndianStates) had conducted at least one situational analysis;eight had conducted two situational analyses sepa-rated by a period of 4 years; and the reports pub-lished on the WHO’s South-East Asia Regional Office(SEARO) website after government approval [21].The aim of this paper was to investigate associations
between the adoption (implementation or partial imple-mentation) of national policies intended to improveQUM and patterns of medicine use in WHO South-EastAsian countries. The analysis relies on data on medi-cines use in public-sector primary care, and policy im-plementation, extracted from the country situationalanalysis reports [21]. Specific objectives were to establishfor the WHO South-East Asia region:
1. which policies are associated with better QUM,2. whether the implementation of more policies is
associated with better QUM, and3. whether there was any improvement in policy
implementation and QUM in countries that hadundertaken two situational analyses.
MethodsThe country reports of the situational analyses publishedon the website of the WHO Regional Office forSouth-East Asia (WHO/SEARO) [21] were reviewed anddata extracted on QUM in public-sector primary care
and the implementation of policies to encourage appro-priate use. The methods for conducting country situ-ational analyses have been described elsewhere [21,22] and are summarised in Table 1. Briefly, data onpolicy implementation was collected by interviews ofhealth staff and observation, and data on QUM byprescription survey following the International Net-work for the Rational Use of Drugs (INRUD)/WHOmethodology [23, 24] at all the health facilities visited.The methods used to analyse the extracted datafollowed similar methods used by first author inanalysing global data and are described elsewhere [16,17] and summarised below.A dataset was created (Additional file 1) consisting of
six standard QUM indicators [16, 17] and indicators forimplementation of 25 policies hypothesised to influence
Table 1 Summary of methods used in a country situationalanalysis
Background
Development of the situational analysis approach in South-East Asiawas requested by Member States [38, 39] and involves the systematiccollection of data by a government multi-disciplinary team over 2weeks using a pre-designed workbook tool [21] and supervised byWHO. The workbook tool (Additional file 2) builds on other tools[14, 23, 24] and was developed by WHO/SEARO during situationalanalyses done in 11 countries during 2010–13 and piloted for use bygovernment staff in eight countries during 2014–15.
Methods
Visits are made to:• all major MOH units and other agencies responsible for medicinesmanagement (supply, selection, use, regulation, policy, insuranceand professional training) to understand what policies are in placeand what each unit does.
• healthcare facilities, aiming to visit 20 facilities, two of each type ofpublic facility (primary care centres and sub-centres, secondary andtertiary hospitals, with half of the facilities being primary carecentres) plus private pharmacies (results not reported in this paper)in at least two provinces/regions, as selected by the MOH.
Data collection and Analysis
At the central level, staff are interviewed about the health system,what their unit does and what policies are in place.At each health facility (whether hospital or health centre), the teamreviews 30 primary care outpatient encounters (using whateverdocumentation is available at the facility, e.g. prescriptions held in thepharmacy or by the patient, paper slips in the pharmacy, patientrecords, or outpatient registers). The means for standard indicators ofmedicines use [23, 24] are calculated for each facility and eachcategory of facility. Also, antibiotic use in 30 outpatient cases of upperrespiratory tract infection is reviewed, although this is difficult in somecountries where diagnosis is not recorded on the prescription. Thebasis for a diagnosis of upper respiratory tract infection is alsorecorded e.g. acute viral respiratory infection, pharyngitis, sore throat,rhinitis, runny nose, cough, cold, otitis media, earache, sinusitis, acutelaryngitis and acute bronchitis.The medicines’ supply and regulatory systems are also reviewed andhealth workers interviewed about medicine management policyimplementation.A descriptive analysis is done each day and presented by the team ata national workshop at the end of 2 weeks, and a country reportpublished on the WHO/SEARO website after government approval[21, 38].
Holloway et al. BMC Health Services Research (2018) 18:526 Page 2 of 16
medicines use [14–17], derived from data collected dur-ing 20 country situational analysis visits. Since differentprovinces or regions and different healthcare facilitieswere visited in the countries where two situational ana-lyses were done, and the visits were separated by 3–5 years (during which time the implementation of somepolicies changed), these situational analyses were treatedas separate records (country-year jurisdictions) in thedataset.The QUM indicators (described in Table 2, together
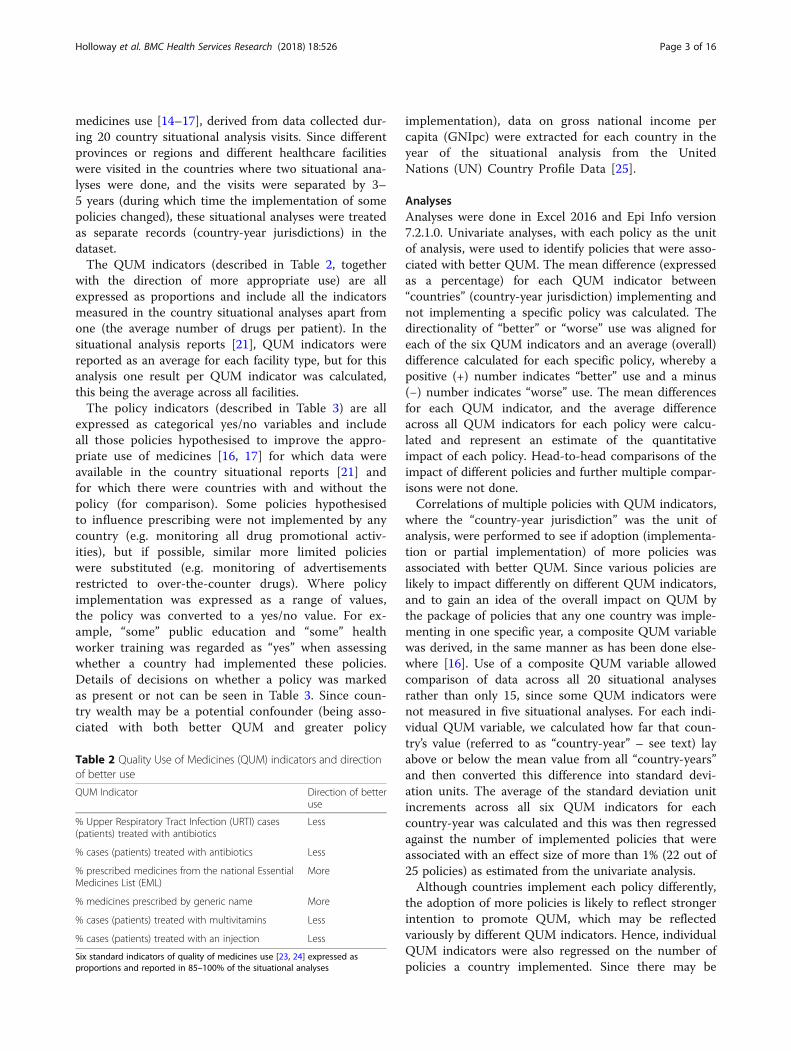
with the direction of more appropriate use) are allexpressed as proportions and include all the indicatorsmeasured in the country situational analyses apart fromone (the average number of drugs per patient). In thesituational analysis reports [21], QUM indicators werereported as an average for each facility type, but for thisanalysis one result per QUM indicator was calculated,this being the average across all facilities.The policy indicators (described in Table 3) are all
expressed as categorical yes/no variables and includeall those policies hypothesised to improve the appro-priate use of medicines [16, 17] for which data wereavailable in the country situational reports [21] andfor which there were countries with and without thepolicy (for comparison). Some policies hypothesisedto influence prescribing were not implemented by anycountry (e.g. monitoring all drug promotional activ-ities), but if possible, similar more limited policieswere substituted (e.g. monitoring of advertisementsrestricted to over-the-counter drugs). Where policyimplementation was expressed as a range of values,the policy was converted to a yes/no value. For ex-ample, “some” public education and “some” healthworker training was regarded as “yes” when assessingwhether a country had implemented these policies.Details of decisions on whether a policy was markedas present or not can be seen in Table 3. Since coun-try wealth may be a potential confounder (being asso-ciated with both better QUM and greater policy
implementation), data on gross national income percapita (GNIpc) were extracted for each country in theyear of the situational analysis from the UnitedNations (UN) Country Profile Data [25].
AnalysesAnalyses were done in Excel 2016 and Epi Info version7.2.1.0. Univariate analyses, with each policy as the unitof analysis, were used to identify policies that were asso-ciated with better QUM. The mean difference (expressedas a percentage) for each QUM indicator between“countries” (country-year jurisdiction) implementing andnot implementing a specific policy was calculated. Thedirectionality of “better” or “worse” use was aligned foreach of the six QUM indicators and an average (overall)difference calculated for each specific policy, whereby apositive (+) number indicates “better” use and a minus(−) number indicates “worse” use. The mean differencesfor each QUM indicator, and the average differenceacross all QUM indicators for each policy were calcu-lated and represent an estimate of the quantitativeimpact of each policy. Head-to-head comparisons of theimpact of different policies and further multiple compar-isons were not done.Correlations of multiple policies with QUM indicators,
where the “country-year jurisdiction” was the unit ofanalysis, were performed to see if adoption (implementa-tion or partial implementation) of more policies wasassociated with better QUM. Since various policies arelikely to impact differently on different QUM indicators,and to gain an idea of the overall impact on QUM bythe package of policies that any one country was imple-menting in one specific year, a composite QUM variablewas derived, in the same manner as has been done else-where [16]. Use of a composite QUM variable allowedcomparison of data across all 20 situational analysesrather than only 15, since some QUM indicators werenot measured in five situational analyses. For each indi-vidual QUM variable, we calculated how far that coun-try’s value (referred to as “country-year” – see text) layabove or below the mean value from all “country-years”and then converted this difference into standard devi-ation units. The average of the standard deviation unitincrements across all six QUM indicators for eachcountry-year was calculated and this was then regressedagainst the number of implemented policies that wereassociated with an effect size of more than 1% (22 out of25 policies) as estimated from the univariate analysis.Although countries implement each policy differently,
the adoption of more policies is likely to reflect strongerintention to promote QUM, which may be reflectedvariously by different QUM indicators. Hence, individualQUM indicators were also regressed on the number ofpolicies a country implemented. Since there may be
Table 2 Quality Use of Medicines (QUM) indicators and directionof better use
QUM Indicator Direction of betteruse
% Upper Respiratory Tract Infection (URTI) cases(patients) treated with antibiotics
Less
% cases (patients) treated with antibiotics Less
% prescribed medicines from the national EssentialMedicines List (EML)
More
% medicines prescribed by generic name More
% cases (patients) treated with multivitamins Less
% cases (patients) treated with an injection Less
Six standard indicators of quality of medicines use [23, 24] expressed asproportions and reported in 85–100% of the situational analyses
Holloway et al. BMC Health Services Research (2018) 18:526 Page 3 of 16

Table 3 Medicine Policy variables with information on how a policy was judged to be present or not
Policies recommended to improve medicines usea Criteria to determine whether a policy was adopted (implemented or partiallyimplemented) in a country
National structures, medicines policies and monitoring
1 National MOH unit on promoting rational use of medicines Policy was marked “yes” if there was any unit, even if very small and consisting ofonly 1–2 persons, or an executive committee with responsibility for promoting qualityuse of medicines.
2 Presence of a Drug and Therapeutic Committee (DTC) inmost referral hospitals
Policy was marked “yes” if more than half of referral hospitals visited had a DTCwhich had met in the last year (even if not very active) and there was an MOHmandate for DTCs.
3 National strategy to contain antimicrobial resistance Policy was marked “yes” if there was any policy document endorsed by MOH onAMR containment.
4 Presence of National Drug Information Centre Policy was marked “yes” if any national drug information centre existed, even if thecentre was not very active and did not offer 24-hour emergency information.
5 Prescription audit in the last 2 years Policy was marked “yes” even if the audit had only been undertaken in the healthfacilities of some districts, but including at least one of the districts visited duringthe situational analysis.
Educational policies
6 Undergraduate training of prescribers on the NationalEssential Medicines List (EML)
Policy was marked “yes” even if only some training institutions included the EML inthe curriculum.
7 Undergraduate training of prescribers on the NationalStandard Treatment Guidelines (STGs)
Policy was marked “yes” even if only some training institutions included the STG inthe curriculum.
8 Continuing medical education (CME) of prescribers byMOH
Policy was marked as “yes” even if only some prescribers received CME on generalprescribing in adults and/or children. The Antibiotic SMART Use program inThailand, INRUD training activities in Nepal and the training activities of theNational Institute of Health (INS) in Timor-Leste are examples of CME by the MOH[21, 37].
9 Public education on medicines use in last 2 years Policy was marked “yes” if any district populations had received public education.
Managerial Policies
10 National Essential Medicines List updated in the last 2 years Was not hypothesized to influence antibiotic use.
11 National Standard Treatment Guidelines updated in the last2 years
Policy was marked” yes” if there was any kind of officially published bookcontaining national treatment guidelines, but not for disease protocols on postersor pamphlets.
12 National Standard Treatment Guidelines (STGs) found insome health facilities (indicator of STG implementation).
Policy was marked “yes” if the national STGs (published book) were observed inmore than two facilities visited.
13 National Formulary available Policy was marked “yes” if any national formulary was observed in any facility.
14 Generic prescribing policy in public sector Policy was marked “yes” if there was any initiative described to encourage genericprescribing. Was not hypothesized to influence antibiotic use.
15 Generic substitution in public sector Policy was marked “yes” if generic substitution was both legal and seen to occur.Was not hypothesized to influence antibiotic use.
16 Prescriber workload low or moderate Low/moderate workload defined as less than 60 patients per prescriber per day, asreported by prescribers or as observed in patient registers.
Supply system
17 Public sector procurement limited to only EML medicines Policy was marked “yes” if public sector procurement limited to EML medicines wasreported at the central level and observed at the health facilities visited. Indicator ofimplementation of the EML.
18 No medicines stock-out problems reported in the healthfacilities visited
Policy was marked “yes” if health workers at the facilities visited stated that therewere no stock-out problems. Indicator of the quality of the supply system whichmay impact on use.
Economic Policies
19 NO Drug sales revenue used to supplement prescriberincome
Policy was marked “no” if prescribers were observed selling drugs in the publicsector, as was the case in one country in 1 year.
20 No registration or consultation fee All countries stated that they dispensed drugs free of charge to all patients inpublic facilities if medicines were available, but some charged registration orconsultation fees which could be perceived by patients as payment for treatment.
Holloway et al. BMC Health Services Research (2018) 18:526 Page 4 of 16

correlation between the results of different situationalanalyses done in the same country, a sensitivity analysiswas done by restricting the regression analysis to the lat-est situational analysis of the country.The impact of country economic status was assessed
by including Gross National Income per capita (GNIpc)into multiple linear regression analyses and by repeatingthe regression analyses for countries with GNIpc aboveand below the median of USD 2230.Finally, in those countries where a situational analysis
was done twice, the mean difference between situationalanalyses, for each of the six QUM indicators, was calcu-lated to see whether there had been any change in QUMover time, and whether any change was accompanied bya corresponding change in the number of policiesimplemented.
ResultsData were extracted from 20 situational analysis reportscovering all 11 countries of the WHO South-east Asiaregion – two reports from eight countries in differentyears, two reports from India (one North Indian and oneSouth Indian state in the same year) and one report eachfrom two countries (Democratic Peoples’ Republic[DPR] of Korea and Indonesia). QUM data for all six in-dicators were extracted from 15 country-visit reports,with 1–2 QUM variables missing from four reports(concerning injection use, prescribing from the EssentialMedicines List [EML] and antibiotic use in upper re-spiratory tract infection [URTI] cases), and 5 out of sixQUM indicators missing from one early report(Bangladesh 2010). A total of 206 public-sector healthfacilities were visited (average of 10–11 public-sector
health facilities per country-visit, half of which were pri-mary healthcare centres) and 30 prescriptions per facilitywere examined to estimate five of the six QUM indica-tors. The QUM indicator concerning the % URTI casestreated with antibiotics was estimated from visits to 151public-sector health facilities (average of 7–8 facilitiesper country visit) with an average of 23 URTI prescrip-tions examined per facility. In two countries (Sri Lanka2010 and Bangladesh 2010) no data on antibiotic use inURTI was available, in two countries (Bhutan 2011 andMaldives 2011) data on antibiotic use in URTI was avail-able in only two health facilities and in one country(Indonesia 2011) from only three health facilities. Policydata for all 25 indicators were extracted from all 20country-visit reports.
Comparison of QUM indicators in countries with andwithout specific policiesTable 4 shows the mean differences for each of the sixQUM indicators, and the average difference across allsix QUM indicators, between countries that did and didnot implement the 25 policies hypothesised to be associ-ated with better use. Figure 1 shows the mean difference(with 95% confidence interval)) across all six QUM indi-cators for each of the 25 policies. Twenty-two out of 25policies were associated with better QUM, although inmany cases the differences were small. Twelve policieswere associated with statistically significantly (p < 0.05)better QUM of more than 3.6% – namely not chargingpatients any user fee or copayment for medicines at thepoint of care, undergraduate education of prescribers onthe national treatment guidelines (STGs), distribution ofSTGs to health facilities (as demonstrated by finding
Table 3 Medicine Policy variables with information on how a policy was judged to be present or not (Continued)
Policies recommended to improve medicines usea Criteria to determine whether a policy was adopted (implemented or partiallyimplemented) in a country
21 No user fee or copayment at the point of care Although all countries officially dispensed drugs free of charge in public facilities,some types of facility, generally hospitals, charged a user fee or co-payment fordrugs at the point of care.
Regulatory policies
22 Systemic antibiotics generally not available over-the-counter (OTC)
Systemic antibiotics could be got OTC in all countries but were generallyunavailable in Bhutan and DPR Korea where the private sector is very small, andeffort is made to enforce the drug schedules.
23 Regulation of advertisements for OTC drugs medicines No countries were monitoring all drug promotional activities, but some did monitoradvertising of OTC drugs.
Human resource policies
24 Prescribing by doctors (as opposed to other staff) in publicprimary care
Policy was marked “yes” if doctors were observed to be prescribing in the primarycare facilities visited. Where doctors were not prescribing paramedical staff ornurses generally prescribed, although in one country unqualified staff sometimesprescribed.
25 No prescribing by staff with less than 1 month’s trainingin public primary care
Policy was marked “yes” if no unqualified staff were observed to prescribe.
aIncludes all the policy questions, hypothesised to act on the quality of medicines use, as hypothesised elsewhere [16, 17] and found in the situational analysisreports [21]
Holloway et al. BMC Health Services Research (2018) 18:526 Page 5 of 16

Table 4 Differences in medicine use between countries with and without each of 25 policies hypothesised to be associated withbetter use
Policy Number ofcountries withpolicy(out of 20)a
% URTIcasestreated withantibiotics
% patientstreatedwithantibiotics
% medicinesprescribedfrom theEML
% medicinesprescribed bygeneric name
% patientsprescribedmultivitamins
% ofpatientsprescribedinjections
Average % better(+) medicines usewith policy(95% CI)
Direction of bettermedicines use:More (+); Less (−)
Less (−) Less (−) More (+) More (+) Less (−) Less (−) Sign changedwhere less use isbetter use
No user fee for drugsat most public healthfacilities
17 −9.6 + 0.1 + 9.5 + 31.2 −7.5 + 0.8 9.5* (0.2 to 18.7)
Undergraduateeducation ofprescribers on STGs
5 −15.9 −5.2 + 12.0 + 22.0 − 1.1 + 0.9 9.2* (2.1 to 16.4)
Systemic antibioticsmostly not availableOTC
3 −16.0 − 5.2 + 12.0 + 22.0 − 1.3 + 1.4 9.2* (1.9 to16.4)
MOH unit on RationalUse of Medicinesestablished
3 −17.3 −10.9 + 0.1 + 19.7 + 0.9 −6.9 9.0* (2.1 to 15.9)
Some public-sectorprescriber CME byMOH
8 −7.5 −1.6 + 5.7 + 21.9 − 8.7 − 4.8 8.4* (2.7 to 14.0)
Advertisements forOTC drugs monitored
7 −14.5 −3.8 + 4.0 + 15.5 − 2.0 − 8.3 8.0* (3.4 to 12.7)
Public sector genericprescribing policy
9 −3.9 −1.6 + 9.8 + 35.1 + 0.4 + 2.2 8.0 (− 3.2 to 19.1)
No drug revenue forpublic sectorprescribers
19 −19.1 −2.7 −2.2 + 18.8 − 7.0 −6.7 7.8* (0.1 to 15.5)
MOH prescribingsurvey done in the last2 years
7 −4.7 −1.2 + 4.6 + 28.6 + 2.7 − 7.7 7.4 (− 1.4 to 16.2)
STGs found in somepublic health facilities
5 − 11.4 −9.7 + 6.1 + 17.8 + 1.4 + 2.4 6.9* (0.6 to 13.1)
No public-sectorregistration orconsultation fee
12 −13.0 −3.3 + 5.6 + 15.2 + 2.5 − 5.6 6.7* (1.5 to 11.9)
Some public educationon medicines use inthe last 2 years
5 −11.7 −7.4 + 2.5 + 8.9 −5.0 + 2.4 5.5* (1.5 to 9.5)
DTCs in most publicreferral hospitals
8 −1.7 + 3.2 −2.5 + 15.2 −9.3 − 10.3 5.1 (− 0.9 to 11.2)
Generic substitution inthe public sector
15 + 6.0 + 7.8 + 16.1 + 21.8 −2.8 + 0.4 4.4 (−5.2 to 14.0)
No drug stock-outproblems reported
9 −11.6 −3.8 −0.1 − 1.4 −2.3 − 7.9 4.5* (0.1 to 8.0)
National Formularyavailable
7 −8.7 −0.7 −3.4 + 6.1 − 5.9 − 3.7 3.6* (0.2 to 7.1)
National EML updatedin the last 2 years
12 −6.0 −0.7 + 16.1 − 0.4 + 1.2 + 2.2 3.2 (− 2.4 to 8.7)
Undergraduateeducation of doctorson the EML
6 −9.9 + 0.6 −3.5 + 1.7 −3.7 −6.8 3.0 (−0.9 to 6.9)
No public-sector unqualified prescribers
18 −5.8 −6.5 + 8.4 + 9.8 + 8.4 + 8.6 2.3 (−4.5 to 9.0)
National STG updatedin the last 2 years
7 + 5.8 + 6.9 + 6.9 + 20.1 + 5.5 − 1.0 1.6 (−6.7 to 10.0)
Holloway et al. BMC Health Services Research (2018) 18:526 Page 6 of 16

them in facilities), a Ministry of Health (MOH) unit ded-icated to promoting QUM, continuing education onprescribing for health workers by MOH, generalnon-availability of systemic antibiotics over-the-counter(OTC), monitoring of advertisements for OTC medi-cines, no revenue from medicine sales for public sector
prescribers, having no stock-out problems, publiceducation and having a national formulary. For the 22(out of 25) policies associated with better overallQUM of more than 1%, 96 (73%) of a possible 132comparisons (6 QUM indicators × 22 policies) wereassociated with better QUM.
Table 4 Differences in medicine use between countries with and without each of 25 policies hypothesised to be associated withbetter use (Continued)
Policy Number ofcountries withpolicy(out of 20)a
% URTIcasestreated withantibiotics
% patientstreatedwithantibiotics
% medicinesprescribedfrom theEML
% medicinesprescribed bygeneric name
% patientsprescribedmultivitamins
% ofpatientsprescribedinjections
Average % better(+) medicines usewith policy(95% CI)
National AMRContainment Strategy
4 −1.3 −3.7 −10.0 + 2.2 − 3.4 − 8.3 1.5 (− 3.4 to 6.4)
Public procurementlimited to EML drugsonly (excl. DPRK)
15 + 12.6 + 12.5 + 15.5 + 22.3 + 0.2 + 3.4 1.5 (− 10.1 to 13.1)
National DrugInformation Centre
2 + 7.2 −1.5 −3.9 + 11.6 + 3.4 + 15.7 − 2.8 (− 10.1 to 4.4)
Public sector PHCprescribing by doctors
13 + 1.9 + 3.5 −2.3 −10.3 −4.0 + 5.8 −3.3 (− 7.1 to 0.4)
Prescriber patientload moderate orlow (< 60 patients/prescriber/day)
12 − 10.9 −8.7 −5.4 −6.3 + 27.2 + 7.9 − 4.5 (− 15.5 to 16.5)
*p ≤ 0.05aSample size applies to the number of countries (out of 20) that had adopted the policy. The number of countries with and without policies for each individualQUM indicator varies slightly as certain QUM indicators were not measured in 5 country visitsOTC Over-the-counter, STG Standard treatment guidelines, MOH Ministry of health, CME Continuing medical education, DTC Drug and therapeutic committee, EMLEssential medicines list, AMR Antimicrobial resistance, DPRK Democratic People’s Republic of Korea (which had no published EML)
Fig. 1 Differences in medicines use between countries with and without medicines policies. STG = Standard Treatment Guidelines; OTC = Over-the-Counter; MOH =Ministry of Health; CME = Continuing Medical Education; DTC = Drug and Therapeutic Committee; EML = Essential MedicinesList; AMR = Antimicrobial Resistance; PHC = Primary Health Care
Holloway et al. BMC Health Services Research (2018) 18:526 Page 7 of 16

Some policies had large effects on one particularQUM indicator, but not on overall use (as judged bysix QUM indicators). Generic prescribing policieswere associated with greater generic prescribing;implementing the national EML (as indicated by hav-ing an updated EML and limiting public procurementto EML drugs) was associated with greater prescribingof EML medicines. However, low to modest prescriberworkload (as defined by seeing less than 60 patientsper day) was not associated with better overall QUM,although it was associated with lower antibiotic use.
Effects of multiple policies and national wealthFigure 2 shows a scatter plot of the composite QUM indi-cator and the number of policies implemented (out of 22policies associated with better QUM) for 20 situational ana-lysis visits (country-years). There was moderate to strongpositive correlation between the number of essential medi-cines policies implemented and the composite QUM indi-cator (r = 0.71, r2 = 0.50, p < 0.05). In sensitivity analyses(not shown graphically) the correlation increased whenGNIpc was included in the regression analysis (r = 0.75, r2
= 0.57, p < 0.05) and the correlation was moderate to strongin the 10 country-visits with GNIpc above USD 2230 (r =0.76, r2 = 0.58, p < 0.05) and below USD 2230 (r = 0.69, r2 =0.48, p < 0.05). Furthermore, confining the regression ana-lysis to data from the most recent situational analyses in 12states (all 11 countries including 2 Indian states), in orderto take account of possible clustering of results from thesame site, also showed moderate to strong correlation
between the composite QUM indicator and the number ofessential medicines policies (r = 0.71, r2 = 0.50, p < 0.05).Figures 3, 4, 5, 6, 7 and 8 show the scatter plots
for the individual QUM indicators versus policy im-plementation. Regression analyses of individual QUMindicators and the number of policies (out of 22) im-plemented showed that with an increasing number ofessential medicines policies implemented there was:an increase in the % prescribed medicines belongingto the EML (r = 0.46, r2 = 0.21, p > 0.05) (Fig. 3); anincrease in the % medicines prescribed by genericname (r = 0.62, r2 = 0.38, p < 0.05) (Fig. 4); a decreasein the % patients prescribed injections (r = − 0.24, r2 =0.06, p > 0.05) (Fig. 5) and a decrease in the % URTIcases prescribed antibiotics (r = − 0.42, r2 = 0.18, p >0.05) (Fig. 6). There was virtually no change in the %patients treated with antibiotics (r = − 0.1, r2 = 0.01,p > 0.05) (Fig. 7) or vitamins (r = − 0.1, r2 = 0.02, p >0.05) (Fig. 8) with increasing number of policies im-plemented. In a sensitivity analysis where policies nothypothesised to influence antibiotic use were excluded(2 policies on generic prescribing and substitutionand 3 policies on EML implementation), a strongerassociation was found between the number of policies(out of 17) implemented and the % URTI cases pre-scribed antibiotics (r = − 0.49, r2 = 0.24, p < 0.05).
Changes over timeIn seven of the eight countries where a situational ana-lysis had been done twice, separated by a period of 3–
Fig. 2 Scatter plot of composite QUM score versus number of policies (out of 22) implemented
Holloway et al. BMC Health Services Research (2018) 18:526 Page 8 of 16

Fig. 3 % prescribed medicines from the Essential Medicines List versus number of policies (out of 22) implemented
Fig. 4 % medicines prescribed by generic name versus number of policies (out of 22) implemented
Holloway et al. BMC Health Services Research (2018) 18:526 Page 9 of 16

5 years, the average mean differences over time forthe six individual QUM indicators and the averagemean difference over the six QUM indicators, to-gether with any change in the number of policies im-plemented are shown in Table 5. The data forBangladesh were excluded because five of the six
QUM indicators were missing from the first situ-ational analysis in 2010. The data show a significantimprovement in QUM together with increased policyimplementation in Thailand, while in other countriesthere was no significant change in QUM and policyimplementation. However, the small sample sizes
Fig. 5 % patients prescribed injections versus number of policies (out of 22) implemented
Fig. 6 % Upper Respiratory Tract Infection cases prescribed antibiotics versus number of policies (out of 22) implemented
Holloway et al. BMC Health Services Research (2018) 18:526 Page 10 of 16

(concerning health facilities and patient encounters)preclude further interpretation of the data.
DiscussionThis study has two important findings. Firstly, some pol-icies were associated with significantly better QUM; and
secondly the more of these policies a country imple-mented the better was the QUM.Policies statistically significantly associated with more
than 7% better overall QUM were: not charging patientsany user fee or co-payment for medicines at the point ofcare; implementation of STGs through undergraduate
Fig. 7 % patients prescribed antibiotics versus number of policies (out of 22) implemented
Fig. 8 % patients prescribed vitamins versus number of policies (out of 22) implemented
Holloway et al. BMC Health Services Research (2018) 18:526 Page 11 of 16

Table
5Chang
esover
timein
8coun
trieswhe
retw
ocoun
trysituationalanalysesweredo
ne
Cou
ntry
(Yearsof
coun
trysituational
analyses)
%URTIcases
treatedwith
antib
ioticsa
%patients
treatedwith
antib
ioticsa
%med
icines
prescribed
from
theEM
La
%med
icines
prescribed
byge
neric
namea
%patients
prescribed
multivitaminsa
%of
patients
prescribed
injections
a
Average
%be
tter
(+)
med
icines
useover
time(95%
CI)
Chang
ein
thenu
mbe
rof
policiesim
plem
ented
betw
eenthesecond
andfirstsituation
analyses
Directionof
better
med
icines
use:More(+);Less
(−)
Less
(−)
Less
(−)
More(+)
More(+)
Less
(−)
Less
(−)
Sign
(+/−)change
dforQUM
indicatorswhe
reless
useisbe
tter
useso
that
“+”=
better
QUM
Bang
lade
sh(2010,2014)
−16.6
0
Bhutan
(2011,2015)
−19.6
+8.1
+1.5
+2.9
−10.1
−3.7
+4.9(−2.4to
+12.5)
+2
Maldives(2011,2014)
−19.3
−13.8
+19.3
+22.8
+5.6
+4.8(−
10.0to
+19.6)
+3
Myanm
ar(2011,2014)
+2.0
+7.1
−7.6
+11.3
+13.7
+4.0
−3.8(−
10.6to
+2.9)
+4
Nep
al(2011,2014)
−6.3
−2.5
−0.04
−10.5
+11.7
−3.7
−1.6(−
7.8to
+4.5)
0
SriLanka
(2010,2015)
+7.1
−7.5
+13.4
−7.8
+1.7(−
6.8to
+10.1)
+2
Thailand
(2012,2015)
−13.7
−17.9
+8.4
+5.0
−2.5
+1.3
+7.7(+
2.0to
+13.4)**
+7
Timor-Leste
(2012,2015)
−24.1
−13.7
−3.7
−6.4
−17.9
+0.1
+7.6(−
2.5to
+17.7)
−1
a The
meandifferen
cebe
tweenthesecond
andfirst
situationa
lana
lyses
**p≤0.05
Holloway et al. BMC Health Services Research (2018) 18:526 Page 12 of 16

education of prescribers and adequate distribution (asindicated by finding STGs available at health facilities);an MOH unit dedicated to monitoring and promotingQUM; continuing medical education (CME) on prescrib-ing for health workers by MOH; limiting the OTC avail-ability of systemic antibiotics; not allowing public sectorprescribers to gain revenue from the sales of medicines;and monitoring advertisements of OTC medicines.Other policies that had a significant but smaller associ-ation with better QUM included: more efficient drugsupply system (as indicated by no stock-out problemsreported); availability of a national formulary; publiceducation programs on medicines use; and not chargingpatients any registration or consultation fee at healthfacilities.The policies associated with better QUM in this study
are similar to those policies associated with better QUMin an analysis of global secondary data [16, 17] (exclud-ing those policies which were not commonly measuredin both studies). The one exception was that CME wasdone by MOH, and was associated with better QUM inthis study, but may not have been done by MOH incountries included in the previous analysis of globaldata, where CME was associated with poorer QUM.The effectiveness of similar interventions has been
reported elsewhere, including: education of prescribers[4, 5] and the public [26], an MOH unit dedicated topromoting QUM [27], administrative interventionssuch as hospital drug and therapeutic committees(DTCs) [28, 29], non-allowance of prescriber incomefrom drug sales [30], non-allowance of antibioticsOTC [31], and monitoring of drug promotional activ-ities [32]. As found in analysis of global data whereprovision of medicines free of charge was associatedwith better use [16, 17], so in this study not chargingpatients any fees for medicines (or fees that could beconstrued by patients as being for medicines e.g.registration and consultation fees) was associated withbetter use.There was a significant moderate to strong positive
correlation between the number of policiesimplemented and the composite QUM (over six indi-cators), and for two of the individual QUM indicators(% URTI cases prescribed antibiotics and % medicinesprescribed by generic name). While the effect sizeswere small for individual policies (< 10%), the effectsizes associated with implementation of multiple pol-icies were large (30–95% over different QUM indica-tors) and comparable with the largest interventioneffects reported elsewhere [4, 5]. We believe that thedata on the possible impacts of multiple policies areimportant and likely to reflect a causal association.This is the second time we have found the correla-tions between numbers of implemented policies and
better QUM measures, and these analyses were conductedin different and independent data-sets [16, 17].Increased effect sizes with multiple (as opposed to
single interventions) have been reported in many litera-ture reviews [4, 5, 33–35]. The correlations between thecomposite QUM indicator and the number of policiesimplemented remained strong in both wealthier andpoorer countries when the regression analysis wasrepeated for countries with a GNIpc above and belowthe median of USD 2230. This finding together with thefact that there was no correlation between GNIpc andthe number of policies implemented suggests that it islikely that the better QUM seen with increasing policyimplementation was due to the policies themselves andnot due to wealth, as has been found elsewhere [16, 17].The apparent improvement in QUM in association
with increased policy implementation over time seen inThailand may be a chance finding since the number offacilities was small and the same facilities were notvisited during both visits. Nevertheless, Thailand in-creased its policy implementation more than othercountries over the time-period and similar results havebeen reported elsewhere [36, 37]. Therefore, it is sug-gested that the method used in this study to measureQUM in relation to policy implementation may be agood method to monitor country progress on promotingQUM.The data analysed in this study were collected from all
countries during 2-week periods using a pre-designedworkbook tool by government staff with facilitation fromWHO, were discussed in each country and a report pro-duced and published on WHO/SEARO website forfuture use [21]. The approach was mandated by MemberStates [38, 39] and proved relatively cheap and quick, soenabling government participation and action. Thisstudy further shows that the data collected from this ap-proach is sufficient for regional analysis and develop-ment of a regional approach to promote better QUM.
LimitationsAlthough there were moderate to strong correlationsbetween medicines use and policy implementation inthis study, causality cannot be proved and may bedue to co-interventions. Small sample sizes disallowedmulti-variable analyses. Nevertheless, these are thebest data available on policy effectiveness in the pub-lic sector in South-East Asia given the absence in allcountries of national longitudinal data which could beused to perform time series analysis to show associ-ation or possibly prove causality. It is acknowledgedthat much health care is provided in the private sec-tor but there was insufficient data to investigate this.Nevertheless, the findings are very relevant sincemany prescribers work in both the public and private
Holloway et al. BMC Health Services Research (2018) 18:526 Page 13 of 16

sectors and many private-sector prescribers copypublic-sector ones e.g. private general practitionerscopying public-sector specialists.The policy data, recorded in the situational analysis
country reports [21], was collected by direct observationand discussion with health officials and health facilitystaff during the country situational analysis visits andthus may be more accurate than data relying on MOHquestionnaires, as used elsewhere [16, 17]. Nevertheless,there may be some misclassification since relatively fewhealth facilities were visited and it was not always easyto interpret whether a policy was implemented or not.For example, there was enormous variation betweencountries and between health facilities in the same coun-try concerning hospital DTC activities, and the contentand extent of prescriber CME and public education pro-vided by the MOH. Some policies measured in this studyare likely to be effective through association with otherhealth system factors and policies. For example, the gen-eral lack of availability of systemic antibiotics OTC inBhutan and DPR Korea may be due to a lack of privatesector as well as regulatory controls. The policy “nostock-outs reported” was assumed to reflect better drugsupply which might then impact on QUM. However, asituation of “no stock-outs” could itself result from bet-ter QUM.The prescribing (QUM) data were collected by direct
examination of treatment in 30 outpatient patientencounters (plus 10–30 URTI cases where measured)per facility on the day of the visit using the INRUD/WHO methodology [23, 24]. Since all six QUM indica-tors were collected in 15 (75%) of the 20 country situ-ational analysis visits, the QUM data may be morerobust than what we used in other work, where werelied on previously published surveys with on averageonly three QUM indicators per country [16]. Neverthe-less, while every effort was made to collect the data in astandard way, the variation between countries in docu-mentation of patient treatment and the small samplesizes involved may have resulted in some inaccuracies inthe results. Furthermore, some indicators such as injec-tion use and antibiotic use in URTI cases could not bemeasured in some countries and in some health facilitieswithin a country. However, any inaccuracies in theQUM and policy data would tend to weaken the correla-tions observed.Another serious weakness is that the QUM measure-
ments were based on small convenience samples (byMOH) of on average 10–11 public health facilities percountry visit. Thus, the surveys were not generalisable towhole countries and no benchmarking of country per-formance can be done using these data. Nevertheless,implementation of some policies was judged by observa-tion of what occurred in the health facilities where
QUM surveys were done, and this may account for thestronger correlation between policy implementation andQUM seen in this study compared to previous analyses[16, 17].
ConclusionsIrrational use of medicines is a serious problem inSouth-East Asia. Essential medicines policies were foundto be associated with better QUM and it is recom-mended that all countries: implement (through adequateeducation and distribution) national STGs, EML andformulary; establish an MOH unit dedicated to QUM;conduct CME on prescribing for health workers underclose supervision of MOH; limit OTC availability of sys-temic antibiotics; disallow public sector prescribers togain revenue from the sales of medicines; monitor adver-tisements of OTC medicines; run public education cam-paigns on QUM; do not charge patients user fees orco-payments for medicines at the point of care; and in-vest in a more efficient drug supply system. The situ-ational analysis approach allows the relatively quick andcheap collection of data on QUM and policy implemen-tation which can be used to monitor progress and planfuture action.
Additional files
Additional file 1: Dataset created from extraction of data from countrysituational analysis reports, all available online at: http://www.searo.who.int/entity/medicines/country_situational_analysis/en/ and http://www.searo.who.int/entity/medicines/en/. Excel file of the dataset createdfrom data extracted from the country situational analysis reports and whichwas used in the analysis described in this manuscript. (XLSX 13 kb)
Additional file 2: Medicines management in healthcare delivery: WHO/SEARO workbook tool and report template for undertaking a situationalanalysis of medicines management in health care delivery in low andmiddle-income countries, March 2016. Available online at:http://www.searo.who.int/entity/medicines/country_situational_analysis/en/. PDF file of the data collection instrument used to collect data in thecountry situational analyses and that was analysed in this manuscript.(PDF 1236 kb)
AbbreviationsCME: Continuing medical education; DPR Korea: Democratic Peoples’Republic of Korea; DTC: Drug and therapeutic committee; EM: Essentialmedicines; EML: Essential medicines list; GNIpc: Gross National Income percapita; INRUD: International Network for the Rational Use of Drugs;MOH: Ministry of Health; OTC: Over-the-counter; QUM: Quality use ofmedicines; SEARO: South-East Asia Regional Office; STG: Standard treatmentguidelines; UN: United Nations; URTI: Upper respiratory tract infection;WHO: World Health Organisation
FundingSouth-East Asia Regional Office (SEARO) of the World Health Organisation,New Delhi, India, funded the original country situational analyses. Extractionand analysis of data from the country reports published on the SEAROwebsite and writing of this manuscript was done without funding. All theviews expressed in this manuscript are solely the views of the authors andnot those of WHO.
Holloway et al. BMC Health Services Research (2018) 18:526 Page 14 of 16

Availability of data and materialsThe workbook tool used for data collection in the field is available on theWHO/SEARO website: http://www.searo.who.int/entity/medicines/country_situational_analysis/en/and also as Additional file 2. The datasetgenerated from data extracted from country situational analysis reports onthe WHO/SEARO website: http://www.searo.who.int/entity/medicines/en/isavailable as a Additional file 1, and further files showing more detailedanalysis are available from the corresponding author on reasonable request.
Authors’ contributionsAll authors have read and approved the manuscript. KAH is a public healthdoctor, formerly of WHO, who developed the methods for the situationalanalyses, facilitated all the situational analyses, analysed the data, and wrotethe manuscript. AK is a professor of pharmacology with internationalexpertise in drug use, medicines pricing and access, who supported threesituational analyses during 2015, reviewed the methods, and helped writethe manuscript. GB is a professor of pharmacology with internationalexpertise in drug selection and use, who supported one situational analysisin 2015, reviewed the methods, and helped write the manuscript. BS is apharmacologist, formerly of WHO, who supported one situational analysis in2015 and who helped write the manuscript. SR is director of InternationalGraduate Programs in Health Social Sciences at Mahidol University, Thailand,who supported one situational analysis in 2015 and who helped write themanuscript. DH is professor of evidence-based practice at Bond University,Australia, formerly director of the WHO Collaborating Centre for Training inPharmaco-economics and Rational Pharmacotherapy at the University ofNewcastle in Australia, who assisted in analysis of the data, interpretation ofthe findings, and writing of the manuscript.
Ethics approval and consent to participateAll the data used in this study was obtained from published country reportsof situational analyses of medicines management - all of which are publiclyavailable online at: http://www.searo.who.int/entity/medicines/country_situational_analysis/en/ and http://www.searo.who.int/entity/medicines/en/All administrative permissions, including formal approval by the respectiveMinistry’s of Health were obtained, prior to publication of the countryreports on the WHO/SEARO website, as mandated by the World HealthOrganisation’s Regional Committee Resolution SEA/RC66/R7, EffectiveManagement of Medicine, World Health Organization Regional Office forSouth-East Asia, New Delhi, 2013 (see reference [38]). Furthermore,various data from these country reports have already been extracted,analysed, and published on the WHO/SEARO website and internationally(see reference [22]).
Consent for publicationNot Applicable.
Competing interestsThe authors declare that they have no competing interests.
Publisher’s NoteSpringer Nature remains neutral with regard to jurisdictional claims inpublished maps and institutional affiliations.
Author details1International Institute of Health Management Research, Jaipur, India.2Institute of Development Studies, University of Sussex, Brighton BN1 9RE,UK. 3Department of Pharmacology, Vallabhbhai Patel Chest Institute,University of Delhi, New Delhi, India. 4All India Institute of Medical Sciences,Bhubaneswar, India. 5Independent Consultant in Medicines Policy,Yogyakarta, Indonesia. 6Faculty of Social Sciences and Humanities, MahidolUniversity, Salaya, Nakornpathom, Thailand. 7Bond University, Gold Coast,QLD, Australia. 8University of Toronto, Toronto, Canada.
Received: 15 February 2018 Accepted: 26 June 2018
References1. Holloway KA. Combating inappropriate use of medicines. Expert Rev Clin
Pharmacol. 2011;4(3):335–48.
2. Holloway KA, van Dijk L. The world medicines situation. Rational use ofmedicines. WHO/EMP/MIE/2011.2.2. 3rd ed. Geneva: World HealthOrganization; 2011. Available: http://www.who.int/medicines/areas/policy/world_medicines_situation/en/index.html . (Accessed 25 July 2017)
3. World Health Organisation. Medicines use in primary care in developingand transitional countries: fact book summarizing results from studiesreported between 1990 and 2006. WHO/EMP/MAR/2009.3. Geneva: WorldHealth Organisation; 2009.
4. Holloway KA, Ivanovska V, Wagner AK, Vialle-Valentin C, Ross-Degnan D.Have we improved use of medicines in developing and transitionalcountries and do we know how to? Two decades of evidence. Tropical MedInt Health. 2013;18(6):656–64.
5. Holloway KA, Ivanovska V, Wagner AK, Vialle-Valentin C, Ross-Degnan D.Prescribing for acute childhood infections in developing and transitionalcountries, 1990-2009. Paediatr Int Child Health. 2015;35(1):5–13.
6. Livermore DM. Bacterial resistance: origins, epidemiology, and impact. ClinInfect Dis. 2003;36(Suppl 1):S11–23.
7. Harbarth S, Samore MH. Antimicrobial resistance determinants and futurecontrol. Emerg Infect Dis. 2005;11:794–801e.
8. Goossens H. Antibiotic consumption and link to resistance. Clin MicrobiolInfect. 2009;15(Suppl 3):12–5.
9. Pirmohamed M, James S, Meakin S, Green C, Scott AK, Walley TJ, Farrar F,Park BK, Breckenridge AM. Adverse drug reactions as cause of admission tohospital: prospective analysis of 18,820 patients. Br Med J. 2004;329:15–9.
10. Howard RL, Avery AJ, Slavenburg S, Royal S, Pipe G, Lucassen P,Pirmohamed M. Which drugs cause preventable admissions to hospital? Asystematic review. Br J Clin Pharmacol. 2006;63(2):136–47.
11. Hitchen L. Adverse drug reactions result in 250 000 UK admissions a year. BrMed J. 2006;332:1109.
12. World Health Organisation. The rational use of drugs. Report of theconference of experts. Geneva: World Health Organisation; 1985.
13. World Health Organisation. Promoting rational use of medicines: corecomponents. WHO policy perspectives of medicines. Geneva: World HealthOrganisation; 2002. p. 5.
14. World Health Organisation. Using indicators to measure countrypharmaceutical situations: fact book on WHO level I and level II monitoringindicators. Who/TCM/2006.2. Geneva: World Health Organisation; 2006.
15. World Health Organisation. Country pharmaceutical situations: fact book onWHO Level 1 indicators 2007. WHO/EMP/MPC/2010.1. Geneva: World HealthOrganisation; 2010.
16. Holloway KA, Henry D. WHO essential medicines policies and use indeveloping and transitional countries: an analysis of reported policyimplementation and medicines use surveys. PLoS Med. 2014;11(9):e1001724.
17. Holloway KA, Rosella L, Henry D. The impact of WHO essential medicinespolicies on inappropriate use of antibiotics. PLoS One. 2016;11(3):e0152020.https://doi.org/10.1371/ journal.pone.0152020.
18. World Health Organisation. Progress in the rational use of medicines. Worldhealth assembly resolution, WHA60.16. Geneva: World Health Organisation;2007.
19. International Conferences for Improving the Use of Medicines, 1997, 2004and 2011. URL: http://www.icium.info. (Accessed 25 July 2017).
20. Bigdeli M, Peters DH, Wagner AK, editors. WHO/HPSR. Medicines in healthsystems: advancing access, affordability and appropriate use. Geneva: WHOand Alliance for Research on Access to Medicines; 2014.
21. Country situation analyses of medicines in health care delivery in South-EastAsia. URL: http://www.searo.who.int/entity/medicines/country_situation_analysis/en/ (Accessed 9 Jan 2018).
22. Holloway KA, Kotwani A, Batmanabane G, Puri M, Tisocki K. Antibiotic use inSouth-East Asia and policies to promote appropriate use: reports fromcountry situational analyses. Br Med J. 2017;358(Suppl 1):9–13.
23. World Health Organisation. How to investigate drug use in health facilities:selected drug use indicators. WHO/DAP/93.1. Geneva: World HealthOrganisation; 1993.
24. Gove S. Integrated management of childhood illness by outpatient healthworkers: technical basis and overview. The WHO working group onguidelines for integrated management of the sick child. Bull World HealthOrgan. 1997;75(Suppl 1):7–24.
25. UN country profile data. URL: http://data.un.org/en/index.html. (Accessed 1June 2017).
26. Huttner B, Goossens H, Verheij T, Harbath S, for the CHAMP Consortium.Characteristics and outcomes of public campaigns with the aim to improve
Holloway et al. BMC Health Services Research (2018) 18:526 Page 15 of 16

outpatient antibiotic use in high income countries. Lancet Infect Dis. 2009;10(1):17–31.
27. Jaffer B. National approach of promote rational use of medicines: theOmani experience. WHO/NGO Technical Briefing Seminar, World HealthAssembly, Geneva, 14th May 2007. Directorate of Rational Drug UseDepartment, MOH, Oman. Available: http://www.who.int/drugresistance/OmanDRDUforWHAMeetingGeneva.pdf (Accessed 25 July 17).
28. Vang C, Tomson G, Kounnavong S, Southammavong T, Phanyanouvong A,Johansson R, Eriksson B, Wahlstrom R. Improving the performance of drugand therapeutics committees in hospitals - a quasi-experimental study inLaos. Eur J Clin Pharmacol. 2006;62:57–63.
29. Lu CY, Ross-Degnan D, Soumerai SB, Pearson SA. Interventions designed toimprove the quality and efficiency of medication use in managed care: acritical review of the literature – 2001-2007. BMC Health Serv Res. 2008;8:75.
30. Park S, Soumerai SB, Adams AS, Finkelstein JA, Jang S, et al. Antibiotic usefollowing a Korean national policy to prohibit medication dispensing byphysicians. Health Policy Plan. 2005;20(5):302–9.
31. Bavestrello L, Cabello A, Casanova D. Impact of regulatory measures in thetrends of community consumption of antibiotics in Chile. Revista MedicaDe Chile. 2002;130(11):1265–72.
32. World Health Organisation. Drug Promotion - what we know, what we haveyet to learn – reviews of materials in the WHO/HAI database on drugpromotion. EDM Research Series No.32, WHO/EDM/PAR/2004.3. Geneva:World Health Organisation; 2004.
33. Rowe AK, de Savigny D, Lanata CF, Victora CG. How can we achieve andmaintain high-quality performance of health workers in low resourcesettings? Lancet. 2005;366(9490):1026–35.
34. Francke AL, Smit MC, De Veer AJE, Mistiaen P. Factors influencing theimplementation of clinical guidelines for health care professionals: a meta-review. BMC Med Inform Decis Mak. 2008;8:38.
35. Sketris IS, Ingram EML, Lummis HL. Strategic opportunities for effectiveoptimal prescribing and medication management. Can J Clin Pharmacol.2009;16(1):e103–25.
36. Boonyasiri A, Thamlikitkul V. Effectiveness of multifaceted interventions onrational use of antibiotics for patients for patients with upper respiratorytract infections and acute Diarrhoea. J Med Assoc Thai. 2014;97(Suppl 3):S13–9.
37. Sumpradit N, Chongtrakul P, Anuwong K, Pumtong S, Kongsomboon K,Butdeemee P, Khonglormyati J, Chomyong S, Tongyoung P, Losiriwat S,Seesuk P, Suwanwaree P, Tangcharoensathien V. Antibiotics Smart use: aworkable model for promoting the rational use of medicines in Thailand.Bull World Health Organ. 2012;90(12):905–13. https://doi.org/10.2471/BLT.12.105445.
38. World Health Organisation/South-East Asia Regional Office (WHO/SEARO).Regional committee resolution SEA/RC66/R7. Effective Management ofMedicines. New Delhi: World Health Organization Regional Office for South-East Asia; 2013.
39. World Health Organisation/South-East Asia Regional Office (WHO/SEARO).Regional committee resolution SEA/RC64/R5. Effective National EssentialDrug Policy including the rational use of medicines. New Delhi: WorldHealth Organisation Regional Office for South-East Asia; 2011.
Holloway et al. BMC Health Services Research (2018) 18:526 Page 16 of 16
Related Documents