Bond angle effects on microtensile bonds: Laboratory and FEA comparison Nelson R.F.A. Silva a , Christine S. Calamia a , Masly Harsono a , Ricardo M. Carvalho b , Luiz F. Pegoraro c , Carlos A.O. Fernandes d , Antonio C.B. Vieira e , Van P. Thompson a, * a Department of Biomaterials and Biomimetics, Department of Prosthodontics, New York University, College of Dentistry, 345 East 24th Street, Room 804, New York City, NY, 10010, USA b Department of Operative Dentistry, Bauru School of Dentistry, SP, Brazil c Department of Prosthodontics, Bauru School of Dentistry, SP, Brazil d Department of Operative Dentistry, Federal University of Ceara, CE, Brazil e School of Engineering, University of Minas Gerais, MG, Brazil Received 6 July 2004; received in revised form 7 April 2005; accepted 12 May 2005 KEYWORDS FEA; Angled interface; Microtensile; Bond strength Summary Objective. To test the hypothesis that there is a reduction in bond strength when a microtensile load is applied to adhesive junctions prepared at 10, 20 and 30 degrees to the usual perpendicular interface. To evaluate the effect of bond angle and adhesive layer thickness on stress levels within the adhesive joint utilizing FEA. Methods. Twenty-four non-carious third molars were selected, occlusal enamel removed and polished perpendicular to the long axis of the tooth. The Clearfil SE Bond and Single Bond were applied on the dentin. A 4 mm resin restoration, Z 100, was built up. The teeth were sectioned at 108, 208 and 308 to the bonding interface (nZ3). The control (nZ3) group had all cuts parallel to the tooth longitudinal axis (08 bond angle). The bond values were calculated in MPa and Two-Way ANOVA and Tukey test applied. FEA was performed (1 mm/side square specimens) to obtain the maximum principal stress (MPS) in the microtensile- model for each bond angle and for varying adhesive thickness from 20 mm to 200 mm for each group. Results. The bond strength results diminish as the angle on the interface increased (P!0.05) for Clearfil SE Bond between 0 (control) and 30 degrees, and for Single Bond between 0 (control) and 10, 20, and 30 degrees. The hypothesis can be fully accepted for Single Bond and partially accepted for Clearfil SE Bond. For the FEA, there was a trend toward decreasing MPS as the bond angle increased, while the MPS for each angled group increased with adhesive layer thickness. Dental Materials (2006) 22, 314–324 www.intl.elsevierhealth.com/journals/dema 0109-5641/$ - see front matter Q 2005 Published by Elsevier Ltd on behalf of Academy of Dental Materials. doi:10.1016/j.dental.2005.05.006 * Corresponding author. Tel.: C1 212 9989938; fax: C1 212 995 4244. E-mail address: [email protected] (V.P. Thompson).

Welcome message from author
This document is posted to help you gain knowledge. Please leave a comment to let me know what you think about it! Share it to your friends and learn new things together.
Transcript
Bond angle effects on microtensile bonds:Laboratory and FEA comparison
Nelson R.F.A. Silvaa, Christine S. Calamiaa, Masly Harsonoa,Ricardo M. Carvalhob, Luiz F. Pegoraroc, Carlos A.O. Fernandesd,Antonio C.B. Vieirae, Van P. Thompsona,*
aDepartment of Biomaterials and Biomimetics, Department of Prosthodontics,New York University, College of Dentistry, 345 East 24th Street, Room 804,New York City, NY, 10010, USAbDepartment of Operative Dentistry, Bauru School of Dentistry, SP, BrazilcDepartment of Prosthodontics, Bauru School of Dentistry, SP, BrazildDepartment of Operative Dentistry, Federal University of Ceara, CE, BrazileSchool of Engineering, University of Minas Gerais, MG, Brazil
Received 6 July 2004; received in revised form 7 April 2005; accepted 12 May 2005
01do
KEYWORDSFEA;Angled interface;Microtensile;Bond strength
09-5641/$ - see front matter Q 2005i:10.1016/j.dental.2005.05.006
* Corresponding author. Tel.: C1 21E-mail address: van.thompson@nyu
Summary Objective. To test the hypothesis that there is a reduction in bondstrength when a microtensile load is applied to adhesive junctions prepared at 10, 20and 30 degrees to the usual perpendicular interface. To evaluate the effect of bondangle and adhesive layer thickness on stress levels within the adhesive joint utilizingFEA.Methods. Twenty-four non-carious third molars were selected, occlusal enamelremoved and polished perpendicular to the long axis of the tooth. The Clearfil SEBond and Single Bond were applied on the dentin. A 4 mm resin restoration, Z100, was built up. The teeth were sectioned at 108, 208 and 308 to the bondinginterface (nZ3). The control (nZ3) group had all cuts parallel to the toothlongitudinal axis (08 bond angle). The bond values were calculated in MPa andTwo-Way ANOVA and Tukey test applied. FEA was performed (1 mm/side squarespecimens) to obtain the maximum principal stress (MPS) in the microtensile-model for each bond angle and for varying adhesive thickness from 20 mm to200 mm for each group.Results. The bond strength results diminish as the angle on the interface increased(P!0.05) for Clearfil SE Bond between 0 (control) and 30 degrees, and for Single Bondbetween 0 (control) and 10, 20, and 30 degrees. The hypothesis can be fully acceptedfor Single Bond and partially accepted for Clearfil SE Bond. For the FEA, there was atrend toward decreasing MPS as the bond angle increased, while the MPS for eachangled group increased with adhesive layer thickness.
Dental Materials (2006) 22, 314–324
www.intl.elsevierhealth.com/journals/dema
Published by Elsevier Ltd on behalf of Academy of Dental Materials.
2 9989938; fax: C1 212 995 4244..edu (V.P. Thompson).
FEA and microtensile bonds 315
Significance. The MPS results for angled interfaces, exhibited the same trend asthe lab values. FEA results indicated an MPS increase with increased adhesivethickness.Q 2005 Published by Elsevier Ltd on behalf of Academy of Dental Materials.
Introduction
The science and art of adhesive dentistry has notyet been fully realized. Frequently additional tissue(hard and sometimes soft) must be removed toplace and retain restorative biomaterials. There-fore, a durable interfacial adhesion between toothand biomaterial is essential [1].
The achievement of the bond between adhesiveresin and dentin depends on penetration of theprimer and adhesive resin into the conditioneddentine surface. This is necessary in order to createmicromechanical interlocking between the dentinecollagen, and resin, and to form a hybrid layer orresin-dentin interdiffusion zone [13]. Althoughproper bonding of resins to dentine has proved tobe difficult, ongoing advances are improving thereliability and predictability of dentinal adhesion[21,19].
Adhesion analyses of dentin bonding agents havebeen performed by numerous mechanical testingmethods and the enormous number of test variablesinvolved, the variable nature of the heterogeneousdentin, and no real agreement on test standardiz-ation, complicate the results.
A microtensile method of bond strength testingwas developed by Sano et al. [14] The essence ofthe microtensile method is the division of resin-bonded teeth into slabs between 0.5 and 1.0 mmthick, which are trimmed in such a manner thattensile force will be concentrated on the bondinterface during testing. One advantage of thistechnique is that the bond interface of a small (ca1 mm2) specimen has better stress distributionduring loading, so there are fewer cohesive failuresthan are found with more conventional testing ofdentin samples [11,12].
The microtensile test for adhesive bond strengthhas normally been performed over flat dentinsurfaces [11,12,14]. Nevertheless, clinical pro-cedures involving tooth preparation do not producea flat superficial surface. Therefore, whenadhesive agents are applied to tooth preparations,different adhesive bond strength can occur withinthe same preparation [24]. Ciucchi [5], in 1997,was the first to use a microtensile method ondifferent regions of restored MOD preparations, but
the dentin surface to microtensile bond strengthtesting was flat.
The microtensile bond test would be the mostapplicable method to test bonds to preparedcavities on sound, as well as caries affected orinfected dentin. However, cavity preparation andremoval of caries result in a surface that is nolonger flat and the variable geometry and surfaceirregularities, produced by the burs, could bepartially responsible for the lower bond valuesrecorded. Studies comparing various bondingagents and bond enhancement procedures tosound, caries affected, and infected dentin willbecome increasingly important in the future. Therole of adhesive bond angle and thickness onmicrotensile bond strengths should be investigated.
The combination of diverse materials andcomplex geometry makes stress distribution anal-ysis in teeth very complicated. Simulation in acomputerized model would allow for a study ofsimultaneous interaction of the many variablesinvolved [2].
The ability to achieve a strong and durable bondbetween the restorative material and tooth struc-ture is of paramount importance for the clinicalsuccess of many dental restorations. A fracturetoughness test should therefore be an appropriatemethod for characterization of the intrinsic frac-ture resistance, and presumably, the in-servicereliability of the dentin-composite resin interface[20]. The fracture toughness and the perpetuationof crack growth are, however, dependent onmaterial thickness. As the adhesive layer becomesthicker, it undergoes Poisson contraction from theouter sides of the beam. This contraction mayrelieve some of the stresses that would otherwisegive rise to fracture.
Some difficulties associated with laboratory testmethods (fabrication of small specimens, theintroduction of the sharp crack, creation of exactand repeatable cement thicknesses, etc.) led theresearchers to try a numerical solution. Therefore,the finite element method was applied to fracturemechanisms and was found to give satisfactoryresults when compared with those obtained exper-imentally [20].
Finite element analysis (FEA) of stress distri-bution has also been used to study the sensitivity of
N.R.F.A. Silva et al.316
bond strengths to specimen design, and changes intesting conditions. Those studies [2,3] show thatthere is a need for a more critical approach on thedesign of appropriate tests for evaluating the bondstrength of resin composite and ceramic, if thedesire for a standardized test procedure is to beachieved. For this objective to be accomplished, acareful examination of bond strength tests ismandatory for correct interpretation of the bondstrength data [22].
Therefore, this study was conducted to seekinformation about the adhesive bond strength ondentin, testing the research hypothesis that there isa reduction in adhesive bond strength when atensile stress was applied at 10, 20 and 30 degreesto the adhesive junction compared to a non-angled(flat) interface, using two different adhesivesystems. A FEA was performed to understand twoaspects: first, to identify the stress distributionpattern at different adhesive joint angles; andsecond to quantify the effect of increasing adhesivethickness at a given joint angle on the stressdistribution, represented by the Maximum PrincipalStress (MPS). The MPS is associated with themaximum tension stress, and permits comparisonof the FEA predictions to the laboratory data.
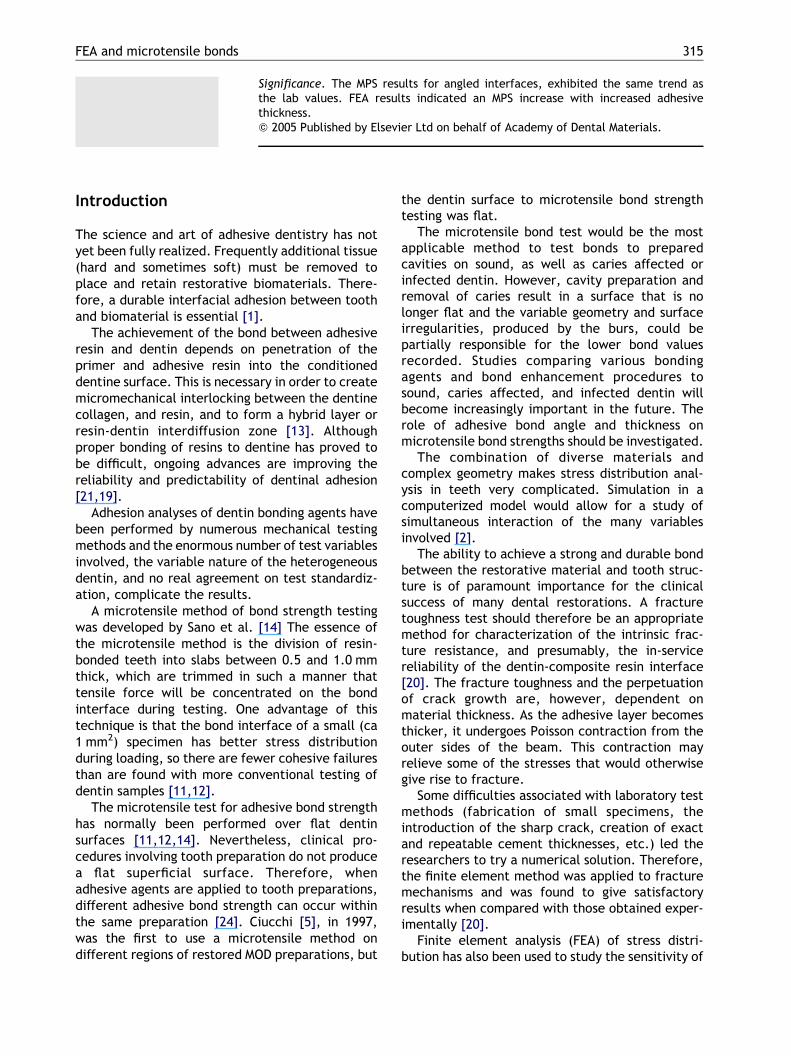
Figure 1 This sequence of pictures shows the MTBS of the cthe flat dentin substrate produced after polishing; (C) Pictsubstrate; (D) and (E) Picture of the cutting procedure formingof the specimen secured to a mold for cutting procedure perpeside; (F2) Picture of the specimen secured to a mold for cuttinlingual side; (G1) Picture of the specimen cut perpendicularepresented by the red lines; (G2) Picture of the specimen cuthe specimen fixed on the Bencor apparatus for the tensile te
Materials and methods
Twenty-four recently extracted non-carious thirdmolars were selected and sterilized using 180 Kradof Gamma irradiation [23], under a protocolapproved by the NYU College of Medicine Insti-tutional Review Board.
The occlusal enamel of these teeth (Fig. 1A) wasremoved perpendicular to the long axis of the teethusing a diamond saw (Buehler Isomet low speed sawwith Buehler Diamond Wafering Blade-Series 20 HCDiamond, No 11-4215, Buehler, USA) to expose aflat dentin surface (Fig. 1B). The flat surfaces werethen polished using a 600-grit silicon paper(Buehler, Phoenix Beta polisher and grinder).
The specimens were randomly divided into twogroups (twelve teeth per group) for adhesiveapplication, one total-etching sytem (Single Bond3M-ESPE) and the other a self-etching system(Clearfil SE Bond Kuraray).
For the Single Bond specimens, before theapplication of the adhesive agent, 35% phosphoricacid (Scotchbond, 3M-ESPE, Co) was applied for 15 son the flat dentin surface, and then rinsed for 10 swith water. The excess water was blotted using anabsorbent paper, leaving the dentin surface moist.
utting procedure. (A) Picture of the tooth; (B) Picture ofure of the adhesive and resin applied on the flatteneda flat surface at the mesial side of the tooth; (F1) Picturendicular (0 degree) to the interface from buccal to lingualg procedure at 30 degrees to the interface from buccal tor to the interface. Note the interface at 0 degree (flat)t at 30 degrees to the interface (red lines); (H) Picture ofsting.
Table
1Thistable
showstheinform
ationsonitemsusedin
thestudy.
Material
Composition
Lot/No
Exp
.Compan
y
SingleBond(3M-ESP
E,Co)
Bis-G
MA;Polyalke
noic
acid
co-polymer;
Dim
ethac
ry-
lates;
HEMA;Photoinitiator;
Ethan
ol;Water
3411
2GM
2003
-11
3M-St.
Pau
lMN55
144,
USA
ScotchbondEtchan
t(3M-ESP
E,Co)
35%PhosphoricAcid;Gel
7523
2XY
2003
-11
3M-St.
Pau
lMN55
144,
USA
ClearfilSE
BondPrimer(Kuraray,
Co)
10-M
ethac
ryloyloxydecyldihyd
roge
nphophate(M
DP);
2-Hyd
roxyethyl
methac
rylate
(HEMA);
Hyd
rophilic
dim
ethac
rylate;dl-Cam
phorquinone;N,N-Diethan
ol-p-
toluidine;Water
6124
327
220
04-03
Kuraray-20
0ParkAve
.New
York,NY10
166,
USA
ClearfilSE
Bond(Kuraray,
Co)
10-M
ethac
ryloyloxydecyldihyd
roge
nphophate(M
DP);
Bis-phenolAdiglycidylmethac
rylate
(HEMA);
Hyd
ro-
phobic
dim
ethac
rylate;dl-Cam
phorquinone;N,N-
Diethan
ol-p-toluidine;Silanatedco
lloidal
silica
6124
332
720
04-03
Kuraray-20
0ParkAve
.New
York,NY10
166,
USA
Z10
0Composite
(3M-ESP
E,Co)
BIS-G
MA,TEGDMAresins
2002
0924
2005
-03
3M-St.
Pau
lMN55
144,
USA
Silico
nPap
er(Buehler)
600-grit
No:30
5118
600
100
–Buehler-41
Wau
kega
nRd.
Lake
Bluff.IL
6004
4,USA
CuringLigh
t25
00–
Serial
#30
1693
0–
3M-335
0Granad
aAve
.N
Oak
dale,MN55
128,
USA
FEA and microtensile bonds 317
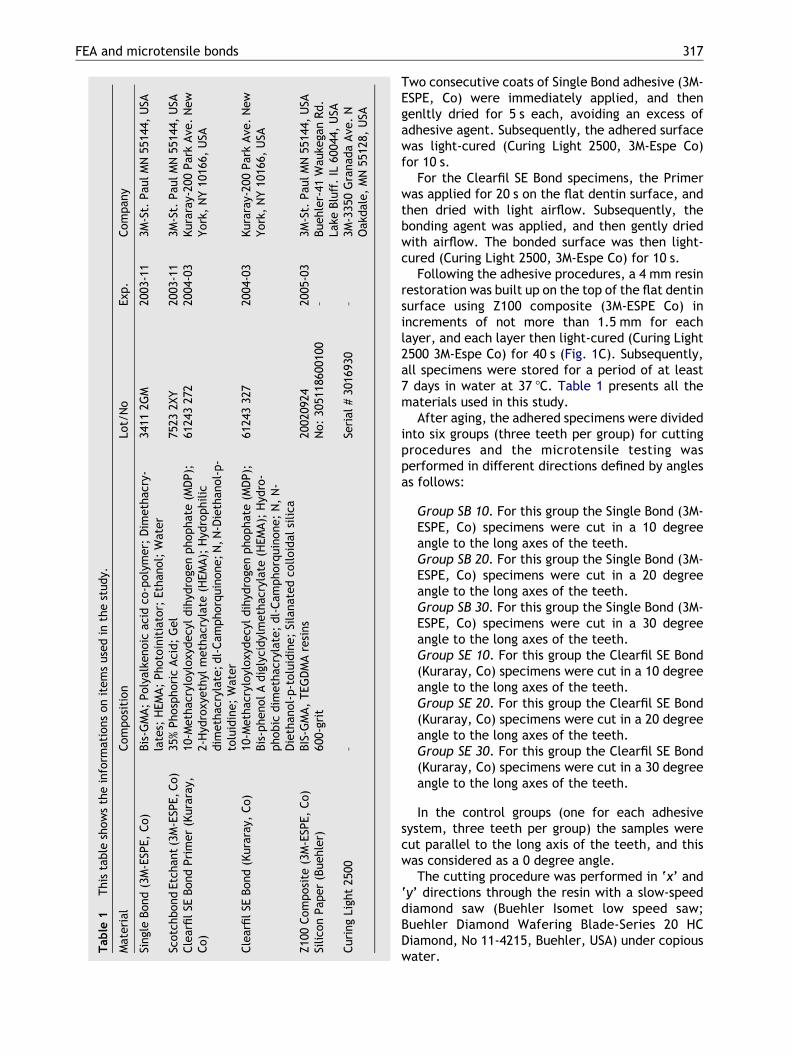
Two consecutive coats of Single Bond adhesive (3M-ESPE, Co) were immediately applied, and thengenltly dried for 5 s each, avoiding an excess ofadhesive agent. Subsequently, the adhered surfacewas light-cured (Curing Light 2500, 3M-Espe Co)for 10 s.
For the Clearfil SE Bond specimens, the Primerwas applied for 20 s on the flat dentin surface, andthen dried with light airflow. Subsequently, thebonding agent was applied, and then gently driedwith airflow. The bonded surface was then light-cured (Curing Light 2500, 3M-Espe Co) for 10 s.
Following the adhesive procedures, a 4 mm resinrestoration was built up on the top of the flat dentinsurface using Z100 composite (3M-ESPE Co) inincrements of not more than 1.5 mm for eachlayer, and each layer then light-cured (Curing Light2500 3M-Espe Co) for 40 s (Fig. 1C). Subsequently,all specimens were stored for a period of at least7 days in water at 37 8C. Table 1 presents all thematerials used in this study.
After aging, the adhered specimens were dividedinto six groups (three teeth per group) for cuttingprocedures and the microtensile testing wasperformed in different directions defined by anglesas follows:
Group SB 10. For this group the Single Bond (3M-ESPE, Co) specimens were cut in a 10 degreeangle to the long axes of the teeth.Group SB 20. For this group the Single Bond (3M-ESPE, Co) specimens were cut in a 20 degreeangle to the long axes of the teeth.Group SB 30. For this group the Single Bond (3M-ESPE, Co) specimens were cut in a 30 degreeangle to the long axes of the teeth.Group SE 10. For this group the Clearfil SE Bond(Kuraray, Co) specimens were cut in a 10 degreeangle to the long axes of the teeth.Group SE 20. For this group the Clearfil SE Bond(Kuraray, Co) specimens were cut in a 20 degreeangle to the long axes of the teeth.Group SE 30. For this group the Clearfil SE Bond(Kuraray, Co) specimens were cut in a 30 degreeangle to the long axes of the teeth.
In the control groups (one for each adhesivesystem, three teeth per group) the samples werecut parallel to the long axis of the teeth, and thiswas considered as a 0 degree angle.
The cutting procedure was performed in ‘x’ and‘y’ directions through the resin with a slow-speeddiamond saw (Buehler Isomet low speed saw;Buehler Diamond Wafering Blade-Series 20 HCDiamond, No 11-4215, Buehler, USA) under copiouswater.
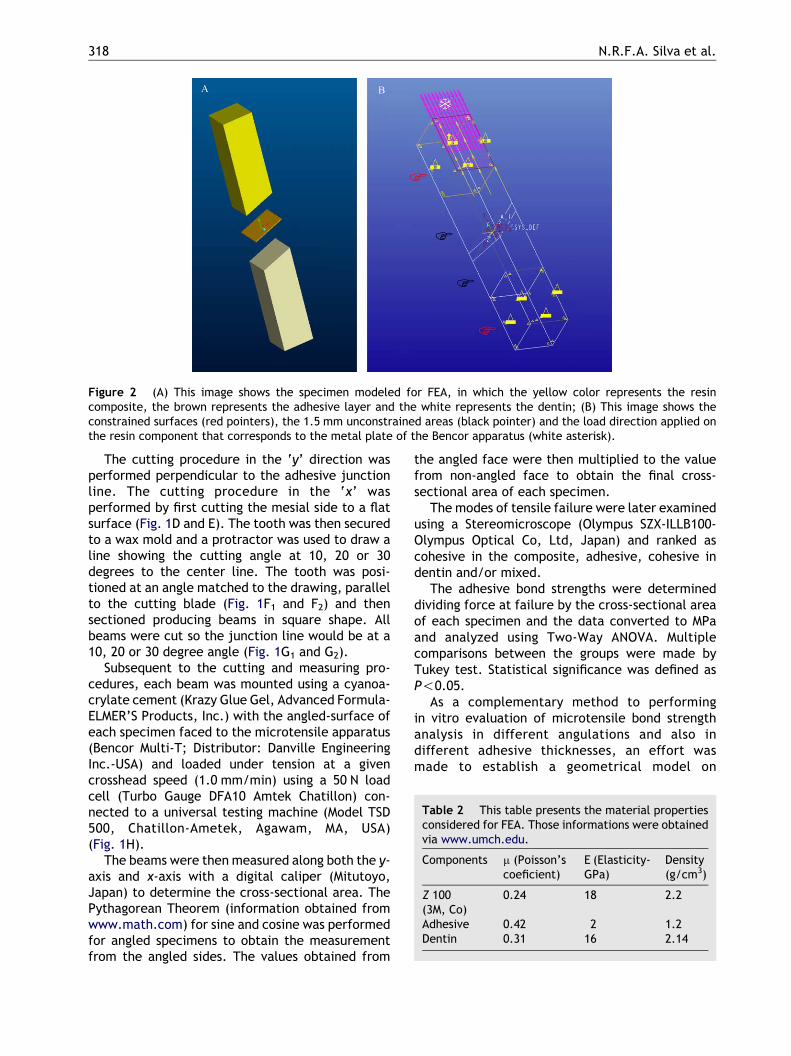
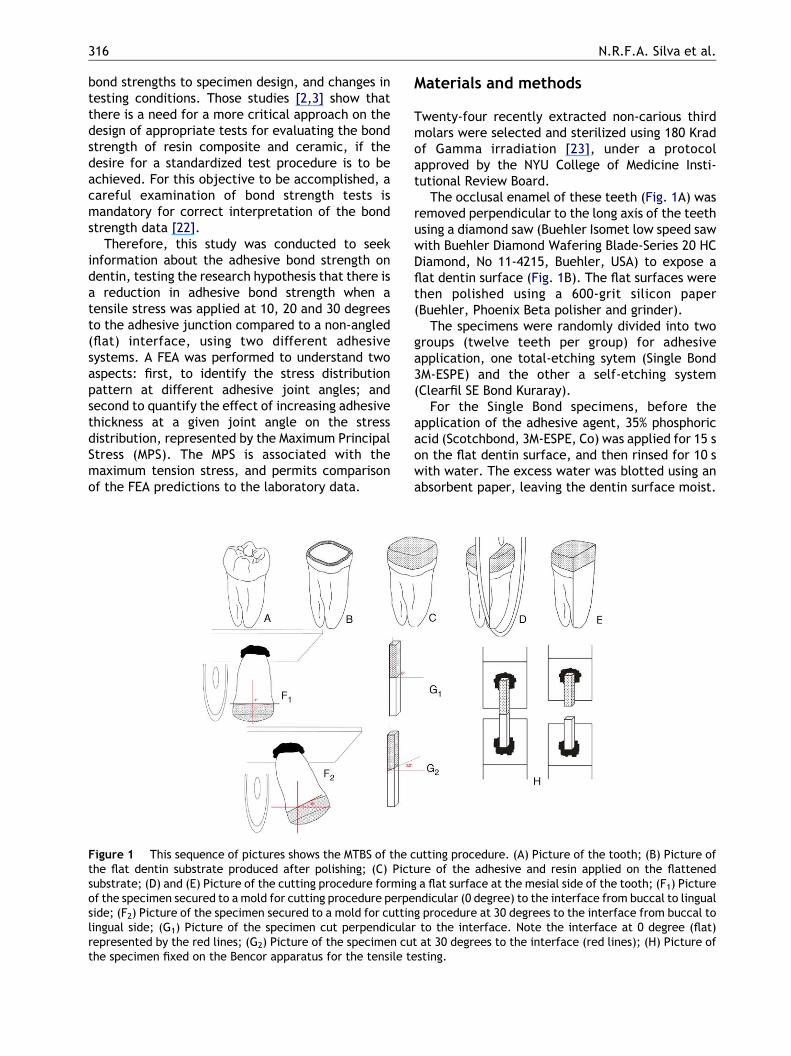
Figure 2 (A) This image shows the specimen modeled for FEA, in which the yellow color represents the resincomposite, the brown represents the adhesive layer and the white represents the dentin; (B) This image shows theconstrained surfaces (red pointers), the 1.5 mm unconstrained areas (black pointer) and the load direction applied onthe resin component that corresponds to the metal plate of the Bencor apparatus (white asterisk).
Table 2 This table presents the material propertiesconsidered for FEA. Those informations were obtainedvia www.umch.edu.
Components m (Poisson’scoeficient)
E (Elasticity-GPa)
Density(g/cm3)
Z 100(3M, Co)
0.24 18 2.2
Adhesive 0.42 2 1.2Dentin 0.31 16 2.14
N.R.F.A. Silva et al.318
The cutting procedure in the ‘y’ direction wasperformed perpendicular to the adhesive junctionline. The cutting procedure in the ‘x’ wasperformed by first cutting the mesial side to a flatsurface (Fig. 1D and E). The tooth was then securedto a wax mold and a protractor was used to draw aline showing the cutting angle at 10, 20 or 30degrees to the center line. The tooth was posi-tioned at an angle matched to the drawing, parallelto the cutting blade (Fig. 1F1 and F2) and thensectioned producing beams in square shape. Allbeams were cut so the junction line would be at a10, 20 or 30 degree angle (Fig. 1G1 and G2).
Subsequent to the cutting and measuring pro-cedures, each beam was mounted using a cyanoa-crylate cement (Krazy Glue Gel, Advanced Formula-ELMER’S Products, Inc.) with the angled-surface ofeach specimen faced to the microtensile apparatus(Bencor Multi-T; Distributor: Danville EngineeringInc.-USA) and loaded under tension at a givencrosshead speed (1.0 mm/min) using a 50 N loadcell (Turbo Gauge DFA10 Amtek Chatillon) con-nected to a universal testing machine (Model TSD500, Chatillon-Ametek, Agawam, MA, USA)(Fig. 1H).
The beams were then measured along both the y-axis and x-axis with a digital caliper (Mitutoyo,Japan) to determine the cross-sectional area. ThePythagorean Theorem (information obtained fromwww.math.com) for sine and cosine was performedfor angled specimens to obtain the measurementfrom the angled sides. The values obtained from
the angled face were then multiplied to the valuefrom non-angled face to obtain the final cross-sectional area of each specimen.
The modes of tensile failure were later examinedusing a Stereomicroscope (Olympus SZX-ILLB100-Olympus Optical Co, Ltd, Japan) and ranked ascohesive in the composite, adhesive, cohesive indentin and/or mixed.
The adhesive bond strengths were determineddividing force at failure by the cross-sectional areaof each specimen and the data converted to MPaand analyzed using Two-Way ANOVA. Multiplecomparisons between the groups were made byTukey test. Statistical significance was defined asP!0.05.
As a complementary method to performingin vitro evaluation of microtensile bond strengthanalysis in different angulations and also indifferent adhesive thicknesses, an effort wasmade to establish a geometrical model on
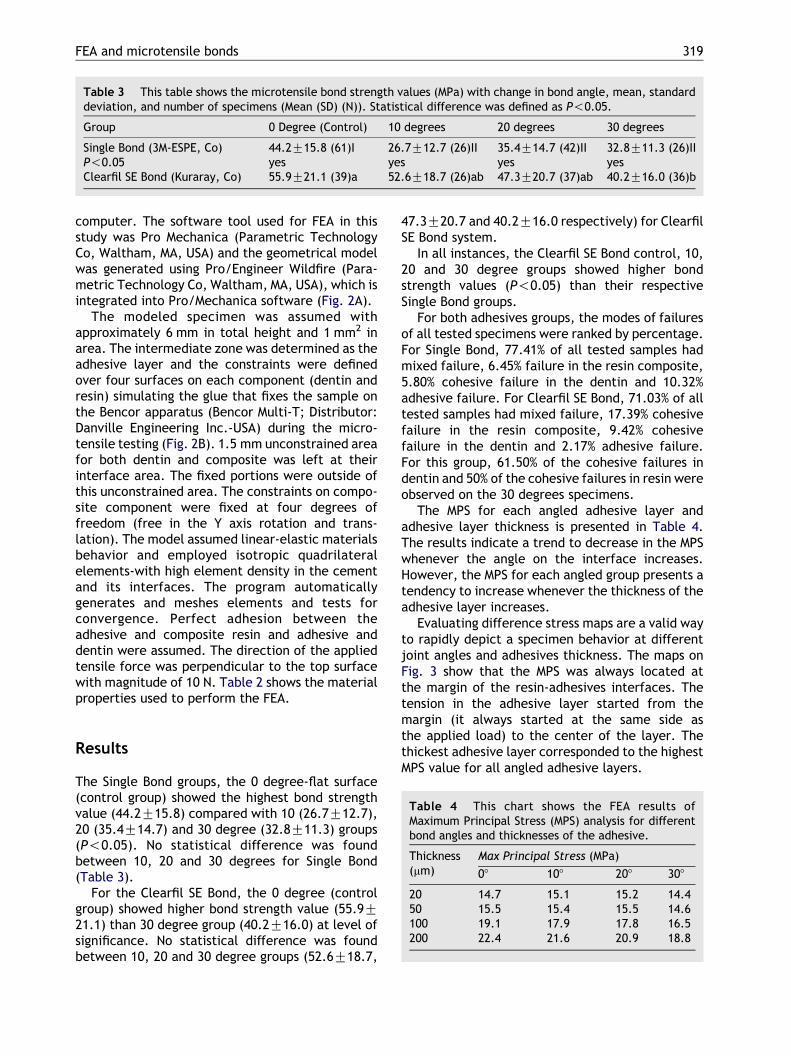
Table 3 This table shows the microtensile bond strength values (MPa) with change in bond angle, mean, standarddeviation, and number of specimens (Mean (SD) (N)). Statistical difference was defined as P!0.05.
Group 0 Degree (Control) 10 degrees 20 degrees 30 degrees
Single Bond (3M-ESPE, Co) 44.2G15.8 (61)I 26.7G12.7 (26)II 35.4G14.7 (42)II 32.8G11.3 (26)IIP!0.05 yes yes yes yesClearfil SE Bond (Kuraray, Co) 55.9G21.1 (39)a 52.6G18.7 (26)ab 47.3G20.7 (37)ab 40.2G16.0 (36)b
FEA and microtensile bonds 319
computer. The software tool used for FEA in thisstudy was Pro Mechanica (Parametric TechnologyCo, Waltham, MA, USA) and the geometrical modelwas generated using Pro/Engineer Wildfire (Para-metric Technology Co, Waltham, MA, USA), which isintegrated into Pro/Mechanica software (Fig. 2A).
The modeled specimen was assumed withapproximately 6 mm in total height and 1 mm2 inarea. The intermediate zone was determined as theadhesive layer and the constraints were definedover four surfaces on each component (dentin andresin) simulating the glue that fixes the sample onthe Bencor apparatus (Bencor Multi-T; Distributor:Danville Engineering Inc.-USA) during the micro-tensile testing (Fig. 2B). 1.5 mm unconstrained areafor both dentin and composite was left at theirinterface area. The fixed portions were outside ofthis unconstrained area. The constraints on compo-site component were fixed at four degrees offreedom (free in the Y axis rotation and trans-lation). The model assumed linear-elastic materialsbehavior and employed isotropic quadrilateralelements-with high element density in the cementand its interfaces. The program automaticallygenerates and meshes elements and tests forconvergence. Perfect adhesion between theadhesive and composite resin and adhesive anddentin were assumed. The direction of the appliedtensile force was perpendicular to the top surfacewith magnitude of 10 N. Table 2 shows the materialproperties used to perform the FEA.
Table 4 This chart shows the FEA results ofMaximum Principal Stress (MPS) analysis for differentbond angles and thicknesses of the adhesive.
Thickness(mm)
Max Principal Stress (MPa)
08 108 208 308
20 14.7 15.1 15.2 14.450 15.5 15.4 15.5 14.6100 19.1 17.9 17.8 16.5200 22.4 21.6 20.9 18.8
Results
The Single Bond groups, the 0 degree-flat surface(control group) showed the highest bond strengthvalue (44.2G15.8) compared with 10 (26.7G12.7),20 (35.4G14.7) and 30 degree (32.8G11.3) groups(P!0.05). No statistical difference was foundbetween 10, 20 and 30 degrees for Single Bond(Table 3).
For the Clearfil SE Bond, the 0 degree (controlgroup) showed higher bond strength value (55.9G21.1) than 30 degree group (40.2G16.0) at level ofsignificance. No statistical difference was foundbetween 10, 20 and 30 degree groups (52.6G18.7,
47.3G20.7 and 40.2G16.0 respectively) for ClearfilSE Bond system.
In all instances, the Clearfil SE Bond control, 10,20 and 30 degree groups showed higher bondstrength values (P!0.05) than their respectiveSingle Bond groups.
For both adhesives groups, the modes of failuresof all tested specimens were ranked by percentage.For Single Bond, 77.41% of all tested samples hadmixed failure, 6.45% failure in the resin composite,5.80% cohesive failure in the dentin and 10.32%adhesive failure. For Clearfil SE Bond, 71.03% of alltested samples had mixed failure, 17.39% cohesivefailure in the resin composite, 9.42% cohesivefailure in the dentin and 2.17% adhesive failure.For this group, 61.50% of the cohesive failures indentin and 50% of the cohesive failures in resin wereobserved on the 30 degrees specimens.
The MPS for each angled adhesive layer andadhesive layer thickness is presented in Table 4.The results indicate a trend to decrease in the MPSwhenever the angle on the interface increases.However, the MPS for each angled group presents atendency to increase whenever the thickness of theadhesive layer increases.
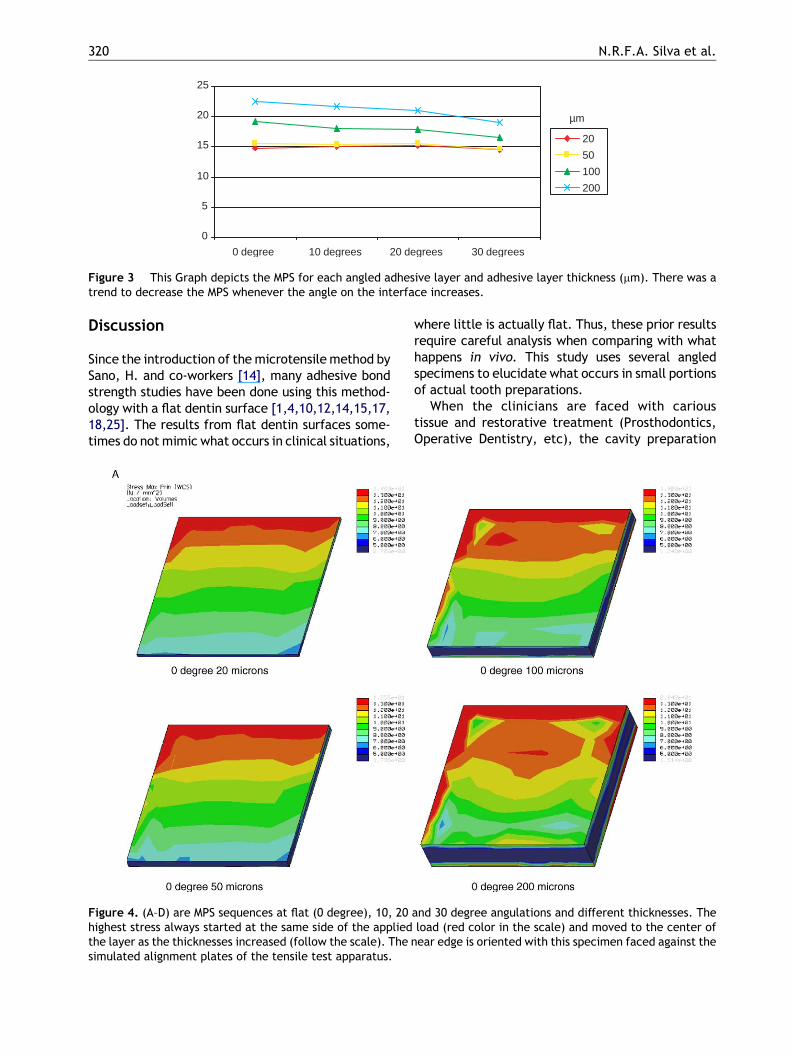
Evaluating difference stress maps are a valid wayto rapidly depict a specimen behavior at differentjoint angles and adhesives thickness. The maps onFig. 3 show that the MPS was always located atthe margin of the resin-adhesives interfaces. Thetension in the adhesive layer started from themargin (it always started at the same side asthe applied load) to the center of the layer. Thethickest adhesive layer corresponded to the highestMPS value for all angled adhesive layers.
0
5
10
15
20
25
0 degree 10 degrees 20 degrees 30 degrees
20
50
100
200
µm
Figure 3 This Graph depicts the MPS for each angled adhesive layer and adhesive layer thickness (mm). There was atrend to decrease the MPS whenever the angle on the interface increases.
N.R.F.A. Silva et al.320
Discussion
Since the introduction of the microtensile method bySano, H. and co-workers [14], many adhesive bondstrength studies have been done using this method-ology with a flat dentin surface [1,4,10,12,14,15,17,18,25]. The results from flat dentin surfaces some-times do not mimic what occurs in clinical situations,
Figure 4. (A–D) are MPS sequences at flat (0 degree), 10, 20highest stress always started at the same side of the appliedthe layer as the thicknesses increased (follow the scale). The nsimulated alignment plates of the tensile test apparatus.
where little is actually flat. Thus, these prior resultsrequire careful analysis when comparing with whathappens in vivo. This study uses several angledspecimens to elucidate what occurs in small portionsof actual tooth preparations.
When the clinicians are faced with carioustissue and restorative treatment (Prosthodontics,Operative Dentistry, etc), the cavity preparation
and 30 degree angulations and different thicknesses. Theload (red color in the scale) and moved to the center ofear edge is oriented with this specimen faced against the
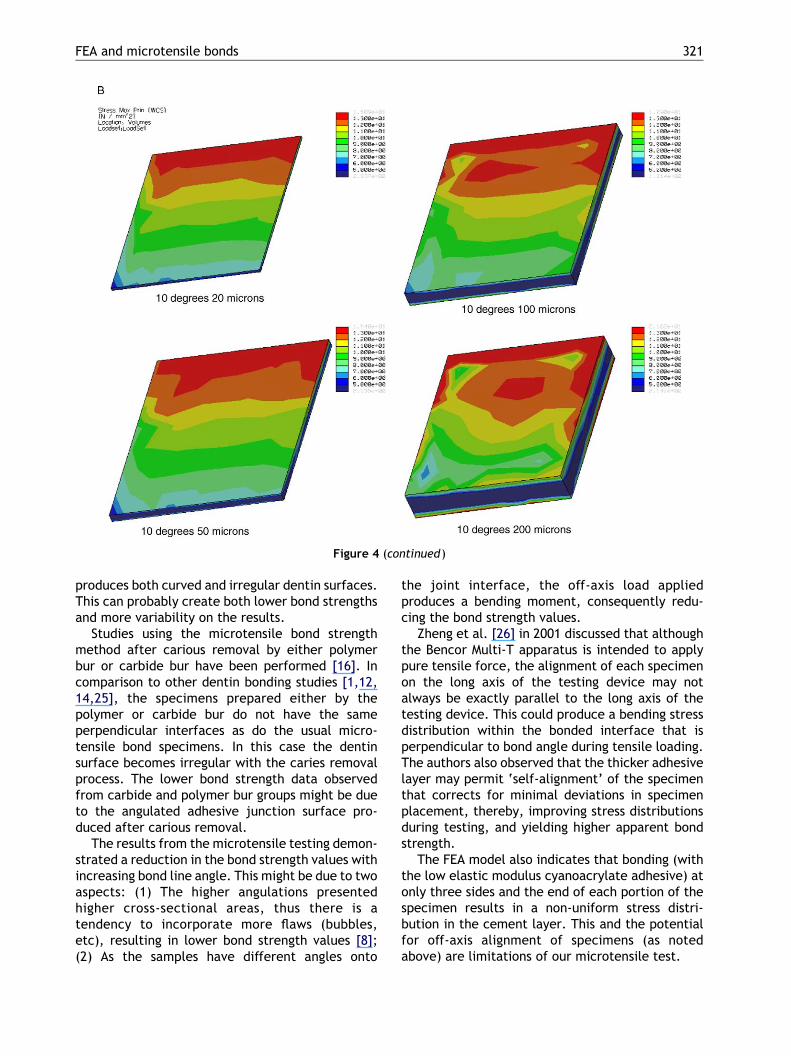
Figure 4 (continued)
FEA and microtensile bonds 321
produces both curved and irregular dentin surfaces.This can probably create both lower bond strengthsand more variability on the results.
Studies using the microtensile bond strengthmethod after carious removal by either polymerbur or carbide bur have been performed [16]. Incomparison to other dentin bonding studies [1,12,14,25], the specimens prepared either by thepolymer or carbide bur do not have the sameperpendicular interfaces as do the usual micro-tensile bond specimens. In this case the dentinsurface becomes irregular with the caries removalprocess. The lower bond strength data observedfrom carbide and polymer bur groups might be dueto the angulated adhesive junction surface pro-duced after carious removal.
The results from the microtensile testing demon-strated a reduction in the bond strength values withincreasing bond line angle. This might be due to twoaspects: (1) The higher angulations presentedhigher cross-sectional areas, thus there is atendency to incorporate more flaws (bubbles,etc), resulting in lower bond strength values [8];(2) As the samples have different angles onto
the joint interface, the off-axis load appliedproduces a bending moment, consequently redu-cing the bond strength values.
Zheng et al. [26] in 2001 discussed that althoughthe Bencor Multi-T apparatus is intended to applypure tensile force, the alignment of each specimenon the long axis of the testing device may notalways be exactly parallel to the long axis of thetesting device. This could produce a bending stressdistribution within the bonded interface that isperpendicular to bond angle during tensile loading.The authors also observed that the thicker adhesivelayer may permit ‘self-alignment’ of the specimenthat corrects for minimal deviations in specimenplacement, thereby, improving stress distributionsduring testing, and yielding higher apparent bondstrength.
The FEA model also indicates that bonding (withthe low elastic modulus cyanoacrylate adhesive) atonly three sides and the end of each portion of thespecimen results in a non-uniform stress distri-bution in the cement layer. This and the potentialfor off-axis alignment of specimens (as notedabove) are limitations of our microtensile test.
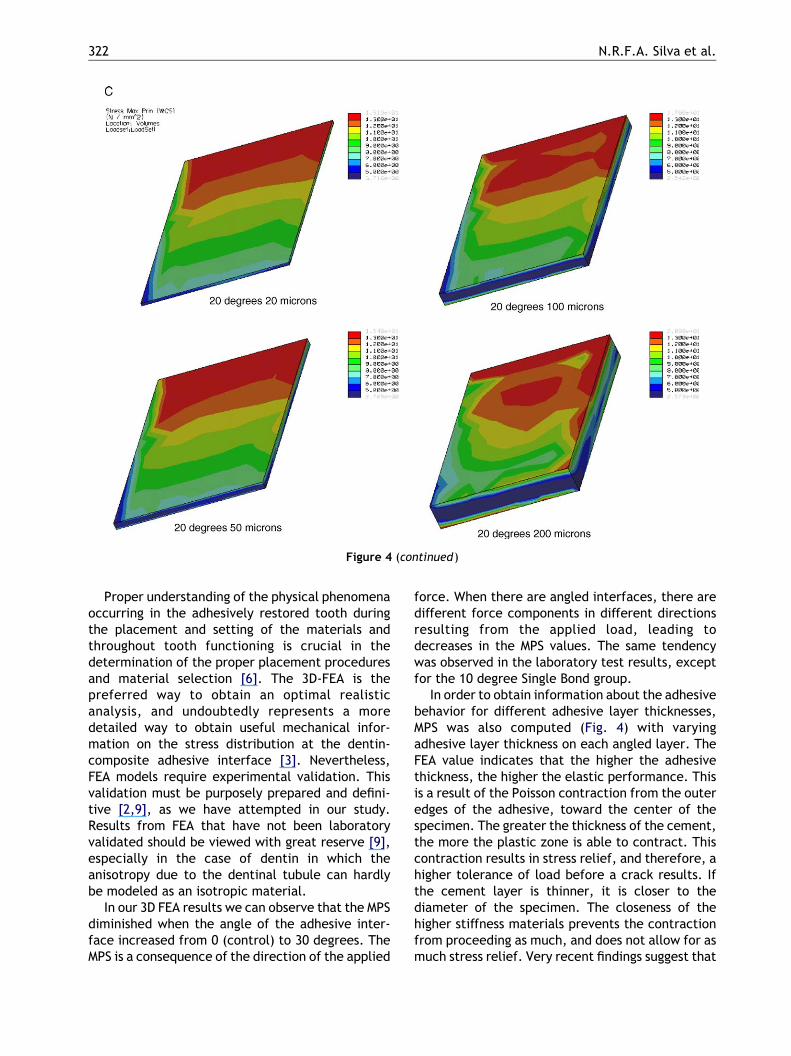
Figure 4 (continued)
N.R.F.A. Silva et al.322
Proper understanding of the physical phenomenaoccurring in the adhesively restored tooth duringthe placement and setting of the materials andthroughout tooth functioning is crucial in thedetermination of the proper placement proceduresand material selection [6]. The 3D-FEA is thepreferred way to obtain an optimal realisticanalysis, and undoubtedly represents a moredetailed way to obtain useful mechanical infor-mation on the stress distribution at the dentin-composite adhesive interface [3]. Nevertheless,FEA models require experimental validation. Thisvalidation must be purposely prepared and defini-tive [2,9], as we have attempted in our study.Results from FEA that have not been laboratoryvalidated should be viewed with great reserve [9],especially in the case of dentin in which theanisotropy due to the dentinal tubule can hardlybe modeled as an isotropic material.
In our 3D FEA results we can observe that the MPSdiminished when the angle of the adhesive inter-face increased from 0 (control) to 30 degrees. TheMPS is a consequence of the direction of the applied
force. When there are angled interfaces, there aredifferent force components in different directionsresulting from the applied load, leading todecreases in the MPS values. The same tendencywas observed in the laboratory test results, exceptfor the 10 degree Single Bond group.
In order to obtain information about the adhesivebehavior for different adhesive layer thicknesses,MPS was also computed (Fig. 4) with varyingadhesive layer thickness on each angled layer. TheFEA value indicates that the higher the adhesivethickness, the higher the elastic performance. Thisis a result of the Poisson contraction from the outeredges of the adhesive, toward the center of thespecimen. The greater the thickness of the cement,the more the plastic zone is able to contract. Thiscontraction results in stress relief, and therefore, ahigher tolerance of load before a crack results. Ifthe cement layer is thinner, it is closer to thediameter of the specimen. The closeness of thehigher stiffness materials prevents the contractionfrom proceeding as much, and does not allow for asmuch stress relief. Very recent findings suggest that
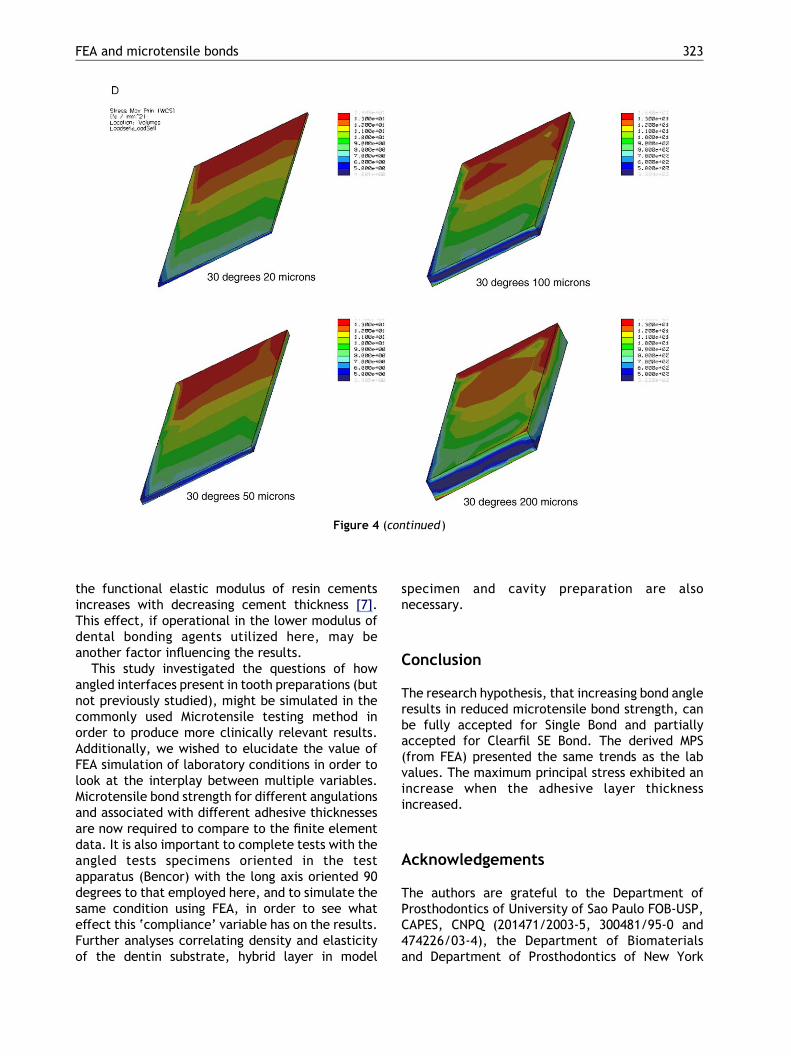
Figure 4 (continued)
FEA and microtensile bonds 323
the functional elastic modulus of resin cementsincreases with decreasing cement thickness [7].This effect, if operational in the lower modulus ofdental bonding agents utilized here, may beanother factor influencing the results.
This study investigated the questions of howangled interfaces present in tooth preparations (butnot previously studied), might be simulated in thecommonly used Microtensile testing method inorder to produce more clinically relevant results.Additionally, we wished to elucidate the value ofFEA simulation of laboratory conditions in order tolook at the interplay between multiple variables.Microtensile bond strength for different angulationsand associated with different adhesive thicknessesare now required to compare to the finite elementdata. It is also important to complete tests with theangled tests specimens oriented in the testapparatus (Bencor) with the long axis oriented 90degrees to that employed here, and to simulate thesame condition using FEA, in order to see whateffect this ‘compliance’ variable has on the results.Further analyses correlating density and elasticityof the dentin substrate, hybrid layer in model
specimen and cavity preparation are alsonecessary.
Conclusion
The research hypothesis, that increasing bond angleresults in reduced microtensile bond strength, canbe fully accepted for Single Bond and partiallyaccepted for Clearfil SE Bond. The derived MPS(from FEA) presented the same trends as the labvalues. The maximum principal stress exhibited anincrease when the adhesive layer thicknessincreased.
Acknowledgements
The authors are grateful to the Department ofProsthodontics of University of Sao Paulo FOB-USP,CAPES, CNPQ (201471/2003-5, 300481/95-0 and474226/03-4), the Department of Biomaterialsand Department of Prosthodontics of New York
N.R.F.A. Silva et al.324
University College of Dentistry NYUCD. We thankElizabeth Clark for the editorial support.
References
[1] Armstrong SR, Boyer DB, Keller JC. Microtensile bondstrength testing and failure analyses of two dentinadhesives. Dent Mater 1998;14:44–50.
[2] Ausiello P, Apicella A, Davidson CL, Rengo S. 3-D finiteelement analyses of cusp movements in human upperpremolar, restored with adhesive resin-based composites.J Biomech 2001;34:1269–77.
[3] Ausiello P, Apicella A, Davidson CL. Effect of adhesive layerproperties on stress distribution in composite restorations—a 3D finite element analysis. Dent Mater 2002;18:295–303.
[4] Carvalho RM, Fernandes CA, Villanueva R, Wang L, Pashley DH. Tensile strength of human dentin as a function of tubuleorientation and density. J Adhes Dent 2001;3(4):309–14.
[5] Ciucchi B. Bonding characteristics of resin compositerestoration on dentin class II cavity walls, in vitro (thesis).Geneva: Univ. de Geneva, Switzerland, 1997.
[6] Davidson CL, Davidson-Kaban SS. Handling of mechanicalstresses in composite restorations. Dent Update 1998;25:274–9.
[7] De Jager N, Pallav A, Feilzer AJ. The apparent increase inYoung’s modulus in thin cement layers. Dent Mat 2004;20:457–62.
[8] Griffith AA. The phenomena of rupture and flow in solids.PhD Trans Roy Soc Lon (series A) 1920;A221:168–98.
[9] Huysmans MCDNJ, Van Der Varst PGT. inite element analysisof quasistatic and fatigue of post and cores. J Dent 1993;21:57–64.
[10] Nikaido T, Kulzemann KH, Chen H, Ogata M, Harada N,Yamaguchi S, et al. Evaluation of thermal cycling andmechanical loading on bond strength of a self-etchingprimer system to dentin. Dent Mater 2002;18:269–75.
[11] Pashley DH, Sano H, Ciucchi B, Yoshiyama M, Carvalho RM.Adhesion testing of dentin bond agents: A review. DentMater 1995;1:117–25.
[12] Pashley DH, Carvalho RM, Sano H, Nakajima M,Yoshiyama M, Shono Y, et al. The microtensile bond test:a review. J Adhes Dent 1999;1(4):299–309.
[13] Phrukkanon S, Burrow MF, Tyas MJ. The effect of dentinelocation and tubule orientation on the bond strengthsbetween resin and dentin. J Dent 1999;27:265–74.
[14] Sano H, Sonada H, Shono T, Takatsu T, Ciucchi B, Carvalho RM. Relationship between surface area for adhesion andtensile bond strength. Evaluation of micro tensile bond test.Dent Mater 1994;10:236–40.
[15] Shono Y, Ogawa T, Terashita M, Carvalho RM, Pashley EL,Pashley DH. Regional measurement of Resin-dentin bondingas an array. J Dent Res 1999;78(2):699–705.
[16] Silva NRFA, Carvalho RM, Pegoraro LF, Tay FR, ThompsonVP. Evaluation of a self-limiting concept in dentinal cariesremoval. J Dent Res (submitted to publication).
[17] Tay FR, Kwong S, Carvalho RM, Pashley EL, Pashley DH.Status of research on new fillers and new resin fordeal composites. In: Advanced adhesive dentistry, 3international Kuraray symposium. Granada: Dec. 1999;p. 106–129.
[18] Tay FR, Carvalho RM, Sano H, Pashley DH. Effect of smearlayers on the bonding of a self-etching primer to dentin.J Adhes Dent 2000;2(2):99–116.
[19] Tay FR, Pashley DH. Dental adhesives of the future. J AdhesDent 2002;4(2):91–103.
[20] Torpali M, Askov T. Fracture toughness determination ofcomposite resin and dentin/composite resin adhesiveinterfaces by laboratory testing and finite element models.Dent Mater 1998;14:287–93.
[21] Van Meerbeek B, Inokoshi S, Braem M, Lambrechts P,Vanherle G. Morphological aspects of the resin-dentininterdiffusion zone with different dentin adhesive systems.J Dent Res 1992;71:1530–40.
[22] Van Noort R, Noroozi S, Howard IC, Cardew G. Acritique of bond strength measurements. J Dent 1989;17(2):61–7.
[23] White JM, Goodis HE, Marshall SJ, Marshall GW. Steriliza-tion of teeth by gamma radiation. J Dent Res 1994;73(9):1560–7.
[24] Yoshikawa T, Sano H, Burrow MF, Tagami J, Pashley DH.Effects of dentin depth and cavity configuration on bondstrength. J Dent Res 1999;78(4):888–904.
[25] Yoshiyama M, Tay FR, Doi J, Nishitani Y, Yamada T, Itou K,et al. Bonding of self-etch and total-etch adhesives tocarious dentin. J Dent Res 2002;81(8):556–60.
[26] Zheng L, Pereira PN, Nakajima M, Sano H, Tagami J.Relationship between adhesive thickness and microtensilebond strength. Oper Dent 2001;26:97–104.
Related Documents